Embed Size (px)
Citation preview

The Andrew O’Neil Memorial Lecture
Mushrooms: For Weight Control and Health
22nd North American Mushroom ConferenceJune 24, 2013
Vancouver, British Columbia
Lawrence J. Cheskin, M.D.Director, Johns Hopkins Weight Management Center Department of Health, Behavior & SocietyJohns Hopkins Bloomberg School of Public Health
Joint Appt: Medicine (GI); International Health (Human Nutrition)

*BMI 30, or about 30 lbs overweight for 5’4” person
Obesity Trends* Among US AdultsBRFSS, 1990, 1999, 2008
BRFSS=Behavioral Risk Factor Surveillance System

Obesity in Canada
▪ Statistics are similar to the US (slightly better)
▪ Additional factors include:
• Generally longer, colder winters limiting physical activity
• Among native populations, a rapid “nutrition transition’ and decreased physical activity

Severe and Morbid Obesity Is Increasing More Rapidly Than Mild Obesity
Normal: 18.5-24.9Class 1 Obesity: 25-29.9 (overweight)Class 2 Obesity: 30.0-39.9 (severe)Class 3 Obesity: 40 or more (morbid/extreme)
Sturm, R. Public Health. 2007. July;121(7):492-496.

Prevalence of Extreme(Morbid) Obesity (BMI ≥40) by Gender and Ethnicity
Flegal KM, et al. JAMA. 2010;303:235-241.

Approximately 25% of children and adolescents are overweight
▪ more than any other known time in history
▪ life expectancy
may decline
as a result
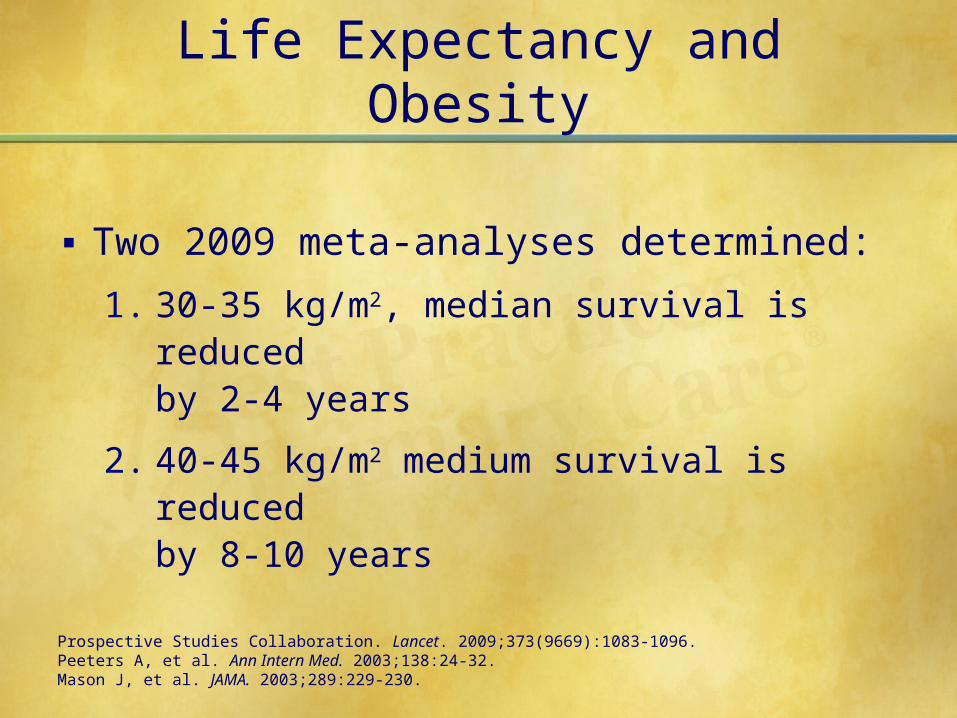
Life Expectancy and Obesity
▪ Two 2009 meta-analyses determined:
1. 30-35 kg/m2, median survival is reduced by 2-4 years
2. 40-45 kg/m2 medium survival is reduced by 8-10 years
Prospective Studies Collaboration. Lancet. 2009;373(9669):1083-1096.Peeters A, et al. Ann Intern Med. 2003;138:24-32.Mason J, et al. JAMA. 2003;289:229-230.

How Might Obesity Shorten Lifespan?Leading Causes of Death, North America
Cause Rate/ 100,000 Obesity-Related?
1. CHD 175 Yes
2. Cancer 133 Yes
3. Accidents 35
4. Stroke 31 Yes
5. COPD 19
6. Diabetes 16 Yes
7. Pneumonia 14
8. Suicide 12

Comorbid Conditions and BMI>27 kg/m2
Common comorbid conditions in obesity
▪ Hypertension
▪ Dyslipidemias
▪ Type 2 diabetes
Anderson JW, et al. Obes Res. 2001;9:S326-S334.

BMI and Relative Riskof Type 2 Diabetes
Adapted from Willett WC, et al. N Engl J Med. 1999;341:427-434.

Intentional Weight Loss (< 20 lbs) and Predicted Reduction in
Mortality
0
10
20
30
40
50
60
All Causes CardiovascularDisease
Cancer ObesityRelatedCancer
DiabetesRelated
ConditionsRed
ucti
on o
f Adj
uste
d M
orta
lity
Rat
e (%
)
Source: Williamson, D.F, et al. (1995). Am J Epidemiol 141: 1128–1141

Phlebitis• Venous• Stasis
Coronary heart disease
Pulmonary disease• Abnormal function• Obstructive sleep apnea• Hypoventilation syndrome
Gall bladder disease
Gout
Diabetes
Osteoarthritis
Nonalcoholic fatty liver disease• Steatosis• Steatohepatitis• Cirrhosis
HypertensionDyslipidemia
Cataracts
Skin
Pancreatitis
Idiopathic intracranial hypertension
Cancer• Breast• Uterus• Cervix• Prostate• Kidney
• Colon• Esophagus• Pancreas• Liver
Gynecologic abnormalities• Abnormal menses• Infertility• Polycystic ovarian syndrome
Stroke
Medical Complications of Obesity

A Classification of the Obesities
Neuroendocrine Obesities▪ Hypothyroidism▪ Hypothalmic syndrome▪ Cushing’s syndrome▪ Polycystic ovary (Stein-Leventhal)
syndrome▪ Pseudohypoparathyroidism▪ Hypogonadism▪ Growth hormone deficiency▪ Insulinoma and hyperinsulinism
Iatrogenic▪ Drugs (psychotropics,
corticosteroids)▪ Hypothalamatic surgery
Nutritional Imbalance and Obesity
▪ High-calorie, high-fat diets▪ Cafeteria diets
Physical Inactivity▪ Enforced (postoperative)▪ Aging▪ Job-related
Genetic (Dysmorphic) Obesities
▪ Autosomal recessive▪ X-linked▪ Chromosomal

Drugs Associated with Weight Gain
▪ Steroids; BCPs; HRT
▪ Tricyclic antidepressants
▪ Phenothiazines
▪ Lithium
▪ Antihistamines
▪ Sulfonylureas, insulin
▪ Beta blockers, thiazides

Adoption Studies
▪ Stunkard, et al

Regulation of body weight
Calories consumed in 1 year:
*Average over 20 yrs (30-50 yrs of age, Framingham study)
Weight gained / year* (kcals fat): 1/2 lb (1,700)
Energy balance Error = 0.17%
980,000

What drives food choice?
▪ TASTE - consumers consistently rate this as the number one reason for the food choices they make
▪ COST - consumers look for bargains/values that taste good
▪ CONVENIENCE - consumers want choices that simplify their lives
▪ PROBLEM - These factors are often barriers to reducing energy intake

What’s Changed?....Food Type Availability
YEAR Number of Fast Food Restaurants
1980 1 per 2000 people
1990 1 per 1400 people
2000 1 per 1000 people
GROWTH OF THE FAST FOOD SECTOR
Tillotson J, Ann Rev Nutr, 2004

Portion size & consumption
-Portion sizes began growing in the 1970s
-Marketplace portions are now 2-8x standard serving sizes
-In children, (~ to adults), doubling portions of a lunch entrée increased entrée and total energy intakes by 25% and 15% (Orlet et al. 2003). When children were allowed to serve themselves, they consumed 25% less of the entrée than when served a large entrée portion.

Diet Composition and Satiety
Hierarchy of satiety (per kcal):Fiber
ProteinComplex carbohydratesSimple carbohydrates
Fat (unsaturated > saturated)Ethanol
Ethanol may even stimulate further food intakeLiquids are less satiating than solids

Dietary Fat and Obesity
▪ Epidemiologic evidence of a direct link
▪ Calorically dense; 9 kcal/gram
▪ Highly palatable
▪ Efficiently stored
▪ Virtually unlimited storage

Nibbling Versus Gorging
▪ Obese individuals frequently eat fewer meals per day
▪ Of 379 men fed 1–2 meals per day, they were heavier, had higher cholesterol, and higher glucose than those who ate more frequently
▪ School children fed three meals per day gain more than those fed five to seven meals per day

The Other Side of the Energy Balance Equation: Is being sedentary a risk
factor for obesity?
▪ Few historical records of activity levels.
▪ In USA: inverse correlation between self-reported P-act and BMI• True for men, women, AA, Latino, white, etc.

WHY DO I EAT--LET ME COUNT THE WAYS
The concept of appropriate/inappropriate eating cues: Food as a habit
Food as a stress reliever
Food as a reward
Food as a boredom reliever
Food as a social facilitator
Food as love
Food as a mountain

Assessing Obesity in Clinical Practice
Body-mass index (BMI) = weight (kg)/height (m)2
• Normal weight: BMI 18.5-24.9
• Overweight: BMI 25.0–29.9
• Obesity: BMI 30.0-39.9
• Extreme obesity: BMI 40.0+
BMI is positively correlated with health risk
Source: NHLBI Obesity Guidelines. Obesity Res 6(suppl 2) (1998)
Continued

Assessing Obesity in Clinical Practice
Waist circumference modifies the risk at any given BMI
High risk:▪ Men > 40 inches
▪ Women > 35 inches
▪ Indirect measure of central adiposity, correlated with visceral fat
▪ Excess fat in the abdomen is an independent predictor of risk factors and morbidity
▪ Use a tape measure around widest point above umbilicus
Source: NHLBI Obesity Guidelines. Obesity Res 6(suppl 2) (1998)

Treatments for Obesity
▪ Lifestyle modification
• Diet
• Physical activity
• Behavior modification
▪ Pharmacotherapy
▪ Surgery

What’s Our Best Hope for Obesity Prevention?
▪ Change the food supply: availability, cost, advertising
▪ Change the built environment: paths, safety
▪ Change our schools
▪ Change attitudes and beliefs
▪ Serve as role models ourselves
▪ Devote resources to research and programs
▪ Be persistent

Results of Weight Loss– Medication Use
▪ The majority of those entering the program suffered from one or more of the following conditions and required medications for control:
• Hypertension
• High cholesterol/ TG
• Type-2 diabetes

As a result of weight loss…
▪ Hypertension ↓ • 57% reduced or stopped HTN meds
While achieving normal BP values
▪ High cholesterol ↓ • 55% stopped taking “statin” medication
And achieved normal cholesterol & TG values
▪ Type-2 diabetes ↓ • 50% reduced or stopped medications, including insulin
and oral agents with improvements in fasting blood glucose / HbA1c
▪ This effect often occurs quite early in the course of wt loss

As a result of weight loss…
▪ Decreased need for medications or treatment for:• Arthritis / pain control
• Gastroesophageal reflux disease (GERD)
• Obstructive sleep apnea (off CPAP)
• Angina pectoris
• Non-alcoholic fatty liver disease (NAFLD)

Other Common Outcomes
▪ Lower cost of health care
▪ Improved health-related quality of life
▪ Improved mood & self-esteem
▪ Improved fertility
▪ Better sleep
▪ More energy
▪ Decreased fatigue

Dietary Control of Obesity
The substitution of low calorie foods for high-calorie foods has been proposed as a means of preventing, or reversing obesity…
Why Mushrooms?
▪ Nutritional value
▪ Nutritional composition
▪ Satiety value
▪ Substitution potential for high fat, high energy density foods
• The Evidence…

But will it work?
What is compensation?
An increase in caloric intake following a meal that is of lower energy.
(“making up for lost calories”)

Background – CompensationSometimes there is compensation –
e.g., after drinking diet soda vs regular
Sometimes not –
only partial compensation eating a less-dense meal (low-fat cream cheese on bagels) following a week of energy-rich meals (regular cream cheese)
Differences in % compensation by age, gender, BMI:
• Young males exhibit more complete compensation than females and older adults (Rolls 1998)
• Obese individuals generally have been found to compensate more poorly than lean (Rolls 1994, Roe 1999)

Our recent work on mushrooms & weight control:Mushroom Council sponsored
▪ The first study to examine whether replacing one food for an entirely different one (meat vs. mushrooms) would lower overall calorie intake, and be as filling as higher calorie foods.

Methods
▪ Controlled intervention study, crossover design with each subject serving as his or her own control.
▪ Healthy men and women, aged 18-65
▪ 18 men and 36 women • normal weight (43%),
• overweight (33%),
• obese (24%)
• received 4 days of lunchtime meat entrées,
• followed by 4 days of the same entrées substituted with mushrooms.
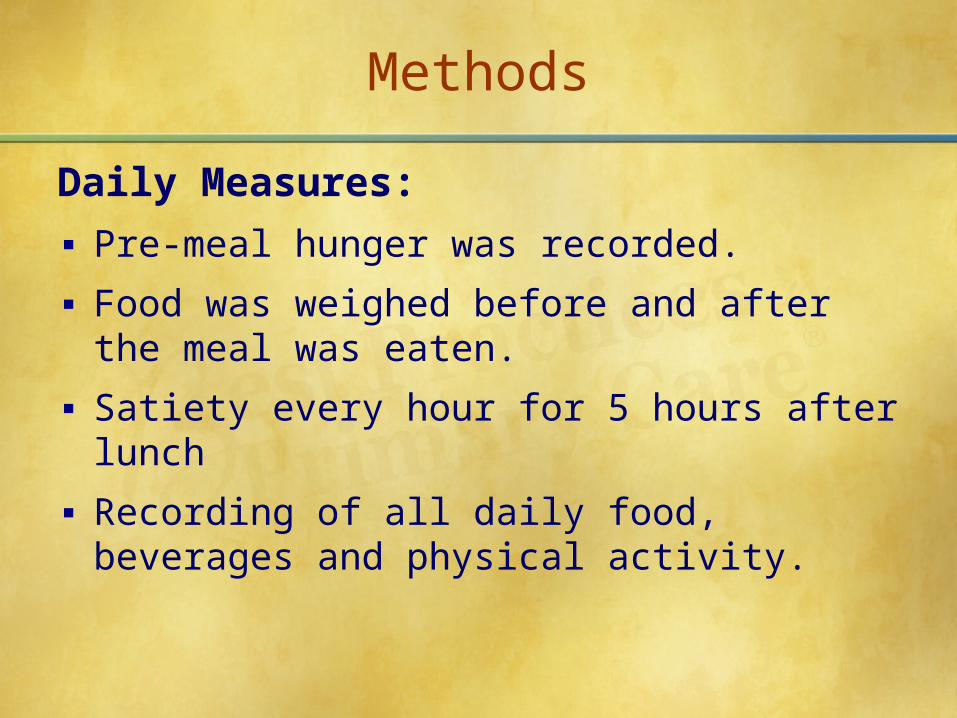
Methods
Daily Measures:
▪ Pre-meal hunger was recorded.
▪ Food was weighed before and after the meal was eaten.
▪ Satiety every hour for 5 hours after lunch
▪ Recording of all daily food, beverages and physical activity.

Methods
Day: 1 2 3 4 5 6 7 8 9 10 11
Washout Washout Washout
Day: 1 2 3 4 5 6 7 8 9 10 11
Washout Washout Washout
First Group Schedule:
Second Group Schedule:
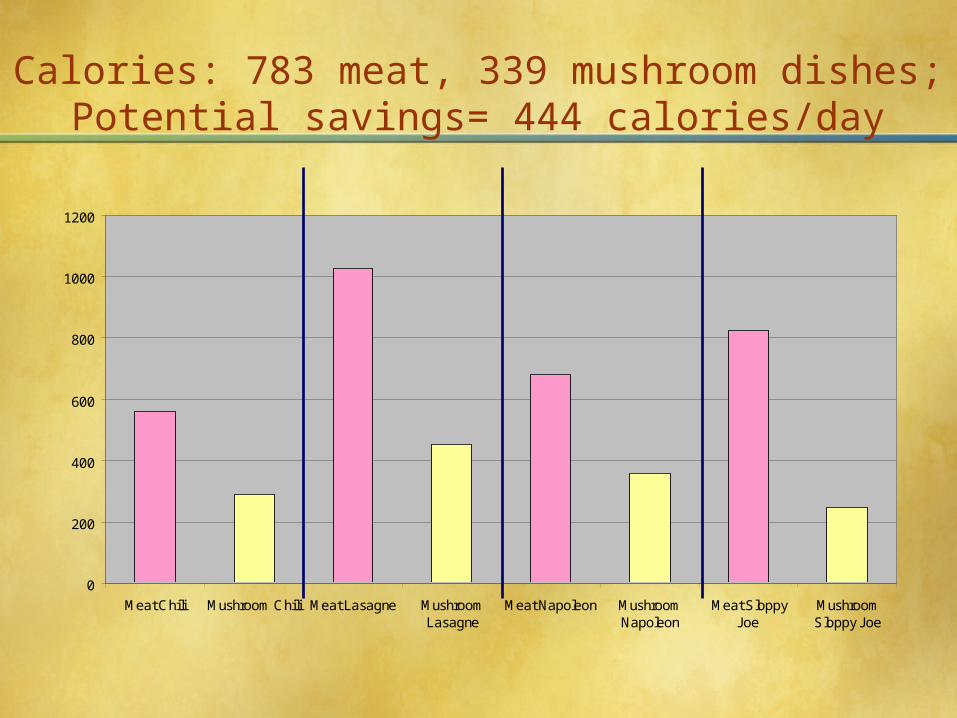
Calories: 783 meat, 339 mushroom dishes;Potential savings= 444 calories/day
0
200
400
600
800
1000
1200
Meat Chili Mushroom Chili Meat Lasagne MushroomLasagne
Meat Napoleon MushroomNapoleon
Meat SloppyJoe
MushroomSloppy Joe

Fat grams per serving
0
10
20
30
40
50
60
70
Meat Chili MushroomChili
MeatLasagne
MushroomLasagne
MeatNapoleon
MushroomNapoleon
Meat SloppyJoe
MushroomSloppy Joe

MUSHROOM LASAGNE INGREDIENTS
8 strips Rippled Edged Lasagne Noodles4 tbs. Butter or Margarine8 oz. Mozzarella Cheese, thinly sliced1/2 tsp. Salt1/2 cup Parmesan Cheese, grated2 lbs. Fresh White Mushrooms3 -8oz. cans Tomato Sauce12 oz. Ricotta or Cottage Cheese1/8 tsp. Ground Black Pepper
DIRECTIONS
Cook noodles following package directions; drain and set aside. Rinse, pat dry and slice mushrooms (makes about 10 cups). In large skillet heat butter; add mushrooms and sauté for 5 minutes. Drain off any mushroom liquid. Butter a 12 x 9-x 2-inch casserole. Cover bottom with 1 can of the tomato sauce. Top with 4 strips of the cooked noodles, overlapping edges slightly. Arrange half of the Mozzarella over the noodles and spoon half of the mushrooms over the cheese. Combine 1 can of the tomato sauce with Ricotta Cheese, salt and black pepper. Spoon half of the cheese and tomato mixture over the mushrooms. Sprinkle with half of the Parmesan cheese. Repeat. Place in a preheated moderate over (350 deg.) for 30 minutes or until bubbly. Let stand 10 minutes before serving.
YIELD: 6 Portions

Results
▪ There was no change in ratings of hunger, satiety, or palatability between meat and mushroom entrees
Hunger
Post-meal Fullness
General Sense of Fullness
Ease of Control Over Eating
Cravings For Foods
Urgency to Eat

Average Daily Consumption, Meat vs Mushroom weeks
(n=54 adults) Meat Week Mushroom Wk
Difference
P-Value
Calories 2014 1635 385/444 0.000
Fat (grams;% of total
intake)
88.4(40%)
60.0(33%)
28.4 0.000
Saturated Fat (grams)
21.5 18.7 2.8 0.099
Carbohydrates (grams)
201 206 5 Not significa
nt
Fiber (grams)
16(3.195%)
18(4.37%)
1.77 0.207
Protein (grams;% of total intake)
105(21%)
68(17%)
37 0.000

Overall Results
Total daily energy intake was significantly greater in the meat condition (2014 kcal) than in the mushrooms (1635 kcal)
Undercompensation for Fat and Calories:▪ Calorie compensation was 14%
▪ Fat compensation was 7%
▪ Saturated fat compensation was 50%
▪ Protein compensation was 10%
▪ Carbohydrate compensation was 100%

Duration of Results
▪ No compensation for the caloric reduction by eating more or exercising less
• either later that day (short-term)
• or over 4 days (intermediate term)

Benefit for weight control?▪ Lean individuals compensated for the calories saved
during the mushroom week more than overweight and obese individuals
▪ When adjusted for exercise, lean people compensate even more, but overweight and obese do not (thus lean people will not lose significant weight from eating mushrooms)
▪ Therefore, overweight or obese people will benefit the most from substituting mushrooms for meat.
Lean Overweight Obese
n = 23 n = 18 n = 13
23% Caloric Compensation
6.3% Caloric Compensation
1.1% Caloric Compensation

Conclusion: These results strongly suggest that the substitution of low ED mushroom foods for high ED foods such as beef, in otherwise similar recipes, can be an effective method for reducing daily energy intake.
FatCalories
Average Compensation
Meat/Mush Difference
0
100
200
300
400
500

Implications:
▪ Do these savings in calories persist beyond a week? (Encouraging in this was that the degree of energy compensation did not appear to increase from day 1 to day 4 of the mushroom substitution, nor was there compensation over the weekend between mushroom and meat weeks. )
▪ Based on the above findings, the effect of consuming a single mushroom-substituted meal 4x/week would be to lose 20 lbs in a year.
▪ These projections were tested in a long-term study
Inflammation and Mushrooms
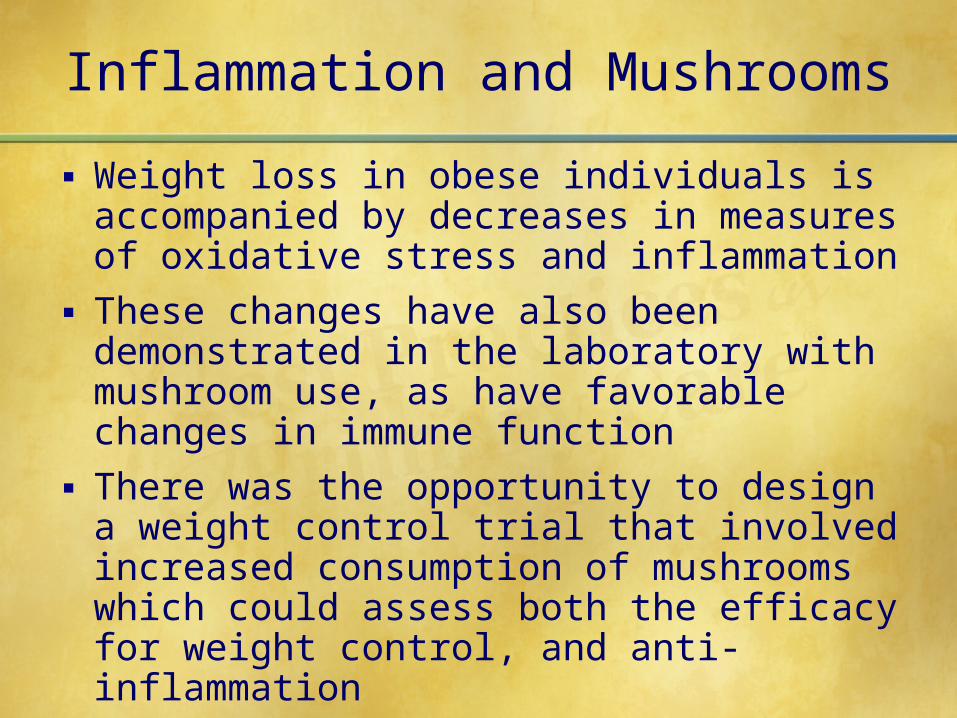
▪ Weight loss in obese individuals is accompanied by decreases in measures of oxidative stress and inflammation
▪ These changes have also been demonstrated in the laboratory with mushroom use, as have favorable changes in immune function
▪ There was the opportunity to design a weight control trial that involved increased consumption of mushrooms which could assess both the efficacy for weight control, and anti-inflammation

Follow-up study:
▪ Built on the experimental results above to perform a controlled, but naturalistic study of the longer-term effect on body weight, weight maintenance, and appetite of mushroom substitution for high ED foods like meats
▪ Added measures to assess the synergistic effects of mushroom consumption on levels of oxidative stress/ inflammation
▪ Inclusion of an active weight loss control group (retested after initial weight loss) that does not use mushrooms allowed separation of these 2 effects (weight loss and anti-inflammation)

Follow-up study design:
▪ Study Design: Randomized, controlled, parallel group, 1-year clinical weight-control trial.
▪ Population: Mushroom-eating adult men and women, overweight or obese (BMI 25-40), seeking weight loss
▪ n = 80 adults (based on previous weight loss studies showing that wt loss was 3 x as great on low ED (low fat, high fiber) diets.
Follow-up study design:
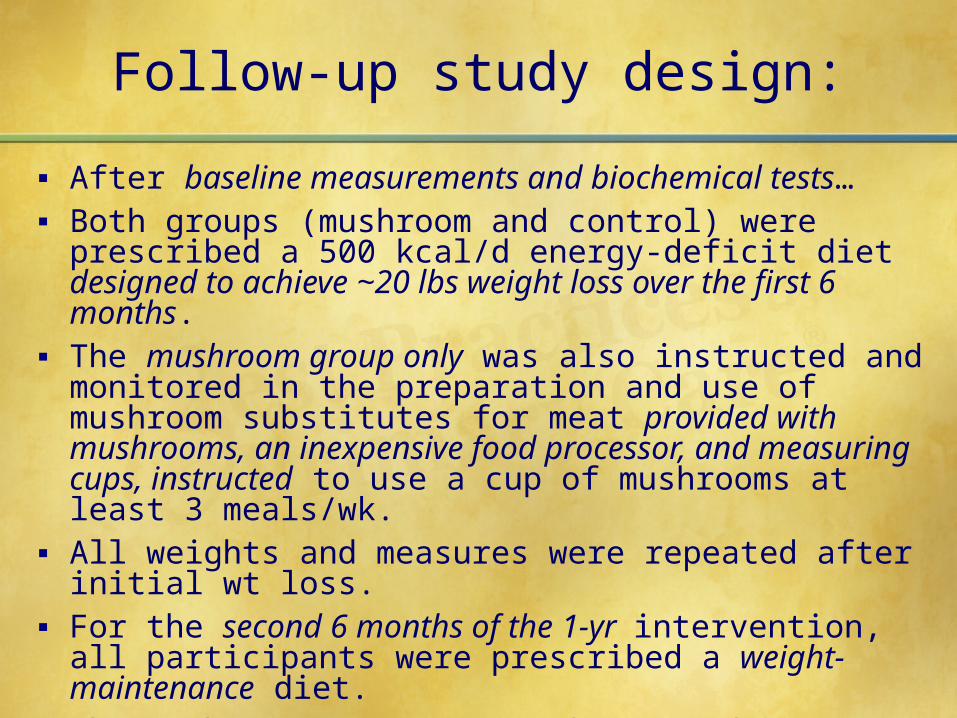
▪ After baseline measurements and biochemical tests…▪ Both groups (mushroom and control) were prescribed a 500
kcal/d energy-deficit diet designed to achieve ~20 lbs weight loss over the first 6 months.
▪ The mushroom group only was also instructed and monitored in the preparation and use of mushroom substitutes for meat provided with mushrooms, an inexpensive food processor, and measuring cups, instructed to use a cup of mushrooms at least 3 meals/wk.
▪ All weights and measures were repeated after initial wt loss.▪ For the second 6 months of the 1-yr intervention, all
participants were prescribed a weight-maintenance diet. ▪ The mushroom group continued using mushrooms. ▪ Food and physical activity logs were completed periodically to
describe changes in consumption patterns.

Follow-up study design:
BASELINE DATA COLLECTION: Anthropometric measures - body weight, BMI, waist circumference, total percent body fat measuresBlood Collection for biochemical measures – Blood glucose, lipid panel, IL-6, CRP and oxd LDLFood Records – 7 day food records

Follow-up study: Intervention
The mushroom group only was instructed and monitored in the preparation and use of mushroom substitutes for meat and other high ED foods, provided with recipes to incorporate mushrooms in their diet
Follow-up study: Phases
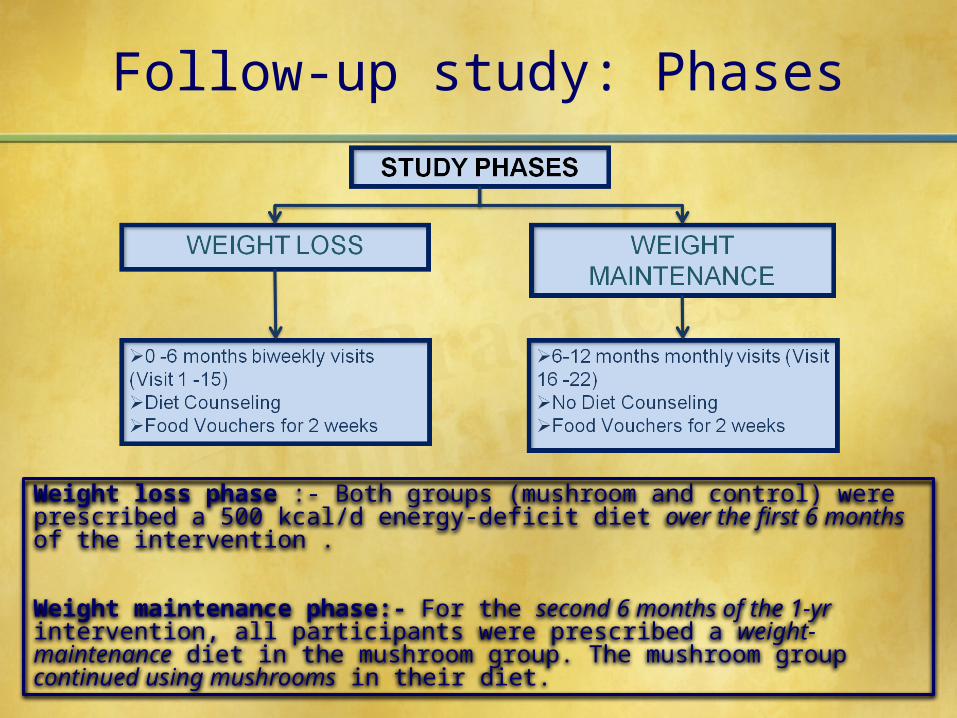
Weight loss phase :- Both groups (mushroom and control) were prescribed a 500 kcal/d energy-deficit diet over the first 6 months of the intervention .
Weight maintenance phase:- For the second 6 months of the 1-yr intervention, all participants were prescribed a weight-maintenance diet in the mushroom group. The mushroom group continued using mushrooms in their diet.

Follow-up study: Data Collection and Analysis
After baseline measurements and biochemical tests at Visit 1…
All the measures & biochemical tests were repeated at Visits 8, 15 & 22
Food and physical activity logs were completed at these visits to describe changes in consumption patterns.
In addition to this, at every visit participants were asked to complete a questionnaire to assess their compliance with mushroom intake
Multivariate analysis of variance and paired sample t-test was used to analyze the data

Positive effect of white button mushrooms when substituted for meat on body weight and composition changes during weight loss and weight maintenance – A one-year randomized clinical trial.
Kavita H. Poddar, PhD,RD1; Meghan Ames, MSPH, RD1; Hsin-Jen Chen2, Mary-Jo Feeney, MS, RD3; Youfa Wang, MD, PhD2; Lawrence J. Cheskin, MD1
1Department of Health Behavior and Society, Johns Hopkins Bloomberg School of Public Health, Baltimore, MD 21205 2Department of International Health, Johns Hopkins Bloomberg School of Public Health, Baltimore, MD 21205
3Consultant to Food and Agricultural Industries, Los Altos, CA 94024 USA
SUBJECTS AND METHODS
The study protocol was approved by the Institutional Review Board at the Johns Hopkins University, Bloomberg School of Public Health.
This was a single blinded randomized clinical trial
The study enrolled 209 overweight/obese (BMI 25-40) adult male & female participants who reported a desire to lose weight. Final analysis included 74 participants, for a drop-out rate of 65% after 12 months
INTRODUCTION
In the United States, weight gain and subsequent development of obesity is reaching epidemic proportions across race, gender and age groups and can be attributed to positive energy balance (1, 2).
American diets are high in fat and energy density making passive overconsumption of energy inevitable, leading to weight gain and obesity (3,4).
Concomitantly, the consumption of red and processed meats has risen significantly in the US, & are associated with high saturated fat and cholesterol making it one of the major contributor of high energy dense food (5).
Substituting high energy dense foods with low energy
dense foods is one obvious strategy to lose weight and improve body composition while providing high nutrient quality & satiety(6).
One study showed that substituting edible mushrooms for meat in the diets of participants lowered total short-term energy intake by nearly 20% in normal, overweight and obese individuals (7).
Current study assesses weight loss and weight maintenance efficacy with white button mushrooms as a substitute for meat over a period of one year & builds on the experimental results of the short-term study described above
DISCUSSION
CONCLUSION
Treatment with mushrooms was associated with high satiety without compromising palatability (7) and current results support the potential utility of mushrooms as a low calorie substitute for red meat in overweight or obese
This substitution can help to reduce total energy and fat intake
The more general strategy of substituting low energy-density foods for energy-dense foods will prove to be an effective method for promoting weight loss and body composition improvement
Paverage of 2.2 pounds, or 1.1% of starting weight was lost .
Waist circumference decreased in individuals on the mushroom diet -- a clinically significant mean of 2 inches during the 6-month weight loss phase compared to 1 inch in standard diet
Following initial weight loss, those who followed mushroom-rich diet, maintained their weight loss and lost an additional 0.5 inches in waist circumference versus those following the standard diet gained an average of almost 5 inches in waist circumference
At the end of 12-month study participants on mushroom rich diet weighed a mean of 7 lbs less, had lowered mean BMI by 1.5 kg/m2, lowered mean waist circumference by 2.5 inches, and lowered mean percent body fat by 0.8% compared to baseline
Overconsumption of energy-dense foods high in fat are associated with overweight status(7) & current results support previous findings
Individuals who followed the mushroom-substituted diet pattern had lower energy & fat intake versus those who followed standard diet
nts in mushroom diet lost an average of 7.0 pounds, or 3.6% of their
articipastarting weight compared to participants in standard diet where
REFERENCES
1. Flegal, K. M., Carroll, M. D., Ogden, C. L., & Curtin, L. R. (2010). Prevalence and trends in obesity among US adults, 1999–2008. JAMA, 303(3), 235–41.
2. Ogden, C. L., Carroll, M. D., Curtin, L. R., Lamb, M. M., & Flegal, K. M. (2010). Prevalence of high body mass index in US children and adolescents, 2007–2008. JAMA, 303(3), 242–9.
3. Prentice, A., & Jebb, S. (2004). Energy intake/physical activity interactions in the homeostasis of body weight regulation. Nutr Rev, 2004, 62, S98-104.
4. Ershow, A.G. (2009). Environmental influences on development of type 2 diabetes and obesity: challenges in personalizing prevention and management. J Diabetes Sci Technol, 3, 727-34.
5. Wang, Y., Beydoun, M. A., Caballero, B., Gary, T. L., & Lawrence, R. (2010). Trends and correlates in meat consumption patterns in the US adult population. Public Health Nutr, 13(9), 1333-45.
6. Wang, Y., Beydoun, M. A. (2009). Meat consumption is associated with obesity and central obesity among US adults..Int J Obes, 33(6), 621-8.
7. Cheskin, L. J., Davis, L. M., Lipsky, L. M., Mitola, A. H., Lycan, T., Mitchell, V., et al. (2008). Lack of energy compensation over 4 days when white button mushrooms are substituted for beef. Appetite, 51, 50-57.
RECRUITMENT
Advertisements through the local newspaper (Baltimore Sun, City Paper), flyers posted around the campus and at local sites (supermarket bulletin boards)
OBJECTIVES
To assess body weight changes at the end of weight loss and weight maintenance phase
To assess BMI, total percent body fat & waist circumference changes at the end of weight loss and weight maintenance phase
To assess macronutrient intake of the participants in the mushroom versus meat diet group at the end of weight loss and weight-maintenance phases of the study
RESULTS
INTERVENTION, STUDY PHASES & DATA COLLECTION
MACRONUTRIENT INTAKE
Table 1: Estimated marginal mean change in macronutrient and fiber intake from baseline to endpoint for participants in the Meat Vs. Mushroom group a
Variable Meat Diet (n=17) Mushroom Diet (n=17)
P Value
Baseline to the end of weight maintenance (0 - 12 months)
Total average calorie intake (kcals/day)a
132.48 ± 94.99
-122.69 ± 112.87 0.092
Total average carbohydrate intake (g/day) a
36.03 ± 11.27 -7.65 ± 13.39 0.017*
Total average protein intake (g/day) a
-8.01 ± 5.24 -13.09 ± 6.22 0.535
Total average fat intake (g/day) a 2.17 ± 5.79 -4.25 ± 6.88 0.480
Total average fiber intake (g/day) a
0.16 ± 1.10 -1.09 ± 1.30 0.468
aMultivariate analysis of variance; P<0.05; means expressed as estimated marginal mean±standard error (SE); Significant at P<0.05*.
BODY COMPOSITION CHANGES
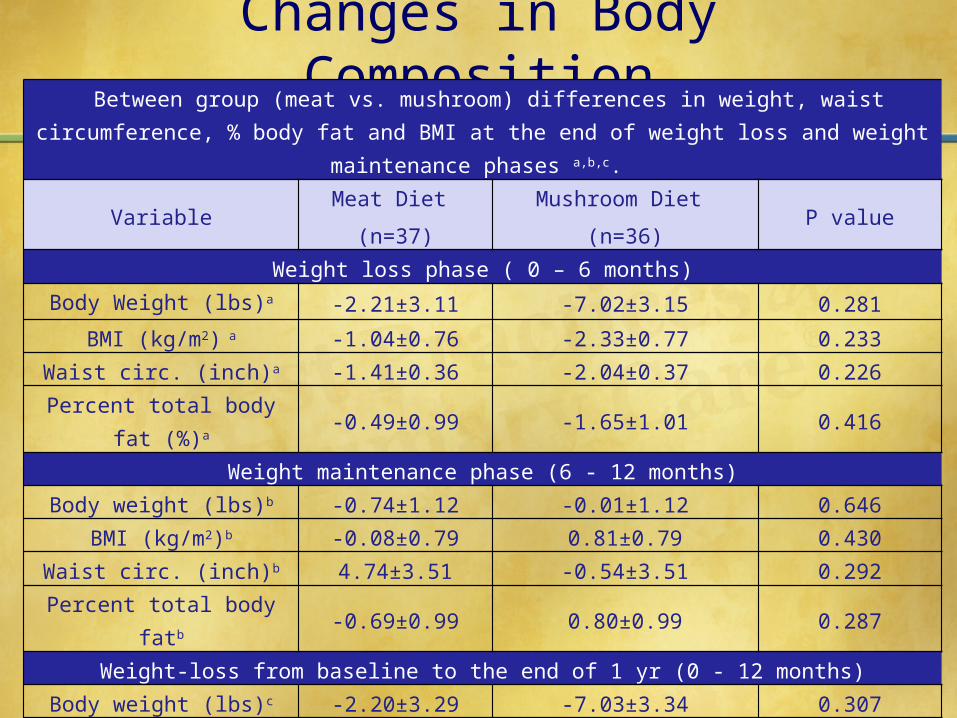
Table 2: Between group (meat vs. mushroom) differences in mean weight, waist circumference, percent body fat and BMI changes for participants at the end of weight loss and weight maintenance phases a,b,c.
VariableMeat Diet
(n=37)Mushroom Diet
(n=36)P value
Weight loss phase ( 0 – 6 months)Body Weight (lbs)a
-2.21±3.11 -7.02±3.15 0.281
BMI (kg/m2) a -1.04±0.76 -2.33±0.77 0.233
Waist circ. (inch)a -1.41±0.36 -2.04±0.37 0.226
Percent total body fat (%)a -0.49±0.99 -1.65±1.01 0.416
Weight maintenance phase (6 - 12 months)
Body weight (lbs)b
-0.74±1.12 -0.01±1.12 0.646
BMI (kg/m2)b -0.08±0.79 0.81±0.79 0.430
Waist circ. (inch)b 4.74±3.51 -0.54±3.51 0.292
Percent total body fatb -0.69±0.99 0.80±0.99 0.287
Weight-loss from baseline to the end of 1 yr (0 - 12 months)
Body weight (lbs)c
-2.20±3.29 -7.03±3.34 0.307
BMI (kg/m2)c -1.00±0.36 -1.53±0.36 0.308
Waist circ. (inch)c 3.32±3.42 -2.58±3.47 0.230
Percent total body fatc -1.01±0.52 -0.85±0.53 0.823
aMultivariate analysis of variance; P<0.05; means expressed as estimated marginal mean±standard error (SE); Analysis includes first 6 months of intervention (weight loss phase). bMultivariate analysis of variance; P<0.05; means expressed as estimated marginal mean±standard error (SE); Analysis includes second 6 months of intervention (weight maintenance phase).cMultivariate analysis of variance; P<0.05; means expressed as estimated marginal mean±standard error (SE); Analysis includes baseline 0 months of intervention to end of the weight maintenance phase 12 months.
Program No. 852.4
Screening and Randomization

Results of Long-Term Study
Those on the mushroom diet lost an average of 7.0 pounds, or 3.6% of their starting weight ; those on the standard diet lost an average of 2.2 pounds, or 1.1% of starting weight
Waist circumference decreased on the mushroom diet -- a clinically significant mean of 2 inches during the 6-month weight loss phase compared to 1 inch on the standard diet
Following initial weight loss, those who followed the mushroom-rich diet maintained their weight loss and lost an additional 0.5 inches in waist circumference versus those following the standard diet who gained an average of almost 5 inches in waist circumference
At the end of 12-month study, those on the mushroom-rich diet weighed a mean of 7 lbs less, had lowered mean BMI by 1.5 kg/m2, lowered mean waist circumference by 2.5 inches, and lowered mean percent body fat by 0.8% compared to baseline
Individuals who followed the mushroom-substituted diet pattern had lower energy & fat intake versus those who followed the standard diet

Results of Long-Term Study

Baseline Macronutrient Content
Variable Baseline intake (Meat)
Baseline intake (Mushroom)
P Value
(NS = not significant)
Total average calorie intake (kcals/day)a
1398.44±107.36 1513.34±107.36 NS
Total average carbohydrate intake (g/day) a
152.25±12.71 172.40±12.71 NS
Total average protein intake (g/day) a
69.00±5.40 69.03±6.12 NS
Total average fat intake (g/day) a 59.09±5.77 62.82±5.77
NS
aMultivariate analysis of variance; means expressed as estimated marginal mean ± standard error (SE)
Changes in Dietary Macronutrients
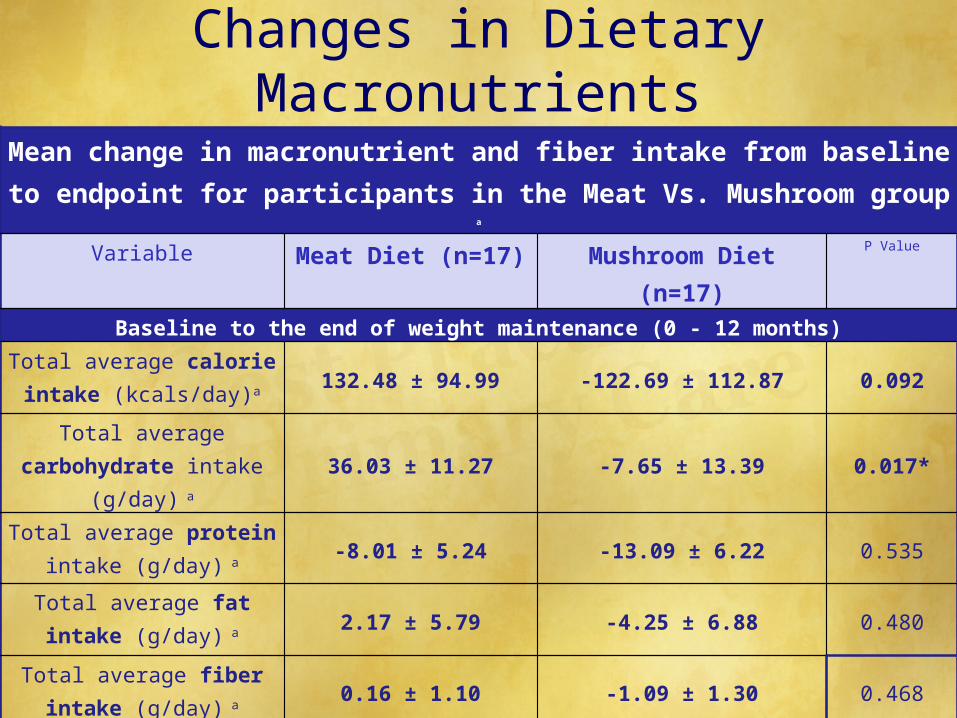
Mean change in macronutrient and fiber intake from baseline to endpoint for participants in the Meat Vs. Mushroom group a
Variable Meat Diet (n=17) Mushroom Diet (n=17) P Value
Baseline to the end of weight maintenance (0 - 12 months)Total average calorie intake
(kcals/day)a 132.48 ± 94.99 -122.69 ± 112.87 0.092
Total average carbohydrate intake (g/day) a 36.03 ± 11.27 -7.65 ± 13.39 0.017*
Total average protein intake (g/day) a -8.01 ± 5.24 -13.09 ± 6.22 0.535
Total average fat intake (g/day) a 2.17 ± 5.79 -4.25 ± 6.88 0.480
Total average fiber intake (g/day) a 0.16 ± 1.10 -1.09 ± 1.30 0.468
aMultivariate analysis of variance; P<0.05; means expressed as estimated marginal mean±standard error (SE); Significant at P<0.05*.
Changes in Body Composition Between group (meat vs. mushroom) differences in weight, waist circumference, % body fat
and BMI at the end of weight loss and weight maintenance phases a,b,c.
VariableMeat Diet
(n=37)
Mushroom Diet
(n=36)P value
Weight loss phase ( 0 – 6 months)Body Weight (lbs)a -2.21±3.11 -7.02±3.15 0.281
BMI (kg/m2) a -1.04±0.76 -2.33±0.77 0.233Waist circ. (inch)a -1.41±0.36 -2.04±0.37 0.226
Percent total body fat (%)a -0.49±0.99 -1.65±1.01 0.416
Weight maintenance phase (6 - 12 months)Body weight (lbs)b -0.74±1.12 -0.01±1.12 0.646
BMI (kg/m2)b -0.08±0.79 0.81±0.79 0.430Waist circ. (inch)b 4.74±3.51 -0.54±3.51 0.292
Percent total body fatb -0.69±0.99 0.80±0.99 0.287
Weight-loss from baseline to the end of 1 yr (0 - 12 months)Body weight (lbs)c -2.20±3.29 -7.03±3.34 0.307
BMI (kg/m2)c -1.00±0.36 -1.53±0.36 0.308Waist circ. (inch)c 3.32±3.42 -2.58±3.47 0.230
Percent total body fatc -1.01±0.52 -0.85±0.53 0.823aMultivariate analysis of variance; P<0.05; means expressed as estimated marginal mean±standard error (SE); Analysis includes first 6 months of
intervention (weight loss phase). bMultivariate analysis of variance; P<0.05; means expressed as estimated marginal mean±standard error (SE); Analysis includes second 6 months of
intervention (weight maintenance phase).cMultivariate analysis of variance; P<0.05; means expressed as estimated marginal mean±standard error (SE); Analysis includes baseline 0 months of
intervention to end of the weight maintenance phase 12 months.

Conclusions
Participants following a mushroom-rich diet lost an average of 7.0 pounds, or 3.6% of their starting weight, compared to the standard diet where average loss was 2.2 pounds, or 1.1% of starting weight
Waist circumference decreased in individuals on the mushroom diet -- a clinically significant mean of 2 inches during the 6-month weight loss phase, compared to 1 inch on the standard diet
Following initial weight loss, those who followed the mushroom-rich diet maintained their weight loss, and lost an additional 0.5 in waist circumference; those on the standard diet gained an average of almost 5 inches in waist circumference
At the end of our 12-month study, those on the mushroom rich diet weighed a mean of 7 lbs less, had lowered mean BMI by 1.5 kg/m2, lowered mean waist circumference by 2.5 inches, and lowered mean percent body fat by 0.8% compared to baseline
It was known that consumption of energy-dense foods high in fat is associated with overweight. The current study also finds poorer results when attempting weight loss
Individuals who followed the mushroom-substituted diet pattern had lower energy & fat intake, and better success at losing weight and maintaining that loss

Take-Home Message
▪ The work you are engaged in every day has the power to help combat an important and pervasive social issue: obesity

Thank you!


![[Psilocybin]Mushrooms - The Journal of Mushroom Cultivation No55 PDF](https://img.pdfslide.net/doc/110x75/5475c184b4af9fb40a8b5dd3/psilocybinmushrooms-the-journal-of-mushroom-cultivation-no55-pdf.jpg)