Embed Size (px)
Citation preview

The androgen receptor cistromeis extensively reprogrammed inhuman prostate tumorigenesis
The Harvard community has made thisarticle openly available. Please share howthis access benefits you. Your story matters
Citation Pomerantz, M. M., F. Li, D. Takeda, R. Lenci, A. Chonkar, M. Chabot,P. Cejas, et al. 2015. “The androgen receptor cistrome is extensivelyreprogrammed in human prostate tumorigenesis.” Nature genetics47 (11): 1346-1351. doi:10.1038/ng.3419. http://dx.doi.org/10.1038/ng.3419.
Published Version doi:10.1038/ng.3419
Citable link http://nrs.harvard.edu/urn-3:HUL.InstRepos:27320237
Terms of Use This article was downloaded from Harvard University’s DASHrepository, and is made available under the terms and conditionsapplicable to Other Posted Material, as set forth at http://nrs.harvard.edu/urn-3:HUL.InstRepos:dash.current.terms-of-use#LAA
The androgen receptor cistrome is extensively reprogrammed in human prostate tumorigenesis
Mark M. Pomerantz1, Fugen Li2,3, David Takeda1,4, Romina Lenci1, Apurva Chonkar1, Matthew Chabot1, Paloma Cejas1,2, Francisca Vazquez4, Jennifer Cook1, Ramesh A. Shivdasani1,2, Michaela Bowden5, Rosina Lis5, William C. Hahn1,4, Philip W. Kantoff1, Myles Brown1,2, Massimo Loda5, Henry W. Long1,2, and Matthew L. Freedman1,2,4
1Department of Medical Oncology, Dana-Farber Cancer Institute and Harvard Medical School, Boston, Massachusetts, USA
2Center for Functional Cancer Epigenetics, Dana-Farber Cancer Institute, Boston, Massachusetts, USA
3Department of Biostatistics and Computational Biology, Dana-Farber Cancer Institute, Boston, Massachusetts, USA
4The Eli and Edythe L. Broad Institute, Cambridge, Massachusetts, USA
5Department of Pathology, Brigham and Women’s Hospital and Harvard Medical School, Boston, Massachusetts, USA
Abstract
Master transcription factors interact with DNA to establish cell-type identity and to regulate gene
expression in mammalian cells1,2. The genome-wide map of these transcription factor binding
sites has been termed the cistrome3. Here we show that the androgen receptor (AR) cistrome
undergoes extensive reprogramming during prostate epithelial transformation in man. Using
human prostate tissue, we observed a core set of AR binding sites that are consistently
reprogrammed in tumors. FOXA1 and HOXB13, co-localized with the reprogrammed AR sites in
human tumor tissue. Introduction of FOXA1 and HOXB13 into an immortalized prostate cell line
Users may view, print, copy, and download text and data-mine the content in such documents, for the purposes of academic research, subject always to the full Conditions of use:http://www.nature.com/authors/editorial_policies/license.html#terms
Correspondence to: [email protected] (M.L.F.).M.M.P., F.L. and D.T. contributed equally to this work.
URLs. The Cancer Genome Atlas data, https://tcga-data.nci.nih.gov/tcga/tcgaDownload.jsp ; Broad Institute Project Achilles, www.broadinstitute.org/achilles ; R package, www.r-project.org; Consensus signal artifact (Velcro) regions, http://hgdownload.cse.ucsc.edu/goldenPath/hg19/encodeDCC/wgEncodeMapability/wgEncodeDacMapabilityConsensusExcludable.bed.gz ; Genomic Regions Enrichment of Annotations Tool (GREAT), http://bejerano.stanford.edu/great/public/html/ ;
Accession codes. Gene Expression Omnibus – GSE70079
Author Contributions. M.M.P designed the study, performed ChIP-seq assays, analyzed data and wrote the manuscript. F.L. analyzed ChIP-seq data and performed biostatistical analysis. D.T. performed shRNA an gene transduction experiments. A.C. and M.C. performed ChIP-seq experiments. P.C. and J.C. assisted with ChIP-seq assays. R.A.S. participated in analyzing data and composing the manuscript. M.L. M.B. and R.L. perform pathological analysis of radical prostatectomy specimens. W.C.H. and F.V. designed and analyzed Project Achilles and shRNA experiments. P.W.K. supplied radical prostatectomy specimens and participated in study design. M.B. and H.W.L. contributed to study design data analysis and manuscript composition. M.L.F. designed the study, analyzed ChIP-seq data, and wrote the manuscript.
The authors report no competing financial interest.
HHS Public AccessAuthor manuscriptNat Genet. Author manuscript; available in PMC 2016 May 01.
Published in final edited form as:Nat Genet. 2015 November ; 47(11): 1346–1351. doi:10.1038/ng.3419.
Author M
anuscriptA
uthor Manuscript
Author M
anuscriptA
uthor Manuscript
reprogrammed the AR cistrome to resemble that of a prostate tumor, functionally linking these
specific factors to AR reprogramming. These findings offer mechanistic insights into a key set of
events that drive normal prostate epithelium towards transformation and establish the centrality of
epigenetic reprogramming in human prostate tumorigenesis.
Activation of the AR is essential for cell growth and cancer progression in the prostate.
Disruption of androgen metabolism influences prostate cancer incidence, and depletion of
AR ligand has been the foundation of prostate cancer treatment for decades4,5. Yet, the AR’s
role in transformation is unclear. There are, for instance, no recurrent AR genetic alterations
in primary tumors6,7. Although many co-factors influence AR signaling in model
systems8-11, it is unknown which factors are relevant for human prostate tumorigenesis.
Several issues limit a comprehensive understanding of the AR and co-factor binding during
transformation. In contrast to luminal epithelial cells and prostate tumors, most cell line
models of normal prostate epithelium do not express the AR12. Moreover, all currently
available prostate cancer cell lines are derived from metastatic disease and thus may not
adequately model localized disease. Performing AR chromatin immunoprecipitation and
high-throughput sequencing (ChIP-seq) directly in primary human tissue overcomes these
impediments. To this end, we performed an AR cistrome-wide association study (CWAS) in
a cohort of normal and tumor human prostate tissue samples.
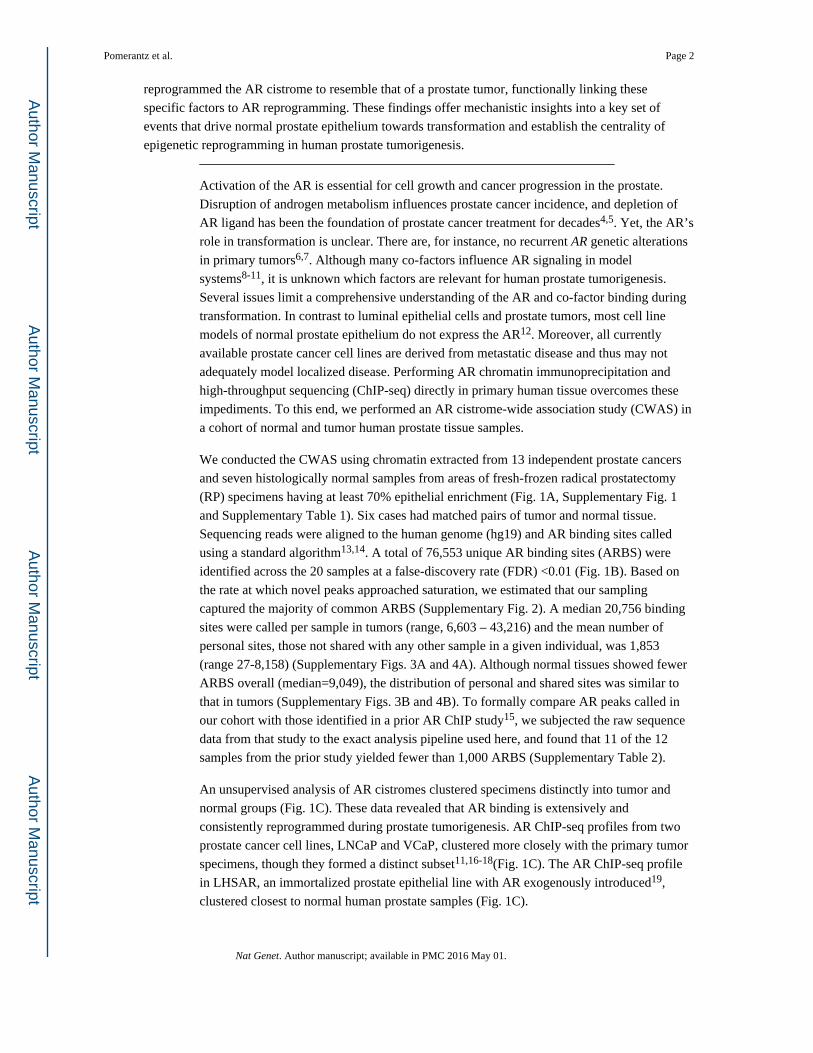
We conducted the CWAS using chromatin extracted from 13 independent prostate cancers
and seven histologically normal samples from areas of fresh-frozen radical prostatectomy
(RP) specimens having at least 70% epithelial enrichment (Fig. 1A, Supplementary Fig. 1
and Supplementary Table 1). Six cases had matched pairs of tumor and normal tissue.
Sequencing reads were aligned to the human genome (hg19) and AR binding sites called
using a standard algorithm13,14. A total of 76,553 unique AR binding sites (ARBS) were
identified across the 20 samples at a false-discovery rate (FDR) <0.01 (Fig. 1B). Based on
the rate at which novel peaks approached saturation, we estimated that our sampling
captured the majority of common ARBS (Supplementary Fig. 2). A median 20,756 binding
sites were called per sample in tumors (range, 6,603 – 43,216) and the mean number of
personal sites, those not shared with any other sample in a given individual, was 1,853
(range 27-8,158) (Supplementary Figs. 3A and 4A). Although normal tissues showed fewer
ARBS overall (median=9,049), the distribution of personal and shared sites was similar to
that in tumors (Supplementary Figs. 3B and 4B). To formally compare AR peaks called in
our cohort with those identified in a prior AR ChIP study15, we subjected the raw sequence
data from that study to the exact analysis pipeline used here, and found that 11 of the 12
samples from the prior study yielded fewer than 1,000 ARBS (Supplementary Table 2).
An unsupervised analysis of AR cistromes clustered specimens distinctly into tumor and
normal groups (Fig. 1C). These data revealed that AR binding is extensively and
consistently reprogrammed during prostate tumorigenesis. AR ChIP-seq profiles from two
prostate cancer cell lines, LNCaP and VCaP, clustered more closely with the primary tumor
specimens, though they formed a distinct subset11,16-18(Fig. 1C). The AR ChIP-seq profile
in LHSAR, an immortalized prostate epithelial line with AR exogenously introduced19,
clustered closest to normal human prostate samples (Fig. 1C).
Pomerantz et al. Page 2
Nat Genet. Author manuscript; available in PMC 2016 May 01.
Author M
anuscriptA
uthor Manuscript
Author M
anuscriptA
uthor Manuscript
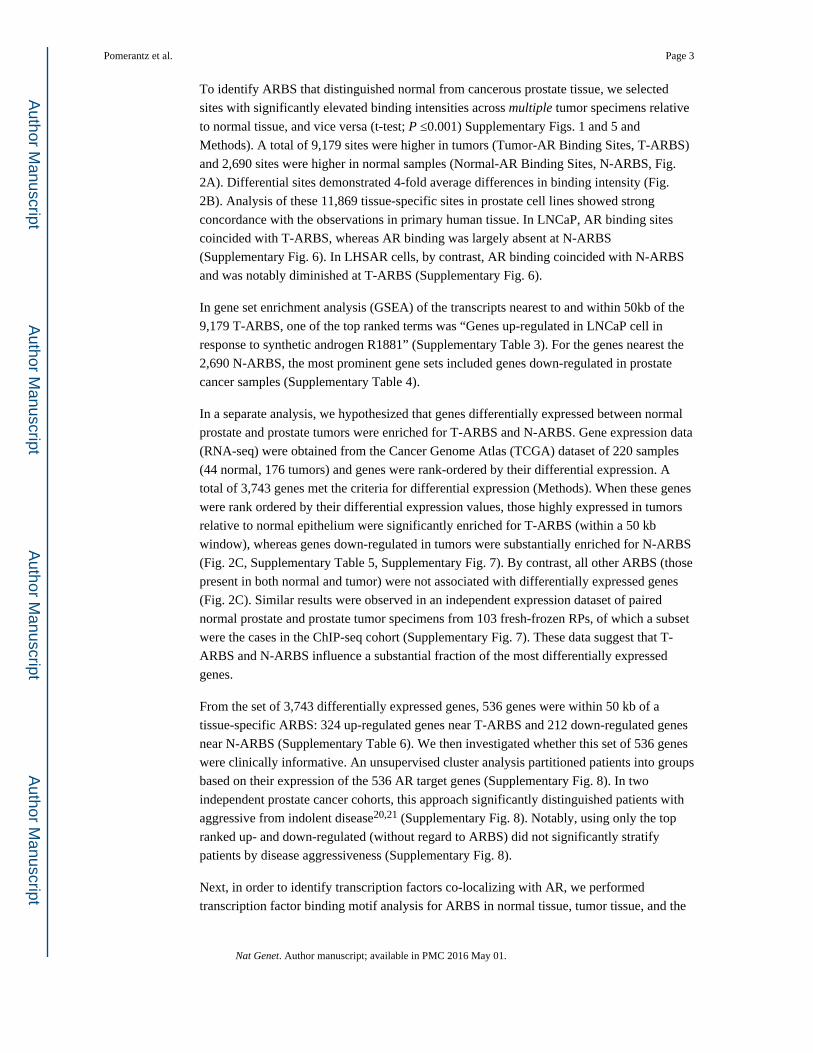
To identify ARBS that distinguished normal from cancerous prostate tissue, we selected
sites with significantly elevated binding intensities across multiple tumor specimens relative
to normal tissue, and vice versa (t-test; P ≤0.001) Supplementary Figs. 1 and 5 and
Methods). A total of 9,179 sites were higher in tumors (Tumor-AR Binding Sites, T-ARBS)
and 2,690 sites were higher in normal samples (Normal-AR Binding Sites, N-ARBS, Fig.
2A). Differential sites demonstrated 4-fold average differences in binding intensity (Fig.
2B). Analysis of these 11,869 tissue-specific sites in prostate cell lines showed strong
concordance with the observations in primary human tissue. In LNCaP, AR binding sites
coincided with T-ARBS, whereas AR binding was largely absent at N-ARBS
(Supplementary Fig. 6). In LHSAR cells, by contrast, AR binding coincided with N-ARBS
and was notably diminished at T-ARBS (Supplementary Fig. 6).
In gene set enrichment analysis (GSEA) of the transcripts nearest to and within 50kb of the
9,179 T-ARBS, one of the top ranked terms was “Genes up-regulated in LNCaP cell in
response to synthetic androgen R1881” (Supplementary Table 3). For the genes nearest the
2,690 N-ARBS, the most prominent gene sets included genes down-regulated in prostate
cancer samples (Supplementary Table 4).
In a separate analysis, we hypothesized that genes differentially expressed between normal
prostate and prostate tumors were enriched for T-ARBS and N-ARBS. Gene expression data
(RNA-seq) were obtained from the Cancer Genome Atlas (TCGA) dataset of 220 samples
(44 normal, 176 tumors) and genes were rank-ordered by their differential expression. A
total of 3,743 genes met the criteria for differential expression (Methods). When these genes
were rank ordered by their differential expression values, those highly expressed in tumors
relative to normal epithelium were significantly enriched for T-ARBS (within a 50 kb
window), whereas genes down-regulated in tumors were substantially enriched for N-ARBS
(Fig. 2C, Supplementary Table 5, Supplementary Fig. 7). By contrast, all other ARBS (those
present in both normal and tumor) were not associated with differentially expressed genes
(Fig. 2C). Similar results were observed in an independent expression dataset of paired
normal prostate and prostate tumor specimens from 103 fresh-frozen RPs, of which a subset
were the cases in the ChIP-seq cohort (Supplementary Fig. 7). These data suggest that T-
ARBS and N-ARBS influence a substantial fraction of the most differentially expressed
genes.
From the set of 3,743 differentially expressed genes, 536 genes were within 50 kb of a
tissue-specific ARBS: 324 up-regulated genes near T-ARBS and 212 down-regulated genes
near N-ARBS (Supplementary Table 6). We then investigated whether this set of 536 genes
were clinically informative. An unsupervised cluster analysis partitioned patients into groups
based on their expression of the 536 AR target genes (Supplementary Fig. 8). In two
independent prostate cancer cohorts, this approach significantly distinguished patients with
aggressive from indolent disease20,21 (Supplementary Fig. 8). Notably, using only the top
ranked up- and down-regulated (without regard to ARBS) did not significantly stratify
patients by disease aggressiveness (Supplementary Fig. 8).
Next, in order to identify transcription factors co-localizing with AR, we performed
transcription factor binding motif analysis for ARBS in normal tissue, tumor tissue, and the
Pomerantz et al. Page 3
Nat Genet. Author manuscript; available in PMC 2016 May 01.
Author M
anuscriptA
uthor Manuscript
Author M
anuscriptA
uthor Manuscript
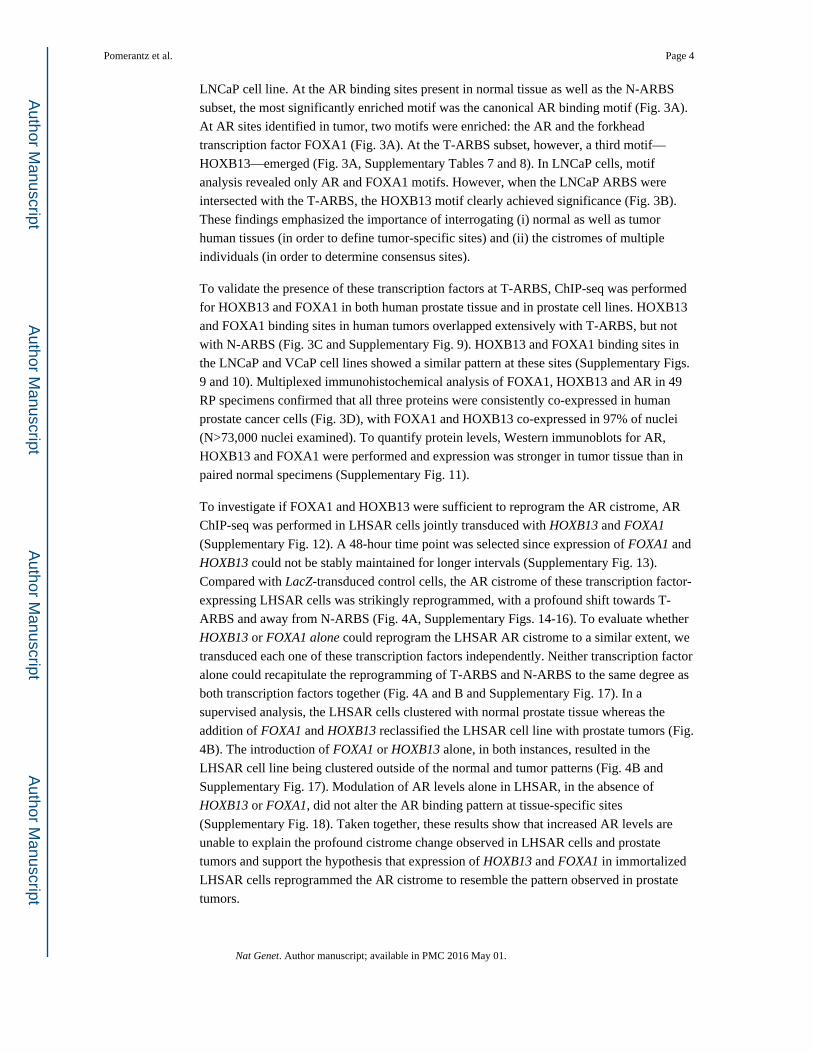
LNCaP cell line. At the AR binding sites present in normal tissue as well as the N-ARBS
subset, the most significantly enriched motif was the canonical AR binding motif (Fig. 3A).
At AR sites identified in tumor, two motifs were enriched: the AR and the forkhead
transcription factor FOXA1 (Fig. 3A). At the T-ARBS subset, however, a third motif—
HOXB13—emerged (Fig. 3A, Supplementary Tables 7 and 8). In LNCaP cells, motif
analysis revealed only AR and FOXA1 motifs. However, when the LNCaP ARBS were
intersected with the T-ARBS, the HOXB13 motif clearly achieved significance (Fig. 3B).
These findings emphasized the importance of interrogating (i) normal as well as tumor
human tissues (in order to define tumor-specific sites) and (ii) the cistromes of multiple
individuals (in order to determine consensus sites).
To validate the presence of these transcription factors at T-ARBS, ChIP-seq was performed
for HOXB13 and FOXA1 in both human prostate tissue and in prostate cell lines. HOXB13
and FOXA1 binding sites in human tumors overlapped extensively with T-ARBS, but not
with N-ARBS (Fig. 3C and Supplementary Fig. 9). HOXB13 and FOXA1 binding sites in
the LNCaP and VCaP cell lines showed a similar pattern at these sites (Supplementary Figs.
9 and 10). Multiplexed immunohistochemical analysis of FOXA1, HOXB13 and AR in 49
RP specimens confirmed that all three proteins were consistently co-expressed in human
prostate cancer cells (Fig. 3D), with FOXA1 and HOXB13 co-expressed in 97% of nuclei
(N>73,000 nuclei examined). To quantify protein levels, Western immunoblots for AR,
HOXB13 and FOXA1 were performed and expression was stronger in tumor tissue than in
paired normal specimens (Supplementary Fig. 11).
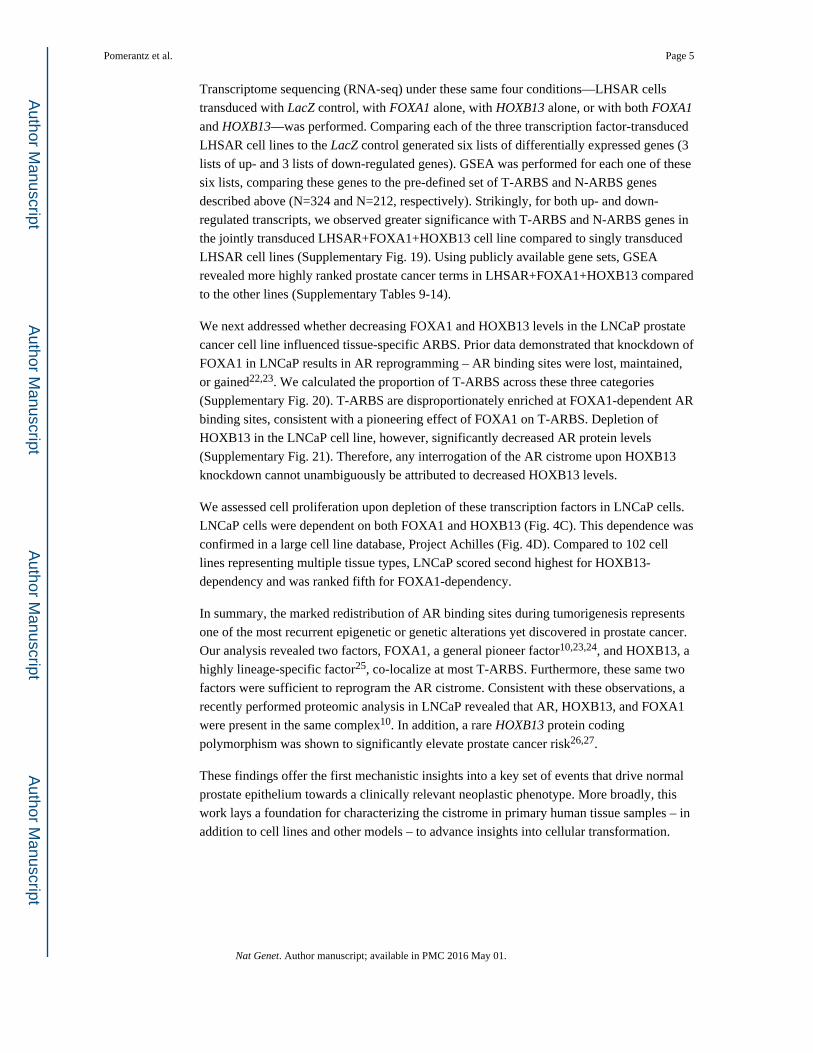
To investigate if FOXA1 and HOXB13 were sufficient to reprogram the AR cistrome, AR
ChIP-seq was performed in LHSAR cells jointly transduced with HOXB13 and FOXA1
(Supplementary Fig. 12). A 48-hour time point was selected since expression of FOXA1 and
HOXB13 could not be stably maintained for longer intervals (Supplementary Fig. 13).
Compared with LacZ-transduced control cells, the AR cistrome of these transcription factor-
expressing LHSAR cells was strikingly reprogrammed, with a profound shift towards T-
ARBS and away from N-ARBS (Fig. 4A, Supplementary Figs. 14-16). To evaluate whether
HOXB13 or FOXA1 alone could reprogram the LHSAR AR cistrome to a similar extent, we
transduced each one of these transcription factors independently. Neither transcription factor
alone could recapitulate the reprogramming of T-ARBS and N-ARBS to the same degree as
both transcription factors together (Fig. 4A and B and Supplementary Fig. 17). In a
supervised analysis, the LHSAR cells clustered with normal prostate tissue whereas the
addition of FOXA1 and HOXB13 reclassified the LHSAR cell line with prostate tumors (Fig.
4B). The introduction of FOXA1 or HOXB13 alone, in both instances, resulted in the
LHSAR cell line being clustered outside of the normal and tumor patterns (Fig. 4B and
Supplementary Fig. 17). Modulation of AR levels alone in LHSAR, in the absence of
HOXB13 or FOXA1, did not alter the AR binding pattern at tissue-specific sites
(Supplementary Fig. 18). Taken together, these results show that increased AR levels are
unable to explain the profound cistrome change observed in LHSAR cells and prostate
tumors and support the hypothesis that expression of HOXB13 and FOXA1 in immortalized
LHSAR cells reprogrammed the AR cistrome to resemble the pattern observed in prostate
tumors.
Pomerantz et al. Page 4
Nat Genet. Author manuscript; available in PMC 2016 May 01.
Author M
anuscriptA
uthor Manuscript
Author M
anuscriptA
uthor Manuscript
Transcriptome sequencing (RNA-seq) under these same four conditions—LHSAR cells
transduced with LacZ control, with FOXA1 alone, with HOXB13 alone, or with both FOXA1
and HOXB13—was performed. Comparing each of the three transcription factor-transduced
LHSAR cell lines to the LacZ control generated six lists of differentially expressed genes (3
lists of up- and 3 lists of down-regulated genes). GSEA was performed for each one of these
six lists, comparing these genes to the pre-defined set of T-ARBS and N-ARBS genes
described above (N=324 and N=212, respectively). Strikingly, for both up- and down-
regulated transcripts, we observed greater significance with T-ARBS and N-ARBS genes in
the jointly transduced LHSAR+FOXA1+HOXB13 cell line compared to singly transduced
LHSAR cell lines (Supplementary Fig. 19). Using publicly available gene sets, GSEA
revealed more highly ranked prostate cancer terms in LHSAR+FOXA1+HOXB13 compared
to the other lines (Supplementary Tables 9-14).
We next addressed whether decreasing FOXA1 and HOXB13 levels in the LNCaP prostate
cancer cell line influenced tissue-specific ARBS. Prior data demonstrated that knockdown of
FOXA1 in LNCaP results in AR reprogramming – AR binding sites were lost, maintained,
or gained22,23. We calculated the proportion of T-ARBS across these three categories
(Supplementary Fig. 20). T-ARBS are disproportionately enriched at FOXA1-dependent AR
binding sites, consistent with a pioneering effect of FOXA1 on T-ARBS. Depletion of
HOXB13 in the LNCaP cell line, however, significantly decreased AR protein levels
(Supplementary Fig. 21). Therefore, any interrogation of the AR cistrome upon HOXB13
knockdown cannot unambiguously be attributed to decreased HOXB13 levels.
We assessed cell proliferation upon depletion of these transcription factors in LNCaP cells.
LNCaP cells were dependent on both FOXA1 and HOXB13 (Fig. 4C). This dependence was
confirmed in a large cell line database, Project Achilles (Fig. 4D). Compared to 102 cell
lines representing multiple tissue types, LNCaP scored second highest for HOXB13-
dependency and was ranked fifth for FOXA1-dependency.
In summary, the marked redistribution of AR binding sites during tumorigenesis represents
one of the most recurrent epigenetic or genetic alterations yet discovered in prostate cancer.
Our analysis revealed two factors, FOXA1, a general pioneer factor10,23,24, and HOXB13, a
highly lineage-specific factor25, co-localize at most T-ARBS. Furthermore, these same two
factors were sufficient to reprogram the AR cistrome. Consistent with these observations, a
recently performed proteomic analysis in LNCaP revealed that AR, HOXB13, and FOXA1
were present in the same complex10. In addition, a rare HOXB13 protein coding
polymorphism was shown to significantly elevate prostate cancer risk26,27.
These findings offer the first mechanistic insights into a key set of events that drive normal
prostate epithelium towards a clinically relevant neoplastic phenotype. More broadly, this
work lays a foundation for characterizing the cistrome in primary human tissue samples – in
addition to cell lines and other models – to advance insights into cellular transformation.
Pomerantz et al. Page 5
Nat Genet. Author manuscript; available in PMC 2016 May 01.
Author M
anuscriptA
uthor Manuscript
Author M
anuscriptA
uthor Manuscript
Online Methods
Tissue cohort
Fresh-frozen RP specimens were selected from the Dana-Farber Cancer Institute/Harvard
Cancer Center SPORE biobank and database, as part of DFCI Protocol No. 01-045 and
approved by the Dana-Farber Cancer Institute/Harvard Cancer Center IRB. Informed
consent was contained from all subjects whose samples were included in the study. A
genitourinary pathologist (M.L.) reviewed hematoxylin and eosin (H & E) stained slides
from each case and isolated areas estimated to be enriched >70% for prostate tumor tissue or
normal prostate epithelium at least 1 cm away from any tumor focus. Fourteen subjects of
were selected for ChIP analysis (Supplementary Table 1). An additional 89 subjects were
selected for expression analysis. Of the 103 subjects total, there was matched normal
prostate epithelium for 63 individuals. A tissue microarray comprised of a separate cohort of
49 subjects was used for analysis by immunohistochemistry.
ChIP-seq in human tissue specimens
Using a 2mm2 core needle, approximately four cores were extracted from the areas circled
on the slide. The frozen cores were pulverized using the Covaris CryoPrep system (Covaris,
Woburn, MA). The tissue was then fixed using 1% formaldehyde buffer for 18 minutes and
quenched with glycine. Chromatin was sheared to 300–500 base pairs using the Covaris
E220 ultra-sonicator. The resulting chromatin was incubated overnight with 6ug antibody—
to AR (N-20, Santa Cruz Biotechnology, Dallas, TX), HOXB13 (H-80, Santa Cruz
Biotechnology, Dallas, TX), or FOXA1 (ab23738, Abcam, Cambridge, England)—bound to
protein A and protein G beads (Life Technologies, Carlsbad, CA). A fraction of the sample
was not exposed to antibody to be used as control (input). The samples were de-crosslinked,
treated with RNase and proteinase K, and DNA was extracted. The samples were then re-
sheared to 100-300 base pairs using the Covaris ultra-sonicator, and concentrations of the
ChIP DNA were quantified by Qubit Fluorometer (Life Technologies). DNA sequencing
libraries were prepared using the ThruPLEX-FD Prep Kit (Rubicon Genomics, Ann Arbor,
MI). Libraries were sequenced using 50-base pair reads on the Illumina platform (Illumina,
San Diego, CA) at Dana-Farber Cancer Institute.
ChIP-seq in cell lines
ChIP of cultured LNCaP and LHSAR cells was performed as described previously24.
Briefly, chromatin from approximately 1×10⁷ fixed cells was sonicated to a size range of
200–300bp. Solubilized chromatin was subjected to immunoprecipitation with the
antibodies described above. De-crosslinking, DNA extraction, library preparation and
genetic sequencing were performed as they were in human tissue. Mycoplasma
contamination was checked at least once in a month (LookOut Mycoplasma PCR Detection
Kit, Sigma-Aldrich)
Sequencing and Data Analysis for ChIP and peak calling
All samples were processed through the exact same computational pipeline developed at the
Center for Functional Cancer Epigenetics (CFCE) using primarily open-source programs.
Pomerantz et al. Page 6
Nat Genet. Author manuscript; available in PMC 2016 May 01.
Author M
anuscriptA
uthor Manuscript
Author M
anuscriptA
uthor Manuscript
Sequence tags were aligned with bowtie to build hg19 of the human genome and uniquely
mapped, non-redundant reads were retained14. These reads (termed ‘unique mappable
locations’) were tabulated for each sample in Supplementary Table 1 and were used to
generate AR binding sites with Model-Based Analysis of ChIP-seq 2 (MACS v2.0.10), with
a q-value (false discovery rate, FDR) threshold of 0.0113,28. We evaluated multiple quality
control criteria based on alignment information and peak quality: (i) sequence quality score,
(ii) uniquely mappable reads (reads that can only map to one location in the genome), (iii)
uniquely mappable locations (locations that can only be mapped by at least one read), (iv)
peak overlap with Velcro regions, a comprehensive set of locations—also called Consensus
Signal Artifact Regions—in the human genome that have anomalous, unstructured, high
signal/read counts in next generation sequencing experiments independent of cell line and of
type of experiment2, (v) number of total peaks (minimum required is 1,000), (vi) high
confidence peaks (the number of peaks that are 10-fold enriched over background), (vii)
percentage overlap with known DNaseI hypersensitive sites derived from the ENCODE
project (minimum required to meet threshold is 80%), and (viii) peak conservation (a
measure of sequence similarity across species based on the hypothesis that conserved
sequences are more likely to be functional). Typically if a sample failed one of these criteria
it will fail many (i.e. low mappable locations will likely lead to low peak numbers many of
which will likely be in high mappability regions, etc.). All analyses were based on ChIP
peaks located outside of promoter regions (≥2 kb upstream or ≤2 kb downstream from any
transcription start site).
Differential AR peak and DNA binding motif analyses
Peaks from all study samples were merged to create a union set of AR sites (N=76,553).
Read densities were calculated for each peak for each sample in reads per million per
nucleotide (RPM), which were used for comparison of cistromes across samples. Sample
similarity was determined by hierarchical clustering using the Spearman correlation between
samples. Tissue-specific peaks (T-ARBS and N-ARBS) were identified by T test using
LIMMA29 with adjusted p<=0.001. Equal numbers of peaks were randomly selected from
each group of differential sites (T-ARBS and N-ARBS) and were used for motif analysis by
the motif search algorithm (MDSeqPos)30 with a cutoff Z score <= −15. For confirmation of
motif analysis with HOMER v3.0.031, we used sequences from all differential ARBS. The
motif rankings are slightly different as MDSeqPos employs a penalty if the matching motif
is farther from the summit from the AR peak, whereas HOMER does not have a distance
penalty.
Determining saturation level of common AR binding sites
In the set of tumor specimens, a number of subjects were randomly sampled and a number
of union AR peaks within that set was determined. For each sample size, we repeated
sampling the cohort 10 times and calculated the average number of union AR peaks and
standard error. The rate of increase in union AR binding sites as the sample size increased
was used to estimate the saturation of AR peak discovery.
Pomerantz et al. Page 7
Nat Genet. Author manuscript; available in PMC 2016 May 01.
Author M
anuscriptA
uthor Manuscript
Author M
anuscriptA
uthor Manuscript
Gene set enrichment analysis
For the 9,179 T-ARBS and the 2,690 N-ARBS, the GREAT tool v3.0.0 was used to map a
peak to gene and perform gene set enrichment analysis using a 50-kilobase window around
each state-specific ARBS.
Gene expression and tissue-specific AR binding sites
mRNA expression data from the Cancer Genome Atlas (TCGA) dataset of 220 samples (44
normal, 176 tumors) were downloaded. Transcripts expressing significantly differential
expression between tumor and normal (adjusted p-value <= 10e-7) were selected for
analysis (n=3,743). These transcripts were rank-ordered by their differential expression and
grouped into bins of 300. The gene bins were plotted against the average read density at
each T-ARBS and N-ARBS using a distance of 50 kb. A similar analysis was performed
using the 103 RP specimens described above. RNA was extracted from fresh frozen tissue
using the QIAGEN AllPrep DNA/RNA kit and prepared for expression analysis using the
Affymetrix HT2.0 array. Expression data, in the form of .CEL files, were normalized using
Robust Multichip Average (RMA) and were log transformed32. In total 1,804 (adjusted p-
value <= 0.001) genes were significantly differentially expressed, binned into groups of 200
and analyzed as above.
HOXB13 motif enrichment analysis
The goal of this analysis was to evaluate the enrichment of the HOXB13 motif in certain
sets of ARBS in LNCaP (Fig. 3B). Data for HOXB13 ChIP in VCaP were downloaded from
Huang et al33. The HOXB13 motif was mapped to each AR peak region based on Position-
Specific Scoring Matrix (PSSM) using program HOMER31 with default parameters. To
evaluate the background HOXB13 genomic distribution, the union DNaseI hypersensitivity
sites (DHS) derived from 80 cell types from the ENCODE project were used. The motif
distribution across all conditions was compared to the DHS peak background and the
enrichment was calculated by the Fisher exact test.
AR-targeted gene set and prostate cancer recurrence-free survival analysis
Each differential ARBS was assigned to the nearest gene (TSS ≤50 kb from the AR
summit). Differential gene expression was calculated based on the TCGA prostate dataset
and RNA-seq data was downloaded from the Broad Institute. All expression values were
normalized based on the TCGA expression pipeline [accessed January 15, 2014].
Differential expression between prostate tumor and normal tissue was identified using
LIMMA29 by t-test with adjusted p <= 1×10⁻⁷. If the closest gene was differentially
expressed in the appropriate direction (e.g., up-regulated in tumor for T-ARBS and down-
regulated in tumors for N-ARBS), it was selected. A total of 536 genes (324 T-ARBS/
upregulated and 212 N-ARBS/downregulated) met criteria.
The Kaplan-Meier survival analysis was carried out using the R package, survival analysis –
version 2.37-7. The end point for survival analysis was biochemical recurrence after radical
prostatectomy. Patient samples underwent unsupervised clustering based on the 536 target
gene set. Statistical significance of the difference between the survival curves was assessed
using ×2 and log-rank tests.
Pomerantz et al. Page 8
Nat Genet. Author manuscript; available in PMC 2016 May 01.
Author M
anuscriptA
uthor Manuscript
Author M
anuscriptA
uthor Manuscript
TSA-plus Fluorescence Immunohistochemistry
A total of 49 formalin-fixed, paraffin-embedded prostate cancer tissues were obtained from
consented patients at Brigham and Women’s Hospital and utilized to construct the TMA,
each sample is represented by three tissue microarray cores for tumor.
A multiplexed tyramide signal amplification method was performed on 4-μm sections of the
TMA for detection of the co-localization of AR, FOXA1 and HOXB13 protein. The staining
approach consists of a multi-step protocol of sequential TSA-amplified immunofluorescence
labels for AR, FOXA1 and HOXB13, and a DAPI counterstain. Briefly the sections were
deparaffinized and hydrated; prior to each immunofluorescence labeling, AR, FOXA1 and
HOXB13 antigens are retrieved with a single microwave step. Each labeling cycle consists
of application of a primary antibody, and a secondary antibody conjugated to horse radish
peroxidase (HRP), and TSA conjugated to a fluorophore. The slides were incubated with the
antibody against AR (AR441, Mouse monoclonal, DAKO) at a dilution of 1:500, FOXA1
[HNF-3a/b(C-20), Goat polyclonal, sc-6553, Santa Cruz] at a dilution of 1:1000 and
HOXB13 (F-9, Mouse monoclonal, sc-28333, Santa Cruz) at a dilution of 1:500 for 30 min
respectively. TSA reagents were obtained from PerkinElmer, Inc. TSA conjugated
Fluorescein was used for AR; CY3 for FOXA1 and CY5 for HOXB13, respectively.
Prostate cancer tissue from RP specimens was used as positive controls for AR, FOXA1 and
HOXB13; Omission of the primary antibody was utilized as a negative control. Single
staining of each antibody and DAPI only counterstained slides were used for spectral library
construction. The TMA was scanned on a Perkin Elmer Vectra 2 imaging work station.
Appropriate filter cubes and 20x objective exposure times were set for each target-dye
combination, specifically nuclei-DAPI, AR-FITC, FOXA1-CY3, HOXB13-CY5. Each
single stained control slide was imaged with the established exposure time to create spectral
controls for generating the spectral library. A 4x magnification spectral scan was run with
the correct number of TMA rows and columns, as identified from the TMA map. Three
focal points were manually selected. The remainder of the scan was fully automated.
Using the “scale to max” spectra viewer, DAPI peak brightness was verified. The constancy
of the shape of the curve (dye spectra) was confirmed by overlaying spectra from individual
pixel readouts using the “normalized” spectra viewer. Three unique regions of the TMA
were sampled. The same process was replicated for each of the individual target-dye
combinations. We ran an algorithm-learning tool utilizing the InForm Analysis software
package to train for the appropriate tumor, benign and PIN regions of interest and
subsequently completed cell segmentation. The normalized total expression intensity was
recorded on a per pixel basis. The reported mean for a given cell was the average intensity
of all the normalized total pixel values in each nucleus. Nuclei finding was enabled by
detecting circular objects in the DAPI channel. A 2 pixel radii around the nuclei was defined
as the cytoplasm. The algorithm was then applied to all the images contained within the
TMA.
Positive staining thresholds were determined initially upon pathology review of the images
generated and subsequently statistically measured by ranking nuclear expression levels for
each marker independently and calculating limit of detection (LOD) (Mean + 3 x stdev).
Pomerantz et al. Page 9
Nat Genet. Author manuscript; available in PMC 2016 May 01.
Author M
anuscriptA
uthor Manuscript
Author M
anuscriptA
uthor Manuscript
Signal intensity cutoffs of 0.09, 1.05 and 0.12 for AR, FOXA1 and HOXB13, respectively
were determined. Statistical analysis was carried out using SPSS V.13.0. The Spearman rank
correlation was used to investigate the correlation of the protein expression between AR,
FOXA1 and HOXB13.
Immunoblotting
Whole cell extracts were prepared by lysis in RIPA buffer (50 mM Tris pH 8.0, 150 mM
NaCl, 1% NP-40, 0.5% sodium deoxycholate, 0.1% SDS) supplemented with prostease
inhibitor cocktail (Roche). Nuclear extracts were prepared by hypotonic lysis (10 mM
HEPES pH 8.0, 5 mM MgCl, 250 mM Sucrose, protease inhibitors) followed by extraction
with RIPA buffer. Immunoblotting was performed according to standard procedures using
the following antibodies: AR D6F11 (Cell Signaling), HOXB13 F-9 (Santa Cruz), FOXA1
ab23738 (Abcam), beta-actin C4 (Santa Cruz). The Odyssey imaging system was used to
quantitate fluorescent intensity of infrared dye conjugated secondary antibodies (LI-COR).
Transduction of HOXB13 and FOXA1 in the LHSAR cell line and knockdown LNCaP
The open reading frame of HOXB13 or FOXA1 was cloned into the pLX302 lentiviral
expression vector using the gateway recombination system. Lentiviral vectors expressing
shRNAs targeting HOXB13 or FOXA1 were obtained from the RNAi consortium at the
Broad Institute (Clone ID#s: TRCN0000020845, TRCN0000020846, TRCN0000358367,
TRCN000014879). ShRNA targeting GFP or luciferase were used as negative controls, and
shRNA targeting ribosomal S6 protein was used as a positive control for a gene required for
cell proliferation. Viruses were generated by transfection into 293T cells with packaging
vectors pVsVg and pDelta8.9, and transductions performed in the presence of 4 ug/ml
polybrene. For expression experiments in LHSAR cells, medium was replaced 24 hours
after transduction with medium containing 2 nM R1881 and incubated 48 hours before
harvesting for ChIP sequencing. For proliferation experiments, transduced cells were
counted and replated in 12 well plates after selection with puromycin. Cells were counted at
the indicated time points using a Vi-Cell analyzer. Results represent the average and 95%
confidence interval of three biological replicates. Expression and knockdown were
confirmed by immunoblotting.
RNA-seq in LHSAR cells and data analysis
LHSAR was transduced with transcription factors as described above. For RNA-seq
analysis, the 75-bp-long reads were aligned to hg19 with STAR aligner34. Cufflinks was
used to generate expression value (RPKM) for each gene35. The differential genes were
identified by LIMMA for down-stream analysis. Sample similarity was determined by the
hierarchical clustering in R Bioconductor using the Spearman correlation between samples
based on the top 1000 most variable genes.
Computational quantification of gene suppression phenotypes from multi-sample RNAi screens
Project Achilles is a systematic effort to create a catalog of vulnerabilities across by
hundreds of cell lines by performing genome-wide pooled shRNA screens to identify
Pomerantz et al. Page 10
Nat Genet. Author manuscript; available in PMC 2016 May 01.
Author M
anuscriptA
uthor Manuscript
Author M
anuscriptA
uthor Manuscript
essential genes. Each cell line is propagated for 16 population doublings or 40 days,
whichever comes first, and the relative abundance of each shRNA is calculated relative to
the initial DNA plasmid pool. After a data processing pipeline, the shRNA level data is
converted to gene level scores using the ATARiS algorithm36. Here we used Achilles 2.9, a
dataset of 102 cell lines interrogated with a library containing ~98,000 shRNAs targeting
~17,000 genes to extract the data for HOXB13 and FOXA1. Data for HOXB13_1_1100 and
FOXA1_1_1101101001 gene summarization scores (ATARiS solutions) were used to make
the graphs. A complete dataset will be available in the Project Achilles online portal.
Dependency of the prostate cancer cell lines from the dataset – LNCaP and PC3 – on
HOXB13 was determined using four separate shRNAs against HOXB1 (Supplementary
Table 15). Cells were infected with lentivirus encoding shRNAs of interest in the presence
of polybrene (4 ug/ml) followed by centrifugation. After 72 h of selection with puromycin,
cells were trypsinized and re-plated in 12 well plates in duplicate. The number of viable
cells was counted every 48 hours using a Beckman Coulter Vi-Cell viability analyzer.
Successful knockdown was confirmed by quantitative PCR using Taqman.
Supplementary Material
Refer to Web version on PubMed Central for supplementary material.
Acknowledgments
We thank Z. Herbert and the Molecular Biology Core Facility at Dana-Farber Cancer Institute for their sequencing expertise. We acknowledge funding from the Prostate Cancer Foundation (Challenge Award), the H.L. Snyder Medical Foundation (MLF), R01CA193910, Anna Fuller Fund (PS#6241901; Infoed 2013-0369), GAME-ON U19 (U19CA148537), the Dana-Farber Prostate Cancer SPORE (P50CA90381-11), and U01 CA176058 (FV and WCH).
References
1. Whyte WA, et al. Master transcription factors and mediator establish super-enhancers at key cell identity genes. Cell. 2013; 153:307–19. [PubMed: 23582322]
2. Consortium EP. An integrated encyclopedia of DNA elements in the human genome. Nature. 2012; 489:57–74. [PubMed: 22955616]
3. Lupien M, Brown M. Cistromics of hormone-dependent cancer. Endocr Relat Cancer. 2009; 16:381–9. [PubMed: 19369485]
4. Thompson IM, et al. The influence of finasteride on the development of prostate cancer. N Engl J Med. 2003; 349:215–24. [PubMed: 12824459]
5. Huggins C. Endocrine-induced regression of cancers. Cancer Res. 1967; 27:1925–30. [PubMed: 5624120]
6. Berger MF, et al. The genomic complexity of primary human prostate cancer. Nature. 2011; 470:214–20. [PubMed: 21307934]
7. Barbieri CE, et al. Exome sequencing identifies recurrent SPOP, FOXA1 and MED12 mutations in prostate cancer. Nat Genet. 2012; 44:685–9. [PubMed: 22610119]
8. Augello MA, Den RB, Knudsen KE. AR function in promoting metastatic prostate cancer. Cancer Metastasis Rev. 2014; 33:399–411. [PubMed: 24425228]
9. Mills IG. Maintaining and reprogramming genomic androgen receptor activity in prostate cancer. Nat Rev Cancer. 2014; 14:187–98. [PubMed: 24561445]
10. Robinson JL, et al. Elevated levels of FOXA1 facilitate androgen receptor chromatin binding resulting in a CRPC-like phenotype. Oncogene. 2013
Pomerantz et al. Page 11
Nat Genet. Author manuscript; available in PMC 2016 May 01.
Author M
anuscriptA
uthor Manuscript
Author M
anuscriptA
uthor Manuscript
11. Chen Y, et al. ETS factors reprogram the androgen receptor cistrome and prime prostate tumorigenesis in response to PTEN loss. Nat Med. 2013; 19:1023–9. [PubMed: 23817021]
12. Sampson N, Neuwirt H, Puhr M, Klocker H, Eder IE. In vitro model systems to study androgen receptor signaling in prostate cancer. Endocr Relat Cancer. 2013; 20:R49–64. [PubMed: 23447570]
13. Feng J, Liu T, Qin B, Zhang Y, Liu XS. Identifying ChIP-seq enrichment using MACS. Nat Protoc. 2012; 7:1728–40. [PubMed: 22936215]
14. Langmead B, Trapnell C, Pop M, Salzberg SL. Ultrafast and memory-efficient alignment of short DNA sequences to the human genome. Genome Biol. 2009; 10:R25. [PubMed: 19261174]
15. Sharma NL, et al. The androgen receptor induces a distinct transcriptional program in castration-resistant prostate cancer in man. Cancer Cell. 2013; 23:35–47. [PubMed: 23260764]
16. He HH, et al. Differential DNase I hypersensitivity reveals factor-dependent chromatin dynamics. Genome Res. 2012; 22:1015–25. [PubMed: 22508765]
17. Massie CE, et al. The androgen receptor fuels prostate cancer by regulating central metabolism and biosynthesis. EMBO J. 2011; 30:2719–33. [PubMed: 21602788]
18. Yu J, et al. An integrated network of androgen receptor, polycomb, and TMPRSS2-ERG gene fusions in prostate cancer progression. Cancer Cell. 2010; 17:443–54. [PubMed: 20478527]
19. Berger R, et al. Androgen-induced differentiation and tumorigenicity of human prostate epithelial cells. Cancer Res. 2004; 64:8867–75. [PubMed: 15604246]
20. Taylor BS, et al. Integrative genomic profiling of human prostate cancer. Cancer Cell. 2010; 18:11–22. [PubMed: 20579941]
21. Glinsky GV, Glinskii AB, Stephenson AJ, Hoffman RM, Gerald WL. Gene expression profiling predicts clinical outcome of prostate cancer. J Clin Invest. 2004; 113:913–23. [PubMed: 15067324]
22. Wang D, et al. Reprogramming transcription by distinct classes of enhancers functionally defined by eRNA. Nature. 2011; 474:390–4. [PubMed: 21572438]
23. Jin HJ, Zhao JC, Wu L, Kim J, Yu J. Cooperativity and equilibrium with FOXA1 define the androgen receptor transcriptional program. Nat Commun. 2014; 5:3972. [PubMed: 24875621]
24. Wang Q, et al. Androgen receptor regulates a distinct transcription program in androgen-independent prostate cancer. Cell. 2009; 138:245–56. [PubMed: 19632176]
25. Economides KD, Capecchi MR. Hoxb13 is required for normal differentiation and secretory function of the ventral prostate. Development. 2003; 130:2061–9. [PubMed: 12668621]
26. Ewing CM, et al. Germline mutations in HOXB13 and prostate-cancer risk. N Engl J Med. 2012; 366:141–9. [PubMed: 22236224]
27. Xu J, et al. HOXB13 is a susceptibility gene for prostate cancer: results from the International Consortium for Prostate Cancer Genetics (ICPCG). Hum Genet. 2013; 132:5–14. [PubMed: 23064873]
28. Zhang Y, et al. Model-based analysis of ChIP-Seq (MACS). Genome Biol. 2008; 9:R137. [PubMed: 18798982]
29. Smyth GK. Linear models and empirical bayes methods for assessing differential expression in microarray experiments. Stat Appl Genet Mol Biol. 2004; 3 Article3.
30. Liu T, et al. Cistrome: an integrative platform for transcriptional regulation studies. Genome Biol. 2011; 12:R83. [PubMed: 21859476]
31. Heinz S, et al. Simple combinations of lineage-determining transcription factors prime cis-regulatory elements required for macrophage and B cell identities. Mol Cell. 2010; 38:576–89. [PubMed: 20513432]
32. Bolstad BM, Irizarry RA, Astrand M, Speed TP. A comparison of normalization methods for high density oligonucleotide array data based on variance and bias. Bioinformatics. 2003; 19:185–93. [PubMed: 12538238]
33. Huang Q, et al. A prostate cancer susceptibility allele at 6q22 increases RFX6 expression by modulating HOXB13 chromatin binding. Nat Genet. 2014
34. Dobin A, et al. STAR: ultrafast universal RNA-seq aligner. Bioinformatics. 2013; 29:15–21. [PubMed: 23104886]
Pomerantz et al. Page 12
Nat Genet. Author manuscript; available in PMC 2016 May 01.
Author M
anuscriptA
uthor Manuscript
Author M
anuscriptA
uthor Manuscript
35. Trapnell C, et al. Differential gene and transcript expression analysis of RNA-seq experiments with TopHat and Cufflinks. Nat Protoc. 2012; 7:562–78. [PubMed: 22383036]
36. Shao DD, et al. ATARiS: computational quantification of gene suppression phenotypes from multisample RNAi screens. Genome Res. 2013; 23:665–78. [PubMed: 23269662]
Pomerantz et al. Page 13
Nat Genet. Author manuscript; available in PMC 2016 May 01.
Author M
anuscriptA
uthor Manuscript
Author M
anuscriptA
uthor Manuscript
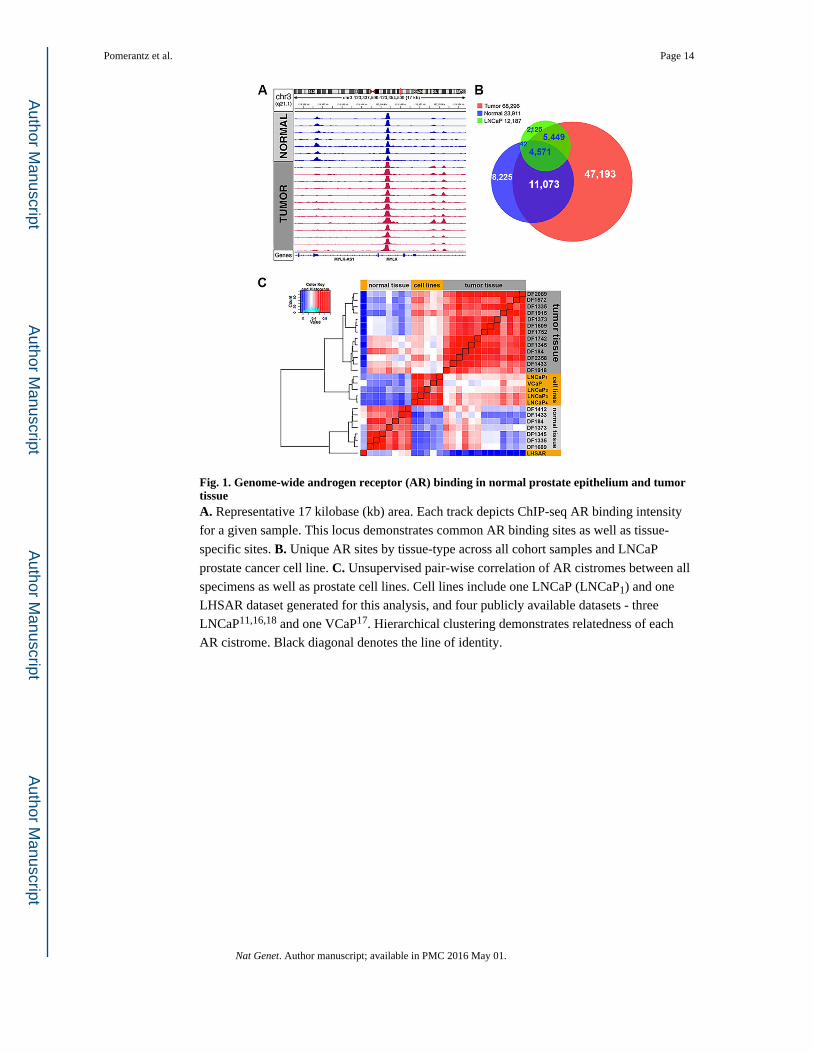
Fig. 1. Genome-wide androgen receptor (AR) binding in normal prostate epithelium and tumor tissueA. Representative 17 kilobase (kb) area. Each track depicts ChIP-seq AR binding intensity
for a given sample. This locus demonstrates common AR binding sites as well as tissue-
specific sites. B. Unique AR sites by tissue-type across all cohort samples and LNCaP
prostate cancer cell line. C. Unsupervised pair-wise correlation of AR cistromes between all
specimens as well as prostate cell lines. Cell lines include one LNCaP (LNCaP1) and one
LHSAR dataset generated for this analysis, and four publicly available datasets - three
LNCaP11,16,18 and one VCaP17. Hierarchical clustering demonstrates relatedness of each
AR cistrome. Black diagonal denotes the line of identity.
Pomerantz et al. Page 14
Nat Genet. Author manuscript; available in PMC 2016 May 01.
Author M
anuscriptA
uthor Manuscript
Author M
anuscriptA
uthor Manuscript
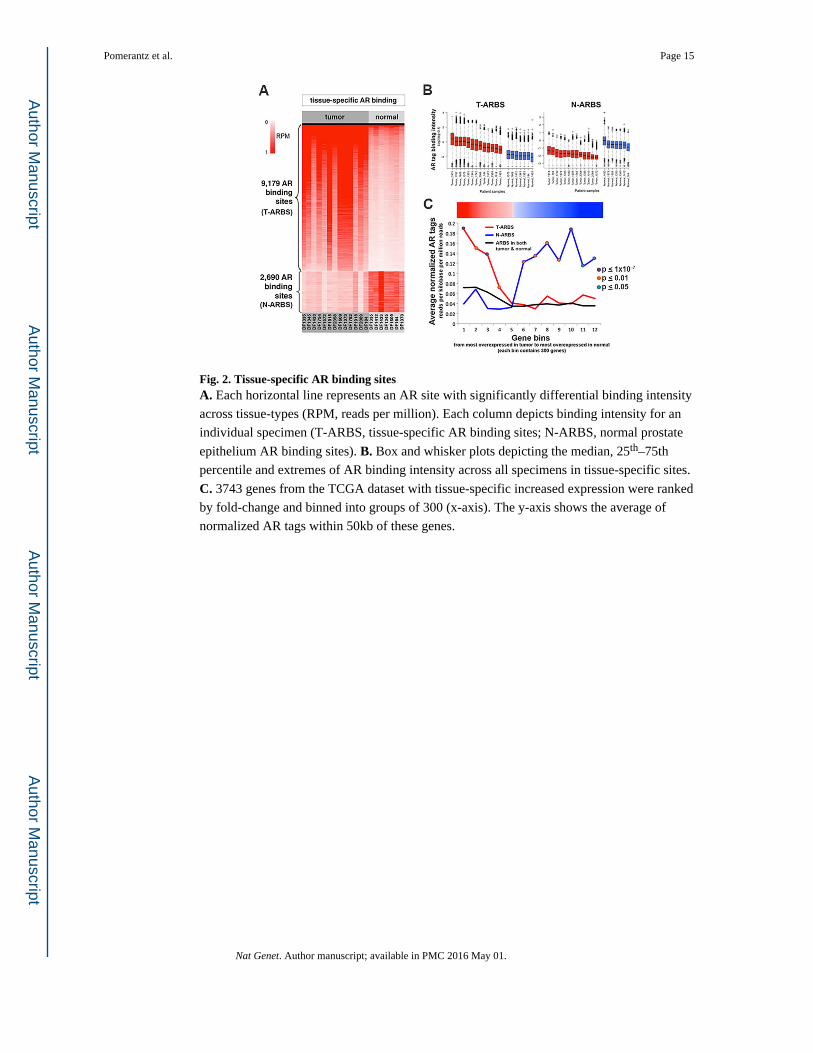
Fig. 2. Tissue-specific AR binding sitesA. Each horizontal line represents an AR site with significantly differential binding intensity
across tissue-types (RPM, reads per million). Each column depicts binding intensity for an
individual specimen (T-ARBS, tissue-specific AR binding sites; N-ARBS, normal prostate
epithelium AR binding sites). B. Box and whisker plots depicting the median, 25th–75th
percentile and extremes of AR binding intensity across all specimens in tissue-specific sites.
C. 3743 genes from the TCGA dataset with tissue-specific increased expression were ranked
by fold-change and binned into groups of 300 (x-axis). The y-axis shows the average of
normalized AR tags within 50kb of these genes.
Pomerantz et al. Page 15
Nat Genet. Author manuscript; available in PMC 2016 May 01.
Author M
anuscriptA
uthor Manuscript
Author M
anuscriptA
uthor Manuscript
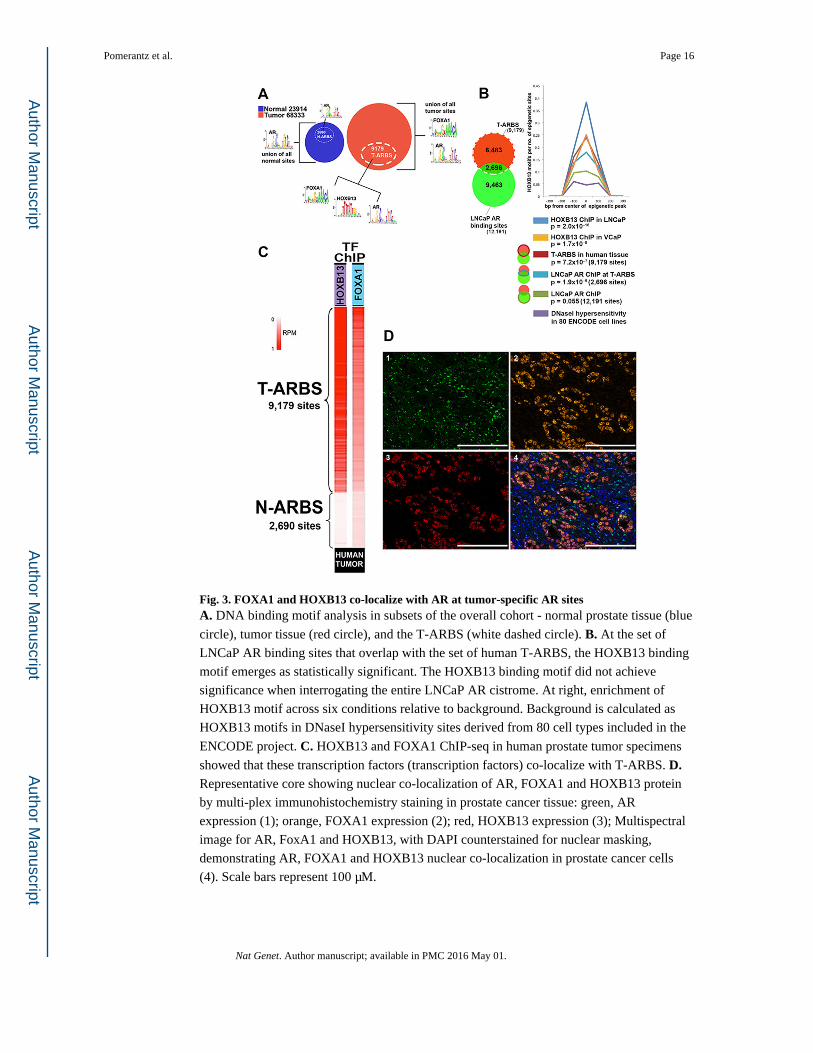
Fig. 3. FOXA1 and HOXB13 co-localize with AR at tumor-specific AR sitesA. DNA binding motif analysis in subsets of the overall cohort - normal prostate tissue (blue
circle), tumor tissue (red circle), and the T-ARBS (white dashed circle). B. At the set of
LNCaP AR binding sites that overlap with the set of human T-ARBS, the HOXB13 binding
motif emerges as statistically significant. The HOXB13 binding motif did not achieve
significance when interrogating the entire LNCaP AR cistrome. At right, enrichment of
HOXB13 motif across six conditions relative to background. Background is calculated as
HOXB13 motifs in DNaseI hypersensitivity sites derived from 80 cell types included in the
ENCODE project. C. HOXB13 and FOXA1 ChIP-seq in human prostate tumor specimens
showed that these transcription factors (transcription factors) co-localize with T-ARBS. D. Representative core showing nuclear co-localization of AR, FOXA1 and HOXB13 protein
by multi-plex immunohistochemistry staining in prostate cancer tissue: green, AR
expression (1); orange, FOXA1 expression (2); red, HOXB13 expression (3); Multispectral
image for AR, FoxA1 and HOXB13, with DAPI counterstained for nuclear masking,
demonstrating AR, FOXA1 and HOXB13 nuclear co-localization in prostate cancer cells
(4). Scale bars represent 100 μM.
Pomerantz et al. Page 16
Nat Genet. Author manuscript; available in PMC 2016 May 01.
Author M
anuscriptA
uthor Manuscript
Author M
anuscriptA
uthor Manuscript
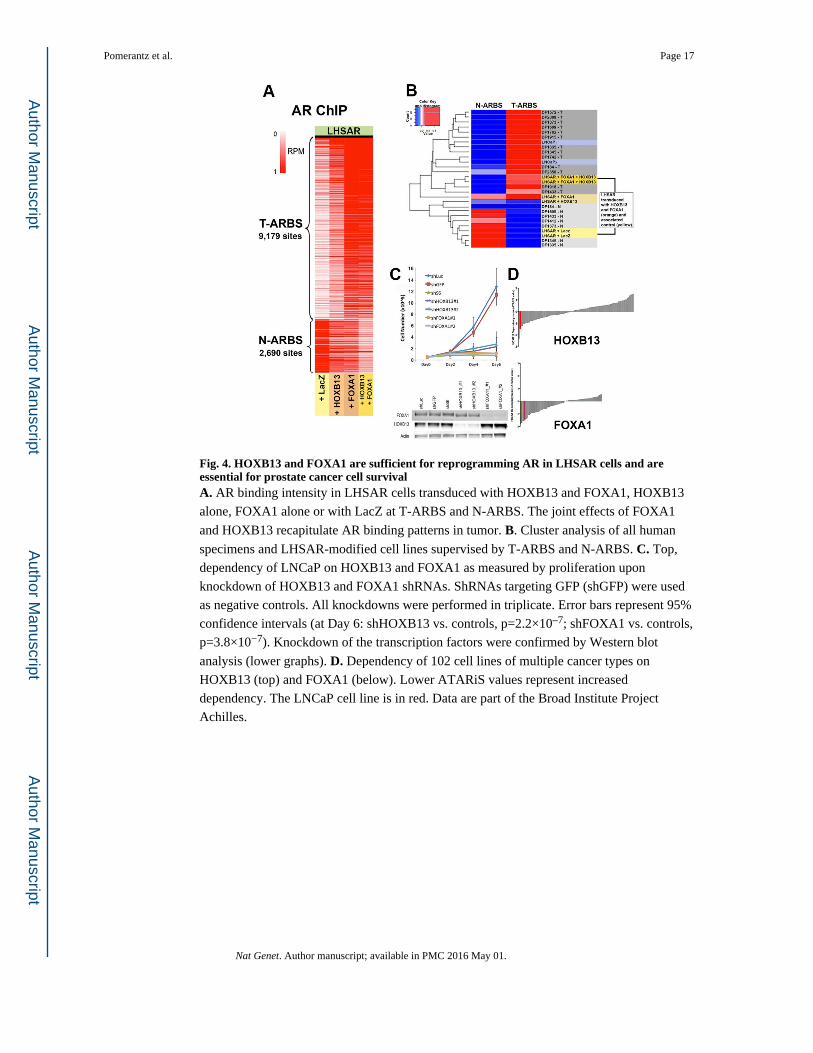
Fig. 4. HOXB13 and FOXA1 are sufficient for reprogramming AR in LHSAR cells and are essential for prostate cancer cell survivalA. AR binding intensity in LHSAR cells transduced with HOXB13 and FOXA1, HOXB13
alone, FOXA1 alone or with LacZ at T-ARBS and N-ARBS. The joint effects of FOXA1
and HOXB13 recapitulate AR binding patterns in tumor. B. Cluster analysis of all human
specimens and LHSAR-modified cell lines supervised by T-ARBS and N-ARBS. C. Top,
dependency of LNCaP on HOXB13 and FOXA1 as measured by proliferation upon
knockdown of HOXB13 and FOXA1 shRNAs. ShRNAs targeting GFP (shGFP) were used
as negative controls. All knockdowns were performed in triplicate. Error bars represent 95%
confidence intervals (at Day 6: shHOXB13 vs. controls, p=2.2×10⁻⁷; shFOXA1 vs. controls,
p=3.8×10⁻⁷). Knockdown of the transcription factors were confirmed by Western blot
analysis (lower graphs). D. Dependency of 102 cell lines of multiple cancer types on
HOXB13 (top) and FOXA1 (below). Lower ATARiS values represent increased
dependency. The LNCaP cell line is in red. Data are part of the Broad Institute Project
Achilles.
Pomerantz et al. Page 17
Nat Genet. Author manuscript; available in PMC 2016 May 01.
Author M
anuscriptA
uthor Manuscript
Author M
anuscriptA
uthor Manuscript