Embed Size (px)
Citation preview
~IHEANRUAL ________ ~
COMMUNITY C OLLEGES & WORKFORCE P REPARATION
www.iowagov/ educate/ ccpubllcatlons/
Title Page i
The AnnualCondition of Iowa’s
Community Colleges2010
Iowa Department of EducationDivision of Community Colleges and Workforce Preparation
Bureau of Community Colleges and Career and Technical Education Services
with a special supplement on high schoolgraduates in community college

The Condition of Iowa’s Community Collegesii
iiiState Board of Education
State of IowaDepartment of Education
Grimes State Office BuildingDes Moines, Iowa
State Board of EducationRosie Hussey, President, Clear LakeCharles C. Edwards, Jr., Vice President, Des MoinesSister Jude Fitzpatrick, West Des MoinesMichael L. Knedler, Council BluffsValorie J. Kruse, Sioux CityAna Lopez, PellaMax Phillips, WoodwardLaMetta Wynn, ClintonCorey Anderson, (Student Member), Cambridge
Jason E. Glass, Director and Executive Officer of the State Board of EducationGail M. Sullivan, Chief of Staff
Administration
It is the policy of the Iowa Department of Education not to discriminate on the basis of race, creed, color, sex, sexual orientation, gender identity, national origin, gender, disability, religion, age, political party affiliation, or actual or potential parental, family or marital status in its programs, activities, or employment practices as required by the Iowa Code sections 216.9 and 256.10(2), Titles VI and VII of the Civil Rights Act of 1964 (42 U.S.C. § 2000d and 2000e), the Equal Pay Act of 1973 (29 U.S.C. § 206, et seq.), Title IX (Educational Amendments, 20 U.S.C. §§ 1681 – 1688) Section 504 (Rehabilitation Act of 1973, 29 U.S.C. § 794), and the Americans with Disabilities Act (42 U.S.C. § 12101, et seq.).
If you have questions or grievances related to compliance with this policy by the Iowa Department of Education, please contact the legal counsel for the Iowa Department of Education, Grimes State Office Building, 400 E 14th St, Des Moines IA 50319-0146, telephone number 515/281-5295, or the Director of the Office for Civil Rights, U.S. Department of Education, 111 N. Canal Street, Suite 1053, Chicago, IL 60606-7204.
Division of Community Colleges and Workforce Preparation
Bureau of Community College Services
Roger Utman Ph.D, Administrator
Colleen Hunt – Bureau ChiefVladimir Bassis – ConsultantKent Farver – ConsultantGeoff Jones – Information SpecialistTom Schenk Jr. – ConsultantJeremy Varner – ConsultantAmy Vybiral – Consultant
iv The Condition of Iowa’s Community Colleges
Acknowledgements
Many people contributed to The Annual Condition of Iowa’s Community Colleges: 2010. The project was supervised by Dr. Roger Utman and Colleen Hunt. The report was compiled and written by Vladimir Bassis, Kent Farver, Jenny Foster, Tom Schenk Jr., Jeremy Varner, and Amy Vybiral. Geoff Jones also assisted in the compilation of data. Xiaoping Wang assisted in matching Community College MIS data with Project EASIER. Gail Sullivan provided helpful comments. Stephanie Weeks thoroughly edited this document and provided invaluable feedback.
The authors sincerely thank everyone who assisted with this report.
Table of Contents v
Sections
Section 1 Iowa Community Colleges ..................................................................... 1
Section 2 Fall Credit Enrollment ............................................................................... 7
Section 3 Fiscal Year Credit Enrollment and Demographics ...................... 21
Section 4 Online Credit Enrollment and Demographics ................................ 47
Section 5 Joint Enrollment and Demographics ................................................. 71
Section 6 Credit Student Awards ............................................................................ 89
Section 7 Credit Programs ......................................................................................... 133
Section 8 Non-Credit Enrollment and Programs .............................................. 137
Section 9 Adult Literacy ............................................................................................... 157
Section 10 Economic Development ......................................................................... 173
Section 11 Apprenticeship ............................................................................................ 179
Section 12 Success of Students ................................................................................ 183
Section 13 Tuition and Fees ........................................................................................ 201
Section 14 Financial Aid ................................................................................................ 213
Section 15 Financial ........................................................................................................ 217
Section 16 Human Resources .................................................................................... 243
Section 17 Special Supplement: Workforce Outcomes .................................. 275
Appendices
Appendix A Glossary ........................................................................................................ 293
Appendix B References .................................................................................................. 297
Appendix C Index ............................................................................................................... 301
Table of Contents

The Condition of Iowa’s Community Collegesvi
1Iowa’s Community Colleges
Community colleges have an “open door” policy, which means that nearly everyone who applies may be accepted.
Each of the 15 community colleges offers comprehensive programs including Arts and Sciences, College Transfer (Parallel) courses, Career and Technical Education programs, training and retraining programs for the workforce of Iowa’s businesses and industries, and a variety of adult education and non-credit courses for residents of each community college district.
History of Iowa’s Community Colleges
Mason City schools established the first two-year postsecondary educational institution in Iowa in 1918. At the time this junior college was organized, there was no law authorizing two-year postsecondary educational programs. Mason City Junior College proved to be successful and was accredited by the North Central Association of Colleges and Schools in 1919.
Additional public junior colleges were organized beginning in 1920, and the movement spread rapidly, until, by 1930, at least 32 towns and cities in Iowa had organized public junior colleges as part of their public school systems.
In 1927, the 42nd General Assembly passed the first law authorizing the establishment of public junior colleges. The law permitted the establishment of schools offering instructional programs at a level higher than an approved four-year high school course. The colleges had to be dually authorized by the voters and approved by the State Superintendent of the Iowa Department of Public Instruction (now the Director of the Iowa Department of Education). Such colleges were able to include postsecondary courses of one or two years. The Superintendent was authorized to prepare standards and to provide adequate inspection of these junior colleges.
The Iowa public junior college movement reached its crest in 1927 when nine public junior colleges were
organized. After the year 1930, no public junior colleges were organized until 1946, when Clinton Junior College was founded. In 1931, the 44th General Assembly approved the first restriction to the development of public junior colleges, prohibiting the establishment of a public junior college in any school district having a population of less than 20,000. The 49th General Assembly in 1941 reduced the population requirement to 5,000.
Between the years 1918 and 1953, a total of 35 different public junior colleges were established through the operation of public school districts. Some of these colleges closed, although 10 of the closed colleges later reopened. The enrollment trend steadily increased over the years with the exception of the World War II years. During the 1955-66 decade, which immediately preceded the initiation of a community college system, enrollment almost quadrupled. By 1965, 16 public junior colleges were operating in Iowa and the total enrollment during the fall semester of the 1965-66 school year was 9,110. Local public school districts operated colleges; a dean who reported directly to the local superintendent administered each. These institutions offered arts and sciences programs equivalent to the first two years of the baccalaureate program and a limited number of occupational programs and adult education opportunities.
In 1958, Congress initiated a development parallel to the public junior college movement. Title VIII of the National Defense Education Act (NDEA) made federal funds available to states on a matching basis to develop area vocational programs. To implement this legislation, the Iowa State Board of Education modified the state vocational education plan to make local school districts and Iowa State University eligible to operate as “area schools.” This legislation included a specific allocation of funds to develop area vocational programs under NDEA’s Title VIII, a designation of area vocational-technical high schools, and the authorization for tuition-paying students to attend these schools and programs.
1 Iowa’sCommunity Colleges
“The mission of the community colleges of Iowa in the 21st century is to provide exemplary educational and community services to meet the needs and enhance the lives of Iowans.”
Source: “Shaping the Future: A Five-Year Plan for the Community Colleges of Iowa, 2006-2011”
2 The Condition of Iowa’s Community Colleges
The Iowa State Board of Education eventually designated a total of 15 schools as area vocational-technical high schools. These schools were also designated as area schools for the purposes of Title VIII, and were to be used to initiate programming for the Manpower Development and Training Act. A total of 1,816 full-time day students enrolled in postsecondary vocational programs for the 1965-66 school year; the majority entered programs administered by agencies operating the area vocational-technical high schools or programs.
Even though public junior colleges and area vocational-technical high schools offered some opportunities for arts and sciences and preparatory vocational education, enrollment opportunities were limited for most Iowans. In 1959, the 58th General Assembly appropriated $25,000 to the Iowa Legislative Research Bureau to conduct a policy study of the needs of higher education in Iowa. Included in this report was a recommendation to establish regional community colleges. The report also recommended the state pay at least half the cost of building and operating these colleges. As a result of this study, the General Assembly directed the Iowa Department of Public Instruction (later renamed the Department of Education in July 1985) to conduct a two-year study of the need to develop a statewide system of public community colleges.
The department submitted its report, “Education Beyond High School Age: The Community College,” to the General Assembly in December 1962. The report made recommendations and proposed enabling legislation. It recommended restructuring the county educational system and forming 16 area education districts whose boundaries should be drawn along existing school district lines. These districts were intended to replace the county boards of education and provide programs and services that would complement those provided by local school districts. It was envisioned that the area districts would also serve as a legal structure through which a statewide system of community colleges could be developed.
In 1963, the 60th General Assembly took no action on the report. An interim legislative committee concluded that it would be appropriate to put vocational and two-year college education together in a single comprehensive system, but separated the county board consolidation issue (area education agencies were later established by the legislature in 1974). Staff of the Iowa Department of Public Instruction worked closely with various groups throughout the state, and arrived at conclusions similar to those of the interim committee. Passage of the Vocational Education Act of 1963 provided additional impetus to this planning.
After receiving the interim committee’s report in 1964, the 61st General Assembly in 1965 enacted legislation that permitted the development of a
statewide system of two-year postsecondary educational institutions, identified as “merged area schools.” The Iowa Department of Public Instruction was to direct the operation of the development of merged area schools as either area community colleges or area vocational schools.
Legislation authorizing merged area schools, which are now referred to as “community colleges,” provided for fiscal support for these institutions through a combination of student tuition and federal, state, and local funds. These resources included a local three-quarter mill levy on the property within the merged area for operational purposes, and an additional three-quarter mill levy for the purchase of sites and construction of buildings. State general aid was distributed to community colleges on the basis of $2.25 per day for the average daily enrollment of full-time equivalent students who were residents of Iowa. The 63rd General Assembly changed this formula in 1969 to determine enrollment and state aid on the basis of actual contact hours of instruction. Individual colleges were granted authority to establish tuition rates, except that tuition was not to exceed the lowest tuition rate charged by any one of Iowa’s three Regent Universities.
Legislation approved in 1965 was enthusiastically received. The Iowa Department of Education received the first plan for a community college on July 5, 1965; one day after the legislation was effective. Plans for the other community colleges followed in quick succession. Although the original plans called for 20 areas, the number was quickly reduced to 16 and later one area was split among adjacent areas. Fourteen (14) community colleges were approved and organized in 1966, and a 15th in January 1967. Fourteen of these community colleges began operation during the 1966-67 school year.
Seven (7) districts were originally approved as Area Community Colleges: (current names)
North Iowa Area Community College Iowa Lakes Community College Iowa Central Community College Iowa Valley Community College District Eastern Iowa Community College District Des Moines Area Community College Southeastern Community College
Eight (8) were approved as Area Vocational Schools: (current names)
Northeast Iowa Community College Northwest Iowa Community College Hawkeye Community College Kirkwood Community College Western Iowa Tech Community College Iowa Western Community College Southwestern Community College Indian Hills Community College
3Iowa’s Community Colleges
By July 1970, all of the area vocational-technical high
schools and junior colleges had either merged into the new system or were discontinued. All areas of the state were included in community college service areas by July 1971.
State oversight primarily consisted of program approval and periodic evaluations by the state and representatives of the Regent universities. Additionally, as of 1980, all 15 institutions were accredited by the North Central Association of Colleges and Schools.
The community colleges and area vocational schools grew quickly, both in terms of students served and services offered. In 1983, the Iowa Industrial New Jobs Training Act was established by the legislature adding contracted customized job training to the community colleges’ list of services. Other job training programs followed, further expanding the role of community colleges in economic development.
In 1987, Hawkeye Community College, the final Iowa college operating as a vocational school, received approval to operate as a comprehensive community college. Currently, all 15 operate as comprehensive community colleges, offering arts and science (college transfer), vocational preparatory, and adult and continuing education programs.
In 1989, the 73rd General Assembly passed Senate File 449, requiring that secondary vocational programs be competency based, and that the competencies be articulated with postsecondary vocational education. This resulted in increased cooperation between local education agencies and the community colleges and a growth in programs in which high school students are awarded college credit for coursework completed in these articulated programs. The Postsecondary Enrollment Options Act of 1989 and later supplemental weighting for concurrent enrollment allowed high school students to jointly enroll in college credit courses in significantly greater numbers.
In 1990, the legislature directed the Iowa Department of Education to overhaul the process by which it reviewed and approved community colleges. The new process, implemented beginning in 1997, was designed to better align with the accreditation process of the North Central Association.
In the late 1990s, the majority of community colleges expanded their role in workforce development by becoming Workforce Investment Act primary service providers and housing one-stop centers.
During the 1990s, the community college management information system (MIS) was developed. The first Condition of Iowa’s Community Colleges report was issued in September 2000. In subsequent years, the system was refined and expanded.
In 1999, the 78th General Assembly passed House File
680 mandating the Department of Education convene a committee to identify and study options for restructuring the governance of Iowa’s Community Colleges. The committee’s final report, which was submitted to the Legislature in December 1999, reaffirmed the existing governance structure of Iowa’s Community Colleges, with locally elected boards of directors and the State Board of Education with responsibility for statewide oversight and coordination. The study recommended the development of a statewide strategic plan for the system of community colleges.
House File 2433 mandated the development of a statewide strategic plan for the statewide system of community colleges every five years. The first plan was approved by community college presidents, the Iowa Association of Community College Trustees, and the State Board of Education, and forwarded to the legislature by July 2001.
Within six months of implementing HF 2433, a progress report was published summarizing statewide and local community college responses to the five-year plan, “Shaping the Future.” Annual progress reports are compiled by the Department of Education and presented to the State Board of Education. In spring 2006, the State Board of Education approved the second five-year statewide community college strategic plan. The following August, the State Board of Education approved performance measures for the plan. Baseline data on each of the measures was reviewed. An annual report is provided to the State Board of Education on these performance measures.
For most of the colleges’ first 40 years, faculty were licensed by the state. In 2003, the legislature replaced licensure requirements with minimum faculty standards and quality faculty plan requirements tied to state accreditation.
Iowa Code
The statement of policy describing the educational opportunities and services to be provided by community colleges is included in Section 260C.1 of the Iowa Code. This statement of policy identifies the following as services that should be included in a community college’s mission.
• The first two years of college work, including pre-professional education.
• Vocational and technical training. • Programs for in-service training and retraining of
workers. • Programs for high school completion for students of
post-high school age. • Programs for all students of high school age who
may best serve themselves by enrolling in vocational and technical training, while also enrolled in a local
4 The Condition of Iowa’s Community Colleges
high school, public or private. • Programs for students of high school age that
provide advanced college placement courses not taught at a student’s high school while the student is also enrolled in the high school.
• Student personnel services. • Community services. • Vocational education for persons who have
academic, socioeconomic, or other handicaps that prevent succeeding in regular vocational education programs.
• Training, retraining, and all necessary preparation
for productive employment of all citizens. • Vocational and technical training for persons who
are not enrolled in a high school and who have not completed high school.
• Developmental education for persons who are academically or personally under prepared to succeed in their program of study.
In 2006, the Iowa Department of Education created a book entitled Forty Years of Growth and Achievement: A History of Iowa’s Community Colleges, which details the statewide, institutional history of the community colleges. For more information on the history of Iowa’s community colleges, see this publication.
Area 1 (NICC)Northeast Iowa Community College
Administrative CenterBox 400
Calmar, Iowa 52132
Area 2 (NIACC)North Iowa Area Community College
Administrative Center500 College Drive
Mason City, Iowa 50401
Area 3 (ILCC)Iowa Lakes Community College
Administrative Center19 South 7th Street
Estherville, Iowa 51334
Area 4 (NCC)Northwest Iowa Community College
Administrative Center603 West Park Street
Sheldon, Iowa 51201-1046
Area 5 (ICCC)Iowa Central Community College
Administrative Center330 Avenue M
Fort Dodge, Iowa 50501
Area 6 (IVCCD)Iowa Valley Community College District
Administrative Center3702 South Center StreetMarshalltown, Iowa 50158
Area 7 (HCC)Hawkeye Community College
Administrative Center1501 East Orange Road, Box 8015
Waterloo, Iowa 50704
Area 9 (EICCD)Eastern Iowa Community College District
Administrative Center306 West River Road
Davenport, Iowa 52801
Area 10 (KCC)Kirkwood Community College
Administrative Center6301 Kirkwood Blvd., S.W., Box 2068
Cedar Rapids, Iowa 52406-2068
Area 11 (DMACC)Des Moines Area Community College
Administrative Center2006 South Ankeny Blvd.
Ankeny, Iowa 50021
Area 12 (WITCC)Western Iowa Tech Community College
Administrative Center4647 Stone Avenue, Box 5199Sioux City, Iowa 51102-5199
Area 13 (IWCC)Iowa Western Community College
Administrative Center2700 College Road, Box 4-C
Council Bluffs, Iowa 51502-3004
Area 14 (SWCC)Southwestern Community College
Administrative Center1501 West Townline Street
Creston, Iowa 50801
Area 15 (IHCC)Indian Hills Community College
Administrative Center525 Grandview AvenueOttumwa, Iowa 52501
Area 16 (SCC)Southeastern Community College
Administrative Center1015 South Gear Avenue, Box 180West Burlington, Iowa 52655-0180
5Iowa’s Community Colleges

6 The Condition of Iowa’s Community Colleges
7Fall Enrollment
Fall Enrollment
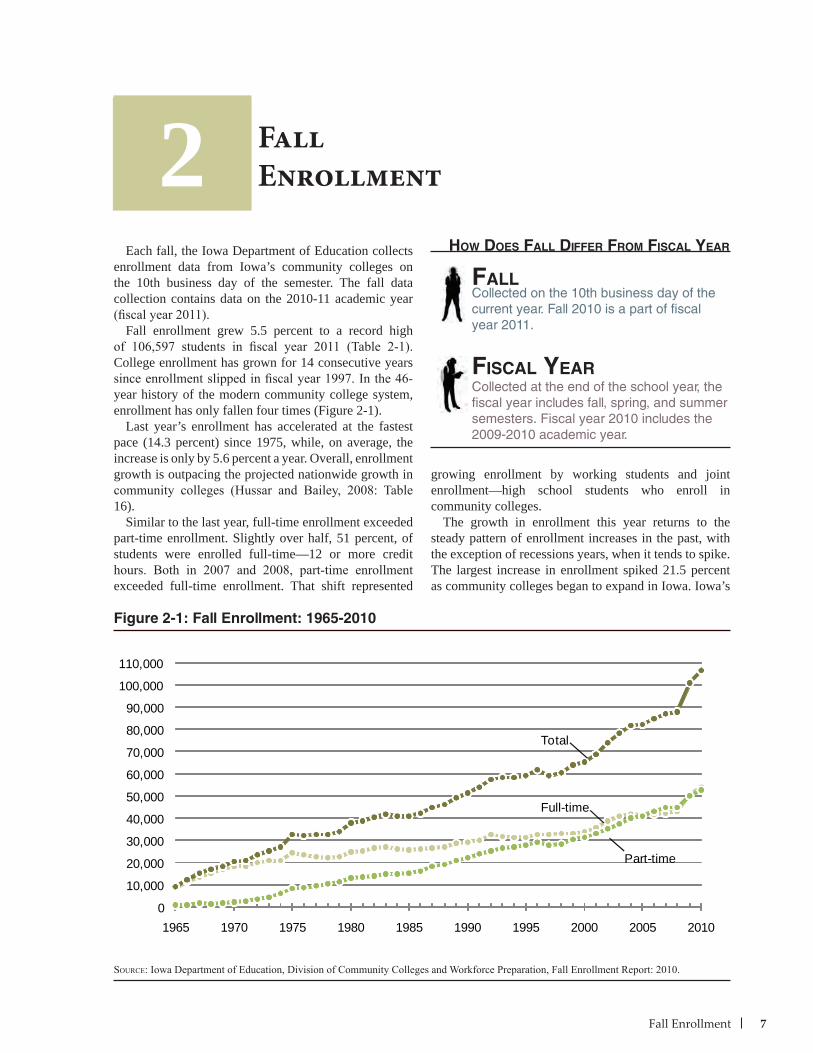
Figure 2-1: Fall Enrollment: 1965-2010
2
Source: Iowa Department of Education, Division of Community Colleges and Workforce Preparation, Fall Enrollment Report: 2010.
Each fall, the Iowa Department of Education collects enrollment data from Iowa’s community colleges on the 10th business day of the semester. The fall data collection contains data on the 2010-11 academic year (fiscal year 2011).
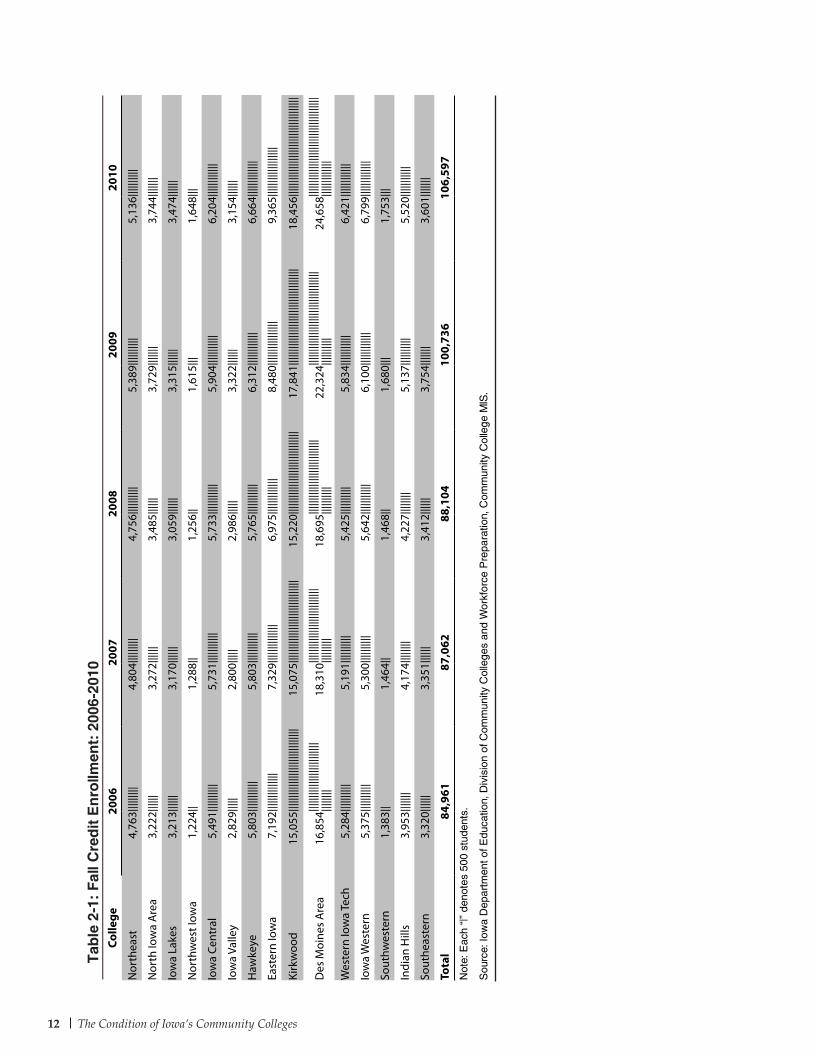
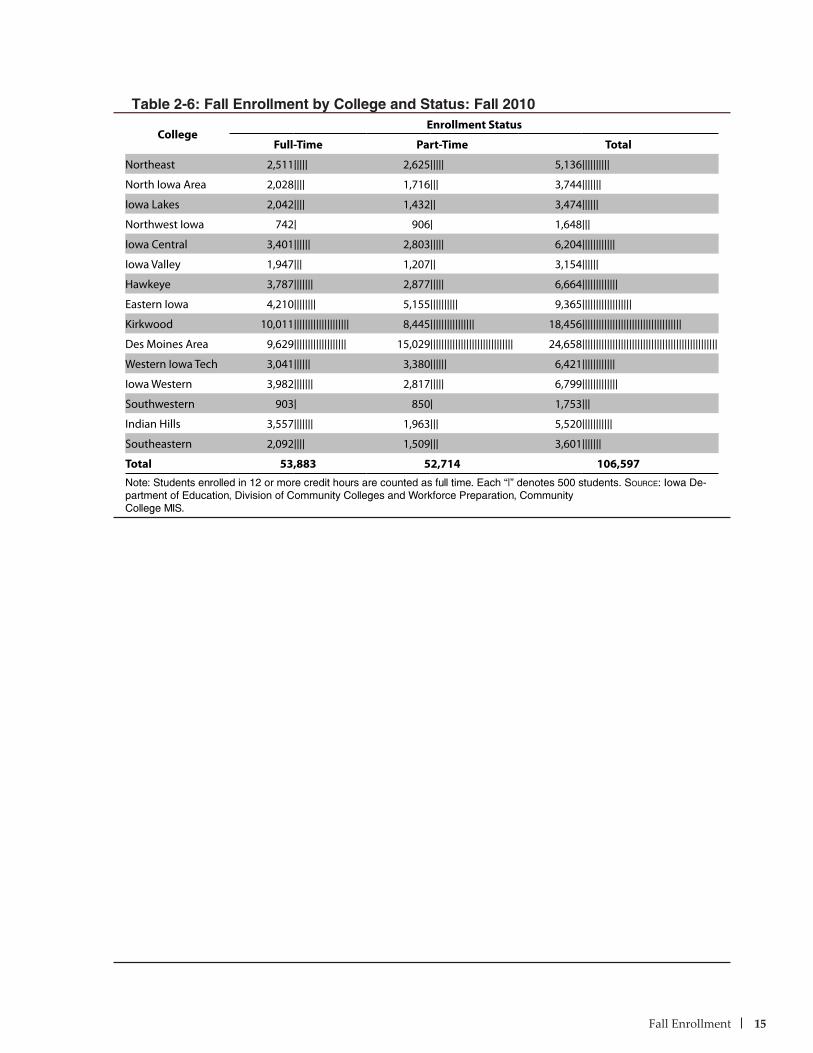
Fall enrollment grew 5.5 percent to a record high of 106,597 students in fiscal year 2011 (Table 2-1). College enrollment has grown for 14 consecutive years since enrollment slipped in fiscal year 1997. In the 46-year history of the modern community college system, enrollment has only fallen four times (Figure 2-1).
Last year’s enrollment has accelerated at the fastest pace (14.3 percent) since 1975, while, on average, the increase is only by 5.6 percent a year. Overall, enrollment growth is outpacing the projected nationwide growth in community colleges (Hussar and Bailey, 2008: Table 16).
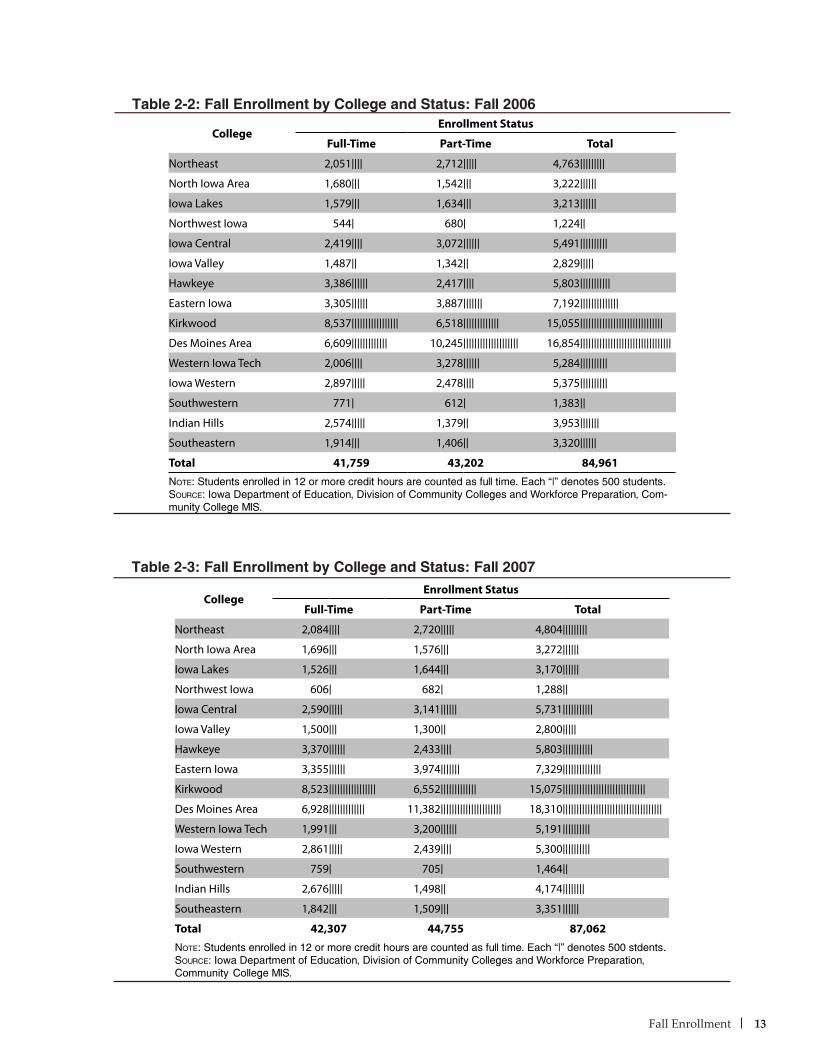
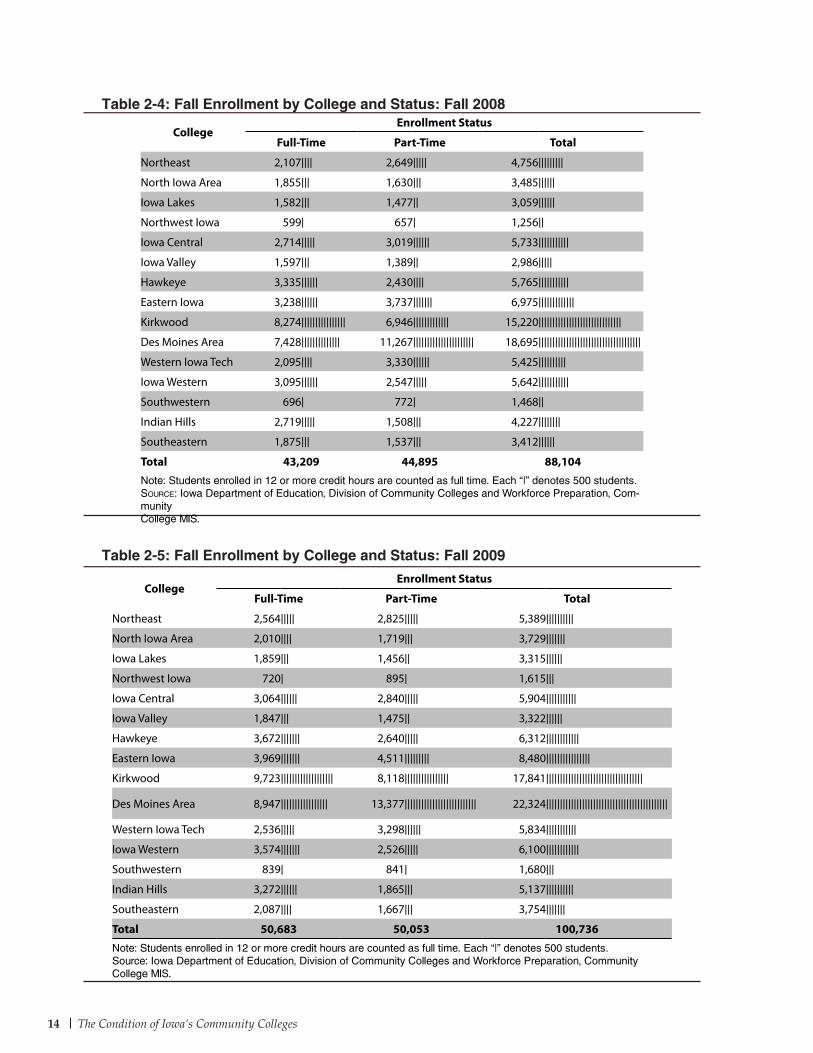
Similar to the last year, full-time enrollment exceeded part-time enrollment. Slightly over half, 51 percent, of students were enrolled full-time—12 or more credit hours. Both in 2007 and 2008, part-time enrollment exceeded full-time enrollment. That shift represented
growing enrollment by working students and joint enrollment—high school students who enroll in community colleges.
The growth in enrollment this year returns to the steady pattern of enrollment increases in the past, with the exception of recessions years, when it tends to spike. The largest increase in enrollment spiked 21.5 percent as community colleges began to expand in Iowa. Iowa’s
How Does Fall DiFFer From Fiscal Year
Collected on the 10th business day of the current year. Fall 2010 is a part of fiscal year 2011.
Collected at the end of the school year, the fiscal year includes fall, spring, and summer semesters. Fiscal year 2010 includes the 2009-2010 academic year.
Fall
Fiscal Year
0
10,000
20,000
30,000
40,000
50,000
60,000
70,000
80,000
90,000
100,000
110,000
1965 1970 1975 1980 1985 1990 1995 2000 2005 2010
Total
Full-time
Part-time
8 The Condition of Iowa’s Community Colleges
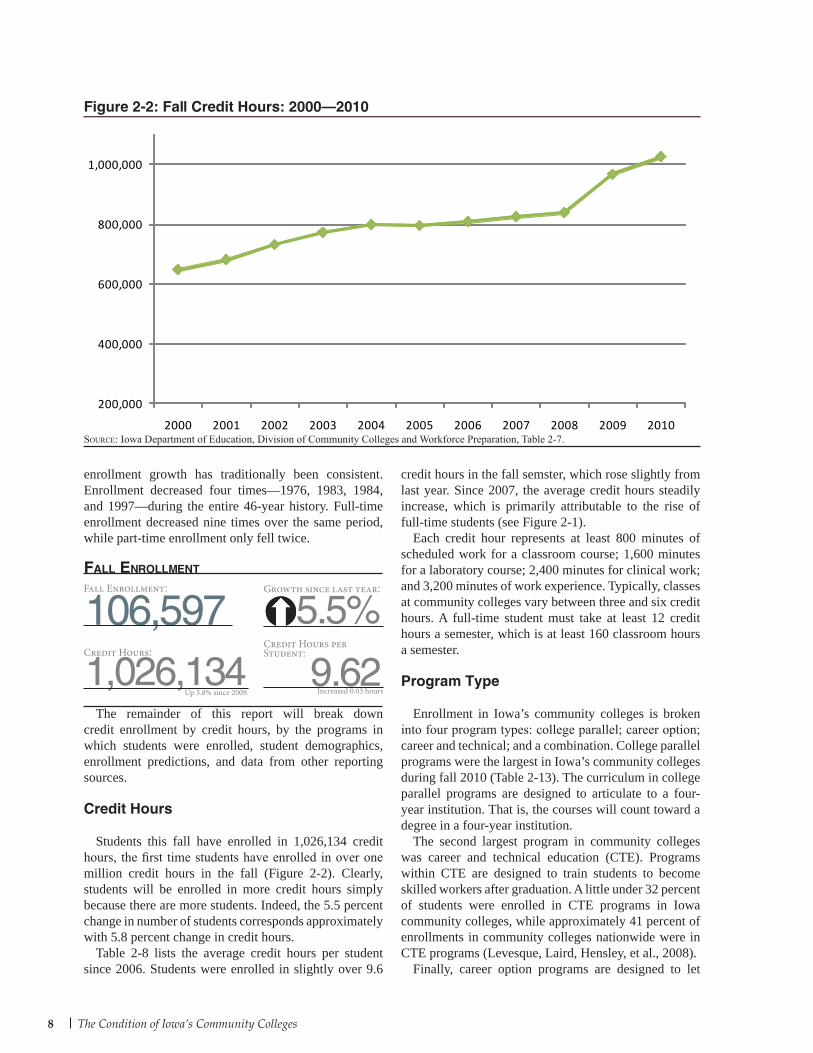
Figure 2-2: Fall Credit Hours: 2000–2010
Source: Iowa Department of Education, Division of Community Colleges and Workforce Preparation, Table 2-7.
enrollment growth has traditionally been consistent. Enrollment decreased four times—1976, 1983, 1984, and 1997—during the entire 46-year history. Full-time enrollment decreased nine times over the same period, while part-time enrollment only fell twice.
The remainder of this report will break down credit enrollment by credit hours, by the programs in which students were enrolled, student demographics, enrollment predictions, and data from other reporting sources.
Credit Hours
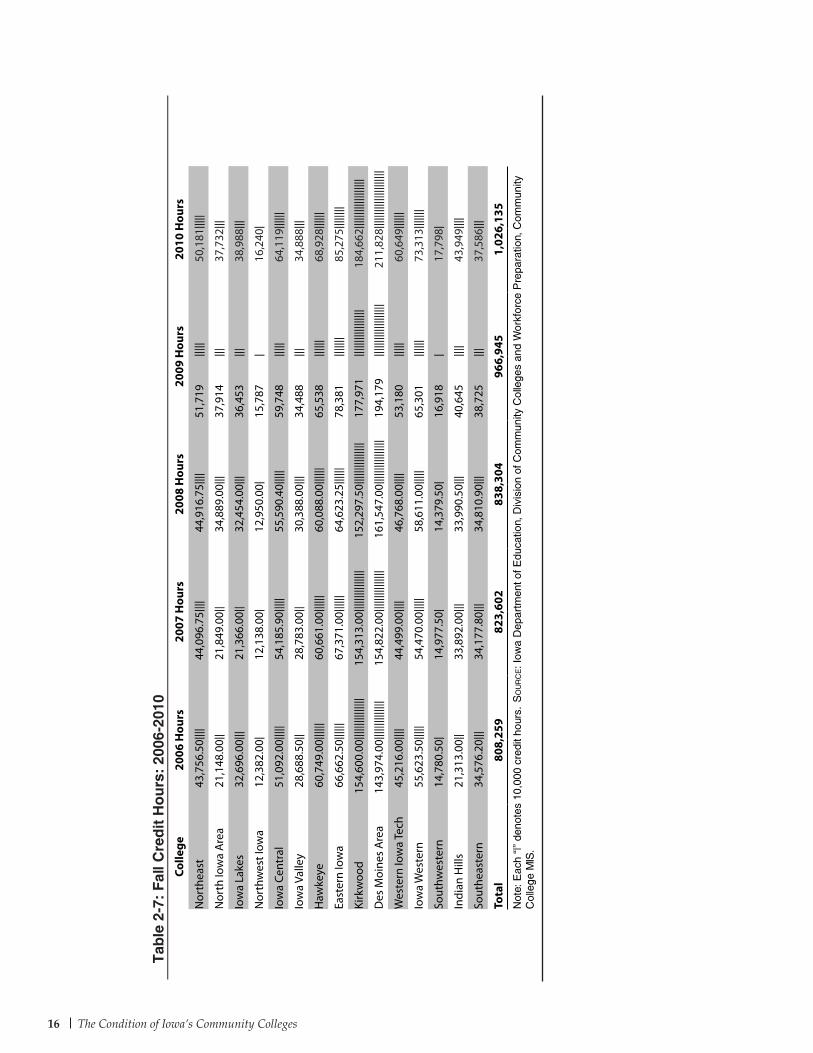
Students this fall have enrolled in 1,026,134 credit hours, the first time students have enrolled in over one million credit hours in the fall (Figure 2-2). Clearly, students will be enrolled in more credit hours simply because there are more students. Indeed, the 5.5 percent change in number of students corresponds approximately with 5.8 percent change in credit hours.
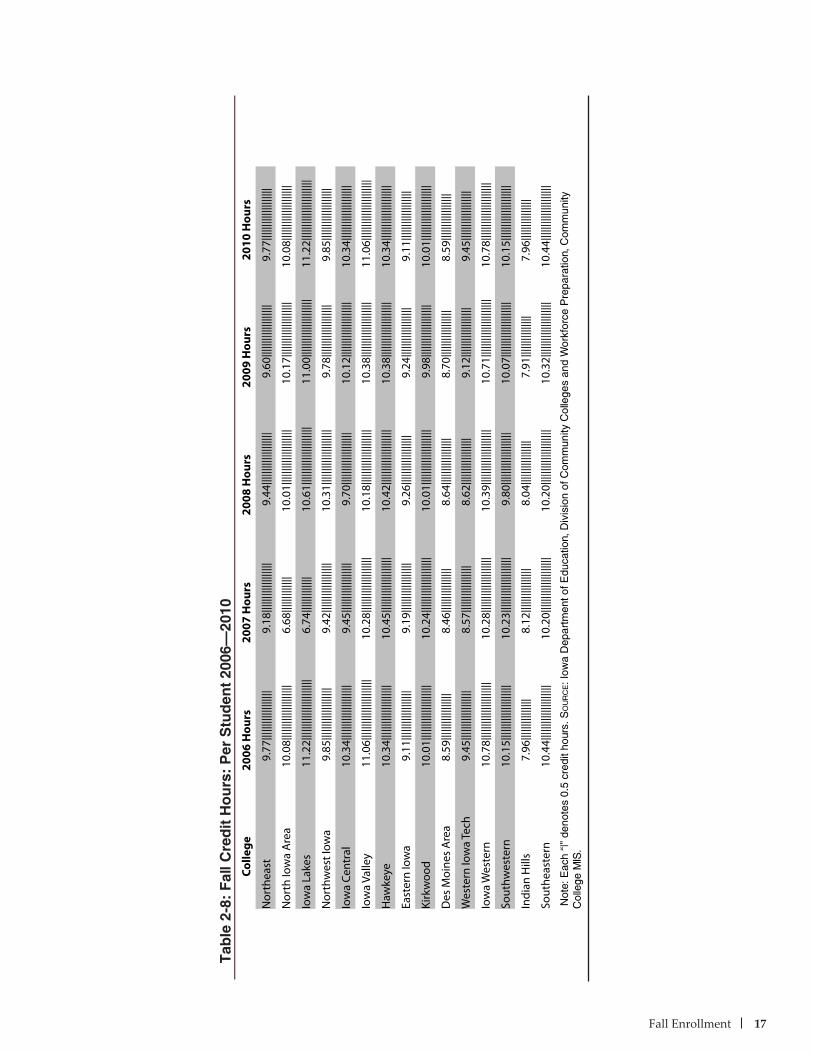
Table 2-8 lists the average credit hours per student since 2006. Students were enrolled in slightly over 9.6
credit hours in the fall semster, which rose slightly from last year. Since 2007, the average credit hours steadily increase, which is primarily attributable to the rise of full-time students (see Figure 2-1).
Each credit hour represents at least 800 minutes of scheduled work for a classroom course; 1,600 minutes for a laboratory course; 2,400 minutes for clinical work; and 3,200 minutes of work experience. Typically, classes at community colleges vary between three and six credit hours. A full-time student must take at least 12 credit hours a semester, which is at least 160 classroom hours a semester.
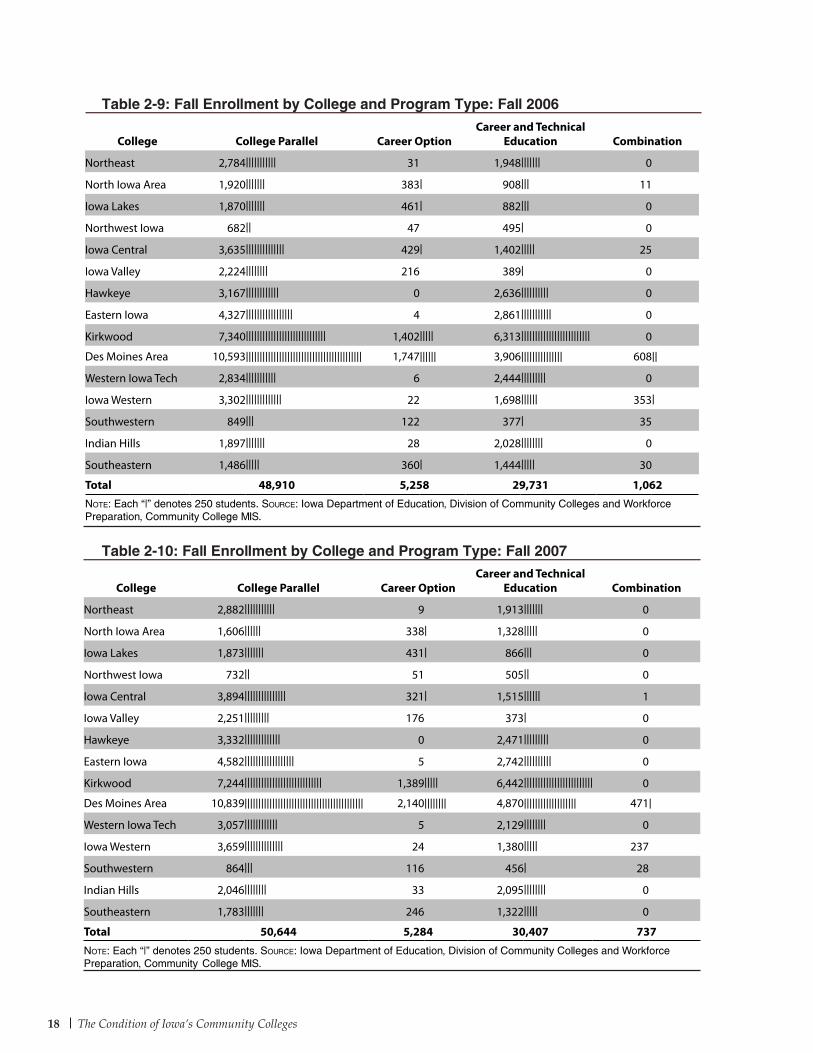
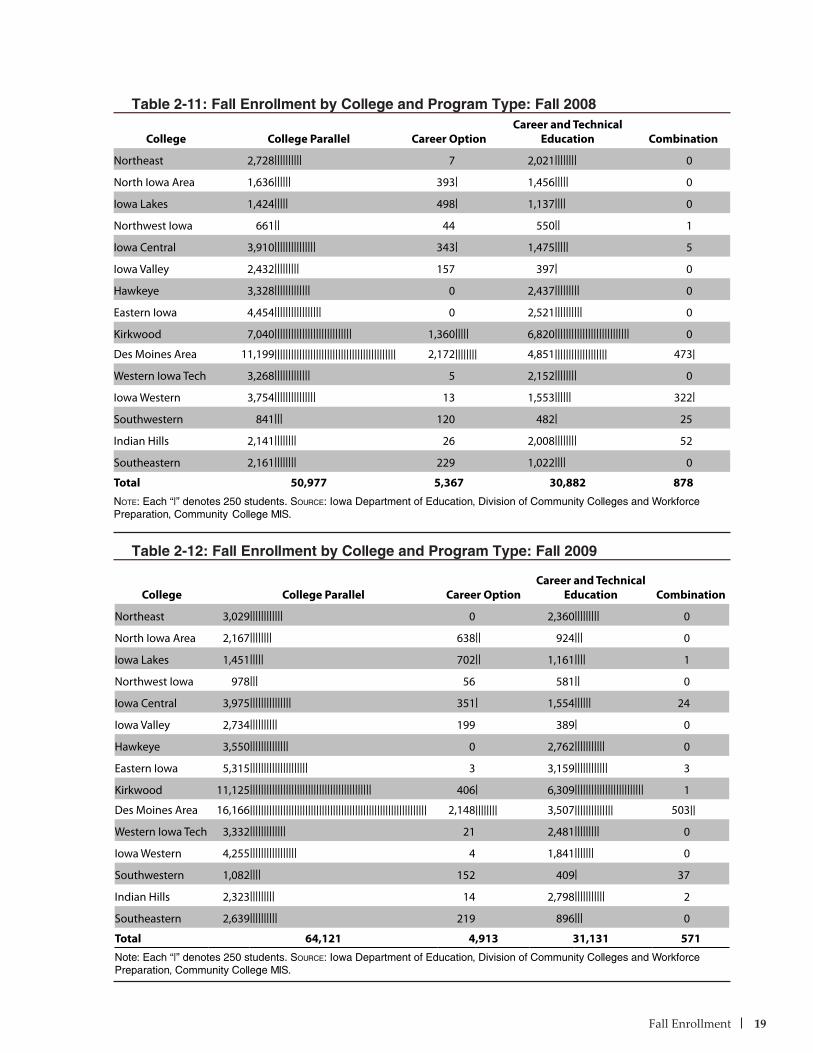
Program Type
Enrollment in Iowa’s community colleges is broken into four program types: college parallel; career option; career and technical; and a combination. College parallel programs were the largest in Iowa’s community colleges during fall 2010 (Table 2-13). The curriculum in college parallel programs are designed to articulate to a four-year institution. That is, the courses will count toward a degree in a four-year institution.
The second largest program in community colleges was career and technical education (CTE). Programs within CTE are designed to train students to become skilled workers after graduation. A little under 32 percent of students were enrolled in CTE programs in Iowa community colleges, while approximately 41 percent of enrollments in community colleges nationwide were in CTE programs (Levesque, Laird, Hensley, et al., 2008).
Finally, career option programs are designed to let
1,026,134
106,597Fall Enrollment:
Fall enrollment
Credit Hours:
9.62Up 5.8% since 2009. Increased 0.03 hours
5.5%Growth since last year:
Credit Hours per Student:
200,000
400,000
600,000
800,000
1,000,000
2000 2001 2002 2003 2004 2005 2006 2007 2008 2009 2010
9Fall Enrollment
students easily articulate to a four-year institution or to move into the workforce. Enrollments in career option programs have stagnated between 2006 and 2008 and declined 8.5 percent in 2009 and increased 5.5 percent in 2010 (Tables 2-9 through 2-13), while enrollments have increased in college parallel (4.4 percent) and CTE (7.6 percent) program types.
Student Demographics
The composition of community college students did not substantially change since last fall nor from last fiscal year (see Section 3). Just over 55 percent of students were female, which is consistent with the state and national trends in community colleges and four-year colleges (Snyder, Dillow, and Hoffman, 2008: Table 181). The average age was 23 years-old, similar to the last year, and consistent with the nationwide average of 23.7 (Provasnik and Planty, 2008). However, a more accurate description is the median age. Similar to two previous years, the median age of 2010 fall enrollees was 19 years-old. Nationally, the median age for students
at public two-year institutions was 21 years-old. Most students in community colleges were between 16 and 22 years-old.
Minorities comprise 14.5 percent of enrollment, a substantial increase over last year’s 11.9 percent. Blacks were the largest minority group (6.2 percent), followed by Hispanics (4.5 percent), and Asian/Pacific Islander group (1.9 percent). One percent (1%) indicated they were a part of multiple racial and ethnic groups.
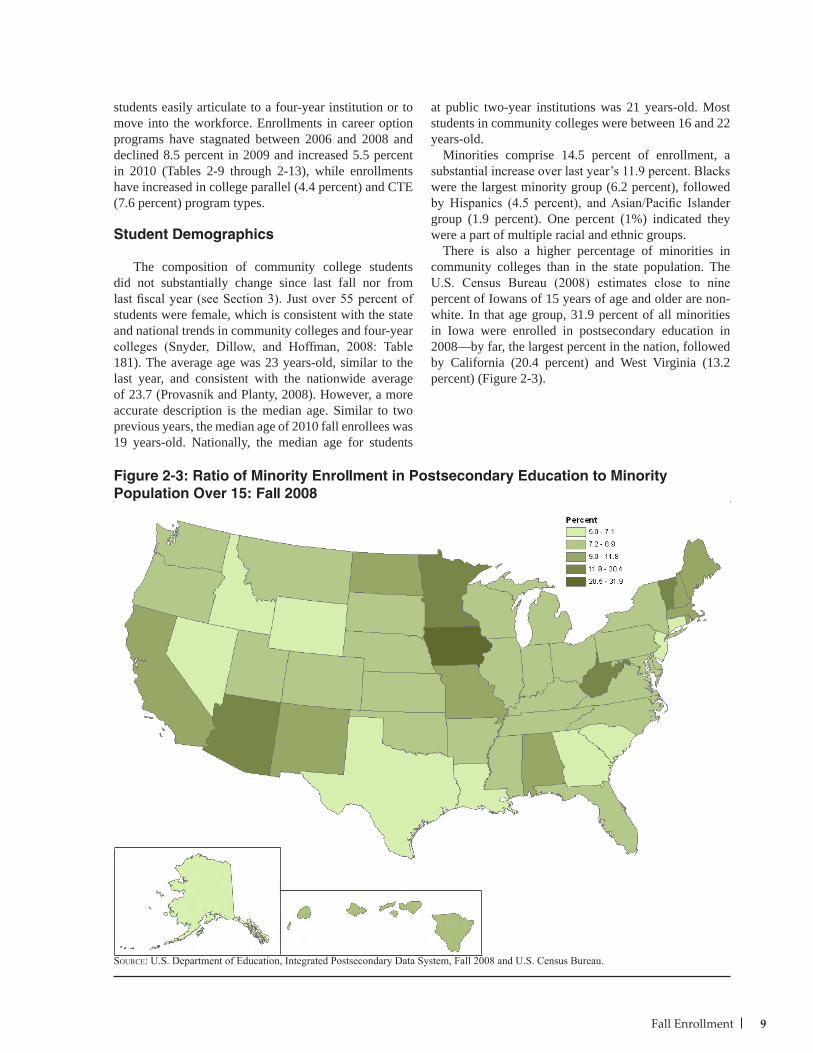
There is also a higher percentage of minorities in community colleges than in the state population. The U.S. Census Bureau (2008) estimates close to nine percent of Iowans of 15 years of age and older are non-white. In that age group, 31.9 percent of all minorities in Iowa were enrolled in postsecondary education in 2008—by far, the largest percent in the nation, followed by California (20.4 percent) and West Virginia (13.2 percent) (Figure 2-3).
Figure 2-3: Ratio of Minority Enrollment in Postsecondary Education to Minority Population Over 15: Fall 2008
Source: U.S. Department of Education, Integrated Postsecondary Data System, Fall 2008 and U.S. Census Bureau.
10 The Condition of Iowa’s Community Colleges
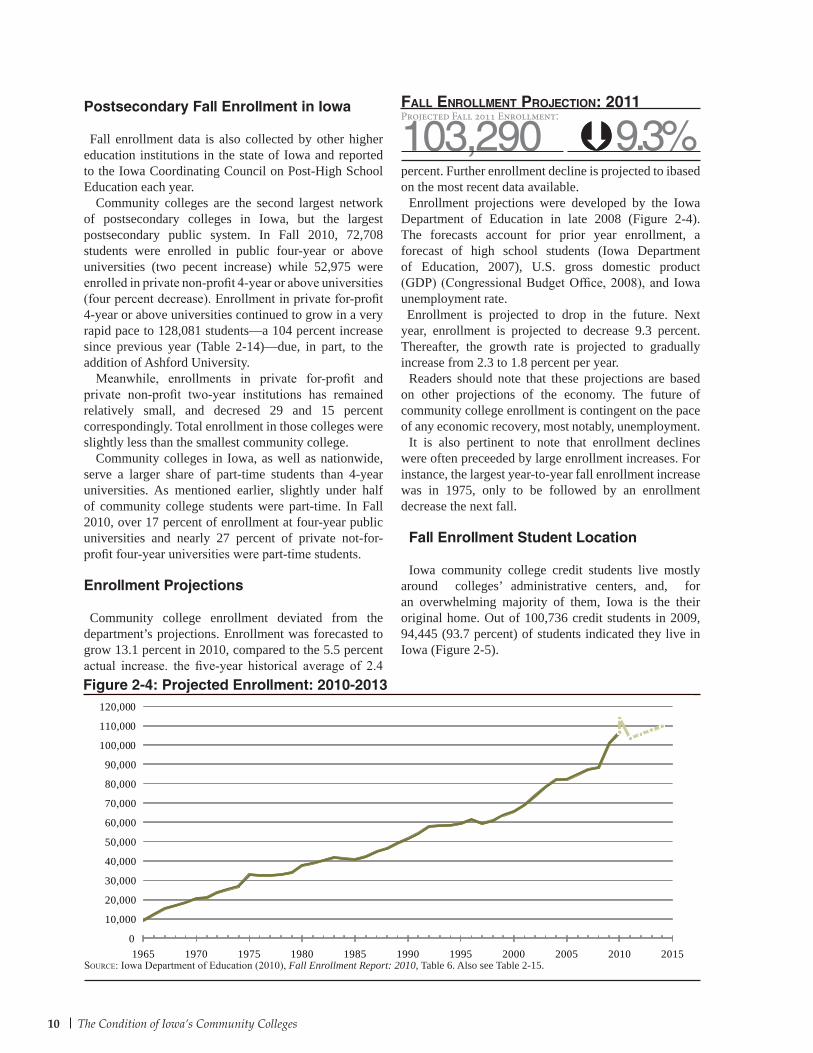
Figure 2-4: Projected Enrollment: 2010-2013
Source: Iowa Department of Education (2010), Fall Enrollment Report: 2010, Table 6. Also see Table 2-15.
Postsecondary Fall Enrollment in Iowa
Fall enrollment data is also collected by other higher education institutions in the state of Iowa and reported to the Iowa Coordinating Council on Post-High School Education each year.
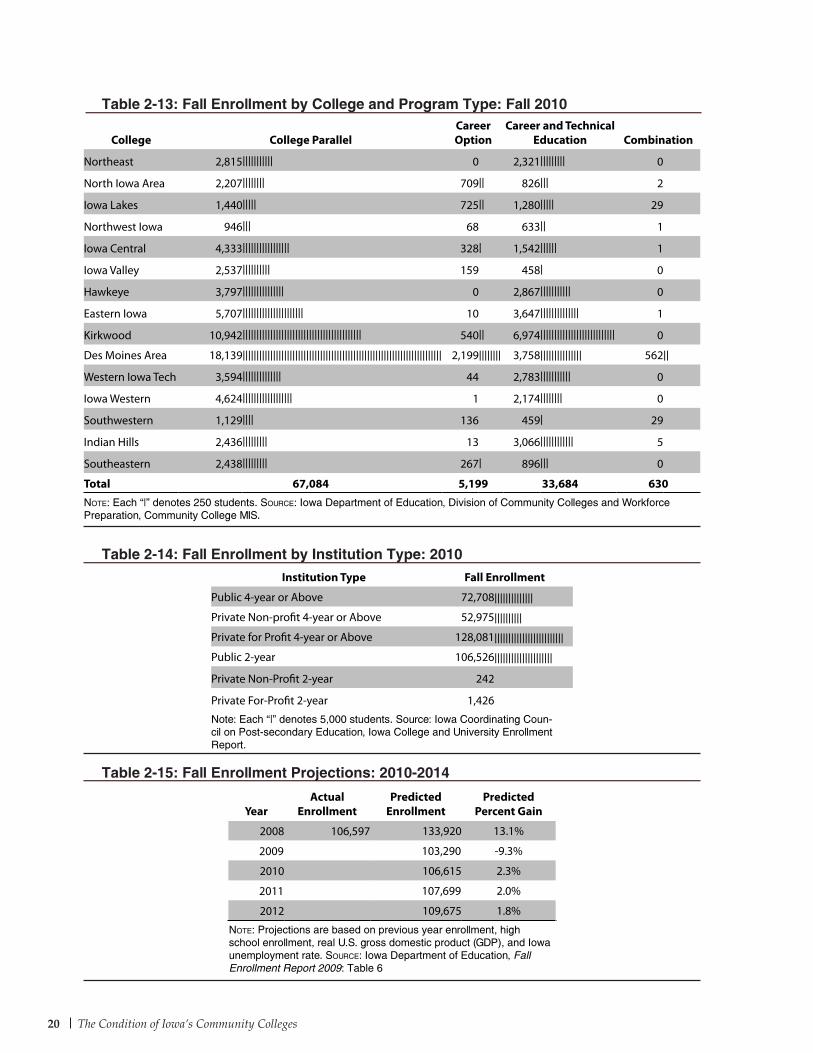
Community colleges are the second largest network of postsecondary colleges in Iowa, but the largest postsecondary public system. In Fall 2010, 72,708 students were enrolled in public four-year or above universities (two pecent increase) while 52,975 were enrolled in private non-profit 4-year or above universities (four percent decrease). Enrollment in private for-profit 4-year or above universities continued to grow in a very rapid pace to 128,081 students—a 104 percent increase since previous year (Table 2-14)—due, in part, to the addition of Ashford University.
Meanwhile, enrollments in private for-profit and private non-profit two-year institutions has remained relatively small, and decresed 29 and 15 percent correspondingly. Total enrollment in those colleges were slightly less than the smallest community college.
Community colleges in Iowa, as well as nationwide, serve a larger share of part-time students than 4-year universities. As mentioned earlier, slightly under half of community college students were part-time. In Fall 2010, over 17 percent of enrollment at four-year public universities and nearly 27 percent of private not-for-profit four-year universities were part-time students.
Enrollment Projections
Community college enrollment deviated from the department’s projections. Enrollment was forecasted to grow 13.1 percent in 2010, compared to the 5.5 percent actual increase. the five-year historical average of 2.4
percent. Further enrollment decline is projected to ibased on the most recent data available.
Enrollment projections were developed by the Iowa Department of Education in late 2008 (Figure 2-4). The forecasts account for prior year enrollment, a forecast of high school students (Iowa Department of Education, 2007), U.S. gross domestic product (GDP) (Congressional Budget Office, 2008), and Iowa unemployment rate.Enrollment is projected to drop in the future. Next
year, enrollment is projected to decrease 9.3 percent. Thereafter, the growth rate is projected to gradually increase from 2.3 to 1.8 percent per year.
Readers should note that these projections are based on other projections of the economy. The future of community college enrollment is contingent on the pace of any economic recovery, most notably, unemployment.
It is also pertinent to note that enrollment declines were often preceeded by large enrollment increases. For instance, the largest year-to-year fall enrollment increase was in 1975, only to be followed by an enrollment decrease the next fall.
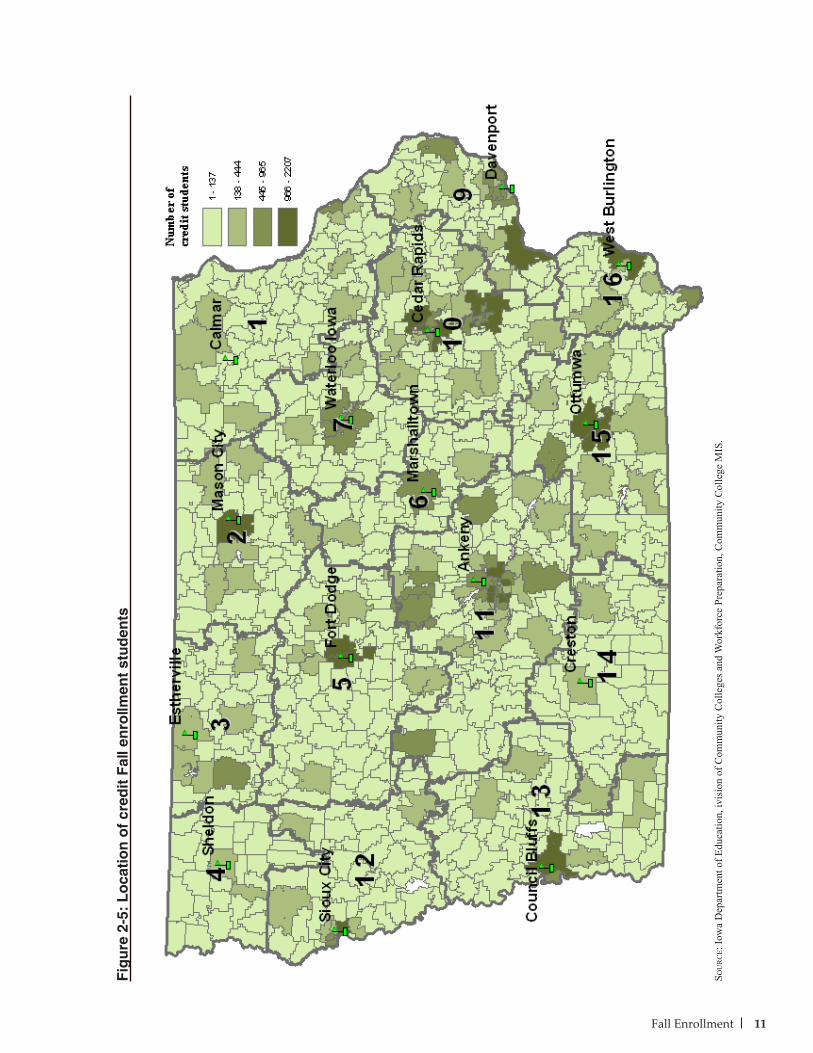
Fall Enrollment Student Location
Iowa community college credit students live mostly around colleges’ administrative centers, and, for an overwhelming majority of them, Iowa is the their original home. Out of 100,736 credit students in 2009, 94,445 (93.7 percent) of students indicated they live in Iowa (Figure 2-5).
103,290 9.3%Fall enrollment Projection: 2011Projected Fall 2011 Enrollment:
0
10,000
20,000
30,000
40,000
50,000
60,000
70,000
80,000
90,000
100,000
110,000
120,000
1965 1970 1975 1980 1985 1990 1995 2000 2005 2010 2015
11Fall Enrollment
Fig
ure
2-5
: L
oca
tio
n o
f cr
edit
Fal
l en
rollm
ent
stu
den
ts
Sou
rc
e: Io
wa
Dep
artm
ent o
f Edu
catio
n, iv
isio
n of
Com
mun
ity C
olle
ges a
nd W
orkf
orce
Pre
para
tion,
Com
mun
ity C
olle
ge M
IS.
The Condition of Iowa’s Community Colleges12
Tab
le 2
-1:
Fal
l Cre
dit
En
rollm
ent:
200
6-20
10Co
llege
2006
2007
2008
2009
2010
Nor
thea
st4,
763|
||||||
||4,
804|
||||||
||4,
756|
||||||
|||5,
389|
||||||
|||5,
136|
||||||
|||
Nor
th Io
wa
Are
a3,
222|
|||||
3,27
2||||
||3,
485|
|||||
3,72
9||||
|||3,
744|
||||||
Iow
a La
kes
3,21
3||||
||3,
170|
|||||
3,05
9||||
||3,
315|
|||||
3,47
4||||
||
Nor
thw
est I
owa
1,22
4||
1,28
8||
1,25
6||
1,61
5|||
1,64
8|||
Iow
a Ce
ntra
l5,
491|
||||||
|||5,
731|
||||||
||||
5,73
3||||
||||||
|5,
904|
||||||
||||
6,20
4||||
||||||
||
Iow
a Va
lley
2,82
9||||
|2,
800|
||||
2,98
6||||
|3,
322|
|||||
3,15
4||||
||
Haw
keye
5,80
3||||
||||||
|5,
803|
||||||
||||
5,76
5||||
||||||
|6,
312|
||||||
|||||
6,66
4||||
||||||
|||
East
ern
Iow
a7,
192|
||||||
||||||
|7,
329|
||||||
||||||
|6,
975|
||||||
||||||
8,48
0||||
||||||
||||||
9,36
5||||
||||||
||||||
||
Kirk
woo
d15
,055
||||||
||||||
||||||
||||||
||||||
15,0
75|||
||||||
||||||
||||||
||||||
|||15
,220
||||||
||||||
||||||
||||||
||||||
17,8
41|||
||||||
||||||
||||||
||||||
||||||
||18
,456
||||||
||||||
||||||
||||||
||||||
||||||
Des
Moi
nes
Are
a16
,854
||||||
||||||
||||||
||||||
||||
|||||
18,3
10|||
||||||
||||||
||||||
||||||
||||||
|||18
,695
||||||
||||||
||||||
||||||
||||||
||||||
|22
,324
||||||
||||||
||||||
||||||
||||||
||||
||||||
||||
24,6
58|||
||||||
||||||
||||||
||||||
||||||
||||||
||||||
||||
Wes
tern
Iow
a Te
ch5,
284|
||||||
|||5,
191|
||||||
|||5,
425|
||||||
|||5,
834|
||||||
||||
6,42
1||||
||||||
||
Iow
a W
este
rn5,
375|
||||||
|||5,
300|
||||||
|||5,
642|
||||||
||||
6,10
0||||
||||||
||6,
799|
||||||
||||||
Sout
hwes
tern
1,38
3||
1,46
4||
1,46
8||
1,68
0|||
1,75
3|||
Indi
an H
ills
3,95
3||||
|||4,
174|
||||||
|4,
227|
||||||
|5,
137|
||||||
|||5,
520|
||||||
||||
Sout
heas
tern
3,32
0||||
||3,
351|
|||||
3,41
2||||
||3,
754|
||||||
3,60
1||||
|||
Tota
l84
,961
87,0
6288
,104
100,
736
106,
597
Not
e: E
ach
“|”
deno
tes
500
stud
ents
.
Sou
rce:
Iow
a D
epar
tmen
t of E
duca
tion,
Div
isio
n of
Com
mun
ity C
olle
ges
and
Wor
kfor
ce P
repa
ratio
n, C
omm
unity
Col
lege
MIS
.
Fall Enrollment 13
CollegeEnrollment Status
Full-Time Part-Time Total
Northeast 2,051|||| 2,712||||| 4,763|||||||||
North Iowa Area 1,680||| 1,542||| 3,222||||||
Iowa Lakes 1,579||| 1,634||| 3,213||||||
Northwest Iowa 544| 680| 1,224||
Iowa Central 2,419|||| 3,072|||||| 5,491||||||||||
Iowa Valley 1,487|| 1,342|| 2,829|||||
Hawkeye 3,386|||||| 2,417|||| 5,803|||||||||||
Eastern Iowa 3,305|||||| 3,887||||||| 7,192||||||||||||||
Kirkwood 8,537||||||||||||||||| 6,518||||||||||||| 15,055||||||||||||||||||||||||||||||
Des Moines Area 6,609||||||||||||| 10,245|||||||||||||||||||| 16,854|||||||||||||||||||||||||||||||||
Western Iowa Tech 2,006|||| 3,278|||||| 5,284||||||||||
Iowa Western 2,897||||| 2,478|||| 5,375||||||||||
Southwestern 771| 612| 1,383||
Indian Hills 2,574||||| 1,379|| 3,953|||||||
Southeastern 1,914||| 1,406|| 3,320||||||
Total 41,759 43,202 84,961Note: Students enrolled in 12 or more credit hours are counted as full time. Each “|” denotes 500 students. Source: Iowa Department of Education, Division of Community Colleges and Workforce Preparation, Com-munity College MIS.
Table 2-3: Fall Enrollment by College and Status: Fall 2007
Table 2-2: Fall Enrollment by College and Status: Fall 2006
CollegeEnrollment Status
Full-Time Part-Time Total
Northeast 2,084|||| 2,720||||| 4,804|||||||||
North Iowa Area 1,696||| 1,576||| 3,272||||||
Iowa Lakes 1,526||| 1,644||| 3,170||||||
Northwest Iowa 606| 682| 1,288||
Iowa Central 2,590||||| 3,141|||||| 5,731|||||||||||
Iowa Valley 1,500||| 1,300|| 2,800|||||
Hawkeye 3,370|||||| 2,433|||| 5,803|||||||||||
Eastern Iowa 3,355|||||| 3,974||||||| 7,329||||||||||||||
Kirkwood 8,523||||||||||||||||| 6,552||||||||||||| 15,075||||||||||||||||||||||||||||||
Des Moines Area 6,928||||||||||||| 11,382|||||||||||||||||||||| 18,310||||||||||||||||||||||||||||||||||||
Western Iowa Tech 1,991||| 3,200|||||| 5,191||||||||||
Iowa Western 2,861||||| 2,439|||| 5,300||||||||||
Southwestern 759| 705| 1,464||
Indian Hills 2,676||||| 1,498|| 4,174||||||||
Southeastern 1,842||| 1,509||| 3,351||||||
Total 42,307 44,755 87,062Note: Students enrolled in 12 or more credit hours are counted as full time. Each “|” denotes 500 stdents. Source: Iowa Department of Education, Division of Community Colleges and Workforce Preparation, Community College MIS.
The Condition of Iowa’s Community Colleges14
Table 2-4: Fall Enrollment by College and Status: Fall 2008
Table 2-5: Fall Enrollment by College and Status: Fall 2009
CollegeEnrollment Status
Full-Time Part-Time Total
Northeast 2,107|||| 2,649||||| 4,756|||||||||
North Iowa Area 1,855||| 1,630||| 3,485||||||
Iowa Lakes 1,582||| 1,477|| 3,059||||||
Northwest Iowa 599| 657| 1,256||
Iowa Central 2,714||||| 3,019|||||| 5,733|||||||||||
Iowa Valley 1,597||| 1,389|| 2,986|||||
Hawkeye 3,335|||||| 2,430|||| 5,765|||||||||||
Eastern Iowa 3,238|||||| 3,737||||||| 6,975|||||||||||||
Kirkwood 8,274|||||||||||||||| 6,946||||||||||||| 15,220||||||||||||||||||||||||||||||
Des Moines Area 7,428|||||||||||||| 11,267|||||||||||||||||||||| 18,695|||||||||||||||||||||||||||||||||||||
Western Iowa Tech 2,095|||| 3,330|||||| 5,425||||||||||
Iowa Western 3,095|||||| 2,547||||| 5,642|||||||||||
Southwestern 696| 772| 1,468||
Indian Hills 2,719||||| 1,508||| 4,227||||||||
Southeastern 1,875||| 1,537||| 3,412||||||
Total 43,209 44,895 88,104Note: Students enrolled in 12 or more credit hours are counted as full time. Each “|” denotes 500 students. Source: Iowa Department of Education, Division of Community Colleges and Workforce Preparation, Com-munity College MIS.
CollegeEnrollment Status
Full-Time Part-Time Total
Northeast 2,564||||| 2,825||||| 5,389||||||||||
North Iowa Area 2,010|||| 1,719||| 3,729|||||||
Iowa Lakes 1,859||| 1,456|| 3,315||||||
Northwest Iowa 720| 895| 1,615|||
Iowa Central 3,064|||||| 2,840||||| 5,904|||||||||||
Iowa Valley 1,847||| 1,475|| 3,322||||||
Hawkeye 3,672||||||| 2,640||||| 6,312||||||||||||
Eastern Iowa 3,969||||||| 4,511||||||||| 8,480||||||||||||||||
Kirkwood 9,723||||||||||||||||||| 8,118|||||||||||||||| 17,841|||||||||||||||||||||||||||||||||||
Des Moines Area 8,947||||||||||||||||| 13,377|||||||||||||||||||||||||| 22,324||||||||||||||||||||||||||||||||||||||||||||
Western Iowa Tech 2,536||||| 3,298|||||| 5,834|||||||||||
Iowa Western 3,574||||||| 2,526||||| 6,100||||||||||||
Southwestern 839| 841| 1,680|||
Indian Hills 3,272|||||| 1,865||| 5,137||||||||||
Southeastern 2,087|||| 1,667||| 3,754|||||||
Total 50,683 50,053 100,736
Note: Students enrolled in 12 or more credit hours are counted as full time. Each “|” denotes 500 students.Source: Iowa Department of Education, Division of Community Colleges and Workforce Preparation, Community College MIS.
Fall Enrollment 15
Table 2-6: Fall Enrollment by College and Status: Fall 2010
CollegeEnrollment Status
Full-Time Part-Time Total
Northeast 2,511||||| 2,625||||| 5,136||||||||||
North Iowa Area 2,028|||| 1,716||| 3,744|||||||
Iowa Lakes 2,042|||| 1,432|| 3,474||||||
Northwest Iowa 742| 906| 1,648|||
Iowa Central 3,401|||||| 2,803||||| 6,204||||||||||||
Iowa Valley 1,947||| 1,207|| 3,154||||||
Hawkeye 3,787||||||| 2,877||||| 6,664|||||||||||||
Eastern Iowa 4,210|||||||| 5,155|||||||||| 9,365||||||||||||||||||
Kirkwood 10,011|||||||||||||||||||| 8,445|||||||||||||||| 18,456||||||||||||||||||||||||||||||||||||
Des Moines Area 9,629||||||||||||||||||| 15,029|||||||||||||||||||||||||||||| 24,658|||||||||||||||||||||||||||||||||||||||||||||||||
Western Iowa Tech 3,041|||||| 3,380|||||| 6,421||||||||||||
Iowa Western 3,982||||||| 2,817||||| 6,799|||||||||||||
Southwestern 903| 850| 1,753|||
Indian Hills 3,557||||||| 1,963||| 5,520|||||||||||
Southeastern 2,092|||| 1,509||| 3,601|||||||
Total 53,883 52,714 106,597Note: Students enrolled in 12 or more credit hours are counted as full time. Each “|” denotes 500 students. Source: Iowa De-partment of Education, Division of Community Colleges and Workforce Preparation, Community College MIS.
The Condition of Iowa’s Community Colleges16
Tab
le 2
-7:
Fal
l Cre
dit
Ho
urs
: 20
06-2
010
Colle
ge20
06 H
ours
2007
Hou
rs20
08 H
ours
2009
Hou
rs20
10 H
ours
Nor
thea
st 4
3,75
6.50
||||
44,
096.
75 |||
| 4
4,91
6.75
||||
51,
719
|||
||50
,181
|||||
Nor
th Io
wa
Are
a 2
1,14
8.00
|| 2
1,84
9.00
|| 3
4,88
9.00
||| 3
7,91
4
|||37
,732
|||
Iow
a La
kes
32,
696.
00 |||
21,
366.
00 ||
32,
454.
00 |||
36,
453
|||
38,9
88|||
Nor
thw
est I
owa
12,
382.
00 |
12,
138.
00 |
12,
950.
00 |
15,
787
|
16,2
40|
Iow
a Ce
ntra
l 5
1,09
2.00
|||||
54,
185.
90 |||
|| 5
5,59
0.40
|||||
59,
748
|||
||64
,119
||||||
Iow
a Va
lley
28,
688.
50 ||
28,
783.
00 ||
30,
388.
00 |||
34,
488
|||
34,8
88|||
Haw
keye
60,
749.
00 |||
||| 6
0,66
1.00
||||||
60,
088.
00 |||
||| 6
5,53
8
||||||
68,9
28|||
|||
East
ern
Iow
a 6
6,66
2.50
||||||
67,
371.
00 |||
||| 6
4,62
3.25
||||||
78,
381
|||
||||
85,2
75|||
|||||
Kirk
woo
d 1
54,6
00.0
0 ||||
||||||
|||||
154
,313
.00 |
||||||
||||||
|| 1
52,2
97.5
0 ||||
||||||
|||||
177
,971
|||
||||||
||||||
||18
4,66
2||||
||||||
||||||
||
Des
Moi
nes
Are
a 1
43,9
74.0
0 ||||
||||||
||||
154
,822
.00 |
||||||
||||||
|| 1
61,5
47.0
0 ||||
||||||
||||||
194
,179
|||
||||||
||||||
||||
211,
828|
||||||
||||||
||||||
||
Wes
tern
Iow
a Te
ch 4
5,21
6.00
||||
44,
499.
00 |||
| 4
6,76
8.00
||||
53,
180
|||
||60
,649
||||||
Iow
a W
este
rn 5
5,62
3.50
|||||
54,
470.
00 |||
|| 5
8,61
1.00
|||||
65,
301
|||
|||73
,313
||||||
|
Sout
hwes
tern
14,
780.
50 |
14,
977.
50 |
14,
379.
50 |
16,
918
|
17,7
98|
Indi
an H
ills
21,
313.
00 ||
33,
892.
00 |||
33,
990.
50 |||
40,
645
|||
|43
,949
||||
Sout
heas
tern
34,
576.
20 |||
34,
177.
80 |||
34,
810.
90 |||
38,
725
|||
37,5
86|||
Tota
l80
8,25
982
3,60
283
8,30
496
6,94
51,
026,
135
Not
e: E
ach
“|”
deno
tes
10,0
00 c
redi
t hou
rs.
So
ur
ce: I
owa
Dep
artm
ent o
f Edu
catio
n, D
ivis
ion
of C
omm
unity
Col
lege
s an
d W
orkf
orce
Pre
para
tion,
Com
mun
ity
Col
lege
MIS
.
Fall Enrollment 17
Tab
le 2
-8:
Fal
l Cre
dit
Ho
urs
: P
er S
tud
ent
2006
–20
10Co
llege
2006
Hou
rs20
07 H
ours
2008
Hou
rs20
09 H
ours
2010
Hou
rs
Nor
thea
st 9
.77 |
||||||
||||||
|||||
9.1
8 ||||
||||||
||||||
|| 9
.44 |
||||||
||||||
||||||
9.6
0 ||||
||||||
||||||
||| 9
.77 |
||||||
||||||
||||||
Nor
th Io
wa
Are
a 1
0.08
||||||
||||||
||||||
|| 6
.68 |
||||||
||||||
10.
01 |||
||||||
||||||
|||||
10.
17 |||
||||||
||||||
|||||
10.
08 |||
||||||
||||||
|||||
Iow
a La
kes
11.
22 |||
||||||
||||||
||||||
| 6
.74 |
||||||
||||||
10.
61 |||
||||||
||||||
||||||
11.
00 |||
||||||
||||||
||||||
11.
22 |||
||||||
||||||
||||||
|
Nor
thw
est I
owa
9.8
5 ||||
||||||
||||||
||| 9
.42 |
||||||
||||||
|||||
10.
31 |||
||||||
||||||
|||||
9.7
8 ||||
||||||
||||||
||| 9
.85 |
||||||
||||||
||||||
Iow
a Ce
ntra
l 1
0.34
||||||
||||||
||||||
|| 9
.45 |
||||||
||||||
|||||
9.7
0 ||||
||||||
||||||
||| 1
0.12
||||||
||||||
||||||
|| 1
0.34
||||||
||||||
||||||
||
Iow
a Va
lley
11.
06 |||
||||||
||||||
||||||
| 1
0.28
||||||
||||||
||||||
|| 1
0.18
||||||
||||||
||||||
|| 1
0.38
||||||
||||||
||||||
|| 1
1.06
||||||
||||||
||||||
||||
Haw
keye
10.
34 |||
||||||
||||||
|||||
10.
45 |||
||||||
||||||
|||||
10.
42 |||
||||||
||||||
|||||
10.
38 |||
||||||
||||||
|||||
10.
34 |||
||||||
||||||
|||||
East
ern
Iow
a 9
.11 |
||||||
||||||
|||||
9.1
9 ||||
||||||
||||||
|| 9
.26 |
||||||
||||||
|||||
9.2
4 ||||
||||||
||||||
|| 9
.11 |
||||||
||||||
|||||
Kirk
woo
d 1
0.01
||||||
||||||
||||||
|| 1
0.24
||||||
||||||
||||||
|| 1
0.01
||||||
||||||
||||||
|| 9
.98 |
||||||
||||||
||||||
10.
01 |||
||||||
||||||
|||||
Des
Moi
nes
Are
a 8
.59 |
||||||
||||||
||||
8.4
6 ||||
||||||
||||||
8.6
4 ||||
||||||
||||||
| 8
.70 |
||||||
||||||
||||
8.5
9 ||||
||||||
||||||
|
Wes
tern
Iow
a Te
ch 9
.45 |
||||||
||||||
|||||
8.5
7 ||||
||||||
||||||
| 8
.62 |
||||||
||||||
||||
9.1
2 ||||
||||||
||||||
|| 9
.45 |
||||||
||||||
|||||
Iow
a W
este
rn 1
0.78
||||||
||||||
||||||
||| 1
0.28
||||||
||||||
||||||
|| 1
0.39
||||||
||||||
||||||
|| 1
0.71
||||||
||||||
||||||
||| 1
0.78
||||||
||||||
||||||
|||
Sout
hwes
tern
10.
15 |||
||||||
||||||
|||||
10.
23 |||
||||||
||||||
|||||
9.8
0 ||||
||||||
||||||
||| 1
0.07
||||||
||||||
||||||
|| 1
0.15
||||||
||||||
||||||
||
Indi
an H
ills
7.9
6 ||||
||||||
|||||
8.1
2 ||||
||||||
||||||
8.0
4 ||||
||||||
||||||
7.9
1 ||||
||||||
|||||
7.9
6 ||||
||||||
|||||
Sout
heas
tern
10.
44 |||
||||||
||||||
|||||
10.
20 |||
||||||
||||||
|||||
10.
20 |||
||||||
||||||
|||||
10.
32 |||
||||||
||||||
|||||
10.
44 |||
||||||
||||||
|||||
Not
e: E
ach
“|”
deno
tes
0.5
cred
it ho
urs.
So
ur
ce: I
owa
Dep
artm
ent o
f Edu
catio
n, D
ivis
ion
of C
omm
unity
Col
lege
s an
d W
orkf
orce
Pre
para
tion,
Com
mun
ity
Col
lege
MIS
.
The Condition of Iowa’s Community Colleges18
College College Parallel Career OptionCareer and Technical
Education Combination
Northeast 2,882||||||||||| 9 1,913||||||| 0
North Iowa Area 1,606|||||| 338| 1,328||||| 0
Iowa Lakes 1,873||||||| 431| 866||| 0
Northwest Iowa 732|| 51 505|| 0
Iowa Central 3,894||||||||||||||| 321| 1,515|||||| 1
Iowa Valley 2,251||||||||| 176 373| 0
Hawkeye 3,332||||||||||||| 0 2,471||||||||| 0
Eastern Iowa 4,582|||||||||||||||||| 5 2,742|||||||||| 0
Kirkwood 7,244|||||||||||||||||||||||||||| 1,389||||| 6,442||||||||||||||||||||||||| 0
Des Moines Area 10,839||||||||||||||||||||||||||||||||||||||||||| 2,140|||||||| 4,870||||||||||||||||||| 471|
Western Iowa Tech 3,057|||||||||||| 5 2,129|||||||| 0
Iowa Western 3,659|||||||||||||| 24 1,380||||| 237
Southwestern 864||| 116 456| 28
Indian Hills 2,046|||||||| 33 2,095|||||||| 0
Southeastern 1,783||||||| 246 1,322||||| 0
Total 50,644 5,284 30,407 737
Note: Each “|” denotes 250 students. Source: Iowa Department of Education, Division of Community Colleges and Workforce Preparation, Community College MIS.
Table 2-9: Fall Enrollment by College and Program Type: Fall 2006
Table 2-10: Fall Enrollment by College and Program Type: Fall 2007
College College Parallel Career OptionCareer and Technical
Education Combination
Northeast 2,784||||||||||| 31 1,948||||||| 0
North Iowa Area 1,920||||||| 383| 908||| 11
Iowa Lakes 1,870||||||| 461| 882||| 0
Northwest Iowa 682|| 47 495| 0
Iowa Central 3,635|||||||||||||| 429| 1,402||||| 25
Iowa Valley 2,224|||||||| 216 389| 0
Hawkeye 3,167|||||||||||| 0 2,636|||||||||| 0
Eastern Iowa 4,327||||||||||||||||| 4 2,861||||||||||| 0
Kirkwood 7,340||||||||||||||||||||||||||||| 1,402||||| 6,313||||||||||||||||||||||||| 0
Des Moines Area 10,593|||||||||||||||||||||||||||||||||||||||||| 1,747|||||| 3,906||||||||||||||| 608||
Western Iowa Tech 2,834||||||||||| 6 2,444||||||||| 0
Iowa Western 3,302||||||||||||| 22 1,698|||||| 353|
Southwestern 849||| 122 377| 35
Indian Hills 1,897||||||| 28 2,028|||||||| 0
Southeastern 1,486||||| 360| 1,444||||| 30
Total 48,910 5,258 29,731 1,062Note: Each “|” denotes 250 students. Source: Iowa Department of Education, Division of Community Colleges and Workforce Preparation, Community College MIS.
Fall Enrollment 19
Table 2-11: Fall Enrollment by College and Program Type: Fall 2008
Table 2-12: Fall Enrollment by College and Program Type: Fall 2009
College College Parallel Career OptionCareer and Technical
Education Combination
Northeast 2,728|||||||||| 7 2,021|||||||| 0
North Iowa Area 1,636|||||| 393| 1,456||||| 0
Iowa Lakes 1,424||||| 498| 1,137|||| 0
Northwest Iowa 661|| 44 550|| 1
Iowa Central 3,910||||||||||||||| 343| 1,475||||| 5
Iowa Valley 2,432||||||||| 157 397| 0
Hawkeye 3,328||||||||||||| 0 2,437||||||||| 0
Eastern Iowa 4,454||||||||||||||||| 0 2,521|||||||||| 0
Kirkwood 7,040|||||||||||||||||||||||||||| 1,360||||| 6,820||||||||||||||||||||||||||| 0
Des Moines Area 11,199|||||||||||||||||||||||||||||||||||||||||||| 2,172|||||||| 4,851||||||||||||||||||| 473|
Western Iowa Tech 3,268||||||||||||| 5 2,152|||||||| 0
Iowa Western 3,754||||||||||||||| 13 1,553|||||| 322|
Southwestern 841||| 120 482| 25
Indian Hills 2,141|||||||| 26 2,008|||||||| 52
Southeastern 2,161|||||||| 229 1,022|||| 0
Total 50,977 5,367 30,882 878Note: Each “|” denotes 250 students. Source: Iowa Department of Education, Division of Community Colleges and Workforce Preparation, Community College MIS.
College College Parallel Career OptionCareer and Technical
Education Combination
Northeast 3,029|||||||||||| 0 2,360||||||||| 0
North Iowa Area 2,167|||||||| 638|| 924||| 0
Iowa Lakes 1,451||||| 702|| 1,161|||| 1
Northwest Iowa 978||| 56 581|| 0
Iowa Central 3,975||||||||||||||| 351| 1,554|||||| 24
Iowa Valley 2,734|||||||||| 199 389| 0
Hawkeye 3,550|||||||||||||| 0 2,762||||||||||| 0
Eastern Iowa 5,315||||||||||||||||||||| 3 3,159|||||||||||| 3
Kirkwood 11,125|||||||||||||||||||||||||||||||||||||||||||| 406| 6,309||||||||||||||||||||||||| 1
Des Moines Area 16,166|||||||||||||||||||||||||||||||||||||||||||||||||||||||||||||||| 2,148|||||||| 3,507|||||||||||||| 503||
Western Iowa Tech 3,332||||||||||||| 21 2,481||||||||| 0
Iowa Western 4,255||||||||||||||||| 4 1,841||||||| 0
Southwestern 1,082|||| 152 409| 37
Indian Hills 2,323||||||||| 14 2,798||||||||||| 2
Southeastern 2,639|||||||||| 219 896||| 0
Total 64,121 4,913 31,131 571Note: Each “|” denotes 250 students. Source: Iowa Department of Education, Division of Community Colleges and Workforce Preparation, Community College MIS.
The Condition of Iowa’s Community Colleges20
Table 2-13: Fall Enrollment by College and Program Type: Fall 2010
YearActual
EnrollmentPredicted
EnrollmentPredicted
Percent Gain
2008 106,597 133,920 13.1%
2009 103,290 -9.3%
2010 106,615 2.3%
2011 107,699 2.0%
2012 109,675 1.8%
Note: Projections are based on previous year enrollment, high school enrollment, real U.S. gross domestic product (GDP), and Iowa unemployment rate. Source: Iowa Department of Education, Fall Enrollment Report 2009: Table 6
Table 2-15: Fall Enrollment Projections: 2010-2014
Table 2-14: Fall Enrollment by Institution Type: 2010
Institution Type Fall Enrollment
Public 4-year or Above 72,708||||||||||||||
Private Non-profit 4-year or Above 52,975||||||||||
Private for Profit 4-year or Above 128,081|||||||||||||||||||||||||
Public 2-year 106,526|||||||||||||||||||||
Private Non-Profit 2-year 242
Private For-Profit 2-year 1,426
Note: Each “|” denotes 5,000 students. Source: Iowa Coordinating Coun-cil on Post-secondary Education, Iowa College and University Enrollment Report.
College College ParallelCareer Option
Career and Technical Education Combination
Northeast 2,815||||||||||| 0 2,321||||||||| 0
North Iowa Area 2,207|||||||| 709|| 826||| 2
Iowa Lakes 1,440||||| 725|| 1,280||||| 29
Northwest Iowa 946||| 68 633|| 1
Iowa Central 4,333||||||||||||||||| 328| 1,542|||||| 1
Iowa Valley 2,537|||||||||| 159 458| 0
Hawkeye 3,797||||||||||||||| 0 2,867||||||||||| 0
Eastern Iowa 5,707|||||||||||||||||||||| 10 3,647|||||||||||||| 1
Kirkwood 10,942||||||||||||||||||||||||||||||||||||||||||| 540|| 6,974||||||||||||||||||||||||||| 0
Des Moines Area 18,139|||||||||||||||||||||||||||||||||||||||||||||||||||||||||||||||||||||||| 2,199|||||||| 3,758||||||||||||||| 562||
Western Iowa Tech 3,594|||||||||||||| 44 2,783||||||||||| 0
Iowa Western 4,624|||||||||||||||||| 1 2,174|||||||| 0
Southwestern 1,129|||| 136 459| 29
Indian Hills 2,436||||||||| 13 3,066|||||||||||| 5
Southeastern 2,438||||||||| 267| 896||| 0
Total 67,084 5,199 33,684 630Note: Each “|” denotes 250 students. Source: Iowa Department of Education, Division of Community Colleges and Workforce Preparation, Community College MIS.
21Fiscal Year Credit Enrollment and Demographics
2,236,939
Fiscal year credit enrollment follows students through the 2009-2010 academic year. Duplicated headcounts include the same student each time she appears at a college. Unduplicated headcounts will only count a student once. While enrollment rose, the composition of community college students remained relatively the same.
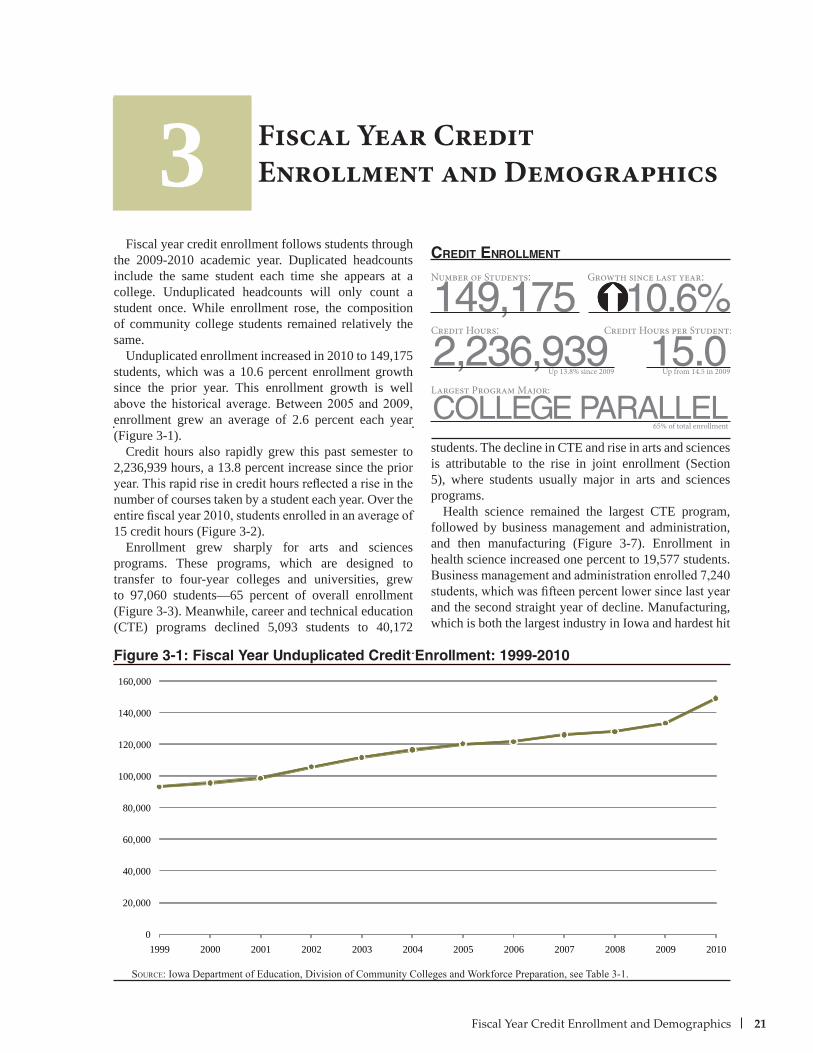
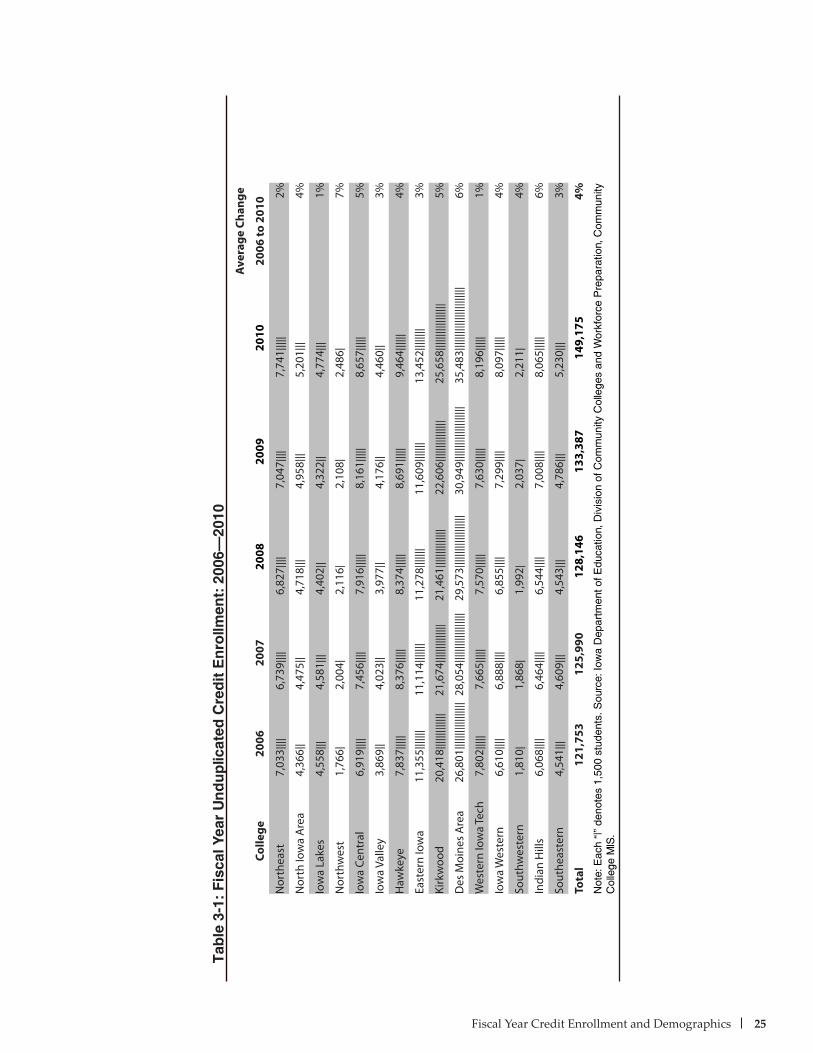
Unduplicated enrollment increased in 2010 to 149,175 students, which was a 10.6 percent enrollment growth since the prior year. This enrollment growth is well above the historical average. Between 2005 and 2009, enrollment grew an average of 2.6 percent each year (Figure 3-1).
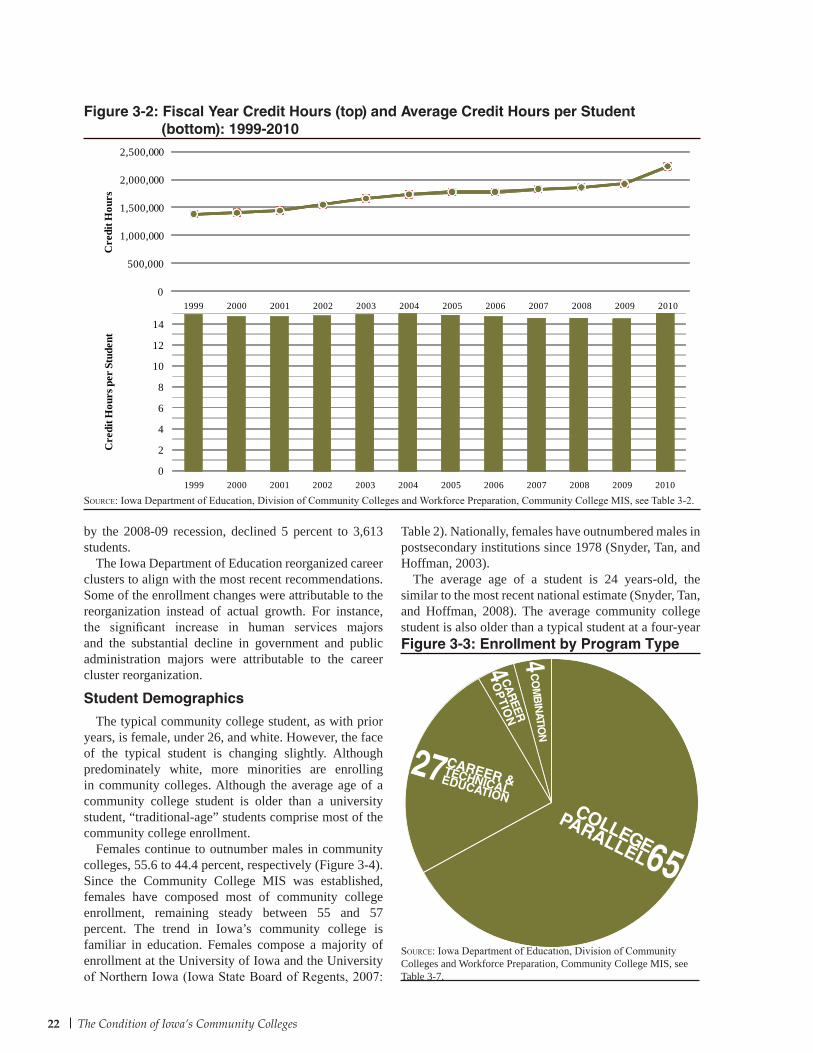
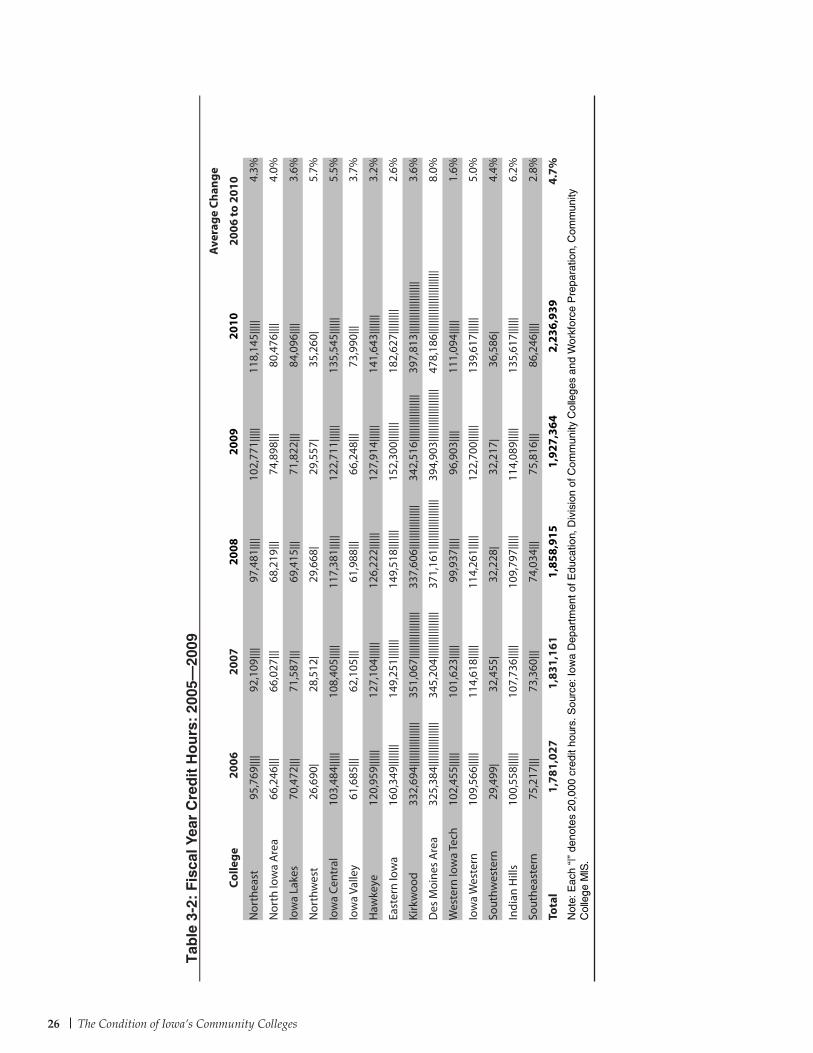
Credit hours also rapidly grew this past semester to 2,236,939 hours, a 13.8 percent increase since the prior year. This rapid rise in credit hours reflected a rise in the number of courses taken by a student each year. Over the entire fiscal year 2010, students enrolled in an average of 15 credit hours (Figure 3-2).
Enrollment grew sharply for arts and sciences programs. These programs, which are designed to transfer to four-year colleges and universities, grew to 97,060 students—65 percent of overall enrollment (Figure 3-3). Meanwhile, career and technical education (CTE) programs declined 5,093 students to 40,172
students. The decline in CTE and rise in arts and sciences is attributable to the rise in joint enrollment (Section 5), where students usually major in arts and sciences programs.
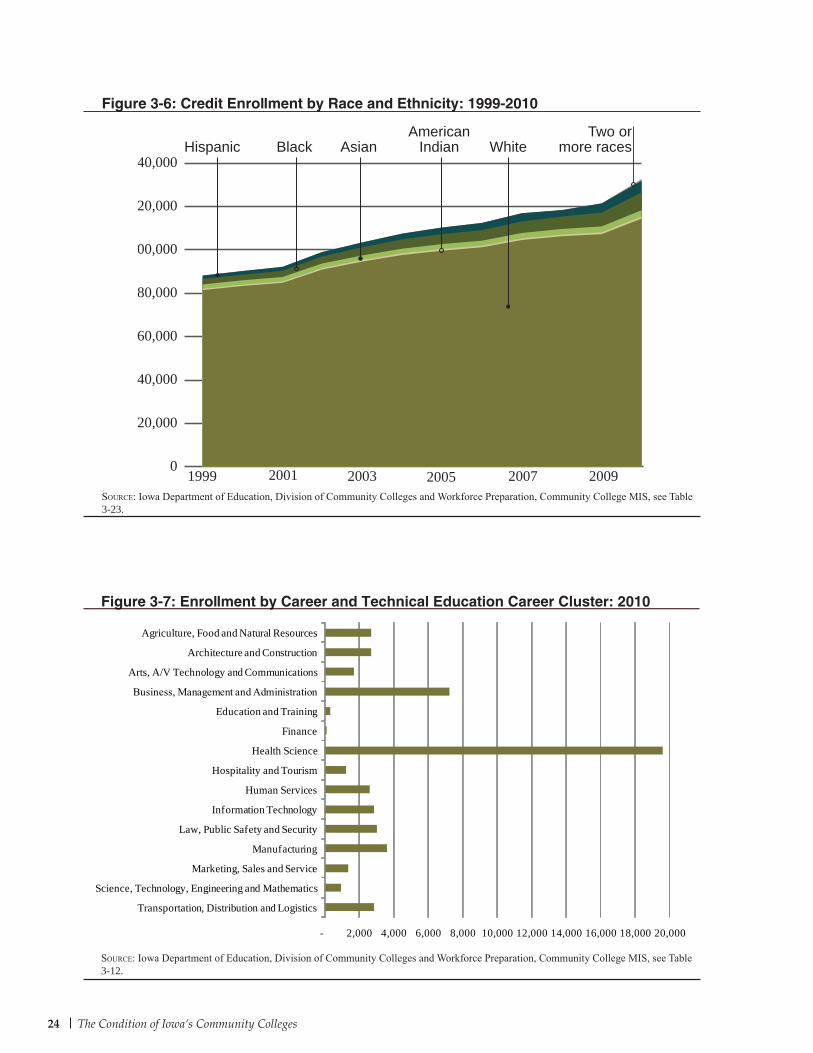
Health science remained the largest CTE program, followed by business management and administration, and then manufacturing (Figure 3-7). Enrollment in health science increased one percent to 19,577 students. Business management and administration enrolled 7,240 students, which was fifteen percent lower since last year and the second straight year of decline. Manufacturing, which is both the largest industry in Iowa and hardest hit
Fiscal Year CreditEnrollment and Demographics
Figure 3-1: Fiscal Year Unduplicated Credit Enrollment: 1999-2010
3
Source: Iowa Department of Education, Division of Community Colleges and Workforce Preparation, see Table 3-1.
Number of Students:
149,175 10.6%creDit enrollment
Credit Hours:
15.0Up 13.8% since 2009 Up from 14.5 in 2009
Growth since last year:
Credit Hours per Student:
0
20,000
40,000
60,000
80,000
100,000
120,000
140,000
160,000
1999 2000 2001 2002 2003 2004 2005 2006 2007 2008 2009 2010
coLLeGe PArALLeLLargest Program Major:
65% of total enrollment
22 The Condition of Iowa’s Community Colleges
by the 2008-09 recession, declined 5 percent to 3,613 students.
The Iowa Department of Education reorganized career clusters to align with the most recent recommendations. Some of the enrollment changes were attributable to the reorganization instead of actual growth. For instance, the significant increase in human services majors and the substantial decline in government and public administration majors were attributable to the career cluster reorganization.
Student Demographics
The typical community college student, as with prior years, is female, under 26, and white. However, the face of the typical student is changing slightly. Although predominately white, more minorities are enrolling in community colleges. Although the average age of a community college student is older than a university student, “traditional-age” students comprise most of the community college enrollment.
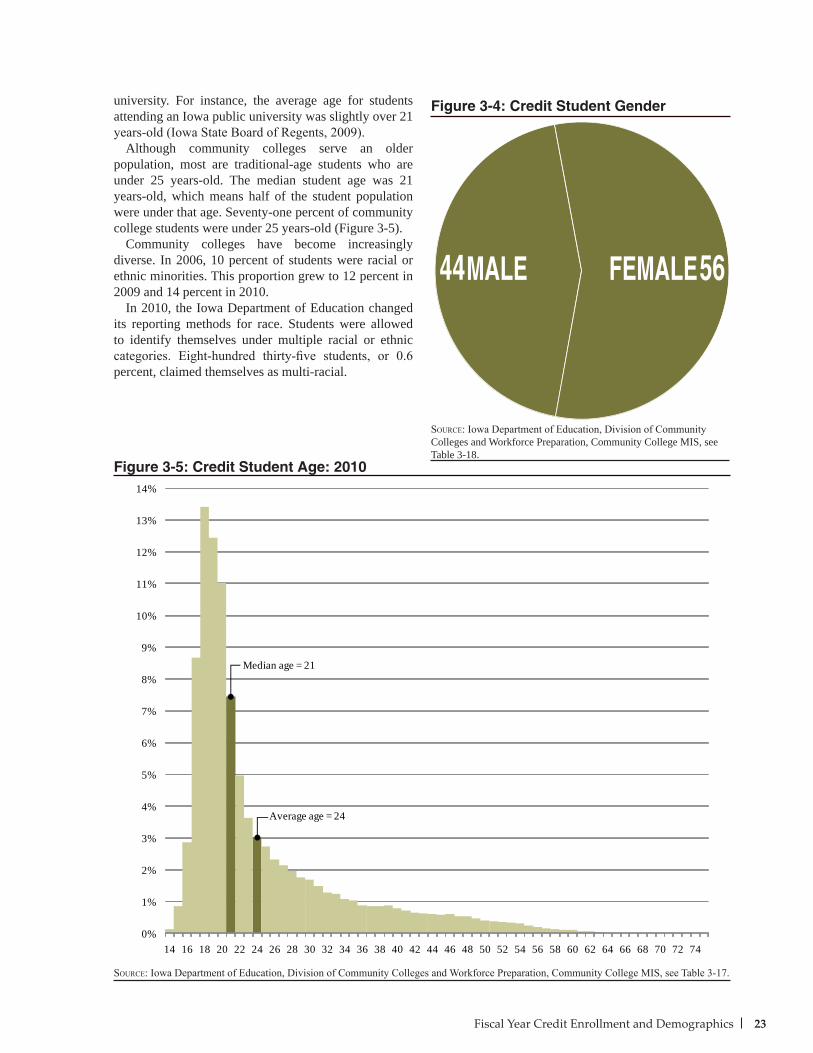
Females continue to outnumber males in community colleges, 55.6 to 44.4 percent, respectively (Figure 3-4). Since the Community College MIS was established, females have composed most of community college enrollment, remaining steady between 55 and 57 percent. The trend in Iowa’s community college is familiar in education. Females compose a majority of enrollment at the University of Iowa and the University of Northern Iowa (Iowa State Board of Regents, 2007:
Figure 3-2: Fiscal Year Credit Hours (top) and Average Credit Hours per Student (bottom): 1999-2010
Source: Iowa Department of Education, Division of Community Colleges and Workforce Preparation, Community College MIS, see Table 3-2.
Table 2). Nationally, females have outnumbered males in postsecondary institutions since 1978 (Snyder, Tan, and Hoffman, 2003).
The average age of a student is 24 years-old, the similar to the most recent national estimate (Snyder, Tan, and Hoffman, 2008). The average community college student is also older than a typical student at a four-year Figure 3-3: Enrollment by Program Type
Source: Iowa Department of Education, Division of Community Colleges and Workforce Preparation, Community College MIS, see Table 3-7.
65
COLLEGEPARALLEL
27 CAREER &TECHNICALEDUCATION
CA
REER
OP
TION
CO
MB
INATIO
N
4 40
500,000
1,000,000
1,500,000
2,000,000
2,500,000
1999 2000 2001 2002 2003 2004 2005 2006 2007 2008 2009 2010
Cre
dit H
ours
0
2
4
6
8
10
12
14
1999 2000 2001 2002 2003 2004 2005 2006 2007 2008 2009 2010
Cre
dit H
ours
per
Stu
dent
23Fiscal Year Credit Enrollment and Demographics
Source: Iowa Department of Education, Division of Community Colleges and Workforce Preparation, Community College MIS, see Table 3-18.
university. For instance, the average age for students attending an Iowa public university was slightly over 21 years-old (Iowa State Board of Regents, 2009).
Although community colleges serve an older population, most are traditional-age students who are under 25 years-old. The median student age was 21 years-old, which means half of the student population were under that age. Seventy-one percent of community college students were under 25 years-old (Figure 3-5).
Community colleges have become increasingly diverse. In 2006, 10 percent of students were racial or ethnic minorities. This proportion grew to 12 percent in 2009 and 14 percent in 2010.
In 2010, the Iowa Department of Education changed its reporting methods for race. Students were allowed to identify themselves under multiple racial or ethnic categories. Eight-hundred thirty-five students, or 0.6 percent, claimed themselves as multi-racial.
Figure 3-4: Credit Student Gender
Figure 3-5: Credit Student Age: 2010
Source: Iowa Department of Education, Division of Community Colleges and Workforce Preparation, Community College MIS, see Table 3-17.
FEMALE56MALE44
0%
1%
2%
3%
4%
5%
6%
7%
8%
9%
10%
11%
12%
13%
14%
14 16 18 20 22 24 26 28 30 32 34 36 38 40 42 44 46 48 50 52 54 56 58 60 62 64 66 68 70 72 74
Median age = 21
Average age = 24
24 The Condition of Iowa’s Community Colleges
Figure 3-7: Enrollment by Career and Technical Education Career Cluster: 2010
Figure 3-6: Credit Enrollment by Race and Ethnicity: 1999-2010
Source: Iowa Department of Education, Division of Community Colleges and Workforce Preparation, Community College MIS, see Table 3-12.
Source: Iowa Department of Education, Division of Community Colleges and Workforce Preparation, Community College MIS, see Table 3-23.
0
20,000
40,000
60,000
80,000
100,000
120,000
140,000Hispanic Black White
Two ormore races
AmericanIndianAsian
1999 2001 2003 2005 2007 2009
- 2,000 4,000 6,000 8,000 10,000 12,000 14,000 16,000 18,000 20,000
Transportation, Distribution and Logistics
Science, Technology, Engineering and Mathematics
Marketing, Sales and Service
Manufacturing
Law, Public Safety and Security
Information Technology
Human Services
Hospitality and Tourism
Health Science
Finance
Education and Training
Business, Management and Administration
Arts, A/V Technology and Communications
Architecture and Construction
Agriculture, Food and Natural Resources
Fiscal Year Credit Enrollment and Demographics 25
Tab
le 3
-1:
Fis
cal Y
ear
Un
du
plic
ated
Cre
dit
En
rollm
ent:
200
6–20
10A
vera
ge C
hang
e
Colle
ge 2
006
2
007
20
0820
0920
1020
06 to
201
0
Nor
thea
st7,
033|
|||6,
739|
|||6,
827|
||| 7
,047
||||
7,7
41 |||
||2%
Nor
th Io
wa
Are
a4,
366|
|4,
475|
|4,
718|
|| 4
,958
||| 5
,201
|||4%
Iow
a La
kes
4,55
8|||
4,58
1|||
4,40
2||
4,3
22 ||
4,7
74 |||
1%
Nor
thw
est
1,76
6|2,
004|
2,11
6| 2
,108
| 2
,486
|7%
Iow
a Ce
ntra
l6,
919|
|||7,
456|
|||7,
916|
||||
8,1
61 |||
|| 8
,657
|||||
5%
Iow
a Va
lley
3,86
9||
4,02
3||
3,97
7||
4,1
76 ||
4,4
60 ||
3%
Haw
keye
7,83
7||||
|8,
376|
||||
8,37
4||||
| 8
,691
|||||
9,4
64 |||
|||4%
East
ern
Iow
a11
,355
||||||
|11
,114
||||||
|11
,278
||||||
| 1
1,60
9 ||||
||| 1
3,45
2 ||||
||||
3%
Kirk
woo
d20
,418
||||||
||||||
|21
,674
||||||
||||||
||21
,461
||||||
||||||
|| 2
2,60
6 ||||
||||||
|||||
25,
658 |
||||||
||||||
||||
5%
Des
Moi
nes
Are
a26
,801
||||||
||||||
|||||
28,0
54|||
||||||
||||||
|||29
,573
||||||
||||||
||||||
| 3
0,94
9 ||||
||||||
||||||
||||
35,
483 |
||||||
||||||
||||||
||||
6%
Wes
tern
Iow
a Te
ch7,
802|
||||
7,66
5||||
|7,
570|
||||
7,6
30 |||
|| 8
,196
|||||
1%
Iow
a W
este
rn6,
610|
|||6,
888|
|||6,
855|
||| 7
,299
||||
8,0
97 |||
||4%
Sout
hwes
tern
1,81
0|1,
868|
1,99
2| 2
,037
| 2
,211
|4%
Indi
an H
ills
6,06
8||||
6,46
4||||
6,54
4||||
7,0
08 |||
| 8
,065
|||||
6%
Sout
heas
tern
4,54
1|||
4,60
9|||
4,54
3|||
4,7
86 |||
5,2
30 |||
3%
Tota
l12
1,75
312
5,99
012
8,14
613
3,38
714
9,17
54%
Not
e: E
ach
“|”
deno
tes
1,50
0 st
uden
ts. S
ourc
e: Io
wa
Dep
artm
ent o
f Edu
catio
n, D
ivis
ion
of C
omm
unity
Col
lege
s an
d W
orkf
orce
Pre
para
tion,
Com
mun
ity
Col
lege
MIS
.
The Condition of Iowa’s Community Colleges26
Tab
le 3
-2:
Fis
cal Y
ear
Cre
dit
Ho
urs
: 20
05–
2009
Ave
rage
Cha
nge
Colle
ge 2
006
2
007
20
0820
0920
1020
06 to
201
0
Nor
thea
st95
,769
||||
92,1
09|||
|97
,481
||||
102,
771|
||||
118,
145|
||||
4.3%
Nor
th Io
wa
Are
a66
,246
|||66
,027
|||68
,219
|||74
,898
|||80
,476
||||
4.0%
Iow
a La
kes
70,4
72|||
71,5
87|||
69,4
15|||
71,8
22|||
84,0
96|||
|3.
6%
Nor
thw
est
26,6
90|
28,5
12|
29,6
68|
29,5
57|
35,2
60|
5.7%
Iow
a Ce
ntra
l10
3,48
4||||
|10
8,40
5||||
|11
7,38
1||||
|12
2,71
1||||
||13
5,54
5||||
||5.
5%
Iow
a Va
lley
61,6
85|||
62,1
05|||
61,9
88|||
66,2
48|||
73,9
90|||
3.7%
Haw
keye
120,
959|
|||||
127,
104|
|||||
126,
222|
|||||
127,
914|
|||||
141,
643|
||||||
3.2%
East
ern
Iow
a16
0,34
9||||
||||
149,
251|
||||||
149,
518|
||||||
152,
300|
||||||
182,
627|
||||||
||2.
6%
Kirk
woo
d33
2,69
4||||
||||||
||||||
351,
067|
||||||
||||||
||||
337,
606|
||||||
||||||
|||34
2,51
6||||
||||||
||||||
|39
7,81
3||||
||||||
||||||
|||3.
6%
Des
Moi
nes
Are
a32
5,38
4||||
||||||
||||||
345,
204|
||||||
||||||
||||
371,
161|
||||||
||||||
|||||
394,
903|
||||||
||||||
||||||
478,
186|
||||||
||||||
||||||
||||
8.0%
Wes
tern
Iow
a Te
ch10
2,45
5||||
|10
1,62
3||||
|99
,937
||||
96,9
03|||
|11
1,09
4||||
|1.
6%
Iow
a W
este
rn10
9,56
6||||
|11
4,61
8||||
|11
4,26
1||||
|12
2,70
0||||
||13
9,61
7||||
||5.
0%
Sout
hwes
tern
29,4
99|
32,4
55|
32,2
28|
32,2
17|
36,5
86|
4.4%
Indi
an H
ills
100,
558|
||||
107,
736|
||||
109,
797|
||||
114,
089|
||||
135,
617|
|||||
6.2%
Sout
heas
tern
75,2
17|||
73,3
60|||
74,0
34|||
75,8
16|||
86,2
46|||
|2.
8%
Tota
l1,
781,
027
1,83
1,16
11,
858,
915
1,92
7,36
42,
236,
939
4.7%
Not
e: E
ach
“|”
deno
tes
20,0
00 c
redi
t hou
rs. S
ourc
e: Io
wa
Dep
artm
ent o
f Edu
catio
n, D
ivis
ion
of C
omm
unity
Col
lege
s an
d W
orkf
orce
Pre
para
tion,
Com
mun
ity
Col
lege
MIS
.
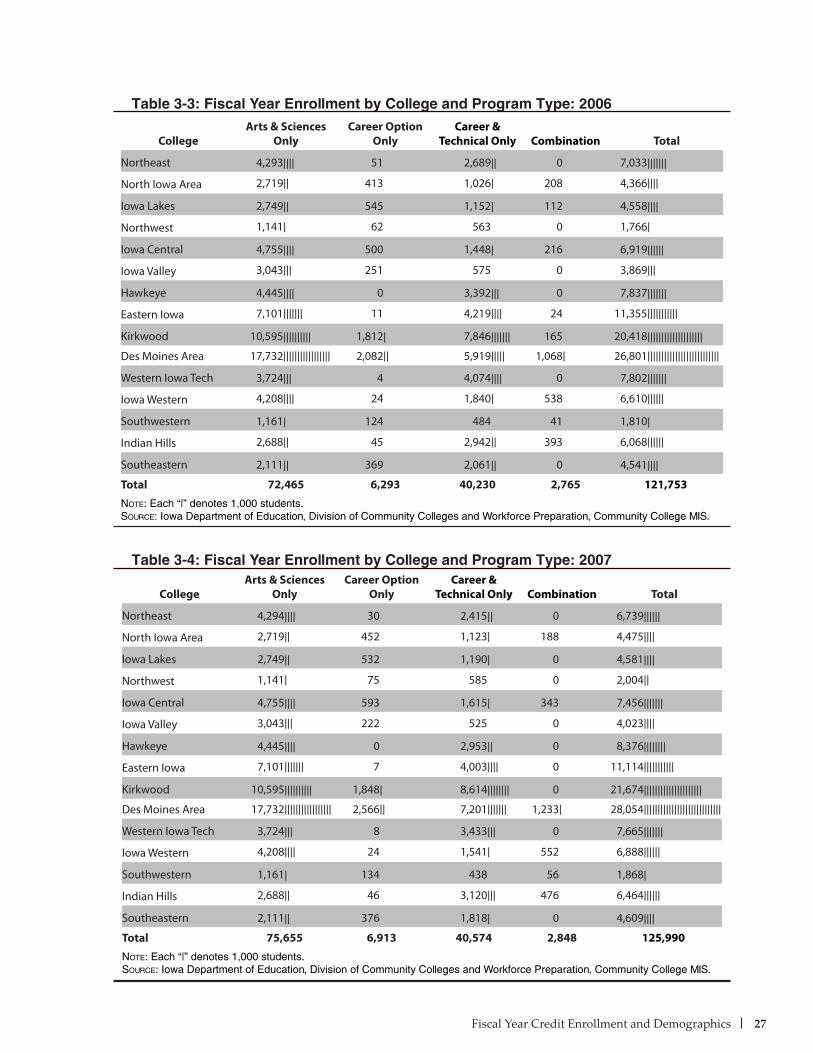
Fiscal Year Credit Enrollment and Demographics 27
Table 3-3: Fiscal Year Enrollment by College and Program Type: 2006
Table 3-4: Fiscal Year Enrollment by College and Program Type: 2007
College Arts & Sciences
OnlyCareer Option
OnlyCareer &
Technical Only Combination Total
Northeast 4,293|||| 51 2,689|| 0 7,033|||||||
North Iowa Area 2,719|| 413 1,026| 208 4,366||||
Iowa Lakes 2,749|| 545 1,152| 112 4,558||||
Northwest 1,141| 62 563 0 1,766|
Iowa Central 4,755|||| 500 1,448| 216 6,919||||||
Iowa Valley 3,043||| 251 575 0 3,869|||
Hawkeye 4,445|||| 0 3,392||| 0 7,837|||||||
Eastern Iowa 7,101||||||| 11 4,219|||| 24 11,355|||||||||||
Kirkwood 10,595|||||||||| 1,812| 7,846||||||| 165 20,418||||||||||||||||||||
Des Moines Area 17,732||||||||||||||||| 2,082|| 5,919||||| 1,068| 26,801||||||||||||||||||||||||||
Western Iowa Tech 3,724||| 4 4,074|||| 0 7,802|||||||
Iowa Western 4,208|||| 24 1,840| 538 6,610||||||
Southwestern 1,161| 124 484 41 1,810|
Indian Hills 2,688|| 45 2,942|| 393 6,068||||||
Southeastern 2,111|| 369 2,061|| 0 4,541||||
Total 72,465 6,293 40,230 2,765 121,753
Note: Each “|” denotes 1,000 students.Source: Iowa Department of Education, Division of Community Colleges and Workforce Preparation, Community College MIS.
College Arts & Sciences
OnlyCareer Option
OnlyCareer &
Technical Only Combination Total
Northeast 4,294|||| 30 2,415|| 0 6,739||||||
North Iowa Area 2,719|| 452 1,123| 188 4,475||||
Iowa Lakes 2,749|| 532 1,190| 0 4,581||||
Northwest 1,141| 75 585 0 2,004||
Iowa Central 4,755|||| 593 1,615| 343 7,456|||||||
Iowa Valley 3,043||| 222 525 0 4,023||||
Hawkeye 4,445|||| 0 2,953|| 0 8,376||||||||
Eastern Iowa 7,101||||||| 7 4,003|||| 0 11,114|||||||||||
Kirkwood 10,595|||||||||| 1,848| 8,614|||||||| 0 21,674|||||||||||||||||||||
Des Moines Area 17,732||||||||||||||||| 2,566|| 7,201||||||| 1,233| 28,054||||||||||||||||||||||||||||
Western Iowa Tech 3,724||| 8 3,433||| 0 7,665|||||||
Iowa Western 4,208|||| 24 1,541| 552 6,888||||||
Southwestern 1,161| 134 438 56 1,868|
Indian Hills 2,688|| 46 3,120||| 476 6,464||||||
Southeastern 2,111|| 376 1,818| 0 4,609||||
Total 75,655 6,913 40,574 2,848 125,990
Note: Each “|” denotes 1,000 students.Source: Iowa Department of Education, Division of Community Colleges and Workforce Preparation, Community College MIS.
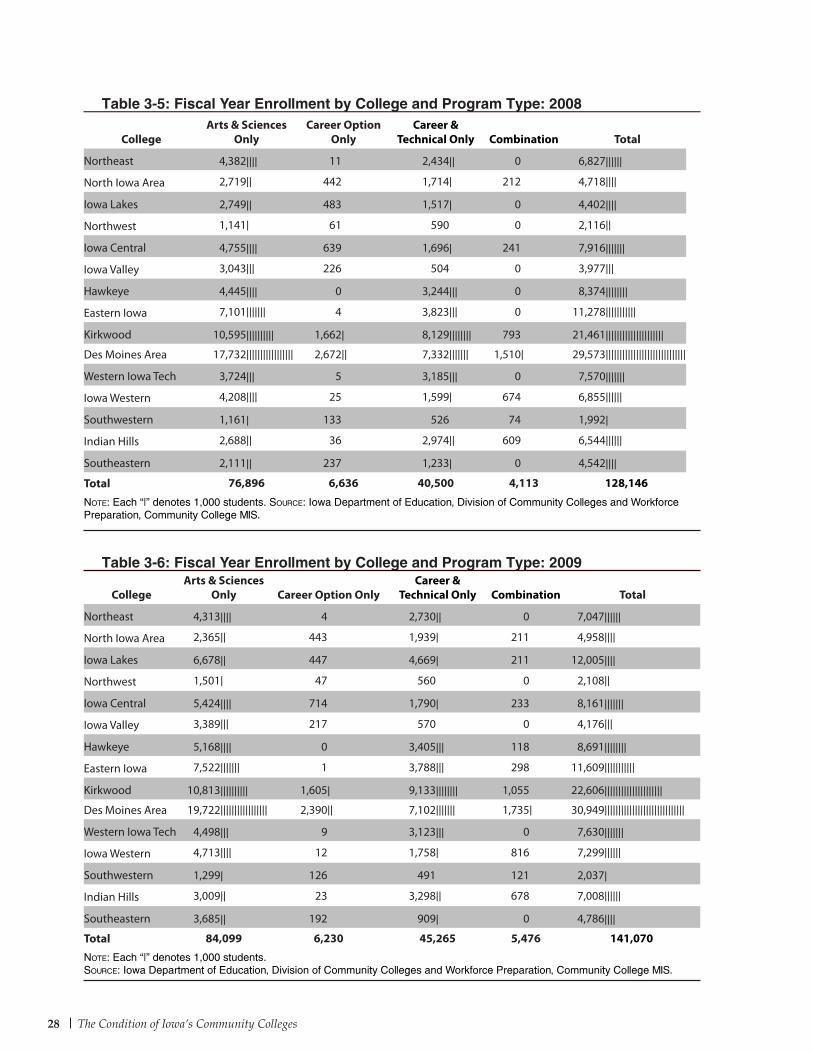
The Condition of Iowa’s Community Colleges28
College Arts & Sciences
Only Career Option OnlyCareer &
Technical Only Combination Total
Northeast 4,313|||| 4 2,730|| 0 7,047||||||
North Iowa Area 2,365|| 443 1,939| 211 4,958||||
Iowa Lakes 6,678|| 447 4,669| 211 12,005||||
Northwest 1,501| 47 560 0 2,108||
Iowa Central 5,424|||| 714 1,790| 233 8,161|||||||
Iowa Valley 3,389||| 217 570 0 4,176|||
Hawkeye 5,168|||| 0 3,405||| 118 8,691||||||||
Eastern Iowa 7,522||||||| 1 3,788||| 298 11,609|||||||||||
Kirkwood 10,813|||||||||| 1,605| 9,133|||||||| 1,055 22,606|||||||||||||||||||||
Des Moines Area 19,722||||||||||||||||| 2,390|| 7,102||||||| 1,735| 30,949|||||||||||||||||||||||||||||
Western Iowa Tech 4,498||| 9 3,123||| 0 7,630|||||||
Iowa Western 4,713|||| 12 1,758| 816 7,299||||||
Southwestern 1,299| 126 491 121 2,037|
Indian Hills 3,009|| 23 3,298|| 678 7,008||||||
Southeastern 3,685|| 192 909| 0 4,786||||
Total 84,099 6,230 45,265 5,476 141,070
Note: Each “|” denotes 1,000 students.Source: Iowa Department of Education, Division of Community Colleges and Workforce Preparation, Community College MIS.
College Arts & Sciences
OnlyCareer Option
OnlyCareer &
Technical Only Combination Total
Northeast 4,382|||| 11 2,434|| 0 6,827||||||
North Iowa Area 2,719|| 442 1,714| 212 4,718||||
Iowa Lakes 2,749|| 483 1,517| 0 4,402||||
Northwest 1,141| 61 590 0 2,116||
Iowa Central 4,755|||| 639 1,696| 241 7,916|||||||
Iowa Valley 3,043||| 226 504 0 3,977|||
Hawkeye 4,445|||| 0 3,244||| 0 8,374||||||||
Eastern Iowa 7,101||||||| 4 3,823||| 0 11,278|||||||||||
Kirkwood 10,595|||||||||| 1,662| 8,129|||||||| 793 21,461|||||||||||||||||||||
Des Moines Area 17,732||||||||||||||||| 2,672|| 7,332||||||| 1,510| 29,573|||||||||||||||||||||||||||||
Western Iowa Tech 3,724||| 5 3,185||| 0 7,570|||||||
Iowa Western 4,208|||| 25 1,599| 674 6,855||||||
Southwestern 1,161| 133 526 74 1,992|
Indian Hills 2,688|| 36 2,974|| 609 6,544||||||
Southeastern 2,111|| 237 1,233| 0 4,542||||
Total 76,896 6,636 40,500 4,113 128,146
Note: Each “|” denotes 1,000 students. Source: Iowa Department of Education, Division of Community Colleges and Workforce Preparation, Community College MIS.
Table 3-5: Fiscal Year Enrollment by College and Program Type: 2008
Table 3-6: Fiscal Year Enrollment by College and Program Type: 2009
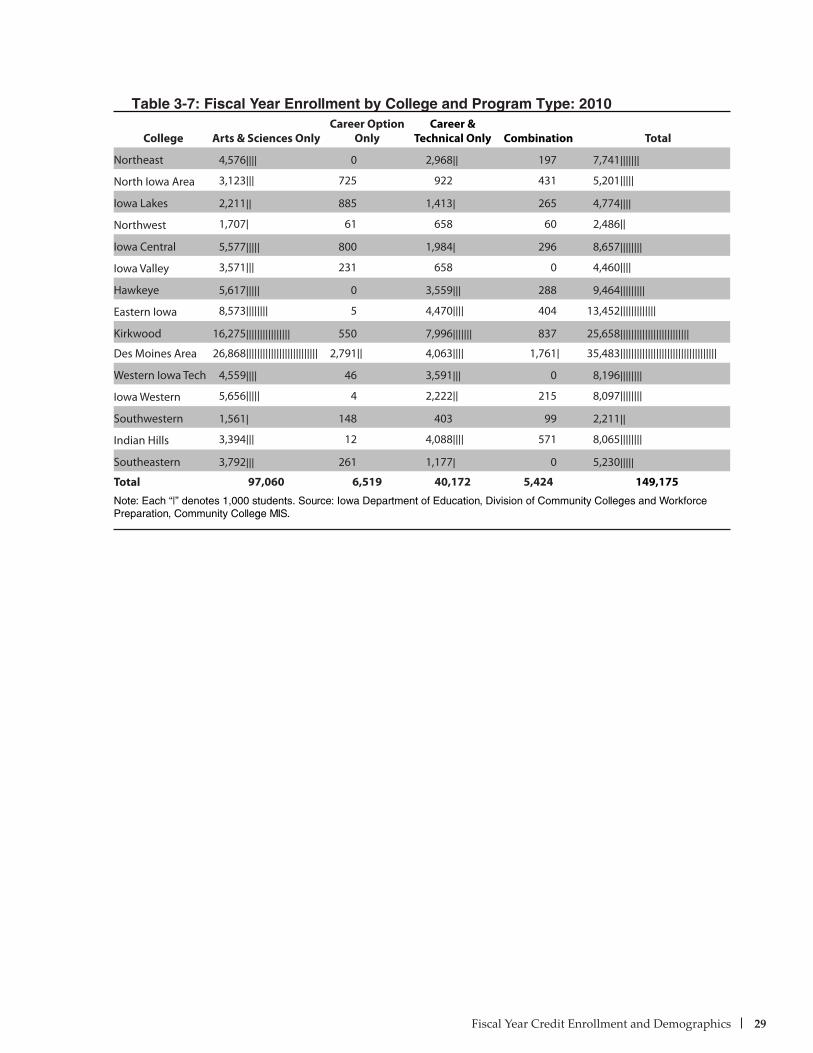
Fiscal Year Credit Enrollment and Demographics 29
Table 3-7: Fiscal Year Enrollment by College and Program Type: 2010
College Arts & Sciences OnlyCareer Option
OnlyCareer &
Technical Only Combination Total
Northeast 4,576|||| 0 2,968|| 197 7,741|||||||
North Iowa Area 3,123||| 725 922 431 5,201|||||
Iowa Lakes 2,211|| 885 1,413| 265 4,774||||
Northwest 1,707| 61 658 60 2,486||
Iowa Central 5,577||||| 800 1,984| 296 8,657||||||||
Iowa Valley 3,571||| 231 658 0 4,460||||
Hawkeye 5,617||||| 0 3,559||| 288 9,464|||||||||
Eastern Iowa 8,573|||||||| 5 4,470|||| 404 13,452|||||||||||||
Kirkwood 16,275|||||||||||||||| 550 7,996||||||| 837 25,658|||||||||||||||||||||||||
Des Moines Area 26,868|||||||||||||||||||||||||| 2,791|| 4,063|||| 1,761| 35,483|||||||||||||||||||||||||||||||||||
Western Iowa Tech 4,559|||| 46 3,591||| 0 8,196||||||||
Iowa Western 5,656||||| 4 2,222|| 215 8,097||||||||
Southwestern 1,561| 148 403 99 2,211||
Indian Hills 3,394||| 12 4,088|||| 571 8,065||||||||
Southeastern 3,792||| 261 1,177| 0 5,230|||||
Total 97,060 6,519 40,172 5,424 149,175
Note: Each “|” denotes 1,000 students. Source: Iowa Department of Education, Division of Community Colleges and Workforce Preparation, Community College MIS.
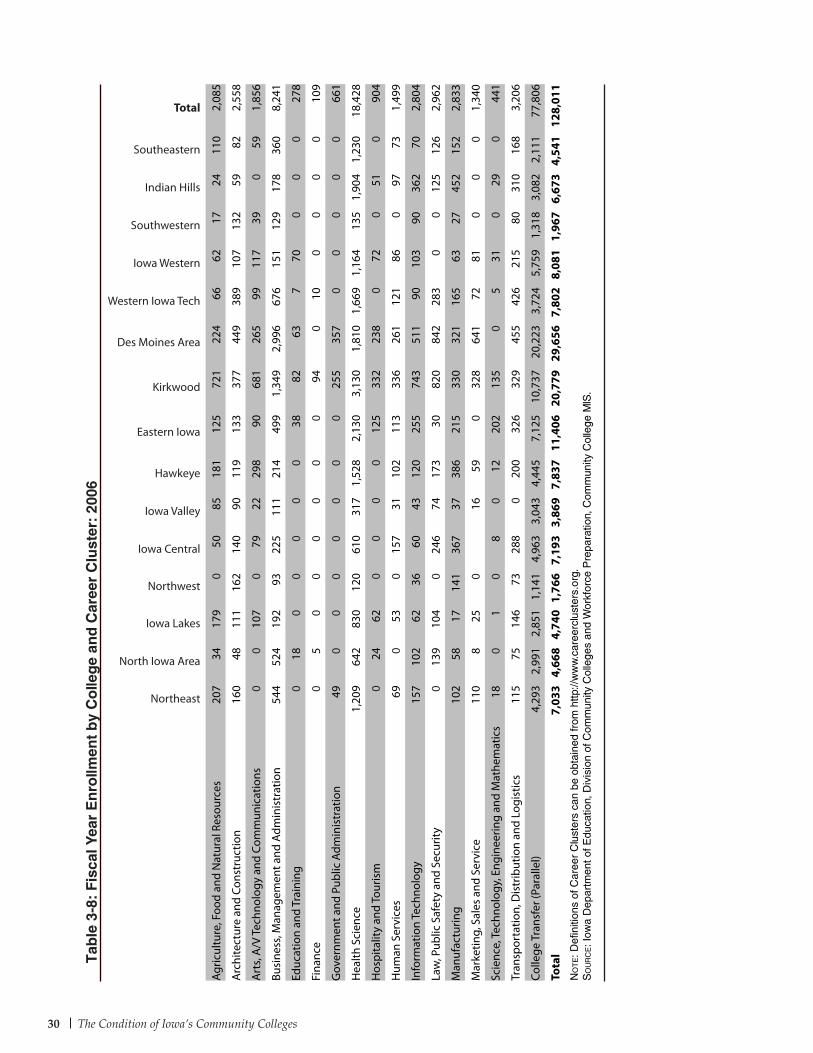
The Condition of Iowa’s Community Colleges30
Tab
le 3
-8:
Fis
cal Y
ear
En
rollm
ent
by
Co
lleg
e an
d C
aree
r C
lust
er:
2006
Northeast
North Iowa Area
Iowa Lakes
Northwest
Iowa Central
Iowa Valley
Hawkeye
Eastern Iowa
Kirkwood
Des Moines Area
Western Iowa Tech
Iowa Western
Southwestern
Indian Hills
Southeastern
Total
Agric
ultu
re, F
ood
and
Nat
ural
Res
ourc
es20
734
179
050
8518
112
572
122
466
6217
2411
02,
085
Arc
hite
ctur
e an
d Co
nstr
uctio
n16
048
111
162
140
9011
913
337
744
938
910
713
259
822,
558
Art
s, A
/V Te
chno
logy
and
Com
mun
icat
ions
00
107
079
2229
890
681
265
9911
739
059
1,85
6
Busi
ness
, Man
agem
ent a
nd A
dmin
istr
atio
n54
452
419
293
225
111
214
499
1,34
92,
996
676
151
129
178
360
8,24
1
Educ
atio
n an
d Tr
aini
ng0
180
00
00
3882
637
700
00
278
Fina
nce
05
00
00
00
940
100
00
010
9
Gov
ernm
ent a
nd P
ublic
Adm
inis
trat
ion
490
00
00
00
255
357
00
00
066
1
Hea
lth S
cien
ce1,
209
642
830
120
610
317
1,52
82,
130
3,13
01,
810
1,66
91,
164
135
1,90
41,
230
18,4
28
Hos
pita
lity
and
Tour
ism
024
620
00
012
533
223
80
720
510
904
Hum
an S
ervi
ces
690
530
157
3110
211
333
626
112
186
097
731,
499
Info
rmat
ion
Tech
nolo
gy15
710
262
3660
4312
025
574
351
190
103
9036
270
2,80
4
Law
, Pub
lic S
afet
y an
d Se
curit
y0
139
104
024
674
173
3082
084
228
30
012
512
62,
962
Man
ufac
turin
g10
258
1714
136
737
386
215
330
321
165
6327
452
152
2,83
3
Mar
ketin
g, S
ales
and
Ser
vice
110
825
016
590
328
641
7281
00
01,
340
Scie
nce,
Tech
nolo
gy, E
ngin
eerin
g an
d M
athe
mat
ics
180
10
80
1220
213
50
531
029
044
1
Tran
spor
tatio
n, D
istr
ibut
ion
and
Logi
stic
s11
575
146
7328
80
200
326
329
455
426
215
8031
016
83,
206
Colle
ge T
rans
fer (
Para
llel)
4,29
32,
991
2,85
11,
141
4,96
33,
043
4,44
57,
125
10,7
3720
,223
3,72
45,
759
1,31
83,
082
2,11
177
,806
Tota
l7,
033
4,66
84,
740
1,76
67,
193
3,86
97,
837
11,4
0620
,779
29,6
567,
802
8,08
11,
967
6,67
34,
541
128,
011
No
te: D
efin
ition
s of
Car
eer
Clu
ster
s ca
n be
obt
aine
d fr
om h
ttp://
ww
w.c
aree
rclu
ster
s.or
g.S
ou
rc
e: I
owa
Dep
artm
ent o
f Edu
catio
n, D
ivis
ion
of C
omm
unity
Col
lege
s an
d W
orkf
orce
Pre
para
tion,
Com
mun
ity C
olle
ge M
IS.
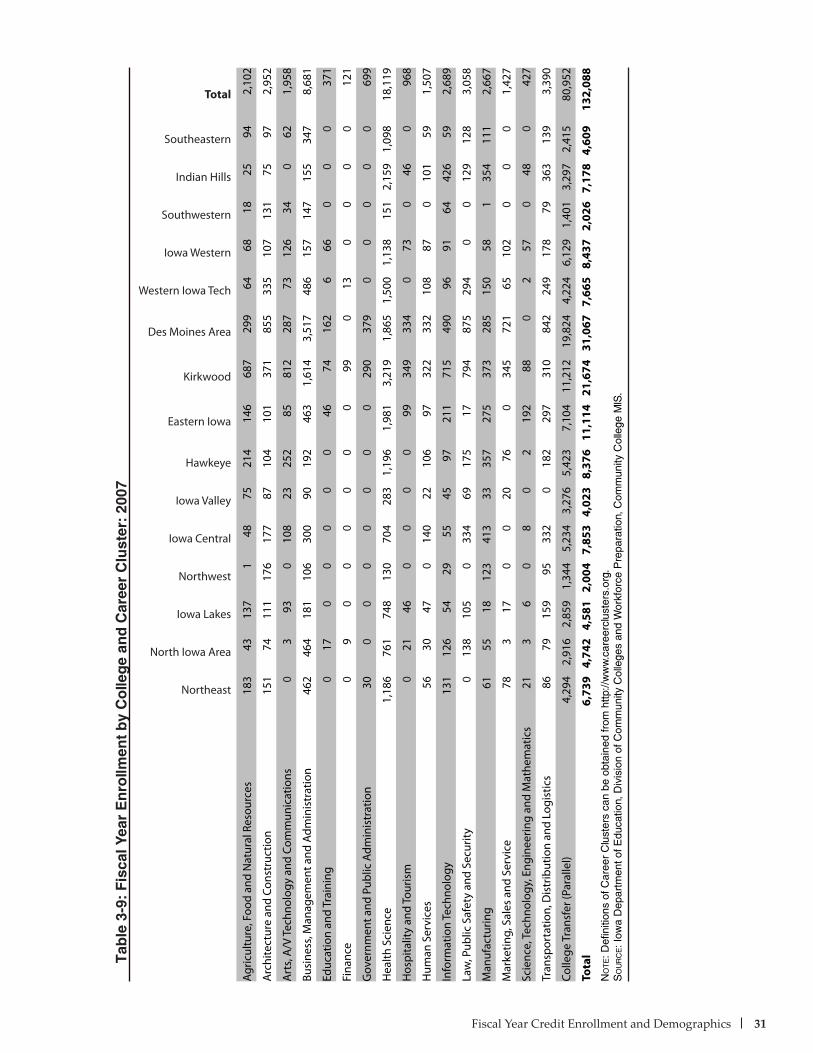
Fiscal Year Credit Enrollment and Demographics 31
Tab
le 3
-9:
Fis
cal Y
ear
En
rollm
ent
by
Co
lleg
e an
d C
aree
r C
lust
er:
2007
Northeast
North Iowa Area
Iowa Lakes
Northwest
Iowa Central
Iowa Valley
Hawkeye
Eastern Iowa
Kirkwood
Des Moines Area
Western Iowa Tech
Iowa Western
Southwestern
Indian Hills
Southeastern
Total
Agric
ultu
re, F
ood
and
Nat
ural
Res
ourc
es18
343
137
148
7521
414
668
729
964
6818
2594
2,10
2
Arc
hite
ctur
e an
d Co
nstr
uctio
n15
174
111
176
177
8710
410
137
185
533
510
713
175
972,
952
Art
s, A
/V Te
chno
logy
and
Com
mun
icat
ions
03
930
108
2325
285
812
287
7312
634
062
1,95
8
Busi
ness
, Man
agem
ent a
nd A
dmin
istr
atio
n46
246
418
110
630
090
192
463
1,61
43,
517
486
157
147
155
347
8,68
1
Educ
atio
n an
d Tr
aini
ng0
170
00
00
4674
162
666
00
037
1
Fina
nce
09
00
00
00
990
130
00
012
1
Gov
ernm
ent a
nd P
ublic
Adm
inis
trat
ion
300
00
00
00
290
379
00
00
069
9
Hea
lth S
cien
ce1,
186
761
748
130
704
283
1,19
61,
981
3,21
91,
865
1,50
01,
138
151
2,15
91,
098
18,1
19
Hos
pita
lity
and
Tour
ism
021
460
00
099
349
334
073
046
096
8
Hum
an S
ervi
ces
5630
470
140
2210
697
322
332
108
870
101
591,
507
Info
rmat
ion
Tech
nolo
gy13
112
654
2955
4597
211
715
490
9691
6442
659
2,68
9
Law
, Pub
lic S
afet
y an
d Se
curit
y0
138
105
033
469
175
1779
487
529
40
012
912
83,
058
Man
ufac
turin
g61
5518
123
413
3335
727
537
328
515
058
135
411
12,
667
Mar
ketin
g, S
ales
and
Ser
vice
783
170
020
760
345
721
6510
20
00
1,42
7
Scie
nce,
Tech
nolo
gy, E
ngin
eerin
g an
d M
athe
mat
ics
213
60
80
219
288
02
570
480
427
Tran
spor
tatio
n, D
istr
ibut
ion
and
Logi
stic
s86
7915
995
332
018
229
731
084
224
917
879
363
139
3,39
0
Colle
ge T
rans
fer (
Para
llel)
4,29
42,
916
2,85
91,
344
5,23
43,
276
5,42
37,
104
11,2
1219
,824
4,22
46,
129
1,40
13,
297
2,41
580
,952
Tota
l6,
739
4,74
24,
581
2,00
47,
853
4,02
38,
376
11,1
1421
,674
31,0
677,
665
8,43
72,
026
7,17
84,
609
132,
088
No
te: D
efin
ition
s of
Car
eer
Clu
ster
s ca
n be
obt
aine
d fr
om h
ttp://
ww
w.c
aree
rclu
ster
s.or
g.S
ou
rc
e: I
owa
Dep
artm
ent o
f Edu
catio
n, D
ivis
ion
of C
omm
unity
Col
lege
s an
d W
orkf
orce
Pre
para
tion,
Com
mun
ity C
olle
ge M
IS.

The Condition of Iowa’s Community Colleges32
Northeast
North Iowa Area
Iowa Lakes
Northwest
Iowa Central
Iowa Valley
Hawkeye
Eastern Iowa
Kirkwood
Des Moines Area
Western Iowa Tech
Iowa Western
Southwestern
Indian Hills
Southeastern
Total
Agric
ultu
re, F
ood
and
Nat
ural
Res
ourc
es21
610
915
82
5471
232
132
737
425
3963
1833
952,
384
Arc
hite
ctur
e an
d Co
nstr
uctio
n16
365
205
192
153
7111
975
414
811
237
158
130
7261
2,92
6
Art
s, A
/V Te
chno
logy
and
Com
mun
icat
ions
3524
9396
2226
092
880
287
8111
139
312,
051
Busi
ness
, Man
agem
ent a
nd A
dmin
istr
atio
n43
162
220
891
291
102
196
409
1,80
33,
488
426
160
153
149
253
8,78
2
Educ
atio
n an
d Tr
aini
ng0
300
00
00
4465
185
657
00
038
7
Fina
nce
04
00
00
00
121
017
00
00
142
Gov
ernm
ent a
nd P
ublic
Adm
inis
trat
ion
110
00
00
00
324
461
00
00
079
6
Hea
lth S
cien
ce1,
160
660
795
137
762
273
1,31
41,
930
3,28
11,
883
1,49
01,
269
162
2,12
661
017
,852
Hos
pita
lity
and
Tour
ism
019
105
032
00
113
377
356
098
053
01,
153
Hum
an S
ervi
ces
7235
620
138
3910
311
136
034
811
091
065
441,
578
Info
rmat
ion
Tech
nolo
gy12
511
037
2939
3213
115
676
647
810
312
988
430
492,
702
Law
, Pub
lic S
afet
y an
d Se
curit
y0
129
930
356
7719
218
824
1,01
028
90
012
710
23,
217
Man
ufac
turin
g46
6227
108
392
2938
726
835
329
613
883
041
810
02,
707
Mar
ketin
g, S
ales
and
Ser
vice
7917
175
014
930
353
694
5094
00
01,
416
Scie
nce,
Tech
nolo
gy, E
ngin
eerin
g an
d M
athe
mat
ics
239
150
170
1222
892
012
520
470
507
Tran
spor
tatio
n, D
istr
ibut
ion
and
Logi
stic
s84
8318
587
312
020
525
136
282
819
218
184
305
126
3,28
5
Colle
ge T
rans
fer (
Para
llel)
4,38
23,
028
2,40
21,
465
5,57
13,
247
5,13
07,
451
11,5
8521
,607
4,38
06,
145
1,54
53,
852
3,07
284
,862
Gra
nd T
otal
6,82
75,
006
4,40
22,
116
8,21
33,
977
8,37
411
,278
22,6
9733
,157
7,57
08,
691
2,21
97,
677
4,54
313
6,74
7N
ot
e: D
efin
ition
s of
Car
eer
Clu
ster
s ca
n be
obt
aine
d fr
om h
ttp://
ww
w.c
aree
rclu
ster
s.or
g.S
ou
rc
e: I
owa
Dep
artm
ent o
f Edu
catio
n, D
ivis
ion
of C
omm
unity
Col
lege
s an
d W
orkf
orce
Pre
para
tion,
Com
mun
ity C
olle
ge M
IS.
Tab
le 3
-10:
Fis
cal Y
ear
En
rollm
ent
by
Co
lleg
e an
d C
aree
r C
lust
er:
2008
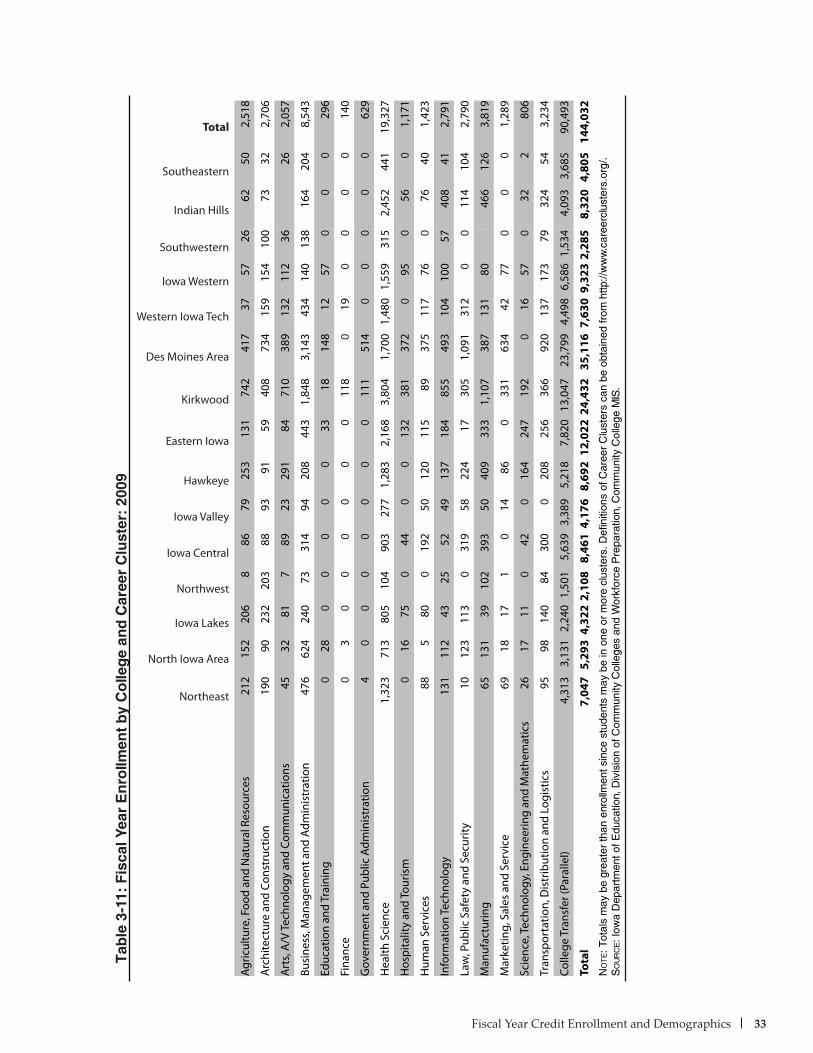
Fiscal Year Credit Enrollment and Demographics 33
Tab
le 3
-11:
Fis
cal Y
ear
En
rollm
ent
by
Co
lleg
e an
d C
aree
r C
lust
er:
2009
Northeast
North Iowa Area
Iowa Lakes
Northwest
Iowa Central
Iowa Valley
Hawkeye
Eastern Iowa
Kirkwood
Des Moines Area
Western Iowa Tech
Iowa Western
Southwestern
Indian Hills
Southeastern
Total
Agric
ultu
re, F
ood
and
Nat
ural
Res
ourc
es21
215
220
68
8679
253
131
742
417
3757
2662
502,
518
Arc
hite
ctur
e an
d Co
nstr
uctio
n19
090
232
203
8893
9159
408
734
159
154
100
7332
2,70
6
Art
s, A
/V Te
chno
logy
and
Com
mun
icat
ions
4532
817
8923
291
8471
038
913
211
236
262,
057
Busi
ness
, Man
agem
ent a
nd A
dmin
istr
atio
n47
662
424
073
314
9420
844
31,
848
3,14
343
414
013
816
420
48,
543
Educ
atio
n an
d Tr
aini
ng0
280
00
00
3318
148
1257
00
029
6
Fina
nce
03
00
00
00
118
019
00
00
140
Gov
ernm
ent a
nd P
ublic
Adm
inis
trat
ion
40
00
00
00
111
514
00
00
062
9
Hea
lth S
cien
ce1,
323
713
805
104
903
277
1,28
32,
168
3,80
41,
700
1,48
01,
559
315
2,45
244
119
,327
Hos
pita
lity
and
Tour
ism
016
750
440
013
238
137
20
950
560
1,17
1
Hum
an S
ervi
ces
885
800
192
5012
011
589
375
117
760
7640
1,42
3
Info
rmat
ion
Tech
nolo
gy13
111
243
2552
4913
718
485
549
310
410
057
408
412,
791
Law
, Pub
lic S
afet
y an
d Se
curit
y10
123
113
031
958
224
1730
51,
091
312
00
114
104
2,79
0
Man
ufac
turin
g65
131
3910
239
350
409
333
1,10
738
713
180
466
126
3,81
9
Mar
ketin
g, S
ales
and
Ser
vice
6918
171
014
860
331
634
4277
00
01,
289
Scie
nce,
Tech
nolo
gy, E
ngin
eerin
g an
d M
athe
mat
ics
2617
110
420
164
247
192
016
570
322
806
Tran
spor
tatio
n, D
istr
ibut
ion
and
Logi
stic
s95
9814
084
300
020
825
636
692
013
717
379
324
543,
234
Colle
ge T
rans
fer (
Para
llel)
4,31
33,
131
2,24
01,
501
5,63
93,
389
5,21
87,
820
13,0
4723
,799
4,49
86,
586
1,53
44,
093
3,68
590
,493
Tota
l7,
047
5,29
34,
322
2,10
88,
461
4,17
68,
692
12,0
2224
,432
35,1
167,
630
9,32
32,
285
8,32
04,
805
144,
032
No
te: T
otal
s m
ay b
e gr
eate
r th
an e
nrol
lmen
t sin
ce s
tude
nts
may
be
in o
ne o
r m
ore
clus
ters
. Def
initi
ons
of C
aree
r C
lust
ers
can
be o
btai
ned
from
http
://w
ww
.car
eerc
lust
ers.
org/
.S
ou
rc
e: I
owa
Dep
artm
ent o
f Edu
catio
n, D
ivis
ion
of C
omm
unity
Col
lege
s an
d W
orkf
orce
Pre
para
tion,
Com
mun
ity C
olle
ge M
IS.
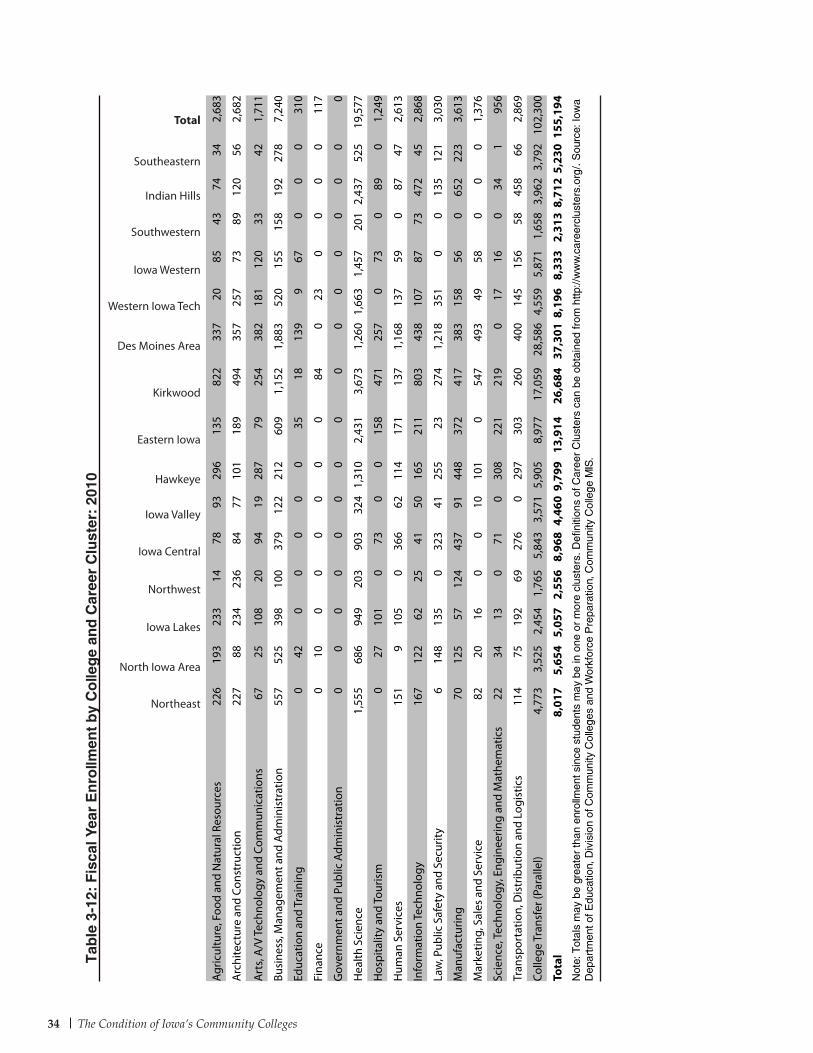
The Condition of Iowa’s Community Colleges34
Tab
le 3
-12:
Fis
cal Y
ear
En
rollm
ent
by
Co
lleg
e an
d C
aree
r C
lust
er:
2010
Northeast
North Iowa Area
Iowa Lakes
Northwest
Iowa Central
Iowa Valley
Hawkeye
Eastern Iowa
Kirkwood
Des Moines Area
Western Iowa Tech
Iowa Western
Southwestern
Indian Hills
Southeastern
Total
Agric
ultu
re, F
ood
and
Nat
ural
Res
ourc
es22
619
323
314
7893
296
135
822
337
2085
4374
342,
683
Arc
hite
ctur
e an
d Co
nstr
uctio
n22
788
234
236
8477
101
189
494
357
257
7389
120
562,
682
Art
s, A
/V Te
chno
logy
and
Com
mun
icat
ions
6725
108
2094
1928
779
254
382
181
120
3342
1,71
1
Busi
ness
, Man
agem
ent a
nd A
dmin
istr
atio
n55
752
539
810
037
912
221
260
91,
152
1,88
352
015
515
819
227
87,
240
Educ
atio
n an
d Tr
aini
ng0
420
00
00
3518
139
967
00
031
0
Fina
nce
010
00
00
00
840
230
00
011
7
Gov
ernm
ent a
nd P
ublic
Adm
inis
trat
ion
00
00
00
00
00
00
00
00
Hea
lth S
cien
ce1,
555
686
949
203
903
324
1,31
02,
431
3,67
31,
260
1,66
31,
457
201
2,43
752
519
,577
Hos
pita
lity
and
Tour
ism
027
101
073
00
158
471
257
073
089
01,
249
Hum
an S
ervi
ces
151
910
50
366
6211
417
113
71,
168
137
590
8747
2,61
3
Info
rmat
ion
Tech
nolo
gy16
712
262
2541
5016
521
180
343
810
787
7347
245
2,86
8
Law
, Pub
lic S
afet
y an
d Se
curit
y6
148
135
032
341
255
2327
41,
218
351
00
135
121
3,03
0
Man
ufac
turin
g70
125
5712
443
791
448
372
417
383
158
560
652
223
3,61
3
Mar
ketin
g, S
ales
and
Ser
vice
8220
160
010
101
054
749
349
580
00
1,37
6
Scie
nce,
Tech
nolo
gy, E
ngin
eerin
g an
d M
athe
mat
ics
2234
130
710
308
221
219
017
160
341
956
Tran
spor
tatio
n, D
istr
ibut
ion
and
Logi
stic
s11
475
192
6927
60
297
303
260
400
145
156
5845
866
2,86
9
Colle
ge T
rans
fer (
Para
llel)
4,77
33,
525
2,45
41,
765
5,84
33,
571
5,90
58,
977
17,0
5928
,586
4,55
95,
871
1,65
83,
962
3,79
210
2,30
0
Tota
l8,
017
5,65
45,
057
2,55
68,
968
4,46
09,
799
13,9
1426
,684
37,3
018,
196
8,33
32,
313
8,71
25,
230
155,
194
Not
e: T
otal
s m
ay b
e gr
eate
r th
an e
nrol
lmen
t sin
ce s
tude
nts
may
be
in o
ne o
r m
ore
clus
ters
. Def
initi
ons
of C
aree
r C
lust
ers
can
be o
btai
ned
from
http
://w
ww
.car
eerc
lust
ers.
org/
. Sou
rce:
Iow
a D
epar
tmen
t of E
duca
tion,
Div
isio
n of
Com
mun
ity C
olle
ges
and
Wor
kfor
ce P
repa
ratio
n, C
omm
unity
Col
lege
MIS
.
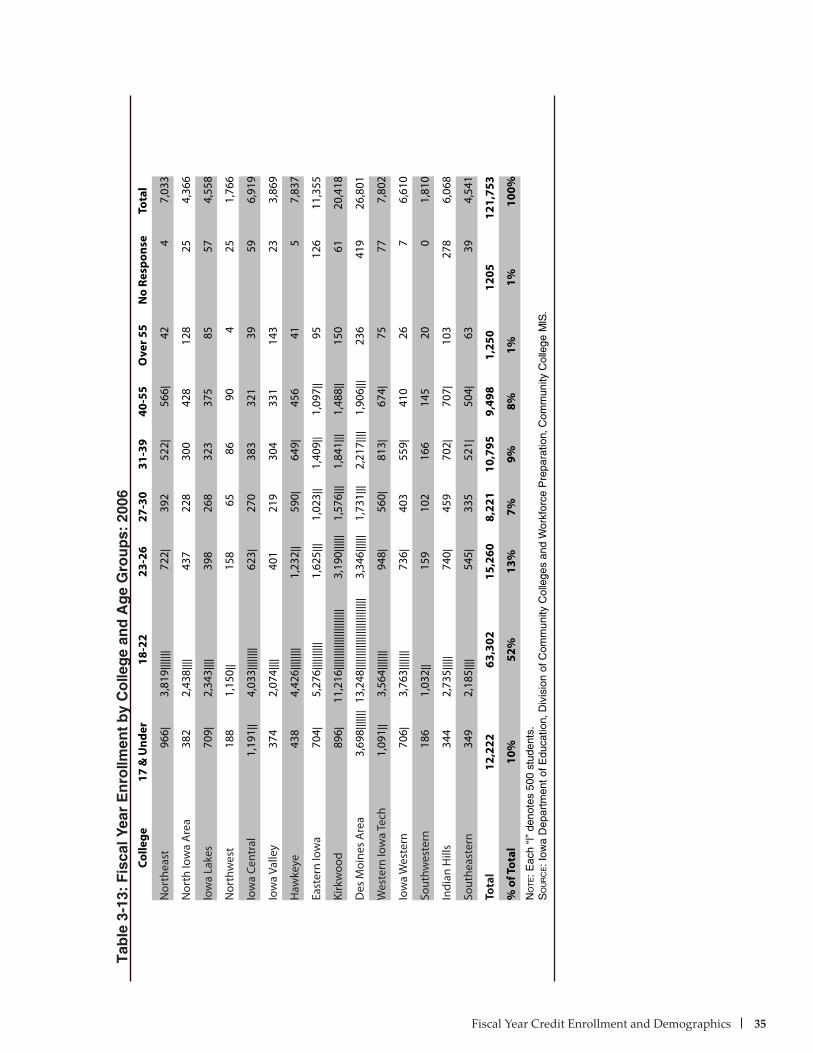
Fiscal Year Credit Enrollment and Demographics 35
Tab
le 3
-13:
Fis
cal Y
ear
En
rollm
ent
by
Co
lleg
e an
d A
ge
Gro
up
s: 2
006
Colle
ge17
& U
nder
18-2
223
-26
27-3
031
-39
40-5
5O
ver 5
5N
o Re
spon
seTo
tal
Nor
thea
st96
6 |3,
819|
||||||
722|
392
522|
566|
424
7,03
3
Nor
th Io
wa
Are
a38
22,
438 |
|||43
722
830
042
812
825
4,36
6
Iow
a La
kes
709 |
2,34
3||||
398
268
323
375
8557
4,55
8
Nor
thw
est
188
1,15
0 ||
158
6586
904
251,
766
Iow
a Ce
ntra
l1,
191 |
|4,
033|
||||||
|62
3|27
038
332
139
596,
919
Iow
a Va
lley
374
2,07
4 ||||
401
219
304
331
143
233,
869
Haw
keye
438
4,42
6 ||||
||||
1,23
2||
590|
649|
456
415
7,83
7
East
ern
Iow
a70
4 |5,
276|
||||||
|||1,
625|
||1,
023|
|1,
409|
|1,
097|
|95
126
11,3
55
Kirk
woo
d89
6 |11
,216
||||||
||||||
||||||
||||
3,19
0||||
||1,
576|
||1,
841|
||1,
488|
|15
061
20,4
18
Des
Moi
nes
Are
a3,
698 |
||||||
13,2
48|||
||||||
||||||
||||||
|||||
3,34
6||||
||1,
731|
||2,
217|
|||1,
906|
||23
641
926
,801
Wes
tern
Iow
a Te
ch1,
091 |
|3,
564|
||||||
948|
560|
813|
674|
7577
7,80
2
Iow
a W
este
rn70
6 |3,
763|
||||||
736|
403
559|
410
267
6,61
0
Sout
hwes
tern
186
1,03
2 ||
159
102
166
145
200
1,81
0
Indi
an H
ills
344
2,73
5 ||||
|74
0|45
970
2|70
7|10
327
86,
068
Sout
heas
tern
349
2,18
5 ||||
545|
335
521|
504|
6339
4,54
1
Tota
l12
,222
63,3
0215
,260
8,22
110
,795
9,49
81,
250
1205
121,
753
% o
f Tot
al10
%52
%13
%7%
9%8%
1%1%
100%
No
te: E
ach
“|”
deno
tes
500
stud
ents
.S
ou
rc
e: I
owa
Dep
artm
ent o
f Edu
catio
n, D
ivis
ion
of C
omm
unity
Col
lege
s an
d W
orkf
orce
Pre
para
tion,
Com
mun
ity C
olle
ge M
IS.
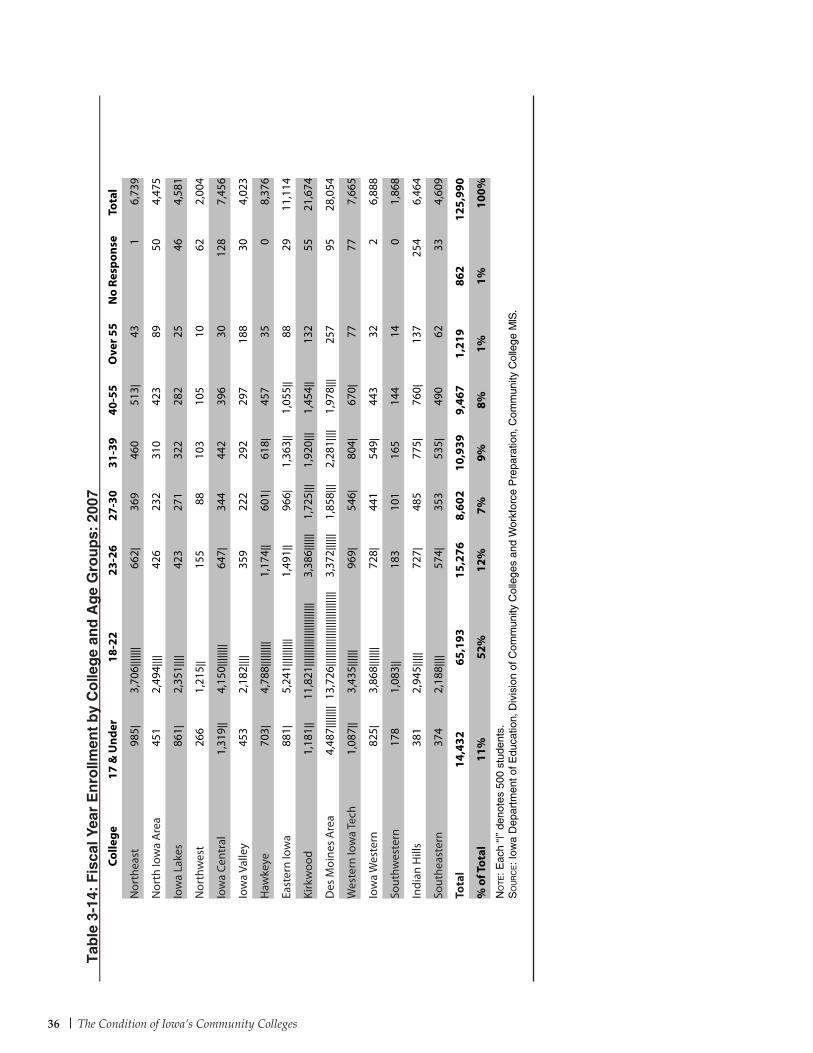
The Condition of Iowa’s Community Colleges36
Colle
ge17
& U
nder
18-2
223
-26
27-3
031
-39
40-5
5O
ver 5
5N
o Re
spon
seTo
tal
Nor
thea
st98
5 |3,
706|
||||||
662|
369
460
513|
431
6,73
9
Nor
th Io
wa
Are
a45
12,
494 |
|||42
623
231
042
389
504,
475
Iow
a La
kes
861 |
2,35
1||||
423
271
322
282
2546
4,58
1
Nor
thw
est
266
1,21
5 ||
155
8810
310
510
622,
004
Iow
a Ce
ntra
l1,
319 |
|4,
150|
||||||
|64
7|34
444
239
630
128
7,45
6
Iow
a Va
lley
453
2,18
2 ||||
359
222
292
297
188
304,
023
Haw
keye
703 |
4,78
8||||
|||||
1,17
4||
601|
618|
457
350
8,37
6
East
ern
Iow
a88
1 |5,
241|
||||||
|||1,
491|
|96
6|1,
363|
|1,
055|
|88
2911
,114
Kirk
woo
d1,
181 |
|11
,821
||||||
||||||
||||||
|||||
3,38
6||||
||1,
725|
||1,
920|
||1,
454|
|13
255
21,6
74
Des
Moi
nes
Are
a4,
487 |
||||||
|13
,726
||||||
||||||
||||||
||||||
|||3,
372|
|||||
1,85
8|||
2,28
1||||
1,97
8|||
257
9528
,054
Wes
tern
Iow
a Te
ch1,
087 |
|3,
435|
|||||
969|
546|
804|
670|
7777
7,66
5
Iow
a W
este
rn82
5 |3,
868|
||||||
728|
441
549|
443
322
6,88
8
Sout
hwes
tern
178
1,08
3 ||
183
101
165
144
140
1,86
8
Indi
an H
ills
381
2,94
5 ||||
|72
7|48
577
5|76
0|13
725
46,
464
Sout
heas
tern
374
2,18
8 ||||
574|
353
535|
490
6233
4,60
9
Tota
l14
,432
65,1
9315
,276
8,60
210
,939
9,46
71,
219
862
125,
990
% o
f Tot
al11
%52
%12
%7%
9%8%
1%1%
100%
No
te: E
ach
“|”
deno
tes
500
stud
ents
.S
ou
rc
e: I
owa
Dep
artm
ent o
f Edu
catio
n, D
ivis
ion
of C
omm
unity
Col
lege
s an
d W
orkf
orce
Pre
para
tion,
Com
mun
ity C
olle
ge M
IS.
Tab
le 3
-14:
Fis
cal Y
ear
En
rollm
ent
by
Co
lleg
e an
d A
ge
Gro
up
s: 2
007

Fiscal Year Credit Enrollment and Demographics 37
Tab
le 3
-15:
Fis
cal Y
ear
En
rollm
ent
by
Co
lleg
e an
d A
ge
Gro
up
s: 2
008
Colle
ge17
& U
nder
18-2
223
-26
27-3
031
-39
40-5
5O
ver 5
5N
o Re
spon
seTo
tal
Nor
thea
st1,
017 |
|3,
808|
||||||
680|
392
475
409
451
6,82
7
Nor
th Io
wa
Are
a56
7 |2,
593|
||||
397
271
349
428
7835
4,71
8
Iow
a La
kes
793 |
2,25
8||||
395
252
350
265
2069
4,40
2
Nor
thw
est
313
1,25
9 ||
165
9212
010
915
432,
116
Iow
a Ce
ntra
l1,
351 |
|4,
447|
||||||
|75
1|37
949
140
530
627,
916
Iow
a Va
lley
448
2,15
5 ||||
346
253
297
298
158
223,
977
Haw
keye
843 |
4,86
4||||
|||||
1,09
1||
550|
563|
429
331
8,37
4
East
ern
Iow
a1,
010 |
|5,
431|
||||||
|||1,
414|
|96
0|1,
323|
|1,
033|
|98
911
,278
Kirk
woo
d1,
254 |
|11
,771
||||||
||||||
||||||
|||||
3,21
1||||
||1,
728|
||1,
911|
||1,
441|
|12
124
21,4
61
Des
Moi
nes
Are
a4,
704 |
||||||
||14
,451
||||||
||||||
||||||
||||||
||||
3,61
6||||
|||1,
929|
||2,
460|
|||2,
054|
|||28
970
29,5
73
Wes
tern
Iow
a Te
ch1,
099 |
|3,
471|
|||||
895|
548|
740|
662|
5510
07,
570
Iow
a W
este
rn70
2 |3,
957|
||||||
731|
427
568|
431
390
6,85
5
Sout
hwes
tern
245
1,09
1 ||
187
116
176
158
190
1,99
2
Indi
an H
ills
507 |
3,07
8||||
||71
9|46
173
9|70
4|13
719
96,
544
Sout
heas
tern
364
2,13
0 ||||
563|
372
544|
483
4839
4,54
3
Tota
l15
,217
66,7
6415
,161
8,73
011
,106
9,30
91,
185
674
128,
146
% o
f Tot
al12
%52
%12
%7%
9%7%
1%1%
100%
No
te: E
ach
“|”
deno
tes
500
stud
ents
.S
ou
rc
e: I
owa
Dep
artm
ent o
f Edu
catio
n, D
ivis
ion
of C
omm
unity
Col
lege
s an
d W
orkf
orce
Pre
para
tion,
Com
mun
ity C
olle
ge M
IS.
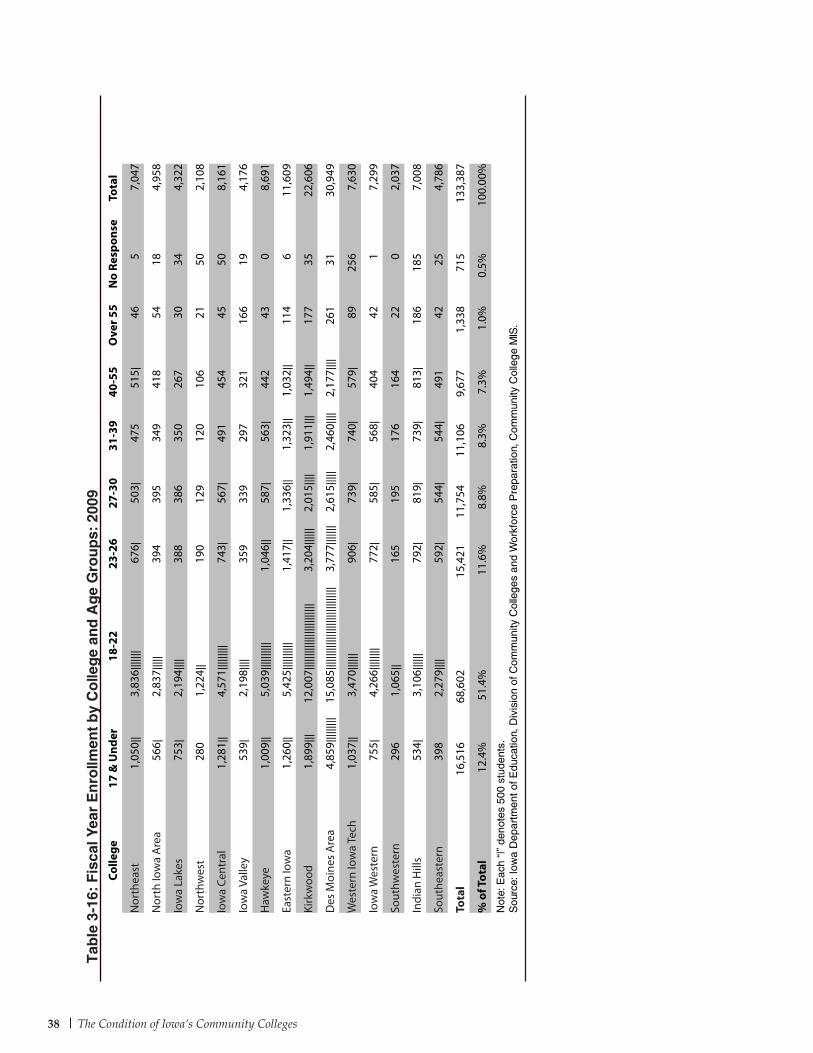
The Condition of Iowa’s Community Colleges38
Colle
ge17
& U
nder
18-2
223
-26
27-3
031
-39
40-5
5O
ver 5
5N
o Re
spon
seTo
tal
Nor
thea
st1,
050 |
|3,
836|
||||||
676|
503|
475
515|
465
7,04
7
Nor
th Io
wa
Are
a56
6 |2,
837|
||||
394
395
349
418
5418
4,95
8
Iow
a La
kes
753 |
2,19
4||||
388
386
350
267
3034
4,32
2
Nor
thw
est
280
1,22
4 ||
190
129
120
106
2150
2,10
8
Iow
a Ce
ntra
l1,
281 |
|4,
571|
||||||
||74
3|56
7|49
145
445
508,
161
Iow
a Va
lley
539 |
2,19
8||||
359
339
297
321
166
194,
176
Haw
keye
1,00
9 ||
5,03
9||||
||||||
1,04
6||
587|
563|
442
430
8,69
1
East
ern
Iow
a1,
260 |
|5,
425|
||||||
|||1,
417|
|1,
336|
|1,
323|
|1,
032|
|11
46
11,6
09
Kirk
woo
d1,
899 |
||12
,007
||||||
||||||
||||||
||||||
3,20
4||||
||2,
015|
|||1,
911|
||1,
494|
|17
735
22,6
06
Des
Moi
nes
Are
a4,
859|
||||||
||15
,085
||||||
||||||
||||||
||||||
||||||
3,77
7||||
|||2,
615|
||||
2,46
0||||
2,17
7||||
261
3130
,949
Wes
tern
Iow
a Te
ch1,
037 |
|3,
470|
|||||
906|
739|
740|
579|
8925
67,
630
Iow
a W
este
rn75
5 |4,
266|
||||||
|77
2|58
5|56
8|40
442
17,
299
Sout
hwes
tern
296
1,06
5 ||
165
195
176
164
220
2,03
7
Indi
an H
ills
534 |
3,10
6||||
||79
2|81
9|73
9|81
3|18
618
57,
008
Sout
heas
tern
398
2,27
9 ||||
592|
544|
544|
491
4225
4,78
6
Tota
l16
,516
68,6
0215
,421
11,7
5411
,106
9,67
71,
338
715
133,
387
% o
f Tot
al12
.4%
51.4
%11
.6%
8.8%
8.3%
7.3%
1.0%
0.5%
100.
00%
Not
e: E
ach
“|”
deno
tes
500
stud
ents
. S
ourc
e: Io
wa
Dep
artm
ent o
f Edu
catio
n, D
ivis
ion
of C
omm
unity
Col
lege
s an
d W
orkf
orce
Pre
para
tion,
Com
mun
ity C
olle
ge M
IS.
Tab
le 3
-16:
Fis
cal Y
ear
En
rollm
ent
by
Co
lleg
e an
d A
ge
Gro
up
s: 2
009
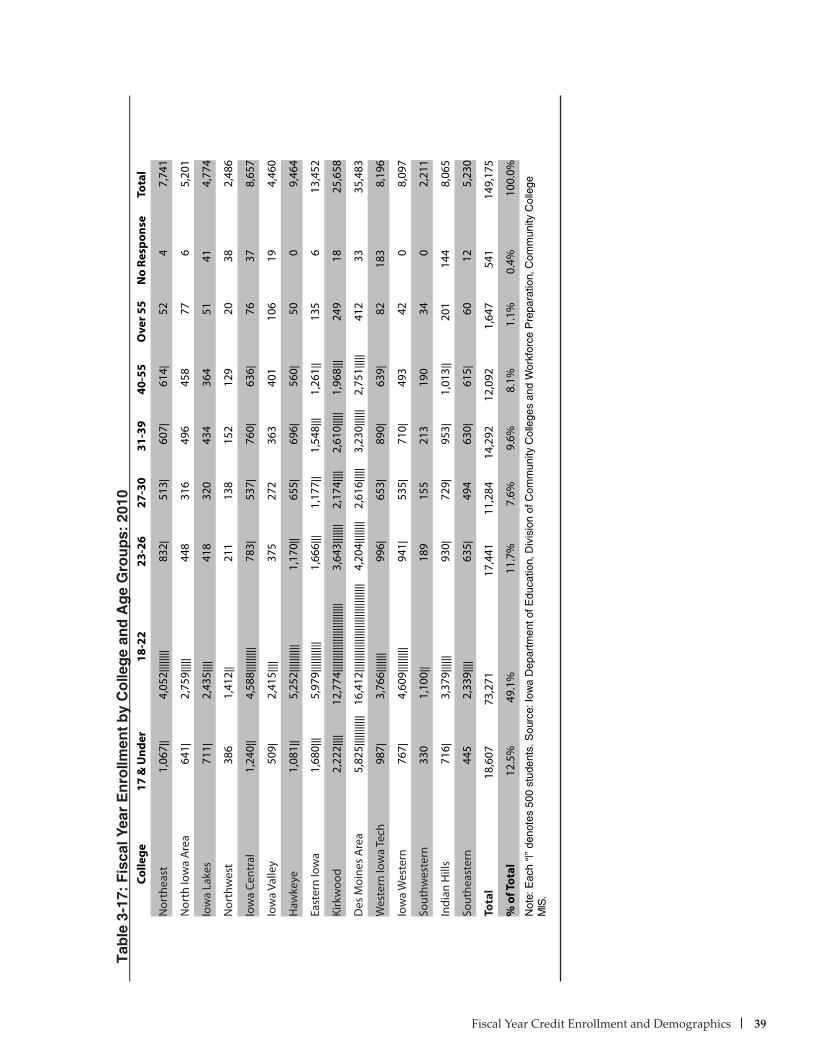
Fiscal Year Credit Enrollment and Demographics 39
Tab
le 3
-17:
Fis
cal Y
ear
En
rollm
ent
by
Co
lleg
e an
d A
ge
Gro
up
s: 2
010
Colle
ge17
& U
nder
18-2
223
-26
27-3
031
-39
40-5
5O
ver 5
5N
o Re
spon
seTo
tal
Nor
thea
st1,
067 |
|4,
052|
||||||
|83
2|51
3|60
7|61
4|52
47,
741
Nor
th Io
wa
Are
a64
1 |2,
759|
||||
448
316
496
458
776
5,20
1
Iow
a La
kes
711 |
2,43
5||||
418
320
434
364
5141
4,77
4
Nor
thw
est
386
1,41
2 ||
211
138
152
129
2038
2,48
6
Iow
a Ce
ntra
l1,
240 |
|4,
588|
||||||
||78
3|53
7|76
0|63
6|76
378,
657
Iow
a Va
lley
509 |
2,41
5||||
375
272
363
401
106
194,
460
Haw
keye
1,08
1 ||
5,25
2||||
||||||
1,17
0||
655|
696|
560|
500
9,46
4
East
ern
Iow
a1,
680 |
||5,
979|
||||||
||||
1,66
6|||
1,17
7||
1,54
8|||
1,26
1||
135
613
,452
Kirk
woo
d2,
222 |
|||12
,774
||||||
||||||
||||||
||||||
|3,
643|
||||||
2,17
4||||
2,61
0||||
|1,
968|
||24
918
25,6
58
Des
Moi
nes
Are
a5,
825 |
||||||
||||
16,4
12|||
||||||
||||||
||||||
||||||
|||||
4,20
4||||
||||
2,61
6||||
|3,
230|
|||||
2,75
1||||
|41
233
35,4
83
Wes
tern
Iow
a Te
ch98
7 |3,
766|
||||||
996|
653|
890|
639|
8218
38,
196
Iow
a W
este
rn76
7 |4,
609|
||||||
||94
1|53
5|71
0|49
342
08,
097
Sout
hwes
tern
330
1,10
0 ||
189
155
213
190
340
2,21
1
Indi
an H
ills
716 |
3,37
9||||
||93
0|72
9|95
3|1,
013|
|20
114
48,
065
Sout
heas
tern
445
2,33
9 ||||
635|
494
630|
615|
6012
5,23
0
Tota
l18
,607
73,2
7117
,441
11,2
8414
,292
12,0
921,
647
541
149,
175
% o
f Tot
al12
.5%
49.1
%11
.7%
7.6%
9.6%
8.1%
1.1%
0.4%
100.
0%
Not
e: E
ach
“|”
deno
tes
500
stud
ents
. Sou
rce:
Iow
a D
epar
tmen
t of E
duca
tion,
Div
isio
n of
Com
mun
ity C
olle
ges
and
Wor
kfor
ce P
repa
ratio
n, C
omm
unity
Col
lege
M
IS.
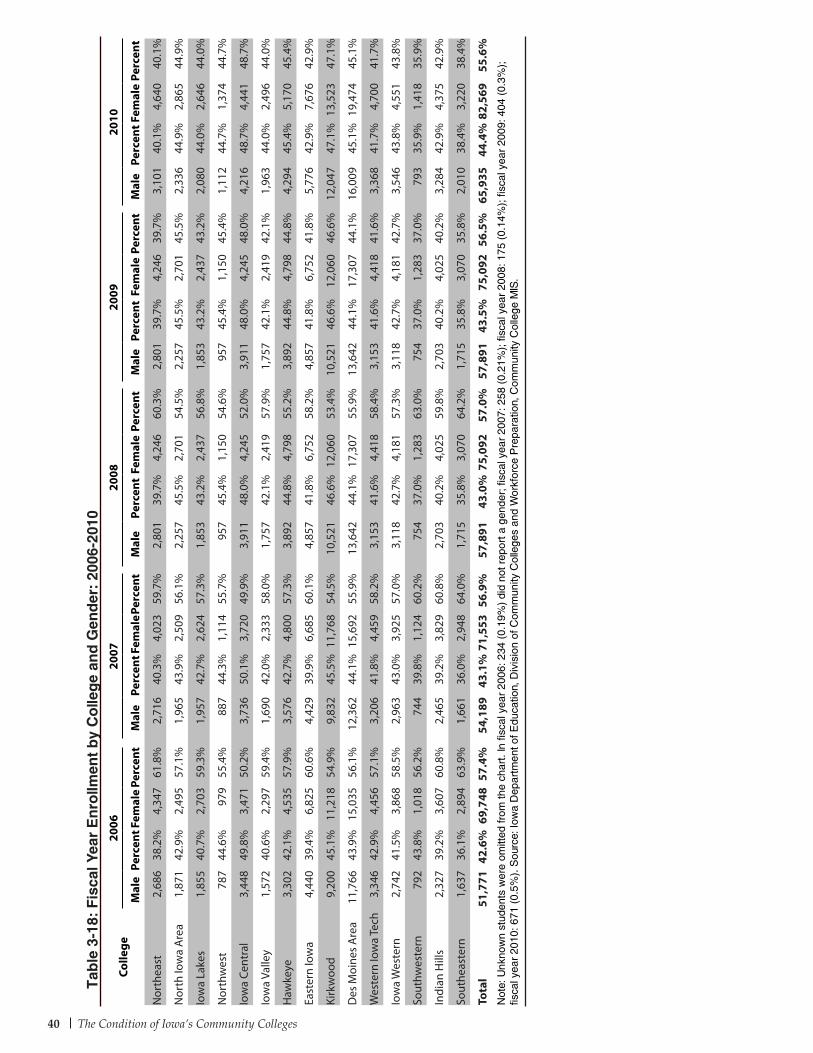
The Condition of Iowa’s Community Colleges40
Tab
le 3
-18:
Fis
cal Y
ear
En
rollm
ent
by
Co
lleg
e an
d G
end
er:
2006
-201
0
Colle
ge20
0620
0720
0820
0920
10
Mal
ePe
rcen
tFem
ale
Perc
ent
Mal
ePe
rcen
tFem
aleP
erce
ntM
ale
Perc
ent
Fem
ale
Perc
ent
Mal
ePe
rcen
tFe
mal
ePe
rcen
tM
ale
Perc
entF
emal
ePe
rcen
t
Nor
thea
st2,
686
38.2
%4,
347
61.8
%2,
716
40.3
%4,
023
59.7
%2,
801
39.7
%4,
246
60.3
%2,
801
39.7
%4,
246
39.7
%3,
101
40.1
%4,
640
40.1
%
Nor
th Io
wa
Are
a1,
871
42.9
%2,
495
57.1
%1,
965
43.9
%2,
509
56.1
%2,
257
45.5
%2,
701
54.5
%2,
257
45.5
%2,
701
45.5
%2,
336
44.9
%2,
865
44.9
%
Iow
a La
kes
1,85
540
.7%
2,70
359
.3%
1,95
742
.7%
2,62
457
.3%
1,85
343
.2%
2,43
756
.8%
1,85
343
.2%
2,43
743
.2%
2,08
044
.0%
2,64
644
.0%
Nor
thw
est
787
44.6
%97
955
.4%
887
44.3
%1,
114
55.7
%95
745
.4%
1,15
054
.6%
957
45.4
%1,
150
45.4
%1,
112
44.7
%1,
374
44.7
%
Iow
a Ce
ntra
l3,
448
49.8
%3,
471
50.2
%3,
736
50.1
%3,
720
49.9
%3,
911
48.0
%4,
245
52.0
%3,
911
48.0
%4,
245
48.0
%4,
216
48.7
%4,
441
48.7
%
Iow
a Va
lley
1,57
240
.6%
2,29
759
.4%
1,69
042
.0%
2,33
358
.0%
1,75
742
.1%
2,41
957
.9%
1,75
742
.1%
2,41
942
.1%
1,96
344
.0%
2,49
644
.0%
Haw
keye
3,30
242
.1%
4,53
557
.9%
3,57
642
.7%
4,80
057
.3%
3,89
244
.8%
4,79
855
.2%
3,89
244
.8%
4,79
844
.8%
4,29
445
.4%
5,17
045
.4%
East
ern
Iow
a4,
440
39.4
%6,
825
60.6
%4,
429
39.9
%6,
685
60.1
%4,
857
41.8
%6,
752
58.2
%4,
857
41.8
%6,
752
41.8
%5,
776
42.9
%7,
676
42.9
%
Kirk
woo
d9,
200
45.1
%11
,218
54.9
%9,
832
45.5
%11
,768
54.5
%10
,521
46.6
%12
,060
53.4
%10
,521
46.6
%12
,060
46.6
%12
,047
47.1
%13
,523
47.1
%
Des
Moi
nes
Are
a11
,766
43.9
%15
,035
56.1
%12
,362
44.1
%15
,692
55.9
%13
,642
44.1
%17
,307
55.9
%13
,642
44.1
%17
,307
44.1
%16
,009
45.1
%19
,474
45.1
%
Wes
tern
Iow
a Te
ch3,
346
42.9
%4,
456
57.1
%3,
206
41.8
%4,
459
58.2
%3,
153
41.6
%4,
418
58.4
%3,
153
41.6
%4,
418
41.6
%3,
368
41.7
%4,
700
41.7
%
Iow
a W
este
rn2,
742
41.5
%3,
868
58.5
%2,
963
43.0
%3,
925
57.0
%3,
118
42.7
%4,
181
57.3
%3,
118
42.7
%4,
181
42.7
%3,
546
43.8
%4,
551
43.8
%
Sout
hwes
tern
792
43.8
%1,
018
56.2
%74
439
.8%
1,12
460
.2%
754
37.0
%1,
283
63.0
%75
437
.0%
1,28
337
.0%
793
35.9
%1,
418
35.9
%
Indi
an H
ills
2,32
739
.2%
3,60
760
.8%
2,46
539
.2%
3,82
960
.8%
2,70
340
.2%
4,02
559
.8%
2,70
340
.2%
4,02
540
.2%
3,28
442
.9%
4,37
542
.9%
Sout
heas
tern
1,63
736
.1%
2,89
463
.9%
1,66
136
.0%
2,94
864
.0%
1,71
535
.8%
3,07
064
.2%
1,71
535
.8%
3,07
035
.8%
2,01
038
.4%
3,22
038
.4%
Tota
l51
,771
42.6
%69
,748
57.4
%54
,189
43.1
%71
,553
56.9
%57
,891
43.0
%75
,092
57.0
%57
,891
43.5
%75
,092
56.5
%65
,935
44.4
%82
,569
55.6
%N
ote:
Unk
now
n st
uden
ts w
ere
omitt
ed fr
om th
e ch
art.
In fi
scal
yea
r 20
06: 2
34 (
0.19
%)
did
not r
epor
t a g
ende
r; fi
scal
yea
r 20
07: 2
58 (
0.21
%);
fisc
al y
ear
2008
: 175
(0.
14%
); fi
scal
yea
r 20
09: 4
04 (
0.3%
);
fisca
l yea
r 20
10: 6
71 (
0.5%
). S
ourc
e: Io
wa
Dep
artm
ent o
f Edu
catio
n, D
ivis
ion
of C
omm
unity
Col
lege
s an
d W
orkf
orce
Pre
para
tion,
Com
mun
ity C
olle
ge M
IS.
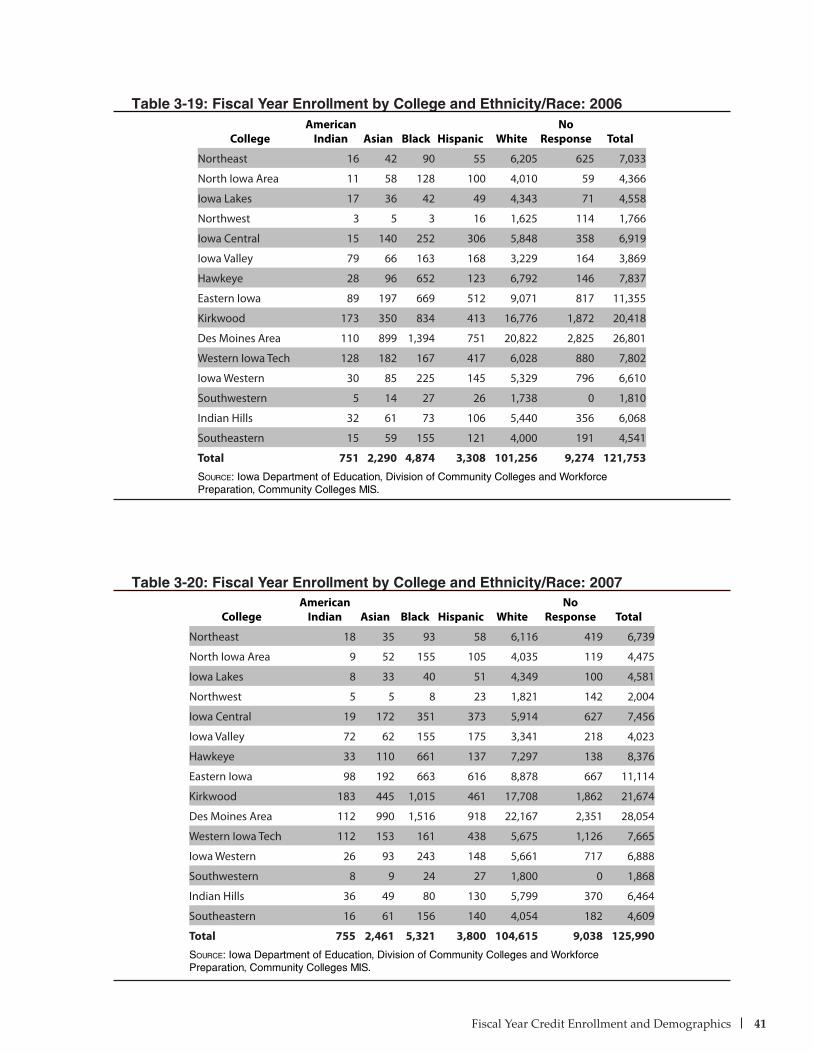
Fiscal Year Credit Enrollment and Demographics 41
CollegeAmerican
Indian Asian Black Hispanic WhiteNo
Response Total
Northeast 16 42 90 55 6,205 625 7,033
North Iowa Area 11 58 128 100 4,010 59 4,366
Iowa Lakes 17 36 42 49 4,343 71 4,558
Northwest 3 5 3 16 1,625 114 1,766
Iowa Central 15 140 252 306 5,848 358 6,919
Iowa Valley 79 66 163 168 3,229 164 3,869
Hawkeye 28 96 652 123 6,792 146 7,837
Eastern Iowa 89 197 669 512 9,071 817 11,355
Kirkwood 173 350 834 413 16,776 1,872 20,418
Des Moines Area 110 899 1,394 751 20,822 2,825 26,801
Western Iowa Tech 128 182 167 417 6,028 880 7,802
Iowa Western 30 85 225 145 5,329 796 6,610
Southwestern 5 14 27 26 1,738 0 1,810
Indian Hills 32 61 73 106 5,440 356 6,068
Southeastern 15 59 155 121 4,000 191 4,541
Total 751 2,290 4,874 3,308 101,256 9,274 121,753Source: Iowa Department of Education, Division of Community Colleges and Workforce Preparation, Community Colleges MIS.
Table 3-19: Fiscal Year Enrollment by College and Ethnicity/Race: 2006
Table 3-20: Fiscal Year Enrollment by College and Ethnicity/Race: 2007
CollegeAmerican
Indian Asian Black Hispanic WhiteNo
Response Total
Northeast 18 35 93 58 6,116 419 6,739
North Iowa Area 9 52 155 105 4,035 119 4,475
Iowa Lakes 8 33 40 51 4,349 100 4,581
Northwest 5 5 8 23 1,821 142 2,004
Iowa Central 19 172 351 373 5,914 627 7,456
Iowa Valley 72 62 155 175 3,341 218 4,023
Hawkeye 33 110 661 137 7,297 138 8,376
Eastern Iowa 98 192 663 616 8,878 667 11,114
Kirkwood 183 445 1,015 461 17,708 1,862 21,674
Des Moines Area 112 990 1,516 918 22,167 2,351 28,054
Western Iowa Tech 112 153 161 438 5,675 1,126 7,665
Iowa Western 26 93 243 148 5,661 717 6,888
Southwestern 8 9 24 27 1,800 0 1,868
Indian Hills 36 49 80 130 5,799 370 6,464
Southeastern 16 61 156 140 4,054 182 4,609
Total 755 2,461 5,321 3,800 104,615 9,038 125,990Source: Iowa Department of Education, Division of Community Colleges and Workforce Preparation, Community Colleges MIS.
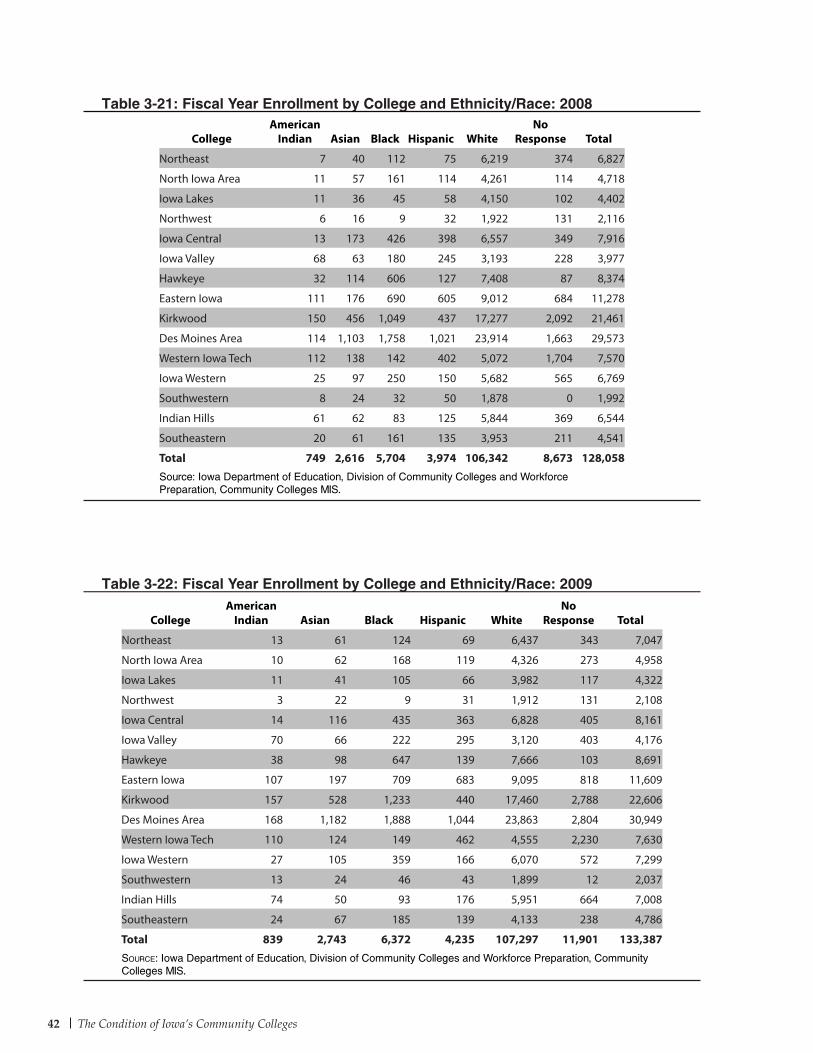
The Condition of Iowa’s Community Colleges42
CollegeAmerican
Indian Asian Black Hispanic WhiteNo
Response Total
Northeast 13 61 124 69 6,437 343 7,047
North Iowa Area 10 62 168 119 4,326 273 4,958
Iowa Lakes 11 41 105 66 3,982 117 4,322
Northwest 3 22 9 31 1,912 131 2,108
Iowa Central 14 116 435 363 6,828 405 8,161
Iowa Valley 70 66 222 295 3,120 403 4,176
Hawkeye 38 98 647 139 7,666 103 8,691
Eastern Iowa 107 197 709 683 9,095 818 11,609
Kirkwood 157 528 1,233 440 17,460 2,788 22,606
Des Moines Area 168 1,182 1,888 1,044 23,863 2,804 30,949
Western Iowa Tech 110 124 149 462 4,555 2,230 7,630
Iowa Western 27 105 359 166 6,070 572 7,299
Southwestern 13 24 46 43 1,899 12 2,037
Indian Hills 74 50 93 176 5,951 664 7,008
Southeastern 24 67 185 139 4,133 238 4,786
Total 839 2,743 6,372 4,235 107,297 11,901 133,387Source: Iowa Department of Education, Division of Community Colleges and Workforce Preparation, Community Colleges MIS.
Table 3-21: Fiscal Year Enrollment by College and Ethnicity/Race: 2008
Table 3-22: Fiscal Year Enrollment by College and Ethnicity/Race: 2009
CollegeAmerican
Indian Asian Black Hispanic WhiteNo
Response Total
Northeast 7 40 112 75 6,219 374 6,827
North Iowa Area 11 57 161 114 4,261 114 4,718
Iowa Lakes 11 36 45 58 4,150 102 4,402
Northwest 6 16 9 32 1,922 131 2,116
Iowa Central 13 173 426 398 6,557 349 7,916
Iowa Valley 68 63 180 245 3,193 228 3,977
Hawkeye 32 114 606 127 7,408 87 8,374
Eastern Iowa 111 176 690 605 9,012 684 11,278
Kirkwood 150 456 1,049 437 17,277 2,092 21,461
Des Moines Area 114 1,103 1,758 1,021 23,914 1,663 29,573
Western Iowa Tech 112 138 142 402 5,072 1,704 7,570
Iowa Western 25 97 250 150 5,682 565 6,769
Southwestern 8 24 32 50 1,878 0 1,992
Indian Hills 61 62 83 125 5,844 369 6,544
Southeastern 20 61 161 135 3,953 211 4,541
Total 749 2,616 5,704 3,974 106,342 8,673 128,058Source: Iowa Department of Education, Division of Community Colleges and Workforce Preparation, Community Colleges MIS.
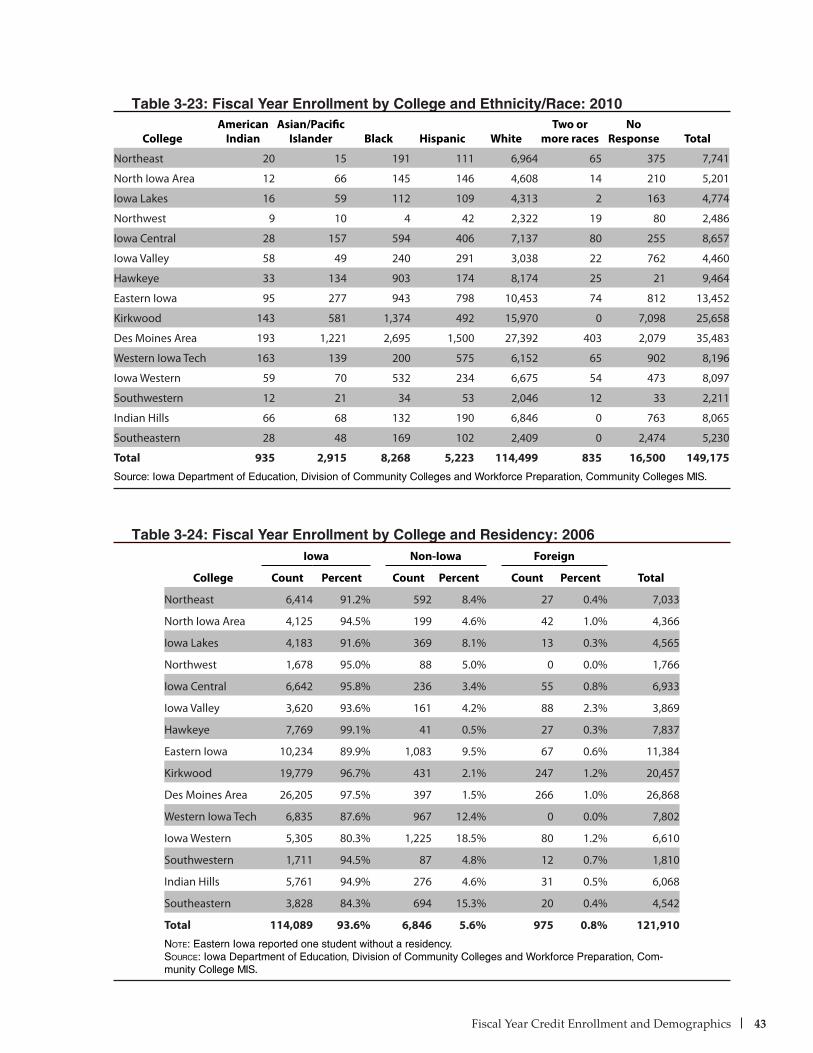
Fiscal Year Credit Enrollment and Demographics 43
Table 3-23: Fiscal Year Enrollment by College and Ethnicity/Race: 2010
Table 3-24: Fiscal Year Enrollment by College and Residency: 2006
CollegeAmerican
IndianAsian/Pacific
Islander Black Hispanic WhiteTwo or
more racesNo
Response Total
Northeast 20 15 191 111 6,964 65 375 7,741
North Iowa Area 12 66 145 146 4,608 14 210 5,201
Iowa Lakes 16 59 112 109 4,313 2 163 4,774
Northwest 9 10 4 42 2,322 19 80 2,486
Iowa Central 28 157 594 406 7,137 80 255 8,657
Iowa Valley 58 49 240 291 3,038 22 762 4,460
Hawkeye 33 134 903 174 8,174 25 21 9,464
Eastern Iowa 95 277 943 798 10,453 74 812 13,452
Kirkwood 143 581 1,374 492 15,970 0 7,098 25,658
Des Moines Area 193 1,221 2,695 1,500 27,392 403 2,079 35,483
Western Iowa Tech 163 139 200 575 6,152 65 902 8,196
Iowa Western 59 70 532 234 6,675 54 473 8,097
Southwestern 12 21 34 53 2,046 12 33 2,211
Indian Hills 66 68 132 190 6,846 0 763 8,065
Southeastern 28 48 169 102 2,409 0 2,474 5,230
Total 935 2,915 8,268 5,223 114,499 835 16,500 149,175Source: Iowa Department of Education, Division of Community Colleges and Workforce Preparation, Community Colleges MIS.
Iowa Non-Iowa Foreign
College Count Percent Count Percent Count Percent Total
Northeast 6,414 91.2% 592 8.4% 27 0.4% 7,033
North Iowa Area 4,125 94.5% 199 4.6% 42 1.0% 4,366
Iowa Lakes 4,183 91.6% 369 8.1% 13 0.3% 4,565
Northwest 1,678 95.0% 88 5.0% 0 0.0% 1,766
Iowa Central 6,642 95.8% 236 3.4% 55 0.8% 6,933
Iowa Valley 3,620 93.6% 161 4.2% 88 2.3% 3,869
Hawkeye 7,769 99.1% 41 0.5% 27 0.3% 7,837
Eastern Iowa 10,234 89.9% 1,083 9.5% 67 0.6% 11,384
Kirkwood 19,779 96.7% 431 2.1% 247 1.2% 20,457
Des Moines Area 26,205 97.5% 397 1.5% 266 1.0% 26,868
Western Iowa Tech 6,835 87.6% 967 12.4% 0 0.0% 7,802
Iowa Western 5,305 80.3% 1,225 18.5% 80 1.2% 6,610
Southwestern 1,711 94.5% 87 4.8% 12 0.7% 1,810
Indian Hills 5,761 94.9% 276 4.6% 31 0.5% 6,068
Southeastern 3,828 84.3% 694 15.3% 20 0.4% 4,542
Total 114,089 93.6% 6,846 5.6% 975 0.8% 121,910Note: Eastern Iowa reported one student without a residency. Source: Iowa Department of Education, Division of Community Colleges and Workforce Preparation, Com-munity College MIS.
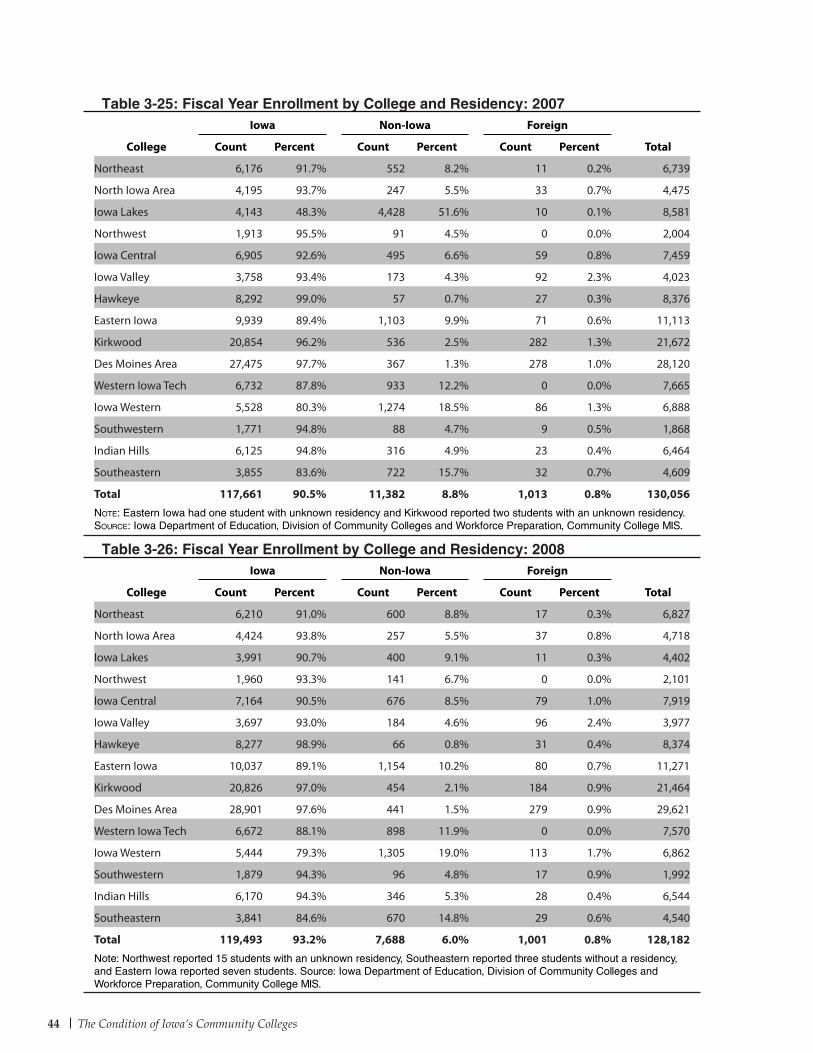
The Condition of Iowa’s Community Colleges44
Iowa Non-Iowa Foreign
College Count Percent Count Percent Count Percent Total
Northeast 6,176 91.7% 552 8.2% 11 0.2% 6,739
North Iowa Area 4,195 93.7% 247 5.5% 33 0.7% 4,475
Iowa Lakes 4,143 48.3% 4,428 51.6% 10 0.1% 8,581
Northwest 1,913 95.5% 91 4.5% 0 0.0% 2,004
Iowa Central 6,905 92.6% 495 6.6% 59 0.8% 7,459
Iowa Valley 3,758 93.4% 173 4.3% 92 2.3% 4,023
Hawkeye 8,292 99.0% 57 0.7% 27 0.3% 8,376
Eastern Iowa 9,939 89.4% 1,103 9.9% 71 0.6% 11,113
Kirkwood 20,854 96.2% 536 2.5% 282 1.3% 21,672
Des Moines Area 27,475 97.7% 367 1.3% 278 1.0% 28,120
Western Iowa Tech 6,732 87.8% 933 12.2% 0 0.0% 7,665
Iowa Western 5,528 80.3% 1,274 18.5% 86 1.3% 6,888
Southwestern 1,771 94.8% 88 4.7% 9 0.5% 1,868
Indian Hills 6,125 94.8% 316 4.9% 23 0.4% 6,464
Southeastern 3,855 83.6% 722 15.7% 32 0.7% 4,609
Total 117,661 90.5% 11,382 8.8% 1,013 0.8% 130,056Note: Eastern Iowa had one student with unknown residency and Kirkwood reported two students with an unknown residency. Source: Iowa Department of Education, Division of Community Colleges and Workforce Preparation, Community College MIS.
Table 3-25: Fiscal Year Enrollment by College and Residency: 2007
Table 3-26: Fiscal Year Enrollment by College and Residency: 2008Iowa Non-Iowa Foreign
College Count Percent Count Percent Count Percent Total
Northeast 6,210 91.0% 600 8.8% 17 0.3% 6,827
North Iowa Area 4,424 93.8% 257 5.5% 37 0.8% 4,718
Iowa Lakes 3,991 90.7% 400 9.1% 11 0.3% 4,402
Northwest 1,960 93.3% 141 6.7% 0 0.0% 2,101
Iowa Central 7,164 90.5% 676 8.5% 79 1.0% 7,919
Iowa Valley 3,697 93.0% 184 4.6% 96 2.4% 3,977
Hawkeye 8,277 98.9% 66 0.8% 31 0.4% 8,374
Eastern Iowa 10,037 89.1% 1,154 10.2% 80 0.7% 11,271
Kirkwood 20,826 97.0% 454 2.1% 184 0.9% 21,464
Des Moines Area 28,901 97.6% 441 1.5% 279 0.9% 29,621
Western Iowa Tech 6,672 88.1% 898 11.9% 0 0.0% 7,570
Iowa Western 5,444 79.3% 1,305 19.0% 113 1.7% 6,862
Southwestern 1,879 94.3% 96 4.8% 17 0.9% 1,992
Indian Hills 6,170 94.3% 346 5.3% 28 0.4% 6,544
Southeastern 3,841 84.6% 670 14.8% 29 0.6% 4,540
Total 119,493 93.2% 7,688 6.0% 1,001 0.8% 128,182Note: Northwest reported 15 students with an unknown residency, Southeastern reported three students without a residency, and Eastern Iowa reported seven students. Source: Iowa Department of Education, Division of Community Colleges and Workforce Preparation, Community College MIS.
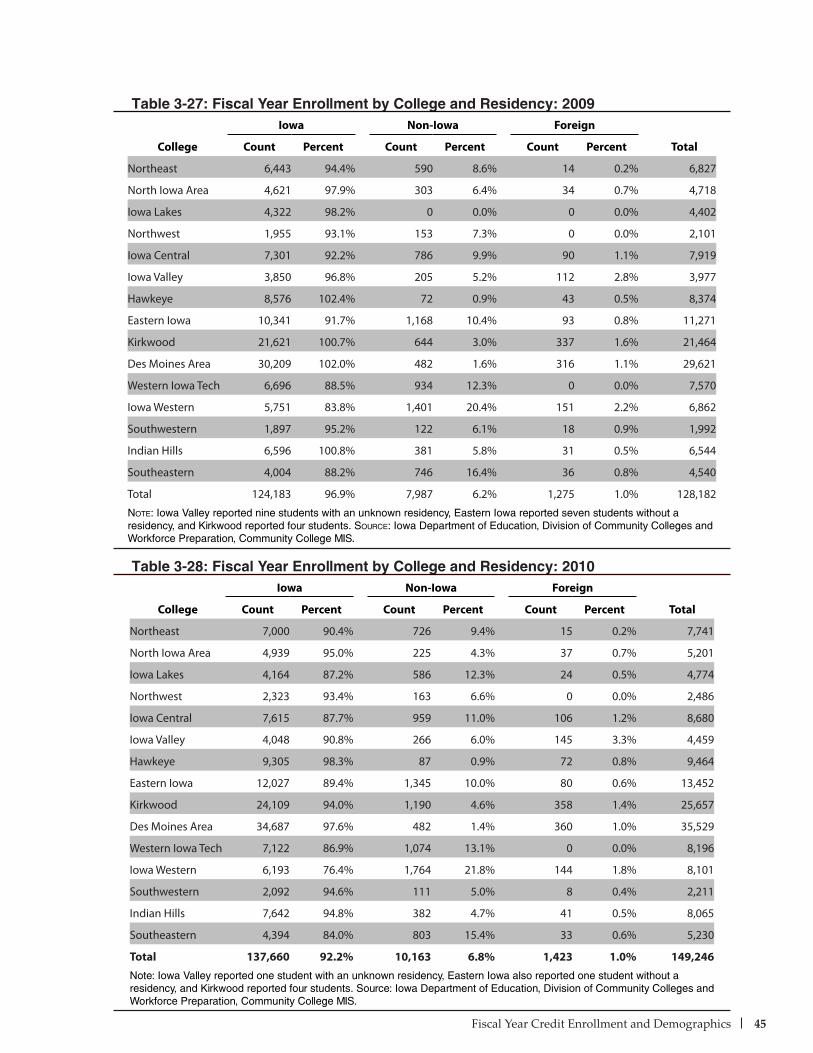
Fiscal Year Credit Enrollment and Demographics 45
Table 3-27: Fiscal Year Enrollment by College and Residency: 2009
Table 3-28: Fiscal Year Enrollment by College and Residency: 2010
Iowa Non-Iowa Foreign
College Count Percent Count Percent Count Percent Total
Northeast 6,443 94.4% 590 8.6% 14 0.2% 6,827
North Iowa Area 4,621 97.9% 303 6.4% 34 0.7% 4,718
Iowa Lakes 4,322 98.2% 0 0.0% 0 0.0% 4,402
Northwest 1,955 93.1% 153 7.3% 0 0.0% 2,101
Iowa Central 7,301 92.2% 786 9.9% 90 1.1% 7,919
Iowa Valley 3,850 96.8% 205 5.2% 112 2.8% 3,977
Hawkeye 8,576 102.4% 72 0.9% 43 0.5% 8,374
Eastern Iowa 10,341 91.7% 1,168 10.4% 93 0.8% 11,271
Kirkwood 21,621 100.7% 644 3.0% 337 1.6% 21,464
Des Moines Area 30,209 102.0% 482 1.6% 316 1.1% 29,621
Western Iowa Tech 6,696 88.5% 934 12.3% 0 0.0% 7,570
Iowa Western 5,751 83.8% 1,401 20.4% 151 2.2% 6,862
Southwestern 1,897 95.2% 122 6.1% 18 0.9% 1,992
Indian Hills 6,596 100.8% 381 5.8% 31 0.5% 6,544
Southeastern 4,004 88.2% 746 16.4% 36 0.8% 4,540
Total 124,183 96.9% 7,987 6.2% 1,275 1.0% 128,182
Note: Iowa Valley reported nine students with an unknown residency, Eastern Iowa reported seven students without a residency, and Kirkwood reported four students. Source: Iowa Department of Education, Division of Community Colleges and Workforce Preparation, Community College MIS.
Iowa Non-Iowa Foreign
College Count Percent Count Percent Count Percent Total
Northeast 7,000 90.4% 726 9.4% 15 0.2% 7,741
North Iowa Area 4,939 95.0% 225 4.3% 37 0.7% 5,201
Iowa Lakes 4,164 87.2% 586 12.3% 24 0.5% 4,774
Northwest 2,323 93.4% 163 6.6% 0 0.0% 2,486
Iowa Central 7,615 87.7% 959 11.0% 106 1.2% 8,680
Iowa Valley 4,048 90.8% 266 6.0% 145 3.3% 4,459
Hawkeye 9,305 98.3% 87 0.9% 72 0.8% 9,464
Eastern Iowa 12,027 89.4% 1,345 10.0% 80 0.6% 13,452
Kirkwood 24,109 94.0% 1,190 4.6% 358 1.4% 25,657
Des Moines Area 34,687 97.6% 482 1.4% 360 1.0% 35,529
Western Iowa Tech 7,122 86.9% 1,074 13.1% 0 0.0% 8,196
Iowa Western 6,193 76.4% 1,764 21.8% 144 1.8% 8,101
Southwestern 2,092 94.6% 111 5.0% 8 0.4% 2,211
Indian Hills 7,642 94.8% 382 4.7% 41 0.5% 8,065
Southeastern 4,394 84.0% 803 15.4% 33 0.6% 5,230
Total 137,660 92.2% 10,163 6.8% 1,423 1.0% 149,246Note: Iowa Valley reported one student with an unknown residency, Eastern Iowa also reported one student without a residency, and Kirkwood reported four students. Source: Iowa Department of Education, Division of Community Colleges and Workforce Preparation, Community College MIS.

46 The Condition of Iowa’s Community Colleges
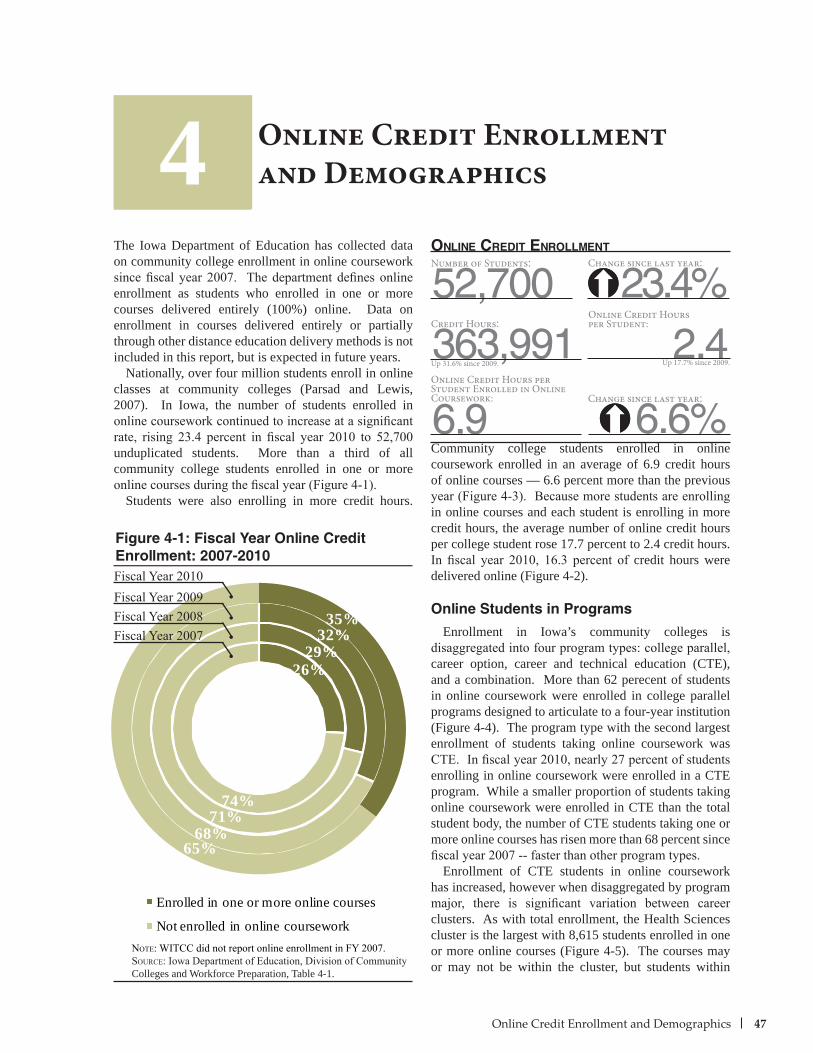
47Online Credit Enrollment and Demographics
Enrolled in one or more online courses
Not enrolled in online coursework
32%29%
26%
68%71%
74%
35%
65%
The Iowa Department of Education has collected data on community college enrollment in online coursework since fiscal year 2007. The department defines online enrollment as students who enrolled in one or more courses delivered entirely (100%) online. Data on enrollment in courses delivered entirely or partially through other distance education delivery methods is not included in this report, but is expected in future years.
Nationally, over four million students enroll in online classes at community colleges (Parsad and Lewis, 2007). In Iowa, the number of students enrolled in online coursework continued to increase at a significant rate, rising 23.4 percent in fiscal year 2010 to 52,700 unduplicated students. More than a third of all community college students enrolled in one or more online courses during the fiscal year (Figure 4-1).
Students were also enrolling in more credit hours.
Community college students enrolled in online coursework enrolled in an average of 6.9 credit hours of online courses — 6.6 percent more than the previous year (Figure 4-3). Because more students are enrolling in online courses and each student is enrolling in more credit hours, the average number of online credit hours per college student rose 17.7 percent to 2.4 credit hours. In fiscal year 2010, 16.3 percent of credit hours were delivered online (Figure 4-2).
Online Students in Programs
Enrollment in Iowa’s community colleges is disaggregated into four program types: college parallel, career option, career and technical education (CTE), and a combination. More than 62 perecent of students in online coursework were enrolled in college parallel programs designed to articulate to a four-year institution (Figure 4-4). The program type with the second largest enrollment of students taking online coursework was CTE. In fiscal year 2010, nearly 27 percent of students enrolling in online coursework were enrolled in a CTE program. While a smaller proportion of students taking online coursework were enrolled in CTE than the total student body, the number of CTE students taking one or more online courses has risen more than 68 percent since fiscal year 2007 -- faster than other program types.
Enrollment of CTE students in online coursework has increased, however when disaggregated by program major, there is significant variation between career clusters. As with total enrollment, the Health Sciences cluster is the largest with 8,615 students enrolled in one or more online courses (Figure 4-5). The courses may or may not be within the cluster, but students within
Online Credit Enrollmentand Demographics
Figure 4-1: Fiscal Year Online Credit Enrollment: 2007-2010
Note: WITCC did not report online enrollment in FY 2007.Source: Iowa Department of Education, Division of Community Colleges and Workforce Preparation, Table 4-1.
Fiscal Year 2008Fiscal Year 2007
363,991
Number of Students:
52,700Change since last year:
23.4%online creDit enrollment
Credit Hours:Online Credit Hoursper Student:
2.4Up 31.6% since 2009. Up 17.7% since 2009.
Online Credit Hours per Student Enrolled in Online Coursework:
6.9Change since last year:
6.6%
Fiscal Year 2009Fiscal Year 2010
4
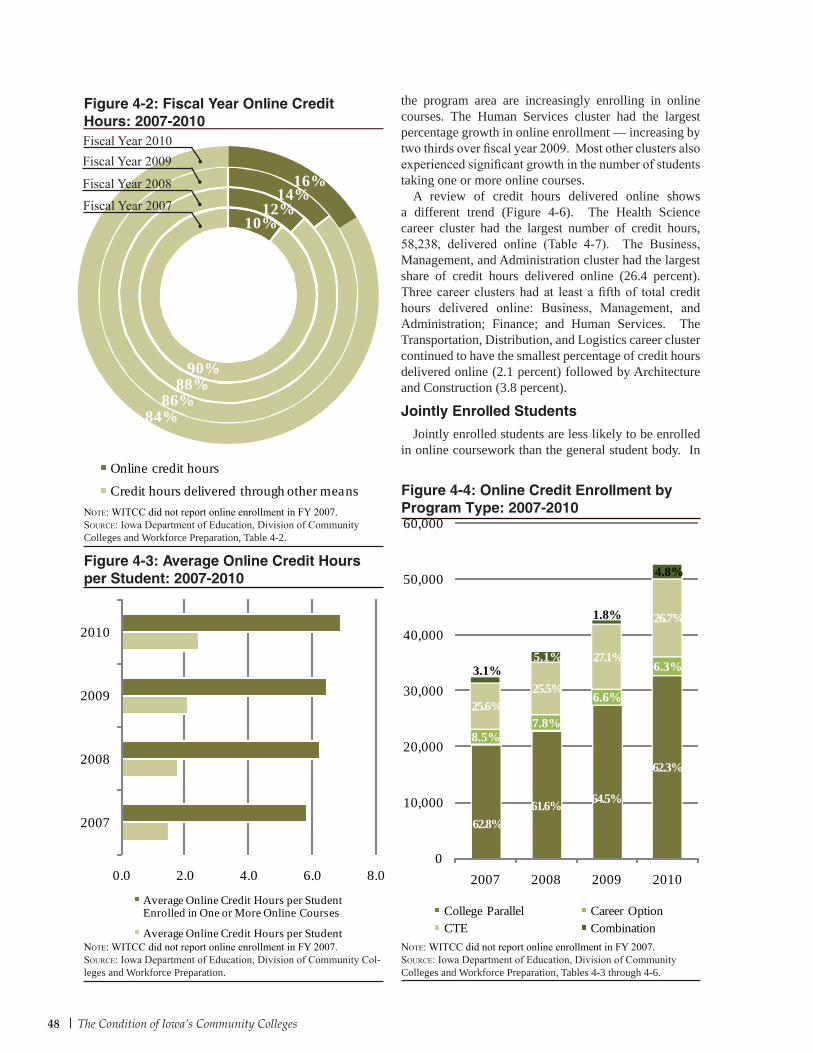
48 The Condition of Iowa’s Community Colleges
Note: WITCC did not report online enrollment in FY 2007.Source: Iowa Department of Education, Division of Community Col-leges and Workforce Preparation.
the program area are increasingly enrolling in online courses. The Human Services cluster had the largest percentage growth in online enrollment — increasing by two thirds over fiscal year 2009. Most other clusters also experienced significant growth in the number of students taking one or more online courses.
A review of credit hours delivered online shows a different trend (Figure 4-6). The Health Science career cluster had the largest number of credit hours, 58,238, delivered online (Table 4-7). The Business, Management, and Administration cluster had the largest share of credit hours delivered online (26.4 percent). Three career clusters had at least a fifth of total credit hours delivered online: Business, Management, and Administration; Finance; and Human Services. The Transportation, Distribution, and Logistics career cluster continued to have the smallest percentage of credit hours delivered online (2.1 percent) followed by Architecture and Construction (3.8 percent).
Jointly Enrolled Students
Jointly enrolled students are less likely to be enrolled in online coursework than the general student body. In
Figure 4-2: Fiscal Year Online Credit Hours: 2007-2010
Note: WITCC did not report online enrollment in FY 2007.Source: Iowa Department of Education, Division of Community Colleges and Workforce Preparation, Table 4-2.
Figure 4-4: Online Credit Enrollment by Program Type: 2007-2010
Note: WITCC did not report online enrollment in FY 2007.Source: Iowa Department of Education, Division of Community Colleges and Workforce Preparation, Tables 4-3 through 4-6.
Figure 4-3: Average Online Credit Hours per Student: 2007-2010
Online credit hours
Credit hours delivered through other means
12%10%
84%
88%
16%
90%
86%
14%Fiscal Year 2008
Fiscal Year 2007
Fiscal Year 2009Fiscal Year 2010
62.8%61.6% 64.5%
62.3%
8.5%7.8%
6.6%
6.3%
25.6%25.5%
27.1%
26.7%
3.1%5.1%
1.8%
4.8%
0
10,000
20,000
30,000
40,000
50,000
60,000
2007 2008 2009 2010
College Parallel Career OptionCTE Combination
0.0 2.0 4.0 6.0 8.0
2007
2008
2009
2010
Average Online Credit Hours per Student Enrolled in One or More Online Courses
Average Online Credit Hours per Student
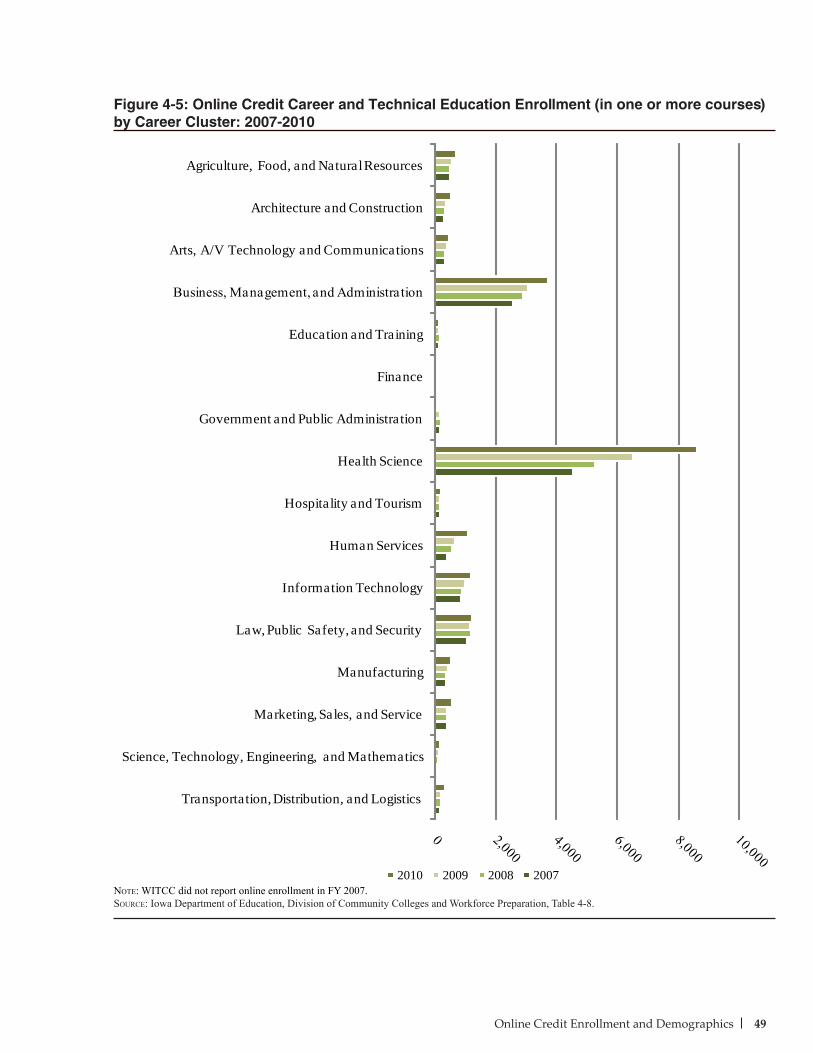
49Online Credit Enrollment and Demographics
Figure 4-5: Online Credit Career and Technical Education Enrollment (in one or more courses) by Career Cluster: 2007-2010
Note: WITCC did not report online enrollment in FY 2007.Source: Iowa Department of Education, Division of Community Colleges and Workforce Preparation, Table 4-8.
Agriculture, Food, and Natural Resources
Architecture and Construction
Arts, A/V Technology and Communications
Business, Management, and Administration
Education and Training
Finance
Government and Public Administration
Health Science
Hospitality and Tourism
Human Services
Information Technology
Law, Public Safety, and Security
Manufacturing
Marketing, Sales, and Service
Science, Technology, Engineering, and Mathematics
Transportation, Distribution, and Logistics
2010 2009 2008 2007
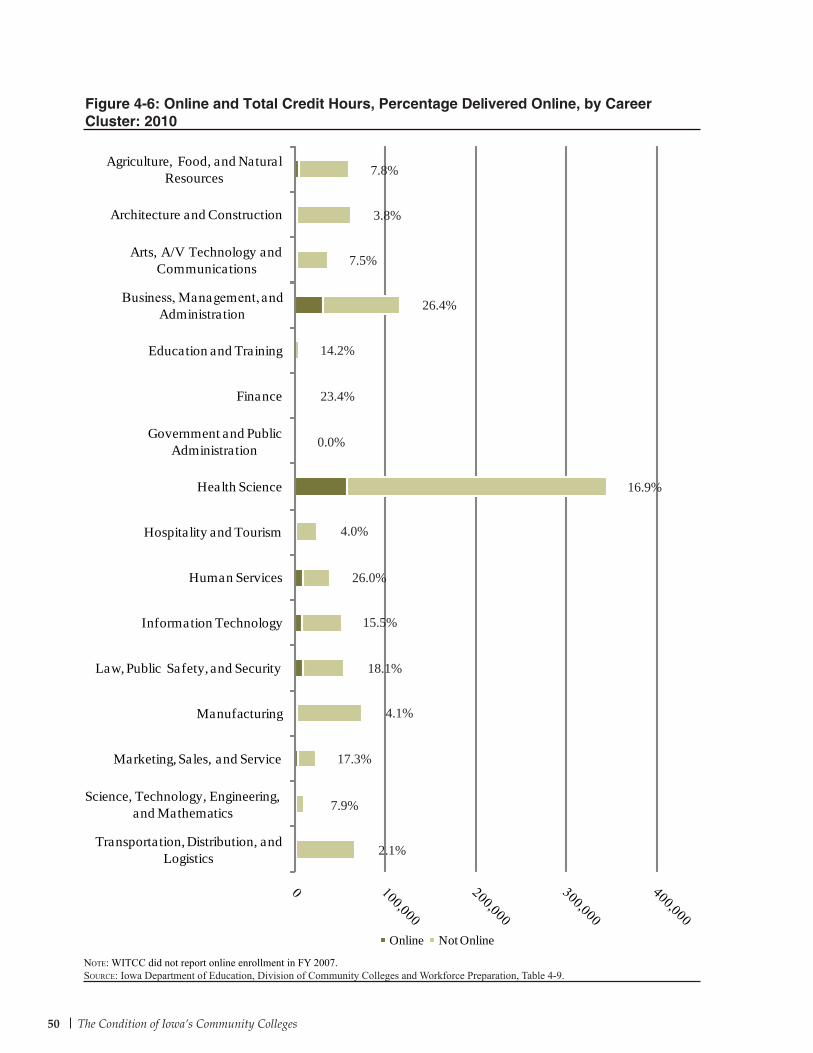
50 The Condition of Iowa’s Community Colleges
Agriculture, Food, and Natural Resources
Architecture and Construction
Arts, A/V Technology and Communications
Business, Management, and Administration
Education and Training
Finance
Government and Public Administration
Health Science
Hospitality and Tourism
Human Services
Information Technology
Law, Public Safety, and Security
Manufacturing
Marketing, Sales, and Service
Science, Technology, Engineering, and Mathematics
Transportation, Distribution, and Logistics
Online Not Online
Note: WITCC did not report online enrollment in FY 2007. Source: Iowa Department of Education, Division of Community Colleges and Workforce Preparation, Table 4-9.
Figure 4-6: Online and Total Credit Hours, Percentage Delivered Online, by Career Cluster: 2010
7.8%
3.8%
7.5%
26.4%
14.2%
23.4%
0.0%
16.9%
4.0%
26.0%
15.5%
18.1%
4.1%
17.3%
7.9%
2.1%
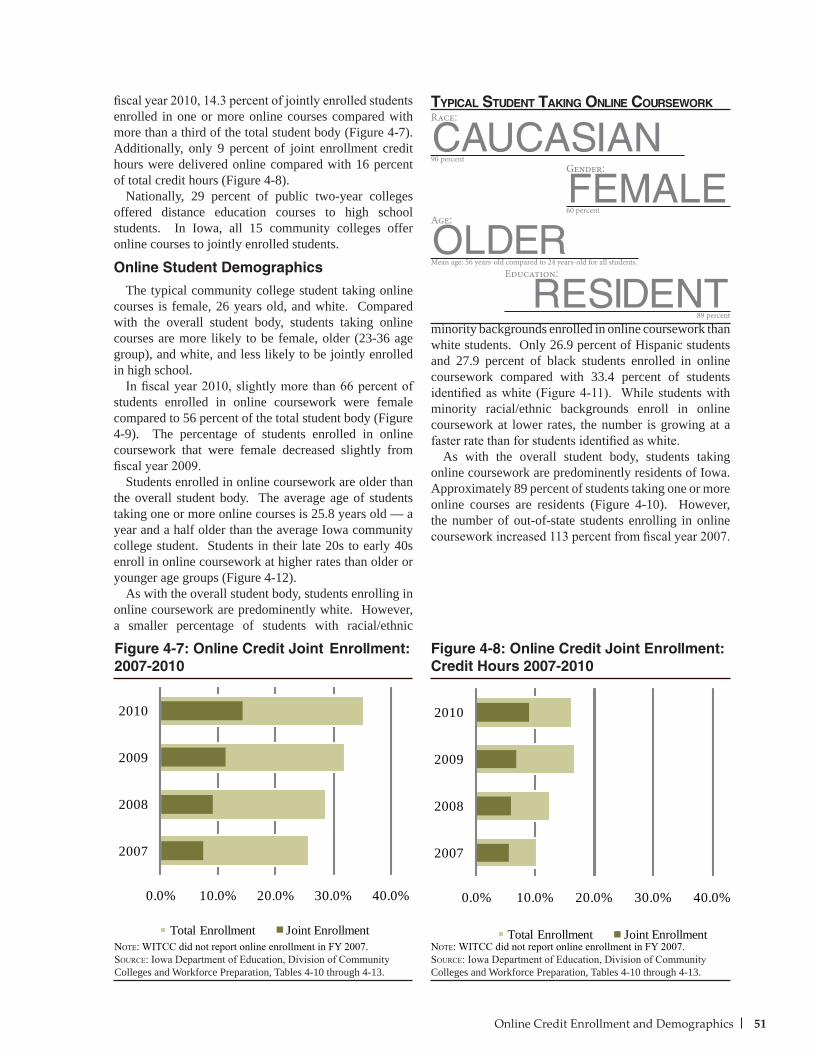
51Online Credit Enrollment and Demographics
fiscal year 2010, 14.3 percent of jointly enrolled students enrolled in one or more online courses compared with more than a third of the total student body (Figure 4-7). Additionally, only 9 percent of joint enrollment credit hours were delivered online compared with 16 percent of total credit hours (Figure 4-8).
Nationally, 29 percent of public two-year colleges offered distance education courses to high school students. In Iowa, all 15 community colleges offer online courses to jointly enrolled students.
Online Student Demographics
The typical community college student taking online courses is female, 26 years old, and white. Compared with the overall student body, students taking online courses are more likely to be female, older (23-36 age group), and white, and less likely to be jointly enrolled in high school.
In fiscal year 2010, slightly more than 66 percent of students enrolled in online coursework were female compared to 56 percent of the total student body (Figure 4-9). The percentage of students enrolled in online coursework that were female decreased slightly from fiscal year 2009.
Students enrolled in online coursework are older than the overall student body. The average age of students taking one or more online courses is 25.8 years old — a year and a half older than the average Iowa community college student. Students in their late 20s to early 40s enroll in online coursework at higher rates than older or younger age groups (Figure 4-12).
As with the overall student body, students enrolling in online coursework are predominently white. However, a smaller percentage of students with racial/ethnic
tYPical stuDent taking online coursework
minority backgrounds enrolled in online coursework than white students. Only 26.9 percent of Hispanic students and 27.9 percent of black students enrolled in online coursework compared with 33.4 percent of students identified as white (Figure 4-11). While students with minority racial/ethnic backgrounds enroll in online coursework at lower rates, the number is growing at a faster rate than for students identified as white.
As with the overall student body, students taking online coursework are predominently residents of Iowa. Approximately 89 percent of students taking one or more online courses are residents (Figure 4-10). However, the number of out-of-state students enrolling in online coursework increased 113 percent from fiscal year 2007.
Figure 4-7: Online Credit Joint Enrollment: 2007-2010
Note: WITCC did not report online enrollment in FY 2007.Source: Iowa Department of Education, Division of Community Colleges and Workforce Preparation, Tables 4-10 through 4-13.
Figure 4-8: Online Credit Joint Enrollment: Credit Hours 2007-2010
Note: WITCC did not report online enrollment in FY 2007.Source: Iowa Department of Education, Division of Community Colleges and Workforce Preparation, Tables 4-10 through 4-13.
0.0% 10.0% 20.0% 30.0% 40.0%
2007
2008
2009
2010
Total Enrollment Joint Enrollment
0.0% 10.0% 20.0% 30.0% 40.0%
2007
2008
2009
2010
Total Enrollment Joint Enrollment
Race:
CAUCASIAN90 percent
Gender:
FEMALE60 percent
Age:
OLDERMean age: 56 years-old compared to 24 years-old for all students.
Education:
RESIDENT89 percent
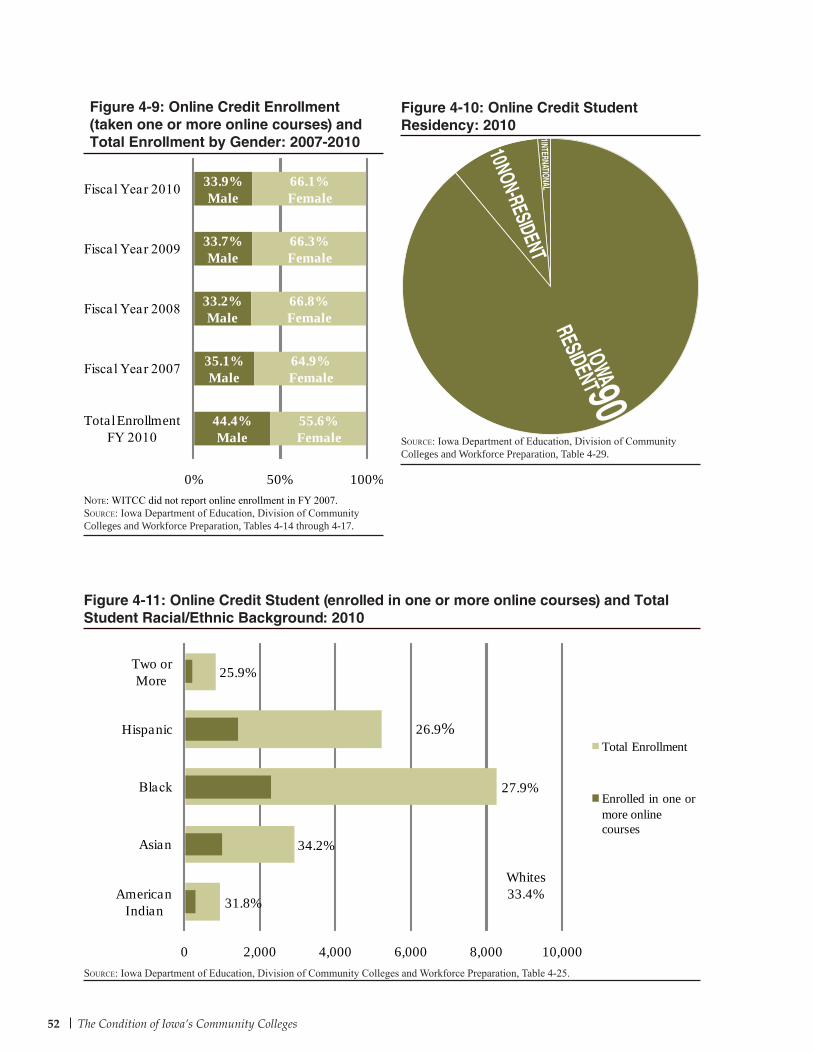
52 The Condition of Iowa’s Community Colleges
0 2,000 4,000 6,000 8,000 10,000
American Indian
Asian
Black
Hispanic
Two or More
Total Enrollment
Enrolled in one or more online courses
26.9%
27.9%
34.2%
31.8%
Whites 33.4%
25.9%
Figure 4-9: Online Credit Enrollment (taken one or more online courses) and Total Enrollment by Gender: 2007-2010
Note: WITCC did not report online enrollment in FY 2007.Source: Iowa Department of Education, Division of Community Colleges and Workforce Preparation, Tables 4-14 through 4-17.
Figure 4-11: Online Credit Student (enrolled in one or more online courses) and Total Student Racial/Ethnic Background: 2010
Source: Iowa Department of Education, Division of Community Colleges and Workforce Preparation, Table 4-25.
Figure 4-10: Online Credit Student Residency: 2010
Source: Iowa Department of Education, Division of Community Colleges and Workforce Preparation, Table 4-29.
44.4% Male
35.1% Male
33.2% Male
33.7% Male
33.9% Male
55.6% Female
64.9% Female
66.8% Female
66.3% Female
66.1% Female
0% 50% 100%
Total Enrollment FY 2010
Fiscal Year 2007
Fiscal Year 2008
Fiscal Year 2009
Fiscal Year 2010
IOWA
RESIDENT90
NON-RESIDENT
10
INTERNATIONAL1
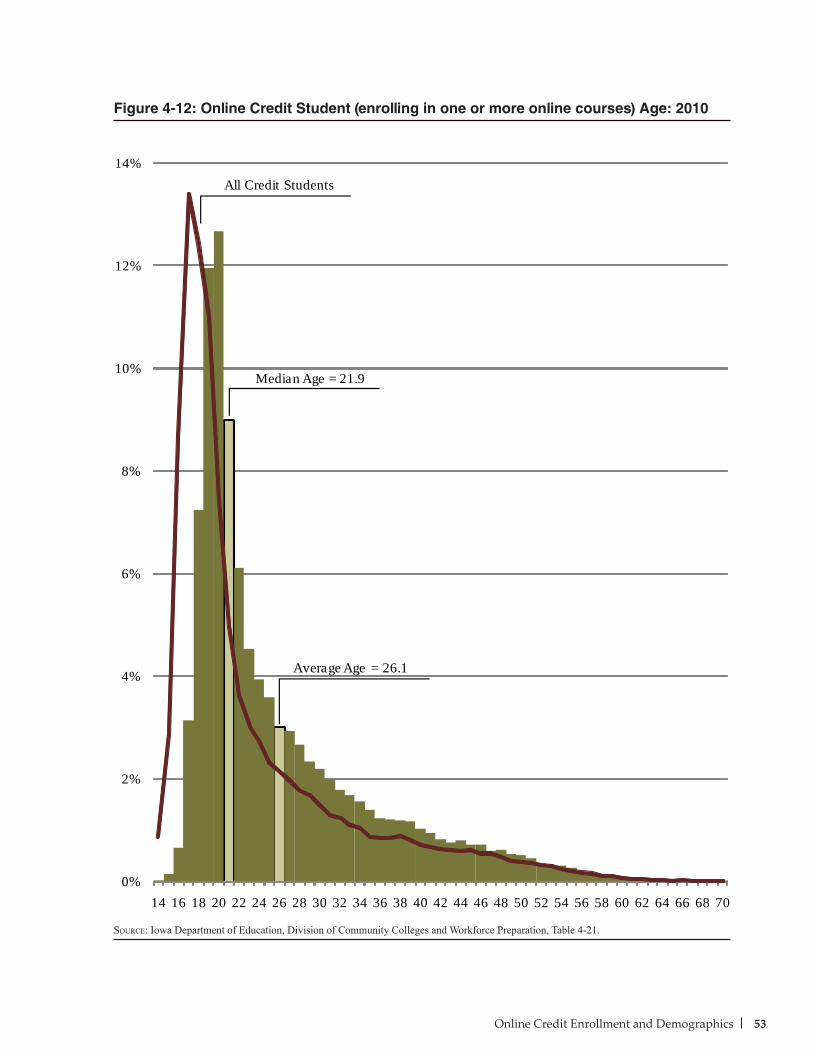
53Online Credit Enrollment and Demographics
0%
2%
4%
6%
8%
10%
12%
14%
16%
14 16 18 20 22 24 26 28 30 32 34 36 38 40 42 44 46 48 50 52 54 56 58 60 62 64 66 68 70
Median Age = 21.9
Average Age = 26.1
All Credit Students
Figure 4-12: Online Credit Student (enrolling in one or more online courses) Age: 2010
Source: Iowa Department of Education, Division of Community Colleges and Workforce Preparation, Table 4-21.
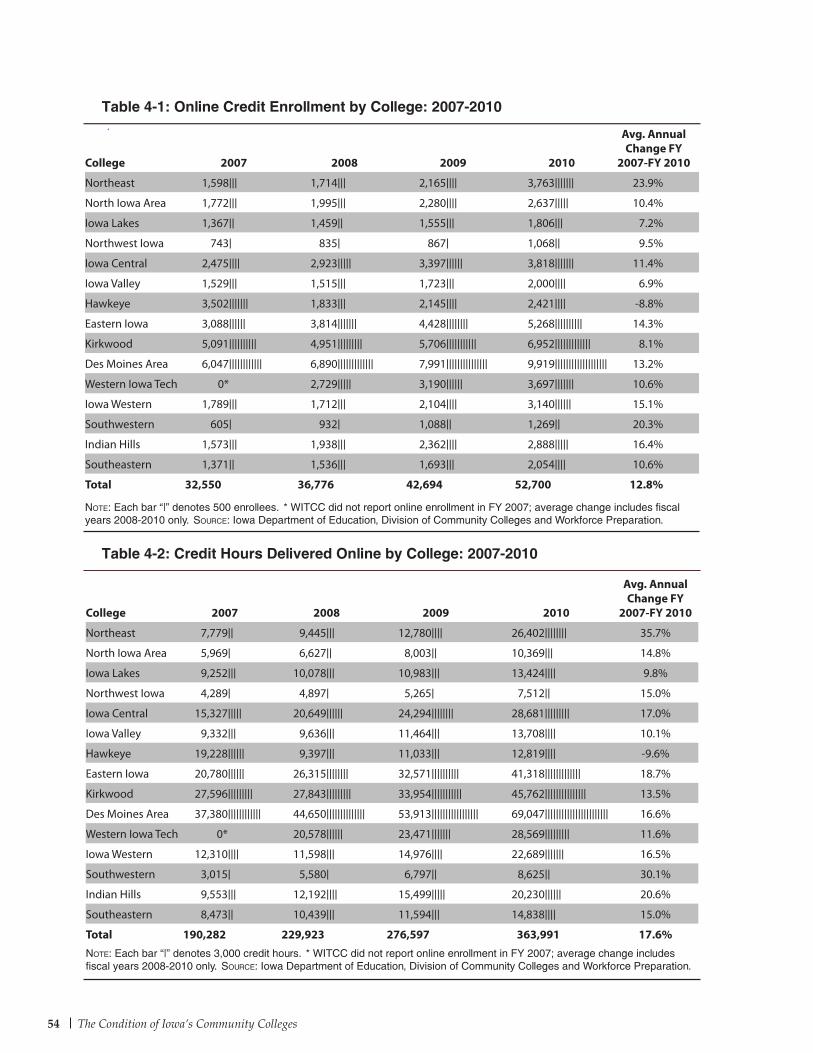
54 The Condition of Iowa’s Community Colleges
Avg. Annual Change FY
2007-FY 2010College 2007 2008 2009 2010
Northeast 1,598 ||| 1,714||| 2,165|||| 3,763||||||| 23.9%
North Iowa Area 1,772 ||| 1,995||| 2,280|||| 2,637||||| 10.4%
Iowa Lakes 1,367 || 1,459|| 1,555||| 1,806||| 7.2%
Northwest Iowa 743 | 835| 867| 1,068|| 9.5%
Iowa Central 2,475 |||| 2,923||||| 3,397|||||| 3,818||||||| 11.4%
Iowa Valley 1,529 ||| 1,515||| 1,723||| 2,000|||| 6.9%
Hawkeye 3,502 ||||||| 1,833||| 2,145|||| 2,421|||| -8.8%
Eastern Iowa 3,088 |||||| 3,814||||||| 4,428|||||||| 5,268|||||||||| 14.3%
Kirkwood 5,091 |||||||||| 4,951||||||||| 5,706||||||||||| 6,952||||||||||||| 8.1%
Des Moines Area 6,047 |||||||||||| 6,890||||||||||||| 7,991||||||||||||||| 9,919||||||||||||||||||| 13.2%
Western Iowa Tech 0* 2,729||||| 3,190|||||| 3,697||||||| 10.6%
Iowa Western 1,789 ||| 1,712||| 2,104|||| 3,140|||||| 15.1%
Southwestern 605 | 932| 1,088|| 1,269|| 20.3%
Indian Hills 1,573 ||| 1,938||| 2,362|||| 2,888||||| 16.4%
Southeastern 1,371 || 1,536||| 1,693||| 2,054|||| 10.6%
Total 32,550 36,776 42,694 52,700 12.8%
Note: Each bar “|” denotes 500 enrollees. * WITCC did not report online enrollment in FY 2007; average change includes fiscal years 2008-2010 only. Source: Iowa Department of Education, Division of Community Colleges and Workforce Preparation.
Table 4-1: Online Credit Enrollment by College: 2007-2010
Table 4-2: Credit Hours Delivered Online by College: 2007-2010
Avg. Annual Change FY
2007-FY 2010College 2007 2008 2009 2010
Northeast 7,779 || 9,445||| 12,780|||| 26,402|||||||| 35.7%
North Iowa Area 5,969 | 6,627|| 8,003|| 10,369||| 14.8%
Iowa Lakes 9,252 ||| 10,078||| 10,983||| 13,424|||| 9.8%
Northwest Iowa 4,289 | 4,897| 5,265| 7,512|| 15.0%
Iowa Central 15,327 ||||| 20,649|||||| 24,294|||||||| 28,681||||||||| 17.0%
Iowa Valley 9,332 ||| 9,636||| 11,464||| 13,708|||| 10.1%
Hawkeye 19,228 |||||| 9,397||| 11,033||| 12,819|||| -9.6%
Eastern Iowa 20,780 |||||| 26,315|||||||| 32,571|||||||||| 41,318||||||||||||| 18.7%
Kirkwood 27,596 ||||||||| 27,843||||||||| 33,954||||||||||| 45,762||||||||||||||| 13.5%
Des Moines Area 37,380 |||||||||||| 44,650|||||||||||||| 53,913||||||||||||||||| 69,047||||||||||||||||||||||| 16.6%
Western Iowa Tech 0* 20,578|||||| 23,471||||||| 28,569||||||||| 11.6%
Iowa Western 12,310 |||| 11,598||| 14,976|||| 22,689||||||| 16.5%
Southwestern 3,015 | 5,580| 6,797|| 8,625|| 30.1%
Indian Hills 9,553 ||| 12,192|||| 15,499||||| 20,230|||||| 20.6%
Southeastern 8,473 || 10,439||| 11,594||| 14,838|||| 15.0%
Total 190,282 229,923 276,597 363,991 17.6%Note: Each bar “|” denotes 3,000 credit hours. * WITCC did not report online enrollment in FY 2007; average change includes fiscal years 2008-2010 only. Source: Iowa Department of Education, Division of Community Colleges and Workforce Preparation.
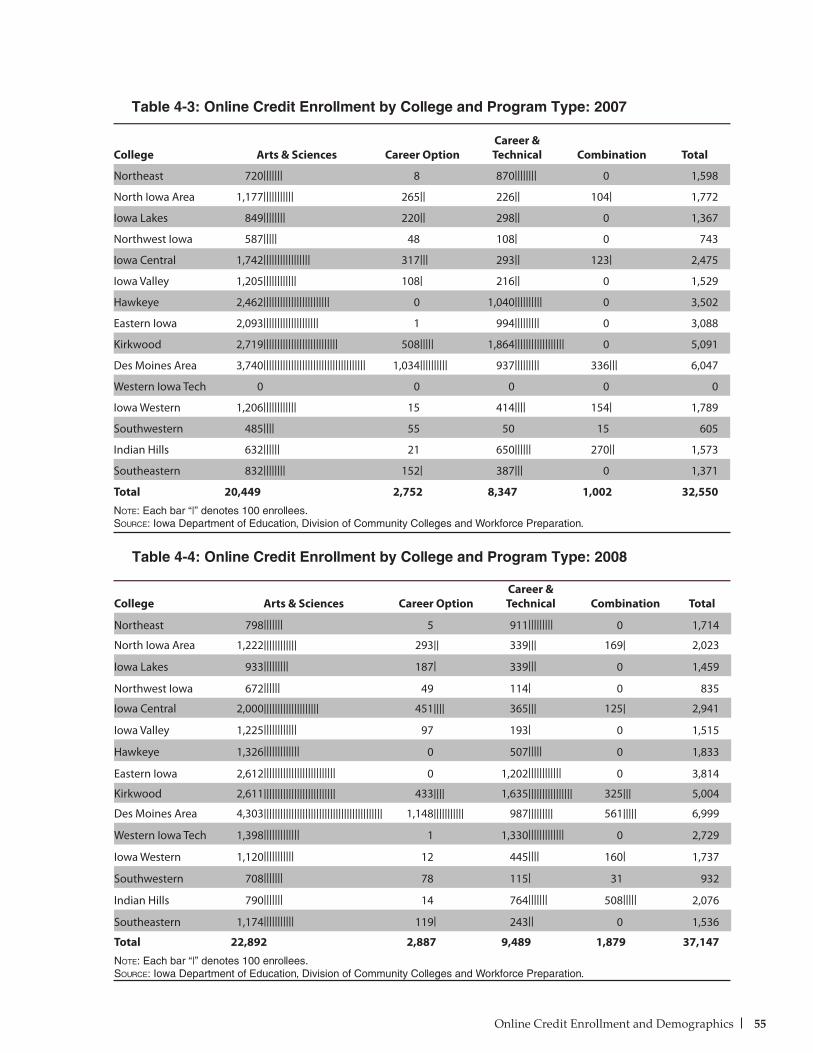
55Online Credit Enrollment and Demographics
College Arts & Sciences Career OptionCareer & Technical Combination Total
Northeast 798||||||| 5 911||||||||| 0 1,714
North Iowa Area 1,222|||||||||||| 293|| 339||| 169| 2,023
Iowa Lakes 933||||||||| 187| 339||| 0 1,459
Northwest Iowa 672|||||| 49 114| 0 835
Iowa Central 2,000|||||||||||||||||||| 451|||| 365||| 125| 2,941
Iowa Valley 1,225|||||||||||| 97 193| 0 1,515
Hawkeye 1,326||||||||||||| 0 507||||| 0 1,833
Eastern Iowa 2,612|||||||||||||||||||||||||| 0 1,202|||||||||||| 0 3,814
Kirkwood 2,611|||||||||||||||||||||||||| 433|||| 1,635|||||||||||||||| 325||| 5,004
Des Moines Area 4,303||||||||||||||||||||||||||||||||||||||||||| 1,148||||||||||| 987||||||||| 561||||| 6,999
Western Iowa Tech 1,398||||||||||||| 1 1,330||||||||||||| 0 2,729
Iowa Western 1,120||||||||||| 12 445|||| 160| 1,737
Southwestern 708||||||| 78 115| 31 932
Indian Hills 790||||||| 14 764||||||| 508||||| 2,076
Southeastern 1,174||||||||||| 119| 243|| 0 1,536
Total 22,892 2,887 9,489 1,879 37,147Note: Each bar “|” denotes 100 enrollees. Source: Iowa Department of Education, Division of Community Colleges and Workforce Preparation.
College Arts & Sciences Career OptionCareer & Technical Combination Total
Northeast 720||||||| 8 870|||||||| 0 1,598
North Iowa Area 1,177||||||||||| 265|| 226|| 104| 1,772
Iowa Lakes 849|||||||| 220|| 298|| 0 1,367
Northwest Iowa 587||||| 48 108| 0 743
Iowa Central 1,742||||||||||||||||| 317||| 293|| 123| 2,475
Iowa Valley 1,205|||||||||||| 108| 216|| 0 1,529
Hawkeye 2,462|||||||||||||||||||||||| 0 1,040|||||||||| 0 3,502
Eastern Iowa 2,093|||||||||||||||||||| 1 994||||||||| 0 3,088
Kirkwood 2,719||||||||||||||||||||||||||| 508||||| 1,864|||||||||||||||||| 0 5,091
Des Moines Area 3,740||||||||||||||||||||||||||||||||||||| 1,034|||||||||| 937||||||||| 336||| 6,047
Western Iowa Tech 0 0 0 0 0
Iowa Western 1,206|||||||||||| 15 414|||| 154| 1,789
Southwestern 485|||| 55 50 15 605
Indian Hills 632|||||| 21 650|||||| 270|| 1,573
Southeastern 832|||||||| 152| 387||| 0 1,371
Total 20,449 2,752 8,347 1,002 32,550Note: Each bar “|” denotes 100 enrollees. Source: Iowa Department of Education, Division of Community Colleges and Workforce Preparation.
Table 4-3: Online Credit Enrollment by College and Program Type: 2007
Table 4-4: Online Credit Enrollment by College and Program Type: 2008
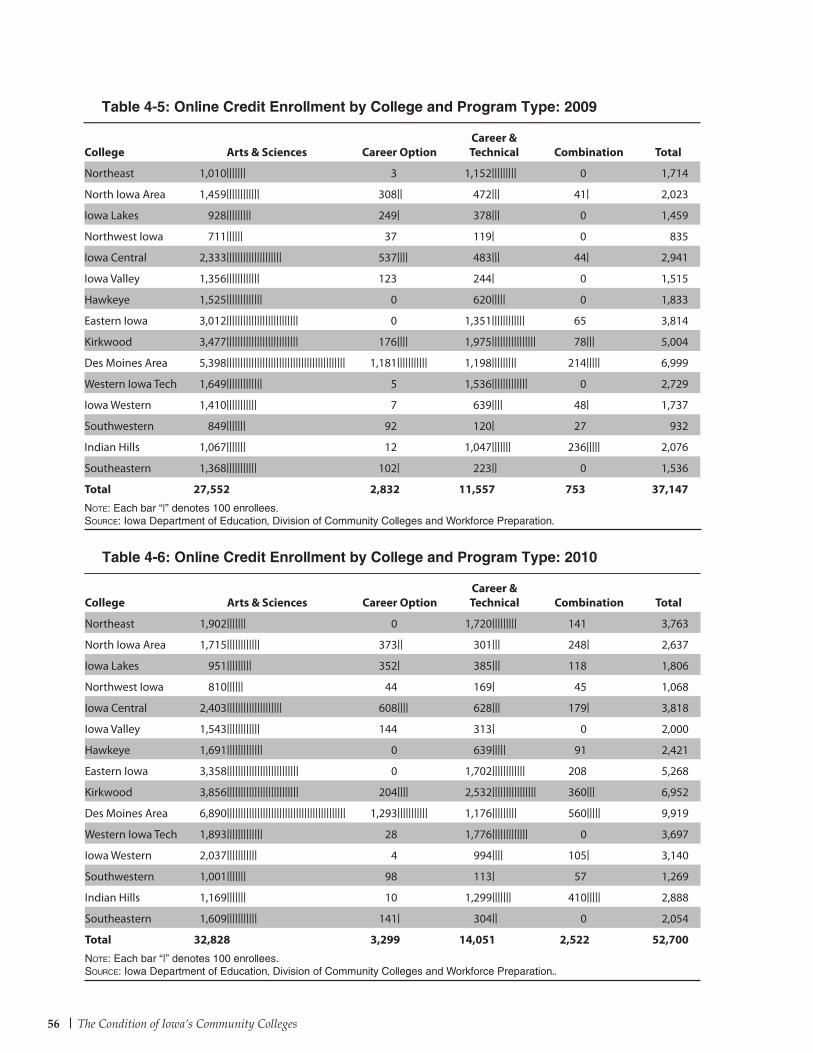
56 The Condition of Iowa’s Community Colleges
College Arts & Sciences Career OptionCareer & Technical Combination Total
Northeast 1,010||||||| 3 1,152||||||||| 0 1,714
North Iowa Area 1,459|||||||||||| 308|| 472||| 41| 2,023
Iowa Lakes 928||||||||| 249| 378||| 0 1,459
Northwest Iowa 711|||||| 37 119| 0 835
Iowa Central 2,333|||||||||||||||||||| 537|||| 483||| 44| 2,941
Iowa Valley 1,356|||||||||||| 123 244| 0 1,515
Hawkeye 1,525||||||||||||| 0 620||||| 0 1,833
Eastern Iowa 3,012|||||||||||||||||||||||||| 0 1,351|||||||||||| 65 3,814
Kirkwood 3,477|||||||||||||||||||||||||| 176|||| 1,975|||||||||||||||| 78||| 5,004
Des Moines Area 5,398||||||||||||||||||||||||||||||||||||||||||| 1,181||||||||||| 1,198||||||||| 214||||| 6,999
Western Iowa Tech 1,649||||||||||||| 5 1,536||||||||||||| 0 2,729
Iowa Western 1,410||||||||||| 7 639|||| 48| 1,737
Southwestern 849||||||| 92 120| 27 932
Indian Hills 1,067||||||| 12 1,047||||||| 236||||| 2,076
Southeastern 1,368||||||||||| 102| 223|| 0 1,536
Total 27,552 2,832 11,557 753 37,147Note: Each bar “|” denotes 100 enrollees. Source: Iowa Department of Education, Division of Community Colleges and Workforce Preparation.
Table 4-5: Online Credit Enrollment by College and Program Type: 2009
Table 4-6: Online Credit Enrollment by College and Program Type: 2010
College Arts & Sciences Career OptionCareer & Technical Combination Total
Northeast 1,902||||||| 0 1,720||||||||| 141 3,763
North Iowa Area 1,715|||||||||||| 373|| 301||| 248| 2,637
Iowa Lakes 951||||||||| 352| 385||| 118 1,806
Northwest Iowa 810|||||| 44 169| 45 1,068
Iowa Central 2,403|||||||||||||||||||| 608|||| 628||| 179| 3,818
Iowa Valley 1,543|||||||||||| 144 313| 0 2,000
Hawkeye 1,691||||||||||||| 0 639||||| 91 2,421
Eastern Iowa 3,358|||||||||||||||||||||||||| 0 1,702|||||||||||| 208 5,268
Kirkwood 3,856|||||||||||||||||||||||||| 204|||| 2,532|||||||||||||||| 360||| 6,952
Des Moines Area 6,890||||||||||||||||||||||||||||||||||||||||||| 1,293||||||||||| 1,176||||||||| 560||||| 9,919
Western Iowa Tech 1,893||||||||||||| 28 1,776||||||||||||| 0 3,697
Iowa Western 2,037||||||||||| 4 994|||| 105| 3,140
Southwestern 1,001||||||| 98 113| 57 1,269
Indian Hills 1,169||||||| 10 1,299||||||| 410||||| 2,888
Southeastern 1,609||||||||||| 141| 304|| 0 2,054
Total 32,828 3,299 14,051 2,522 52,700Note: Each bar “|” denotes 100 enrollees. Source: Iowa Department of Education, Division of Community Colleges and Workforce Preparation..

57Online Credit Enrollment and Demographics
College Arts & Sciences Career Option Career & Technical Combination Total
Northeast 46.6% 0.3% 53.2% 0.0% 100.0%
North Iowa Area 60.4% 14.5% 16.8% 8.4% 100.0%
Iowa Lakes 63.9% 12.8% 23.2% 0.0% 100.0%
Northwest Iowa 80.5% 5.9% 13.7% 0.0% 100.0%
Iowa Central 68.0% 15.3% 12.4% 4.3% 100.0%
Iowa Valley 80.9% 6.4% 12.7% 0.0% 100.0%
Hawkeye 72.3% 0.0% 27.7% 0.0% 100.0%
Eastern Iowa 68.5% 0.0% 31.5% 0.0% 100.0%
Kirkwood 52.2% 8.7% 32.7% 6.5% 100.0%
Des Moines Area 61.5% 16.4% 14.1% 8.0% 100.0%
Western Iowa Tech 51.2% 0.0% 48.7% 0.0% 100.0%
Iowa Western 64.5% 0.7% 25.6% 9.2% 100.0%
Southwestern 76.0% 8.4% 12.3% 3.3% 100.0%
Indian Hills 38.1% 0.7% 36.8% 24.5% 100.0%
Southeastern 76.4% 7.7% 15.8% 0.0% 100.0%
Source: Iowa Department of Education, Division of Community Colleges and Workforce Preparation.
Table 4-7: Online Credit Enrollment by College and Program Type (Proportion): 2010
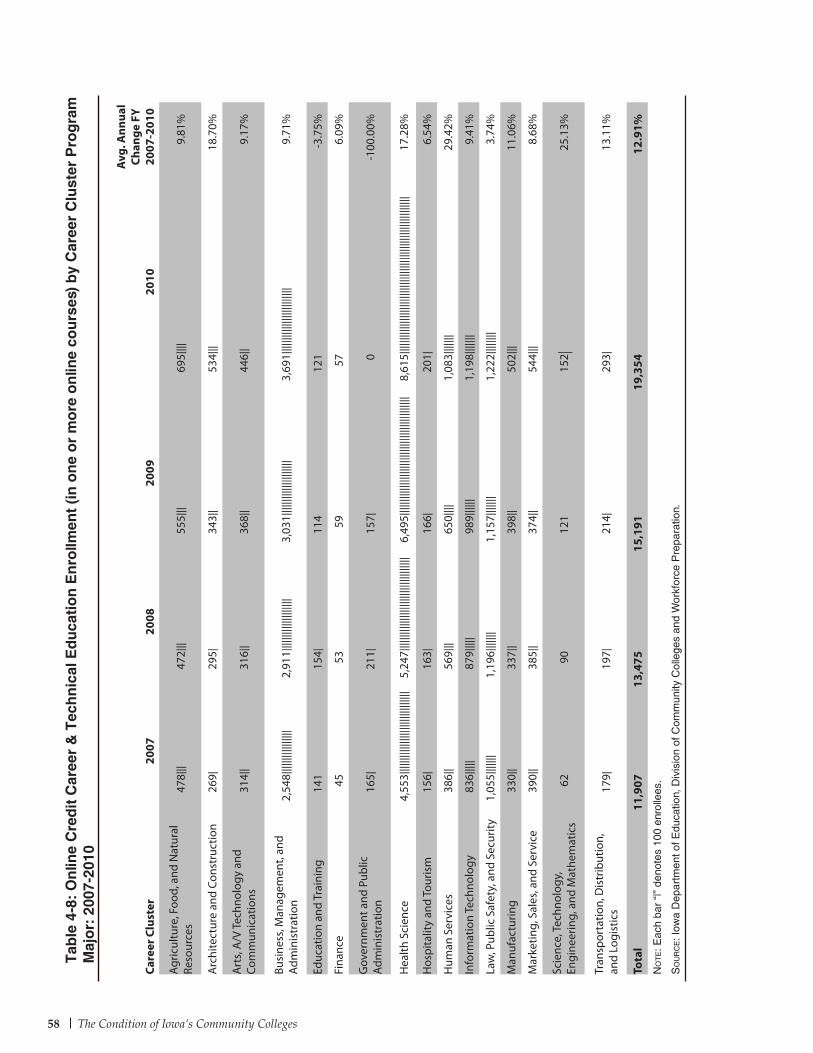
58 The Condition of Iowa’s Community Colleges
Care
er C
lust
er20
0720
0820
0920
10
Avg
. Ann
ual
Chan
ge F
Y 20
07-2
010
Agric
ultu
re, F
ood,
and
Nat
ural
Re
sour
ces
478|
||47
2|||
555|
||69
5||||
9.81
%
Arc
hite
ctur
e an
d Co
nstr
uctio
n26
9|29
5|34
3||
534|
||18
.70%
Art
s, A
/V Te
chno
logy
and
Co
mm
unic
atio
ns31
4||
316|
|36
8||
446|
|9.
17%
Busi
ness
, Man
agem
ent,
and
Adm
inis
trat
ion
2,54
8||||
||||||
||||||
2,91
1||||
||||||
||||||
|||3,
031|
||||||
||||||
||||||
|3,
691|
||||||
||||||
||||||
|||||
9.71
%
Educ
atio
n an
d Tr
aini
ng14
115
4|11
412
1-3
.75%
Fina
nce
4553
5957
6.09
%
Gov
ernm
ent a
nd P
ublic
Ad
min
istr
atio
n16
5|21
1|15
7|0
-100
.00%
Hea
lth S
cien
ce4,
553|
||||||
||||||
||||||
||||||
|||||
5,24
7||||
||||||
||||||
||||||
||||||
||||||
6,49
5||||
||||||
||||||
||||||
||||||
||||||
||||||
|||8,
615|
||||||
||||||
||||||
||||||
||||||
||||||
||||||
||||||
||||||
||17
.28%
Hos
pita
lity
and
Tour
ism
156|
163|
166|
201|
6.54
%
Hum
an S
ervi
ces
386|
|56
9|||
650|
|||1,
083|
||||||
29.4
2%
Info
rmat
ion
Tech
nolo
gy83
6||||
|87
9||||
|98
9||||
||1,
198|
||||||
9.41
%
Law
, Pub
lic S
afet
y, a
nd S
ecur
ity1,
055|
||||||
1,19
6||||
|||1,
157|
||||||
1,22
2||||
||||
3.74
%
Man
ufac
turin
g33
0||
337|
|39
8||
502|
||11
.06%
Mar
ketin
g, S
ales
, and
Ser
vice
390|
|38
5||
374|
|54
4|||
8.68
%
Scie
nce,
Tech
nolo
gy,
Engi
neer
ing,
and
Mat
hem
atic
s62
9012
115
2 |25
.13%
Tran
spor
tatio
n, D
istr
ibut
ion,
an
d Lo
gist
ics
179|
197|
214|
293|
13.1
1%
Tota
l11
,907
13,4
7515
,191
19,3
5412
.91%
No
te: E
ach
bar
“|”
deno
tes
100
enro
llees
.
So
ur
ce: I
owa
Dep
artm
ent o
f Edu
catio
n, D
ivis
ion
of C
omm
unity
Col
lege
s an
d W
orkf
orce
Pre
para
tion.
Tab
le 4
-8:
On
line
Cre
dit
Car
eer
& T
ech
nic
al E
du
cati
on
En
rollm
ent
(in
on
e o
r m
ore
on
line
cou
rses
) b
y C
aree
r C
lust
er P
rog
ram
M
ajo
r: 2
007-
2010
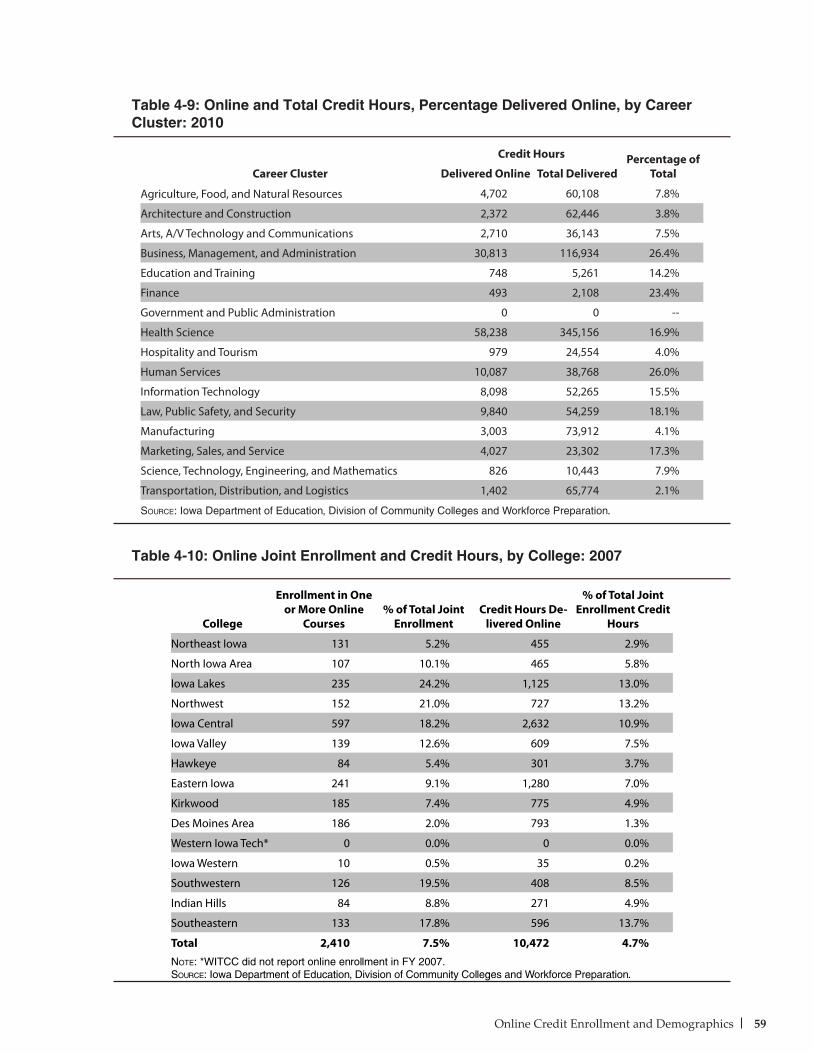
59Online Credit Enrollment and Demographics
Table 4-9: Online and Total Credit Hours, Percentage Delivered Online, by Career Cluster: 2010
Table 4-10: Online Joint Enrollment and Credit Hours, by College: 2007
College
Enrollment in One or More Online
Courses% of Total Joint
EnrollmentCredit Hours De-
livered Online
% of Total Joint Enrollment Credit
Hours
Northeast Iowa 131 5.2% 455 2.9%
North Iowa Area 107 10.1% 465 5.8%
Iowa Lakes 235 24.2% 1,125 13.0%
Northwest 152 21.0% 727 13.2%
Iowa Central 597 18.2% 2,632 10.9%
Iowa Valley 139 12.6% 609 7.5%
Hawkeye 84 5.4% 301 3.7%
Eastern Iowa 241 9.1% 1,280 7.0%
Kirkwood 185 7.4% 775 4.9%
Des Moines Area 186 2.0% 793 1.3%
Western Iowa Tech* 0 0.0% 0 0.0%
Iowa Western 10 0.5% 35 0.2%
Southwestern 126 19.5% 408 8.5%
Indian Hills 84 8.8% 271 4.9%
Southeastern 133 17.8% 596 13.7%
Total 2,410 7.5% 10,472 4.7%Note: *WITCC did not report online enrollment in FY 2007. Source: Iowa Department of Education, Division of Community Colleges and Workforce Preparation.
Career Cluster
Credit Hours Percentage of TotalDelivered Online Total Delivered
Agriculture, Food, and Natural Resources 4,702 60,108 7.8%
Architecture and Construction 2,372 62,446 3.8%
Arts, A/V Technology and Communications 2,710 36,143 7.5%
Business, Management, and Administration 30,813 116,934 26.4%
Education and Training 748 5,261 14.2%
Finance 493 2,108 23.4%
Government and Public Administration 0 0 --
Health Science 58,238 345,156 16.9%
Hospitality and Tourism 979 24,554 4.0%
Human Services 10,087 38,768 26.0%
Information Technology 8,098 52,265 15.5%
Law, Public Safety, and Security 9,840 54,259 18.1%
Manufacturing 3,003 73,912 4.1%
Marketing, Sales, and Service 4,027 23,302 17.3%
Science, Technology, Engineering, and Mathematics 826 10,443 7.9%
Transportation, Distribution, and Logistics 1,402 65,774 2.1%
Source: Iowa Department of Education, Division of Community Colleges and Workforce Preparation.
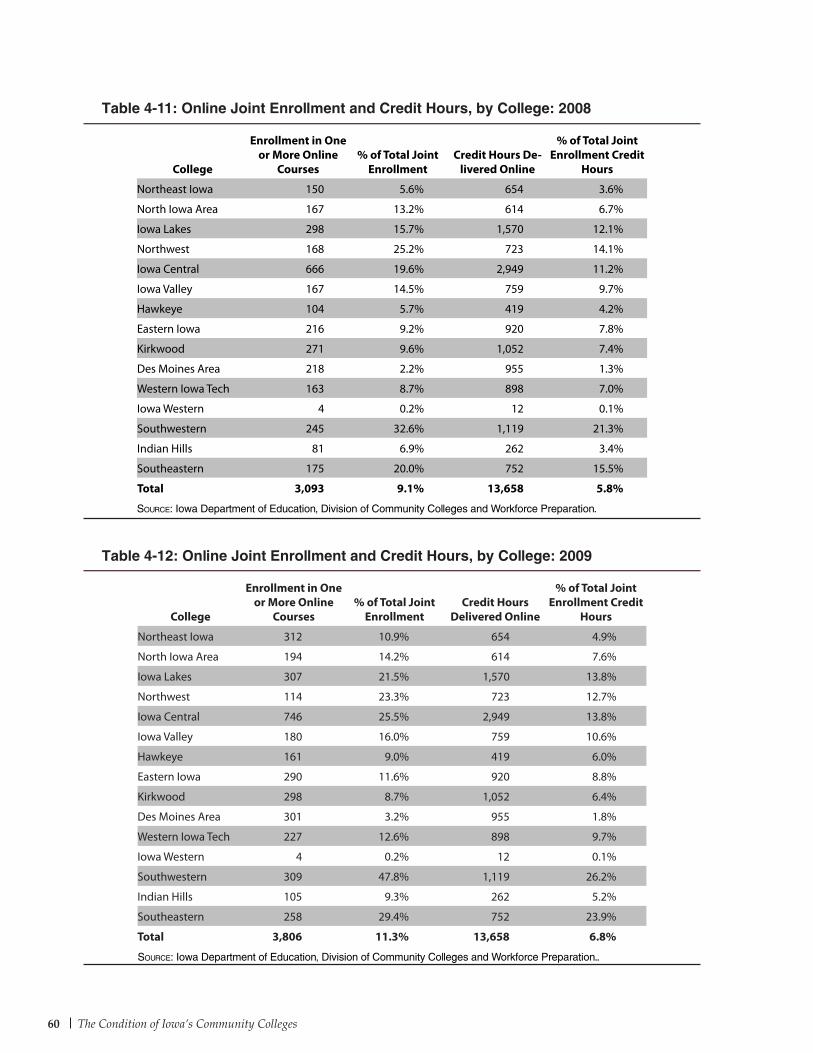
60 The Condition of Iowa’s Community Colleges
College
Enrollment in One or More Online
Courses% of Total Joint
EnrollmentCredit Hours
Delivered Online
% of Total Joint Enrollment Credit
Hours
Northeast Iowa 312 10.9% 654 4.9%
North Iowa Area 194 14.2% 614 7.6%
Iowa Lakes 307 21.5% 1,570 13.8%
Northwest 114 23.3% 723 12.7%
Iowa Central 746 25.5% 2,949 13.8%
Iowa Valley 180 16.0% 759 10.6%
Hawkeye 161 9.0% 419 6.0%
Eastern Iowa 290 11.6% 920 8.8%
Kirkwood 298 8.7% 1,052 6.4%
Des Moines Area 301 3.2% 955 1.8%
Western Iowa Tech 227 12.6% 898 9.7%
Iowa Western 4 0.2% 12 0.1%
Southwestern 309 47.8% 1,119 26.2%
Indian Hills 105 9.3% 262 5.2%
Southeastern 258 29.4% 752 23.9%
Total 3,806 11.3% 13,658 6.8%
Source: Iowa Department of Education, Division of Community Colleges and Workforce Preparation..
Table 4-11: Online Joint Enrollment and Credit Hours, by College: 2008
College
Enrollment in One or More Online
Courses% of Total Joint
EnrollmentCredit Hours De-
livered Online
% of Total Joint Enrollment Credit
Hours
Northeast Iowa 150 5.6% 654 3.6%
North Iowa Area 167 13.2% 614 6.7%
Iowa Lakes 298 15.7% 1,570 12.1%
Northwest 168 25.2% 723 14.1%
Iowa Central 666 19.6% 2,949 11.2%
Iowa Valley 167 14.5% 759 9.7%
Hawkeye 104 5.7% 419 4.2%
Eastern Iowa 216 9.2% 920 7.8%
Kirkwood 271 9.6% 1,052 7.4%
Des Moines Area 218 2.2% 955 1.3%
Western Iowa Tech 163 8.7% 898 7.0%
Iowa Western 4 0.2% 12 0.1%
Southwestern 245 32.6% 1,119 21.3%
Indian Hills 81 6.9% 262 3.4%
Southeastern 175 20.0% 752 15.5%
Total 3,093 9.1% 13,658 5.8%
Source: Iowa Department of Education, Division of Community Colleges and Workforce Preparation.
Table 4-12: Online Joint Enrollment and Credit Hours, by College: 2009
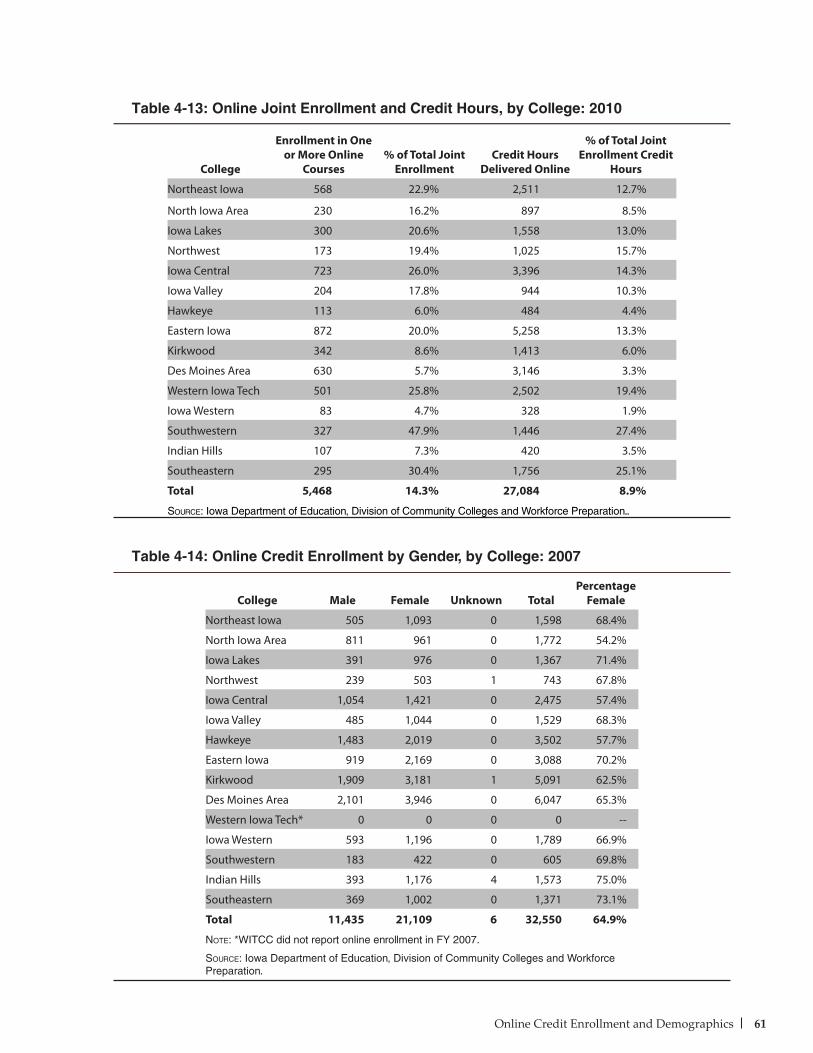
61Online Credit Enrollment and Demographics
College
Enrollment in One or More Online
Courses% of Total Joint
EnrollmentCredit Hours
Delivered Online
% of Total Joint Enrollment Credit
Hours
Northeast Iowa 568 22.9% 2,511 12.7%
North Iowa Area 230 16.2% 897 8.5%
Iowa Lakes 300 20.6% 1,558 13.0%
Northwest 173 19.4% 1,025 15.7%
Iowa Central 723 26.0% 3,396 14.3%
Iowa Valley 204 17.8% 944 10.3%
Hawkeye 113 6.0% 484 4.4%
Eastern Iowa 872 20.0% 5,258 13.3%
Kirkwood 342 8.6% 1,413 6.0%
Des Moines Area 630 5.7% 3,146 3.3%
Western Iowa Tech 501 25.8% 2,502 19.4%
Iowa Western 83 4.7% 328 1.9%
Southwestern 327 47.9% 1,446 27.4%
Indian Hills 107 7.3% 420 3.5%
Southeastern 295 30.4% 1,756 25.1%
Total 5,468 14.3% 27,084 8.9%
Source: Iowa Department of Education, Division of Community Colleges and Workforce Preparation..
Table 4-13: Online Joint Enrollment and Credit Hours, by College: 2010
College Male Female Unknown TotalPercentage
Female
Northeast Iowa 505 1,093 0 1,598 68.4%
North Iowa Area 811 961 0 1,772 54.2%
Iowa Lakes 391 976 0 1,367 71.4%
Northwest 239 503 1 743 67.8%
Iowa Central 1,054 1,421 0 2,475 57.4%
Iowa Valley 485 1,044 0 1,529 68.3%
Hawkeye 1,483 2,019 0 3,502 57.7%
Eastern Iowa 919 2,169 0 3,088 70.2%
Kirkwood 1,909 3,181 1 5,091 62.5%
Des Moines Area 2,101 3,946 0 6,047 65.3%
Western Iowa Tech* 0 0 0 0 --
Iowa Western 593 1,196 0 1,789 66.9%
Southwestern 183 422 0 605 69.8%
Indian Hills 393 1,176 4 1,573 75.0%
Southeastern 369 1,002 0 1,371 73.1%
Total 11,435 21,109 6 32,550 64.9%
Note: *WITCC did not report online enrollment in FY 2007.
Source: Iowa Department of Education, Division of Community Colleges and Workforce Preparation.
Table 4-14: Online Credit Enrollment by Gender, by College: 2007
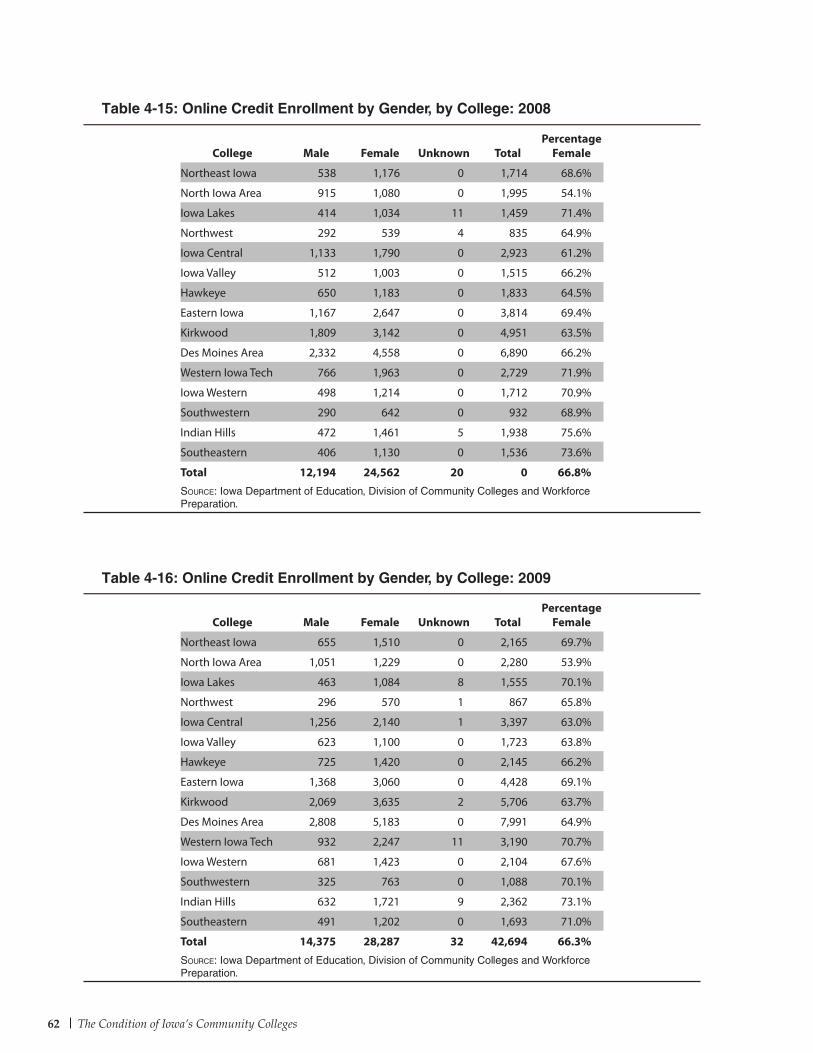
62 The Condition of Iowa’s Community Colleges
College Male Female Unknown TotalPercentage
Female
Northeast Iowa 538 1,176 0 1,714 68.6%
North Iowa Area 915 1,080 0 1,995 54.1%
Iowa Lakes 414 1,034 11 1,459 71.4%
Northwest 292 539 4 835 64.9%
Iowa Central 1,133 1,790 0 2,923 61.2%
Iowa Valley 512 1,003 0 1,515 66.2%
Hawkeye 650 1,183 0 1,833 64.5%
Eastern Iowa 1,167 2,647 0 3,814 69.4%
Kirkwood 1,809 3,142 0 4,951 63.5%
Des Moines Area 2,332 4,558 0 6,890 66.2%
Western Iowa Tech 766 1,963 0 2,729 71.9%
Iowa Western 498 1,214 0 1,712 70.9%
Southwestern 290 642 0 932 68.9%
Indian Hills 472 1,461 5 1,938 75.6%
Southeastern 406 1,130 0 1,536 73.6%
Total 12,194 24,562 20 0 66.8%Source: Iowa Department of Education, Division of Community Colleges and Workforce Preparation.
Table 4-15: Online Credit Enrollment by Gender, by College: 2008
College Male Female Unknown TotalPercentage
Female
Northeast Iowa 655 1,510 0 2,165 69.7%
North Iowa Area 1,051 1,229 0 2,280 53.9%
Iowa Lakes 463 1,084 8 1,555 70.1%
Northwest 296 570 1 867 65.8%
Iowa Central 1,256 2,140 1 3,397 63.0%
Iowa Valley 623 1,100 0 1,723 63.8%
Hawkeye 725 1,420 0 2,145 66.2%
Eastern Iowa 1,368 3,060 0 4,428 69.1%
Kirkwood 2,069 3,635 2 5,706 63.7%
Des Moines Area 2,808 5,183 0 7,991 64.9%
Western Iowa Tech 932 2,247 11 3,190 70.7%
Iowa Western 681 1,423 0 2,104 67.6%
Southwestern 325 763 0 1,088 70.1%
Indian Hills 632 1,721 9 2,362 73.1%
Southeastern 491 1,202 0 1,693 71.0%
Total 14,375 28,287 32 42,694 66.3%Source: Iowa Department of Education, Division of Community Colleges and Workforce Preparation.
Table 4-16: Online Credit Enrollment by Gender, by College: 2009
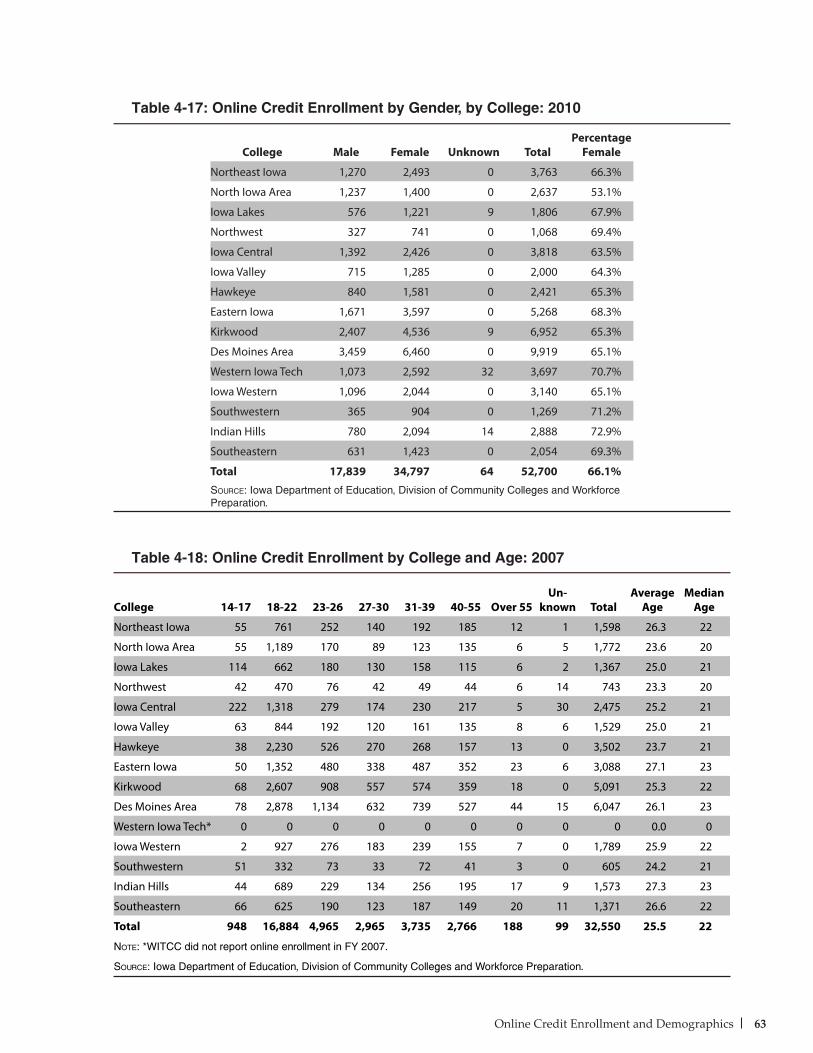
63Online Credit Enrollment and Demographics
Table 4-18: Online Credit Enrollment by College and Age: 2007
College 14-17 18-22 23-26 27-30 31-39 40-55 Over 55Un-
known TotalAverage
AgeMedian
Age
Northeast Iowa 55 761 252 140 192 185 12 1 1,598 26.3 22
North Iowa Area 55 1,189 170 89 123 135 6 5 1,772 23.6 20
Iowa Lakes 114 662 180 130 158 115 6 2 1,367 25.0 21
Northwest 42 470 76 42 49 44 6 14 743 23.3 20
Iowa Central 222 1,318 279 174 230 217 5 30 2,475 25.2 21
Iowa Valley 63 844 192 120 161 135 8 6 1,529 25.0 21
Hawkeye 38 2,230 526 270 268 157 13 0 3,502 23.7 21
Eastern Iowa 50 1,352 480 338 487 352 23 6 3,088 27.1 23
Kirkwood 68 2,607 908 557 574 359 18 0 5,091 25.3 22
Des Moines Area 78 2,878 1,134 632 739 527 44 15 6,047 26.1 23
Western Iowa Tech* 0 0 0 0 0 0 0 0 0 0.0 0
Iowa Western 2 927 276 183 239 155 7 0 1,789 25.9 22
Southwestern 51 332 73 33 72 41 3 0 605 24.2 21
Indian Hills 44 689 229 134 256 195 17 9 1,573 27.3 23
Southeastern 66 625 190 123 187 149 20 11 1,371 26.6 22
Total 948 16,884 4,965 2,965 3,735 2,766 188 99 32,550 25.5 22
Note: *WITCC did not report online enrollment in FY 2007.
Source: Iowa Department of Education, Division of Community Colleges and Workforce Preparation.
College Male Female Unknown TotalPercentage
Female
Northeast Iowa 1,270 2,493 0 3,763 66.3%
North Iowa Area 1,237 1,400 0 2,637 53.1%
Iowa Lakes 576 1,221 9 1,806 67.9%
Northwest 327 741 0 1,068 69.4%
Iowa Central 1,392 2,426 0 3,818 63.5%
Iowa Valley 715 1,285 0 2,000 64.3%
Hawkeye 840 1,581 0 2,421 65.3%
Eastern Iowa 1,671 3,597 0 5,268 68.3%
Kirkwood 2,407 4,536 9 6,952 65.3%
Des Moines Area 3,459 6,460 0 9,919 65.1%
Western Iowa Tech 1,073 2,592 32 3,697 70.7%
Iowa Western 1,096 2,044 0 3,140 65.1%
Southwestern 365 904 0 1,269 71.2%
Indian Hills 780 2,094 14 2,888 72.9%
Southeastern 631 1,423 0 2,054 69.3%
Total 17,839 34,797 64 52,700 66.1%Source: Iowa Department of Education, Division of Community Colleges and Workforce Preparation.
Table 4-17: Online Credit Enrollment by Gender, by College: 2010
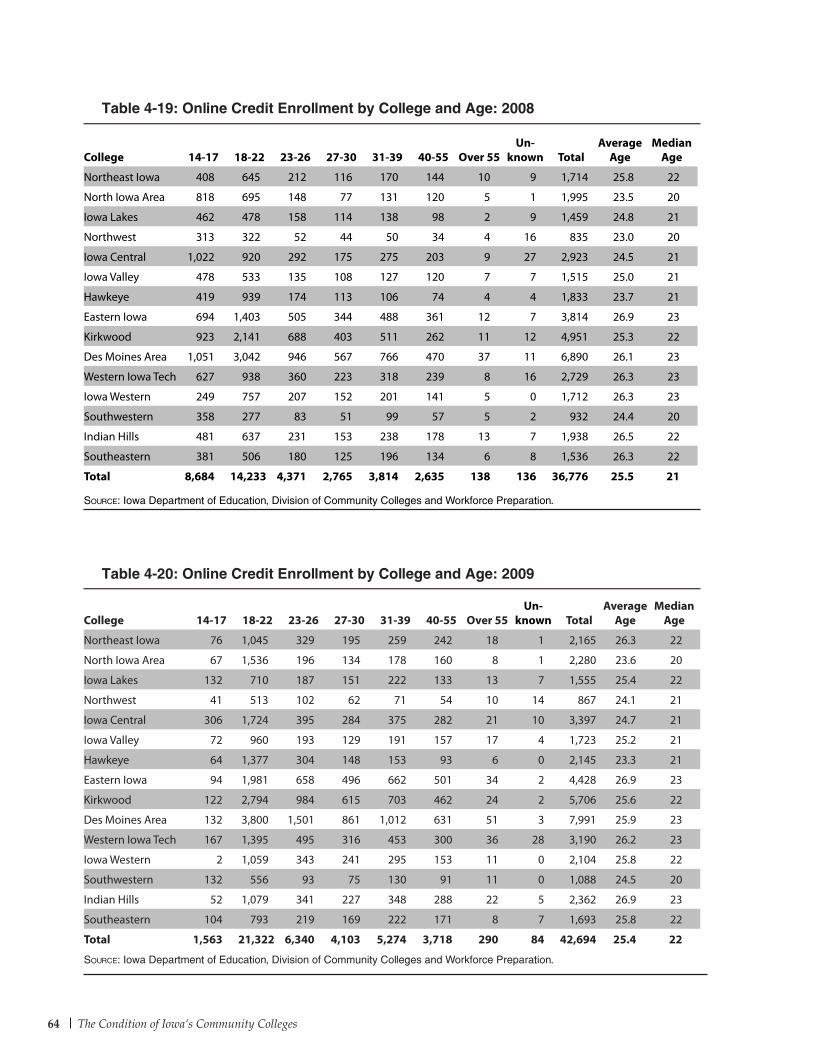
64 The Condition of Iowa’s Community Colleges
College 14-17 18-22 23-26 27-30 31-39 40-55 Over 55Un-
known TotalAverage
AgeMedian
Age
Northeast Iowa 408 645 212 116 170 144 10 9 1,714 25.8 22
North Iowa Area 818 695 148 77 131 120 5 1 1,995 23.5 20
Iowa Lakes 462 478 158 114 138 98 2 9 1,459 24.8 21
Northwest 313 322 52 44 50 34 4 16 835 23.0 20
Iowa Central 1,022 920 292 175 275 203 9 27 2,923 24.5 21
Iowa Valley 478 533 135 108 127 120 7 7 1,515 25.0 21
Hawkeye 419 939 174 113 106 74 4 4 1,833 23.7 21
Eastern Iowa 694 1,403 505 344 488 361 12 7 3,814 26.9 23
Kirkwood 923 2,141 688 403 511 262 11 12 4,951 25.3 22
Des Moines Area 1,051 3,042 946 567 766 470 37 11 6,890 26.1 23
Western Iowa Tech 627 938 360 223 318 239 8 16 2,729 26.3 23
Iowa Western 249 757 207 152 201 141 5 0 1,712 26.3 23
Southwestern 358 277 83 51 99 57 5 2 932 24.4 20
Indian Hills 481 637 231 153 238 178 13 7 1,938 26.5 22
Southeastern 381 506 180 125 196 134 6 8 1,536 26.3 22
Total 8,684 14,233 4,371 2,765 3,814 2,635 138 136 36,776 25.5 21
Source: Iowa Department of Education, Division of Community Colleges and Workforce Preparation.
Table 4-19: Online Credit Enrollment by College and Age: 2008
Table 4-20: Online Credit Enrollment by College and Age: 2009
College 14-17 18-22 23-26 27-30 31-39 40-55 Over 55Un-
known TotalAverage
AgeMedian
Age
Northeast Iowa 76 1,045 329 195 259 242 18 1 2,165 26.3 22
North Iowa Area 67 1,536 196 134 178 160 8 1 2,280 23.6 20
Iowa Lakes 132 710 187 151 222 133 13 7 1,555 25.4 22
Northwest 41 513 102 62 71 54 10 14 867 24.1 21
Iowa Central 306 1,724 395 284 375 282 21 10 3,397 24.7 21
Iowa Valley 72 960 193 129 191 157 17 4 1,723 25.2 21
Hawkeye 64 1,377 304 148 153 93 6 0 2,145 23.3 21
Eastern Iowa 94 1,981 658 496 662 501 34 2 4,428 26.9 23
Kirkwood 122 2,794 984 615 703 462 24 2 5,706 25.6 22
Des Moines Area 132 3,800 1,501 861 1,012 631 51 3 7,991 25.9 23
Western Iowa Tech 167 1,395 495 316 453 300 36 28 3,190 26.2 23
Iowa Western 2 1,059 343 241 295 153 11 0 2,104 25.8 22
Southwestern 132 556 93 75 130 91 11 0 1,088 24.5 20
Indian Hills 52 1,079 341 227 348 288 22 5 2,362 26.9 23
Southeastern 104 793 219 169 222 171 8 7 1,693 25.8 22
Total 1,563 21,322 6,340 4,103 5,274 3,718 290 84 42,694 25.4 22
Source: Iowa Department of Education, Division of Community Colleges and Workforce Preparation.
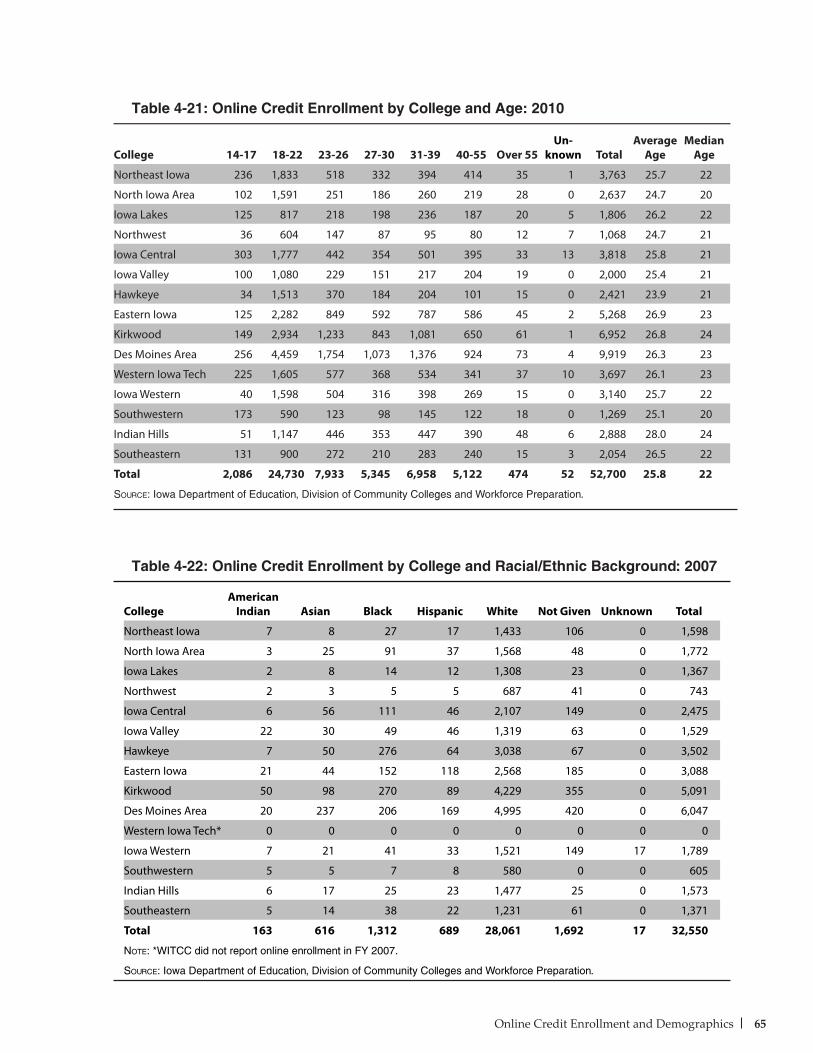
65Online Credit Enrollment and Demographics
Table 4-21: Online Credit Enrollment by College and Age: 2010
College 14-17 18-22 23-26 27-30 31-39 40-55 Over 55Un-
known TotalAverage
AgeMedian
Age
Northeast Iowa 236 1,833 518 332 394 414 35 1 3,763 25.7 22
North Iowa Area 102 1,591 251 186 260 219 28 0 2,637 24.7 20
Iowa Lakes 125 817 218 198 236 187 20 5 1,806 26.2 22
Northwest 36 604 147 87 95 80 12 7 1,068 24.7 21
Iowa Central 303 1,777 442 354 501 395 33 13 3,818 25.8 21
Iowa Valley 100 1,080 229 151 217 204 19 0 2,000 25.4 21
Hawkeye 34 1,513 370 184 204 101 15 0 2,421 23.9 21
Eastern Iowa 125 2,282 849 592 787 586 45 2 5,268 26.9 23
Kirkwood 149 2,934 1,233 843 1,081 650 61 1 6,952 26.8 24
Des Moines Area 256 4,459 1,754 1,073 1,376 924 73 4 9,919 26.3 23
Western Iowa Tech 225 1,605 577 368 534 341 37 10 3,697 26.1 23
Iowa Western 40 1,598 504 316 398 269 15 0 3,140 25.7 22
Southwestern 173 590 123 98 145 122 18 0 1,269 25.1 20
Indian Hills 51 1,147 446 353 447 390 48 6 2,888 28.0 24
Southeastern 131 900 272 210 283 240 15 3 2,054 26.5 22
Total 2,086 24,730 7,933 5,345 6,958 5,122 474 52 52,700 25.8 22
Source: Iowa Department of Education, Division of Community Colleges and Workforce Preparation.
Table 4-22: Online Credit Enrollment by College and Racial/Ethnic Background: 2007
CollegeAmerican
Indian Asian Black Hispanic White Not Given Unknown Total
Northeast Iowa 7 8 27 17 1,433 106 0 1,598
North Iowa Area 3 25 91 37 1,568 48 0 1,772
Iowa Lakes 2 8 14 12 1,308 23 0 1,367
Northwest 2 3 5 5 687 41 0 743
Iowa Central 6 56 111 46 2,107 149 0 2,475
Iowa Valley 22 30 49 46 1,319 63 0 1,529
Hawkeye 7 50 276 64 3,038 67 0 3,502
Eastern Iowa 21 44 152 118 2,568 185 0 3,088
Kirkwood 50 98 270 89 4,229 355 0 5,091
Des Moines Area 20 237 206 169 4,995 420 0 6,047
Western Iowa Tech* 0 0 0 0 0 0 0 0
Iowa Western 7 21 41 33 1,521 149 17 1,789
Southwestern 5 5 7 8 580 0 0 605
Indian Hills 6 17 25 23 1,477 25 0 1,573
Southeastern 5 14 38 22 1,231 61 0 1,371
Total 163 616 1,312 689 28,061 1,692 17 32,550
Note: *WITCC did not report online enrollment in FY 2007.
Source: Iowa Department of Education, Division of Community Colleges and Workforce Preparation.
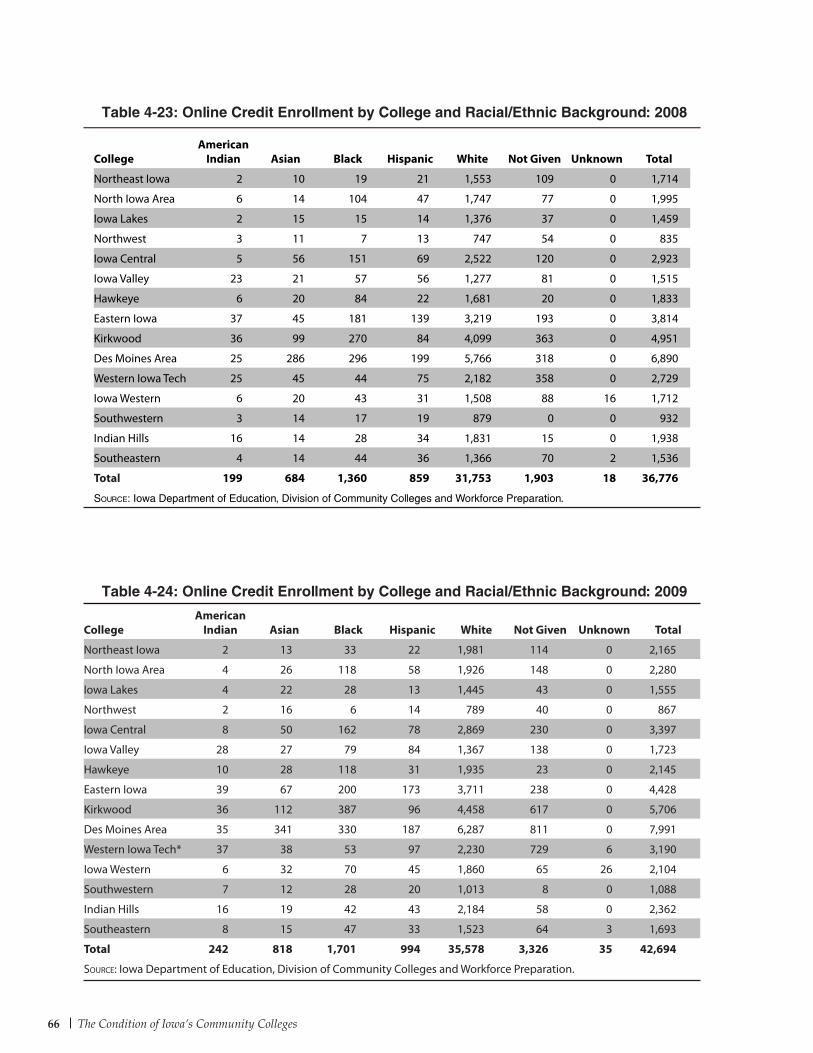
66 The Condition of Iowa’s Community Colleges
CollegeAmerican
Indian Asian Black Hispanic White Not Given Unknown Total
Northeast Iowa 2 13 33 22 1,981 114 0 2,165
North Iowa Area 4 26 118 58 1,926 148 0 2,280
Iowa Lakes 4 22 28 13 1,445 43 0 1,555
Northwest 2 16 6 14 789 40 0 867
Iowa Central 8 50 162 78 2,869 230 0 3,397
Iowa Valley 28 27 79 84 1,367 138 0 1,723
Hawkeye 10 28 118 31 1,935 23 0 2,145
Eastern Iowa 39 67 200 173 3,711 238 0 4,428
Kirkwood 36 112 387 96 4,458 617 0 5,706
Des Moines Area 35 341 330 187 6,287 811 0 7,991
Western Iowa Tech* 37 38 53 97 2,230 729 6 3,190
Iowa Western 6 32 70 45 1,860 65 26 2,104
Southwestern 7 12 28 20 1,013 8 0 1,088
Indian Hills 16 19 42 43 2,184 58 0 2,362
Southeastern 8 15 47 33 1,523 64 3 1,693
Total 242 818 1,701 994 35,578 3,326 35 42,694
Source: Iowa Department of Education, Division of Community Colleges and Workforce Preparation.
Table 4-23: Online Credit Enrollment by College and Racial/Ethnic Background: 2008
CollegeAmerican
Indian Asian Black Hispanic White Not Given Unknown Total
Northeast Iowa 2 10 19 21 1,553 109 0 1,714
North Iowa Area 6 14 104 47 1,747 77 0 1,995
Iowa Lakes 2 15 15 14 1,376 37 0 1,459
Northwest 3 11 7 13 747 54 0 835
Iowa Central 5 56 151 69 2,522 120 0 2,923
Iowa Valley 23 21 57 56 1,277 81 0 1,515
Hawkeye 6 20 84 22 1,681 20 0 1,833
Eastern Iowa 37 45 181 139 3,219 193 0 3,814
Kirkwood 36 99 270 84 4,099 363 0 4,951
Des Moines Area 25 286 296 199 5,766 318 0 6,890
Western Iowa Tech 25 45 44 75 2,182 358 0 2,729
Iowa Western 6 20 43 31 1,508 88 16 1,712
Southwestern 3 14 17 19 879 0 0 932
Indian Hills 16 14 28 34 1,831 15 0 1,938
Southeastern 4 14 44 36 1,366 70 2 1,536
Total 199 684 1,360 859 31,753 1,903 18 36,776
Source: Iowa Department of Education, Division of Community Colleges and Workforce Preparation.
Table 4-24: Online Credit Enrollment by College and Racial/Ethnic Background: 2009
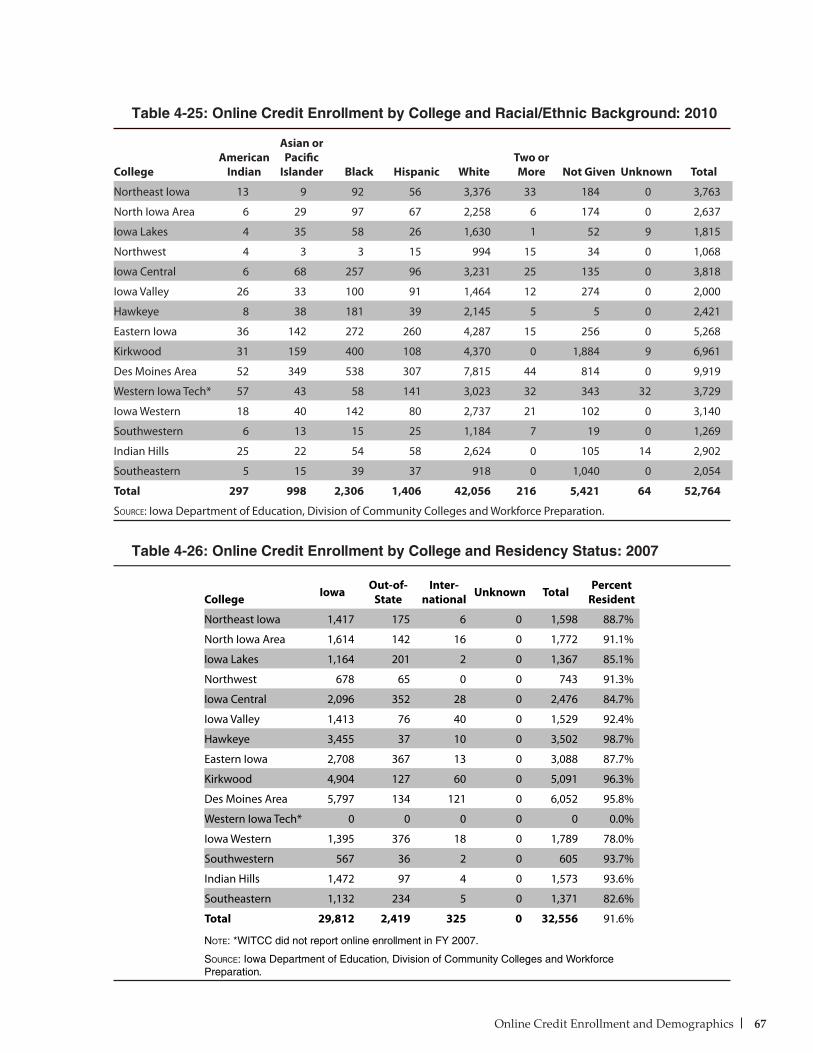
67Online Credit Enrollment and Demographics
Table 4-25: Online Credit Enrollment by College and Racial/Ethnic Background: 2010
CollegeAmerican
Indian
Asian or Pacific
Islander Black Hispanic WhiteTwo or More Not Given Unknown Total
Northeast Iowa 13 9 92 56 3,376 33 184 0 3,763
North Iowa Area 6 29 97 67 2,258 6 174 0 2,637
Iowa Lakes 4 35 58 26 1,630 1 52 9 1,815
Northwest 4 3 3 15 994 15 34 0 1,068
Iowa Central 6 68 257 96 3,231 25 135 0 3,818
Iowa Valley 26 33 100 91 1,464 12 274 0 2,000
Hawkeye 8 38 181 39 2,145 5 5 0 2,421
Eastern Iowa 36 142 272 260 4,287 15 256 0 5,268
Kirkwood 31 159 400 108 4,370 0 1,884 9 6,961
Des Moines Area 52 349 538 307 7,815 44 814 0 9,919
Western Iowa Tech* 57 43 58 141 3,023 32 343 32 3,729
Iowa Western 18 40 142 80 2,737 21 102 0 3,140
Southwestern 6 13 15 25 1,184 7 19 0 1,269
Indian Hills 25 22 54 58 2,624 0 105 14 2,902
Southeastern 5 15 39 37 918 0 1,040 0 2,054
Total 297 998 2,306 1,406 42,056 216 5,421 64 52,764
Source: Iowa Department of Education, Division of Community Colleges and Workforce Preparation.
Table 4-26: Online Credit Enrollment by College and Residency Status: 2007
College Iowa Out-of-State
Inter-national Unknown Total Percent
Resident
Northeast Iowa 1,417 175 6 0 1,598 88.7%
North Iowa Area 1,614 142 16 0 1,772 91.1%
Iowa Lakes 1,164 201 2 0 1,367 85.1%
Northwest 678 65 0 0 743 91.3%
Iowa Central 2,096 352 28 0 2,476 84.7%
Iowa Valley 1,413 76 40 0 1,529 92.4%
Hawkeye 3,455 37 10 0 3,502 98.7%
Eastern Iowa 2,708 367 13 0 3,088 87.7%
Kirkwood 4,904 127 60 0 5,091 96.3%
Des Moines Area 5,797 134 121 0 6,052 95.8%
Western Iowa Tech* 0 0 0 0 0 0.0%
Iowa Western 1,395 376 18 0 1,789 78.0%
Southwestern 567 36 2 0 605 93.7%
Indian Hills 1,472 97 4 0 1,573 93.6%
Southeastern 1,132 234 5 0 1,371 82.6%
Total 29,812 2,419 325 0 32,556 91.6%
Note: *WITCC did not report online enrollment in FY 2007.
Source: Iowa Department of Education, Division of Community Colleges and Workforce Preparation.
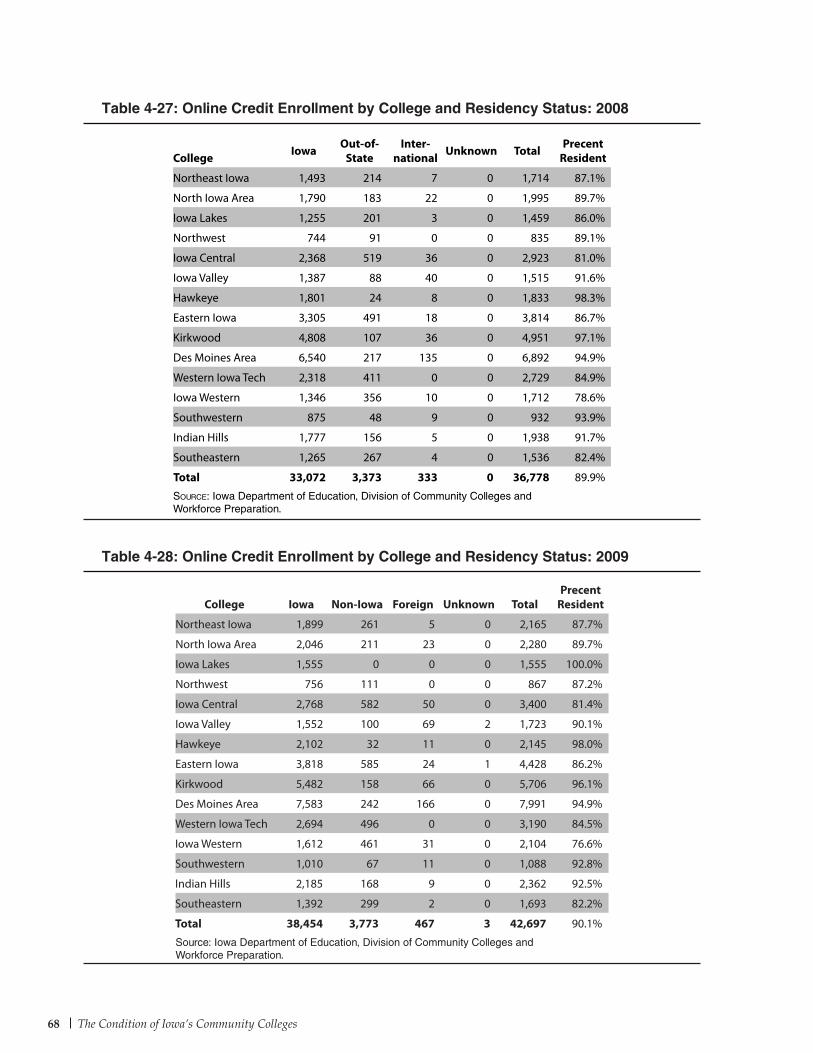
68 The Condition of Iowa’s Community Colleges
College Iowa Out-of-State
Inter-national Unknown Total Precent
Resident
Northeast Iowa 1,493 214 7 0 1,714 87.1%
North Iowa Area 1,790 183 22 0 1,995 89.7%
Iowa Lakes 1,255 201 3 0 1,459 86.0%
Northwest 744 91 0 0 835 89.1%
Iowa Central 2,368 519 36 0 2,923 81.0%
Iowa Valley 1,387 88 40 0 1,515 91.6%
Hawkeye 1,801 24 8 0 1,833 98.3%
Eastern Iowa 3,305 491 18 0 3,814 86.7%
Kirkwood 4,808 107 36 0 4,951 97.1%
Des Moines Area 6,540 217 135 0 6,892 94.9%
Western Iowa Tech 2,318 411 0 0 2,729 84.9%
Iowa Western 1,346 356 10 0 1,712 78.6%
Southwestern 875 48 9 0 932 93.9%
Indian Hills 1,777 156 5 0 1,938 91.7%
Southeastern 1,265 267 4 0 1,536 82.4%
Total 33,072 3,373 333 0 36,778 89.9%
Source: Iowa Department of Education, Division of Community Colleges and Workforce Preparation.
Table 4-27: Online Credit Enrollment by College and Residency Status: 2008
Table 4-28: Online Credit Enrollment by College and Residency Status: 2009
College Iowa Non-Iowa Foreign Unknown TotalPrecent
Resident
Northeast Iowa 1,899 261 5 0 2,165 87.7%
North Iowa Area 2,046 211 23 0 2,280 89.7%
Iowa Lakes 1,555 0 0 0 1,555 100.0%
Northwest 756 111 0 0 867 87.2%
Iowa Central 2,768 582 50 0 3,400 81.4%
Iowa Valley 1,552 100 69 2 1,723 90.1%
Hawkeye 2,102 32 11 0 2,145 98.0%
Eastern Iowa 3,818 585 24 1 4,428 86.2%
Kirkwood 5,482 158 66 0 5,706 96.1%
Des Moines Area 7,583 242 166 0 7,991 94.9%
Western Iowa Tech 2,694 496 0 0 3,190 84.5%
Iowa Western 1,612 461 31 0 2,104 76.6%
Southwestern 1,010 67 11 0 1,088 92.8%
Indian Hills 2,185 168 9 0 2,362 92.5%
Southeastern 1,392 299 2 0 1,693 82.2%
Total 38,454 3,773 467 3 42,697 90.1%
Source: Iowa Department of Education, Division of Community Colleges and Workforce Preparation.
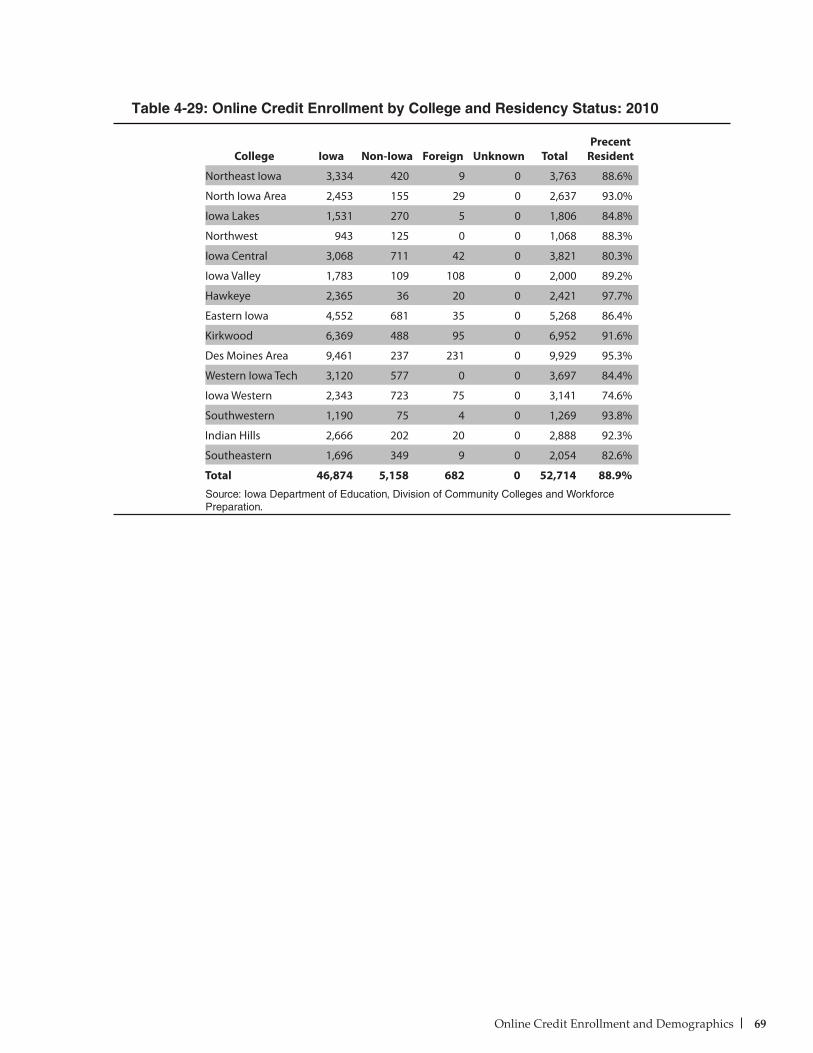
69Online Credit Enrollment and Demographics
Table 4-29: Online Credit Enrollment by College and Residency Status: 2010
College Iowa Non-Iowa Foreign Unknown TotalPrecent
Resident
Northeast Iowa 3,334 420 9 0 3,763 88.6%
North Iowa Area 2,453 155 29 0 2,637 93.0%
Iowa Lakes 1,531 270 5 0 1,806 84.8%
Northwest 943 125 0 0 1,068 88.3%
Iowa Central 3,068 711 42 0 3,821 80.3%
Iowa Valley 1,783 109 108 0 2,000 89.2%
Hawkeye 2,365 36 20 0 2,421 97.7%
Eastern Iowa 4,552 681 35 0 5,268 86.4%
Kirkwood 6,369 488 95 0 6,952 91.6%
Des Moines Area 9,461 237 231 0 9,929 95.3%
Western Iowa Tech 3,120 577 0 0 3,697 84.4%
Iowa Western 2,343 723 75 0 3,141 74.6%
Southwestern 1,190 75 4 0 1,269 93.8%
Indian Hills 2,666 202 20 0 2,888 92.3%
Southeastern 1,696 349 9 0 2,054 82.6%
Total 46,874 5,158 682 0 52,714 88.9%Source: Iowa Department of Education, Division of Community Colleges and Workforce Preparation.

70 The Condition of Iowa’s Community Colleges
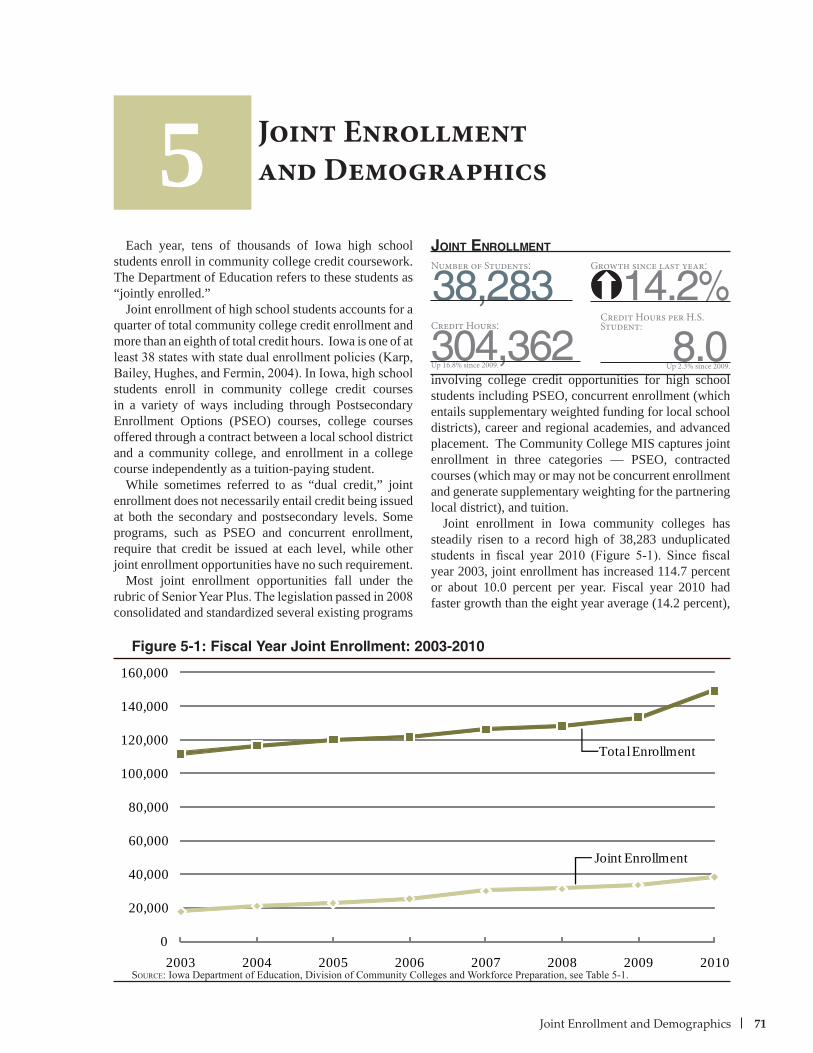
71Joint Enrollment and Demographics
Each year, tens of thousands of Iowa high school students enroll in community college credit coursework. The Department of Education refers to these students as “jointly enrolled.”
Joint enrollment of high school students accounts for a quarter of total community college credit enrollment and more than an eighth of total credit hours. Iowa is one of at least 38 states with state dual enrollment policies (Karp, Bailey, Hughes, and Fermin, 2004). In Iowa, high school students enroll in community college credit courses in a variety of ways including through Postsecondary Enrollment Options (PSEO) courses, college courses offered through a contract between a local school district and a community college, and enrollment in a college course independently as a tuition-paying student.
While sometimes referred to as “dual credit,” joint enrollment does not necessarily entail credit being issued at both the secondary and postsecondary levels. Some programs, such as PSEO and concurrent enrollment, require that credit be issued at each level, while other joint enrollment opportunities have no such requirement.
Most joint enrollment opportunities fall under the rubric of Senior Year Plus. The legislation passed in 2008 consolidated and standardized several existing programs
involving college credit opportunities for high school students including PSEO, concurrent enrollment (which entails supplementary weighted funding for local school districts), career and regional academies, and advanced placement. The Community College MIS captures joint enrollment in three categories — PSEO, contracted courses (which may or may not be concurrent enrollment and generate supplementary weighting for the partnering local district), and tuition.
Joint enrollment in Iowa community colleges has steadily risen to a record high of 38,283 unduplicated students in fiscal year 2010 (Figure 5-1). Since fiscal year 2003, joint enrollment has increased 114.7 percent or about 10.0 percent per year. Fiscal year 2010 had faster growth than the eight year average (14.2 percent),
Joint Enrollment and Demographics
Figure 5-1: Fiscal Year Joint Enrollment: 2003-2010
5
Source: Iowa Department of Education, Division of Community Colleges and Workforce Preparation, see Table 5-1.
304,362
Number of Students:
38,283Growth since last year:
14.2%joint enrollment
Credit Hours:Credit Hours per H.S. Student:
8.0Up 16.8% since 2009. Up 2.3% since 2009.
Joint Enrollment
Total Enrollment
0
20,000
40,000
60,000
80,000
100,000
120,000
140,000
160,000
2003 2004 2005 2006 2007 2008 2009 2010
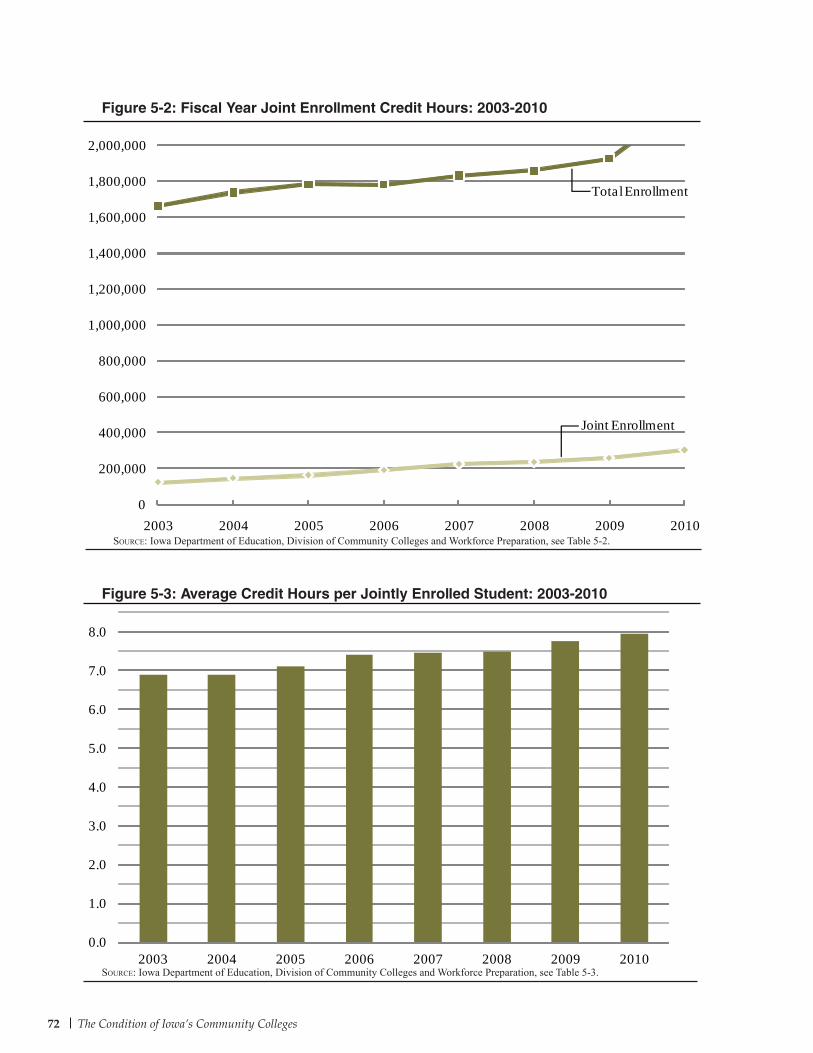
72 The Condition of Iowa’s Community Colleges
0.0
1.0
2.0
3.0
4.0
5.0
6.0
7.0
8.0
2003 2004 2005 2006 2007 2008 2009 2010
Figure 5-2: Fiscal Year Joint Enrollment Credit Hours: 2003-2010
Source: Iowa Department of Education, Division of Community Colleges and Workforce Preparation, see Table 5-2.
Figure 5-3: Average Credit Hours per Jointly Enrolled Student: 2003-2010
Source: Iowa Department of Education, Division of Community Colleges and Workforce Preparation, see Table 5-3.
Joint Enrollment
Total Enrollment
0
200,000
400,000
600,000
800,000
1,000,000
1,200,000
1,400,000
1,600,000
1,800,000
2,000,000
2003 2004 2005 2006 2007 2008 2009 2010
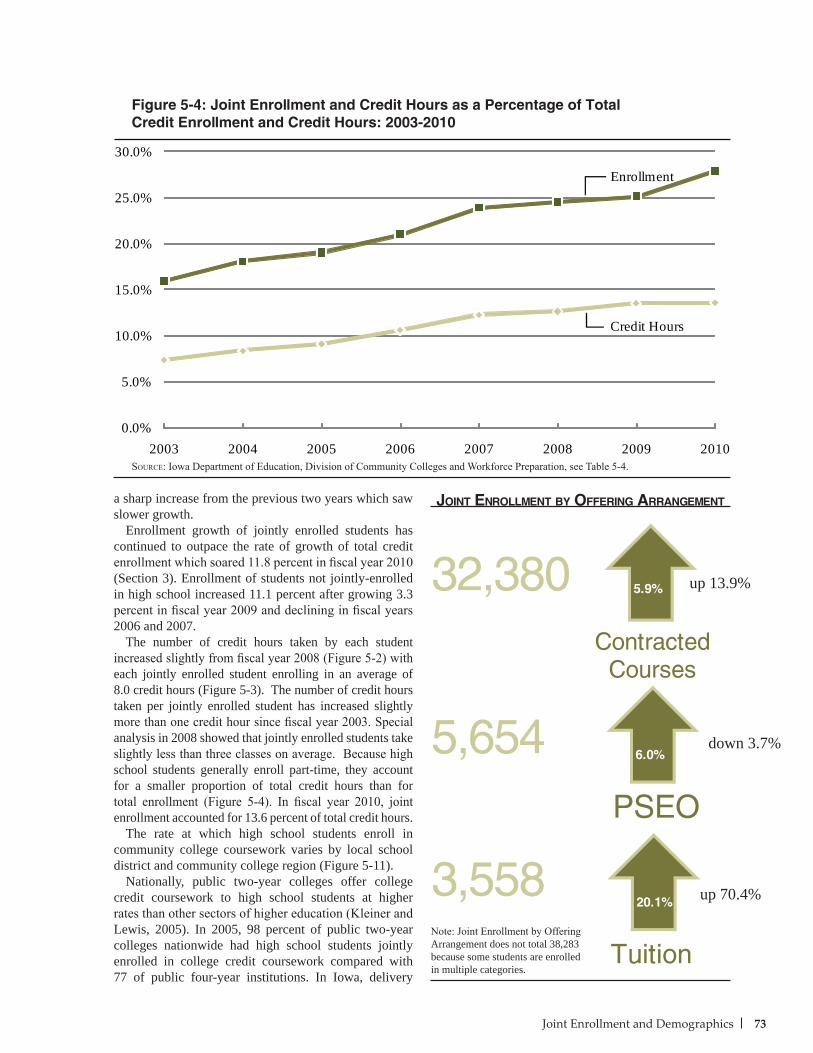
73Joint Enrollment and Demographics
Enrollment
Credit Hours
0.0%
5.0%
10.0%
15.0%
20.0%
25.0%
30.0%
2003 2004 2005 2006 2007 2008 2009 2010
Figure 5-4: Joint Enrollment and Credit Hours as a Percentage of Total Credit Enrollment and Credit Hours: 2003-2010
Source: Iowa Department of Education, Division of Community Colleges and Workforce Preparation, see Table 5-4.
a sharp increase from the previous two years which saw slower growth.
Enrollment growth of jointly enrolled students has continued to outpace the rate of growth of total credit enrollment which soared 11.8 percent in fiscal year 2010 (Section 3). Enrollment of students not jointly-enrolled in high school increased 11.1 percent after growing 3.3 percent in fiscal year 2009 and declining in fiscal years 2006 and 2007.
The number of credit hours taken by each student increased slightly from fiscal year 2008 (Figure 5-2) with each jointly enrolled student enrolling in an average of 8.0 credit hours (Figure 5-3). The number of credit hours taken per jointly enrolled student has increased slightly more than one credit hour since fiscal year 2003. Special analysis in 2008 showed that jointly enrolled students take slightly less than three classes on average. Because high school students generally enroll part-time, they account for a smaller proportion of total credit hours than for total enrollment (Figure 5-4). In fiscal year 2010, joint enrollment accounted for 13.6 percent of total credit hours.
The rate at which high school students enroll in community college coursework varies by local school district and community college region (Figure 5-11).
Nationally, public two-year colleges offer college credit coursework to high school students at higher rates than other sectors of higher education (Kleiner and Lewis, 2005). In 2005, 98 percent of public two-year colleges nationwide had high school students jointly enrolled in college credit coursework compared with 77 of public four-year institutions. In Iowa, delivery
joint enrollment bY oFFering arrangement
5,654
32,380
3,558Note: Joint Enrollment by Offering Arrangement does not total 38,283 because some students are enrolled in multiple categories.
6.0%
PSEO
5.9%
Contracted Courses
20.1%
Tuition
down 3.7%
up 13.9%
up 70.4%
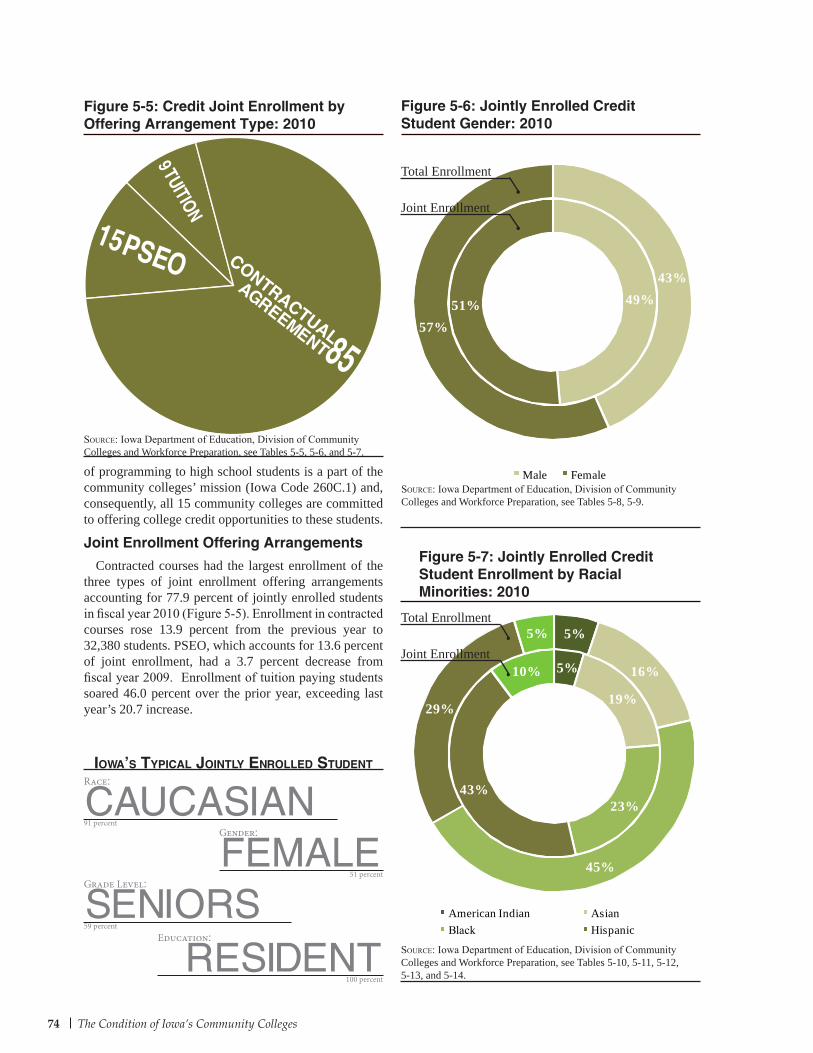
74 The Condition of Iowa’s Community Colleges
5%
19%
23%43%
10%
5%
16%
45%
29%
5%
American Indian AsianBlack Hispanic
of programming to high school students is a part of the community colleges’ mission (Iowa Code 260C.1) and, consequently, all 15 community colleges are committed to offering college credit opportunities to these students.
Joint Enrollment Offering Arrangements
Contracted courses had the largest enrollment of the three types of joint enrollment offering arrangements accounting for 77.9 percent of jointly enrolled students in fiscal year 2010 (Figure 5-5). Enrollment in contracted courses rose 13.9 percent from the previous year to 32,380 students. PSEO, which accounts for 13.6 percent of joint enrollment, had a 3.7 percent decrease from fiscal year 2009. Enrollment of tuition paying students soared 46.0 percent over the prior year, exceeding last year’s 20.7 increase.
Figure 5-7: Jointly Enrolled Credit Student Enrollment by Racial Minorities: 2010
49%51%
43%
57%
Male Female
Figure 5-6: Jointly Enrolled Credit Student Gender: 2010
Source: Iowa Department of Education, Division of Community Colleges and Workforce Preparation, see Tables 5-8, 5-9.
Total Enrollment
Joint Enrollment
Total Enrollment
Joint Enrollment
iowa’s tYPical jointlY enrolleD stuDent
Figure 5-5: Credit Joint Enrollment by Offering Arrangement Type: 2010
Source: Iowa Department of Education, Division of Community Colleges and Workforce Preparation, see Tables 5-5, 5-6, and 5-7.
Source: Iowa Department of Education, Division of Community Colleges and Workforce Preparation, see Tables 5-10, 5-11, 5-12, 5-13, and 5-14.
Race:
CAUCASIAN91 percent
Gender:
FEMALE51 percent
Grade Level:
SENIORS59 percent
Education:
RESIDENT100 percent
CONTRACTUAL
AGREEMENT85
PSEO15
TUITION
9
75Joint Enrollment and Demographics
MA
P
76 The Condition of Iowa’s Community Colleges
MA
P
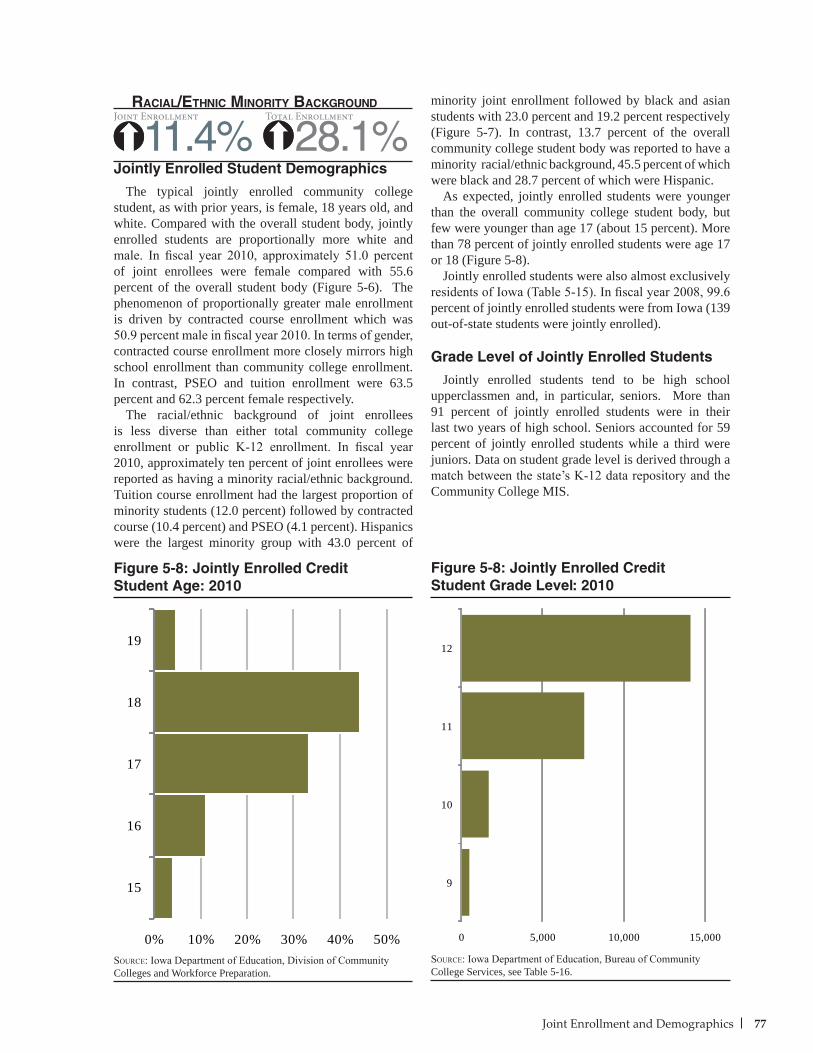
77Joint Enrollment and Demographics
racial/etHnic minoritY backgrounDJoint Enrollment
11.4%Total Enrollment
28.1%Jointly Enrolled Student Demographics
The typical jointly enrolled community college student, as with prior years, is female, 18 years old, and white. Compared with the overall student body, jointly enrolled students are proportionally more white and male. In fiscal year 2010, approximately 51.0 percent of joint enrollees were female compared with 55.6 percent of the overall student body (Figure 5-6). The phenomenon of proportionally greater male enrollment is driven by contracted course enrollment which was 50.9 percent male in fiscal year 2010. In terms of gender, contracted course enrollment more closely mirrors high school enrollment than community college enrollment. In contrast, PSEO and tuition enrollment were 63.5 percent and 62.3 percent female respectively.
The racial/ethnic background of joint enrollees is less diverse than either total community college enrollment or public K-12 enrollment. In fiscal year 2010, approximately ten percent of joint enrollees were reported as having a minority racial/ethnic background. Tuition course enrollment had the largest proportion of minority students (12.0 percent) followed by contracted course (10.4 percent) and PSEO (4.1 percent). Hispanics were the largest minority group with 43.0 percent of
minority joint enrollment followed by black and asian students with 23.0 percent and 19.2 percent respectively (Figure 5-7). In contrast, 13.7 percent of the overall community college student body was reported to have a minority racial/ethnic background, 45.5 percent of which were black and 28.7 percent of which were Hispanic.
As expected, jointly enrolled students were younger than the overall community college student body, but few were younger than age 17 (about 15 percent). More than 78 percent of jointly enrolled students were age 17 or 18 (Figure 5-8).
Jointly enrolled students were also almost exclusively residents of Iowa (Table 5-15). In fiscal year 2008, 99.6 percent of jointly enrolled students were from Iowa (139 out-of-state students were jointly enrolled).
Grade Level of Jointly Enrolled Students
Jointly enrolled students tend to be high school upperclassmen and, in particular, seniors. More than 91 percent of jointly enrolled students were in their last two years of high school. Seniors accounted for 59 percent of jointly enrolled students while a third were juniors. Data on student grade level is derived through a match between the state’s K-12 data repository and the Community College MIS.
Source: Iowa Department of Education, Division of Community Colleges and Workforce Preparation.
Figure 5-8: Jointly Enrolled Credit Student Age: 2010
Source: Iowa Department of Education, Bureau of Community College Services, see Table 5-16.
Figure 5-8: Jointly Enrolled Credit Student Grade Level: 2010
0% 10% 20% 30% 40% 50%
15
16
17
18
19
0 5,000 10,000 15,000
9
10
11
12
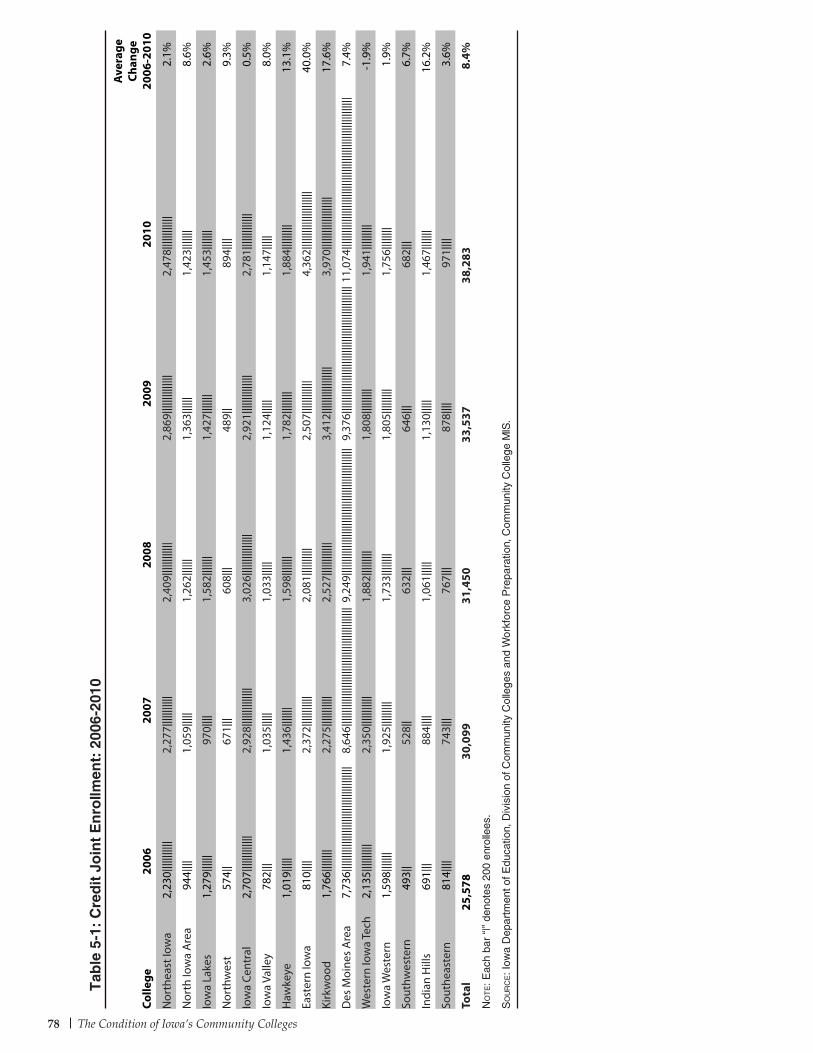
78 The Condition of Iowa’s Community Colleges
Tab
le 5
-1:
Cre
dit
Jo
int
En
rollm
ent:
200
6-20
10
2006
2007
2008
2009
2010
Ave
rage
Ch
ange
20
06-2
010
Colle
ge
Nor
thea
st Io
wa
2,23
0||||
||||||
|2,
277|
||||||
||||
2,40
9||||
||||||
||2,
869|
||||||
||||||
|2,
478|
||||||
|||||
2.1%
Nor
th Io
wa
Are
a94
4||||
1,05
9||||
|1,
262|
|||||
1,36
3||||
||1,
423|
||||||
8.6%
Iow
a La
kes
1,27
9||||
||97
0||||
1,58
2||||
|||1,
427|
||||||
1,45
3||||
|||2.
6%
Nor
thw
est
574|
|67
1|||
608|
||48
9||
894|
|||9.
3%
Iow
a Ce
ntra
l2,
707|
||||||
||||||
2,92
8||||
||||||
||||
3,02
6||||
||||||
|||||
2,92
1||||
||||||
||||
2,78
1||||
||||||
|||0.
5%
Iow
a Va
lley
782|
||1,
035|
||||
1,03
3||||
|1,
124|
||||
1,14
7||||
|8.
0%
Haw
keye
1,01
9||||
|1,
436|
||||||
1,59
8||||
|||1,
782|
||||||
|1,
884|
||||||
||13
.1%
East
ern
Iow
a81
0||||
2,37
2||||
||||||
|2,
081|
||||||
|||2,
507|
||||||
|||||
4,36
2||||
||||||
||||||
|||||
40.0
%
Kirk
woo
d1,
766|
||||||
|2,
275|
||||||
||||
2,52
7||||
||||||
||3,
412|
||||||
||||||
||||
3,97
0||||
||||||
||||||
|||17
.6%
Des
Moi
nes
Are
a7,
736|
||||||
||||||
||||||
||||||
||||||
||||||
|8,
646|
||||||
||||||
||||||
||||||
||||||
||||||
||||||
9,24
9||||
||||||
||||||
||||||
||||||
||||||
||||||
||||||
9,37
6||||
||||||
||||||
||||||
||||||
||||||
||||||
||||||
11,0
74|||
||||||
||||||
||||||
||||||
||||||
||||||
||||||
||||||
||||
7.4%
Wes
tern
Iow
a Te
ch2,
135|
||||||
|||2,
350|
||||||
||||
1,88
2||||
|||||
1,80
8||||
|||||
1,94
1||||
|||||
-1.9
%
Iow
a W
este
rn1,
598|
||||||
1,92
5||||
|||||
1,73
3||||
||||
1,80
5||||
|||||
1,75
6||||
||||
1.9%
Sout
hwes
tern
493|
|52
8||
632|
||64
6|||
682|
||6.
7%
Indi
an H
ills
691|
||88
4||||
1,06
1||||
|1,
130|
||||
1,46
7||||
|||16
.2%
Sout
heas
tern
814|
|||74
3|||
767|
||87
8||||
971|
|||3.
6%
Tota
l25
,578
30,0
9931
,450
33,5
3738
,283
8.4%
No
te: E
ach
bar
“|”
deno
tes
200
enro
llees
.
So
ur
ce: I
owa
Dep
artm
ent o
f Edu
catio
n, D
ivis
ion
of C
omm
unity
Col
lege
s an
d W
orkf
orce
Pre
para
tion,
Com
mun
ity C
olle
ge M
IS.
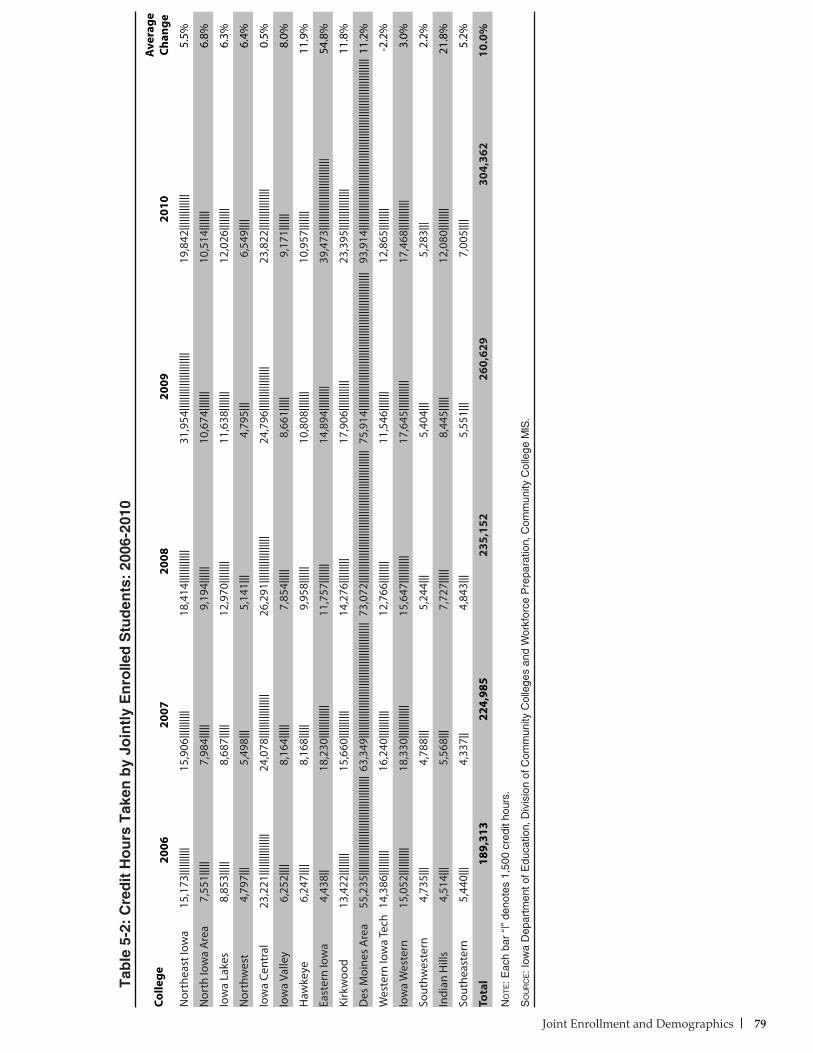
79Joint Enrollment and Demographics
Tab
le 5
-2:
Cre
dit
Ho
urs
Tak
en b
y Jo
intl
y E
nro
lled
Stu
den
ts:
2006
-201
0
Colle
ge20
0620
0720
0820
0920
10A
vera
ge
Chan
ge
Nor
thea
st Io
wa
15,1
73|||
||||||
|15
,906
||||||
||||
18,4
14|||
||||||
|||31
,954
||||||
||||||
||||||
|||19
,842
||||||
||||||
|5.
5%
Nor
th Io
wa
Are
a7,
551|
||||
7,98
4||||
|9,
194|
|||||
10,6
74|||
||||
10,5
14|||
||||
6.8%
Iow
a La
kes
8,85
3||||
|8,
687|
||||
12,9
70|||
|||||
11,6
38|||
||||
12,0
26|||
|||||
6.3%
Nor
thw
est
4,79
7|||
5,49
8|||
5,14
1|||
4,79
5|||
6,54
9||||
6.4%
Iow
a Ce
ntra
l23
,221
||||||
||||||
|||24
,078
||||||
||||||
||||
26,2
91|||
||||||
||||||
||24
,796
||||||
||||||
||||
23,8
22|||
||||||
||||||
0.5%
Iow
a Va
lley
6,25
2||||
8,16
4||||
|7,
854|
||||
8,66
1||||
|9,
171|
|||||
8.0%
Haw
keye
6,24
7||||
8,16
8||||
|9,
958|
|||||
10,8
08|||
||||
10,9
57|||
||||
11.9
%
East
ern
Iow
a4,
438|
|18
,230
||||||
||||||
11,7
57|||
||||
14,8
94|||
||||||
39,4
73|||
||||||
||||||
||||||
|||||
54.8
%
Kirk
woo
d13
,422
||||||
||15
,660
||||||
||||
14,2
76|||
||||||
17,9
06|||
||||||
||23
,395
||||||
||||||
|||11
.8%
Des
Moi
nes
Are
a55
,235
||||||
||||||
||||||
||||||
||||||
||||||
63,3
49|||
||||||
||||||
||||||
||||||
||||||
||||||
|||73
,072
||||||
||||||
||||||
||||||
||||||
||||||
||||||
||||||
75,9
14|||
||||||
||||||
||||||
||||||
||||||
||||||
||||||
|||||
93,9
14|||
||||||
||||||
||||||
||||||
||||||
||||||
||||||
||||||
||||||
|||||
11.2
%
Wes
tern
Iow
a Te
ch14
,386
||||||
|||16
,240
||||||
||||
12,7
66|||
|||||
11,5
46|||
||||
12,8
65|||
|||||
-2.2
%
Iow
a W
este
rn15
,052
||||||
||||
18,3
30|||
||||||
|||15
,647
||||||
||||
17,6
45|||
||||||
||17
,468
||||||
|||||
3.0%
Sout
hwes
tern
4,73
5|||
4,78
8|||
5,24
4|||
5,40
4|||
5,28
3|||
2.2%
Indi
an H
ills
4,51
4|||
5,56
8|||
7,72
7||||
|8,
445|
||||
12,0
80|||
|||||
21.8
%
Sout
heas
tern
5,44
0|||
4,33
7||
4,84
3|||
5,55
1|||
7,00
5||||
5.2%
Tota
l18
9,31
322
4,98
523
5,15
226
0,62
930
4,36
210
.0%
No
te: E
ach
bar
“|”
deno
tes
1,50
0 cr
edit
hour
s.
So
ur
ce: I
owa
Dep
artm
ent o
f Edu
catio
n, D
ivis
ion
of C
omm
unity
Col
lege
s an
d W
orkf
orce
Pre
para
tion,
Com
mun
ity C
olle
ge M
IS.
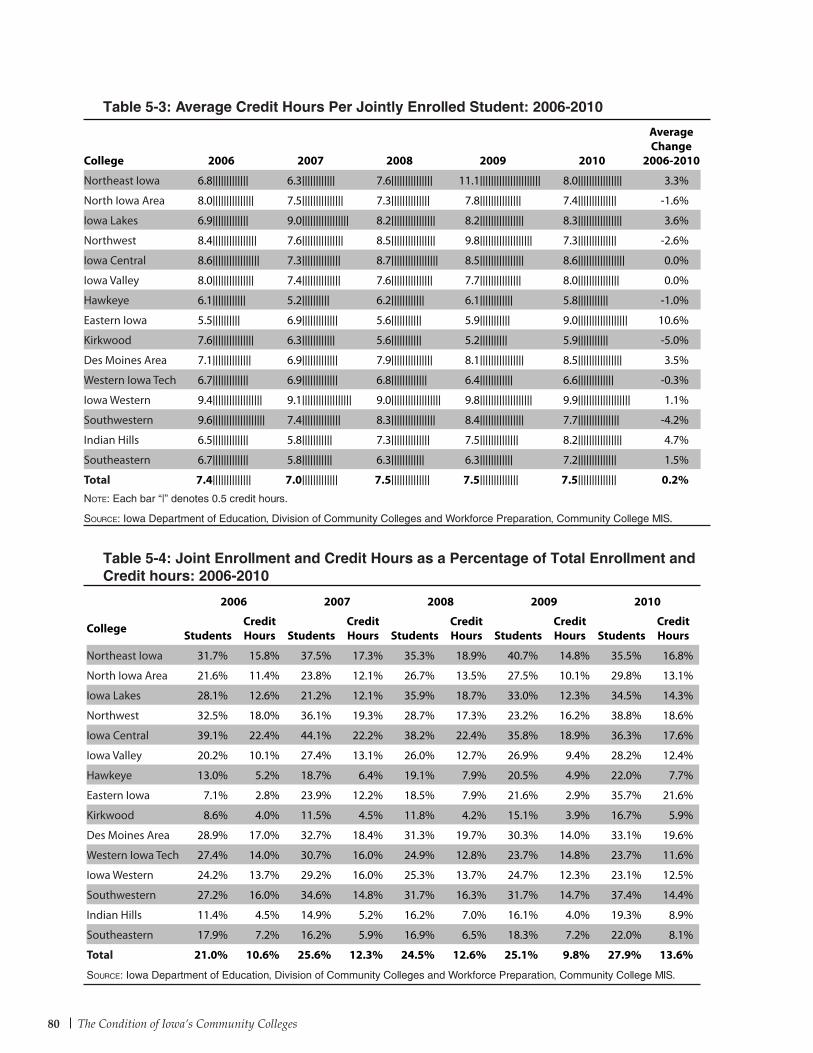
80 The Condition of Iowa’s Community Colleges
Table 5-3: Average Credit Hours Per Jointly Enrolled Student: 2006-2010
2006 2007 2008 2009 2010
Average Change
2006-2010College
Northeast Iowa 6.8||||||||||||| 6.3|||||||||||| 7.6||||||||||||||| 11.1|||||||||||||||||||||| 8.0|||||||||||||||| 3.3%
North Iowa Area 8.0||||||||||||||| 7.5||||||||||||||| 7.3|||||||||||||| 7.8||||||||||||||| 7.4|||||||||||||| -1.6%
Iowa Lakes 6.9||||||||||||| 9.0||||||||||||||||| 8.2|||||||||||||||| 8.2|||||||||||||||| 8.3|||||||||||||||| 3.6%
Northwest 8.4|||||||||||||||| 7.6||||||||||||||| 8.5|||||||||||||||| 9.8||||||||||||||||||| 7.3|||||||||||||| -2.6%
Iowa Central 8.6||||||||||||||||| 7.3|||||||||||||| 8.7||||||||||||||||| 8.5|||||||||||||||| 8.6||||||||||||||||| 0.0%
Iowa Valley 8.0||||||||||||||| 7.4|||||||||||||| 7.6||||||||||||||| 7.7||||||||||||||| 8.0||||||||||||||| 0.0%
Hawkeye 6.1|||||||||||| 5.2|||||||||| 6.2|||||||||||| 6.1|||||||||||| 5.8||||||||||| -1.0%
Eastern Iowa 5.5|||||||||| 6.9||||||||||||| 5.6||||||||||| 5.9||||||||||| 9.0|||||||||||||||||| 10.6%
Kirkwood 7.6||||||||||||||| 6.3|||||||||||| 5.6||||||||||| 5.2|||||||||| 5.9||||||||||| -5.0%
Des Moines Area 7.1|||||||||||||| 6.9||||||||||||| 7.9||||||||||||||| 8.1|||||||||||||||| 8.5|||||||||||||||| 3.5%
Western Iowa Tech 6.7||||||||||||| 6.9||||||||||||| 6.8||||||||||||| 6.4|||||||||||| 6.6||||||||||||| -0.3%
Iowa Western 9.4|||||||||||||||||| 9.1|||||||||||||||||| 9.0|||||||||||||||||| 9.8||||||||||||||||||| 9.9||||||||||||||||||| 1.1%
Southwestern 9.6||||||||||||||||||| 7.4|||||||||||||| 8.3|||||||||||||||| 8.4|||||||||||||||| 7.7||||||||||||||| -4.2%
Indian Hills 6.5||||||||||||| 5.8||||||||||| 7.3|||||||||||||| 7.5|||||||||||||| 8.2|||||||||||||||| 4.7%
Southeastern 6.7||||||||||||| 5.8||||||||||| 6.3|||||||||||| 6.3|||||||||||| 7.2|||||||||||||| 1.5%
Total 7.4|||||||||||||| 7.0||||||||||||| 7.5|||||||||||||| 7.5|||||||||||||| 7.5|||||||||||||| 0.2%Note: Each bar “|” denotes 0.5 credit hours.
Source: Iowa Department of Education, Division of Community Colleges and Workforce Preparation, Community College MIS.
Table 5-4: Joint Enrollment and Credit Hours as a Percentage of Total Enrollment and Credit hours: 2006-2010
2006 2007 2008 2009 2010
College StudentsCredit Hours Students
Credit Hours Students
Credit Hours Students
Credit Hours Students
Credit Hours
Northeast Iowa 31.7% 15.8% 37.5% 17.3% 35.3% 18.9% 40.7% 14.8% 35.5% 16.8%
North Iowa Area 21.6% 11.4% 23.8% 12.1% 26.7% 13.5% 27.5% 10.1% 29.8% 13.1%
Iowa Lakes 28.1% 12.6% 21.2% 12.1% 35.9% 18.7% 33.0% 12.3% 34.5% 14.3%
Northwest 32.5% 18.0% 36.1% 19.3% 28.7% 17.3% 23.2% 16.2% 38.8% 18.6%
Iowa Central 39.1% 22.4% 44.1% 22.2% 38.2% 22.4% 35.8% 18.9% 36.3% 17.6%
Iowa Valley 20.2% 10.1% 27.4% 13.1% 26.0% 12.7% 26.9% 9.4% 28.2% 12.4%
Hawkeye 13.0% 5.2% 18.7% 6.4% 19.1% 7.9% 20.5% 4.9% 22.0% 7.7%
Eastern Iowa 7.1% 2.8% 23.9% 12.2% 18.5% 7.9% 21.6% 2.9% 35.7% 21.6%
Kirkwood 8.6% 4.0% 11.5% 4.5% 11.8% 4.2% 15.1% 3.9% 16.7% 5.9%
Des Moines Area 28.9% 17.0% 32.7% 18.4% 31.3% 19.7% 30.3% 14.0% 33.1% 19.6%
Western Iowa Tech 27.4% 14.0% 30.7% 16.0% 24.9% 12.8% 23.7% 14.8% 23.7% 11.6%
Iowa Western 24.2% 13.7% 29.2% 16.0% 25.3% 13.7% 24.7% 12.3% 23.1% 12.5%
Southwestern 27.2% 16.0% 34.6% 14.8% 31.7% 16.3% 31.7% 14.7% 37.4% 14.4%
Indian Hills 11.4% 4.5% 14.9% 5.2% 16.2% 7.0% 16.1% 4.0% 19.3% 8.9%
Southeastern 17.9% 7.2% 16.2% 5.9% 16.9% 6.5% 18.3% 7.2% 22.0% 8.1%
Total 21.0% 10.6% 25.6% 12.3% 24.5% 12.6% 25.1% 9.8% 27.9% 13.6%
Source: Iowa Department of Education, Division of Community Colleges and Workforce Preparation, Community College MIS.
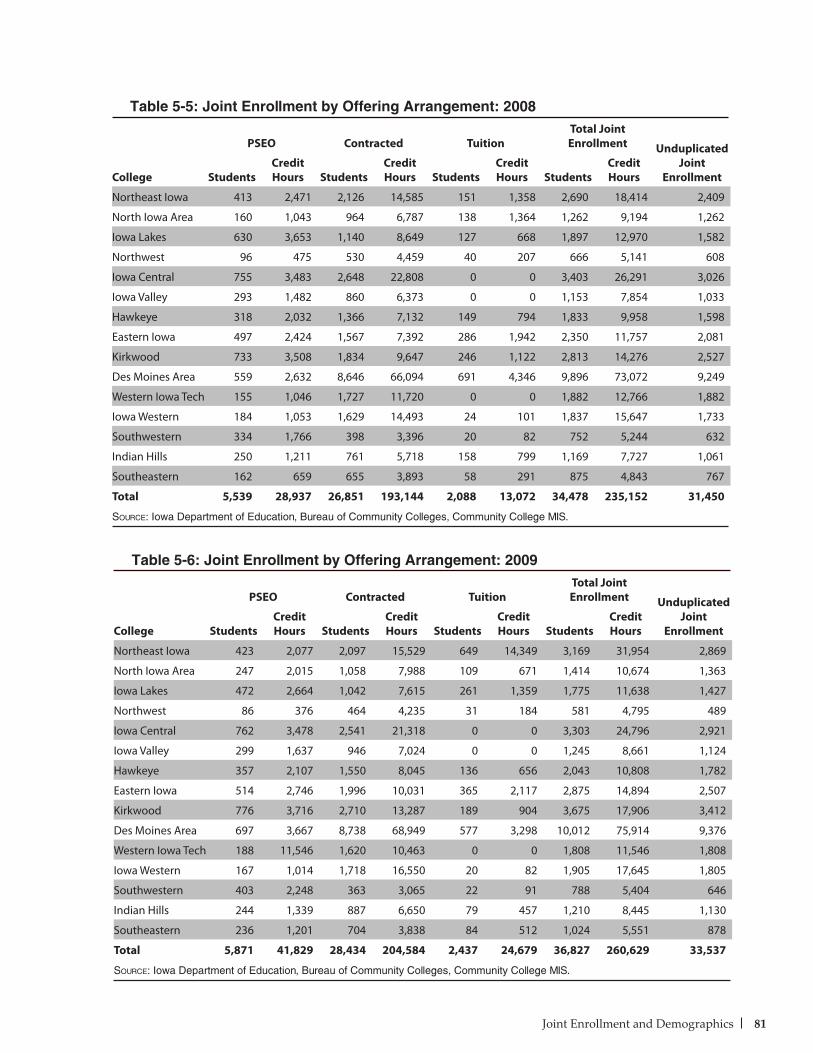
81Joint Enrollment and Demographics
College
PSEO Contracted TuitionTotal Joint Enrollment Unduplicated
Joint EnrollmentStudents
Credit Hours Students
Credit Hours Students
Credit Hours Students
Credit Hours
Northeast Iowa 423 2,077 2,097 15,529 649 14,349 3,169 31,954 2,869
North Iowa Area 247 2,015 1,058 7,988 109 671 1,414 10,674 1,363
Iowa Lakes 472 2,664 1,042 7,615 261 1,359 1,775 11,638 1,427
Northwest 86 376 464 4,235 31 184 581 4,795 489
Iowa Central 762 3,478 2,541 21,318 0 0 3,303 24,796 2,921
Iowa Valley 299 1,637 946 7,024 0 0 1,245 8,661 1,124
Hawkeye 357 2,107 1,550 8,045 136 656 2,043 10,808 1,782
Eastern Iowa 514 2,746 1,996 10,031 365 2,117 2,875 14,894 2,507
Kirkwood 776 3,716 2,710 13,287 189 904 3,675 17,906 3,412
Des Moines Area 697 3,667 8,738 68,949 577 3,298 10,012 75,914 9,376
Western Iowa Tech 188 11,546 1,620 10,463 0 0 1,808 11,546 1,808
Iowa Western 167 1,014 1,718 16,550 20 82 1,905 17,645 1,805
Southwestern 403 2,248 363 3,065 22 91 788 5,404 646
Indian Hills 244 1,339 887 6,650 79 457 1,210 8,445 1,130
Southeastern 236 1,201 704 3,838 84 512 1,024 5,551 878
Total 5,871 41,829 28,434 204,584 2,437 24,679 36,827 260,629 33,537
Source: Iowa Department of Education, Bureau of Community Colleges, Community College MIS.
Table 5-6: Joint Enrollment by Offering Arrangement: 2009
College
PSEO Contracted TuitionTotal Joint Enrollment Unduplicated
Joint EnrollmentStudents
Credit Hours Students
Credit Hours Students
Credit Hours Students
Credit Hours
Northeast Iowa 413 2,471 2,126 14,585 151 1,358 2,690 18,414 2,409
North Iowa Area 160 1,043 964 6,787 138 1,364 1,262 9,194 1,262
Iowa Lakes 630 3,653 1,140 8,649 127 668 1,897 12,970 1,582
Northwest 96 475 530 4,459 40 207 666 5,141 608
Iowa Central 755 3,483 2,648 22,808 0 0 3,403 26,291 3,026
Iowa Valley 293 1,482 860 6,373 0 0 1,153 7,854 1,033
Hawkeye 318 2,032 1,366 7,132 149 794 1,833 9,958 1,598
Eastern Iowa 497 2,424 1,567 7,392 286 1,942 2,350 11,757 2,081
Kirkwood 733 3,508 1,834 9,647 246 1,122 2,813 14,276 2,527
Des Moines Area 559 2,632 8,646 66,094 691 4,346 9,896 73,072 9,249
Western Iowa Tech 155 1,046 1,727 11,720 0 0 1,882 12,766 1,882
Iowa Western 184 1,053 1,629 14,493 24 101 1,837 15,647 1,733
Southwestern 334 1,766 398 3,396 20 82 752 5,244 632
Indian Hills 250 1,211 761 5,718 158 799 1,169 7,727 1,061
Southeastern 162 659 655 3,893 58 291 875 4,843 767
Total 5,539 28,937 26,851 193,144 2,088 13,072 34,478 235,152 31,450
Source: Iowa Department of Education, Bureau of Community Colleges, Community College MIS.
Table 5-5: Joint Enrollment by Offering Arrangement: 2008
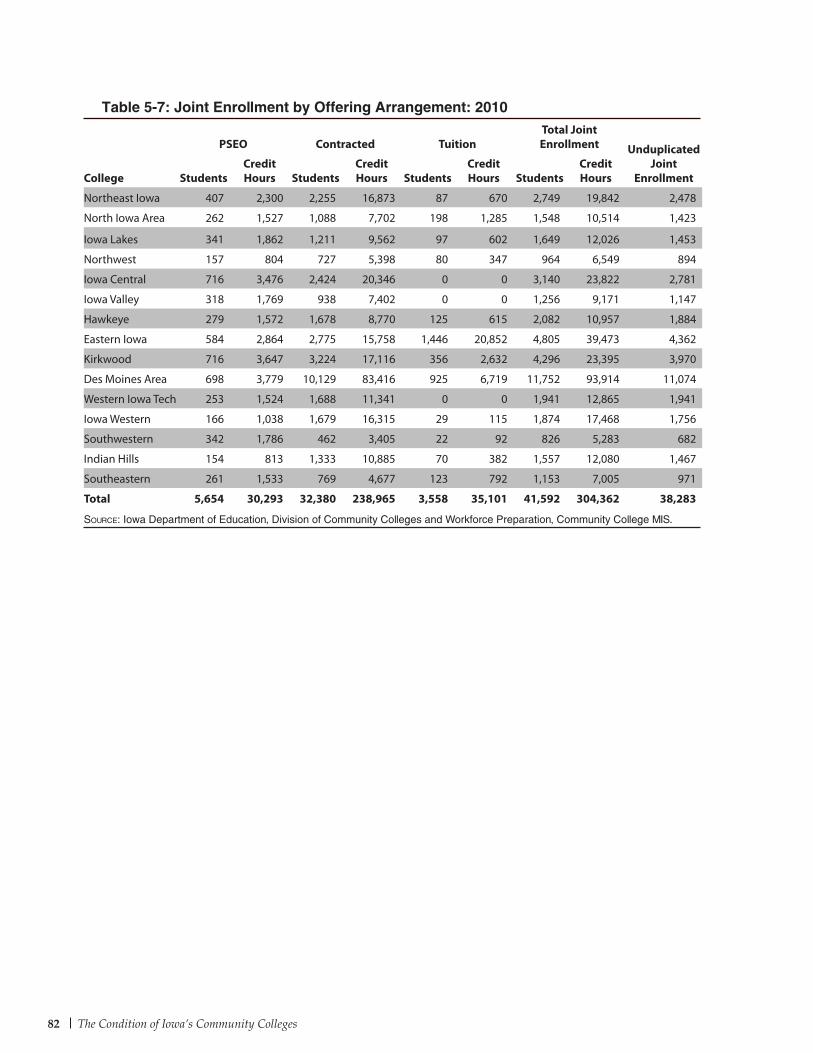
82 The Condition of Iowa’s Community Colleges
College
PSEO Contracted TuitionTotal Joint Enrollment Unduplicated
Joint EnrollmentStudents
Credit Hours Students
Credit Hours Students
Credit Hours Students
Credit Hours
Northeast Iowa 407 2,300 2,255 16,873 87 670 2,749 19,842 2,478
North Iowa Area 262 1,527 1,088 7,702 198 1,285 1,548 10,514 1,423
Iowa Lakes 341 1,862 1,211 9,562 97 602 1,649 12,026 1,453
Northwest 157 804 727 5,398 80 347 964 6,549 894
Iowa Central 716 3,476 2,424 20,346 0 0 3,140 23,822 2,781
Iowa Valley 318 1,769 938 7,402 0 0 1,256 9,171 1,147
Hawkeye 279 1,572 1,678 8,770 125 615 2,082 10,957 1,884
Eastern Iowa 584 2,864 2,775 15,758 1,446 20,852 4,805 39,473 4,362
Kirkwood 716 3,647 3,224 17,116 356 2,632 4,296 23,395 3,970
Des Moines Area 698 3,779 10,129 83,416 925 6,719 11,752 93,914 11,074
Western Iowa Tech 253 1,524 1,688 11,341 0 0 1,941 12,865 1,941
Iowa Western 166 1,038 1,679 16,315 29 115 1,874 17,468 1,756
Southwestern 342 1,786 462 3,405 22 92 826 5,283 682
Indian Hills 154 813 1,333 10,885 70 382 1,557 12,080 1,467
Southeastern 261 1,533 769 4,677 123 792 1,153 7,005 971
Total 5,654 30,293 32,380 238,965 3,558 35,101 41,592 304,362 38,283
Source: Iowa Department of Education, Division of Community Colleges and Workforce Preparation, Community College MIS.
Table 5-7: Joint Enrollment by Offering Arrangement: 2010
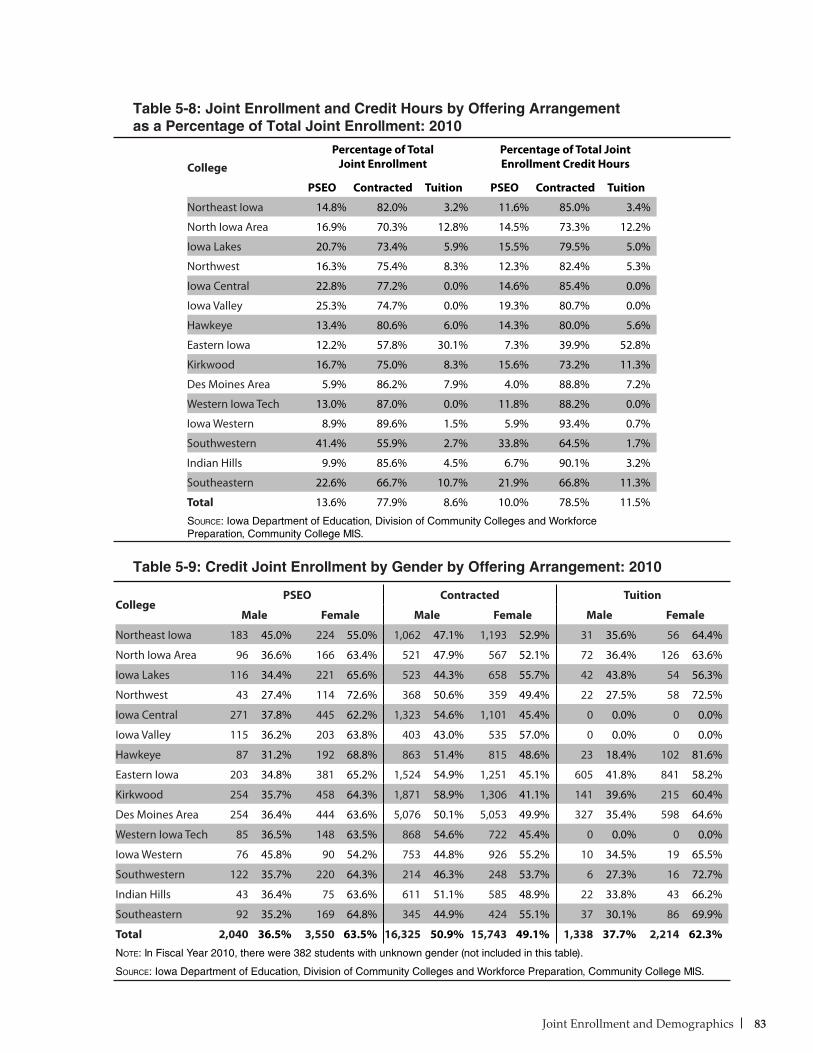
83Joint Enrollment and Demographics
Table 5-8: Joint Enrollment and Credit Hours by Offering Arrangement as a Percentage of Total Joint Enrollment: 2010
CollegePercentage of Total
Joint EnrollmentPercentage of Total Joint Enrollment Credit Hours
PSEO Contracted Tuition PSEO Contracted Tuition
Northeast Iowa 14.8% 82.0% 3.2% 11.6% 85.0% 3.4%
North Iowa Area 16.9% 70.3% 12.8% 14.5% 73.3% 12.2%
Iowa Lakes 20.7% 73.4% 5.9% 15.5% 79.5% 5.0%
Northwest 16.3% 75.4% 8.3% 12.3% 82.4% 5.3%
Iowa Central 22.8% 77.2% 0.0% 14.6% 85.4% 0.0%
Iowa Valley 25.3% 74.7% 0.0% 19.3% 80.7% 0.0%
Hawkeye 13.4% 80.6% 6.0% 14.3% 80.0% 5.6%
Eastern Iowa 12.2% 57.8% 30.1% 7.3% 39.9% 52.8%
Kirkwood 16.7% 75.0% 8.3% 15.6% 73.2% 11.3%
Des Moines Area 5.9% 86.2% 7.9% 4.0% 88.8% 7.2%
Western Iowa Tech 13.0% 87.0% 0.0% 11.8% 88.2% 0.0%
Iowa Western 8.9% 89.6% 1.5% 5.9% 93.4% 0.7%
Southwestern 41.4% 55.9% 2.7% 33.8% 64.5% 1.7%
Indian Hills 9.9% 85.6% 4.5% 6.7% 90.1% 3.2%
Southeastern 22.6% 66.7% 10.7% 21.9% 66.8% 11.3%
Total 13.6% 77.9% 8.6% 10.0% 78.5% 11.5%
Source: Iowa Department of Education, Division of Community Colleges and Workforce Preparation, Community College MIS.
Table 5-9: Credit Joint Enrollment by Gender by Offering Arrangement: 2010
CollegePSEO Contracted Tuition
Male Female Male Female Male Female
Northeast Iowa 183 45.0% 224 55.0% 1,062 47.1% 1,193 52.9% 31 35.6% 56 64.4%
North Iowa Area 96 36.6% 166 63.4% 521 47.9% 567 52.1% 72 36.4% 126 63.6%
Iowa Lakes 116 34.4% 221 65.6% 523 44.3% 658 55.7% 42 43.8% 54 56.3%
Northwest 43 27.4% 114 72.6% 368 50.6% 359 49.4% 22 27.5% 58 72.5%
Iowa Central 271 37.8% 445 62.2% 1,323 54.6% 1,101 45.4% 0 0.0% 0 0.0%
Iowa Valley 115 36.2% 203 63.8% 403 43.0% 535 57.0% 0 0.0% 0 0.0%
Hawkeye 87 31.2% 192 68.8% 863 51.4% 815 48.6% 23 18.4% 102 81.6%
Eastern Iowa 203 34.8% 381 65.2% 1,524 54.9% 1,251 45.1% 605 41.8% 841 58.2%
Kirkwood 254 35.7% 458 64.3% 1,871 58.9% 1,306 41.1% 141 39.6% 215 60.4%
Des Moines Area 254 36.4% 444 63.6% 5,076 50.1% 5,053 49.9% 327 35.4% 598 64.6%
Western Iowa Tech 85 36.5% 148 63.5% 868 54.6% 722 45.4% 0 0.0% 0 0.0%
Iowa Western 76 45.8% 90 54.2% 753 44.8% 926 55.2% 10 34.5% 19 65.5%
Southwestern 122 35.7% 220 64.3% 214 46.3% 248 53.7% 6 27.3% 16 72.7%
Indian Hills 43 36.4% 75 63.6% 611 51.1% 585 48.9% 22 33.8% 43 66.2%
Southeastern 92 35.2% 169 64.8% 345 44.9% 424 55.1% 37 30.1% 86 69.9%
Total 2,040 36.5% 3,550 63.5% 16,325 50.9% 15,743 49.1% 1,338 37.7% 2,214 62.3%Note: In Fiscal Year 2010, there were 382 students with unknown gender (not included in this table).
Source: Iowa Department of Education, Division of Community Colleges and Workforce Preparation, Community College MIS.
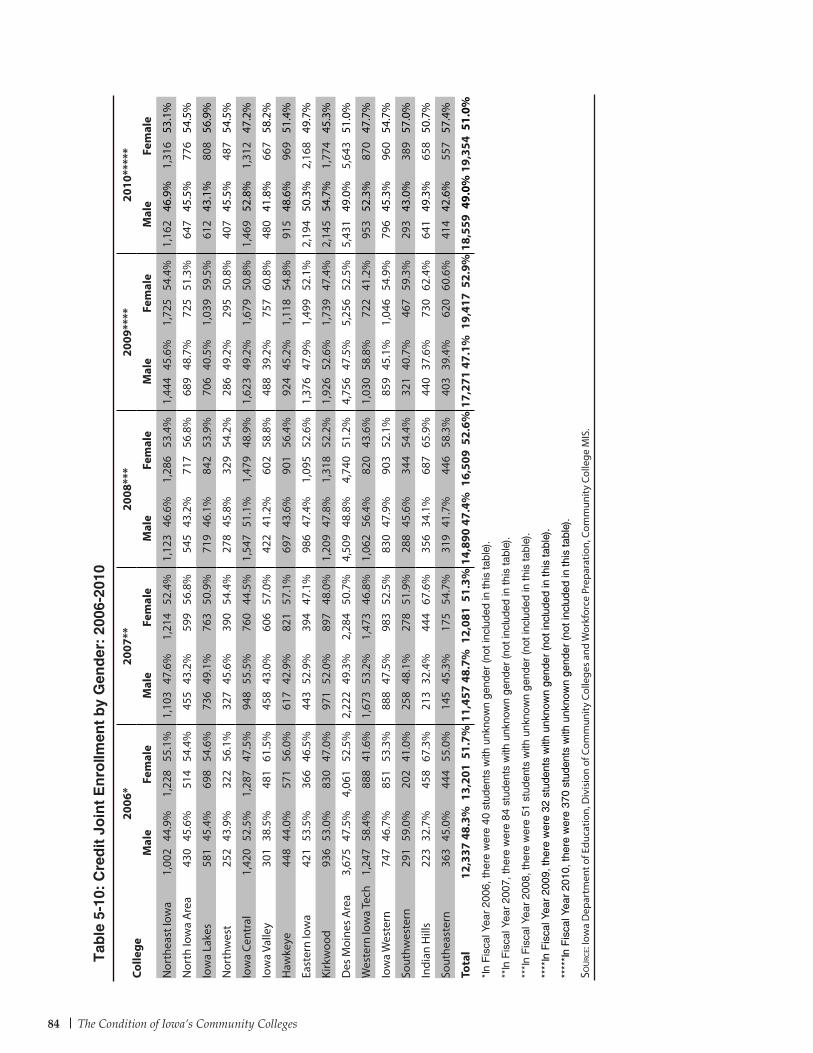
84 The Condition of Iowa’s Community Colleges
Tab
le 5
-10:
Cre
dit
Jo
int
En
rollm
ent
by
Gen
der
: 20
06-2
010
Colle
ge20
06*
2007
**20
08**
*20
09**
**20
10**
***
Mal
eFe
mal
eM
ale
Fem
ale
Mal
eFe
mal
eM
ale
Fem
ale
Mal
eFe
mal
e
Nor
thea
st Io
wa
1,00
244
.9%
1,22
855
.1%
1,10
347
.6%
1,21
452
.4%
1,12
346
.6%
1,28
653
.4%
1,44
445
.6%
1,72
554
.4%
1,16
246
.9%
1,31
653
.1%
Nor
th Io
wa
Are
a43
045
.6%
514
54.4
%45
543
.2%
599
56.8
%54
543
.2%
717
56.8
%68
948
.7%
725
51.3
%64
745
.5%
776
54.5
%
Iow
a La
kes
581
45.4
%69
854
.6%
736
49.1
%76
350
.9%
719
46.1
%84
253
.9%
706
40.5
%1,
039
59.5
%61
243
.1%
808
56.9
%
Nor
thw
est
252
43.9
%32
256
.1%
327
45.6
%39
054
.4%
278
45.8
%32
954
.2%
286
49.2
%29
550
.8%
407
45.5
%48
754
.5%
Iow
a Ce
ntra
l1,
420
52.5
%1,
287
47.5
%94
855
.5%
760
44.5
%1,
547
51.1
%1,
479
48.9
%1,
623
49.2
%1,
679
50.8
%1,
469
52.8
%1,
312
47.2
%
Iow
a Va
lley
301
38.5
%48
161
.5%
458
43.0
%60
657
.0%
422
41.2
%60
258
.8%
488
39.2
%75
760
.8%
480
41.8
%66
758
.2%
Haw
keye
448
44.0
%57
156
.0%
617
42.9
%82
157
.1%
697
43.6
%90
156
.4%
924
45.2
%1,
118
54.8
%91
548
.6%
969
51.4
%
East
ern
Iow
a42
153
.5%
366
46.5
%44
352
.9%
394
47.1
%98
647
.4%
1,09
552
.6%
1,37
647
.9%
1,49
952
.1%
2,19
450
.3%
2,16
849
.7%
Kirk
woo
d93
653
.0%
830
47.0
%97
152
.0%
897
48.0
%1,
209
47.8
%1,
318
52.2
%1,
926
52.6
%1,
739
47.4
%2,
145
54.7
%1,
774
45.3
%
Des
Moi
nes
Are
a3,
675
47.5
%4,
061
52.5
%2,
222
49.3
%2,
284
50.7
%4,
509
48.8
%4,
740
51.2
%4,
756
47.5
%5,
256
52.5
%5,
431
49.0
%5,
643
51.0
%
Wes
tern
Iow
a Te
ch1,
247
58.4
%88
841
.6%
1,67
353
.2%
1,47
346
.8%
1,06
256
.4%
820
43.6
%1,
030
58.8
%72
241
.2%
953
52.3
%87
047
.7%
Iow
a W
este
rn74
746
.7%
851
53.3
%88
847
.5%
983
52.5
%83
047
.9%
903
52.1
%85
945
.1%
1,04
654
.9%
796
45.3
%96
054
.7%
Sout
hwes
tern
291
59.0
%20
241
.0%
258
48.1
%27
851
.9%
288
45.6
%34
454
.4%
321
40.7
%46
759
.3%
293
43.0
%38
957
.0%
Indi
an H
ills
223
32.7
%45
867
.3%
213
32.4
%44
467
.6%
356
34.1
%68
765
.9%
440
37.6
%73
062
.4%
641
49.3
%65
850
.7%
Sout
heas
tern
363
45.0
%44
455
.0%
145
45.3
%17
554
.7%
319
41.7
%44
658
.3%
403
39.4
%62
060
.6%
414
42.6
%55
757
.4%
Tota
l12
,337
48.3
%13
,201
51.7
%11
,457
48.7
%12
,081
51.3
%14
,890
47.4
%16
,509
52.6
%17
,271
47.1
%19
,417
52.9
%18
,559
49.0
%19
,354
51.0
%
*In
Fis
cal Y
ear
2006
, the
re w
ere
40 s
tude
nts
with
unk
now
n ge
nder
(not
incl
uded
in th
is ta
ble)
.
**In
Fis
cal Y
ear
2007
, the
re w
ere
84 s
tude
nts
with
unk
now
n ge
nder
(not
incl
uded
in th
is ta
ble)
.
***I
n F
isca
l Yea
r 20
08, t
here
wer
e 51
stu
dent
s w
ith u
nkno
wn
gend
er (n
ot in
clud
ed in
this
tabl
e).
****
In F
isca
l Yea
r 20
09, t
here
wer
e 32
stu
dent
s w
ith u
nkno
wn
gend
er (n
ot in
clud
ed in
this
tabl
e).
****
*In
Fis
cal Y
ear
2010
, the
re w
ere
370
stud
ents
with
unk
now
n ge
nder
(not
incl
uded
in th
is ta
ble)
.
Sourc
e: Io
wa
Dep
artm
ent o
f Edu
catio
n, D
ivis
ion
of C
omm
unity
Col
lege
s an
d W
orkf
orce
Pre
para
tion,
Com
mun
ity C
olle
ge M
IS.
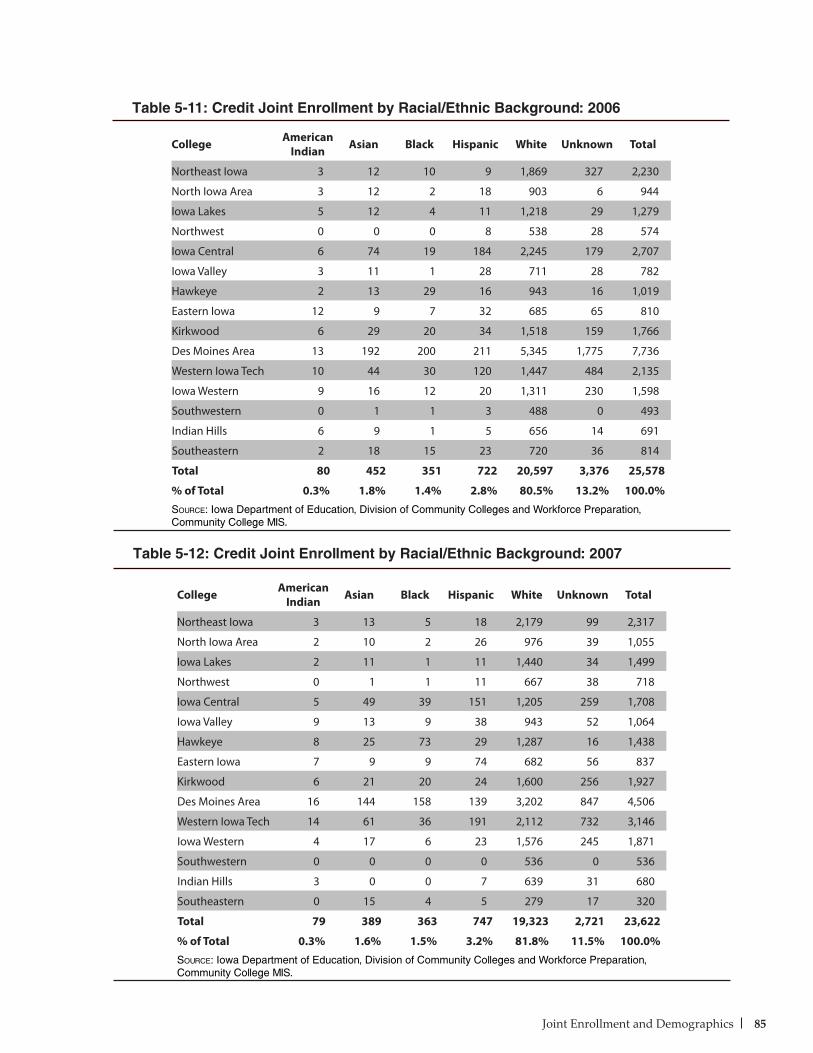
85Joint Enrollment and Demographics
College American Indian Asian Black Hispanic White Unknown Total
Northeast Iowa 3 12 10 9 1,869 327 2,230
North Iowa Area 3 12 2 18 903 6 944
Iowa Lakes 5 12 4 11 1,218 29 1,279
Northwest 0 0 0 8 538 28 574
Iowa Central 6 74 19 184 2,245 179 2,707
Iowa Valley 3 11 1 28 711 28 782
Hawkeye 2 13 29 16 943 16 1,019
Eastern Iowa 12 9 7 32 685 65 810
Kirkwood 6 29 20 34 1,518 159 1,766
Des Moines Area 13 192 200 211 5,345 1,775 7,736
Western Iowa Tech 10 44 30 120 1,447 484 2,135
Iowa Western 9 16 12 20 1,311 230 1,598
Southwestern 0 1 1 3 488 0 493
Indian Hills 6 9 1 5 656 14 691
Southeastern 2 18 15 23 720 36 814
Total 80 452 351 722 20,597 3,376 25,578
% of Total 0.3% 1.8% 1.4% 2.8% 80.5% 13.2% 100.0%Source: Iowa Department of Education, Division of Community Colleges and Workforce Preparation, Community College MIS.
Table 5-11: Credit Joint Enrollment by Racial/Ethnic Background: 2006
College American Indian Asian Black Hispanic White Unknown Total
Northeast Iowa 3 13 5 18 2,179 99 2,317
North Iowa Area 2 10 2 26 976 39 1,055
Iowa Lakes 2 11 1 11 1,440 34 1,499
Northwest 0 1 1 11 667 38 718
Iowa Central 5 49 39 151 1,205 259 1,708
Iowa Valley 9 13 9 38 943 52 1,064
Hawkeye 8 25 73 29 1,287 16 1,438
Eastern Iowa 7 9 9 74 682 56 837
Kirkwood 6 21 20 24 1,600 256 1,927
Des Moines Area 16 144 158 139 3,202 847 4,506
Western Iowa Tech 14 61 36 191 2,112 732 3,146
Iowa Western 4 17 6 23 1,576 245 1,871
Southwestern 0 0 0 0 536 0 536
Indian Hills 3 0 0 7 639 31 680
Southeastern 0 15 4 5 279 17 320
Total 79 389 363 747 19,323 2,721 23,622
% of Total 0.3% 1.6% 1.5% 3.2% 81.8% 11.5% 100.0%Source: Iowa Department of Education, Division of Community Colleges and Workforce Preparation, Community College MIS.
Table 5-12: Credit Joint Enrollment by Racial/Ethnic Background: 2007
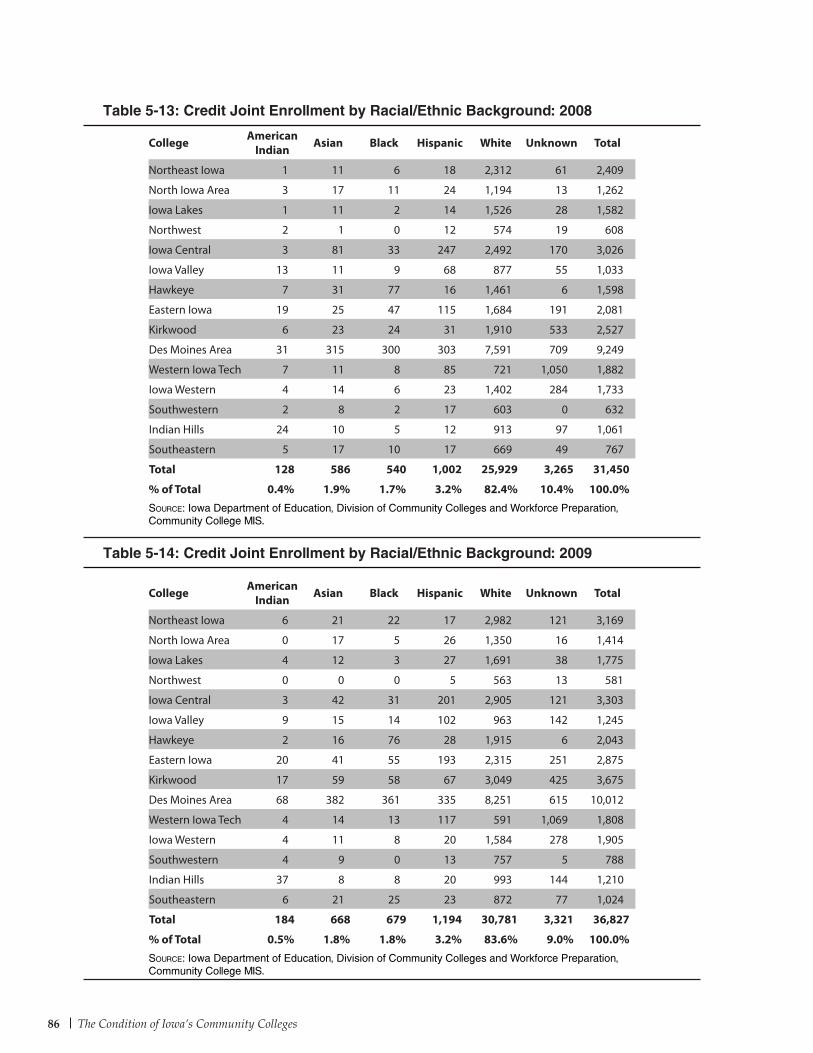
86 The Condition of Iowa’s Community Colleges
College American Indian Asian Black Hispanic White Unknown Total
Northeast Iowa 6 21 22 17 2,982 121 3,169
North Iowa Area 0 17 5 26 1,350 16 1,414
Iowa Lakes 4 12 3 27 1,691 38 1,775
Northwest 0 0 0 5 563 13 581
Iowa Central 3 42 31 201 2,905 121 3,303
Iowa Valley 9 15 14 102 963 142 1,245
Hawkeye 2 16 76 28 1,915 6 2,043
Eastern Iowa 20 41 55 193 2,315 251 2,875
Kirkwood 17 59 58 67 3,049 425 3,675
Des Moines Area 68 382 361 335 8,251 615 10,012
Western Iowa Tech 4 14 13 117 591 1,069 1,808
Iowa Western 4 11 8 20 1,584 278 1,905
Southwestern 4 9 0 13 757 5 788
Indian Hills 37 8 8 20 993 144 1,210
Southeastern 6 21 25 23 872 77 1,024
Total 184 668 679 1,194 30,781 3,321 36,827
% of Total 0.5% 1.8% 1.8% 3.2% 83.6% 9.0% 100.0%Source: Iowa Department of Education, Division of Community Colleges and Workforce Preparation, Community College MIS.
College American Indian Asian Black Hispanic White Unknown Total
Northeast Iowa 1 11 6 18 2,312 61 2,409
North Iowa Area 3 17 11 24 1,194 13 1,262
Iowa Lakes 1 11 2 14 1,526 28 1,582
Northwest 2 1 0 12 574 19 608
Iowa Central 3 81 33 247 2,492 170 3,026
Iowa Valley 13 11 9 68 877 55 1,033
Hawkeye 7 31 77 16 1,461 6 1,598
Eastern Iowa 19 25 47 115 1,684 191 2,081
Kirkwood 6 23 24 31 1,910 533 2,527
Des Moines Area 31 315 300 303 7,591 709 9,249
Western Iowa Tech 7 11 8 85 721 1,050 1,882
Iowa Western 4 14 6 23 1,402 284 1,733
Southwestern 2 8 2 17 603 0 632
Indian Hills 24 10 5 12 913 97 1,061
Southeastern 5 17 10 17 669 49 767
Total 128 586 540 1,002 25,929 3,265 31,450
% of Total 0.4% 1.9% 1.7% 3.2% 82.4% 10.4% 100.0%Source: Iowa Department of Education, Division of Community Colleges and Workforce Preparation, Community College MIS.
Table 5-13: Credit Joint Enrollment by Racial/Ethnic Background: 2008
Table 5-14: Credit Joint Enrollment by Racial/Ethnic Background: 2009
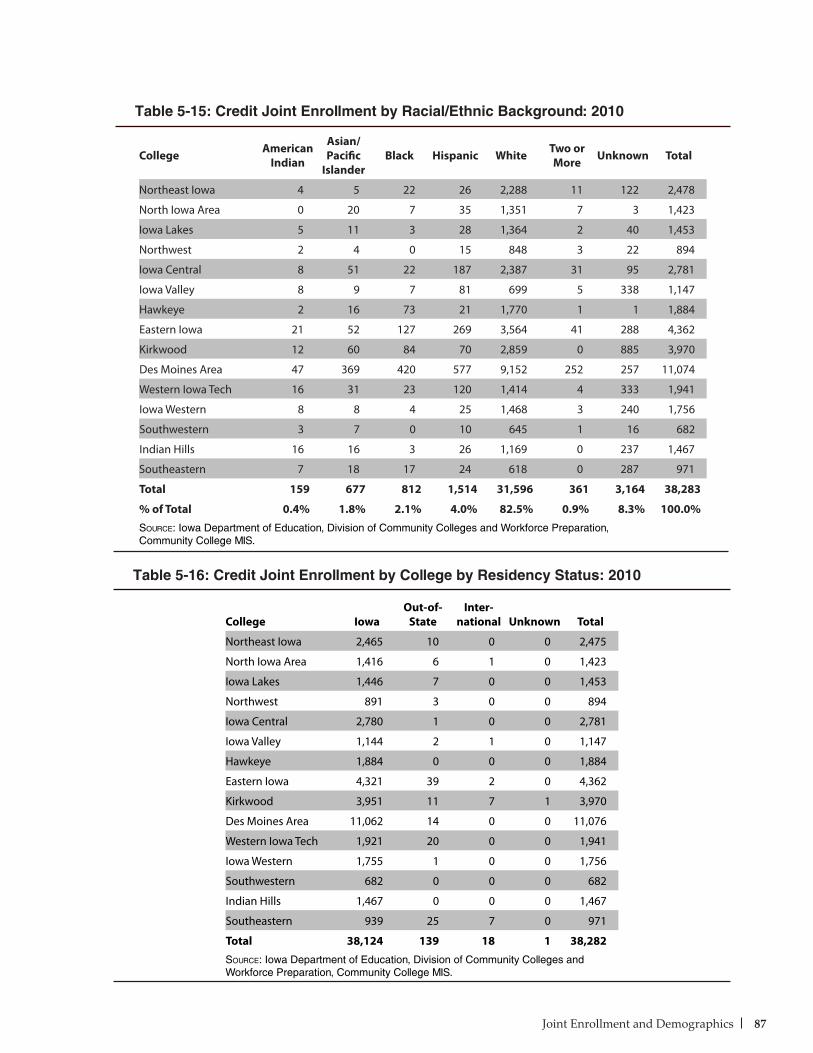
87Joint Enrollment and Demographics
Table 5-15: Credit Joint Enrollment by Racial/Ethnic Background: 2010
College American Indian
Asian/Pacific
IslanderBlack Hispanic White Two or
More Unknown Total
Northeast Iowa 4 5 22 26 2,288 11 122 2,478
North Iowa Area 0 20 7 35 1,351 7 3 1,423
Iowa Lakes 5 11 3 28 1,364 2 40 1,453
Northwest 2 4 0 15 848 3 22 894
Iowa Central 8 51 22 187 2,387 31 95 2,781
Iowa Valley 8 9 7 81 699 5 338 1,147
Hawkeye 2 16 73 21 1,770 1 1 1,884
Eastern Iowa 21 52 127 269 3,564 41 288 4,362
Kirkwood 12 60 84 70 2,859 0 885 3,970
Des Moines Area 47 369 420 577 9,152 252 257 11,074
Western Iowa Tech 16 31 23 120 1,414 4 333 1,941
Iowa Western 8 8 4 25 1,468 3 240 1,756
Southwestern 3 7 0 10 645 1 16 682
Indian Hills 16 16 3 26 1,169 0 237 1,467
Southeastern 7 18 17 24 618 0 287 971
Total 159 677 812 1,514 31,596 361 3,164 38,283
% of Total 0.4% 1.8% 2.1% 4.0% 82.5% 0.9% 8.3% 100.0%Source: Iowa Department of Education, Division of Community Colleges and Workforce Preparation, Community College MIS.
Table 5-16: Credit Joint Enrollment by College by Residency Status: 2010
College IowaOut-of-
StateInter-
national Unknown Total
Northeast Iowa 2,465 10 0 0 2,475
North Iowa Area 1,416 6 1 0 1,423
Iowa Lakes 1,446 7 0 0 1,453
Northwest 891 3 0 0 894
Iowa Central 2,780 1 0 0 2,781
Iowa Valley 1,144 2 1 0 1,147
Hawkeye 1,884 0 0 0 1,884
Eastern Iowa 4,321 39 2 0 4,362
Kirkwood 3,951 11 7 1 3,970
Des Moines Area 11,062 14 0 0 11,076
Western Iowa Tech 1,921 20 0 0 1,941
Iowa Western 1,755 1 0 0 1,756
Southwestern 682 0 0 0 682
Indian Hills 1,467 0 0 0 1,467
Southeastern 939 25 7 0 971
Total 38,124 139 18 1 38,282Source: Iowa Department of Education, Division of Community Colleges and Workforce Preparation, Community College MIS.
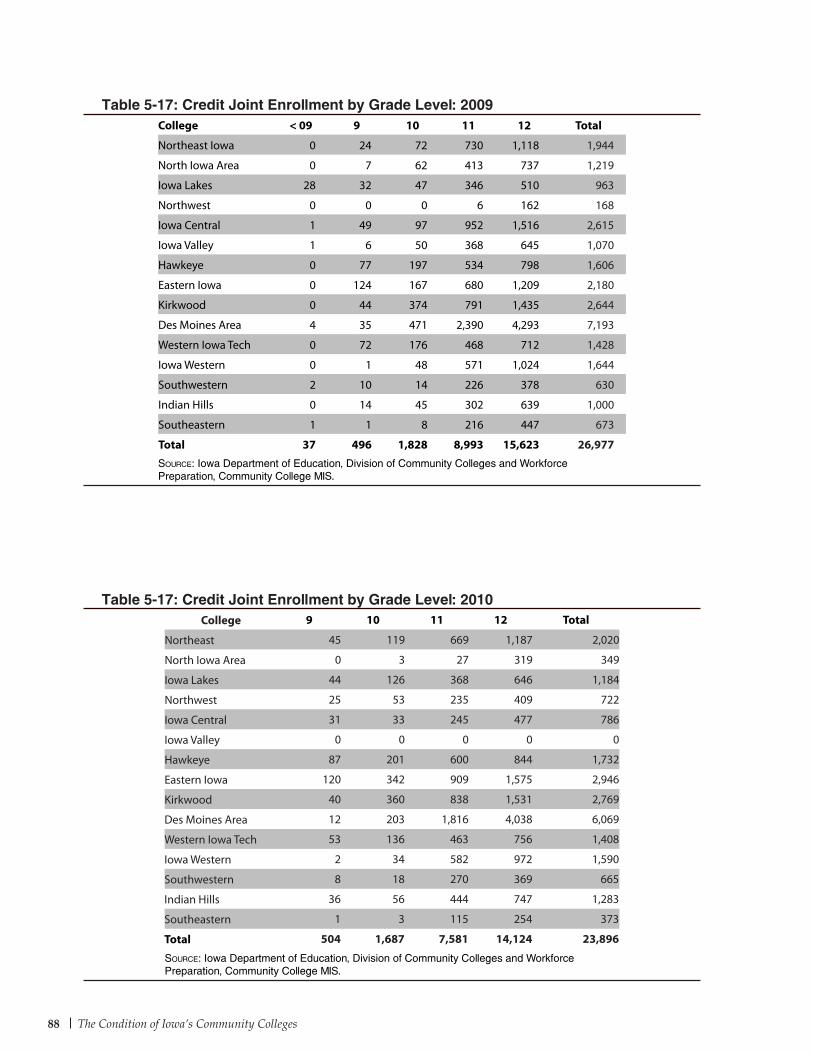
88 The Condition of Iowa’s Community Colleges
Table 5-17: Credit Joint Enrollment by Grade Level: 2009College < 09 9 10 11 12 Total
Northeast Iowa 0 24 72 730 1,118 1,944
North Iowa Area 0 7 62 413 737 1,219
Iowa Lakes 28 32 47 346 510 963
Northwest 0 0 0 6 162 168
Iowa Central 1 49 97 952 1,516 2,615
Iowa Valley 1 6 50 368 645 1,070
Hawkeye 0 77 197 534 798 1,606
Eastern Iowa 0 124 167 680 1,209 2,180
Kirkwood 0 44 374 791 1,435 2,644
Des Moines Area 4 35 471 2,390 4,293 7,193
Western Iowa Tech 0 72 176 468 712 1,428
Iowa Western 0 1 48 571 1,024 1,644
Southwestern 2 10 14 226 378 630
Indian Hills 0 14 45 302 639 1,000
Southeastern 1 1 8 216 447 673
Total 37 496 1,828 8,993 15,623 26,977Source: Iowa Department of Education, Division of Community Colleges and Workforce Preparation, Community College MIS.
Table 5-17: Credit Joint Enrollment by Grade Level: 2010College 9 10 11 12 Total
Northeast 45 119 669 1,187 2,020
North Iowa Area 0 3 27 319 349
Iowa Lakes 44 126 368 646 1,184
Northwest 25 53 235 409 722
Iowa Central 31 33 245 477 786
Iowa Valley 0 0 0 0 0
Hawkeye 87 201 600 844 1,732
Eastern Iowa 120 342 909 1,575 2,946
Kirkwood 40 360 838 1,531 2,769
Des Moines Area 12 203 1,816 4,038 6,069
Western Iowa Tech 53 136 463 756 1,408
Iowa Western 2 34 582 972 1,590
Southwestern 8 18 270 369 665
Indian Hills 36 56 444 747 1,283
Southeastern 1 3 115 254 373
Total 504 1,687 7,581 14,124 23,896
Source: Iowa Department of Education, Division of Community Colleges and Workforce Preparation, Community College MIS.
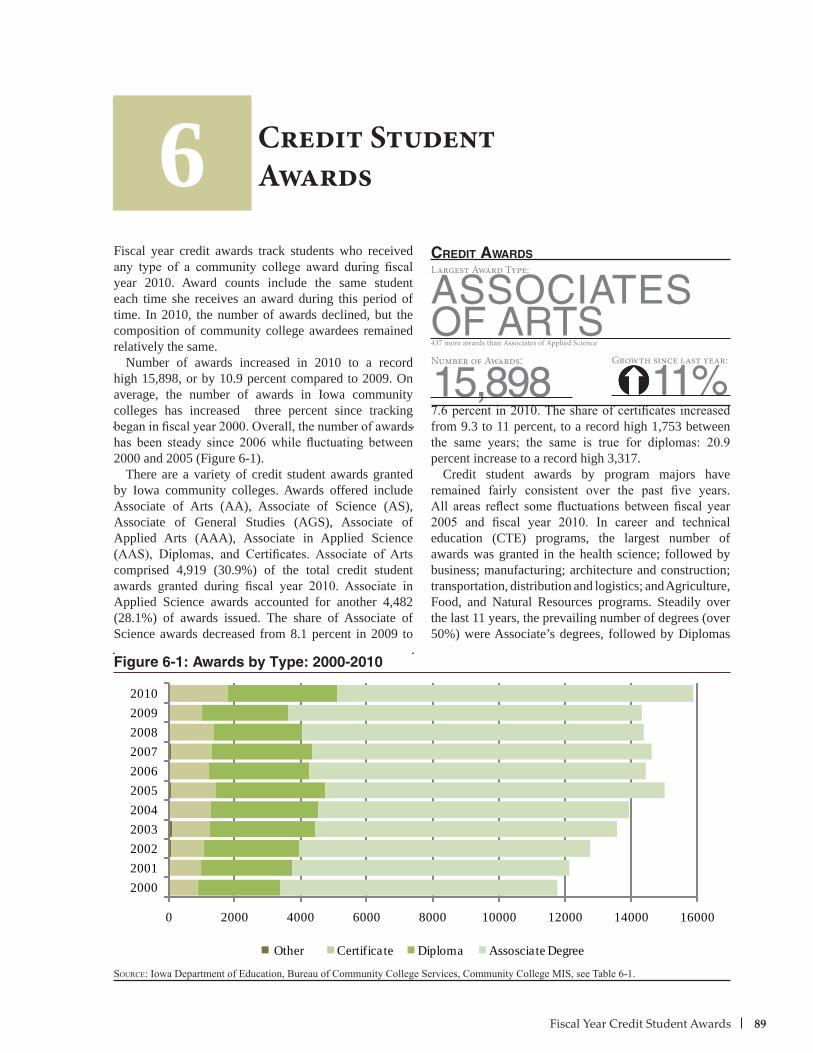
89Fiscal Year Credit Student Awards
ASSOCIATESOF ARTS
15,898
Fiscal year credit awards track students who received any type of a community college award during fiscal year 2010. Award counts include the same student each time she receives an award during this period of time. In 2010, the number of awards declined, but the composition of community college awardees remained relatively the same.
Number of awards increased in 2010 to a record high 15,898, or by 10.9 percent compared to 2009. On average, the number of awards in Iowa community colleges has increased three percent since tracking began in fiscal year 2000. Overall, the number of awards has been steady since 2006 while fluctuating between 2000 and 2005 (Figure 6-1).
There are a variety of credit student awards granted by Iowa community colleges. Awards offered include Associate of Arts (AA), Associate of Science (AS), Associate of General Studies (AGS), Associate of Applied Arts (AAA), Associate in Applied Science (AAS), Diplomas, and Certificates. Associate of Arts comprised 4,919 (30.9%) of the total credit student awards granted during fiscal year 2010. Associate in Applied Science awards accounted for another 4,482 (28.1%) of awards issued. The share of Associate of Science awards decreased from 8.1 percent in 2009 to
7.6 percent in 2010. The share of certificates increased from 9.3 to 11 percent, to a record high 1,753 between the same years; the same is true for diplomas: 20.9 percent increase to a record high 3,317.
Credit student awards by program majors have remained fairly consistent over the past five years. All areas reflect some fluctuations between fiscal year 2005 and fiscal year 2010. In career and technical education (CTE) programs, the largest number of awards was granted in the health science; followed by business; manufacturing; architecture and construction; transportation, distribution and logistics; and Agriculture, Food, and Natural Resources programs. Steadily over the last 11 years, the prevailing number of degrees (over 50%) were Associate’s degrees, followed by Diplomas
Credit Student Awards
Figure 6-1: Awards by Type: 2000-2010
6
Source: Iowa Department of Education, Bureau of Community College Services, Community College MIS, see Table 6-1.
Number of Awards:
11%
creDit awarDs
Growth since last year:
Largest Award Type:
437 more awards than Associates of Applied Science
0 2000 4000 6000 8000 10000 12000 14000 16000
20002001200220032004200520062007200820092010
Other Certificate Diploma Assosciate Degree
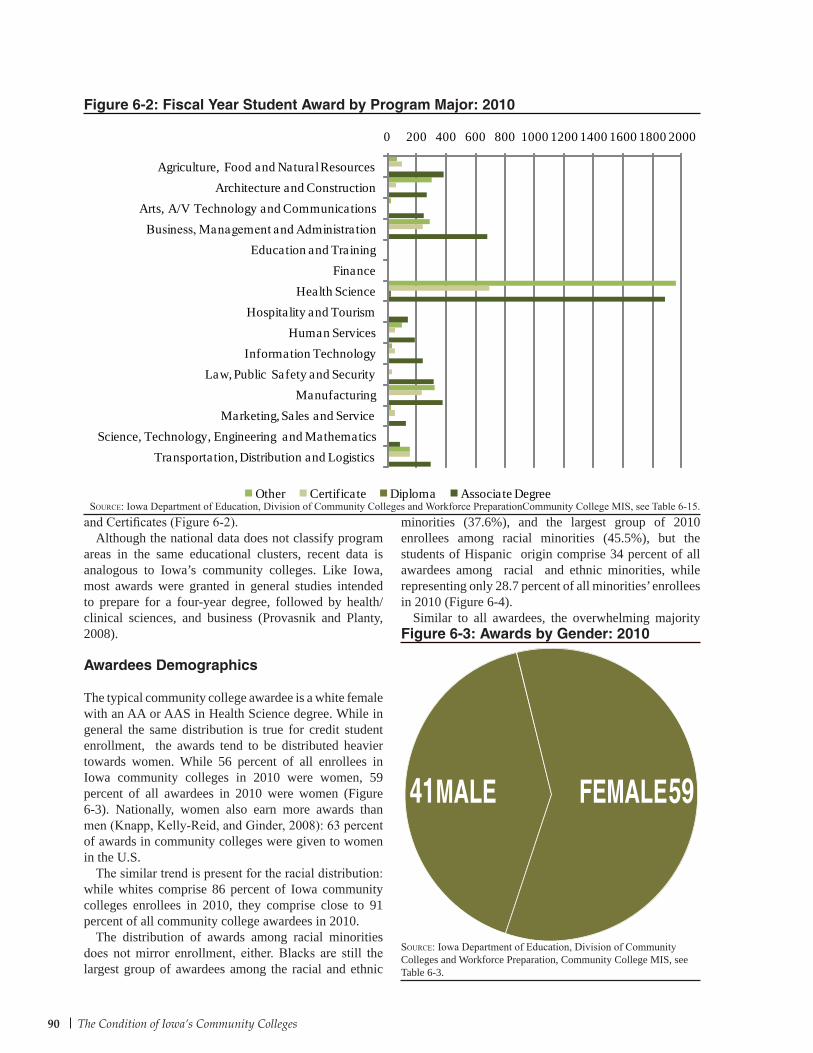
90 The Condition of Iowa’s Community Colleges
and Certificates (Figure 6-2).Although the national data does not classify program
areas in the same educational clusters, recent data is analogous to Iowa’s community colleges. Like Iowa, most awards were granted in general studies intended to prepare for a four-year degree, followed by health/clinical sciences, and business (Provasnik and Planty, 2008).
Awardees Demographics
The typical community college awardee is a white female with an AA or AAS in Health Science degree. While in general the same distribution is true for credit student enrollment, the awards tend to be distributed heavier towards women. While 56 percent of all enrollees in Iowa community colleges in 2010 were women, 59 percent of all awardees in 2010 were women (Figure 6-3). Nationally, women also earn more awards than men (Knapp, Kelly-Reid, and Ginder, 2008): 63 percent of awards in community colleges were given to women in the U.S.
The similar trend is present for the racial distribution: while whites comprise 86 percent of Iowa community colleges enrollees in 2010, they comprise close to 91 percent of all community college awardees in 2010.
The distribution of awards among racial minorities does not mirror enrollment, either. Blacks are still the largest group of awardees among the racial and ethnic
Figure 6-2: Fiscal Year Student Award by Program Major: 2010
Source: Iowa Department of Education, Division of Community Colleges and Workforce PreparationCommunity College MIS, see Table 6-15.minorities (37.6%), and the largest group of 2010 enrollees among racial minorities (45.5%), but the students of Hispanic origin comprise 34 percent of all awardees among racial and ethnic minorities, while representing only 28.7 percent of all minorities’ enrollees in 2010 (Figure 6-4).
Similar to all awardees, the overwhelming majority Figure 6-3: Awards by Gender: 2010
Source: Iowa Department of Education, Division of Community Colleges and Workforce Preparation, Community College MIS, see Table 6-3.
0 200 400 600 800 1000 1200 1400 1600 1800 2000
Agriculture, Food and Natural ResourcesArchitecture and Construction
Arts, A/V Technology and CommunicationsBusiness, Management and Administration
Education and TrainingFinance
Health ScienceHospitality and Tourism
Human ServicesInformation Technology
Law, Public Safety and SecurityManufacturing
Marketing, Sales and ServiceScience, Technology, Engineering and Mathematics
Transportation, Distribution and Logistics
Other Certificate Diploma Associate Degree
FEMALE59MALE41
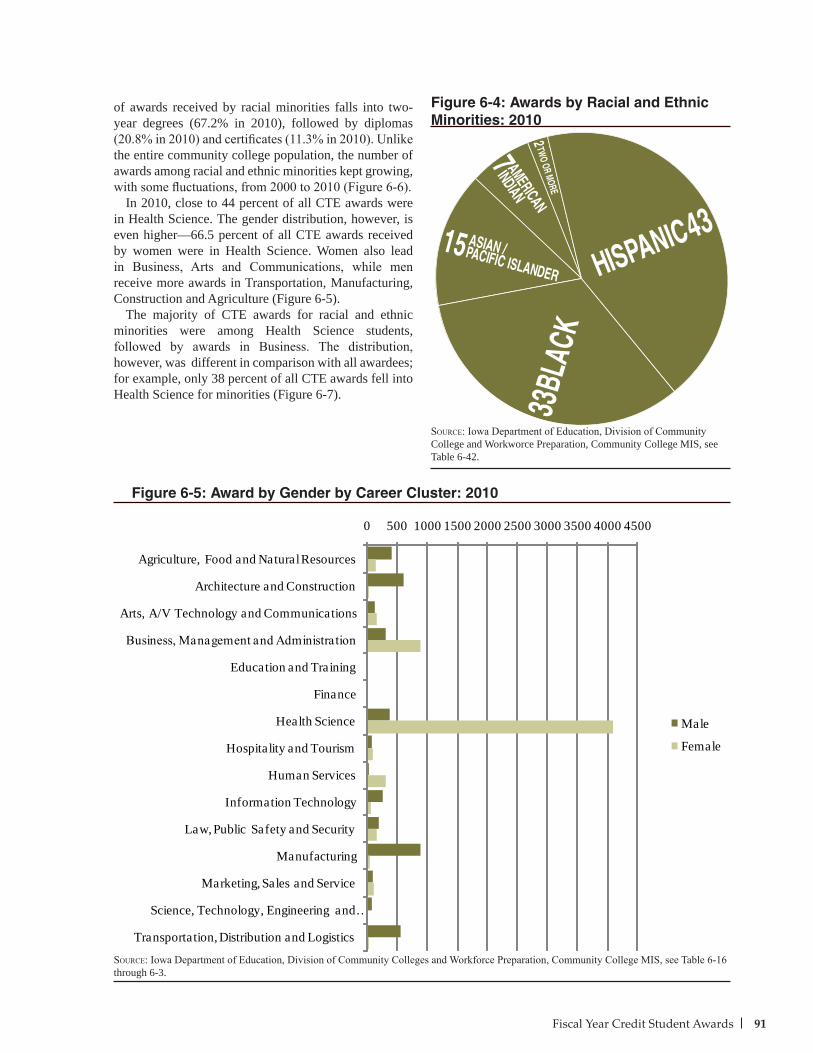
91Fiscal Year Credit Student Awards
Figure 6-5: Award by Gender by Career Cluster: 2010
Source: Iowa Department of Education, Division of Community Colleges and Workforce Preparation, Community College MIS, see Table 6-16 through 6-3.
of awards received by racial minorities falls into two-year degrees (67.2% in 2010), followed by diplomas (20.8% in 2010) and certificates (11.3% in 2010). Unlike the entire community college population, the number of awards among racial and ethnic minorities kept growing, with some fluctuations, from 2000 to 2010 (Figure 6-6).
In 2010, close to 44 percent of all CTE awards were in Health Science. The gender distribution, however, is even higher —66.5 percent of all CTE awards received by women were in Health Science. Women also lead in Business, Arts and Communications, while men receive more awards in Transportation, Manufacturing, Construction and Agriculture (Figure 6-5).
The majority of CTE awards for racial and ethnic minorities were among Health Science students, followed by awards in Business. The distribution, however, was different in comparison with all awardees; for example, only 38 percent of all CTE awards fell into Health Science for minorities (Figure 6-7).
Figure 6-4: Awards by Racial and Ethnic Minorities: 2010
Source: Iowa Department of Education, Division of Community College and Workworce Preparation, Community College MIS, see Table 6-42.
0 500 1000 1500 2000 2500 3000 3500 4000 4500
Agriculture, Food and Natural Resources
Architecture and Construction
Arts, A/V Technology and Communications
Business, Management and Administration
Education and Training
Finance
Health Science
Hospitality and Tourism
Human Services
Information Technology
Law, Public Safety and Security
Manufacturing
Marketing, Sales and Service
Science, Technology, Engineering and …
Transportation, Distribution and Logistics
Male
Female
HISPANIC43ASIAN /PACIFIC ISLANDER
15
BLAC
K33
AMERICAN
INDIAN7 TW
O OR MORE
2
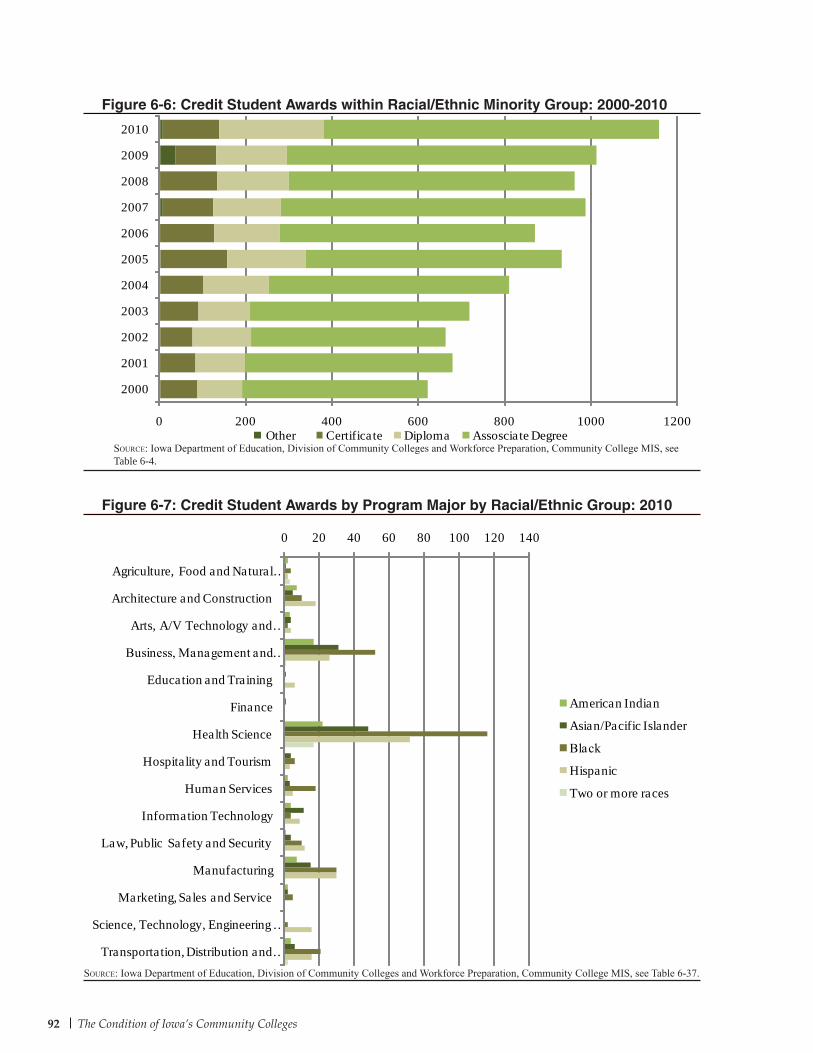
92 The Condition of Iowa’s Community Colleges
Figure 6-6: Credit Student Awards within Racial/Ethnic Minority Group: 2000-2010
Source: Iowa Department of Education, Division of Community Colleges and Workforce Preparation, Community College MIS, see Table 6-4.
Figure 6-7: Credit Student Awards by Program Major by Racial/Ethnic Group: 2010
Source: Iowa Department of Education, Division of Community Colleges and Workforce Preparation, Community College MIS, see Table 6-37.
0 200 400 600 800 1000 1200
2000
2001
2002
2003
2004
2005
2006
2007
2008
2009
2010
Other Certificate Diploma Assosciate Degree
0 20 40 60 80 100 120 140
Agriculture, Food and Natural …
Architecture and Construction
Arts, A/V Technology and …
Business, Management and …
Education and Training
Finance
Health Science
Hospitality and Tourism
Human Services
Information Technology
Law, Public Safety and Security
Manufacturing
Marketing, Sales and Service
Science, Technology, Engineering …
Transportation, Distribution and …
American Indian
Asian/Pacific Islander
Black
Hispanic
Two or more races
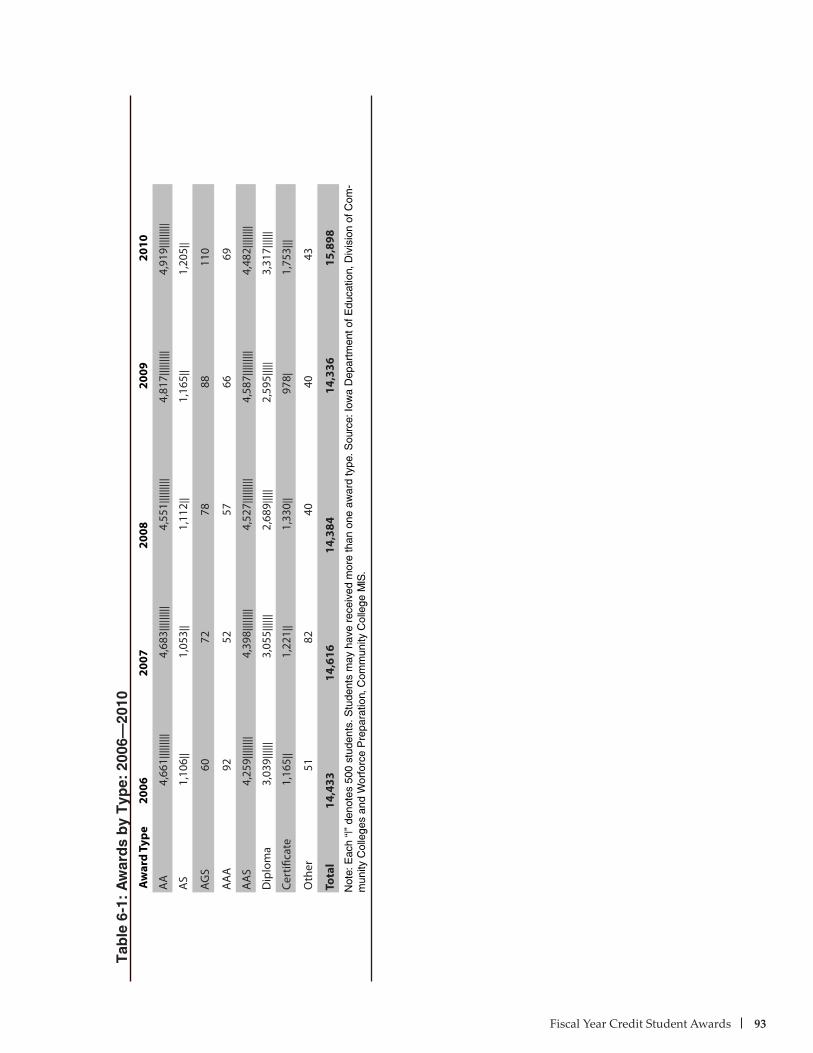
Fiscal Year Credit Student Awards 93
Tab
le 6
-1:
Aw
ard
s b
y T
ype:
200
6–20
10A
war
d Ty
pe20
0620
0720
0820
0920
10
AA
4,
661|
||||||
||4,
683|
||||||
||4,
551|
||||||
||4,
817|
||||||
||4,
919|
||||||
||
AS
1,
106|
|1,
053|
|1,
112|
|1,
165|
|1,
205|
|
AG
S
6072
7888
110
AA
A
9252
5766
69
AA
S
4,25
9 ||||
||||
4,39
8||||
||||
4,52
7||||
|||||
4,58
7||||
|||||
4,48
2||||
||||
Dip
lom
a
3,03
9||||
||3,
055|
|||||
2,68
9||||
|2,
595|
||||
3,31
7||||
||
Cer
tifica
te
1,16
5||
1,22
1||
1,33
0||
978|
1,75
3|||
Oth
er
5182
4040
43
Tot
al
14,4
3314
,616
14,3
8414
,336
15,8
98N
ote:
Eac
h “|
” de
note
s 50
0 st
uden
ts. S
tude
nts
may
hav
e re
ceiv
ed m
ore
than
one
aw
ard
type
. Sou
rce:
Iow
a D
epar
tmen
t of E
duca
tion,
Div
isio
n of
Com
-m
unity
Col
lege
s an
d W
orfo
rce
Pre
para
tion,
Com
mun
ity C
olle
ge M
IS.
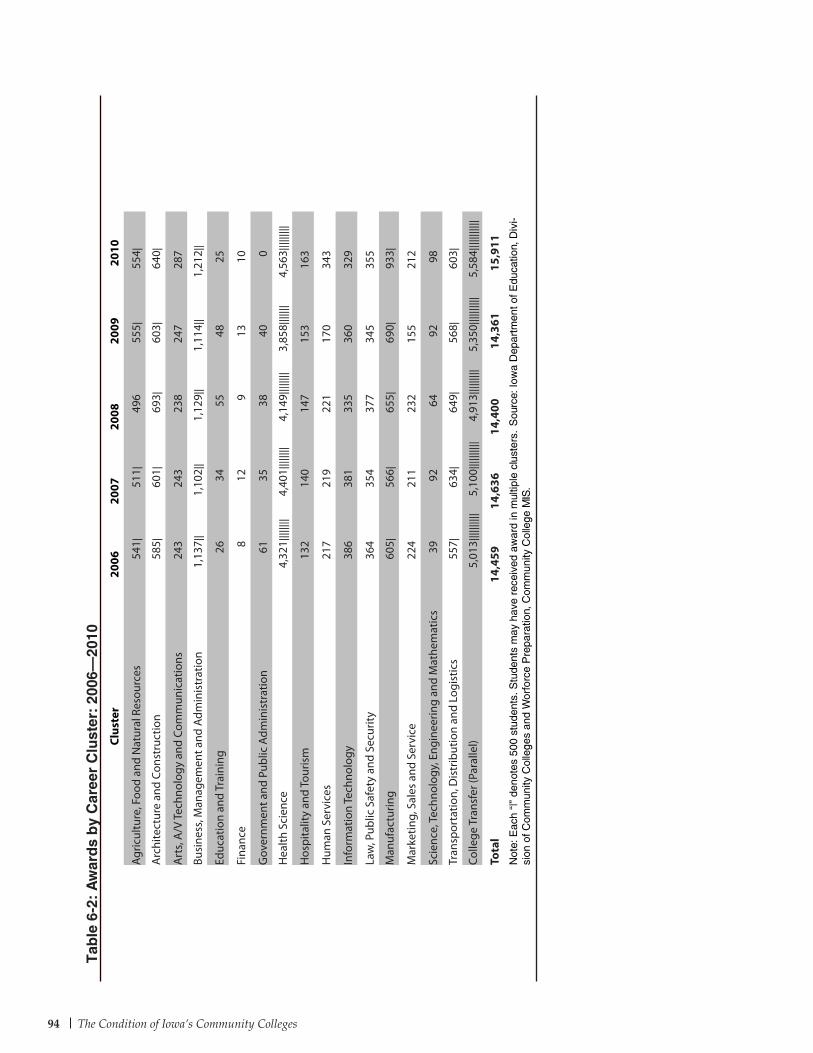
The Condition of Iowa’s Community Colleges94
Tab
le 6
-2:
Aw
ard
s b
y C
aree
r C
lust
er:
2006
–20
10Cl
uste
r20
0620
0720
0820
0920
10
Agric
ultu
re, F
ood
and
Nat
ural
Res
ourc
es54
1 |51
1|49
655
5|55
4|
Arc
hite
ctur
e an
d Co
nstr
uctio
n58
5|60
1|69
3|60
3|64
0|
Art
s, A
/V Te
chno
logy
and
Com
mun
icat
ions
243
243
238
247
287
Busi
ness
, Man
agem
ent a
nd A
dmin
istr
atio
n1,
137|
|1,
102|
|1,
129|
|1,
114|
|1,
212|
|
Educ
atio
n an
d Tr
aini
ng26
3455
4825
Fina
nce
812
913
10
Gov
ernm
ent a
nd P
ublic
Adm
inis
trat
ion
6135
3840
0
Hea
lth S
cien
ce4,
321 |
||||||
|4,
401|
||||||
|4,
149|
||||||
|3,
858|
||||||
4,56
3||||
|||||
Hos
pita
lity
and
Tour
ism
132
140
147
153
163
Hum
an S
ervi
ces
217
219
221
170
343
Info
rmat
ion
Tech
nolo
gy38
638
133
536
032
9
Law
, Pub
lic S
afet
y an
d Se
curit
y36
435
437
734
535
5
Man
ufac
turin
g60
5 |56
6|65
5|69
0|93
3|
Mar
ketin
g, S
ales
and
Ser
vice
224
211
232
155
212
Scie
nce,
Tech
nolo
gy, E
ngin
eerin
g an
d M
athe
mat
ics
3992
6492
98
Tran
spor
tatio
n, D
istr
ibut
ion
and
Logi
stic
s55
7 |63
4|64
9|56
8|60
3|
Colle
ge T
rans
fer (
Para
llel)
5,01
3||||
||||||
5,10
0||||
||||||
4,91
3||||
|||||
5,35
0||||
||||||
5,58
4||||
||||||
|
Tota
l14
,459
14,6
3614
,400
14,3
6115
,911
Not
e: E
ach
“|”
deno
tes
500
stud
ents
. Stu
dent
s m
ay h
ave
rece
ived
aw
ard
in m
ultip
le c
lust
ers.
Sou
rce:
Iow
a D
epar
tmen
t of E
duca
tion,
Div
i-si
on o
f Com
mun
ity C
olle
ges
and
Wor
forc
e P
repa
ratio
n, C
omm
unity
Col
lege
MIS
.
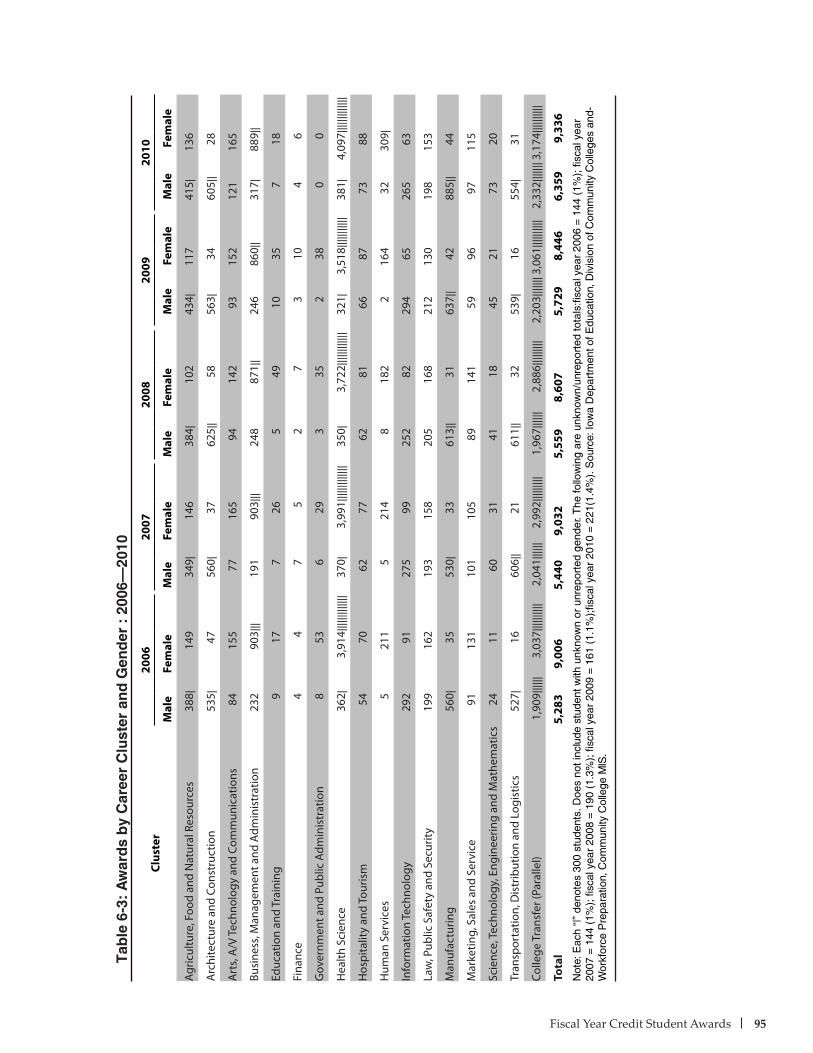
Fiscal Year Credit Student Awards 95
Tab
le 6
-3:
Aw
ard
s b
y C
aree
r C
lust
er a
nd
Gen
der
: 2
006–
2010
Clus
ter
2006
2007
2008
2009
2010
Mal
eFe
mal
eM
ale
Fem
ale
Mal
eFe
mal
eM
ale
Fem
ale
Mal
eFe
mal
e
Agric
ultu
re, F
ood
and
Nat
ural
Res
ourc
es38
8 |14
934
9|14
638
4|10
243
4|11
741
5|13
6
Arc
hite
ctur
e an
d Co
nstr
uctio
n53
5 |47
560|
3762
5||
5856
3|34
605|
|28
Art
s, A
/V Te
chno
logy
and
Com
mun
icat
ions
8415
577
165
9414
293
152
121
165
Busi
ness
, Man
agem
ent a
nd A
dmin
istr
atio
n23
290
3 |||
191
903|
||24
887
1||
246
860|
|31
7|88
9||
Educ
atio
n an
d Tr
aini
ng9
177
265
4910
357
18
Fina
nce
44
75
27
310
46
Gov
ernm
ent a
nd P
ublic
Adm
inis
trat
ion
853
629
335
238
00
Hea
lth S
cien
ce36
2 |3,
914|
||||||
||||||
370|
3,99
1||||
||||||
|||35
0|3,
722|
||||||
|||||
321|
3,51
8||||
||||||
|38
1|4,
097|
||||||
||||||
Hos
pita
lity
and
Tour
ism
5470
6277
6281
6687
7388
Hum
an S
ervi
ces
521
15
214
818
22
164
3230
9 |
Info
rmat
ion
Tech
nolo
gy29
291
275
9925
282
294
6526
563
Law
, Pub
lic S
afet
y an
d Se
curit
y19
916
219
315
820
516
821
213
019
815
3
Man
ufac
turin
g56
0 |35
530|
3361
3||
3163
7||
4288
5||
44
Mar
ketin
g, S
ales
and
Ser
vice
9113
110
110
589
141
5996
9711
5
Scie
nce,
Tech
nolo
gy, E
ngin
eerin
g an
d M
athe
mat
ics
2411
6031
4118
4521
7320
Tran
spor
tatio
n, D
istr
ibut
ion
and
Logi
stic
s52
7 |16
606|
|21
611|
|32
539|
1655
4|31
Colle
ge T
rans
fer (
Para
llel)
1,90
9 ||||
||3,
037|
||||||
|||2,
041|
|||||
2,99
2||||
|||||
1,96
7||||
||2,
886|
||||||
||2,
203|
||||||
3,06
1||||
||||||
2,33
2||||
|||3,
174|
||||||
|||
Tota
l5,
283
9,00
65,
440
9,03
25,
559
8,60
75,
729
8,44
66,
359
9,33
6N
ote:
Eac
h “|
” de
note
s 30
0 st
uden
ts. D
oes
not i
nclu
de s
tude
nt w
ith u
nkno
wn
or u
nrep
orte
d ge
nder
. The
follo
win
g ar
e un
know
n/un
repo
rted
tota
ls:fi
scal
yea
r 20
06 =
144
(1%
); fi
scal
yea
r 20
07 =
144
(1%
); fi
scal
yea
r 20
08 =
190
(1.
3%);
fisc
al y
ear
2009
= 1
61 (
1.1%
);fis
cal y
ear
2010
= 2
21(1
.4%
). S
ourc
e: Io
wa
Dep
artm
ent o
f Edu
catio
n, D
ivis
ion
of C
omm
unity
Col
lege
s an
d-W
orkf
orce
Pre
para
tion,
Com
mun
ity C
olle
ge M
IS.
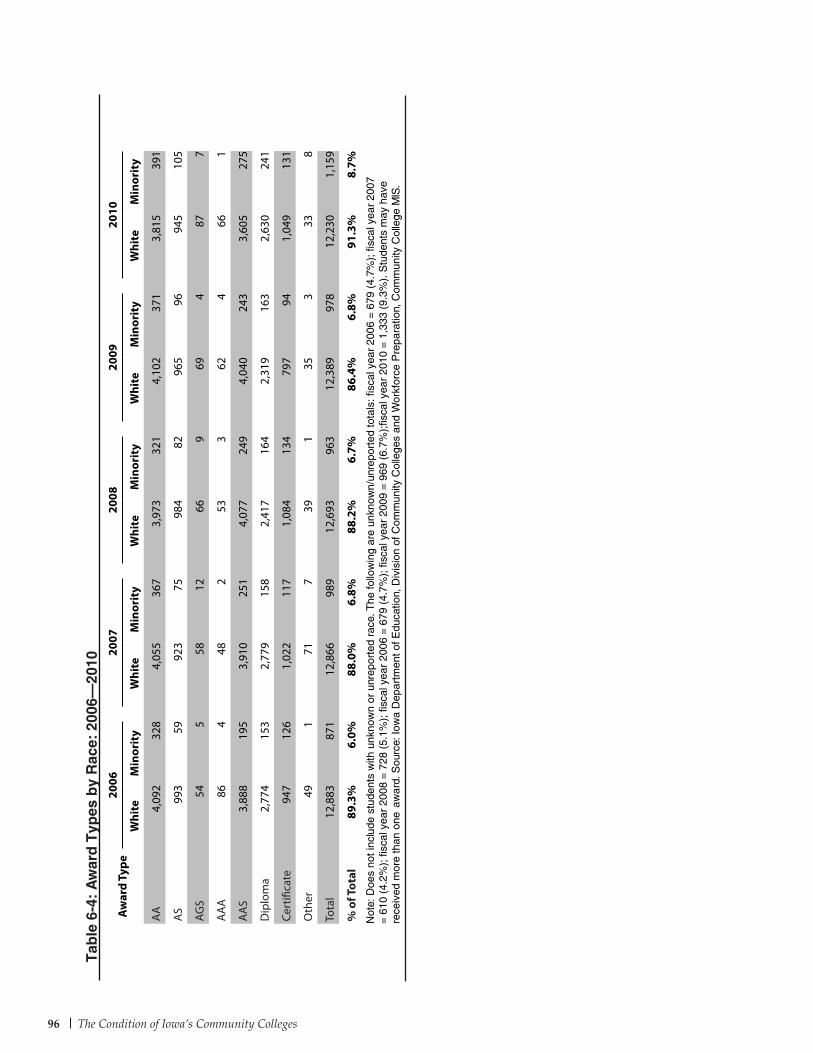
The Condition of Iowa’s Community Colleges96
Tab
le 6
-4:
Aw
ard
Typ
es b
y R
ace:
200
6–20
10
Aw
ard
Type
2006
2007
2008
2009
2010
Whi
te
Min
orit
y W
hite
M
inor
ity
W
hite
M
inor
ity
W
hite
M
inor
ity
W
hite
M
inor
ity
AA
4,
092
328
4,05
536
73,
973
321
4,10
237
13,
815
391
AS
99
359
923
7598
482
965
9694
510
5
AG
S
545
5812
669
694
877
AA
A
864
482
533
624
661
AA
S
3,88
819
53,
910
251
4,07
724
94,
040
243
3,60
527
5
Dip
lom
a
2,77
415
32,
779
158
2,41
716
42,
319
163
2,63
024
1
Cer
tifica
te
947
126
1,02
211
71,
084
134
797
941,
049
131
Oth
er
491
717
391
353
338
Tota
l 12
,883
871
12,8
6698
912
,693
963
12,3
8997
812
,230
1,15
9
% o
f Tot
al
89.3
%6.
0%88
.0%
6.8%
88.2
%6.
7%86
.4%
6.8%
91.3
%8.
7%N
ote:
Doe
s no
t inc
lude
stu
dent
s w
ith u
nkno
wn
or u
nrep
orte
d ra
ce. T
he fo
llow
ing
are
unkn
own/
unre
port
ed to
tals
: fis
cal y
ear
2006
= 6
79 (
4.7%
); fi
scal
yea
r 20
07
= 61
0 (4
.2%
); fi
scal
yea
r 20
08 =
728
(5.
1%);
fisc
al y
ear
2006
= 6
79 (
4.7%
); fi
scal
yea
r 20
09 =
969
(6.
7%);
fisca
l yea
r 20
10 =
1,3
33 (
9.3%
). S
tude
nts
may
hav
e re
ceiv
ed m
ore
than
one
aw
ard.
Sou
rce:
Iow
a D
epar
tmen
t of E
duca
tion,
Div
isio
n of
Com
mun
ity C
olle
ges
and
Wor
kfor
ce P
repa
ratio
n, C
omm
unity
Col
lege
MIS
.
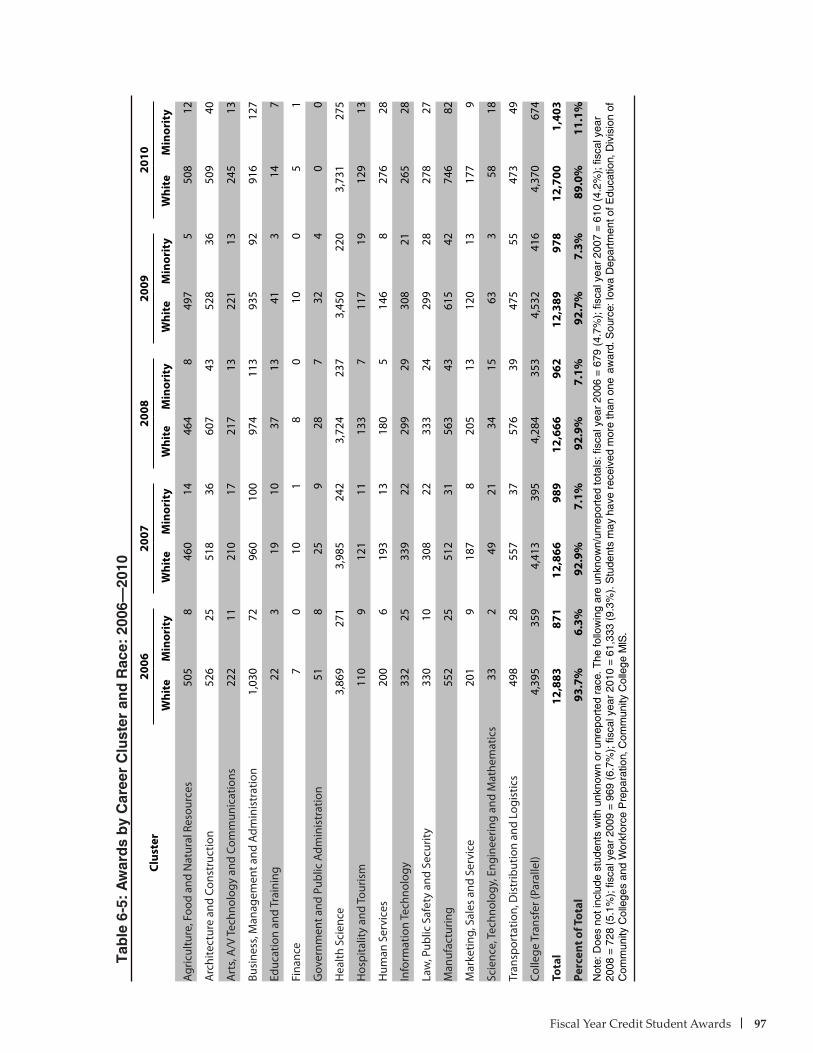
Fiscal Year Credit Student Awards 97
Tab
le 6
-5:
Aw
ard
s b
y C
aree
r C
lust
er a
nd
Rac
e: 2
006–
2010
Clus
ter
2006
2007
2008
2009
2010
Whi
te
Min
orit
y W
hite
M
inor
ity
W
hite
M
inor
ity
W
hite
M
inor
ity
W
hite
M
inor
ity
Agric
ultu
re, F
ood
and
Nat
ural
Res
ourc
es50
58
460
1446
48
497
550
812
Arc
hite
ctur
e an
d Co
nstr
uctio
n52
625
518
3660
743
528
3650
940
Art
s, A
/V Te
chno
logy
and
Com
mun
icat
ions
222
1121
017
217
1322
113
245
13
Busi
ness
, Man
agem
ent a
nd A
dmin
istr
atio
n1,
030
7296
010
097
411
393
592
916
127
Educ
atio
n an
d Tr
aini
ng22
319
1037
1341
314
7
Fina
nce
70
101
80
100
51
Gov
ernm
ent a
nd P
ublic
Adm
inis
trat
ion
518
259
287
324
00
Hea
lth S
cien
ce3,
869
271
3,98
524
23,
724
237
3,45
022
03,
731
275
Hos
pita
lity
and
Tour
ism
110
912
111
133
711
719
129
13
Hum
an S
ervi
ces
200
619
313
180
514
68
276
28
Info
rmat
ion
Tech
nolo
gy33
225
339
2229
929
308
2126
528
Law
, Pub
lic S
afet
y an
d Se
curit
y33
010
308
2233
324
299
2827
827
Man
ufac
turin
g55
225
512
3156
343
615
4274
682
Mar
ketin
g, S
ales
and
Ser
vice
201
918
78
205
1312
013
177
9
Scie
nce,
Tech
nolo
gy, E
ngin
eerin
g an
d M
athe
mat
ics
332
4921
3415
633
5818
Tran
spor
tatio
n, D
istr
ibut
ion
and
Logi
stic
s49
828
557
3757
639
475
5547
349
Colle
ge T
rans
fer (
Para
llel)
4,39
535
94,
413
395
4,28
435
34,
532
416
4,37
067
4
Tota
l12
,883
871
12,8
6698
912
,666
962
12,3
8997
812
,700
1,40
3
Perc
ent o
f Tot
al93
.7%
6.3%
92.9
%7.
1%92
.9%
7.1%
92.7
%7.
3%89
.0%
11.1
%N
ote:
Doe
s no
t inc
lude
stu
dent
s w
ith u
nkno
wn
or u
nrep
orte
d ra
ce. T
he fo
llow
ing
are
unkn
own/
unre
port
ed to
tals
: fis
cal y
ear
2006
= 6
79 (
4.7%
); fi
scal
yea
r 20
07 =
610
(4.
2%);
fisc
al y
ear
2008
= 7
28 (
5.1%
); fi
scal
yea
r 20
09 =
969
(6.
7%);
fisc
al y
ear
2010
= 6
1,33
3 (9
.3%
). S
tude
nts
may
hav
e re
ceiv
ed m
ore
than
one
aw
ard.
Sou
rce:
Iow
a D
epar
tmen
t of E
duca
tion,
Div
isio
n of
C
omm
unity
Col
lege
s an
d W
orkf
orce
Pre
para
tion,
Com
mun
ity C
olle
ge M
IS.
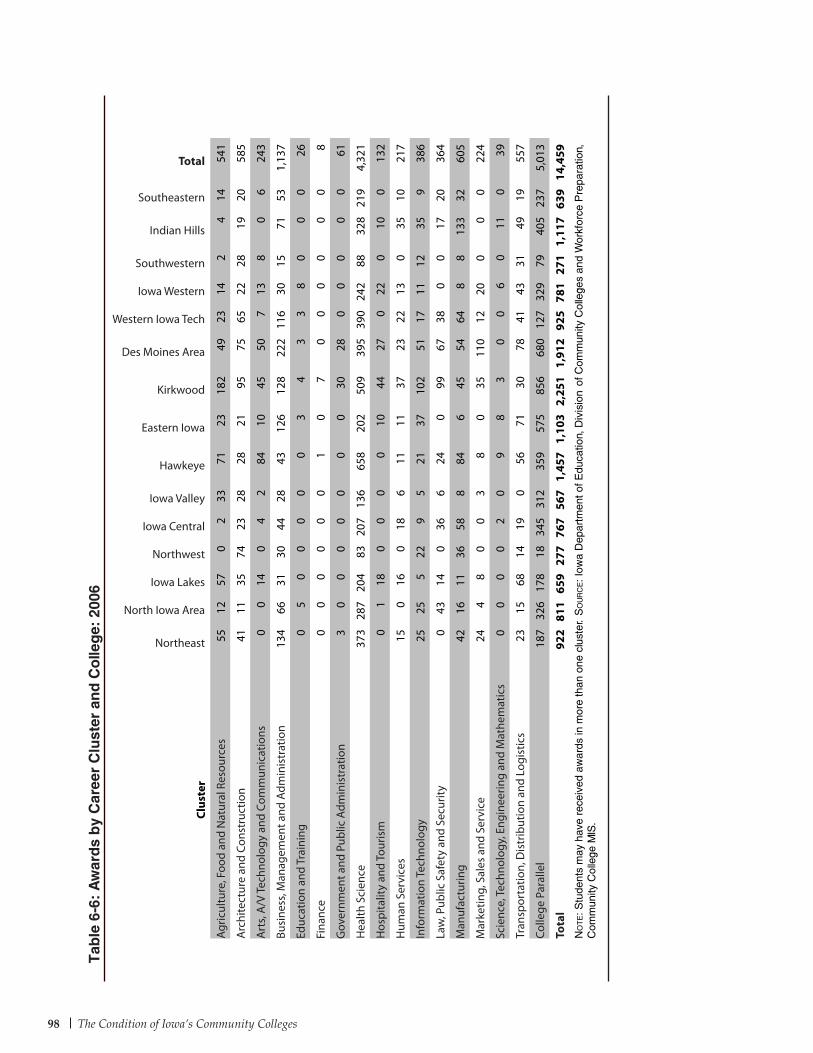
The Condition of Iowa’s Community Colleges98
Clus
ter
Northeast
North Iowa Area
Iowa Lakes
Northwest
Iowa Central
Iowa Valley
Hawkeye
Eastern Iowa
Kirkwood
Des Moines Area
Western Iowa Tech
Iowa Western
Southwestern
Indian Hills
Southeastern
Total
Agric
ultu
re, F
ood
and
Nat
ural
Res
ourc
es55
1257
02
3371
2318
249
2314
24
1454
1
Arc
hite
ctur
e an
d Co
nstr
uctio
n41
1135
7423
2828
2195
7565
2228
1920
585
Art
s, A
/V Te
chno
logy
and
Com
mun
icat
ions
00
140
42
8410
4550
713
80
624
3
Busi
ness
, Man
agem
ent a
nd A
dmin
istr
atio
n13
466
3130
4428
4312
612
822
211
630
1571
531,
137
Educ
atio
n an
d Tr
aini
ng0
50
00
00
34
33
80
00
26
Fina
nce
00
00
00
10
70
00
00
08
Gov
ernm
ent a
nd P
ublic
Adm
inis
trat
ion
30
00
00
00
3028
00
00
061
Hea
lth S
cien
ce37
328
720
483
207
136
658
202
509
395
390
242
8832
821
94,
321
Hos
pita
lity
and
Tour
ism
01
180
00
010
4427
022
010
013
2
Hum
an S
ervi
ces
150
160
186
1111
3723
2213
035
1021
7
Info
rmat
ion
Tech
nolo
gy25
255
229
521
3710
251
1711
1235
938
6
Law
, Pub
lic S
afet
y an
d Se
curit
y0
4314
036
624
099
6738
00
1720
364
Man
ufac
turin
g42
1611
3658
884
645
5464
88
133
3260
5
Mar
ketin
g, S
ales
and
Ser
vice
244
80
03
80
3511
012
200
00
224
Scie
nce,
Tech
nolo
gy, E
ngin
eerin
g an
d M
athe
mat
ics
00
00
20
98
30
06
011
039
Tran
spor
tatio
n, D
istr
ibut
ion
and
Logi
stic
s23
1568
1419
056
7130
7841
4331
4919
557
Colle
ge P
aral
lel
187
326
178
1834
531
235
957
585
668
012
732
979
405
237
5,01
3
Tota
l92
281
165
927
776
756
71,
457
1,10
32,
251
1,91
292
578
127
11,
117
639
14,4
59N
ot
e: S
tude
nts
may
hav
e re
ceiv
ed a
war
ds in
mor
e th
an o
ne c
lust
er.
So
ur
ce: I
owa
Dep
artm
ent o
f Edu
catio
n, D
ivis
ion
of C
omm
unity
Col
lege
s an
d W
orkf
orce
Pre
para
tion,
C
omm
unity
Col
lege
MIS
.
Tab
le 6
-6:
Aw
ard
s b
y C
aree
r C
lust
er a
nd
Co
lleg
e: 2
006
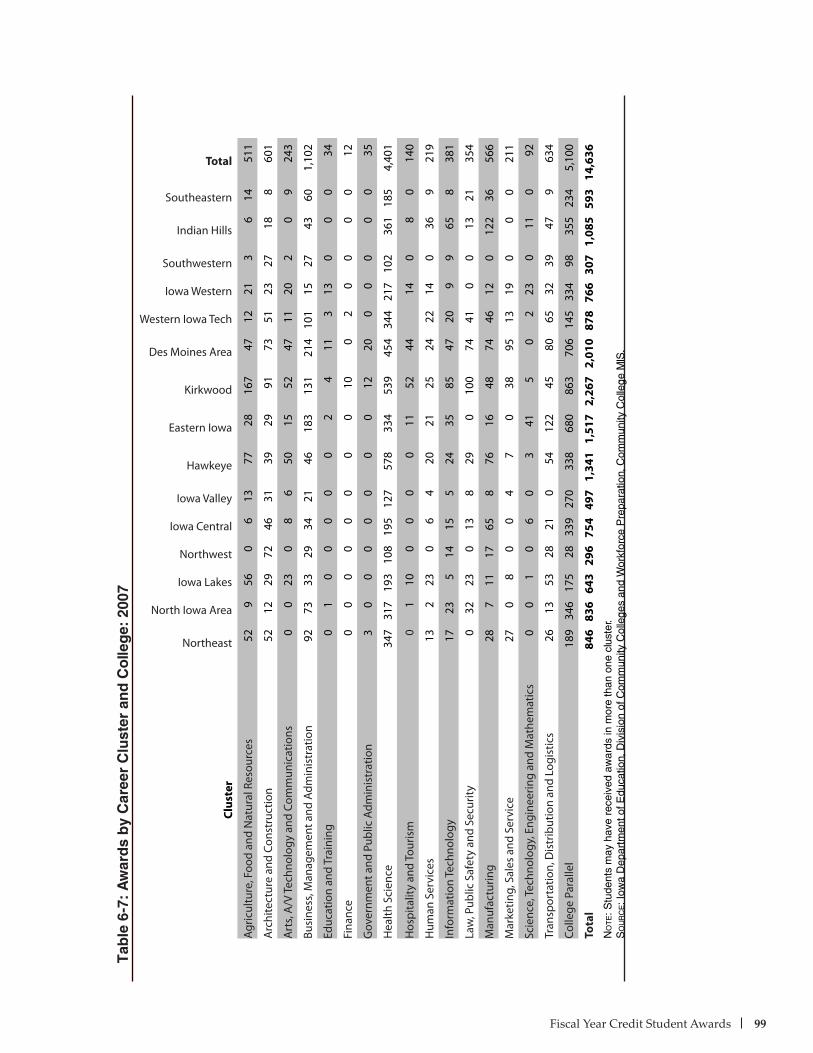
Fiscal Year Credit Student Awards 99
Tab
le 6
-7:
Aw
ard
s b
y C
aree
r C
lust
er a
nd
Co
lleg
e: 2
007
Clus
ter
Northeast
North Iowa Area
Iowa Lakes
Northwest
Iowa Central
Iowa Valley
Hawkeye
Eastern Iowa
Kirkwood
Des Moines Area
Western Iowa Tech
Iowa Western
Southwestern
Indian Hills
Southeastern
Total
Agric
ultu
re, F
ood
and
Nat
ural
Res
ourc
es52
956
06
1377
2816
747
1221
36
1451
1
Arc
hite
ctur
e an
d Co
nstr
uctio
n52
1229
7246
3139
2991
7351
2327
188
601
Art
s, A
/V Te
chno
logy
and
Com
mun
icat
ions
00
230
86
5015
5247
1120
20
924
3
Busi
ness
, Man
agem
ent a
nd A
dmin
istr
atio
n92
7333
2934
2146
183
131
214
101
1527
4360
1,10
2
Educ
atio
n an
d Tr
aini
ng0
10
00
00
24
113
130
00
34
Fina
nce
00
00
00
00
100
20
00
012
Gov
ernm
ent a
nd P
ublic
Adm
inis
trat
ion
30
00
00
00
1220
00
00
035
Hea
lth S
cien
ce34
731
719
310
819
512
757
833
453
945
434
421
710
236
118
54,
401
Hos
pita
lity
and
Tour
ism
01
100
00
011
5244
140
80
140
Hum
an S
ervi
ces
132
230
64
2021
2524
2214
036
921
9
Info
rmat
ion
Tech
nolo
gy17
235
1415
524
3585
4720
99
658
381
Law
, Pub
lic S
afet
y an
d Se
curit
y0
3223
013
829
010
074
410
013
2135
4
Man
ufac
turin
g28
711
1765
876
1648
7446
120
122
3656
6
Mar
ketin
g, S
ales
and
Ser
vice
270
80
04
70
3895
1319
00
021
1
Scie
nce,
Tech
nolo
gy, E
ngin
eerin
g an
d M
athe
mat
ics
00
10
60
341
50
223
011
092
Tran
spor
tatio
n, D
istr
ibut
ion
and
Logi
stic
s26
1353
2821
054
122
4580
6532
3947
963
4
Colle
ge P
aral
lel
189
346
175
2833
927
033
868
086
370
614
533
498
355
234
5,10
0
Tota
l84
683
664
329
675
449
71,
341
1,51
72,
267
2,01
087
876
630
71,
085
593
14,6
36N
ot
e: S
tude
nts
may
hav
e re
ceiv
ed a
war
ds in
mor
e th
an o
ne c
lust
er.
So
ur
ce: I
owa
Dep
artm
ent o
f Edu
catio
n, D
ivis
ion
of C
omm
unity
Col
lege
s an
d W
orkf
orce
Pre
para
tion,
Com
mun
ity C
olle
ge M
IS.
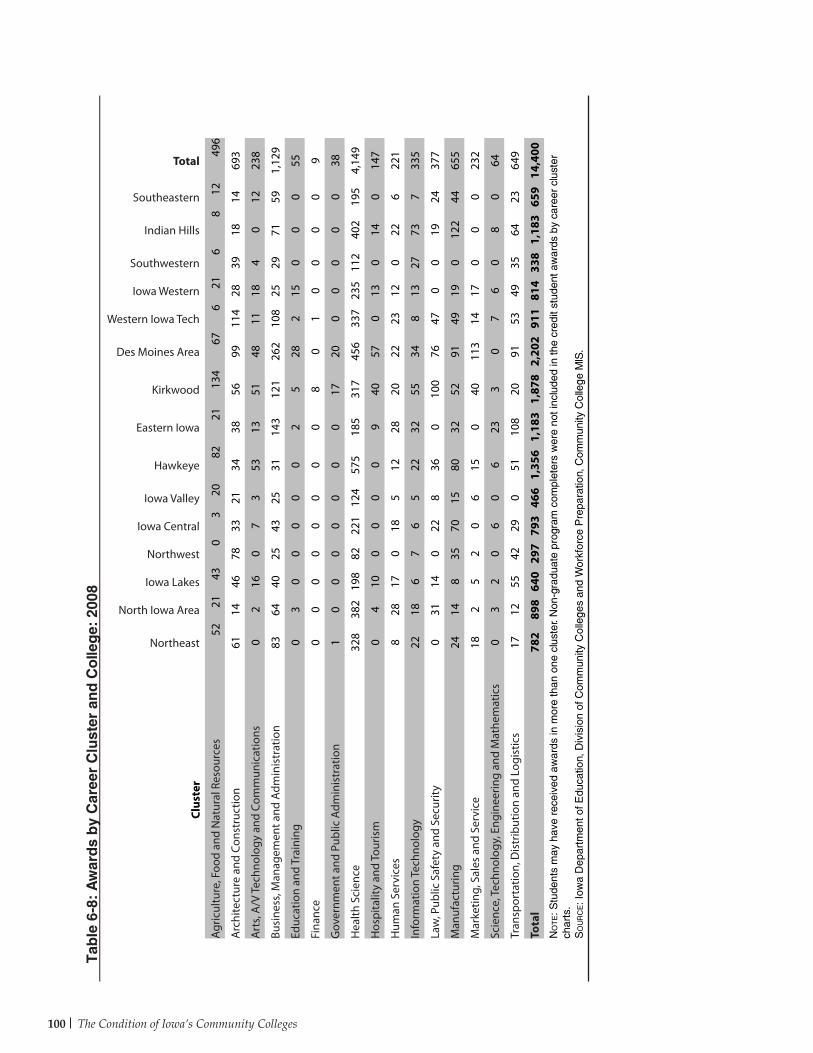
The Condition of Iowa’s Community Colleges100
Clus
ter
Northeast
North Iowa Area
Iowa Lakes
Northwest
Iowa Central
Iowa Valley
Hawkeye
Eastern Iowa
Kirkwood
Des Moines Area
Western Iowa Tech
Iowa Western
Southwestern
Indian Hills
Southeastern
Total
Agric
ultu
re, F
ood
and
Nat
ural
Res
ourc
es52
2143
03
2082
2113
467
621
68
1249
6
Arc
hite
ctur
e an
d Co
nstr
uctio
n61
1446
7833
2134
3856
9911
428
3918
1469
3
Art
s, A
/V Te
chno
logy
and
Com
mun
icat
ions
02
160
73
5313
5148
1118
40
1223
8
Busi
ness
, Man
agem
ent a
nd A
dmin
istr
atio
n83
6440
2543
2531
143
121
262
108
2529
7159
1,12
9
Educ
atio
n an
d Tr
aini
ng0
30
00
00
25
282
150
00
55
Fina
nce
00
00
00
00
80
10
00
09
Gov
ernm
ent a
nd P
ublic
Adm
inis
trat
ion
10
00
00
00
1720
00
00
038
Hea
lth S
cien
ce32
838
219
882
221
124
575
185
317
456
337
235
112
402
195
4,14
9
Hos
pita
lity
and
Tour
ism
04
100
00
09
4057
013
014
014
7
Hum
an S
ervi
ces
828
170
185
1228
2022
2312
022
622
1
Info
rmat
ion
Tech
nolo
gy22
186
76
522
3255
348
1327
737
335
Law
, Pub
lic S
afet
y an
d Se
curit
y0
3114
022
836
010
076
470
019
2437
7
Man
ufac
turin
g24
148
3570
1580
3252
9149
190
122
4465
5
Mar
ketin
g, S
ales
and
Ser
vice
182
52
06
150
4011
314
170
00
232
Scie
nce,
Tech
nolo
gy, E
ngin
eerin
g an
d M
athe
mat
ics
03
20
60
623
30
76
08
064
Tran
spor
tatio
n, D
istr
ibut
ion
and
Logi
stic
s17
1255
4229
051
108
2091
5349
3564
2364
9
Tota
l78
289
864
029
779
346
61,
356
1,18
31,
878
2,20
291
181
433
81,
183
659
14,4
00N
ot
e: S
tude
nts
may
hav
e re
ceiv
ed a
war
ds in
mor
e th
an o
ne c
lust
er. N
on-g
radu
ate
prog
ram
com
plet
ers
wer
e no
t inc
lude
d in
the
cred
it st
uden
t aw
ards
by
care
er c
lust
er
char
ts.
So
ur
ce: I
owa
Dep
artm
ent o
f Edu
catio
n, D
ivis
ion
of C
omm
unity
Col
lege
s an
d W
orkf
orce
Pre
para
tion,
Com
mun
ity C
olle
ge M
IS.
Tab
le 6
-8:
Aw
ard
s b
y C
aree
r C
lust
er a
nd
Co
lleg
e: 2
008
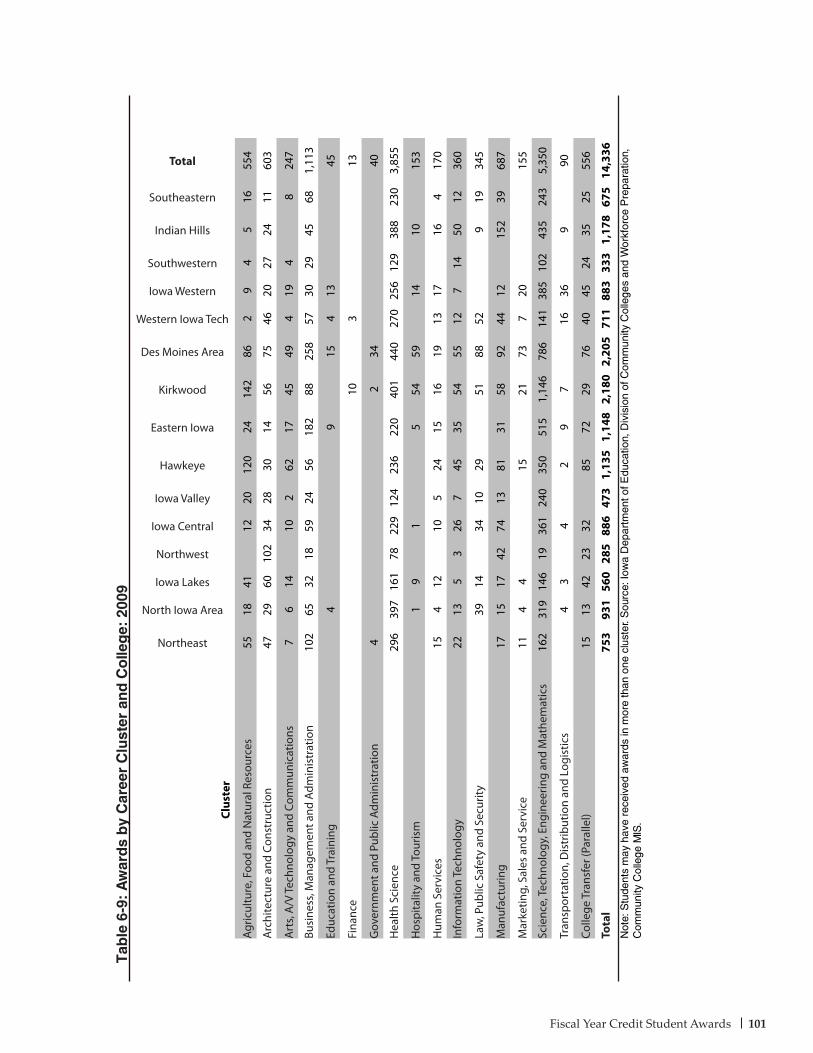
Fiscal Year Credit Student Awards 101
Tab
le 6
-9:
Aw
ard
s b
y C
aree
r C
lust
er a
nd
Co
lleg
e: 2
009
Clus
ter
Northeast
North Iowa Area
Iowa Lakes
Northwest
Iowa Central
Iowa Valley
Hawkeye
Eastern Iowa
Kirkwood
Des Moines Area
Western Iowa Tech
Iowa Western
Southwestern
Indian Hills
Southeastern
Total
Agric
ultu
re, F
ood
and
Nat
ural
Res
ourc
es55
1841
1220
120
2414
286
29
45
1655
4
Arc
hite
ctur
e an
d Co
nstr
uctio
n47
2960
102
3428
3014
5675
4620
2724
1160
3
Art
s, A
/V Te
chno
logy
and
Com
mun
icat
ions
76
1410
262
1745
494
194
824
7
Busi
ness
, Man
agem
ent a
nd A
dmin
istr
atio
n10
265
3218
5924
5618
288
258
5730
2945
681,
113
Educ
atio
n an
d Tr
aini
ng4
915
413
45
Fina
nce
103
13
Gov
ernm
ent a
nd P
ublic
Adm
inis
trat
ion
42
3440
Hea
lth S
cien
ce29
639
716
178
229
124
236
220
401
440
270
256
129
388
230
3,85
5
Hos
pita
lity
and
Tour
ism
19
15
5459
1410
153
Hum
an S
ervi
ces
154
1210
524
1516
1913
1716
417
0
Info
rmat
ion
Tech
nolo
gy22
135
326
745
3554
5512
714
5012
360
Law
, Pub
lic S
afet
y an
d Se
curit
y39
1434
1029
5188
529
1934
5
Man
ufac
turin
g17
1517
4274
1381
3158
9244
1215
239
687
Mar
ketin
g, S
ales
and
Ser
vice
114
415
2173
720
155
Scie
nce,
Tech
nolo
gy, E
ngin
eerin
g an
d M
athe
mat
ics
162
319
146
1936
124
035
051
51,
146
786
141
385
102
435
243
5,35
0
Tran
spor
tatio
n, D
istr
ibut
ion
and
Logi
stic
s4
34
29
716
369
90
Colle
ge T
rans
fer (
Para
llel)
1513
4223
3285
7229
7640
4524
3525
556
Tota
l75
393
156
028
588
647
31,
135
1,14
82,
180
2,20
571
188
333
31,
178
675
14,3
36N
ote:
Stu
dent
s m
ay h
ave
rece
ived
aw
ards
in m
ore
than
one
clu
ster
. Sou
rce:
Iow
a D
epar
tmen
t of E
duca
tion,
Div
isio
n of
Com
mun
ity C
olle
ges
and
Wor
kfor
ce P
repa
ratio
n,
Com
mun
ity C
olle
ge M
IS.
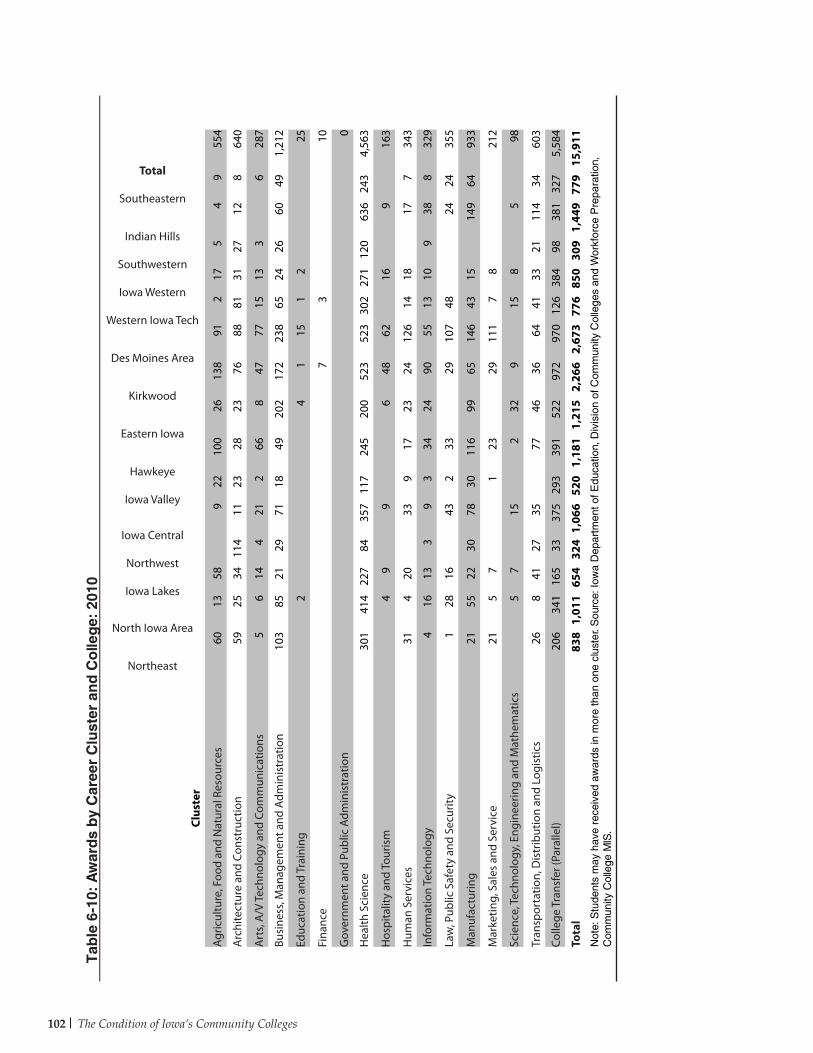
The Condition of Iowa’s Community Colleges102
Tab
le 6
-10:
Aw
ard
s b
y C
aree
r C
lust
er a
nd
Co
lleg
e: 2
010
Clus
ter
Northeast
North Iowa Area
Iowa Lakes
Northwest
Iowa Central
Iowa Valley
Hawkeye
Eastern Iowa
Kirkwood
Des Moines Area
Western Iowa Tech
Iowa Western
Southwestern
Indian Hills
Southeastern
Total
Agric
ultu
re, F
ood
and
Nat
ural
Res
ourc
es60
1358
922
100
2613
891
217
54
955
4
Arc
hite
ctur
e an
d Co
nstr
uctio
n59
2534
114
1123
2823
7688
8131
2712
864
0
Art
s, A
/V Te
chno
logy
and
Com
mun
icat
ions
56
144
212
668
4777
1513
36
287
Busi
ness
, Man
agem
ent a
nd A
dmin
istr
atio
n10
385
2129
7118
4920
217
223
865
2426
6049
1,21
2
Educ
atio
n an
d Tr
aini
ng2
41
151
225
Fina
nce
73
10
Gov
ernm
ent a
nd P
ublic
Adm
inis
trat
ion
0
Hea
lth S
cien
ce30
141
422
784
357
117
245
200
523
523
302
271
120
636
243
4,56
3
Hos
pita
lity
and
Tour
ism
49
96
4862
169
163
Hum
an S
ervi
ces
314
2033
917
2324
126
1418
177
343
Info
rmat
ion
Tech
nolo
gy4
1613
39
334
2490
5513
109
388
329
Law
, Pub
lic S
afet
y an
d Se
curit
y1
2816
432
3329
107
4824
2435
5
Man
ufac
turin
g21
5522
3078
3011
699
6514
643
1514
964
933
Mar
ketin
g, S
ales
and
Ser
vice
215
71
2329
111
78
212
Scie
nce,
Tech
nolo
gy, E
ngin
eerin
g an
d M
athe
mat
ics
57
152
329
158
598
Tran
spor
tatio
n, D
istr
ibut
ion
and
Logi
stic
s26
841
2735
7746
3664
4133
2111
434
603
Colle
ge T
rans
fer (
Para
llel)
206
341
165
3337
529
339
152
297
297
012
638
498
381
327
5,58
4
Tota
l83
81,
011
654
324
1,06
652
01,
181
1,21
52,
266
2,67
377
685
030
91,
449
779
15,9
11N
ote:
Stu
dent
s m
ay h
ave
rece
ived
aw
ards
in m
ore
than
one
clu
ster
. Sou
rce:
Iow
a D
epar
tmen
t of E
duca
tion,
Div
isio
n of
Com
mun
ity C
olle
ges
and
Wor
kfor
ce P
repa
ratio
n,
Com
mun
ity C
olle
ge M
IS.
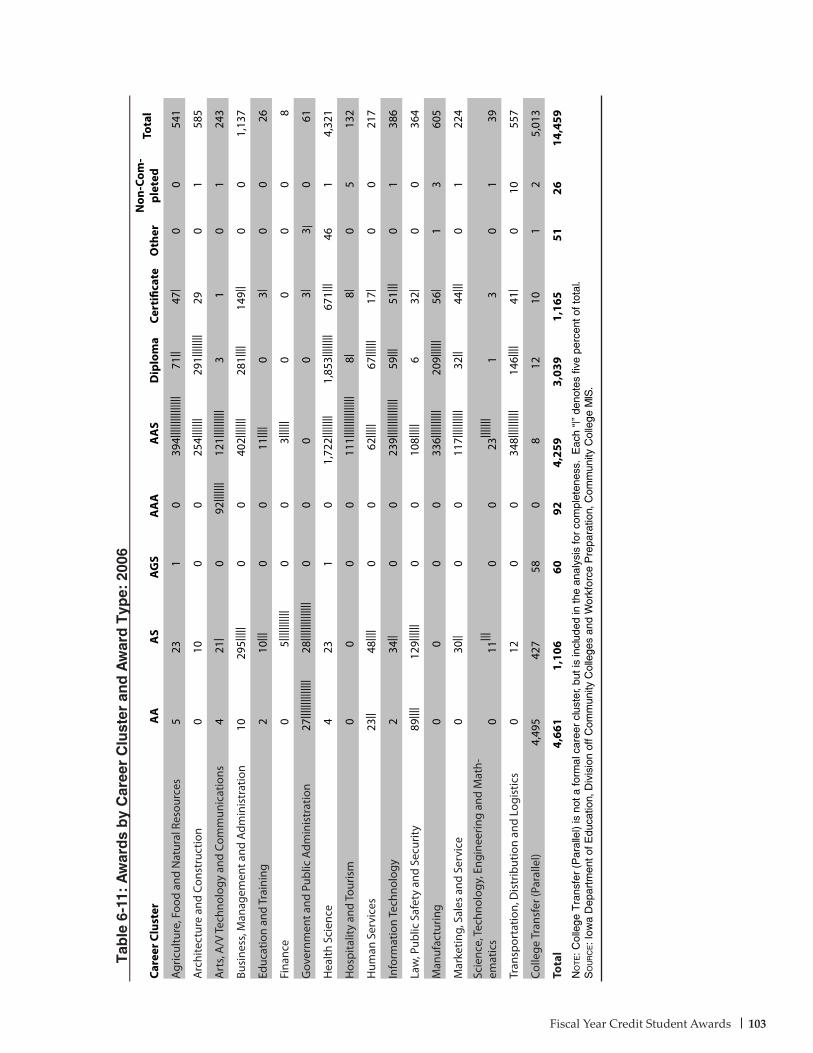
Fiscal Year Credit Student Awards 103
Tab
le 6
-11:
Aw
ard
s b
y C
aree
r C
lust
er a
nd
Aw
ard
Typ
e: 2
006
Care
er C
lust
erA
AA
SA
GS
AA
AA
AS
Dip
lom
aCe
rtifi
cate
Oth
erN
on-C
om-
plet
edTo
tal
Agric
ultu
re, F
ood
and
Nat
ural
Res
ourc
es5
231
039
4||||
||||||
|||||
71||
47|
00
541
Arc
hite
ctur
e an
d Co
nstr
uctio
n0
100
025
4||||
|||29
1||||
||||
290
158
5
Art
s, A
/V Te
chno
logy
and
Com
mun
icat
ions
421
|0
92|||
||||
121|
||||||
|||3
10
124
3
Busi
ness
, Man
agem
ent a
nd A
dmin
istr
atio
n10
295|
||||
00
402|
||||||
281|
|||14
9||
00
1,13
7
Educ
atio
n an
d Tr
aini
ng2
10|||
00
11|||
|0
3|0
026
Fina
nce
05|
||||||
||||
00
3||||
||0
00
08
Gov
ernm
ent a
nd P
ublic
Adm
inis
trat
ion
27|||
||||||
|||||
28|||
||||||
|||||
00
00
3|3|
061
Hea
lth S
cien
ce4
231
01,
722|
||||||
|1,
853|
||||||
|67
1|||
461
4,32
1
Hos
pita
lity
and
Tour
ism
00
00
111|
||||||
||||||
||8|
8|0
513
2
Hum
an S
ervi
ces
23||
48|||
|0
062
|||||
67|||
|||17
|0
021
7
Info
rmat
ion
Tech
nolo
gy2
34||
00
239|
||||||
||||||
|59
|||51
|||0
138
6
Law
, Pub
lic S
afet
y an
d Se
curit
y89
||||
129|
|||||
00
108|
||||
632
|0
036
4
Man
ufac
turin
g0
00
033
6||||
||||||
209|
|||||
56|
13
605
Mar
ketin
g, S
ales
and
Ser
vice
030
||0
011
7||||
||||||
32||
44|||
01
224
Scie
nce,
Tech
nolo
gy, E
ngin
eerin
g an
d M
ath-
emat
ics
011
|||0
023
||||||
|1
30
139
Tran
spor
tatio
n, D
istr
ibut
ion
and
Logi
stic
s0
120
034
8||||
||||||
146|
|||41
|0
1055
7
Colle
ge T
rans
fer (
Para
llel)
4,49
542
758
08
1210
12
5,01
3
Tota
l4,
661
1,10
660
924,
259
3,03
91,
165
5126
14,4
59N
ot
e: C
olle
ge T
rans
fer
(Par
alle
l) is
not
a fo
rmal
car
eer
clus
ter,
but i
s in
clud
ed in
the
anal
ysis
for
com
plet
enes
s. E
ach
“|”
deno
tes
five
perc
ent o
f tot
al.
So
ur
ce: I
owa
Dep
artm
ent o
f Edu
catio
n, D
ivis
ion
off C
omm
unity
Col
lege
s an
d W
orkf
orce
Pre
para
tion,
Com
mun
ity C
olle
ge M
IS.
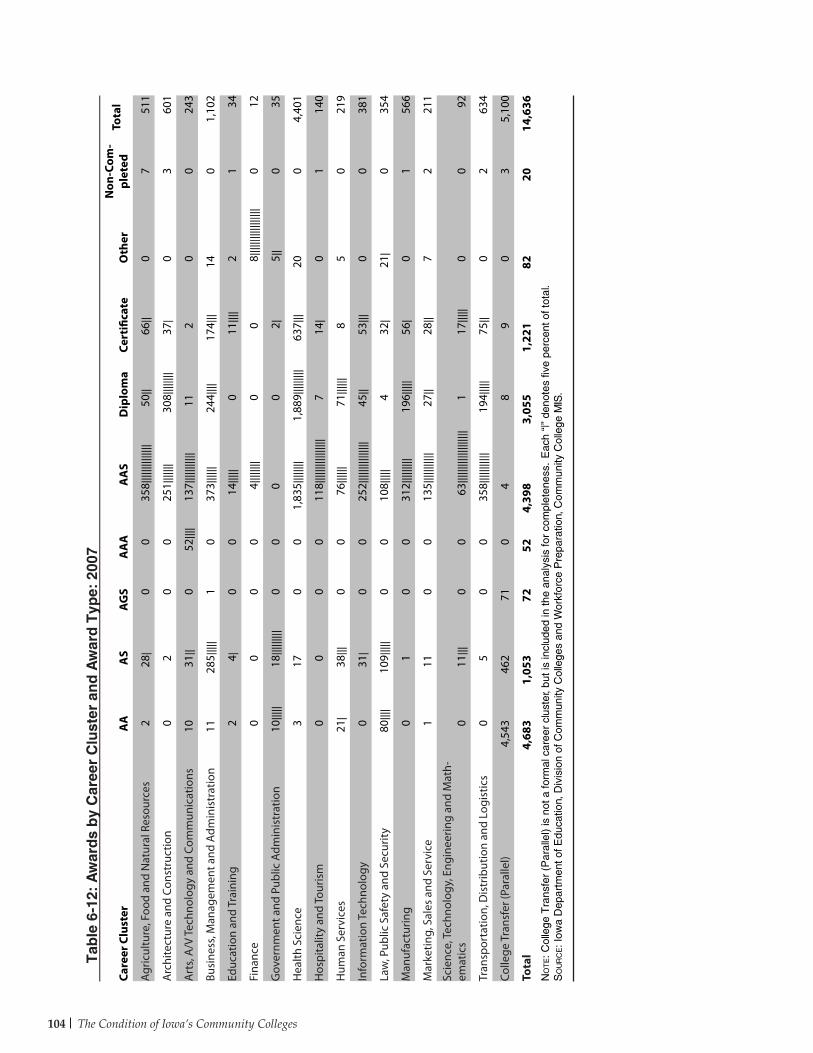
The Condition of Iowa’s Community Colleges104
Care
er C
lust
erA
AA
SA
GS
AA
AA
AS
Dip
lom
aCe
rtifi
cate
Oth
erN
on-C
om-
plet
edTo
tal
Agric
ultu
re, F
ood
and
Nat
ural
Res
ourc
es2
28|
00
358|
||||||
||||||
|50
||66
||0
751
1
Arc
hite
ctur
e an
d Co
nstr
uctio
n0
20
025
1 ||||
|||30
8||||
||||
37|
03
601
Art
s, A
/V Te
chno
logy
and
Com
mun
icat
ions
1031
||0
52|||
|13
7||||
||||||
|11
20
024
3
Busi
ness
, Man
agem
ent a
nd A
dmin
istr
atio
n11
285 |
||||
10
373|
|||||
244|
|||17
4|||
140
1,10
2
Educ
atio
n an
d Tr
aini
ng2
4 |0
014
|||||
011
||||
21
34
Fina
nce
00
00
4 ||||
||||
00
8||||
||||||
||||||
|0
12
Gov
ernm
ent a
nd P
ublic
Adm
inis
trat
ion
10|||
||18
||||||
|||0
00
02|
5||
035
Hea
lth S
cien
ce3
170
01,
835 |
||||||
|1,
889|
||||||
||63
7|||
200
4,40
1
Hos
pita
lity
and
Tour
ism
00
00
118 |
||||||
||||||
|||7
14|
01
140
Hum
an S
ervi
ces
21|
38|||
00
76|||
|||71
||||||
85
021
9
Info
rmat
ion
Tech
nolo
gy0
31|
00
252|
||||||
||||||
||45
||53
|||0
038
1
Law
, Pub
lic S
afet
y an
d Se
curit
y80
||||
109|
||||
00
108|
||||
432
|21
|0
354
Man
ufac
turin
g0
10
031
2 ||||
|||||
196|
||||
56|
01
566
Mar
ketin
g, S
ales
and
Ser
vice
111
00
135 |
||||||
||||
27||
28||
72
211
Scie
nce,
Tech
nolo
gy, E
ngin
eerin
g an
d M
ath-
emat
ics
011
|||0
063
||||||
||||||
||||||
|1
17|||
||0
092
Tran
spor
tatio
n, D
istr
ibut
ion
and
Logi
stic
s0
50
035
8 ||||
||||||
|19
4||||
|75
||0
263
4
Colle
ge T
rans
fer (
Para
llel)
4,54
346
271
04
89
03
5,10
0
Tota
l4,
683
1,05
372
524,
398
3,05
51,
221
8220
14,6
36N
ot
e: C
olle
ge T
rans
fer
(Par
alle
l) is
not
a fo
rmal
car
eer
clus
ter,
but i
s in
clud
ed in
the
anal
ysis
for
com
plet
enes
s. E
ach
“|”
deno
tes
five
perc
ent o
f tot
al.
So
ur
ce: I
owa
Dep
artm
ent o
f Edu
catio
n, D
ivis
ion
of C
omm
unity
Col
lege
s an
d W
orkf
orce
Pre
para
tion,
Com
mun
ity C
olle
ge M
IS.
Tab
le 6
-12:
Aw
ard
s b
y C
aree
r C
lust
er a
nd
Aw
ard
Typ
e: 2
007
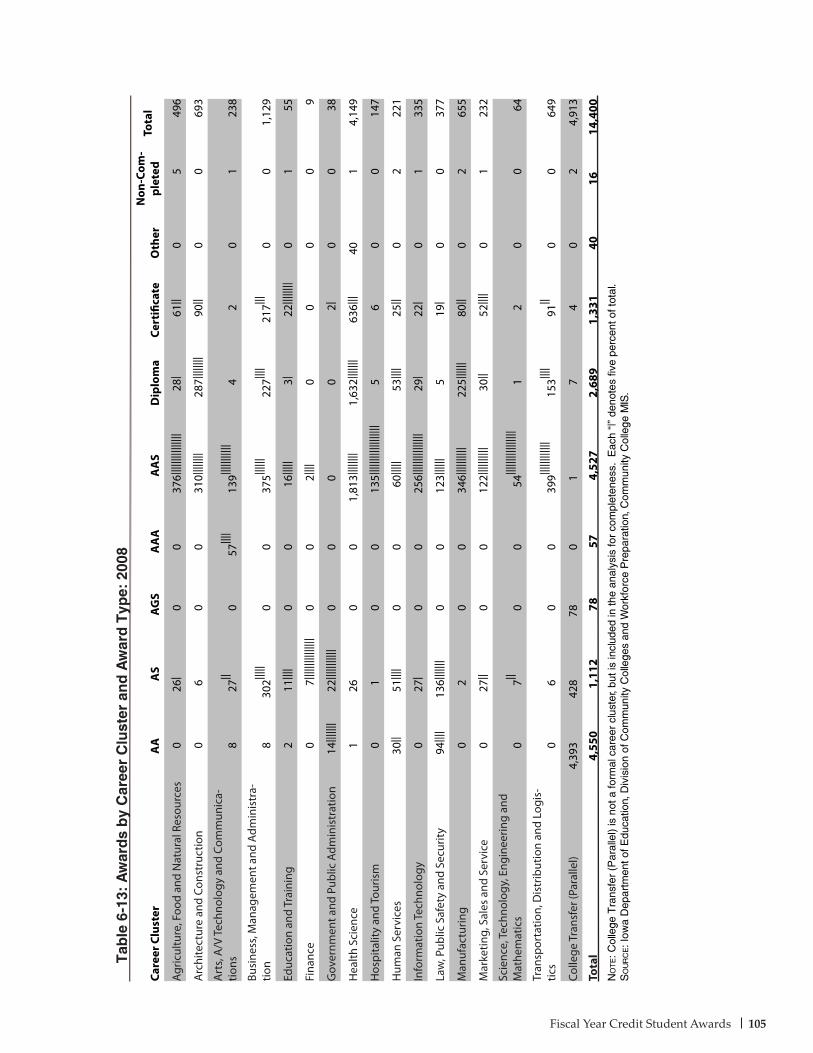
Fiscal Year Credit Student Awards 105
Tab
le 6
-13:
Aw
ard
s b
y C
aree
r C
lust
er a
nd
Aw
ard
Typ
e: 2
008
Care
er C
lust
erA
AA
SA
GS
AA
AA
AS
Dip
lom
aCe
rtifi
cate
Oth
erN
on-C
om-
plet
edTo
tal
Agric
ultu
re, F
ood
and
Nat
ural
Res
ourc
es0
26|
00
376|
||||||
||||||
||28
|61
||0
549
6
Arc
hite
ctur
e an
d Co
nstr
uctio
n0
60
031
0||||
||||
287|
||||||
|90
||0
069
3
Art
s, A
/V Te
chno
logy
and
Com
mun
ica-
tions
827
||0
57|||
|13
9||||||
|||||
42
01
238
Busi
ness
, Man
agem
ent a
nd A
dmin
istr
a-tio
n8
302|||
||0
037
5||||||
227|||
|21
7|||0
01,
129
Educ
atio
n an
d Tr
aini
ng2
11|||
|0
016
|||||
3|22
||||||
||0
155
Fina
nce
07|
||||||
||||||
||0
02|
|||0
00
09
Gov
ernm
ent a
nd P
ublic
Adm
inis
trat
ion
14|||
||||
22|||
||||||
||0
00
02|
00
38
Hea
lth S
cien
ce1
260
01,
813|
||||||
|1,
632|
||||||
636|
||40
14,
149
Hos
pita
lity
and
Tour
ism
01
00
135|
||||||
||||||
|||||
56
00
147
Hum
an S
ervi
ces
30||
51|||
|0
060
|||||
53|||
|25
||0
222
1
Info
rmat
ion
Tech
nolo
gy0
27|
00
256|
||||||
||||||
||29
|22
|0
133
5
Law
, Pub
lic S
afet
y an
d Se
curit
y94
||||
136|
||||||
00
123|
|||||
519
|0
037
7
Man
ufac
turin
g0
20
034
6||||
||||||
225|
|||||
80||
02
655
Mar
ketin
g, S
ales
and
Ser
vice
027
||0
012
2||||
||||||
30||
52|||
|0
123
2
Scie
nce,
Tech
nolo
gy, E
ngin
eerin
g an
d M
athe
mat
ics
07||
00
54|||
||||||
||||||
|1
20
064
Tran
spor
tatio
n, D
istr
ibut
ion
and
Logi
s-tic
s0
60
039
9||||||
||||||
153|||
|91
||0
064
9
Colle
ge T
rans
fer (
Para
llel)
4,39
342
878
01
74
02
4,91
3
Tota
l4,
550
1,11
278
574,
527
2,68
91,
331
4016
14,4
00N
ot
e: C
olle
ge T
rans
fer
(Par
alle
l) is
not
a fo
rmal
car
eer
clus
ter,
but i
s in
clud
ed in
the
anal
ysis
for
com
plet
enes
s. E
ach
“|”
deno
tes
five
perc
ent o
f tot
al.
So
ur
ce: I
owa
Dep
artm
ent o
f Edu
catio
n, D
ivis
ion
of C
omm
unity
Col
lege
s an
d W
orkf
orce
Pre
para
tion,
Com
mun
ity C
olle
ge M
IS.
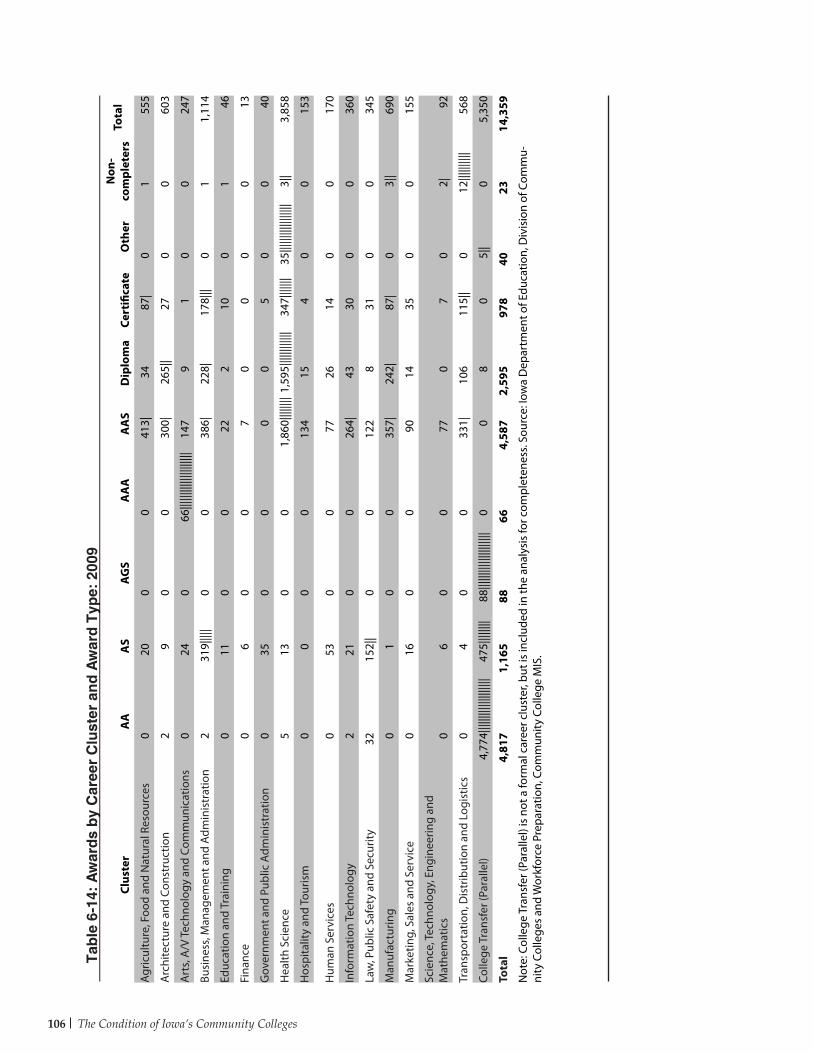
The Condition of Iowa’s Community Colleges106
Tab
le 6
-14:
Aw
ard
s b
y C
aree
r C
lust
er a
nd
Aw
ard
Typ
e: 2
009
Clus
ter
AA
AS
AG
SA
AA
AA
SD
iplo
ma
Cert
ifica
teO
ther
Non
-co
mpl
eter
sTo
tal
Agric
ultu
re, F
ood
and
Nat
ural
Res
ourc
es0
200
041
3|34
87|
01
555
Arc
hite
ctur
e an
d Co
nstr
uctio
n2
90
030
0|26
5||
270
060
3
Art
s, A
/V Te
chno
logy
and
Com
mun
icat
ions
024
066
||||||
||||||
||||||
||14
79
10
024
7
Busi
ness
, Man
agem
ent a
nd A
dmin
istr
atio
n2
319|
||||
00
386|
228|
178|
||0
11,
114
Educ
atio
n an
d Tr
aini
ng0
110
022
210
01
46
Fina
nce
06
00
70
00
013
Gov
ernm
ent a
nd P
ublic
Adm
inis
trat
ion
035
00
00
50
040
Hea
lth S
cien
ce5
130
01,
860|
||||||
|1,5
95|||
||||||
|||34
7||||
|||35
||||||
||||||
|||||
3||
3,85
8
Hos
pita
lity
and
Tour
ism
00
00
134
154
00
153
Hum
an S
ervi
ces
053
00
7726
140
017
0
Info
rmat
ion
Tech
nolo
gy2
210
026
4|43
300
036
0
Law
, Pub
lic S
afet
y an
d Se
curit
y32
152|
|0
012
28
310
034
5
Man
ufac
turin
g0
10
035
7|24
2|87
|0
3||
690
Mar
ketin
g, S
ales
and
Ser
vice
016
00
9014
350
015
5
Scie
nce,
Tech
nolo
gy, E
ngin
eerin
g an
d M
athe
mat
ics
06
00
770
70
2|92
Tran
spor
tatio
n, D
istr
ibut
ion
and
Logi
stic
s0
40
033
1|10
611
5||
012
||||||
||||
568
Colle
ge T
rans
fer (
Para
llel)
4,77
4||||
||||||
||||||
|||47
5||||
||||
88|||
||||||
||||||
|||||
00
80
5||
05,
350
Tota
l4,
817
1,16
588
664,
587
2,59
597
840
2314
,359
Not
e: C
olle
ge T
rans
fer (
Para
llel)
is n
ot a
form
al c
aree
r clu
ster
, but
is in
clud
ed in
the
anal
ysis
for c
ompl
eten
ess.
Sour
ce: I
owa
Dep
artm
ent o
f Edu
catio
n, D
ivis
ion
of C
omm
u-ni
ty C
olle
ges
and
Wor
kfor
ce P
repa
ratio
n, C
omm
unity
Col
lege
MIS
.
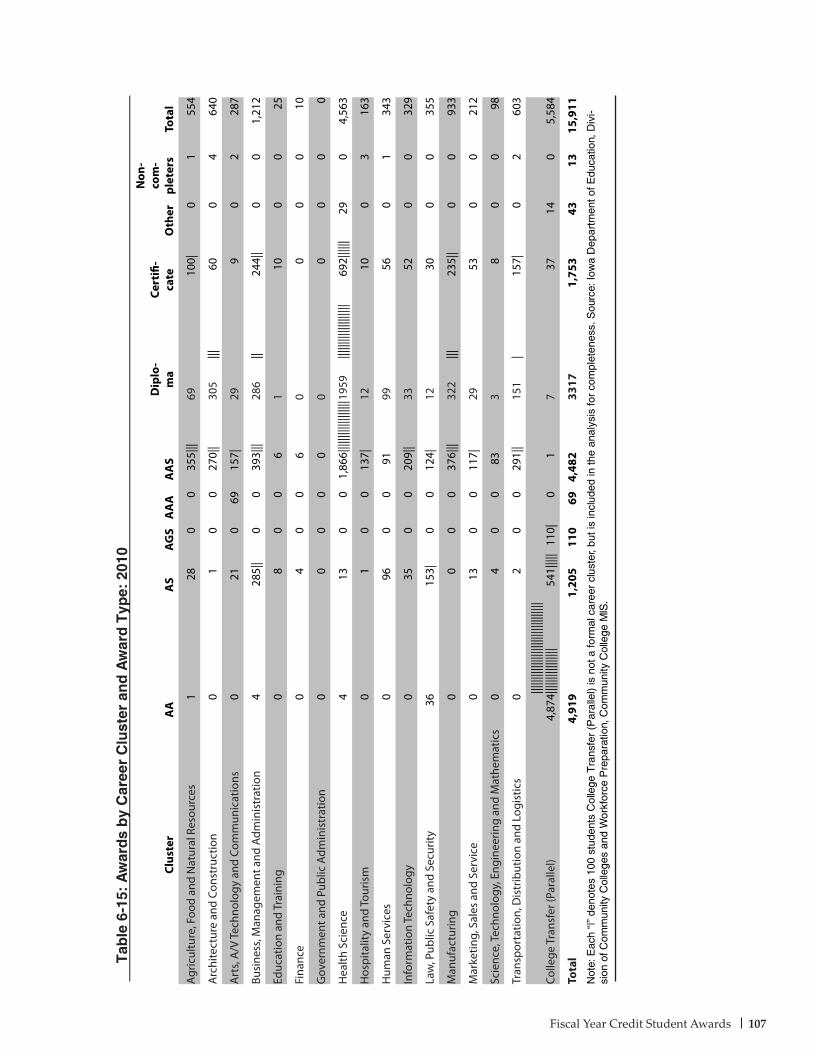
Fiscal Year Credit Student Awards 107
Tab
le 6
-15:
Aw
ard
s b
y C
aree
r C
lust
er a
nd
Aw
ard
Typ
e: 2
010
Clus
ter
AA
AS
AG
SA
AA
AA
SD
iplo
-m
aCe
rtifi
-ca
teO
ther
Non
-co
m-
plet
ers
Tota
l
Agric
ultu
re, F
ood
and
Nat
ural
Res
ourc
es1
280
035
5|||
6910
0|0
155
4
Arc
hite
ctur
e an
d Co
nstr
uctio
n0
10
027
0||
305
|||60
04
640
Art
s, A
/V Te
chno
logy
and
Com
mun
icat
ions
021
069
157|
299
02
287
Busi
ness
, Man
agem
ent a
nd A
dmin
istr
atio
n4
285|
|0
039
3|||
286
||24
4||
00
1,21
2
Educ
atio
n an
d Tr
aini
ng0
80
06
110
00
25
Fina
nce
04
00
60
00
010
Gov
ernm
ent a
nd P
ublic
Adm
inis
trat
ion
00
00
00
00
00
Hea
lth S
cien
ce4
130
01,
866|
||||||
||||||
|||||1
959
||||||
||||||
||||||
|69
2||||
||29
04,
563
Hos
pita
lity
and
Tour
ism
01
00
137|
1210
03
163
Hum
an S
ervi
ces
096
00
9199
560
134
3
Info
rmat
ion
Tech
nolo
gy0
350
020
9||
3352
00
329
Law
, Pub
lic S
afet
y an
d Se
curit
y36
153|
00
124|
1230
00
355
Man
ufac
turin
g0
00
037
6|||
322
|||23
5||
00
933
Mar
ketin
g, S
ales
and
Ser
vice
013
00
117|
2953
00
212
Scie
nce,
Tech
nolo
gy, E
ngin
eerin
g an
d M
athe
mat
ics
04
00
833
80
098
Tran
spor
tatio
n, D
istr
ibut
ion
and
Logi
stic
s0
20
029
1||
151
|15
7|0
260
3
Colle
ge T
rans
fer (
Para
llel)
4,87
4||||||
||||||
||||||
||||||
||||||
|||||
||||||
||||||
|54
1||||
|11
0|0
17
3714
05,
584
Tota
l4,
919
1,20
511
069
4,48
233
171,
753
4313
15,9
11N
ote:
Eac
h “|
” de
note
s 10
0 st
uden
ts C
olle
ge T
rans
fer
(Par
alle
l) is
not
a fo
rmal
car
eer
clus
ter,
but i
s in
clud
ed in
the
anal
ysis
for
com
plet
enes
s. S
ourc
e: Io
wa
Dep
artm
ent o
f Edu
catio
n, D
ivi-
sion
of C
omm
unity
Col
lege
s an
d W
orkf
orce
Pre
para
tion,
Com
mun
ity C
olle
ge M
IS.
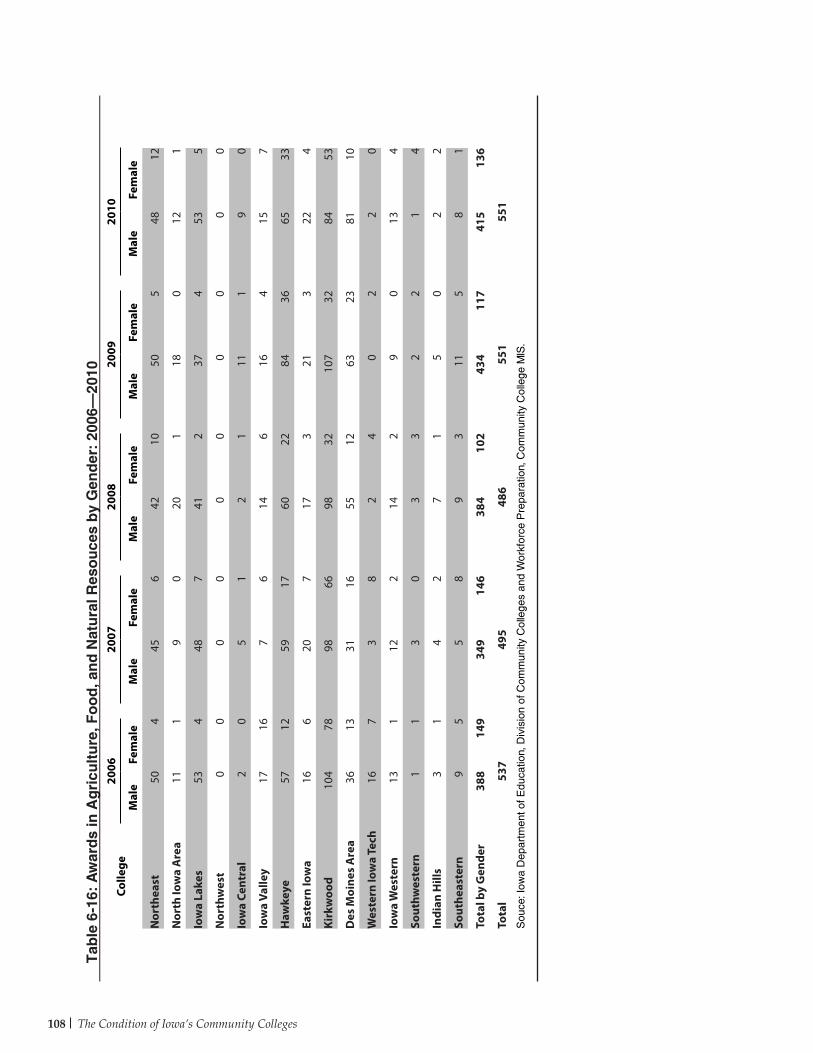
The Condition of Iowa’s Community Colleges108
Tab
le 6
-16:
Aw
ard
s in
Ag
ricu
ltu
re, F
oo
d, a
nd
Nat
ura
l Res
ou
ces
by
Gen
der
: 20
06–
2010
Colle
ge20
0620
0720
0820
0920
10
Mal
eFe
mal
eM
ale
Fem
ale
Mal
eFe
mal
eM
ale
Fem
ale
Mal
eFe
mal
e
Nor
thea
st50
445
642
1050
548
12
Nor
th Io
wa
Are
a11
19
020
118
012
1
Iow
a La
kes
534
487
412
374
535
Nor
thw
est
00
00
00
00
00
Iow
a Ce
ntra
l2
05
12
111
19
0
Iow
a Va
lley
1716
76
146
164
157
Haw
keye
5712
5917
6022
8436
6533
East
ern
Iow
a16
620
717
321
322
4
Kirk
woo
d10
478
9866
9832
107
3284
53
Des
Moi
nes
Are
a36
1331
1655
1263
2381
10
Wes
tern
Iow
a Te
ch16
73
82
40
22
0
Iow
a W
este
rn13
112
214
29
013
4
Sout
hwes
tern
11
30
33
22
14
Indi
an H
ills
31
42
71
50
22
Sout
heas
tern
95
58
93
115
81
Tota
l by
Gen
der
388
149
349
146
384
102
434
117
415
136
Tota
l53
749
548
655
155
1S
ouce
: Iow
a D
epar
tmen
t of E
duca
tion,
Div
isio
n of
Com
mun
ity C
olle
ges
and
Wor
kfor
ce P
repa
ratio
n, C
omm
unity
Col
lege
MIS
.

Fiscal Year Credit Student Awards 109
Tab
le 6
-17:
Aw
ard
s A
rch
itec
ture
an
d C
on
stru
ctio
n b
y G
end
er:
2006
–20
10
Colle
ge20
0620
0720
0820
0920
10
Mal
eFe
mal
eM
ale
Fem
ale
Mal
eFe
mal
eM
ale
Fem
ale
Mal
eFe
mal
e
Nor
thea
st36
551
159
146
157
1
Nor
th Io
wa
Are
a11
011
114
029
023
1
Iow
a La
kes
322
281
460
563
331
Nor
thw
est
740
711
762
102
011
13
Iow
a Ce
ntra
l20
344
228
429
310
1
Iow
a Va
lley
280
283
183
271
221
Haw
keye
253
363
293
273
261
East
ern
Iow
a17
429
030
814
022
1
Kirk
woo
d86
886
447
743
1267
6
Des
Moi
nes
Are
a67
863
1089
1071
482
6
Wes
tern
Iow
a Te
ch57
844
710
56
442
782
Iow
a W
este
rn21
020
021
618
230
1
Sout
hwes
tern
253
261
363
261
252
Indi
an H
ills
172
171
162
202
111
Sout
heas
tern
191
62
113
110
80
Tota
l by
Gen
der
535
4756
037
625
5856
334
605
28
Tota
l58
259
768
359
763
3S
ouce
: Iow
a D
epar
tmen
t of E
duca
tion,
Div
isio
n of
Com
mun
ity C
olle
ges
and
Wor
kfor
ce P
repa
ratio
n, C
omm
unity
Col
lege
MIS
.
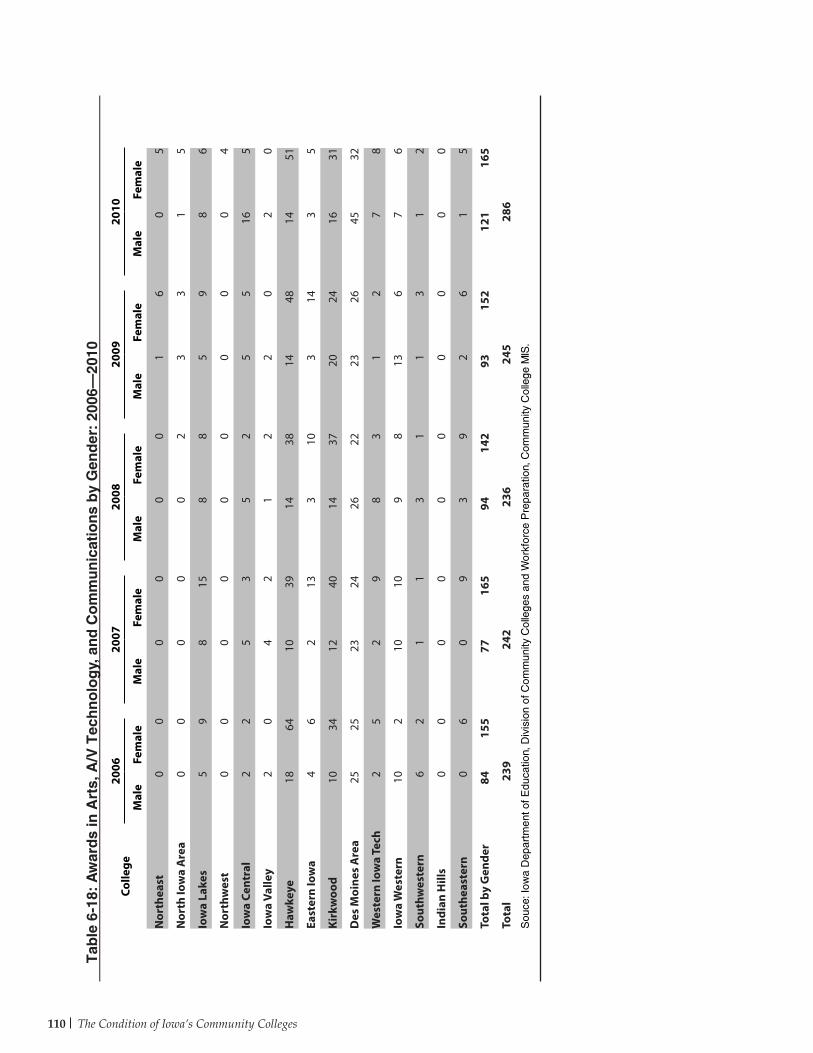
The Condition of Iowa’s Community Colleges110
Tab
le 6
-18:
Aw
ard
s in
Art
s, A
/V T
ech
no
log
y, a
nd
Co
mm
un
icat
ion
s b
y G
end
er:
2006
–20
10
Colle
ge20
0620
0720
0820
0920
10
Mal
eFe
mal
eM
ale
Fem
ale
Mal
eFe
mal
eM
ale
Fem
ale
Mal
eFe
mal
e
Nor
thea
st0
00
00
01
60
5
Nor
th Io
wa
Are
a0
00
00
23
31
5
Iow
a La
kes
59
815
88
59
86
Nor
thw
est
00
00
00
00
04
Iow
a Ce
ntra
l2
25
35
25
516
5
Iow
a Va
lley
20
42
12
20
20
Haw
keye
1864
1039
1438
1448
1451
East
ern
Iow
a4
62
133
103
143
5
Kirk
woo
d10
3412
4014
3720
2416
31
Des
Moi
nes
Are
a25
2523
2426
2223
2645
32
Wes
tern
Iow
a Te
ch2
52
98
31
27
8
Iow
a W
este
rn10
210
109
813
67
6
Sout
hwes
tern
62
11
31
13
12
Indi
an H
ills
00
00
00
00
00
Sout
heas
tern
06
09
39
26
15
Tota
l by
Gen
der
8415
577
165
9414
293
152
121
165
Tota
l23
924
223
624
528
6S
ouce
: Iow
a D
epar
tmen
t of E
duca
tion,
Div
isio
n of
Com
mun
ity C
olle
ges
and
Wor
kfor
ce P
repa
ratio
n, C
omm
unity
Col
lege
MIS
.

Fiscal Year Credit Student Awards 111
Tab
le 6
-19:
Aw
ard
s in
Bu
sin
ess
Man
agem
ent
and
Ad
min
istr
atio
n b
y G
end
er:
2006
–20
10
Colle
ge20
0620
0720
0820
0920
10
Mal
eFe
mal
eM
ale
Fem
ale
Mal
eFe
mal
eM
ale
Fem
ale
Mal
eFe
mal
e
Nor
thea
st15
119
1279
1862
1784
1786
Nor
th Io
wa
Are
a18
4718
5319
4317
4718
67
Iow
a La
kes
427
825
832
824
318
Nor
thw
est
1020
326
421
216
821
Iow
a Ce
ntra
l2
428
267
3619
3828
41
Iow
a Va
lley
127
021
124
123
315
Haw
keye
241
442
229
353
247
East
ern
Iow
a19
107
1017
133
110
2016
268
132
Kirk
woo
d29
9830
9927
9329
5865
106
Des
Moi
nes
Are
a75
147
5515
968
194
8117
767
171
Wes
tern
Iow
a Te
ch40
7628
7237
6823
3317
47
Iow
a W
este
rn4
262
133
226
243
21
Sout
hwes
tern
312
621
821
722
224
Indi
an H
ills
368
241
566
144
951
Sout
heas
tern
746
555
850
1255
742
Tota
l by
Gen
der
232
903
191
903
248
871
246
860
317
889
Tota
l11
3510
9411
1911
0612
06S
ouce
: Iow
a D
epar
tmen
t of E
duca
tion,
Div
isio
n of
Com
mun
ity C
olle
ges
and
Wor
kfor
ce P
repa
ratio
n, C
omm
unity
Col
lege
MIS
.
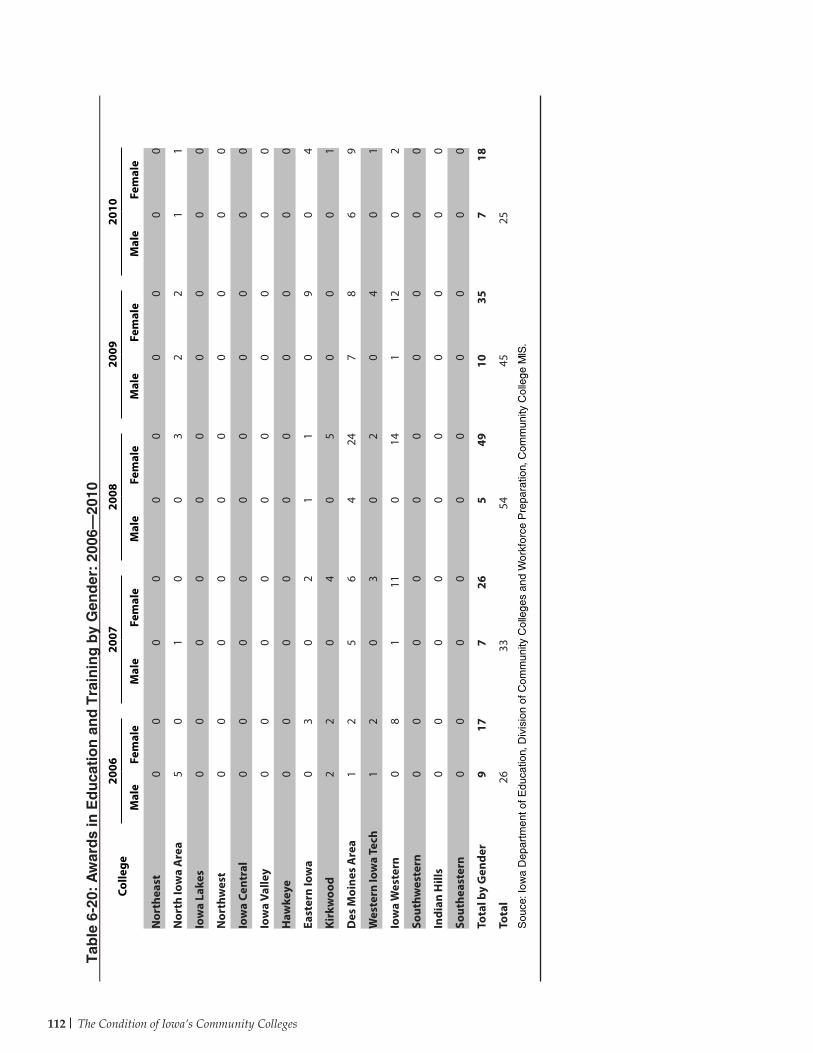
The Condition of Iowa’s Community Colleges112
Tab
le 6
-20:
Aw
ard
s in
Ed
uca
tio
n a
nd
Tra
inin
g b
y G
end
er:
2006
–20
10
Colle
ge20
0620
0720
0820
0920
10
Mal
eFe
mal
eM
ale
Fem
ale
Mal
eFe
mal
eM
ale
Fem
ale
Mal
eFe
mal
e
Nor
thea
st0
00
00
00
00
0
Nor
th Io
wa
Are
a5
01
00
32
21
1
Iow
a La
kes
00
00
00
00
00
Nor
thw
est
00
00
00
00
00
Iow
a Ce
ntra
l0
00
00
00
00
0
Iow
a Va
lley
00
00
00
00
00
Haw
keye
00
00
00
00
00
East
ern
Iow
a0
30
21
10
90
4
Kirk
woo
d2
20
40
50
00
1
Des
Moi
nes
Are
a1
25
64
247
86
9
Wes
tern
Iow
a Te
ch1
20
30
20
40
1
Iow
a W
este
rn0
81
110
141
120
2
Sout
hwes
tern
00
00
00
00
00
Indi
an H
ills
00
00
00
00
00
Sout
heas
tern
00
00
00
00
00
Tota
l by
Gen
der
917
726
549
1035
718
Tota
l26
3354
4525
Sou
ce: I
owa
Dep
artm
ent o
f Edu
catio
n, D
ivis
ion
of C
omm
unity
Col
lege
s an
d W
orkf
orce
Pre
para
tion,
Com
mun
ity C
olle
ge M
IS.
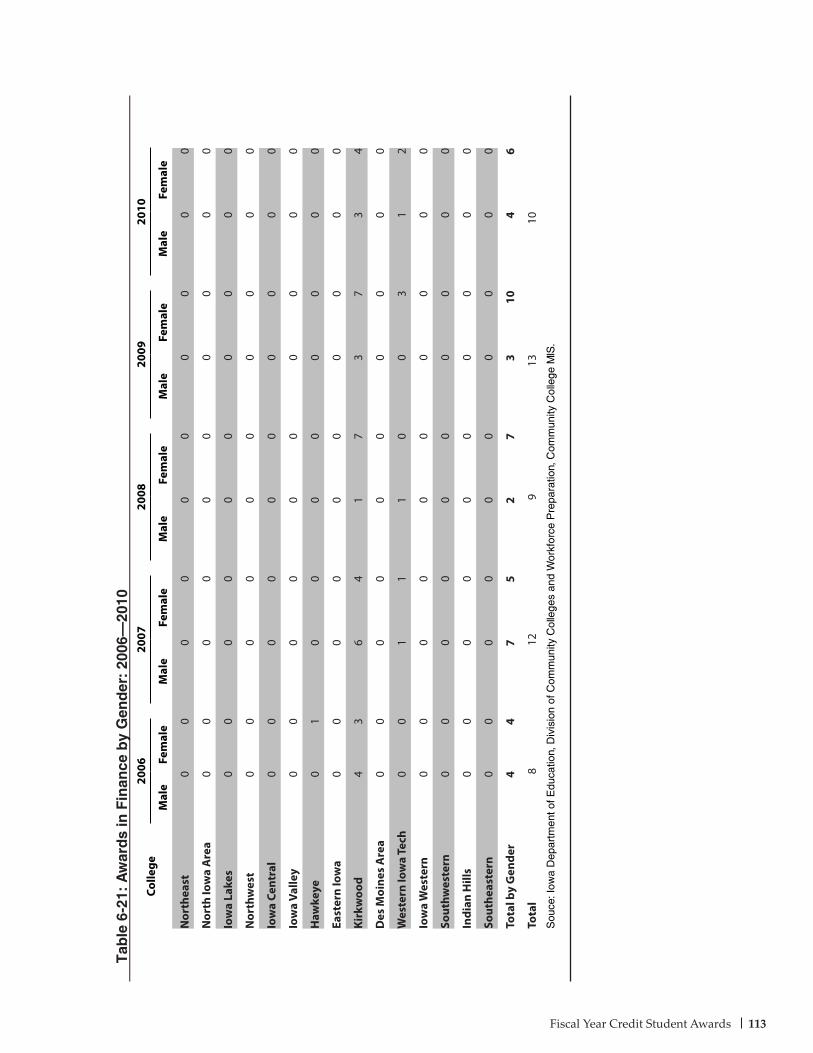
Fiscal Year Credit Student Awards 113
Tab
le 6
-21:
Aw
ard
s in
Fin
ance
by
Gen
der
: 20
06–
2010
Colle
ge20
0620
0720
0820
0920
10
Mal
eFe
mal
eM
ale
Fem
ale
Mal
eFe
mal
eM
ale
Fem
ale
Mal
eFe
mal
e
Nor
thea
st0
00
00
00
00
0
Nor
th Io
wa
Are
a0
00
00
00
00
0
Iow
a La
kes
00
00
00
00
00
Nor
thw
est
00
00
00
00
00
Iow
a Ce
ntra
l0
00
00
00
00
0
Iow
a Va
lley
00
00
00
00
00
Haw
keye
01
00
00
00
00
East
ern
Iow
a0
00
00
00
00
0
Kirk
woo
d4
36
41
73
73
4
Des
Moi
nes
Are
a0
00
00
00
00
0
Wes
tern
Iow
a Te
ch0
01
11
00
31
2
Iow
a W
este
rn0
00
00
00
00
0
Sout
hwes
tern
00
00
00
00
00
Indi
an H
ills
00
00
00
00
00
Sout
heas
tern
00
00
00
00
00
Tota
l by
Gen
der
44
75
27
310
46
Tota
l8
129
1310
Sou
ce: I
owa
Dep
artm
ent o
f Edu
catio
n, D
ivis
ion
of C
omm
unity
Col
lege
s an
d W
orkf
orce
Pre
para
tion,
Com
mun
ity C
olle
ge M
IS.
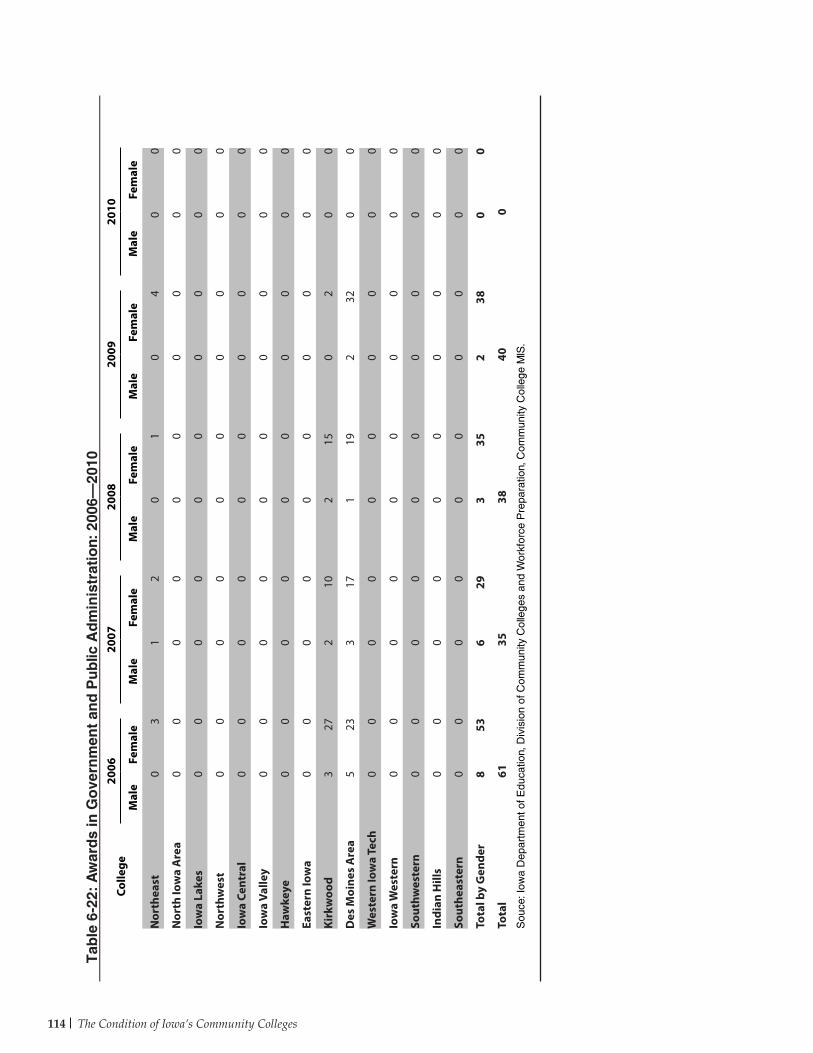
The Condition of Iowa’s Community Colleges114
Tab
le 6
-22:
Aw
ard
s in
Go
vern
men
t an
d P
ub
lic A
dm
inis
trat
ion:
200
6–20
10
Colle
ge20
0620
0720
0820
0920
10
Mal
eFe
mal
eM
ale
Fem
ale
Mal
eFe
mal
eM
ale
Fem
ale
Mal
eFe
mal
e
Nor
thea
st0
31
20
10
40
0
Nor
th Io
wa
Are
a0
00
00
00
00
0
Iow
a La
kes
00
00
00
00
00
Nor
thw
est
00
00
00
00
00
Iow
a Ce
ntra
l0
00
00
00
00
0
Iow
a Va
lley
00
00
00
00
00
Haw
keye
00
00
00
00
00
East
ern
Iow
a0
00
00
00
00
0
Kirk
woo
d3
272
102
150
20
0
Des
Moi
nes
Are
a5
233
171
192
320
0
Wes
tern
Iow
a Te
ch0
00
00
00
00
0
Iow
a W
este
rn0
00
00
00
00
0
Sout
hwes
tern
00
00
00
00
00
Indi
an H
ills
00
00
00
00
00
Sout
heas
tern
00
00
00
00
00
Tota
l by
Gen
der
853
629
335
238
00
Tota
l61
3538
400
Sou
ce: I
owa
Dep
artm
ent o
f Edu
catio
n, D
ivis
ion
of C
omm
unity
Col
lege
s an
d W
orkf
orce
Pre
para
tion,
Com
mun
ity C
olle
ge M
IS.
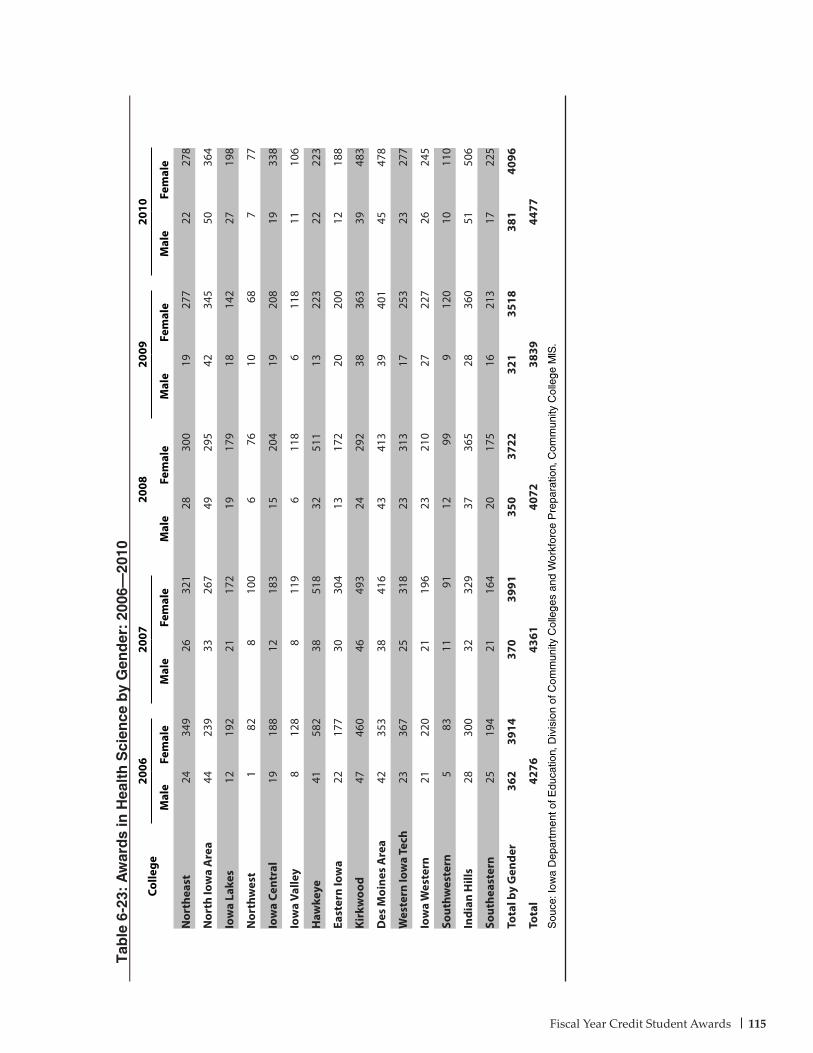
Fiscal Year Credit Student Awards 115
Tab
le 6
-23:
Aw
ard
s in
Hea
lth
Sci
ence
by
Gen
der
: 20
06–
2010
Colle
ge20
0620
0720
0820
0920
10
Mal
eFe
mal
eM
ale
Fem
ale
Mal
eFe
mal
eM
ale
Fem
ale
Mal
eFe
mal
e
Nor
thea
st24
349
2632
128
300
1927
722
278
Nor
th Io
wa
Are
a44
239
3326
749
295
4234
550
364
Iow
a La
kes
1219
221
172
1917
918
142
2719
8
Nor
thw
est
182
810
06
7610
687
77
Iow
a Ce
ntra
l19
188
1218
315
204
1920
819
338
Iow
a Va
lley
812
88
119
611
86
118
1110
6
Haw
keye
4158
238
518
3251
113
223
2222
3
East
ern
Iow
a22
177
3030
413
172
2020
012
188
Kirk
woo
d47
460
4649
324
292
3836
339
483
Des
Moi
nes
Are
a42
353
3841
643
413
3940
145
478
Wes
tern
Iow
a Te
ch23
367
2531
823
313
1725
323
277
Iow
a W
este
rn21
220
2119
623
210
2722
726
245
Sout
hwes
tern
583
1191
1299
912
010
110
Indi
an H
ills
2830
032
329
3736
528
360
5150
6
Sout
heas
tern
2519
421
164
2017
516
213
1722
5
Tota
l by
Gen
der
362
3914
370
3991
350
3722
321
3518
381
4096
Tota
l42
7643
6140
7238
3944
77S
ouce
: Iow
a D
epar
tmen
t of E
duca
tion,
Div
isio
n of
Com
mun
ity C
olle
ges
and
Wor
kfor
ce P
repa
ratio
n, C
omm
unity
Col
lege
MIS
.
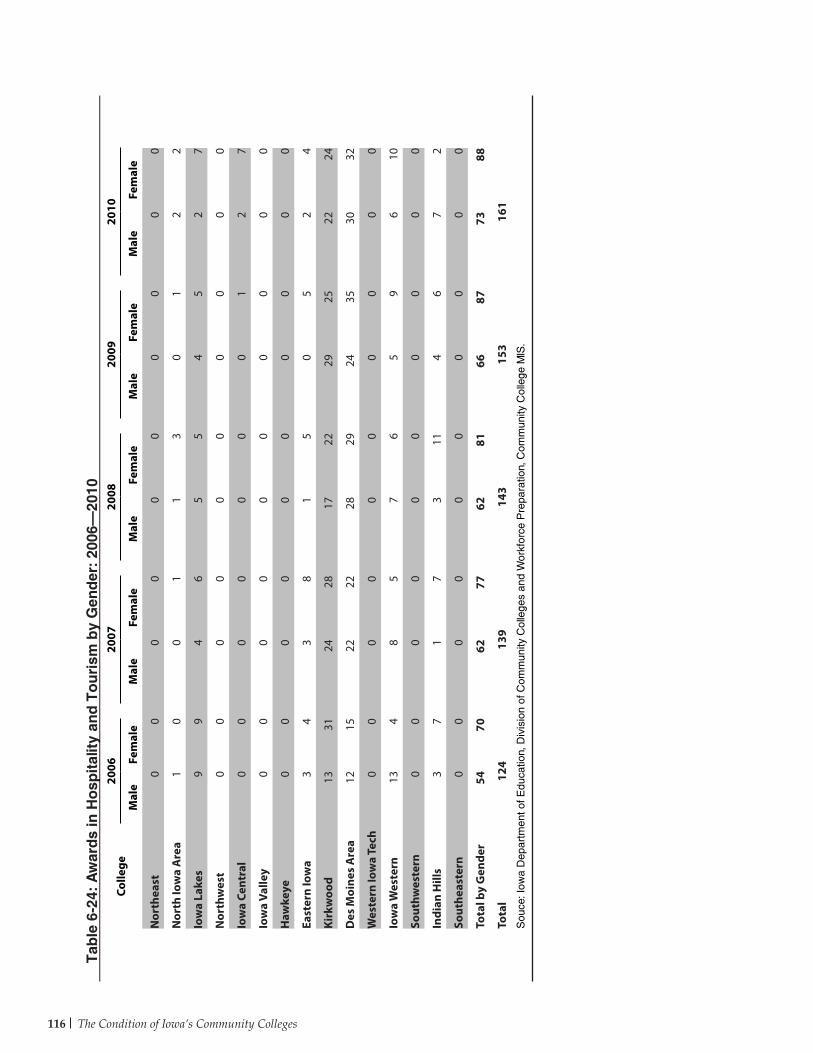
The Condition of Iowa’s Community Colleges116
Tab
le 6
-24:
Aw
ard
s in
Ho
spit
alit
y an
d T
ou
rism
by
Gen
der
: 20
06–
2010
Colle
ge20
0620
0720
0820
0920
10
Mal
eFe
mal
eM
ale
Fem
ale
Mal
eFe
mal
eM
ale
Fem
ale
Mal
eFe
mal
e
Nor
thea
st0
00
00
00
00
0
Nor
th Io
wa
Are
a1
00
11
30
12
2
Iow
a La
kes
99
46
55
45
27
Nor
thw
est
00
00
00
00
00
Iow
a Ce
ntra
l0
00
00
00
12
7
Iow
a Va
lley
00
00
00
00
00
Haw
keye
00
00
00
00
00
East
ern
Iow
a3
43
81
50
52
4
Kirk
woo
d13
3124
2817
2229
2522
24
Des
Moi
nes
Are
a12
1522
2228
2924
3530
32
Wes
tern
Iow
a Te
ch0
00
00
00
00
0
Iow
a W
este
rn13
48
57
65
96
10
Sout
hwes
tern
00
00
00
00
00
Indi
an H
ills
37
17
311
46
72
Sout
heas
tern
00
00
00
00
00
Tota
l by
Gen
der
5470
6277
6281
6687
7388
Tota
l12
413
914
315
316
1S
ouce
: Iow
a D
epar
tmen
t of E
duca
tion,
Div
isio
n of
Com
mun
ity C
olle
ges
and
Wor
kfor
ce P
repa
ratio
n, C
omm
unity
Col
lege
MIS
.
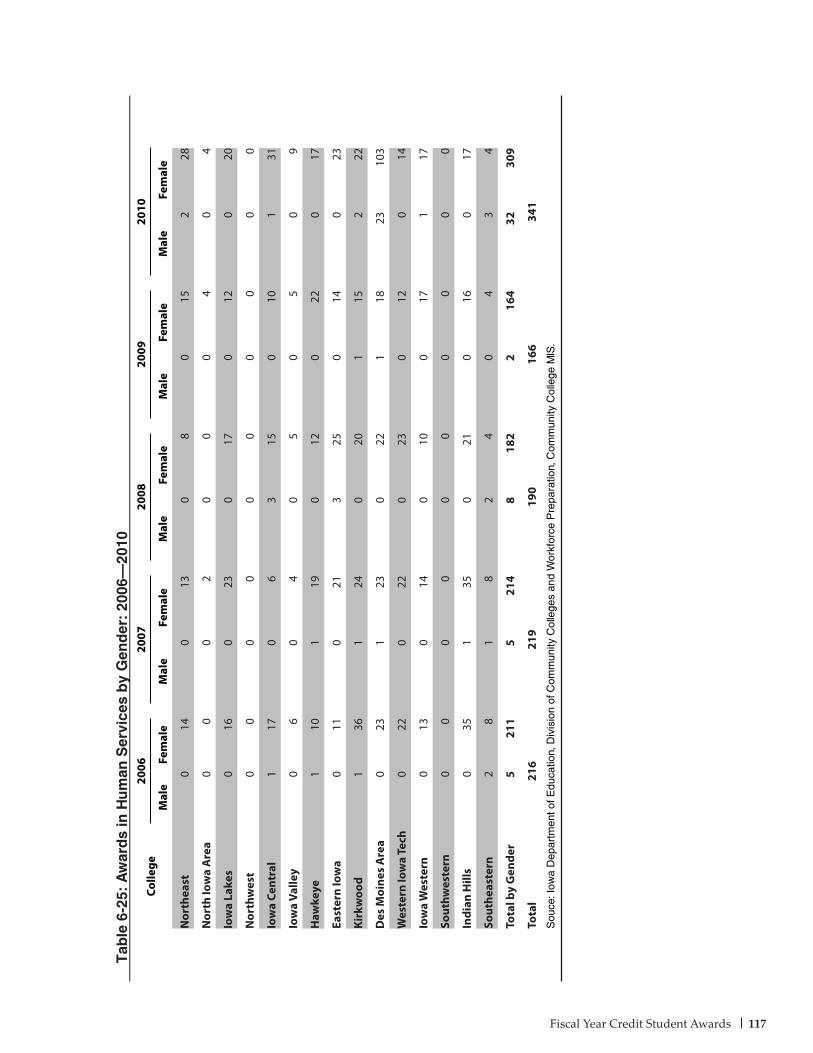
Fiscal Year Credit Student Awards 117
Tab
le 6
-25:
Aw
ard
s in
Hu
man
Ser
vice
s b
y G
end
er:
2006
–20
10
Colle
ge20
0620
0720
0820
0920
10
Mal
eFe
mal
eM
ale
Fem
ale
Mal
eFe
mal
eM
ale
Fem
ale
Mal
eFe
mal
e
Nor
thea
st0
140
130
80
152
28
Nor
th Io
wa
Are
a0
00
20
00
40
4
Iow
a La
kes
016
023
017
012
020
Nor
thw
est
00
00
00
00
00
Iow
a Ce
ntra
l1
170
63
150
101
31
Iow
a Va
lley
06
04
05
05
09
Haw
keye
110
119
012
022
017
East
ern
Iow
a0
110
213
250
140
23
Kirk
woo
d1
361
240
201
152
22
Des
Moi
nes
Are
a0
231
230
221
1823
103
Wes
tern
Iow
a Te
ch0
220
220
230
120
14
Iow
a W
este
rn0
130
140
100
171
17
Sout
hwes
tern
00
00
00
00
00
Indi
an H
ills
035
135
021
016
017
Sout
heas
tern
28
18
24
04
34
Tota
l by
Gen
der
521
15
214
818
22
164
3230
9
Tota
l21
621
919
016
634
1S
ouce
: Iow
a D
epar
tmen
t of E
duca
tion,
Div
isio
n of
Com
mun
ity C
olle
ges
and
Wor
kfor
ce P
repa
ratio
n, C
omm
unity
Col
lege
MIS
.

The Condition of Iowa’s Community Colleges118
Tab
le 6
-26:
Aw
ard
s in
Info
rmat
ion
Tec
hn
olo
gy
by
Gen
der
: 20
06–
2010
Colle
ge20
0620
0720
0820
0920
10
Mal
eFe
mal
eM
ale
Fem
ale
Mal
eFe
mal
eM
ale
Fem
ale
Mal
eFe
mal
e
Nor
thea
st18
612
512
1015
73
1
Nor
th Io
wa
Are
a18
713
916
212
112
4
Iow
a La
kes
41
50
42
41
103
Nor
thw
est
157
84
52
21
21
Iow
a Ce
ntra
l5
49
65
121
58
1
Iow
a Va
lley
41
41
32
52
12
Haw
keye
183
158
175
405
331
East
ern
Iow
a27
1026
730
228
720
3
Kirk
woo
d83
1974
1145
1048
677
13
Des
Moi
nes
Are
a38
1335
1229
544
1148
7
Wes
tern
Iow
a Te
ch15
210
108
010
27
6
Iow
a W
este
rn8
25
47
55
29
1
Sout
hwes
tern
93
36
1710
113
45
Indi
an H
ills
2510
4915
5023
3911
2612
Sout
heas
tern
53
71
43
101
53
Tota
l by
Gen
der
292
9127
599
252
8229
465
265
63
Tota
l38
337
433
435
932
8S
ouce
: Iow
a D
epar
tmen
t of E
duca
tion,
Div
isio
n of
Com
mun
ity C
olle
ges
and
Wor
kfor
ce P
repa
ratio
n, C
omm
unity
Col
lege
MIS
.
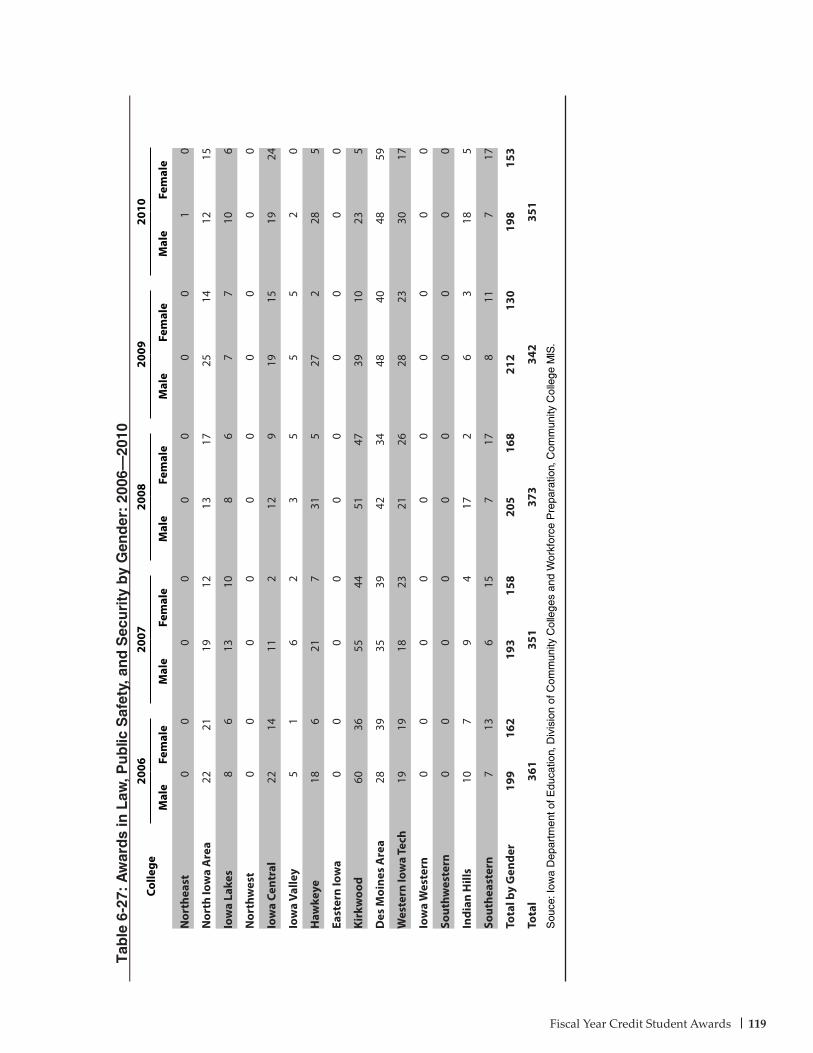
Fiscal Year Credit Student Awards 119
Tab
le 6
-27:
Aw
ard
s in
Law
, Pu
blic
Saf
ety,
an
d S
ecu
rity
by
Gen
der
: 20
06–
2010
Colle
ge20
0620
0720
0820
0920
10
Mal
eFe
mal
eM
ale
Fem
ale
Mal
eFe
mal
eM
ale
Fem
ale
Mal
eFe
mal
e
Nor
thea
st0
00
00
00
01
0
Nor
th Io
wa
Are
a22
2119
1213
1725
1412
15
Iow
a La
kes
86
1310
86
77
106
Nor
thw
est
00
00
00
00
00
Iow
a Ce
ntra
l22
1411
212
919
1519
24
Iow
a Va
lley
51
62
35
55
20
Haw
keye
186
217
315
272
285
East
ern
Iow
a0
00
00
00
00
0
Kirk
woo
d60
3655
4451
4739
1023
5
Des
Moi
nes
Are
a28
3935
3942
3448
4048
59
Wes
tern
Iow
a Te
ch19
1918
2321
2628
2330
17
Iow
a W
este
rn0
00
00
00
00
0
Sout
hwes
tern
00
00
00
00
00
Indi
an H
ills
107
94
172
63
185
Sout
heas
tern
713
615
717
811
717
Tota
l by
Gen
der
199
162
193
158
205
168
212
130
198
153
Tota
l36
135
137
334
235
1S
ouce
: Iow
a D
epar
tmen
t of E
duca
tion,
Div
isio
n of
Com
mun
ity C
olle
ges
and
Wor
kfor
ce P
repa
ratio
n, C
omm
unity
Col
lege
MIS
.
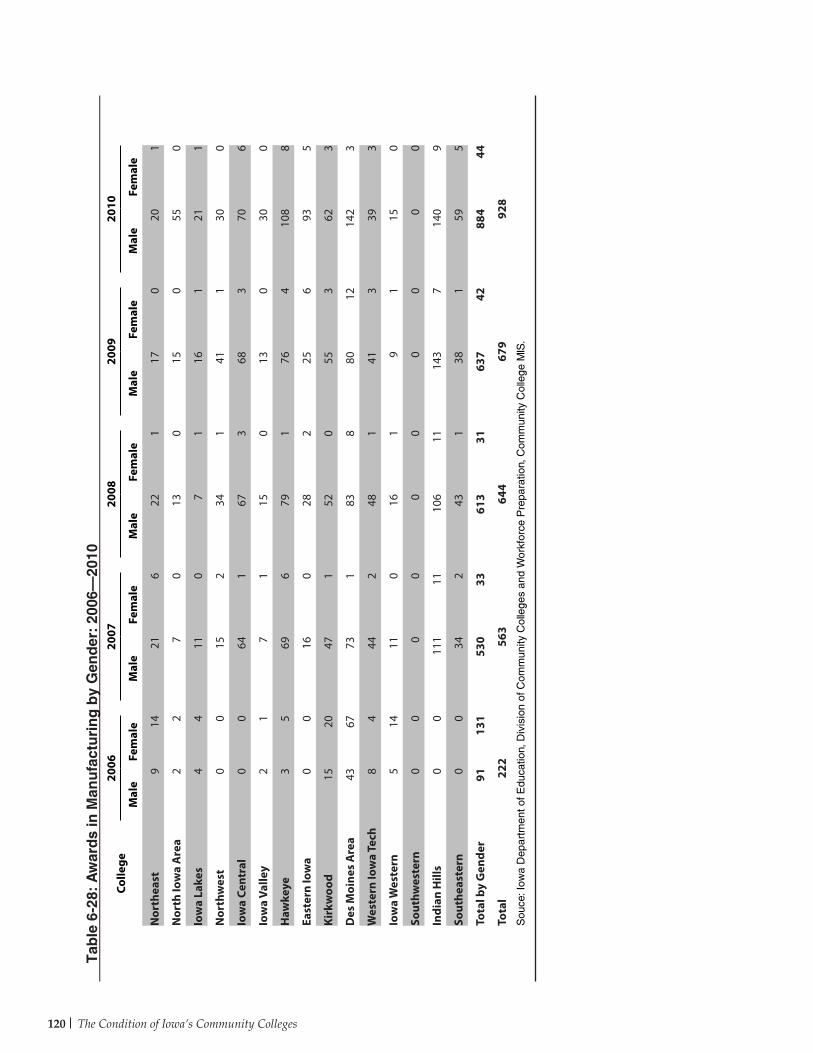
The Condition of Iowa’s Community Colleges120
Tab
le 6
-28:
Aw
ard
s in
Man
ufa
ctu
rin
g b
y G
end
er:
2006
–20
10
Colle
ge20
0620
0720
0820
0920
10
Mal
eFe
mal
eM
ale
Fem
ale
Mal
eFe
mal
eM
ale
Fem
ale
Mal
eFe
mal
e
Nor
thea
st9
1421
622
117
020
1
Nor
th Io
wa
Are
a2
27
013
015
055
0
Iow
a La
kes
44
110
71
161
211
Nor
thw
est
00
152
341
411
300
Iow
a Ce
ntra
l0
064
167
368
370
6
Iow
a Va
lley
21
71
150
130
300
Haw
keye
35
696
791
764
108
8
East
ern
Iow
a0
016
028
225
693
5
Kirk
woo
d15
2047
152
055
362
3
Des
Moi
nes
Are
a43
6773
183
880
1214
23
Wes
tern
Iow
a Te
ch8
444
248
141
339
3
Iow
a W
este
rn5
1411
016
19
115
0
Sout
hwes
tern
00
00
00
00
00
Indi
an H
ills
00
111
1110
611
143
714
09
Sout
heas
tern
00
342
431
381
595
Tota
l by
Gen
der
9113
153
033
613
3163
742
884
44
Tota
l22
256
364
467
992
8S
ouce
: Iow
a D
epar
tmen
t of E
duca
tion,
Div
isio
n of
Com
mun
ity C
olle
ges
and
Wor
kfor
ce P
repa
ratio
n, C
omm
unity
Col
lege
MIS
.
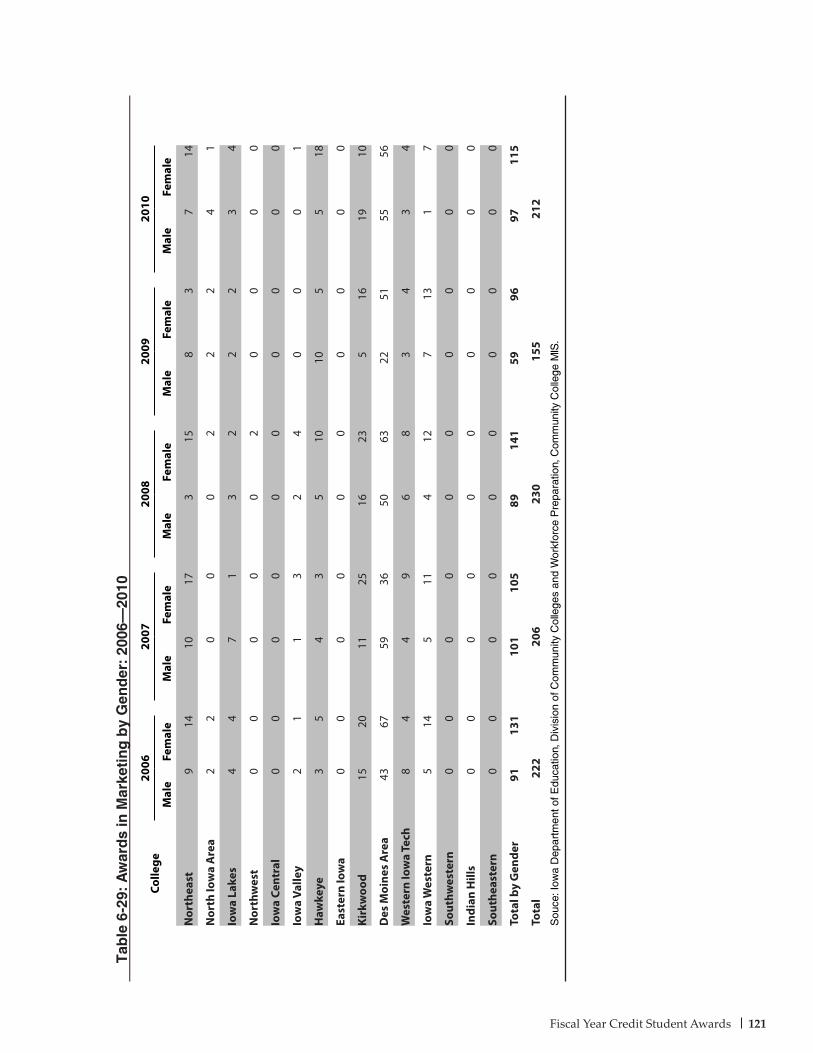
Fiscal Year Credit Student Awards 121
Tab
le 6
-29:
Aw
ard
s in
Mar
keti
ng
by
Gen
der
: 20
06–
2010
Colle
ge20
0620
0720
0820
0920
10
Mal
eFe
mal
eM
ale
Fem
ale
Mal
eFe
mal
eM
ale
Fem
ale
Mal
eFe
mal
e
Nor
thea
st9
1410
173
158
37
14
Nor
th Io
wa
Are
a2
20
00
22
24
1
Iow
a La
kes
44
71
32
22
34
Nor
thw
est
00
00
02
00
00
Iow
a Ce
ntra
l0
00
00
00
00
0
Iow
a Va
lley
21
13
24
00
01
Haw
keye
35
43
510
105
518
East
ern
Iow
a0
00
00
00
00
0
Kirk
woo
d15
2011
2516
235
1619
10
Des
Moi
nes
Are
a43
6759
3650
6322
5155
56
Wes
tern
Iow
a Te
ch8
44
96
83
43
4
Iow
a W
este
rn5
145
114
127
131
7
Sout
hwes
tern
00
00
00
00
00
Indi
an H
ills
00
00
00
00
00
Sout
heas
tern
00
00
00
00
00
Tota
l by
Gen
der
9113
110
110
589
141
5996
9711
5
Tota
l22
220
623
015
521
2S
ouce
: Iow
a D
epar
tmen
t of E
duca
tion,
Div
isio
n of
Com
mun
ity C
olle
ges
and
Wor
kfor
ce P
repa
ratio
n, C
omm
unity
Col
lege
MIS
.
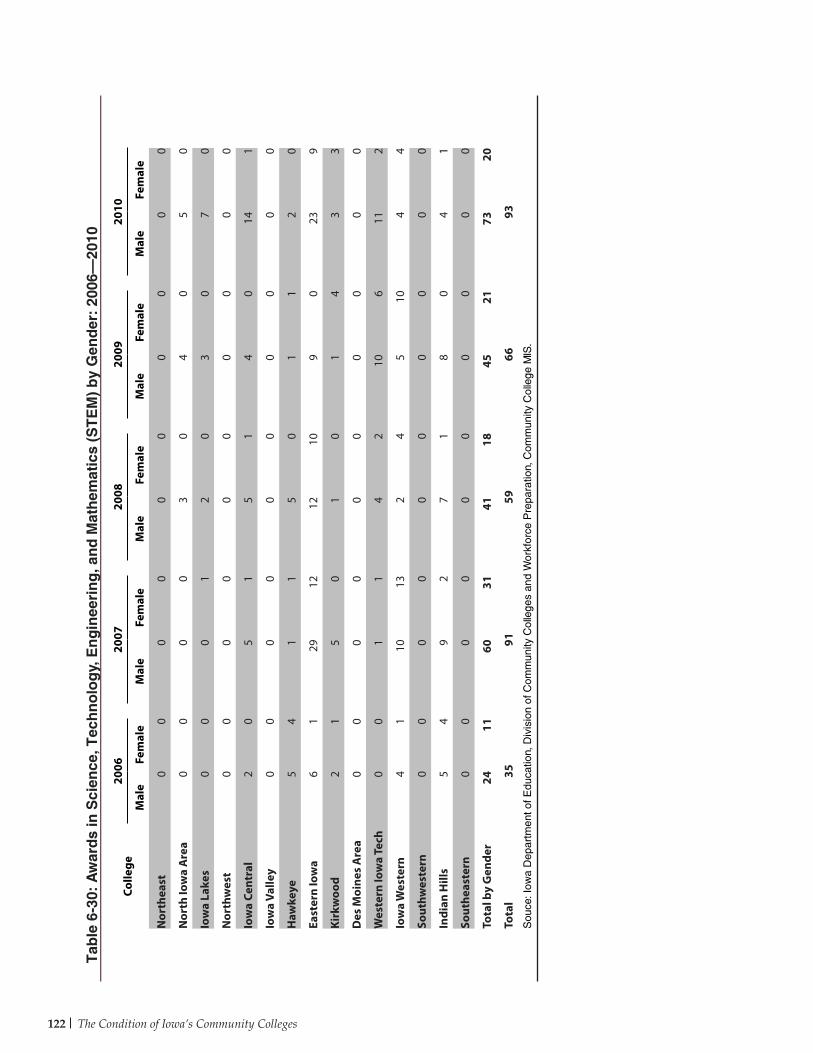
The Condition of Iowa’s Community Colleges122
Tab
le 6
-30:
Aw
ard
s in
Sci
ence
, Tec
hn
olo
gy,
En
gin
eeri
ng
, an
d M
ath
emat
ics
(ST
EM
) b
y G
end
er:
2006
–20
10
Colle
ge20
0620
0720
0820
0920
10
Mal
eFe
mal
eM
ale
Fem
ale
Mal
eFe
mal
eM
ale
Fem
ale
Mal
eFe
mal
e
Nor
thea
st0
00
00
00
00
0
Nor
th Io
wa
Are
a0
00
03
04
05
0
Iow
a La
kes
00
01
20
30
70
Nor
thw
est
00
00
00
00
00
Iow
a Ce
ntra
l2
05
15
14
014
1
Iow
a Va
lley
00
00
00
00
00
Haw
keye
54
11
50
11
20
East
ern
Iow
a6
129
1212
109
023
9
Kirk
woo
d2
15
01
01
43
3
Des
Moi
nes
Are
a0
00
00
00
00
0
Wes
tern
Iow
a Te
ch0
01
14
210
611
2
Iow
a W
este
rn4
110
132
45
104
4
Sout
hwes
tern
00
00
00
00
00
Indi
an H
ills
54
92
71
80
41
Sout
heas
tern
00
00
00
00
00
Tota
l by
Gen
der
2411
6031
4118
4521
7320
Tota
l35
9159
6693
Sou
ce: I
owa
Dep
artm
ent o
f Edu
catio
n, D
ivis
ion
of C
omm
unity
Col
lege
s an
d W
orkf
orce
Pre
para
tion,
Com
mun
ity C
olle
ge M
IS.
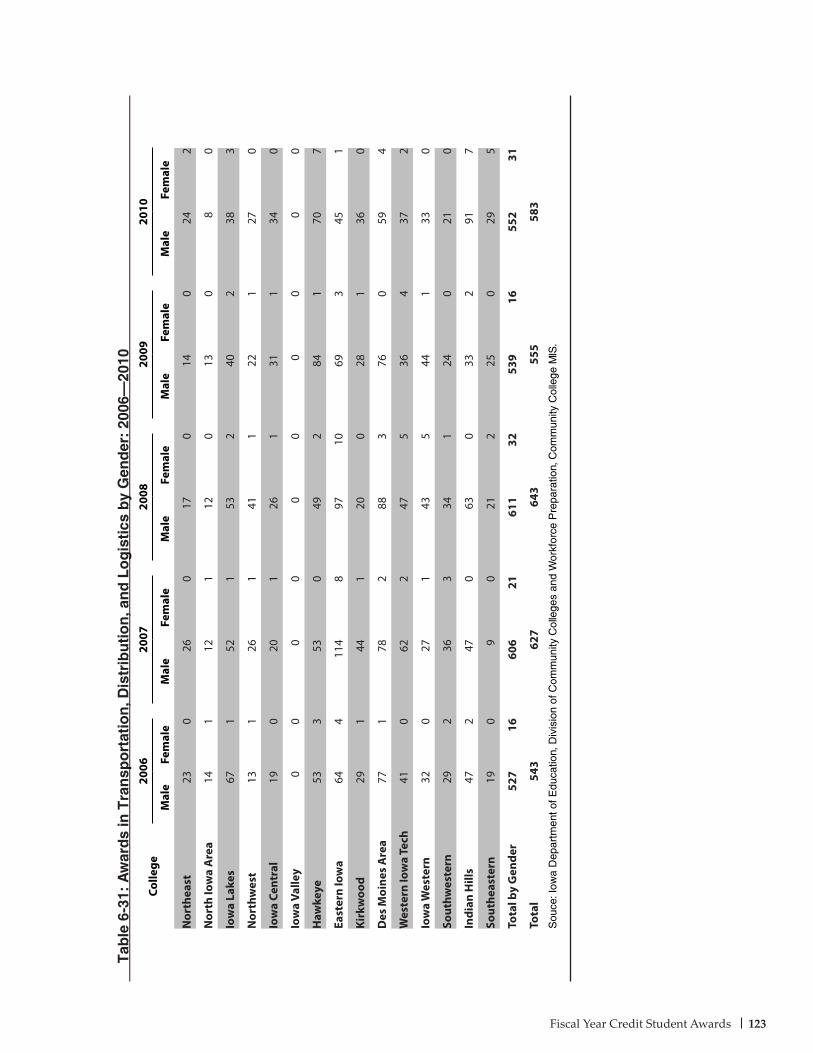
Fiscal Year Credit Student Awards 123
Tab
le 6
-31:
Aw
ard
s in
Tra
nsp
ort
atio
n, D
istr
ibu
tio
n, a
nd
Lo
gis
tics
by
Gen
der
: 20
06–
2010
Colle
ge20
0620
0720
0820
0920
10
Mal
eFe
mal
eM
ale
Fem
ale
Mal
eFe
mal
eM
ale
Fem
ale
Mal
eFe
mal
e
Nor
thea
st23
026
017
014
024
2
Nor
th Io
wa
Are
a14
112
112
013
08
0
Iow
a La
kes
671
521
532
402
383
Nor
thw
est
131
261
411
221
270
Iow
a Ce
ntra
l19
020
126
131
134
0
Iow
a Va
lley
00
00
00
00
00
Haw
keye
533
530
492
841
707
East
ern
Iow
a64
411
48
9710
693
451
Kirk
woo
d29
144
120
028
136
0
Des
Moi
nes
Are
a77
178
288
376
059
4
Wes
tern
Iow
a Te
ch41
062
247
536
437
2
Iow
a W
este
rn32
027
143
544
133
0
Sout
hwes
tern
292
363
341
240
210
Indi
an H
ills
472
470
630
332
917
Sout
heas
tern
190
90
212
250
295
Tota
l by
Gen
der
527
1660
621
611
3253
916
552
31
Tota
l54
362
764
355
558
3S
ouce
: Iow
a D
epar
tmen
t of E
duca
tion,
Div
isio
n of
Com
mun
ity C
olle
ges
and
Wor
kfor
ce P
repa
ratio
n, C
omm
unity
Col
lege
MIS
.
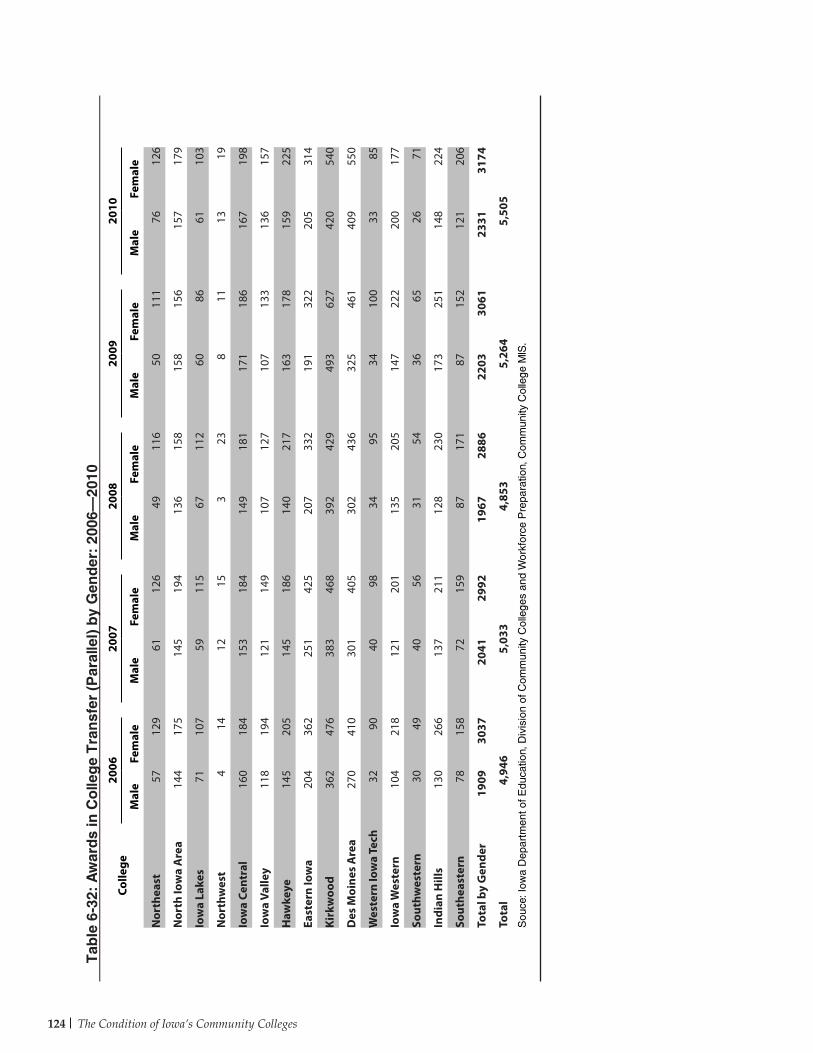
The Condition of Iowa’s Community Colleges124
Tab
le 6
-32:
Aw
ard
s in
Co
lleg
e T
ran
sfer
(P
aral
lel)
by
Gen
der
: 20
06–
2010
Colle
ge20
0620
0720
0820
0920
10
Mal
eFe
mal
eM
ale
Fem
ale
Mal
eFe
mal
eM
ale
Fem
ale
Mal
eFe
mal
e
Nor
thea
st57
129
6112
649
116
5011
176
126
Nor
th Io
wa
Are
a14
417
514
519
413
615
815
815
615
717
9
Iow
a La
kes
7110
759
115
6711
260
8661
103
Nor
thw
est
414
1215
323
811
1319
Iow
a Ce
ntra
l16
018
415
318
414
918
117
118
616
719
8
Iow
a Va
lley
118
194
121
149
107
127
107
133
136
157
Haw
keye
145
205
145
186
140
217
163
178
159
225
East
ern
Iow
a20
436
225
142
520
733
219
132
220
531
4
Kirk
woo
d36
247
638
346
839
242
949
362
742
054
0
Des
Moi
nes
Are
a27
041
030
140
530
243
632
546
140
955
0
Wes
tern
Iow
a Te
ch32
9040
9834
9534
100
3385
Iow
a W
este
rn10
421
812
120
113
520
514
722
220
017
7
Sout
hwes
tern
3049
4056
3154
3665
2671
Indi
an H
ills
130
266
137
211
128
230
173
251
148
224
Sout
heas
tern
7815
872
159
8717
187
152
121
206
Tota
l by
Gen
der
1909
3037
2041
2992
1967
2886
2203
3061
2331
3174
Tota
l4,
946
5,03
34,
853
5,26
45,
505
Sou
ce: I
owa
Dep
artm
ent o
f Edu
catio
n, D
ivis
ion
of C
omm
unity
Col
lege
s an
d W
orkf
orce
Pre
para
tion,
Com
mun
ity C
olle
ge M
IS.
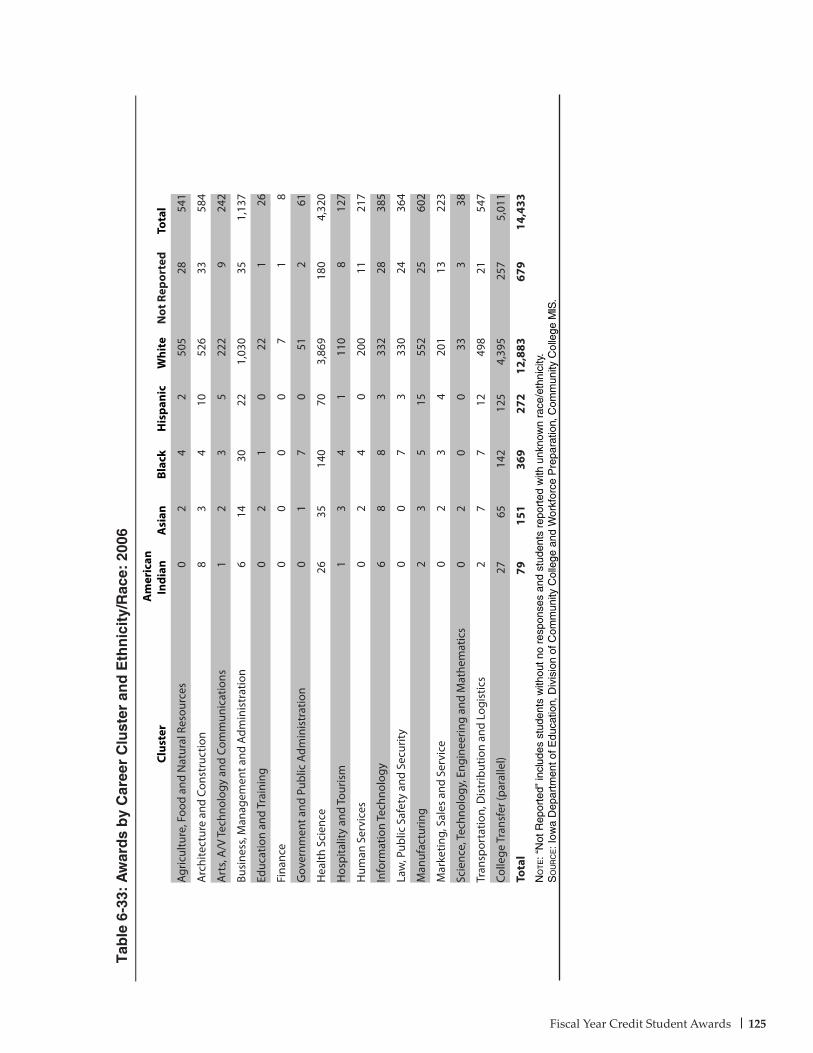
Fiscal Year Credit Student Awards 125
Tab
le 6
-33:
Aw
ard
s b
y C
aree
r C
lust
er a
nd
Eth
nic
ity/
Rac
e: 2
006
Clus
ter
Am
eric
an
Indi
an
Asi
an
Bla
ck
His
pani
c
Whi
te
Not
Rep
orte
d T
otal
Agric
ultu
re, F
ood
and
Nat
ural
Res
ourc
es0
24
250
528
541
Arc
hite
ctur
e an
d Co
nstr
uctio
n8
34
1052
633
584
Art
s, A
/V Te
chno
logy
and
Com
mun
icat
ions
12
35
222
924
2
Busi
ness
, Man
agem
ent a
nd A
dmin
istr
atio
n6
1430
221,
030
351,
137
Educ
atio
n an
d Tr
aini
ng0
21
022
126
Fina
nce
00
00
71
8
Gov
ernm
ent a
nd P
ublic
Adm
inis
trat
ion
01
70
512
61
Hea
lth S
cien
ce26
3514
070
3,86
918
04,
320
Hos
pita
lity
and
Tour
ism
13
41
110
812
7
Hum
an S
ervi
ces
02
40
200
1121
7
Info
rmat
ion
Tech
nolo
gy6
88
333
228
385
Law
, Pub
lic S
afet
y an
d Se
curit
y0
07
333
024
364
Man
ufac
turin
g2
35
1555
225
602
Mar
ketin
g, S
ales
and
Ser
vice
02
34
201
1322
3
Scie
nce,
Tech
nolo
gy, E
ngin
eerin
g an
d M
athe
mat
ics
02
00
333
38
Tran
spor
tatio
n, D
istr
ibut
ion
and
Logi
stic
s2
77
1249
821
547
Colle
ge T
rans
fer (
para
llel)
2765
142
125
4,39
525
75,
011
Tota
l79
151
369
272
12,8
8367
914
,433
No
te: “
Not
Rep
orte
d” in
clud
es s
tude
nts
with
out n
o re
spon
ses
and
stud
ents
rep
orte
d w
ith u
nkno
wn
race
/eth
nici
ty.
So
ur
ce: I
owa
Dep
artm
ent o
f Edu
catio
n, D
ivis
ion
of C
omm
unity
Col
lege
and
Wor
kfor
ce P
repa
ratio
n, C
omm
unity
Col
lege
MIS
.
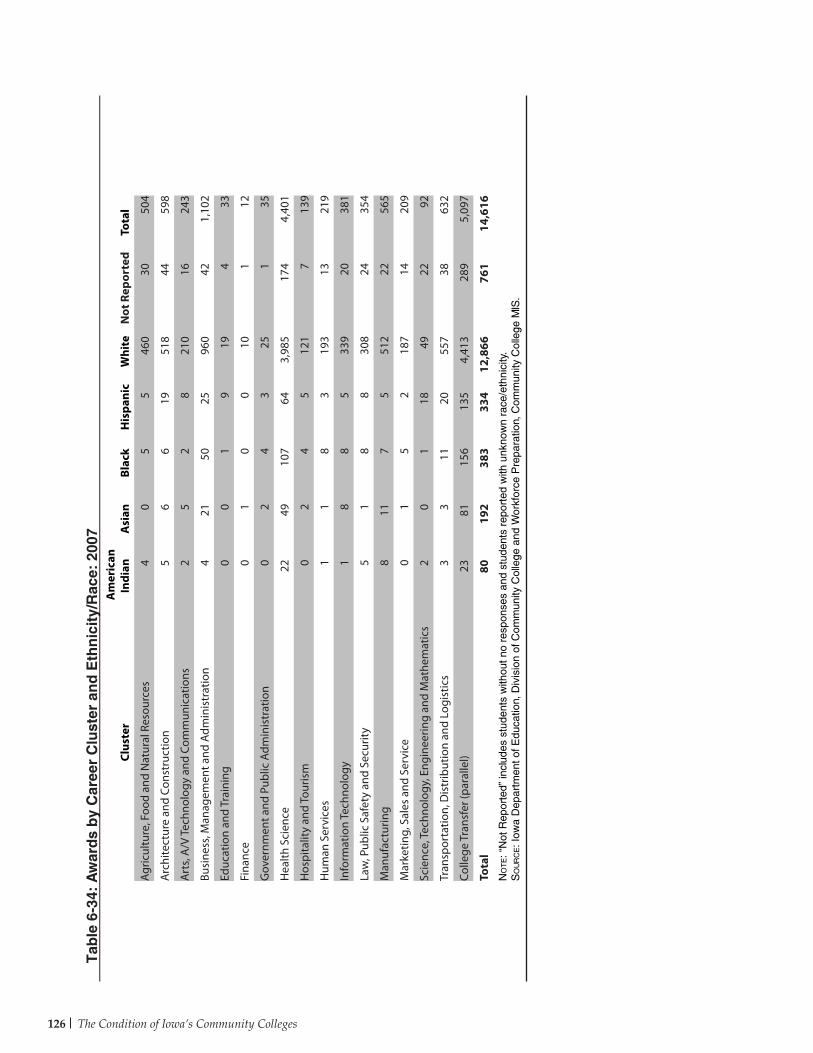
The Condition of Iowa’s Community Colleges126
Clus
ter
Am
eric
an
Indi
an
Asi
an
Bla
ck
His
pani
c
Whi
te
Not
Rep
orte
d T
otal
Agric
ultu
re, F
ood
and
Nat
ural
Res
ourc
es4
05
546
030
504
Arc
hite
ctur
e an
d Co
nstr
uctio
n5
66
1951
844
598
Art
s, A
/V Te
chno
logy
and
Com
mun
icat
ions
25
28
210
1624
3
Busi
ness
, Man
agem
ent a
nd A
dmin
istr
atio
n4
2150
2596
042
1,10
2
Educ
atio
n an
d Tr
aini
ng0
01
919
433
Fina
nce
01
00
101
12
Gov
ernm
ent a
nd P
ublic
Adm
inis
trat
ion
02
43
251
35
Hea
lth S
cien
ce22
4910
764
3,98
517
44,
401
Hos
pita
lity
and
Tour
ism
02
45
121
713
9
Hum
an S
ervi
ces
11
83
193
1321
9
Info
rmat
ion
Tech
nolo
gy1
88
533
920
381
Law
, Pub
lic S
afet
y an
d Se
curit
y5
18
830
824
354
Man
ufac
turin
g8
117
551
222
565
Mar
ketin
g, S
ales
and
Ser
vice
01
52
187
1420
9
Scie
nce,
Tech
nolo
gy, E
ngin
eerin
g an
d M
athe
mat
ics
20
118
4922
92
Tran
spor
tatio
n, D
istr
ibut
ion
and
Logi
stic
s3
311
2055
738
632
Colle
ge T
rans
fer (
para
llel)
2381
156
135
4,41
328
95,
097
Tota
l80
192
383
334
12,8
6676
114
,616
No
te: “
Not
Rep
orte
d” in
clud
es s
tude
nts
with
out n
o re
spon
ses
and
stud
ents
rep
orte
d w
ith u
nkno
wn
race
/eth
nici
ty.
So
ur
ce: I
owa
Dep
artm
ent o
f Edu
catio
n, D
ivis
ion
of C
omm
unity
Col
lege
and
Wor
kfor
ce P
repa
ratio
n, C
omm
unity
Col
lege
MIS
.
Tab
le 6
-34:
Aw
ard
s b
y C
aree
r C
lust
er a
nd
Eth
nic
ity/
Rac
e: 2
007
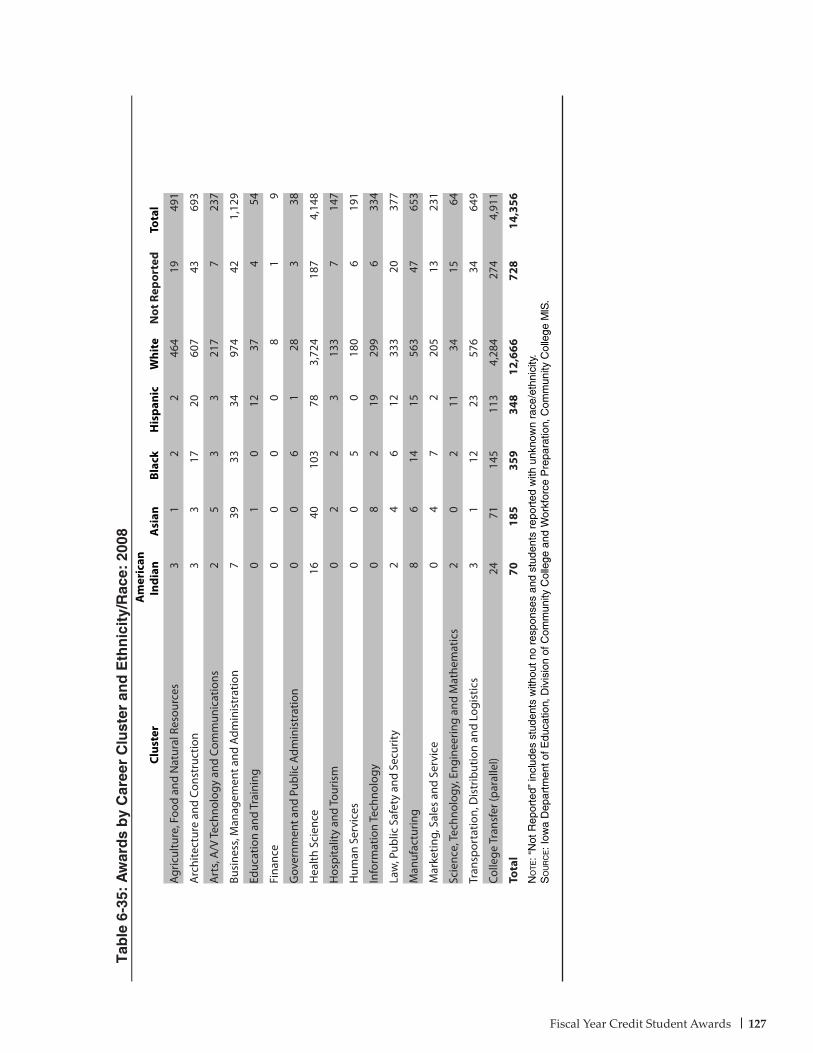
Fiscal Year Credit Student Awards 127
Tab
le 6
-35:
Aw
ard
s b
y C
aree
r C
lust
er a
nd
Eth
nic
ity/
Rac
e: 2
008
Clus
ter
Am
eric
an
Indi
an
Asi
an
Bla
ck
His
pani
c
Whi
te
Not
Rep
orte
d T
otal
Agric
ultu
re, F
ood
and
Nat
ural
Res
ourc
es3
12
246
419
491
Arc
hite
ctur
e an
d Co
nstr
uctio
n3
317
2060
743
693
Art
s, A
/V Te
chno
logy
and
Com
mun
icat
ions
25
33
217
723
7
Busi
ness
, Man
agem
ent a
nd A
dmin
istr
atio
n7
3933
3497
442
1,12
9
Educ
atio
n an
d Tr
aini
ng0
10
1237
454
Fina
nce
00
00
81
9
Gov
ernm
ent a
nd P
ublic
Adm
inis
trat
ion
00
61
283
38
Hea
lth S
cien
ce16
4010
378
3,72
418
74,
148
Hos
pita
lity
and
Tour
ism
02
23
133
714
7
Hum
an S
ervi
ces
00
50
180
619
1
Info
rmat
ion
Tech
nolo
gy0
82
1929
96
334
Law
, Pub
lic S
afet
y an
d Se
curit
y2
46
1233
320
377
Man
ufac
turin
g8
614
1556
347
653
Mar
ketin
g, S
ales
and
Ser
vice
04
72
205
1323
1
Scie
nce,
Tech
nolo
gy, E
ngin
eerin
g an
d M
athe
mat
ics
20
211
3415
64
Tran
spor
tatio
n, D
istr
ibut
ion
and
Logi
stic
s3
112
2357
634
649
Colle
ge T
rans
fer (
para
llel)
2471
145
113
4,28
427
44,
911
Tota
l70
185
359
348
12,6
6672
814
,356
No
te: “
Not
Rep
orte
d” in
clud
es s
tude
nts
with
out n
o re
spon
ses
and
stud
ents
rep
orte
d w
ith u
nkno
wn
race
/eth
nici
ty.
So
ur
ce: I
owa
Dep
artm
ent o
f Edu
catio
n, D
ivis
ion
of C
omm
unity
Col
lege
and
Wor
kfor
ce P
repa
ratio
n, C
omm
unity
Col
lege
MIS
.
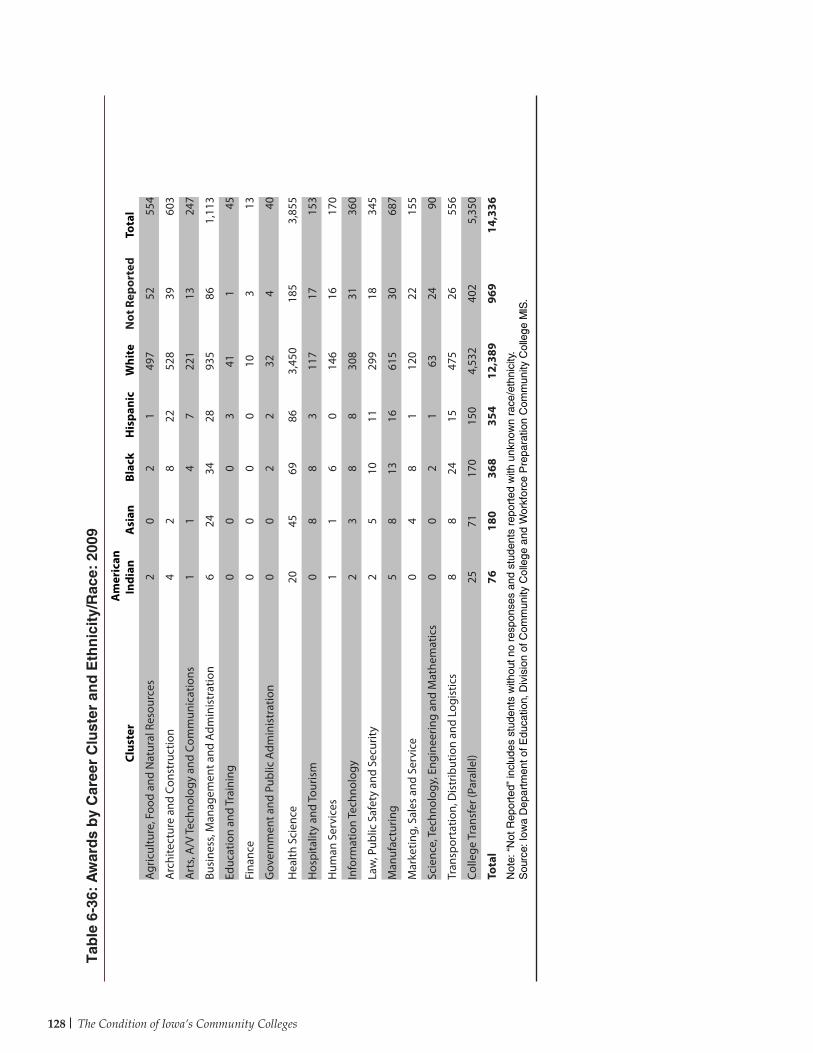
The Condition of Iowa’s Community Colleges128
Tab
le 6
-36:
Aw
ard
s b
y C
aree
r C
lust
er a
nd
Eth
nic
ity/
Rac
e: 2
009
Clus
ter
Am
eric
an
Indi
an
Asi
an
Bla
ck
His
pani
c W
hite
N
ot R
epor
ted
Tot
al
Agric
ultu
re, F
ood
and
Nat
ural
Res
ourc
es2
02
149
752
554
Arc
hite
ctur
e an
d Co
nstr
uctio
n4
28
2252
839
603
Art
s, A
/V Te
chno
logy
and
Com
mun
icat
ions
11
47
221
1324
7
Busi
ness
, Man
agem
ent a
nd A
dmin
istr
atio
n6
2434
2893
586
1,11
3
Educ
atio
n an
d Tr
aini
ng0
00
341
145
Fina
nce
00
00
103
13
Gov
ernm
ent a
nd P
ublic
Adm
inis
trat
ion
00
22
324
40
Hea
lth S
cien
ce20
4569
863,
450
185
3,85
5
Hos
pita
lity
and
Tour
ism
08
83
117
1715
3
Hum
an S
ervi
ces
11
60
146
1617
0
Info
rmat
ion
Tech
nolo
gy2
38
830
831
360
Law
, Pub
lic S
afet
y an
d Se
curit
y2
510
1129
918
345
Man
ufac
turin
g5
813
1661
530
687
Mar
ketin
g, S
ales
and
Ser
vice
04
81
120
2215
5
Scie
nce,
Tech
nolo
gy, E
ngin
eerin
g an
d M
athe
mat
ics
00
21
6324
90
Tran
spor
tatio
n, D
istr
ibut
ion
and
Logi
stic
s8
824
1547
526
556
Colle
ge T
rans
fer (
Para
llel)
2571
170
150
4,53
240
25,
350
Tota
l76
180
368
354
12,3
8996
914
,336
Not
e: “
Not
Rep
orte
d” in
clud
es s
tude
nts
with
out n
o re
spon
ses
and
stud
ents
rep
orte
d w
ith u
nkno
wn
race
/eth
nici
ty.
Sou
rce:
Iow
a D
epar
tmen
t of E
duca
tion,
Div
isio
n of
Com
mun
ity C
olle
ge a
nd W
orkf
orce
Pre
para
tion
Com
mun
ity C
olle
ge M
IS.
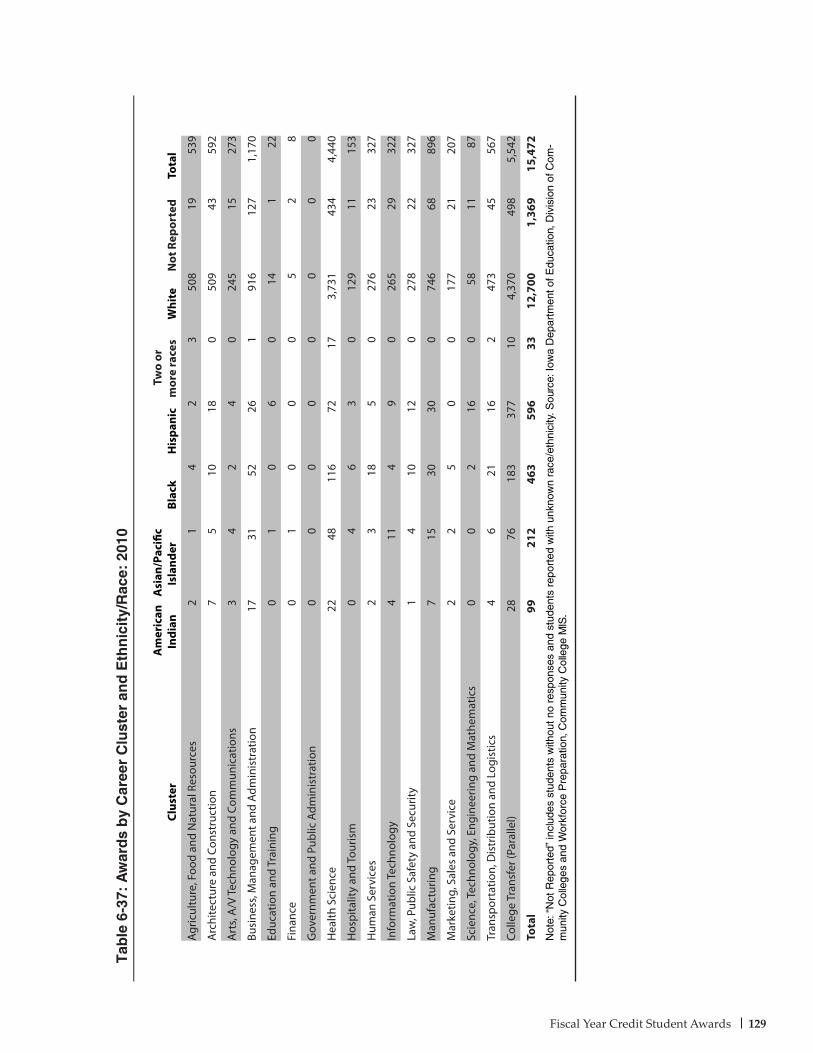
Fiscal Year Credit Student Awards 129
Tab
le 6
-37:
Aw
ard
s b
y C
aree
r C
lust
er a
nd
Eth
nic
ity/
Rac
e: 2
010
Clus
ter
Am
eric
an
Indi
an
Asi
an/P
acifi
c Is
land
er
Bla
ck
His
pani
c
Tw
o or
m
ore
race
s
Whi
te
Not
Rep
orte
d T
otal
Agric
ultu
re, F
ood
and
Nat
ural
Res
ourc
es2
14
23
508
1953
9
Arc
hite
ctur
e an
d Co
nstr
uctio
n7
510
180
509
4359
2
Art
s, A
/V Te
chno
logy
and
Com
mun
icat
ions
34
24
024
515
273
Busi
ness
, Man
agem
ent a
nd A
dmin
istr
atio
n17
3152
261
916
127
1,17
0
Educ
atio
n an
d Tr
aini
ng0
10
60
141
22
Fina
nce
01
00
05
28
Gov
ernm
ent a
nd P
ublic
Adm
inis
trat
ion
00
00
00
00
Hea
lth S
cien
ce22
4811
672
173,
731
434
4,44
0
Hos
pita
lity
and
Tour
ism
04
63
012
911
153
Hum
an S
ervi
ces
23
185
027
623
327
Info
rmat
ion
Tech
nolo
gy4
114
90
265
2932
2
Law
, Pub
lic S
afet
y an
d Se
curit
y1
410
120
278
2232
7
Man
ufac
turin
g7
1530
300
746
6889
6
Mar
ketin
g, S
ales
and
Ser
vice
22
50
017
721
207
Scie
nce,
Tech
nolo
gy, E
ngin
eerin
g an
d M
athe
mat
ics
00
216
058
1187
Tran
spor
tatio
n, D
istr
ibut
ion
and
Logi
stic
s4
621
162
473
4556
7
Colle
ge T
rans
fer (
Para
llel)
2876
183
377
104,
370
498
5,54
2
Tota
l99
212
463
596
3312
,700
1,36
915
,472
Not
e: “
Not
Rep
orte
d” in
clud
es s
tude
nts
with
out n
o re
spon
ses
and
stud
ents
rep
orte
d w
ith u
nkno
wn
race
/eth
nici
ty. S
ourc
e: Io
wa
Dep
artm
ent o
f Edu
catio
n, D
ivis
ion
of C
om-
mun
ity C
olle
ges
and
Wor
kfor
ce P
repa
ratio
n, C
omm
unity
Col
lege
MIS
.
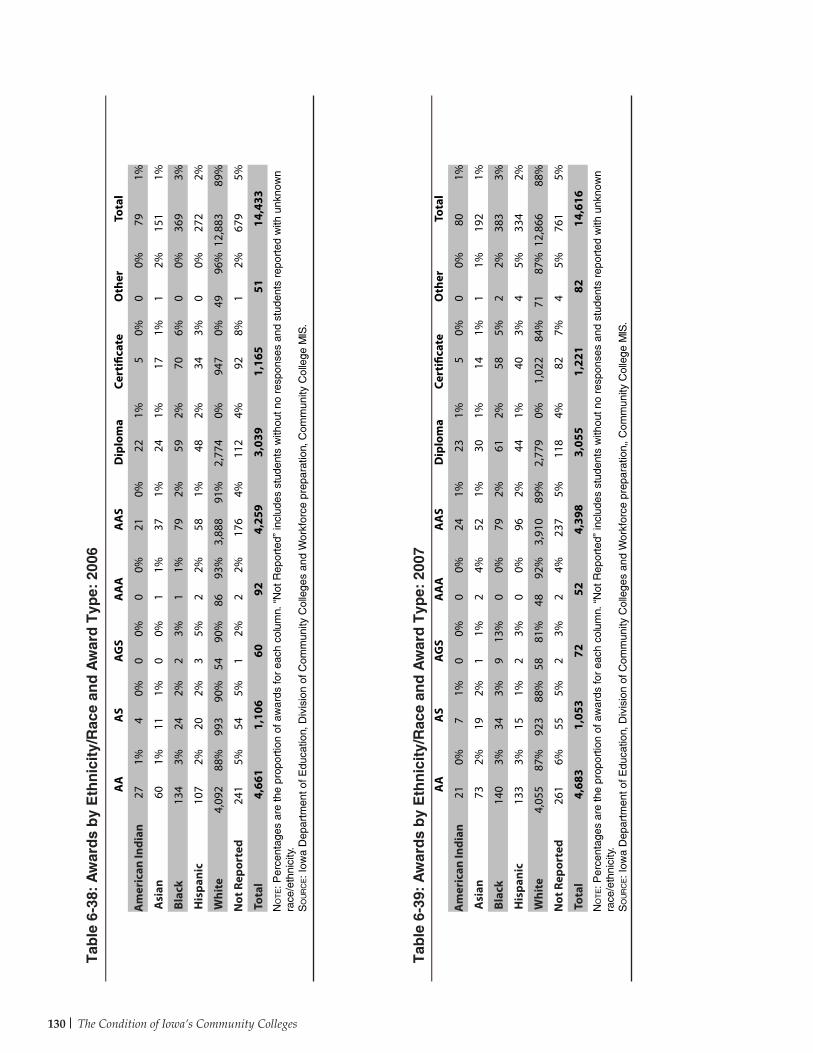
The Condition of Iowa’s Community Colleges130
AA
AS
AG
SA
AA
AA
SD
iplo
ma
Cert
ifica
teO
ther
Tota
l
Am
eric
an In
dian
210%
71%
00%
00%
241%
231%
50%
00%
801%
Asi
an
732%
192%
11%
24%
521%
301%
141%
11%
192
1%
Bla
ck
140
3%34
3%9
13%
00%
792%
612%
585%
22%
383
3%
His
pani
c
133
3%15
1%2
3%0
0%96
2%44
1%40
3%4
5%33
42%
Whi
te
4,05
587
%92
388
%58
81%
4892
%3,
910
89%
2,77
90%
1,02
284
%71
87%
12,8
6688
%
Not
Rep
orte
d26
16%
555%
23%
24%
237
5%11
84%
827%
45%
761
5%
Tot
al
4,68
31,
053
7252
4,39
83,
055
1,22
182
14,6
16N
ot
e: P
erce
ntag
es a
re th
e pr
opor
tion
of a
war
ds fo
r ea
ch c
olum
n. “
Not
Rep
orte
d” in
clud
es s
tude
nts
with
out n
o re
spon
ses
and
stud
ents
rep
orte
d w
ith u
nkno
wn
race
/eth
nici
ty.
So
ur
ce: I
owa
Dep
artm
ent o
f Edu
catio
n, D
ivis
ion
of C
omm
unity
Col
lege
s an
d W
orkf
orce
pre
para
tion,
, Com
mun
ity C
olle
ge M
IS.
AA
AS
AG
SA
AA
AA
SD
iplo
ma
Cert
ifica
teO
ther
Tota
l
Am
eric
an In
dian
271%
40%
00%
00%
210%
221%
50%
00%
791%
Asi
an
601%
111%
00%
11%
371%
241%
171%
12%
151
1%
Bla
ck
134
3%24
2%2
3%1
1%79
2%59
2%70
6%0
0%36
93%
His
pani
c
107
2%20
2%3
5%2
2%58
1%48
2%34
3%0
0%27
22%
Whi
te
4,09
288
%99
390
%54
90%
8693
%3,
888
91%
2,77
40%
947
0%49
96%
12,8
8389
%
Not
Rep
orte
d24
15%
545%
12%
22%
176
4%11
24%
928%
12%
679
5%
Tot
al
4,66
11,
106
6092
4,25
93,
039
1,16
551
14,4
33N
ot
e: P
erce
ntag
es a
re th
e pr
opor
tion
of a
war
ds fo
r ea
ch c
olum
n. “
Not
Rep
orte
d” in
clud
es s
tude
nts
with
out n
o re
spon
ses
and
stud
ents
rep
orte
d w
ith u
nkno
wn
race
/eth
nici
ty.
So
ur
ce: I
owa
Dep
artm
ent o
f Edu
catio
n, D
ivis
ion
of C
omm
unity
Col
lege
s an
d W
orkf
orce
pre
para
tion,
Com
mun
ity C
olle
ge M
IS.
Tab
le 6
-38:
Aw
ard
s b
y E
thn
icit
y/R
ace
and
Aw
ard
Typ
e: 2
006
Tab
le 6
-39:
Aw
ard
s b
y E
thn
icit
y/R
ace
and
Aw
ard
Typ
e: 2
007
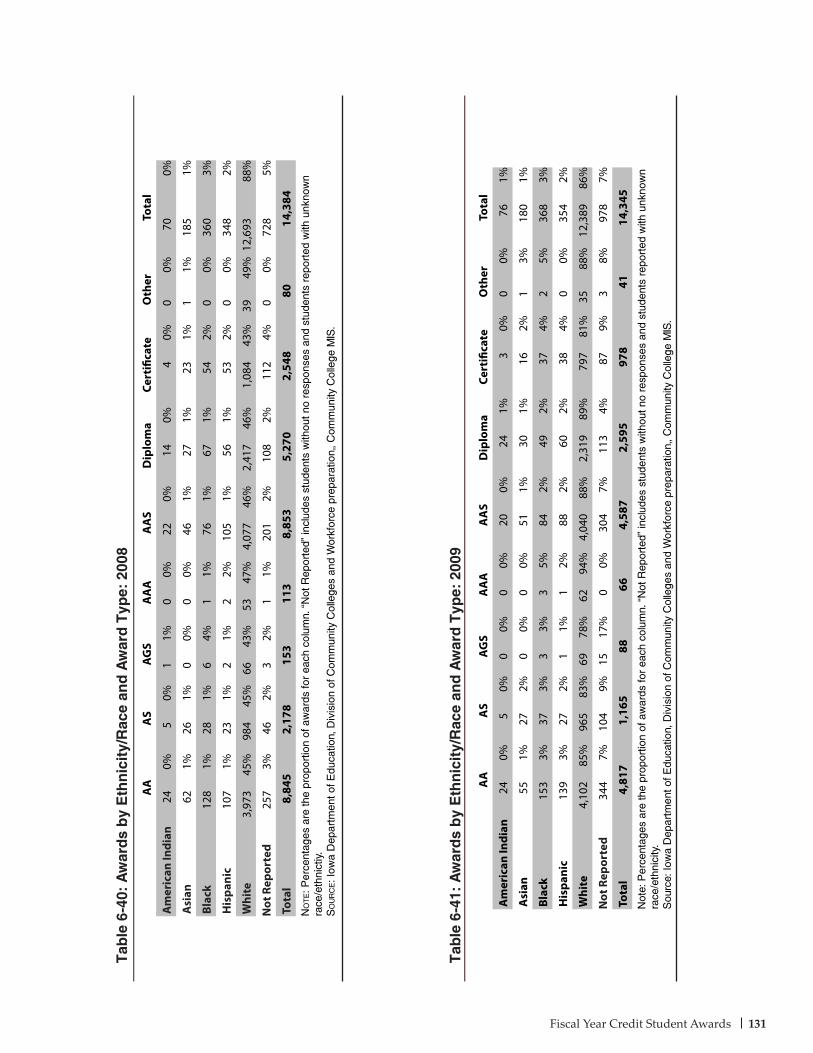
Fiscal Year Credit Student Awards 131
Tab
le 6
-40:
Aw
ard
s b
y E
thn
icit
y/R
ace
and
Aw
ard
Typ
e: 2
008
Tab
le 6
-41:
Aw
ard
s b
y E
thn
icit
y/R
ace
and
Aw
ard
Typ
e: 2
009
AA
A
S
AG
S
AA
A
AA
S
Dip
lom
a
Cer
tific
ate
O
ther
T
otal
Am
eric
an In
dian
24
0%5
0%1
1%0
0%22
0%14
0%4
0%0
0%70
0%
Asi
an
621%
261%
00%
00%
461%
271%
231%
11%
185
1%
Bla
ck
128
1%28
1%6
4%1
1%76
1%67
1%54
2%0
0%36
03%
His
pani
c
107
1%23
1%2
1%2
2%10
51%
561%
532%
00%
348
2%
Whi
te
3,97
345
%98
445
%66
43%
5347
%4,
077
46%
2,41
746
%1,
084
43%
3949
%12
,693
88%
Not
Rep
orte
d25
73%
462%
32%
11%
201
2%10
82%
112
4%0
0%72
85%
Tot
al
8,84
52,
178
153
113
8,85
35,
270
2,54
880
14,3
84N
ot
e: P
erce
ntag
es a
re th
e pr
opor
tion
of a
war
ds fo
r ea
ch c
olum
n. “
Not
Rep
orte
d” in
clud
es s
tude
nts
with
out n
o re
spon
ses
and
stud
ents
rep
orte
d w
ith u
nkno
wn
race
/eth
nict
iy.
So
ur
ce: I
owa
Dep
artm
ent o
f Edu
catio
n, D
ivis
ion
of C
omm
unity
Col
lege
s an
d W
orkf
orce
pre
para
tion,
, Com
mun
ity C
olle
ge M
IS.
AA
AS
AG
SA
AA
AA
SD
iplo
ma
Cert
ifica
teO
ther
Tota
l
Am
eric
an In
dian
24
0%5
0%0
0%0
0%20
0%24
1%3
0%0
0%76
1%
Asi
an
551%
272%
00%
00%
511%
301%
162%
13%
180
1%
Bla
ck
153
3%37
3%3
3%3
5%84
2%49
2%37
4%2
5%36
83%
His
pani
c
139
3%27
2%1
1%1
2%88
2%60
2%38
4%0
0%35
42%
Whi
te
4,10
285
%96
583
%69
78%
6294
%4,
040
88%
2,31
989
%79
781
%35
88%
12,3
8986
%
Not
Rep
orte
d34
47%
104
9%15
17%
00%
304
7%11
34%
879%
38%
978
7%
Tota
l 4,
817
1,16
588
664,
587
2,59
597
841
14,3
45N
ote:
Per
cent
ages
are
the
prop
ortio
n of
aw
ards
for
each
col
umn.
“N
ot R
epor
ted”
incl
udes
stu
dent
s w
ithou
t no
resp
onse
s an
d st
uden
ts r
epor
ted
with
unk
now
n ra
ce/e
thni
city
.S
ourc
e: Io
wa
Dep
artm
ent o
f Edu
catio
n, D
ivis
ion
of C
omm
unity
Col
lege
s an
d W
orkf
orce
pre
para
tion,
, Com
mun
ity C
olle
ge M
IS.
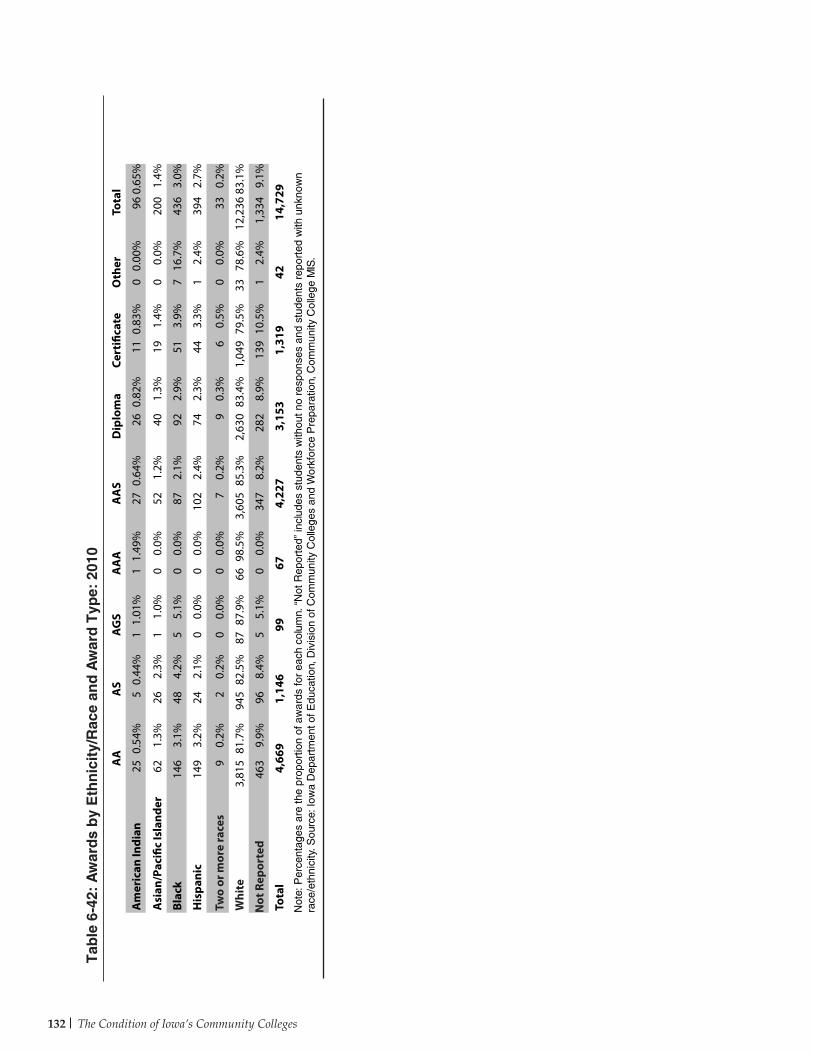
The Condition of Iowa’s Community Colleges132
Tab
le 6
-42:
Aw
ard
s b
y E
thn
icit
y/R
ace
and
Aw
ard
Typ
e: 2
010
AA
AS
AG
SA
AA
AA
SD
iplo
ma
Cert
ifica
teO
ther
Tota
l
Am
eric
an In
dian
25
0.54
%5
0.44
%1
1.01
%1
1.49
%27
0.64
%26
0.82
%11
0.83
%0
0.00
%96
0.65
%
Asi
an/P
acifi
c Is
land
er
621.
3%26
2.3%
11.
0%0
0.0%
521.
2%40
1.3%
191.
4%0
0.0%
200
1.4%
Bla
ck
146
3.1%
484.
2%5
5.1%
00.
0%87
2.1%
922.
9%51
3.9%
716
.7%
436
3.0%
His
pani
c
149
3.2%
242.
1%0
0.0%
00.
0%10
22.
4%74
2.3%
443.
3%1
2.4%
394
2.7%
Tw
o or
mor
e ra
ces
90.
2%2
0.2%
00.
0%0
0.0%
70.
2%9
0.3%
60.
5%0
0.0%
330.
2%
Whi
te
3,81
581
.7%
945
82.5
%87
87.9
%66
98.5
%3,
605
85.3
%2,
630
83.4
%1,
049
79.5
%33
78.6
%12
,236
83.1
%
Not
Rep
orte
d46
39.
9%96
8.4%
55.
1%0
0.0%
347
8.2%
282
8.9%
139
10.5
%1
2.4%
1,33
49.
1%
Tot
al
4,66
91,
146
9967
4,22
73,
153
1,31
942
14,7
29N
ote:
Per
cent
ages
are
the
prop
ortio
n of
aw
ards
for
each
col
umn.
“N
ot R
epor
ted”
incl
udes
stu
dent
s w
ithou
t no
resp
onse
s an
d st
uden
ts r
epor
ted
with
unk
now
n ra
ce/e
thni
city
. Sou
rce:
Iow
a D
epar
tmen
t of E
duca
tion,
Div
isio
n of
Com
mun
ity C
olle
ges
and
Wor
kfor
ce P
repa
ratio
n, C
omm
unity
Col
lege
MIS
.
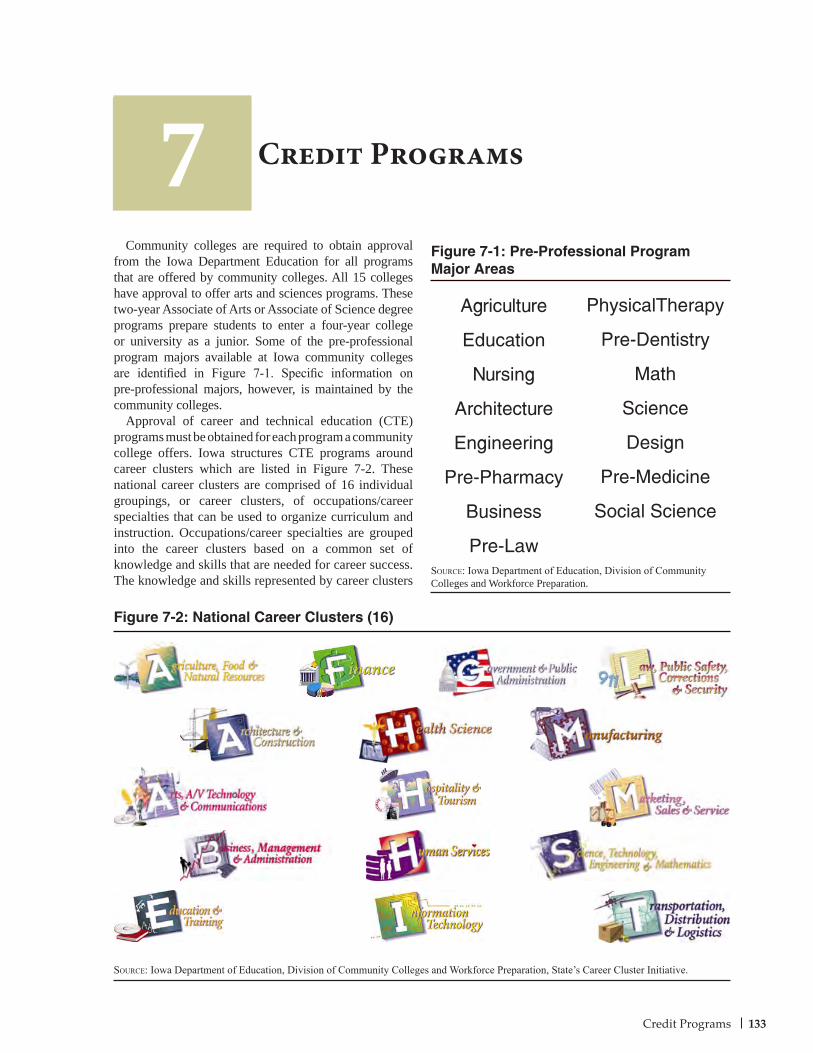
133Credit Programs
Figure 7-1: Pre-Professional Program Major Areas
Source: Iowa Department of Education, Division of Community Colleges and Workforce Preparation.
Community colleges are required to obtain approval from the Iowa Department Education for all programs that are offered by community colleges. All 15 colleges have approval to offer arts and sciences programs. These two-year Associate of Arts or Associate of Science degree programs prepare students to enter a four-year college or university as a junior. Some of the pre-professional program majors available at Iowa community colleges are identified in Figure 7-1. Specific information on pre-professional majors, however, is maintained by the community colleges.
Approval of career and technical education (CTE) programs must be obtained for each program a community college offers. Iowa structures CTE programs around career clusters which are listed in Figure 7-2. These national career clusters are comprised of 16 individual groupings, or career clusters, of occupations/career specialties that can be used to organize curriculum and instruction. Occupations/career specialties are grouped into the career clusters based on a common set of knowledge and skills that are needed for career success. The knowledge and skills represented by career clusters
Credit Programs7Agriculture
Education
Nursing
Architecture
Engineering
Pre-Pharmacy
Business
Pre-Law
PhysicalTherapy
Pre-Dentistry
Math
Science
Design
Pre-Medicine
Social Science
Figure 7-2: National Career Clusters (16)
Source: Iowa Department of Education, Division of Community Colleges and Workforce Preparation, State’s Career Cluster Initiative.
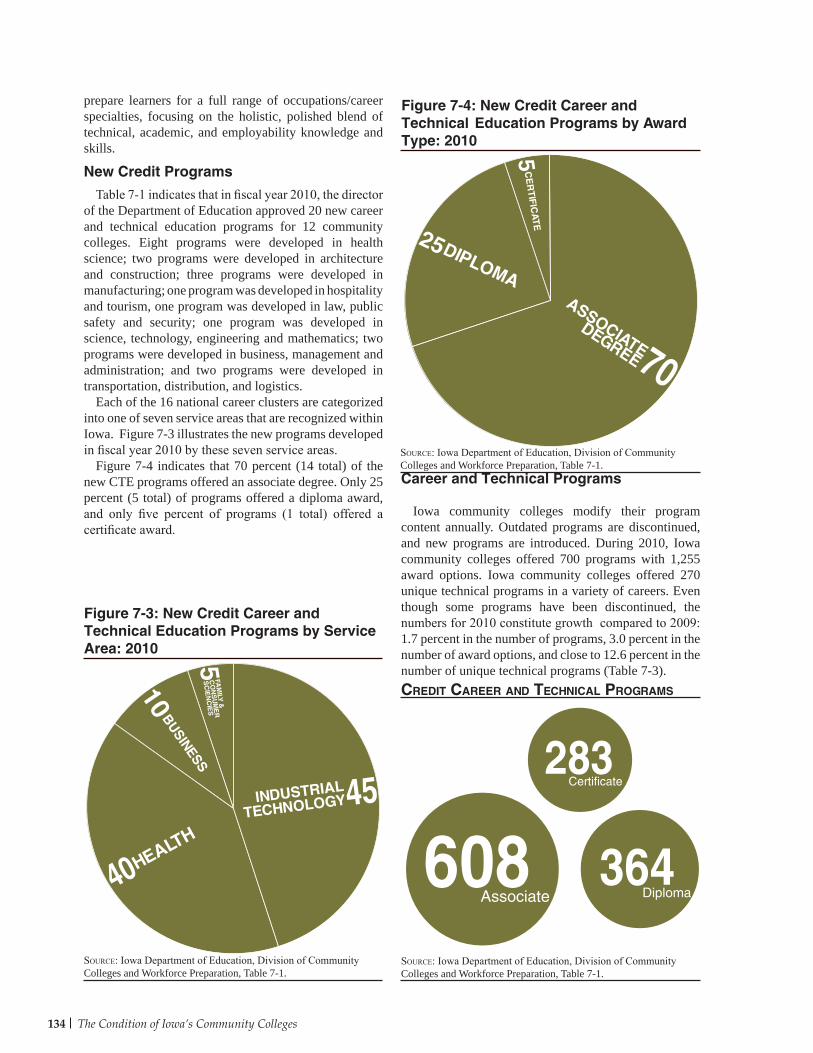
134 The Condition of Iowa’s Community Colleges
Source: Iowa Department of Education, Division of Community Colleges and Workforce Preparation, Table 7-1.
Figure 7-4: New Credit Career and Technical Education Programs by Award Type: 2010
prepare learners for a full range of occupations/career specialties, focusing on the holistic, polished blend of technical, academic, and employability knowledge and skills.
New Credit Programs
Table 7-1 indicates that in fiscal year 2010, the director of the Department of Education approved 20 new career and technical education programs for 12 community colleges. Eight programs were developed in health science; two programs were developed in architecture and construction; three programs were developed in manufacturing; one program was developed in hospitality and tourism, one program was developed in law, public safety and security; one program was developed in science, technology, engineering and mathematics; two programs were developed in business, management and administration; and two programs were developed in transportation, distribution, and logistics.
Each of the 16 national career clusters are categorized into one of seven service areas that are recognized within Iowa. Figure 7-3 illustrates the new programs developed in fiscal year 2010 by these seven service areas.
Figure 7-4 indicates that 70 percent (14 total) of the new CTE programs offered an associate degree. Only 25 percent (5 total) of programs offered a diploma award, and only five percent of programs (1 total) offered a certificate award.
Source: Iowa Department of Education, Division of Community Colleges and Workforce Preparation, Table 7-1.
Figure 7-3: New Credit Career and Technical Education Programs by Service Area: 2010
creDit career anD tecHnical Programs
Career and Technical Programs
Iowa community colleges modify their program content annually . Outdated programs are discontinued, and new programs are introduced. During 2010, Iowa community colleges offered 700 programs with 1,255 award options. Iowa community colleges offered 270 unique technical programs in a variety of careers. Even though some programs have been discontinued, the numbers for 2010 constitute growth compared to 2009: 1.7 percent in the number of programs, 3.0 percent in the number of award options, and close to 12.6 percent in the number of unique technical programs (Table 7-3).
608Associate
364Diploma
283Certificate
ASSOCIATEDEGREE70
DIPLOMA
25
CE
RT
IFIC
AT
E
5
INDUSTRIAL
TECHNOLOGY45
HEALTH
BUSINESS
10
FAM
ILY &
CO
NS
UM
ER
SC
IEN
CIE
S5
40
Source: Iowa Department of Education, Division of Community Colleges and Workforce Preparation, Table 7-1.
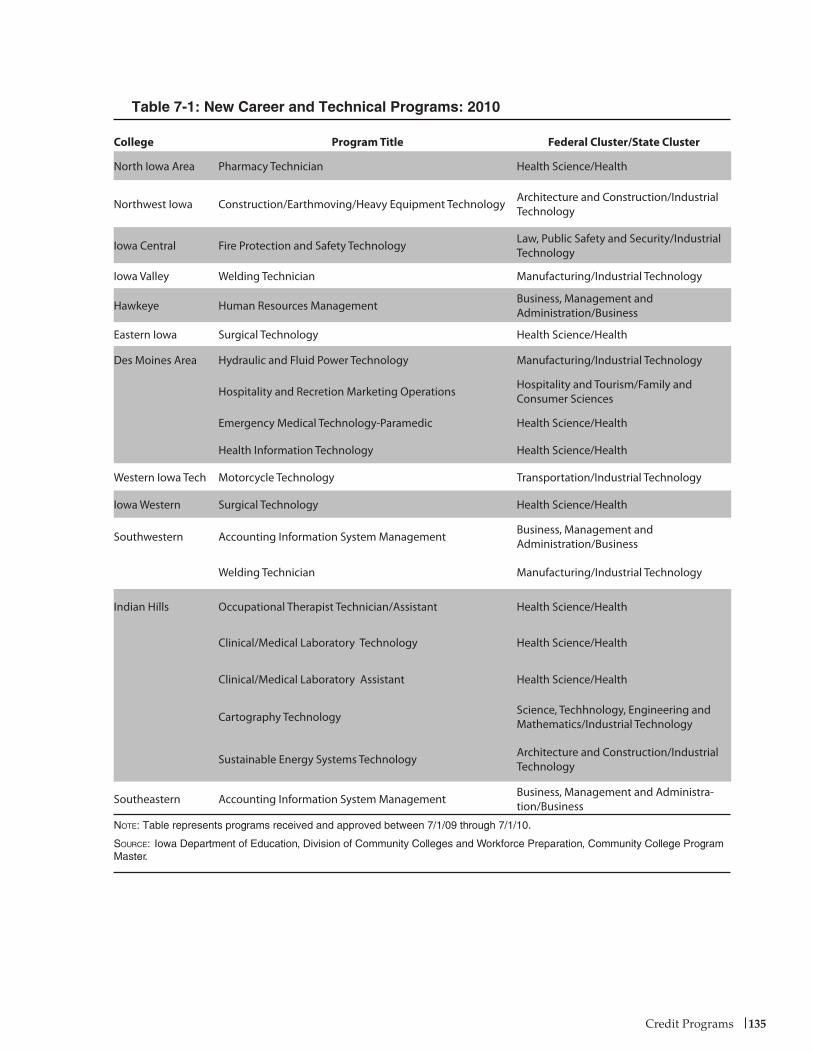
135Credit Programs
Table 7-1: New Career and Technical Programs: 2010
College Program Title Federal Cluster/State Cluster
North Iowa Area Pharmacy Technician Health Science/Health
Northwest Iowa Construction/Earthmoving/Heavy Equipment Technology Architecture and Construction/Industrial Technology
Iowa Central Fire Protection and Safety Technology Law, Public Safety and Security/Industrial Technology
Iowa Valley Welding Technician Manufacturing/Industrial Technology
Hawkeye Human Resources Management Business, Management and Administration/Business
Eastern Iowa Surgical Technology Health Science/Health
Des Moines Area Hydraulic and Fluid Power Technology Manufacturing/Industrial Technology
Hospitality and Recretion Marketing Operations Hospitality and Tourism/Family and Consumer Sciences
Emergency Medical Technology-Paramedic Health Science/Health
Health Information Technology Health Science/Health
Western Iowa Tech Motorcycle Technology Transportation/Industrial Technology
Iowa Western Surgical Technology Health Science/Health
Southwestern Accounting Information System Management Business, Management and Administration/Business
Welding Technician Manufacturing/Industrial Technology
Indian Hills Occupational Therapist Technician/Assistant Health Science/Health
Clinical/Medical Laboratory Technology Health Science/Health
Clinical/Medical Laboratory Assistant Health Science/Health
Cartography Technology Science, Techhnology, Engineering and Mathematics/Industrial Technology
Sustainable Energy Systems Technology Architecture and Construction/Industrial Technology
Southeastern Accounting Information System Management Business, Management and Administra-tion/Business
Note: Table represents programs received and approved between 7/1/09 through 7/1/10.
Source: Iowa Department of Education, Division of Community Colleges and Workforce Preparation, Community College Program Master.
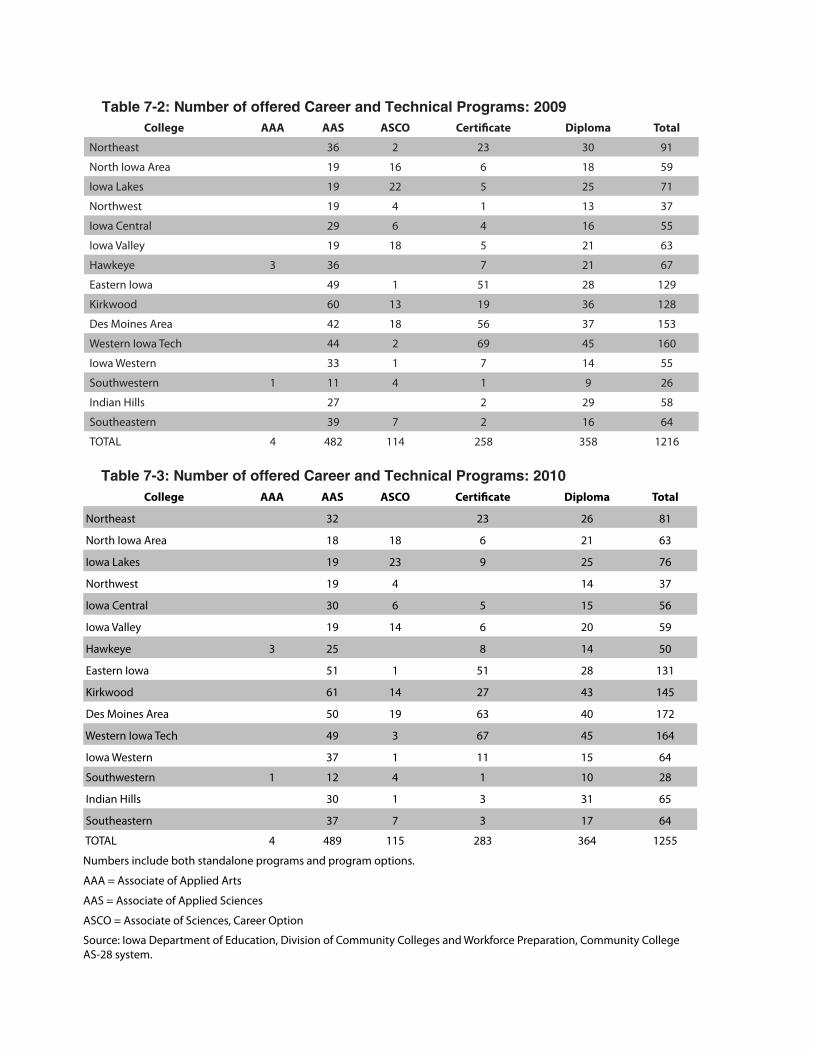
Table 7-2: Number of offered Career and Technical Programs: 2009College AAA AAS ASCO Certificate Diploma Total
Northeast 36 2 23 30 91
North Iowa Area 19 16 6 18 59
Iowa Lakes 19 22 5 25 71
Northwest 19 4 1 13 37
Iowa Central 29 6 4 16 55
Iowa Valley 19 18 5 21 63
Hawkeye 3 36 7 21 67
Eastern Iowa 49 1 51 28 129
Kirkwood 60 13 19 36 128
Des Moines Area 42 18 56 37 153
Western Iowa Tech 44 2 69 45 160
Iowa Western 33 1 7 14 55
Southwestern 1 11 4 1 9 26
Indian Hills 27 2 29 58
Southeastern 39 7 2 16 64
TOTAL 4 482 114 258 358 1216
College AAA AAS ASCO Certificate Diploma Total
Northeast 32 23 26 81
North Iowa Area 18 18 6 21 63
Iowa Lakes 19 23 9 25 76
Northwest 19 4 14 37
Iowa Central 30 6 5 15 56
Iowa Valley 19 14 6 20 59
Hawkeye 3 25 8 14 50
Eastern Iowa 51 1 51 28 131
Kirkwood 61 14 27 43 145
Des Moines Area 50 19 63 40 172
Western Iowa Tech 49 3 67 45 164
Iowa Western 37 1 11 15 64
Southwestern 1 12 4 1 10 28
Indian Hills 30 1 3 31 65
Southeastern 37 7 3 17 64
TOTAL 4 489 115 283 364 1255
Numbers include both standalone programs and program options.
AAA = Associate of Applied Arts
AAS = Associate of Applied Sciences
ASCO = Associate of Sciences, Career Option
Source: Iowa Department of Education, Division of Community Colleges and Workforce Preparation, Community College AS-28 system.
Table 7-3: Number of offered Career and Technical Programs: 2010
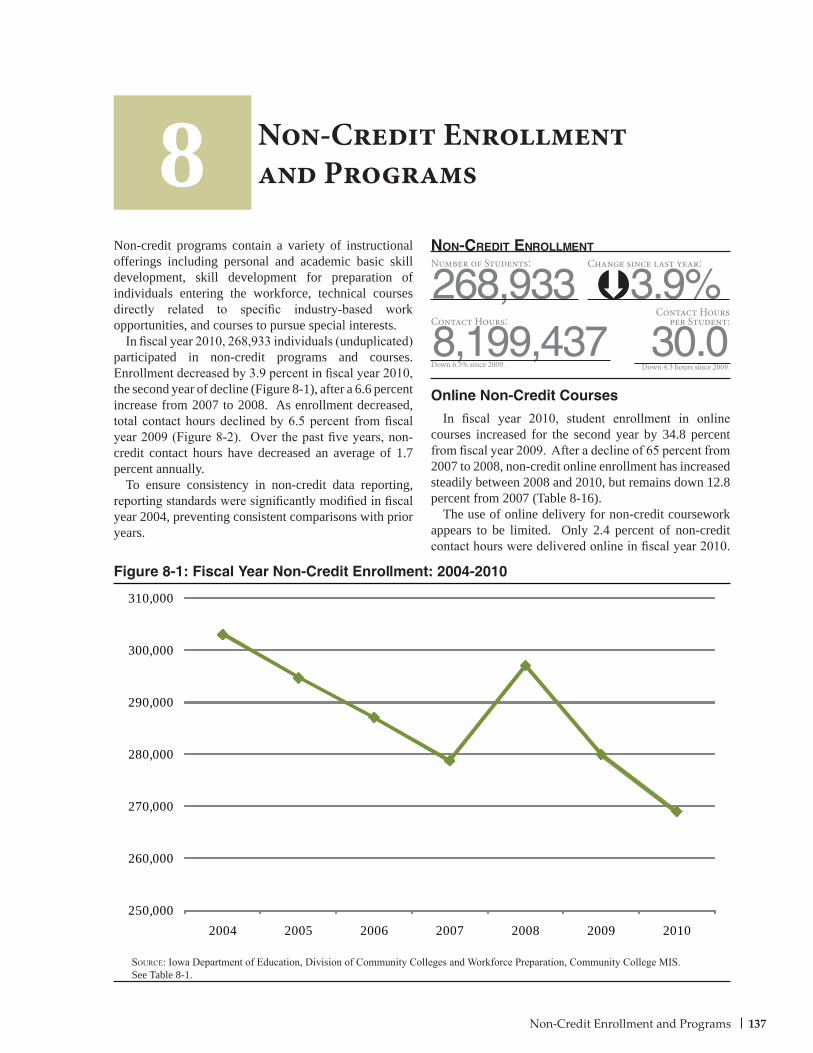
137Non-Credit Enrollment and Programs
Non-credit programs contain a variety of instructional offerings including personal and academic basic skill development, skill development for preparation of individuals entering the workforce, technical courses directly related to specific industry-based work opportunities, and courses to pursue special interests.
In fiscal year 2010, 268,933 individuals (unduplicated) participated in non-credit programs and courses. Enrollment decreased by 3.9 percent in fiscal year 2010, the second year of decline (Figure 8-1), after a 6.6 percent increase from 2007 to 2008. As enrollment decreased, total contact hours declined by 6.5 percent from fiscal year 2009 (Figure 8-2). Over the past five years, non-credit contact hours have decreased an average of 1.7 percent annually.
To ensure consistency in non-credit data reporting, reporting standards were significantly modified in fiscal year 2004, preventing consistent comparisons with prior years.
Online Non-Credit Courses
In fiscal year 2010, student enrollment in online courses increased for the second year by 34.8 percent from fiscal year 2009. After a decline of 65 percent from 2007 to 2008, non-credit online enrollment has increased steadily between 2008 and 2010, but remains down 12.8 percent from 2007 (Table 8-16).
The use of online delivery for non-credit coursework appears to be limited. Only 2.4 percent of non-credit contact hours were delivered online in fiscal year 2010.
Non-Credit Enrollmentand Programs
Figure 8-1: Fiscal Year Non-Credit Enrollment: 2004-2010
8
Source: Iowa Department of Education, Division of Community Colleges and Workforce Preparation, Community College MIS. See Table 8-1.
8,199,437
Number of Students:
268,933 3.9%non-creDit enrollment
Contact Hours:Contact Hours
per Student:
30.0Down 6.5% since 2009. Down 4.3 hours since 2009.
Change since last year:
250,000
260,000
270,000
280,000
290,000
300,000
310,000
2004 2005 2006 2007 2008 2009 2010
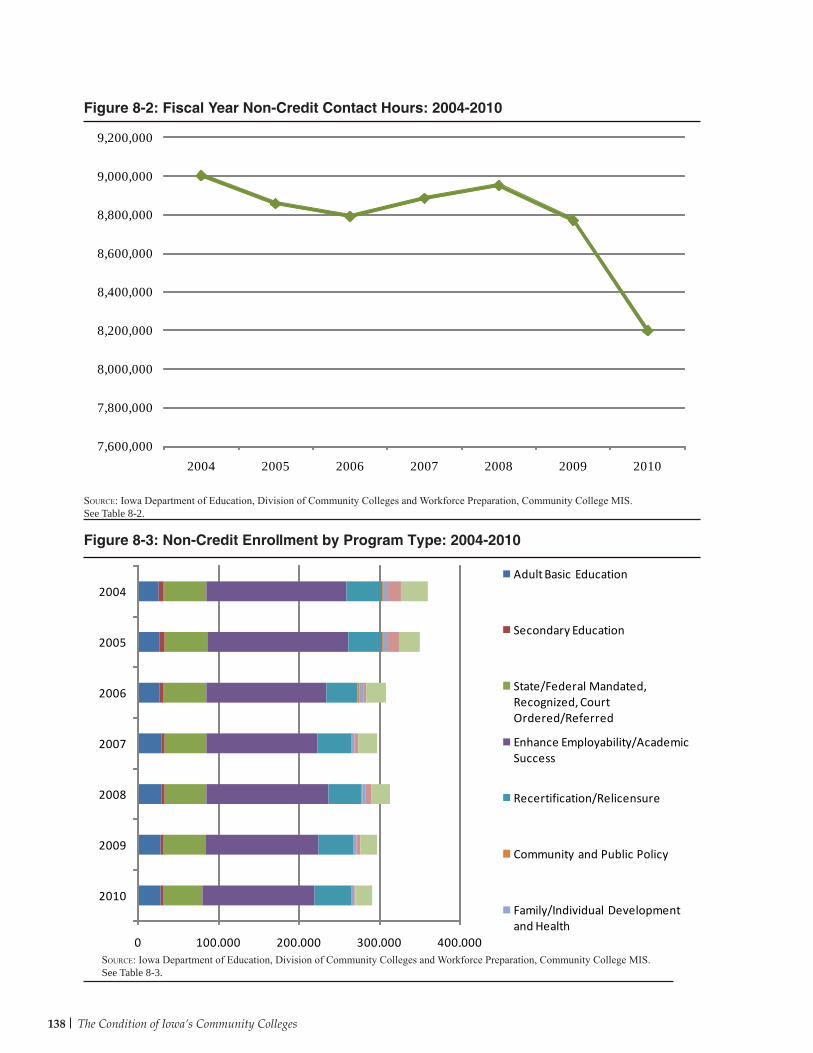
138 The Condition of Iowa’s Community Colleges
Figure 8-2: Fiscal Year Non-Credit Contact Hours: 2004-2010
Figure 8-3: Non-Credit Enrollment by Program Type: 2004-2010
Source: Iowa Department of Education, Division of Community Colleges and Workforce Preparation, Community College MIS. See Table 8-3.
Source: Iowa Department of Education, Division of Community Colleges and Workforce Preparation, Community College MIS. See Table 8-2.
7,600,000
7,800,000
8,000,000
8,200,000
8,400,000
8,600,000
8,800,000
9,000,000
9,200,000
2004 2005 2006 2007 2008 2009 2010
0 100,000 200,000 300,000 400,000
2010
2009
2008
2007
2006
2005
2004Adult Basic Education
Secondary Education
State/Federal Mandated, Recognized, Court Ordered/Referred
Enhance Employability/Academic Success
Recertification/Relicensure
Community and Public Policy
Family/Individual Development and Health
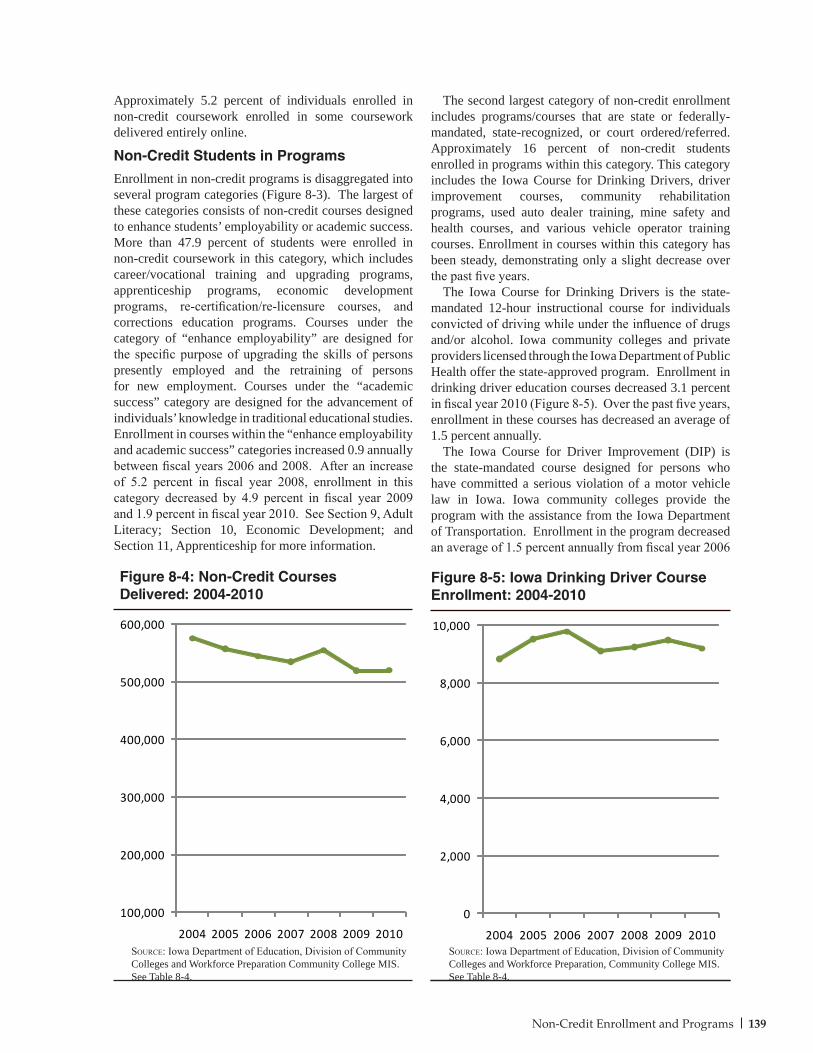
139Non-Credit Enrollment and Programs
Approximately 5.2 percent of individuals enrolled in non-credit coursework enrolled in some coursework delivered entirely online.
Non-Credit Students in Programs
Enrollment in non-credit programs is disaggregated into several program categories (Figure 8-3). The largest of these categories consists of non-credit courses designed to enhance students’ employability or academic success. More than 47.9 percent of students were enrolled in non-credit coursework in this category, which includes career/vocational training and upgrading programs, apprenticeship programs, economic development programs, re-certification/re-licensure courses, and corrections education programs. Courses under the category of “enhance employability” are designed for the specific purpose of upgrading the skills of persons presently employed and the retraining of persons for new employment. Courses under the “academic success” category are designed for the advancement of individuals’ knowledge in traditional educational studies. Enrollment in courses within the “enhance employability and academic success” categories increased 0.9 annually between fiscal years 2006 and 2008. After an increase of 5.2 percent in fiscal year 2008, enrollment in this category decreased by 4.9 percent in fiscal year 2009 and 1.9 percent in fiscal year 2010. See Section 9, Adult Literacy; Section 10, Economic Development; and Section 11, Apprenticeship for more information.
Figure 8-5: Iowa Drinking Driver Course Enrollment: 2004-2010
Source: Iowa Department of Education, Division of Community Colleges and Workforce Preparation, Community College MIS. See Table 8-4.
The second largest category of non-credit enrollment includes programs/courses that are state or federally-mandated, state-recognized, or court ordered/referred. Approximately 16 percent of non-credit students enrolled in programs within this category. This category includes the Iowa Course for Drinking Drivers, driver improvement courses, community rehabilitation programs, used auto dealer training, mine safety and health courses, and various vehicle operator training courses. Enrollment in courses within this category has been steady, demonstrating only a slight decrease over the past five years.
The Iowa Course for Drinking Drivers is the state-mandated 12-hour instructional course for individuals convicted of driving while under the influence of drugs and/or alcohol. Iowa community colleges and private providers licensed through the Iowa Department of Public Health offer the state-approved program. Enrollment in drinking driver education courses decreased 3.1 percent in fiscal year 2010 (Figure 8-5). Over the past five years, enrollment in these courses has decreased an average of 1.5 percent annually.
The Iowa Course for Driver Improvement (DIP) is the state-mandated course designed for persons who have committed a serious violation of a motor vehicle law in Iowa. Iowa community colleges provide the program with the assistance from the Iowa Department of Transportation. Enrollment in the program decreased an average of 1.5 percent annually from fiscal year 2006
Figure 8-4: Non-Credit Courses Delivered: 2004-2010
Source: Iowa Department of Education, Division of Community Colleges and Workforce Preparation Community College MIS. See Table 8-4.
100,000
200,000
300,000
400,000
500,000
600,000
2004 2005 2006 2007 2008 2009 2010
0
2,000
4,000
6,000
8,000
10,000
2004 2005 2006 2007 2008 2009 2010
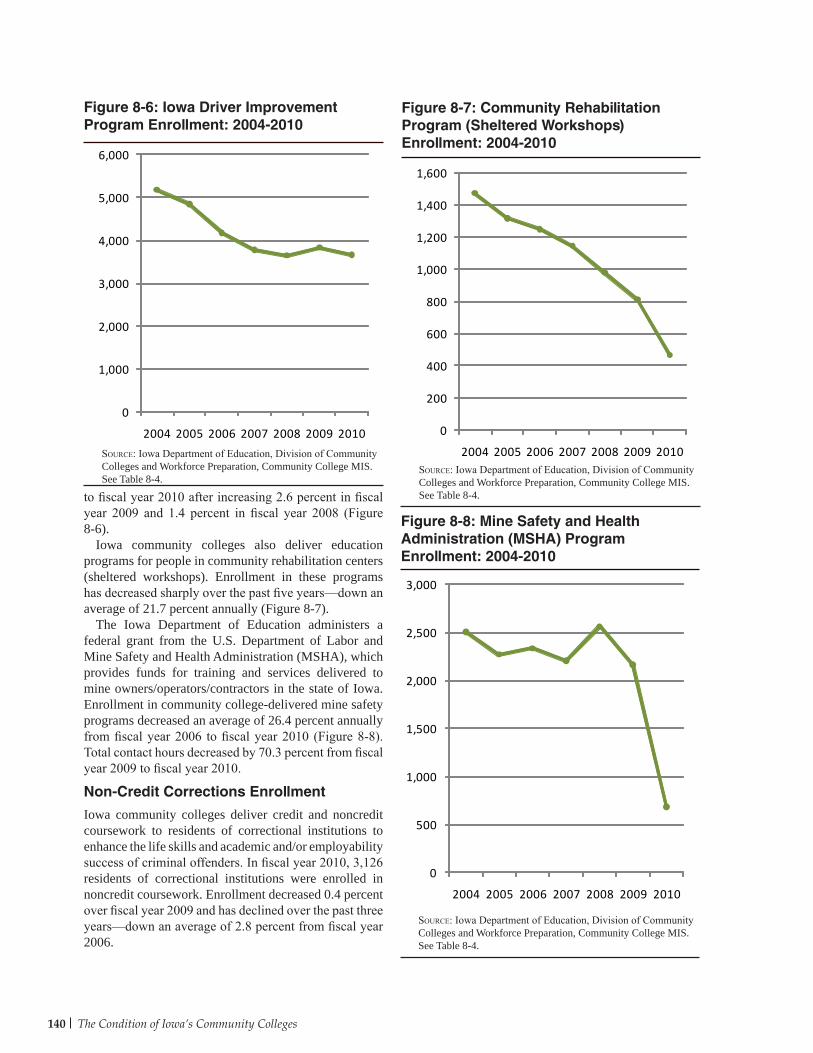
140 The Condition of Iowa’s Community Colleges
to fiscal year 2010 after increasing 2.6 percent in fiscal year 2009 and 1.4 percent in fiscal year 2008 (Figure 8-6).
Iowa community colleges also deliver education programs for people in community rehabilitation centers (sheltered workshops). Enrollment in these programs has decreased sharply over the past five years—down an average of 21.7 percent annually (Figure 8-7).
The Iowa Department of Education administers a federal grant from the U.S. Department of Labor and Mine Safety and Health Administration (MSHA), which provides funds for training and services delivered to mine owners/operators/contractors in the state of Iowa. Enrollment in community college-delivered mine safety programs decreased an average of 26.4 percent annually from fiscal year 2006 to fiscal year 2010 (Figure 8-8). Total contact hours decreased by 70.3 percent from fiscal year 2009 to fiscal year 2010.
Non-Credit Corrections Enrollment
Iowa community colleges deliver credit and noncredit coursework to residents of correctional institutions to enhance the life skills and academic and/or employability success of criminal offenders. In fiscal year 2010, 3,126 residents of correctional institutions were enrolled in noncredit coursework. Enrollment decreased 0.4 percent over fiscal year 2009 and has declined over the past three years—down an average of 2.8 percent from fiscal year 2006.
Figure 8-7: Community Rehabilitation Program (Sheltered Workshops) Enrollment: 2004-2010
Source: Iowa Department of Education, Division of Community Colleges and Workforce Preparation, Community College MIS. See Table 8-4.
Figure 8-8: Mine Safety and Health Administration (MSHA) Program Enrollment: 2004-2010
Source: Iowa Department of Education, Division of Community Colleges and Workforce Preparation, Community College MIS. See Table 8-4.
Figure 8-6: Iowa Driver Improvement Program Enrollment: 2004-2010
Source: Iowa Department of Education, Division of Community Colleges and Workforce Preparation, Community College MIS. See Table 8-4.
0
500
1,000
1,500
2,000
2,500
3,000
2004 2005 2006 2007 2008 2009 2010
0
1,000
2,000
3,000
4,000
5,000
6,000
2004 2005 2006 2007 2008 2009 2010 0
200
400
600
800
1,000
1,200
1,400
1,600
2004 2005 2006 2007 2008 2009 2010
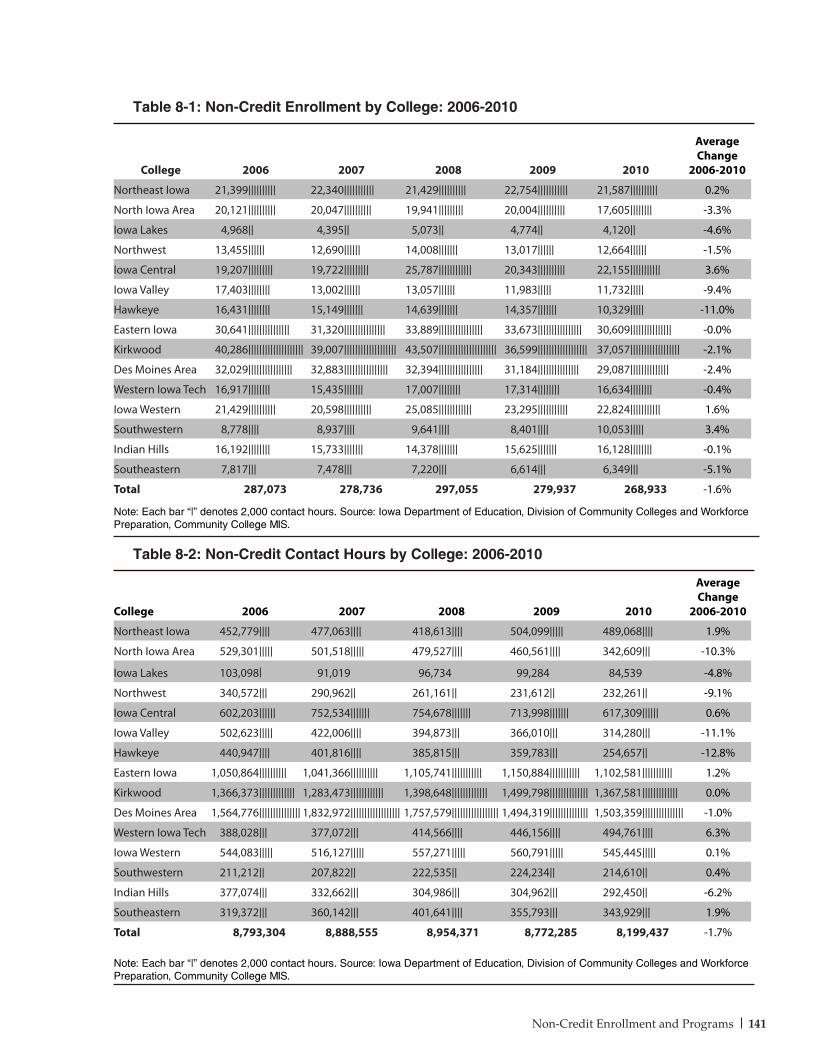
141Non-Credit Enrollment and Programs
College 2006 2007 2008 2009 2010
Average Change
2006-2010
Northeast Iowa 21,399|||||||||| 22,340||||||||||| 21,429|||||||||| 22,754||||||||||| 21,587|||||||||| 0.2%
North Iowa Area 20,121|||||||||| 20,047|||||||||| 19,941||||||||| 20,004|||||||||| 17,605|||||||| -3.3%
Iowa Lakes 4,968|| 4,395|| 5,073|| 4,774|| 4,120|| -4.6%
Northwest 13,455|||||| 12,690|||||| 14,008||||||| 13,017|||||| 12,664|||||| -1.5%
Iowa Central 19,207||||||||| 19,722||||||||| 25,787|||||||||||| 20,343|||||||||| 22,155||||||||||| 3.6%
Iowa Valley 17,403|||||||| 13,002|||||| 13,057|||||| 11,983||||| 11,732||||| -9.4%
Hawkeye 16,431|||||||| 15,149||||||| 14,639||||||| 14,357||||||| 10,329||||| -11.0%
Eastern Iowa 30,641||||||||||||||| 31,320||||||||||||||| 33,889|||||||||||||||| 33,673|||||||||||||||| 30,609||||||||||||||| -0.0%
Kirkwood 40,286|||||||||||||||||||| 39,007||||||||||||||||||| 43,507||||||||||||||||||||| 36,599|||||||||||||||||| 37,057|||||||||||||||||| -2.1%
Des Moines Area 32,029|||||||||||||||| 32,883|||||||||||||||| 32,394|||||||||||||||| 31,184||||||||||||||| 29,087|||||||||||||| -2.4%
Western Iowa Tech 16,917|||||||| 15,435||||||| 17,007|||||||| 17,314|||||||| 16,634|||||||| -0.4%
Iowa Western 21,429|||||||||| 20,598|||||||||| 25,085|||||||||||| 23,295||||||||||| 22,824||||||||||| 1.6%
Southwestern 8,778|||| 8,937|||| 9,641|||| 8,401|||| 10,053||||| 3.4%
Indian Hills 16,192|||||||| 15,733||||||| 14,378||||||| 15,625||||||| 16,128|||||||| -0.1%
Southeastern 7,817||| 7,478||| 7,220||| 6,614||| 6,349||| -5.1%
Total 287,073 278,736 297,055 279,937 268,933 -1.6%
Note: Each bar “|” denotes 2,000 contact hours. Source: Iowa Department of Education, Division of Community Colleges and Workforce Preparation, Community College MIS.
College 2006 2007 2008 2009 2010
Average Change
2006-2010
Northeast Iowa 452,779|||| 477,063|||| 418,613|||| 504,099||||| 489,068|||| 1.9%
North Iowa Area 529,301||||| 501,518||||| 479,527|||| 460,561|||| 342,609||| -10.3%
Iowa Lakes 103,098| 91,019 96,734 99,284 84,539 -4.8%
Northwest 340,572||| 290,962|| 261,161|| 231,612|| 232,261|| -9.1%
Iowa Central 602,203|||||| 752,534||||||| 754,678||||||| 713,998||||||| 617,309|||||| 0.6%
Iowa Valley 502,623||||| 422,006|||| 394,873||| 366,010||| 314,280||| -11.1%
Hawkeye 440,947|||| 401,816|||| 385,815||| 359,783||| 254,657|| -12.8%
Eastern Iowa 1,050,864|||||||||| 1,041,366|||||||||| 1,105,741||||||||||| 1,150,884||||||||||| 1,102,581||||||||||| 1.2%
Kirkwood 1,366,373||||||||||||| 1,283,473|||||||||||| 1,398,648||||||||||||| 1,499,798|||||||||||||| 1,367,581||||||||||||| 0.0%
Des Moines Area 1,564,776||||||||||||||| 1,832,972|||||||||||||||||| 1,757,579||||||||||||||||| 1,494,319|||||||||||||| 1,503,359||||||||||||||| -1.0%
Western Iowa Tech 388,028||| 377,072||| 414,566|||| 446,156|||| 494,761|||| 6.3%
Iowa Western 544,083||||| 516,127||||| 557,271||||| 560,791||||| 545,445||||| 0.1%
Southwestern 211,212|| 207,822|| 222,535|| 224,234|| 214,610|| 0.4%
Indian Hills 377,074||| 332,662||| 304,986||| 304,962||| 292,450|| -6.2%
Southeastern 319,372||| 360,142||| 401,641|||| 355,793||| 343,929||| 1.9%
Total 8,793,304 8,888,555 8,954,371 8,772,285 8,199,437 -1.7%
Note: Each bar “|” denotes 2,000 contact hours. Source: Iowa Department of Education, Division of Community Colleges and Workforce Preparation, Community College MIS.
Table 8-1: Non-Credit Enrollment by College: 2006-2010
Table 8-2: Non-Credit Contact Hours by College: 2006-2010
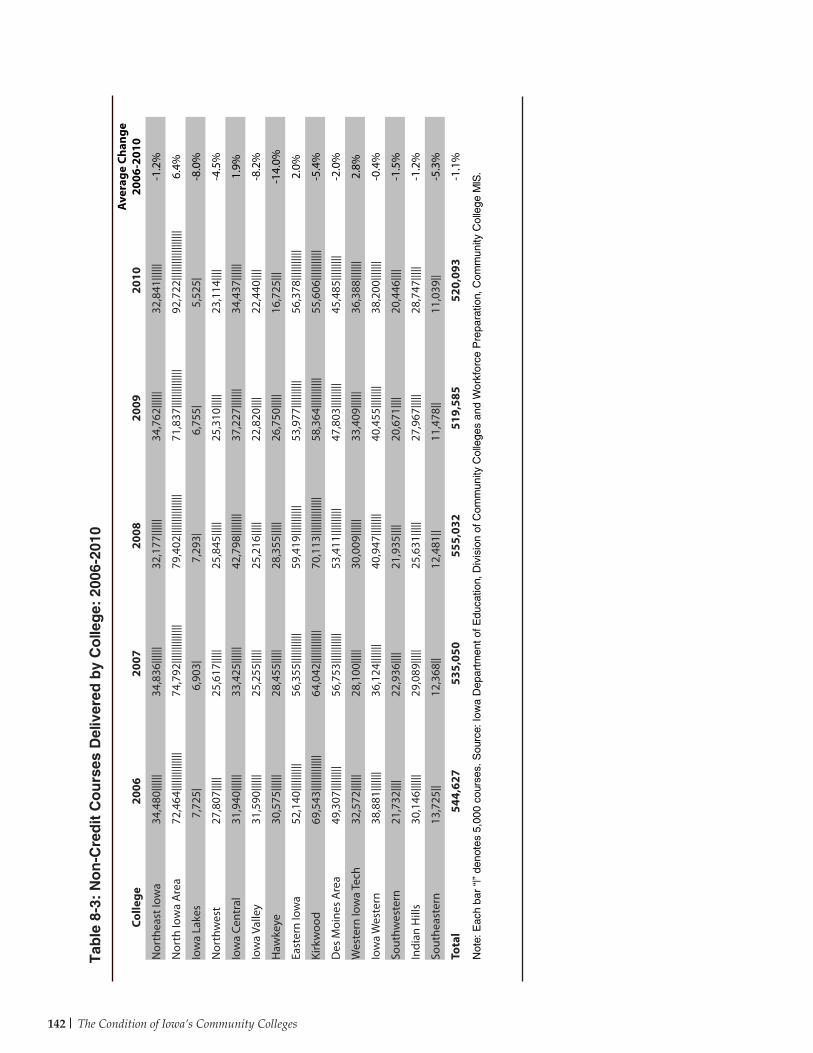
142 The Condition of Iowa’s Community Colleges
Colle
ge20
0620
0720
0820
0920
10A
vera
ge C
hang
e 20
06-2
010
Nor
thea
st Io
wa
34,4
80|||
|||34
,836
||||||
32,1
77|||
|||34
,762
||||||
32,8
41|||
|||-1
.2%
Nor
th Io
wa
Are
a72
,464
||||||
||||||
||74
,792
||||||
||||||
||79
,402
||||||
||||||
|||71
,837
||||||
||||||
||92
,722
||||||
||||||
||||||
6.4%
Iow
a La
kes
7,72
5|6,
903|
7,29
3|6,
755|
5,52
5|-8
.0%
Nor
thw
est
27,8
07|||
||25
,617
|||||
25,8
45|||
||25
,310
|||||
23,1
14|||
|-4
.5%
Iow
a Ce
ntra
l31
,940
||||||
33,4
25|||
|||42
,798
||||||
||37
,227
||||||
|34
,437
||||||
1.9%
Iow
a Va
lley
31,5
90|||
|||25
,255
|||||
25,2
16|||
||22
,820
||||
22,4
40|||
|-8
.2%
Haw
keye
30,5
75|||
|||28
,455
|||||
28,3
55|||
||26
,750
|||||
16,7
25|||
-14.
0%
East
ern
Iow
a52
,140
||||||
||||
56,3
55|||
||||||
||59
,419
||||||
|||||
53,9
77|||
||||||
|56
,378
||||||
|||||
2.0%
Kirk
woo
d69
,543
||||||
||||||
|64
,042
||||||
||||||
70,1
13|||
||||||
|||||
58,3
64|||
||||||
||55
,606
||||||
|||||
-5.4
%
Des
Moi
nes
Are
a49
,307
||||||
|||56
,753
||||||
|||||
53,4
11|||
||||||
|47
,803
||||||
|||45
,485
||||||
|||-2
.0%
Wes
tern
Iow
a Te
ch32
,572
||||||
28,1
00|||
||30
,009
||||||
33,4
09|||
|||36
,388
||||||
|2.
8%
Iow
a W
este
rn38
,881
||||||
|36
,124
||||||
|40
,947
||||||
||40
,455
||||||
||38
,200
||||||
|-0
.4%
Sout
hwes
tern
21,7
32|||
|22
,936
||||
21,9
35|||
|20
,671
||||
20,4
46|||
|-1
.5%
Indi
an H
ills
30,1
46|||
|||29
,089
|||||
25,6
31|||
||27
,967
|||||
28,7
47|||
||-1
.2%
Sout
heas
tern
13,7
25||
12,3
68||
12,4
81||
11,4
78||
11,0
39||
-5.3
%
Tota
l54
4,62
753
5,05
055
5,03
251
9,58
552
0,09
3-1
.1%
Not
e: E
ach
bar
“|”
deno
tes
5,00
0 co
urse
s. S
ourc
e: Io
wa
Dep
artm
ent o
f Edu
catio
n, D
ivis
ion
of C
omm
unity
Col
lege
s an
d W
orkf
orce
Pre
para
tion,
Com
mun
ity C
olle
ge M
IS.
Tab
le 8
-3:
No
n-C
red
it C
ou
rses
Del
iver
ed b
y C
olle
ge:
200
6-20
10
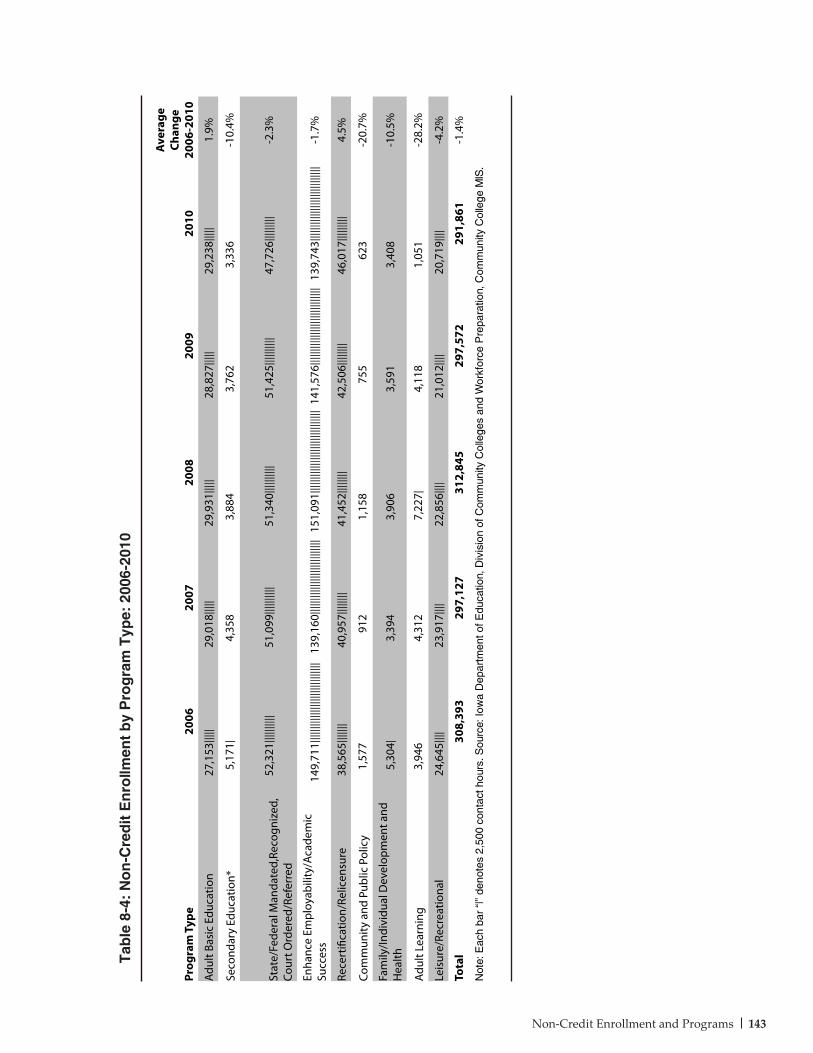
143Non-Credit Enrollment and Programs
Prog
ram
Typ
e20
0620
0720
0820
0920
10
Ave
rage
Ch
ange
20
06-2
010
Adul
t Bas
ic E
duca
tion
27,1
53|||
||29
,018
|||||
29,9
31|||
||28
,827
|||||
29,2
38|||
||1.
9%
Seco
ndar
y Ed
ucat
ion*
5,17
1|4,
358
3,88
43,
762
3,33
6-1
0.4%
Stat
e/Fe
dera
l Man
date
d,Re
cogn
ized
, Co
urt O
rder
ed/R
efer
red
52,3
21|||
||||||
|51
,099
||||||
||||
51,3
40|||
||||||
|51
,425
||||||
||||
47,7
26|||
||||||
-2.3
%
Enha
nce
Empl
oyab
ility
/Aca
dem
ic
Succ
ess
149,
711|
||||||
||||||
||||||
||||||
||||
139,
160|
||||||
||||||
||||||
||||||
||15
1,09
1||||
||||||
||||||
||||||
||||||
||14
1,57
6||||
||||||
||||||
||||||
||||||
139,
743|
||||||
||||||
||||||
||||||
||-1
.7%
Rece
rtifi
catio
n/Re
licen
sure
38,5
65|||
||||
40,9
57|||
|||||
41,4
52|||
|||||
42,5
06|||
|||||
46,0
17|||
||||||
4.5%
Com
mun
ity a
nd P
ublic
Pol
icy
1,57
791
21,
158
755
623
-20.
7%
Fam
ily/In
divi
dual
Dev
elop
men
t and
H
ealth
5,30
4|3,
394
3,90
63,
591
3,40
8-1
0.5%
Adul
t Lea
rnin
g3,
946
4,31
27,
227|
4,11
81,
051
-28.
2%
Leis
ure/
Recr
eatio
nal
24,6
45|||
|23
,917
||||
22,8
56|||
|21
,012
||||
20,7
19|||
|-4
.2%
Tota
l30
8,39
329
7,12
731
2,84
529
7,57
229
1,86
1-1
.4%
Not
e: E
ach
bar
“|”
deno
tes
2,50
0 co
ntac
t hou
rs. S
ourc
e: Io
wa
Dep
artm
ent o
f Edu
catio
n, D
ivis
ion
of C
omm
unity
Col
lege
s an
d W
orkf
orce
Pre
para
tion,
Com
mun
ity C
olle
ge M
IS.
Tab
le 8
-4:
No
n-C
red
it E
nro
llmen
t b
y P
rog
ram
Typ
e: 2
006-
2010

144 The Condition of Iowa’s Community Colleges
Colle
geA
dult
Bas
ic
Educ
atio
nSe
cond
ary
Educ
atio
n
Stat
e/Fe
d-er
al M
anda
ted,
Re
cogn
ized
, Co
urt O
rder
ed/
Refe
rred
Enha
nce
Empl
oyab
ility
/A
cade
mic
Suc
-ce
ssRe
cert
ifica
tion
/Re
licen
sure
Com
mu-
nity
and
Pub
lic
Polic
y
Fam
ily/In
di-
vidu
al D
evel
-op
men
t and
H
ealt
hA
dult
Lea
rnin
gLe
isur
e/Re
cre-
atio
nal
Tota
l
Nor
thea
st Io
wa
1,12
020
54,
573
15,4
240
019
459
31,
256
23,3
65
Nor
th Io
wa
Are
a1,
904
222,
331
13,0
895,
868
01,
404
489
1,53
326
,640
Iow
a La
kes
340
661,
211
2,29
21,
260
025
461
125
5,60
9
Nor
thw
est
1,06
715
31,
982
10,3
361,
151
017
53
1,54
616
,413
Iow
a Ce
ntra
l1,
724
127
2,78
714
,330
060
345
265
274
19,9
12
Iow
a Va
lley
1,50
531
21,
832
9,67
81,
517
794
644
354
2,73
919
,375
Haw
keye
1,39
029
83,
601
9,12
00
211
404
734
15,5
69
East
ern
Iow
a3,
082
458
5,05
215
,898
1,67
623
380
410
23,
626
30,9
31
Kirk
woo
d2,
823
1,87
57,
648
14,8
583,
471
00
760
7,22
638
,661
Des
Moi
nes
Are
a4,
492
1,63
39,
513
10,4
773,
842
045
715
280
30,7
09
Wes
tern
Iow
a Te
ch1,
219
02,
384
9,59
44,
248
024
50
1,25
718
,947
Iow
a W
este
rn2,
177
03,
416
7,71
18,
533
168
192
561
1,78
424
,542
Sout
hwes
tern
513
01,
371
4,81
32,
377
137
9813
378
510
,227
Indi
an H
ills
2,05
622
2,90
98,
981
4,02
116
415
220
288
319
,390
Sout
heas
tern
1,74
10
1,71
13,
110
601
069
459
77,
833
Tota
l27
,153
5,17
152
,321
149,
711
38,5
651,
577
5,03
43,
946
24,6
4530
8,12
3
% o
f Tot
al8.
8%1.
7%17
.0%
48.6
%12
.5%
0.5%
1.6%
1.3%
8.0%
100.
0%
So
ur
ce: I
owa
Dep
artm
ent o
f Edu
catio
n, D
ivis
ion
of C
omm
unity
Col
lege
s and
Wor
kfor
ce P
repa
ratio
n, C
omm
unity
Col
lege
MIS
.
Tab
le 8
-5:
No
n-C
red
it E
nro
llmen
t b
y P
rog
ram
Typ
e b
y C
olle
ge:
200
6
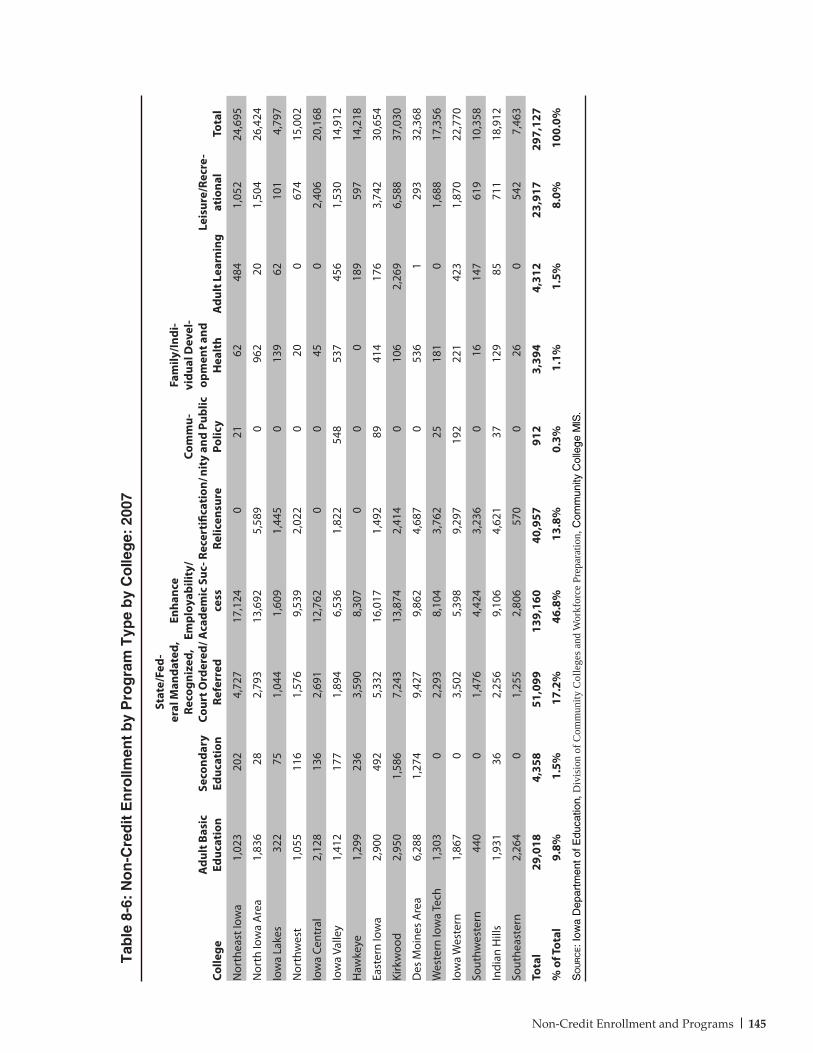
145Non-Credit Enrollment and Programs
Tab
le 8
-6:
No
n-C
red
it E
nro
llmen
t b
y P
rog
ram
Typ
e b
y C
olle
ge:
200
7
Colle
geA
dult
Bas
ic
Educ
atio
nSe
cond
ary
Educ
atio
n
Stat
e/Fe
d-er
al M
anda
ted,
Re
cogn
ized
, Co
urt O
rder
ed/
Refe
rred
Enha
nce
Empl
oyab
ility
/A
cade
mic
Suc
-ce
ssRe
cert
ifica
tion
/Re
licen
sure
Com
mu-
nity
and
Pub
lic
Polic
y
Fam
ily/In
di-
vidu
al D
evel
-op
men
t and
H
ealt
hA
dult
Lea
rnin
gLe
isur
e/Re
cre-
atio
nal
Tota
l
Nor
thea
st Io
wa
1,02
320
24,
727
17,1
240
2162
484
1,05
224
,695
Nor
th Io
wa
Are
a1,
836
282,
793
13,6
925,
589
096
220
1,50
426
,424
Iow
a La
kes
322
751,
044
1,60
91,
445
013
962
101
4,79
7
Nor
thw
est
1,05
511
61,
576
9,53
92,
022
020
067
415
,002
Iow
a Ce
ntra
l2,
128
136
2,69
112
,762
00
450
2,40
620
,168
Iow
a Va
lley
1,41
217
71,
894
6,53
61,
822
548
537
456
1,53
014
,912
Haw
keye
1,29
923
63,
590
8,30
70
00
189
597
14,2
18
East
ern
Iow
a2,
900
492
5,33
216
,017
1,49
289
414
176
3,74
230
,654
Kirk
woo
d2,
950
1,58
67,
243
13,8
742,
414
010
62,
269
6,58
837
,030
Des
Moi
nes
Are
a6,
288
1,27
49,
427
9,86
24,
687
053
61
293
32,3
68
Wes
tern
Iow
a Te
ch1,
303
02,
293
8,10
43,
762
2518
10
1,68
817
,356
Iow
a W
este
rn1,
867
03,
502
5,39
89,
297
192
221
423
1,87
022
,770
Sout
hwes
tern
440
01,
476
4,42
43,
236
016
147
619
10,3
58
Indi
an H
ills
1,93
136
2,25
69,
106
4,62
137
129
8571
118
,912
Sout
heas
tern
2,26
40
1,25
52,
806
570
026
054
27,
463
Tota
l29
,018
4,35
851
,099
139,
160
40,9
5791
23,
394
4,31
223
,917
297,
127
% o
f Tot
al9.
8%1.
5%17
.2%
46.8
%13
.8%
0.3%
1.1%
1.5%
8.0%
100.
0%
So
ur
ce: I
owa
Dep
artm
ent o
f Edu
catio
n, D
ivis
ion
of C
omm
unity
Col
lege
s and
Wor
kfor
ce P
repa
ratio
n, C
omm
unity
Col
lege
MIS
.
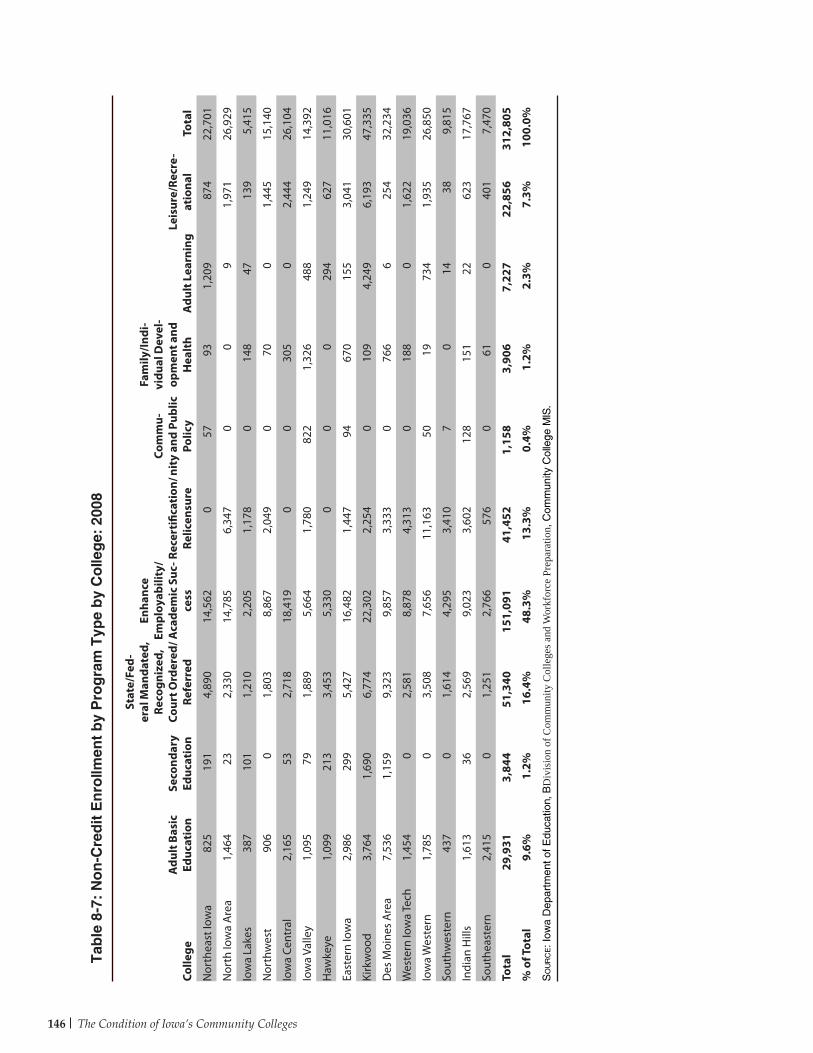
146 The Condition of Iowa’s Community Colleges
Tab
le 8
-7:
No
n-C
red
it E
nro
llmen
t b
y P
rog
ram
Typ
e b
y C
olle
ge:
200
8
Colle
geA
dult
Bas
ic
Educ
atio
nSe
cond
ary
Educ
atio
n
Stat
e/Fe
d-er
al M
anda
ted,
Re
cogn
ized
, Co
urt O
rder
ed/
Refe
rred
Enha
nce
Empl
oyab
ility
/A
cade
mic
Suc
-ce
ssRe
cert
ifica
tion
/Re
licen
sure
Com
mu-
nity
and
Pub
lic
Polic
y
Fam
ily/In
di-
vidu
al D
evel
-op
men
t and
H
ealt
hA
dult
Lea
rnin
gLe
isur
e/Re
cre-
atio
nal
Tota
l
Nor
thea
st Io
wa
825
191
4,89
014
,562
057
931,
209
874
22,7
01
Nor
th Io
wa
Are
a1,
464
232,
330
14,7
856,
347
00
91,
971
26,9
29
Iow
a La
kes
387
101
1,21
02,
205
1,17
80
148
4713
95,
415
Nor
thw
est
906
01,
803
8,86
72,
049
070
01,
445
15,1
40
Iow
a Ce
ntra
l2,
165
532,
718
18,4
190
030
50
2,44
426
,104
Iow
a Va
lley
1,09
579
1,88
95,
664
1,78
082
21,
326
488
1,24
914
,392
Haw
keye
1,09
921
33,
453
5,33
00
00
294
627
11,0
16
East
ern
Iow
a2,
986
299
5,42
716
,482
1,44
794
670
155
3,04
130
,601
Kirk
woo
d3,
764
1,69
06,
774
22,3
022,
254
010
94,
249
6,19
347
,335
Des
Moi
nes
Are
a7,
536
1,15
99,
323
9,85
73,
333
076
66
254
32,2
34
Wes
tern
Iow
a Te
ch1,
454
02,
581
8,87
84,
313
018
80
1,62
219
,036
Iow
a W
este
rn1,
785
03,
508
7,65
611
,163
5019
734
1,93
526
,850
Sout
hwes
tern
437
01,
614
4,29
53,
410
70
1438
9,81
5
Indi
an H
ills
1,61
336
2,56
99,
023
3,60
212
815
122
623
17,7
67
Sout
heas
tern
2,41
50
1,25
12,
766
576
061
040
17,
470
Tota
l29
,931
3,84
451
,340
151,
091
41,4
521,
158
3,90
67,
227
22,8
5631
2,80
5
% o
f Tot
al9.
6%1.
2%16
.4%
48.3
%13
.3%
0.4%
1.2%
2.3%
7.3%
100.
0%
So
ur
ce: I
owa
Dep
artm
ent o
f Edu
catio
n, B
Div
isio
n of
Com
mun
ity C
olle
ges a
nd W
orkf
orce
Pre
para
tion,
Com
mun
ity C
olle
ge M
IS.
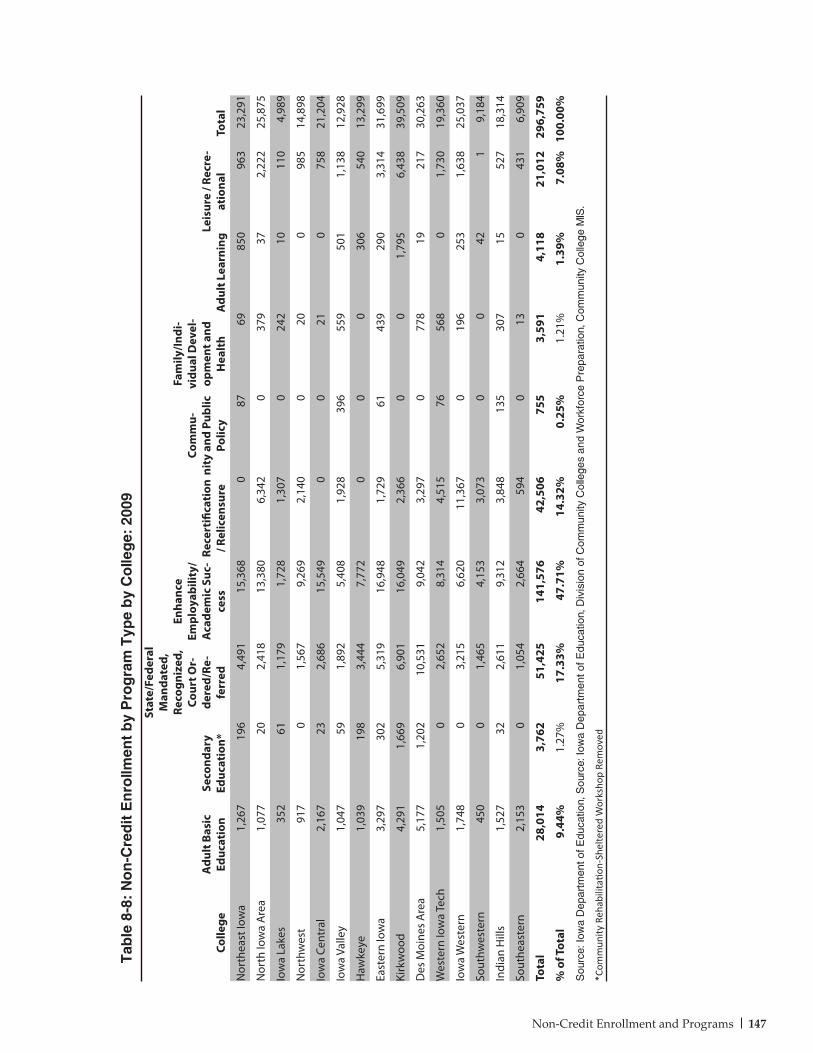
147Non-Credit Enrollment and Programs
Colle
geA
dult
Bas
ic
Educ
atio
nSe
cond
ary
Educ
atio
n*
Stat
e/Fe
dera
l M
anda
ted,
Re
cogn
ized
, Co
urt O
r-de
red/
Re-
ferr
ed
Enha
nce
Empl
oyab
ility
/A
cade
mic
Suc
-ce
ssRe
cert
ifica
tion
/ R
elic
ensu
re
Com
mu-
nity
and
Pub
lic
Polic
y
Fam
ily/In
di-
vidu
al D
evel
-op
men
t and
H
ealt
hA
dult
Lea
rnin
gLe
isur
e / R
ecre
-at
iona
lTo
tal
Nor
thea
st Io
wa
1,26
719
64,
491
15,3
680
8769
850
963
23,2
91
Nor
th Io
wa
Are
a1,
077
202,
418
13,3
806,
342
037
937
2,22
225
,875
Iow
a La
kes
352
611,
179
1,72
81,
307
024
210
110
4,98
9
Nor
thw
est
917
01,
567
9,26
92,
140
020
098
514
,898
Iow
a Ce
ntra
l2,
167
232,
686
15,5
490
021
075
821
,204
Iow
a Va
lley
1,04
759
1,89
25,
408
1,92
839
655
950
11,
138
12,9
28
Haw
keye
1,03
919
83,
444
7,77
20
00
306
540
13,2
99
East
ern
Iow
a3,
297
302
5,31
916
,948
1,72
961
439
290
3,31
431
,699
Kirk
woo
d4,
291
1,66
96,
901
16,0
492,
366
00
1,79
56,
438
39,5
09
Des
Moi
nes
Are
a5,
177
1,20
210
,531
9,04
23,
297
077
819
217
30,2
63
Wes
tern
Iow
a Te
ch1,
505
02,
652
8,31
44,
515
7656
80
1,73
019
,360
Iow
a W
este
rn1,
748
03,
215
6,62
011
,367
019
625
31,
638
25,0
37
Sout
hwes
tern
450
01,
465
4,15
33,
073
00
421
9,18
4
Indi
an H
ills
1,52
732
2,61
19,
312
3,84
813
530
715
527
18,3
14
Sout
heas
tern
2,15
30
1,05
42,
664
594
013
043
16,
909
Tota
l28
,014
3,76
251
,425
141,
576
42,5
0675
53,
591
4,11
821
,012
296,
759
% o
f Tot
al9.
44%
1.27
%17
.33%
47.7
1%14
.32%
0.25
%1.
21%
1.39
%7.
08%
100.
00%
Sou
rce:
Iow
a D
epar
tmen
t of E
duca
tion,
Sou
rce:
Iow
a D
epar
tmen
t of E
duca
tion,
Div
isio
n of
Com
mun
ity C
olle
ges
and
Wor
kfor
ce P
repa
ratio
n, C
omm
unity
Col
lege
MIS
.
*Com
mun
ity R
ehab
ilita
tion-
Shel
tere
d W
orks
hop
Rem
oved
Tab
le 8
-8:
No
n-C
red
it E
nro
llmen
t b
y P
rog
ram
Typ
e b
y C
olle
ge:
200
9
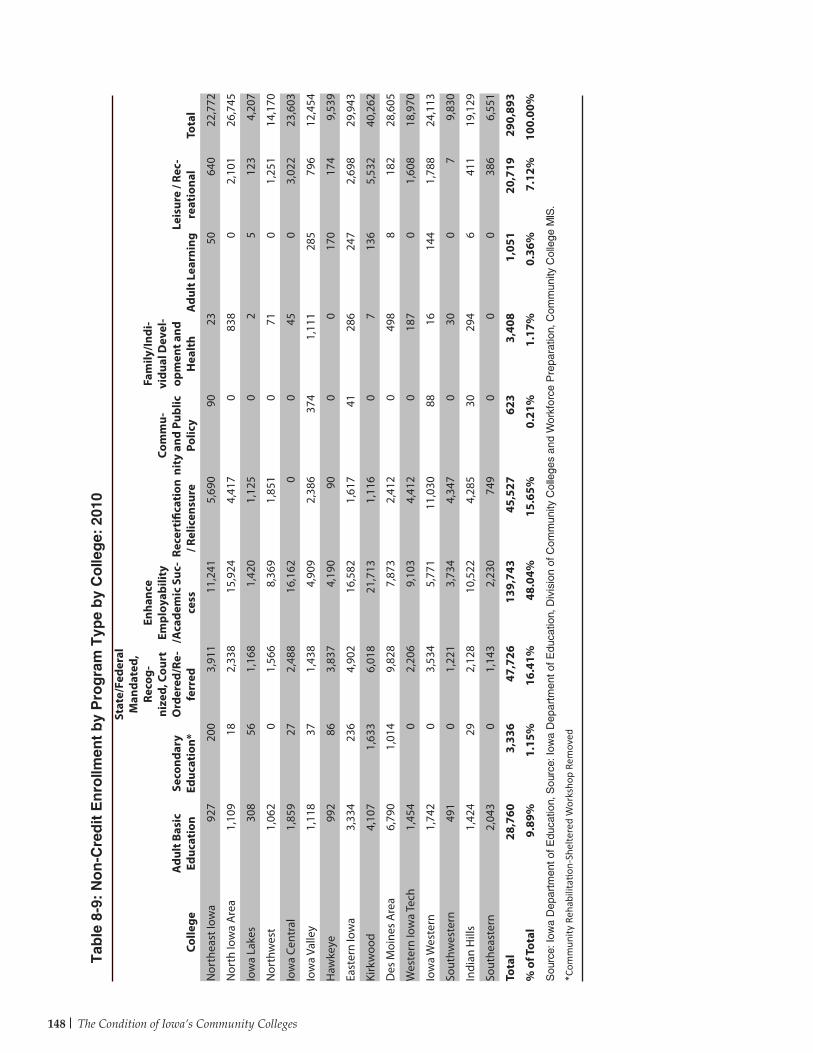
148 The Condition of Iowa’s Community Colleges
Colle
geA
dult
Bas
ic
Educ
atio
nSe
cond
ary
Educ
atio
n*
Stat
e/Fe
dera
l M
anda
ted,
Re
cog-
nize
d, C
ourt
O
rder
ed/R
e-fe
rred
Enha
nce
Empl
oyab
ility
/A
cade
mic
Suc
-ce
ssRe
cert
ifica
tion
/ R
elic
ensu
re
Com
mu-
nity
and
Pub
lic
Polic
y
Fam
ily/In
di-
vidu
al D
evel
-op
men
t and
H
ealt
hA
dult
Lea
rnin
gLe
isur
e / R
ec-
reat
iona
lTo
tal
Nor
thea
st Io
wa
927
200
3,91
111
,241
5,69
090
2350
640
22,7
72
Nor
th Io
wa
Are
a1,
109
182,
338
15,9
244,
417
083
80
2,10
126
,745
Iow
a La
kes
308
561,
168
1,42
01,
125
02
512
34,
207
Nor
thw
est
1,06
20
1,56
68,
369
1,85
10
710
1,25
114
,170
Iow
a Ce
ntra
l1,
859
272,
488
16,1
620
045
03,
022
23,6
03
Iow
a Va
lley
1,11
837
1,43
84,
909
2,38
637
41,
111
285
796
12,4
54
Haw
keye
992
863,
837
4,19
090
00
170
174
9,53
9
East
ern
Iow
a3,
334
236
4,90
216
,582
1,61
741
286
247
2,69
829
,943
Kirk
woo
d4,
107
1,63
36,
018
21,7
131,
116
07
136
5,53
240
,262
Des
Moi
nes
Are
a6,
790
1,01
49,
828
7,87
32,
412
049
88
182
28,6
05
Wes
tern
Iow
a Te
ch1,
454
02,
206
9,10
34,
412
018
70
1,60
818
,970
Iow
a W
este
rn1,
742
03,
534
5,77
111
,030
8816
144
1,78
824
,113
Sout
hwes
tern
491
01,
221
3,73
44,
347
030
07
9,83
0
Indi
an H
ills
1,42
429
2,12
810
,522
4,28
530
294
641
119
,129
Sout
heas
tern
2,04
30
1,14
32,
230
749
00
038
66,
551
Tota
l28
,760
3,33
647
,726
139,
743
45,5
2762
33,
408
1,05
120
,719
290,
893
% o
f Tot
al9.
89%
1.15
%16
.41%
48.0
4%15
.65%
0.21
%1.
17%
0.36
%7.
12%
100.
00%
Sou
rce:
Iow
a D
epar
tmen
t of E
duca
tion,
Sou
rce:
Iow
a D
epar
tmen
t of E
duca
tion,
Div
isio
n of
Com
mun
ity C
olle
ges
and
Wor
kfor
ce P
repa
ratio
n, C
omm
unity
Col
lege
MIS
.
*Com
mun
ity R
ehab
ilita
tion-
Shel
tere
d W
orks
hop
Rem
oved
Tab
le 8
-9:
No
n-C
red
it E
nro
llmen
t b
y P
rog
ram
Typ
e b
y C
olle
ge:
201
0
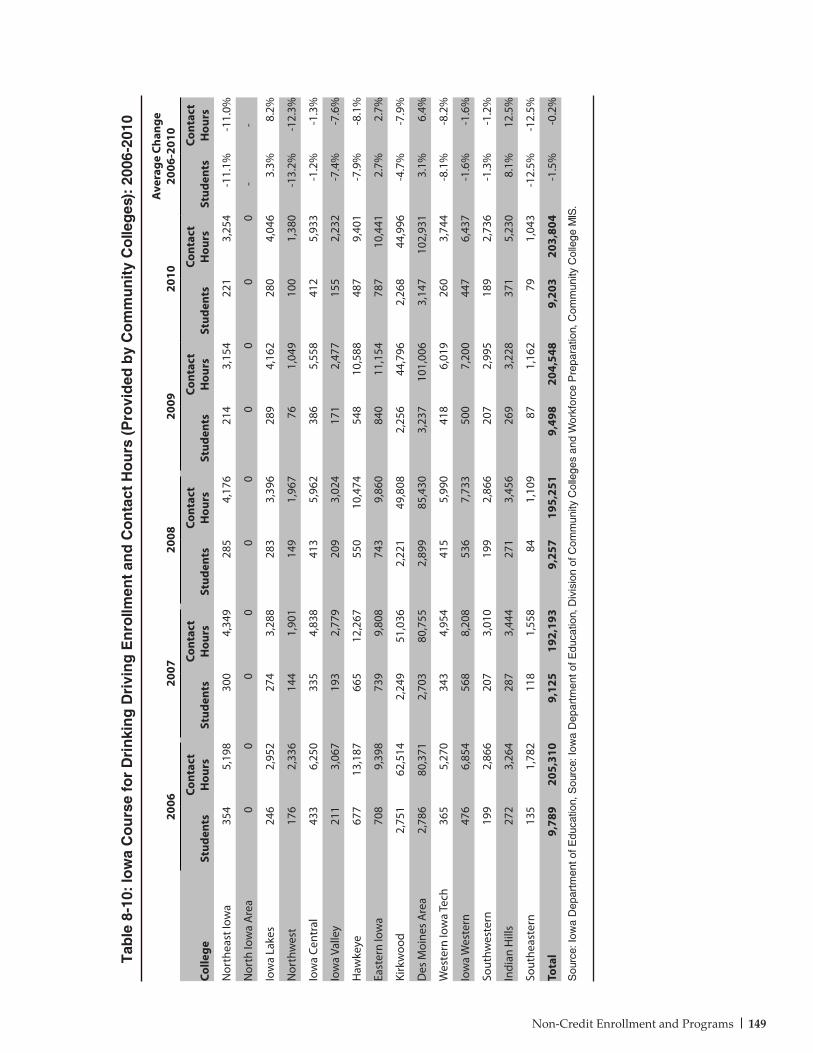
149Non-Credit Enrollment and Programs
Tab
le 8
-10:
Iow
a C
ou
rse
for
Dri
nki
ng
Dri
vin
g E
nro
llmen
t an
d C
on
tact
Ho
urs
(P
rovi
ded
by
Co
mm
un
ity
Co
lleg
es):
200
6-20
10
2006
2007
2008
2009
2010
Ave
rage
Cha
nge
2006
-201
0
Colle
geSt
uden
tsCo
ntac
t H
ours
Stud
ents
Cont
act
Hou
rsSt
uden
tsCo
ntac
t H
ours
Stud
ents
Cont
act
Hou
rsSt
uden
tsCo
ntac
t H
ours
Stud
ents
Cont
act
Hou
rs
Nor
thea
st Io
wa
354
5,19
830
04,
349
285
4,17
621
43,
154
221
3,25
4-1
1.1%
-11.
0%
Nor
th Io
wa
Are
a0
00
00
00
00
0-
-
Iow
a La
kes
246
2,95
227
43,
288
283
3,39
628
94,
162
280
4,04
63.
3%8.
2%
Nor
thw
est
176
2,33
614
41,
901
149
1,96
776
1,04
910
01,
380
-13.
2%-1
2.3%
Iow
a Ce
ntra
l43
36,
250
335
4,83
841
35,
962
386
5,55
841
25,
933
-1.2
%-1
.3%
Iow
a Va
lley
211
3,06
719
32,
779
209
3,02
417
12,
477
155
2,23
2-7
.4%
-7.6
%
Haw
keye
677
13,1
8766
512
,267
550
10,4
7454
810
,588
487
9,40
1-7
.9%
-8.1
%
East
ern
Iow
a70
89,
398
739
9,80
874
39,
860
840
11,1
5478
710
,441
2.7%
2.7%
Kirk
woo
d2,
751
62,5
142,
249
51,0
362,
221
49,8
082,
256
44,7
962,
268
44,9
96-4
.7%
-7.9
%
Des
Moi
nes
Are
a2,
786
80,3
712,
703
80,7
552,
899
85,4
303,
237
101,
006
3,14
710
2,93
13.
1%6.
4%
Wes
tern
Iow
a Te
ch36
55,
270
343
4,95
441
55,
990
418
6,01
926
03,
744
-8.1
%-8
.2%
Iow
a W
este
rn47
66,
854
568
8,20
853
67,
733
500
7,20
044
76,
437
-1.6
%-1
.6%
Sout
hwes
tern
199
2,86
620
73,
010
199
2,86
620
72,
995
189
2,73
6-1
.3%
-1.2
%
Indi
an H
ills
272
3,26
428
73,
444
271
3,45
626
93,
228
371
5,23
08.
1%12
.5%
Sout
heas
tern
135
1,78
211
81,
558
841,
109
871,
162
791,
043
-12.
5%-1
2.5%
Tota
l9,
789
205,
310
9,12
519
2,19
39,
257
195,
251
9,49
820
4,54
89,
203
203,
804
-1.5
%-0
.2%
Sou
rce:
Iow
a D
epar
tmen
t of E
duca
tion,
Sou
rce:
Iow
a D
epar
tmen
t of E
duca
tion,
Div
isio
n of
Com
mun
ity C
olle
ges
and
Wor
kfor
ce P
repa
ratio
n, C
omm
unity
Col
lege
MIS
.
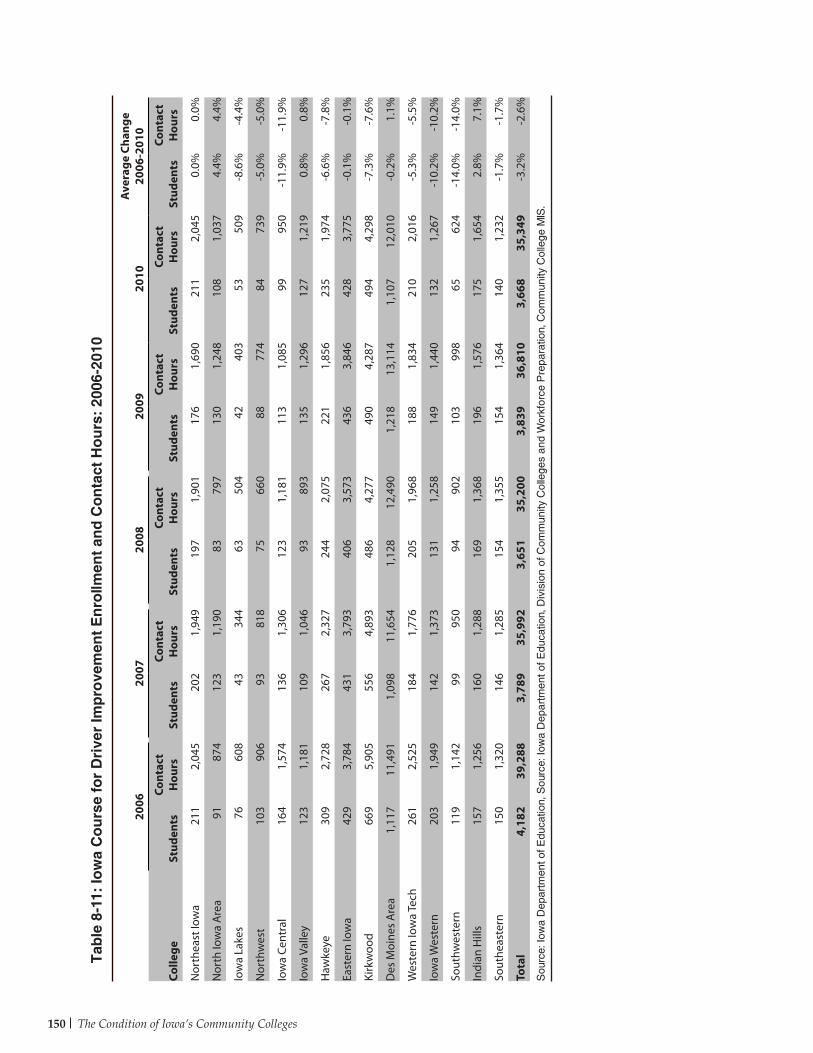
150 The Condition of Iowa’s Community Colleges
Tab
le 8
-11:
Iow
a C
ou
rse
for
Dri
ver
Imp
rove
men
t E
nro
llmen
t an
d C
on
tact
Ho
urs
: 20
06-2
010
2006
2007
2008
2009
2010
Ave
rage
Cha
nge
2006
-201
0
Colle
geSt
uden
tsCo
ntac
t H
ours
Stud
ents
Cont
act
Hou
rsSt
uden
tsCo
ntac
t H
ours
Stud
ents
Cont
act
Hou
rsSt
uden
tsCo
ntac
t H
ours
Stud
ents
Cont
act
Hou
rs
Nor
thea
st Io
wa
211
2,04
520
21,
949
197
1,90
117
61,
690
211
2,04
50.
0%0.
0%
Nor
th Io
wa
Are
a91
874
123
1,19
083
797
130
1,24
810
81,
037
4.4%
4.4%
Iow
a La
kes
7660
843
344
6350
442
403
5350
9-8
.6%
-4.4
%
Nor
thw
est
103
906
9381
875
660
8877
484
739
-5.0
%-5
.0%
Iow
a Ce
ntra
l16
41,
574
136
1,30
612
31,
181
113
1,08
599
950
-11.
9%-1
1.9%
Iow
a Va
lley
123
1,18
110
91,
046
9389
313
51,
296
127
1,21
90.
8%0.
8%
Haw
keye
309
2,72
826
72,
327
244
2,07
522
11,
856
235
1,97
4-6
.6%
-7.8
%
East
ern
Iow
a42
93,
784
431
3,79
340
63,
573
436
3,84
642
83,
775
-0.1
%-0
.1%
Kirk
woo
d66
95,
905
556
4,89
348
64,
277
490
4,28
749
44,
298
-7.3
%-7
.6%
Des
Moi
nes
Are
a1,
117
11,4
911,
098
11,6
541,
128
12,4
901,
218
13,1
141,
107
12,0
10-0
.2%
1.1%
Wes
tern
Iow
a Te
ch26
12,
525
184
1,77
620
51,
968
188
1,83
421
02,
016
-5.3
%-5
.5%
Iow
a W
este
rn20
31,
949
142
1,37
313
11,
258
149
1,44
013
21,
267
-10.
2%-1
0.2%
Sout
hwes
tern
119
1,14
299
950
9490
210
399
865
624
-14.
0%-1
4.0%
Indi
an H
ills
157
1,25
616
01,
288
169
1,36
819
61,
576
175
1,65
42.
8%7.
1%
Sout
heas
tern
150
1,32
014
61,
285
154
1,35
515
41,
364
140
1,23
2-1
.7%
-1.7
%
Tota
l4,
182
39,2
883,
789
35,9
923,
651
35,2
003,
839
36,8
103,
668
35,3
49-3
.2%
-2.6
%
Sou
rce:
Iow
a D
epar
tmen
t of E
duca
tion,
Sou
rce:
Iow
a D
epar
tmen
t of E
duca
tion,
Div
isio
n of
Com
mun
ity C
olle
ges
and
Wor
kfor
ce P
repa
ratio
n, C
omm
unity
Col
lege
MIS
.
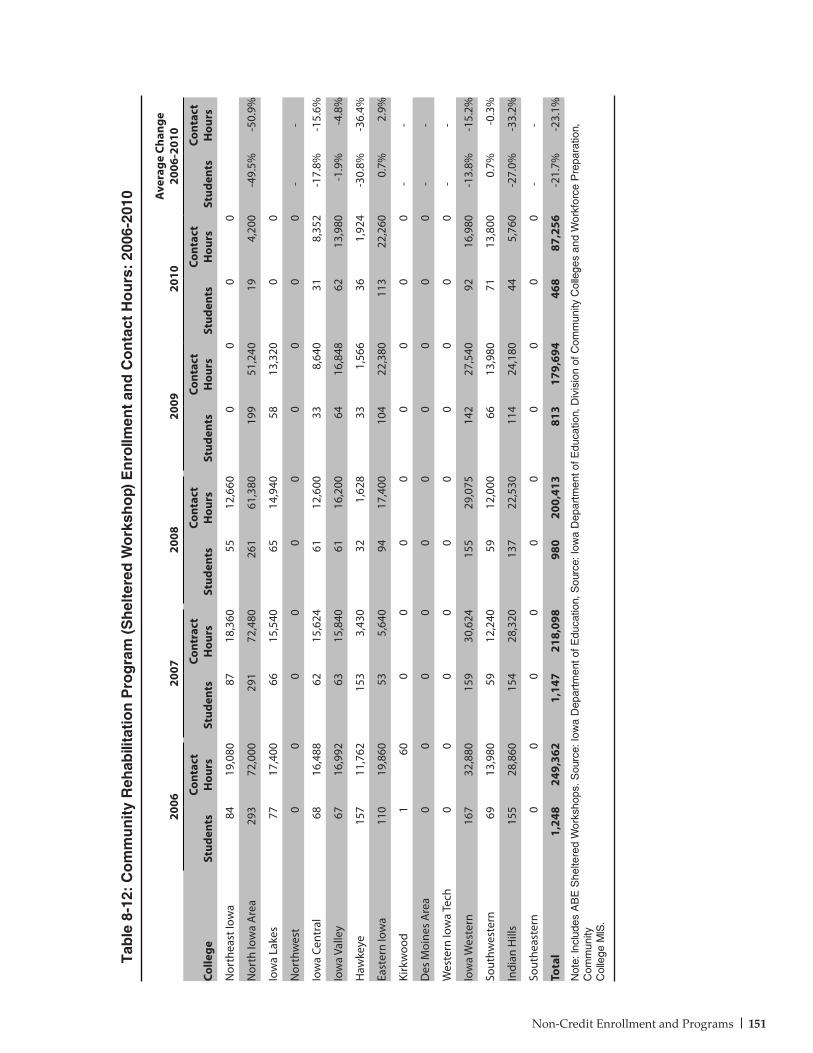
151Non-Credit Enrollment and Programs
Tab
le 8
-12:
Co
mm
un
ity
Reh
abili
tati
on
Pro
gra
m (
Sh
elte
red
Wo
rksh
op)
En
rollm
ent
and
Co
nta
ct H
ou
rs:
2006
-201
0
2006
2007
2008
2009
2010
Ave
rage
Cha
nge
2006
-201
0
Colle
geSt
uden
tsCo
ntac
t H
ours
Stud
ents
Cont
ract
H
ours
Stud
ents
Cont
act
Hou
rsSt
uden
tsCo
ntac
t H
ours
Stud
ents
Cont
act
Hou
rsSt
uden
tsCo
ntac
t H
ours
Nor
thea
st Io
wa
8419
,080
8718
,360
5512
,660
00
00
Nor
th Io
wa
Are
a29
372
,000
291
72,4
8026
161
,380
199
51,2
4019
4,20
0-4
9.5%
-50.
9%
Iow
a La
kes
7717
,400
6615
,540
6514
,940
5813
,320
00
Nor
thw
est
00
00
00
00
00
--
Iow
a Ce
ntra
l68
16,4
8862
15,6
2461
12,6
0033
8,64
031
8,35
2-1
7.8%
-15.
6%
Iow
a Va
lley
6716
,992
6315
,840
6116
,200
6416
,848
6213
,980
-1.9
%-4
.8%
Haw
keye
157
11,7
6215
33,
430
321,
628
331,
566
361,
924
-30.
8%-3
6.4%
East
ern
Iow
a11
019
,860
535,
640
9417
,400
104
22,3
8011
322
,260
0.7%
2.9%
Kirk
woo
d1
600
00
00
00
0-
-
Des
Moi
nes
Are
a0
00
00
00
00
0-
-
Wes
tern
Iow
a Te
ch0
00
00
00
00
0-
-
Iow
a W
este
rn16
732
,880
159
30,6
2415
529
,075
142
27,5
4092
16,9
80-1
3.8%
-15.
2%
Sout
hwes
tern
6913
,980
5912
,240
5912
,000
6613
,980
7113
,800
0.7%
-0.3
%
Indi
an H
ills
155
28,8
6015
428
,320
137
22,5
3011
424
,180
445,
760
-27.
0%-3
3.2%
Sout
heas
tern
00
00
00
00
00
--
Tota
l1,
248
249,
362
1,14
721
8,09
898
020
0,41
381
317
9,69
446
887
,256
-21.
7%-2
3.1%
Not
e: In
clud
es A
BE
She
ltere
d W
orks
hops
. Sou
rce:
Iow
a D
epar
tmen
t of E
duca
tion,
Sou
rce:
Iow
a D
epar
tmen
t of E
duca
tion,
Div
isio
n of
Com
mun
ity C
olle
ges
and
Wor
kfor
ce P
repa
ratio
n,
Com
mun
ity
Col
lege
MIS
.
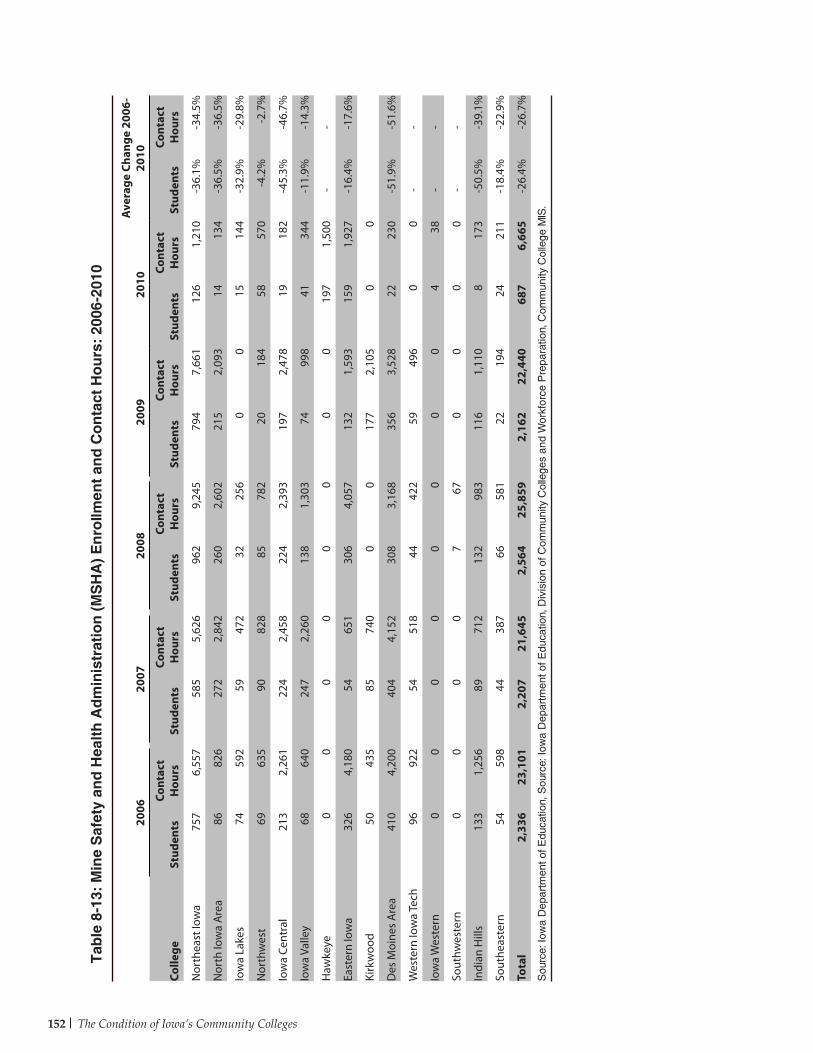
152 The Condition of Iowa’s Community Colleges
2006
2007
2008
2009
2010
Ave
rage
Cha
nge
2006
-20
10
Colle
geSt
uden
tsCo
ntac
t H
ours
Stud
ents
Cont
act
Hou
rsSt
uden
tsCo
ntac
t H
ours
Stud
ents
Cont
act
Hou
rsSt
uden
tsCo
ntac
t H
ours
Stud
ents
Cont
act
Hou
rs
Nor
thea
st Io
wa
757
6,55
758
55,
626
962
9,24
579
47,
661
126
1,21
0-3
6.1%
-34.
5%
Nor
th Io
wa
Are
a86
826
272
2,84
226
02,
602
215
2,09
314
134
-36.
5%-3
6.5%
Iow
a La
kes
7459
259
472
3225
60
015
144
-32.
9%-2
9.8%
Nor
thw
est
6963
590
828
8578
220
184
5857
0-4
.2%
-2.7
%
Iow
a Ce
ntra
l21
32,
261
224
2,45
822
42,
393
197
2,47
819
182
-45.
3%-4
6.7%
Iow
a Va
lley
6864
024
72,
260
138
1,30
374
998
4134
4-1
1.9%
-14.
3%
Haw
keye
00
00
00
00
197
1,50
0-
-
East
ern
Iow
a32
64,
180
5465
130
64,
057
132
1,59
315
91,
927
-16.
4%-1
7.6%
Kirk
woo
d50
435
8574
00
017
72,
105
00
Des
Moi
nes
Are
a41
04,
200
404
4,15
230
83,
168
356
3,52
822
230
-51.
9%-5
1.6%
Wes
tern
Iow
a Te
ch96
922
5451
844
422
5949
60
0-
-
Iow
a W
este
rn0
00
00
00
04
38-
-
Sout
hwes
tern
00
00
767
00
00
--
Indi
an H
ills
133
1,25
689
712
132
983
116
1,11
08
173
-50.
5%-3
9.1%
Sout
heas
tern
5459
844
387
6658
122
194
2421
1-1
8.4%
-22.
9%
Tota
l2,
336
23,1
012,
207
21,6
452,
564
25,8
592,
162
22,4
4068
76,
665
-26.
4%-2
6.7%
Sou
rce:
Iow
a D
epar
tmen
t of E
duca
tion,
Sou
rce:
Iow
a D
epar
tmen
t of E
duca
tion,
Div
isio
n of
Com
mun
ity C
olle
ges
and
Wor
kfor
ce P
repa
ratio
n, C
omm
unity
Col
lege
MIS
.
Tab
le 8
-13:
Min
e S
afet
y an
d H
ealt
h A
dm
inis
trat
ion
(M
SH
A)
En
rollm
ent
and
Co
nta
ct H
ou
rs:
2006
-201
0
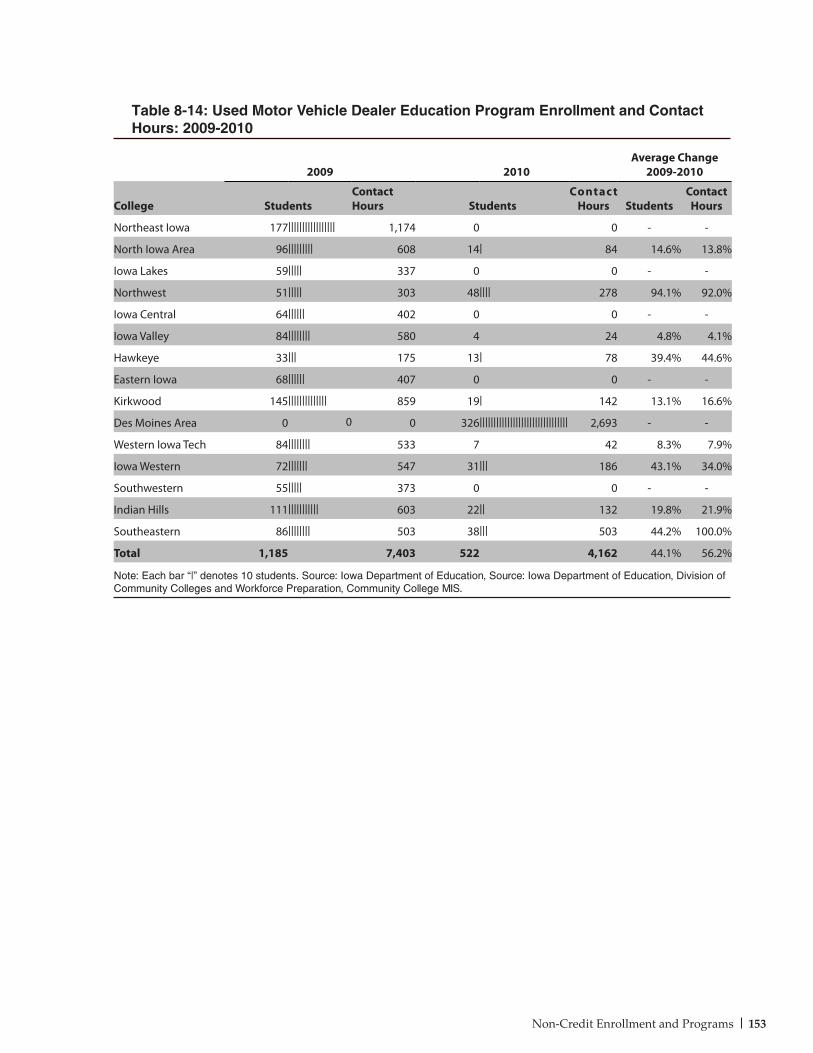
153Non-Credit Enrollment and Programs
2009 2010Average Change
2009-2010
College StudentsContact Hours Students
Contac t Hours Students
Contact Hours
Northeast Iowa 177||||||||||||||||| 1,174 0 0 - -
North Iowa Area 96||||||||| 608 14| 84 14.6% 13.8%
Iowa Lakes 59||||| 337 0 0 - -
Northwest 51||||| 303 48|||| 278 94.1% 92.0%
Iowa Central 64|||||| 402 0 0 - -
Iowa Valley 84|||||||| 580 4 24 4.8% 4.1%
Hawkeye 33||| 175 13| 78 39.4% 44.6%
Eastern Iowa 68|||||| 407 0 0 - -
Kirkwood 145|||||||||||||| 859 19| 142 13.1% 16.6%
Des Moines Area 0 0 0 326|||||||||||||||||||||||||||||||| 2,693 - -
Western Iowa Tech 84|||||||| 533 7 42 8.3% 7.9%
Iowa Western 72||||||| 547 31||| 186 43.1% 34.0%
Southwestern 55||||| 373 0 0 - -
Indian Hills 111||||||||||| 603 22|| 132 19.8% 21.9%
Southeastern 86|||||||| 503 38||| 503 44.2% 100.0%
Total 1,185 7,403 522 4,162 44.1% 56.2%
Note: Each bar “|” denotes 10 students. Source: Iowa Department of Education, Source: Iowa Department of Education, Division of Community Colleges and Workforce Preparation, Community College MIS.
Table 8-14: Used Motor Vehicle Dealer Education Program Enrollment and Contact Hours: 2009-2010
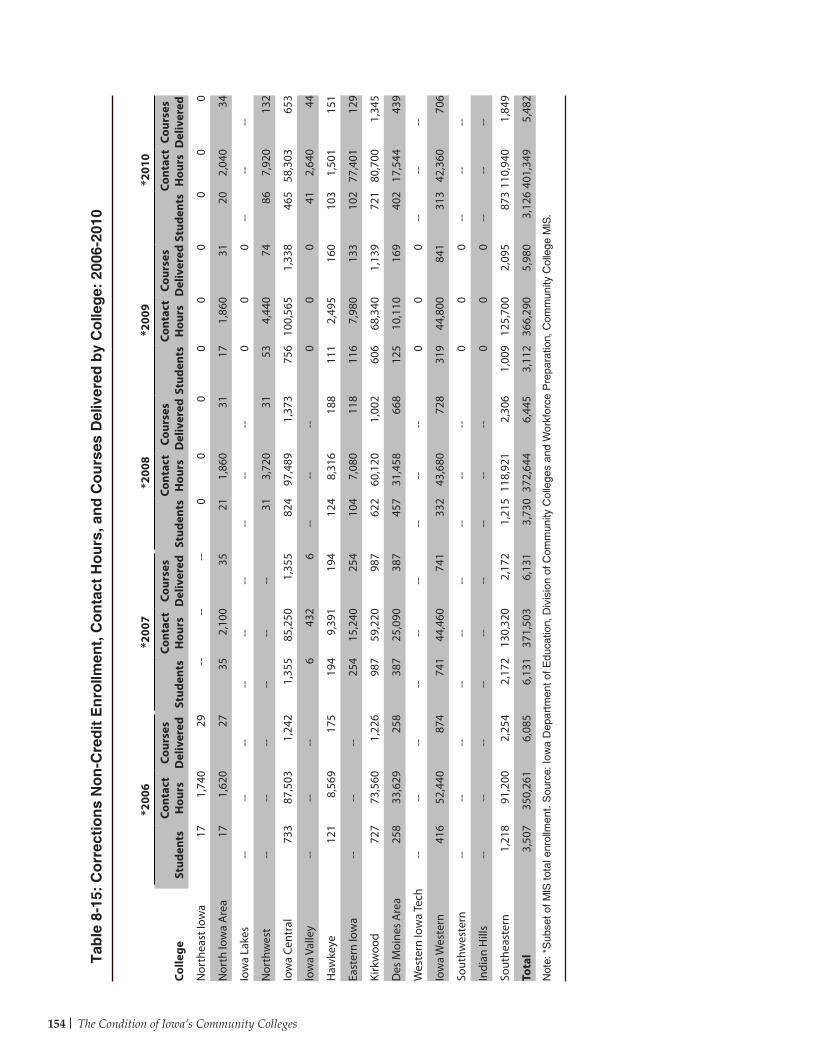
154 The Condition of Iowa’s Community Colleges
Colle
ge
*200
6*2
007
*200
8*2
009
*201
0
Stud
ents
Cont
act
Hou
rsCo
urse
s D
eliv
ered
Stud
ents
Cont
act
Hou
rsCo
urse
s D
eliv
ered
Stud
ents
Cont
act
Hou
rsCo
urse
s D
eliv
ered
Stud
ents
Cont
act
Hou
rsCo
urse
s D
eliv
ered
Stud
ents
Cont
act
Hou
rsCo
urse
s D
eliv
ered
Nor
thea
st Io
wa
171,
740
29--
----
00
00
00
00
0
Nor
th Io
wa
Are
a17
1,62
027
352,
100
3521
1,86
031
171,
860
3120
2,04
034
Iow
a La
kes
----
----
----
----
--0
00
----
--
Nor
thw
est
----
----
----
313,
720
3153
4,44
074
867,
920
132
Iow
a Ce
ntra
l73
387
,503
1,24
21,
355
85,2
501,
355
824
97,4
891,
373
756
100,
565
1,33
846
558
,303
653
Iow
a Va
lley
----
--6
432
6--
----
00
041
2,64
044
Haw
keye
121
8,56
917
519
49,
391
194
124
8,31
618
811
12,
495
160
103
1,50
115
1
East
ern
Iow
a--
----
254
15,2
4025
410
47,
080
118
116
7,98
013
310
277
,401
129
Kirk
woo
d72
773
,560
1,22
698
759
,220
987
622
60,1
201,
002
606
68,3
401,
139
721
80,7
001,
345
Des
Moi
nes
Are
a25
833
,629
258
387
25,0
9038
745
731
,458
668
125
10,1
1016
940
217
,544
439
Wes
tern
Iow
a Te
ch--
----
----
----
----
00
0--
----
Iow
a W
este
rn41
652
,440
874
741
44,4
6074
133
243
,680
728
319
44,8
0084
131
342
,360
706
Sout
hwes
tern
----
----
----
----
--0
00
----
--
Indi
an H
ills
----
----
----
----
--0
00
----
--
Sout
heas
tern
1,21
891
,200
2,25
42,
172
130,
320
2,17
21,
215
118,
921
2,30
61,
009
125,
700
2,09
587
311
0,94
01,
849
Tota
l3,
507
350,
261
6,08
56,
131
371,
503
6,13
13,
730
372,
644
6,44
53,
112
366,
290
5,98
03,
126
401,
349
5,48
2
Not
e: *
Sub
set o
f MIS
tota
l enr
ollm
ent.
Sou
rce:
Iow
a D
epar
tmen
t of E
duca
tion,
Div
isio
n of
Com
mun
ity C
olle
ges
and
Wor
kfor
ce P
repa
ratio
n, C
omm
unity
Col
lege
MIS
.
Tab
le 8
-15:
Co
rrec
tio
ns
No
n-C
red
it E
nro
llmen
t, C
on
tact
Ho
urs
, an
d C
ou
rses
Del
iver
ed b
y C
olle
ge:
200
6-20
10
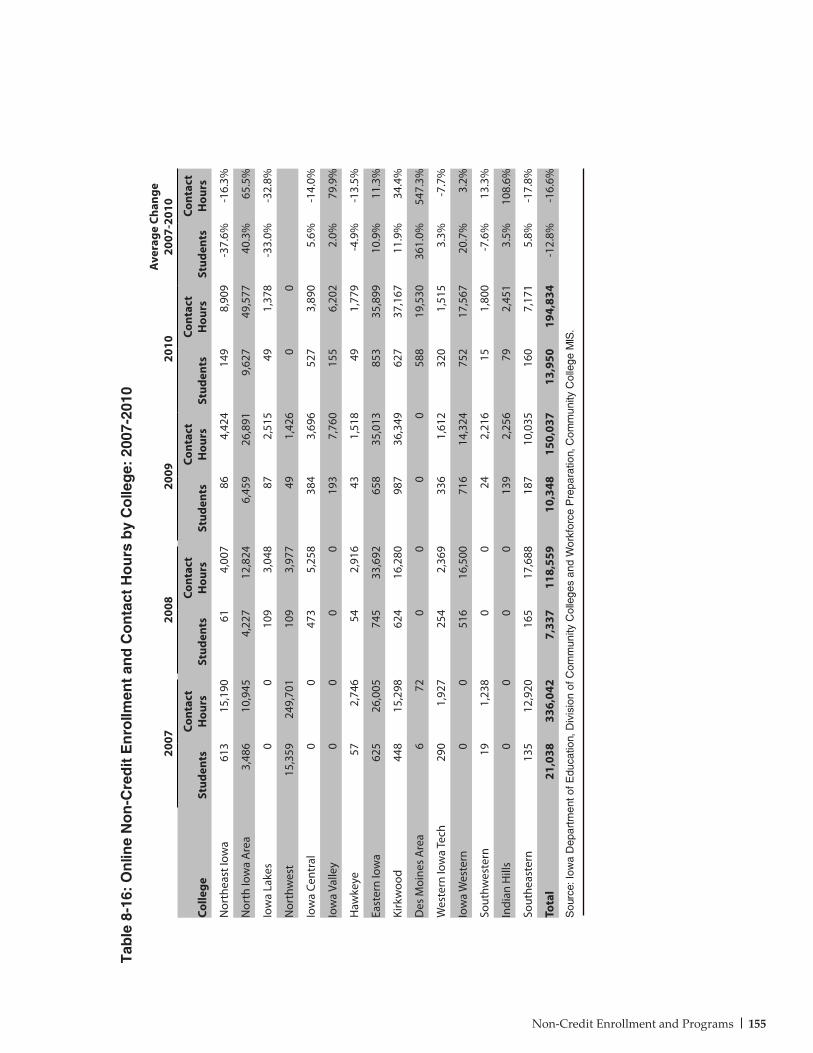
155Non-Credit Enrollment and Programs
2007
2008
2009
2010
Ave
rage
Cha
nge
2007
-201
0
Colle
geSt
uden
tsCo
ntac
t H
ours
Stud
ents
Cont
act
Hou
rsSt
uden
tsCo
ntac
t H
ours
Stud
ents
Cont
act
Hou
rsSt
uden
tsCo
ntac
t H
ours
Nor
thea
st Io
wa
613
15,1
9061
4,00
786
4,42
414
98,
909
-37.
6%-1
6.3%
Nor
th Io
wa
Are
a3,
486
10,9
454,
227
12,8
246,
459
26,8
919,
627
49,5
7740
.3%
65.5
%
Iow
a La
kes
00
109
3,04
887
2,51
549
1,37
8-3
3.0%
-32.
8%
Nor
thw
est
15,3
5924
9,70
110
93,
977
491,
426
00
Iow
a Ce
ntra
l0
047
35,
258
384
3,69
652
73,
890
5.6%
-14.
0%
Iow
a Va
lley
00
00
193
7,76
015
56,
202
2.0%
79.9
%
Haw
keye
572,
746
542,
916
431,
518
491,
779
-4.9
%-1
3.5%
East
ern
Iow
a62
526
,005
745
33,6
9265
835
,013
853
35,8
9910
.9%
11.3
%
Kirk
woo
d44
815
,298
624
16,2
8098
736
,349
627
37,1
6711
.9%
34.4
%
Des
Moi
nes
Are
a6
720
00
058
819
,530
361.
0%54
7.3%
Wes
tern
Iow
a Te
ch29
01,
927
254
2,36
933
61,
612
320
1,51
53.
3%-7
.7%
Iow
a W
este
rn0
051
616
,500
716
14,3
2475
217
,567
20.7
%3.
2%
Sout
hwes
tern
191,
238
00
242,
216
151,
800
-7.6
%13
.3%
Indi
an H
ills
00
00
139
2,25
679
2,45
13.
5%10
8.6%
Sout
heas
tern
135
12,9
2016
517
,688
187
10,0
3516
07,
171
5.8%
-17.
8%
Tota
l21
,038
336,
042
7,33
711
8,55
910
,348
150,
037
13,9
5019
4,83
4-1
2.8%
-16.
6%
Sou
rce:
Iow
a D
epar
tmen
t of E
duca
tion,
Div
isio
n of
Com
mun
ity C
olle
ges
and
Wor
kfor
ce P
repa
ratio
n, C
omm
unity
Col
lege
MIS
.
Tab
le 8
-16:
On
line
No
n-C
red
it E
nro
llmen
t an
d C
on
tact
Ho
urs
by
Co
lleg
e: 2
007-
2010

156 The Condition of Iowa’s Community Colleges
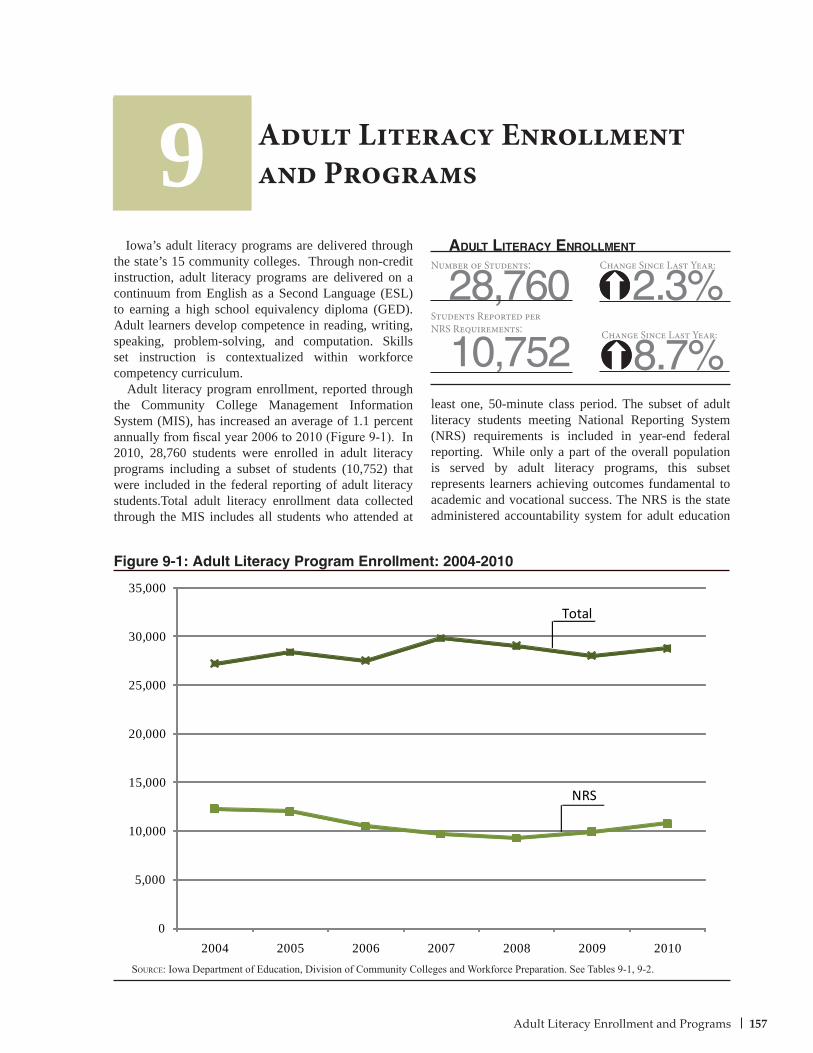
157Adult Literacy Enrollment and Programs
Iowa’s adult literacy programs are delivered through the state’s 15 community colleges. Through non-credit instruction, adult literacy programs are delivered on a continuum from English as a Second Language (ESL) to earning a high school equivalency diploma (GED). Adult learners develop competence in reading, writing, speaking, problem-solving, and computation. Skills set instruction is contextualized within workforce competency curriculum. Adult literacy program enrollment, reported through the Community College Management Information System (MIS), has increased an average of 1.1 percent annually from fiscal year 2006 to 2010 (Figure 9-1). In 2010, 28,760 students were enrolled in adult literacy programs including a subset of students (10,752) that were included in the federal reporting of adult literacy students.Total adult literacy enrollment data collected through the MIS includes all students who attended at
least one, 50-minute class period. The subset of adult literacy students meeting National Reporting System (NRS) requirements is included in year-end federal reporting. While only a part of the overall population is served by adult literacy programs, this subset represents learners achieving outcomes fundamental to academic and vocational success. The NRS is the state administered accountability system for adult education
Adult Literacy Enrollment and Programs9
10,752 8.7%
aDult literacY enrollment
Figure 9-1: Adult Literacy Program Enrollment: 2004-2010
Source: Iowa Department of Education, Division of Community Colleges and Workforce Preparation. See Tables 9-1, 9-2.
28,760 2.3%Number of Students: Change Since Last Year:
Students Reported per NRS Requirements: Change Since Last Year:
0
5,000
10,000
15,000
20,000
25,000
30,000
35,000
2004 2005 2006 2007 2008 2009 2010
Total
NRS
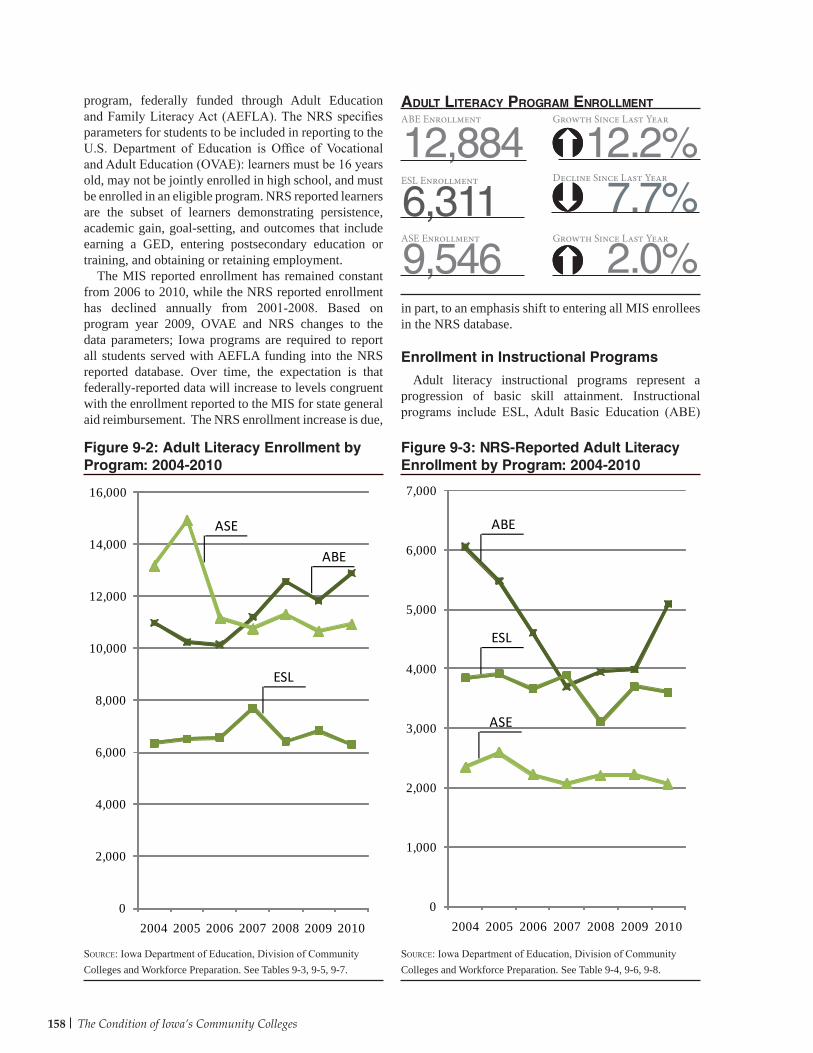
158 The Condition of Iowa’s Community Colleges
Source: Iowa Department of Education, Division of Community Colleges and Workforce Preparation. See Tables 9-3, 9-5, 9-7.
Figure 9-2: Adult Literacy Enrollment by Program: 2004-2010
program, federally funded through Adult Education and Family Literacy Act (AEFLA). The NRS specifies parameters for students to be included in reporting to the U.S. Department of Education is Office of Vocational and Adult Education (OVAE): learners must be 16 years old, may not be jointly enrolled in high school, and must be enrolled in an eligible program. NRS reported learners are the subset of learners demonstrating persistence, academic gain, goal-setting, and outcomes that include earning a GED, entering postsecondary education or training, and obtaining or retaining employment. The MIS reported enrollment has remained constant from 2006 to 2010, while the NRS reported enrollment has declined annually from 2001-2008. Based on program year 2009, OVAE and NRS changes to the data parameters; Iowa programs are required to report all students served with AEFLA funding into the NRS reported database. Over time, the expectation is that federally-reported data will increase to levels congruent with the enrollment reported to the MIS for state general aid reimbursement. The NRS enrollment increase is due,
in part, to an emphasis shift to entering all MIS enrollees in the NRS database.
Enrollment in Instructional Programs
Adult literacy instructional programs represent a progression of basic skill attainment. Instructional programs include ESL, Adult Basic Education (ABE)
Figure 9-3: NRS-Reported Adult Literacy Enrollment by Program: 2004-2010
Source: Iowa Department of Education, Division of Community Colleges and Workforce Preparation. See Table 9-4, 9-6, 9-8.
aDult literacY Program enrollment
12,884 12.2%6,311ESL Enrollment
7.7%9,546 2.0%
ABE Enrollment Growth Since Last Year
Decline Since Last Year
Growth Since Last YearASE Enrollment
0
1,000
2,000
3,000
4,000
5,000
6,000
7,000
2004 2005 2006 2007 2008 2009 2010
ESL
ASE
ABE
0
2,000
4,000
6,000
8,000
10,000
12,000
14,000
16,000
2004 2005 2006 2007 2008 2009 2010
ASE
ABE
ESL
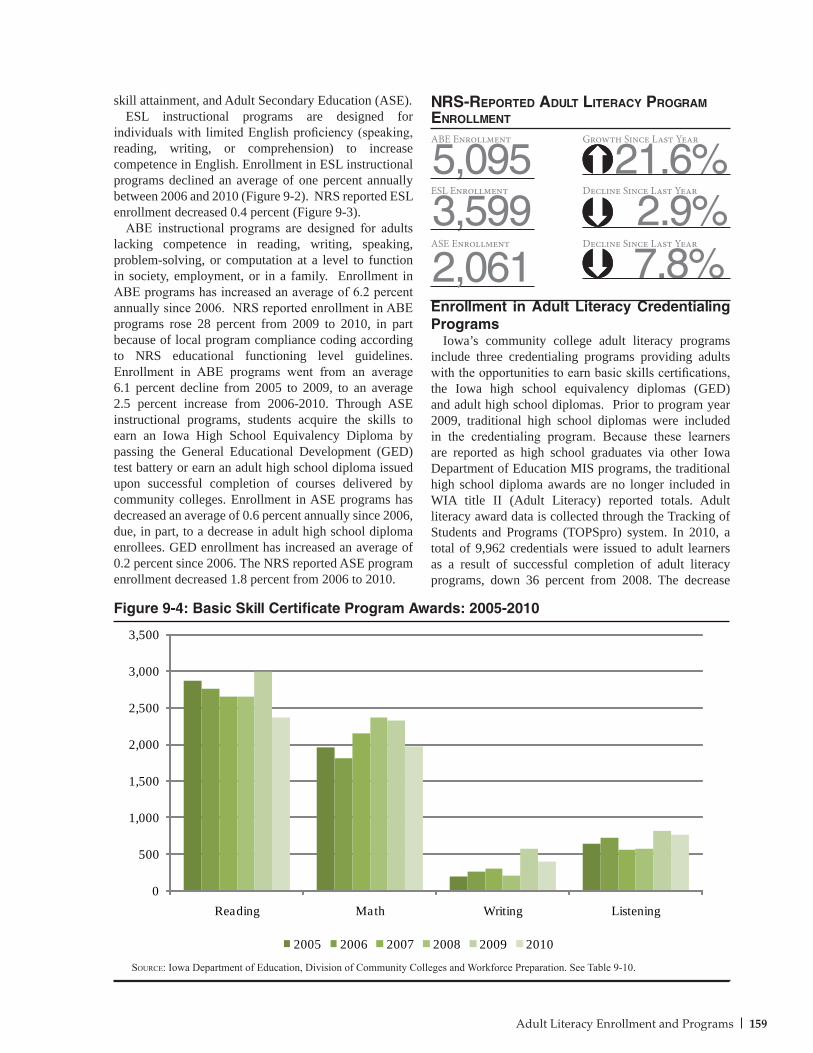
159Adult Literacy Enrollment and Programs
5,095 21.6%
nrs-rePorteD aDult literacY Program enrollment
3,599ESL Enrollment
2.9% 7.8%2,061
Figure 9-4: Basic Skill Certificate Program Awards: 2005-2010
skill attainment, and Adult Secondary Education (ASE).ESL instructional programs are designed for
individuals with limited English proficiency (speaking, reading, writing, or comprehension) to increase competence in English. Enrollment in ESL instructional programs declined an average of one percent annually between 2006 and 2010 (Figure 9-2). NRS reported ESL enrollment decreased 0.4 percent (Figure 9-3).
ABE instructional programs are designed for adults lacking competence in reading, writing, speaking, problem-solving, or computation at a level to function in society, employment, or in a family. Enrollment in ABE programs has increased an average of 6.2 percent annually since 2006. NRS reported enrollment in ABE programs rose 28 percent from 2009 to 2010, in part because of local program compliance coding according to NRS educational functioning level guidelines. Enrollment in ABE programs went from an average 6.1 percent decline from 2005 to 2009, to an average 2.5 percent increase from 2006-2010. Through ASE instructional programs, students acquire the skills to earn an Iowa High School Equivalency Diploma by passing the General Educational Development (GED) test battery or earn an adult high school diploma issued upon successful completion of courses delivered by community colleges. Enrollment in ASE programs has decreased an average of 0.6 percent annually since 2006, due, in part, to a decrease in adult high school diploma enrollees. GED enrollment has increased an average of 0.2 percent since 2006. The NRS reported ASE program enrollment decreased 1.8 percent from 2006 to 2010.
Enrollment in Adult Literacy Credentialing Programs
Iowa’s community college adult literacy programs include three credentialing programs providing adults with the opportunities to earn basic skills certifications, the Iowa high school equivalency diplomas (GED) and adult high school diplomas. Prior to program year 2009, traditional high school diplomas were included in the credentialing program. Because these learners are reported as high school graduates via other Iowa Department of Education MIS programs, the traditional high school diploma awards are no longer included in WIA title II (Adult Literacy) reported totals. Adult literacy award data is collected through the Tracking of Students and Programs (TOPSpro) system. In 2010, a total of 9,962 credentials were issued to adult learners as a result of successful completion of adult literacy programs, down 36 percent from 2008. The decrease
Source: Iowa Department of Education, Division of Community Colleges and Workforce Preparation. See Table 9-10.
0
500
1,000
1,500
2,000
2,500
3,000
3,500
Reading Math Writing Listening
2005 2006 2007 2008 2009 2010
ABE Enrollment Growth Since Last Year
Decline Since Last Year
ASE Enrollment Decline Since Last Year
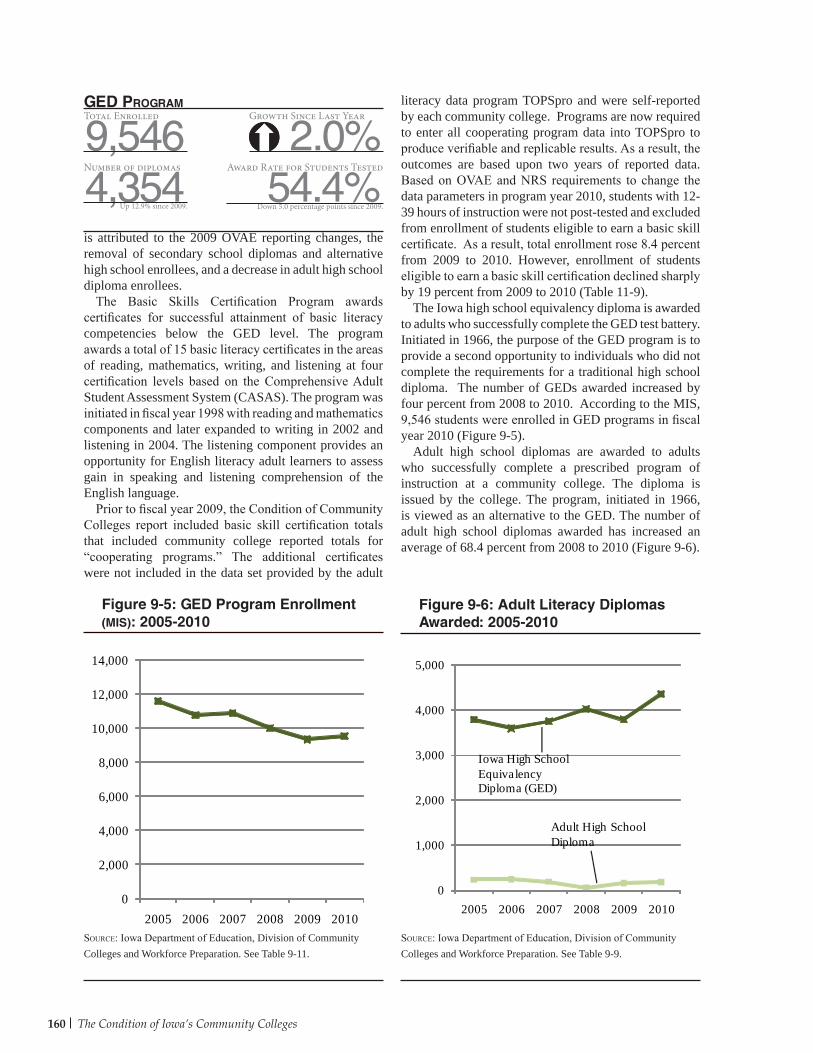
160 The Condition of Iowa’s Community Colleges
geD Program
9,546 2.0%4,354Number of diplomas
54.4%Up 12.9% since 2009. Down 5.0 percentage points since 2009.
is attributed to the 2009 OVAE reporting changes, the removal of secondary school diplomas and alternative high school enrollees, and a decrease in adult high school diploma enrollees.
The Basic Skills Certification Program awards certificates for successful attainment of basic literacy competencies below the GED level. The program awards a total of 15 basic literacy certificates in the areas of reading, mathematics, writing, and listening at four certification levels based on the Comprehensive Adult Student Assessment System (CASAS). The program was initiated in fiscal year 1998 with reading and mathematics components and later expanded to writing in 2002 and listening in 2004. The listening component provides an opportunity for English literacy adult learners to assess gain in speaking and listening comprehension of the English language.
Prior to fiscal year 2009, the Condition of Community Colleges report included basic skill certification totals that included community college reported totals for “cooperating programs.” The additional certificates were not included in the data set provided by the adult
literacy data program TOPSpro and were self-reported by each community college. Programs are now required to enter all cooperating program data into TOPSpro to produce verifiable and replicable results. As a result, the outcomes are based upon two years of reported data. Based on OVAE and NRS requirements to change the data parameters in program year 2010, students with 12-39 hours of instruction were not post-tested and excluded from enrollment of students eligible to earn a basic skill certificate. As a result, total enrollment rose 8.4 percent from 2009 to 2010. However, enrollment of students eligible to earn a basic skill certification declined sharply by 19 percent from 2009 to 2010 (Table 11-9).
The Iowa high school equivalency diploma is awarded to adults who successfully complete the GED test battery. Initiated in 1966, the purpose of the GED program is to provide a second opportunity to individuals who did not complete the requirements for a traditional high school diploma. The number of GEDs awarded increased by four percent from 2008 to 2010. According to the MIS, 9,546 students were enrolled in GED programs in fiscal year 2010 (Figure 9-5).
Adult high school diplomas are awarded to adults who successfully complete a prescribed program of instruction at a community college. The diploma is issued by the college. The program, initiated in 1966, is viewed as an alternative to the GED. The number of adult high school diplomas awarded has increased an average of 68.4 percent from 2008 to 2010 (Figure 9-6).
Source: Iowa Department of Education, Division of Community Colleges and Workforce Preparation. See Table 9-11.
Figure 9-5: GED Program Enrollment (mis): 2005-2010
Source: Iowa Department of Education, Division of Community Colleges and Workforce Preparation. See Table 9-9.
Figure 9-6: Adult Literacy Diplomas Awarded: 2005-2010
Total Enrolled Growth Since Last Year
Award Rate for Students Tested
0
2,000
4,000
6,000
8,000
10,000
12,000
14,000
2005 2006 2007 2008 2009 2010
0
1,000
2,000
3,000
4,000
5,000
2005 2006 2007 2008 2009 2010
Iowa High School Equivalency Diploma (GED)
Adult High SchoolDiploma
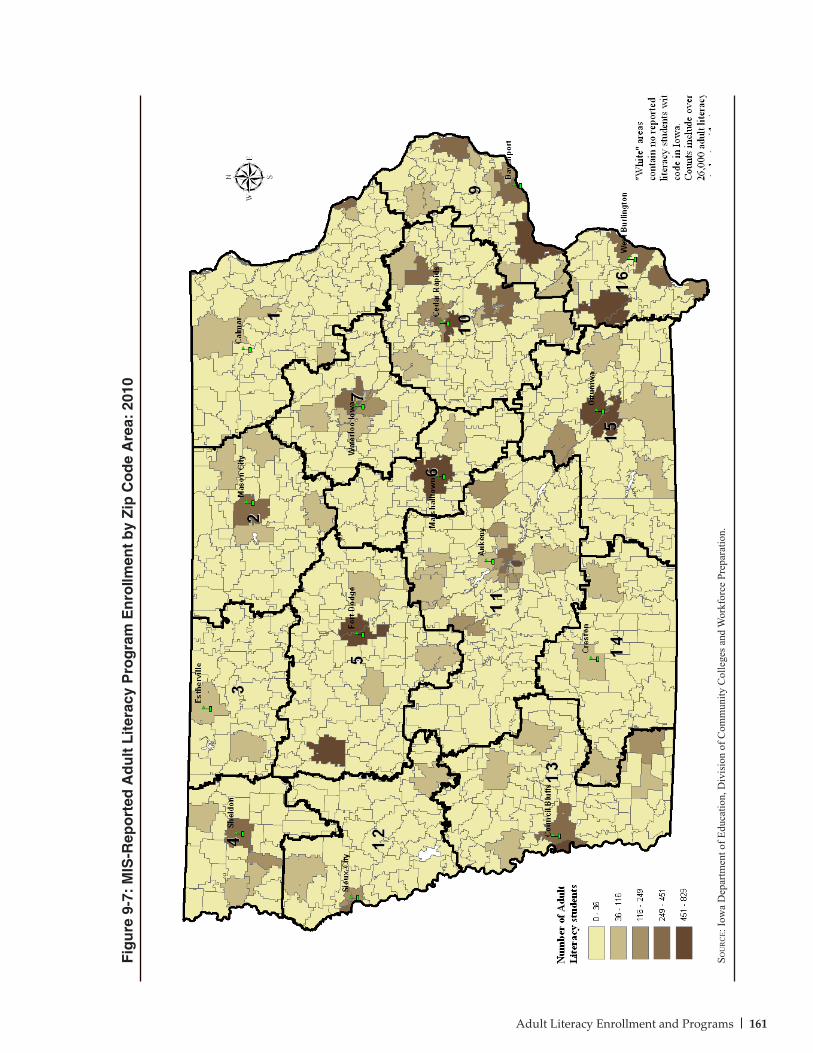
161Adult Literacy Enrollment and Programs
Fig
ure
9-7
: M
IS-R
epo
rted
Ad
ult
Lit
erac
y P
rog
ram
En
rollm
ent
by
Zip
Co
de
Are
a: 2
010
Sou
rc
e: Io
wa
Dep
artm
ent o
f Edu
catio
n, D
ivis
ion
of C
omm
unity
Col
lege
s and
Wor
kfor
ce P
repa
ratio
n.
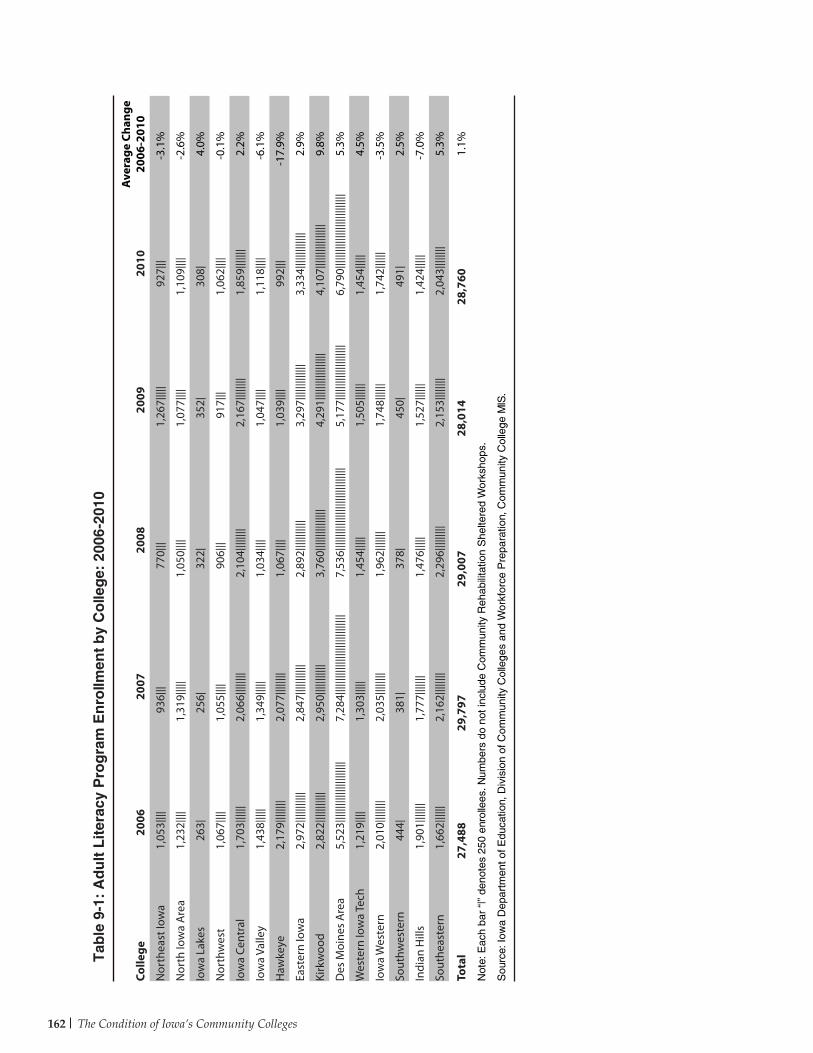
162 The Condition of Iowa’s Community Colleges
Colle
ge20
0620
0720
0820
0920
10A
vera
ge C
hang
e 20
06-2
010
Nor
thea
st Io
wa
1,05
3||||
936|
||77
0|||
1,26
7||||
|92
7|||
-3.1
%
Nor
th Io
wa
Are
a1,
232|
|||1,
319|
||||
1,05
0||||
1,07
7||||
1,10
9||||
-2.6
%
Iow
a La
kes
263|
256|
322|
352|
308|
4.0%
Nor
thw
est
1,06
7||||
1,05
5||||
906|
||91
7|||
1,06
2||||
-0.1
%
Iow
a Ce
ntra
l1,
703|
|||||
2,06
6||||
||||
2,10
4||||
||||
2,16
7||||
||||
1,85
9||||
|||2.
2%
Iow
a Va
lley
1,43
8||||
|1,
349|
||||
1,03
4||||
1,04
7||||
1,11
8||||
-6.1
%
Haw
keye
2,17
9||||
||||
2,07
7||||
||||
1,06
7||||
1,03
9||||
992|
||-1
7.9%
East
ern
Iow
a2,
972|
||||||
||||
2,84
7||||
||||||
|2,
892|
||||||
||||
3,29
7||||
||||||
|||3,
334|
||||||
||||||
2.9%
Kirk
woo
d2,
822|
||||||
||||
2,95
0||||
||||||
|3,
760|
||||||
||||||
||4,
291|
||||||
||||||
||||
4,10
7||||
||||||
||||||
9.8%
Des
Moi
nes
Are
a5,
523|
||||||
||||||
||||||
|||7,
284|
||||||
||||||
||||||
||||||
||||
7,53
6||||
||||||
||||||
||||||
||||||
||5,
177|
||||||
||||||
||||||
|6,
790|
||||||
||||||
||||||
||||||
||5.
3%
Wes
tern
Iow
a Te
ch1,
219|
|||1,
303|
||||
1,45
4||||
|1,
505|
|||||
1,45
4||||
|4.
5%
Iow
a W
este
rn2,
010|
||||||
|2,
035|
||||||
|1,
962|
||||||
1,74
8||||
||1,
742|
|||||
-3.5
%
Sout
hwes
tern
444|
381|
378|
450|
491|
2.5%
Indi
an H
ills
1,90
1||||
|||1,
777|
||||||
1,47
6||||
|1,
527|
|||||
1,42
4||||
|-7
.0%
Sout
heas
tern
1,66
2||||
||2,
162|
||||||
|2,
296|
||||||
||2,
153|
||||||
|2,
043|
||||||
|5.
3%
Tota
l27
,488
29,7
9729
,007
28,0
1428
,760
1.1%
Not
e: E
ach
bar
“|”
deno
tes
250
enro
llees
. Num
bers
do
not i
nclu
de C
omm
unity
Reh
abili
tatio
n S
helte
red
Wor
ksho
ps.
Sou
rce:
Iow
a D
epar
tmen
t of E
duca
tion,
Div
isio
n of
Com
mun
ity C
olle
ges
and
Wor
kfor
ce P
repa
ratio
n, C
omm
unity
Col
lege
MIS
.
Tab
le 9
-1:
Ad
ult
Lit
erac
y P
rog
ram
En
rollm
ent
by
Co
lleg
e: 2
006-
2010
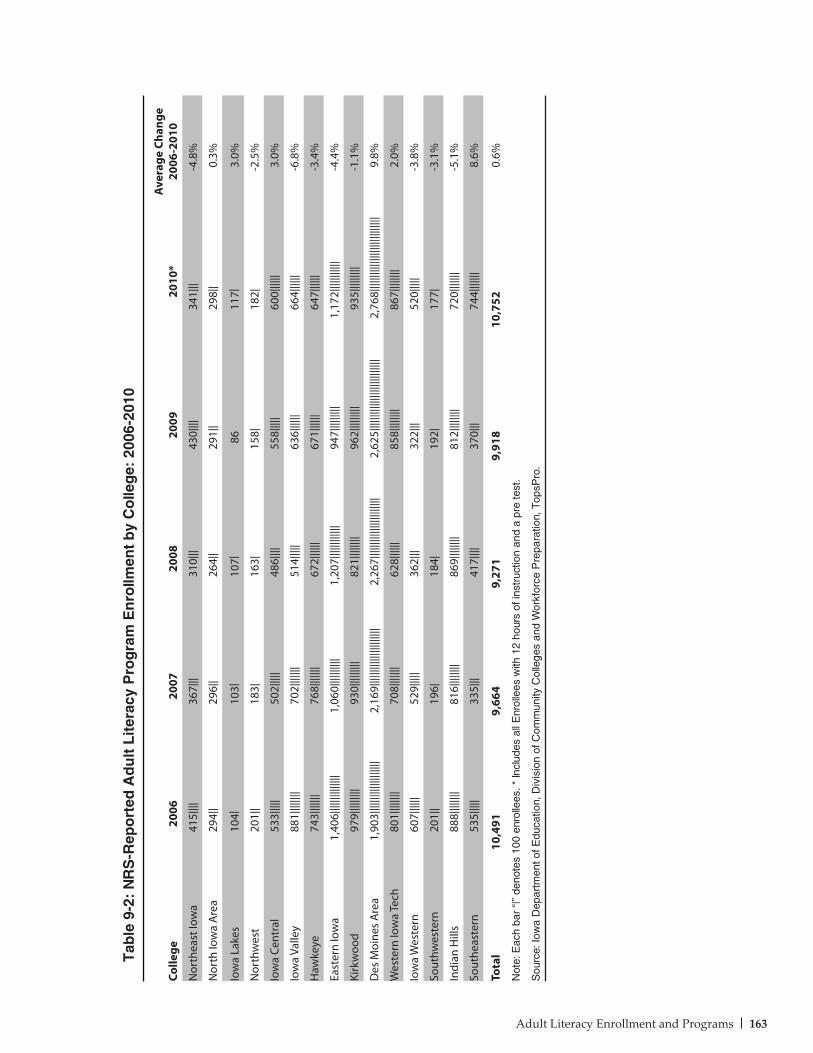
163Adult Literacy Enrollment and Programs
Colle
ge20
0620
0720
0820
0920
10*
Ave
rage
Cha
nge
2006
-201
0
Nor
thea
st Io
wa
415|
|||36
7|||
310|
||43
0||||
341|
||-4
.8%
Nor
th Io
wa
Are
a29
4||
296|
|26
4||
291|
|29
8||
0.3%
Iow
a La
kes
104|
103|
107|
8611
7|3.
0%
Nor
thw
est
201|
|18
3|16
3|15
8|18
2|-2
.5%
Iow
a Ce
ntra
l53
3||||
|50
2||||
|48
6||||
558|
||||
600|
|||||
3.0%
Iow
a Va
lley
881|
||||||
|70
2||||
|||51
4||||
|63
6||||
||66
4||||
||-6
.8%
Haw
keye
743|
||||||
768|
||||||
672|
|||||
671|
|||||
647|
|||||
-3.4
%
East
ern
Iow
a1,
406|
||||||
||||||
|1,
060|
||||||
|||1,
207|
||||||
|||||
947|
||||||
||1,
172|
||||||
||||
-4.4
%
Kirk
woo
d97
9||||
|||||
930|
||||||
||82
1||||
||||
962|
||||||
||93
5||||
|||||
-1.1
%
Des
Moi
nes
Are
a1,
903|
||||||
||||||
||||||
2,16
9||||
||||||
||||||
|||||
2,26
7||||
||||||
||||||
||||||
2,62
5||||
||||||
||||||
||||||
||||
2,76
8||||
||||||
||||||
||||||
|||||
9.8%
Wes
tern
Iow
a Te
ch80
1||||
||||
708|
||||||
628|
|||||
858|
||||||
|86
7||||
||||
2.0%
Iow
a W
este
rn60
7||||
||52
9||||
|36
2|||
322|
||52
0||||
|-3
.8%
Sout
hwes
tern
201|
|19
6|18
4|19
2|17
7|-3
.1%
Indi
an H
ills
888|
||||||
|81
6||||
||||
869|
||||||
|81
2||||
||||
720|
||||||
-5.1
%
Sout
heas
tern
535|
||||
335|
||41
7||||
370|
||74
4||||
|||8.
6%
Tota
l10
,491
9,66
49,
271
9,91
810
,752
0.6%
Not
e: E
ach
bar
“|”
deno
tes
100
enro
llees
. * In
clud
es a
ll E
nrol
lees
with
12
hour
s of
inst
ruct
ion
and
a pr
e te
st.
Sou
rce:
Iow
a D
epar
tmen
t of E
duca
tion,
Div
isio
n of
Com
mun
ity C
olle
ges
and
Wor
kfor
ce P
repa
ratio
n, T
opsP
ro.
Tab
le 9
-2:
NR
S-R
epo
rted
Ad
ult
Lit
erac
y P
rog
ram
En
rollm
ent
by
Co
lleg
e: 2
006-
2010
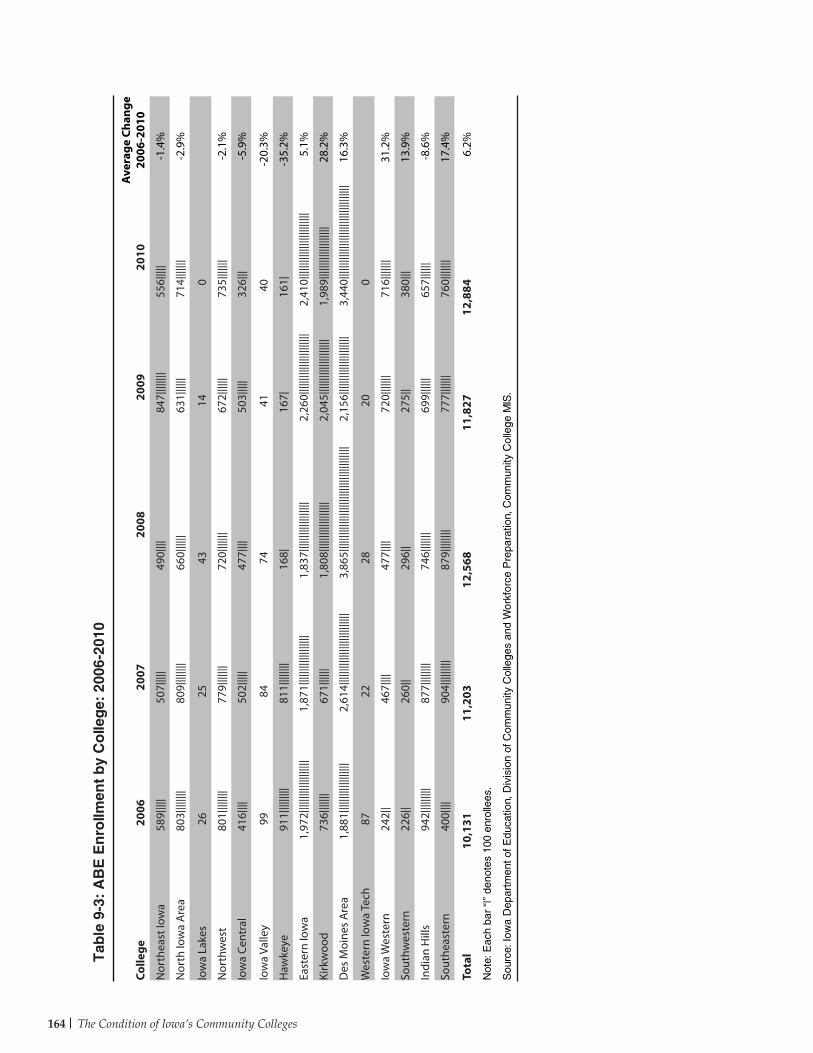
164 The Condition of Iowa’s Community Colleges
Colle
ge20
0620
0720
0820
0920
10A
vera
ge C
hang
e 20
06-2
010
Nor
thea
st Io
wa
589|
||||
507|
||||
490|
|||84
7||||
||||
556|
||||
-1.4
%
Nor
th Io
wa
Are
a80
3||||
||||
809|
||||||
|66
0||||
||63
1||||
||71
4||||
|||-2
.9%
Iow
a La
kes
2625
4314
0
Nor
thw
est
801|
||||||
|77
9||||
|||72
0||||
|||67
2||||
||73
5||||
|||-2
.1%
Iow
a Ce
ntra
l41
6||||
502|
||||
477|
|||50
3||||
|32
6|||
-5.9
%
Iow
a Va
lley
9984
7441
40-2
0.3%
Haw
keye
911|
||||||
||81
1||||
||||
168|
167|
161|
-35.
2%
East
ern
Iow
a1,
972|
||||||
||||||
||||||
1,87
1||||
||||||
||||||
||1,
837|
||||||
||||||
|||||
2,26
0||||
||||||
||||||
||||||
2,41
0||||
||||||
||||||
||||||
||5.
1%
Kirk
woo
d73
6||||
|||67
1||||
||1,
808|
||||||
||||||
|||||
2,04
5||||
||||||
||||||
||||
1,98
9||||
||||||
||||||
|||28
.2%
Des
Moi
nes
Are
a1,
881|
||||||
||||||
|||||
2,61
4||||
||||||
||||||
||||||
||||
3,86
5||||
||||||
||||||
||||||
||||||
||||||
||||
2,15
6||||
||||||
||||||
|||||
3,44
0||||
||||||
||||||
||||||
||||||
||||||
16.3
%
Wes
tern
Iow
a Te
ch87
2228
200
Iow
a W
este
rn24
2||
467|
|||47
7||||
720|
||||||
716|
||||||
31.2
%
Sout
hwes
tern
226|
|26
0||
296|
|27
5||
380|
||13
.9%
Indi
an H
ills
942|
||||||
||87
7||||
||||
746|
||||||
699|
|||||
657|
|||||
-8.6
%
Sout
heas
tern
400|
|||90
4||||
|||||
879|
||||||
|77
7||||
|||76
0||||
|||17
.4%
Tota
l10
,131
11,2
0312
,568
11,8
2712
,884
6.2%
Not
e: E
ach
bar
“|”
deno
tes
100
enro
llees
.
Sou
rce:
Iow
a D
epar
tmen
t of E
duca
tion,
Div
isio
n of
Com
mun
ity C
olle
ges
and
Wor
kfor
ce P
repa
ratio
n, C
omm
unity
Col
lege
MIS
.
Tab
le 9
-3:
AB
E E
nro
llmen
t b
y C
olle
ge:
200
6-20
10
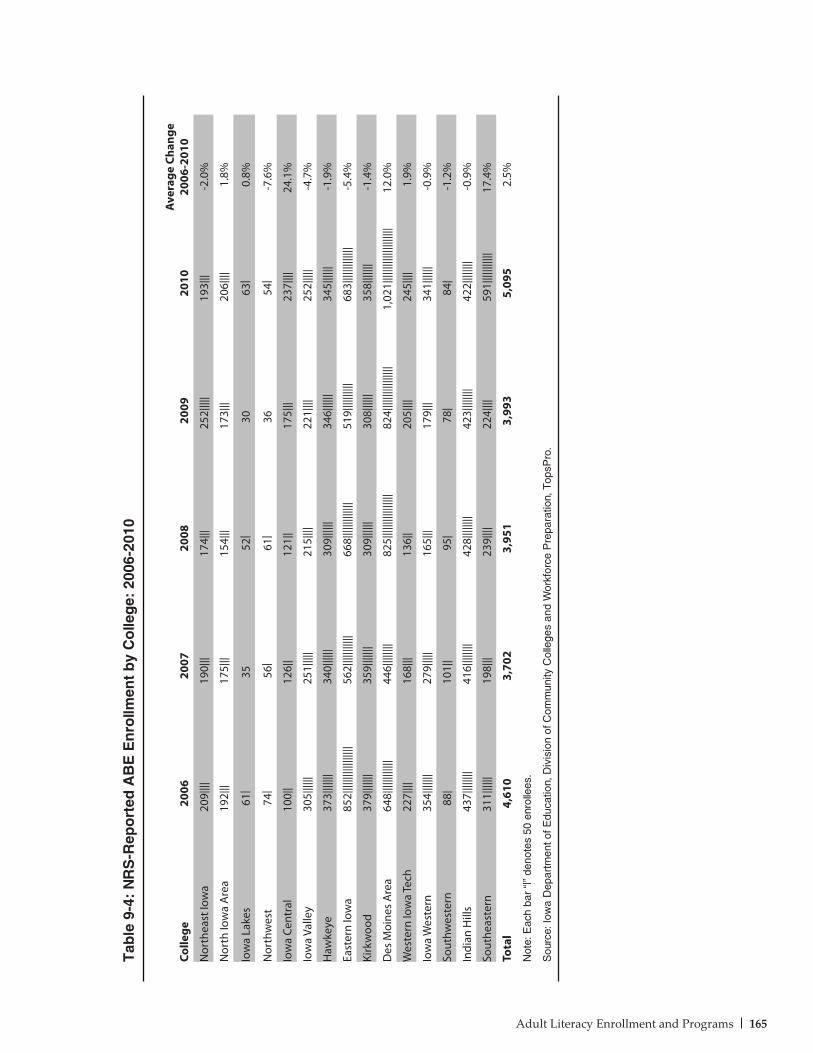
165Adult Literacy Enrollment and Programs
Colle
ge20
0620
0720
0820
0920
10A
vera
ge C
hang
e 20
06-2
010
Nor
thea
st Io
wa
209|
|||19
0|||
174|
||25
2||||
|19
3|||
-2.0
%
Nor
th Io
wa
Are
a19
2|||
175|
||15
4|||
173|
||20
6||||
1.8%
Iow
a La
kes
61|
3552
|30
63|
0.8%
Nor
thw
est
74|
56|
61|
3654
|-7
.6%
Iow
a Ce
ntra
l10
0||
126|
|12
1||
175|
||23
7||||
24.1
%
Iow
a Va
lley
305|
|||||
251|
||||
215|
|||22
1||||
252|
||||
-4.7
%
Haw
keye
373|
||||||
340|
|||||
309|
|||||
346|
|||||
345|
|||||
-1.9
%
East
ern
Iow
a85
2||||
||||||
||||||
|56
2||||
||||||
|66
8||||
||||||
|||51
9||||
||||||
683|
||||||
||||||
-5.4
%
Kirk
woo
d37
9||||
|||35
9||||
|||30
9||||
||30
8||||
||35
8||||
|||-1
.4%
Des
Moi
nes
Are
a64
8||||
||||||
||44
6||||
||||
825|
||||||
||||||
|||82
4||||
||||||
||||||
1,02
1||||
||||||
||||||
||||
12.0
%
Wes
tern
Iow
a Te
ch22
7||||
168|
||13
6||
205|
|||24
5||||
1.9%
Iow
a W
este
rn35
4||||
|||27
9||||
|16
5|||
179|
||34
1||||
||-0
.9%
Sout
hwes
tern
88|
101|
|95
|78
|84
|-1
.2%
Indi
an H
ills
437|
||||||
|41
6||||
||||
428|
||||||
|42
3||||
||||
422|
||||||
|-0
.9%
Sout
heas
tern
311|
|||||
198|
||23
9||||
224|
|||59
1||||
||||||
|17
.4%
Tota
l4,
610
3,70
23,
951
3,99
35,
095
2.5%
Not
e: E
ach
bar
“|”
deno
tes
50 e
nrol
lees
.
Sou
rce:
Iow
a D
epar
tmen
t of E
duca
tion,
Div
isio
n of
Com
mun
ity C
olle
ges
and
Wor
kfor
ce P
repa
ratio
n, T
opsP
ro.
Tab
le 9
-4:
NR
S-R
epo
rted
AB
E E
nro
llmen
t b
y C
olle
ge:
200
6-20
10
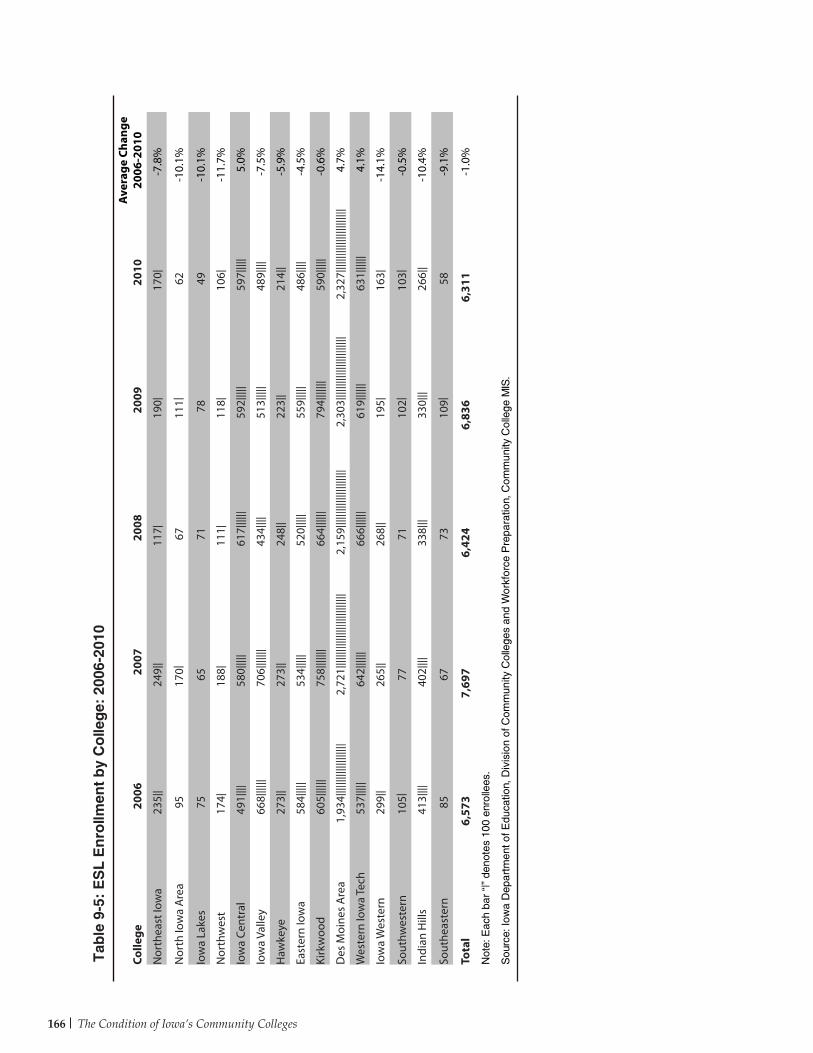
166 The Condition of Iowa’s Community Colleges
Tab
le 9
-5:
ES
L E
nro
llmen
t b
y C
olle
ge:
200
6-20
10
Colle
ge20
0620
0720
0820
0920
10A
vera
ge C
hang
e 20
06-2
010
Nor
thea
st Io
wa
235|
|24
9||
117|
190|
170|
-7.8
%
Nor
th Io
wa
Are
a95
170|
6711
1|62
-10.
1%
Iow
a La
kes
7565
7178
49-1
0.1%
Nor
thw
est
174|
188|
111|
118|
106|
-11.
7%
Iow
a Ce
ntra
l49
1||||
580|
||||
617|
|||||
592|
||||
597|
||||
5.0%
Iow
a Va
lley
668|
|||||
706|
||||||
434|
|||51
3||||
|48
9||||
-7.5
%
Haw
keye
273|
|27
3||
248|
|22
3||
214|
|-5
.9%
East
ern
Iow
a58
4||||
|53
4||||
|52
0||||
|55
9||||
|48
6||||
-4.5
%
Kirk
woo
d60
5||||
||75
8||||
|||66
4||||
||79
4||||
|||59
0||||
|-0
.6%
Des
Moi
nes
Are
a1,
934|
||||||
||||||
||||||
2,72
1||||
||||||
||||||
||||||
|||||
2,15
9||||
||||||
||||||
|||||
2,30
3||||
||||||
||||||
||||||
|2,
327|
||||||
||||||
||||||
||||
4.7%
Wes
tern
Iow
a Te
ch53
7||||
|64
2||||
||66
6||||
||61
9||||
||63
1||||
||4.
1%
Iow
a W
este
rn29
9||
265|
|26
8||
195|
163|
-14.
1%
Sout
hwes
tern
105|
7771
102|
103|
-0.5
%
Indi
an H
ills
413|
|||40
2||||
338|
||33
0|||
266|
|-1
0.4%
Sout
heas
tern
8567
7310
9|58
-9.1
%
Tota
l6,
573
7,69
76,
424
6,83
66,
311
-1.0
%
Not
e: E
ach
bar
“|”
deno
tes
100
enro
llees
.
Sou
rce:
Iow
a D
epar
tmen
t of E
duca
tion,
Div
isio
n of
Com
mun
ity C
olle
ges
and
Wor
kfor
ce P
repa
ratio
n, C
omm
unity
Col
lege
MIS
.
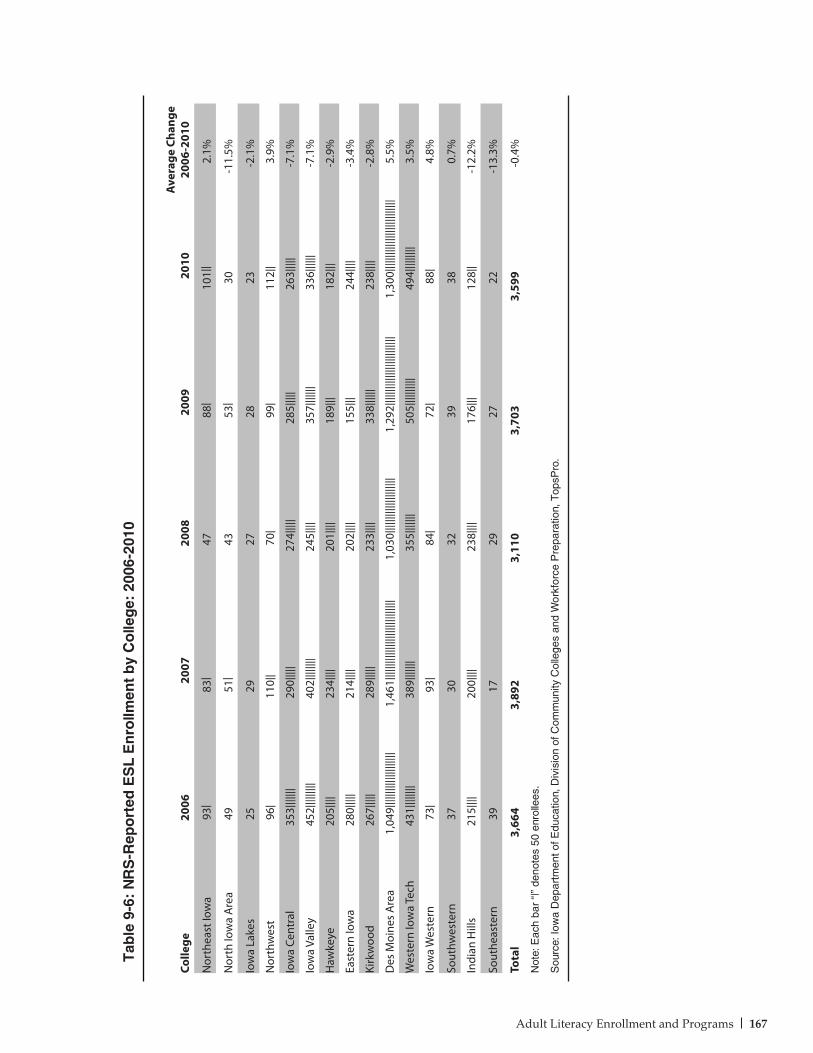
167Adult Literacy Enrollment and Programs
Colle
ge20
0620
0720
0820
0920
10A
vera
ge C
hang
e 20
06-2
010
Nor
thea
st Io
wa
93|
83|
4788
|10
1||
2.1%
Nor
th Io
wa
Are
a49
51|
4353
|30
-11.
5%
Iow
a La
kes
2529
2728
23-2
.1%
Nor
thw
est
96|
110|
|70
|99
|11
2||
3.9%
Iow
a Ce
ntra
l35
3||||
|||29
0||||
|27
4||||
|28
5||||
|26
3||||
|-7
.1%
Iow
a Va
lley
452|
||||||
||40
2||||
||||
245|
|||35
7||||
|||33
6||||
||-7
.1%
Haw
keye
205|
|||23
4||||
201|
|||18
9|||
182|
||-2
.9%
East
ern
Iow
a28
0||||
|21
4||||
202|
|||15
5|||
244|
|||-3
.4%
Kirk
woo
d26
7||||
|28
9||||
|23
3||||
338|
|||||
238|
|||-2
.8%
Des
Moi
nes
Are
a1,
049|
||||||
||||||
||||||
|1,
461|
||||||
||||||
||||||
||||||
||||
1,03
0||||
||||||
||||||
||||
1,29
2||||
||||||
||||||
||||||
|||1,
300|
||||||
||||||
||||||
||||||
|5.
5%
Wes
tern
Iow
a Te
ch43
1||||
||||
389|
||||||
355|
||||||
505|
||||||
|||49
4||||
|||||
3.5%
Iow
a W
este
rn73
|93
|84
|72
|88
|4.
8%
Sout
hwes
tern
3730
3239
380.
7%
Indi
an H
ills
215|
|||20
0||||
238|
|||17
6|||
128|
|-1
2.2%
Sout
heas
tern
3917
2927
22-1
3.3%
Tota
l3,
664
3,89
23,
110
3,70
33,
599
-0.4
%
Not
e: E
ach
bar
“|”
deno
tes
50 e
nrol
lees
.
Sou
rce:
Iow
a D
epar
tmen
t of E
duca
tion,
Div
isio
n of
Com
mun
ity C
olle
ges
and
Wor
kfor
ce P
repa
ratio
n, T
opsP
ro.
Tab
le 9
-6:
NR
S-R
epo
rted
ES
L E
nro
llmen
t b
y C
olle
ge:
200
6-20
10
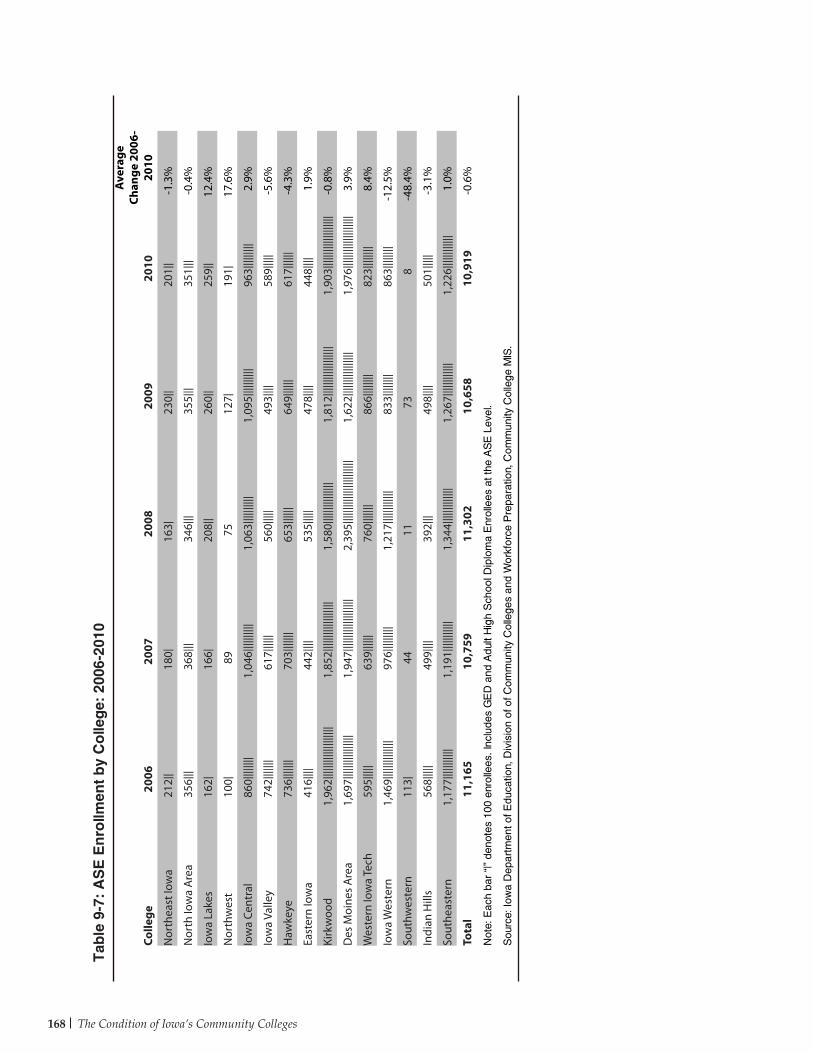
168 The Condition of Iowa’s Community Colleges
Tab
le 9
-7:
AS
E E
nro
llmen
t b
y C
olle
ge:
200
6-20
10
Colle
ge20
0620
0720
0820
0920
10
Ave
rage
Ch
ange
200
6-20
10
Nor
thea
st Io
wa
212|
|18
0|16
3|23
0||
201|
|-1
.3%
Nor
th Io
wa
Are
a35
6|||
368|
||34
6|||
355|
||35
1|||
-0.4
%
Iow
a La
kes
162|
166|
208|
|26
0||
259|
|12
.4%
Nor
thw
est
100|
8975
127|
191|
17.6
%
Iow
a Ce
ntra
l86
0||||
||||
1,04
6||||
||||||
1,06
3||||
||||||
1,09
5||||
||||||
963|
||||||
||2.
9%
Iow
a Va
lley
742|
||||||
617|
|||||
560|
||||
493|
|||58
9||||
|-5
.6%
Haw
keye
736|
||||||
703|
||||||
653|
|||||
649|
|||||
617|
|||||
-4.3
%
East
ern
Iow
a41
6||||
442|
|||53
5||||
|47
8||||
448|
|||1.
9%
Kirk
woo
d1,
962|
||||||
||||||
||||||
1,85
2||||
||||||
||||||
||1,
580|
||||||
||||||
||1,
812|
||||||
||||||
|||||
1,90
3||||
||||||
||||||
|||-0
.8%
Des
Moi
nes
Are
a1,
697|
||||||
||||||
|||1,
947|
||||||
||||||
||||||
2,39
5||||
||||||
||||||
||||||
|1,
622|
||||||
||||||
|||1,
976|
||||||
||||||
||||||
3.9%
Wes
tern
Iow
a Te
ch59
5||||
|63
9||||
||76
0||||
|||86
6||||
||||
823|
||||||
|8.
4%
Iow
a W
este
rn1,
469|
||||||
||||||
|97
6||||
|||||
1,21
7||||
||||||
||83
3||||
||||
863|
||||||
|-1
2.5%
Sout
hwes
tern
113|
4411
738
-48.
4%
Indi
an H
ills
568|
||||
499|
|||39
2|||
498|
|||50
1||||
|-3
.1%
Sout
heas
tern
1,17
7||||
||||||
|1,
191|
||||||
||||
1,34
4||||
||||||
|||1,
267|
||||||
|||||
1,22
6||||
||||||
||1.
0%
Tota
l11
,165
10,7
5911
,302
10,6
5810
,919
-0.6
%
Not
e: E
ach
bar
“|”
deno
tes
100
enro
llees
. Inc
lude
s G
ED
and
Adu
lt H
igh
Sch
ool D
iplo
ma
Enr
olle
es a
t the
AS
E L
evel
.
Sou
rce:
Iow
a D
epar
tmen
t of E
duca
tion,
Div
isio
n of
of C
omm
unity
Col
lege
s an
d W
orkf
orce
Pre
para
tion,
Com
mun
ity C
olle
ge M
IS.
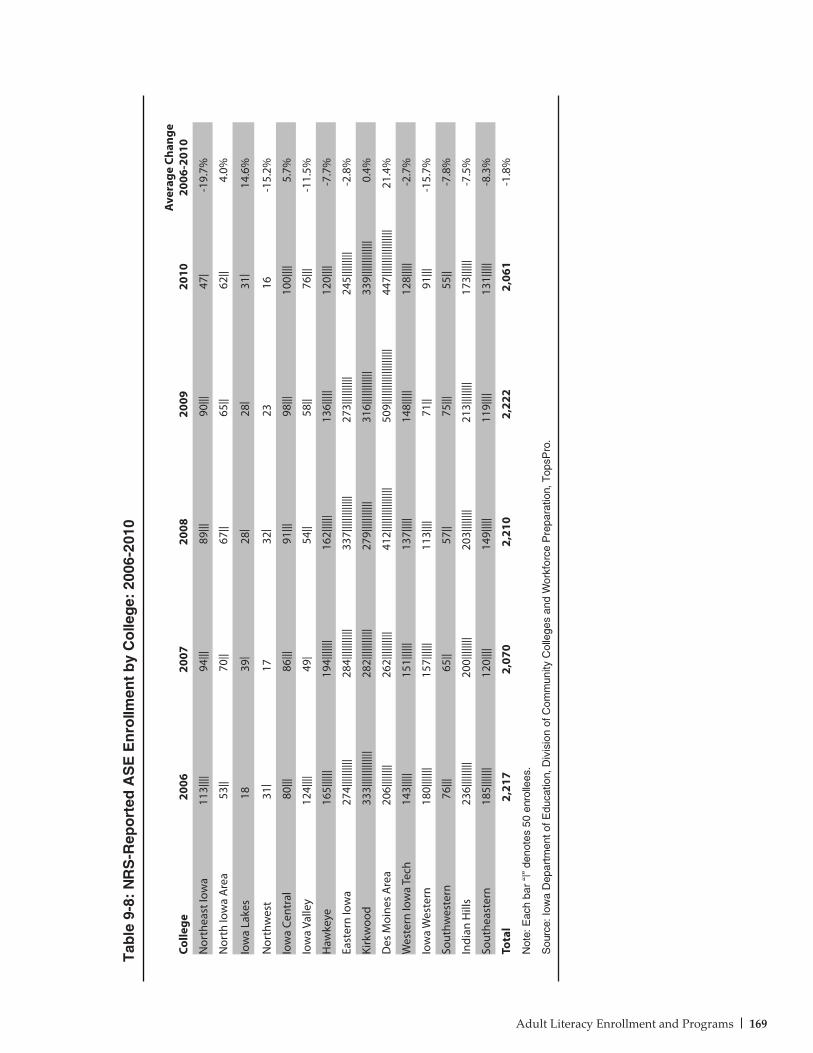
169Adult Literacy Enrollment and Programs
Colle
ge20
0620
0720
0820
0920
10A
vera
ge C
hang
e 20
06-2
010
Nor
thea
st Io
wa
113|
|||94
|||89
|||90
|||47
|-1
9.7%
Nor
th Io
wa
Are
a53
||70
||67
||65
||62
||4.
0%
Iow
a La
kes
1839
|28
|28
|31
|14
.6%
Nor
thw
est
31|
1732
|23
16-1
5.2%
Iow
a Ce
ntra
l80
|||86
|||91
|||98
|||10
0||||
5.7%
Iow
a Va
lley
124|
|||49
|54
||58
||76
|||-1
1.5%
Haw
keye
165|
|||||
194|
||||||
162|
|||||
136|
||||
120|
|||-7
.7%
East
ern
Iow
a27
4||||
||||||
284|
||||||
||||
337|
||||||
||||||
273|
||||||
|||24
5||||
|||||
-2.8
%
Kirk
woo
d33
3||||
||||||
|||28
2||||
||||||
|27
9||||
||||||
|31
6||||
||||||
||33
9||||
||||||
|||0.
4%
Des
Moi
nes
Are
a20
6||||
||||
262|
||||||
|||41
2||||
||||||
||||||
509|
||||||
||||||
||||||
|44
7||||
||||||
||||||
|21
.4%
Wes
tern
Iow
a Te
ch14
3||||
|15
1||||
||13
7||||
|14
8||||
|12
8||||
|-2
.7%
Iow
a W
este
rn18
0||||
|||15
7||||
||11
3||||
71||
91|||
-15.
7%
Sout
hwes
tern
76|||
65||
57||
75|||
55||
-7.8
%
Indi
an H
ills
236|
||||||
||20
0||||
||||
203|
||||||
|21
3||||
||||
173|
|||||
-7.5
%
Sout
heas
tern
185|
||||||
120|
|||14
9||||
|11
9||||
131|
||||
-8.3
%
Tota
l2,
217
2,07
02,
210
2,22
22,
061
-1.8
%
Not
e: E
ach
bar
“|”
deno
tes
50 e
nrol
lees
.
Sou
rce:
Iow
a D
epar
tmen
t of E
duca
tion,
Div
isio
n of
Com
mun
ity C
olle
ges
and
Wor
kfor
ce P
repa
ratio
n, T
opsP
ro.
Tab
le 9
-8:
NR
S-R
epo
rted
AS
E E
nro
llmen
t b
y C
olle
ge:
200
6-20
10
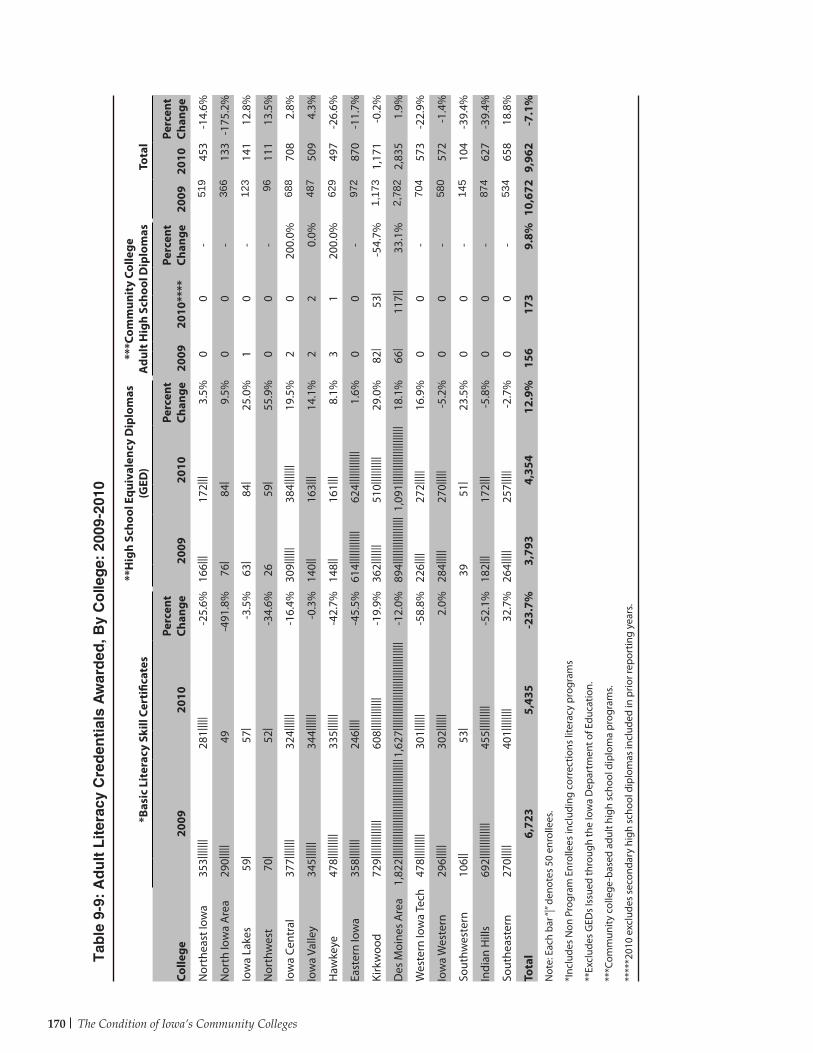
170 The Condition of Iowa’s Community Colleges
*Bas
ic L
iter
acy
Skill
Cer
tific
ates
**H
igh
Scho
ol E
quiv
alen
cy D
iplo
mas
(G
ED)
***C
omm
unit
y Co
llege
A
dult
Hig
h Sc
hool
Dip
lom
asTo
tal
Colle
ge20
0920
10Pe
rcen
t Ch
ange
2009
2010
Perc
ent
Chan
ge20
0920
10**
**Pe
rcen
t Ch
ange
2009
2010
Perc
ent
Chan
ge
Nor
thea
st Io
wa
353|
||||||
281|
||||
-25.
6%16
6|||
172|
||3.
5%0
0-
519
453
-14.
6%
Nor
th Io
wa
Are
a29
0||||
|49
-491
.8%
76|
84|
9.5%
00
-36
613
3-1
75.2
%
Iow
a La
kes
59|
57|
-3.5
%63
|84
|25
.0%
10
-12
314
112
.8%
Nor
thw
est
70|
52|
-34.
6%26
59|
55.9
%0
0-
9611
113
.5%
Iow
a Ce
ntra
l37
7||||
|||32
4||||
||-1
6.4%
309|
|||||
384|
||||||
19.5
%2
020
0.0%
688
708
2.8%
Iow
a Va
lley
345|
|||||
344|
|||||
-0.3
%14
0||
163|
||14
.1%
22
0.0%
487
509
4.3%
Haw
keye
478|
||||||
||33
5||||
||-4
2.7%
148|
|16
1|||
8.1%
31
200.
0%62
949
7-2
6.6%
East
ern
Iow
a35
8||||
|||24
6||||
-45.
5%61
4||||
||||||
||62
4||||
||||||
||1.
6%0
0-
972
870
-11.
7%
Kirk
woo
d72
9||||
||||||
||||
608|
||||||
|||||
-19.
9%36
2||||
|||51
0||||
||||||
29.0
%82
|53
|-5
4.7%
1,17
31,
171
-0.2
%
Des
Moi
nes
Are
a1,
822|
||||||
||||||
||||||
||||||
||||||
||||| 1
,627
||||||
||||||
||||||
||||||
||||||
||-1
2.0%
894|
||||||
||||||
||||
1,09
1||||
||||||
||||||
|||||
18.1
%66
|11
7||
33.1
%2,
782
2,83
51.
9%
Wes
tern
Iow
a Te
ch47
8||||
|||||
301|
|||||
-58.
8%22
6||||
272|
||||
16.9
%0
0-
704
573
-22.
9%
Iow
a W
este
rn29
6||||
|30
2||||
||2.
0%28
4||||
|27
0||||
|-5
.2%
00
-58
057
2-1
.4%
Sout
hwes
tern
106|
|53
|39
51|
23.5
%0
0-
145
104
-39.
4%
Indi
an H
ills
692|
||||||
||||||
455|
||||||
||-5
2.1%
182|
||17
2|||
-5.8
%0
0-
874
627
-39.
4%
Sout
heas
tern
270|
||||
401|
||||||
|32
.7%
264|
||||
257|
||||
-2.7
%0
0-
534
658
18.8
%
Tota
l6,
723
5,43
5-2
3.7%
3,79
34,
354
12.9
%15
617
39.
8%10
,672
9,96
2-7
.1%
Not
e: E
ach
bar “
|” de
note
s 50
enr
olle
es.
*Inc
lude
s N
on P
rogr
am E
nrol
lees
incl
udin
g co
rrec
tions
lite
racy
pro
gram
s
**Ex
clud
es G
EDs
Issu
ed th
roug
h th
e Io
wa
Dep
artm
ent o
f Edu
catio
n.
***C
omm
unity
col
lege
-bas
ed a
dult
high
sch
ool d
iplo
ma
prog
ram
s.
****
*201
0 ex
clud
es s
econ
dary
hig
h sc
hool
dip
lom
as in
clud
ed in
prio
r rep
ortin
g ye
ars.
Tab
le 9
-9:
Ad
ult
Lit
erac
y C
red
enti
als
Aw
ard
ed, B
y C
olle
ge:
200
9-20
10
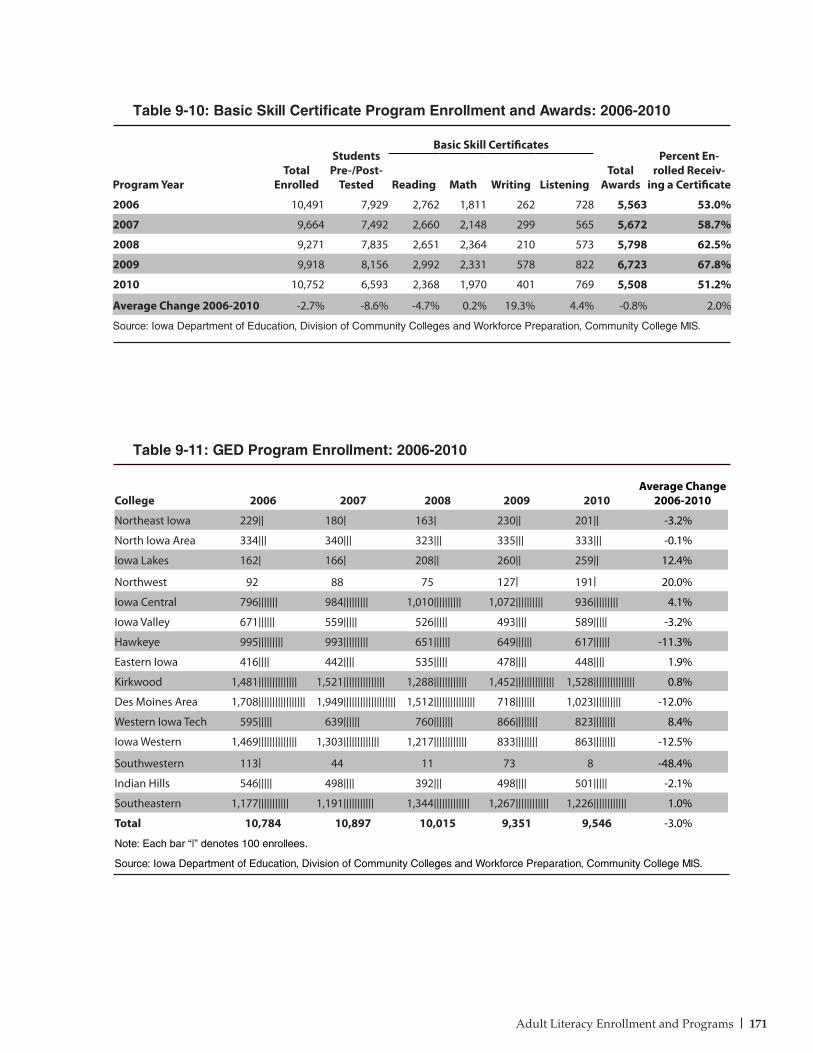
171Adult Literacy Enrollment and Programs
Table 9-10: Basic Skill Certificate Program Enrollment and Awards: 2006-2010
Program YearTotal
Enrolled
Students Pre-/Post-
Tested
Basic Skill Certificates
Total Awards
Percent En-rolled Receiv-
ing a CertificateReading Math Writing Listening
2006 10,491 7,929 2,762 1,811 262 728 5,563 53.0%
2007 9,664 7,492 2,660 2,148 299 565 5,672 58.7%
2008 9,271 7,835 2,651 2,364 210 573 5,798 62.5%
2009 9,918 8,156 2,992 2,331 578 822 6,723 67.8%
2010 10,752 6,593 2,368 1,970 401 769 5,508 51.2%
Average Change 2006-2010 -2.7% -8.6% -4.7% 0.2% 19.3% 4.4% -0.8% 2.0%
Source: Iowa Department of Education, Division of Community Colleges and Workforce Preparation, Community College MIS.
College 2006 2007 2008 2009 2010Average Change
2006-2010
Northeast Iowa 229|| 180| 163| 230|| 201|| -3.2%
North Iowa Area 334||| 340||| 323||| 335||| 333||| -0.1%
Iowa Lakes 162| 166| 208|| 260|| 259|| 12.4%
Northwest 92 88 75 127| 191| 20.0%
Iowa Central 796||||||| 984||||||||| 1,010|||||||||| 1,072|||||||||| 936||||||||| 4.1%
Iowa Valley 671|||||| 559||||| 526||||| 493|||| 589||||| -3.2%
Hawkeye 995||||||||| 993||||||||| 651|||||| 649|||||| 617|||||| -11.3%
Eastern Iowa 416|||| 442|||| 535||||| 478|||| 448|||| 1.9%
Kirkwood 1,481|||||||||||||| 1,521||||||||||||||| 1,288|||||||||||| 1,452|||||||||||||| 1,528||||||||||||||| 0.8%
Des Moines Area 1,708||||||||||||||||| 1,949||||||||||||||||||| 1,512||||||||||||||| 718||||||| 1,023|||||||||| -12.0%
Western Iowa Tech 595||||| 639|||||| 760||||||| 866|||||||| 823|||||||| 8.4%
Iowa Western 1,469|||||||||||||| 1,303||||||||||||| 1,217|||||||||||| 833|||||||| 863|||||||| -12.5%
Southwestern 113| 44 11 73 8 -48.4%
Indian Hills 546||||| 498|||| 392||| 498|||| 501||||| -2.1%
Southeastern 1,177||||||||||| 1,191||||||||||| 1,344||||||||||||| 1,267|||||||||||| 1,226|||||||||||| 1.0%
Total 10,784 10,897 10,015 9,351 9,546 -3.0%
Note: Each bar “|” denotes 100 enrollees.
Source: Iowa Department of Education, Division of Community Colleges and Workforce Preparation, Community College MIS.
Table 9-11: GED Program Enrollment: 2006-2010

172 The Condition of Iowa’s Community Colleges
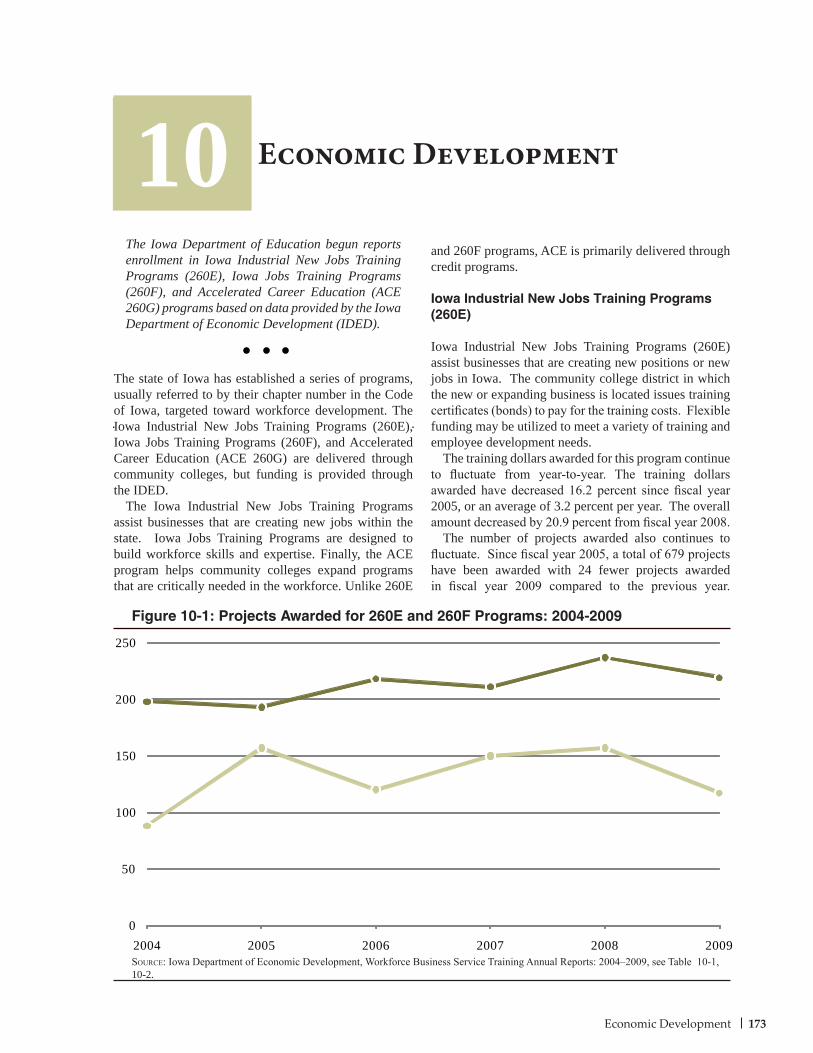
173Economic Development
The state of Iowa has established a series of programs, usually referred to by their chapter number in the Code of Iowa, targeted toward workforce development. The Iowa Industrial New Jobs Training Programs (260E), Iowa Jobs Training Programs (260F), and Accelerated Career Education (ACE 260G) are delivered through community colleges, but funding is provided through the IDED.
The Iowa Industrial New Jobs Training Programs assist businesses that are creating new jobs within the state. Iowa Jobs Training Programs are designed to build workforce skills and expertise. Finally, the ACE program helps community colleges expand programs that are critically needed in the workforce. Unlike 260E
and 260F programs, ACE is primarily delivered through credit programs.
Iowa Industrial New Jobs Training Programs (260E)
Iowa Industrial New Jobs Training Programs (260E) assist businesses that are creating new positions or new jobs in Iowa. The community college district in which the new or expanding business is located issues training certificates (bonds) to pay for the training costs. Flexible funding may be utilized to meet a variety of training and employee development needs.
The training dollars awarded for this program continue to fluctuate from year-to-year. The training dollars awarded have decreased 16.2 percent since fiscal year 2005, or an average of 3.2 percent per year. The overall amount decreased by 20.9 percent from fiscal year 2008.
The number of projects awarded also continues to fluctuate. Since fiscal year 2005, a total of 679 projects have been awarded with 24 fewer projects awarded in fiscal year 2009 compared to the previous year.
Economic Development10The Iowa Department of Education begun reports enrollment in Iowa Industrial New Jobs Training Programs (260E), Iowa Jobs Training Programs (260F), and Accelerated Career Education (ACE 260G) programs based on data provided by the Iowa Department of Economic Development (IDED).
Figure 10-1: Projects Awarded for 260E and 260F Programs: 2004-2009
Source: Iowa Department of Economic Development, Workforce Business Service Training Annual Reports: 2004–2009, see Table 10-1, 10-2.
0
50
100
150
200
250
2004 2005 2006 2007 2008 2009
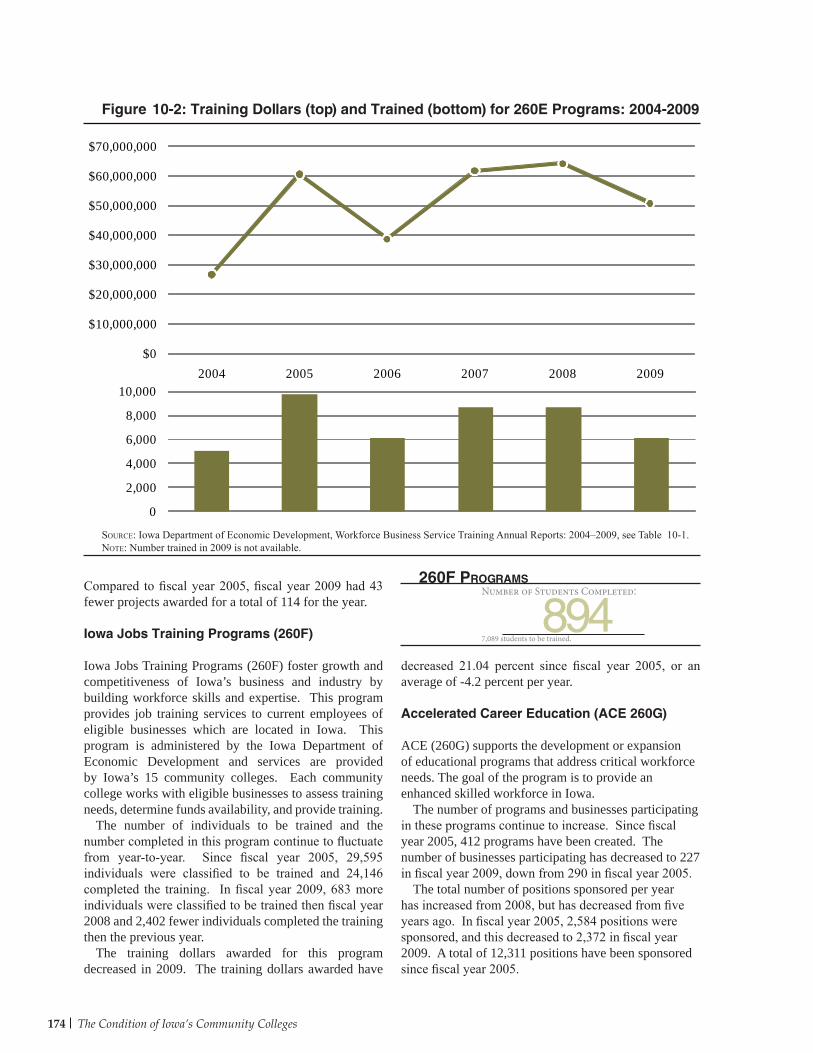
174 The Condition of Iowa’s Community Colleges
Compared to fiscal year 2005, fiscal year 2009 had 43 fewer projects awarded for a total of 114 for the year.
Iowa Jobs Training Programs (260F)
Iowa Jobs Training Programs (260F) foster growth and competitiveness of Iowa’s business and industry by building workforce skills and expertise. This program provides job training services to current employees of eligible businesses which are located in Iowa. This program is administered by the Iowa Department of Economic Development and services are provided by Iowa’s 15 community colleges. Each community college works with eligible businesses to assess training needs, determine funds availability, and provide training.
The number of individuals to be trained and the number completed in this program continue to fluctuate from year-to-year. Since fiscal year 2005, 29,595 individuals were classified to be trained and 24,146 completed the training. In fiscal year 2009, 683 more individuals were classified to be trained then fiscal year 2008 and 2,402 fewer individuals completed the training then the previous year.
The training dollars awarded for this program decreased in 2009. The training dollars awarded have
decreased 21.04 percent since fiscal year 2005, or an average of -4.2 percent per year.
Accelerated Career Education (ACE 260G)
ACE (260G) supports the development or expansion of educational programs that address critical workforce needs. The goal of the program is to provide an enhanced skilled workforce in Iowa.
The number of programs and businesses participating in these programs continue to increase. Since fiscal year 2005, 412 programs have been created. The number of businesses participating has decreased to 227 in fiscal year 2009, down from 290 in fiscal year 2005.
The total number of positions sponsored per year has increased from 2008, but has decreased from five years ago. In fiscal year 2005, 2,584 positions were sponsored, and this decreased to 2,372 in fiscal year 2009. A total of 12,311 positions have been sponsored since fiscal year 2005.
Figure 10-2: Training Dollars (top) and Trained (bottom) for 260E Programs: 2004-2009
Source: Iowa Department of Economic Development, Workforce Business Service Training Annual Reports: 2004–2009, see Table 10-1.Note: Number trained in 2009 is not available.
Number of Students Completed:
894260F Programs
7,089 students to be trained.
*$0
$10,000,000
$20,000,000
$30,000,000
$40,000,000
$50,000,000
$60,000,000
$70,000,000
2004 2005 2006 2007 2008 2009
0
2,000
4,000
6,000
8,000
10,000
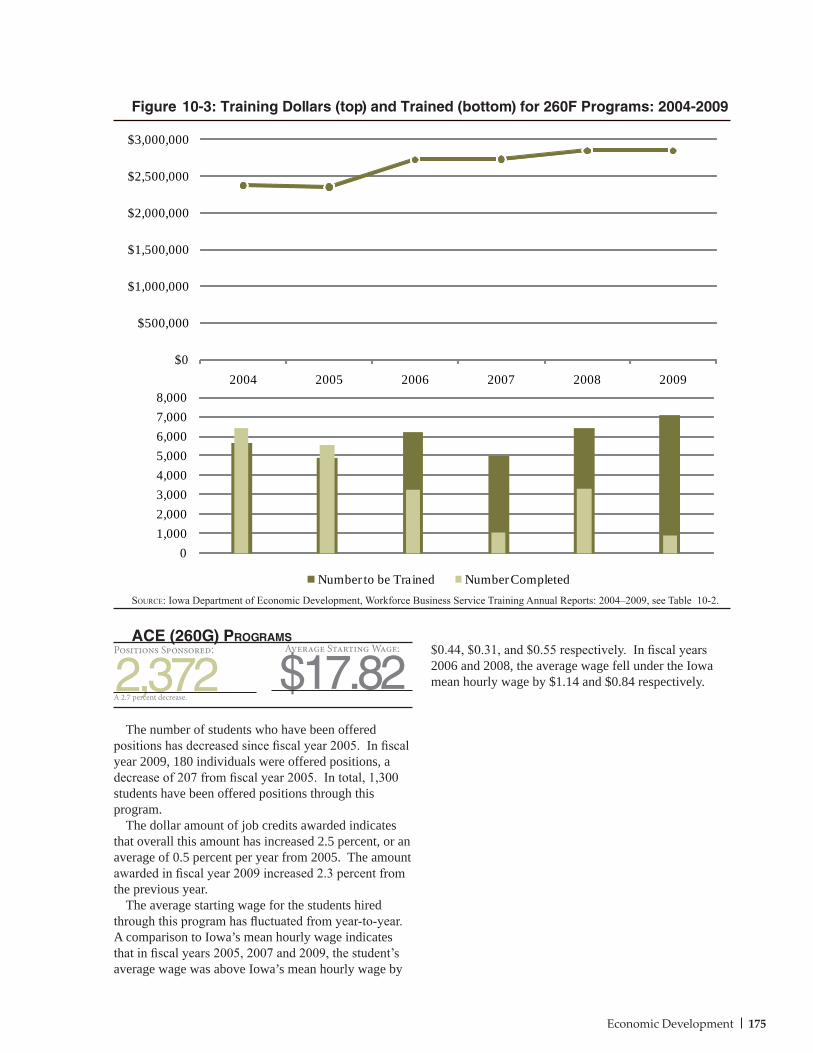
175Economic Development
Source: Iowa Department of Economic Development, Workforce Business Service Training Annual Reports: 2004–2009, see Table 10-2.
$0
$500,000
$1,000,000
$1,500,000
$2,000,000
$2,500,000
$3,000,000
2004 2005 2006 2007 2008 2009
01,0002,0003,0004,0005,0006,0007,0008,000
The number of students who have been offered positions has decreased since fiscal year 2005. In fiscal year 2009, 180 individuals were offered positions, a decrease of 207 from fiscal year 2005. In total, 1,300 students have been offered positions through this program.
The dollar amount of job credits awarded indicates that overall this amount has increased 2.5 percent, or an average of 0.5 percent per year from 2005. The amount awarded in fiscal year 2009 increased 2.3 percent from the previous year.
The average starting wage for the students hired through this program has fluctuated from year-to-year. A comparison to Iowa’s mean hourly wage indicates that in fiscal years 2005, 2007 and 2009, the student’s average wage was above Iowa’s mean hourly wage by
$0.44, $0.31, and $0.55 respectively. In fiscal years 2006 and 2008, the average wage fell under the Iowa mean hourly wage by $1.14 and $0.84 respectively.
Figure 10-3: Training Dollars (top) and Trained (bottom) for 260F Programs: 2004-2009
Positions Sponsored:
2,372Average Starting Wage:
$17.82ace (260g) Programs
A 2.7 percent decrease.
Number to be Trained Number Completed
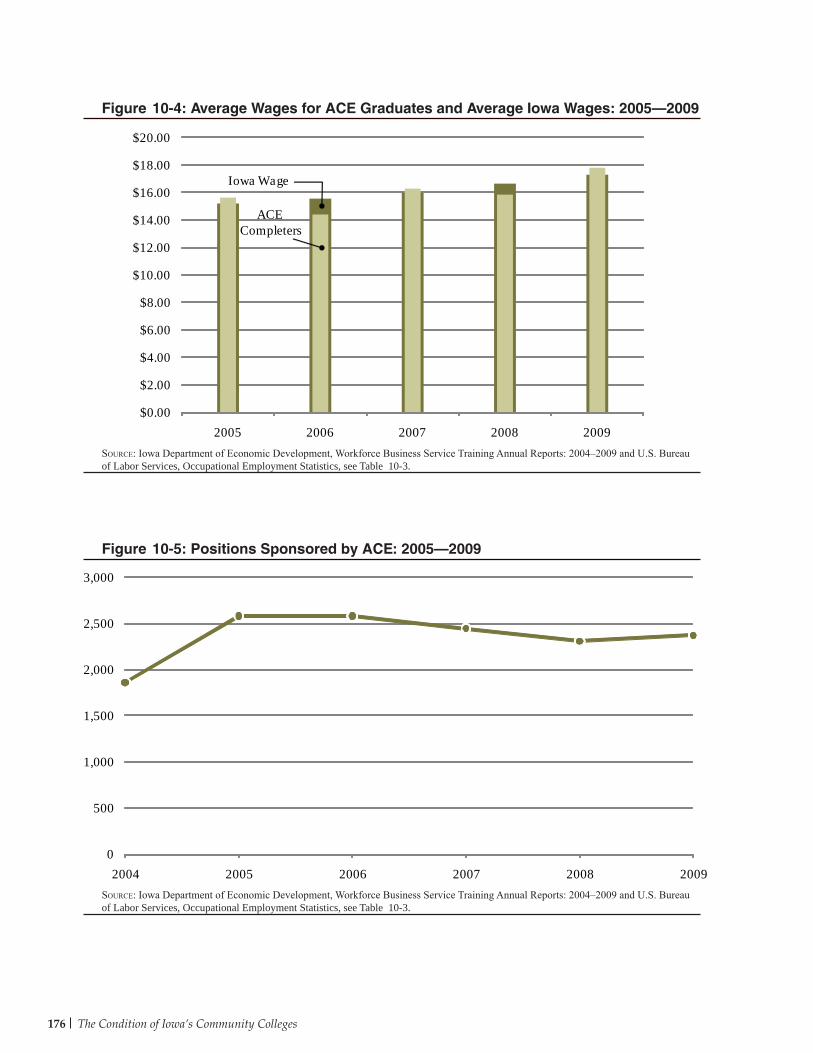
The Condition of Iowa’s Community Colleges176
Figure 10-4: Average Wages for ACE Graduates and Average Iowa Wages: 2005–2009
Figure 10-5: Positions Sponsored by ACE: 2005–2009
$0.00
$2.00
$4.00
$6.00
$8.00
$10.00
$12.00
$14.00
$16.00
$18.00
$20.00
2005 2006 2007 2008 2009
Iowa Wage
ACECompleters
Source: Iowa Department of Economic Development, Workforce Business Service Training Annual Reports: 2004–2009 and U.S. Bureau of Labor Services, Occupational Employment Statistics, see Table 10-3.
0
500
1,000
1,500
2,000
2,500
3,000
2004 2005 2006 2007 2008 2009Source: Iowa Department of Economic Development, Workforce Business Service Training Annual Reports: 2004–2009 and U.S. Bureau of Labor Services, Occupational Employment Statistics, see Table 10-3.
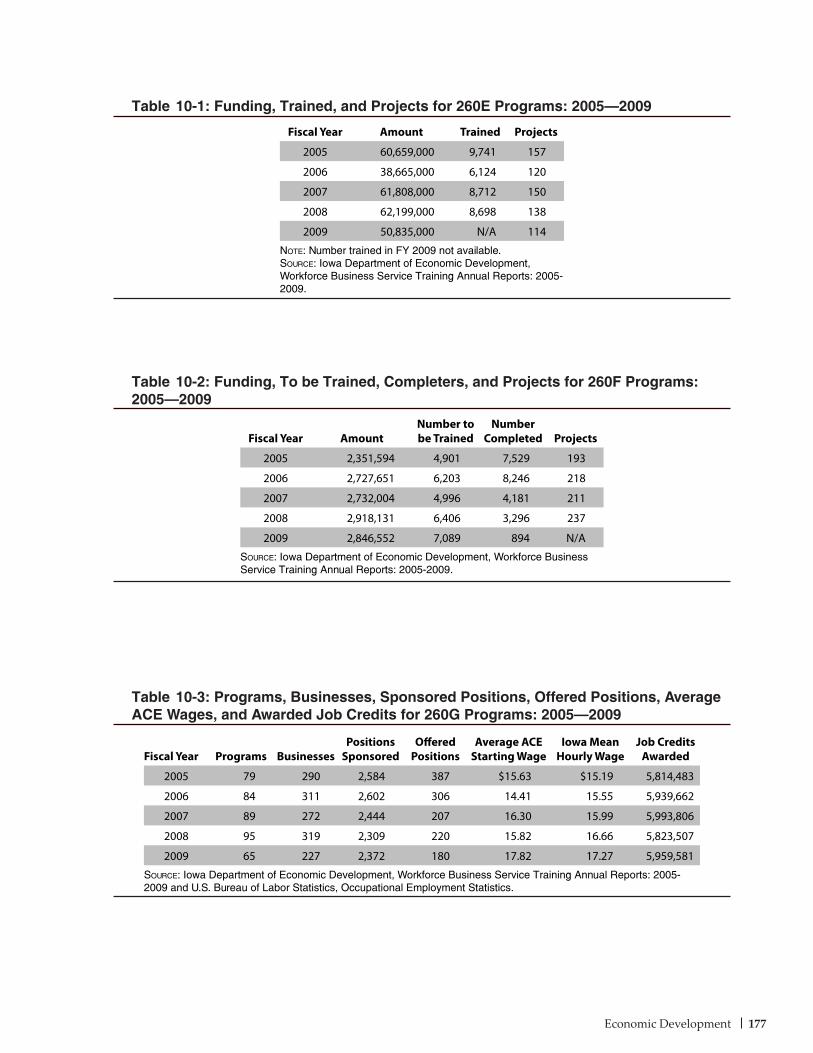
Economic Development 177
Table 10-1: Funding, Trained, and Projects for 260E Programs: 2005–2009
Fiscal Year Amount Trained Projects
2005 60,659,000 9,741 157
2006 38,665,000 6,124 120
2007 61,808,000 8,712 150
2008 62,199,000 8,698 138
2009 50,835,000 N/A 114
Note: Number trained in FY 2009 not available. Source: Iowa Department of Economic Development, Workforce Business Service Training Annual Reports: 2005-2009.
Table 10-2: Funding, To be Trained, Completers, and Projects for 260F Programs:2005–2009
Fiscal Year AmountNumber to be Trained
Number Completed Projects
2005 2,351,594 4,901 7,529 193
2006 2,727,651 6,203 8,246 218
2007 2,732,004 4,996 4,181 211
2008 2,918,131 6,406 3,296 237
2009 2,846,552 7,089 894 N/A
Source: Iowa Department of Economic Development, Workforce Business Service Training Annual Reports: 2005-2009.
Fiscal Year Programs BusinessesPositions
SponsoredOffered
PositionsAverage ACE
Starting WageIowa Mean
Hourly WageJob Credits
Awarded
2005 79 290 2,584 387 $15.63 $15.19 5,814,483
2006 84 311 2,602 306 14.41 15.55 5,939,662
2007 89 272 2,444 207 16.30 15.99 5,993,806
2008 95 319 2,309 220 15.82 16.66 5,823,507
2009 65 227 2,372 180 17.82 17.27 5,959,581
Source: Iowa Department of Economic Development, Workforce Business Service Training Annual Reports: 2005-2009 and U.S. Bureau of Labor Statistics, Occupational Employment Statistics.
Table 10-3: Programs, Businesses, Sponsored Positions, Offered Positions, Average ACE Wages, and Awarded Job Credits for 260G Programs: 2005–2009

178 The Condition of Iowa’s Community Colleges
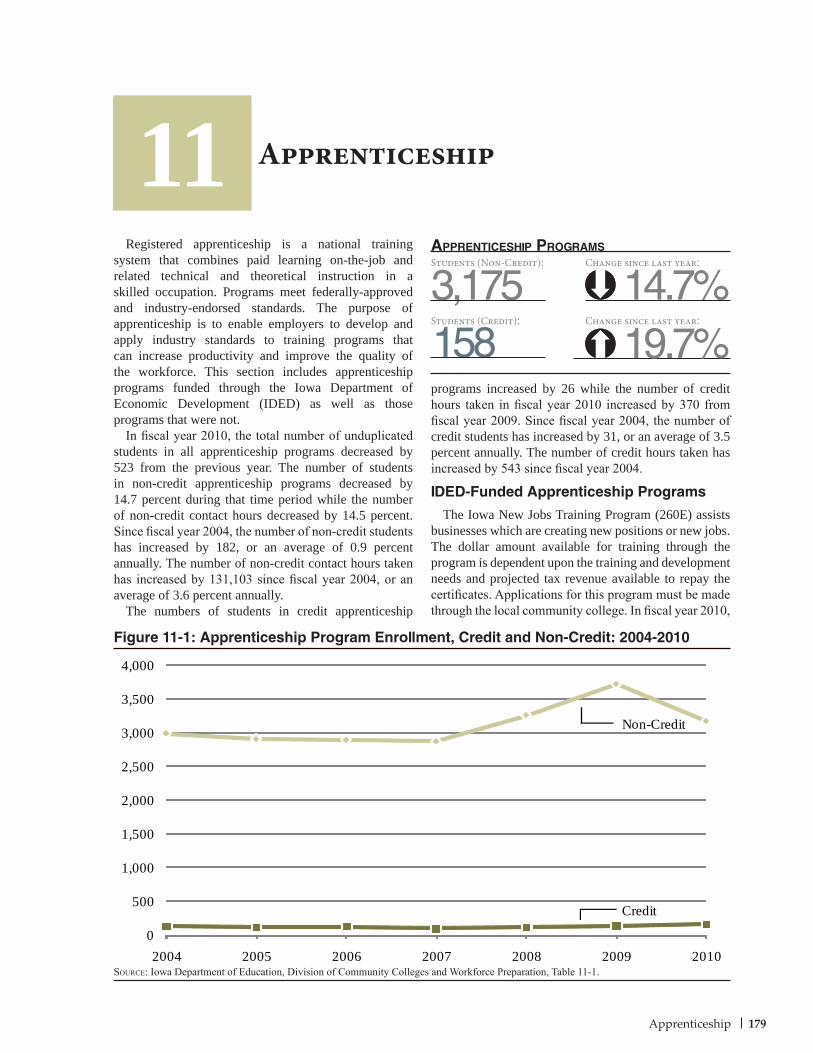
179Apprenticeship
3,175Students (Non-Credit): Change since last year:
14.7%aPPrenticesHiP Programs
158Students (Credit):
Figure 11-1: Apprenticeship Program Enrollment, Credit and Non-Credit: 2004-2010
Source: Iowa Department of Education, Division of Community Colleges and Workforce Preparation, Table 11-1.
Registered apprenticeship is a national training system that combines paid learning on-the-job and related technical and theoretical instruction in a skilled occupation. Programs meet federally-approved and industry-endorsed standards. The purpose of apprenticeship is to enable employers to develop and apply industry standards to training programs that can increase productivity and improve the quality of the workforce. This section includes apprenticeship programs funded through the Iowa Department of Economic Development (IDED) as well as those programs that were not.
In fiscal year 2010, the total number of unduplicated students in all apprenticeship programs decreased by 523 from the previous year. The number of students in non-credit apprenticeship programs decreased by 14.7 percent during that time period while the number of non-credit contact hours decreased by 14.5 percent. Since fiscal year 2004, the number of non-credit students has increased by 182, or an average of 0.9 percent annually. The number of non-credit contact hours taken has increased by 131,103 since fiscal year 2004, or an average of 3.6 percent annually.
The numbers of students in credit apprenticeship
programs increased by 26 while the number of credit hours taken in fiscal year 2010 increased by 370 from fiscal year 2009. Since fiscal year 2004, the number of credit students has increased by 31, or an average of 3.5 percent annually. The number of credit hours taken has increased by 543 since fiscal year 2004.
IDED-Funded Apprenticeship Programs
The Iowa New Jobs Training Program (260E) assists businesses which are creating new positions or new jobs. The dollar amount available for training through the program is dependent upon the training and development needs and projected tax revenue available to repay the certificates. Applications for this program must be made through the local community college. In fiscal year 2010,
Apprenticeship11
0
500
1,000
1,500
2,000
2,500
3,000
3,500
4,000
2004 2005 2006 2007 2008 2009 2010
Non-Credit
Credit
19.7%Change since last year:
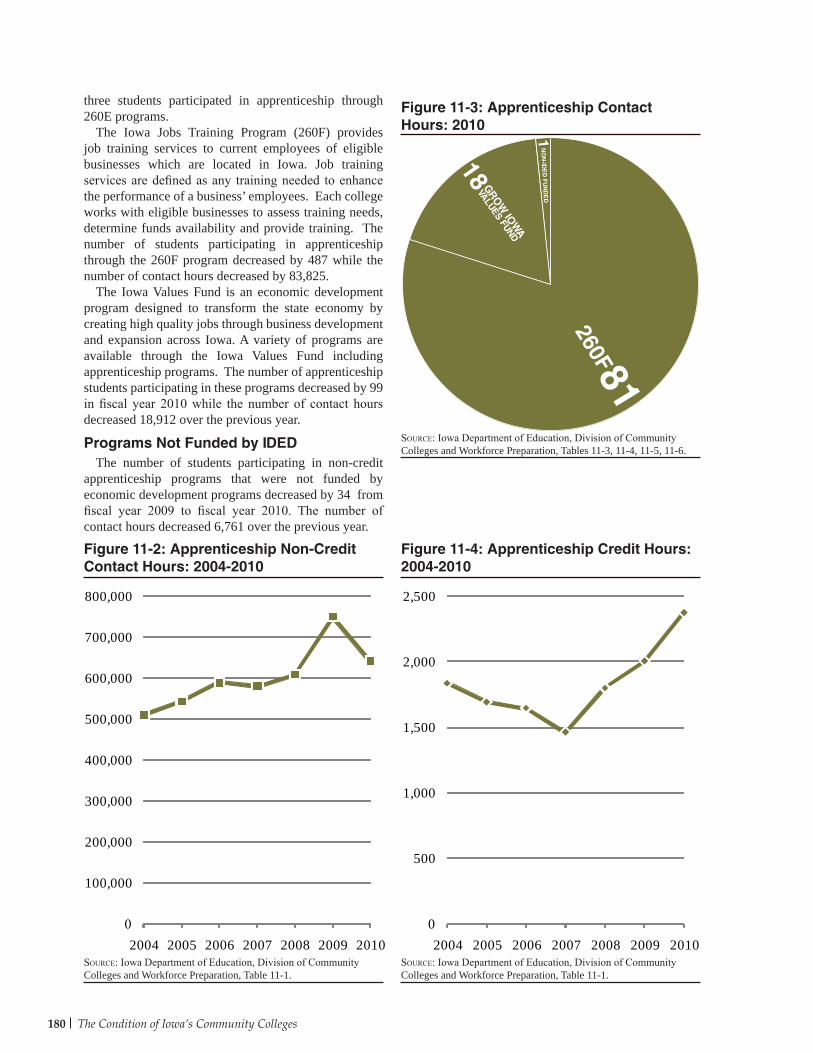
180 The Condition of Iowa’s Community Colleges
Figure 11-2: Apprenticeship Non-Credit Contact Hours: 2004-2010
three students participated in apprenticeship through 260E programs.
The Iowa Jobs Training Program (260F) provides job training services to current employees of eligible businesses which are located in Iowa. Job training services are defined as any training needed to enhance the performance of a business’ employees. Each college works with eligible businesses to assess training needs, determine funds availability and provide training. The number of students participating in apprenticeship through the 260F program decreased by 487 while the number of contact hours decreased by 83,825.
The Iowa Values Fund is an economic development program designed to transform the state economy by creating high quality jobs through business development and expansion across Iowa. A variety of programs are available through the Iowa Values Fund including apprenticeship programs. The number of apprenticeship students participating in these programs decreased by 99 in fiscal year 2010 while the number of contact hours decreased 18,912 over the previous year.
Programs Not Funded by IDEDThe number of students participating in non-credit
apprenticeship programs that were not funded by economic development programs decreased by 34 from fiscal year 2009 to fiscal year 2010. The number of contact hours decreased 6,761 over the previous year.
Source: Iowa Department of Education, Division of Community Colleges and Workforce Preparation, Table 11-1.
Figure 11-4: Apprenticeship Credit Hours: 2004-2010
Source: Iowa Department of Education, Division of Community Colleges and Workforce Preparation, Table 11-1.
Source: Iowa Department of Education, Division of Community Colleges and Workforce Preparation, Tables 11-3, 11-4, 11-5, 11-6.
Figure 11-3: Apprenticeship Contact Hours: 2010
0
100,000
200,000
300,000
400,000
500,000
600,000
700,000
800,000
2004 2005 2006 2007 2008 2009 20100
500
1,000
1,500
2,000
2,500
2004 2005 2006 2007 2008 2009 2010
260F81
GROW
IOW
A
VALUES FUND
18
NO
N-ID
ED
FU
ND
ED
1
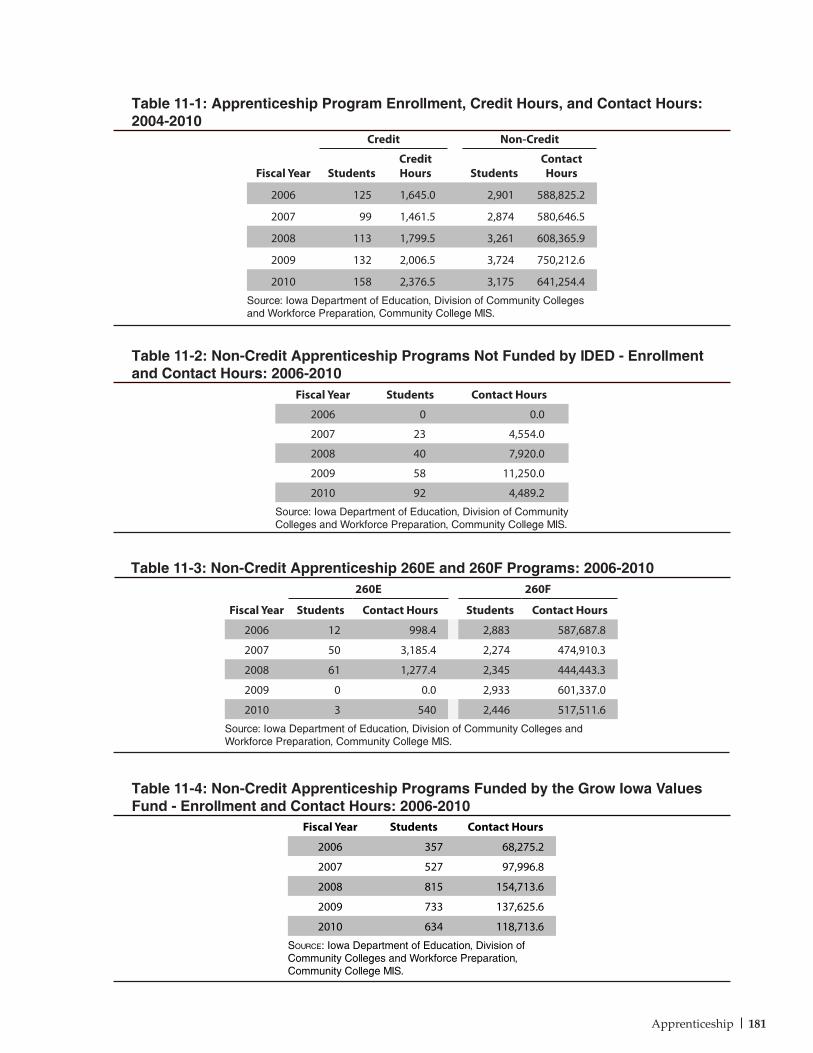
181Apprenticeship
260E 260F
Fiscal Year Students Contact Hours Students Contact Hours
2006 12 998.4 2,883 587,687.8
2007 50 3,185.4 2,274 474,910.3
2008 61 1,277.4 2,345 444,443.3
2009 0 0.0 2,933 601,337.0
2010 3 540 2,446 517,511.6
Source: Iowa Department of Education, Division of Community Colleges and Workforce Preparation, Community College MIS.
Fiscal Year
Credit Non-Credit
StudentsCredit Hours Students
Contact Hours
2006 125 1,645.0 2,901 588,825.2
2007 99 1,461.5 2,874 580,646.5
2008 113 1,799.5 3,261 608,365.9
2009 132 2,006.5 3,724 750,212.6
2010 158 2,376.5 3,175 641,254.4
Source: Iowa Department of Education, Division of Community Colleges and Workforce Preparation, Community College MIS.
Fiscal Year Students Contact Hours
2006 0 0.0
2007 23 4,554.0
2008 40 7,920.0
2009 58 11,250.0
2010 92 4,489.2
Source: Iowa Department of Education, Division of Community Colleges and Workforce Preparation, Community College MIS.
Fiscal Year Students Contact Hours
2006 357 68,275.2
2007 527 97,996.8
2008 815 154,713.6
2009 733 137,625.6
2010 634 118,713.6
Source: Iowa Department of Education, Division of Community Colleges and Workforce Preparation, Community College MIS.
Table 11-1: Apprenticeship Program Enrollment, Credit Hours, and Contact Hours: 2004-2010
Table 11-2: Non-Credit Apprenticeship Programs Not Funded by IDED - Enrollment and Contact Hours: 2006-2010
Table 11-4: Non-Credit Apprenticeship Programs Funded by the Grow Iowa Values Fund - Enrollment and Contact Hours: 2006-2010
Table 11-3: Non-Credit Apprenticeship 260E and 260F Programs: 2006-2010
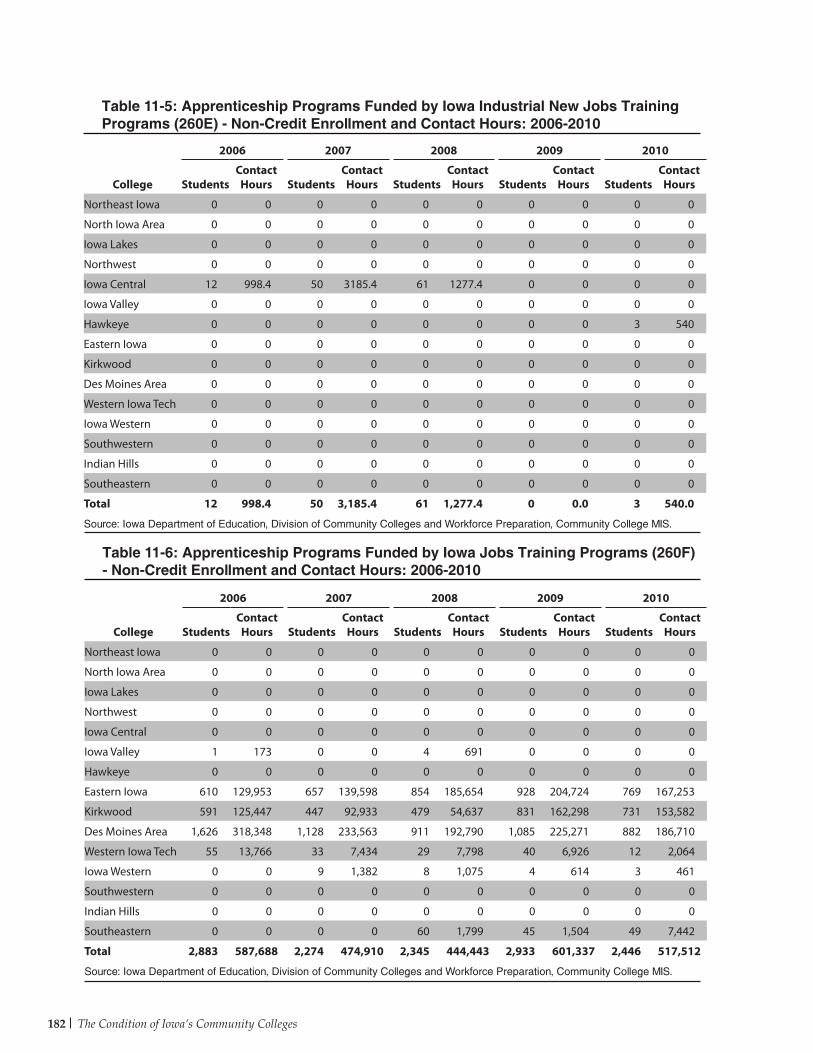
182 The Condition of Iowa’s Community Colleges
Table 11-6: Apprenticeship Programs Funded by Iowa Jobs Training Programs (260F) - Non-Credit Enrollment and Contact Hours: 2006-2010
College
2006 2007 2008 2009 2010
StudentsContact Hours Students
Contact Hours Students
Contact Hours Students
Contact Hours Students
Contact Hours
Northeast Iowa 0 0 0 0 0 0 0 0 0 0
North Iowa Area 0 0 0 0 0 0 0 0 0 0
Iowa Lakes 0 0 0 0 0 0 0 0 0 0
Northwest 0 0 0 0 0 0 0 0 0 0
Iowa Central 0 0 0 0 0 0 0 0 0 0
Iowa Valley 1 173 0 0 4 691 0 0 0 0
Hawkeye 0 0 0 0 0 0 0 0 0 0
Eastern Iowa 610 129,953 657 139,598 854 185,654 928 204,724 769 167,253
Kirkwood 591 125,447 447 92,933 479 54,637 831 162,298 731 153,582
Des Moines Area 1,626 318,348 1,128 233,563 911 192,790 1,085 225,271 882 186,710
Western Iowa Tech 55 13,766 33 7,434 29 7,798 40 6,926 12 2,064
Iowa Western 0 0 9 1,382 8 1,075 4 614 3 461
Southwestern 0 0 0 0 0 0 0 0 0 0
Indian Hills 0 0 0 0 0 0 0 0 0 0
Southeastern 0 0 0 0 60 1,799 45 1,504 49 7,442
Total 2,883 587,688 2,274 474,910 2,345 444,443 2,933 601,337 2,446 517,512
Source: Iowa Department of Education, Division of Community Colleges and Workforce Preparation, Community College MIS.
Table 11-5: Apprenticeship Programs Funded by Iowa Industrial New Jobs Training Programs (260E) - Non-Credit Enrollment and Contact Hours: 2006-2010
College
2006 2007 2008 2009 2010
StudentsContact Hours Students
Contact Hours Students
Contact Hours Students
Contact Hours Students
Contact Hours
Northeast Iowa 0 0 0 0 0 0 0 0 0 0
North Iowa Area 0 0 0 0 0 0 0 0 0 0
Iowa Lakes 0 0 0 0 0 0 0 0 0 0
Northwest 0 0 0 0 0 0 0 0 0 0
Iowa Central 12 998.4 50 3185.4 61 1277.4 0 0 0 0
Iowa Valley 0 0 0 0 0 0 0 0 0 0
Hawkeye 0 0 0 0 0 0 0 0 3 540
Eastern Iowa 0 0 0 0 0 0 0 0 0 0
Kirkwood 0 0 0 0 0 0 0 0 0 0
Des Moines Area 0 0 0 0 0 0 0 0 0 0
Western Iowa Tech 0 0 0 0 0 0 0 0 0 0
Iowa Western 0 0 0 0 0 0 0 0 0 0
Southwestern 0 0 0 0 0 0 0 0 0 0
Indian Hills 0 0 0 0 0 0 0 0 0 0
Southeastern 0 0 0 0 0 0 0 0 0 0
Total 12 998.4 50 3,185.4 61 1,277.4 0 0.0 3 540.0
Source: Iowa Department of Education, Division of Community Colleges and Workforce Preparation, Community College MIS.
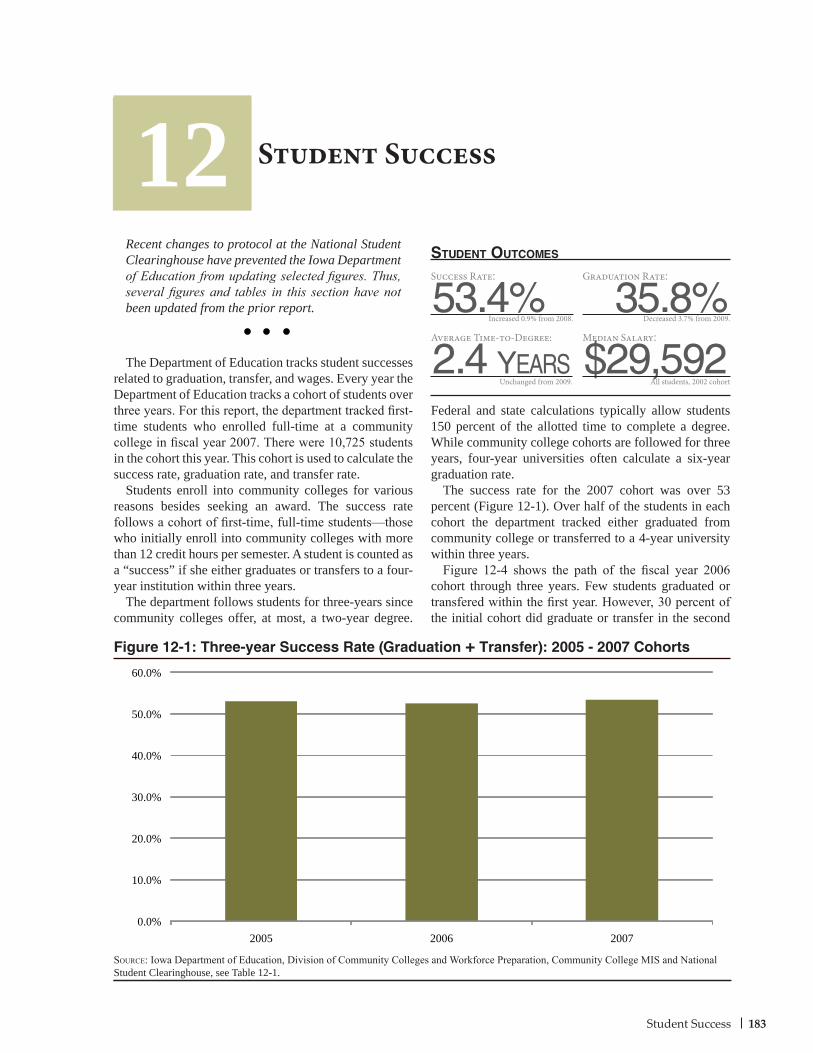
183Student Success
The Department of Education tracks student successes related to graduation, transfer, and wages. Every year the Department of Education tracks a cohort of students over three years. For this report, the department tracked first-time students who enrolled full-time at a community college in fiscal year 2007. There were 10,725 students in the cohort this year. This cohort is used to calculate the success rate, graduation rate, and transfer rate.
Students enroll into community colleges for various reasons besides seeking an award. The success rate follows a cohort of first-time, full-time students—those who initially enroll into community colleges with more than 12 credit hours per semester. A student is counted as a “success” if she either graduates or transfers to a four-year institution within three years.
The department follows students for three-years since community colleges offer, at most, a two-year degree.
Federal and state calculations typically allow students 150 percent of the allotted time to complete a degree. While community college cohorts are followed for three years, four-year universities often calculate a six-year graduation rate.
The success rate for the 2007 cohort was over 53 percent (Figure 12-1). Over half of the students in each cohort the department tracked either graduated from community college or transferred to a 4-year university within three years.
Figure 12-4 shows the path of the fiscal year 2006 cohort through three years. Few students graduated or transfered within the first year. However, 30 percent of the initial cohort did graduate or transfer in the second
Student Success
Figure 12-1: Three-year Success Rate (Graduation + Transfer): 2005 - 2007 Cohorts
12
Source: Iowa Department of Education, Division of Community Colleges and Workforce Preparation, Community College MIS and National Student Clearinghouse, see Table 12-1.
stuDent outcomes
Success Rate:
53.4%Average Time-to-Degree:
2.4 YeArS
0.0%
10.0%
20.0%
30.0%
40.0%
50.0%
60.0%
2005 2006 2007
Increased 0.9% from 2008.
Unchanged from 2009.
Recent changes to protocol at the National Student Clearinghouse have prevented the Iowa Department of Education from updating selected figures. Thus, several figures and tables in this section have not been updated from the prior report.
Median Salary:
$29,592All students, 2002 cohort
Graduation Rate:
35.8%Decreased 3.7% from 2009.
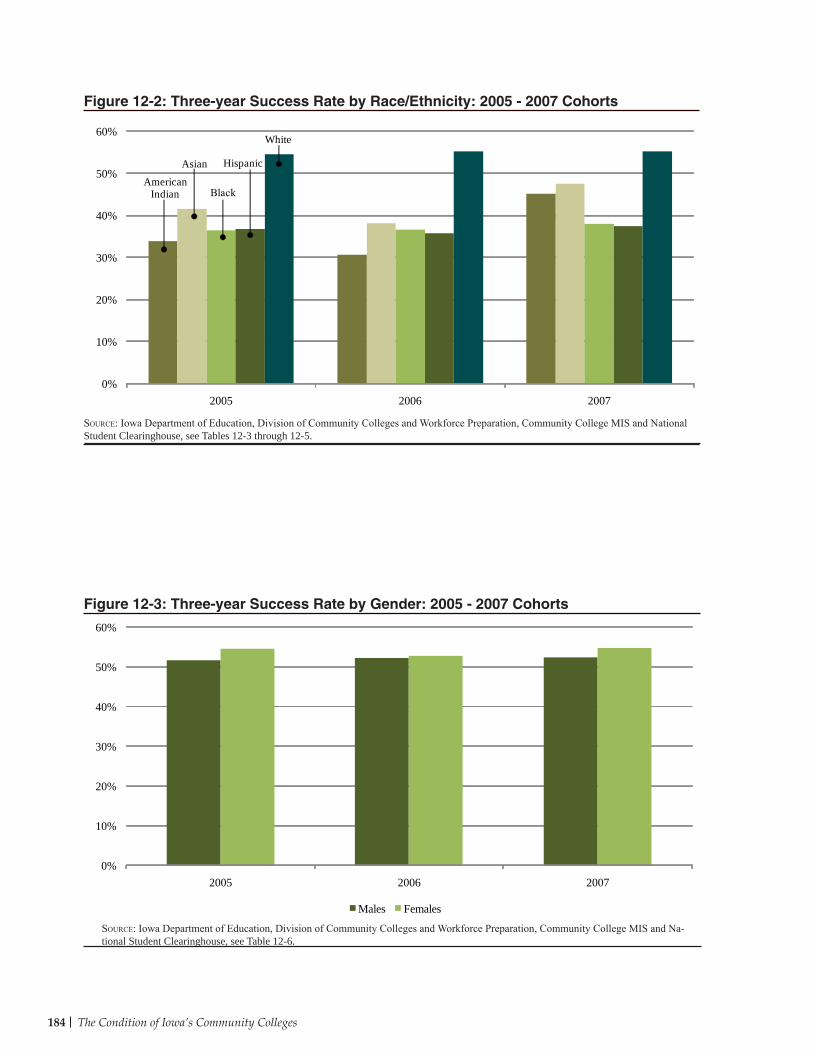
184 The Condition of Iowa’s Community Colleges
Figure 12-2: Three-year Success Rate by Race/Ethnicity: 2005 - 2007 Cohorts
Source: Iowa Department of Education, Division of Community Colleges and Workforce Preparation, Community College MIS and National Student Clearinghouse, see Tables 12-3 through 12-5.
Figure 12-3: Three-year Success Rate by Gender: 2005 - 2007 Cohorts
Source: Iowa Department of Education, Division of Community Colleges and Workforce Preparation, Community College MIS and Na-tional Student Clearinghouse, see Table 12-6.
0%
10%
20%
30%
40%
50%
60%
2005 2006 2007
Males Females
0%
10%
20%
30%
40%
50%
60%
2005 2006 2007
AmericanIndian
Asian
Black
Hispanic
White
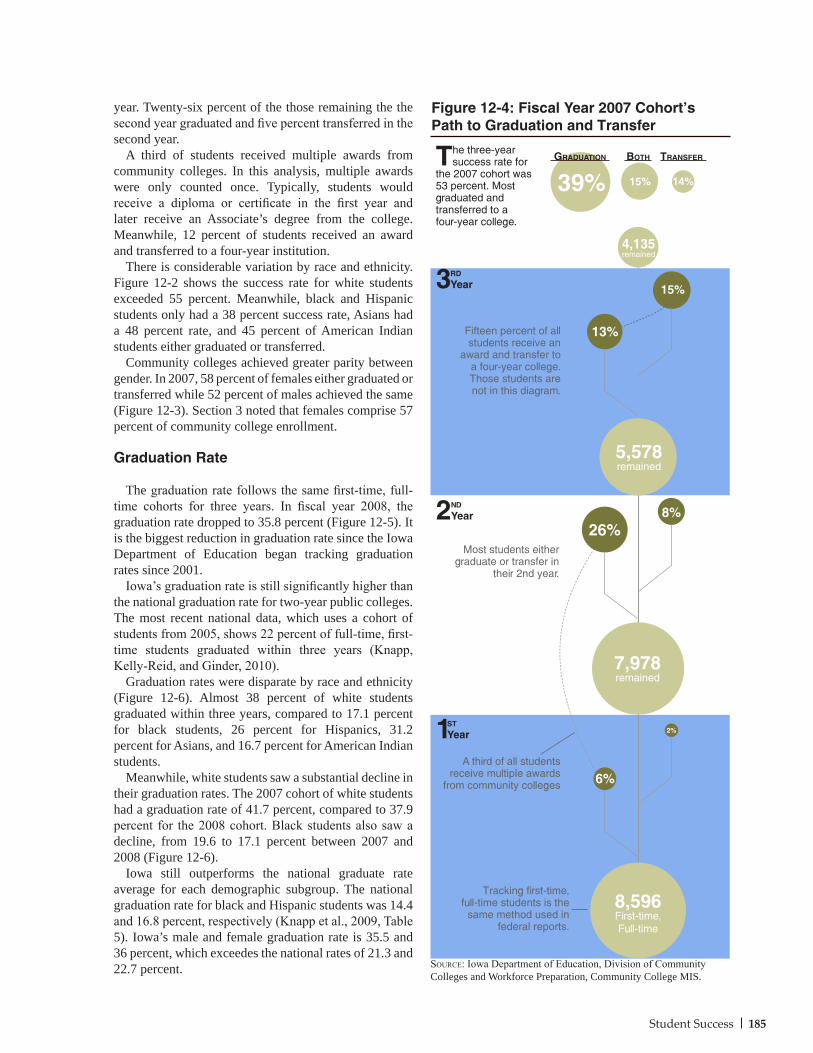
185Student Success
1st
Year
Tracking first-time, full-time students is the
same method used in federal reports.
Figure 12-4: Fiscal Year 2007 Cohort’s Path to Graduation and Transfer
The three-year success rate for
the 2007 cohort was 53 percent. Most graduated andtransferred to afour-year college.
graDuation transFer
39% 14%
A third of all students receive multiple awards
from community colleges
Most students either graduate or transfer in
their 2nd year.
6%
2%
8%26%
13%
15%
15%
botH
Fifteen percent of allstudents receive an
award and transfer toa four-year college. Those students are not in this diagram.
2nD
Year
3rD
Year
Source: Iowa Department of Education, Division of Community Colleges and Workforce Preparation, Community College MIS.
8,596First-time,Full-time
7,978remained
5,578remained
4,135remained
year. Twenty-six percent of the those remaining the the second year graduated and five percent transferred in the second year.
A third of students received multiple awards from community colleges. In this analysis, multiple awards were only counted once. Typically, students would receive a diploma or certificate in the first year and later receive an Associate’s degree from the college. Meanwhile, 12 percent of students received an award and transferred to a four-year institution.
There is considerable variation by race and ethnicity. Figure 12-2 shows the success rate for white students exceeded 55 percent. Meanwhile, black and Hispanic students only had a 38 percent success rate, Asians had a 48 percent rate, and 45 percent of American Indian students either graduated or transferred.
Community colleges achieved greater parity between gender. In 2007, 58 percent of females either graduated or transferred while 52 percent of males achieved the same (Figure 12-3). Section 3 noted that females comprise 57 percent of community college enrollment.
Graduation Rate
The graduation rate follows the same first-time, full-time cohorts for three years. In fiscal year 2008, the graduation rate dropped to 35.8 percent (Figure 12-5). It is the biggest reduction in graduation rate since the Iowa Department of Education began tracking graduation rates since 2001.
Iowa’s graduation rate is still significantly higher than the national graduation rate for two-year public colleges. The most recent national data, which uses a cohort of students from 2005, shows 22 percent of full-time, first-time students graduated within three years (Knapp, Kelly-Reid, and Ginder, 2010).
Graduation rates were disparate by race and ethnicity (Figure 12-6). Almost 38 percent of white students graduated within three years, compared to 17.1 percent for black students, 26 percent for Hispanics, 31.2 percent for Asians, and 16.7 percent for American Indian students.
Meanwhile, white students saw a substantial decline in their graduation rates. The 2007 cohort of white students had a graduation rate of 41.7 percent, compared to 37.9 percent for the 2008 cohort. Black students also saw a decline, from 19.6 to 17.1 percent between 2007 and 2008 (Figure 12-6).
Iowa still outperforms the national graduate rate average for each demographic subgroup. The national graduation rate for black and Hispanic students was 14.4 and 16.8 percent, respectively (Knapp et al., 2009, Table 5). Iowa’s male and female graduation rate is 35.5 and 36 percent, which exceedes the national rates of 21.3 and 22.7 percent.
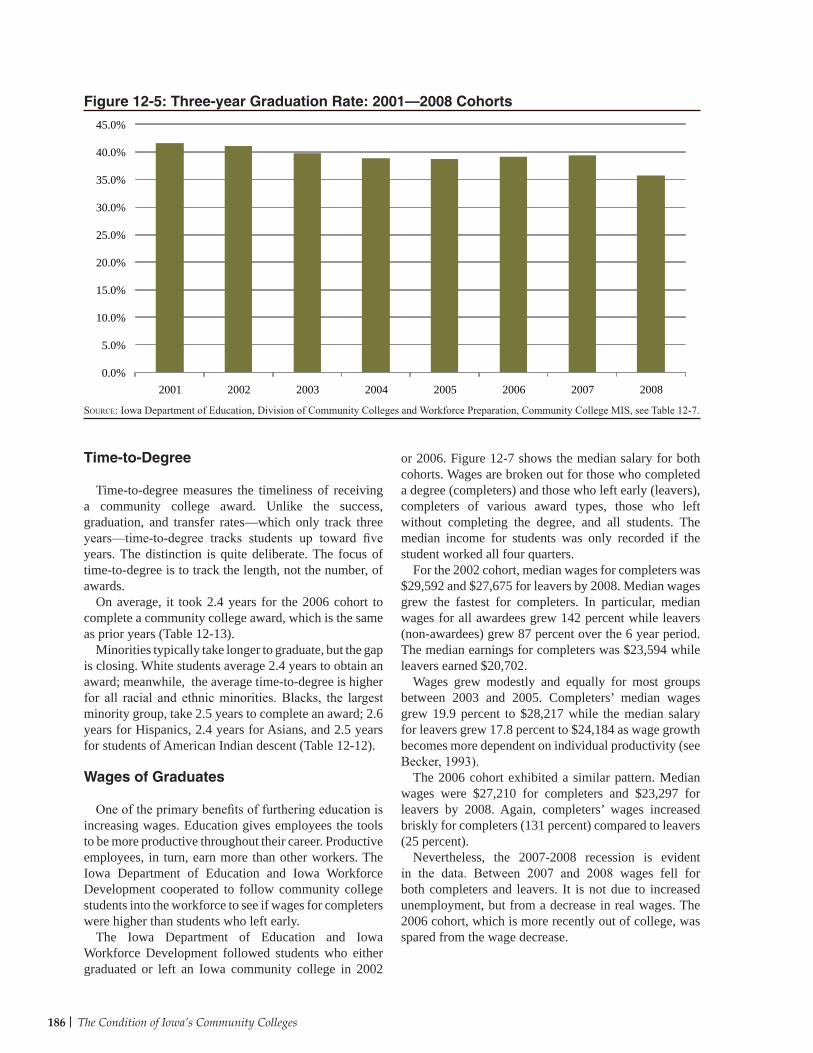
186 The Condition of Iowa’s Community Colleges
Time-to-Degree
Time-to-degree measures the timeliness of receiving a community college award. Unlike the success, graduation, and transfer rates—which only track three years—time-to-degree tracks students up toward five years. The distinction is quite deliberate. The focus of time-to-degree is to track the length, not the number, of awards.
On average, it took 2.4 years for the 2006 cohort to complete a community college award, which is the same as prior years (Table 12-13).
Minorities typically take longer to graduate, but the gap is closing. White students average 2.4 years to obtain an award; meanwhile, the average time-to-degree is higher for all racial and ethnic minorities. Blacks, the largest minority group, take 2.5 years to complete an award; 2.6 years for Hispanics, 2.4 years for Asians, and 2.5 years for students of American Indian descent (Table 12-12).
Wages of Graduates
One of the primary benefits of furthering education is increasing wages. Education gives employees the tools to be more productive throughout their career. Productive employees, in turn, earn more than other workers. The Iowa Department of Education and Iowa Workforce Development cooperated to follow community college students into the workforce to see if wages for completers were higher than students who left early.
The Iowa Department of Education and Iowa Workforce Development followed students who either graduated or left an Iowa community college in 2002
or 2006. Figure 12-7 shows the median salary for both cohorts. Wages are broken out for those who completed a degree (completers) and those who left early (leavers), completers of various award types, those who left without completing the degree, and all students. The median income for students was only recorded if the student worked all four quarters.
For the 2002 cohort, median wages for completers was $29,592 and $27,675 for leavers by 2008. Median wages grew the fastest for completers. In particular, median wages for all awardees grew 142 percent while leavers (non-awardees) grew 87 percent over the 6 year period. The median earnings for completers was $23,594 while leavers earned $20,702.
Wages grew modestly and equally for most groups between 2003 and 2005. Completers’ median wages grew 19.9 percent to $28,217 while the median salary for leavers grew 17.8 percent to $24,184 as wage growth becomes more dependent on individual productivity (see Becker, 1993).
The 2006 cohort exhibited a similar pattern. Median wages were $27,210 for completers and $23,297 for leavers by 2008. Again, completers’ wages increased briskly for completers (131 percent) compared to leavers (25 percent).
Nevertheless, the 2007-2008 recession is evident in the data. Between 2007 and 2008 wages fell for both completers and leavers. It is not due to increased unemployment, but from a decrease in real wages. The 2006 cohort, which is more recently out of college, was spared from the wage decrease.
Figure 12-5: Three-year Graduation Rate: 2001–2008 Cohorts
Source: Iowa Department of Education, Division of Community Colleges and Workforce Preparation, Community College MIS, see Table 12-7.
0.0%
5.0%
10.0%
15.0%
20.0%
25.0%
30.0%
35.0%
40.0%
45.0%
2001 2002 2003 2004 2005 2006 2007 2008
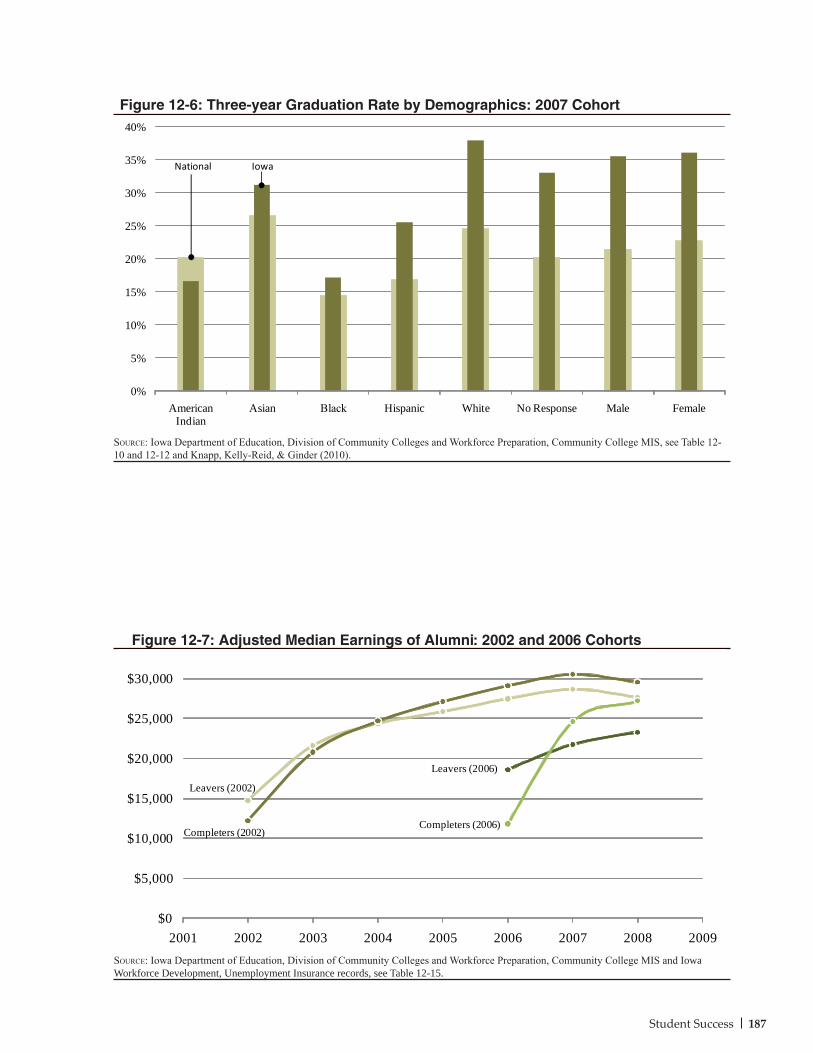
187Student Success
Figure 12-6: Three-year Graduation Rate by Demographics: 2007 Cohort
Source: Iowa Department of Education, Division of Community Colleges and Workforce Preparation, Community College MIS, see Table 12-10 and 12-12 and Knapp, Kelly-Reid, & Ginder (2010).
Figure 12-7: Adjusted Median Earnings of Alumni: 2002 and 2006 Cohorts
Source: Iowa Department of Education, Division of Community Colleges and Workforce Preparation, Community College MIS and Iowa Workforce Development, Unemployment Insurance records, see Table 12-15.
$0
$5,000
$10,000
$15,000
$20,000
$25,000
$30,000
2001 2002 2003 2004 2005 2006 2007 2008 2009
Leavers (2006)
Completers (2006)
Leavers (2002)
Completers (2002)
0%
5%
10%
15%
20%
25%
30%
35%
40%
American Indian
Asian Black Hispanic White No Response Male Female
IowaNational
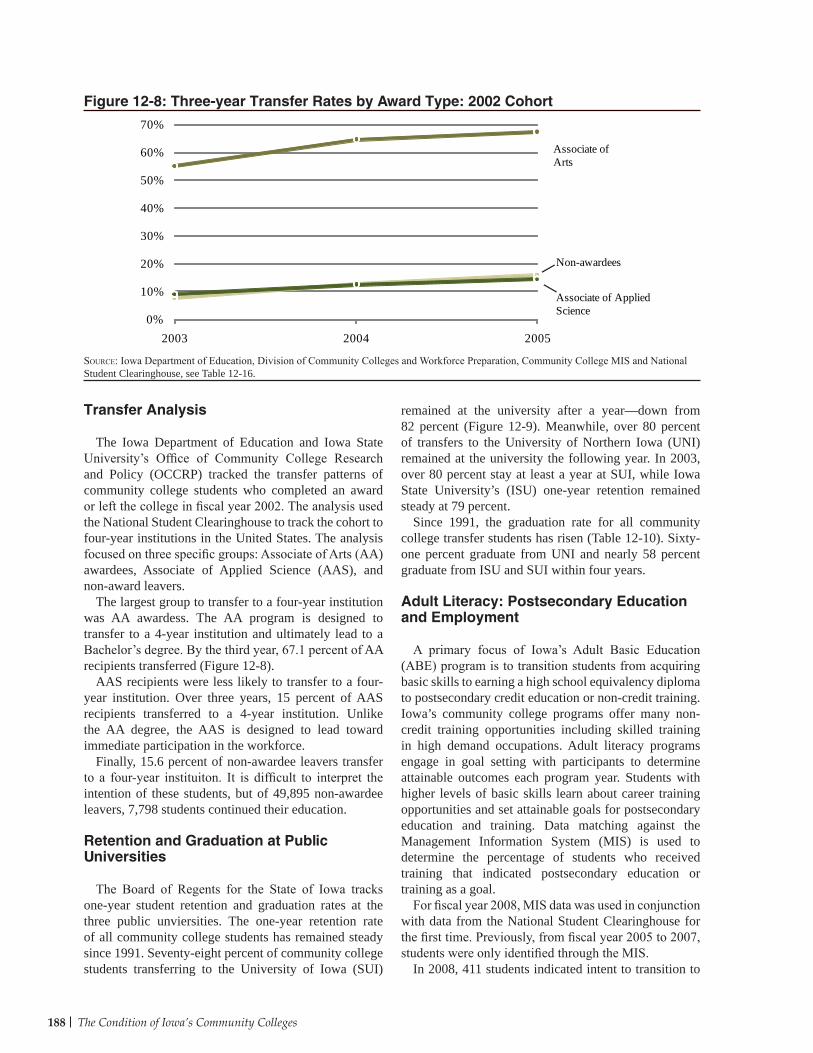
188 The Condition of Iowa’s Community Colleges
Figure 12-8: Three-year Transfer Rates by Award Type: 2002 Cohort
Source: Iowa Department of Education, Division of Community Colleges and Workforce Preparation, Community College MIS and National Student Clearinghouse, see Table 12-16.
0%
10%
20%
30%
40%
50%
60%
70%
2003 2004 2005
Associate of Arts
Non-awardees
Associate of AppliedScience
remained at the university after a year—down from 82 percent (Figure 12-9). Meanwhile, over 80 percent of transfers to the University of Northern Iowa (UNI) remained at the university the following year. In 2003, over 80 percent stay at least a year at SUI, while Iowa State University’s (ISU) one-year retention remained steady at 79 percent.
Since 1991, the graduation rate for all community college transfer students has risen (Table 12-10). Sixty-one percent graduate from UNI and nearly 58 percent graduate from ISU and SUI within four years.
Adult Literacy: Postsecondary Education and Employment
A primary focus of Iowa’s Adult Basic Education (ABE) program is to transition students from acquiring basic skills to earning a high school equivalency diploma to postsecondary credit education or non-credit training. Iowa’s community college programs offer many non-credit training opportunities including skilled training in high demand occupations. Adult literacy programs engage in goal setting with participants to determine attainable outcomes each program year. Students with higher levels of basic skills learn about career training opportunities and set attainable goals for postsecondary education and training. Data matching against the Management Information System (MIS) is used to determine the percentage of students who received training that indicated postsecondary education or training as a goal.
For fiscal year 2008, MIS data was used in conjunction with data from the National Student Clearinghouse for the first time. Previously, from fiscal year 2005 to 2007, students were only identified through the MIS.
In 2008, 411 students indicated intent to transition to
Transfer Analysis
The Iowa Department of Education and Iowa State University’s Office of Community College Research and Policy (OCCRP) tracked the transfer patterns of community college students who completed an award or left the college in fiscal year 2002. The analysis used the National Student Clearinghouse to track the cohort to four-year institutions in the United States. The analysis focused on three specific groups: Associate of Arts (AA) awardees, Associate of Applied Science (AAS), and non-award leavers.
The largest group to transfer to a four-year institution was AA awardess. The AA program is designed to transfer to a 4-year institution and ultimately lead to a Bachelor’s degree. By the third year, 67.1 percent of AA recipients transferred (Figure 12-8).
AAS recipients were less likely to transfer to a four-year institution. Over three years, 15 percent of AAS recipients transferred to a 4-year institution. Unlike the AA degree, the AAS is designed to lead toward immediate participation in the workforce.
Finally, 15.6 percent of non-awardee leavers transfer to a four-year instituiton. It is difficult to interpret the intention of these students, but of 49,895 non-awardee leavers, 7,798 students continued their education.
Retention and Graduation at Public Universities
The Board of Regents for the State of Iowa tracks one-year student retention and graduation rates at the three public unviersities. The one-year retention rate of all community college students has remained steady since 1991. Seventy-eight percent of community college students transferring to the University of Iowa (SUI)
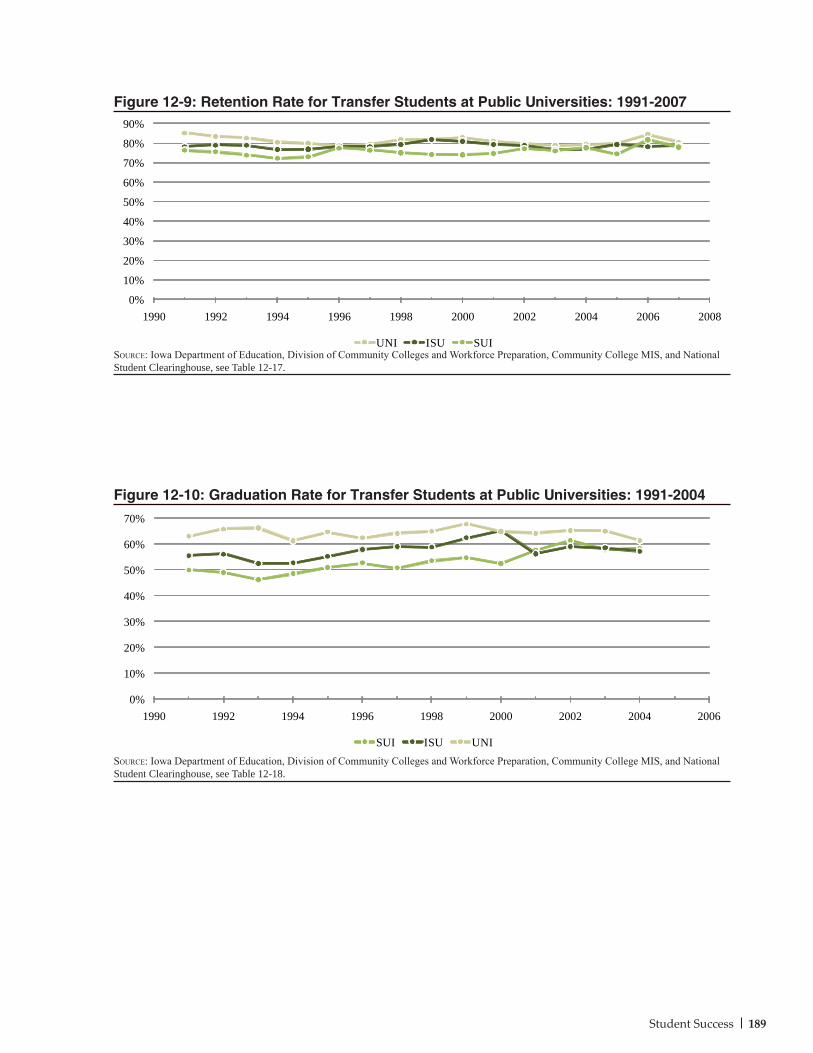
189Student Success
Figure 12-9: Retention Rate for Transfer Students at Public Universities: 1991-2007
Source: Iowa Department of Education, Division of Community Colleges and Workforce Preparation, Community College MIS, and National Student Clearinghouse, see Table 12-17.
Figure 12-10: Graduation Rate for Transfer Students at Public Universities: 1991-2004
Source: Iowa Department of Education, Division of Community Colleges and Workforce Preparation, Community College MIS, and National Student Clearinghouse, see Table 12-18.
0%
10%
20%
30%
40%
50%
60%
70%
80%
90%
1990 1992 1994 1996 1998 2000 2002 2004 2006 2008
UNI ISU SUI
0%
10%
20%
30%
40%
50%
60%
70%
1990 1992 1994 1996 1998 2000 2002 2004 2006
SUI ISU UNI
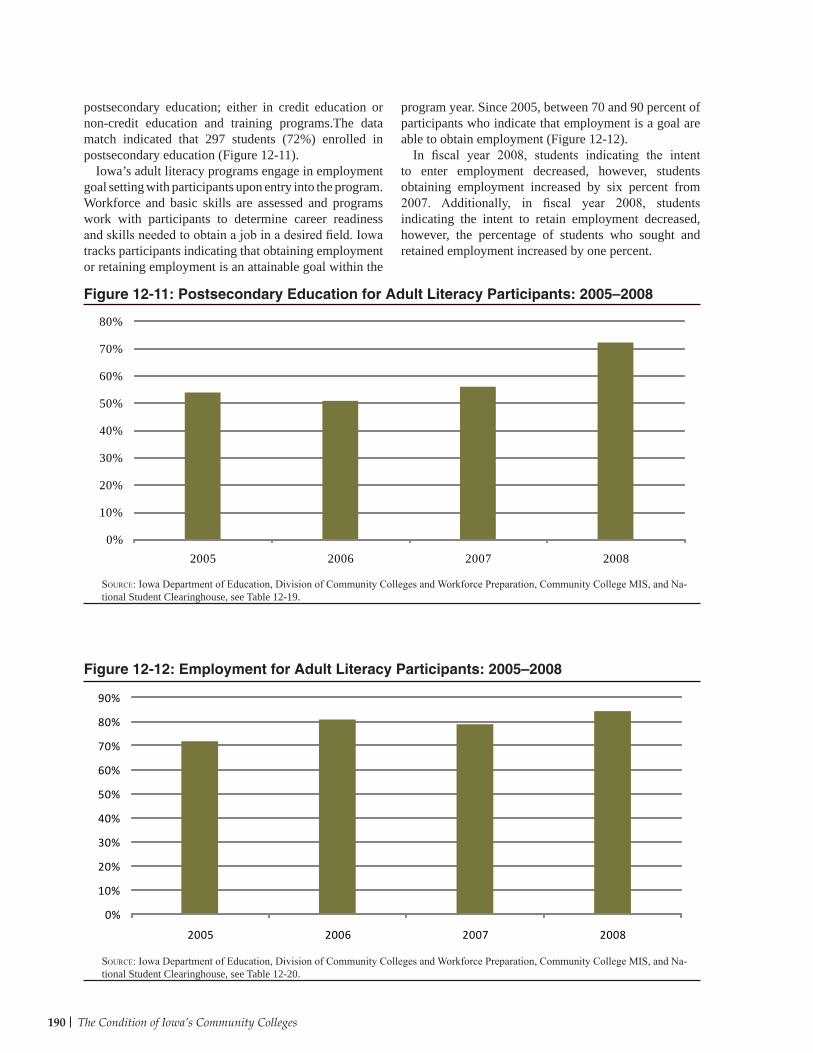
190 The Condition of Iowa’s Community Colleges
postsecondary education; either in credit education or non-credit education and training programs.The data match indicated that 297 students (72%) enrolled in postsecondary education (Figure 12-11).
Iowa’s adult literacy programs engage in employment goal setting with participants upon entry into the program. Workforce and basic skills are assessed and programs work with participants to determine career readiness and skills needed to obtain a job in a desired field. Iowa tracks participants indicating that obtaining employment or retaining employment is an attainable goal within the
program year. Since 2005, between 70 and 90 percent of participants who indicate that employment is a goal are able to obtain employment (Figure 12-12).
In fiscal year 2008, students indicating the intent to enter employment decreased, however, students obtaining employment increased by six percent from 2007. Additionally, in fiscal year 2008, students indicating the intent to retain employment decreased, however, the percentage of students who sought and retained employment increased by one percent.
0%
10%
20%
30%
40%
50%
60%
70%
80%
90%
2005 2006 2007 2008
Figure 12-11: Postsecondary Education for Adult Literacy Participants: 2005—2008
Figure 12-12: Employment for Adult Literacy Participants: 2005—2008
Source: Iowa Department of Education, Division of Community Colleges and Workforce Preparation, Community College MIS, and Na-tional Student Clearinghouse, see Table 12-19.
Source: Iowa Department of Education, Division of Community Colleges and Workforce Preparation, Community College MIS, and Na-tional Student Clearinghouse, see Table 12-20.
0%
10%
20%
30%
40%
50%
60%
70%
80%
2005 2006 2007 2008
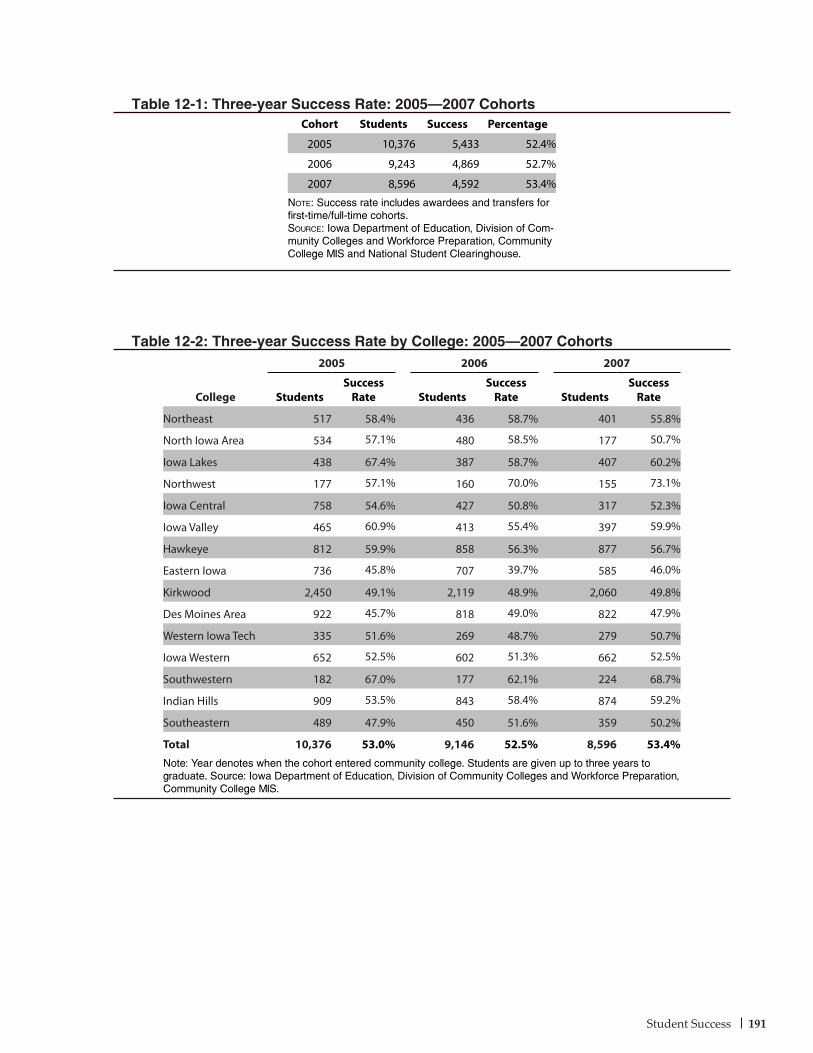
Student Success 191
Table 12-1: Three-year Success Rate: 2005–2007 Cohorts
Table 12-2: Three-year Success Rate by College: 2005–2007 Cohorts
Cohort Students Success Percentage
2005 10,376 5,433 52.4%
2006 9,243 4,869 52.7%
2007 8,596 4,592 53.4%
Note: Success rate includes awardees and transfers for first-time/full-time cohorts.Source: Iowa Department of Education, Division of Com-munity Colleges and Workforce Preparation, Community College MIS and National Student Clearinghouse.
College
2005 2006 2007
StudentsSuccess
Rate StudentsSuccess
Rate StudentsSuccess
Rate
Northeast 517 58.4% 436 58.7% 401 55.8%
North Iowa Area 534 57.1% 480 58.5% 177 50.7%
Iowa Lakes 438 67.4% 387 58.7% 407 60.2%
Northwest 177 57.1% 160 70.0% 155 73.1%
Iowa Central 758 54.6% 427 50.8% 317 52.3%
Iowa Valley 465 60.9% 413 55.4% 397 59.9%
Hawkeye 812 59.9% 858 56.3% 877 56.7%
Eastern Iowa 736 45.8% 707 39.7% 585 46.0%
Kirkwood 2,450 49.1% 2,119 48.9% 2,060 49.8%
Des Moines Area 922 45.7% 818 49.0% 822 47.9%
Western Iowa Tech 335 51.6% 269 48.7% 279 50.7%
Iowa Western 652 52.5% 602 51.3% 662 52.5%
Southwestern 182 67.0% 177 62.1% 224 68.7%
Indian Hills 909 53.5% 843 58.4% 874 59.2%
Southeastern 489 47.9% 450 51.6% 359 50.2%
Total 10,376 53.0% 9,146 52.5% 8,596 53.4%Note: Year denotes when the cohort entered community college. Students are given up to three years to graduate. Source: Iowa Department of Education, Division of Community Colleges and Workforce Preparation, Community College MIS.
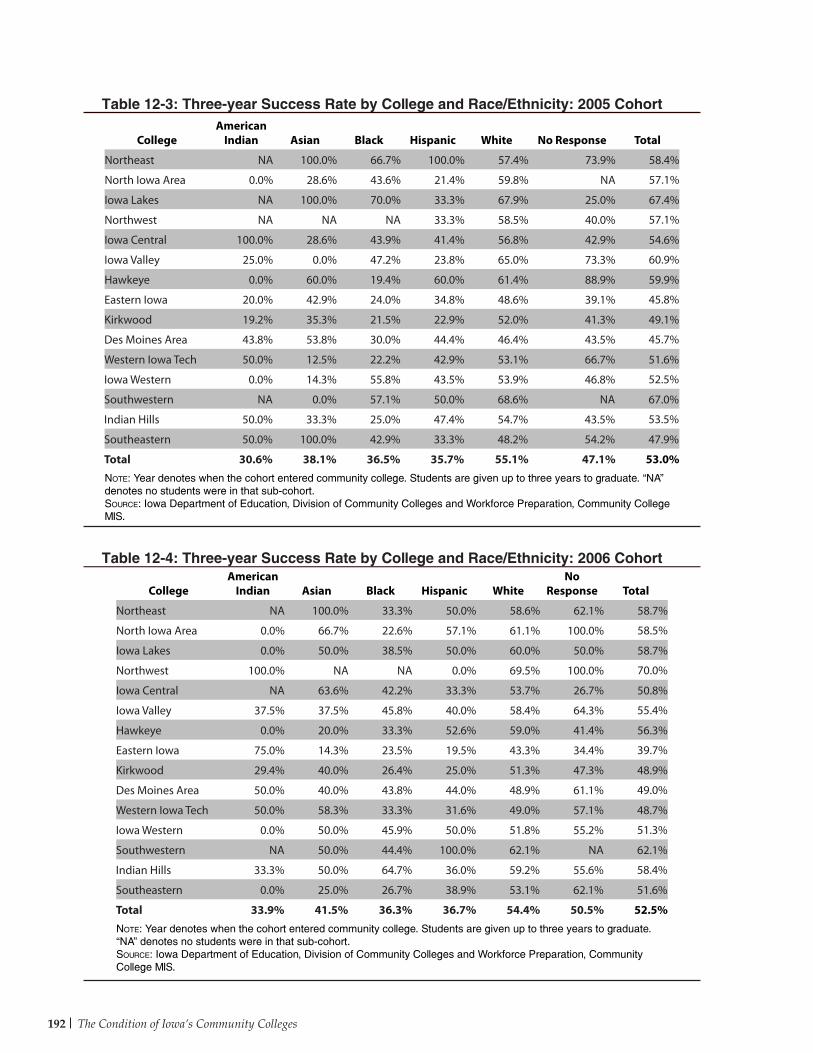
The Condition of Iowa’s Community Colleges192
CollegeAmerican
Indian Asian Black Hispanic White No Response Total
Northeast NA 100.0% 66.7% 100.0% 57.4% 73.9% 58.4%
North Iowa Area 0.0% 28.6% 43.6% 21.4% 59.8% NA 57.1%
Iowa Lakes NA 100.0% 70.0% 33.3% 67.9% 25.0% 67.4%
Northwest NA NA NA 33.3% 58.5% 40.0% 57.1%
Iowa Central 100.0% 28.6% 43.9% 41.4% 56.8% 42.9% 54.6%
Iowa Valley 25.0% 0.0% 47.2% 23.8% 65.0% 73.3% 60.9%
Hawkeye 0.0% 60.0% 19.4% 60.0% 61.4% 88.9% 59.9%
Eastern Iowa 20.0% 42.9% 24.0% 34.8% 48.6% 39.1% 45.8%
Kirkwood 19.2% 35.3% 21.5% 22.9% 52.0% 41.3% 49.1%
Des Moines Area 43.8% 53.8% 30.0% 44.4% 46.4% 43.5% 45.7%
Western Iowa Tech 50.0% 12.5% 22.2% 42.9% 53.1% 66.7% 51.6%
Iowa Western 0.0% 14.3% 55.8% 43.5% 53.9% 46.8% 52.5%
Southwestern NA 0.0% 57.1% 50.0% 68.6% NA 67.0%
Indian Hills 50.0% 33.3% 25.0% 47.4% 54.7% 43.5% 53.5%
Southeastern 50.0% 100.0% 42.9% 33.3% 48.2% 54.2% 47.9%
Total 30.6% 38.1% 36.5% 35.7% 55.1% 47.1% 53.0%Note: Year denotes when the cohort entered community college. Students are given up to three years to graduate. “NA” denotes no students were in that sub-cohort.Source: Iowa Department of Education, Division of Community Colleges and Workforce Preparation, Community College MIS.
Table 12-3: Three-year Success Rate by College and Race/Ethnicity: 2005 Cohort
Table 12-4: Three-year Success Rate by College and Race/Ethnicity: 2006 Cohort
CollegeAmerican
Indian Asian Black Hispanic WhiteNo
Response Total
Northeast NA 100.0% 33.3% 50.0% 58.6% 62.1% 58.7%
North Iowa Area 0.0% 66.7% 22.6% 57.1% 61.1% 100.0% 58.5%
Iowa Lakes 0.0% 50.0% 38.5% 50.0% 60.0% 50.0% 58.7%
Northwest 100.0% NA NA 0.0% 69.5% 100.0% 70.0%
Iowa Central NA 63.6% 42.2% 33.3% 53.7% 26.7% 50.8%
Iowa Valley 37.5% 37.5% 45.8% 40.0% 58.4% 64.3% 55.4%
Hawkeye 0.0% 20.0% 33.3% 52.6% 59.0% 41.4% 56.3%
Eastern Iowa 75.0% 14.3% 23.5% 19.5% 43.3% 34.4% 39.7%
Kirkwood 29.4% 40.0% 26.4% 25.0% 51.3% 47.3% 48.9%
Des Moines Area 50.0% 40.0% 43.8% 44.0% 48.9% 61.1% 49.0%
Western Iowa Tech 50.0% 58.3% 33.3% 31.6% 49.0% 57.1% 48.7%
Iowa Western 0.0% 50.0% 45.9% 50.0% 51.8% 55.2% 51.3%
Southwestern NA 50.0% 44.4% 100.0% 62.1% NA 62.1%
Indian Hills 33.3% 50.0% 64.7% 36.0% 59.2% 55.6% 58.4%
Southeastern 0.0% 25.0% 26.7% 38.9% 53.1% 62.1% 51.6%
Total 33.9% 41.5% 36.3% 36.7% 54.4% 50.5% 52.5%Note: Year denotes when the cohort entered community college. Students are given up to three years to graduate. “NA” denotes no students were in that sub-cohort.Source: Iowa Department of Education, Division of Community Colleges and Workforce Preparation, Community College MIS.
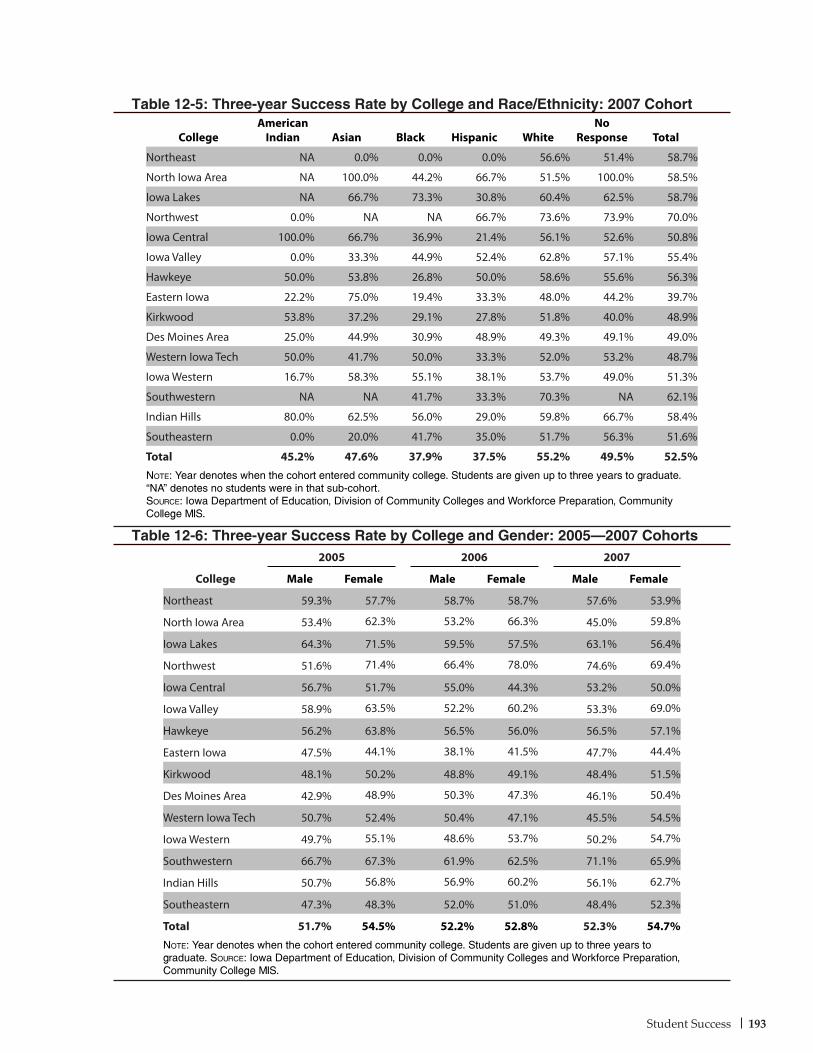
Student Success 193
Table 12-5: Three-year Success Rate by College and Race/Ethnicity: 2007 Cohort
CollegeAmerican
Indian Asian Black Hispanic WhiteNo
Response Total
Northeast NA 0.0% 0.0% 0.0% 56.6% 51.4% 58.7%
North Iowa Area NA 100.0% 44.2% 66.7% 51.5% 100.0% 58.5%
Iowa Lakes NA 66.7% 73.3% 30.8% 60.4% 62.5% 58.7%
Northwest 0.0% NA NA 66.7% 73.6% 73.9% 70.0%
Iowa Central 100.0% 66.7% 36.9% 21.4% 56.1% 52.6% 50.8%
Iowa Valley 0.0% 33.3% 44.9% 52.4% 62.8% 57.1% 55.4%
Hawkeye 50.0% 53.8% 26.8% 50.0% 58.6% 55.6% 56.3%
Eastern Iowa 22.2% 75.0% 19.4% 33.3% 48.0% 44.2% 39.7%
Kirkwood 53.8% 37.2% 29.1% 27.8% 51.8% 40.0% 48.9%
Des Moines Area 25.0% 44.9% 30.9% 48.9% 49.3% 49.1% 49.0%
Western Iowa Tech 50.0% 41.7% 50.0% 33.3% 52.0% 53.2% 48.7%
Iowa Western 16.7% 58.3% 55.1% 38.1% 53.7% 49.0% 51.3%
Southwestern NA NA 41.7% 33.3% 70.3% NA 62.1%
Indian Hills 80.0% 62.5% 56.0% 29.0% 59.8% 66.7% 58.4%
Southeastern 0.0% 20.0% 41.7% 35.0% 51.7% 56.3% 51.6%
Total 45.2% 47.6% 37.9% 37.5% 55.2% 49.5% 52.5%Note: Year denotes when the cohort entered community college. Students are given up to three years to graduate. “NA” denotes no students were in that sub-cohort.Source: Iowa Department of Education, Division of Community Colleges and Workforce Preparation, Community College MIS.
Table 12-6: Three-year Success Rate by College and Gender: 2005–2007 Cohorts
College
2005 2006 2007
Male Female Male Female Male Female
Northeast 59.3% 57.7% 58.7% 58.7% 57.6% 53.9%
North Iowa Area 53.4% 62.3% 53.2% 66.3% 45.0% 59.8%
Iowa Lakes 64.3% 71.5% 59.5% 57.5% 63.1% 56.4%
Northwest 51.6% 71.4% 66.4% 78.0% 74.6% 69.4%
Iowa Central 56.7% 51.7% 55.0% 44.3% 53.2% 50.0%
Iowa Valley 58.9% 63.5% 52.2% 60.2% 53.3% 69.0%
Hawkeye 56.2% 63.8% 56.5% 56.0% 56.5% 57.1%
Eastern Iowa 47.5% 44.1% 38.1% 41.5% 47.7% 44.4%
Kirkwood 48.1% 50.2% 48.8% 49.1% 48.4% 51.5%
Des Moines Area 42.9% 48.9% 50.3% 47.3% 46.1% 50.4%
Western Iowa Tech 50.7% 52.4% 50.4% 47.1% 45.5% 54.5%
Iowa Western 49.7% 55.1% 48.6% 53.7% 50.2% 54.7%
Southwestern 66.7% 67.3% 61.9% 62.5% 71.1% 65.9%
Indian Hills 50.7% 56.8% 56.9% 60.2% 56.1% 62.7%
Southeastern 47.3% 48.3% 52.0% 51.0% 48.4% 52.3%
Total 51.7% 54.5% 52.2% 52.8% 52.3% 54.7%Note: Year denotes when the cohort entered community college. Students are given up to three years to graduate. Source: Iowa Department of Education, Division of Community Colleges and Workforce Preparation, Community College MIS.
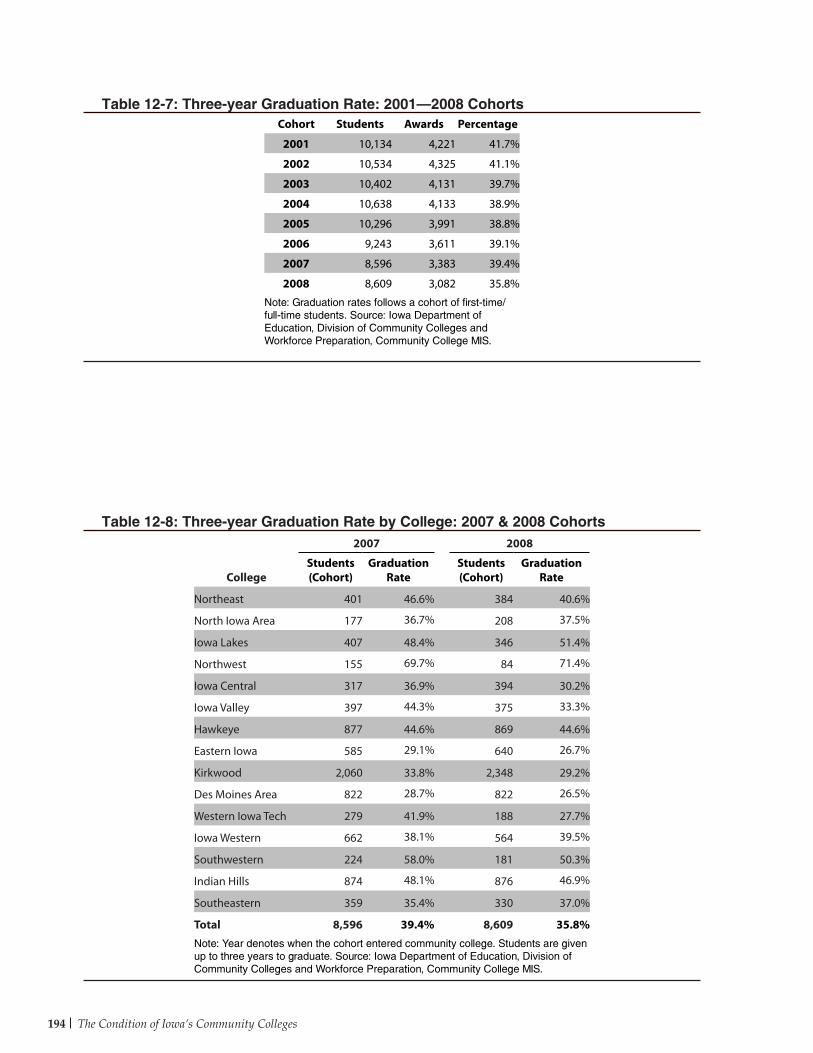
The Condition of Iowa’s Community Colleges194
Cohort Students Awards Percentage
2001 10,134 4,221 41.7%
2002 10,534 4,325 41.1%
2003 10,402 4,131 39.7%
2004 10,638 4,133 38.9%
2005 10,296 3,991 38.8%
2006 9,243 3,611 39.1%
2007 8,596 3,383 39.4%
2008 8,609 3,082 35.8%
Note: Graduation rates follows a cohort of first-time/full-time students. Source: Iowa Department of Education, Division of Community Colleges and Workforce Preparation, Community College MIS.
Table 12-7: Three-year Graduation Rate: 2001–2008 Cohorts
Table 12-8: Three-year Graduation Rate by College: 2007 & 2008 Cohorts
College
2007 2008
Students (Cohort)
Graduation Rate
Students (Cohort)
Graduation Rate
Northeast 401 46.6% 384 40.6%
North Iowa Area 177 36.7% 208 37.5%
Iowa Lakes 407 48.4% 346 51.4%
Northwest 155 69.7% 84 71.4%
Iowa Central 317 36.9% 394 30.2%
Iowa Valley 397 44.3% 375 33.3%
Hawkeye 877 44.6% 869 44.6%
Eastern Iowa 585 29.1% 640 26.7%
Kirkwood 2,060 33.8% 2,348 29.2%
Des Moines Area 822 28.7% 822 26.5%
Western Iowa Tech 279 41.9% 188 27.7%
Iowa Western 662 38.1% 564 39.5%
Southwestern 224 58.0% 181 50.3%
Indian Hills 874 48.1% 876 46.9%
Southeastern 359 35.4% 330 37.0%
Total 8,596 39.4% 8,609 35.8%Note: Year denotes when the cohort entered community college. Students are given up to three years to graduate. Source: Iowa Department of Education, Division of Community Colleges and Workforce Preparation, Community College MIS.
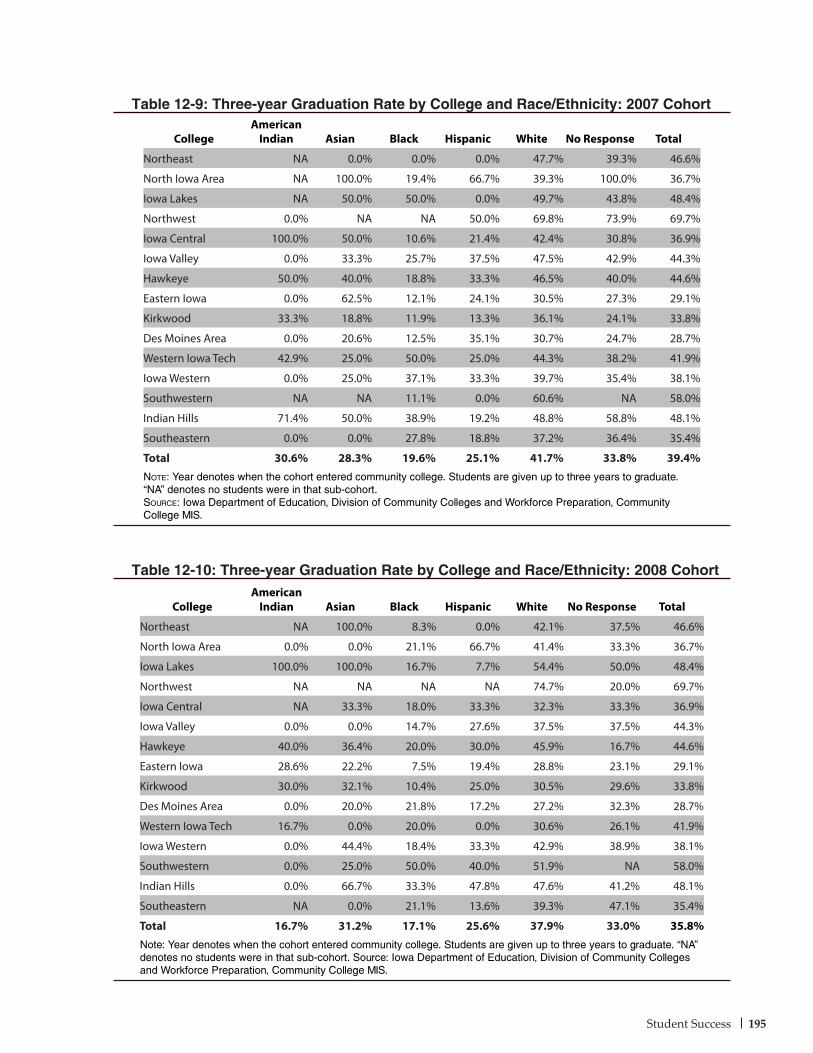
Student Success 195
CollegeAmerican
Indian Asian Black Hispanic White No Response Total
Northeast NA 0.0% 0.0% 0.0% 47.7% 39.3% 46.6%
North Iowa Area NA 100.0% 19.4% 66.7% 39.3% 100.0% 36.7%
Iowa Lakes NA 50.0% 50.0% 0.0% 49.7% 43.8% 48.4%
Northwest 0.0% NA NA 50.0% 69.8% 73.9% 69.7%
Iowa Central 100.0% 50.0% 10.6% 21.4% 42.4% 30.8% 36.9%
Iowa Valley 0.0% 33.3% 25.7% 37.5% 47.5% 42.9% 44.3%
Hawkeye 50.0% 40.0% 18.8% 33.3% 46.5% 40.0% 44.6%
Eastern Iowa 0.0% 62.5% 12.1% 24.1% 30.5% 27.3% 29.1%
Kirkwood 33.3% 18.8% 11.9% 13.3% 36.1% 24.1% 33.8%
Des Moines Area 0.0% 20.6% 12.5% 35.1% 30.7% 24.7% 28.7%
Western Iowa Tech 42.9% 25.0% 50.0% 25.0% 44.3% 38.2% 41.9%
Iowa Western 0.0% 25.0% 37.1% 33.3% 39.7% 35.4% 38.1%
Southwestern NA NA 11.1% 0.0% 60.6% NA 58.0%
Indian Hills 71.4% 50.0% 38.9% 19.2% 48.8% 58.8% 48.1%
Southeastern 0.0% 0.0% 27.8% 18.8% 37.2% 36.4% 35.4%
Total 30.6% 28.3% 19.6% 25.1% 41.7% 33.8% 39.4%Note: Year denotes when the cohort entered community college. Students are given up to three years to graduate. “NA” denotes no students were in that sub-cohort.Source: Iowa Department of Education, Division of Community Colleges and Workforce Preparation, Community College MIS.
Table 12-9: Three-year Graduation Rate by College and Race/Ethnicity: 2007 Cohort
Table 12-10: Three-year Graduation Rate by College and Race/Ethnicity: 2008 Cohort
CollegeAmerican
Indian Asian Black Hispanic White No Response Total
Northeast NA 100.0% 8.3% 0.0% 42.1% 37.5% 46.6%
North Iowa Area 0.0% 0.0% 21.1% 66.7% 41.4% 33.3% 36.7%
Iowa Lakes 100.0% 100.0% 16.7% 7.7% 54.4% 50.0% 48.4%
Northwest NA NA NA NA 74.7% 20.0% 69.7%
Iowa Central NA 33.3% 18.0% 33.3% 32.3% 33.3% 36.9%
Iowa Valley 0.0% 0.0% 14.7% 27.6% 37.5% 37.5% 44.3%
Hawkeye 40.0% 36.4% 20.0% 30.0% 45.9% 16.7% 44.6%
Eastern Iowa 28.6% 22.2% 7.5% 19.4% 28.8% 23.1% 29.1%
Kirkwood 30.0% 32.1% 10.4% 25.0% 30.5% 29.6% 33.8%
Des Moines Area 0.0% 20.0% 21.8% 17.2% 27.2% 32.3% 28.7%
Western Iowa Tech 16.7% 0.0% 20.0% 0.0% 30.6% 26.1% 41.9%
Iowa Western 0.0% 44.4% 18.4% 33.3% 42.9% 38.9% 38.1%
Southwestern 0.0% 25.0% 50.0% 40.0% 51.9% NA 58.0%
Indian Hills 0.0% 66.7% 33.3% 47.8% 47.6% 41.2% 48.1%
Southeastern NA 0.0% 21.1% 13.6% 39.3% 47.1% 35.4%
Total 16.7% 31.2% 17.1% 25.6% 37.9% 33.0% 35.8%Note: Year denotes when the cohort entered community college. Students are given up to three years to graduate. “NA” denotes no students were in that sub-cohort. Source: Iowa Department of Education, Division of Community Colleges and Workforce Preparation, Community College MIS.
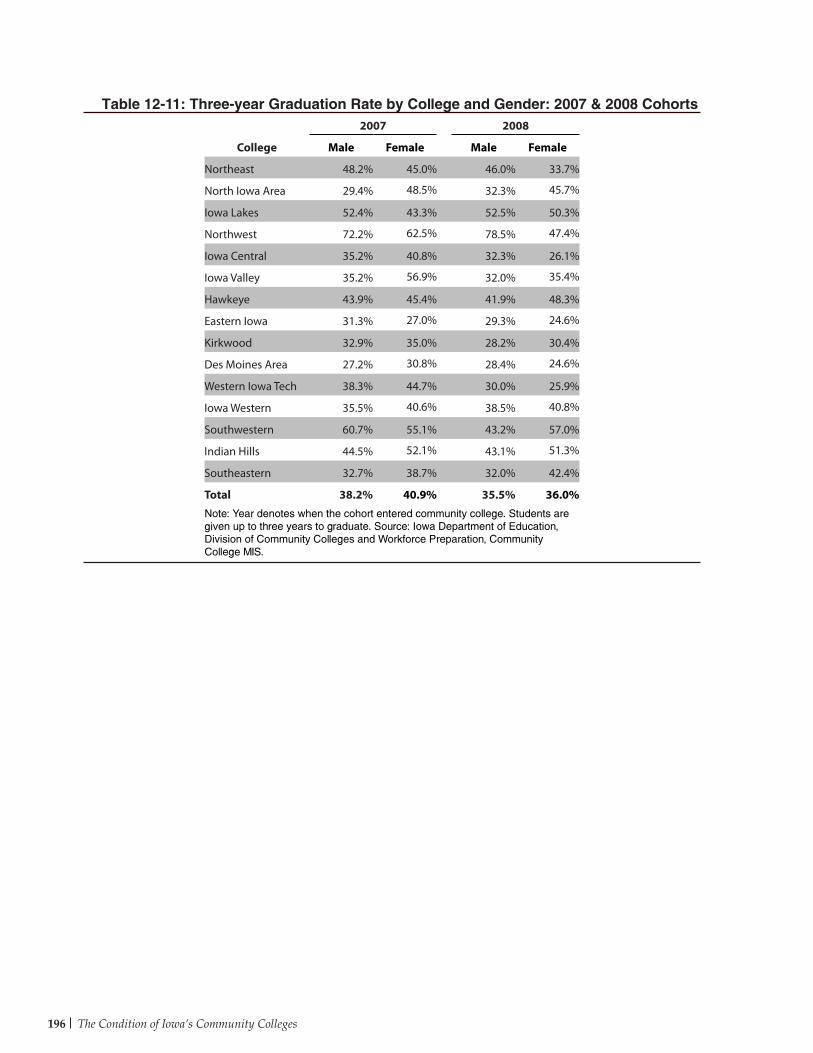
The Condition of Iowa’s Community Colleges196
Table 12-11: Three-year Graduation Rate by College and Gender: 2007 & 2008 Cohorts
College
2007 2008
Male Female Male Female
Northeast 48.2% 45.0% 46.0% 33.7%
North Iowa Area 29.4% 48.5% 32.3% 45.7%
Iowa Lakes 52.4% 43.3% 52.5% 50.3%
Northwest 72.2% 62.5% 78.5% 47.4%
Iowa Central 35.2% 40.8% 32.3% 26.1%
Iowa Valley 35.2% 56.9% 32.0% 35.4%
Hawkeye 43.9% 45.4% 41.9% 48.3%
Eastern Iowa 31.3% 27.0% 29.3% 24.6%
Kirkwood 32.9% 35.0% 28.2% 30.4%
Des Moines Area 27.2% 30.8% 28.4% 24.6%
Western Iowa Tech 38.3% 44.7% 30.0% 25.9%
Iowa Western 35.5% 40.6% 38.5% 40.8%
Southwestern 60.7% 55.1% 43.2% 57.0%
Indian Hills 44.5% 52.1% 43.1% 51.3%
Southeastern 32.7% 38.7% 32.0% 42.4%
Total 38.2% 40.9% 35.5% 36.0%Note: Year denotes when the cohort entered community college. Students are given up to three years to graduate. Source: Iowa Department of Education, Division of Community Colleges and Workforce Preparation, Community College MIS.
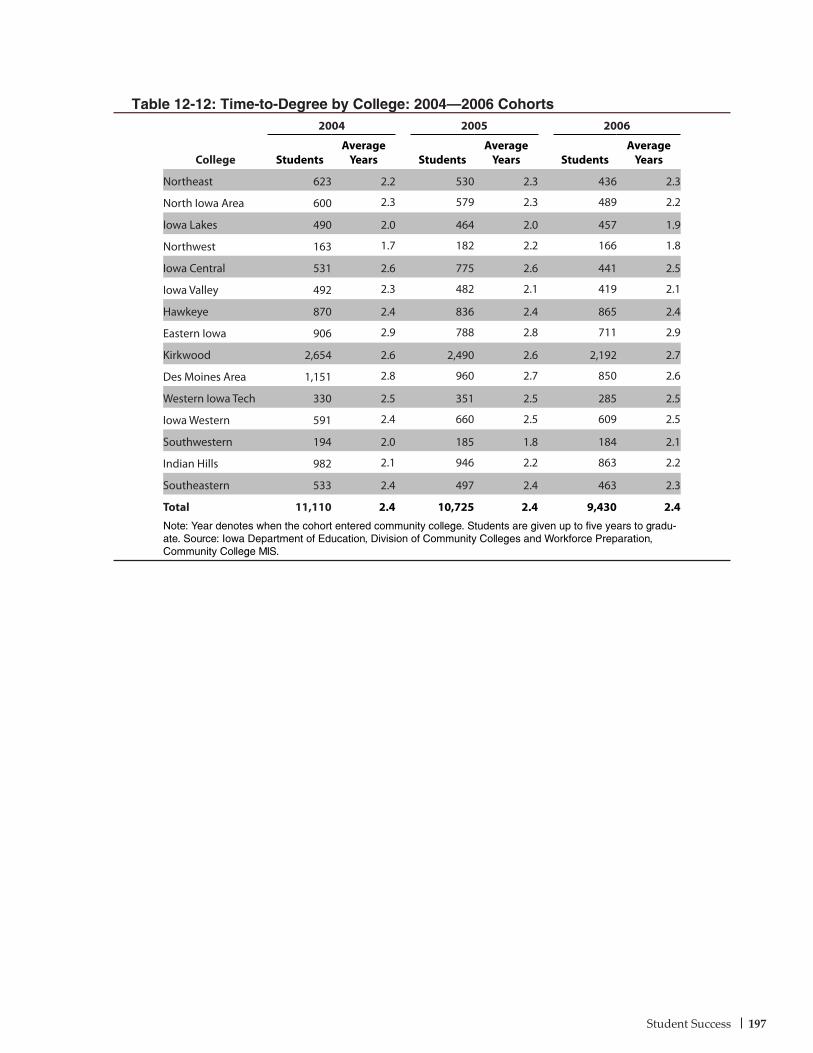
Student Success 197
Table 12-12: Time-to-Degree by College: 2004–2006 Cohorts
College
2004 2005 2006
StudentsAverage
Years StudentsAverage
Years StudentsAverage
Years
Northeast 623 2.2 530 2.3 436 2.3
North Iowa Area 600 2.3 579 2.3 489 2.2
Iowa Lakes 490 2.0 464 2.0 457 1.9
Northwest 163 1.7 182 2.2 166 1.8
Iowa Central 531 2.6 775 2.6 441 2.5
Iowa Valley 492 2.3 482 2.1 419 2.1
Hawkeye 870 2.4 836 2.4 865 2.4
Eastern Iowa 906 2.9 788 2.8 711 2.9
Kirkwood 2,654 2.6 2,490 2.6 2,192 2.7
Des Moines Area 1,151 2.8 960 2.7 850 2.6
Western Iowa Tech 330 2.5 351 2.5 285 2.5
Iowa Western 591 2.4 660 2.5 609 2.5
Southwestern 194 2.0 185 1.8 184 2.1
Indian Hills 982 2.1 946 2.2 863 2.2
Southeastern 533 2.4 497 2.4 463 2.3
Total 11,110 2.4 10,725 2.4 9,430 2.4Note: Year denotes when the cohort entered community college. Students are given up to five years to gradu-ate. Source: Iowa Department of Education, Division of Community Colleges and Workforce Preparation, Community College MIS.
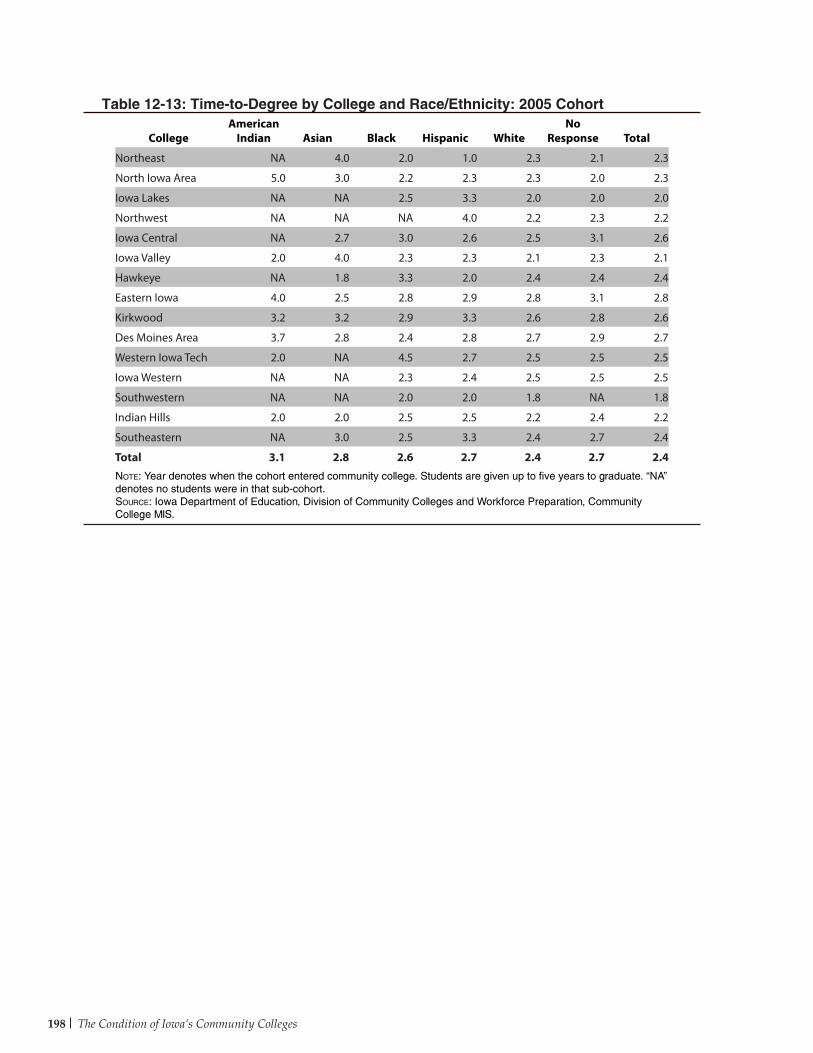
The Condition of Iowa’s Community Colleges198
Table 12-13: Time-to-Degree by College and Race/Ethnicity: 2005 Cohort
CollegeAmerican
Indian Asian Black Hispanic WhiteNo
Response Total
Northeast NA 4.0 2.0 1.0 2.3 2.1 2.3
North Iowa Area 5.0 3.0 2.2 2.3 2.3 2.0 2.3
Iowa Lakes NA NA 2.5 3.3 2.0 2.0 2.0
Northwest NA NA NA 4.0 2.2 2.3 2.2
Iowa Central NA 2.7 3.0 2.6 2.5 3.1 2.6
Iowa Valley 2.0 4.0 2.3 2.3 2.1 2.3 2.1
Hawkeye NA 1.8 3.3 2.0 2.4 2.4 2.4
Eastern Iowa 4.0 2.5 2.8 2.9 2.8 3.1 2.8
Kirkwood 3.2 3.2 2.9 3.3 2.6 2.8 2.6
Des Moines Area 3.7 2.8 2.4 2.8 2.7 2.9 2.7
Western Iowa Tech 2.0 NA 4.5 2.7 2.5 2.5 2.5
Iowa Western NA NA 2.3 2.4 2.5 2.5 2.5
Southwestern NA NA 2.0 2.0 1.8 NA 1.8
Indian Hills 2.0 2.0 2.5 2.5 2.2 2.4 2.2
Southeastern NA 3.0 2.5 3.3 2.4 2.7 2.4
Total 3.1 2.8 2.6 2.7 2.4 2.7 2.4Note: Year denotes when the cohort entered community college. Students are given up to five years to graduate. “NA” denotes no students were in that sub-cohort. Source: Iowa Department of Education, Division of Community Colleges and Workforce Preparation, Community College MIS.
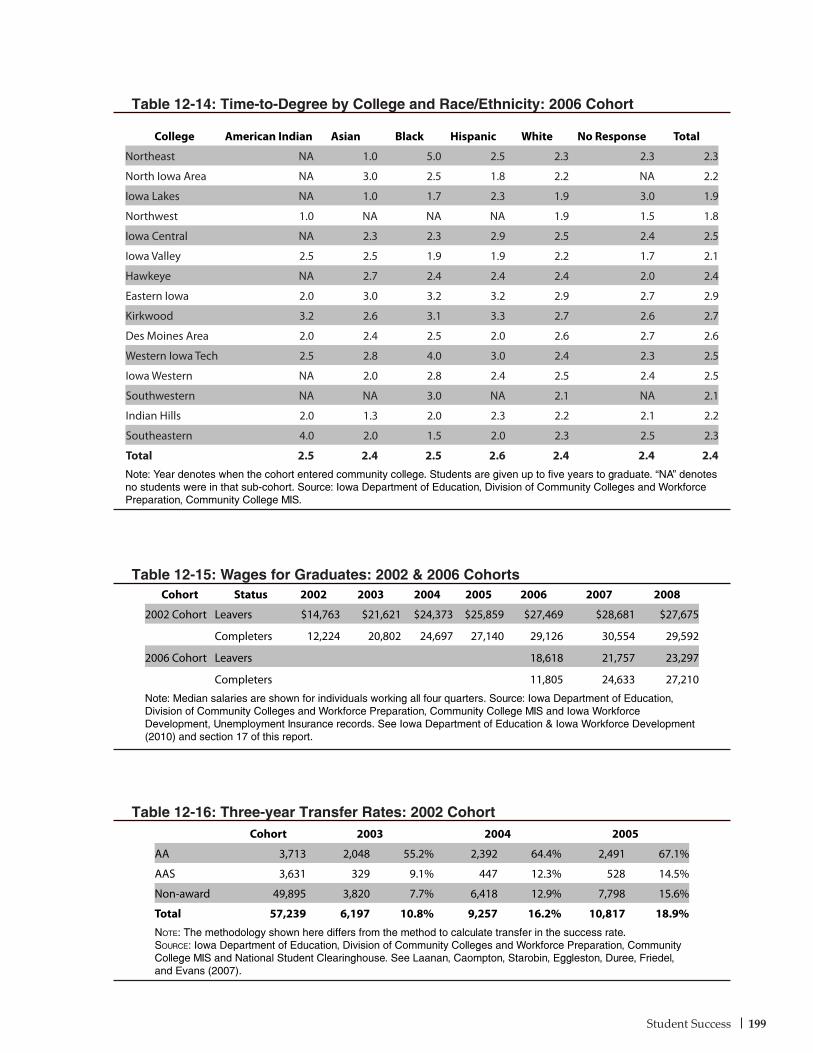
Student Success 199
Table 12-16: Three-year Transfer Rates: 2002 CohortCohort 2003 2004 2005
AA 3,713 2,048 55.2% 2,392 64.4% 2,491 67.1%
AAS 3,631 329 9.1% 447 12.3% 528 14.5%
Non-award 49,895 3,820 7.7% 6,418 12.9% 7,798 15.6%
Total 57,239 6,197 10.8% 9,257 16.2% 10,817 18.9%Note: The methodology shown here differs from the method to calculate transfer in the success rate. Source: Iowa Department of Education, Division of Community Colleges and Workforce Preparation, Community College MIS and National Student Clearinghouse. See Laanan, Caompton, Starobin, Eggleston, Duree, Friedel, and Evans (2007).
Table 12-15: Wages for Graduates: 2002 & 2006 CohortsCohort Status 2002 2003 2004 2005 2006 2007 2008
2002 Cohort Leavers $14,763 $21,621 $24,373 $25,859 $27,469 $28,681 $27,675
Completers 12,224 20,802 24,697 27,140 29,126 30,554 29,592
2006 Cohort Leavers 18,618 21,757 23,297
Completers 11,805 24,633 27,210
Note: Median salaries are shown for individuals working all four quarters. Source: Iowa Department of Education, Division of Community Colleges and Workforce Preparation, Community College MIS and Iowa Workforce Development, Unemployment Insurance records. See Iowa Department of Education & Iowa Workforce Development (2010) and section 17 of this report.
Table 12-14: Time-to-Degree by College and Race/Ethnicity: 2006 Cohort
College American Indian Asian Black Hispanic White No Response Total
Northeast NA 1.0 5.0 2.5 2.3 2.3 2.3
North Iowa Area NA 3.0 2.5 1.8 2.2 NA 2.2
Iowa Lakes NA 1.0 1.7 2.3 1.9 3.0 1.9
Northwest 1.0 NA NA NA 1.9 1.5 1.8
Iowa Central NA 2.3 2.3 2.9 2.5 2.4 2.5
Iowa Valley 2.5 2.5 1.9 1.9 2.2 1.7 2.1
Hawkeye NA 2.7 2.4 2.4 2.4 2.0 2.4
Eastern Iowa 2.0 3.0 3.2 3.2 2.9 2.7 2.9
Kirkwood 3.2 2.6 3.1 3.3 2.7 2.6 2.7
Des Moines Area 2.0 2.4 2.5 2.0 2.6 2.7 2.6
Western Iowa Tech 2.5 2.8 4.0 3.0 2.4 2.3 2.5
Iowa Western NA 2.0 2.8 2.4 2.5 2.4 2.5
Southwestern NA NA 3.0 NA 2.1 NA 2.1
Indian Hills 2.0 1.3 2.0 2.3 2.2 2.1 2.2
Southeastern 4.0 2.0 1.5 2.0 2.3 2.5 2.3
Total 2.5 2.4 2.5 2.6 2.4 2.4 2.4Note: Year denotes when the cohort entered community college. Students are given up to five years to graduate. “NA” denotes no students were in that sub-cohort. Source: Iowa Department of Education, Division of Community Colleges and Workforce Preparation, Community College MIS.
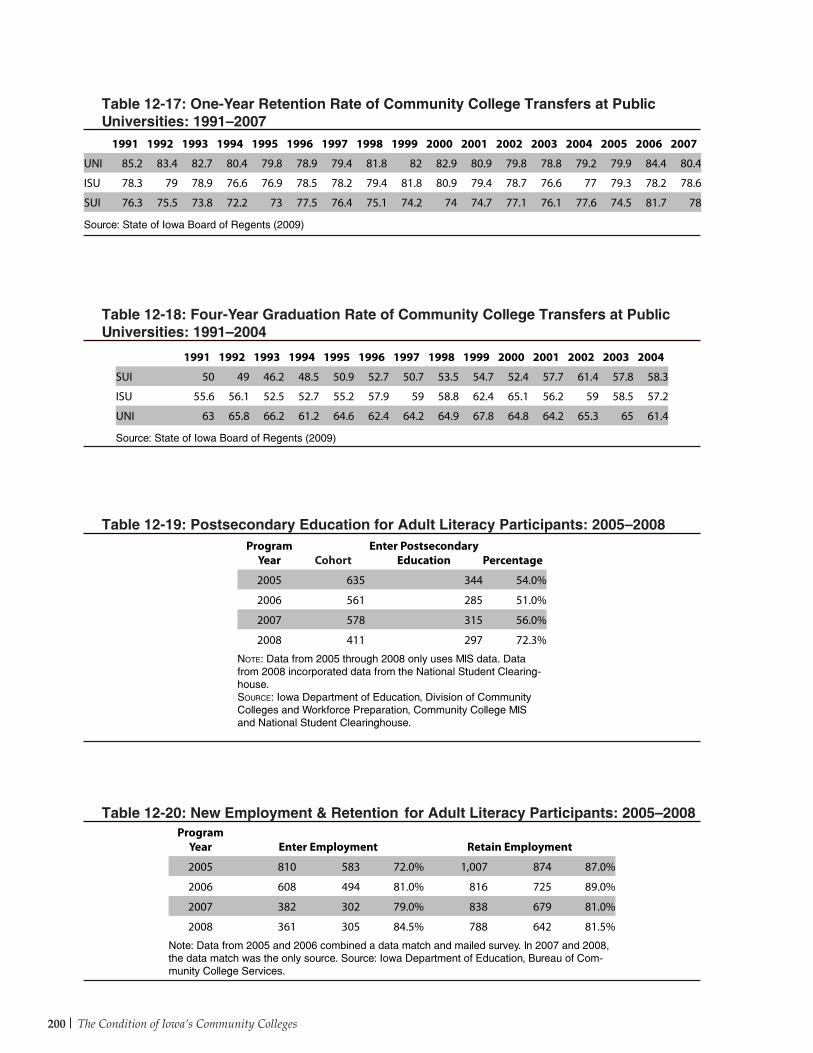
The Condition of Iowa’s Community Colleges200
Program Year Cohort
Enter Postsecondary Education Percentage
2005 635 344 54.0%
2006 561 285 51.0%
2007 578 315 56.0%
2008 411 297 72.3%
Note: Data from 2005 through 2008 only uses MIS data. Data from 2008 incorporated data from the National Student Clearing-house. Source: Iowa Department of Education, Division of Community Colleges and Workforce Preparation, Community College MIS and National Student Clearinghouse.
Table 12-19: Postsecondary Education for Adult Literacy Participants: 2005—2008
Table 12-20: New Employment & Retention for Adult Literacy Participants: 2005—2008Program
Year Enter Employment Retain Employment
2005 810 583 72.0% 1,007 874 87.0%
2006 608 494 81.0% 816 725 89.0%
2007 382 302 79.0% 838 679 81.0%
2008 361 305 84.5% 788 642 81.5%
Note: Data from 2005 and 2006 combined a data match and mailed survey. In 2007 and 2008, the data match was the only source. Source: Iowa Department of Education, Bureau of Com-munity College Services.
1991 1992 1993 1994 1995 1996 1997 1998 1999 2000 2001 2002 2003 2004 2005 2006 2007
UNI 85.2 83.4 82.7 80.4 79.8 78.9 79.4 81.8 82 82.9 80.9 79.8 78.8 79.2 79.9 84.4 80.4
ISU 78.3 79 78.9 76.6 76.9 78.5 78.2 79.4 81.8 80.9 79.4 78.7 76.6 77 79.3 78.2 78.6
SUI 76.3 75.5 73.8 72.2 73 77.5 76.4 75.1 74.2 74 74.7 77.1 76.1 77.6 74.5 81.7 78
Source: State of Iowa Board of Regents (2009)
1991 1992 1993 1994 1995 1996 1997 1998 1999 2000 2001 2002 2003 2004
SUI 50 49 46.2 48.5 50.9 52.7 50.7 53.5 54.7 52.4 57.7 61.4 57.8 58.3
ISU 55.6 56.1 52.5 52.7 55.2 57.9 59 58.8 62.4 65.1 56.2 59 58.5 57.2
UNI 63 65.8 66.2 61.2 64.6 62.4 64.2 64.9 67.8 64.8 64.2 65.3 65 61.4
Source: State of Iowa Board of Regents (2009)
Table 12-17: One-Year Retention Rate of Community College Transfers at Public Universities: 1991—2007
Table 12-18: Four-Year Graduation Rate of Community College Transfers at Public Universities: 1991—2004
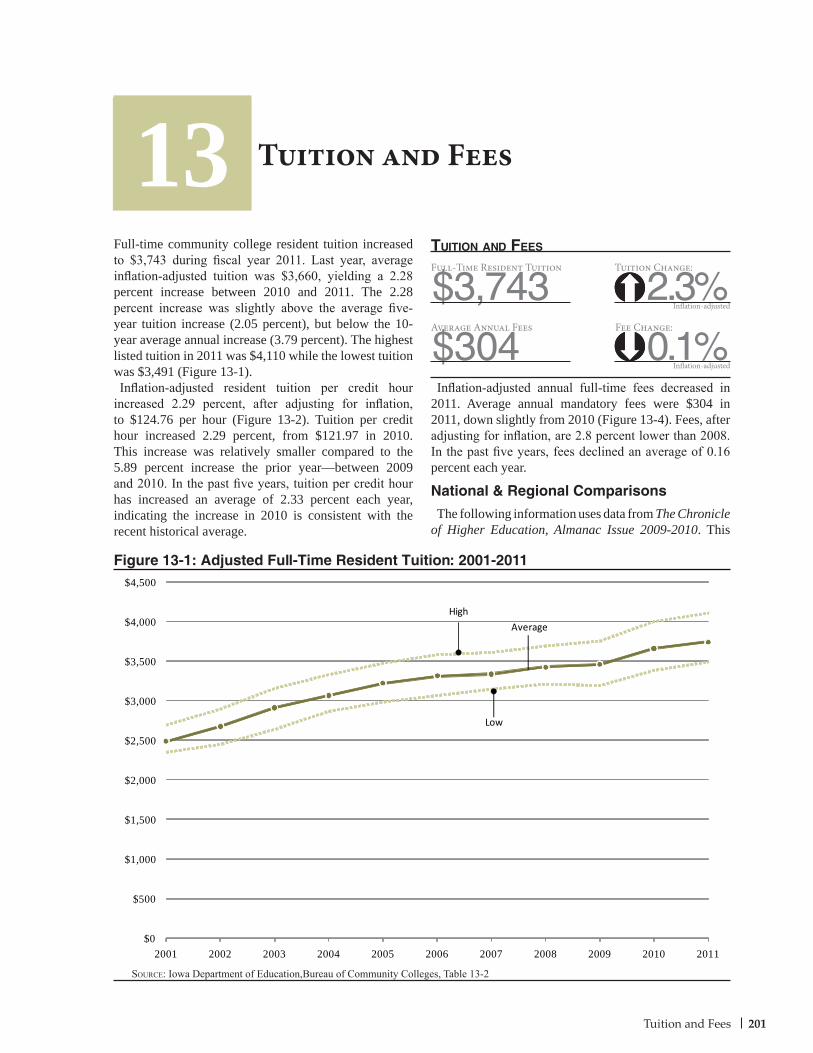
201Tuition and Fees
Tuition and Fees
Figure 13-1: Adjusted Full-Time Resident Tuition: 2001-2011
13
Source: Iowa Department of Education,Bureau of Community Colleges, Table 13-2
Full-time community college resident tuition increased to $3,743 during fiscal year 2011. Last year, average inflation-adjusted tuition was $3,660, yielding a 2.28 percent increase between 2010 and 2011. The 2.28 percent increase was slightly above the average five-year tuition increase (2.05 percent), but below the 10-year average annual increase (3.79 percent). The highest listed tuition in 2011 was $4,110 while the lowest tuition was $3,491 (Figure 13-1).Inflation-adjusted resident tuition per credit hour
increased 2.29 percent, after adjusting for inflation, to $124.76 per hour (Figure 13-2). Tuition per credit hour increased 2.29 percent, from $121.97 in 2010. This increase was relatively smaller compared to the 5.89 percent increase the prior year—between 2009 and 2010. In the past five years, tuition per credit hour has increased an average of 2.33 percent each year, indicating the increase in 2010 is consistent with the recent historical average.
Inflation-adjusted annual full-time fees decreased in 2011. Average annual mandatory fees were $304 in 2011, down slightly from 2010 (Figure 13-4). Fees, after adjusting for inflation, are 2.8 percent lower than 2008. In the past five years, fees declined an average of 0.16 percent each year.
National & Regional Comparisons
The following information uses data from The Chronicle of Higher Education, Almanac Issue 2009-2010. This
Full-Time Resident Tuition
$3,743Tuition Change:
2.3%tuition anD Fees
Average Annual Fees
$304Fee Change:
0.1%
$0
$500
$1,000
$1,500
$2,000
$2,500
$3,000
$3,500
$4,000
$4,500
2001 2002 2003 2004 2005 2006 2007 2008 2009 2010 2011
High
Average
Low
Inflation-adjusted
Inflation-adjusted
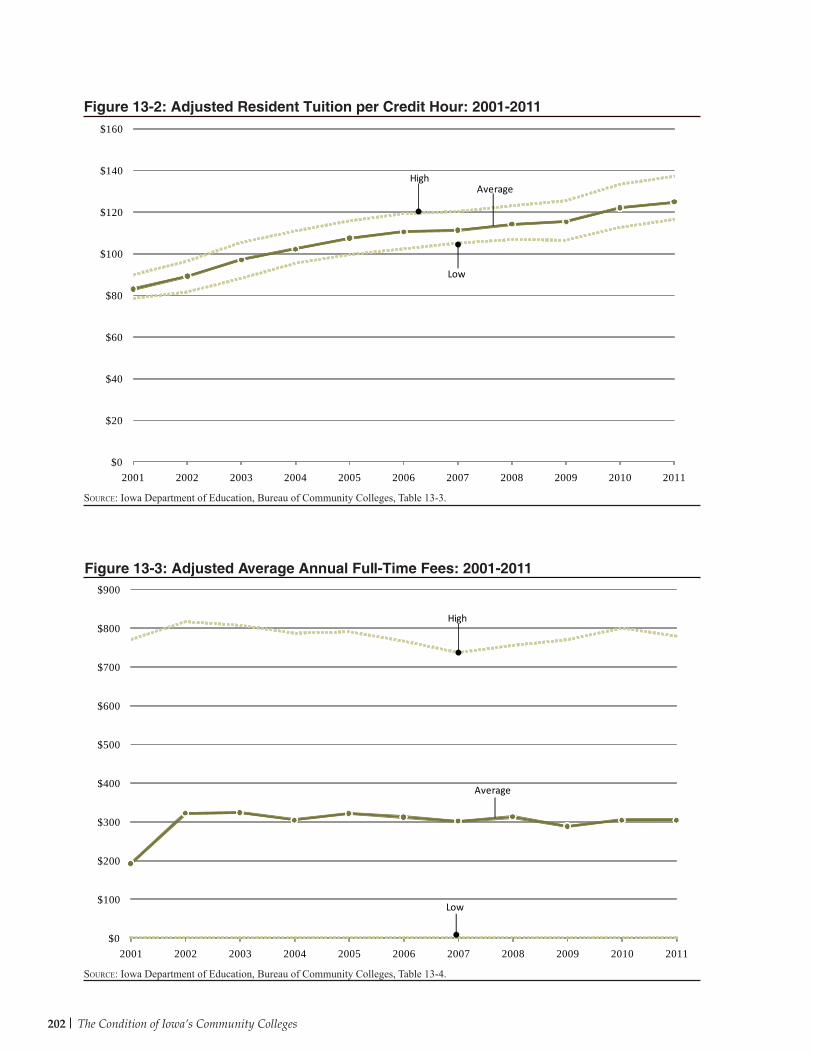
202 The Condition of Iowa’s Community Colleges
Figure 13-2: Adjusted Resident Tuition per Credit Hour: 2001-2011
Source: Iowa Department of Education, Bureau of Community Colleges, Table 13-3.
Figure 13-3: Adjusted Average Annual Full-Time Fees: 2001-2011
Source: Iowa Department of Education, Bureau of Community Colleges, Table 13-4.
$0
$20
$40
$60
$80
$100
$120
$140
$160
2001 2002 2003 2004 2005 2006 2007 2008 2009 2010 2011
HighAverage
Low
$0
$100
$200
$300
$400
$500
$600
$700
$800
$900
2001 2002 2003 2004 2005 2006 2007 2008 2009 2010 2011
High
Average
Low
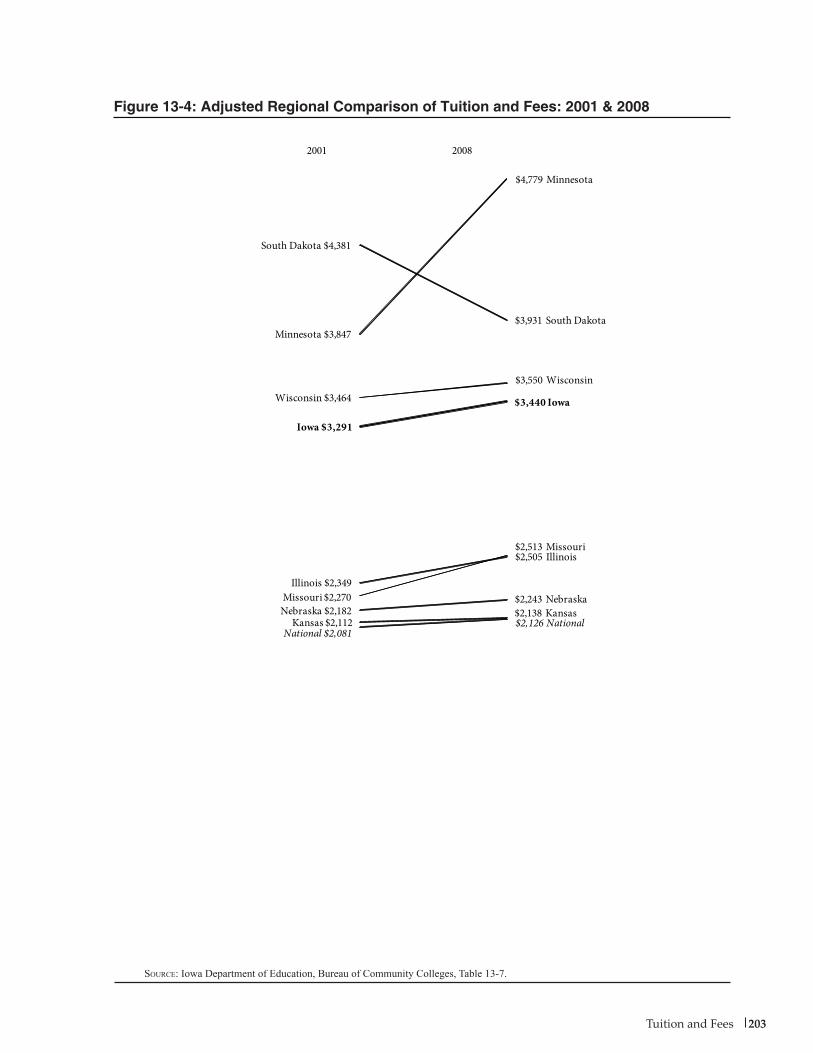
203Tuition and Fees
Source: Iowa Department of Education, Bureau of Community Colleges, Table 13-7.
Figure 13-4: Adjusted Regional Comparison of Tuition and Fees: 2001 & 2008
Minnesota $3,847
South Dakota $4,381
Iowa $3,291
Wisconsin $3,464
Missouri $2,270Illinois $2,349
Kansas $2,112Nebraska $2,182
National $2,081
$4,779 Minnesota
$3,931 South Dakota
$3,440 Iowa
$3,550 Wisconsin
$2,513 Missouri$2,505 Illinois
$2,138 Kansas$2,243 Nebraska
$2,126 National
2001 2008
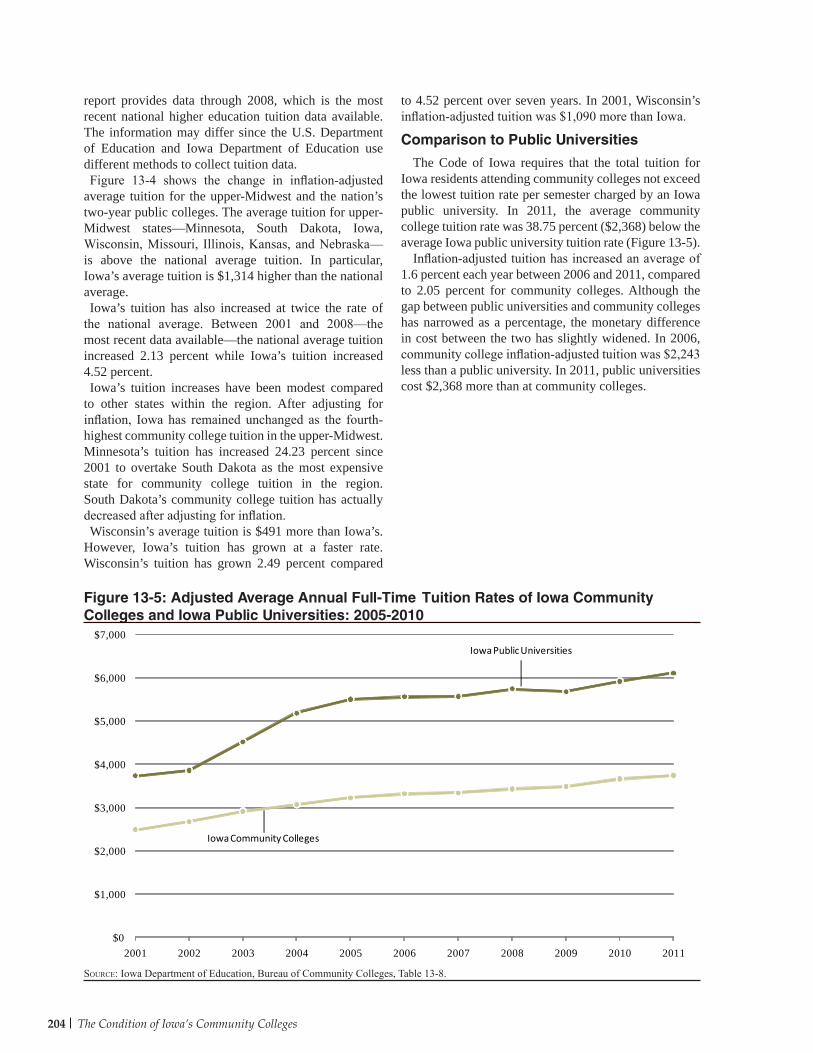
204 The Condition of Iowa’s Community Colleges
Source: Iowa Department of Education, Bureau of Community Colleges, Table 13-8.
Figure 13-5: Adjusted Average Annual Full-Time Tuition Rates of Iowa Community Colleges and Iowa Public Universities: 2005-2010
report provides data through 2008, which is the most recent national higher education tuition data available. The information may differ since the U.S. Department of Education and Iowa Department of Education use different methods to collect tuition data.Figure 13-4 shows the change in inflation-adjusted
average tuition for the upper-Midwest and the nation’s two-year public colleges. The average tuition for upper-Midwest states —Minnesota, South Dakota, Iowa, Wisconsin, Missouri, Illinois, Kansas, and Nebraska—is above the national average tuition. In particular, Iowa’s average tuition is $1,314 higher than the national average.Iowa’s tuition has also increased at twice the rate of
the national average. Between 2001 and 2008—the most recent data available—the national average tuition increased 2.13 percent while Iowa’s tuition increased 4.52 percent.Iowa’s tuition increases have been modest compared
to other states within the region. After adjusting for inflation, Iowa has remained unchanged as the fourth-highest community college tuition in the upper-Midwest. Minnesota’s tuition has increased 24.23 percent since 2001 to overtake South Dakota as the most expensive state for community college tuition in the region. South Dakota’s community college tuition has actually decreased after adjusting for inflation.Wisconsin’s average tuition is $491 more than Iowa’s.
However, Iowa’s tuition has grown at a faster rate. Wisconsin’s tuition has grown 2.49 percent compared
to 4.52 percent over seven years. In 2001, Wisconsin’s inflation-adjusted tuition was $1,090 more than Iowa.
Comparison to Public Universities
The Code of Iowa requires that the total tuition for Iowa residents attending community colleges not exceed the lowest tuition rate per semester charged by an Iowa public university. In 2011, the average community college tuition rate was 38.75 percent ($2,368) below the average Iowa public university tuition rate (Figure 13-5).
Inflation-adjusted tuition has increased an average of 1.6 percent each year between 2006 and 2011, compared to 2.05 percent for community colleges. Although the gap between public universities and community colleges has narrowed as a percentage, the monetary difference in cost between the two has slightly widened. In 2006, community college inflation-adjusted tuition was $2,243 less than a public university. In 2011, public universities cost $2,368 more than at community colleges.
$0
$1,000
$2,000
$3,000
$4,000
$5,000
$6,000
$7,000
2001 2002 2003 2004 2005 2006 2007 2008 2009 2010 2011
Iowa Public Universities
Iowa Community Colleges
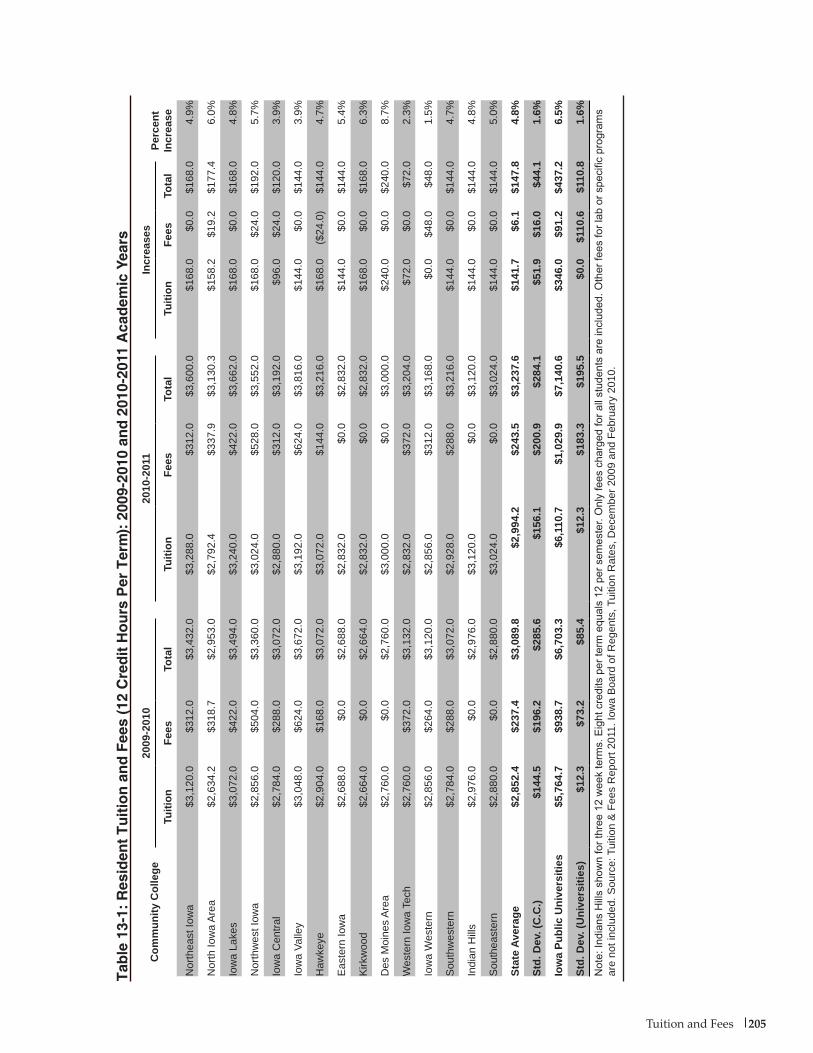
205Tuition and Fees
Tab
le 1
3-1:
Res
iden
t T
uit
ion
an
d F
ees
(12
Cre
dit
Ho
urs
Per
Ter
m):
200
9-20
10 a
nd
201
0-20
11 A
cad
emic
Yea
rs
Com
mun
ity C
olle
ge20
09-2
010
2010
-201
1In
crea
ses
Perc
ent
Incr
ease
Tuiti
onFe
esTo
tal
Tuiti
onFe
esTo
tal
Tuiti
onFe
esTo
tal
Nor
thea
st Io
wa
$3,1
20.0
$3
12.0
$3
,432
.0
$3,2
88.0
$3
12.0
$3
,600
.0
$168
.0
$0.0
$1
68.0
4.
9%
Nor
th Io
wa
Are
a $2
,634
.2
$318
.7
$2,9
53.0
$2
,792
.4
$337
.9
$3,1
30.3
$1
58.2
$1
9.2
$177
.4
6.0%
Iow
a La
kes
$3,0
72.0
$4
22.0
$3
,494
.0
$3,2
40.0
$4
22.0
$3
,662
.0
$168
.0
$0.0
$1
68.0
4.
8%
Nor
thw
est I
owa
$2,8
56.0
$5
04.0
$3
,360
.0
$3,0
24.0
$5
28.0
$3
,552
.0
$168
.0
$24.
0 $1
92.0
5.
7%
Iow
a C
entra
l$2
,784
.0
$288
.0
$3,0
72.0
$2
,880
.0
$312
.0
$3,1
92.0
$9
6.0
$24.
0 $1
20.0
3.
9%
Iow
a Va
lley
$3,0
48.0
$6
24.0
$3
,672
.0
$3,1
92.0
$6
24.0
$3
,816
.0
$144
.0
$0.0
$1
44.0
3.
9%
Haw
keye
$2,9
04.0
$1
68.0
$3
,072
.0
$3,0
72.0
$1
44.0
$3
,216
.0
$168
.0
($24
.0)
$144
.0
4.7%
Eas
tern
Iow
a$2
,688
.0
$0.0
$2
,688
.0
$2,8
32.0
$0
.0
$2,8
32.0
$1
44.0
$0
.0
$144
.0
5.4%
Kirk
woo
d$2
,664
.0
$0.0
$2
,664
.0
$2,8
32.0
$0
.0
$2,8
32.0
$1
68.0
$0
.0
$168
.0
6.3%
Des
Moi
nes
Are
a $2
,760
.0
$0.0
$2
,760
.0
$3,0
00.0
$0
.0
$3,0
00.0
$2
40.0
$0
.0
$240
.0
8.7%
Wes
tern
Iow
a Te
ch$2
,760
.0
$372
.0
$3,1
32.0
$2
,832
.0
$372
.0
$3,2
04.0
$7
2.0
$0.0
$7
2.0
2.3%
Iow
a W
este
rn
$2,8
56.0
$2
64.0
$3
,120
.0
$2,8
56.0
$3
12.0
$3
,168
.0
$0.0
$4
8.0
$48.
0 1.
5%
Sou
thw
este
rn$2
,784
.0
$288
.0
$3,0
72.0
$2
,928
.0
$288
.0
$3,2
16.0
$1
44.0
$0
.0
$144
.0
4.7%
Indi
an H
ills
$2,9
76.0
$0
.0
$2,9
76.0
$3
,120
.0
$0.0
$3
,120
.0
$144
.0
$0.0
$1
44.0
4.
8%
Sou
thea
ster
n $2
,880
.0
$0.0
$2
,880
.0
$3,0
24.0
$0
.0
$3,0
24.0
$1
44.0
$0
.0
$144
.0
5.0%
Stat
e Av
erag
e$2
,852
.4
$237
.4
$3,0
89.8
$2
,994
.2
$243
.5
$3,2
37.6
$1
41.7
$6
.1
$147
.8
4.8%
Std.
Dev
. (C
.C.)
$144
.5
$196
.2
$285
.6
$156
.1
$200
.9
$284
.1
$51.
9 $1
6.0
$44.
1 1.
6%
Iow
a Pu
blic
Uni
vers
ities
$5,7
64.7
$9
38.7
$6
,703
.3
$6,1
10.7
$1
,029
.9
$7,1
40.6
$3
46.0
$9
1.2
$437
.2
6.5%
Std.
Dev
. (U
nive
rsiti
es)
$12.
3 $7
3.2
$85.
4 $1
2.3
$183
.3
$195
.5
$0.0
$1
10.6
$1
10.8
1.
6%N
ote:
Indi
ans
Hill
s sh
own
for t
hree
12
wee
k te
rms.
Eig
ht c
redi
ts p
er te
rm e
qual
s 12
per
sem
este
r. O
nly
fees
cha
rged
for a
ll st
uden
ts a
re in
clud
ed. O
ther
fees
for l
ab o
r spe
cific
pro
gram
s ar
e no
t inc
lude
d. S
ourc
e: T
uitio
n &
Fee
s R
epor
t 201
1. Io
wa
Boa
rd o
f Reg
ents
, Tui
tion
Rat
es, D
ecem
ber 2
009
and
Febr
uary
201
0.
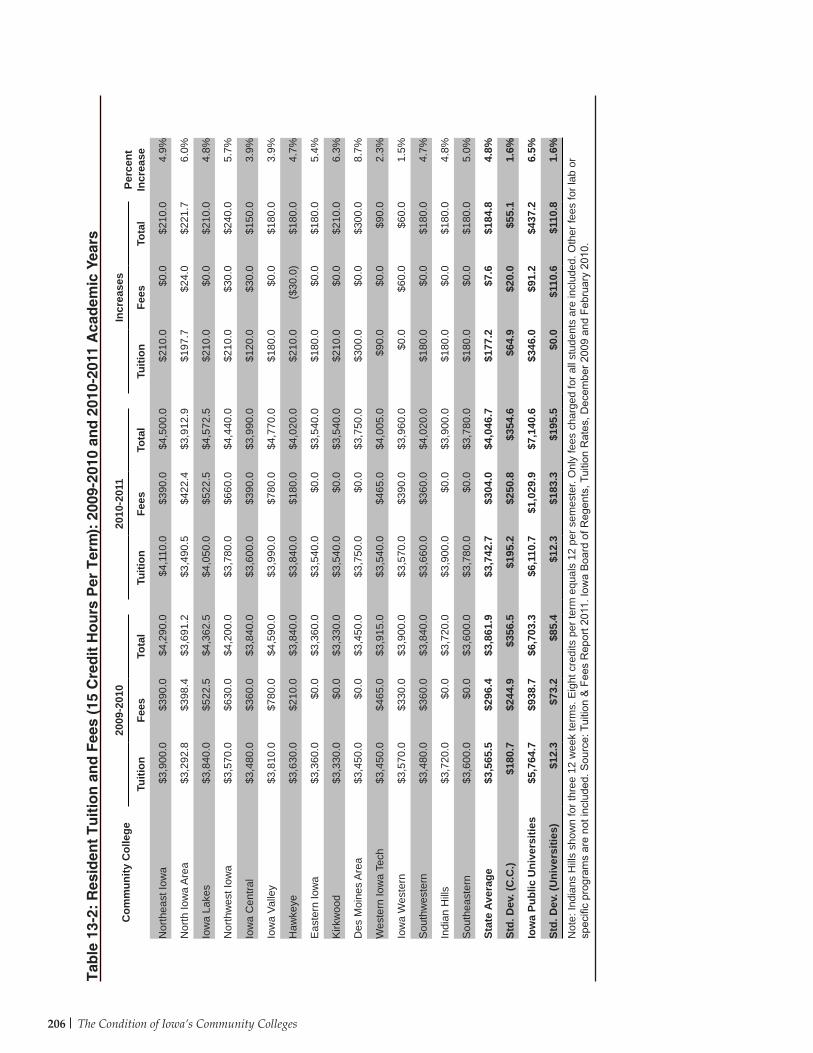
206 The Condition of Iowa’s Community Colleges
Tab
le 1
3-2:
Res
iden
t T
uit
ion
an
d F
ees
(15
Cre
dit
Ho
urs
Per
Ter
m):
200
9-20
10 a
nd
201
0-20
11 A
cad
emic
Yea
rs
Com
mun
ity C
olle
ge20
09-2
010
2010
-201
1In
crea
ses
Perc
ent
Incr
ease
Tuiti
onFe
esTo
tal
Tuiti
onFe
esTo
tal
Tuiti
onFe
esTo
tal
Nor
thea
st Io
wa
$3,9
00.0
$3
90.0
$4
,290
.0
$4,1
10.0
$3
90.0
$4
,500
.0
$210
.0
$0.0
$2
10.0
4.
9%
Nor
th Io
wa
Are
a $3
,292
.8
$398
.4
$3,6
91.2
$3
,490
.5
$422
.4
$3,9
12.9
$1
97.7
$2
4.0
$221
.7
6.0%
Iow
a La
kes
$3,8
40.0
$5
22.5
$4
,362
.5
$4,0
50.0
$5
22.5
$4
,572
.5
$210
.0
$0.0
$2
10.0
4.
8%
Nor
thw
est I
owa
$3,5
70.0
$6
30.0
$4
,200
.0
$3,7
80.0
$6
60.0
$4
,440
.0
$210
.0
$30.
0 $2
40.0
5.
7%
Iow
a C
entra
l$3
,480
.0
$360
.0
$3,8
40.0
$3
,600
.0
$390
.0
$3,9
90.0
$1
20.0
$3
0.0
$150
.0
3.9%
Iow
a Va
lley
$3,8
10.0
$7
80.0
$4
,590
.0
$3,9
90.0
$7
80.0
$4
,770
.0
$180
.0
$0.0
$1
80.0
3.
9%
Haw
keye
$3,6
30.0
$2
10.0
$3
,840
.0
$3,8
40.0
$1
80.0
$4
,020
.0
$210
.0
($30
.0)
$180
.0
4.7%
Eas
tern
Iow
a$3
,360
.0
$0.0
$3
,360
.0
$3,5
40.0
$0
.0
$3,5
40.0
$1
80.0
$0
.0
$180
.0
5.4%
Kirk
woo
d$3
,330
.0
$0.0
$3
,330
.0
$3,5
40.0
$0
.0
$3,5
40.0
$2
10.0
$0
.0
$210
.0
6.3%
Des
Moi
nes
Are
a $3
,450
.0
$0.0
$3
,450
.0
$3,7
50.0
$0
.0
$3,7
50.0
$3
00.0
$0
.0
$300
.0
8.7%
Wes
tern
Iow
a Te
ch$3
,450
.0
$465
.0
$3,9
15.0
$3
,540
.0
$465
.0
$4,0
05.0
$9
0.0
$0.0
$9
0.0
2.3%
Iow
a W
este
rn$3
,570
.0
$330
.0
$3,9
00.0
$3
,570
.0
$390
.0
$3,9
60.0
$0
.0
$60.
0 $6
0.0
1.5%
Sou
thw
este
rn$3
,480
.0
$360
.0
$3,8
40.0
$3
,660
.0
$360
.0
$4,0
20.0
$1
80.0
$0
.0
$180
.0
4.7%
Indi
an H
ills
$3,7
20.0
$0
.0
$3,7
20.0
$3
,900
.0
$0.0
$3
,900
.0
$180
.0
$0.0
$1
80.0
4.
8%
Sou
thea
ster
n$3
,600
.0
$0.0
$3
,600
.0
$3,7
80.0
$0
.0
$3,7
80.0
$1
80.0
$0
.0
$180
.0
5.0%
Stat
e Av
erag
e$3
,565
.5
$296
.4
$3,8
61.9
$3
,742
.7
$304
.0
$4,0
46.7
$1
77.2
$7
.6
$184
.8
4.8%
Std.
Dev
. (C
.C.)
$180
.7
$244
.9
$356
.5
$195
.2
$250
.8
$354
.6
$64.
9 $2
0.0
$55.
1 1.
6%
Iow
a Pu
blic
Uni
vers
ities
$5,7
64.7
$9
38.7
$6
,703
.3
$6,1
10.7
$1
,029
.9
$7,1
40.6
$3
46.0
$9
1.2
$437
.2
6.5%
Std.
Dev
. (U
nive
rsiti
es)
$12.
3 $7
3.2
$85.
4 $1
2.3
$183
.3
$195
.5
$0.0
$1
10.6
$1
10.8
1.
6%N
ote:
Indi
ans
Hill
s sh
own
for t
hree
12
wee
k te
rms.
Eig
ht c
redi
ts p
er te
rm e
qual
s 12
per
sem
este
r. O
nly
fees
cha
rged
for a
ll st
uden
ts a
re in
clud
ed. O
ther
fees
for l
ab o
r sp
ecifi
c pr
ogra
ms
are
not i
nclu
ded.
Sou
rce:
Tui
tion
& F
ees
Rep
ort 2
011.
Iow
a B
oard
of R
egen
ts, T
uitio
n R
ates
, Dec
embe
r 200
9 an
d Fe
brua
ry 2
010.
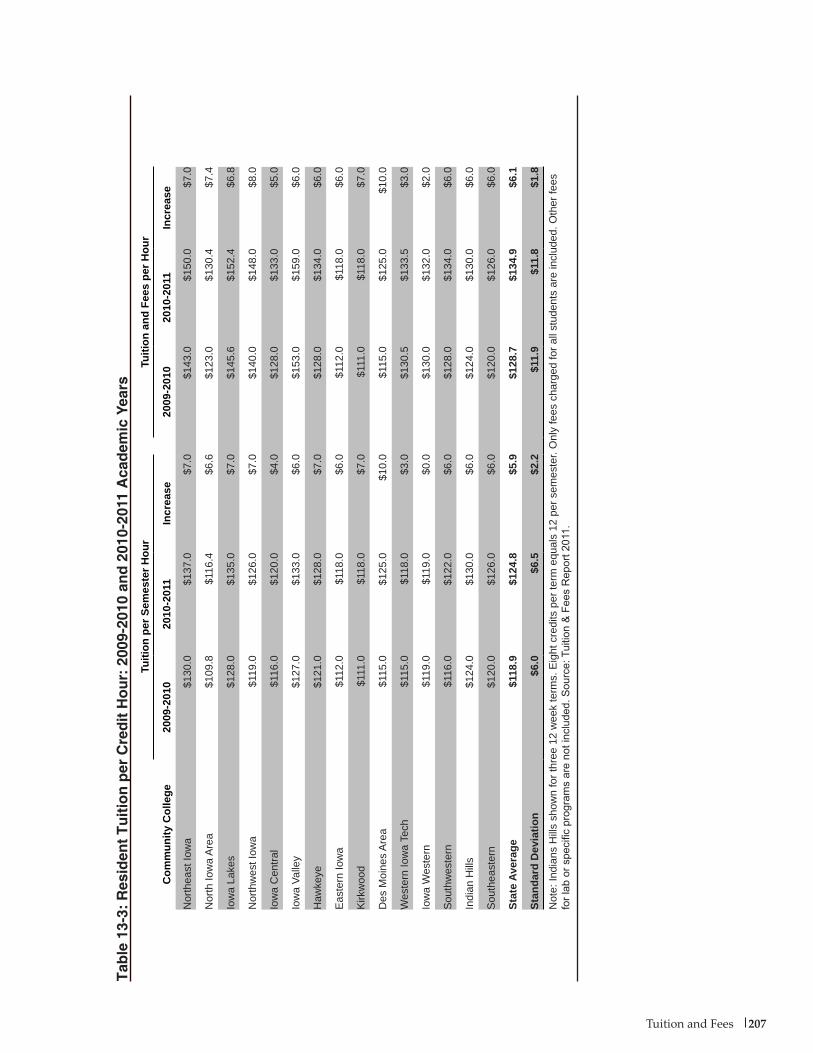
207Tuition and Fees
Tab
le 1
3-3:
Res
iden
t T
uit
ion
per
Cre
dit
Ho
ur:
200
9-20
10 a
nd
201
0-20
11 A
cad
emic
Yea
rs
Com
mun
ity C
olle
ge
Tuiti
on p
er S
emes
ter H
our
Tuiti
on a
nd F
ees
per H
our
2009
-201
020
10-2
011
Incr
ease
2009
-201
020
10-2
011
Incr
ease
Nor
thea
st Io
wa
$130
.0$1
37.0
$7.0
$1
43.0
$1
50.0
$7
.0
Nor
th Io
wa
Are
a$1
09.8
$116
.4$6
.6
$123
.0
$130
.4
$7.4
Iow
a La
kes
$128
.0$1
35.0
$7.0
$1
45.6
$1
52.4
$6
.8
Nor
thw
est I
owa
$119
.0$1
26.0
$7.0
$1
40.0
$1
48.0
$8
.0
Iow
a C
entra
l$1
16.0
$120
.0$4
.0
$128
.0
$133
.0
$5.0
Iow
a Va
lley
$127
.0$1
33.0
$6.0
$1
53.0
$1
59.0
$6
.0
Haw
keye
$121
.0$1
28.0
$7.0
$1
28.0
$1
34.0
$6
.0
Eas
tern
Iow
a$1
12.0
$118
.0$6
.0
$112
.0
$118
.0
$6.0
Kirk
woo
d$1
11.0
$118
.0$7
.0
$111
.0
$118
.0
$7.0
Des
Moi
nes
Are
a$1
15.0
$125
.0$1
0.0
$115
.0
$125
.0
$10.
0
Wes
tern
Iow
a Te
ch$1
15.0
$118
.0$3
.0
$130
.5
$133
.5
$3.0
Iow
a W
este
rn$1
19.0
$119
.0$0
.0
$130
.0
$132
.0
$2.0
Sou
thw
este
rn$1
16.0
$122
.0$6
.0
$128
.0
$134
.0
$6.0
Indi
an H
ills
$124
.0$1
30.0
$6.0
$1
24.0
$1
30.0
$6
.0
Sou
thea
ster
n$1
20.0
$126
.0$6
.0
$120
.0
$126
.0
$6.0
Stat
e Av
erag
e$1
18.9
$1
24.8
$5
.9
$128
.7
$134
.9
$6.1
Stan
dard
Dev
iatio
n$6
.0$6
.5$2
.2$1
1.9
$11.
8$1
.8N
ote:
Indi
ans
Hill
s sh
own
for t
hree
12
wee
k te
rms.
Eig
ht c
redi
ts p
er te
rm e
qual
s 12
per
sem
este
r. O
nly
fees
cha
rged
for a
ll st
uden
ts a
re in
clud
ed. O
ther
fees
fo
r lab
or s
peci
fic p
rogr
ams
are
not i
nclu
ded.
Sou
rce:
Tui
tion
& F
ees
Rep
ort 2
011.
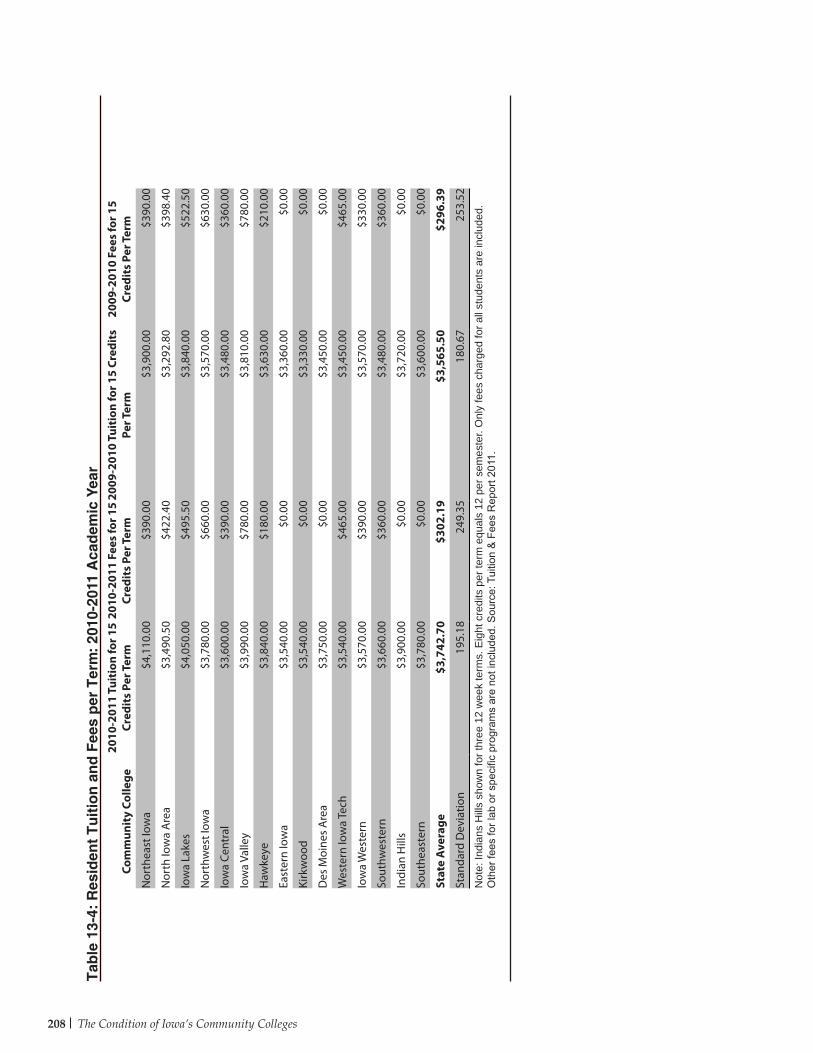
208 The Condition of Iowa’s Community Colleges
Tab
le 1
3-4:
Res
iden
t T
uit
ion
an
d F
ees
per
Ter
m:
2010
-201
1 A
cad
emic
Yea
r
Com
mun
ity
Colle
ge20
10-2
011
Tuit
ion
for 1
5 Cr
edit
s Pe
r Ter
m20
10-2
011
Fees
for 1
5 Cr
edit
s Pe
r Ter
m20
09-2
010
Tuit
ion
for 1
5 Cr
edit
s Pe
r Ter
m20
09-2
010
Fees
for 1
5 Cr
edit
s Pe
r Ter
m
Nor
thea
st Io
wa
$4,1
10.0
0 $3
90.0
0 $3
,900
.00
$390
.00
Nor
th Io
wa
Are
a$3
,490
.50
$422
.40
$3,2
92.8
0 $3
98.4
0
Iow
a La
kes
$4,0
50.0
0 $4
95.5
0 $3
,840
.00
$522
.50
Nor
thw
est I
owa
$3,7
80.0
0 $6
60.0
0 $3
,570
.00
$630
.00
Iow
a Ce
ntra
l$3
,600
.00
$390
.00
$3,4
80.0
0 $3
60.0
0
Iow
a Va
lley
$3,9
90.0
0 $7
80.0
0 $3
,810
.00
$780
.00
Haw
keye
$3,8
40.0
0 $1
80.0
0 $3
,630
.00
$210
.00
East
ern
Iow
a$3
,540
.00
$0.0
0 $3
,360
.00
$0.0
0
Kirk
woo
d$3
,540
.00
$0.0
0 $3
,330
.00
$0.0
0
Des
Moi
nes
Are
a$3
,750
.00
$0.0
0 $3
,450
.00
$0.0
0
Wes
tern
Iow
a Te
ch$3
,540
.00
$465
.00
$3,4
50.0
0 $4
65.0
0
Iow
a W
este
rn$3
,570
.00
$390
.00
$3,5
70.0
0 $3
30.0
0
Sout
hwes
tern
$3,6
60.0
0 $3
60.0
0 $3
,480
.00
$360
.00
Indi
an H
ills
$3,9
00.0
0 $0
.00
$3,7
20.0
0 $0
.00
Sout
heas
tern
$3,7
80.0
0 $0
.00
$3,6
00.0
0 $0
.00
Stat
e A
vera
ge$3
,742
.70
$302
.19
$3,5
65.5
0 $2
96.3
9
Stan
dard
Dev
iatio
n19
5.18
24
9.35
18
0.67
25
3.52
Not
e: In
dian
s H
ills
show
n fo
r thr
ee 1
2 w
eek
term
s. E
ight
cre
dits
per
term
equ
als
12 p
er s
emes
ter.
Onl
y fe
es c
harg
ed fo
r all
stud
ents
are
incl
uded
. O
ther
fees
for l
ab o
r spe
cific
pro
gram
s ar
e no
t inc
lude
d. S
ourc
e: T
uitio
n &
Fee
s R
epor
t 201
1.
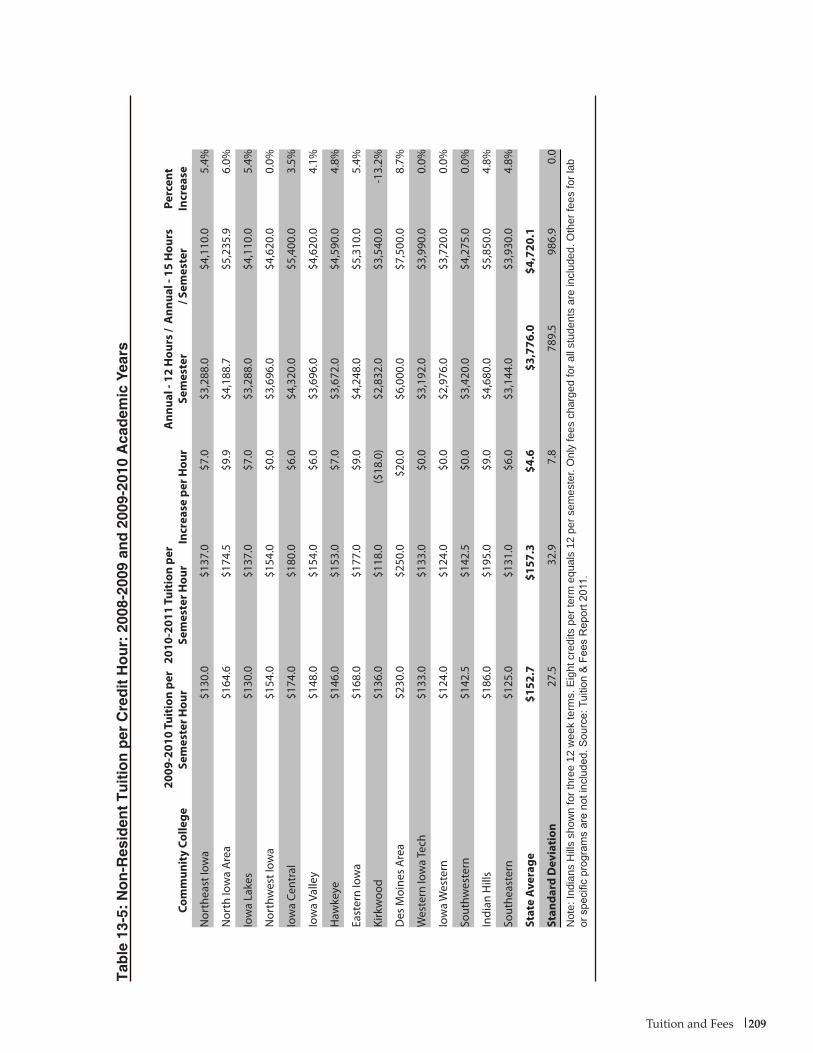
209Tuition and Fees
Tab
le 1
3-5:
No
n-R
esid
ent
Tu
itio
n p
er C
red
it H
ou
r: 2
008-
2009
an
d 2
009-
2010
Aca
dem
ic Y
ears
Com
mun
ity
Colle
ge20
09-2
010
Tuit
ion
per
Sem
este
r Hou
r20
10-2
011
Tuit
ion
per
Sem
este
r Hou
rIn
crea
se p
er H
our
Ann
ual -
12
Hou
rs /
Sem
este
rA
nnua
l - 1
5 H
ours
/ S
emes
ter
Perc
ent
Incr
ease
Nor
thea
st Io
wa
$130
.0
$137
.0
$7.0
$3
,288
.0
$4,1
10.0
5.
4%
Nor
th Io
wa
Are
a$1
64.6
$1
74.5
$9
.9
$4,1
88.7
$5
,235
.9
6.0%
Iow
a La
kes
$130
.0
$137
.0
$7.0
$3
,288
.0
$4,1
10.0
5.
4%
Nor
thw
est I
owa
$154
.0
$154
.0
$0.0
$3
,696
.0
$4,6
20.0
0.
0%
Iow
a Ce
ntra
l$1
74.0
$1
80.0
$6
.0
$4,3
20.0
$5
,400
.0
3.5%
Iow
a Va
lley
$148
.0
$154
.0
$6.0
$3
,696
.0
$4,6
20.0
4.
1%
Haw
keye
$146
.0
$153
.0
$7.0
$3
,672
.0
$4,5
90.0
4.
8%
East
ern
Iow
a$1
68.0
$1
77.0
$9
.0
$4,2
48.0
$5
,310
.0
5.4%
Kirk
woo
d$1
36.0
$1
18.0
($
18.0
)$2
,832
.0
$3,5
40.0
-1
3.2%
Des
Moi
nes
Are
a$2
30.0
$2
50.0
$2
0.0
$6,0
00.0
$7
,500
.0
8.7%
Wes
tern
Iow
a Te
ch$1
33.0
$1
33.0
$0
.0
$3,1
92.0
$3
,990
.0
0.0%
Iow
a W
este
rn$1
24.0
$1
24.0
$0
.0
$2,9
76.0
$3
,720
.0
0.0%
Sout
hwes
tern
$142
.5
$142
.5
$0.0
$3
,420
.0
$4,2
75.0
0.
0%
Indi
an H
ills
$186
.0
$195
.0
$9.0
$4
,680
.0
$5,8
50.0
4.
8%
Sout
heas
tern
$125
.0
$131
.0
$6.0
$3
,144
.0
$3,9
30.0
4.
8%
Stat
e A
vera
ge
$152
.7
$157
.3
$4.6
$3
,776
.0
$4,7
20.1
Stan
dard
Dev
iati
on27
.5
32.9
7.
8 78
9.5
986.
9 0.
0
Not
e: In
dian
s H
ills
show
n fo
r thr
ee 1
2 w
eek
term
s. E
ight
cre
dits
per
term
equ
als
12 p
er s
emes
ter.
Onl
y fe
es c
harg
ed fo
r all
stud
ents
are
incl
uded
. Oth
er fe
es fo
r lab
or
spe
cific
pro
gram
s ar
e no
t inc
lude
d. S
ourc
e: T
uitio
n &
Fee
s R
epor
t 201
1.
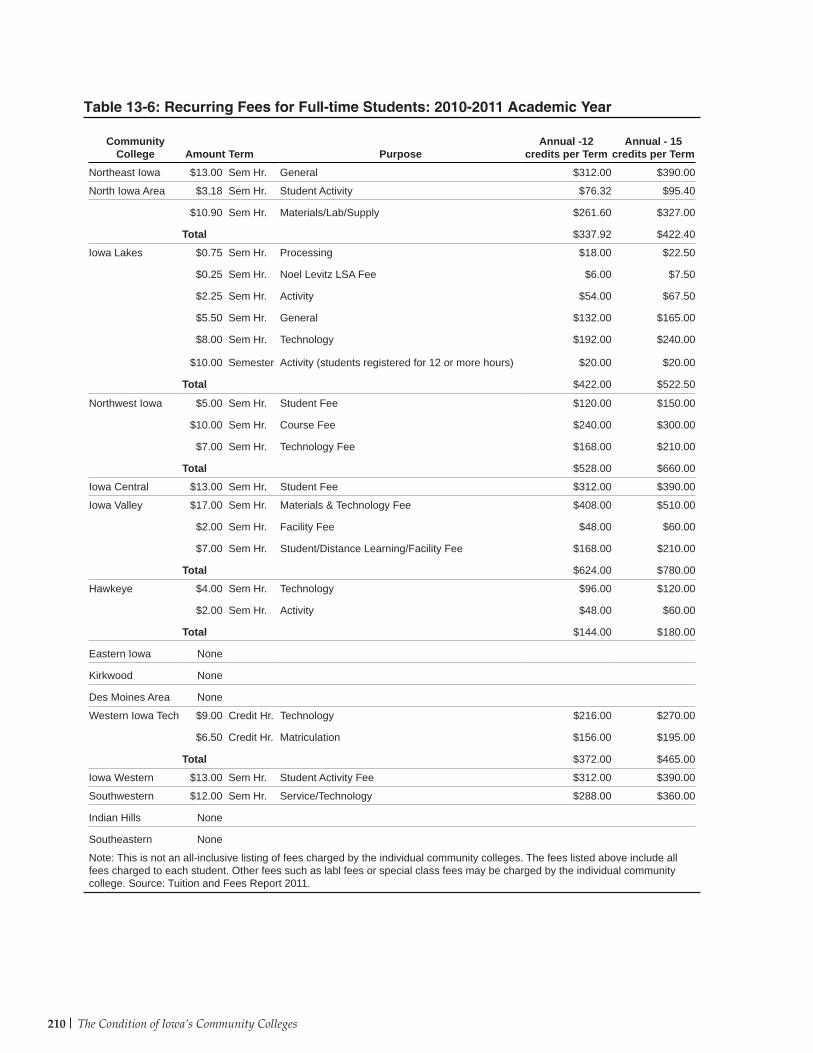
210 The Condition of Iowa’s Community Colleges
Table 13-6: Recurring Fees for Full-time Students: 2010-2011 Academic Year
Community College Amount Term Purpose
Annual -12 credits per Term
Annual - 15 credits per Term
Northeast Iowa $13.00 Sem Hr. General $312.00 $390.00
North Iowa Area $3.18 Sem Hr. Student Activity $76.32 $95.40
$10.90 Sem Hr. Materials/Lab/Supply $261.60 $327.00
Total $337.92 $422.40
Iowa Lakes $0.75 Sem Hr. Processing $18.00 $22.50
$0.25 Sem Hr. Noel Levitz LSA Fee $6.00 $7.50
$2.25 Sem Hr. Activity $54.00 $67.50
$5.50 Sem Hr. General $132.00 $165.00
$8.00 Sem Hr. Technology $192.00 $240.00
$10.00 Semester Activity (students registered for 12 or more hours) $20.00 $20.00
Total $422.00 $522.50
Northwest Iowa $5.00 Sem Hr. Student Fee $120.00 $150.00
$10.00 Sem Hr. Course Fee $240.00 $300.00
$7.00 Sem Hr. Technology Fee $168.00 $210.00
Total $528.00 $660.00
Iowa Central $13.00 Sem Hr. Student Fee $312.00 $390.00
Iowa Valley $17.00 Sem Hr. Materials & Technology Fee $408.00 $510.00
$2.00 Sem Hr. Facility Fee $48.00 $60.00
$7.00 Sem Hr. Student/Distance Learning/Facility Fee $168.00 $210.00
Total $624.00 $780.00
Hawkeye $4.00 Sem Hr. Technology $96.00 $120.00
$2.00 Sem Hr. Activity $48.00 $60.00
Total $144.00 $180.00
Eastern Iowa None
Kirkwood None
Des Moines Area None
Western Iowa Tech $9.00 Credit Hr. Technology $216.00 $270.00
$6.50 Credit Hr. Matriculation $156.00 $195.00
Total $372.00 $465.00
Iowa Western $13.00 Sem Hr. Student Activity Fee $312.00 $390.00
Southwestern $12.00 Sem Hr. Service/Technology $288.00 $360.00
Indian Hills None
Southeastern None
Note: This is not an all-inclusive listing of fees charged by the individual community colleges. The fees listed above include all fees charged to each student. Other fees such as labl fees or special class fees may be charged by the individual community college. Source: Tuition and Fees Report 2011.
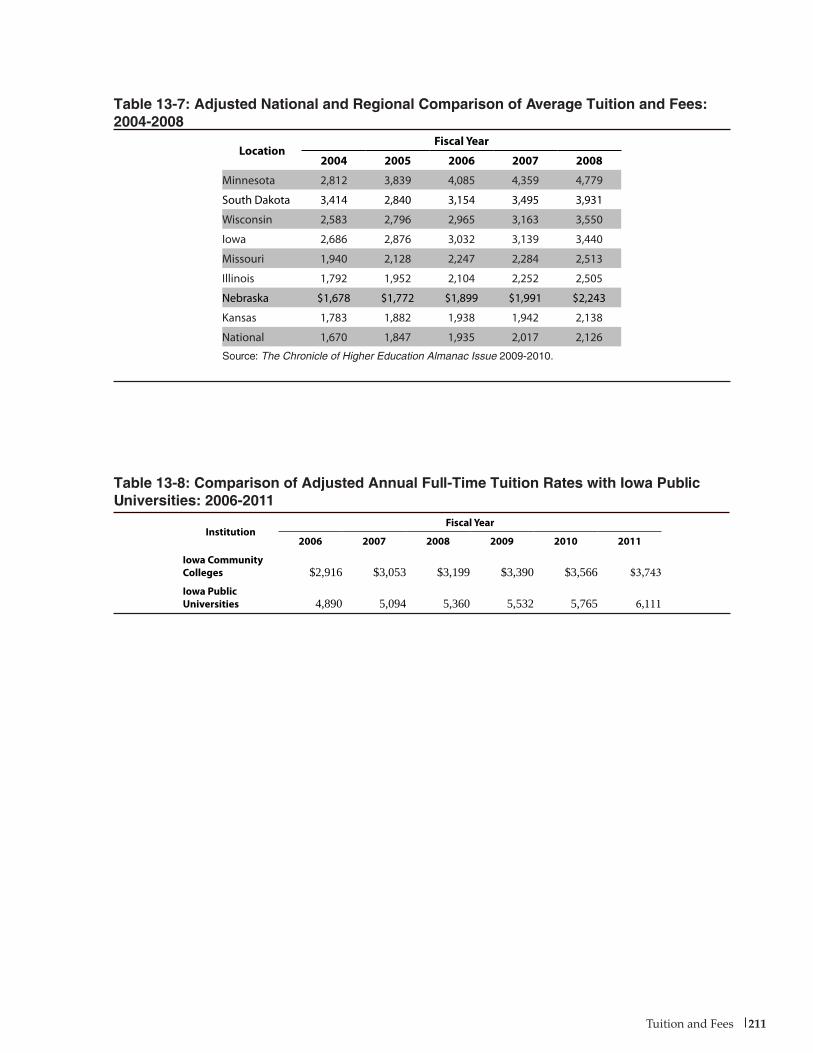
211Tuition and Fees
Table 13-8: Comparison of Adjusted Annual Full-Time Tuition Rates with Iowa Public Universities: 2006-2011
Table 13-7: Adjusted National and Regional Comparison of Average Tuition and Fees: 2004-2008
LocationFiscal Year
2004 2005 2006 2007 2008
Minnesota 2,812 3,839 4,085 4,359 4,779
South Dakota 3,414 2,840 3,154 3,495 3,931
Wisconsin 2,583 2,796 2,965 3,163 3,550
Iowa 2,686 2,876 3,032 3,139 3,440
Missouri 1,940 2,128 2,247 2,284 2,513
Illinois 1,792 1,952 2,104 2,252 2,505
Nebraska $1,678 $1,772 $1,899 $1,991 $2,243
Kansas 1,783 1,882 1,938 1,942 2,138
National 1,670 1,847 1,935 2,017 2,126
Source: The Chronicle of Higher Education Almanac Issue 2009-2010.
InstitutionFiscal Year
2006 2007 2008 2009 2010 2011
Iowa Community Colleges $2,916 $3,053 $3,199 $3,390 $3,566 $3,743 Iowa Public Universities 4,890 5,094 5,360 5,532 5,765 6,111

212 The Condition of Iowa’s Community Colleges
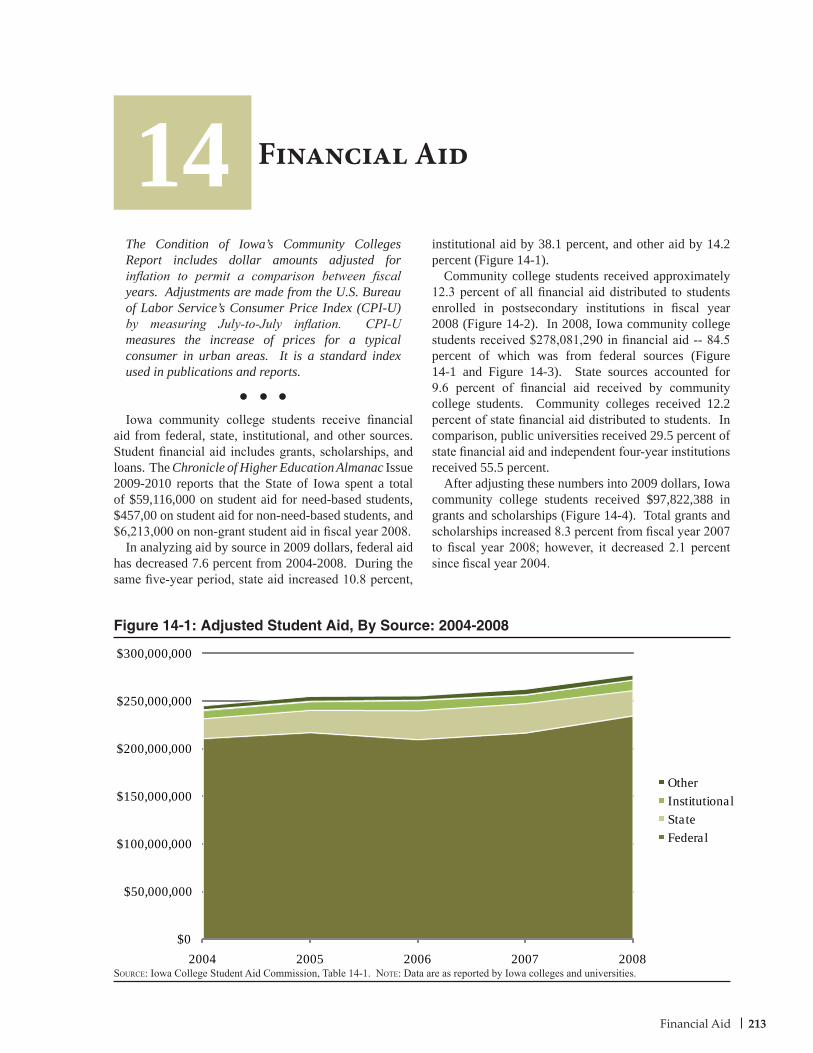
213Financial Aid
$0
$50,000,000
$100,000,000
$150,000,000
$200,000,000
$250,000,000
$300,000,000
2004 2005 2006 2007 2008
OtherInstitutionalStateFederal
Figure 14-1: Adjusted Student Aid, By Source: 2004-2008
Source: Iowa College Student Aid Commission, Table 14-1. Note: Data are as reported by Iowa colleges and universities.
The Condition of Iowa’s Community Colleges Report includes dollar amounts adjusted for inflation to permit a comparison between fiscal years. Adjustments are made from the U.S. Bureau of Labor Service’s Consumer Price Index (CPI-U) by measuring July-to-July inflation. CPI-U measures the increase of prices for a typical consumer in urban areas. It is a standard index used in publications and reports.
Iowa community college students receive financial aid from federal, state, institutional, and other sources. Student financial aid includes grants, scholarships, and loans. The Chronicle of Higher Education Almanac Issue 2009-2010 reports that the State of Iowa spent a total of $59,116,000 on student aid for need-based students, $457,00 on student aid for non-need-based students, and $6,213,000 on non-grant student aid in fiscal year 2008.
In analyzing aid by source in 2009 dollars, federal aid has decreased 7.6 percent from 2004-2008. During the same five-year period, state aid increased 10.8 percent,
institutional aid by 38.1 percent, and other aid by 14.2 percent (Figure 14-1).
Community college students received approximately 12.3 percent of all financial aid distributed to students enrolled in postsecondary institutions in fiscal year 2008 (Figure 14-2). In 2008, Iowa community college students received $278,081,290 in financial aid -- 84.5 percent of which was from federal sources (Figure 14-1 and Figure 14-3). State sources accounted for 9.6 percent of financial aid received by community college students. Community colleges received 12.2 percent of state financial aid distributed to students. In comparison, public universities received 29.5 percent of state financial aid and independent four-year institutions received 55.5 percent.
After adjusting these numbers into 2009 dollars, Iowa community college students received $97,822,388 in grants and scholarships (Figure 14-4). Total grants and scholarships increased 8.3 percent from fiscal year 2007 to fiscal year 2008; however, it decreased 2.1 percent since fiscal year 2004.
Financial Aid14
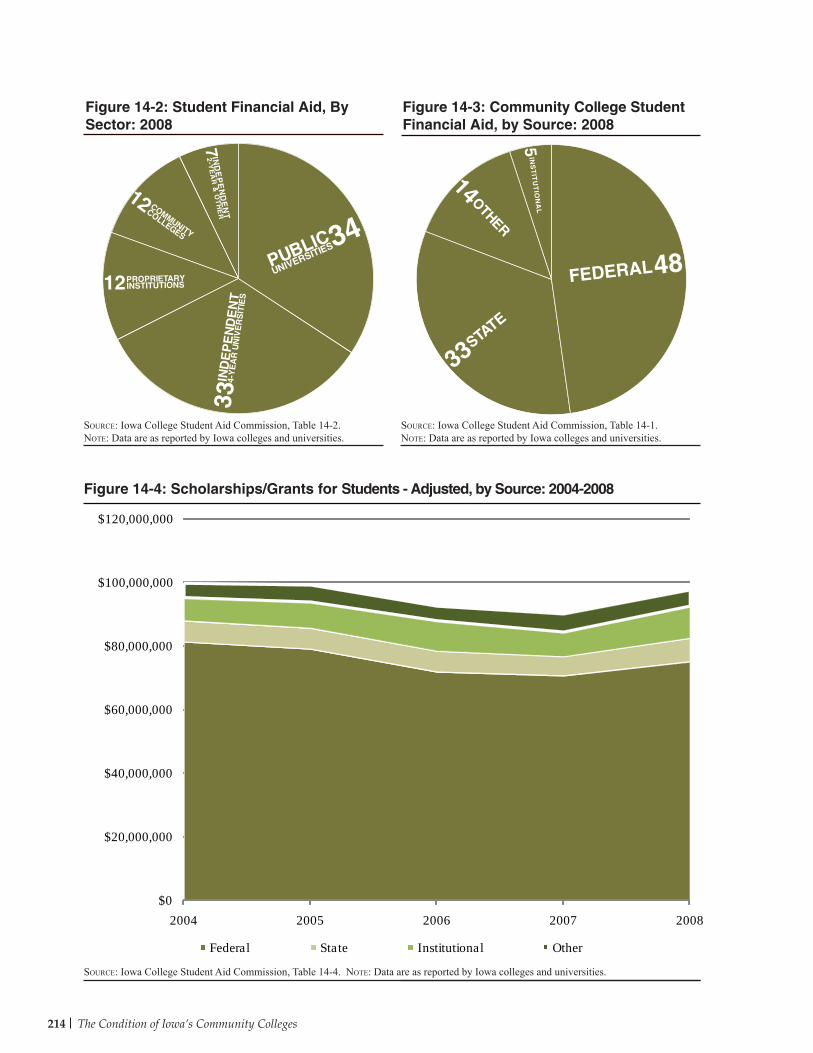
214 The Condition of Iowa’s Community Colleges
$0
$20,000,000
$40,000,000
$60,000,000
$80,000,000
$100,000,000
$120,000,000
2004 2005 2006 2007 2008
Federal State Institutional Other
Source: Iowa College Student Aid Commission, Table 14-1.Note: Data are as reported by Iowa colleges and universities.
Source: Iowa College Student Aid Commission, Table 14-2.Note: Data are as reported by Iowa colleges and universities.
Figure 14-2: Student Financial Aid, By Sector: 2008
Figure 14-4: Scholarships/Grants for Students - Adjusted, by Source: 2004-2008
Source: Iowa College Student Aid Commission, Table 14-4. Note: Data are as reported by Iowa colleges and universities.
Figure 14-3: Community College Student Financial Aid, by Source: 2008
PUBLIC
UNIVERSITIES34
IND
EP
EN
DE
NT
2-Y
EA
R &
OT
HE
R
7
IND
EP
EN
DE
NT
4-Y
EA
R U
NIV
ER
SIT
IES
33
PROPRIETARYINSTITUTIONS12
COMMUNITY
COLLEGES
12
FEDERAL48
OTHER
14
INS
TIT
UT
ION
AL
5
STATE
33
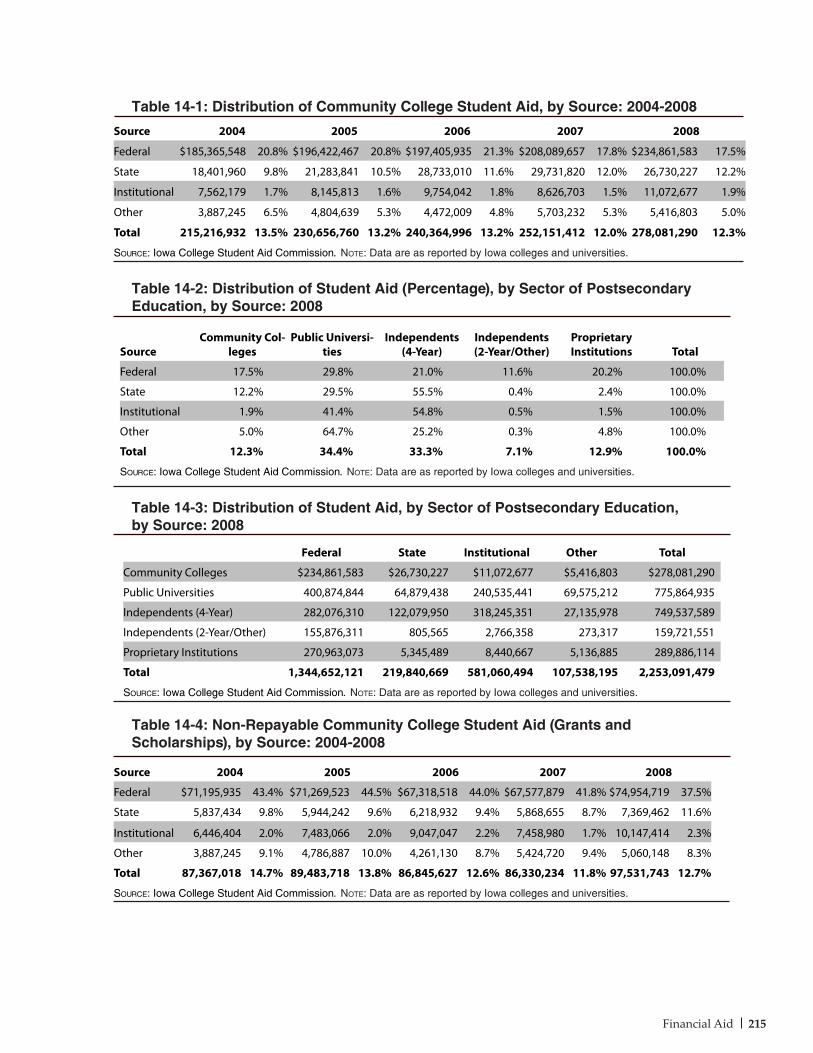
215Financial Aid
Table 14-1: Distribution of Community College Student Aid, by Source: 2004-2008
Federal State Institutional Other Total
Community Colleges $234,861,583 $26,730,227 $11,072,677 $5,416,803 $278,081,290
Public Universities 400,874,844 64,879,438 240,535,441 69,575,212 775,864,935
Independents (4-Year) 282,076,310 122,079,950 318,245,351 27,135,978 749,537,589
Independents (2-Year/Other) 155,876,311 805,565 2,766,358 273,317 159,721,551
Proprietary Institutions 270,963,073 5,345,489 8,440,667 5,136,885 289,886,114
Total 1,344,652,121 219,840,669 581,060,494 107,538,195 2,253,091,479
Source: Iowa College Student Aid Commission. Note: Data are as reported by Iowa colleges and universities.
Source 2004 2005 2006 2007 2008
Federal $185,365,548 20.8% $196,422,467 20.8% $197,405,935 21.3% $208,089,657 17.8% $234,861,583 17.5%
State 18,401,960 9.8% 21,283,841 10.5% 28,733,010 11.6% 29,731,820 12.0% 26,730,227 12.2%
Institutional 7,562,179 1.7% 8,145,813 1.6% 9,754,042 1.8% 8,626,703 1.5% 11,072,677 1.9%
Other 3,887,245 6.5% 4,804,639 5.3% 4,472,009 4.8% 5,703,232 5.3% 5,416,803 5.0%
Total 215,216,932 13.5% 230,656,760 13.2% 240,364,996 13.2% 252,151,412 12.0% 278,081,290 12.3%
Source: Iowa College Student Aid Commission. Note: Data are as reported by Iowa colleges and universities.
Table 14-2: Distribution of Student Aid (Percentage), by Sector of Postsecondary Education, by Source: 2008
SourceCommunity Col-
legesPublic Universi-
tiesIndependents
(4-Year)Independents (2-Year/Other)
Proprietary Institutions Total
Federal 17.5% 29.8% 21.0% 11.6% 20.2% 100.0%
State 12.2% 29.5% 55.5% 0.4% 2.4% 100.0%
Institutional 1.9% 41.4% 54.8% 0.5% 1.5% 100.0%
Other 5.0% 64.7% 25.2% 0.3% 4.8% 100.0%
Total 12.3% 34.4% 33.3% 7.1% 12.9% 100.0%
Source: Iowa College Student Aid Commission. Note: Data are as reported by Iowa colleges and universities.
Table 14-3: Distribution of Student Aid, by Sector of Postsecondary Education, by Source: 2008
Table 14-4: Non-Repayable Community College Student Aid (Grants and Scholarships), by Source: 2004-2008
Source 2004 2005 2006 2007 2008
Federal $71,195,935 43.4% $71,269,523 44.5% $67,318,518 44.0% $67,577,879 41.8% $74,954,719 37.5%
State 5,837,434 9.8% 5,944,242 9.6% 6,218,932 9.4% 5,868,655 8.7% 7,369,462 11.6%
Institutional 6,446,404 2.0% 7,483,066 2.0% 9,047,047 2.2% 7,458,980 1.7% 10,147,414 2.3%
Other 3,887,245 9.1% 4,786,887 10.0% 4,261,130 8.7% 5,424,720 9.4% 5,060,148 8.3%
Total 87,367,018 14.7% 89,483,718 13.8% 86,845,627 12.6% 86,330,234 11.8% 97,531,743 12.7%
Source: Iowa College Student Aid Commission. Note: Data are as reported by Iowa colleges and universities.

216 The Condition of Iowa’s Community Colleges
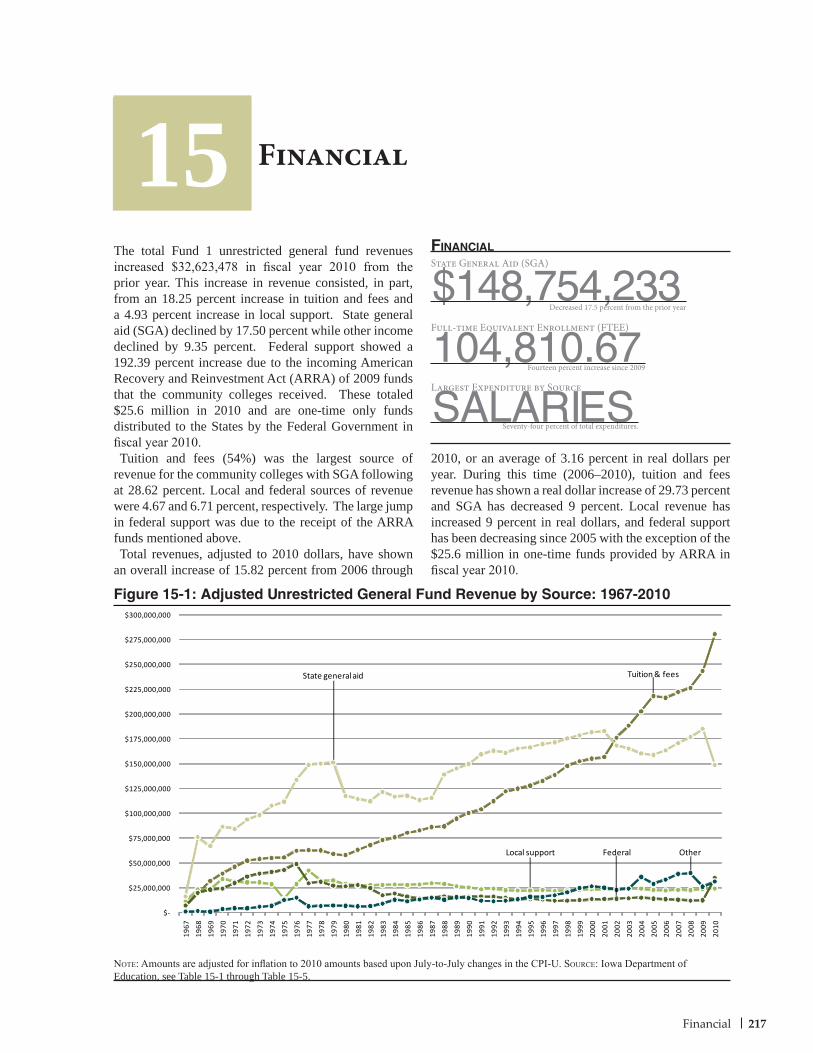
217Financial
Financial
Figure 15-1: Adjusted Unrestricted General Fund Revenue by Source: 1967-2010
15The total Fund 1 unrestricted general fund revenues increased $32,623,478 in fiscal year 2010 from the prior year. This increase in revenue consisted, in part, from an 18.25 percent increase in tuition and fees and a 4.93 percent increase in local support. State general aid (SGA) declined by 17.50 percent while other income declined by 9.35 percent. Federal support showed a 192.39 percent increase due to the incoming American Recovery and Reinvestment Act (ARRA) of 2009 funds that the community colleges received. These totaled $25.6 million in 2010 and are one-time only funds distributed to the States by the Federal Government in fiscal year 2010.Tuition and fees (54%) was the largest source of
revenue for the community colleges with SGA following at 28.62 percent. Local and federal sources of revenue were 4.67 and 6.71 percent, respectively. The large jump in federal support was due to the receipt of the ARRA funds mentioned above.Total revenues, adjusted to 2010 dollars, have shown
an overall increase of 15.82 percent from 2006 through
2010, or an average of 3.16 percent in real dollars per year. During this time (2006–2010), tuition and fees revenue has shown a real dollar increase of 29.73 percent and SGA has decreased 9 percent. Local revenue has increased 9 percent in real dollars, and federal support has been decreasing since 2005 with the exception of the $25.6 million in one-time funds provided by ARRA in fiscal year 2010.
Note: Amounts are adjusted for inflation to 2010 amounts based upon July-to-July changes in the CPI-U. Source: Iowa Department of Education, see Table 15-1 through Table 15-5.
State General Aid (SGA)
$148,754,233Financial
Largest Expenditure by Source
SALARIES
Decreased 17.5 percent from the prior year
Seventy-four percent of total expenditures.
Full-time Equivalent Enrollment (FTEE)
104,810.67Fourteen percent increase since 2009
$-
$25,000,000
$50,000,000
$75,000,000
$100,000,000
$125,000,000
$150,000,000
$175,000,000
$200,000,000
$225,000,000
$250,000,000
$275,000,000
$300,000,000
1967
1968
1969
1970
1971
1972
1973
1974
1975
1976
1977
1978
1979
1980
1981
1982
1983
1984
1985
1986
1987
1988
1989
1990
1991
1992
1993
1994
1995
1996
1997
1998
1999
2000
2001
2002
2003
2004
2005
2006
2007
2008
2009
2010
State general aid Tuition & fees
FederalLocal support Other
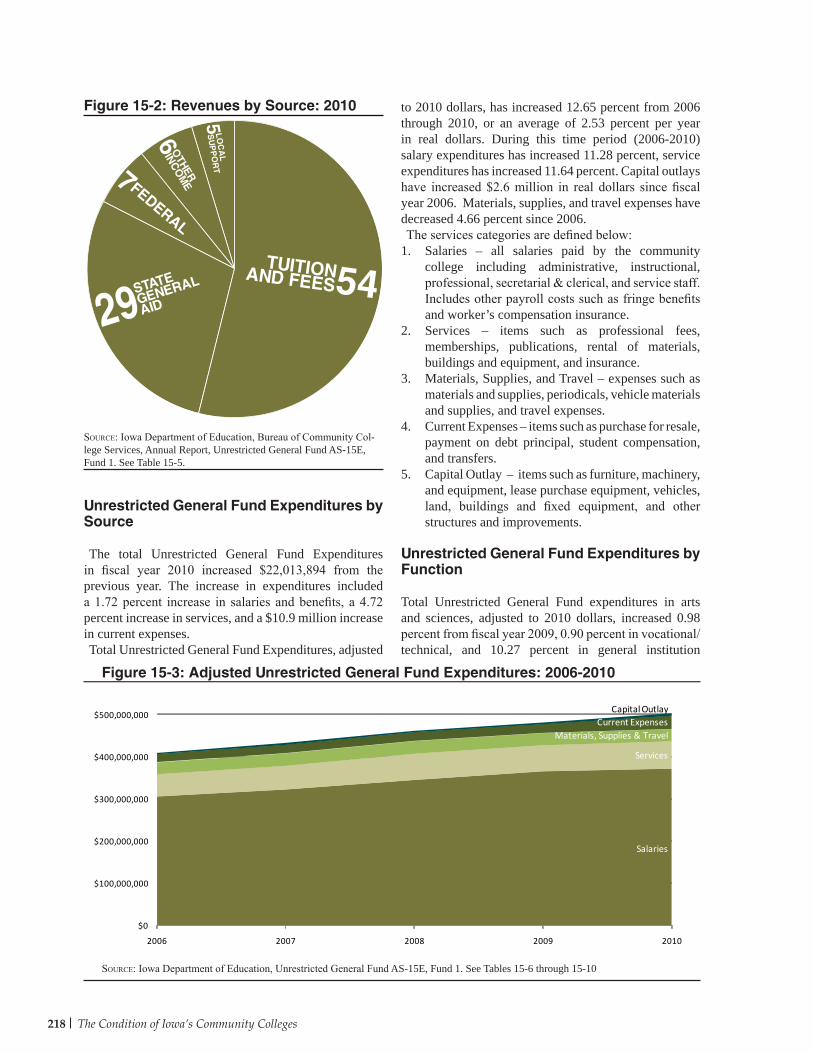
218 The Condition of Iowa’s Community Colleges
Figure 15-2: Revenues by Source: 2010
Source: Iowa Department of Education, Bureau of Community Col-lege Services, Annual Report, Unrestricted General Fund AS-15E, Fund 1. See Table 15-5.
Unrestricted General Fund Expenditures by Source
The total Unrestricted General Fund Expenditures in fiscal year 2010 increased $22,013,894 from the previous year. The increase in expenditures included a 1.72 percent increase in salaries and benefits, a 4.72 percent increase in services, and a $10.9 million increase in current expenses.Total Unrestricted General Fund Expenditures, adjusted
to 2010 dollars, has increased 12.65 percent from 2006 through 2010, or an average of 2.53 percent per year in real dollars. During this time period (2006-2010) salary expenditures has increased 11.28 percent, service expenditures has increased 11.64 percent. Capital outlays have increased $2.6 million in real dollars since fiscal year 2006. Materials, supplies, and travel expenses have decreased 4.66 percent since 2006.The services categories are defined below:
1. Salaries – all salaries paid by the community college including administrative, instructional, professional, secretarial & clerical, and service staff. Includes other payroll costs such as fringe benefits and worker’s compensation insurance.
2. Services – items such as professional fees, memberships, publications, rental of materials, buildings and equipment, and insurance.
3. Materials, Supplies, and Travel – expenses such as materials and supplies, periodicals, vehicle materials and supplies, and travel expenses.
4. Current Expenses – items such as purchase for resale, payment on debt principal, student compensation, and transfers.
5. Capital Outlay – items such as furniture, machinery, and equipment, lease purchase equipment, vehicles, land, buildings and fixed equipment, and other structures and improvements.
Unrestricted General Fund Expenditures by Function
Total Unrestricted General Fund expenditures in arts and sciences, adjusted to 2010 dollars, increased 0.98 percent from fiscal year 2009, 0.90 percent in vocational/technical, and 10.27 percent in general institution
Source: Iowa Department of Education, Unrestricted General Fund AS-15E, Fund 1. See Tables 15-6 through 15-10
Figure 15-3: Adjusted Unrestricted General Fund Expenditures: 2006-2010
TUITIONAND FEES54STATE
GENERAL
AID29
FEDERAL
7
OTHER
INC
OM
E
6 LO
CA
LS
UP
PO
RT
5
$0
$100,000,000
$200,000,000
$300,000,000
$400,000,000
$500,000,000
2006 2007 2008 2009 2010
Salaries
Services
Materials, Supplies & TravelCurrent Expenses
Capital Outlay

219Financial
functions. Adult Education expenditures decreased 6.11 percent cooperative programs/services declines 16.74 percent, and student services expenditures declined 2.5 percent.From 2006 through 2010, in 2010 dollars, the arts
and sciences function experienced a 17.97 percent ($18.3 million) increase in expenditures, the vocational/technical function a 8.06 percent ($9 million) increase, the administration function a 40 percent ($9.6 million) increase, and student services a 11.35 percent ($4.3 million) increase. In contrast, adult education expenditures decreased 11.02 percent ($4.8 million), and learning resources expenditures decreased 5.87 percent ($793,846) since fiscal year 2006.The vocational/technical function continues to be
the largest source of expenditures in fiscal year 2010 at 23.96 percent. This function is followed by the arts and sciences function at 23.86 percent. The physical plant function was 11.51 percent, the general institution expenses were 13.55 percent, adult education was 7.69 percent, and the administration function was 6.72 percent of the total expenditures in fiscal year 2010.The function categories are defined below:
• Arts and Sciences – all administrative and instructional organizational units of the community college that provide instruction in the area of college parallel and career option/college parallel (CO/CP).
• Career/Vocational Technical – all organizational units designed to provide vocational, technical, and semi-professional training.
• Adult Education – all organizational units designed to provide services, courses, and programs intended mainly for part-time students who are not a part of one of the instructional divisions of arts and sciences or career/vocational technical functions. Some examples include Adult Basic Education (ABE), high school completion, and short-term preparatory.
• Cooperative Programs or Services – all organizational units designed to provide instruction for secondary joint effort activities and all activities concerning Chapter 260E Industrial New Jobs Training and Chapter 260F Jobs Training.
• Administration – all expenses of the Community College Board of Trustees, the CEO, and business office, which serves the entire community college.
• Student Services – all organizational units, which are primarily concerned with providing services for students.
• Learning Resources – all organizational units, which provide for storage, distribution, and use of educational materials throughout the entire community college.
• Physical Plant – all organizational units, which are responsible for the operation and maintenance of the community college’s physical facilities.
• General Institution – all other expenses except those included in the above functions. Some examples include institutional development, data processing, general printing, communication, alumni affairs, early retirement, and telecommunications.
Unrestricted General Fund Revenues vs. Expenditures
Both revenues and expenditures have increased each year over the last five years. After adjusting for inflation and adjusting each year into 2010 dollars, revenue grew by 3.97 percent from fiscal year 2009 to fiscal year 2010 and expenditures grew by 1.89 percent. Since fiscal year 2006, Unrestricted General Fund revenues have grown 15.82 percent while Unrestricted General Fund expenditures have grown 12.65 percent.
Full-Time Equivalent Enrollment (FTEE)
The Full-Time Equivalent Enrollment (FTEE) calculation is utilized when determining SGA. Due to timing of the calculation to meet Iowa Legislative deadlines, the enrollment used to calculate SGA is two years behind the year of the aid (i.e., fiscal year 2010 enrollments are used to calculate fiscal year 2012 SGA). Twenty-four (24) credit semester hours equals one FTEE, while 600 non-credit contact hours equals one FTEE.
FTEE totals have increased overall from fiscal year 2006 through fiscal year 2010 by 15,563.57. The fiscal
Figure 15-4: Expenditures by Source: 2010
Source: Iowa Department of Education, Division of Community Colleges and Workforce Preparation, Annual Report, Unrestricted General Fund AS-15E, Fund 1. See Table 15-5.
SALARIES &
BENEFITS74
SERVICES
13M
ATER
IALS
SU
PP
LIES
&
TRAV
EL
6C
URR
ENT
EXPENSES
6
1C
AP
ITAL
OU
TL
AY
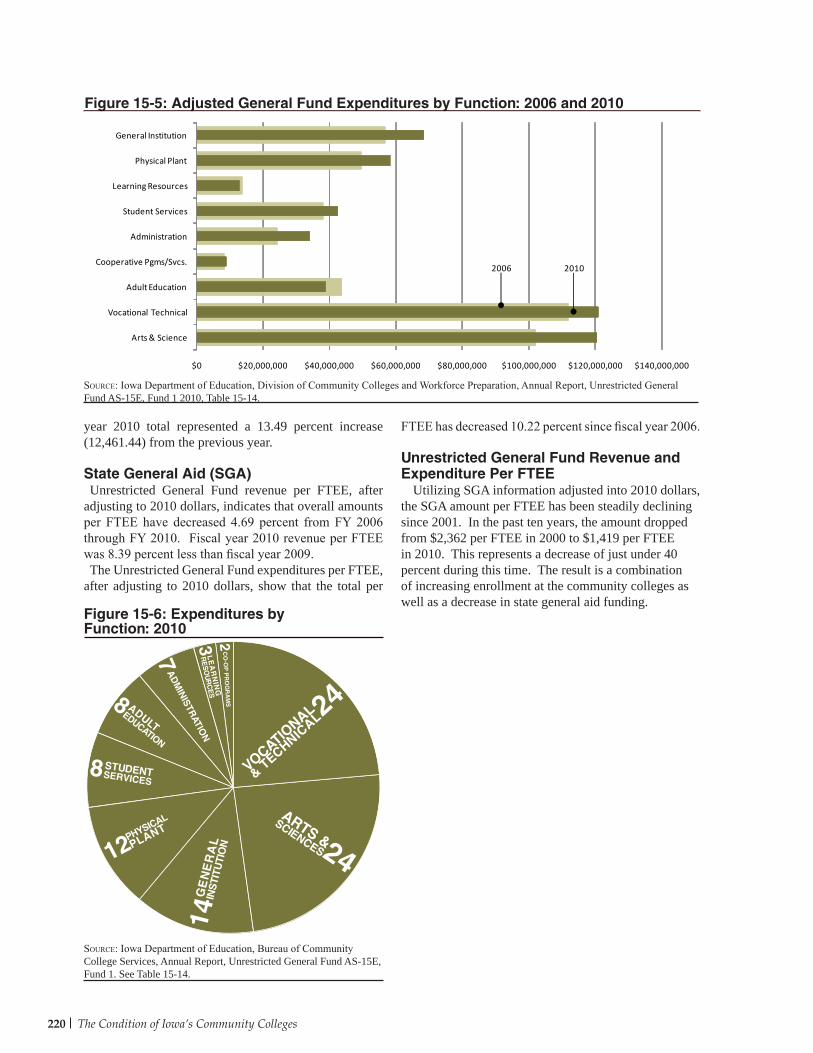
220 The Condition of Iowa’s Community Colleges
year 2010 total represented a 13.49 percent increase (12,461.44) from the previous year.
State General Aid (SGA)Unrestricted General Fund revenue per FTEE, after
adjusting to 2010 dollars, indicates that overall amounts per FTEE have decreased 4.69 percent from FY 2006 through FY 2010. Fiscal year 2010 revenue per FTEE was 8.39 percent less than fiscal year 2009. The Unrestricted General Fund expenditures per FTEE,
after adjusting to 2010 dollars, show that the total per
FTEE has decreased 10.22 percent since fiscal year 2006.
Unrestricted General Fund Revenue and Expenditure Per FTEE
Utilizing SGA information adjusted into 2010 dollars, the SGA amount per FTEE has been steadily declining since 2001. In the past ten years, the amount dropped from $2,362 per FTEE in 2000 to $1,419 per FTEE in 2010. This represents a decrease of just under 40 percent during this time. The result is a combination of increasing enrollment at the community colleges as well as a decrease in state general aid funding.
Figure 15-5: Adjusted General Fund Expenditures by Function: 2006 and 2010
Source: Iowa Department of Education, Division of Community Colleges and Workforce Preparation, Annual Report, Unrestricted General Fund AS-15E, Fund 1 2010, Table 15-14.
Figure 15-6: Expenditures byFunction: 2010
Source: Iowa Department of Education, Bureau of Community College Services, Annual Report, Unrestricted General Fund AS-15E, Fund 1. See Table 15-14.
23
13
9 A DE D
3LR
2C
O
VOCATIONAL
& TECHNIC
AL24
ARTS &SCIENCES24
GE
NE
RA
LIN
STI
TUTI
ON
14
PHYSICAL
PLANT
12
ADULTEDUCATION
8
STUDENTSERVICES8
AD
MIN
ISTRATIO
N
7 LE
AR
NIN
G
RE
SO
UR
CE
S3
CO
-OP
PR
OG
RA
MS
2
$0 $20,000,000 $40,000,000 $60,000,000 $80,000,000 $100,000,000 $120,000,000 $140,000,000
Arts & Science
Vocational Technical
Adult Education
Cooperative Pgms/Svcs.
Administration
Student Services
Learning Resources
Physical Plant
General Institution
2006 2010

221Financial
Figure 15-7: Full-Time Equivalent Enrollment (FTEE): 1967-2009
Note: FTEE between 1996 and 1998 are not available. Source: Iowa Department of Education, Division of Community Colleges and Workforce Preparation, AS-15E. See Table 15-15 through 15-19 and www.iowa.gov/educate for historical amounts.
Note: FTEE between 1996 and 1998 are not available. Source: Iowa Department of Education, Division of Community Colleges and Workforce Preparation, Community College MIS. See Table 15-20 and www.iowa.gov/educate for historical amounts.
Figure 15-8: Adjusted State General Aid per FTEE: 1967-2010
0
10,000
20,000
30,000
40,000
50,000
60,000
70,000
80,000
90,000
100,000
110,000
120,000
1967 1970 1973 1976 1979 1982 1985 1988 1991 1994 1997 2000 2003 2006 2009
$-
$500
$1,000
$1,500
$2,000
$2,500
$3,000
$3,500
$4,000
$4,500
1967 1970 1973 1976 1979 1982 1985 1988 1991 1994 1997 2000 2003 2006 2009
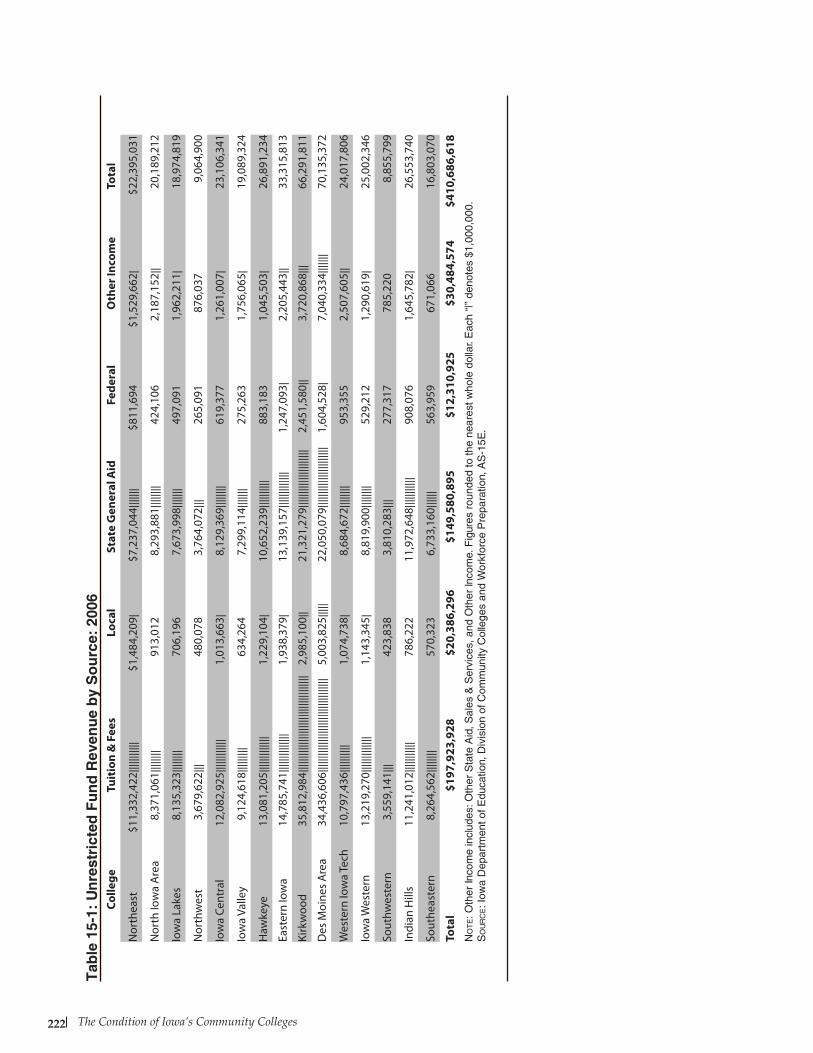
The Condition of Iowa’s Community Colleges222
Colle
geTu
itio
n &
Fee
sLo
cal
Stat
e G
ener
al A
idFe
dera
lO
ther
Inco
me
Tota
l
Nor
thea
st$1
1,33
2,42
2 ||||
||||||
|$1
,484
,209
|$7
,237
,044
||||||
|$8
11,6
94$1
,529
,662
|$2
2,39
5,03
1
Nor
th Io
wa
Are
a8,
371,
061 |
||||||
|91
3,01
28,
293,
881|
||||||
|42
4,10
62,
187,
152|
|20
,189
,212
Iow
a La
kes
8,13
5,32
3 ||||
||||
706,
196
7,67
3,99
8||||
|||49
7,09
11,
962,
211|
18,9
74,8
19
Nor
thw
est
3,67
9,62
2 |||
480,
078
3,76
4,07
2|||
265,
091
876,
037
9,06
4,90
0
Iow
a Ce
ntra
l12
,082
,925
||||||
||||||
1,01
3,66
3|8,
129,
369|
||||||
|61
9,37
71,
261,
007|
23,1
06,3
41
Iow
a Va
lley
9,12
4,61
8 ||||
|||||
634,
264
7,29
9,11
4||||
|||27
5,26
31,
756,
065|
19,0
89,3
24
Haw
keye
13,0
81,2
05|||
||||||
||||
1,22
9,10
4|10
,652
,239
||||||
||||
883,
183
1,04
5,50
3|26
,891
,234
East
ern
Iow
a14
,785
,741
||||||
||||||
||1,
938,
379|
13,1
39,1
57|||
||||||
||||
1,24
7,09
3|2,
205,
443|
|33
,315
,813
Kirk
woo
d35
,812
,984
||||||
||||||
||||||
||||||
||||||
|||||
2,98
5,10
0||
21,3
21,2
79|||
||||||
||||||
||||||
2,45
1,58
0||
3,72
0,86
8|||
66,2
91,8
11
Des
Moi
nes
Are
a34
,436
,606
||||||
||||||
||||||
||||||
||||||
||||
5,00
3,82
5||||
|22
,050
,079
||||||
||||||
||||||
||||
1,60
4,52
8|7,
040,
334|
||||||
70,1
35,3
72
Wes
tern
Iow
a Te
ch10
,797
,436
||||||
||||
1,07
4,73
8|8,
684,
672|
||||||
|95
3,35
52,
507,
605|
|24
,017
,806
Iow
a W
este
rn13
,219
,270
||||||
||||||
|1,
143,
345|
8,81
9,90
0||||
||||
529,
212
1,29
0,61
9|25
,002
,346
Sout
hwes
tern
3,55
9,14
1 |||
423,
838
3,81
0,28
3|||
277,
317
785,
220
8,85
5,79
9
Indi
an H
ills
11,2
41,0
12|||
||||||
||78
6,22
211
,972
,648
||||||
|||||
908,
076
1,64
5,78
2|26
,553
,740
Sout
heas
tern
8,26
4,56
2 ||||
||||
570,
323
6,73
3,16
0||||
||56
3,95
967
1,06
616
,803
,070
Tota
l$1
97,9
23,9
28$2
0,38
6,29
6$1
49,5
80,8
95$1
2,31
0,92
5$3
0,48
4,57
4$4
10,6
86,6
18N
ot
e: O
ther
Inco
me
incl
udes
: Oth
er S
tate
Aid
, Sal
es &
Ser
vice
s, a
nd O
ther
Inco
me.
Fig
ures
rou
nded
to th
e ne
ares
t who
le d
olla
r. E
ach
“|”
deno
tes
$1,0
00,0
00.
So
ur
ce: I
owa
Dep
artm
ent o
f Edu
catio
n, D
ivis
ion
of C
omm
unity
Col
lege
s an
d W
orkf
orce
Pre
para
tion,
AS
-15E
.
Tab
le 1
5-1:
Un
rest
rict
ed F
un
d R
even
ue
by
So
urc
e: 2
006
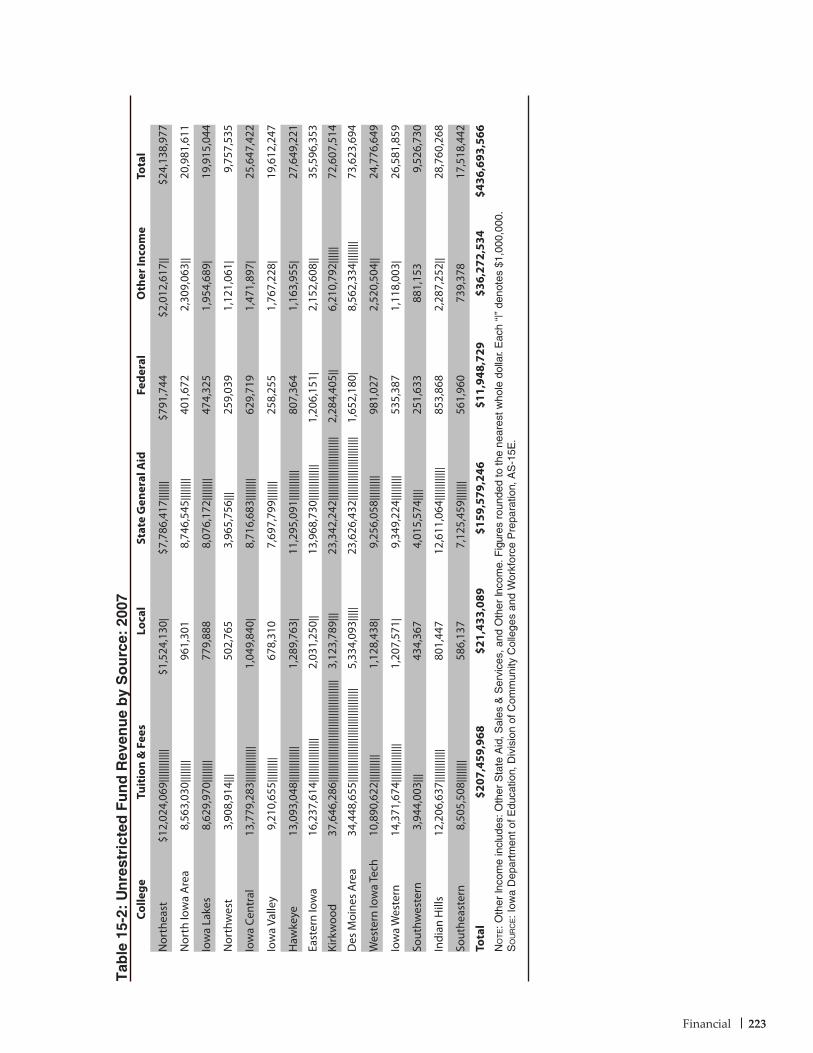
Financial 223
Tab
le 1
5-2:
Un
rest
rict
ed F
un
d R
even
ue
by
So
urc
e: 2
007
Colle
geTu
itio
n &
Fee
sLo
cal
Stat
e G
ener
al A
idFe
dera
lO
ther
Inco
me
Tota
l
Nor
thea
st$1
2,02
4,06
9 ||||
||||||
||$1
,524
,130
|$7
,786
,417
||||||
|$7
91,7
44$2
,012
,617
||$2
4,13
8,97
7
Nor
th Io
wa
Are
a8,
563,
030 |
||||||
|96
1,30
18,
746,
545|
||||||
|40
1,67
22,
309,
063|
|20
,981
,611
Iow
a La
kes
8,62
9,97
0 ||||
||||
779,
888
8,07
6,17
2||||
||||
474,
325
1,95
4,68
9|19
,915
,044
Nor
thw
est
3,90
8,91
4 |||
502,
765
3,96
5,75
6|||
259,
039
1,12
1,06
1|9,
757,
535
Iow
a Ce
ntra
l13
,779
,283
||||||
||||||
|1,
049,
840|
8,71
6,68
3||||
||||
629,
719
1,47
1,89
7|25
,647
,422
Iow
a Va
lley
9,21
0,65
5 ||||
|||||
678,
310
7,69
7,79
9||||
|||25
8,25
51,
767,
228|
19,6
12,2
47
Haw
keye
13,0
93,0
48|||
||||||
||||
1,28
9,76
3|11
,295
,091
||||||
|||||
807,
364
1,16
3,95
5|27
,649
,221
East
ern
Iow
a16
,237
,614
||||||
||||||
||||
2,03
1,25
0||
13,9
68,7
30|||
||||||
||||
1,20
6,15
1|2,
152,
608|
|35
,596
,353
Kirk
woo
d37
,646
,286
||||||
||||||
||||||
||||||
||||||
||||||
|3,
123,
789|
||23
,342
,242
||||||
||||||
||||||
|||||
2,28
4,40
5||
6,21
0,79
2||||
||72
,607
,514
Des
Moi
nes
Are
a34
,448
,655
||||||
||||||
||||||
||||||
||||||
||||
5,33
4,09
3||||
|23
,626
,432
||||||
||||||
||||||
|||||
1,65
2,18
0|8,
562,
334|
||||||
|73
,623
,694
Wes
tern
Iow
a Te
ch10
,890
,622
||||||
||||
1,12
8,43
8|9,
256,
058|
||||||
||98
1,02
72,
520,
504|
|24
,776
,649
Iow
a W
este
rn14
,371
,674
||||||
||||||
||1,
207,
571|
9,34
9,22
4||||
|||||
535,
387
1,11
8,00
3|26
,581
,859
Sout
hwes
tern
3,94
4,00
3 |||
434,
367
4,01
5,57
4||||
251,
633
881,
153
9,52
6,73
0
Indi
an H
ills
12,2
06,6
37|||
||||||
|||80
1,44
712
,611
,064
||||||
||||||
853,
868
2,28
7,25
2||
28,7
60,2
68
Sout
heas
tern
8,50
5,50
8 ||||
||||
586,
137
7,12
5,45
9||||
|||56
1,96
073
9,37
817
,518
,442
Tota
l$2
07,4
59,9
68$2
1,43
3,08
9$1
59,5
79,2
46$1
1,94
8,72
9$3
6,27
2,53
4$4
36,6
93,5
66N
ot
e: O
ther
Inco
me
incl
udes
: Oth
er S
tate
Aid
, Sal
es &
Ser
vice
s, a
nd O
ther
Inco
me.
Fig
ures
rou
nded
to th
e ne
ares
t who
le d
olla
r. E
ach
“|”
deno
tes
$1,0
00,0
00.
So
ur
ce: I
owa
Dep
artm
ent o
f Edu
catio
n, D
ivis
ion
of C
omm
unity
Col
lege
s an
d W
orkf
orce
Pre
para
tion,
AS
-15E
.
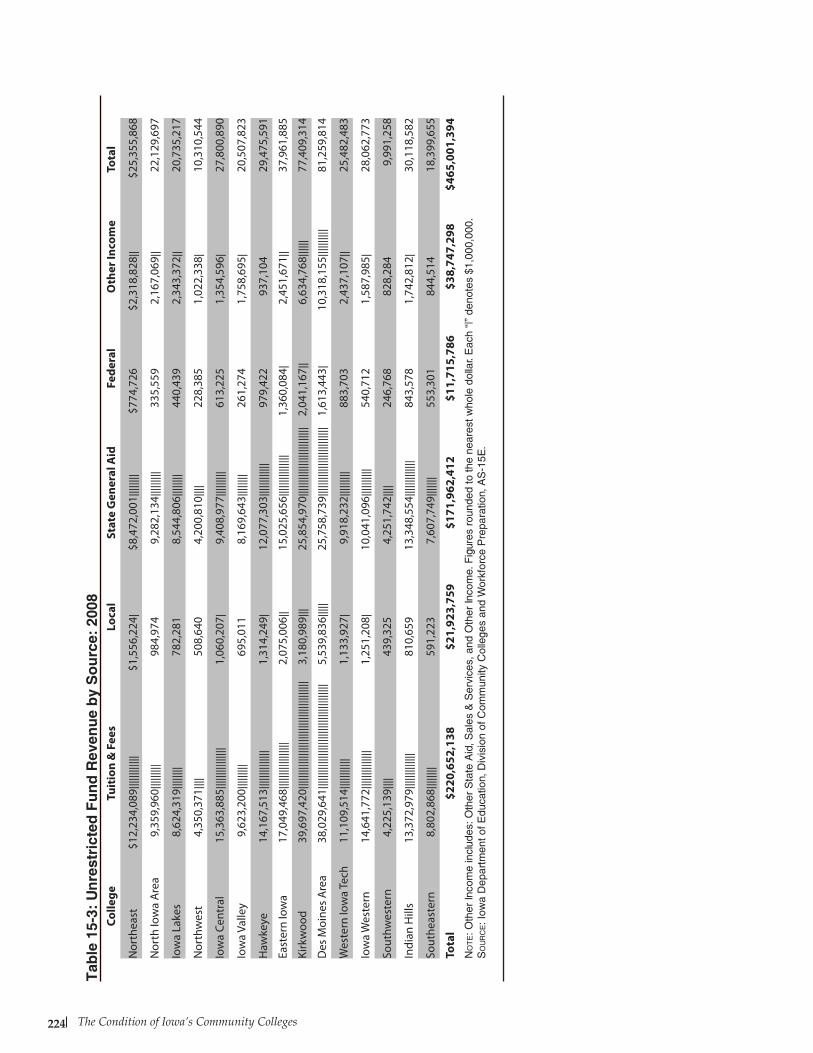
The Condition of Iowa’s Community Colleges224
Colle
geTu
itio
n &
Fee
sLo
cal
Stat
e G
ener
al A
idFe
dera
lO
ther
Inco
me
Tota
l
Nor
thea
st$1
2,23
4,08
9 ||||
||||||
||$1
,556
,224
|$8
,472
,001
||||||
||$7
74,7
26$2
,318
,828
||$2
5,35
5,86
8
Nor
th Io
wa
Are
a9,
359,
960 |
||||||
||98
4,97
49,
282,
134|
||||||
||33
5,55
92,
167,
069|
|22
,129
,697
Iow
a La
kes
8,62
4,31
9 ||||
||||
782,
281
8,54
4,80
6||||
||||
440,
439
2,34
3,37
2||
20,7
35,2
17
Nor
thw
est
4,35
0,37
1 ||||
508,
640
4,20
0,81
0||||
228,
385
1,02
2,33
8|10
,310
,544
Iow
a Ce
ntra
l15
,363
,885
||||||
||||||
|||1,
060,
207|
9,40
8,97
7||||
|||||
613,
225
1,35
4,59
6|27
,800
,890
Iow
a Va
lley
9,62
3,20
0 ||||
|||||
695,
011
8,16
9,64
3||||
||||
261,
274
1,75
8,69
5|20
,507
,823
Haw
keye
14,1
67,5
13|||
||||||
|||||
1,31
4,24
9|12
,077
,303
||||||
||||||
979,
422
937,
104
29,4
75,5
91
East
ern
Iow
a17
,049
,468
||||||
||||||
|||||
2,07
5,00
6||
15,0
25,6
56|||
||||||
||||||
1,36
0,08
4|2,
451,
671|
|37
,961
,885
Kirk
woo
d39
,697
,420
||||||
||||||
||||||
||||||
||||||
||||||
|||3,
180,
989|
||25
,854
,970
||||||
||||||
||||||
||||||
|2,
041,
167|
|6,
634,
768|
|||||
77,4
09,3
14
Des
Moi
nes
Are
a38
,029
,641
||||||
||||||
||||||
||||||
||||||
||||||
||5,
539,
836|
||||
25,7
58,7
39|||
||||||
||||||
||||||
||||
1,61
3,44
3|10
,318
,155
||||||
||||
81,2
59,8
14
Wes
tern
Iow
a Te
ch11
,109
,514
||||||
|||||
1,13
3,92
7|9,
918,
232|
||||||
||88
3,70
32,
437,
107|
|25
,482
,483
Iow
a W
este
rn14
,641
,772
||||||
||||||
||1,
251,
208|
10,0
41,0
96|||
||||||
|54
0,71
21,
587,
985|
28,0
62,7
73
Sout
hwes
tern
4,22
5,13
9 ||||
439,
325
4,25
1,74
2||||
246,
768
828,
284
9,99
1,25
8
Indi
an H
ills
13,3
72,9
79|||
||||||
||||
810,
659
13,3
48,5
54|||
||||||
||||
843,
578
1,74
2,81
2|30
,118
,582
Sout
heas
tern
8,80
2,86
8 ||||
||||
591,
223
7,60
7,74
9||||
|||55
3,30
184
4,51
418
,399
,655
Tota
l$2
20,6
52,1
38$2
1,92
3,75
9$1
71,9
62,4
12$1
1,71
5,78
6$3
8,74
7,29
8$4
65,0
01,3
94N
ot
e: O
ther
Inco
me
incl
udes
: Oth
er S
tate
Aid
, Sal
es &
Ser
vice
s, a
nd O
ther
Inco
me.
Fig
ures
rou
nded
to th
e ne
ares
t who
le d
olla
r. E
ach
“|”
deno
tes
$1,0
00,0
00.
So
ur
ce: I
owa
Dep
artm
ent o
f Edu
catio
n, D
ivis
ion
of C
omm
unity
Col
lege
s an
d W
orkf
orce
Pre
para
tion,
AS
-15E
.
Tab
le 1
5-3:
Un
rest
rict
ed F
un
d R
even
ue
by
So
urc
e: 2
008
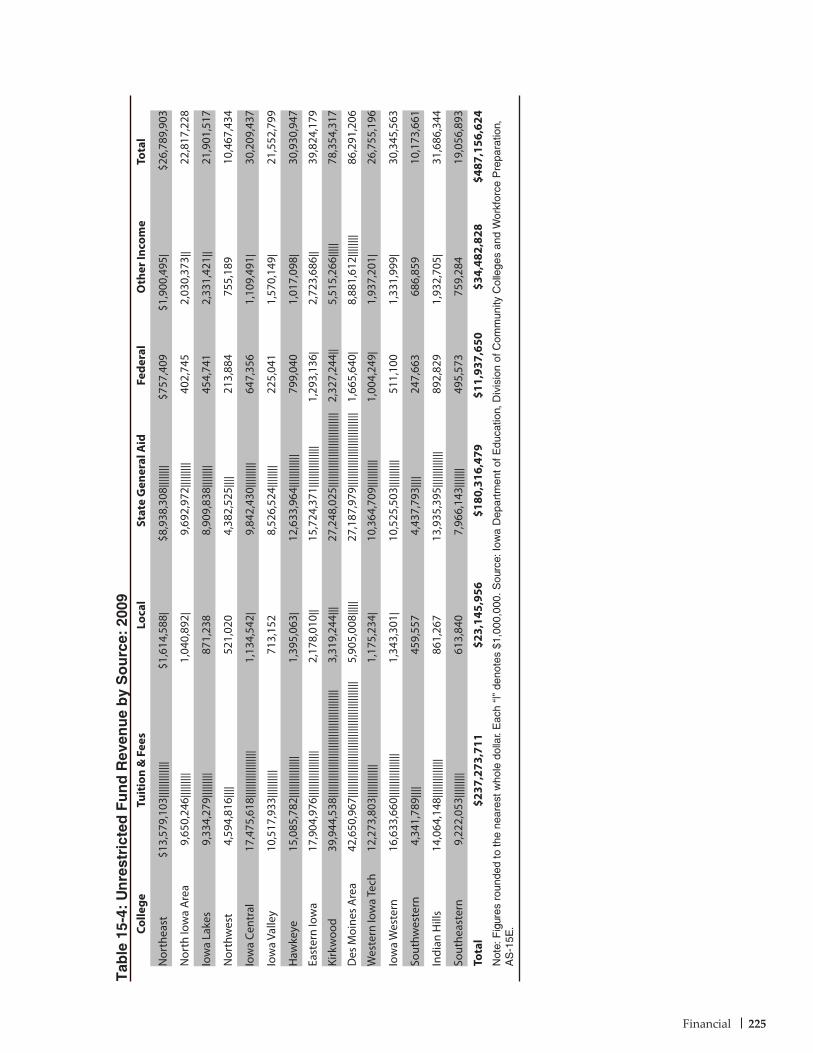
Financial 225
Tab
le 1
5-4:
Un
rest
rict
ed F
un
d R
even
ue
by
So
urc
e: 2
009
Colle
geTu
itio
n &
Fee
sLo
cal
Stat
e G
ener
al A
idFe
dera
lO
ther
Inco
me
Tota
l
Nor
thea
st$1
3,57
9,10
3 ||||
||||||
|||$1
,614
,588
|$8
,938
,308
||||||
||$7
57,4
09$1
,900
,495
|$2
6,78
9,90
3
Nor
th Io
wa
Are
a9,
650,
246 |
||||||
||1,
040,
892|
9,69
2,97
2||||
|||||
402,
745
2,03
0,37
3||
22,8
17,2
28
Iow
a La
kes
9,33
4,27
9 ||||
|||||
871,
238
8,90
9,83
8||||
||||
454,
741
2,33
1,42
1||
21,9
01,5
17
Nor
thw
est
4,59
4,81
6 ||||
521,
020
4,38
2,52
5||||
213,
884
755,
189
10,4
67,4
34
Iow
a Ce
ntra
l17
,475
,618
||||||
||||||
|||||
1,13
4,54
2|9,
842,
430|
||||||
||64
7,35
61,
109,
491|
30,2
09,4
37
Iow
a Va
lley
10,5
17,9
33|||
||||||
|71
3,15
28,
526,
524|
||||||
|22
5,04
11,
570,
149|
21,5
52,7
99
Haw
keye
15,0
85,7
82|||
||||||
||||||
1,39
5,06
3|12
,633
,964
||||||
||||||
799,
040
1,01
7,09
8|30
,930
,947
East
ern
Iow
a17
,904
,976
||||||
||||||
|||||
2,17
8,01
0||
15,7
24,3
71|||
||||||
||||||
1,29
3,13
6|2,
723,
686|
|39
,824
,179
Kirk
woo
d39
,944
,538
||||||
||||||
||||||
||||||
||||||
||||||
|||3,
319,
244|
||27
,248
,025
||||||
||||||
||||||
||||||
|||2,
327,
244|
|5,
515,
266|
||||
78,3
54,3
17
Des
Moi
nes
Are
a42
,650
,967
||||||
||||||
||||||
||||||
||||||
||||||
||||||
5,90
5,00
8||||
|27
,187
,979
||||||
||||||
||||||
||||||
|||1,
665,
640|
8,88
1,61
2||||
||||
86,2
91,2
06
Wes
tern
Iow
a Te
ch12
,273
,803
||||||
||||||
1,17
5,23
4|10
,364
,709
||||||
||||
1,00
4,24
9|1,
937,
201|
26,7
55,1
96
Iow
a W
este
rn16
,633
,660
||||||
||||||
||||
1,34
3,30
1|10
,525
,503
||||||
||||
511,
100
1,33
1,99
9|30
,345
,563
Sout
hwes
tern
4,34
1,78
9 ||||
459,
557
4,43
7,79
3||||
247,
663
686,
859
10,1
73,6
61
Indi
an H
ills
14,0
64,1
48|||
||||||
|||||
861,
267
13,9
35,3
95|||
||||||
||||
892,
829
1,93
2,70
5|31
,686
,344
Sout
heas
tern
9,22
2,05
3 ||||
|||||
613,
840
7,96
6,14
3||||
|||49
5,57
375
9,28
419
,056
,893
Tota
l$2
37,2
73,7
11$2
3,14
5,95
6$1
80,3
16,4
79$1
1,93
7,65
0$3
4,48
2,82
8$4
87,1
56,6
24N
ote:
Fig
ures
rou
nded
to th
e ne
ares
t who
le d
olla
r. E
ach
“|”
deno
tes
$1,0
00,0
00. S
ourc
e: Io
wa
Dep
artm
ent o
f Edu
catio
n, D
ivis
ion
of C
omm
unity
Col
lege
s an
d W
orkf
orce
Pre
para
tion,
A
S-1
5E.
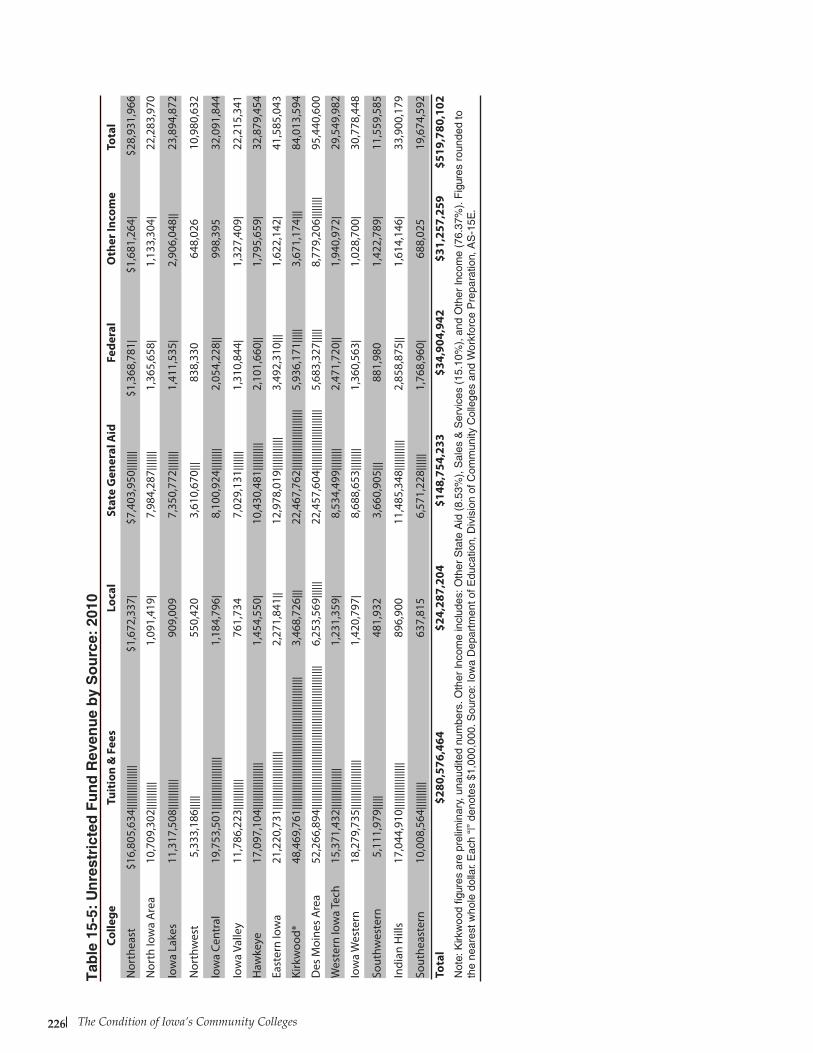
The Condition of Iowa’s Community Colleges226
Tab
le 1
5-5:
Un
rest
rict
ed F
un
d R
even
ue
by
So
urc
e: 2
010
Colle
geTu
itio
n &
Fee
sLo
cal
Stat
e G
ener
al A
idFe
dera
lO
ther
Inco
me
Tota
l
Nor
thea
st$1
6,80
5,63
4||||
||||||
||||||
$1,6
72,3
37|
$7,4
03,9
50|||
||||
$1,3
68,7
81|
$1,6
81,2
64|
$28,
931,
966
Nor
th Io
wa
Are
a10
,709
,302
||||||
||||
1,09
1,41
9|7,
984,
287|
||||||
1,36
5,65
8|1,
133,
304|
22,2
83,9
70
Iow
a La
kes
11,3
17,5
08|||
||||||
||90
9,00
97,
350,
772|
||||||
1,41
1,53
5|2,
906,
048|
|23
,894
,872
Nor
thw
est
5,33
3,18
6 ||||
|55
0,42
03,
610,
670|
||83
8,33
064
8,02
610
,980
,632
Iow
a Ce
ntra
l19
,753
,501
||||||
||||||
||||||
|1,
184,
796|
8,10
0,92
4||||
||||
2,05
4,22
8||
998,
395
32,0
91,8
44
Iow
a Va
lley
11,7
86,2
23|||
||||||
||76
1,73
47,
029,
131|
||||||
1,31
0,84
4|1,
327,
409|
22,2
15,3
41
Haw
keye
17,0
97,1
04|||
||||||
||||||
||1,
454,
550|
10,4
30,4
81|||
||||||
|2,
101,
660|
|1,
795,
659|
32,8
79,4
54
East
ern
Iow
a21
,220
,731
||||||
||||||
||||||
|||2,
271,
841|
|12
,978
,019
||||||
||||||
3,49
2,31
0|||
1,62
2,14
2|41
,585
,043
Kirk
woo
d*48
,469
,761
||||||
||||||
||||||
||||||
||||||
||||||
||||||
||||||
3,46
8,72
6|||
22,4
67,7
62|||
||||||
||||||
||||||
|5,
936,
171|
||||
3,67
1,17
4|||
84,0
13,5
94
Des
Moi
nes
Are
a52
,266
,894
||||||
||||||
||||||
||||||
||||||
||||||
||||||
||||||
||||
6,25
3,56
9||||
||22
,457
,604
||||||
||||||
||||||
||||
5,68
3,32
7||||
|8,
779,
206|
||||||
|95
,440
,600
Wes
tern
Iow
a Te
ch15
,371
,432
||||||
||||||
|||1,
231,
359|
8,53
4,49
9||||
||||
2,47
1,72
0||
1,94
0,97
2|29
,549
,982
Iow
a W
este
rn18
,279
,735
||||||
||||||
||||||
1,42
0,79
7|8,
688,
653|
||||||
|1,
360,
563|
1,02
8,70
0|30
,778
,448
Sout
hwes
tern
5,11
1,97
9 ||||
|48
1,93
23,
660,
905|
||88
1,98
01,
422,
789|
11,5
59,5
85
Indi
an H
ills
17,0
44,9
10|||
||||||
||||||
||89
6,90
011
,485
,348
||||||
|||||
2,85
8,87
5||
1,61
4,14
6|33
,900
,179
Sout
heas
tern
10,0
08,5
64|||
||||||
|63
7,81
56,
571,
228|
|||||
1,76
8,96
0|68
8,02
519
,674
,592
Tota
l$2
80,5
76,4
64$2
4,28
7,20
4$1
48,7
54,2
33$3
4,90
4,94
2$3
1,25
7,25
9$5
19,7
80,1
02N
ote:
Kirk
woo
d fig
ures
are
pre
limin
ary,
una
udite
d nu
mbe
rs. O
ther
Inco
me
incl
udes
: Oth
er S
tate
Aid
(8.
53%
), S
ales
& S
ervi
ces
(15.
10%
), a
nd O
ther
Inco
me
(76.
37%
). F
igur
es r
ound
ed to
th
e ne
ares
t who
le d
olla
r. E
ach
“|”
deno
tes
$1,0
00,0
00. S
ourc
e: Io
wa
Dep
artm
ent o
f Edu
catio
n, D
ivis
ion
of C
omm
unity
Col
lege
s an
d W
orkf
orce
Pre
para
tion,
AS
-15E
.
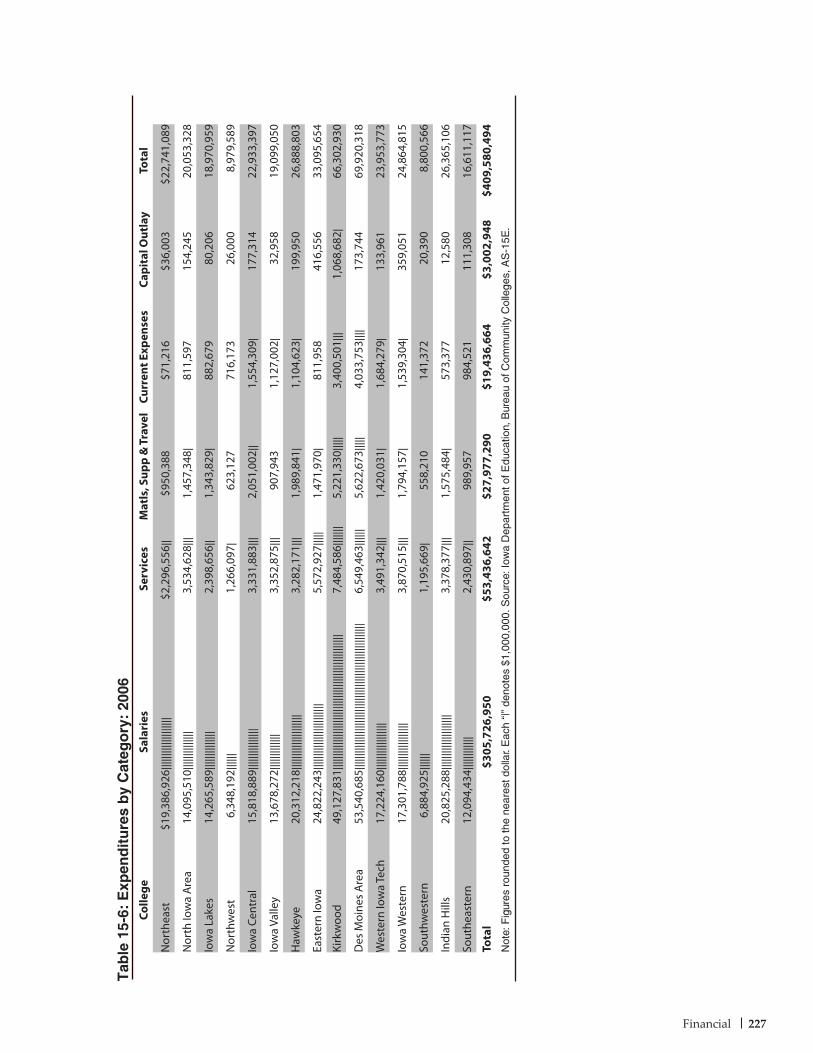
Financial 227
Tab
le 1
5-6:
Exp
end
itu
res
by
Cat
ego
ry:
2006
Colle
geSa
lari
esSe
rvic
esM
atls
, Sup
p &
Tra
vel
Curr
ent E
xpen
ses
Capi
tal O
utla
yTo
tal
Nor
thea
st$1
9,38
6,92
6 ||||
||||||
||||||
|||$2
,296
,556
||$9
50,3
88$7
1,21
6$3
6,00
3$2
2,74
1,08
9
Nor
th Io
wa
Are
a14
,095
,510
||||||
||||||
||3,
534,
628|
||1,
457,
348|
811,
597
154,
245
20,0
53,3
28
Iow
a La
kes
14,2
65,5
89|||
||||||
|||||
2,39
8,65
6||
1,34
3,82
9|88
2,67
980
,206
18,9
70,9
59
Nor
thw
est
6,34
8,19
2 ||||
||1,
266,
097|
623,
127
716,
173
26,0
008,
979,
589
Iow
a Ce
ntra
l15
,818
,889
||||||
||||||
|||3,
331,
883|
||2,
051,
002|
|1,
554,
309|
177,
314
22,9
33,3
97
Iow
a Va
lley
13,6
78,2
72|||
||||||
||||
3,35
2,87
5|||
907,
943
1,12
7,00
2|32
,958
19,0
99,0
50
Haw
keye
20,3
12,2
18|||
||||||
||||||
|||||
3,28
2,17
1|||
1,98
9,84
1|1,
104,
623|
199,
950
26,8
88,8
03
East
ern
Iow
a24
,822
,243
||||||
||||||
||||||
||||||
5,57
2,92
7||||
|1,
471,
970|
811,
958
416,
556
33,0
95,6
54
Kirk
woo
d49
,127
,831
||||||
||||||
||||||
||||||
||||||
||||||
||||||
||||||
|7,
484,
586|
||||||
5,22
1,33
0||||
|3,
400,
501|
||1,
068,
682|
66,3
02,9
30
Des
Moi
nes
Are
a53
,540
,685
||||||
||||||
||||||
||||||
||||||
||||||
||||||
||||||
|||||
6,54
9,46
3||||
||5,
622,
673|
||||
4,03
3,75
3||||
173,
744
69,9
20,3
18
Wes
tern
Iow
a Te
ch17
,224
,160
||||||
||||||
|||||
3,49
1,34
2|||
1,42
0,03
1|1,
684,
279|
133,
961
23,9
53,7
73
Iow
a W
este
rn17
,301
,788
||||||
||||||
|||||
3,87
0,51
5|||
1,79
4,15
7|1,
539,
304|
359,
051
24,8
64,8
15
Sout
hwes
tern
6,88
4,92
5 ||||
||1,
195,
669|
558,
210
141,
372
20,3
908,
800,
566
Indi
an H
ills
20,8
25,2
88|||
||||||
||||||
|||||
3,37
8,37
7|||
1,57
5,48
4|57
3,37
712
,580
26,3
65,1
06
Sout
heas
tern
12,0
94,4
34|||
||||||
|||2,
430,
897|
|98
9,95
798
4,52
111
1,30
816
,611
,117
Tota
l$3
05,7
26,9
50$5
3,43
6,64
2$2
7,97
7,29
0$1
9,43
6,66
4$3
,002
,948
$409
,580
,494
Not
e: F
igur
es r
ound
ed to
the
near
est d
olla
r. E
ach
“|”
deno
tes
$1,0
00,0
00. S
ourc
e: Io
wa
Dep
artm
ent o
f Edu
catio
n, B
urea
u of
Com
mun
ity C
olle
ges,
AS
-15E
.
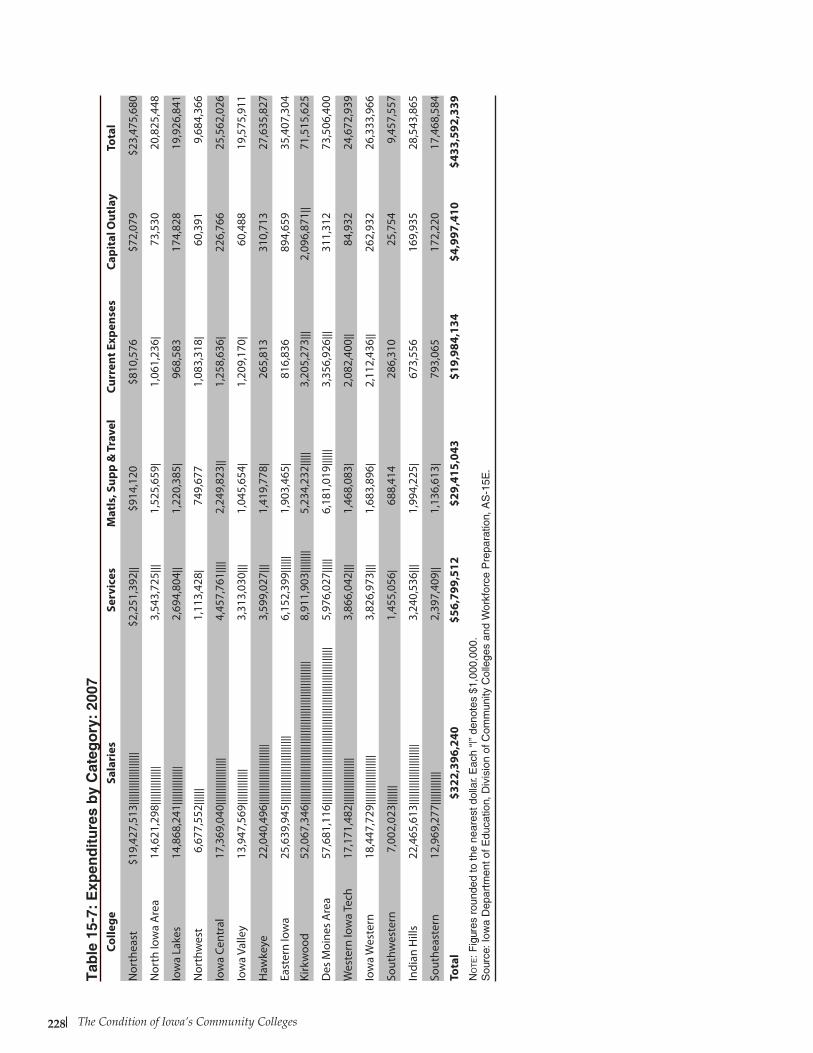
The Condition of Iowa’s Community Colleges228
Colle
geSa
lari
esSe
rvic
esM
atls
, Sup
p &
Tra
vel
Curr
ent E
xpen
ses
Capi
tal O
utla
yTo
tal
Nor
thea
st$1
9,42
7,51
3 ||||
||||||
||||||
|||$2
,251
,392
||$9
14,1
20$8
10,5
76$7
2,07
9$2
3,47
5,68
0
Nor
th Io
wa
Are
a14
,621
,298
||||||
||||||
||3,
543,
725|
||1,
525,
659|
1,06
1,23
6|73
,530
20,8
25,4
48
Iow
a La
kes
14,8
68,2
41|||
||||||
|||||
2,69
4,80
4||
1,22
0,38
5|96
8,58
317
4,82
819
,926
,841
Nor
thw
est
6,67
7,55
2 ||||
||1,
113,
428|
749,
677
1,08
3,31
8|60
,391
9,68
4,36
6
Iow
a Ce
ntra
l17
,369
,040
||||||
||||||
|||||
4,45
7,76
1||||
2,24
9,82
3||
1,25
8,63
6|22
6,76
625
,562
,026
Iow
a Va
lley
13,9
47,5
69|||
||||||
||||
3,31
3,03
0|||
1,04
5,65
4|1,
209,
170|
60,4
8819
,575
,911
Haw
keye
22,0
40,4
96|||
||||||
||||||
||||||
|3,
599,
027|
||1,
419,
778|
265,
813
310,
713
27,6
35,8
27
East
ern
Iow
a25
,639
,945
||||||
||||||
||||||
||||||
|6,
152,
399|
|||||
1,90
3,46
5|81
6,83
689
4,65
935
,407
,304
Kirk
woo
d52
,067
,346
||||||
||||||
||||||
||||||
||||||
||||||
||||||
||||||
||||
8,91
1,90
3||||
||||
5,23
4,23
2||||
|3,
205,
273|
||2,
096,
871|
|71
,515
,625
Des
Moi
nes
Are
a57
,681
,116
||||||
||||||
||||||
||||||
||||||
||||||
||||||
||||||
||||||
|||5,
976,
027|
||||
6,18
1,01
9||||
||3,
356,
926|
||31
1,31
273
,506
,400
Wes
tern
Iow
a Te
ch17
,171
,482
||||||
||||||
|||||
3,86
6,04
2|||
1,46
8,08
3|2,
082,
400|
|84
,932
24,6
72,9
39
Iow
a W
este
rn18
,447
,729
||||||
||||||
||||||
3,82
6,97
3|||
1,68
3,89
6|2,
112,
436|
|26
2,93
226
,333
,966
Sout
hwes
tern
7,00
2,02
3||||
|||1,
455,
056|
688,
414
286,
310
25,7
549,
457,
557
Indi
an H
ills
22,4
65,6
13|||
||||||
||||||
||||||
|3,
240,
536|
||1,
994,
225|
673,
556
169,
935
28,5
43,8
65
Sout
heas
tern
12,9
69,2
77|||
||||||
|||2,
397,
409|
|1,
136,
613|
793,
065
172,
220
17,4
68,5
84
Tota
l$3
22,3
96,2
40$5
6,79
9,51
2$2
9,41
5,04
3$1
9,98
4,13
4$4
,997
,410
$433
,592
,339
No
te: F
igur
es r
ound
ed to
the
near
est d
olla
r. E
ach
“|”
deno
tes
$1,0
00,0
00.
Sou
rce:
Iow
a D
epar
tmen
t of E
duca
tion,
Div
isio
n of
Com
mun
ity C
olle
ges
and
Wor
kfor
ce P
repa
ratio
n, A
S-1
5E.
Tab
le 1
5-7:
Exp
end
itu
res
by
Cat
ego
ry:
2007
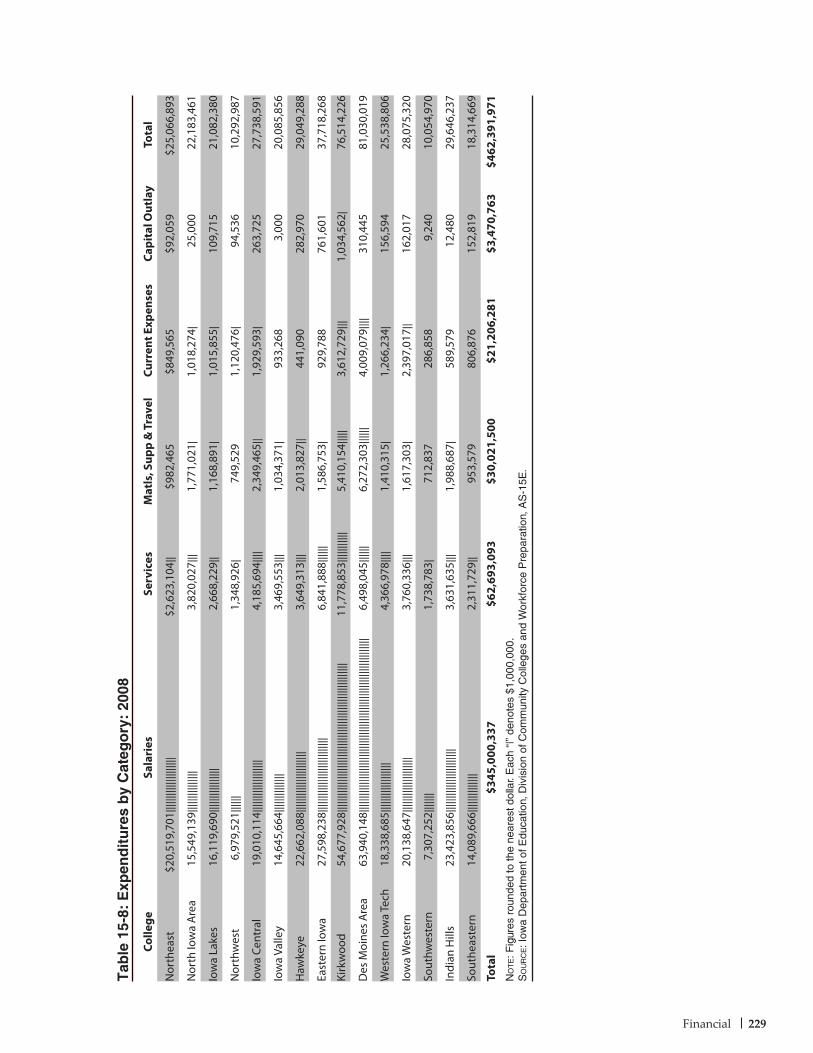
Financial 229
Tab
le 1
5-8:
Exp
end
itu
res
by
Cat
ego
ry:
2008
Colle
geSa
lari
esSe
rvic
esM
atls
, Sup
p &
Tra
vel
Curr
ent E
xpen
ses
Capi
tal O
utla
yTo
tal
Nor
thea
st$2
0,51
9,70
1 ||||
||||||
||||||
||||
$2,6
23,1
04||
$982
,465
$849
,565
$92,
059
$25,
066,
893
Nor
th Io
wa
Are
a15
,549
,139
||||||
||||||
|||3,
820,
027|
||1,
771,
021|
1,01
8,27
4|25
,000
22,1
83,4
61
Iow
a La
kes
16,1
19,6
90|||
||||||
||||||
|2,
668,
229|
|1,
168,
891|
1,01
5,85
5|10
9,71
521
,082
,380
Nor
thw
est
6,97
9,52
1 ||||
||1,
348,
926|
749,
529
1,12
0,47
6|94
,536
10,2
92,9
87
Iow
a Ce
ntra
l19
,010
,114
||||||
||||||
||||||
|4,
185,
694|
|||2,
349,
465|
|1,
929,
593|
263,
725
27,7
38,5
91
Iow
a Va
lley
14,6
45,6
64|||
||||||
|||||
3,46
9,55
3|||
1,03
4,37
1|93
3,26
83,
000
20,0
85,8
56
Haw
keye
22,6
62,0
88|||
||||||
||||||
||||||
|3,
649,
313|
||2,
013,
827|
|44
1,09
028
2,97
029
,049
,288
East
ern
Iow
a27
,598
,238
||||||
||||||
||||||
||||||
|||6,
841,
888|
|||||
1,58
6,75
3|92
9,78
876
1,60
137
,718
,268
Kirk
woo
d54
,677
,928
||||||
||||||
||||||
||||||
||||||
||||||
||||||
||||||
||||||
11,7
78,8
53|||
||||||
||5,
410,
154|
||||
3,61
2,72
9|||
1,03
4,56
2|76
,514
,226
Des
Moi
nes
Are
a63
,940
,148
||||||
||||||
||||||
||||||
||||||
||||||
||||||
||||||
||||||
||||||
|||6,
498,
045|
|||||
6,27
2,30
3||||
||4,
009,
079|
|||31
0,44
581
,030
,019
Wes
tern
Iow
a Te
ch18
,338
,685
||||||
||||||
||||||
4,36
6,97
8||||
1,41
0,31
5|1,
266,
234|
156,
594
25,5
38,8
06
Iow
a W
este
rn20
,138
,647
||||||
||||||
||||||
||3,
760,
336|
||1,
617,
303|
2,39
7,01
7||
162,
017
28,0
75,3
20
Sout
hwes
tern
7,30
7,25
2||||
|||1,
738,
783|
712,
837
286,
858
9,24
010
,054
,970
Indi
an H
ills
23,4
23,8
56|||
||||||
||||||
||||||
||3,
631,
635|
||1,
988,
687|
589,
579
12,4
8029
,646
,237
Sout
heas
tern
14,0
89,6
66|||
||||||
|||||
2,31
1,72
9||
953,
579
806,
876
152,
819
18,3
14,6
69
Tota
l$3
45,0
00,3
37$6
2,69
3,09
3$3
0,02
1,50
0$2
1,20
6,28
1$3
,470
,763
$462
,391
,971
No
te: F
igur
es r
ound
ed to
the
near
est d
olla
r. E
ach
“|”
deno
tes
$1,0
00,0
00.
So
ur
ce: I
owa
Dep
artm
ent o
f Edu
catio
n, D
ivis
ion
of C
omm
unity
Col
lege
s an
d W
orkf
orce
Pre
para
tion,
AS
-15E
.
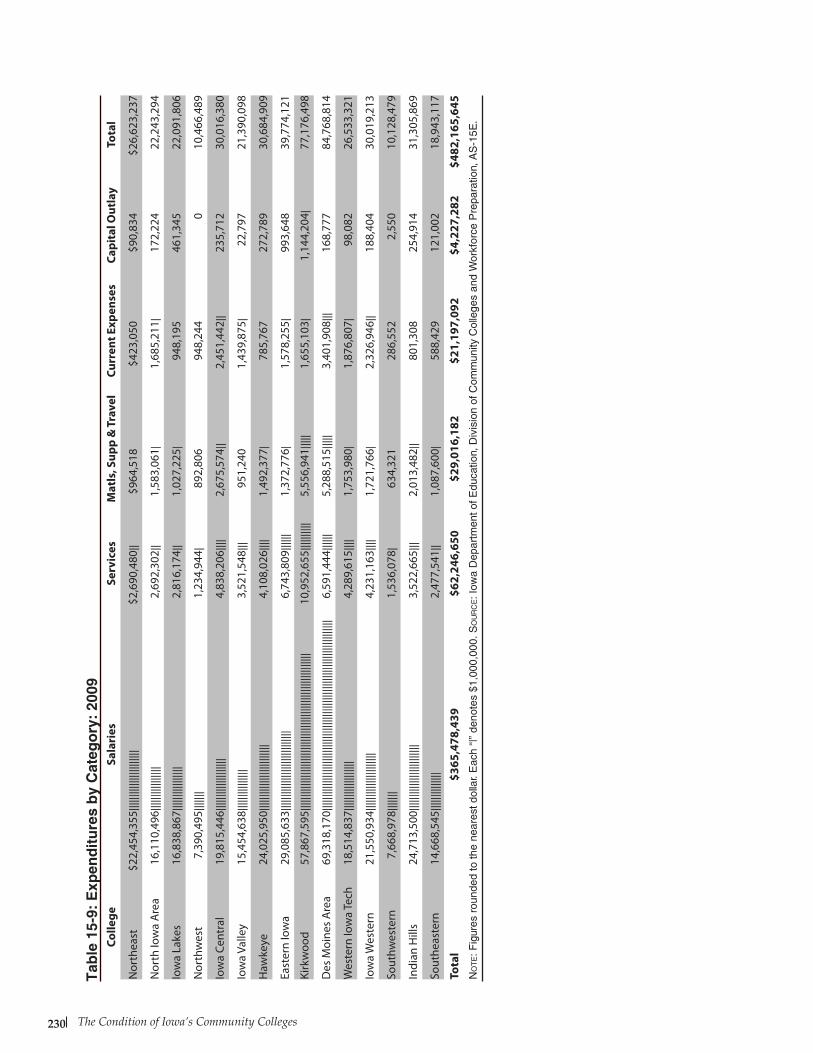
The Condition of Iowa’s Community Colleges230
Colle
geSa
lari
esSe
rvic
esM
atls
, Sup
p &
Tra
vel
Curr
ent E
xpen
ses
Capi
tal O
utla
yTo
tal
Nor
thea
st$2
2,45
4,35
5 ||||
||||||
||||||
||||||
$2,6
90,4
80||
$964
,518
$423
,050
$90,
834
$26,
623,
237
Nor
th Io
wa
Are
a16
,110
,496
||||||
||||||
||||
2,69
2,30
2||
1,58
3,06
1|1,
685,
211|
172,
224
22,2
43,2
94
Iow
a La
kes
16,8
38,8
67|||
||||||
||||||
|2,
816,
174|
|1,
027,
225|
948,
195
461,
345
22,0
91,8
06
Nor
thw
est
7,39
0,49
5 ||||
|||1,
234,
944|
892,
806
948,
244
010
,466
,489
Iow
a Ce
ntra
l19
,815
,446
||||||
||||||
||||||
|4,
838,
206|
|||2,
675,
574|
|2,
451,
442|
|23
5,71
230
,016
,380
Iow
a Va
lley
15,4
54,6
38|||
||||||
||||||
3,52
1,54
8|||
951,
240
1,43
9,87
5|22
,797
21,3
90,0
98
Haw
keye
24,0
25,9
50|||
||||||
||||||
||||||
|||4,
108,
026|
|||1,
492,
377|
785,
767
272,
789
30,6
84,9
09
East
ern
Iow
a29
,085
,633
||||||
||||||
||||||
||||||
|||||
6,74
3,80
9||||
||1,
372,
776|
1,57
8,25
5|99
3,64
839
,774
,121
Kirk
woo
d57
,867
,595
||||||
||||||
||||||
||||||
||||||
||||||
||||||
||||||
||||||
|||10
,952
,655
||||||
||||
5,55
6,94
1||||
|1,
655,
103|
1,14
4,20
4|77
,176
,498
Des
Moi
nes
Are
a69
,318
,170
||||||
||||||
||||||
||||||
||||||
||||||
||||||
||||||
||||||
||||||
||||||
|||6,
591,
444|
|||||
5,28
8,51
5||||
|3,
401,
908|
||16
8,77
784
,768
,814
Wes
tern
Iow
a Te
ch18
,514
,837
||||||
||||||
||||||
4,28
9,61
5||||
1,75
3,98
0|1,
876,
807|
98,0
8226
,533
,321
Iow
a W
este
rn21
,550
,934
||||||
||||||
||||||
|||4,
231,
163|
|||1,
721,
766|
2,32
6,94
6||
188,
404
30,0
19,2
13
Sout
hwes
tern
7,66
8,97
8||||
|||1,
536,
078|
634,
321
286,
552
2,55
010
,128
,479
Indi
an H
ills
24,7
13,5
00|||
||||||
||||||
||||||
|||3,
522,
665|
||2,
013,
482|
|80
1,30
825
4,91
431
,305
,869
Sout
heas
tern
14,6
68,5
45|||
||||||
|||||
2,47
7,54
1||
1,08
7,60
0|58
8,42
912
1,00
218
,943
,117
Tota
l$3
65,4
78,4
39$6
2,24
6,65
0$2
9,01
6,18
2$2
1,19
7,09
2$4
,227
,282
$482
,165
,645
No
te: F
igur
es r
ound
ed to
the
near
est d
olla
r. E
ach
“|”
deno
tes
$1,0
00,0
00. S
ou
rc
e: I
owa
Dep
artm
ent o
f Edu
catio
n, D
ivis
ion
of C
omm
unity
Col
lege
s an
d W
orkf
orce
Pre
para
tion,
AS
-15E
.
Tab
le 1
5-9:
Exp
end
itu
res
by
Cat
ego
ry:
2009
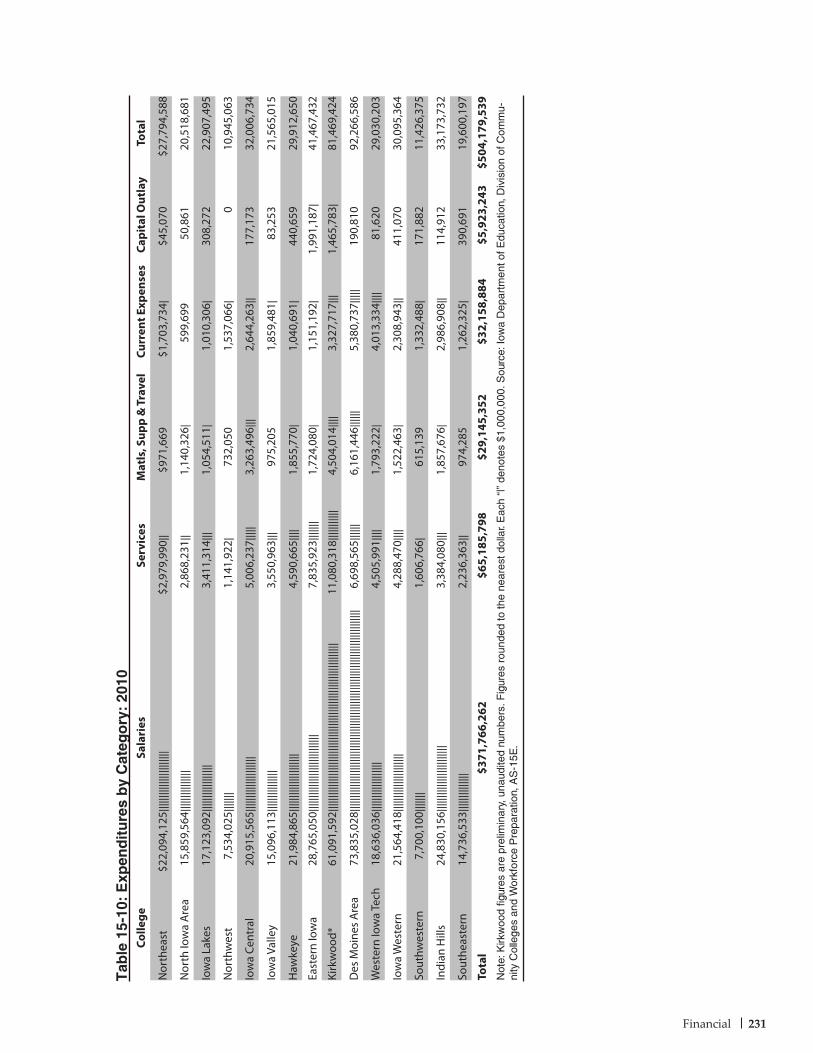
Financial 231
Tab
le 1
5-10
: E
xpen
dit
ure
s b
y C
ateg
ory
: 20
10Co
llege
Sala
ries
Serv
ices
Mat
ls, S
upp
& T
rave
lCu
rren
t Exp
ense
sCa
pita
l Out
lay
Tota
l
Nor
thea
st$2
2,09
4,12
5 ||||
||||||
||||||
||||||
$2,9
79,9
90||
$971
,669
$1,7
03,7
34|
$45,
070
$27,
794,
588
Nor
th Io
wa
Are
a15
,859
,564
||||||
||||||
|||2,
868,
231|
|1,
140,
326|
599,
699
50,8
6120
,518
,681
Iow
a La
kes
17,1
23,0
92|||
||||||
||||||
||3,
411,
314|
||1,
054,
511|
1,01
0,30
6|30
8,27
222
,907
,495
Nor
thw
est
7,53
4,02
5 ||||
|||1,
141,
922|
732,
050
1,53
7,06
6|0
10,9
45,0
63
Iow
a Ce
ntra
l20
,915
,565
||||||
||||||
||||||
||5,
006,
237|
||||
3,26
3,49
6|||
2,64
4,26
3||
177,
173
32,0
06,7
34
Iow
a Va
lley
15,0
96,1
13|||
||||||
||||||
3,55
0,96
3|||
975,
205
1,85
9,48
1|83
,253
21,5
65,0
15
Haw
keye
21,9
84,8
65|||
||||||
||||||
||||||
4,59
0,66
5||||
1,85
5,77
0|1,
040,
691|
440,
659
29,9
12,6
50
East
ern
Iow
a28
,765
,050
||||||
||||||
||||||
||||||
||||
7,83
5,92
3||||
|||1,
724,
080|
1,15
1,19
2|1,
991,
187|
41,4
67,4
32
Kirk
woo
d*61
,091
,592
||||||
||||||
||||||
||||||
||||||
||||||
||||||
||||||
||||||
||||||
|11
,080
,318
||||||
|||||
4,50
4,01
4||||
3,32
7,71
7|||
1,46
5,78
3|81
,469
,424
Des
Moi
nes
Are
a73
,835
,028
||||||
||||||
||||||
||||||
||||||
||||||
||||||
||||||
||||||
||||||
||||||
||||||
|6,
698,
565|
|||||
6,16
1,44
6||||
||5,
380,
737|
||||
190,
810
92,2
66,5
86
Wes
tern
Iow
a Te
ch18
,636
,036
||||||
||||||
||||||
4,50
5,99
1||||
1,79
3,22
2|4,
013,
334|
|||81
,620
29,0
30,2
03
Iow
a W
este
rn21
,564
,418
||||||
||||||
||||||
|||4,
288,
470|
|||1,
522,
463|
2,30
8,94
3||
411,
070
30,0
95,3
64
Sout
hwes
tern
7,70
0,10
0 ||||
|||1,
606,
766|
615,
139
1,33
2,48
8|17
1,88
211
,426
,375
Indi
an H
ills
24,8
30,1
56|||
||||||
||||||
||||||
|||3,
384,
080|
||1,
857,
676|
2,98
6,90
8||
114,
912
33,1
73,7
32
Sout
heas
tern
14,7
36,5
33|||
||||||
|||||
2,23
6,36
3||
974,
285
1,26
2,32
5|39
0,69
119
,600
,197
Tota
l$3
71,7
66,2
62$6
5,18
5,79
8$2
9,14
5,35
2$3
2,15
8,88
4$5
,923
,243
$504
,179
,539
Not
e: K
irkw
ood
figur
es a
re p
relim
inar
y, u
naud
ited
num
bers
. Fig
ures
rou
nded
to th
e ne
ares
t dol
lar.
Eac
h “|
” de
note
s $1
,000
,000
. Sou
rce:
Iow
a D
epar
tmen
t of E
duca
tion,
Div
isio
n of
Com
mu-
nity
Col
lege
s an
d W
orkf
orce
Pre
para
tion,
AS
-15E
.
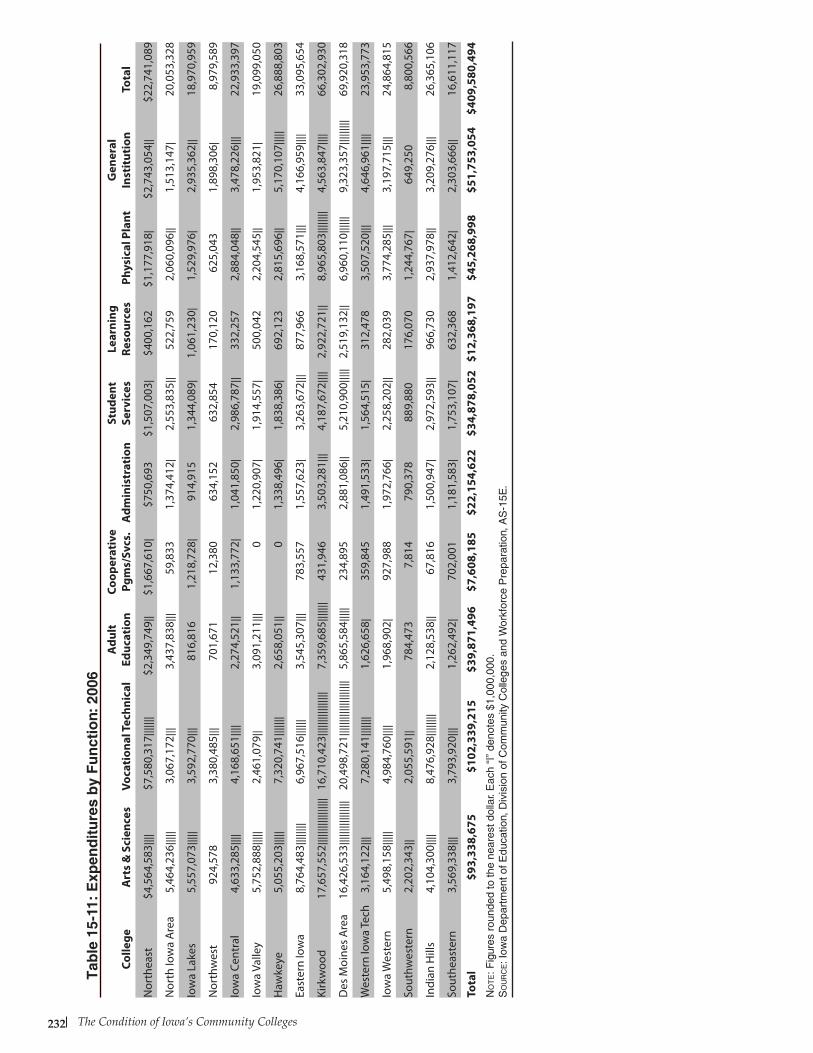
The Condition of Iowa’s Community Colleges232
Colle
geA
rts
& S
cien
ces
Voca
tion
al T
echn
ical
Adu
lt
Educ
atio
nCo
oper
ativ
e Pg
ms/
Svcs
.A
dmin
istr
atio
nSt
uden
t Se
rvic
esLe
arni
ng
Reso
urce
sPh
ysic
al P
lant
Gen
eral
In
stit
utio
nTo
tal
Nor
thea
st$4
,564
,583
||||
$7,5
80,3
17|||
||||
$2,3
49,7
49||
$1,6
67,6
10|
$750
,693
$1,5
07,0
03|
$400
,162
$1,1
77,9
18|
$2,7
43,0
54||
$22,
741,
089
Nor
th Io
wa
Are
a5,
464,
236 |
||||
3,06
7,17
2|||
3,43
7,83
8|||
59,8
331,
374,
412|
2,55
3,83
5||
522,
759
2,06
0,09
6||
1,51
3,14
7|20
,053
,328
Iow
a La
kes
5,55
7,07
3 ||||
|3,
592,
770|
||81
6,81
61,
218,
728|
914,
915
1,34
4,08
9|1,
061,
230|
1,52
9,97
6|2,
935,
362|
|18
,970
,959
Nor
thw
est
924,
578
3,38
0,48
5 |||
701,
671
12,3
8063
4,15
263
2,85
417
0,12
062
5,04
31,
898,
306|
8,97
9,58
9
Iow
a Ce
ntra
l4,
633,
285 |
|||4,
168,
651|
|||2,
274,
521|
|1,
133,
772|
1,04
1,85
0|2,
986,
787|
|33
2,25
72,
884,
048|
|3,
478,
226|
||22
,933
,397
Iow
a Va
lley
5,75
2,88
8 ||||
|2,
461,
079|
|3,
091,
211|
||0
1,22
0,90
7|1,
914,
557|
500,
042
2,20
4,54
5||
1,95
3,82
1|19
,099
,050
Haw
keye
5,05
5,20
3 ||||
|7,
320,
741|
||||||
2,65
8,05
1||
01,
338,
496|
1,83
8,38
6|69
2,12
32,
815,
696|
|5,
170,
107|
||||
26,8
88,8
03
East
ern
Iow
a8,
764,
483 |
||||||
|6,
967,
516|
|||||
3,54
5,30
7|||
783,
557
1,55
7,62
3|3,
263,
672|
||87
7,96
63,
168,
571|
||4,
166,
959|
|||33
,095
,654
Kirk
woo
d17
,657
,552
||||||
||||||
|||||
16,7
10,4
23|||
||||||
||||||
|7,
359,
685|
||||||
431,
946
3,50
3,28
1|||
4,18
7,67
2||||
2,92
2,72
1||
8,96
5,80
3||||
||||
4,56
3,84
7||||
66,3
02,9
30
Des
Moi
nes
Are
a16
,426
,533
||||||
||||||
||||
20,4
98,7
21|||
||||||
||||||
|||||
5,86
5,58
4||||
|23
4,89
52,
881,
086|
|5,
210,
900|
||||
2,51
9,13
2||
6,96
0,11
0||||
||9,
323,
357|
||||||
||69
,920
,318
Wes
tern
Iow
a Te
ch3,
164,
122 |
||7,
280,
141|
||||||
1,62
6,65
8|35
9,84
51,
491,
533|
1,56
4,51
5|31
2,47
83,
507,
520|
||4,
646,
961|
|||23
,953
,773
Iow
a W
este
rn5,
498,
158 |
||||
4,98
4,76
0||||
1,96
8,90
2|92
7,98
81,
972,
766|
2,25
8,20
2||
282,
039
3,77
4,28
5|||
3,19
7,71
5|||
24,8
64,8
15
Sout
hwes
tern
2,20
2,34
3 ||
2,05
5,59
1||
784,
473
7,81
479
0,37
888
9,88
017
6,07
01,
244,
767|
649,
250
8,80
0,56
6
Indi
an H
ills
4,10
4,30
0 ||||
8,47
6,92
8||||
||||
2,12
8,53
8||
67,8
161,
500,
947|
2,97
2,59
3||
966,
730
2,93
7,97
8||
3,20
9,27
6|||
26,3
65,1
06
Sout
heas
tern
3,56
9,33
8 |||
3,79
3,92
0|||
1,26
2,49
2|70
2,00
11,
181,
583|
1,75
3,10
7|63
2,36
81,
412,
642|
2,30
3,66
6||
16,6
11,1
17
Tota
l$9
3,33
8,67
5$1
02,3
39,2
15$3
9,87
1,49
6$7
,608
,185
$22,
154,
622
$34,
878,
052
$12,
368,
197
$45,
268,
998
$51,
753,
054
$409
,580
,494
No
te: F
igur
es r
ound
ed to
the
near
est d
olla
r. E
ach
“|”
deno
tes
$1,0
00,0
00.
So
ur
ce: I
owa
Dep
artm
ent o
f Edu
catio
n, D
ivis
ion
of C
omm
unity
Col
lege
s an
d W
orkf
orce
Pre
para
tion,
AS
-15E
.
Tab
le 1
5-11
: E
xpen
dit
ure
s b
y F
un
ctio
n: 2
006
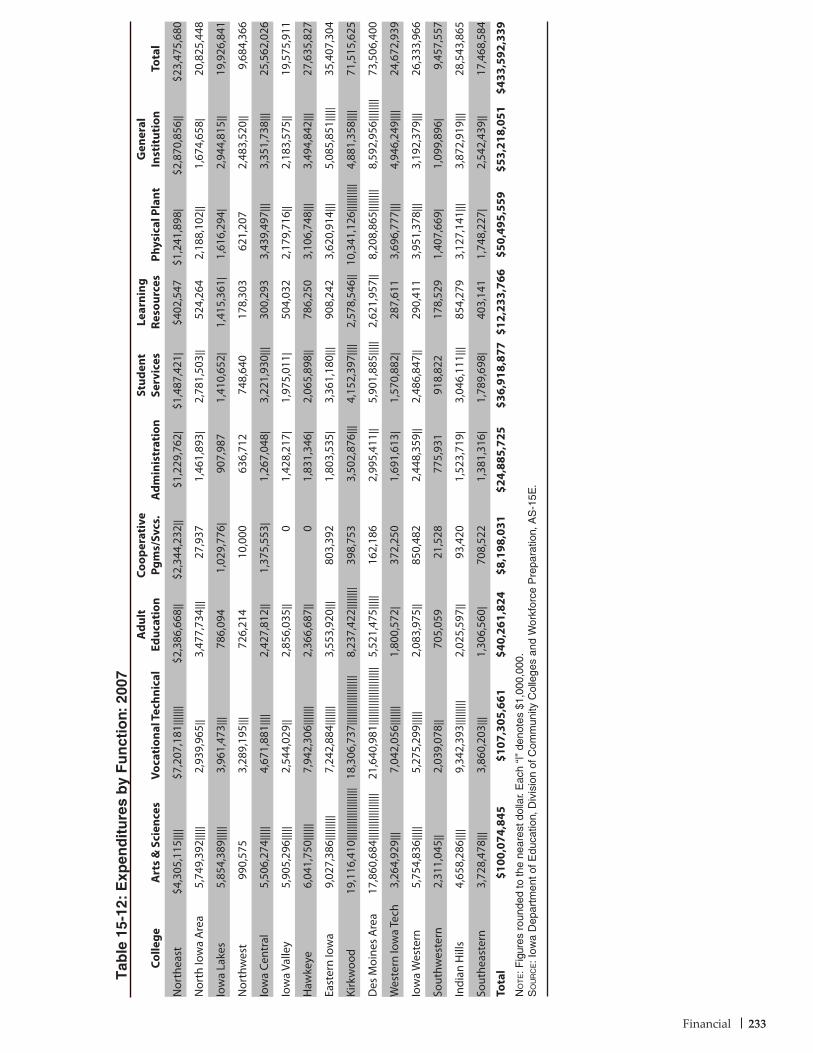
Financial 233
Tab
le 1
5-12
: E
xpen
dit
ure
s b
y F
un
ctio
n: 2
007
Colle
geA
rts
& S
cien
ces
Voca
tion
al T
echn
ical
Adu
lt
Educ
atio
nCo
oper
ativ
e Pg
ms/
Svcs
.A
dmin
istr
atio
nSt
uden
t Se
rvic
esLe
arni
ng
Reso
urce
sPh
ysic
al P
lant
Gen
eral
In
stit
utio
nTo
tal
Nor
thea
st$4
,305
,115
||||
$7,2
07,1
81|||
||||
$2,3
86,6
68||
$2,3
44,2
32||
$1,2
29,7
62|
$1,4
87,4
21|
$402
,547
$1,2
41,8
98|
$2,8
70,8
56||
$23,
475,
680
Nor
th Io
wa
Are
a5,
749,
392 |
||||
2,93
9,96
5||
3,47
7,73
4|||
27,9
371,
461,
893|
2,78
1,50
3||
524,
264
2,18
8,10
2||
1,67
4,65
8|20
,825
,448
Iow
a La
kes
5,85
4,38
9 ||||
|3,
961,
473|
||78
6,09
41,
029,
776|
907,
987
1,41
0,65
2|1,
415,
361|
1,61
6,29
4|2,
944,
815|
|19
,926
,841
Nor
thw
est
990,
575
3,28
9,19
5 |||
726,
214
10,0
0063
6,71
274
8,64
017
8,30
362
1,20
72,
483,
520|
|9,
684,
366
Iow
a Ce
ntra
l5,
506,
274 |
||||
4,67
1,88
1||||
2,42
7,81
2||
1,37
5,55
3|1,
267,
048|
3,22
1,93
0|||
300,
293
3,43
9,49
7|||
3,35
1,73
8|||
25,5
62,0
26
Iow
a Va
lley
5,90
5,29
6 ||||
|2,
544,
029|
|2,
856,
035|
|0
1,42
8,21
7|1,
975,
011|
504,
032
2,17
9,71
6||
2,18
3,57
5||
19,5
75,9
11
Haw
keye
6,04
1,75
0 ||||
||7,
942,
306|
||||||
2,36
6,68
7||
01,
831,
346|
2,06
5,89
8||
786,
250
3,10
6,74
8|||
3,49
4,84
2|||
27,6
35,8
27
East
ern
Iow
a9,
027,
386 |
||||||
||7,
242,
884|
||||||
3,55
3,92
0|||
803,
392
1,80
3,53
5|3,
361,
180|
||90
8,24
23,
620,
914|
||5,
085,
851|
||||
35,4
07,3
04
Kirk
woo
d19
,116
,410
||||||
||||||
||||||
|18
,306
,737
||||||
||||||
||||||
8,23
7,42
2||||
||||
398,
753
3,50
2,87
6|||
4,15
2,39
7||||
2,57
8,54
6||
10,3
41,1
26|||
||||||
|4,
881,
358|
|||71
,515
,625
Des
Moi
nes
Are
a17
,860
,684
||||||
||||||
|||||
21,6
40,9
81|||
||||||
||||||
||||||
5,52
1,47
5||||
|16
2,18
62,
995,
411|
|5,
901,
885|
||||
2,62
1,95
7||
8,20
8,86
5||||
||||
8,59
2,95
6||||
||||
73,5
06,4
00
Wes
tern
Iow
a Te
ch3,
264,
929 |
||7,
042,
056|
||||||
1,80
0,57
2|37
2,25
01,
691,
613|
1,57
0,88
2|28
7,61
13,
696,
777|
||4,
946,
249|
|||24
,672
,939
Iow
a W
este
rn5,
754,
836 |
||||
5,27
5,29
9||||
|2,
083,
975|
|85
0,48
22,
448,
359|
|2,
486,
847|
|29
0,41
13,
951,
378|
||3,
192,
379|
||26
,333
,966
Sout
hwes
tern
2,31
1,04
5 ||
2,03
9,07
8||
705,
059
21,5
2877
5,93
191
8,82
217
8,52
91,
407,
669|
1,09
9,89
6|9,
457,
557
Indi
an H
ills
4,65
8,28
6 ||||
9,34
2,39
3||||
|||||
2,02
5,59
7||
93,4
201,
523,
719|
3,04
6,11
1|||
854,
279
3,12
7,14
1|||
3,87
2,91
9|||
28,5
43,8
65
Sout
heas
tern
3,72
8,47
8|||
3,86
0,20
3|||
1,30
6,56
0|70
8,52
21,
381,
316|
1,78
9,69
8|40
3,14
11,
748,
227|
2,54
2,43
9||
17,4
68,5
84
Tota
l$1
00,0
74,8
45$1
07,3
05,6
61$4
0,26
1,82
4$8
,198
,031
$24,
885,
725
$36,
918,
877
$12,
233,
766
$50,
495,
559
$53,
218,
051
$433
,592
,339
No
te: F
igur
es r
ound
ed to
the
near
est d
olla
r. E
ach
“|”
deno
tes
$1,0
00,0
00.
So
ur
ce: I
owa
Dep
artm
ent o
f Edu
catio
n, D
ivis
ion
of C
omm
unity
Col
lege
s an
d W
orkf
orce
Pre
para
tion,
AS
-15E
.
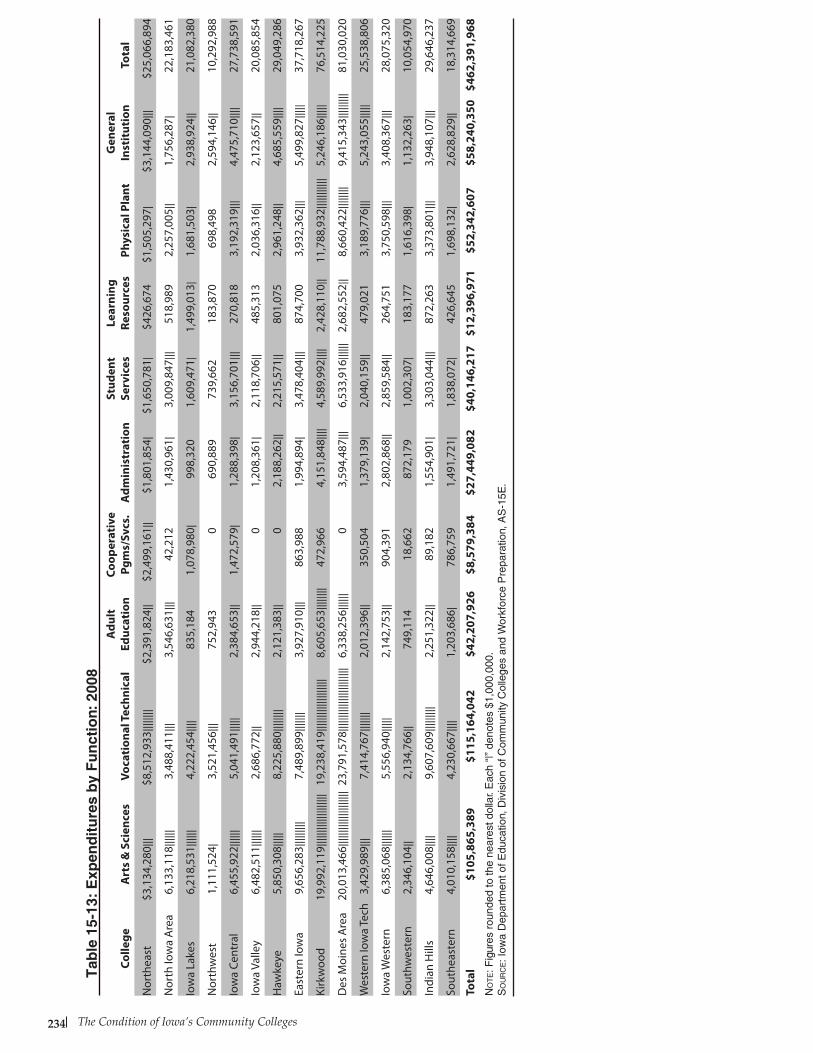
The Condition of Iowa’s Community Colleges234
Colle
geA
rts
& S
cien
ces
Voca
tion
al T
echn
ical
Adu
lt
Educ
atio
nCo
oper
ativ
e Pg
ms/
Svcs
.A
dmin
istr
atio
nSt
uden
t Se
rvic
esLe
arni
ng
Reso
urce
sPh
ysic
al P
lant
Gen
eral
In
stit
utio
nTo
tal
Nor
thea
st$3
,134
,280
|||$8
,512
,933
||||||
||$2
,391
,824
||$2
,499
,161
||$1
,801
,854
|$1
,650
,781
|$4
26,6
74$1
,505
,297
|$3
,144
,090
|||$2
5,06
6,89
4
Nor
th Io
wa
Are
a6,
133,
118 |
|||||
3,48
8,41
1|||
3,54
6,63
1|||
42,2
121,
430,
961|
3,00
9,84
7|||
518,
989
2,25
7,00
5||
1,75
6,28
7|22
,183
,461
Iow
a La
kes
6,21
8,53
1 ||||
||4,
222,
454|
|||83
5,18
41,
078,
980|
998,
320
1,60
9,47
1|1,
499,
013|
1,68
1,50
3|2,
938,
924|
|21
,082
,380
Nor
thw
est
1,11
1,52
4 |3,
521,
456|
||75
2,94
30
690,
889
739,
662
183,
870
698,
498
2,59
4,14
6||
10,2
92,9
88
Iow
a Ce
ntra
l6,
455,
922 |
|||||
5,04
1,49
1||||
|2,
384,
653|
|1,
472,
579|
1,28
8,39
8|3,
156,
701|
||27
0,81
83,
192,
319|
||4,
475,
710|
|||27
,738
,591
Iow
a Va
lley
6,48
2,51
1 ||||
||2,
686,
772|
|2,
944,
218|
|0
1,20
8,36
1|2,
118,
706|
|48
5,31
32,
036,
316|
|2,
123,
657|
|20
,085
,854
Haw
keye
5,85
0,30
8 ||||
|8,
225,
880|
||||||
|2,
121,
383|
|0
2,18
8,26
2||
2,21
5,57
1||
801,
075
2,96
1,24
8||
4,68
5,55
9||||
29,0
49,2
86
East
ern
Iow
a9,
656,
283 |
||||||
||7,
489,
899|
||||||
3,92
7,91
0|||
863,
988
1,99
4,89
4|3,
478,
404|
||87
4,70
03,
932,
362|
||5,
499,
827|
||||
37,7
18,2
67
Kirk
woo
d19
,992
,119
||||||
||||||
||||||
|19
,238
,419
||||||
||||||
||||||
|8,
605,
653|
||||||
|47
2,96
64,
151,
848|
|||4,
589,
992|
|||2,
428,
110|
|11
,788
,932
||||||
|||||
5,24
6,18
6||||
|76
,514
,225
Des
Moi
nes
Are
a20
,013
,466
||||||
||||||
||||||
||23
,791
,578
||||||
||||||
||||||
|||||
6,33
8,25
6||||
||0
3,59
4,48
7|||
6,53
3,91
6||||
||2,
682,
552|
|8,
660,
422|
||||||
|9,
415,
343|
||||||
||81
,030
,020
Wes
tern
Iow
a Te
ch3,
429,
989 |
||7,
414,
767|
||||||
2,01
2,39
6||
350,
504
1,37
9,13
9|2,
040,
159|
|47
9,02
13,
189,
776|
||5,
243,
055|
||||
25,5
38,8
06
Iow
a W
este
rn6,
385,
068 |
|||||
5,55
6,94
0||||
|2,
142,
753|
|90
4,39
12,
802,
868|
|2,
859,
584|
|26
4,75
13,
750,
598|
||3,
408,
367|
||28
,075
,320
Sout
hwes
tern
2,34
6,10
4 ||
2,13
4,76
6||
749,
114
18,6
6287
2,17
91,
002,
307|
183,
177
1,61
6,39
8|1,
132,
263|
10,0
54,9
70
Indi
an H
ills
4,64
6,00
8 ||||
9,60
7,60
9||||
|||||
2,25
1,32
2||
89,1
821,
554,
901|
3,30
3,04
4|||
872,
263
3,37
3,80
1|||
3,94
8,10
7|||
29,6
46,2
37
Sout
heas
tern
4,01
0,15
8 ||||
4,23
0,66
7||||
1,20
3,68
6|78
6,75
91,
491,
721|
1,83
8,07
2|42
6,64
51,
698,
132|
2,62
8,82
9||
18,3
14,6
69
Tota
l$1
05,8
65,3
89$1
15,1
64,0
42$4
2,20
7,92
6$8
,579
,384
$27,
449,
082
$40,
146,
217
$12,
396,
971
$52,
342,
607
$58,
240,
350
$462
,391
,968
No
te: F
igur
es r
ound
ed to
the
near
est d
olla
r. E
ach
“|”
deno
tes
$1,0
00,0
00.
So
ur
ce: I
owa
Dep
artm
ent o
f Edu
catio
n, D
ivis
ion
of C
omm
unity
Col
lege
s an
d W
orkf
orce
Pre
para
tion,
AS
-15E
.
Tab
le 1
5-13
: E
xpen
dit
ure
s b
y F
un
ctio
n: 2
008
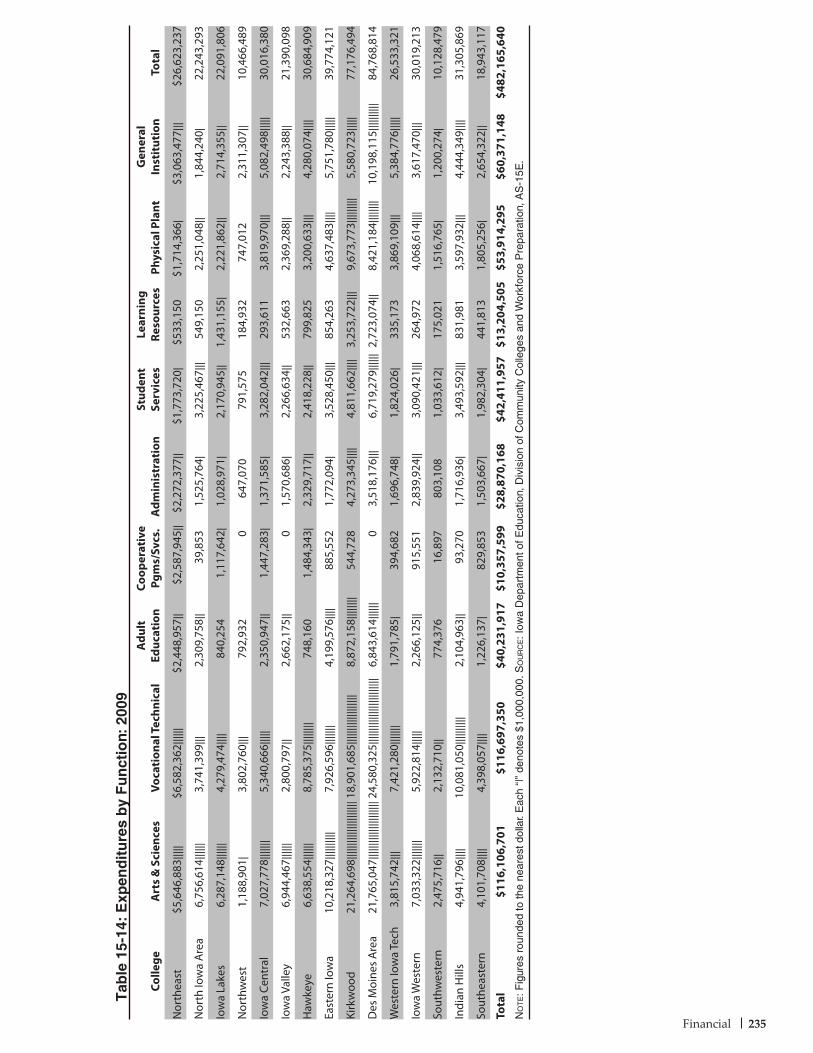
Financial 235
Tab
le 1
5-14
: E
xpen
dit
ure
s b
y F
un
ctio
n: 2
009
Colle
geA
rts
& S
cien
ces
Voca
tion
al T
echn
ical
Adu
lt
Educ
atio
nCo
oper
ativ
e Pg
ms/
Svcs
.A
dmin
istr
atio
nSt
uden
t Se
rvic
esLe
arni
ng
Reso
urce
sPh
ysic
al P
lant
Gen
eral
In
stit
utio
nTo
tal
Nor
thea
st$5
,646
,883
|||||
$6,5
82,3
62|||
|||$2
,448
,957
||$2
,587
,945
||$2
,272
,377
||$1
,773
,720
|$5
33,1
50$1
,714
,366
|$3
,063
,477
|||$2
6,62
3,23
7
Nor
th Io
wa
Are
a6,
756,
614 |
|||||
3,74
1,39
9|||
2,30
9,75
8||
39,8
531,
525,
764|
3,22
5,46
7|||
549,
150
2,25
1,04
8||
1,84
4,24
0|22
,243
,293
Iow
a La
kes
6,28
7,14
8 ||||
||4,
279,
474|
|||84
0,25
41,
117,
642|
1,02
8,97
1|2,
170,
945|
|1,
431,
155|
2,22
1,86
2||
2,71
4,35
5||
22,0
91,8
06
Nor
thw
est
1,18
8,90
1 |3,
802,
760|
||79
2,93
20
647,
070
791,
575
184,
932
747,
012
2,31
1,30
7||
10,4
66,4
89
Iow
a Ce
ntra
l7,
027,
778 |
||||||
5,34
0,66
6||||
|2,
350,
947|
|1,
447,
283|
1,37
1,58
5|3,
282,
042|
||29
3,61
13,
819,
970|
||5,
082,
498|
||||
30,0
16,3
80
Iow
a Va
lley
6,94
4,46
7 ||||
||2,
800,
797|
|2,
662,
175|
|0
1,57
0,68
6|2,
266,
634|
|53
2,66
32,
369,
288|
|2,
243,
388|
|21
,390
,098
Haw
keye
6,63
8,55
4 ||||
||8,
785,
375|
||||||
|74
8,16
01,
484,
343|
2,32
9,71
7||
2,41
8,22
8||
799,
825
3,20
0,63
3|||
4,28
0,07
4||||
30,6
84,9
09
East
ern
Iow
a10
,218
,327
||||||
||||
7,92
6,59
6||||
|||4,
199,
576|
|||88
5,55
21,
772,
094|
3,52
8,45
0|||
854,
263
4,63
7,48
3||||
5,75
1,78
0||||
|39
,774
,121
Kirk
woo
d21
,264
,698
||||||
||||||
||||||
|||18
,901
,685
||||||
||||||
||||||
8,87
2,15
8||||
||||
544,
728
4,27
3,34
5||||
4,81
1,66
2||||
3,25
3,72
2|||
9,67
3,77
3||||
|||||
5,58
0,72
3||||
|77
,176
,494
Des
Moi
nes
Are
a21
,765
,047
||||||
||||||
||||||
|||24
,580
,325
||||||
||||||
||||||
||||||
6,84
3,61
4||||
||0
3,51
8,17
6|||
6,71
9,27
9||||
||2,
723,
074|
|8,
421,
184|
||||||
|10
,198
,115
||||||
||||
84,7
68,8
14
Wes
tern
Iow
a Te
ch3,
815,
742 |
||7,
421,
280|
||||||
1,79
1,78
5|39
4,68
21,
696,
748|
1,82
4,02
6|33
5,17
33,
869,
109|
||5,
384,
776|
||||
26,5
33,3
21
Iow
a W
este
rn7,
033,
322 |
||||||
5,92
2,81
4||||
|2,
266,
125|
|91
5,55
12,
839,
924|
|3,
090,
421|
||26
4,97
24,
068,
614|
|||3,
617,
470|
||30
,019
,213
Sout
hwes
tern
2,47
5,71
6 ||
2,13
2,71
0||
774,
376
16,8
9780
3,10
81,
033,
612|
175,
021
1,51
6,76
5|1,
200,
274|
10,1
28,4
79
Indi
an H
ills
4,94
1,79
6 ||||
10,0
81,0
50|||
||||||
|2,
104,
963|
|93
,270
1,71
6,93
6|3,
493,
592|
||83
1,98
13,
597,
932|
||4,
444,
349|
|||31
,305
,869
Sout
heas
tern
4,10
1,70
8 ||||
4,39
8,05
7||||
1,22
6,13
7|82
9,85
31,
503,
667|
1,98
2,30
4|44
1,81
31,
805,
256|
2,65
4,32
2||
18,9
43,1
17
Tota
l$1
16,1
06,7
01$1
16,6
97,3
50$4
0,23
1,91
7$1
0,35
7,59
9$2
8,87
0,16
8$4
2,41
1,95
7$1
3,20
4,50
5$5
3,91
4,29
5$6
0,37
1,14
8$4
82,1
65,6
40N
ot
e: F
igur
es r
ound
ed to
the
near
est d
olla
r. E
ach
“|”
deno
tes
$1,0
00,0
00. S
ou
rc
e: I
owa
Dep
artm
ent o
f Edu
catio
n, D
ivis
ion
of C
omm
unity
Col
lege
s an
d W
orkf
orce
Pre
para
tion,
AS
-15E
.
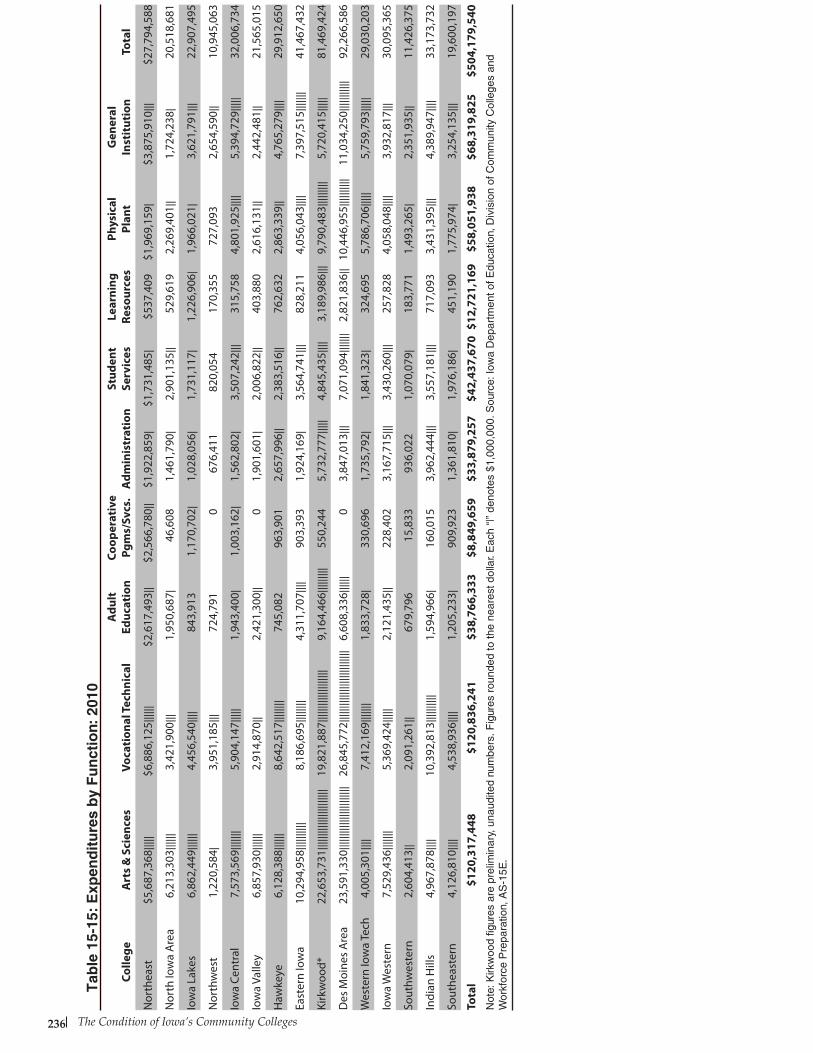
The Condition of Iowa’s Community Colleges236
Tab
le 1
5-15
: E
xpen
dit
ure
s b
y F
un
ctio
n: 2
010
Colle
geA
rts
& S
cien
ces
Voca
tion
al T
echn
ical
Adu
lt
Educ
atio
nCo
oper
ativ
e Pg
ms/
Svcs
.A
dmin
istr
atio
nSt
uden
t Se
rvic
esLe
arni
ng
Reso
urce
sPh
ysic
al
Plan
tG
ener
al
Inst
itut
ion
Tota
l
Nor
thea
st$5
,687
,368
|||||
$6,8
86,1
25|||
|||$2
,617
,493
||$2
,566
,780
||$1
,922
,859
|$1
,731
,485
|$5
37,4
09$1
,969
,159
|$3
,875
,910
|||$2
7,79
4,58
8
Nor
th Io
wa
Are
a6,
213,
303 |
|||||
3,42
1,90
0|||
1,95
0,68
7|46
,608
1,46
1,79
0|2,
901,
135|
|52
9,61
92,
269,
401|
|1,
724,
238|
20,5
18,6
81
Iow
a La
kes
6,86
2,44
9 ||||
||4,
456,
540|
|||84
3,91
31,
170,
702|
1,02
8,05
6|1,
731,
117|
1,22
6,90
6|1,
966,
021|
3,62
1,79
1|||
22,9
07,4
95
Nor
thw
est
1,22
0,58
4 |3,
951,
185|
||72
4,79
10
676,
411
820,
054
170,
355
727,
093
2,65
4,59
0||
10,9
45,0
63
Iow
a Ce
ntra
l7,
573,
569 |
||||||
5,90
4,14
7||||
|1,
943,
400|
1,00
3,16
2|1,
562,
802|
3,50
7,24
2|||
315,
758
4,80
1,92
5||||
5,39
4,72
9||||
|32
,006
,734
Iow
a Va
lley
6,85
7,93
0 ||||
||2,
914,
870|
|2,
421,
300|
|0
1,90
1,60
1|2,
006,
822|
|40
3,88
02,
616,
131|
|2,
442,
481|
|21
,565
,015
Haw
keye
6,12
8,38
8 ||||
||8,
642,
517|
||||||
|74
5,08
296
3,90
12,
657,
996|
|2,
383,
516|
|76
2,63
22,
863,
339|
|4,
765,
279|
|||29
,912
,650
East
ern
Iow
a10
,294
,958
||||||
||||
8,18
6,69
5||||
||||
4,31
1,70
7||||
903,
393
1,92
4,16
9|3,
564,
741|
||82
8,21
14,
056,
043|
|||7,
397,
515|
||||||
41,4
67,4
32
Kirk
woo
d*22
,653
,731
||||||
||||||
||||||
||||
19,8
21,8
87|||
||||||
||||||
||||
9,16
4,46
6||||
|||||
550,
244
5,73
2,77
7||||
|4,
845,
435|
|||3,
189,
986|
||9,
790,
483|
||||||
||5,
720,
415|
||||
81,4
69,4
24
Des
Moi
nes
Are
a23
,591
,330
||||||
||||||
||||||
|||||
26,8
45,7
72|||
||||||
||||||
||||||
|||||
6,60
8,33
6||||
||0
3,84
7,01
3|||
7,07
1,09
4||||
|||2,
821,
836|
|10
,446
,955
||||||
||||
11,0
34,2
50|||
||||||
||92
,266
,586
Wes
tern
Iow
a Te
ch4,
005,
301 |
|||7,
412,
169|
||||||
1,83
3,72
8|33
0,69
61,
735,
792|
1,84
1,32
3|32
4,69
55,
786,
706|
||||
5,75
9,79
3||||
|29
,030
,203
Iow
a W
este
rn7,
529,
436 |
||||||
5,36
9,42
4||||
|2,
121,
435|
|22
8,40
23,
167,
715|
||3,
430,
260|
||25
7,82
84,
058,
048|
|||3,
932,
817|
||30
,095
,365
Sout
hwes
tern
2,60
4,41
3 ||
2,09
1,26
1||
679,
796
15,8
3393
6,02
21,
070,
079|
183,
771
1,49
3,26
5|2,
351,
935|
|11
,426
,375
Indi
an H
ills
4,96
7,87
8 ||||
10,3
92,8
13|||
||||||
|1,
594,
966|
160,
015
3,96
2,44
4|||
3,55
7,18
1|||
717,
093
3,43
1,39
5|||
4,38
9,94
7||||
33,1
73,7
32
Sout
heas
tern
4,12
6,81
0 ||||
4,53
8,93
6||||
1,20
5,23
3|90
9,92
31,
361,
810|
1,97
6,18
6|45
1,19
01,
775,
974|
3,25
4,13
5|||
19,6
00,1
97
Tota
l$1
20,3
17,4
48$1
20,8
36,2
41$3
8,76
6,33
3$8
,849
,659
$33,
879,
257
$42,
437,
670
$12,
721,
169
$58,
051,
938
$68,
319,
825
$504
,179
,540
Not
e: K
irkw
ood
figur
es a
re p
relim
inar
y, u
naud
ited
num
bers
. Fig
ures
rou
nded
to th
e ne
ares
t dol
lar.
Eac
h “|
” de
note
s $1
,000
,000
. Sou
rce:
Iow
a D
epar
tmen
t of E
duca
tion,
Div
isio
n of
Com
mun
ity C
olle
ges
and
Wor
kfor
ce P
repa
ratio
n, A
S-1
5E.

Financial 237
Table 15-16: Full-Time Equivalent Enrollment (FTEE): 2006
College
Credit Non-Credit
Eligible Credit Hours FTEE
Eligible Credit Hours FTEE Total FTEE
Northeast 95,769 3,990.39 ||| 355,462 592.44 4,582.83 ||||
North Iowa Area 66,246 2,760.25 || 491,416 819.03 3,579.28 |||
Iowa Lakes 70,472 2,936.33 || 93,555 155.93 3,092.26 |||
Northwest 26,690 1,112.08 | 303,289 505.48 1,617.56 |
Iowa Central 103,484 4,311.83 |||| 429,297 715.49 5,027.32 |||||
Iowa Valley 61,685 2,570.21 || 395,311 658.85 3,229.06 |||
Hawkeye 120,959 5,039.96 ||||| 362,594 604.32 5,644.28 |||||
Eastern Iowa 160,349 6,681.19 |||||| 795,063 1,325.10 | 8,006.29 ||||||||
Kirkwood 332,694 13,862.25 ||||||||||||| 978,454 1,630.76 | 15,493.01 |||||||||||||||
Des Moines Area 325,384 13,557.67 ||||||||||||| 1,405,097 2,341.83 || 15,899.50 |||||||||||||||
Western Iowa Tech 102,455 4,268.96 |||| 368,555 614.26 4,883.22 ||||
Iowa Western 109,567 4,565.27 |||| 464,212 773.69 5,338.96 |||||
Southwestern 29,500 1,229.15 | 205,218 342.03 1,571.18 |
Indian Hills 100,558 4,189.92 |||| 361,174 601.96 4,791.88 ||||
Southeastern 75,217 3,134.04 ||| 213,857 356.43 3,490.47 |||
Total 1,781,027 74,209.50 7,222,551 12,037.60 86,247.10Note: Each “|” denotes 10,000 students.Source: Iowa Department of Education, Division of Community Colleges and Workforce Preparation, Community College MIS.
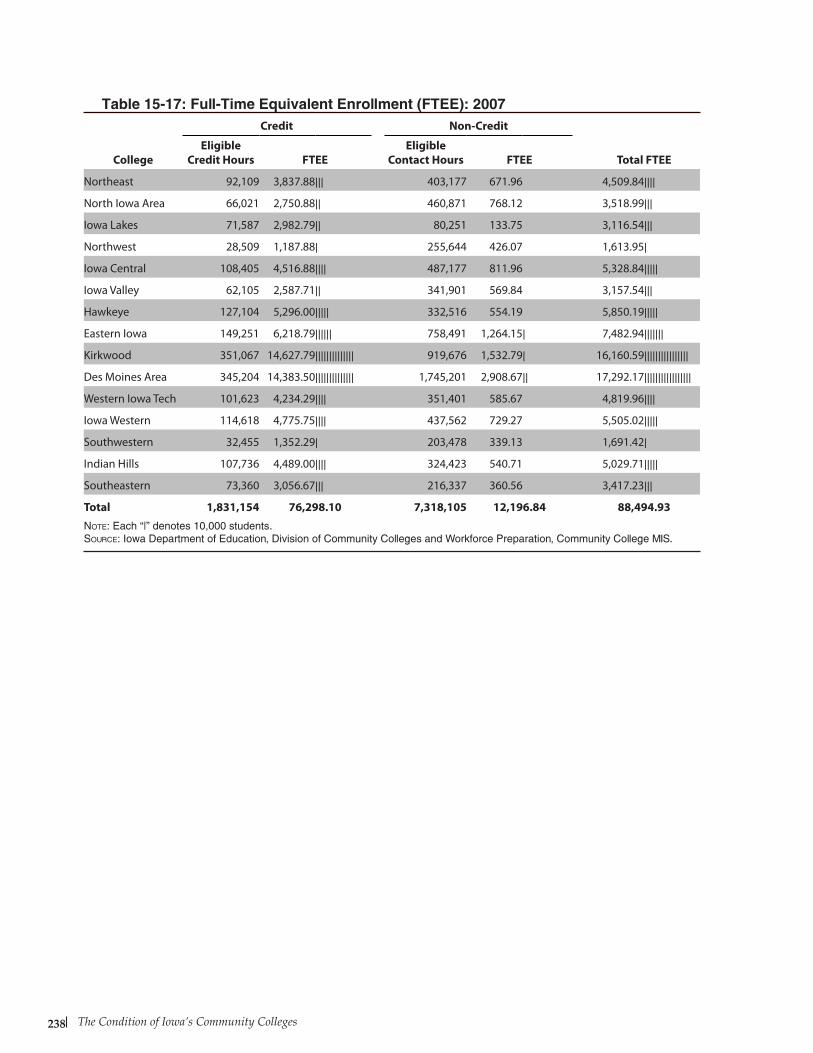
The Condition of Iowa’s Community Colleges238
College
Credit Non-Credit
Eligible Credit Hours FTEE
Eligible Contact Hours FTEE Total FTEE
Northeast 92,109 3,837.88 ||| 403,177 671.96 4,509.84 ||||
North Iowa Area 66,021 2,750.88 || 460,871 768.12 3,518.99 |||
Iowa Lakes 71,587 2,982.79 || 80,251 133.75 3,116.54 |||
Northwest 28,509 1,187.88 | 255,644 426.07 1,613.95 |
Iowa Central 108,405 4,516.88 |||| 487,177 811.96 5,328.84 |||||
Iowa Valley 62,105 2,587.71 || 341,901 569.84 3,157.54 |||
Hawkeye 127,104 5,296.00 ||||| 332,516 554.19 5,850.19 |||||
Eastern Iowa 149,251 6,218.79 |||||| 758,491 1,264.15 | 7,482.94 |||||||
Kirkwood 351,067 14,627.79 |||||||||||||| 919,676 1,532.79 | 16,160.59 ||||||||||||||||
Des Moines Area 345,204 14,383.50 |||||||||||||| 1,745,201 2,908.67 || 17,292.17 |||||||||||||||||
Western Iowa Tech 101,623 4,234.29 |||| 351,401 585.67 4,819.96 ||||
Iowa Western 114,618 4,775.75 |||| 437,562 729.27 5,505.02 |||||
Southwestern 32,455 1,352.29 | 203,478 339.13 1,691.42 |
Indian Hills 107,736 4,489.00 |||| 324,423 540.71 5,029.71 |||||
Southeastern 73,360 3,056.67 ||| 216,337 360.56 3,417.23 |||
Total 1,831,154 76,298.10 7,318,105 12,196.84 88,494.93Note: Each “|” denotes 10,000 students.Source: Iowa Department of Education, Division of Community Colleges and Workforce Preparation, Community College MIS.
Table 15-17: Full-Time Equivalent Enrollment (FTEE): 2007
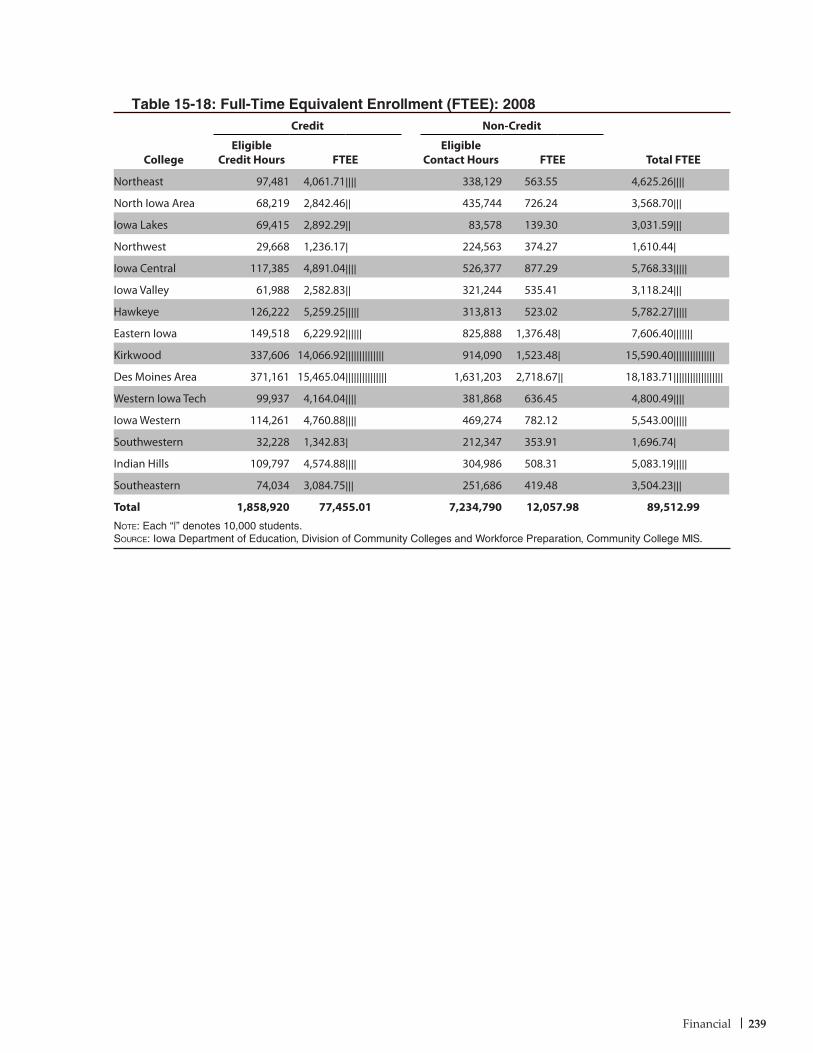
Financial 239
Table 15-18: Full-Time Equivalent Enrollment (FTEE): 2008
College
Credit Non-Credit
Eligible Credit Hours FTEE
Eligible Contact Hours FTEE Total FTEE
Northeast 97,481 4,061.71 |||| 338,129 563.55 4,625.26 ||||
North Iowa Area 68,219 2,842.46 || 435,744 726.24 3,568.70 |||
Iowa Lakes 69,415 2,892.29 || 83,578 139.30 3,031.59 |||
Northwest 29,668 1,236.17 | 224,563 374.27 1,610.44 |
Iowa Central 117,385 4,891.04 |||| 526,377 877.29 5,768.33 |||||
Iowa Valley 61,988 2,582.83 || 321,244 535.41 3,118.24 |||
Hawkeye 126,222 5,259.25 ||||| 313,813 523.02 5,782.27 |||||
Eastern Iowa 149,518 6,229.92 |||||| 825,888 1,376.48 | 7,606.40 |||||||
Kirkwood 337,606 14,066.92 |||||||||||||| 914,090 1,523.48 | 15,590.40 |||||||||||||||
Des Moines Area 371,161 15,465.04 ||||||||||||||| 1,631,203 2,718.67 || 18,183.71 ||||||||||||||||||
Western Iowa Tech 99,937 4,164.04 |||| 381,868 636.45 4,800.49 ||||
Iowa Western 114,261 4,760.88 |||| 469,274 782.12 5,543.00 |||||
Southwestern 32,228 1,342.83 | 212,347 353.91 1,696.74 |
Indian Hills 109,797 4,574.88 |||| 304,986 508.31 5,083.19 |||||
Southeastern 74,034 3,084.75 ||| 251,686 419.48 3,504.23 |||
Total 1,858,920 77,455.01 7,234,790 12,057.98 89,512.99Note: Each “|” denotes 10,000 students.Source: Iowa Department of Education, Division of Community Colleges and Workforce Preparation, Community College MIS.
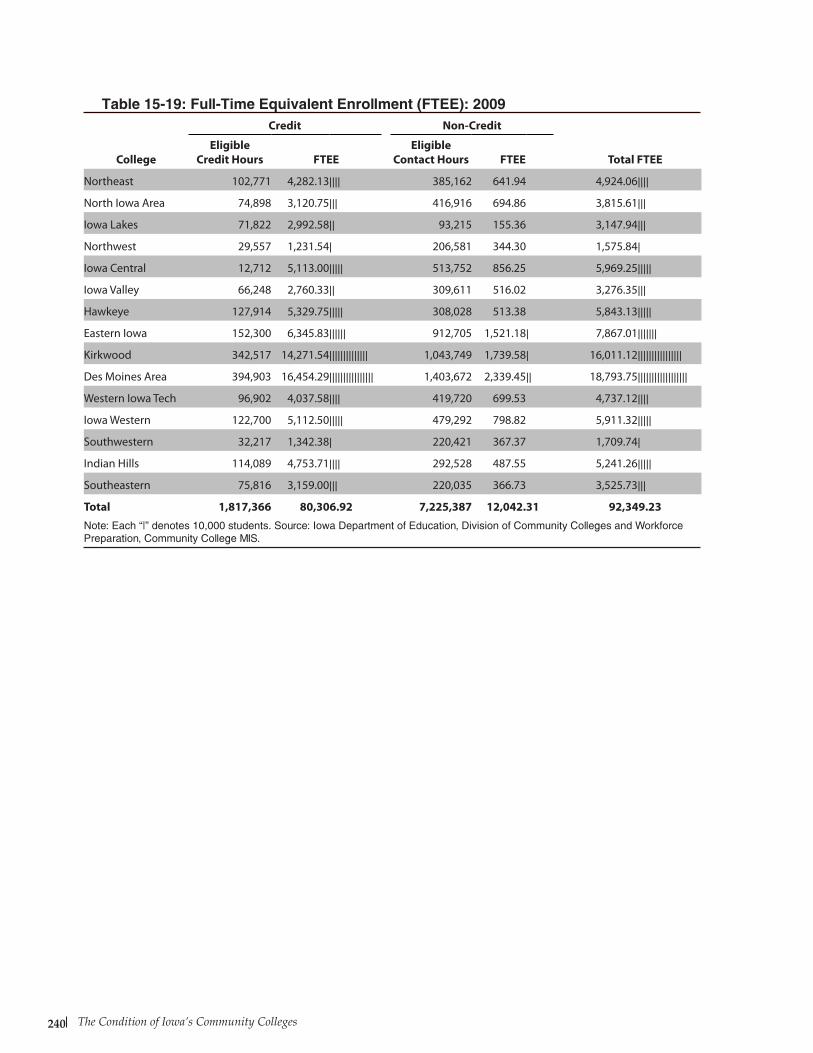
The Condition of Iowa’s Community Colleges240
College
Credit Non-Credit
Eligible Credit Hours FTEE
Eligible Contact Hours FTEE Total FTEE
Northeast 102,771 4,282.13 |||| 385,162 641.94 4,924.06 ||||
North Iowa Area 74,898 3,120.75 ||| 416,916 694.86 3,815.61 |||
Iowa Lakes 71,822 2,992.58 || 93,215 155.36 3,147.94 |||
Northwest 29,557 1,231.54 | 206,581 344.30 1,575.84 |
Iowa Central 12,712 5,113.00 ||||| 513,752 856.25 5,969.25 |||||
Iowa Valley 66,248 2,760.33 || 309,611 516.02 3,276.35 |||
Hawkeye 127,914 5,329.75 ||||| 308,028 513.38 5,843.13 |||||
Eastern Iowa 152,300 6,345.83 |||||| 912,705 1,521.18 | 7,867.01 |||||||
Kirkwood 342,517 14,271.54 |||||||||||||| 1,043,749 1,739.58 | 16,011.12 ||||||||||||||||
Des Moines Area 394,903 16,454.29 |||||||||||||||| 1,403,672 2,339.45 || 18,793.75 ||||||||||||||||||
Western Iowa Tech 96,902 4,037.58 |||| 419,720 699.53 4,737.12 ||||
Iowa Western 122,700 5,112.50 ||||| 479,292 798.82 5,911.32 |||||
Southwestern 32,217 1,342.38 | 220,421 367.37 1,709.74 |
Indian Hills 114,089 4,753.71 |||| 292,528 487.55 5,241.26 |||||
Southeastern 75,816 3,159.00 ||| 220,035 366.73 3,525.73 |||
Total 1,817,366 80,306.92 7,225,387 12,042.31 92,349.23Note: Each “|” denotes 10,000 students. Source: Iowa Department of Education, Division of Community Colleges and Workforce Preparation, Community College MIS.
Table 15-19: Full-Time Equivalent Enrollment (FTEE): 2009
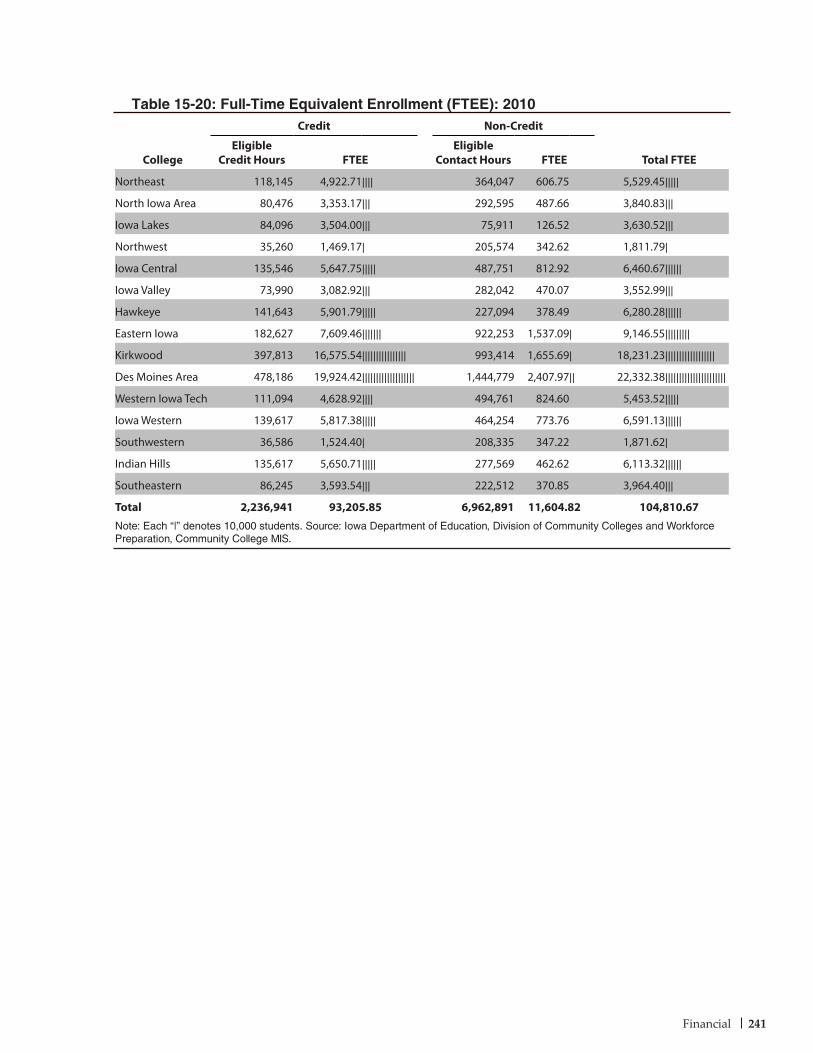
Financial 241
Table 15-20: Full-Time Equivalent Enrollment (FTEE): 2010
College
Credit Non-Credit
Eligible Credit Hours FTEE
Eligible Contact Hours FTEE Total FTEE
Northeast 118,145 4,922.71 |||| 364,047 606.75 5,529.45 |||||
North Iowa Area 80,476 3,353.17 ||| 292,595 487.66 3,840.83 |||
Iowa Lakes 84,096 3,504.00 ||| 75,911 126.52 3,630.52 |||
Northwest 35,260 1,469.17 | 205,574 342.62 1,811.79 |
Iowa Central 135,546 5,647.75 ||||| 487,751 812.92 6,460.67 ||||||
Iowa Valley 73,990 3,082.92 ||| 282,042 470.07 3,552.99 |||
Hawkeye 141,643 5,901.79 ||||| 227,094 378.49 6,280.28 ||||||
Eastern Iowa 182,627 7,609.46 ||||||| 922,253 1,537.09 | 9,146.55 |||||||||
Kirkwood 397,813 16,575.54 |||||||||||||||| 993,414 1,655.69 | 18,231.23 ||||||||||||||||||
Des Moines Area 478,186 19,924.42 ||||||||||||||||||| 1,444,779 2,407.97 || 22,332.38 ||||||||||||||||||||||
Western Iowa Tech 111,094 4,628.92 |||| 494,761 824.60 5,453.52 |||||
Iowa Western 139,617 5,817.38 ||||| 464,254 773.76 6,591.13 ||||||
Southwestern 36,586 1,524.40 | 208,335 347.22 1,871.62 |
Indian Hills 135,617 5,650.71 ||||| 277,569 462.62 6,113.32 ||||||
Southeastern 86,245 3,593.54 ||| 222,512 370.85 3,964.40 |||
Total 2,236,941 93,205.85 6,962,891 11,604.82 104,810.67Note: Each “|” denotes 10,000 students. Source: Iowa Department of Education, Division of Community Colleges and Workforce Preparation, Community College MIS.

The Condition of Iowa’s Community Colleges242
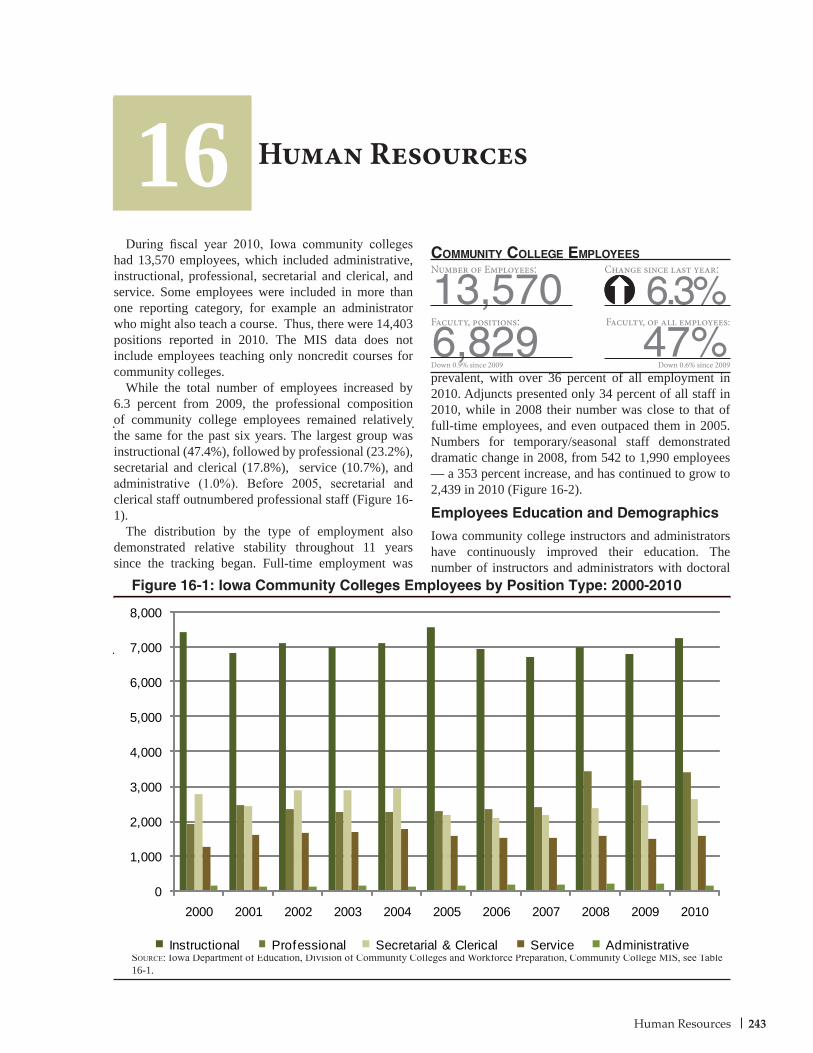
243Human Resources
6,829Faculty, positions:
47%Faculty, of all employees:
During fiscal year 2010, Iowa community colleges had 13,570 employees, which included administrative, instructional, professional, secretarial and clerical, and service. Some employees were included in more than one reporting category, for example an administrator who might also teach a course. Thus, there were 14,403 positions reported in 2010. The MIS data does not include employees teaching only noncredit courses for community colleges.
While the total number of employees increased by 6.3 percent from 2009, the professional composition of community college employees remained relatively the same for the past six years. The largest group was instructional (47.4%), followed by professional (23.2%), secretarial and clerical (17.8%), service (10.7%), and administrative (1.0%). Before 2005, secretarial and clerical staff outnumbered professional staff (Figure 16-1).
The distribution by the type of employment also demonstrated relative stability throughout 11 years since the tracking began. Full-time employment was
prevalent, with over 36 percent of all employment in 2010. Adjuncts presented only 34 percent of all staff in 2010, while in 2008 their number was close to that of full-time employees, and even outpaced them in 2005. Numbers for temporary/seasonal staff demonstrated dramatic change in 2008, from 542 to 1,990 employees — a 353 percent increase, and has continued to grow to 2,439 in 2010 (Figure 16-2).
Employees Education and Demographics
Iowa community college instructors and administrators have continuously improved their education. The number of instructors and administrators with doctoral
Human Resources
Figure 16-1: Iowa Community Colleges Employees by Position Type: 2000-2010
16
Source: Iowa Department of Education, Division of Community Colleges and Workforce Preparation, Community College MIS, see Table 16-1.
Number of Employees:
13,570 6.3%communitY college emPloYees
Down 0.9% since 2009 Down 0.6% since 2009
Change since last year:
0
1,000
2,000
3,000
4,000
5,000
6,000
7,000
8,000
2000 2001 2002 2003 2004 2005 2006 2007 2008 2009 2010
Instructional Professional Secretarial & Clerical Service Administrative
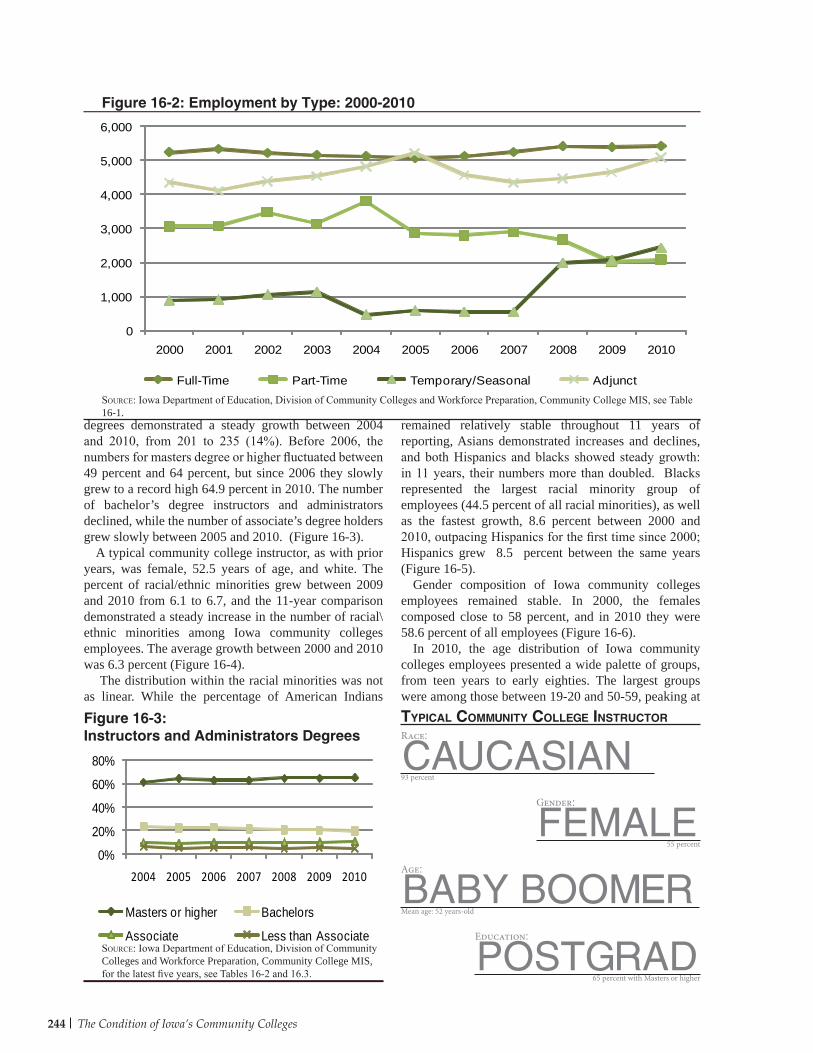
244 The Condition of Iowa’s Community Colleges
degrees demonstrated a steady growth between 2004 and 2010, from 201 to 235 (14%). Before 2006, the numbers for masters degree or higher fluctuated between 49 percent and 64 percent, but since 2006 they slowly grew to a record high 64.9 percent in 2010. The number of bachelor’s degree instructors and administrators declined, while the number of associate’s degree holders grew slowly between 2005 and 2010. (Figure 16-3).
A typical community college instructor, as with prior years, was female, 52.5 years of age, and white. The percent of racial/ethnic minorities grew between 2009 and 2010 from 6.1 to 6.7, and the 11-year comparison demonstrated a steady increase in the number of racial\ethnic minorities among Iowa community colleges employees. The average growth between 2000 and 2010 was 6.3 percent (Figure 16-4).
The distribution within the racial minorities was not as linear. While the percentage of American Indians
Figure 16-2: Employment by Type: 2000-2010
Source: Iowa Department of Education, Division of Community Colleges and Workforce Preparation, Community College MIS, see Table 16-1.
remained relatively stable throughout 11 years of reporting, Asians demonstrated increases and declines, and both Hispanics and blacks showed steady growth: in 11 years, their numbers more than doubled. Blacks represented the largest racial minority group of employees (44.5 percent of all racial minorities), as well as the fastest growth, 8.6 percent between 2000 and 2010, outpacing Hispanics for the first time since 2000; Hispanics grew 8.5 percent between the same years (Figure 16-5).
Gender composition of Iowa community colleges employees remained stable. In 2000, the females composed close to 58 percent, and in 2010 they were 58.6 percent of all employees (Figure 16-6).
In 2010, the age distribution of Iowa community colleges employees presented a wide palette of groups, from teen years to early eighties. The largest groups were among those between 19-20 and 50-59, peaking at tYPical communitY college instructorFigure 16-3:
Instructors and Administrators Degrees
Source: Iowa Department of Education, Division of Community Colleges and Workforce Preparation, Community College MIS, for the latest five years, see Tables 16-2 and 16.3.
0
1,000
2,000
3,000
4,000
5,000
6,000
2000 2001 2002 2003 2004 2005 2006 2007 2008 2009 2010
Full-Time Part-Time Temporary/Seasonal Adjunct
0%
20%
40%
60%
80%
2004 2005 2006 2007 2008 2009 2010
Masters or higher Bachelors
Associate Less than Associate
Race:
CAUCASIAN93 percent
Gender:
FEMALE55 percent
Age:
BABY BOOMERMean age: 52 years-old
Education:
POSTGRAD65 percent with Masters or higher
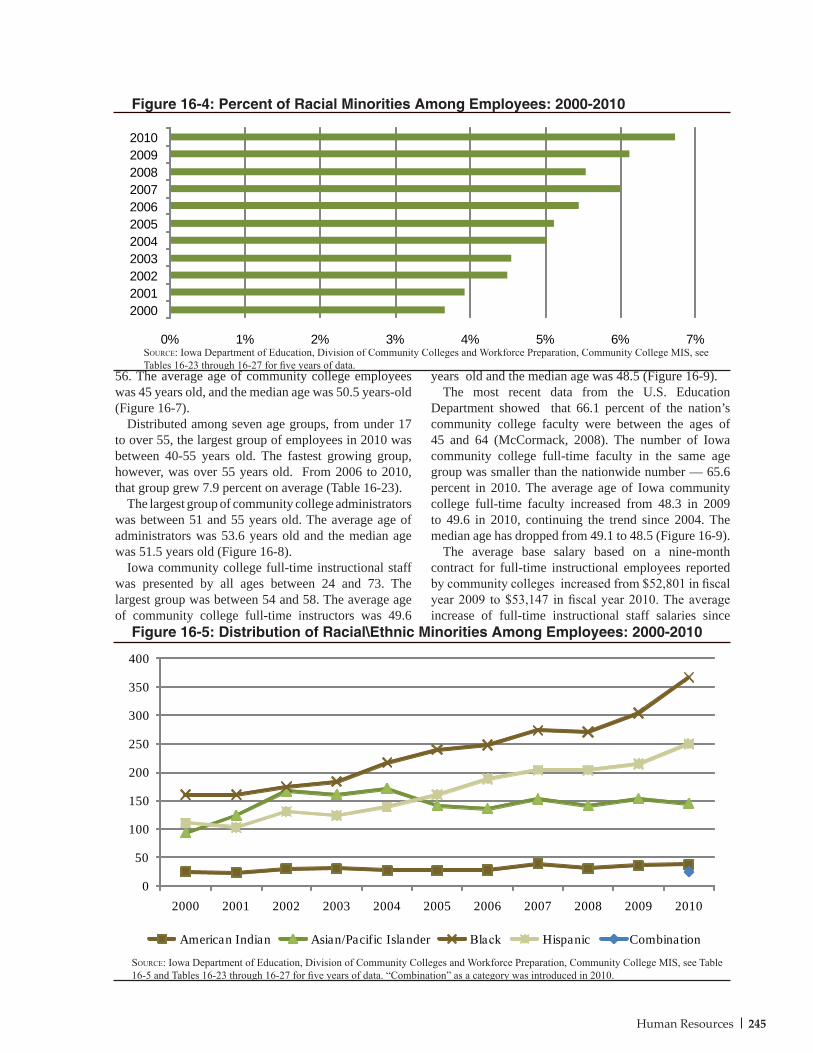
245Human Resources
Figure 16-4: Percent of Racial Minorities Among Employees: 2000-2010
Source: Iowa Department of Education, Division of Community Colleges and Workforce Preparation, Community College MIS, see Tables 16-23 through 16-27 for five years of data.
56. The average age of community college employees was 45 years old, and the median age was 50.5 years-old (Figure 16-7).
Distributed among seven age groups, from under 17 to over 55, the largest group of employees in 2010 was between 40-55 years old. The fastest growing group, however, was over 55 years old. From 2006 to 2010, that group grew 7.9 percent on average (Table 16-23).
The largest group of community college administrators was between 51 and 55 years old. The average age of administrators was 53.6 years old and the median age was 51.5 years old (Figure 16-8).
Iowa community college full-time instructional staff was presented by all ages between 24 and 73. The largest group was between 54 and 58. The average age of community college full-time instructors was 49.6
years old and the median age was 48.5 (Figure 16-9). The most recent data from the U.S. Education
Department showed that 66.1 percent of the nation’s community college faculty were between the ages of 45 and 64 (McCormack, 2008). The number of Iowa community college full-time faculty in the same age group was smaller than the nationwide number — 65.6 percent in 2010. The average age of Iowa community college full-time faculty increased from 48.3 in 2009 to 49.6 in 2010, continuing the trend since 2004. The median age has dropped from 49.1 to 48.5 (Figure 16-9).
The average base salary based on a nine-month contract for full-time instructional employees reported by community colleges increased from $52,801 in fiscal year 2009 to $53,147 in fiscal year 2010. The average increase of full-time instructional staff salaries since
Source: Iowa Department of Education, Division of Community Colleges and Workforce Preparation, Community College MIS, see Table 16-5 and Tables 16-23 through 16-27 for five years of data. “Combination” as a category was introduced in 2010.
Figure 16-5: Distribution of Racial\Ethnic Minorities Among Employees: 2000-2010
0% 1% 2% 3% 4% 5% 6% 7%
20002001200220032004200520062007200820092010
0
50
100
150
200
250
300
350
400
2000 2001 2002 2003 2004 2005 2006 2007 2008 2009 2010
American Indian Asian/Pacific Islander Black Hispanic Combination
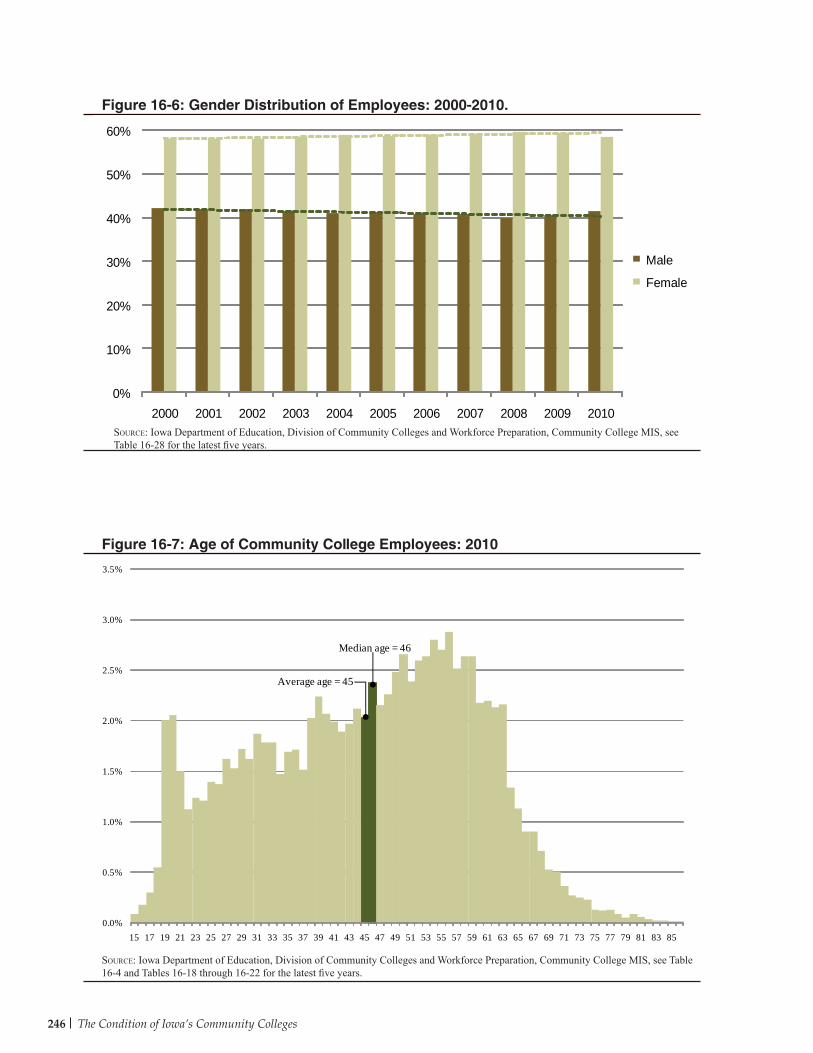
246 The Condition of Iowa’s Community Colleges
Figure 16-6: Gender Distribution of Employees: 2000-2010.
Figure 16-7: Age of Community College Employees: 2010
Source: Iowa Department of Education, Division of Community Colleges and Workforce Preparation, Community College MIS, see Table 16-28 for the latest five years.
Source: Iowa Department of Education, Division of Community Colleges and Workforce Preparation, Community College MIS, see Table 16-4 and Tables 16-18 through 16-22 for the latest five years.
0%
10%
20%
30%
40%
50%
60%
2000 2001 2002 2003 2004 2005 2006 2007 2008 2009 2010
Male
Female
0.0%
0.5%
1.0%
1.5%
2.0%
2.5%
3.0%
3.5%
15 17 19 21 23 25 27 29 31 33 35 37 39 41 43 45 47 49 51 53 55 57 59 61 63 65 67 69 71 73 75 77 79 81 83 85
Average age = 45
Median age = 46
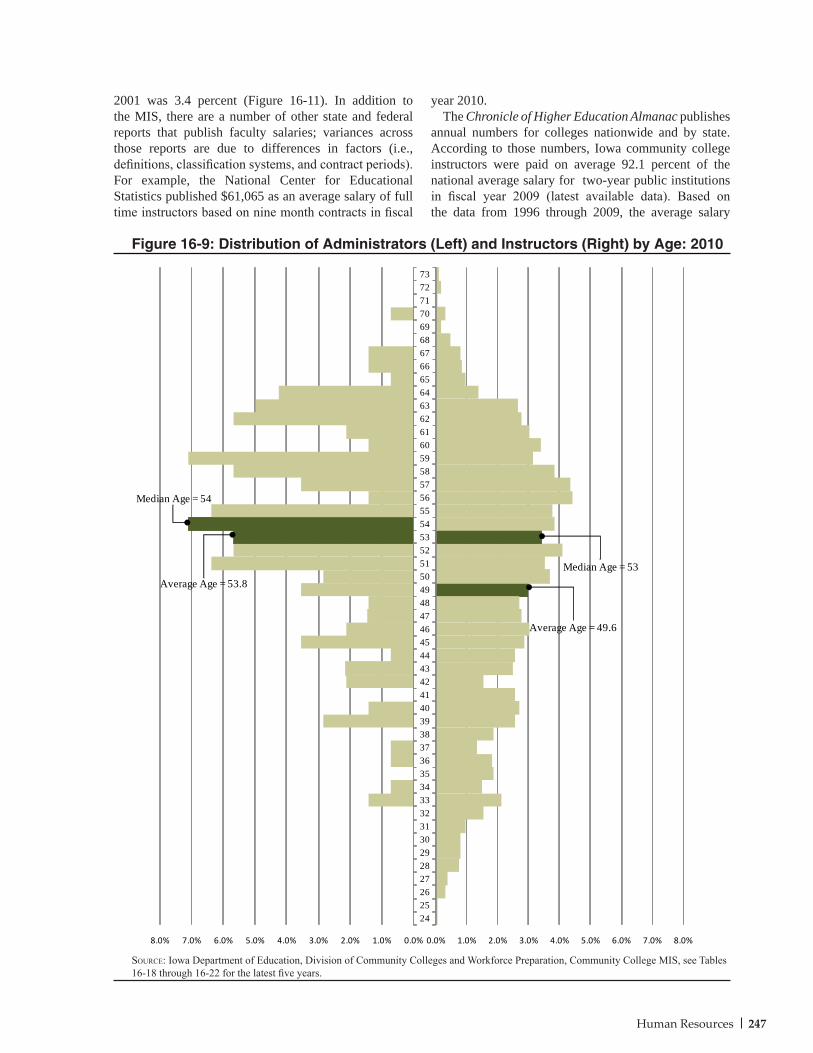
247Human Resources
2001 was 3.4 percent (Figure 16-11). In addition to the MIS, there are a number of other state and federal reports that publish faculty salaries; variances across those reports are due to differences in factors (i.e., definitions, classification systems, and contract periods). For example, the National Center for Educational Statistics published $61,065 as an average salary of full time instructors based on nine month contracts in fiscal
year 2010.The Chronicle of Higher Education Almanac publishes
annual numbers for colleges nationwide and by state. According to those numbers, Iowa community college instructors were paid on average 92.1 percent of the national average salary for two-year public institutions in fiscal year 2009 (latest available data). Based on the data from 1996 through 2009, the average salary
Figure 16-9: Distribution of Administrators (Left) and Instructors (Right) by Age: 2010
Source: Iowa Department of Education, Division of Community Colleges and Workforce Preparation, Community College MIS, see Tables 16-18 through 16-22 for the latest five years.
0.0%1.0%2.0%3.0%4.0%5.0%6.0%7.0%8.0% 0.0% 1.0% 2.0% 3.0% 4.0% 5.0% 6.0% 7.0% 8.0%
2425262728293031323334353637383940414243444546474849505152535455565758596061626364656667686970717273
Median Age = 53
Average Age = 49.6
Average Age = 53.8
Median Age = 54
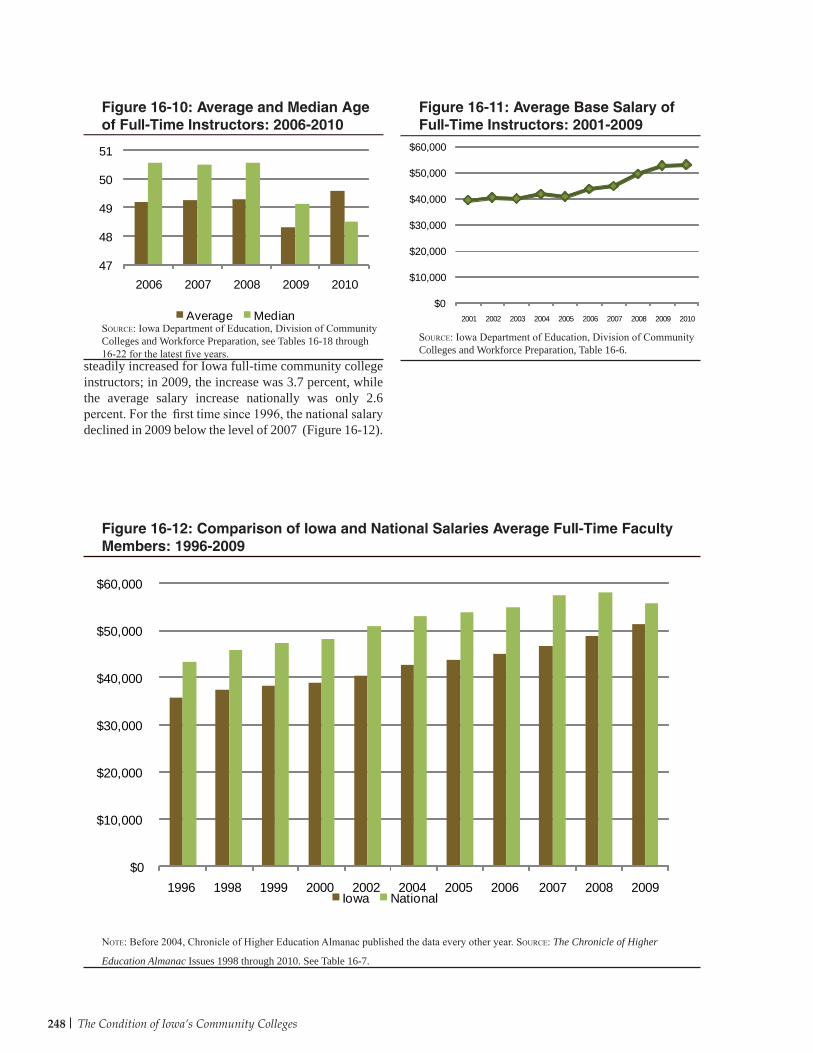
248 The Condition of Iowa’s Community Colleges
Figure 16-10: Average and Median Age of Full-Time Instructors: 2006-2010
Figure 16-11: Average Base Salary of Full-Time Instructors: 2001-2009
Source: Iowa Department of Education, Division of Community Colleges and Workforce Preparation, see Tables 16-18 through 16-22 for the latest five years.
Source: Iowa Department of Education, Division of Community Colleges and Workforce Preparation, Table 16-6.
Figure 16-12: Comparison of Iowa and National Salaries Average Full-Time Faculty Members: 1996-2009
Note: Before 2004, Chronicle of Higher Education Almanac published the data every other year. Source: The Chronicle of Higher
Education Almanac Issues 1998 through 2010. See Table 16-7.
steadily increased for Iowa full-time community college instructors; in 2009, the increase was 3.7 percent, while the average salary increase nationally was only 2.6 percent. For the first time since 1996, the national salary declined in 2009 below the level of 2007 (Figure 16-12).
47
48
49
50
51
2006 2007 2008 2009 2010
Average Median$0
$10,000
$20,000
$30,000
$40,000
$50,000
$60,000
2001 2002 2003 2004 2005 2006 2007 2008 2009 2010
$0
$10,000
$20,000
$30,000
$40,000
$50,000
$60,000
1996 1998 1999 2000 2002 2004 2005 2006 2007 2008 2009Iowa National
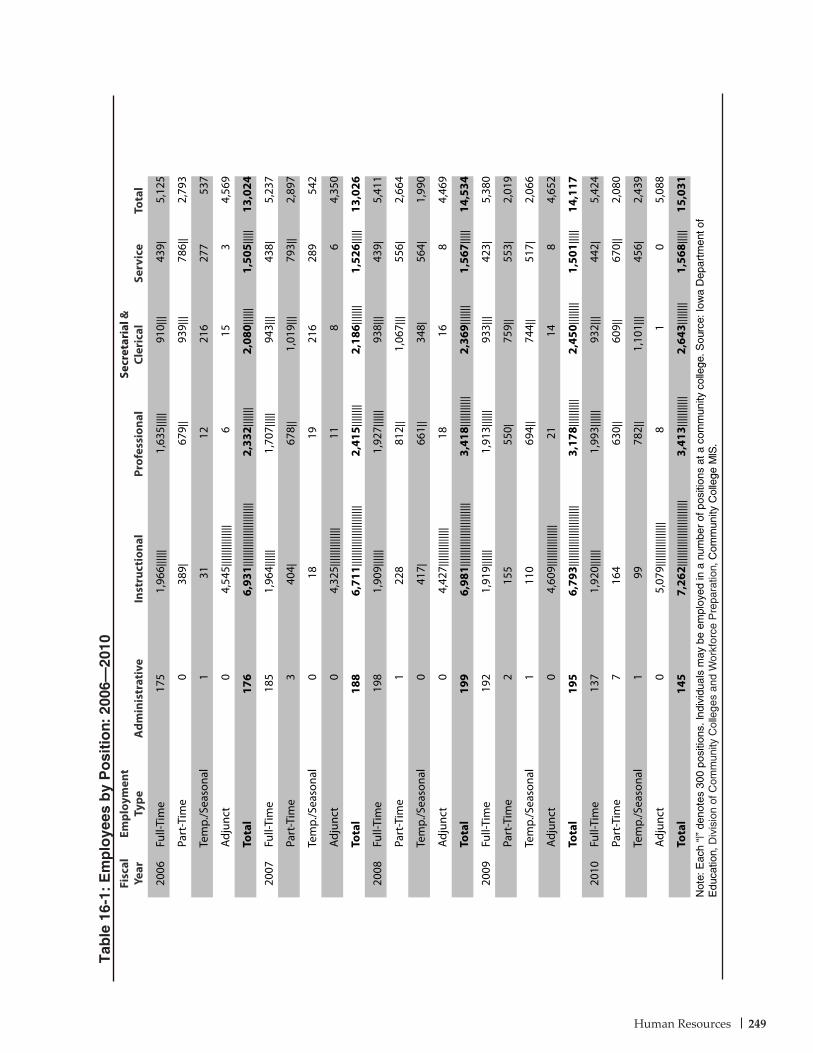
249Human Resources
Tab
le 1
6-1:
Em
plo
yees
by
Po
siti
on:
200
6–20
10Fi
scal
Ye
arEm
ploy
men
t Ty
peA
dmin
istr
ativ
eIn
stru
ctio
nal
Prof
essi
onal
Secr
etar
ial &
Cl
eric
alSe
rvic
e T
otal
2006
Ful
l-Tim
e
175
1,96
6 ||||
||1,
635|
||||
910|
||43
9|5,
125
P
art-T
ime
0
389 |
679|
|93
9|||
786|
|2,
793
Te
mp.
/Sea
sona
l 1
3112
216
277
537
A
djun
ct
04,
545 |
||||||
||||||
||6
153
4,56
9
T
otal
17
66,
931 |
||||||
||||||
||||||
||||
2,33
2||||
|||2,
080|
|||||
1,50
5||||
|13
,024
2007
Ful
l-Tim
e
185
1,96
4 ||||
||1,
707|
||||
943|
||43
8|5,
237
P
art-T
ime
3
404 |
678|
|1,
019|
||79
3||
2,89
7
Te
mp.
/Sea
sona
l 0
1819
216
289
542
A
djun
ct
04,
325 |
||||||
||||||
|11
86
4,35
0
T
otal
18
86,
711 |
||||||
||||||
||||||
|||2,
415|
||||||
|2,
186|
||||||
1,52
6||||
|13
,026
2008
Ful
l-Tim
e
198
1,90
9 ||||
||1,
927|
|||||
938|
||43
9|5,
411
Par
t-Tim
e
122
881
2||
1,06
7|||
556|
2,66
4
Tem
p./S
easo
nal
041
7 |66
1||
348|
564|
1,99
0
Adj
unct
0
4,42
7 ||||
||||||
||||
1816
84,
469
Tot
al
199
6,98
1 ||||
||||||
||||||
||||||
|3,
418|
||||||
||||
2,36
9||||
|||1,
567|
||||
14,5
34
2009
Ful
l-Tim
e
192
1,91
9 ||||
||1,
913|
|||||
933|
||42
3|5,
380
Par
t-Tim
e
215
555
0 |75
9||
553|
2,01
9
Tem
p./S
easo
nal
111
069
4 ||
744|
|51
7|2,
066
Adj
unct
0
4,60
9 ||||
||||||
|||||
2114
84,
652
Tot
al
195
6,79
3 ||||
||||||
||||||
||||||
3,17
8||||
||||||
2,45
0||||
||||
1,50
1||||
|14
,117
2010
Ful
l-Tim
e
137
1,92
0 ||||
||1,
993|
|||||
932|
||44
2|5,
424
Par
t-Tim
e
716
463
0 ||
609|
|67
0||
2,08
0
Tem
p./S
easo
nal
199
782 |
|1,
101|
||45
6|2,
439
Adj
unct
0
5,07
9 ||||
||||||
||||||
81
05,
088
Tot
al
145
7,26
2 ||||
||||||
||||||
||||||
||3,
413|
||||||
||||
2,64
3||||
||||
1,56
8||||
|15
,031
Not
e: E
ach
“|”
deno
tes
300
posi
tions
. Ind
ivid
uals
may
be
empl
oyed
in a
num
ber
of p
ositi
ons
at a
com
mun
ity c
olle
ge. S
ourc
e: Io
wa
Dep
artm
ent o
f E
duca
tion,
Div
isio
n of
Com
mun
ity C
olle
ges
and
Wor
kfor
ce P
repa
ratio
n, C
omm
unity
Col
lege
MIS
.
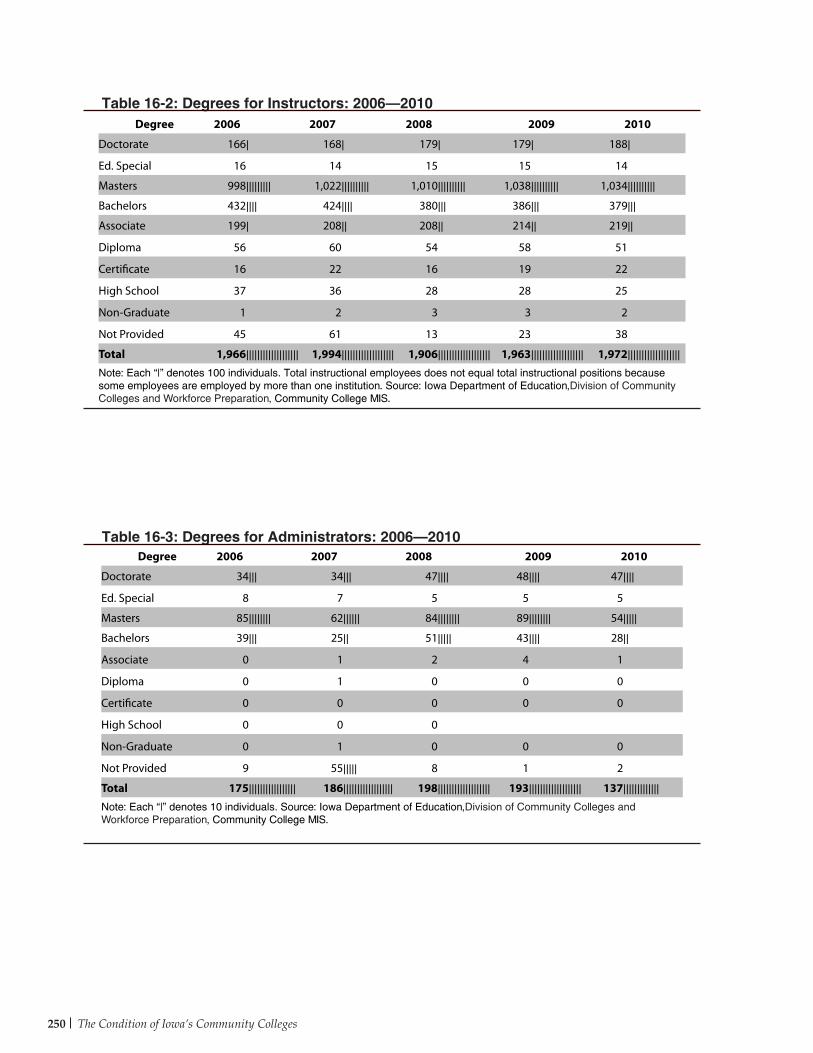
The Condition of Iowa’s Community Colleges250
Table 16-2: Degrees for Instructors: 2006–2010
Table 16-3: Degrees for Administrators: 2006–2010
Degree 2006 2007 2008 2009 2010
Doctorate 166| 168| 179| 179| 188|
Ed. Special 16 14 15 15 14
Masters 998||||||||| 1,022|||||||||| 1,010|||||||||| 1,038|||||||||| 1,034||||||||||
Bachelors 432|||| 424|||| 380||| 386||| 379|||
Associate 199| 208|| 208|| 214|| 219||
Diploma 56 60 54 58 51
Certificate 16 22 16 19 22
High School 37 36 28 28 25
Non-Graduate 1 2 3 3 2
Not Provided 45 61 13 23 38
Total 1,966||||||||||||||||||| 1,994||||||||||||||||||| 1,906||||||||||||||||||| 1,963||||||||||||||||||| 1,972|||||||||||||||||||
Note: Each “|” denotes 100 individuals. Total instructional employees does not equal total instructional positions because some employees are employed by more than one institution. Source: Iowa Department of Education,Division of Community Colleges and Workforce Preparation, Community College MIS.
Degree 2006 2007 2008 2009 2010
Doctorate 34||| 34||| 47|||| 48|||| 47||||
Ed. Special 8 7 5 5 5
Masters 85|||||||| 62|||||| 84|||||||| 89|||||||| 54|||||
Bachelors 39||| 25|| 51||||| 43|||| 28||
Associate 0 1 2 4 1
Diploma 0 1 0 0 0
Certificate 0 0 0 0 0
High School 0 0 0
Non-Graduate 0 1 0 0 0
Not Provided 9 55||||| 8 1 2
Total 175||||||||||||||||| 186|||||||||||||||||| 198||||||||||||||||||| 193||||||||||||||||||| 137|||||||||||||
Note: Each “|” denotes 10 individuals. Source: Iowa Department of Education,Division of Community Colleges and Workforce Preparation, Community College MIS.
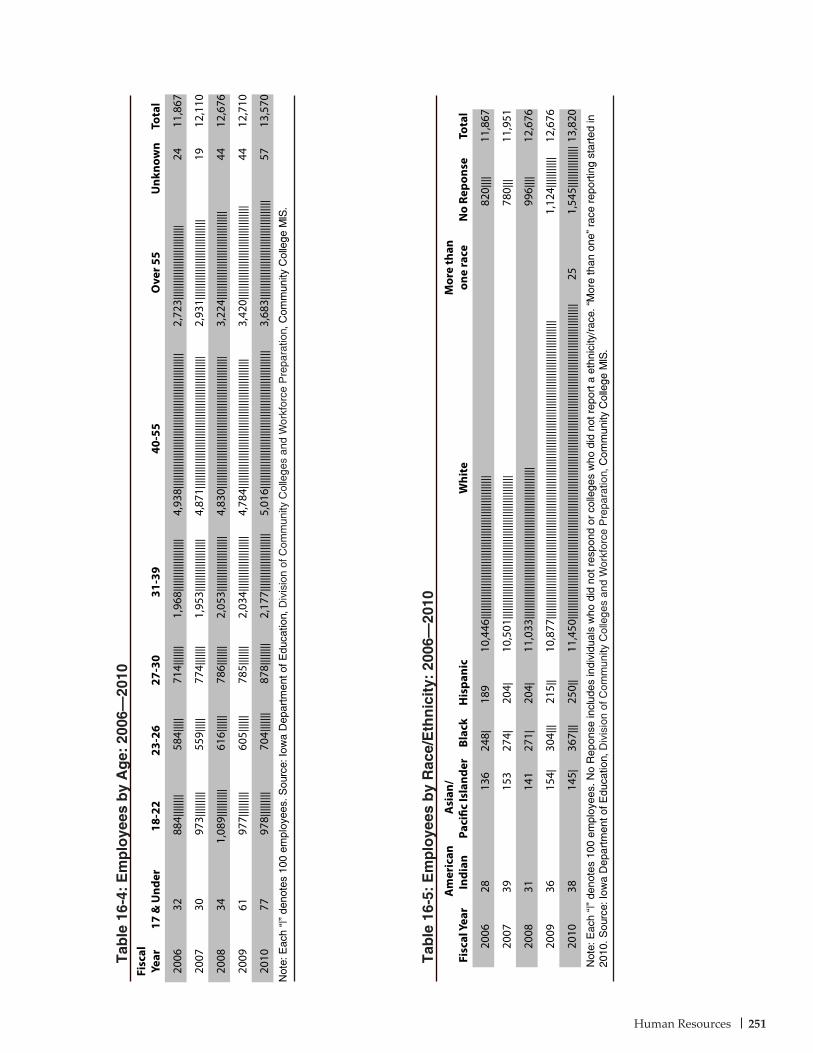
251Human Resources
Tab
le 1
6-4:
Em
plo
yees
by
Ag
e: 2
006–
2010
Tab
le 1
6-5:
Em
plo
yees
by
Rac
e/E
thn
icit
y: 2
006–
2010
Fisc
al
Year
17 &
Und
er18
-22
23-2
627
-30
31-3
940
-55
Ove
r 55
Unk
now
nTo
tal
2006
3288
4 ||||
||||
584|
||||
714|
||||||
1,96
8||||
||||||
||||||
|||4,
938|
||||||
||||||
||||||
||||||
||||||
||||||
||||||
||||||
2,72
3||||
||||||
||||||
||||||
|||||
2411
,867
2007
3097
3 ||||
|||||
559|
||||
774|
||||||
1,95
3||||
||||||
||||||
|||4,
871|
||||||
||||||
||||||
||||||
||||||
||||||
||||||
|||||
2,93
1||||
||||||
||||||
||||||
||||||
|19
12,1
10
2008
341,
089 |
||||||
|||61
6||||
||78
6||||
|||2,
053|
||||||
||||||
||||||
|4,
830|
||||||
||||||
||||||
||||||
||||||
||||||
||||||
|||||
3,22
4||||
||||||
||||||
||||||
||||||
||||
4412
,676
2009
6197
7 ||||
|||||
605|
|||||
785|
||||||
2,03
4||||
||||||
||||||
||||
4,78
4||||
||||||
||||||
||||||
||||||
||||||
||||||
||||||
|3,
420|
||||||
||||||
||||||
||||||
||||||
|||44
12,7
10
2010
7797
8 ||||
|||||
704|
||||||
878|
||||||
|2,
177|
||||||
||||||
||||||
||5,
016|
||||||
||||||
||||||
||||||
||||||
||||||
||||||
||||||
|3,
683|
||||||
||||||
||||||
||||||
||||||
|||||
5713
,570
Not
e: E
ach
“|”
deno
tes
100
empl
oyee
s. S
ourc
e: Io
wa
Dep
artm
ent o
f Edu
catio
n, D
ivis
ion
of C
omm
unity
Col
lege
s an
d W
orkf
orce
Pre
para
tion,
Com
mun
ity C
olle
ge M
IS.
Fis
cal Y
ear
Am
eric
an
Indi
an
Asi
an/
Paci
fic Is
land
er
Bla
ck
His
pani
c W
hite
M
ore
than
on
e ra
ceN
o Re
pons
e T
otal
2006
2813
624
8 |18
910
,446
||||||
||||||
||||||
||||||
||||||
||||||
||||||
||||||
||||
820|
|||11
,867
2007
3915
327
4 |20
4|10
,501
||||||
||||||
||||||
||||||
||||||
||||||
||||||
||||||
||||
780|
||11
,951
2008
3114
127
1 |20
4|11
,033
||||||
||||||
||||||
||||||
||||||
||||||
||||||
||||||
||||||
|99
6||||
12,6
76
2009
3615
4 |30
4|||
215|
|10
,877
||||||
||||||
||||||
||||||
||||||
||||||
||||||
||||||
||||||
||||||
||||||
||||||
||||||
||||||
||||||
||||||
||||||
||||||
1,12
4||||
||||||
|12
,676
2010
3814
5 |36
7|||
250|
|11
,450
||||||
||||||
||||||
||||||
||||||
||||||
||||||
||||||
||||||
||||||
||||||
||||||
||||||
||||||
||||||
||||||
||||||
||||||
||||||
251,
545|
||||||
||||||
||13
,820
Not
e: E
ach
“|”
deno
tes
100
empl
oyee
s. N
o R
epon
se in
clud
es in
divi
dual
s w
ho d
id n
ot r
espo
nd o
r co
llege
s w
ho d
id n
ot r
epor
t a e
thni
city
/rac
e. “
Mor
e th
an o
ne”
race
rep
ortin
g st
arte
d in
20
10. S
ourc
e: Io
wa
Dep
artm
ent o
f Edu
catio
n, D
ivis
ion
of C
omm
unity
Col
lege
s an
d W
orkf
orce
Pre
para
tion,
Com
mun
ity C
olle
ge M
IS.
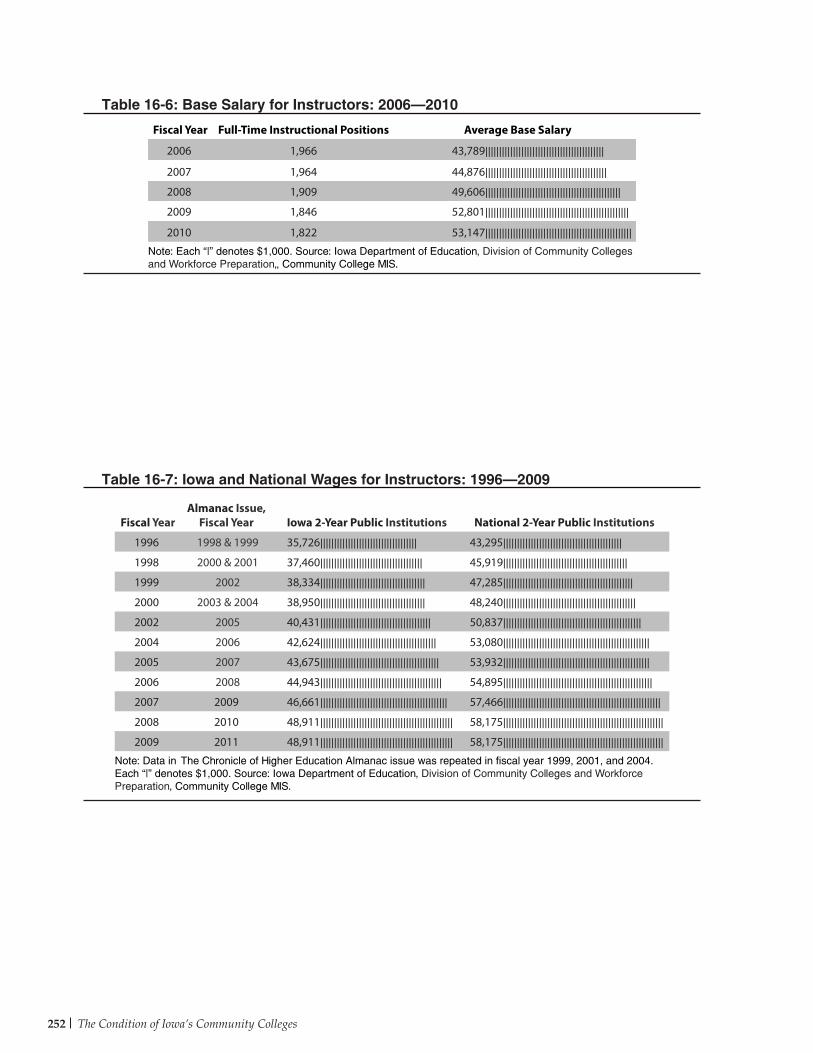
The Condition of Iowa’s Community Colleges252
Table 16-6: Base Salary for Instructors: 2006–2010
Table 16-7: Iowa and National Wages for Instructors: 1996–2009
Fiscal Year Full-Time Instructional Positions Average Base Salary
2006 1,966 43,789|||||||||||||||||||||||||||||||||||||||||||
2007 1,964 44,876||||||||||||||||||||||||||||||||||||||||||||
2008 1,909 49,606|||||||||||||||||||||||||||||||||||||||||||||||||
2009 1,846 52,801||||||||||||||||||||||||||||||||||||||||||||||||||||
2010 1,822 53,147|||||||||||||||||||||||||||||||||||||||||||||||||||||
Note: Each “|” denotes $1,000. Source: Iowa Department of Education, Division of Community Colleges and Workforce Preparation,, Community College MIS.
Fiscal Year Almanac Issue,
Fiscal Year Iowa 2-Year Public Institutions National 2-Year Public Institutions
1996 1998 & 1999 35,726||||||||||||||||||||||||||||||||||| 43,295|||||||||||||||||||||||||||||||||||||||||||
1998 2000 & 2001 37,460||||||||||||||||||||||||||||||||||||| 45,919|||||||||||||||||||||||||||||||||||||||||||||
1999 2002 38,334|||||||||||||||||||||||||||||||||||||| 47,285|||||||||||||||||||||||||||||||||||||||||||||||
2000 2003 & 2004 38,950|||||||||||||||||||||||||||||||||||||| 48,240||||||||||||||||||||||||||||||||||||||||||||||||
2002 2005 40,431|||||||||||||||||||||||||||||||||||||||| 50,837||||||||||||||||||||||||||||||||||||||||||||||||||
2004 2006 42,624|||||||||||||||||||||||||||||||||||||||||| 53,080|||||||||||||||||||||||||||||||||||||||||||||||||||||
2005 2007 43,675||||||||||||||||||||||||||||||||||||||||||| 53,932|||||||||||||||||||||||||||||||||||||||||||||||||||||
2006 2008 44,943|||||||||||||||||||||||||||||||||||||||||||| 54,895||||||||||||||||||||||||||||||||||||||||||||||||||||||
2007 2009 46,661|||||||||||||||||||||||||||||||||||||||||||||| 57,466|||||||||||||||||||||||||||||||||||||||||||||||||||||||||
2008 2010 48,911|||||||||||||||||||||||||||||||||||||||||||||||| 58,175||||||||||||||||||||||||||||||||||||||||||||||||||||||||||
2009 2011 48,911|||||||||||||||||||||||||||||||||||||||||||||||| 58,175||||||||||||||||||||||||||||||||||||||||||||||||||||||||||
Note: Data in The Chronicle of Higher Education Almanac issue was repeated in fiscal year 1999, 2001, and 2004. Each “|” denotes $1,000. Source: Iowa Department of Education, Division of Community Colleges and Workforce Preparation, Community College MIS.
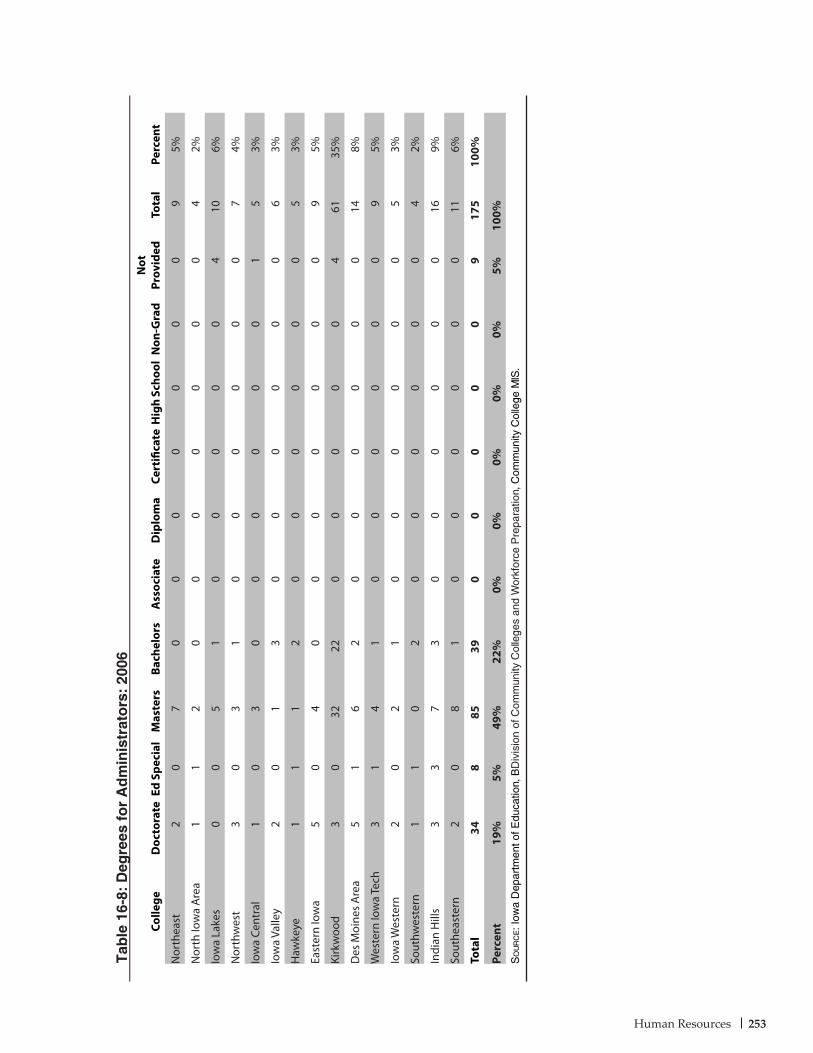
253Human Resources
Tab
le 1
6-8:
Deg
rees
fo
r A
dm
inis
trat
ors
: 20
06
Colle
geD
octo
rate
Ed S
peci
alM
aste
rsBa
chel
ors
Ass
ocia
teD
iplo
ma
Cert
ifica
teH
igh
Scho
olN
on-G
rad
Not
Pr
ovid
edTo
tal
Perc
ent
Nor
thea
st2
07
00
00
00
09
5%
Nor
th Io
wa
Are
a1
12
00
00
00
04
2%
Iow
a La
kes
00
51
00
00
04
106%
Nor
thw
est
30
31
00
00
00
74%
Iow
a Ce
ntra
l1
03
00
00
00
15
3%
Iow
a Va
lley
20
13
00
00
00
63%
Haw
keye
11
12
00
00
00
53%
East
ern
Iow
a5
04
00
00
00
09
5%
Kirk
woo
d3
032
220
00
00
461
35%
Des
Moi
nes
Are
a5
16
20
00
00
014
8%
Wes
tern
Iow
a Te
ch3
14
10
00
00
09
5%
Iow
a W
este
rn2
02
10
00
00
05
3%
Sout
hwes
tern
11
02
00
00
00
42%
Indi
an H
ills
33
73
00
00
00
169%
Sout
heas
tern
20
81
00
00
00
116%
Tota
l34
885
390
00
00
917
510
0%
Perc
ent
19%
5%49
%22
%0%
0%0%
0%0%
5%10
0%S
ou
rc
e: I
owa
Dep
artm
ent o
f Edu
catio
n, B
Div
isio
n of
Com
mun
ity C
olle
ges
and
Wor
kfor
ce P
repa
ratio
n, C
omm
unity
Col
lege
MIS
.

The Condition of Iowa’s Community Colleges254
Colle
geD
octo
rate
Ed S
peci
alM
aste
rsBa
chel
ors
Ass
ocia
teD
iplo
ma
Cert
ifica
teH
igh
Scho
olN
on-G
rad
Not
Pr
ovid
edTo
tal
Perc
ent
Nor
thea
st2
05
00
10
00
08
5%
Nor
th Io
wa
Are
a0
00
00
00
00
00
0%
Iow
a La
kes
00
51
00
00
02
85%
Nor
thw
est
30
40
00
00
00
74%
Iow
a Ce
ntra
l1
03
00
00
00
15
3%
Iow
a Va
lley
20
12
00
00
01
64%
Haw
keye
11
30
00
00
00
53%
East
ern
Iow
a5
04
00
00
00
09
5%
Kirk
woo
d2
09
50
00
00
4864
37%
Des
Moi
nes
Are
a5
15
10
00
00
012
7%
Wes
tern
Iow
a Te
ch3
15
10
00
01
011
6%
Iow
a W
este
rn1
02
10
00
00
04
2%
Sout
hwes
tern
21
02
00
00
00
53%
Indi
an H
ills
33
63
00
00
00
159%
Sout
heas
tern
30
63
00
00
00
127%
Tota
l33
758
190
10
01
5217
110
0%
Perc
ent
19%
4%34
%11
%0%
1%0%
0%1%
30%
100%
So
ur
ce: I
owa
Dep
artm
ent o
f Edu
catio
n, D
ivis
ion
of C
omm
unity
Col
lege
s and
Wor
kfor
ce P
repa
ratio
n, C
omm
unity
Col
lege
MIS
.
Tab
le 1
6-9:
Deg
rees
fo
r A
dm
inis
trat
ors
: 20
07
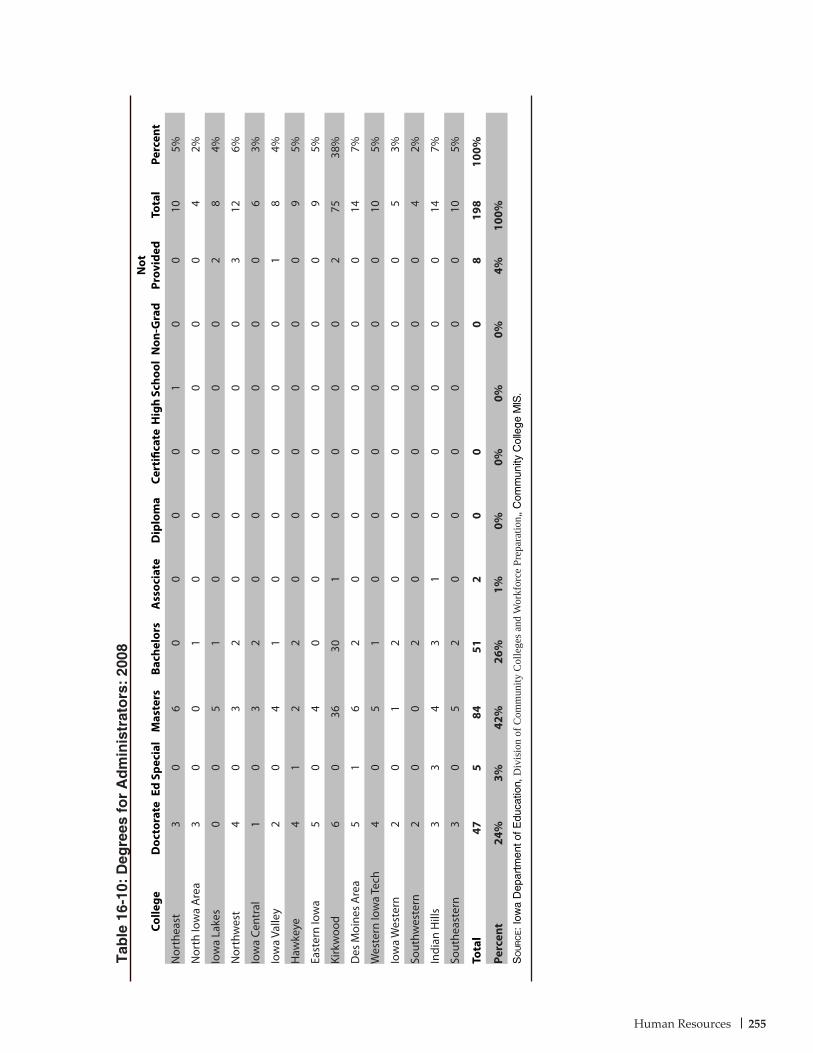
255Human Resources
Tab
le 1
6-10
: D
egre
es f
or
Ad
min
istr
ato
rs:
2008
Colle
geD
octo
rate
Ed S
peci
alM
aste
rsBa
chel
ors
Ass
ocia
teD
iplo
ma
Cert
ifica
teH
igh
Scho
olN
on-G
rad
Not
Pr
ovid
edTo
tal
Perc
ent
Nor
thea
st3
06
00
00
10
010
5%
Nor
th Io
wa
Are
a3
00
10
00
00
04
2%
Iow
a La
kes
00
51
00
00
02
84%
Nor
thw
est
40
32
00
00
03
126%
Iow
a Ce
ntra
l1
03
20
00
00
06
3%
Iow
a Va
lley
20
41
00
00
01
84%
Haw
keye
41
22
00
00
00
95%
East
ern
Iow
a5
04
00
00
00
09
5%
Kirk
woo
d6
036
301
00
00
275
38%
Des
Moi
nes
Are
a5
16
20
00
00
014
7%
Wes
tern
Iow
a Te
ch4
05
10
00
00
010
5%
Iow
a W
este
rn2
01
20
00
00
05
3%
Sout
hwes
tern
20
02
00
00
00
42%
Indi
an H
ills
33
43
10
00
00
147%
Sout
heas
tern
30
52
00
00
00
105%
Tota
l47
584
512
00
08
198
100%
Perc
ent
24%
3%42
%26
%1%
0%0%
0%0%
4%10
0%S
ou
rc
e: I
owa
Dep
artm
ent o
f Edu
catio
n, D
ivis
ion
of C
omm
unity
Col
lege
s and
Wor
kfor
ce P
repa
ratio
n,, C
omm
unity
Col
lege
MIS
.
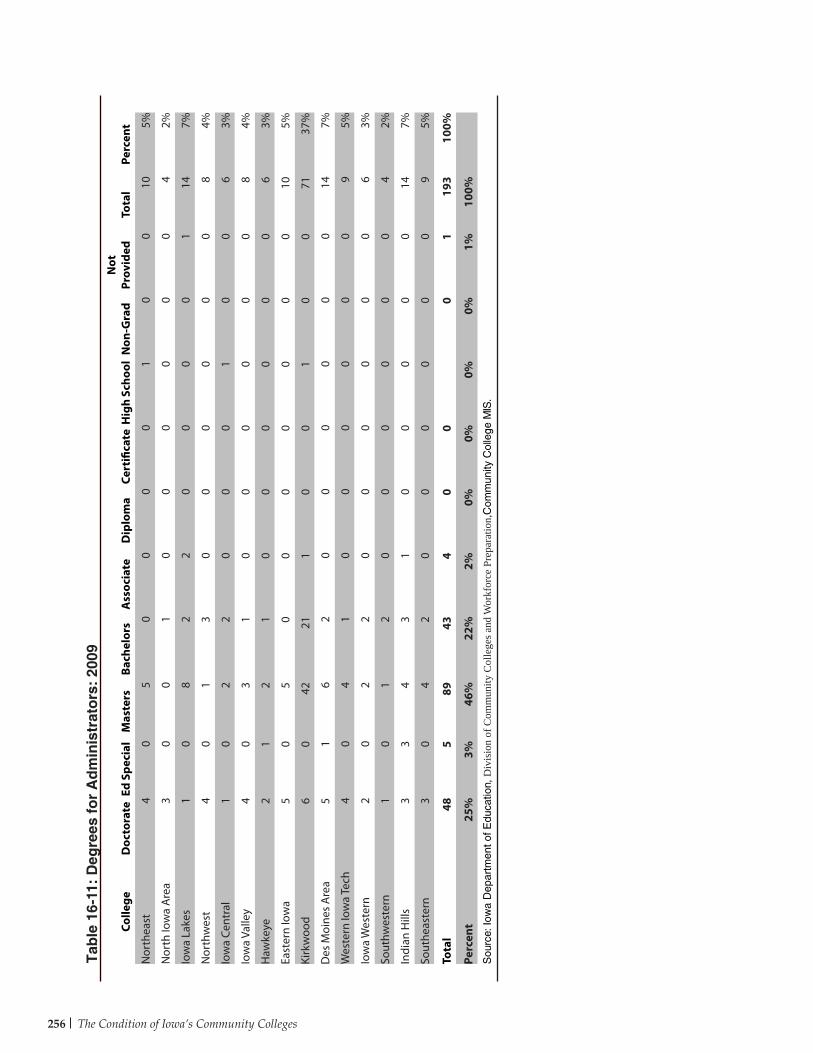
The Condition of Iowa’s Community Colleges256
Colle
geD
octo
rate
Ed S
peci
alM
aste
rsBa
chel
ors
Ass
ocia
teD
iplo
ma
Cert
ifica
teH
igh
Scho
olN
on-G
rad
Not
Pr
ovid
edTo
tal
Perc
ent
Nor
thea
st4
05
00
00
10
010
5%
Nor
th Io
wa
Are
a3
00
10
00
00
04
2%
Iow
a La
kes
10
82
20
00
01
147%
Nor
thw
est
40
13
00
00
00
84%
Iow
a Ce
ntra
l1
02
20
00
10
06
3%
Iow
a Va
lley
40
31
00
00
00
84%
Haw
keye
21
21
00
00
00
63%
East
ern
Iow
a5
05
00
00
00
010
5%
Kirk
woo
d6
042
211
00
10
071
37%
Des
Moi
nes
Are
a5
16
20
00
00
014
7%
Wes
tern
Iow
a Te
ch4
04
10
00
00
09
5%
Iow
a W
este
rn2
02
20
00
00
06
3%
Sout
hwes
tern
10
12
00
00
00
42%
Indi
an H
ills
33
43
10
00
00
147%
Sout
heas
tern
30
42
00
00
00
95%
Tota
l48
589
434
00
01
193
100%
Perc
ent
25%
3%46
%22
%2%
0%0%
0%0%
1%10
0%S
ourc
e: Io
wa
Dep
artm
ent o
f Edu
catio
n, D
ivis
ion
of C
omm
unity
Col
lege
s and
Wor
kfor
ce P
repa
ratio
n,C
omm
unity
Col
lege
MIS
.
Tab
le 1
6-11
: D
egre
es f
or
Ad
min
istr
ato
rs:
2009
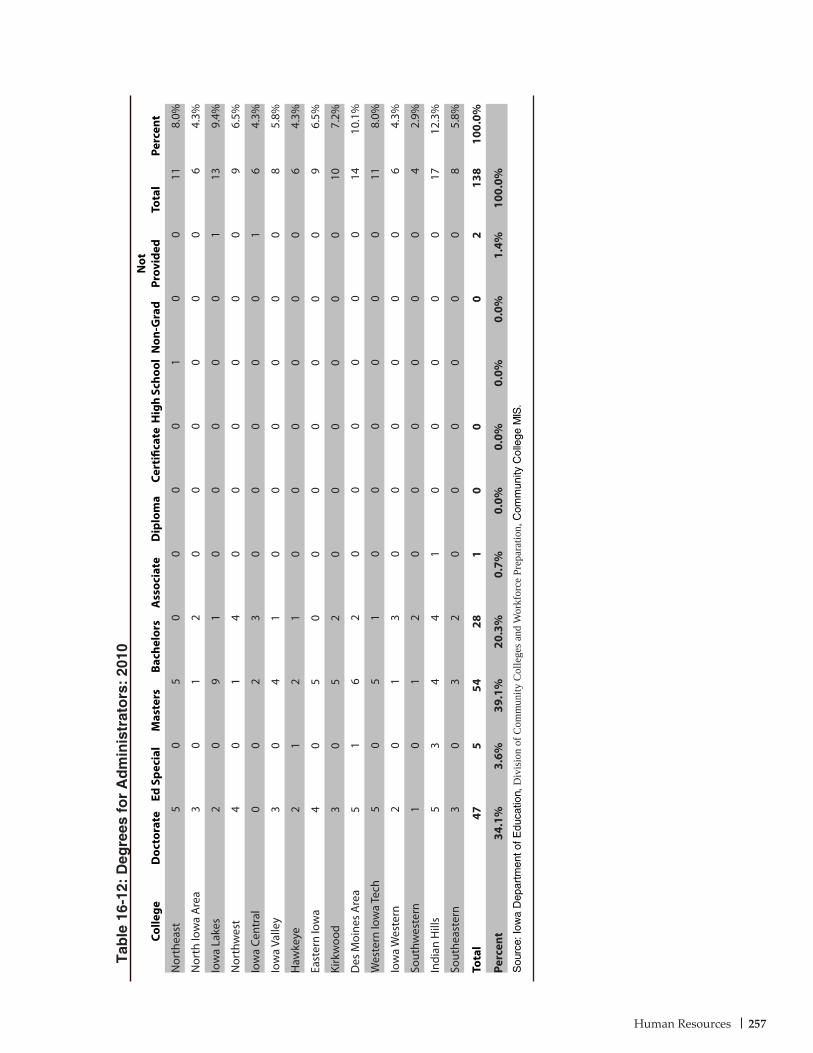
257Human Resources
Tab
le 1
6-12
: D
egre
es f
or
Ad
min
istr
ato
rs:
2010
Colle
geD
octo
rate
Ed S
peci
alM
aste
rsBa
chel
ors
Ass
ocia
teD
iplo
ma
Cert
ifica
teH
igh
Scho
olN
on-G
rad
Not
Pr
ovid
edTo
tal
Perc
ent
Nor
thea
st5
05
00
00
10
011
8.0%
Nor
th Io
wa
Are
a3
01
20
00
00
06
4.3%
Iow
a La
kes
20
91
00
00
01
139.
4%
Nor
thw
est
40
14
00
00
00
96.
5%
Iow
a Ce
ntra
l0
02
30
00
00
16
4.3%
Iow
a Va
lley
30
41
00
00
00
85.
8%
Haw
keye
21
21
00
00
00
64.
3%
East
ern
Iow
a4
05
00
00
00
09
6.5%
Kirk
woo
d3
05
20
00
00
010
7.2%
Des
Moi
nes
Are
a5
16
20
00
00
014
10.1
%
Wes
tern
Iow
a Te
ch5
05
10
00
00
011
8.0%
Iow
a W
este
rn2
01
30
00
00
06
4.3%
Sout
hwes
tern
10
12
00
00
00
42.
9%
Indi
an H
ills
53
44
10
00
00
1712
.3%
Sout
heas
tern
30
32
00
00
00
85.
8%
Tota
l47
554
281
00
02
138
100.
0%
Perc
ent
34.1
%3.
6%39
.1%
20.3
%0.
7%0.
0%0.
0%0.
0%0.
0%1.
4%10
0.0%
Sou
rce:
Iow
a D
epar
tmen
t of E
duca
tion,
Div
isio
n of
Com
mun
ity C
olle
ges a
nd W
orkf
orce
Pre
para
tion,
Com
mun
ity C
olle
ge M
IS.

The Condition of Iowa’s Community Colleges258
Colle
geD
octo
rate
Ed S
peci
alM
aste
rsBa
chel
ors
Ass
ocia
teD
iplo
ma
Cert
ifica
teH
igh
Scho
olN
on-G
rad
Not
Pr
ovid
edTo
tal
Perc
ent
Nor
thea
st8
069
314
110
20
513
07%
Nor
th Io
wa
Are
a7
059
123
01
20
084
4%
Iow
a La
kes
22
4319
94
00
021
100
5%
Nor
thw
est
00
139
106
11
00
402%
Iow
a Ce
ntra
l1
046
1511
01
20
177
4%
Iow
a Va
lley
80
5215
51
11
00
834%
Haw
keye
120
6426
175
00
05
129
7%
East
ern
Iow
a20
210
559
221
517
00
231
12%
Kirk
woo
d40
414
355
261
00
010
279
14%
Des
Moi
nes
Are
a35
314
968
338
44
00
304
15%
Wes
tern
Iow
a Te
ch8
442
2214
30
51
099
5%
Iow
a W
este
rn7
065
3812
61
00
012
97%
Sout
hwes
tern
30
349
32
01
01
533%
Indi
an H
ills
71
6738
234
22
00
144
7%
Sout
heas
tern
80
4716
74
00
02
844%
Tota
l16
616
998
432
199
5616
371
451,
966
100%
Perc
ent
8%1%
51%
22%
10%
3%1%
2%0%
2%10
0%S
ou
rc
e: I
owa
Dep
artm
ent o
f Edu
catio
n, D
ivis
ion
of C
omm
unity
Col
lege
s an
d W
orkf
orce
Pre
para
tion,
Com
mun
ity C
olle
ge M
IS.
Tab
le 1
6-13
: D
egre
es f
or
Inst
ruct
ors
: 20
06
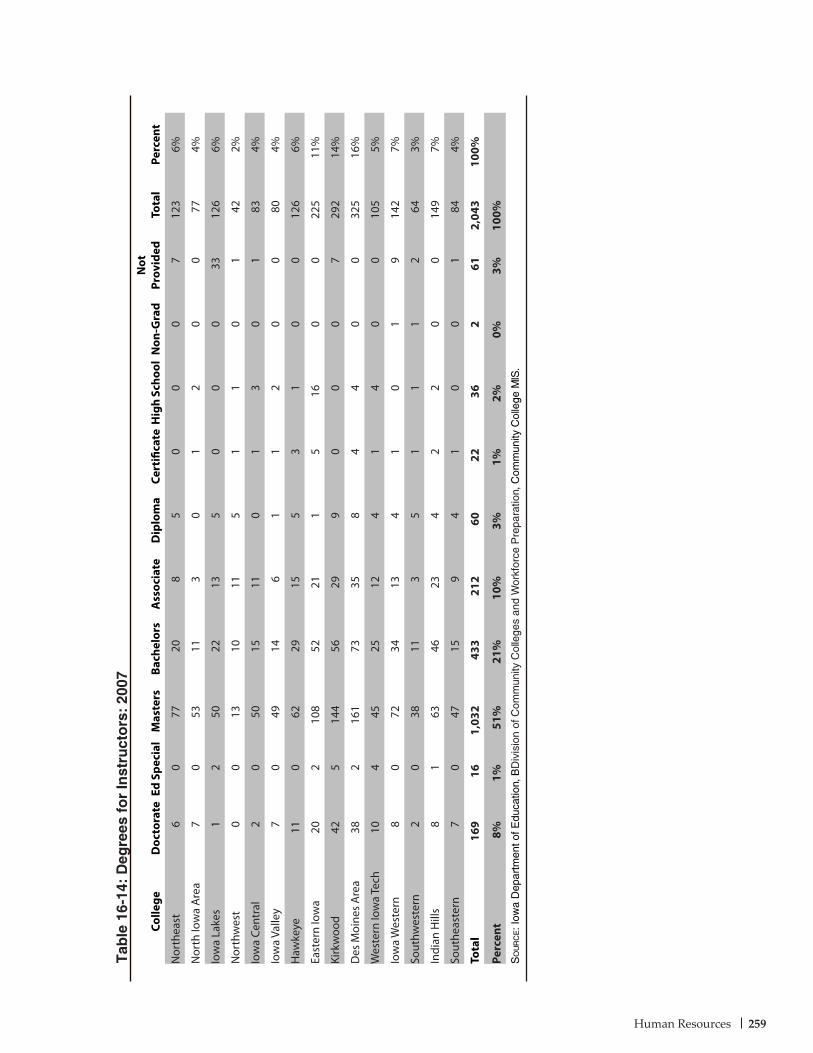
259Human Resources
Tab
le 1
6-14
: D
egre
es f
or
Inst
ruct
ors
: 20
07
Colle
geD
octo
rate
Ed S
peci
alM
aste
rsBa
chel
ors
Ass
ocia
teD
iplo
ma
Cert
ifica
teH
igh
Scho
olN
on-G
rad
Not
Pr
ovid
edTo
tal
Perc
ent
Nor
thea
st6
077
208
50
00
712
36%
Nor
th Io
wa
Are
a7
053
113
01
20
077
4%
Iow
a La
kes
12
5022
135
00
033
126
6%
Nor
thw
est
00
1310
115
11
01
422%
Iow
a Ce
ntra
l2
050
1511
01
30
183
4%
Iow
a Va
lley
70
4914
61
12
00
804%
Haw
keye
110
6229
155
31
00
126
6%
East
ern
Iow
a20
210
852
211
516
00
225
11%
Kirk
woo
d42
514
456
299
00
07
292
14%
Des
Moi
nes
Are
a38
216
173
358
44
00
325
16%
Wes
tern
Iow
a Te
ch10
445
2512
41
40
010
55%
Iow
a W
este
rn8
072
3413
41
01
914
27%
Sout
hwes
tern
20
3811
35
11
12
643%
Indi
an H
ills
81
6346
234
22
00
149
7%
Sout
heas
tern
70
4715
94
10
01
844%
Tota
l16
916
1,03
243
321
260
2236
261
2,04
310
0%
Perc
ent
8%1%
51%
21%
10%
3%1%
2%0%
3%10
0%S
ou
rc
e: I
owa
Dep
artm
ent o
f Edu
catio
n, B
Div
isio
n of
Com
mun
ity C
olle
ges
and
Wor
kfor
ce P
repa
ratio
n, C
omm
unity
Col
lege
MIS
.
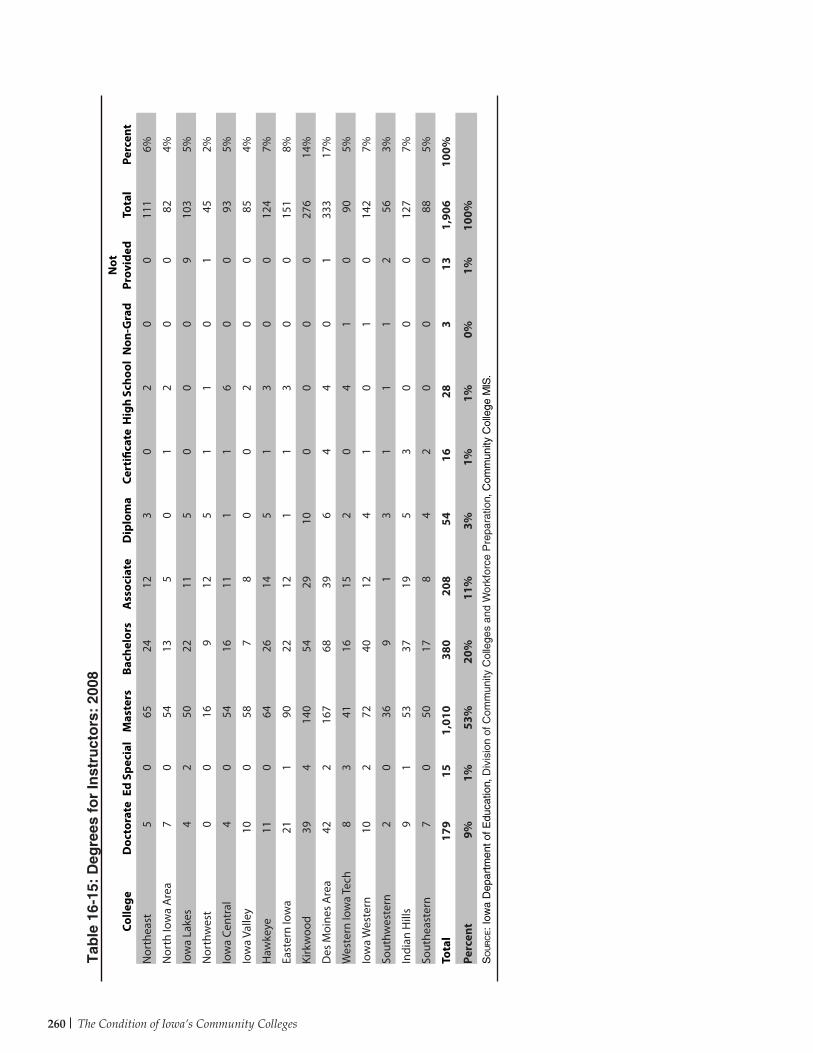
The Condition of Iowa’s Community Colleges260
Colle
geD
octo
rate
Ed S
peci
alM
aste
rsBa
chel
ors
Ass
ocia
teD
iplo
ma
Cert
ifica
teH
igh
Scho
olN
on-G
rad
Not
Pr
ovid
edTo
tal
Perc
ent
Nor
thea
st5
065
2412
30
20
011
16%
Nor
th Io
wa
Are
a7
054
135
01
20
082
4%
Iow
a La
kes
42
5022
115
00
09
103
5%
Nor
thw
est
00
169
125
11
01
452%
Iow
a Ce
ntra
l4
054
1611
11
60
093
5%
Iow
a Va
lley
100
587
80
02
00
854%
Haw
keye
110
6426
145
13
00
124
7%
East
ern
Iow
a21
190
2212
11
30
015
18%
Kirk
woo
d39
414
054
2910
00
00
276
14%
Des
Moi
nes
Are
a42
216
768
396
44
01
333
17%
Wes
tern
Iow
a Te
ch8
341
1615
20
41
090
5%
Iow
a W
este
rn10
272
4012
41
01
014
27%
Sout
hwes
tern
20
369
13
11
12
563%
Indi
an H
ills
91
5337
195
30
00
127
7%
Sout
heas
tern
70
5017
84
20
00
885%
Tota
l17
915
1,01
038
020
854
1628
313
1,90
610
0%
Perc
ent
9%1%
53%
20%
11%
3%1%
1%0%
1%10
0%S
ou
rc
e: I
owa
Dep
artm
ent o
f Edu
catio
n, D
ivis
ion
of C
omm
unity
Col
lege
s an
d W
orkf
orce
Pre
para
tion,
Com
mun
ity C
olle
ge M
IS.
Tab
le 1
6-15
: D
egre
es f
or
Inst
ruct
ors
: 20
08
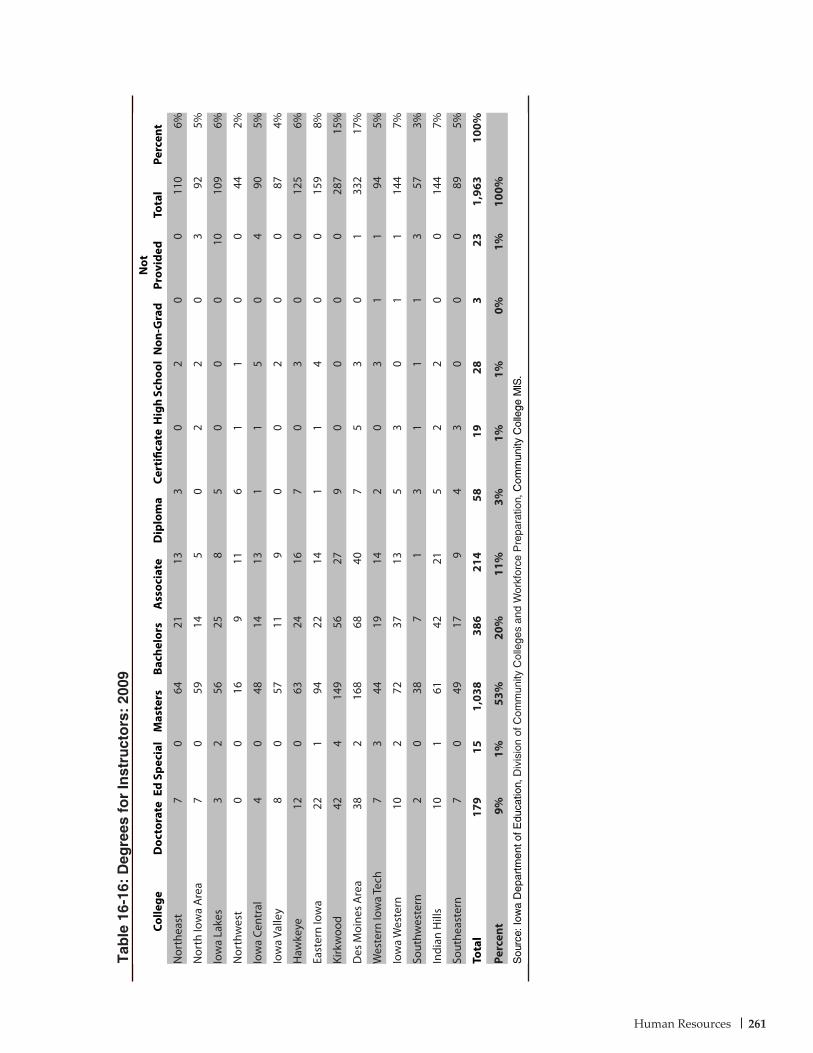
261Human Resources
Tab
le 1
6-16
: D
egre
es f
or
Inst
ruct
ors
: 20
09
Colle
geD
octo
rate
Ed S
peci
alM
aste
rsBa
chel
ors
Ass
ocia
teD
iplo
ma
Cert
ifica
teH
igh
Scho
olN
on-G
rad
Not
Pr
ovid
edTo
tal
Perc
ent
Nor
thea
st7
064
2113
30
20
011
06%
Nor
th Io
wa
Are
a7
059
145
02
20
392
5%
Iow
a La
kes
32
5625
85
00
010
109
6%
Nor
thw
est
00
169
116
11
00
442%
Iow
a Ce
ntra
l4
048
1413
11
50
490
5%
Iow
a Va
lley
80
5711
90
02
00
874%
Haw
keye
120
6324
167
03
00
125
6%
East
ern
Iow
a22
194
2214
11
40
015
98%
Kirk
woo
d42
414
956
279
00
00
287
15%
Des
Moi
nes
Are
a38
216
868
407
53
01
332
17%
Wes
tern
Iow
a Te
ch7
344
1914
20
31
194
5%
Iow
a W
este
rn10
272
3713
53
01
114
47%
Sout
hwes
tern
20
387
13
11
13
573%
Indi
an H
ills
101
6142
215
22
00
144
7%
Sout
heas
tern
70
4917
94
30
00
895%
Tota
l17
915
1,03
838
621
458
1928
323
1,96
310
0%
Perc
ent
9%1%
53%
20%
11%
3%1%
1%0%
1%10
0%S
ourc
e: Io
wa
Dep
artm
ent o
f Edu
catio
n, D
ivis
ion
of C
omm
unity
Col
lege
s an
d W
orkf
orce
Pre
para
tion,
Com
mun
ity C
olle
ge M
IS.
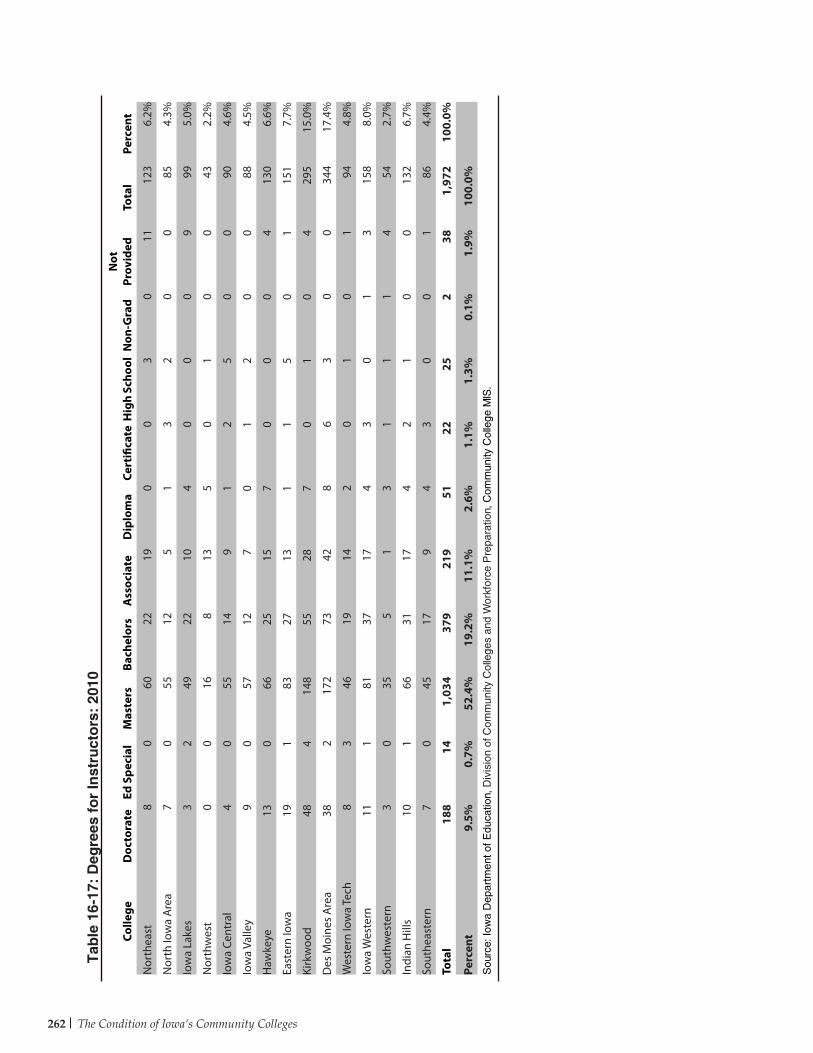
The Condition of Iowa’s Community Colleges262
Tab
le 1
6-17
: D
egre
es f
or
Inst
ruct
ors
: 20
10
Colle
geD
octo
rate
Ed S
peci
alM
aste
rsBa
chel
ors
Ass
ocia
teD
iplo
ma
Cert
ifica
teH
igh
Scho
olN
on-G
rad
Not
Pr
ovid
edTo
tal
Perc
ent
Nor
thea
st8
060
2219
00
30
1112
36.
2%
Nor
th Io
wa
Are
a7
055
125
13
20
085
4.3%
Iow
a La
kes
32
4922
104
00
09
995.
0%
Nor
thw
est
00
168
135
01
00
432.
2%
Iow
a Ce
ntra
l4
055
149
12
50
090
4.6%
Iow
a Va
lley
90
5712
70
12
00
884.
5%
Haw
keye
130
6625
157
00
04
130
6.6%
East
ern
Iow
a19
183
2713
11
50
115
17.
7%
Kirk
woo
d48
414
855
287
01
04
295
15.0
%
Des
Moi
nes
Are
a38
217
273
428
63
00
344
17.4
%
Wes
tern
Iow
a Te
ch8
346
1914
20
10
194
4.8%
Iow
a W
este
rn11
181
3717
43
01
315
88.
0%
Sout
hwes
tern
30
355
13
11
14
542.
7%
Indi
an H
ills
101
6631
174
21
00
132
6.7%
Sout
heas
tern
70
4517
94
30
01
864.
4%
Tota
l18
814
1,03
437
921
951
2225
238
1,97
210
0.0%
Perc
ent
9.5%
0.7%
52.4
%19
.2%
11.1
%2.
6%1.
1%1.
3%0.
1%1.
9%10
0.0%
Sou
rce:
Iow
a D
epar
tmen
t of E
duca
tion,
Div
isio
n of
Com
mun
ity C
olle
ges
and
Wor
kfor
ce P
repa
ratio
n, C
omm
unity
Col
lege
MIS
.
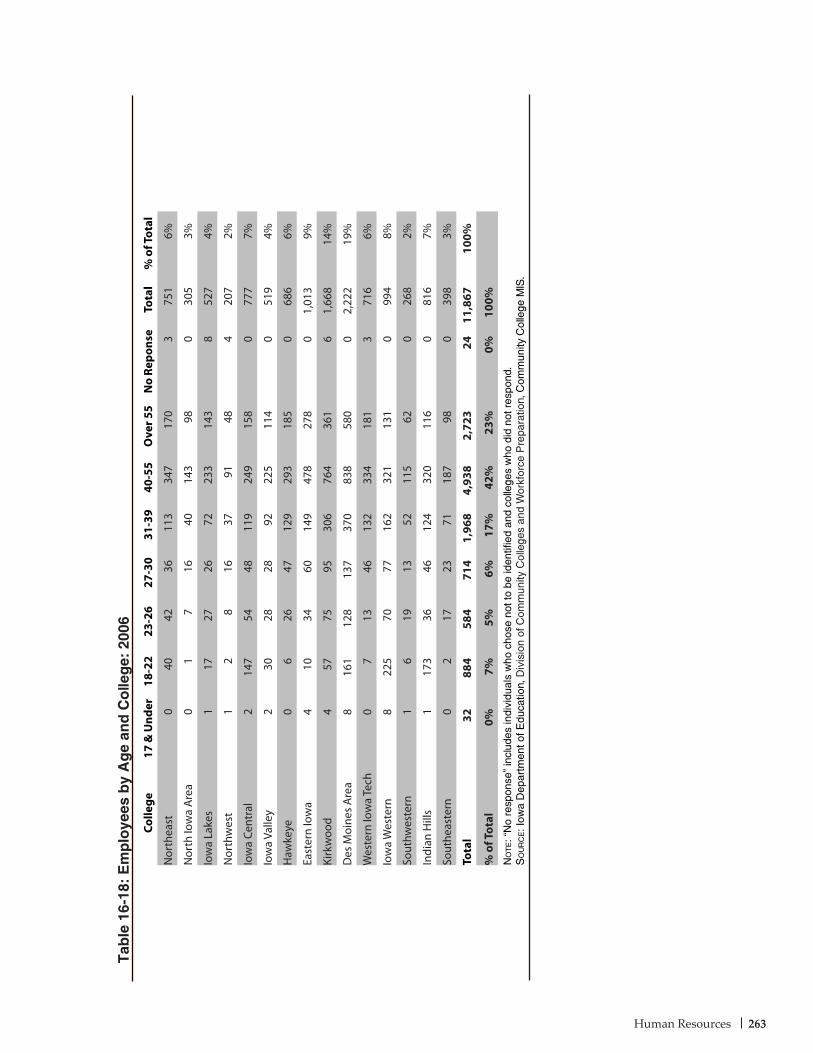
263Human Resources
Tab
le 1
6-18
: E
mp
loye
es b
y A
ge
and
Co
lleg
e: 2
006
Colle
ge17
& U
nder
18-2
223
-26
27-3
031
-39
40-5
5O
ver 5
5N
o Re
pons
eTo
tal
% o
f Tot
al
Nor
thea
st0
4042
3611
334
717
03
751
6%
Nor
th Io
wa
Are
a0
17
1640
143
980
305
3%
Iow
a La
kes
117
2726
7223
314
38
527
4%
Nor
thw
est
12
816
3791
484
207
2%
Iow
a Ce
ntra
l2
147
5448
119
249
158
077
77%
Iow
a Va
lley
230
2828
9222
511
40
519
4%
Haw
keye
06
2647
129
293
185
068
66%
East
ern
Iow
a4
1034
6014
947
827
80
1,01
39%
Kirk
woo
d4
5775
9530
676
436
16
1,66
814
%
Des
Moi
nes
Are
a8
161
128
137
370
838
580
02,
222
19%
Wes
tern
Iow
a Te
ch0
713
4613
233
418
13
716
6%
Iow
a W
este
rn8
225
7077
162
321
131
099
48%
Sout
hwes
tern
16
1913
5211
562
026
82%
Indi
an H
ills
117
336
4612
432
011
60
816
7%
Sout
heas
tern
02
1723
7118
798
039
83%
Tota
l32
884
584
714
1,96
84,
938
2,72
324
11,8
6710
0%
% o
f Tot
al0%
7%5%
6%17
%42
%23
%0%
100%
No
te: “
No
resp
onse
” in
clud
es in
divi
dual
s w
ho c
hose
not
to b
e id
entif
ied
and
colle
ges
who
did
not
res
pond
. S
ou
rc
e: I
owa
Dep
artm
ent o
f Edu
catio
n, D
ivis
ion
of C
omm
unity
Col
lege
s an
d W
orkf
orce
Pre
para
tion,
Com
mun
ity C
olle
ge M
IS.
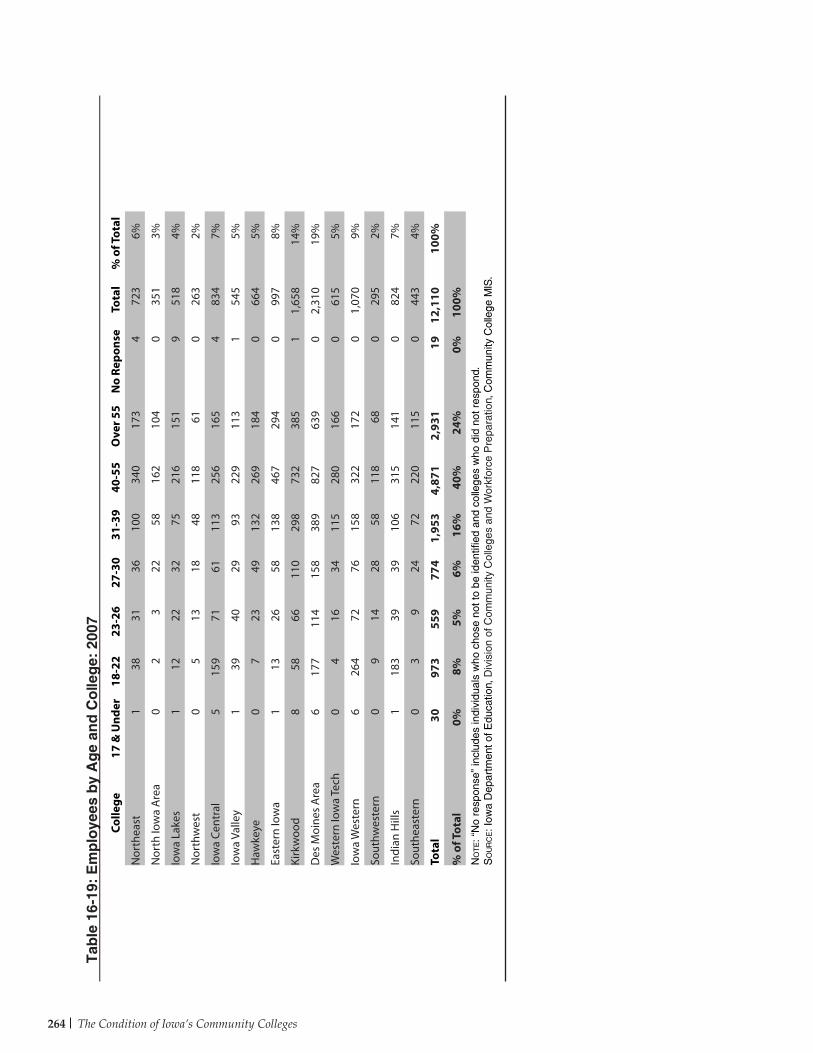
The Condition of Iowa’s Community Colleges264
Colle
ge17
& U
nder
18-2
223
-26
27-3
031
-39
40-5
5O
ver 5
5N
o Re
pons
eTo
tal
% o
f Tot
al
Nor
thea
st1
3831
3610
034
017
34
723
6%
Nor
th Io
wa
Are
a0
23
2258
162
104
035
13%
Iow
a La
kes
112
2232
7521
615
19
518
4%
Nor
thw
est
05
1318
4811
861
026
32%
Iow
a Ce
ntra
l5
159
7161
113
256
165
483
47%
Iow
a Va
lley
139
4029
9322
911
31
545
5%
Haw
keye
07
2349
132
269
184
066
45%
East
ern
Iow
a1
1326
5813
846
729
40
997
8%
Kirk
woo
d8
5866
110
298
732
385
11,
658
14%
Des
Moi
nes
Are
a6
177
114
158
389
827
639
02,
310
19%
Wes
tern
Iow
a Te
ch0
416
3411
528
016
60
615
5%
Iow
a W
este
rn6
264
7276
158
322
172
01,
070
9%
Sout
hwes
tern
09
1428
5811
868
029
52%
Indi
an H
ills
118
339
3910
631
514
10
824
7%
Sout
heas
tern
03
924
7222
011
50
443
4%
Tota
l30
973
559
774
1,95
34,
871
2,93
119
12,1
1010
0%
% o
f Tot
al0%
8%5%
6%16
%40
%24
%0%
100%
No
te: “
No
resp
onse
” in
clud
es in
divi
dual
s w
ho c
hose
not
to b
e id
entif
ied
and
colle
ges
who
did
not
res
pond
. S
ou
rc
e: I
owa
Dep
artm
ent o
f Edu
catio
n, D
ivis
ion
of C
omm
unity
Col
lege
s an
d W
orkf
orce
Pre
para
tion,
Com
mun
ity C
olle
ge M
IS.
Tab
le 1
6-19
: E
mp
loye
es b
y A
ge
and
Co
lleg
e: 2
007
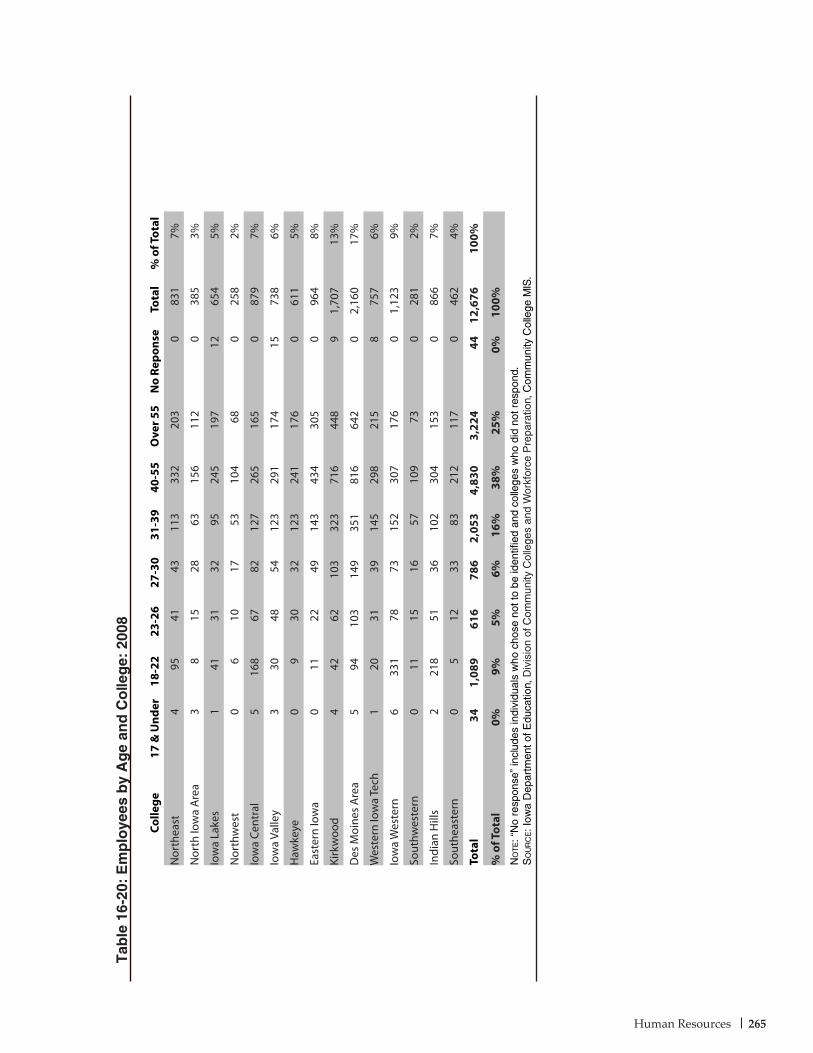
265Human Resources
Tab
le 1
6-20
: E
mp
loye
es b
y A
ge
and
Co
lleg
e: 2
008
Colle
ge17
& U
nder
18-2
223
-26
27-3
031
-39
40-5
5O
ver 5
5N
o Re
pons
eTo
tal
% o
f Tot
al
Nor
thea
st4
9541
4311
333
220
30
831
7%
Nor
th Io
wa
Are
a3
815
2863
156
112
038
53%
Iow
a La
kes
141
3132
9524
519
712
654
5%
Nor
thw
est
06
1017
5310
468
025
82%
Iow
a Ce
ntra
l5
168
6782
127
265
165
087
97%
Iow
a Va
lley
330
4854
123
291
174
1573
86%
Haw
keye
09
3032
123
241
176
061
15%
East
ern
Iow
a0
1122
4914
343
430
50
964
8%
Kirk
woo
d4
4262
103
323
716
448
91,
707
13%
Des
Moi
nes
Are
a5
9410
314
935
181
664
20
2,16
017
%
Wes
tern
Iow
a Te
ch1
2031
3914
529
821
58
757
6%
Iow
a W
este
rn6
331
7873
152
307
176
01,
123
9%
Sout
hwes
tern
011
1516
5710
973
028
12%
Indi
an H
ills
221
851
3610
230
415
30
866
7%
Sout
heas
tern
05
1233
8321
211
70
462
4%
Tota
l34
1,08
961
678
62,
053
4,83
03,
224
4412
,676
100%
% o
f Tot
al0%
9%5%
6%16
%38
%25
%0%
100%
No
te: “
No
resp
onse
” in
clud
es in
divi
dual
s w
ho c
hose
not
to b
e id
entif
ied
and
colle
ges
who
did
not
res
pond
. S
ou
rc
e: I
owa
Dep
artm
ent o
f Edu
catio
n, D
ivis
ion
of C
omm
unity
Col
lege
s an
d W
orkf
orce
Pre
para
tion,
Com
mun
ity C
olle
ge M
IS.
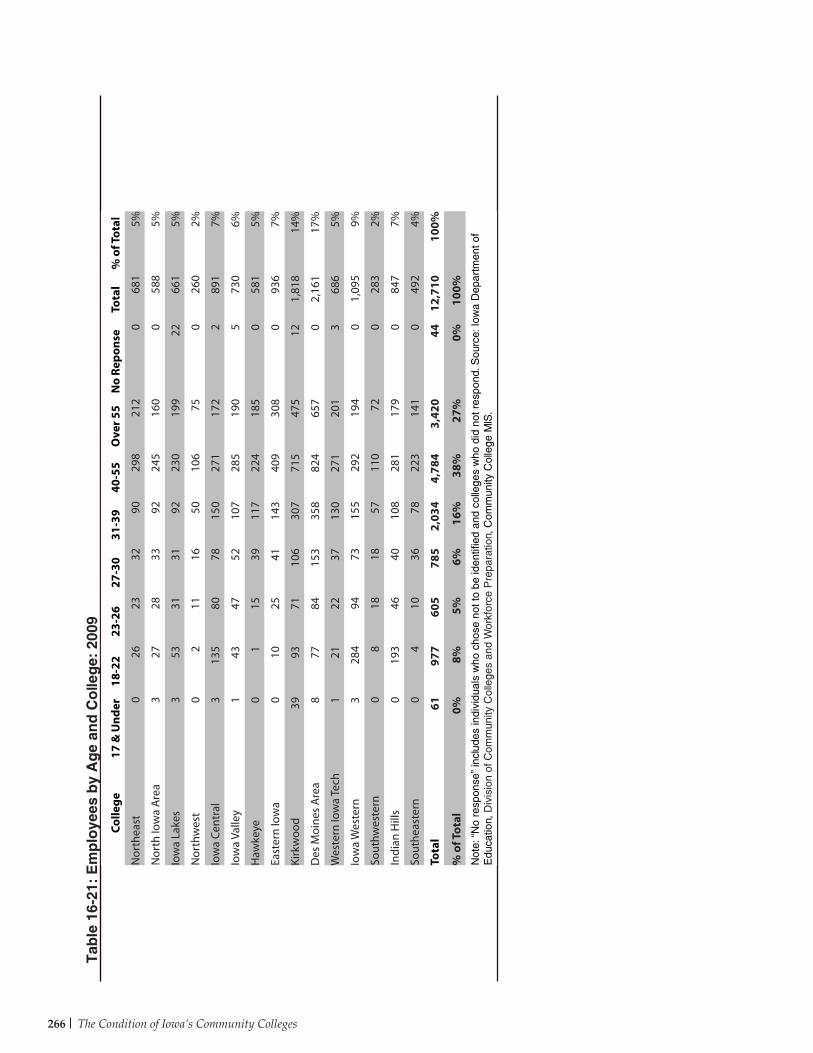
The Condition of Iowa’s Community Colleges266
Tab
le 1
6-21
: E
mp
loye
es b
y A
ge
and
Co
lleg
e: 2
009
Colle
ge17
& U
nder
18-2
223
-26
27-3
031
-39
40-5
5O
ver 5
5N
o Re
pons
eTo
tal
% o
f Tot
al
Nor
thea
st0
2623
3290
298
212
068
15%
Nor
th Io
wa
Are
a3
2728
3392
245
160
058
85%
Iow
a La
kes
353
3131
9223
019
922
661
5%
Nor
thw
est
02
1116
5010
675
026
02%
Iow
a Ce
ntra
l3
135
8078
150
271
172
289
17%
Iow
a Va
lley
143
4752
107
285
190
573
06%
Haw
keye
01
1539
117
224
185
058
15%
East
ern
Iow
a0
1025
4114
340
930
80
936
7%
Kirk
woo
d39
9371
106
307
715
475
121,
818
14%
Des
Moi
nes
Are
a8
7784
153
358
824
657
02,
161
17%
Wes
tern
Iow
a Te
ch1
2122
3713
027
120
13
686
5%
Iow
a W
este
rn3
284
9473
155
292
194
01,
095
9%
Sout
hwes
tern
08
1818
5711
072
028
32%
Indi
an H
ills
019
346
4010
828
117
90
847
7%
Sout
heas
tern
04
1036
7822
314
10
492
4%
Tota
l61
977
605
785
2,03
44,
784
3,42
044
12,7
1010
0%
% o
f Tot
al0%
8%5%
6%16
%38
%27
%0%
100%
Not
e: “
No
resp
onse
” in
clud
es in
divi
dual
s w
ho c
hose
not
to b
e id
entif
ied
and
colle
ges
who
did
not
res
pond
. Sou
rce:
Iow
a D
epar
tmen
t of
Edu
catio
n, D
ivis
ion
of C
omm
unity
Col
lege
s an
d W
orkf
orce
Pre
para
tion,
Com
mun
ity C
olle
ge M
IS.
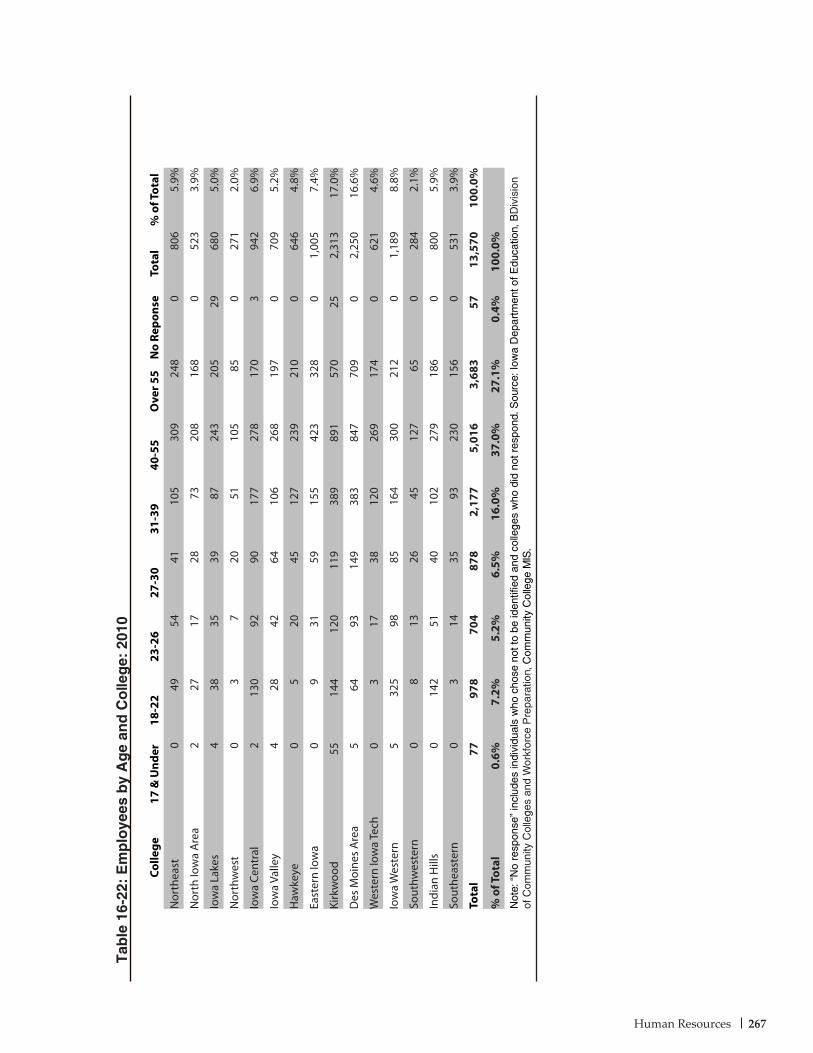
267Human Resources
Tab
le 1
6-22
: E
mp
loye
es b
y A
ge
and
Co
lleg
e: 2
010
Colle
ge17
& U
nder
18-2
223
-26
27-3
031
-39
40-5
5O
ver 5
5N
o Re
pons
eTo
tal
% o
f Tot
al
Nor
thea
st0
4954
4110
530
924
80
806
5.9%
Nor
th Io
wa
Are
a2
2717
2873
208
168
052
33.
9%
Iow
a La
kes
438
3539
8724
320
529
680
5.0%
Nor
thw
est
03
720
5110
585
027
12.
0%
Iow
a Ce
ntra
l2
130
9290
177
278
170
394
26.
9%
Iow
a Va
lley
428
4264
106
268
197
070
95.
2%
Haw
keye
05
2045
127
239
210
064
64.
8%
East
ern
Iow
a0
931
5915
542
332
80
1,00
57.
4%
Kirk
woo
d55
144
120
119
389
891
570
252,
313
17.0
%
Des
Moi
nes
Are
a5
6493
149
383
847
709
02,
250
16.6
%
Wes
tern
Iow
a Te
ch0
317
3812
026
917
40
621
4.6%
Iow
a W
este
rn5
325
9885
164
300
212
01,
189
8.8%
Sout
hwes
tern
08
1326
4512
765
028
42.
1%
Indi
an H
ills
014
251
4010
227
918
60
800
5.9%
Sout
heas
tern
03
1435
9323
015
60
531
3.9%
Tota
l77
978
704
878
2,17
75,
016
3,68
357
13,5
7010
0.0%
% o
f Tot
al0.
6%7.
2%5.
2%6.
5%16
.0%
37.0
%27
.1%
0.4%
100.
0%N
ote:
“N
o re
spon
se”
incl
udes
indi
vidu
als
who
cho
se n
ot to
be
iden
tifie
d an
d co
llege
s w
ho d
id n
ot r
espo
nd. S
ourc
e: Io
wa
Dep
artm
ent o
f Edu
catio
n, B
Div
isio
n of
Com
mun
ity C
olle
ges
and
Wor
kfor
ce P
repa
ratio
n, C
omm
unity
Col
lege
MIS
.
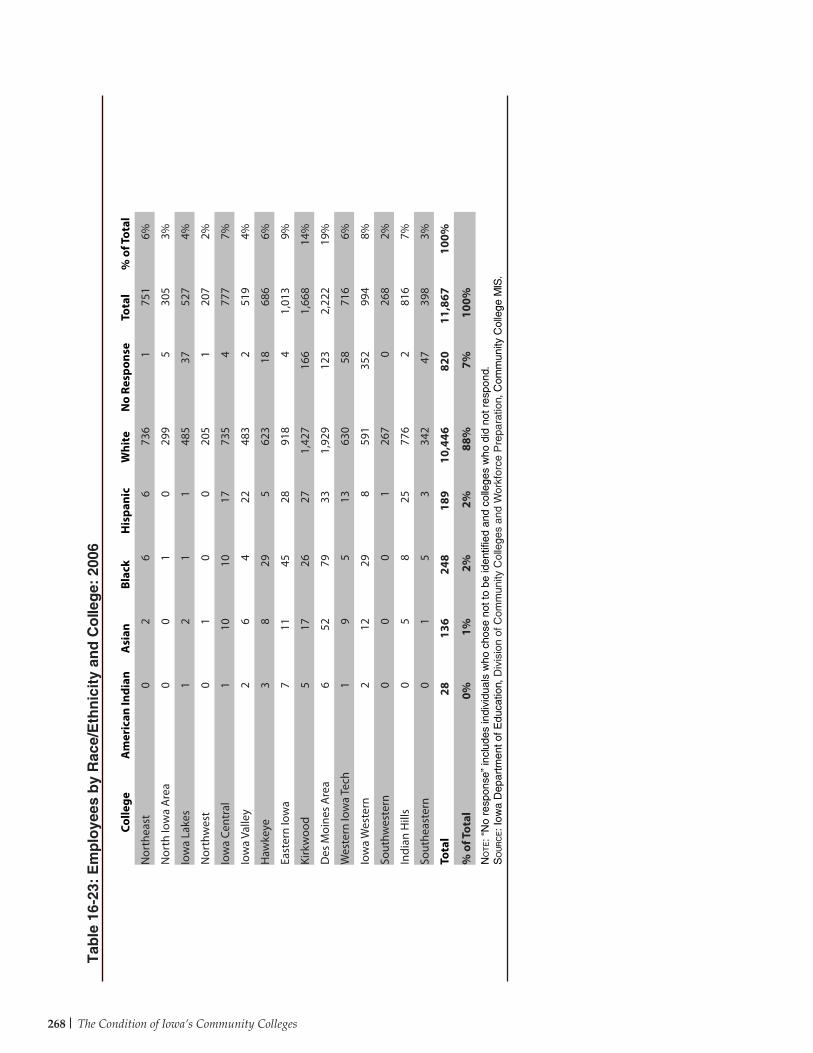
The Condition of Iowa’s Community Colleges268
Colle
geA
mer
ican
Indi
anA
sian
Blac
kH
ispa
nic
Whi
teN
o Re
spon
seTo
tal
% o
f Tot
al
Nor
thea
st0
26
673
61
751
6%
Nor
th Io
wa
Are
a0
01
029
95
305
3%
Iow
a La
kes
12
11
485
3752
74%
Nor
thw
est
01
00
205
120
72%
Iow
a Ce
ntra
l1
1010
1773
54
777
7%
Iow
a Va
lley
26
422
483
251
94%
Haw
keye
38
295
623
1868
66%
East
ern
Iow
a7
1145
2891
84
1,01
39%
Kirk
woo
d5
1726
271,
427
166
1,66
814
%
Des
Moi
nes
Are
a6
5279
331,
929
123
2,22
219
%
Wes
tern
Iow
a Te
ch1
95
1363
058
716
6%
Iow
a W
este
rn2
1229
859
135
299
48%
Sout
hwes
tern
00
01
267
026
82%
Indi
an H
ills
05
825
776
281
67%
Sout
heas
tern
01
53
342
4739
83%
Tota
l28
136
248
189
10,4
4682
011
,867
100%
% o
f Tot
al0%
1%2%
2%88
%7%
100%
No
te: “
No
resp
onse
” in
clud
es in
divi
dual
s w
ho c
hose
not
to b
e id
entif
ied
and
colle
ges
who
did
not
res
pond
. S
ou
rc
e: I
owa
Dep
artm
ent o
f Edu
catio
n, D
ivis
ion
of C
omm
unity
Col
lege
s an
d W
orkf
orce
Pre
para
tion,
Com
mun
ity C
olle
ge M
IS.
Tab
le 1
6-23
: E
mp
loye
es b
y R
ace/
Eth
nic
ity
and
Co
lleg
e: 2
006
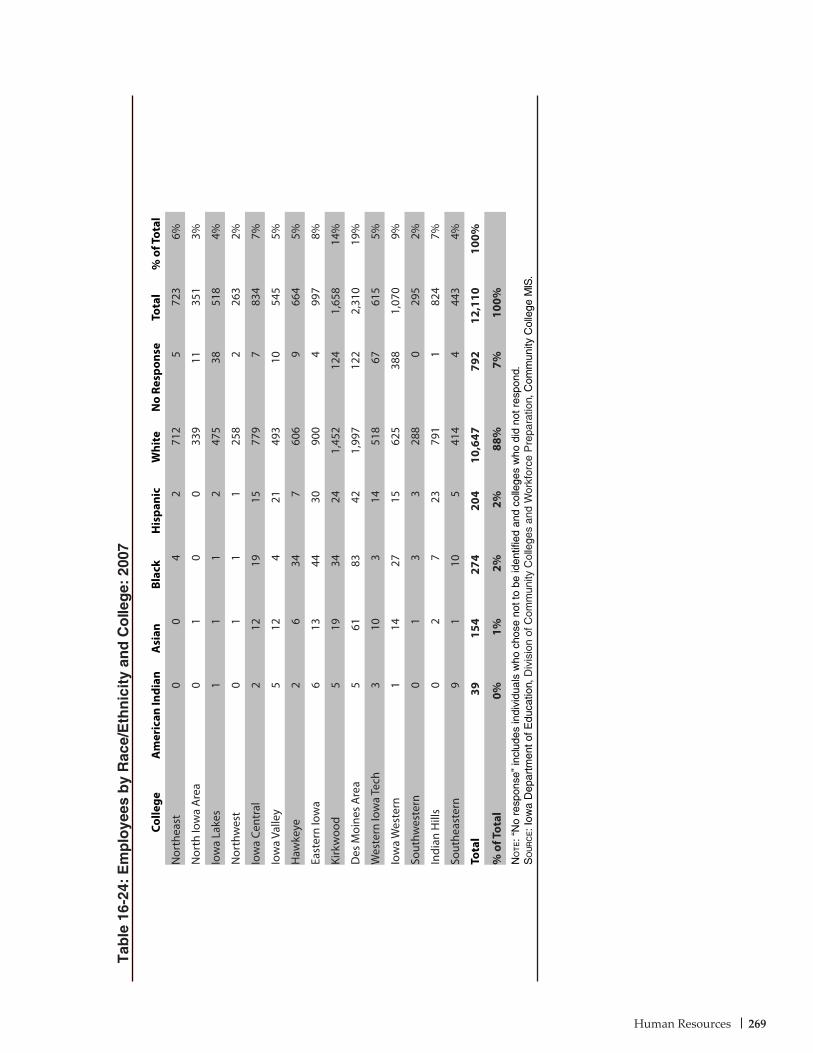
269Human Resources
Tab
le 1
6-24
: E
mp
loye
es b
y R
ace/
Eth
nic
ity
and
Co
lleg
e: 2
007
Colle
geA
mer
ican
Indi
anA
sian
Blac
kH
ispa
nic
Whi
teN
o Re
spon
seTo
tal
% o
f Tot
al
Nor
thea
st0
04
271
25
723
6%
Nor
th Io
wa
Are
a0
10
033
911
351
3%
Iow
a La
kes
11
12
475
3851
84%
Nor
thw
est
01
11
258
226
32%
Iow
a Ce
ntra
l2
1219
1577
97
834
7%
Iow
a Va
lley
512
421
493
1054
55%
Haw
keye
26
347
606
966
45%
East
ern
Iow
a6
1344
3090
04
997
8%
Kirk
woo
d5
1934
241,
452
124
1,65
814
%
Des
Moi
nes
Are
a5
6183
421,
997
122
2,31
019
%
Wes
tern
Iow
a Te
ch3
103
1451
867
615
5%
Iow
a W
este
rn1
1427
1562
538
81,
070
9%
Sout
hwes
tern
01
33
288
029
52%
Indi
an H
ills
02
723
791
182
47%
Sout
heas
tern
91
105
414
444
34%
Tota
l39
154
274
204
10,6
4779
212
,110
100%
% o
f Tot
al0%
1%2%
2%88
%7%
100%
No
te: “
No
resp
onse
” in
clud
es in
divi
dual
s w
ho c
hose
not
to b
e id
entif
ied
and
colle
ges
who
did
not
res
pond
. S
ou
rc
e: I
owa
Dep
artm
ent o
f Edu
catio
n, D
ivis
ion
of C
omm
unity
Col
lege
s an
d W
orkf
orce
Pre
para
tion,
Com
mun
ity C
olle
ge M
IS.

The Condition of Iowa’s Community Colleges270
Colle
geA
mer
ican
Indi
anA
sian
Blac
kH
ispa
nic
Whi
teN
o Re
spon
seTo
tal
% o
f Tot
al
Nor
thea
st0
16
378
140
831
7%
Nor
th Io
wa
Are
a0
03
434
335
385
3%
Iow
a La
kes
10
13
599
5065
45%
Nor
thw
est
02
12
252
125
82%
Iow
a Ce
ntra
l1
1229
1481
211
879
7%
Iow
a Va
lley
37
1125
650
4273
86%
Haw
keye
24
317
565
261
15%
East
ern
Iow
a4
1342
2887
43
964
8%
Kirk
woo
d4
1619
221,
433
213
1,70
713
%
Des
Moi
nes
Are
a4
5770
351,
879
115
2,16
017
%
Wes
tern
Iow
a Te
ch3
113
2061
510
575
76%
Iow
a W
este
rn3
1334
968
937
51,
123
9%
Sout
hwes
tern
01
12
277
028
12%
Indi
an H
ills
03
1024
826
386
67%
Sout
heas
tern
61
106
438
146
24%
Tota
l31
141
271
204
11,0
3399
612
,676
100%
% o
f Tot
al0%
1%2%
2%87
%8%
100%
No
te: “
No
resp
onse
” in
clud
es in
divi
dual
s w
ho c
hose
not
to b
e id
entif
ied
and
colle
ges
who
did
not
res
pond
. S
ou
rc
e: I
owa
Dep
artm
ent o
f Edu
catio
n, D
ivis
ion
of C
omm
unity
Col
lege
s an
d W
orkf
orce
Pre
para
tion,
Com
mun
ity C
olle
ge M
IS.
Tab
le 1
6-25
: E
mp
loye
es b
y R
ace/
Eth
nic
ity
and
Co
lleg
e: 2
008
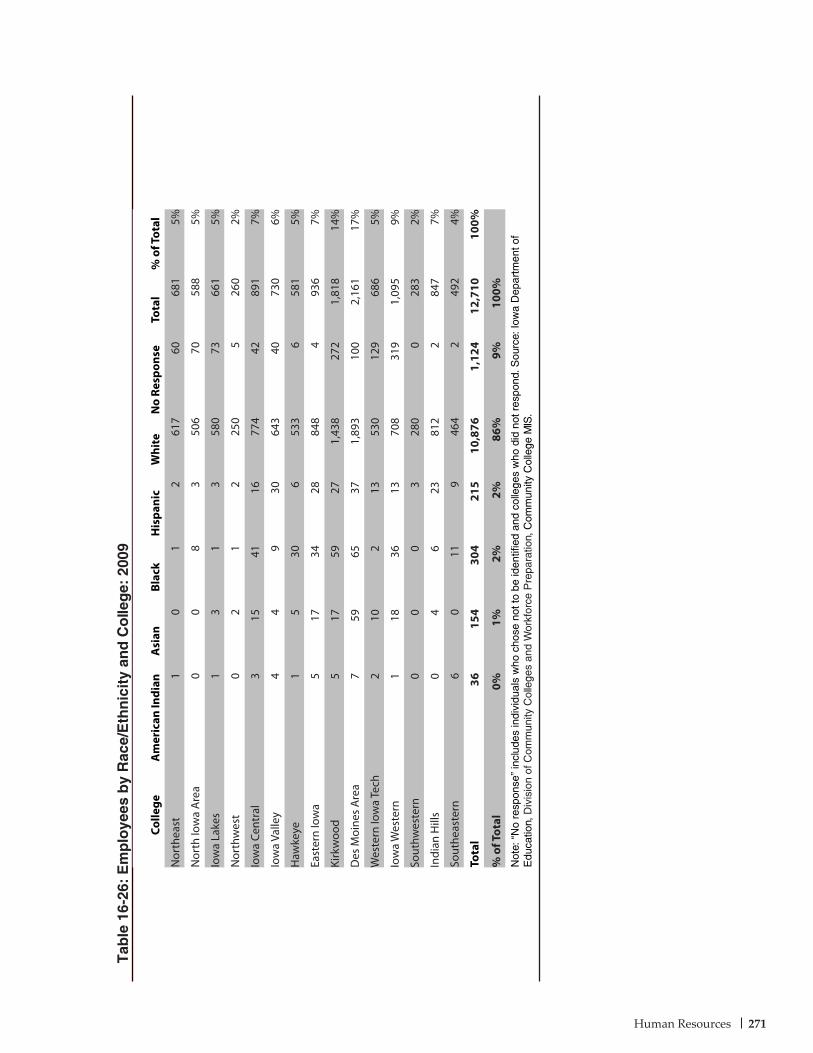
271Human Resources
Tab
le 1
6-26
: E
mp
loye
es b
y R
ace/
Eth
nic
ity
and
Co
lleg
e: 2
009
Colle
geA
mer
ican
Indi
anA
sian
Blac
kH
ispa
nic
Whi
teN
o Re
spon
seTo
tal
% o
f Tot
al
Nor
thea
st1
01
261
760
681
5%
Nor
th Io
wa
Are
a0
08
350
670
588
5%
Iow
a La
kes
13
13
580
7366
15%
Nor
thw
est
02
12
250
526
02%
Iow
a Ce
ntra
l3
1541
1677
442
891
7%
Iow
a Va
lley
44
930
643
4073
06%
Haw
keye
15
306
533
658
15%
East
ern
Iow
a5
1734
2884
84
936
7%
Kirk
woo
d5
1759
271,
438
272
1,81
814
%
Des
Moi
nes
Are
a7
5965
371,
893
100
2,16
117
%
Wes
tern
Iow
a Te
ch2
102
1353
012
968
65%
Iow
a W
este
rn1
1836
1370
831
91,
095
9%
Sout
hwes
tern
00
03
280
028
32%
Indi
an H
ills
04
623
812
284
77%
Sout
heas
tern
60
119
464
249
24%
Tota
l36
154
304
215
10,8
761,
124
12,7
1010
0%
% o
f Tot
al0%
1%2%
2%86
%9%
100%
Not
e: “
No
resp
onse
” in
clud
es in
divi
dual
s w
ho c
hose
not
to b
e id
entif
ied
and
colle
ges
who
did
not
res
pond
. Sou
rce:
Iow
a D
epar
tmen
t of
Edu
catio
n, D
ivis
ion
of C
omm
unity
Col
lege
s an
d W
orkf
orce
Pre
para
tion,
Com
mun
ity C
olle
ge M
IS.
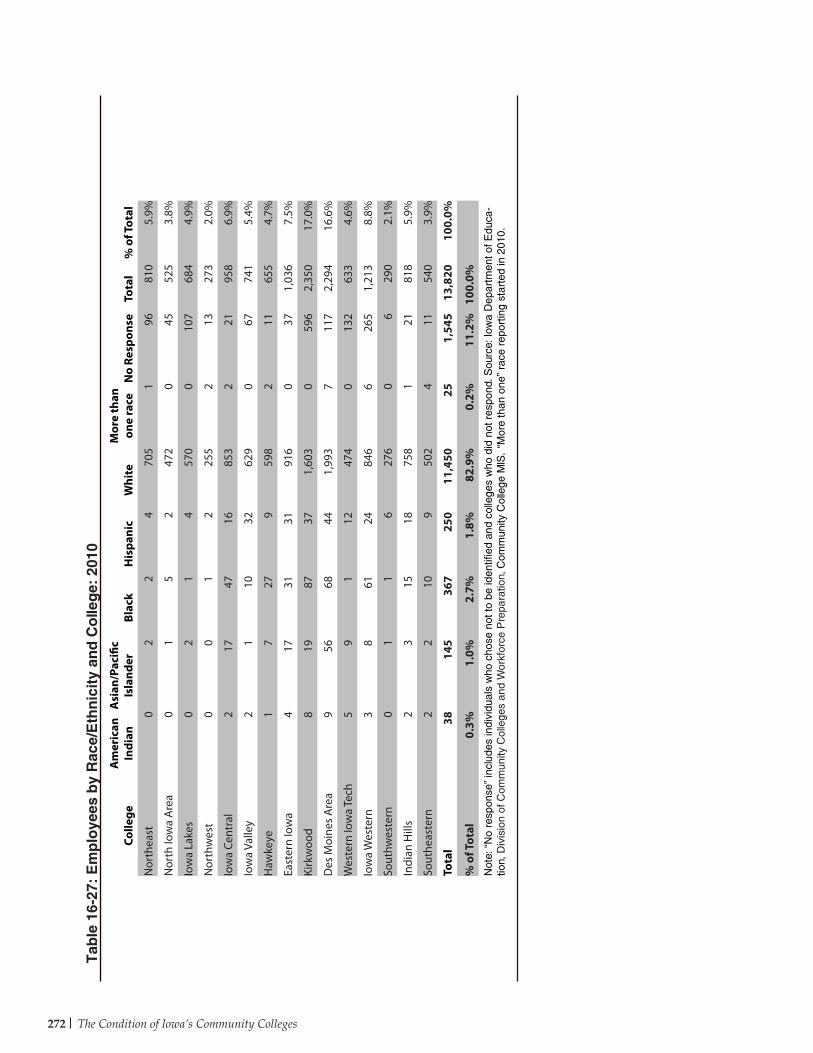
The Condition of Iowa’s Community Colleges272
Tab
le 1
6-27
: E
mp
loye
es b
y R
ace/
Eth
nic
ity
and
Co
lleg
e: 2
010
Colle
geA
mer
ican
In
dian
Asi
an/P
acifi
c Is
land
erBl
ack
His
pani
cW
hite
Mor
e th
an
one
race
No
Resp
onse
Tota
l%
of T
otal
Nor
thea
st0
22
470
51
9681
05.
9%
Nor
th Io
wa
Are
a0
15
247
20
4552
53.
8%
Iow
a La
kes
02
14
570
010
768
44.
9%
Nor
thw
est
00
12
255
213
273
2.0%
Iow
a Ce
ntra
l2
1747
1685
32
2195
86.
9%
Iow
a Va
lley
21
1032
629
067
741
5.4%
Haw
keye
17
279
598
211
655
4.7%
East
ern
Iow
a4
1731
3191
60
371,
036
7.5%
Kirk
woo
d8
1987
371,
603
059
62,
350
17.0
%
Des
Moi
nes
Are
a9
5668
441,
993
711
72,
294
16.6
%
Wes
tern
Iow
a Te
ch5
91
1247
40
132
633
4.6%
Iow
a W
este
rn3
861
2484
66
265
1,21
38.
8%
Sout
hwes
tern
01
16
276
06
290
2.1%
Indi
an H
ills
23
1518
758
121
818
5.9%
Sout
heas
tern
22
109
502
411
540
3.9%
Tota
l38
145
367
250
11,4
5025
1,54
513
,820
100.
0%
% o
f Tot
al0.
3%1.
0%2.
7%1.
8%82
.9%
0.2%
11.2
%10
0.0%
Not
e: “
No
resp
onse
” in
clud
es in
divi
dual
s w
ho c
hose
not
to b
e id
entif
ied
and
colle
ges
who
did
not
res
pond
. Sou
rce:
Iow
a D
epar
tmen
t of E
duca
-tio
n, D
ivis
ion
of C
omm
unity
Col
lege
s an
d W
orkf
orce
Pre
para
tion,
Com
mun
ity C
olle
ge M
IS.
“Mor
e th
an o
ne”
race
rep
ortin
g st
arte
d in
201
0.
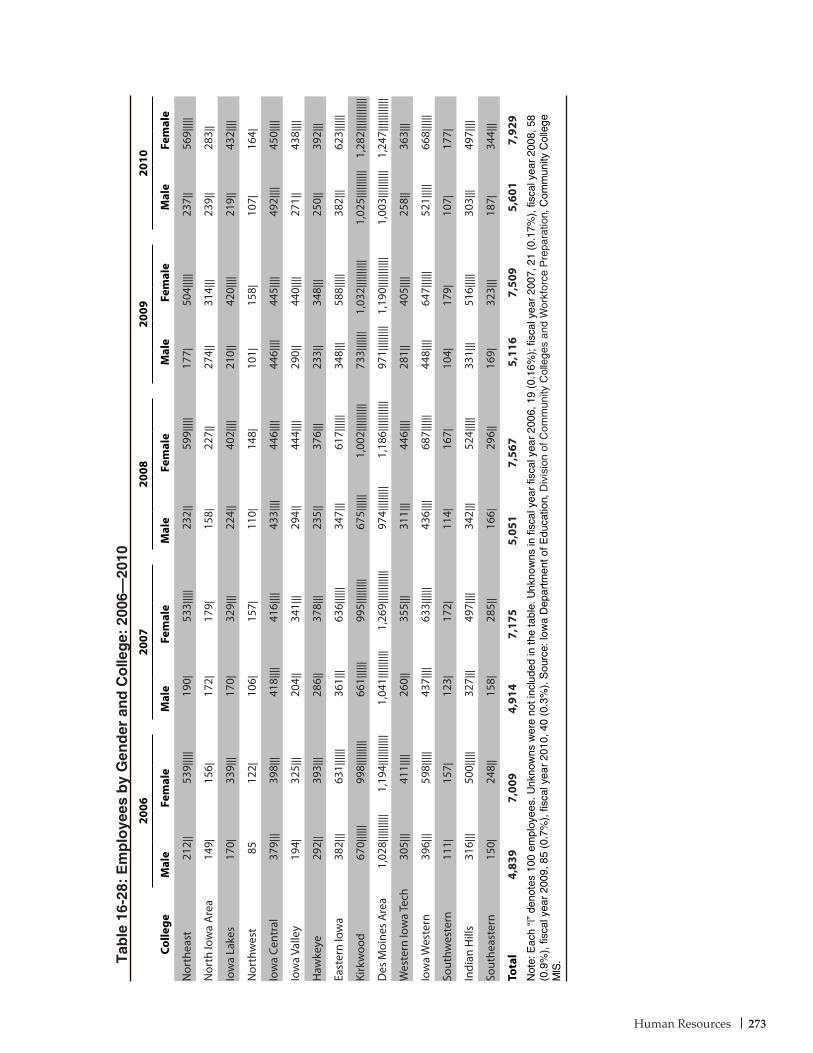
273Human Resources
Tab
le 1
6-28
: E
mp
loye
es b
y G
end
er a
nd
Co
lleg
e: 2
006–
2010
Colle
ge
2006
2007
2008
2009
2010
Mal
eFe
mal
eM
ale
Fem
ale
Mal
eFe
mal
eM
ale
Fem
ale
Mal
eFe
mal
e
Nor
thea
st21
2 ||
539|
||||
190|
533|
||||
232|
|59
9||||
|17
7|50
4||||
|23
7||
569|
||||
Nor
th Io
wa
Are
a14
9|15
6|17
2|17
9|15
8|22
7||
274|
|31
4|||
239|
|28
3||
Iow
a La
kes
170|
339|
||17
0|32
9|||
224|
|40
2||||
210|
|42
0||||
219|
|43
2||||
Nor
thw
est
8512
2|10
6|15
7|11
0|14
8|10
1|15
8|10
7|16
4|
Iow
a Ce
ntra
l37
9|||
398|
||41
8||||
416|
|||43
3||||
446|
|||44
6||||
445|
|||49
2||||
450|
|||
Iow
a Va
lley
194|
325|
||20
4||
341|
||29
4||
444|
|||29
0||
440|
|||27
1||
438|
|||
Haw
keye
292|
|39
3|||
286|
|37
8|||
235|
|37
6|||
233|
|34
8|||
250|
|39
2|||
East
ern
Iow
a38
2|||
631|
|||||
361|
||63
6||||
||34
7|||
617|
|||||
348|
||58
8||||
|38
2|||
623|
|||||
Kirk
woo
d67
0||||
||99
8||||
|||||
661|
|||||
995|
||||||
||67
5||||
||1,
002|
||||||
|||73
3||||
|||1,
032|
||||||
|||1,
025|
||||||
|||1,
282|
||||||
|||||
Des
Moi
nes
Are
a1,
028|
||||||
|||1,
194|
||||||
||||
1,04
1||||
||||||
1,26
9||||
||||||
||97
4||||
|||||
1,18
6||||
||||||
|97
1||||
|||||
1,19
0||||
||||||
|1,
003|
||||||
|||1,
247|
||||||
|||||
Wes
tern
Iow
a Te
ch30
5|||
411|
|||26
0||
355|
||31
1|||
446|
|||28
1||
405|
|||25
8||
363|
||
Iow
a W
este
rn39
6|||
598|
||||
437|
|||63
3||||
||43
6||||
687|
|||||
448|
|||64
7||||
||52
1||||
|66
8||||
||
Sout
hwes
tern
111|
157|
123|
172|
114|
167|
104|
179|
107|
177|
Indi
an H
ills
316|
||50
0||||
|32
7|||
497|
|||34
2|||
524|
||||
331|
||51
6||||
|30
3|||
497|
|||
Sout
heas
tern
150|
248|
|15
8|28
5||
166|
296|
|16
9|32
3|||
187|
344|
||
Tota
l4,
839
7,00
94,
914
7,17
55,
051
7,56
75,
116
7,50
95,
601
7,92
9N
ote:
Eac
h “|
” de
note
s 10
0 em
ploy
ees.
Unk
now
ns w
ere
not i
nclu
ded
in th
e ta
ble.
Unk
now
ns in
fisc
al y
ear
fisca
l yea
r 20
06, 1
9 (0
.16%
); fi
scal
yea
r 20
07, 2
1 (0
.17%
), fi
scal
yea
r 20
08, 5
8 (0
.9%
), fi
scal
yea
r 20
09, 8
5 (0
.7%
), fi
scal
yea
r 20
10, 4
0 (0
.3%
). S
ourc
e: Io
wa
Dep
artm
ent o
f Edu
catio
n, D
ivis
ion
of C
omm
unity
Col
lege
s an
d W
orkf
orce
Pre
para
tion,
Com
mun
ity C
olle
ge
MIS
.

274 The Condition of Iowa’s Community Colleges
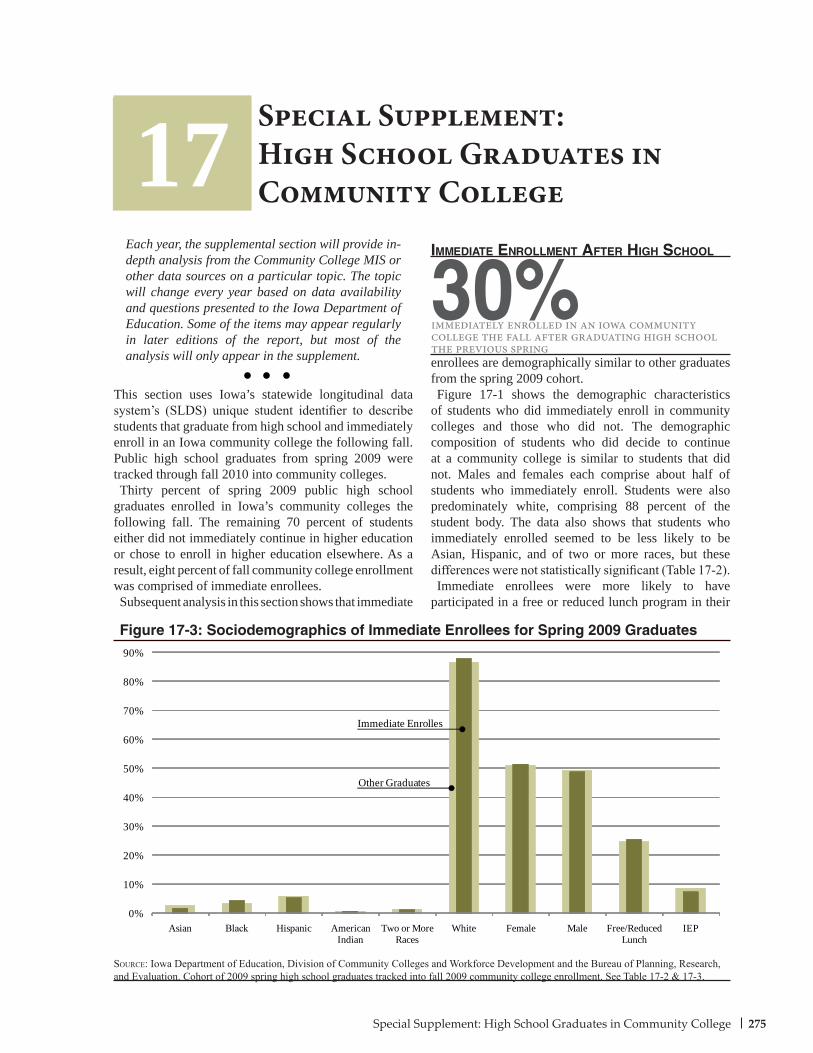
275Special Supplement: High School Graduates in Community College
30%This section uses Iowa’s statewide longitudinal data system’s (SLDS) unique student identifier to describe students that graduate from high school and immediately enroll in an Iowa community college the following fall. Public high school graduates from spring 2009 were tracked through fall 2010 into community colleges.Thirty percent of spring 2009 public high school
graduates enrolled in Iowa’s community colleges the following fall. The remaining 70 percent of students either did not immediately continue in higher education or chose to enroll in higher education elsewhere. As a result, eight percent of fall community college enrollment was comprised of immediate enrollees.Subsequent analysis in this section shows that immediate
enrollees are demographically similar to other graduates from the spring 2009 cohort.Figure 17-1 shows the demographic characteristics
of students who did immediately enroll in community colleges and those who did not. The demographic composition of students who did decide to continue at a community college is similar to students that did not. Males and females each comprise about half of students who immediately enroll. Students were also predominately white, comprising 88 percent of the student body. The data also shows that students who immediately enrolled seemed to be less likely to be Asian, Hispanic, and of two or more races, but these differences were not statistically significant (Table 17-2).Immediate enrollees were more likely to have
participated in a free or reduced lunch program in their
Special Supplement:High School Graduates in Community College17
immeDiate enrollment aFter HigH scHool
immediately enrolled in an iowa community college the fall after graduating high school the previous spring
Each year, the supplemental section will provide in-depth analysis from the Community College MIS or other data sources on a particular topic. The topic will change every year based on data availability and questions presented to the Iowa Department of Education. Some of the items may appear regularly in later editions of the report, but most of the analysis will only appear in the supplement.
Source: Iowa Department of Education, Division of Community Colleges and Workforce Development and the Bureau of Planning, Research, and Evaluation. Cohort of 2009 spring high school graduates tracked into fall 2009 community college enrollment. See Table 17-2 & 17-3.
Figure 17-3: Sociodemographics of Immediate Enrollees for Spring 2009 Graduates
0%
10%
20%
30%
40%
50%
60%
70%
80%
90%
Asian Black Hispanic American Indian
Two or More Races
White Female Male Free/Reduced Lunch
IEP
Immediate Enrolles
Other Graduates
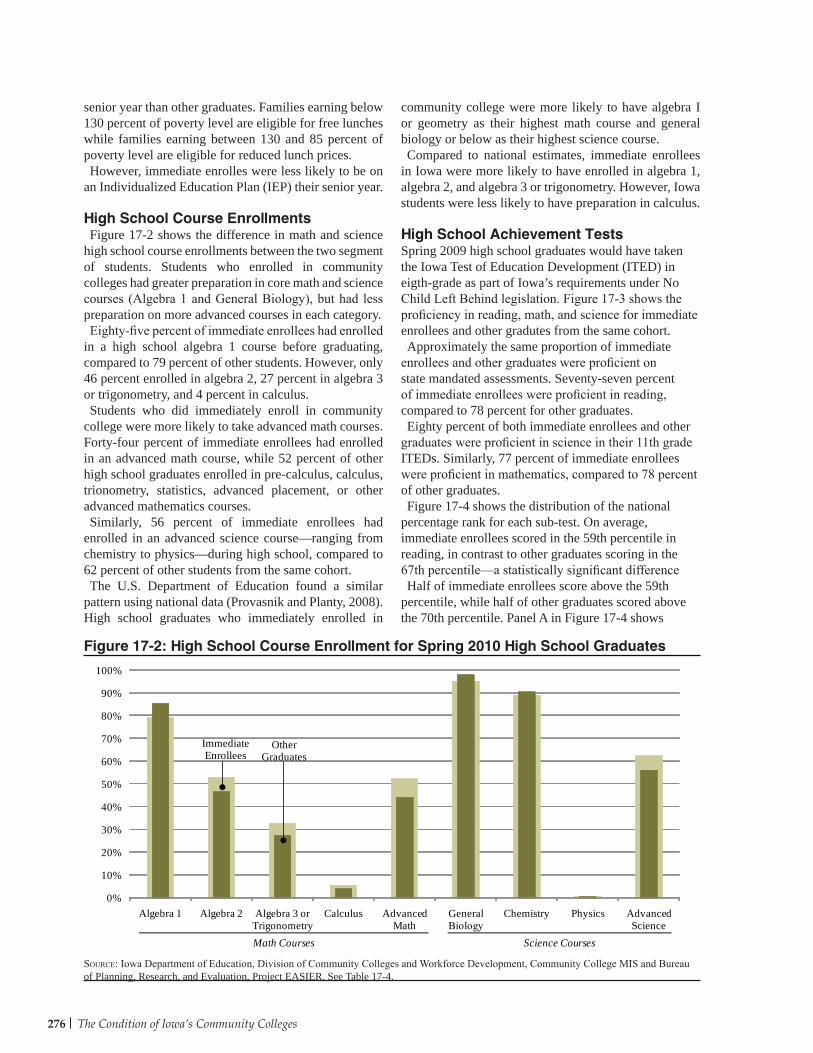
276 The Condition of Iowa’s Community Colleges
senior year than other graduates. Families earning below 130 percent of poverty level are eligible for free lunches while families earning between 130 and 85 percent of poverty level are eligible for reduced lunch prices.However, immediate enrolles were less likely to be on
an Individualized Education Plan (IEP) their senior year.
High School Course EnrollmentsFigure 17-2 shows the difference in math and science
high school course enrollments between the two segment of students. Students who enrolled in community colleges had greater preparation in core math and science courses (Algebra 1 and General Biology), but had less preparation on more advanced courses in each category.Eighty-five percent of immediate enrollees had enrolled
in a high school algebra 1 course before graduating, compared to 79 percent of other students. However, only 46 percent enrolled in algebra 2, 27 percent in algebra 3 or trigonometry, and 4 percent in calculus.Students who did immediately enroll in community
college were more likely to take advanced math courses. Forty-four percent of immediate enrollees had enrolled in an advanced math course, while 52 percent of other high school graduates enrolled in pre-calculus, calculus, trionometry, statistics, advanced placement, or other advanced mathematics courses.Similarly, 56 percent of immediate enrollees had
enrolled in an advanced science course—ranging from chemistry to physics—during high school, compared to 62 percent of other students from the same cohort.The U.S. Department of Education found a similar
pattern using national data (Provasnik and Planty, 2008). High school graduates who immediately enrolled in
community college were more likely to have algebra I or geometry as their highest math course and general biology or below as their highest science course.Compared to national estimates, immediate enrollees
in Iowa were more likely to have enrolled in algebra 1, algebra 2, and algebra 3 or trigonometry. However, Iowa students were less likely to have preparation in calculus.
High School Achievement TestsSpring 2009 high school graduates would have taken the Iowa Test of Education Development (ITED) in eigth-grade as part of Iowa’s requirements under No Child Left Behind legislation. Figure 17-3 shows the proficiency in reading, math, and science for immediate enrollees and other gradutes from the same cohort.Approximately the same proportion of immediate
enrollees and other graduates were proficient on state mandated assessments. Seventy-seven percent of immediate enrollees were proficient in reading, compared to 78 percent for other graduates.Eighty percent of both immediate enrollees and other
graduates were proficient in science in their 11th grade ITEDs. Similarly, 77 percent of immediate enrollees were proficient in mathematics, compared to 78 percent of other graduates.Figure 17-4 shows the distribution of the national
percentage rank for each sub-test. On average, immediate enrollees scored in the 59th percentile in reading, in contrast to other graduates scoring in the 67th percentile—a statistically significant differenceHalf of immediate enrollees score above the 59th
percentile, while half of other graduates scored above the 70th percentile. Panel A in Figure 17-4 shows
Figure 17-2: High School Course Enrollment for Spring 2010 High School Graduates
Source: Iowa Department of Education, Division of Community Colleges and Workforce Development, Community College MIS and Bureau of Planning, Research, and Evaluation, Project EASIER. See Table 17-4.
0%
10%
20%
30%
40%
50%
60%
70%
80%
90%
100%
Algebra 1 Algebra 2 Algebra 3 or Trigonometry
Calculus Advanced Math
General Biology
Chemistry Physics Advanced Science
Math Courses Science Courses
ImmediateEnrollees
OtherGraduates
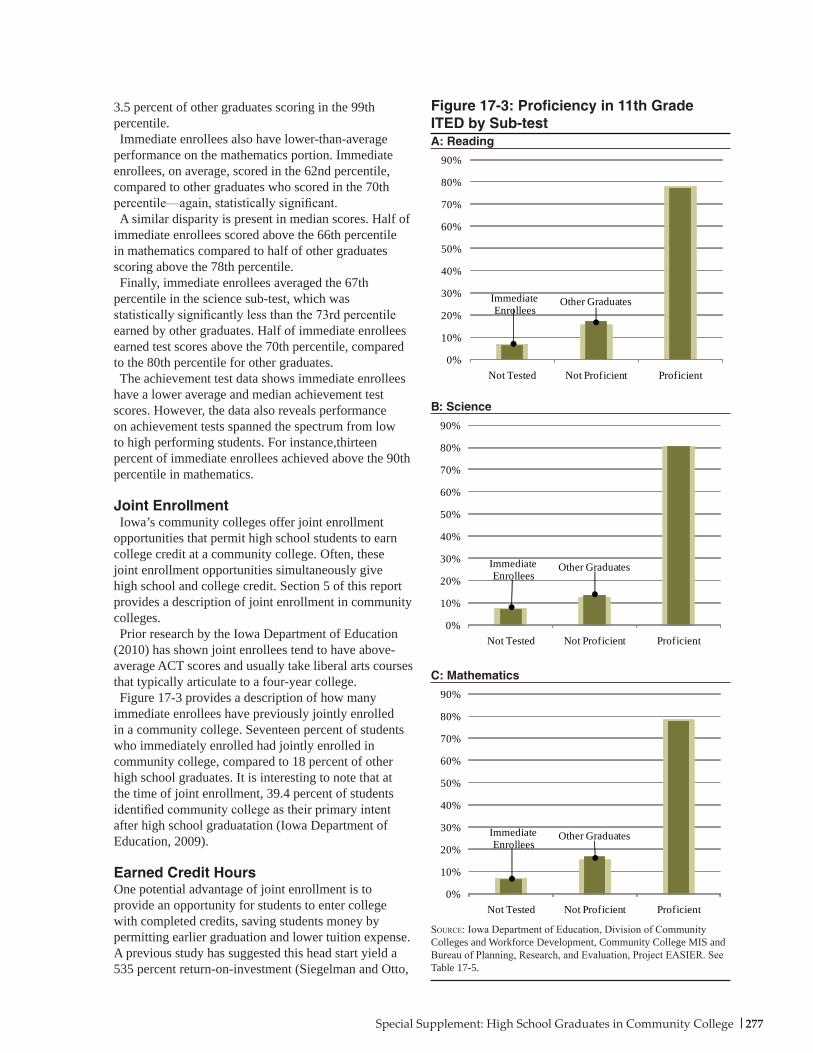
277Special Supplement: High School Graduates in Community College
3.5 percent of other graduates scoring in the 99th percentile.Immediate enrollees also have lower-than-average
performance on the mathematics portion. Immediate enrollees, on average, scored in the 62nd percentile, compared to other graduates who scored in the 70th percentile—again, statistically significant.A similar disparity is present in median scores. Half of
immediate enrollees scored above the 66th percentile in mathematics compared to half of other graduates scoring above the 78th percentile.Finally, immediate enrollees averaged the 67th
percentile in the science sub-test, which was statistically significantly less than the 73rd percentile earned by other graduates. Half of immediate enrollees earned test scores above the 70th percentile, compared to the 80th percentile for other graduates.The achievement test data shows immediate enrollees
have a lower average and median achievement test scores. However, the data also reveals performance on achievement tests spanned the spectrum from low to high performing students. For instance,thirteen percent of immediate enrollees achieved above the 90th percentile in mathematics.
Joint EnrollmentIowa’s community colleges offer joint enrollment
opportunities that permit high school students to earn college credit at a community college. Often, these joint enrollment opportunities simultaneously give high school and college credit. Section 5 of this report provides a description of joint enrollment in community colleges.Prior research by the Iowa Department of Education
(2010) has shown joint enrollees tend to have above-average ACT scores and usually take liberal arts courses that typically articulate to a four-year college. Figure 17-3 provides a description of how many
immediate enrollees have previously jointly enrolled in a community college. Seventeen percent of students who immediately enrolled had jointly enrolled in community college, compared to 18 percent of other high school graduates. It is interesting to note that at the time of joint enrollment, 39.4 percent of students identified community college as their primary intent after high school graduatation (Iowa Department of Education, 2009).
Earned Credit HoursOne potential advantage of joint enrollment is to provide an opportunity for students to enter college with completed credits, saving students money by permitting earlier graduation and lower tuition expense. A previous study has suggested this head start yield a 535 percent return-on-investment (Siegelman and Otto,
Figure 17-3: Proficiency in 11th Grade ITED by Sub-test
Source: Iowa Department of Education, Division of Community Colleges and Workforce Development, Community College MIS and Bureau of Planning, Research, and Evaluation, Project EASIER. See Table 17-5.
0%
10%
20%
30%
40%
50%
60%
70%
80%
90%
Not Tested Not Proficient Proficient
Other GraduatesImmediate Enrollees
A: Reading
B: Science
0%
10%
20%
30%
40%
50%
60%
70%
80%
90%
Not Tested Not Proficient Proficient
Other GraduatesImmediate Enrollees
C: Mathematics
0%
10%
20%
30%
40%
50%
60%
70%
80%
90%
Not Tested Not Proficient Proficient
Other GraduatesImmediate Enrollees
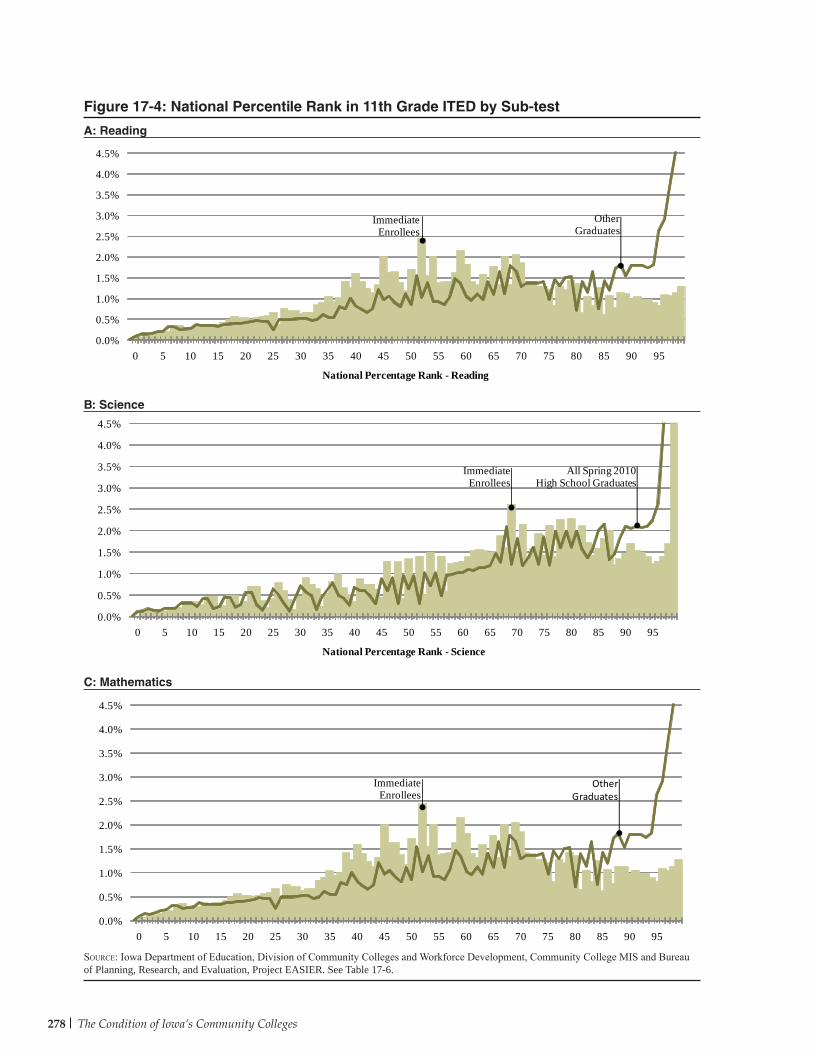
278 The Condition of Iowa’s Community Colleges
Figure 17-4: National Percentile Rank in 11th Grade ITED by Sub-test
Source: Iowa Department of Education, Division of Community Colleges and Workforce Development, Community College MIS and Bureau of Planning, Research, and Evaluation, Project EASIER. See Table 17-6.
0.0%
0.5%
1.0%
1.5%
2.0%
2.5%
3.0%
3.5%
4.0%
4.5%
0 5 10 15 20 25 30 35 40 45 50 55 60 65 70 75 80 85 90 95
OtherGraduates
ImmediateEnrollees
0.0%
0.5%
1.0%
1.5%
2.0%
2.5%
3.0%
3.5%
4.0%
4.5%
0 5 10 15 20 25 30 35 40 45 50 55 60 65 70 75 80 85 90 95
National Percentage Rank - Reading
OtherGraduates
ImmediateEnrollees
0.0%
0.5%
1.0%
1.5%
2.0%
2.5%
3.0%
3.5%
4.0%
4.5%
0 5 10 15 20 25 30 35 40 45 50 55 60 65 70 75 80 85 90 95
National Percentage Rank - Science
All Spring 2010High School Graduates
ImmediateEnrollees
A: Reading
B: Science
C: Mathematics
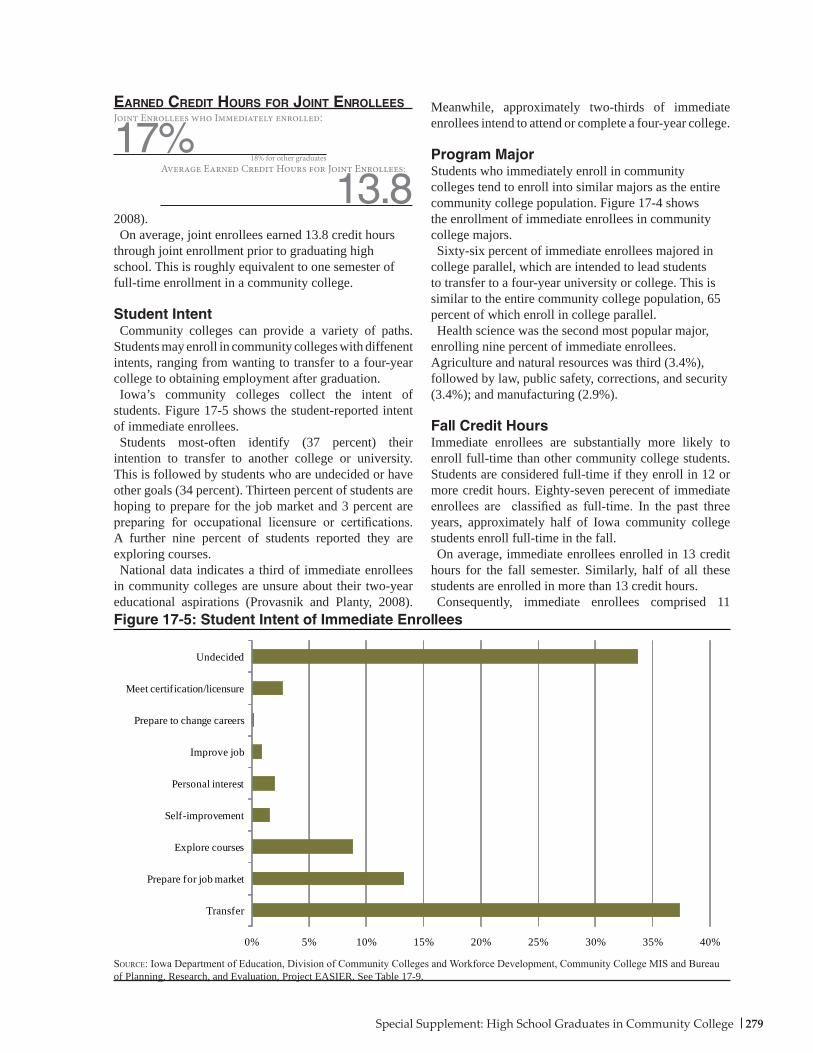
279Special Supplement: High School Graduates in Community College
2008).On average, joint enrollees earned 13.8 credit hours
through joint enrollment prior to graduating high school. This is roughly equivalent to one semester of full-time enrollment in a community college.
Student IntentCommunity colleges can provide a variety of paths.
Students may enroll in community colleges with diffenent intents, ranging from wanting to transfer to a four-year college to obtaining employment after graduation.Iowa’s community colleges collect the intent of
students. Figure 17-5 shows the student-reported intent of immediate enrollees.Students most-often identify (37 percent) their
intention to transfer to another college or university. This is followed by students who are undecided or have other goals (34 percent). Thirteen percent of students are hoping to prepare for the job market and 3 percent are preparing for occupational licensure or certifications. A further nine percent of students reported they are exploring courses.National data indicates a third of immediate enrollees
in community colleges are unsure about their two-year educational aspirations (Provasnik and Planty, 2008).
Meanwhile, approximately two-thirds of immediate enrollees intend to attend or complete a four-year college.
Program MajorStudents who immediately enroll in community colleges tend to enroll into similar majors as the entire community college population. Figure 17-4 shows the enrollment of immediate enrollees in community college majors.Sixty-six percent of immediate enrollees majored in
college parallel, which are intended to lead students to transfer to a four-year university or college. This is similar to the entire community college population, 65 percent of which enroll in college parallel.Health science was the second most popular major,
enrolling nine percent of immediate enrollees. Agriculture and natural resources was third (3.4%), followed by law, public safety, corrections, and security (3.4%); and manufacturing (2.9%).
Fall Credit HoursImmediate enrollees are substantially more likely to enroll full-time than other community college students. Students are considered full-time if they enroll in 12 or more credit hours. Eighty-seven perecent of immediate enrollees are classified as full-time. In the past three years, approximately half of Iowa community college students enroll full-time in the fall.On average, immediate enrollees enrolled in 13 credit
hours for the fall semester. Similarly, half of all these students are enrolled in more than 13 credit hours.Consequently, immediate enrollees comprised 11
Figure 17-5: Student Intent of Immediate Enrollees
Source: Iowa Department of Education, Division of Community Colleges and Workforce Development, Community College MIS and Bureau of Planning, Research, and Evaluation, Project EASIER. See Table 17-9.
earneD creDit Hours For joint enrollees
0% 5% 10% 15% 20% 25% 30% 35% 40%
Transfer
Prepare for job market
Explore courses
Self-improvement
Personal interest
Improve job
Prepare to change careers
Meet certification/licensure
Undecided
Joint Enrollees who Immediately enrolled:
17%18% for other graduates
Average Earned Credit Hours for Joint Enrollees:
13.8
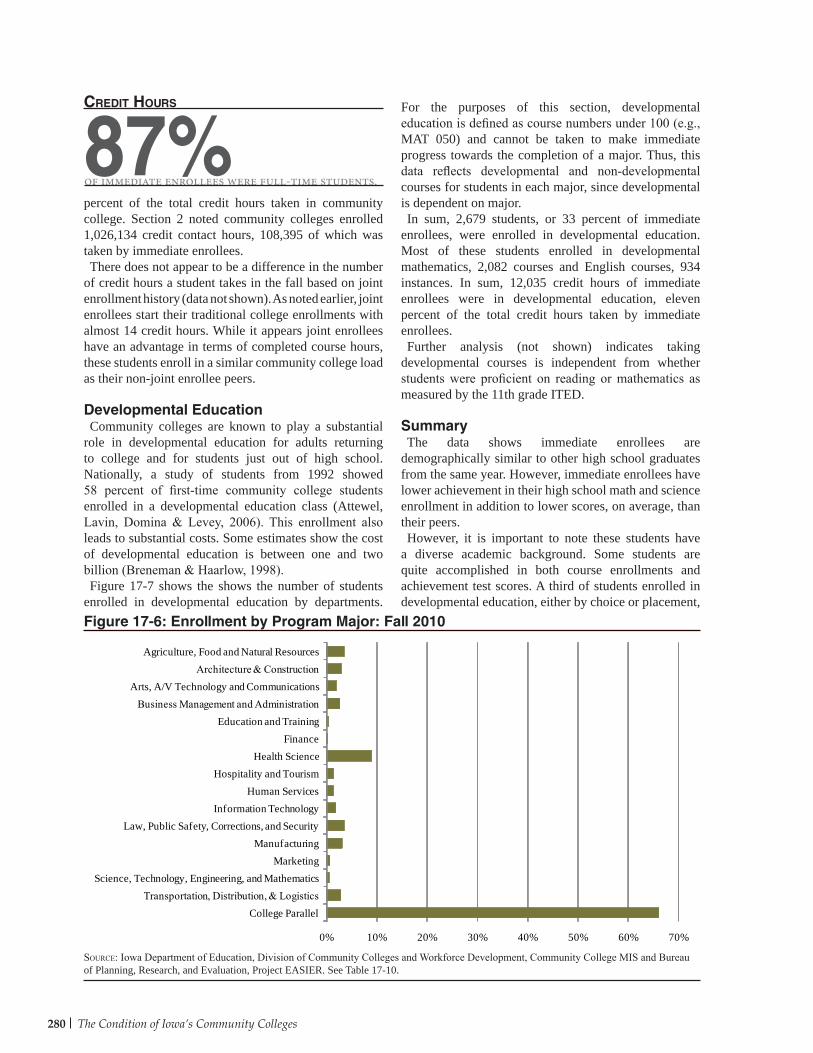
280 The Condition of Iowa’s Community Colleges
percent of the total credit hours taken in community college. Section 2 noted community colleges enrolled 1,026,134 credit contact hours, 108,395 of which was taken by immediate enrollees.There does not appear to be a difference in the number
of credit hours a student takes in the fall based on joint enrollment history (data not shown). As noted earlier, joint enrollees start their traditional college enrollments with almost 14 credit hours. While it appears joint enrollees have an advantage in terms of completed course hours, these students enroll in a similar community college load as their non-joint enrollee peers.
Developmental EducationCommunity colleges are known to play a substantial
role in developmental education for adults returning to college and for students just out of high school. Nationally, a study of students from 1992 showed 58 percent of first-time community college students enrolled in a developmental education class (Attewel, Lavin, Domina & Levey, 2006). This enrollment also leads to substantial costs. Some estimates show the cost of developmental education is between one and two billion (Breneman & Haarlow, 1998).Figure 17-7 shows the shows the number of students
enrolled in developmental education by departments.
For the purposes of this section, developmental education is defined as course numbers under 100 (e.g., MAT 050) and cannot be taken to make immediate progress towards the completion of a major. Thus, this data reflects developmental and non-developmental courses for students in each major, since developmental is dependent on major.In sum, 2,679 students, or 33 percent of immediate
enrollees, were enrolled in developmental education. Most of these students enrolled in developmental mathematics, 2,082 courses and English courses, 934 instances. In sum, 12,035 credit hours of immediate enrollees were in developmental education, eleven percent of the total credit hours taken by immediate enrollees.Further analysis (not shown) indicates taking
developmental courses is independent from whether students were proficient on reading or mathematics as measured by the 11th grade ITED.
SummaryThe data shows immediate enrollees are
demographically similar to other high school graduates from the same year. However, immediate enrollees have lower achievement in their high school math and science enrollment in addition to lower scores, on average, than their peers.However, it is important to note these students have
a diverse academic background. Some students are quite accomplished in both course enrollments and achievement test scores. A third of students enrolled in developmental education, either by choice or placement,
Figure 17-6: Enrollment by Program Major: Fall 2010
Source: Iowa Department of Education, Division of Community Colleges and Workforce Development, Community College MIS and Bureau of Planning, Research, and Evaluation, Project EASIER. See Table 17-10.
0% 10% 20% 30% 40% 50% 60% 70%
College ParallelTransportation, Distribution, & Logistics
Science, Technology, Engineering, and MathematicsMarketing
ManufacturingLaw, Public Safety, Corrections, and Security
Information TechnologyHuman Services
Hospitality and TourismHealth Science
FinanceEducation and Training
Business Management and AdministrationArts, A/V Technology and Communications
Architecture & ConstructionAgriculture, Food and Natural Resources
87%creDit Hours
of immediate enrollees were full-time students.
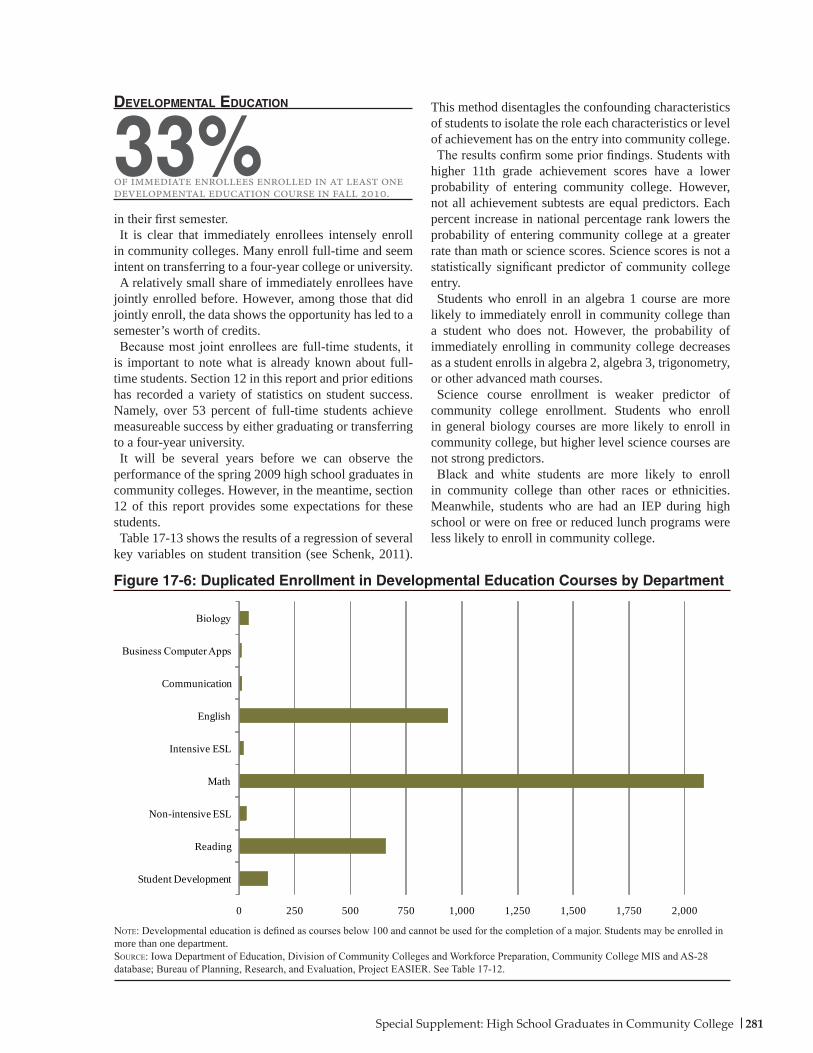
281Special Supplement: High School Graduates in Community College
in their first semester.It is clear that immediately enrollees intensely enroll
in community colleges. Many enroll full-time and seem intent on transferring to a four-year college or university.A relatively small share of immediately enrollees have
jointly enrolled before. However, among those that did jointly enroll, the data shows the opportunity has led to a semester’s worth of credits.Because most joint enrollees are full-time students, it
is important to note what is already known about full-time students. Section 12 in this report and prior editions has recorded a variety of statistics on student success. Namely, over 53 percent of full-time students achieve measureable success by either graduating or transferring to a four-year university.It will be several years before we can observe the
performance of the spring 2009 high school graduates in community colleges. However, in the meantime, section 12 of this report provides some expectations for these students.Table 17-13 shows the results of a regression of several
key variables on student transition (see Schenk, 2011).
This method disentagles the confounding characteristics of students to isolate the role each characteristics or level of achievement has on the entry into community college.The results confirm some prior findings. Students with
higher 11th grade achievement scores have a lower probability of entering community college. However, not all achievement subtests are equal predictors. Each percent increase in national percentage rank lowers the probability of entering community college at a greater rate than math or science scores. Science scores is not a statistically significant predictor of community college entry.Students who enroll in an algebra 1 course are more
likely to immediately enroll in community college than a student who does not. However, the probability of immediately enrolling in community college decreases as a student enrolls in algebra 2, algebra 3, trigonometry, or other advanced math courses.Science course enrollment is weaker predictor of
community college enrollment. Students who enroll in general biology courses are more likely to enroll in community college, but higher level science courses are not strong predictors.Black and white students are more likely to enroll
in community college than other races or ethnicities. Meanwhile, students who are had an IEP during high school or were on free or reduced lunch programs were less likely to enroll in community college.
Figure 17-6: Duplicated Enrollment in Developmental Education Courses by Department
Note: Developmental education is defined as courses below 100 and cannot be used for the completion of a major. Students may be enrolled in more than one department.Source: Iowa Department of Education, Division of Community Colleges and Workforce Preparation, Community College MIS and AS-28 database; Bureau of Planning, Research, and Evaluation, Project EASIER. See Table 17-12.
33%DeveloPmental eDucation
of immediate enrollees enrolled in at least one developmental education course in fall 2010.
0 250 500 750 1,000 1,250 1,500 1,750 2,000
Student Development
Reading
Non-intensive ESL
Math
Intensive ESL
English
Communication
Business Computer Apps
Biology
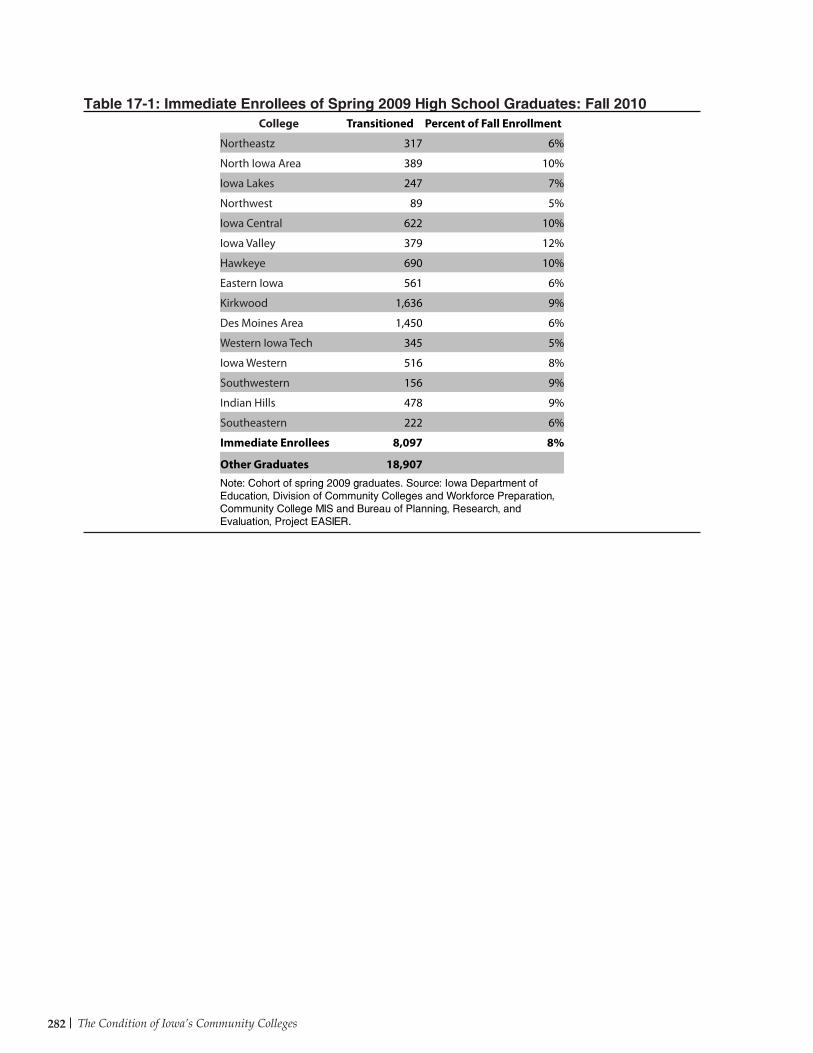
The Condition of Iowa’s Community Colleges282
Table 17-1: Immediate Enrollees of Spring 2009 High School Graduates: Fall 2010College Transitioned Percent of Fall Enrollment
Northeastz 317 6%
North Iowa Area 389 10%
Iowa Lakes 247 7%
Northwest 89 5%
Iowa Central 622 10%
Iowa Valley 379 12%
Hawkeye 690 10%
Eastern Iowa 561 6%
Kirkwood 1,636 9%
Des Moines Area 1,450 6%
Western Iowa Tech 345 5%
Iowa Western 516 8%
Southwestern 156 9%
Indian Hills 478 9%
Southeastern 222 6%
Immediate Enrollees 8,097 8%
Other Graduates 18,907Note: Cohort of spring 2009 graduates. Source: Iowa Department of Education, Division of Community Colleges and Workforce Preparation, Community College MIS and Bureau of Planning, Research, and Evaluation, Project EASIER.
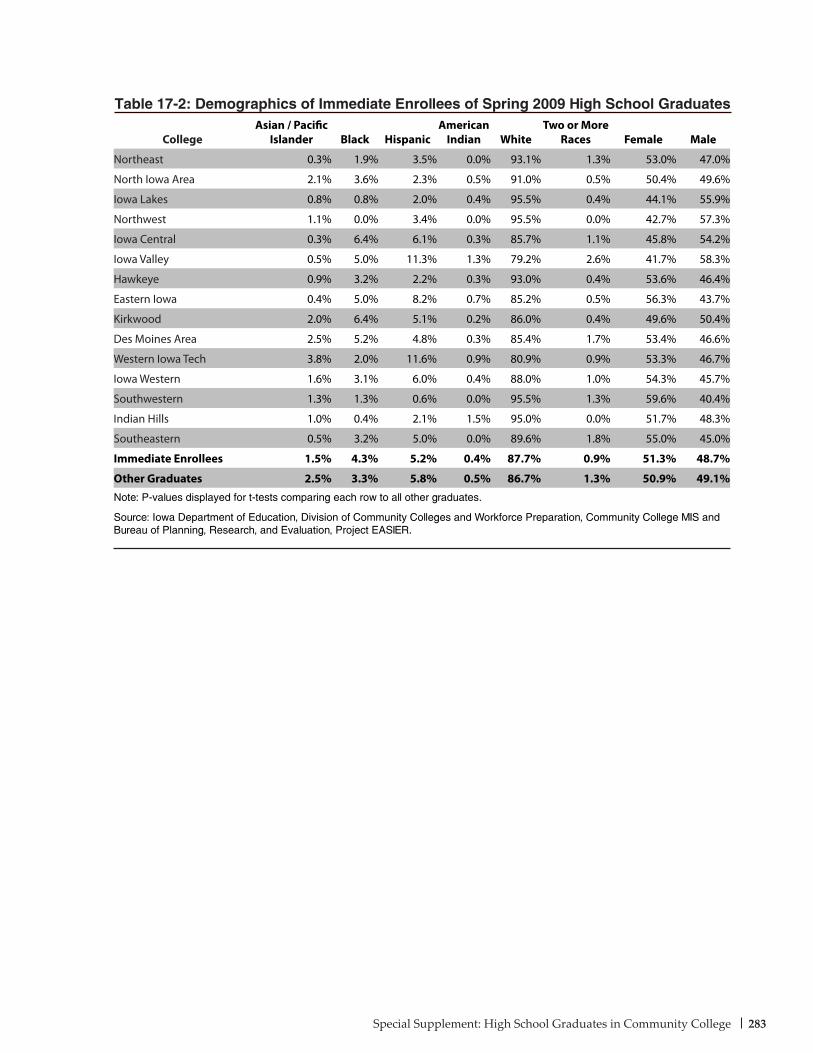
283Special Supplement: High School Graduates in Community College
Table 17-2: Demographics of Immediate Enrollees of Spring 2009 High School Graduates
CollegeAsian / Pacific
Islander Black HispanicAmerican
Indian WhiteTwo or More
Races Female Male
Northeast 0.3% 1.9% 3.5% 0.0% 93.1% 1.3% 53.0% 47.0%
North Iowa Area 2.1% 3.6% 2.3% 0.5% 91.0% 0.5% 50.4% 49.6%
Iowa Lakes 0.8% 0.8% 2.0% 0.4% 95.5% 0.4% 44.1% 55.9%
Northwest 1.1% 0.0% 3.4% 0.0% 95.5% 0.0% 42.7% 57.3%
Iowa Central 0.3% 6.4% 6.1% 0.3% 85.7% 1.1% 45.8% 54.2%
Iowa Valley 0.5% 5.0% 11.3% 1.3% 79.2% 2.6% 41.7% 58.3%
Hawkeye 0.9% 3.2% 2.2% 0.3% 93.0% 0.4% 53.6% 46.4%
Eastern Iowa 0.4% 5.0% 8.2% 0.7% 85.2% 0.5% 56.3% 43.7%
Kirkwood 2.0% 6.4% 5.1% 0.2% 86.0% 0.4% 49.6% 50.4%
Des Moines Area 2.5% 5.2% 4.8% 0.3% 85.4% 1.7% 53.4% 46.6%
Western Iowa Tech 3.8% 2.0% 11.6% 0.9% 80.9% 0.9% 53.3% 46.7%
Iowa Western 1.6% 3.1% 6.0% 0.4% 88.0% 1.0% 54.3% 45.7%
Southwestern 1.3% 1.3% 0.6% 0.0% 95.5% 1.3% 59.6% 40.4%
Indian Hills 1.0% 0.4% 2.1% 1.5% 95.0% 0.0% 51.7% 48.3%
Southeastern 0.5% 3.2% 5.0% 0.0% 89.6% 1.8% 55.0% 45.0%
Immediate Enrollees 1.5% 4.3% 5.2% 0.4% 87.7% 0.9% 51.3% 48.7%
Other Graduates 2.5% 3.3% 5.8% 0.5% 86.7% 1.3% 50.9% 49.1%Note: P-values displayed for t-tests comparing each row to all other graduates.
Source: Iowa Department of Education, Division of Community Colleges and Workforce Preparation, Community College MIS and Bureau of Planning, Research, and Evaluation, Project EASIER.
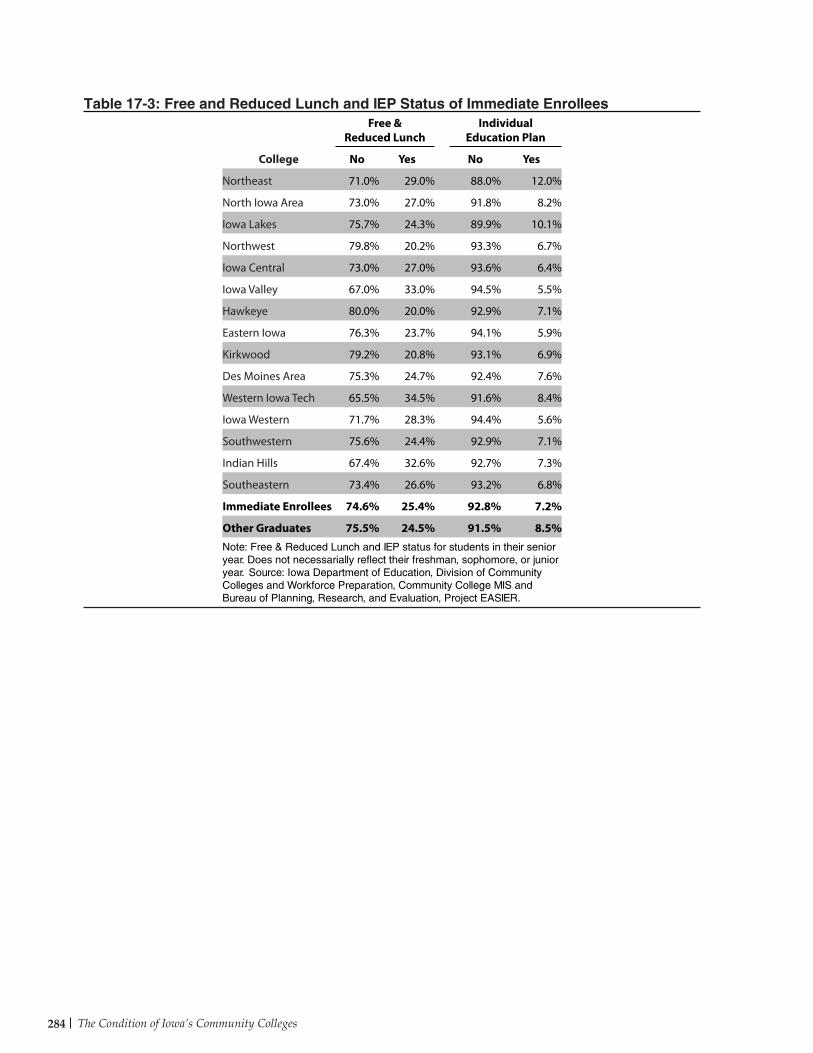
The Condition of Iowa’s Community Colleges284
Table 17-3: Free and Reduced Lunch and IEP Status of Immediate EnrolleesFree &
Reduced LunchIndividual
Education Plan
College No Yes No Yes
Northeast 71.0% 29.0% 88.0% 12.0%
North Iowa Area 73.0% 27.0% 91.8% 8.2%
Iowa Lakes 75.7% 24.3% 89.9% 10.1%
Northwest 79.8% 20.2% 93.3% 6.7%
Iowa Central 73.0% 27.0% 93.6% 6.4%
Iowa Valley 67.0% 33.0% 94.5% 5.5%
Hawkeye 80.0% 20.0% 92.9% 7.1%
Eastern Iowa 76.3% 23.7% 94.1% 5.9%
Kirkwood 79.2% 20.8% 93.1% 6.9%
Des Moines Area 75.3% 24.7% 92.4% 7.6%
Western Iowa Tech 65.5% 34.5% 91.6% 8.4%
Iowa Western 71.7% 28.3% 94.4% 5.6%
Southwestern 75.6% 24.4% 92.9% 7.1%
Indian Hills 67.4% 32.6% 92.7% 7.3%
Southeastern 73.4% 26.6% 93.2% 6.8%
Immediate Enrollees 74.6% 25.4% 92.8% 7.2%
Other Graduates 75.5% 24.5% 91.5% 8.5%Note: Free & Reduced Lunch and IEP status for students in their senior year. Does not necessarially reflect their freshman, sophomore, or junior year. Source: Iowa Department of Education, Division of Community Colleges and Workforce Preparation, Community College MIS and Bureau of Planning, Research, and Evaluation, Project EASIER.
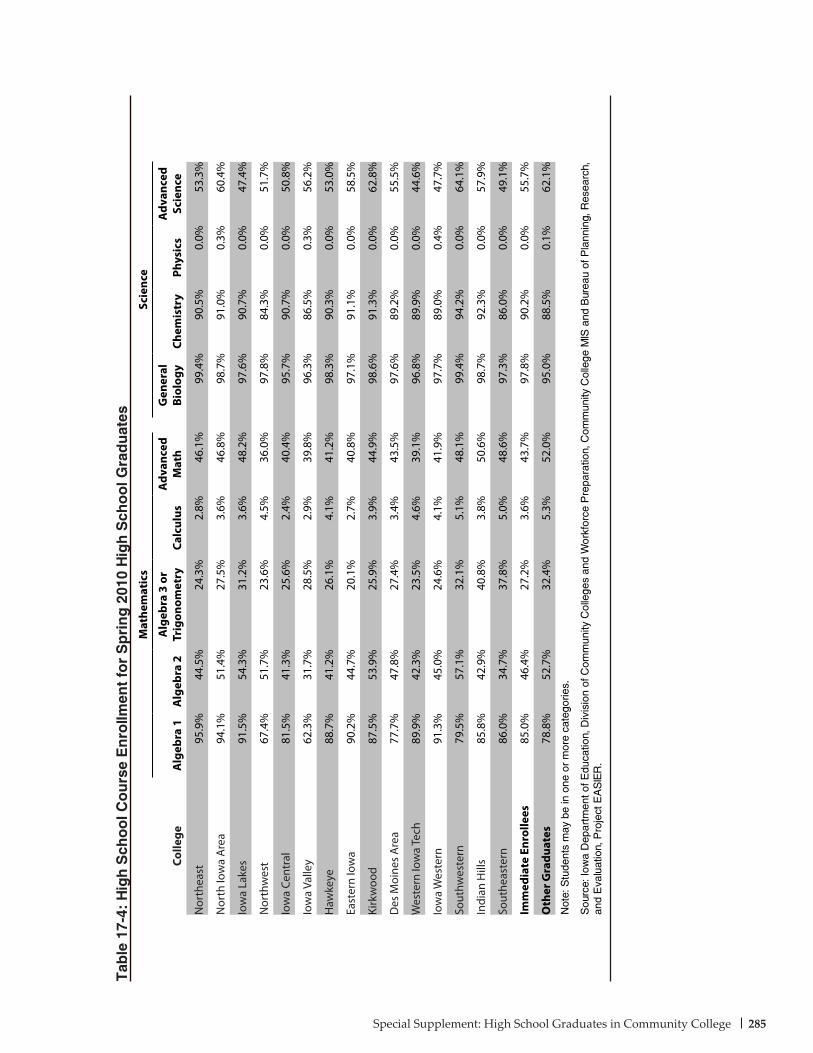
285Special Supplement: High School Graduates in Community College
Colle
ge
Mat
hem
atic
sSc
ienc
e
Alg
ebra
1A
lgeb
ra 2
Alg
ebra
3 o
r Tr
igon
omet
ryCa
lcul
usA
dvan
ced
Mat
hG
ener
al
Biol
ogy
Chem
istr
yPh
ysic
sA
dvan
ced
Scie
nce
Nor
thea
st95
.9%
44.5
%24
.3%
2.8%
46.1
%99
.4%
90.5
%0.
0%53
.3%
Nor
th Io
wa
Are
a94
.1%
51.4
%27
.5%
3.6%
46.8
%98
.7%
91.0
%0.
3%60
.4%
Iow
a La
kes
91.5
%54
.3%
31.2
%3.
6%48
.2%
97.6
%90
.7%
0.0%
47.4
%
Nor
thw
est
67.4
%51
.7%
23.6
%4.
5%36
.0%
97.8
%84
.3%
0.0%
51.7
%
Iow
a Ce
ntra
l81
.5%
41.3
%25
.6%
2.4%
40.4
%95
.7%
90.7
%0.
0%50
.8%
Iow
a Va
lley
62.3
%31
.7%
28.5
%2.
9%39
.8%
96.3
%86
.5%
0.3%
56.2
%
Haw
keye
88.7
%41
.2%
26.1
%4.
1%41
.2%
98.3
%90
.3%
0.0%
53.0
%
East
ern
Iow
a90
.2%
44.7
%20
.1%
2.7%
40.8
%97
.1%
91.1
%0.
0%58
.5%
Kirk
woo
d87
.5%
53.9
%25
.9%
3.9%
44.9
%98
.6%
91.3
%0.
0%62
.8%
Des
Moi
nes
Are
a77
.7%
47.8
%27
.4%
3.4%
43.5
%97
.6%
89.2
%0.
0%55
.5%
Wes
tern
Iow
a Te
ch89
.9%
42.3
%23
.5%
4.6%
39.1
%96
.8%
89.9
%0.
0%44
.6%
Iow
a W
este
rn91
.3%
45.0
%24
.6%
4.1%
41.9
%97
.7%
89.0
%0.
4%47
.7%
Sout
hwes
tern
79.5
%57
.1%
32.1
%5.
1%48
.1%
99.4
%94
.2%
0.0%
64.1
%
Indi
an H
ills
85.8
%42
.9%
40.8
%3.
8%50
.6%
98.7
%92
.3%
0.0%
57.9
%
Sout
heas
tern
86.0
%34
.7%
37.8
%5.
0%48
.6%
97.3
%86
.0%
0.0%
49.1
%
Imm
edia
te E
nrol
lees
85.0
%46
.4%
27.2
%3.
6%43
.7%
97.8
%90
.2%
0.0%
55.7
%
Oth
er G
radu
ates
78.8
%52
.7%
32.4
%5.
3%52
.0%
95.0
%88
.5%
0.1%
62.1
%
Not
e: S
tude
nts
may
be
in o
ne o
r m
ore
cate
gorie
s.
Sou
rce:
Iow
a D
epar
tmen
t of E
duca
tion,
Div
isio
n of
Com
mun
ity C
olle
ges
and
Wor
kfor
ce P
repa
ratio
n, C
omm
unity
Col
lege
MIS
and
Bur
eau
of P
lann
ing,
Res
earc
h,
and
Eva
luat
ion,
Pro
ject
EA
SIE
R.
Tab
le 1
7-4:
Hig
h S
cho
ol C
ou
rse
En
rollm
ent
for
Sp
rin
g 2
010
Hig
h S
cho
ol G
rad
uat
es
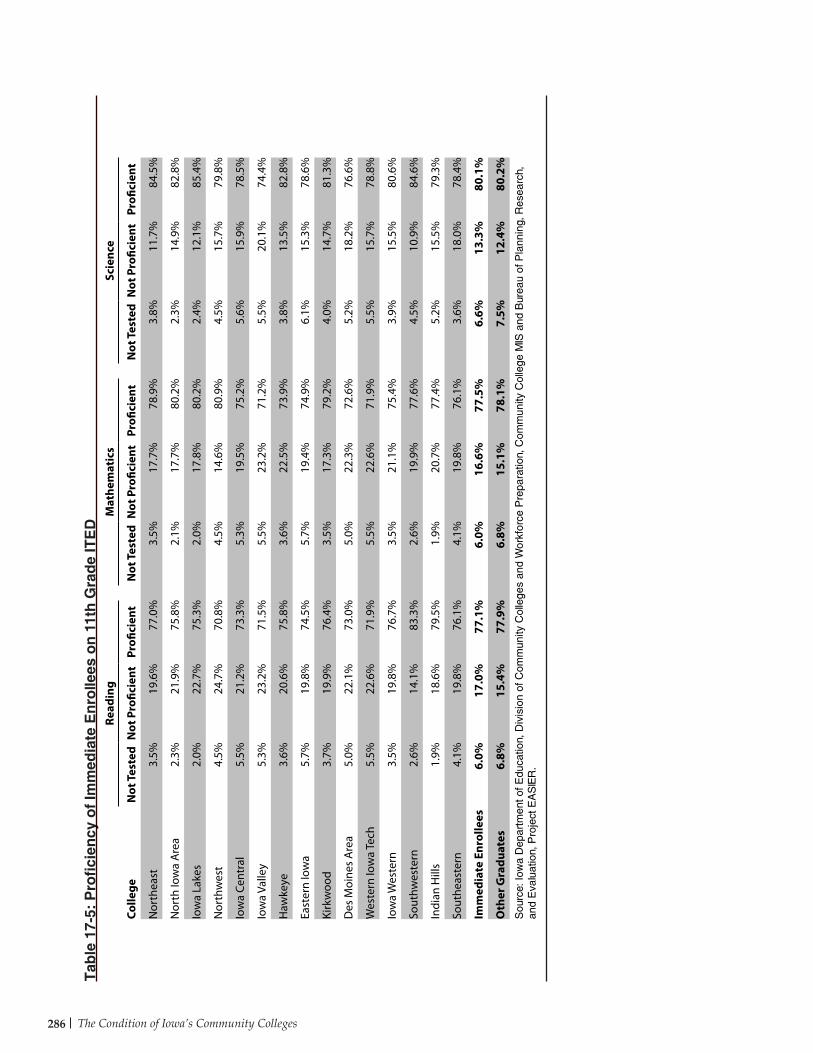
The Condition of Iowa’s Community Colleges286
Tab
le 1
7-5:
Pro
fici
ency
of
Imm
edia
te E
nro
llees
on
11t
h G
rad
e IT
ED
Read
ing
Mat
hem
atic
sSc
ienc
e
Colle
geN
ot T
este
dN
ot P
rofic
ient
Profi
cien
tN
ot T
este
dN
ot P
rofic
ient
Profi
cien
tN
ot T
este
dN
ot P
rofic
ient
Profi
cien
t
Nor
thea
st3.
5%19
.6%
77.0
%3.
5%17
.7%
78.9
%3.
8%11
.7%
84.5
%
Nor
th Io
wa
Are
a2.
3%21
.9%
75.8
%2.
1%17
.7%
80.2
%2.
3%14
.9%
82.8
%
Iow
a La
kes
2.0%
22.7
%75
.3%
2.0%
17.8
%80
.2%
2.4%
12.1
%85
.4%
Nor
thw
est
4.5%
24.7
%70
.8%
4.5%
14.6
%80
.9%
4.5%
15.7
%79
.8%
Iow
a Ce
ntra
l5.
5%21
.2%
73.3
%5.
3%19
.5%
75.2
%5.
6%15
.9%
78.5
%
Iow
a Va
lley
5.3%
23.2
%71
.5%
5.5%
23.2
%71
.2%
5.5%
20.1
%74
.4%
Haw
keye
3.6%
20.6
%75
.8%
3.6%
22.5
%73
.9%
3.8%
13.5
%82
.8%
East
ern
Iow
a5.
7%19
.8%
74.5
%5.
7%19
.4%
74.9
%6.
1%15
.3%
78.6
%
Kirk
woo
d3.
7%19
.9%
76.4
%3.
5%17
.3%
79.2
%4.
0%14
.7%
81.3
%
Des
Moi
nes
Are
a5.
0%22
.1%
73.0
%5.
0%22
.3%
72.6
%5.
2%18
.2%
76.6
%
Wes
tern
Iow
a Te
ch5.
5%22
.6%
71.9
%5.
5%22
.6%
71.9
%5.
5%15
.7%
78.8
%
Iow
a W
este
rn3.
5%19
.8%
76.7
%3.
5%21
.1%
75.4
%3.
9%15
.5%
80.6
%
Sout
hwes
tern
2.6%
14.1
%83
.3%
2.6%
19.9
%77
.6%
4.5%
10.9
%84
.6%
Indi
an H
ills
1.9%
18.6
%79
.5%
1.9%
20.7
%77
.4%
5.2%
15.5
%79
.3%
Sout
heas
tern
4.1%
19.8
%76
.1%
4.1%
19.8
%76
.1%
3.6%
18.0
%78
.4%
Imm
edia
te E
nrol
lees
6.0%
17.0
%77
.1%
6.0%
16.6
%77
.5%
6.6%
13.3
%80
.1%
Oth
er G
radu
ates
6.8%
15.4
%77
.9%
6.8%
15.1
%78
.1%
7.5%
12.4
%80
.2%
Sou
rce:
Iow
a D
epar
tmen
t of E
duca
tion,
Div
isio
n of
Com
mun
ity C
olle
ges
and
Wor
kfor
ce P
repa
ratio
n, C
omm
unity
Col
lege
MIS
and
Bur
eau
of P
lann
ing,
Res
earc
h,
and
Eva
luat
ion,
Pro
ject
EA
SIE
R.
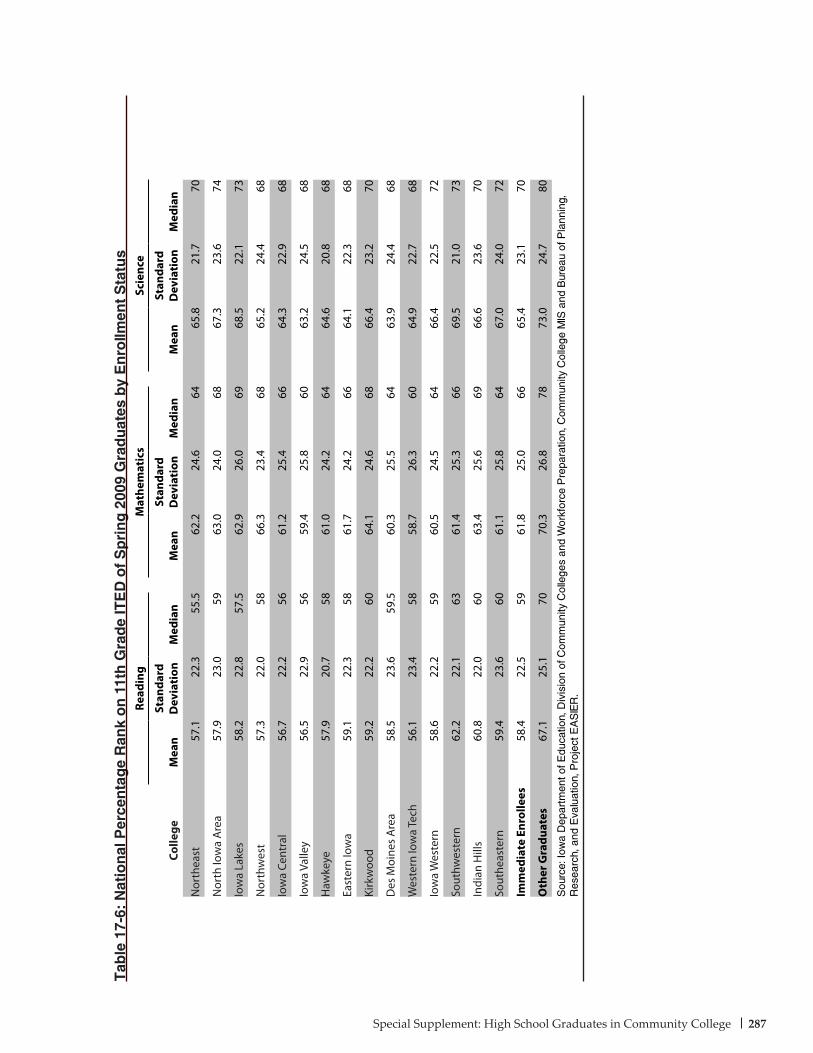
287Special Supplement: High School Graduates in Community College
Tab
le 1
7-6:
Nat
ion
al P
erce
nta
ge
Ran
k o
n 1
1th
Gra
de
ITE
D o
f S
pri
ng
200
9 G
rad
uat
es b
y E
nro
llmen
t S
tatu
s
Colle
ge
Read
ing
Mat
hem
atic
sSc
ienc
e
Mea
nSt
anda
rd
Dev
iati
onM
edia
nM
ean
Stan
dard
D
evia
tion
Med
ian
Mea
nSt
anda
rd
Dev
iati
onM
edia
n
Nor
thea
st57
.122
.355
.562
.224
.664
65.8
21.7
70
Nor
th Io
wa
Are
a57
.923
.059
63.0
24.0
6867
.323
.674
Iow
a La
kes
58.2
22.8
57.5
62.9
26.0
6968
.522
.173
Nor
thw
est
57.3
22.0
5866
.323
.468
65.2
24.4
68
Iow
a Ce
ntra
l56
.722
.256
61.2
25.4
6664
.322
.968
Iow
a Va
lley
56.5
22.9
5659
.425
.860
63.2
24.5
68
Haw
keye
57.9
20.7
5861
.024
.264
64.6
20.8
68
East
ern
Iow
a59
.122
.358
61.7
24.2
6664
.122
.368
Kirk
woo
d59
.222
.260
64.1
24.6
6866
.423
.270
Des
Moi
nes
Are
a58
.523
.659
.560
.325
.564
63.9
24.4
68
Wes
tern
Iow
a Te
ch56
.123
.458
58.7
26.3
6064
.922
.768
Iow
a W
este
rn58
.622
.259
60.5
24.5
6466
.422
.572
Sout
hwes
tern
62.2
22.1
6361
.425
.366
69.5
21.0
73
Indi
an H
ills
60.8
22.0
6063
.425
.669
66.6
23.6
70
Sout
heas
tern
59.4
23.6
6061
.125
.864
67.0
24.0
72
Imm
edia
te E
nrol
lees
58.4
22.5
5961
.825
.066
65.4
23.1
70
Oth
er G
radu
ates
67.1
25.1
7070
.326
.878
73.0
24.7
80
Sou
rce:
Iow
a D
epar
tmen
t of E
duca
tion,
Div
isio
n of
Com
mun
ity C
olle
ges
and
Wor
kfor
ce P
repa
ratio
n, C
omm
unity
Col
lege
MIS
and
Bur
eau
of P
lann
ing,
R
esea
rch,
and
Eva
luat
ion,
Pro
ject
EA
SIE
R.

The Condition of Iowa’s Community Colleges288
College Did Not Jointly Enroll Jointly Enrolled
Northeast 79.2% 20.8%
North Iowa Area 75.3% 24.7%
Iowa Lakes 69.2% 30.8%
Northwest 95.5% 4.5%
Iowa Central 80.7% 19.3%
Iowa Valley 94.2% 5.8%
Hawkeye 80.3% 19.7%
Eastern Iowa 90.0% 10.0%
Kirkwood 86.7% 13.3%
Des Moines Area 77.4% 22.6%
Western Iowa Tech 98.3% 1.7%
Iowa Western 82.4% 17.6%
Southwestern 74.4% 25.6%
Indian Hills 87.4% 12.6%
Southeastern 86.9% 13.1%
Immediate Enrollees 83.4% 16.6%
Other Graduates 81.6% 18.4%Note: Jointly enrolled includes any Spring 2009 graduate who jointly enrolled in the previous two years at a community college.
Source: Iowa Department of Education, Division of Community Colleges and Workforce Preparation, Community College MIS and Bureau of Planning, Research, and Evaluation, Project EASIER.
Table 17-7: Prior Joint Enrollment for 2009 High School Graduates
College MeanStandard Deviation Median
Northeast 5.6 7.9 3
North Iowa Area 6.0 8.0 3
Iowa Lakes 9.1 11.4 5
Northwest 6.3 11.3 3
Iowa Central 9.8 13.4 6
Iowa Valley 5.4 8.3 0
Hawkeye 4.8 6.9 3
Eastern Iowa 4.6 7.4 3
Kirkwood 3.7 5.9 0
Des Moines Area 7.2 8.1 5
Western Iowa Tech 6.8 7.5 6
Iowa Western 4.9 7.0 0
Southwestern 5.9 8.5 0
Indian Hills 5.6 8.7 2
Southeastern 5.4 7.5 3
Immediate Enrollees 5.8 8.4 3
Source: Iowa Department of Education, Division of Community Colleges and Workforce Preparation, Community College MIS and Bureau of Planning, Research, and Evaluation, Project EASIER.
Table 17-8: Earned Credit Hours of Prior Joint Enrollees Upon Fall 2010 Entry
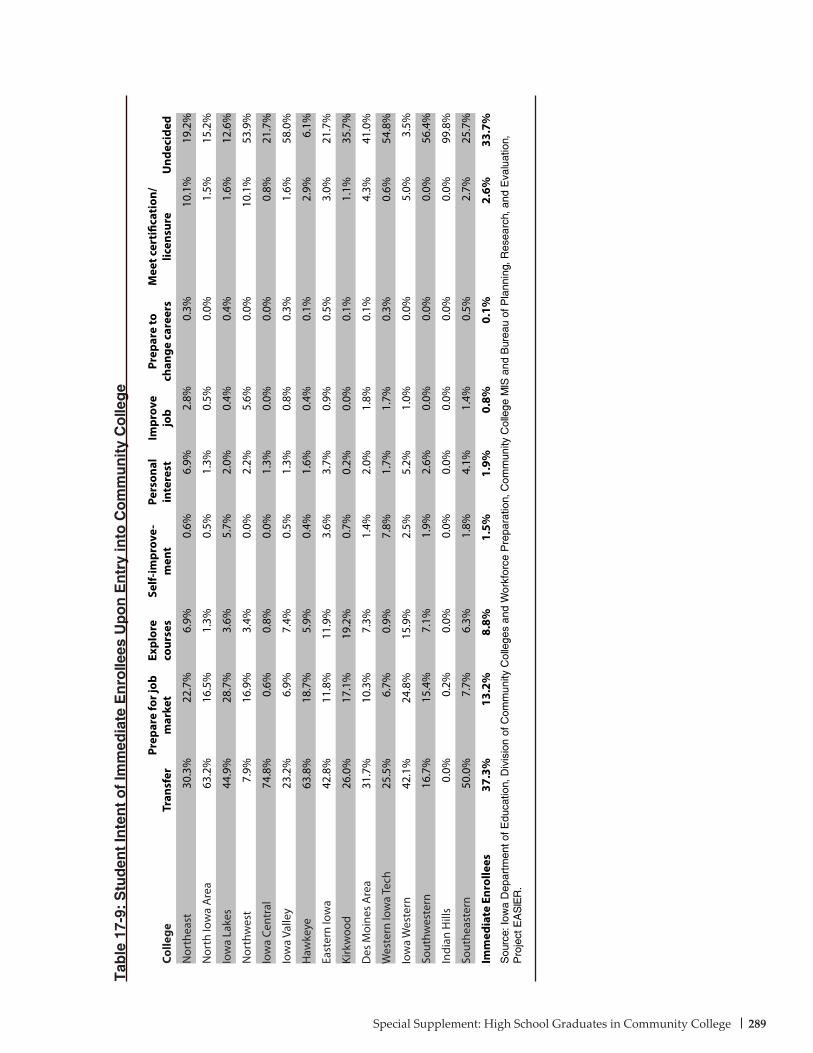
289Special Supplement: High School Graduates in Community College
Colle
geTr
ansf
erPr
epar
e fo
r job
m
arke
tEx
plor
e co
urse
sSe
lf-im
prov
e-m
ent
Pers
onal
in
tere
stIm
prov
e jo
bPr
epar
e to
ch
ange
car
eers
Mee
t cer
tific
atio
n/lic
ensu
reU
ndec
ided
Nor
thea
st30
.3%
22.7
%6.
9%0.
6%6.
9%2.
8%0.
3%10
.1%
19.2
%
Nor
th Io
wa
Are
a63
.2%
16.5
%1.
3%0.
5%1.
3%0.
5%0.
0%1.
5%15
.2%
Iow
a La
kes
44.9
%28
.7%
3.6%
5.7%
2.0%
0.4%
0.4%
1.6%
12.6
%
Nor
thw
est
7.9%
16.9
%3.
4%0.
0%2.
2%5.
6%0.
0%10
.1%
53.9
%
Iow
a Ce
ntra
l74
.8%
0.6%
0.8%
0.0%
1.3%
0.0%
0.0%
0.8%
21.7
%
Iow
a Va
lley
23.2
%6.
9%7.
4%0.
5%1.
3%0.
8%0.
3%1.
6%58
.0%
Haw
keye
63.8
%18
.7%
5.9%
0.4%
1.6%
0.4%
0.1%
2.9%
6.1%
East
ern
Iow
a42
.8%
11.8
%11
.9%
3.6%
3.7%
0.9%
0.5%
3.0%
21.7
%
Kirk
woo
d26
.0%
17.1
%19
.2%
0.7%
0.2%
0.0%
0.1%
1.1%
35.7
%
Des
Moi
nes
Are
a31
.7%
10.3
%7.
3%1.
4%2.
0%1.
8%0.
1%4.
3%41
.0%
Wes
tern
Iow
a Te
ch25
.5%
6.7%
0.9%
7.8%
1.7%
1.7%
0.3%
0.6%
54.8
%
Iow
a W
este
rn42
.1%
24.8
%15
.9%
2.5%
5.2%
1.0%
0.0%
5.0%
3.5%
Sout
hwes
tern
16.7
%15
.4%
7.1%
1.9%
2.6%
0.0%
0.0%
0.0%
56.4
%
Indi
an H
ills
0.0%
0.2%
0.0%
0.0%
0.0%
0.0%
0.0%
0.0%
99.8
%
Sout
heas
tern
50.0
%7.
7%6.
3%1.
8%4.
1%1.
4%0.
5%2.
7%25
.7%
Imm
edia
te E
nrol
lees
37.3
%13
.2%
8.8%
1.5%
1.9%
0.8%
0.1%
2.6%
33.7
%S
ourc
e: Io
wa
Dep
artm
ent o
f Edu
catio
n, D
ivis
ion
of C
omm
unity
Col
lege
s an
d W
orkf
orce
Pre
para
tion,
Com
mun
ity C
olle
ge M
IS a
nd B
urea
u of
Pla
nnin
g, R
esea
rch,
and
Eva
luat
ion,
P
roje
ct E
AS
IER
.
Tab
le 1
7-9:
Stu
den
t In
ten
t o
f Im
med
iate
En
rolle
es U
po
n E
ntr
y in
to C
om
mu
nit
y C
olle
ge
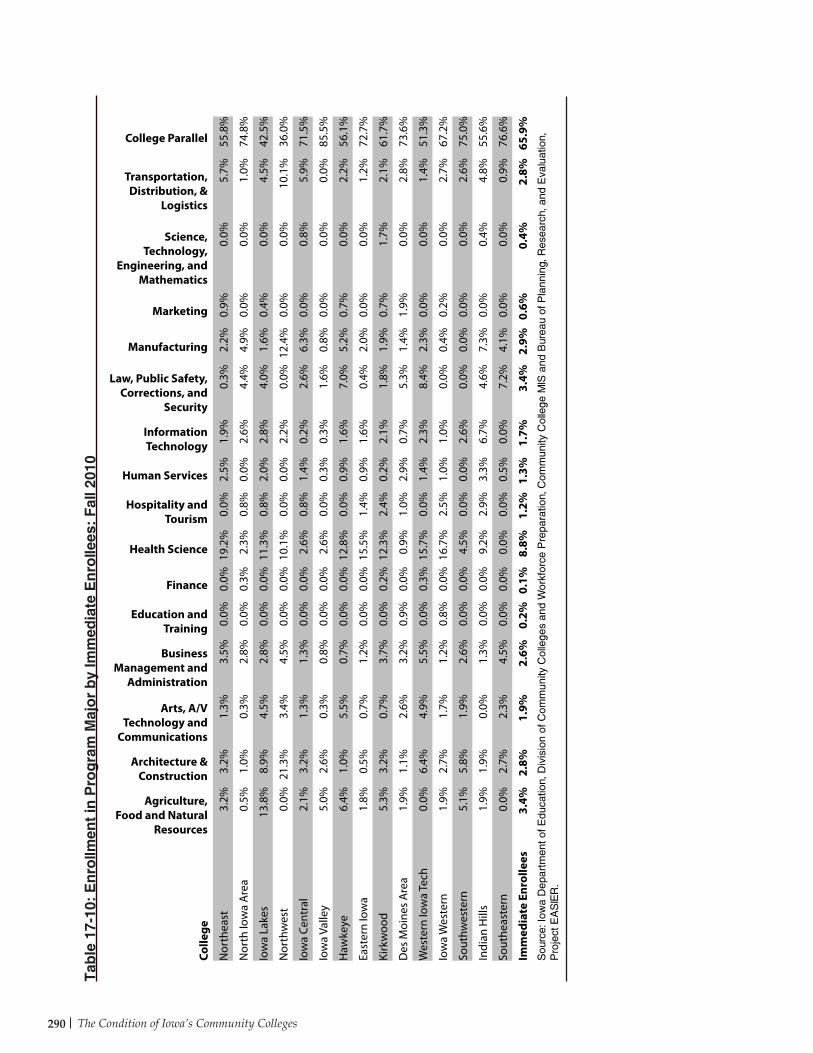
The Condition of Iowa’s Community Colleges290
Colle
ge
Agriculture, Food and Natural
Resources
Architecture & Construction
Arts, A/V Technology and
Communications
Business Management and
Administration
Education and Training
Finance
Health Science
Hospitality and Tourism
Human Services
Information Technology
Law, Public Safety, Corrections, and
Security
Manufacturing
Marketing
Science, Technology,
Engineering, and Mathematics
Transportation, Distribution, &
Logistics
College Parallel
Nor
thea
st3.
2%3.
2%1.
3%3.
5%0.
0%0.
0%19
.2%
0.0%
2.5%
1.9%
0.3%
2.2%
0.9%
0.0%
5.7%
55.8
%
Nor
th Io
wa
Are
a0.
5%1.
0%0.
3%2.
8%0.
0%0.
3%2.
3%0.
8%0.
0%2.
6%4.
4%4.
9%0.
0%0.
0%1.
0%74
.8%
Iow
a La
kes
13.8
%8.
9%4.
5%2.
8%0.
0%0.
0%11
.3%
0.8%
2.0%
2.8%
4.0%
1.6%
0.4%
0.0%
4.5%
42.5
%
Nor
thw
est
0.0%
21.3
%3.
4%4.
5%0.
0%0.
0%10
.1%
0.0%
0.0%
2.2%
0.0%
12.4
%0.
0%0.
0%10
.1%
36.0
%
Iow
a Ce
ntra
l2.
1%3.
2%1.
3%1.
3%0.
0%0.
0%2.
6%0.
8%1.
4%0.
2%2.
6%6.
3%0.
0%0.
8%5.
9%71
.5%
Iow
a Va
lley
5.0%
2.6%
0.3%
0.8%
0.0%
0.0%
2.6%
0.0%
0.3%
0.3%
1.6%
0.8%
0.0%
0.0%
0.0%
85.5
%
Haw
keye
6.4%
1.0%
5.5%
0.7%
0.0%
0.0%
12.8
%0.
0%0.
9%1.
6%7.
0%5.
2%0.
7%0.
0%2.
2%56
.1%
East
ern
Iow
a1.
8%0.
5%0.
7%1.
2%0.
0%0.
0%15
.5%
1.4%
0.9%
1.6%
0.4%
2.0%
0.0%
0.0%
1.2%
72.7
%
Kirk
woo
d5.
3%3.
2%0.
7%3.
7%0.
0%0.
2%12
.3%
2.4%
0.2%
2.1%
1.8%
1.9%
0.7%
1.7%
2.1%
61.7
%
Des
Moi
nes
Are
a1.
9%1.
1%2.
6%3.
2%0.
9%0.
0%0.
9%1.
0%2.
9%0.
7%5.
3%1.
4%1.
9%0.
0%2.
8%73
.6%
Wes
tern
Iow
a Te
ch0.
0%6.
4%4.
9%5.
5%0.
0%0.
3%15
.7%
0.0%
1.4%
2.3%
8.4%
2.3%
0.0%
0.0%
1.4%
51.3
%
Iow
a W
este
rn1.
9%2.
7%1.
7%1.
2%0.
8%0.
0%16
.7%
2.5%
1.0%
1.0%
0.0%
0.4%
0.2%
0.0%
2.7%
67.2
%
Sout
hwes
tern
5.1%
5.8%
1.9%
2.6%
0.0%
0.0%
4.5%
0.0%
0.0%
2.6%
0.0%
0.0%
0.0%
0.0%
2.6%
75.0
%
Indi
an H
ills
1.9%
1.9%
0.0%
1.3%
0.0%
0.0%
9.2%
2.9%
3.3%
6.7%
4.6%
7.3%
0.0%
0.4%
4.8%
55.6
%
Sout
heas
tern
0.0%
2.7%
2.3%
4.5%
0.0%
0.0%
0.0%
0.0%
0.5%
0.0%
7.2%
4.1%
0.0%
0.0%
0.9%
76.6
%
Imm
edia
te E
nrol
lees
3.4%
2.8%
1.9%
2.6%
0.2%
0.1%
8.8%
1.2%
1.3%
1.7%
3.4%
2.9%
0.6%
0.4%
2.8%
65.9
%S
ourc
e: Io
wa
Dep
artm
ent o
f Edu
catio
n, D
ivis
ion
of C
omm
unity
Col
lege
s an
d W
orkf
orce
Pre
para
tion,
Com
mun
ity C
olle
ge M
IS a
nd B
urea
u of
Pla
nnin
g, R
esea
rch,
and
Eva
luat
ion,
P
roje
ct E
AS
IER
.
Tab
le 1
7-10
: E
nro
llmen
t in
Pro
gra
m M
ajo
r b
y Im
med
iate
En
rolle
es:
Fal
l 201
0
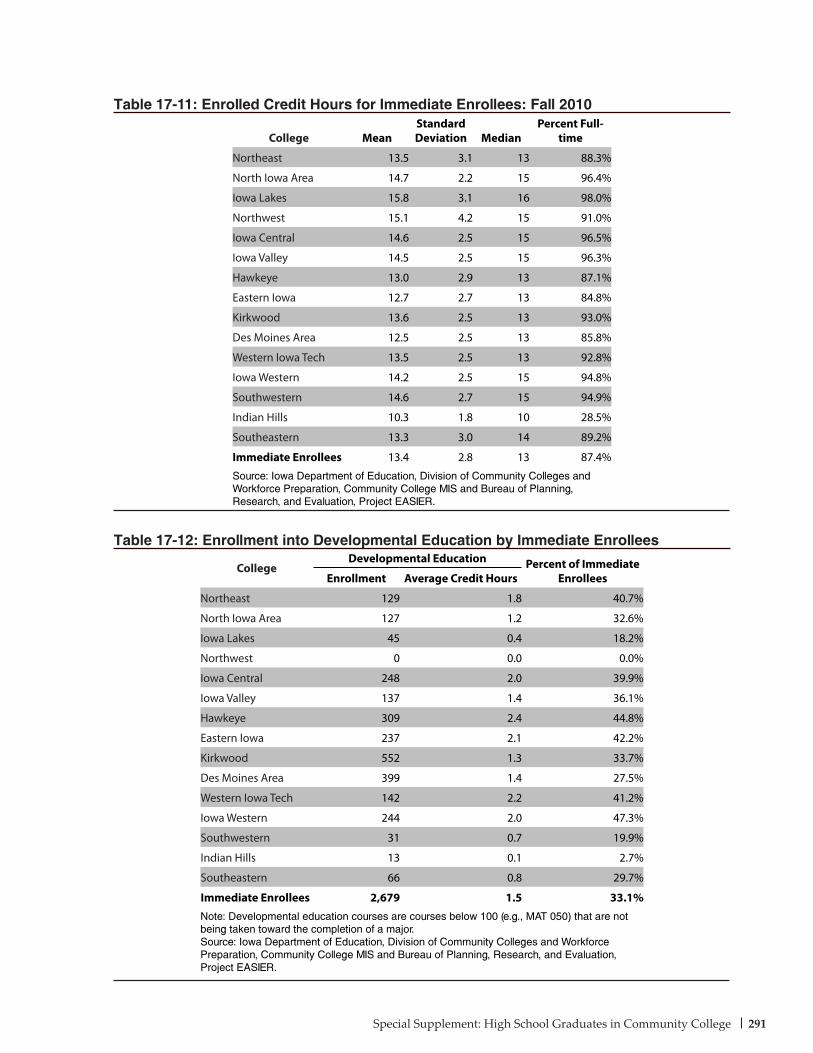
291Special Supplement: High School Graduates in Community College
College MeanStandard Deviation Median
Percent Full-time
Northeast 13.5 3.1 13 88.3%
North Iowa Area 14.7 2.2 15 96.4%
Iowa Lakes 15.8 3.1 16 98.0%
Northwest 15.1 4.2 15 91.0%
Iowa Central 14.6 2.5 15 96.5%
Iowa Valley 14.5 2.5 15 96.3%
Hawkeye 13.0 2.9 13 87.1%
Eastern Iowa 12.7 2.7 13 84.8%
Kirkwood 13.6 2.5 13 93.0%
Des Moines Area 12.5 2.5 13 85.8%
Western Iowa Tech 13.5 2.5 13 92.8%
Iowa Western 14.2 2.5 15 94.8%
Southwestern 14.6 2.7 15 94.9%
Indian Hills 10.3 1.8 10 28.5%
Southeastern 13.3 3.0 14 89.2%
Immediate Enrollees 13.4 2.8 13 87.4%
Source: Iowa Department of Education, Division of Community Colleges and Workforce Preparation, Community College MIS and Bureau of Planning, Research, and Evaluation, Project EASIER.
Table 17-11: Enrolled Credit Hours for Immediate Enrollees: Fall 2010
CollegeDevelopmental Education Percent of Immediate
EnrolleesEnrollment Average Credit Hours
Northeast 129 1.8 40.7%
North Iowa Area 127 1.2 32.6%
Iowa Lakes 45 0.4 18.2%
Northwest 0 0.0 0.0%
Iowa Central 248 2.0 39.9%
Iowa Valley 137 1.4 36.1%
Hawkeye 309 2.4 44.8%
Eastern Iowa 237 2.1 42.2%
Kirkwood 552 1.3 33.7%
Des Moines Area 399 1.4 27.5%
Western Iowa Tech 142 2.2 41.2%
Iowa Western 244 2.0 47.3%
Southwestern 31 0.7 19.9%
Indian Hills 13 0.1 2.7%
Southeastern 66 0.8 29.7%
Immediate Enrollees 2,679 1.5 33.1%Note: Developmental education courses are courses below 100 (e.g., MAT 050) that are not being taken toward the completion of a major.Source: Iowa Department of Education, Division of Community Colleges and Workforce Preparation, Community College MIS and Bureau of Planning, Research, and Evaluation, Project EASIER.
Table 17-12: Enrollment into Developmental Education by Immediate Enrollees
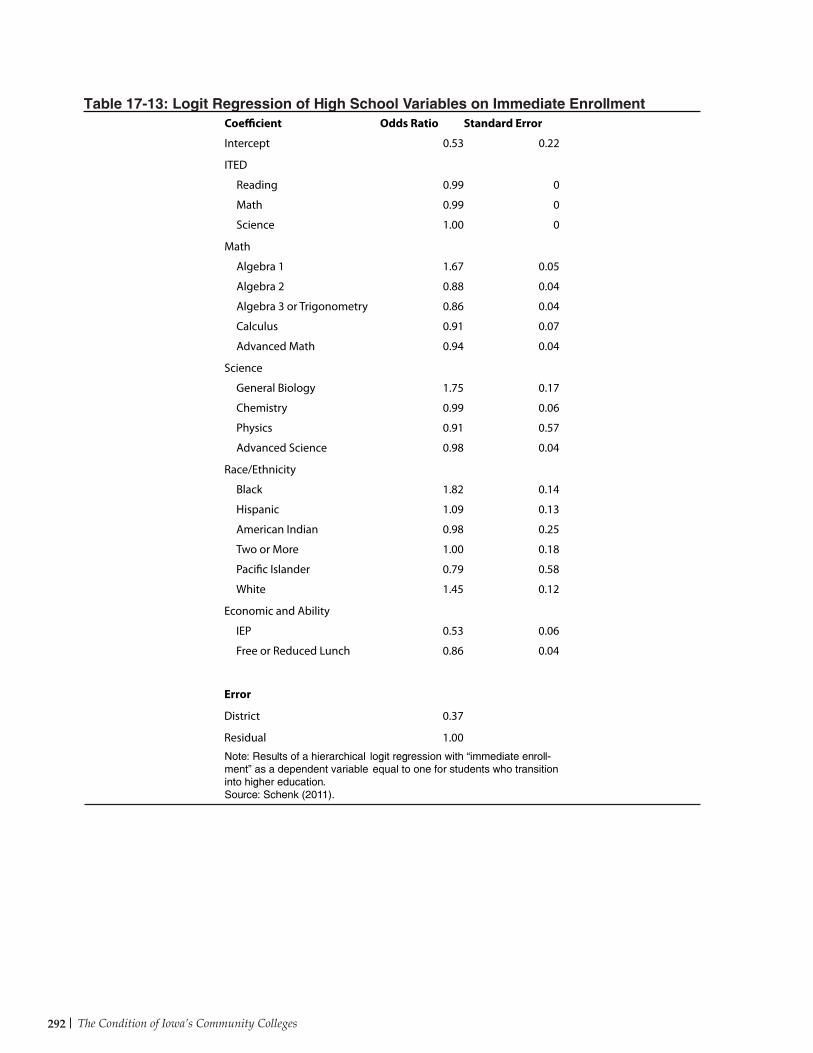
The Condition of Iowa’s Community Colleges292
Coefficient Odds Ratio Standard Error
Intercept 0.53 0.22
ITED
Reading 0.99 0
Math 0.99 0
Science 1.00 0
Math
Algebra 1 1.67 0.05
Algebra 2 0.88 0.04
Algebra 3 or Trigonometry 0.86 0.04
Calculus 0.91 0.07
Advanced Math 0.94 0.04
Science
General Biology 1.75 0.17
Chemistry 0.99 0.06
Physics 0.91 0.57
Advanced Science 0.98 0.04
Race/Ethnicity
Black 1.82 0.14
Hispanic 1.09 0.13
American Indian 0.98 0.25
Two or More 1.00 0.18
Pacific Islander 0.79 0.58
White 1.45 0.12
Economic and Ability
IEP 0.53 0.06
Free or Reduced Lunch 0.86 0.04
Error
District 0.37
Residual 1.00
Note: Results of a hierarchical logit regression with “immediate enroll-ment” as a dependent variable equal to one for students who transition into higher education.Source: Schenk (2011).
Table 17-13: Logit Regression of High School Variables on Immediate Enrollment
293Glossary
For complete definitions of Community College Management Information System (MIS) data elements, see the Fiscal Year 2010 MIS Data Dictionary available on the Department’s website: www.iowa.gov/educate.
Adult High School Diploma A program of instruction designed for an 18 year old or older individual that culminates in a Community College Adult High School Diploma. Courses are set at a length of 60 contact hours per course, with a maximum of five courses per semester.
Alternative High SchoolAn established environment within or apart from the regular high school with policies and rules, educational objectives, staff and resources designed to accommodate student needs, and to provide a comprehensive high school education consistent with the goals established by school districts in the area. Whether or not an individual student may choose to attend an alternative school may be limited by court order or by approval of the local school district. Community colleges may establish and operate alternative high schools for secondary school districts on a contractual basis. Students are not eligible for postsecondary State General Aid unless such students are taking courses above and beyond the defined programs for high school completion.
Apprentice A person at least 16 years of age (except where an older minimum age standard is established by law) who enters into any contract of service registered with the appropriate apprentice agency. An apprentice receives instruction from his or her employer in an apprenticeship approved occupation.
Apprenticeship Program A program registered with the Department of Labor or the state apprenticeship agency in accordance with the National Apprenticeship Act. An apprenticeship program is conducted or sponsored by an employer, a group of employers, or a joint apprenticeship committee representing both employers and labor, and contains all of the terms and conditions for the qualification, recruitment, selection, and training of apprentices. Related instruction courses are often part of the program.
Articulation The process of mutually agreeing upon courses and programs earned at a sending institution for credit or advanced placement at a receiving institution. Often courses and programs are transferable either from secondary to postsecondary institutions or between postsecondary institutions.
Arts and Sciences Credit courses contained in the two-year associate degrees transfer program (College Parallel/Liberal General Studies/College Transfer) and College Parallel/Career Option programs.
Arts and Sciences Courses Credit courses in College Parallel/Liberal General Studies/College Transfer, which are transferable to four-year institutions for completion of a baccalaureate degree and those that are included in career/technical curriculums that are applicable for employment on completion of curriculum.
Associate in Applied Arts (AAA) & Associate in Applied Science (AAS) Degrees
The degree awarded for satisfying the curriculum requirements and demonstrated competence for employment in the occupational field for which the program was designed. Typically, these degrees apply to occupations requiring significant amounts of applied scientific and mathematical knowledge. These degrees require a minimum of 60 semester credit hours (90 quarter hours) in length with a minimum of 12 semester credit hours (18 quarter hours) of general education. Programs awarding these degrees shall not exceed 19 semester credit hours per term (28.5 quarter hours) and shall not exceed 86 semester credit hours (129 quarters hours) in length.
Associate in Arts (AA) & Associate in Science (AS) Degrees
The degrees awarded for satisfying the curriculum requirements of arts and science courses designed as college parallel programs transferable as the first two years of a baccalaureate degree. These programs are referred as college parallel/liberal general studies/college transfer. They include a minimum of 60 semester credit hours (90 quarter
GlossaryA

hours) of credit courses designed and acceptable for transfer with the understanding that 16 semester hours (24 quarter hours) of career/technical courses could be included in the total.
Associate in General Studies Degree (AGS)The degree awarded for satisfying the curriculum requirements of a two-year program other than set forth in Iowa Administrative Code 281—21.2(10) associate of arts or science. The degree requirements are flexible for individual students, not intended for transfer, and include a minimum of 60 semester credit hours (90 quarter hours).
Career and Technical Education The organized educational activities that offer a sequence of courses that include academic and technical knowledge and skills needed for current employment or further education.
Certificate The award for satisfying the curriculum requirements of an activity, course, and/or program other than one that is intended for a diploma or a degree. Certificates can be awarded for credit and non-credit offerings.
College Parallel/Career Option Program (CP/CO)
AS or AA degree programs designed as the first two years of transfer credit toward a baccalaureate degree in a specific occupational area which includes a minimum number of skill development courses for immediate employment. Students have a choice of articulating their program to a four-year institution for completion of a baccalaureate degree or seeking employment in curriculum designed occupation or a related field.
College Parallel/Liberal General Studies/College Transfer
See Associate in Arts (AA) & Associate in Science (AS) Degrees.
Contact HourThe computation of minutes given for an instructional activity. The minimum requirement of one contact hour is 50 minutes.
Continuing Education Unit (CEU) A uniform unit of measurement given by a college for non-credit activity, course, and/or program. One continuing education unit (CEU) equals 10 contact hours (based on one 50-minute classroom hour) of participation in an organized education experience.
Credit A unit of measure/recognition given by a college for the completion of an activity, course, and/
or program recognized by higher education. It accounts for instructional activity in standards terms of rationalization of collegiate requirements related to transferability.
Credit Hour The computation of a single hour of class time per week occurring over a defined instructional period (term). An hour is referred to as 50 minutes to equal one credit hour of instruction, with requirements stated as semester minimums. Classroom: 800 minutes (533 minutes for one quarter hour) of scheduled instruction plus, when applicable, a scheduled culminating activity. Laboratory: 1,600 minutes (1,066 minutes for one quarter hour). Clinical practice: 2,400 minutes (1,599 minutes for one quarter hour).Cooperative/work experience: 3,200 minutes (2,132 minutes for one quarter hour).
Developmental Education A non-college transfer course designed to provide assistance (remedial instruction) to an individual so they can successfully complete the regular courses in their program of study.
Diploma The award granted for satisfying the curriculum requirements of a program that consist of a minimum of 15 semester credit hours (22 quarter hours) with the general education component consisting of a minimum of 3 semester hours (4 quarter hours).
Full-Time Equivalent Enrollment (FTEE) The equivalent number of students attending a single community college. One FTEE in credit hours equals twenty-four (24) credit hours. One FTEE in non-credit (contact) hours equals 600 contact hours.
General Education Credit courses designed to broaden student ability to reason, think, compute, communicate and adapt to change. They also include human development in civic, consumer, environmental, and social responsibilities. The general education requirements include courses in communications, humanities, mathematics, science, and social science. The number and type of general education courses is determined by the degree (state requirements) and often varies with different receiving institutions.
Headcount The actual number of students enrolled in a given instructional category or unit during a given period of time.Unduplicated headcount means that a person is counted only once during the reporting period even though they may be enrolled in more than
295Glossary
one program. The individual is to be reported in the program in which they were most recently enrolled. If the above criterion discriminates, then the student is to be reported in the program in which they received the most credit or contact hours of instruction. In any case, the student should be counted only once during a specified period of enrollment even though they may be in more than one term during the reporting period.
Human Resources Community college employees are classified according to position and assignment codes. The staff is usually classified as administration, instructional/faculty, professional, secretarial/clerical, and service.A full-time faculty/instructor is classified full-time according to the college’s definition and whose regular assignment is instruction (more than 50 percent), including those with released time for research. Also included are full-time instructional faculty on sabbatical leave, full-time replacements for instructional faculty on leave without pay, and chairs of departments (if they have no other administrative title and hold a full-time faculty rank). A part-time faculty/instructor is classified part-time according to the college’s definition and who is employed less than full-time (see above definition).An adjunct faculty/instructor is when a person has an occasional or temporary affiliation with an institution or another faculty member in performing a duty or service in an auxiliary capacity.Temporary/Seasonal includes individuals who are employed by the college for short-time periods for specific purposes. Such an employee may be full or part-time and often are not provided benefits.
Joint Enrollment A student who is enrolled in a secondary school and a postsecondary institution at the same time. The credits earned are often applicable for fulfilling the graduation requirements at both levels. Courses offered for joint enrollment are disaggregated into the following categories:Contracted courses are college credit courses offered to secondary school students through contractual arrangements. These courses often generate supplementary weighting for the local district. Courses generating supplementary weighting are defined as “concurrent enrollment.”Postsecondary Enrollment Options (PSEO) courses are college credit courses offered to secondary school students through the PSEO program.Tuition courses are college credit courses taken secondary school students independently.
Jointly Administered Program A program entered into by two or more educational institutions to provide instructional or administrative services jointly, to the mutual advantage of the constituents of each institution.
Leisure/Recreational Courses that provide instruction in leisure, recreation, casual culture, wellness, and/or self-enjoyment subjects.
Non-Credit Non-Credit offerings cover a wide range of activities, courses, and programs usually for the adult population. They are recognized for their ability to provide offerings in non-traditional lengths and delivery methods, as well as special ”packaging” for individuals and business/industry.
Preparatory Program Preparatory programs are designed to provide the specific skills and knowledge essential for successful entry into an occupation following completion of a designated curriculum. These programs may be for credit and/or non-credit depending on the intent and requirements of the curriculum.Full-time programs operate on the average of 15 credit hours per term and at least two terms in length.Part-time programs operate on the average of less than 15 credit hours per term and at least two terms in length.Short-term programs are less than 22 credit hours in length.
Secondary High School Diploma ProgramCourses provided by community colleges for secondary credit toward a high school diploma granted by a local secondary school district.
Student A full-time student is one who enrolls for 12 or more semester credit hours (18 or more quarter hours) in the most recent regular term of enrollment. A part-time student is one who enrolls for less than 12 semester credit hours (18 quarter hours) in the most recent regular term of enrollment.Appropriate adjustments for length of summer term are to be used if the student has not attended a regular term during the academic year. The above definitions are used for uniform state reporting, however community colleges often define full-time and part-time enrollments according to independent local criteria. The Iowa College Student Aid Commission’s full-time definition is a student enrolled for 12 or more semester credits, 12 or more quarter credits, or 24 contact hours a week each term.

296 The Condition of Iowa’s Community Colleges

298 The Condition of Iowa’s Community Colleges
References
Attewell, Paul A., David E. Lavin, Thurston Domina, and Tania Levey. 2006. New Evidence on College Remediation. The Journal of Higher Education. Vol. 77(5), pp. 886-924.
Breneman, David W. and William N. Haarlow. Remediation in Higher Education. 1998. A symposium Featuring “Remedial Education: Costs and Consequences. Fordham Report. Vol. 2(9).
Congressional Budget Office. 2009. Congressional Budget Office - Economic Projections. Congressional Budget Office - Economic Projections. http://www.cbo.gov/budget/econproj.shtml.
Hussar, William, and Tabitha Bailey. 2008. Projections of Education Statistics to 2017. Washington, DC: U.S. Department of Education, National Center for Education Statistics, Institute for Education Sciences.
Iowa Coordinating Council on Post-High School Education. 2008. Iowa College and University Enrollment Report: Fall 2008. University of Iowa.
Iowa Department of Education. 2010a. The Annual Condition of Education Report: 2010. Des Moines, IA: Iowa Department of Education, Division of School Support and Information.
—. 2009. The Annual Condition of Iowa’s Community Colleges: 2008. Des Moines, IA: Iowa Department of Education, Division of Community Colleges and Workforce Preparation
—. 2008. The Annual Condition of Education Report: 2008. Des Moines, IA: Iowa Department of Education, Division of School Support and Information.
Iowa State Board of Regents. 2007. Fall Enrollment 2007. Board of Regents.
Karp, Melinda M., Juan Carlos Calcagno, Katherine L. Hughes, Dong Wook Jeong, and Thomas Bailey. 2008. Dual Enrollment Students in Florida and New York City: Postsecondary Outcomes. CCRC Brief. Number 37 (No. 37). New York, NY: Community College Research Center.
Kleiner, Brian, and Laurie Lewis. 2005. Dual Enrollment of High School Students at Postsecondary Institutions: 2002-03. Washington D.C.: U.S. Department of Education, April. http://nces.ed.gov/pubs2005/2005008.pdf.
Knapp, Laura G., Janice E. Kelly-Reid, and Scott A. Ginder. 2009. Employees in Postsecondary Institutions, Fall 2008, and Salaries of Full-Time Instructional Staff, 2008-09 (NCES 2010-165). Washington D.C.: National Center for Education Statistics, Institute of Education Sciences, U.S. Department of Education.
Levesque, Karen, Jennifer Lard, Elisabeth Hensley, Susan P. Choy, Emily Forrest Sataldi, and Lisa Hudson. 2008. Career and Technical Education in the United States: 1990 to 2005 (NCES 2008-035). National Center for Education Statistics, Institute of Education Sciences, U.S. Department of Education. Washington, D.C.
B
McCormack, Eugene. 2008. Community Colleges Hope to Keep Aging Professors in the Classroom. The Chronicle of Higher Education, June 13, sec. Special Report.
Parsad, Basmat, and Laurie Lewis. 2008. Distance Education at Degree-Granting Postsecondary Institutions: 2006-07. Washington D.C.: U.S. Department of Eduation, National Center for Education Statistics, Institute for Education Sciences.
Provasnik, Stephen, and Michael Planty. 2008. Community Colleges: Special Supplement to The Condition of Education 2008. Washington D.C.: U.S. Department of Education, August. http://nces.ed.gov/pubs2008/2008033.pdf.
Schenk, Tom. 2011, forthcoming. Predicting Entry into Community Colleges from Secondary School in Iowa: 2010 Cohort. Technical Bulletin #3. Des Moines, IA: Iowa Department of Education.
Schenk, Tom and Kiyo Matsuyama. 2009. Calculating Returns to Degree Using Administrative Data: 2002 Cohort. Technical Bulletin #2. Des Moines, IA: Iowa Department of Education.
Siegelman, Harvey, & Daniel Otto. 2008. The Economic Impact of Early College Opportunity Programs at Iowa’s Community Colleges. Des Moines, IA: Strategic Economics Group. Retrieved from http://www.economicsgroup.com/reports/2008%20Early%20College%20Opportunity%20Study.pdf
Snyder, Thomas D., Sally A. Dillow, and Charlene M. Hoffman. 2008. Digest of Education Statistics: 2007. Washington D.C.: U.S. Department of Education.
U.S. Census Bureau. 2008. Population Estimates. Washington D.C.: U.S. Census Bureau, Population Division. www.census.gov/popest/.

301Glossary
IndexC
Symbols260E 173, 174, 177, 181, 182260F 173, 174, 175, 177, 181, 182260G 173, 174, 175, 177
AAA 89, 103, 104, 105, 130, 131, 293, 294, 188, 199,
294, 106, 131AAA 293, 89, 103, 104, 105, 130, 131, 106, 131AAS 89, 103, 104, 105, 130, 131, 136, 293, 188, 199,
106, 131ABE 158, 159, 164, 165, 188, 219adult literacy 157–172
employment & postsecondary outcomes 190Agriculture, Food, and Natural Resources , 59, 58AGS 89, 294, 103, 104, 105, 106, 130, 131, 131Architecture and Construction 30, 31, 32, 33, 98, 99,
100, 48, 58, 101, 59, 103, 104, 105, 106, 125, 126, 127, 128
arts and sciences 8–9, 133, 219expenditures 219
AS 89, 103, 104, 105, 130, 131, 293, 294, 218, 219, 220, 222, 223, 224, 228, 229, 230, 232, 233, 234, 235, 294, 106, 131
Awards 89–132
BBusiness, Management and Administration 21, 30, 31,
32, 33, 98, 99, 100, 101, 103, 104, 105, 106, 125, 126, 127, 128
Ccareer cluster 100, 103, 48, 104, 105, 106Certificate 103, 104, 105, 130, 131, 136, 254, 255, 294,
253, 256, 258, 259, 106, 260, 131, 261concurrent 71, 295, 71contact hours 293, 180, 294, 295credit hours 7, 8, 13, 14, 293, 294, 295, 47, 54, 14, 48,
71, 48, 73, 51, 79, 80CTE 8, 9, 21, 47, 89, 47
Ddemographics
awardee 90
employee 243student 9, 22, 51, 77
Diploma 254, 103, 104, 105, 130, 131, 255, 293, 294, 295, 256, 258, 259, 260, 253, 106, 261, 131
dual credit. See joint enrollment
Eemployee
educational attainment 243employees 243–274employment
employment type 243enrollment
fall 7–20fiscal year 21–46joint 48, 71–88non-credit 137–156online 47–70projections 10
ESL 157, 158, 159, 166, 167expenditures 218
FFinance 30, 31, 32, 33, 98, 99, 100, 48, 58, 101, 59,
103, 104, 105, 106, 125, 126, 127, 128financial aid 213–216FTEE 219
GGED 157, 160, 171graduation rate 183, 185, 188
HHealth Science 21, 30, 31, 32, 33, 48, 90, 91, 98, 99,
58, 100, 101, 59, 103, 104, 105, 125, 126, 127, 106, 128
high school students. See joint enrollmentHuman Services 30, 31, 32, 33, 98, 99, 58, 100, 101,
59, 103, 104, 105, 106, 125, 126, 127, 128
IIDED 173, 179, 180, 181Iowa State University 188Iowa Workforce Development 186, 187, 199
302 The Condition of Iowa’s Community Colleges
Jjoint enrollment 48, 48–49, 71–88
grade level 77
MManufacturing 21, 30, 31, 32, 33, 98, 99, 58, 100, 101,
59, 103, 104, 105, 106, 125, 126, 127, 128Marketing 30, 31, 32, 33, 98, 99, 58, 100, 101, 59, 103,
104, 105, 106, 125, 126, 127, 128
Nnon-credit enrollment 137–156
PPSEO 71, 295, 74, 81, 82, 83, 77Public Safety 30, 31, 32, 33, 98, 99, 58, 100, 101, 59,
103, 104, 105, 106, 125, 126, 127, 128, 135public university comparison 204
Ssalaries
instructor 245Senior Year Plus 71SGA 217, 220STEM , 48success rate 183, 185, 199
TTime-to-degree 186transfer rate 188Transportation, Distribution, and Logistics , 58, 59, 48tuition
joint enrollment 74national & regional comparison 201
UUniversity of Iowa 22, 188, 298University of Northern Iowa 22, 188
Vvocational
expenditures 219programs. See Career and Technical Education (CTE)
Wwages
student 183, 186by completion status 186

COMMUNITY COLLEGES & WORKFORCE PREPARATION
www. iowagov/ educate/ ccpublicatlons/