Embed Size (px)
Citation preview

Giving USA
2017The Annual Report on Philanthropyfor the Year 2016
Researched and written by

Giving USA Foundation™ thanks our Platinum Supporter and Giving Institute
Member, DonorPerfect, for their generous contribution to this year’s report.

Mar
y B
ald
win
Un
iver
sity
, pho
to b
y Ka
te Jo
yce
Stud
ios
20
Giving USA Contributors

We are grateful for the generous gifts to Giving USA FoundationTM for Giving USA and wish to recognize the substantial support from the following contributors.
* Contribution includes an amount for in-kind services (continued on next page)
Platinum ($25,000+)
Patron ($10,000+)
Mar
y B
ald
win
Un
iver
sity
, pho
to b
y Ka
te Jo
yce
Stud
ios
20
*

Giving USA Contributors
Partner ($2,500 – $4,999)
nc.nc.since 1948
eazleyeazleyBBFFoundationoundation
II
Maree G. Bullockin Recognition ofJimmie R. Alford
M. Anne Murphy, CFRE
Benefactor ($5,000 – $9,999)
Committed to nonprofit fundraising success.
* Contribution includes an amount for in-kind services
*
*

Giving USA Contributors
Builder ($1,000 – $2,499)
Friend ($100 – $999)
Special Research Grants
Advancement ResourcesArnoult & Associates, Inc.Brenda AsareAskRIGHTDonorSearchEvans Consulting GroupFalk Consulting, LLCPeter J. FissingerGlobal Advancement, LLCGreen Oak Consulting GroupMolly HansenHeaton Smith GroupHeller Consulting Angela Hodson
Dunham+CompanyFidelity CharitableOhio Presbyterian Retirement
Services Foundation
The Kellogg Organization, Inc.Jay and Christie LoveSandy Macnab, FAHP, CFREWendy McGradyThe Oram GroupPrasad Consulting & ResearchDavid and Patricia ShufflebargerAggie Sweeney, CFRESharon TiknisVirgil Scott Consulting, Inc.Winkler Group
Presbyterian Association of Homes and Services
Stead Family Foundation
Association for Healthcare Philanthropy
BenevonCarlson Fundraising, LLCCarlton & CompanyDonorDriveJoyaux AssociatesKCI-Ketchum Canada, Inc.
The Lapin Group, LLCMargaret and Tom Mesaros The Monument GroupNancy L. Raybin Sentergroup, Inc.TrueSense Marketing The Yunker Group, Inc.

Mem
ori
al P
ark
Co
nse
rvan
cy, p
hoto
by
Cod
y D
uty
Giving USA

Giving USATM
2017 The Annual Report on
Philanthropy for the Year 2016 62nd Annual Issue
Researched and written at
Publisher
Mem
ori
al P
ark
Co
nse
rvan
cy, p
hoto
by
Cod
y D
uty

Giving USA is a public outreach initiative of Giving USA Foundation™. The Foundation, established in 1985 by what is now The Giving Institute, endeavors to advance philanthropy through research and education.
Giving USA: The Annual Report on Philanthropy for the Year 2016 is a 2017 copyright of Giving USA Foundation™ and is researched and written at the Indiana University Lilly Family School of Philanthropy.
All rights are reserved.
No portion of this publication may be reproduced, whether in print or electronic form, without the written permission of the Giving USA Foundation™. Permission to reprint excerpts may be obtained by writing to the Foundation. Go to www.givingusa.org for more information about permission requests.
For media inquiries at Giving USA Foundation™, please contact Johnny Ford with Public Communications, Inc. at 312.558.1770 or [email protected]. For media inquiries at the Indiana University Lilly Family School of Philanthropy, please contact Adriene Davis Kalugyer, 317.278.8972 or adrldavi@iupui. For research and other types of inquiries, please contact Giving USA Foundation™ at [email protected] or call 312.981.6794.
Citation of this report must use the following text regardless of scholarly style: Giving USA: The Annual Report on Philanthropy for the Year 2016 (2017). Chicago: Giving USA Foundation™.
Speakers may cite Giving USA. Use of Giving USA’s data or other material in presentations, texts, online format, or other contexts must credit Giving USA as noted in the above sections in a prominent fashion.
Stock photos © 2017 by Getty Images.Private images courtesy of Giving Institute member organizations.

Acknowledgments . . . . . . . . . . . . . . . . . . . . . . . . . . . . . . . . . . . . . . . . . . . . . . . . . . . . 11Foreword . . . . . . . . . . . . . . . . . . . . . . . . . . . . . . . . . . . . . . . . . . . . . . . . . . . . . . . . . . 15How to Apply Giving USA . . . . . . . . . . . . . . . . . . . . . . . . . . . . . . . . . . . . . . . . . . . . . .17Infographic: Total Estimated 2016 Giving . . . . . . . . . . . . . . . . . . . . . . . . . . . . . . . . . . 20
GIVING USA ESTIMATES1 Key Findings. . . . . . . . . . . . . . . . . . . . . . . . . . . . . . . . . . . . . . . . . . . . . . . . . . . . . 232 The Numbers . . . . . . . . . . . . . . . . . . . . . . . . . . . . . . . . . . . . . . . . . . . . . . . . . . . 27
SPECIAL SECTION3 Giving to and from Donor-Advised Funds . . . . . . . . . . . . . . . . . . . . . . . . . . . . . . 69
SOURCES OF CONTRIBUTIONS4 Giving by Individuals . . . . . . . . . . . . . . . . . . . . . . . . . . . . . . . . . . . . . . . . . . . . . . 895 Giving by Foundations . . . . . . . . . . . . . . . . . . . . . . . . . . . . . . . . . . . . . . . . . . . . 1116 Giving by Bequest . . . . . . . . . . . . . . . . . . . . . . . . . . . . . . . . . . . . . . . . . . . . . . . 1297 Giving by Corporations . . . . . . . . . . . . . . . . . . . . . . . . . . . . . . . . . . . . . . . . . . . 145
USES OF CONTRIBUTIONS Introduction to the Giving USA Uses of Contributions Chapters . . . . . . . . . . . . . 1658 Summary of the National Taxonomy of Exempt Entities (NTEE) . . . . . . . . . . . . . . 1679 Giving to Religion . . . . . . . . . . . . . . . . . . . . . . . . . . . . . . . . . . . . . . . . . . . . . . . 17110 Giving to Education . . . . . . . . . . . . . . . . . . . . . . . . . . . . . . . . . . . . . . . . . . . . . . 19311 Giving to Human Services . . . . . . . . . . . . . . . . . . . . . . . . . . . . . . . . . . . . . . . . . 21712 Giving to Foundations . . . . . . . . . . . . . . . . . . . . . . . . . . . . . . . . . . . . . . . . . . . 23913 Giving to Health . . . . . . . . . . . . . . . . . . . . . . . . . . . . . . . . . . . . . . . . . . . . . . . . 25114 Giving to Public-Society Benefit . . . . . . . . . . . . . . . . . . . . . . . . . . . . . . . . . . . . . 27115 Giving to Arts, Culture, and Humanities . . . . . . . . . . . . . . . . . . . . . . . . . . . . . . 28916 Giving to International Affairs . . . . . . . . . . . . . . . . . . . . . . . . . . . . . . . . . . . . . . 30917 Giving to Environment/Animals . . . . . . . . . . . . . . . . . . . . . . . . . . . . . . . . . . . . . 331
GIVING DATA18 Data Tables for Charts in The Numbers . . . . . . . . . . . . . . . . . . . . . . . . . . . . . . . . 351
METHODOLOGY19 Brief Summary of Methods Used . . . . . . . . . . . . . . . . . . . . . . . . . . . . . . . . . . . . 36120 Glossary . . . . . . . . . . . . . . . . . . . . . . . . . . . . . . . . . . . . . . . . . . . . . . . . . . . . . . 37921 Sources of Philanthropic Information . . . . . . . . . . . . . . . . . . . . . . . . . . . . . . . . . 383
The Giving Institute and the Giving USA Foundation™ . . . . . . . . . . . . . . . . . . . . . . . 391Committees, Advisory Council, and Staff . . . . . . . . . . . . . . . . . . . . . . . . . . . . . . . . . 392Professional Code of Ethics . . . . . . . . . . . . . . . . . . . . . . . . . . . . . . . . . . . . . . . . . . . . 402Standards of Practice . . . . . . . . . . . . . . . . . . . . . . . . . . . . . . . . . . . . . . . . . . . . . . . . 403
Contents

10 | Giving USA FoundationTM | Giving USA 2017
Giving USAGiving USA Acknowledgments
Tho
mas
Jef
fers
on
’s P
op
lar
Fore
st

Acknowledgments
Giving USA: The Annual Report on Philanthropy is an endeavor to provide
the best data on charitable giving within the United States, in service of both the scholars and practitioners who move the field of philanthropy forward. This effort would not be possible without the support of the staff at the Indiana University Lilly Family School of Philanthropy (“the school”), the Giving USA FoundationTM, The Giving Institute, staff at Sentergroup, and many other individuals who volunteer their time and skill to help create Giving USA. Truly, producing the most comprehensive and accurate benchmark for charitable giving is a team effort in every sense.
As first time managing editors for Giving USA, we would like to extend a very sincere “thank you” to our colleagues at the school for their patience, support, and expertise as we navigated the research and production process.
Specifically, we are grateful to Jon Bergdoll, our Giving USA statistician, for verifying, checking, and double-checking our work. We would also like to extend our thanks to Jon Durnford of DataLake, LLC, who continues to work with our team to improve and uphold the accuracy of our estimates. In addition, we thank
Giving USA FoundationTM | Giving USA 2017 | 11
Tho
mas
Jef
fers
on
’s P
op
lar
Fore
st
Chelsea Naylor, the Giving USA research assistant, for her irreplaceable support in both authoring chapters and assuring this edition’s quality.
A very big “thank you” goes to Adriene Davis Kalugyer, the Manager of Public Affairs for the school who has been involved in the dissemination of Giving USA since the publication came to the school in 2000. Her expertise, guidance, and sense of humor were instrumental to the production of this edition. Additional recognition goes to Johnny Ford and his colleagues at Public Communications Inc., our new public relations partners, who adapted very well to the unique production cycle of this report.
Throughout the 2017 production process, we received invaluable assistance from a former managing editor and associate managing editor of Giving USA. Melanie A. McKitrick, former Managing Editor of Giving USA, not only authored two chapters in this edition but also advised the current managing editors throughout this year’s production process. In addition, our gratitude goes out to Grace Baranowski, former Associate Managing Editor of Giving USA, who provided editorial and data assistance.
In recent years, Giving USA has partnered with nonprofit and fundraising professionals, as well as current students and alumni of the school, to author the chapters analyzing trends for both sources and uses of charitable giving. This year, we would like to thank both new and returning authors, including: Melanie A. McKitrick,
Josh Moore, Xiaonan Kou, Ruth Hansen, Thad Austen, Heather O’Connor, Qi Gao, Xinyi Zhao, Hannah Travis, Allison Mitchell, Ian Ermatinger-Salas, Christianna Luy, Meg O’Halloran, and Chelsea Naylor.
Our leadership at the school, including Dean, Amir Pasic; Associate Dean for Academic Affairs and Research, Patrick Rooney; and Director of Research, Una Osili continues to provide steadfast guidance to ensure that this publication sets the gold standard in the field. In addition, we thank our research colleagues for their patience and support: Jacqueline Ackerman, Jon Bergdoll, Chelsea Clark, Silvia Garcia, Xiao Han, Xiaonan Kou, Jennifer Staashelm, and Sasha Zarins.
Annually, volunteers from Giving Institute member firms serve on Giving USA committees to ensure the quality of this publication. On behalf of the school, we would like to thank all of these volunteers—especially the chairs of the committees with whom the research team works most closely: Laura MacDonald and Wendy McGrady (Editorial Review Board), Josh Birkholz (Advisory Council on Methodology), and Rick Dunham (Marketing Sub-Committee). Additional thanks are due to the members of the Advisory Council on Methodology—these scholars, researchers, and leaders donate their time and expertise to ensure our estimates are as rigorous as possible.. Also, we thank the members of the Editorial Review Board, who lent their skill and experience in support of the
12 | Giving USA FoundationTM | Giving USA 2017
Giving USA Acknowledgments
Giving USA chapters as reviewers and lead reviewers throughout the entire production process.
We would especially like to thank Keith Curtis, the Immediate Past Chair of the Giving USA FoundationTM, and Melissa James of The Curtis Group for their assistance in reviewing our special section on donor-advised funds. Giving USA 2017 will be the first edition providing a special section on these charitable giving vehicles, and we hope this will be a valuable addition for our readers. The Giving USA FoundationTM has additionally provided support for the school to expand upon new research aimed at understanding the donor-advised fund landscape, and we look forward to sharing this work with the Giving USA community in the future.
The school also sends a “thank you” to the Giving USA FoundationTM chair, Aggie Sweeney, and The Giving Institute chair, Jeffrey Byrne, for their leadership of this partnership. We also thank the Sentergroup staff for assisting with all aspects of planning, producing, and marketing Giving USA as well as fulfilling Giving USA orders. These individuals specifically include Jean Bean, Erin Berggren, Michelle Goldberg, Mariam Gunja, Tom Radde and Spenser Davis. On the production side, we extend our gratitude to Eric Cashion and Debbie Calevich of the creative department at Dunham+Company for designing and producing this year’s edition.
As Giving USA strives to provide the most accurate and relevant information
to the philanthropic community, we are thankful for the organizations and individuals who share their data, assist with writing summaries for Giving USA, or otherwise provide guidance. Our appreciation goes out to: Foundation Center; Jon Durnford of DataLake; John Van Drunen and his colleagues at ECFA; Ann Kaplan at the Council for Aid to Education; the Association for Health Care Philanthropy; Carmen Perez, André Solórzano, and their colleagues at CECP; Jim O’Shaughnessy and Chuck Longfield at Blackbaud; and Paul Arnsberger at the IRS. We are appreciative of their continued partnership and support of Giving USA, and look forward to working with these external colleagues on future editions of this publication.
Finally, we want to thank our family and friends for their support, love, and understanding during the busiest season of our professional lives.
Sincerely,
Mallory St. Claire, B.S. Co-Managing Editor of Giving USAIndiana University Lilly Family School of Philanthropy
Anna Pruitt, Ph.D.Co-Managing Editor of Giving USAIndiana University Lilly Family School of Philanthropy
Giving USA Acknowledgments
Giving USA FoundationTM | Giving USA 2017 | 13

14 | Giving USA FoundationTM | Giving USA 2017
Giving USA Acknowledgments

Giving USA FoundationTM | Giving USA 2017 | 15
Foreword: Giving USA 2017
In many ways, 2016 was an unusual year. Although economic and political uncertainty pervaded much
of the year, Americans continued to be generous, giving a record $390.05 billion to U.S. charitable organizations, an increase of 2.7 percent over 2015.
Giving by individuals and households continued its remarkable role in American philanthropy, rising by almost 4 percent and driving the growth in total giving. Helping to bolster individual giving, both personal consumption and disposable personal income grew by nearly 4 percent over 2015. Additionally, the S&P 500
finished the year up 9.5 percent after an uneven performance for much of 2016 and a mixed economic picture in 2015.
Three of the four sources of giving rose in 2016. Notably, all nine major types of recipient charities experienced increases in giving as well, just the sixth time in the last four decades that this has occurred.
We are pleased that giving grew virtually across the board, reflecting widespread interest in philanthropy, and suggesting that donors were motivated by a number of varying causes and organizations.
The role of philanthropy in society is evolving, and so are the ways in which Americans engage in philanthropy. We are seeing more innovation and
______________________________________________
Giving by individuals and households continued its remarkable role in American philanthropy...
______________________________________________

collaboration, ranging from the tools and platforms used to give, connect, and volunteer, to the ways people and organizations come together to identify and solve complex societal issues.
Giving USA is evolving too, helping to meet the needs of those who are engaged in philanthropy. We are helping you consider how to understand and take advantage of changes in philanthropy. For example, Giving USA 2017 includes a special chapter about donor-advised funds, and in 2018 we will release an in-depth Giving USA Special Report about this popular approach to giving. And while the rigor and strength of Giving USA’s methodology is unmatched, we are always exploring potential opportunities to build upon the excellence that is our hallmark.
In its 62rd year of publication, Giving USA provides you with the solid knowledge of context, history, and patterns that leads to useful perspectives that can help advance your organization. Throughout the report, our experts and advisors offer sage insights and advice for fundraisers and other philanthropic sector professionals and volunteers.
Giving USA FoundationTM, The Giving Institute, and the Indiana University Lilly Family School of Philanthropy are pleased to continue our partnership in providing the most comprehensive, longest-running, and most rigorously researched resource on U.S. charitable giving. We are privileged to report on Americans’
generosity, the forms it takes, how those patterns and trends unfold over time, and what that means for you.
As we come together to examine this new knowledge, we encourage you to also pause to appreciate the power of voluntary giving that helps individuals and communities come together to improve the way we live.
Sincerely,
Aggie Sweeney, Chair Giving USA FoundationTM
Jeffrey D. Byrne, ChairThe Giving Institute
Amir Pasic, Eugene R. Tempel DeanLilly Family School of PhilanthropyIndiana University
16 | Giving USA FoundationTM | Giving USA 2017
Giving USA Foreword

Giving USA FoundationTM | Giving USA 2017 | 17
Giving USA: Your roadmap to strategic fundraising
As both an intelligence report and practical guide for fundraising
professionals, Giving USA 2017 will help inform and refine your fundraising efforts.
Giving USA’s data is also essential for educating stakeholders and benchmarking your nonprofit against national trends. To help you put the research to immediate work, members of The Giving Institute have contributed their expert advice on converting the data into action.
Applying the research
Tracking how charitable giving has progressed over time—both nationally and at your own organization—provides an insightful backstory to your current circumstances and can help develop tools for planning future fundraising methods. With that knowledge, you can:
Make informed hypotheses about the market for national giving. Use national data to forecast for
________________________________________
Giving USA 2017 arms you with intelligence to inform and refine fundraising efforts... ________________________________________

the future, inform strategic planning, and create models for fundraising campaigns.
Learn how donors are earmarking ways their gifts can be used and assess how these trends might apply to your organization.
Incorporate data and key takeaways into proposals and donor communications.
Enhance your case for support. Identify the origin of your donations and use the data to highlight how your organization corresponds to national data. Then, discuss what you and your donors can accomplish together in light of this information.
Anticipate how national trends might impact your organization and develop plans to harness them for the benefit of your work. For example, there are now more giving methods and vehicles than ever, from apps to financial tools such as donor-advised funds, which allow donors can make charitable gifts quickly and easily.
Pinpointing economic trends
Giving USA helps unravel economic trends (like stock market performance, disposable personal income, GDP, and personal consumption) to show how they correlate to giving by source. Being knowledgeable about these trends can help you build rapport with people
18 | Giving USA FoundationTM | Giving USA 2017
Giving USA Giving USA
Memorial Park Conservancy, photo by Cody Duty

who closely monitor the economy and potentially boost donations.
Personal disposable income is a key variable to understand. Why? Because American individuals account for nearly three-fourths of all donations annually. Monitor this metric to see if expectations need to be shifted up or down in terms of revenue sources.
Performing a self-analysis
Does your organization match national trends in terms of growth/decline? If overall giving went up 2.7 percent, and your subsector only saw 1 percent growth, try to determine reasons for the mismatch.
Where should you focus your outreach? Study the four sources of charitable donations—individuals, estates, foundations, and corporations—then compare trends against your organization’s historic sources of funding. Many nonprofits mistakenly believe that corporations and foundations comprise the bulk of charitable giving, but overwhelmingly, individuals/households are the biggest source.
Do your organization’s stakeholders have the same level of understanding about charitable giving? If not, find ways to bolster their knowledge. Consider distributing concise fact sheets concerning your subsector or national trends, such as the Key Findings from this edition of Giving USA.
Whether this is your first exposure to Giving USA or you’ve been using it for decades, applying the data is an important habit to continue—it should be ingrained in your organizational philosophy. Refer back to this book throughout the year as you communicate with donors, fine-tune your case for support, and plan for a successful future.
With thanks to Jeffrey Byrne (Jeffrey Byrne + Associates), Keith Curtis (The Curtis Group), Donald Fellows (Marts & Lundy), and David King (Alexander Haas).
Giving USA Giving USA
Giving USA FoundationTM | Giving USA 2017 | 19

20 | Giving USA FoundationTM | Giving USA 2017
In 2016, INDIVIDUAL DONORS drove the rise in philanthropic giving
And for only the sixth time in 40 years, all nine major philanthropysubsectors realized giving increases
Where did the generosity come from?*
$390.05 billionGiving by Individuals$281.86 billionincreased 3.9 percent (2.6 percent when inflation- adjusted) over 2015. . . . . . . . . . . . . . . . . . . . . . . . . . .
Giving by Foundations$59.28 billionwas 3.5 percent (2.2 percent when inflation-adjusted) over 2015. . . . . . . . . . . . . . . . . . . . . . . . . . .
Giving by Bequest$30.36 billiondeclined 9.0 percent (10.1 percent when inflation-adjusted) over 2015. . . . . . . . . . . . . . . . . . . . . . . . . . .
Giving by Corporations$18.55 billionincreased 3.5 percent (2.3 percent when inflation-adjusted) over 2015
Contributions by source (by percentage of the total)72%
15%
8%
5%
3.9%
3.5%
9.0%
3.5%
Visit www.GivingUSA.org tolearn more and to order your copy ofGiving USA 2017: The Annual Reporton Philanthropy for the Year 2016.
The single largest contributor to the
growth in total giving was an increase of $10.53
billion in GIVING BY INDIVIDUALS—offsetting
declines frombequest giving.
* All figures on this infographic are reported in current dollars unless otherwise noted.

Giving USA FoundationTM | Giving USA 2017 | 21
390.05 billion 32% Religion $122.94 billion
____________________________________________________________________________
15% Education $59.77 billion____________________________________________________________________________
12% Human Services $46.80 billion____________________________________________________________________________
10% To Foundations $40.56 billion____________________________________________________________________________
8% Health $33.14 billion____________________________________________________________________________
8% Public-Society Benefit $29.89 billion____________________________________________________________________________
5% Arts, Culture, and Humanities $18.21 billion____________________________________________________________________________
6% International Affairs $22.03 billion____________________________________________________________________________
3% Environment/Animals $11.05 billion____________________________________________________________________________
2% To Individuals $7.12 billion____________________________________________________________________________
Giving to international affairs comprised a larger percentage of total
charitable giving in the United States, increasing
from 4 percent to 6 percent in 2016.
Giving to environment/animals increased 7.2 percent
in 2016, the largest gain of any subsector, outpacing growth in overall giving for the last two years.
Giving USA FoundationTM, The Giving Institute, and the Indiana University Lilly Family School of Philanthropy are pleased to continue their partnership in providing the most comprehensive, longest-running, and most rigorously researched resource on U.S. charitable giving, Giving USA: The Annual Report on Philanthropy. It is a privilege to report on Americans’ generosity and related historical trends on U.S. charitable giving.
Where are all of the charitable dollars going?(as a percentage of the total)
Each charitable subsector grew in
2016 except for giving to individuals.
Growth rates rangedfrom approximately
3–7 percent.
20 | Giving USA FoundationTM | Giving USA 2016
Giving USA Giving USA
Un
ited
Way
of
Gre
ater
Ph
ilad
elp
hia
an
d S
ou
ther
n N
ew J
erse
y
22 | Giving USA FoundationTM | Giving USA 2017
Giving USA

This section includes an overview of U.S. giving trends in 2016 by donor and recipient type, including total amounts given and received and the rates of change in giving from 2015.
Giving USA FoundationTM | Giving USA 2017 | 23
1 | KeyFindings

Total estimated charitable giving in the United States rose 2.7 percent between 2015 and 2016 (1.4 percent, adjusted for inflation), to $390.05 billion in contributions. This increase reflects growth in giving to all of the major recipient subsectors, and strong growth in giving by individuals.1
Giving by individuals totaled an estimated $281.86 billion, rising 3.9 percent in 2016 (an increase of 2.6 percent, adjusted for inflation). Itemized giving comprised 81.8 percent of the total estimate for giving by individuals.2 Giving by both itemizing and non-itemizing households increased, at 4.0 percent and 3.4 percent, respectively.
Giving by foundations increased 3.5 percent, to an estimated $59.28 billion in 2015 (an increase of 2.2 percent, adjusted for inflation). These figures are provided by the Foundation Center. Grantmaking by community foundations rose 9.9 percent from 2015. Grantmaking by operating foundations and independent foundations also increased at 4.5 percent and 2.3 percent, respectively.3
Giving by bequest totaled an estimated $30.36 billion in 2016, declining 9.0 percent from 2015 (a 10.1 percent decline, adjusted for inflation).
Giving by corporations is estimated to have increased by 3.5 percent in 2016, totaling $18.55 billion (an increase of 2.3 percent, adjusted for inflation). Corporate giving includes cash and in-kind contributions made through corporate giving programs, as well as grants and gifts made by corporate foundations. Corporate foundation grantmaking is estimated to have totaled $5.53 billion in 2016, which was an increase of 0.3 percent (in current dollars) from 2015.4
Giving to religion increased 3.0 percent between 2015 and 2016, with an estimated $122.94 billion in contributions. Inflation-adjusted giving to the religion subsector was 1.8 percent in 2016.
Giving to education is estimated to have increased 3.6 percent between 2015 and 2016, to $59.77 billion. Adjusted for inflation, giving to education organizations increased 2.3 percent.
Giving to human services increased by an estimated 4.0 percent in 2016, totaling $46.80 billion. Adjusted for inflation, giving to human service organizations increased by 2.7 percent.
Giving USA Key Findings
24 | Giving USA FoundationTM | Giving USA 2017
3.9%
3.5%
3.5%
3.0%
3.6%
4.0%
9.0%

Giving to foundations is estimated to have increased by 3.1 percent in 2016, to $40.56 billion. Adjusted for inflation, giving to foundations increased 1.8 percent.
Giving to health organizations is estimated to have increased by 5.7 percent between 2015 and 2016 (an increase of 4.4 percent, adjusted for inflation), to $33.14 billion.
Giving to public-society benefit organizations increased by an estimated 3.7 percent between 2015 and 2016, to $29.89 billion. Adjusted for inflation, giving to public-society benefit organizations grew 2.5 percent.
Giving to arts, culture, and humanities is estimated to have increased 6.4 percent between 2015 and 2016, to $18.21 billion. Adjusted for inflation, giving to the arts, culture, and humanities subsector increased 5.1 percent.
Giving to international affairs is estimated to be $22.03 billion in 2016, an increase of 5.8 percent from 2015. Adjusted for inflation, giving to international affairs organizations increased 4.6 percent.
Giving to environmental and animal organizations is estimated to have increased 7.2 percent between 2015 and 2016, to $11.05 billion. Adjusted for inflation, donations to the environment/animals subsector increased 5.8 percent.
Giving to individuals is estimated to have declined 2.5 percent (3.7 percent in inflation-adjusted dollars) between 2015 and 2016, to $7.12 billion. The bulk of these donations are in-kind gifts of medications to patients in need, made through the Patient Assistance Programs (PAPs) of pharmaceutical companies’ operating foundations.
Unallocated giving was negative $1.46 billion in 2016. This amount can be considered as the difference between giving by source and by use in any particular year. This amount includes the difference between itemized deductions by individuals (and households) carried over from previous years. The tax year in which a gift is claimed by the donor (carried over) and the year when the recipient organization reports it as revenue (the year in which it is received) may be different.
Giving USA Key Findings
Giving USA FoundationTM | Giving USA 2017 | 25
5.7%
3.7%
6.4%
5.8%
7.2%
2.5%
3.1%

References 1 All data in this section are reported as estimates,
which are subject to revision. To provide the most accurate estimates for charitable giving, as new data become available, Giving USA revises its estimates for at least the last two years. See more about how Giving USA calculates charitable giving by sources and uses in the “Brief summary of methods used” section of this report.
2 Itemized and non-itemized giving calculations include “mega-gifts,” but not disaster giving. See more about how Giving USA calculates charitable giving by sources and uses in the “Brief summary of methods used” section of this report.
3 Data were provided by Foundation Center in April 2017 and are subject to revision. Data on giving by and to foundations are available in Foundation Center’s Key Facts on U.S. Foundations reports, available at Foundation Center’s website at www.foundationcenter.org
4 Data on corporate grantmaking were provided by Foundation Center in April 2017 and are subject to revision. Data on giving by and to foundations are available in Foundation Center’s Key Facts on U.S. Foundations reports, available at Foundation Center’s website at www.foundationcenter.org
Giving USA Key Findings
26 | Giving USA FoundationTM | Giving USA 2017

2 | TheNumbers
This section includes data and contextual information about U.S. giving trends, including:
Giving USA pie charts on giving by source and to recipient organizations in 2016
40 years of trend data on total giving
graphed rates of change in giving in the last two years by source and to recipient organizations
40 years of trend data on giving by source and to recipient organizations
trends on giving by source compared with specific economic factors
trends on U.S. volunteering
trends on the number of U.S. charities
Giving USA FoundationTM | Giving USA 2017 | 27

28 | Giving USA FoundationTM | Giving USA 2017
Giving USA The Numbers

Giving by individuals comprised 72 percent of total giving in 2016.1
Giving by foundations—which includes grants made by independent, community, and operating foundations—amounted to 15 percent of all gifts made in 2016.2
Giving by bequest accounted for 8 percent of all gifts made in 2016.
Giving by individuals, bequest, and family foundations amounted to an estimated 87 percent of total giving in 2016.3
Giving by corporations comprised 5 percent of total giving in 2016.
2016 contributions: $390.05 billion by source of contributions (in billions of dollars – all figures are rounded)
Giving USA The Numbers
Giving USA FoundationTM | Giving USA 2017 | 29
Foundations$59.28
Individuals$281.86
Corporations$18.55
Bequests$30.36
15%72%
8%
5%

Religious organizations received the largest share of charitable dollars in 2016, at 32 percent of the total.4
The education subsector received the second-largest share of charitable dollars in 2016, at 15 percent of the total.
Human services organizations received 12 percent of total charitable dollars in 2016, ranking third in total gifts received.
2016 contributions: $390.05 billion by type of recipient organization(in billions of dollars – all figures are rounded)
30 | Giving USA FoundationTM | Giving USA 2017
Giving USA The Numbers
Religion$122.94
Education$59.77
Human services$46.80
Gifts to grantmaking foundations
$40.56
Health$33.14
Public-society benefit$29.89
Arts, culture, and humanities
$18.21
International affairs$22.03
Environment/animals$11.05
To individuals$7.12
32%
15%
12%
10%
8%
8%
5%6%
3%2%

Gifts to independent, community, and operating grantmaking foundations amounted to the fourth-largest share of charitable dollars in 2016, with 10 percent of the total.
The health subsector received 8 percent of the total, ranking fifth in total gifts received.
Public-society benefit organizations also received 8 percent of the total and amounted to the sixth-largest share of charitable dollars.
Gifts to the international affairs subsector received the seventh-largest share of gifts in 2016, with 6 percent of the total.
The arts, culture, and humanities subsector received the eighth-largest proportion of charitable dollars in 2016, at 5 percent of the total.
Environment/animals organizations received 3 percent of total charitable dollars in 2016, ranking ninth in total gifts received.
Gifts made directly to individuals amounted to 2 percent of total charitable dollars in 2016.
2016 contributions: $390.05 billion by type of recipient organization(in billions of dollars – all figures are rounded)
Giving USA The Numbers
Giving USA FoundationTM | Giving USA 2017 | 31

Total charitable giving increased 4.0 percent in current dollars between 2014 and 2015, and increased 2.7 percent between 2015 and 2016.5
The two-year change in total charitable giving between 2014 and 2016 is 6.8 percent in current dollars.
Giving by individuals increased 3.9 percent in current dollars between 2014 and 2015. This is level with an increase of 3.9 percent between 2015 and 2016. The cumulative change in current-dollar giving by individuals between 2014 and 2016 is 8.0 percent.
Current-dollar grantmaking by independent, community, and operating foundations increased 4.3 percent between 2014 and 2015. This increase precedes a more modest rise in foundation giving of 3.5 percent between 2015 and 2016. The cumulative change in current-dollar giving by foundations between 2014 and 2016 is 8.0 percent.6
Changes in giving by source 2014–2015 and 2015–2016, and 2014–2016 cumulative (in current dollars)
32 | Giving USA FoundationTM | Giving USA 2017
Giving USA The Numbers
Total
Individuals
Foundations
Bequests
Corporations
4.0%6.8%
8.0%
8.0%
-2.3%
2.7%
2.7%
3.9%
3.9%
4.3%
3.5%
7.3%
-9.0%
-0.8%
3.5%
2014 to 2016, cumulative*
Percentage change from previous year *The two-year change is calculated separately and is not the sum of the changes in the two years.
2014–2015 2015–2016

Giving by bequest increased 7.3 percent in current dollars between 2014 and 2015. This increase precedes a decline of 9.0 percent between 2015 and 2016. The cumulative change in current-dollar giving by bequest between 2014 and 2016 is a decline of 2.3 percent.
Giving by corporations declined 0.8 percent in current dollars between 2014 and 2015. This drop precedes an increase of 3.5 percent between 2015 and 2016. The cumulative change in current-dollar giving by corporations between 2014 and 2016 is 2.7 percent.
Changes in giving by source 2014–2015 and 2015–2016, and 2014–2016 cumulative (in current dollars)
Giving USA The Numbers
Giving USA FoundationTM | Giving USA 2017 | 33

Total charitable giving increased 3.8 percent in inflation-adjusted dollars between 2014 and 2015, and increased 1.4 percent between 2015 and 2016.7
The two-year change in total charitable giving between 2014 and 2016 is 5.3 percent in inflation-adjusted dollars.
Giving by individuals grew 3.7 percent in inflation-adjusted dollars between 2014 and 2015. This growth precedes an increase of 2.6 percent between 2015 and 2016. The cumulative change in inflation-adjusted giving by individuals between 2014 and 2016 is 6.4 percent.
Inflation-adjusted-dollar grantmaking by independent, community, and operating foundations increased 4.1 percent between 2014 and 2015. This increase precedes a more modest rise in foundation giving of 2.2 percent between 2015 and 2016. The cumulative change in inflation-adjusted giving by foundations between 2014 and 2016 is 6.4 percent.8
Changes in giving by source 2014–2015 and 2015–2016, and 2014–2016 cumulative(in inflation-adjusted dollars, 2016 = $100)
34 | Giving USA FoundationTM | Giving USA 2017
Giving USA The Numbers
Total
Individuals
Foundations
Bequests
Corporations
3.8%5.3%
6.4%
6.4%
-3.7%
1.2%
1.4%
3.7%
2.6%
4.1%
2.2%
7.1%
-10.1%
-1.0%
2.3%
2014 to 2016, cumulative*
Percentage change from previous year *The two-year change is calculated separately and is not the sum of the changes in the two years.
2014–2015 2015–2016

Giving by bequest increased 7.1 percent in inflation-adjusted dollars between 2014 and 2015. This increase precedes a decline of 10.1 percent between 2015 and 2016. The cumulative change in inflation-adjusted giving by bequest between 2014 and 2016 is a drop of 3.7 percent.
Giving by corporations declined 1.0 percent in inflation-adjusted dollars between 2014 and 2015. This drop precedes a rise of 2.3 percent between 2015 and 2016. The cumulative change in inflation-adjusted giving by corporations between 2014 and 2016 is 1.2 percent.
Changes in giving by source 2014 to 2015 and 2015 to 2016, and 2014 to 2016 cumulative(in inflation-adjusted dollars, 2016 = $100)
Giving USA The Numbers
Giving USA FoundationTM | Giving USA 2017 | 35
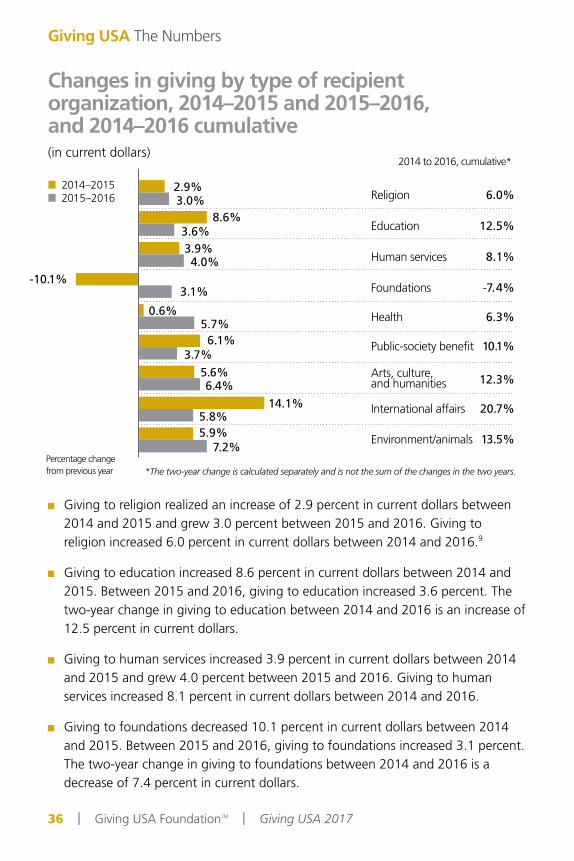
Giving to religion realized an increase of 2.9 percent in current dollars between 2014 and 2015 and grew 3.0 percent between 2015 and 2016. Giving to religion increased 6.0 percent in current dollars between 2014 and 2016.9
Giving to education increased 8.6 percent in current dollars between 2014 and 2015. Between 2015 and 2016, giving to education increased 3.6 percent. The two-year change in giving to education between 2014 and 2016 is an increase of 12.5 percent in current dollars.
Giving to human services increased 3.9 percent in current dollars between 2014 and 2015 and grew 4.0 percent between 2015 and 2016. Giving to human services increased 8.1 percent in current dollars between 2014 and 2016.
Giving to foundations decreased 10.1 percent in current dollars between 2014 and 2015. Between 2015 and 2016, giving to foundations increased 3.1 percent. The two-year change in giving to foundations between 2014 and 2016 is a decrease of 7.4 percent in current dollars.
Changes in giving by type of recipient organization, 2014–2015 and 2015–2016, and 2014–2016 cumulative(in current dollars)
36 | Giving USA FoundationTM | Giving USA 2017
Giving USA The Numbers
Religion 6.0%
Education 12.5%
Human services 8.1%
Foundations -7.4%
Health 6.3%
Public-society benefit 10.1%
Arts, culture, 12.3%and humanities
International affairs 20.7%
Environment/animals 13.5%
2014 to 2016, cumulative*
2.9%
8.6%3.6%3.9%4.0%
-10.1%3.1%
3.0%
5.7%6.1%
3.7%5.6%6.4%
5.8%5.9%
7.2%
14.1%
0.6%
Percentage change from previous year *The two-year change is calculated separately and is not the sum of the changes in the two years.
2014–2015 2015–2016

Giving USA The Numbers
Giving USA FoundationTM | Giving USA 2017 | 37
Giving to health realized an increase of 0.6 percent in current dollars between 2014 and 2015 and grew 5.7 percent between 2015 and 2016. Giving to health increased 6.3 percent in current dollars between 2014 and 2016.
Giving to the public-society benefit subsector increased 6.1 percent in current dollars between 2014 and 2015. Between 2015 and 2016, giving to public-society benefit organizations increased 3.7 percent. The two-year change in giving to public-society benefit organizations between 2014 and 2016 is an increase of 10.1 percent in current dollars.
Giving to the arts, culture, and humanities subsector increased 5.6 percent in current dollars between 2014 and 2015. Between 2015 and 2016, giving to arts, culture, and humanities organizations increased 6.4 percent. The two-year change in giving to arts, culture, and humanities organizations between 2014 and 2016 is an increase of 12.3 percent in current dollars.
Giving to international affairs increased 14.1 percent in current dollars between 2014 and 2015 and increased 5.8 percent between 2015 and 2016. Giving to international affairs increased 20.7 percent in current dollars between 2014 and 2016.
Giving to environmental and animal organizations increased 5.9 percent in current dollars between 2014 and 2015 and grew 7.2 percent between 2015 and 2016. Giving to environmental and animal organizations increased 13.5 percent in current dollars between 2014 and 2016.
Changes in giving by type of recipient organization, 2014–2015 and 2015–2016, and 2014–2016 cumulative(in current dollars)

Giving to religion realized an increase of 2.7 percent in inflation-adjusted dollars between 2014 and 2015 and grew 1.8 percent between 2015 and 2016. Giving to religion increased 4.5 percent in inflation-adjusted dollars between 2014 and 2016.10
Giving to education increased 8.4 percent in inflation-adjusted dollars between 2014 and 2015. Between 2015 and 2016, giving to education increased 2.3 percent. The two-year change in giving to education between 2014 and 2016 is an increase of 10.9 percent in inflation-adjusted dollars.
Giving to human services increased 3.7 percent in inflation-adjusted dollars between 2014 and 2015 and grew 2.7 percent between 2015 and 2016. Giving to human services grew 6.6 percent in inflation-adjusted dollars between 2014 and 2016.
Giving to foundations decreased 10.3 percent in inflation-adjusted dollars between 2014 and 2015. Between 2015 and 2016, giving to foundations increased 1.8 percent. The two-year change in giving to foundations between 2014 and 2016 is a decrease of 8.7 percent in inflation-adjusted dollars.
Changes in giving by type of recipient organization, 2014–2015 and 2015–2016, and 2014–2016 cumulative(in inflation-adjusted dollars, 2016 = $100)
38 | Giving USA FoundationTM | Giving USA 2017
Giving USA The Numbers
Percentage change from previous year *The two-year change is calculated separately and is not the sum of the changes in the two years.
Religion 4.5%
Education 10.9%
Human services 6.6%
Foundations -8.7%
Health 4.8%
Public-society benefit 8.5%
Arts, culture, 10.7%and humanities
International affairs 19.0%
Environment/animals 11.8%
2014–2015 2015–2016
2014 to 2016, cumulative*
2.7%
8.4%2.3%
3.7%2.7%
-10.3%1.8%
1.8%
4.4%
5.9%2.5%
5.3%5.1%
4.6%
5.7%5.8%
13.8%
0.3%

Giving to health realized an increase of 0.3 percent in inflation-adjusted dollars between 2014 and 2015 and grew 4.4 percent between 2015 and 2016. Giving to health grew 4.8 percent in inflation-adjusted dollars between 2014 and 2016.
Giving to the public-society benefit subsector increased 5.9 percent in inflation-adjusted dollars between 2014 and 2015. Between 2015 and 2016, giving to public-society benefit organizations increased 2.5 percent. The two-year change in giving to public-society benefit organizations between 2014 and 2016 is an increase of 8.5 percent in inflation-adjusted dollars.
Giving to the arts, culture, and humanities subsector increased 5.3 percent in inflation-adjusted dollars between 2014 and 2015. Between 2015 and 2016, giving to arts, culture, and humanities organizations increased 5.1 percent. The two-year change in giving to arts, culture, and humanities organizations between 2014 and 2016 is an increase of 10.7 percent in inflation-adjusted dollars.
Giving to international affairs increased 13.8 percent in inflation-adjusted dollars between 2014 and 2015 and increased 4.6 percent between 2015 and 2016. Giving to international affairs increased 19.0 percent in inflation-adjusted dollars between 2014 and 2016.
Giving to environmental and animal organizations increased 5.7 percent in inflation-adjusted dollars between 2014 and 2015 and 5.8 percent between 2015 and 2016. Giving to environment and animals organizations increased 11.8 percent in inflation-adjusted dollars between 2014 and 2016.
Changes in giving by type of recipient organization, 2014–2015 and 2015–2016, and 2014–2016 cumulative(in inflation-adjusted dollars, 2016 = $100)
Giving USA The Numbers
Giving USA FoundationTM | Giving USA 2017 | 39

Total giving reached $390.05 billion in 2016, a 2.7 percent increase in current dollars and a 1.4 percent increase in inflation-adjusted dollars.11
Total charitable giving has increased in current dollars every year since 1976, with the exception of three years that saw declines: 1987, 2008, and 2009.12 The average rate of change in total giving in current dollars since 1976 is 6.7 percent, making the rate of change between 2015 and 2016 lower than average.
Adjusted for inflation, total charitable giving has declined eight times since 1976. The average rate of change in total giving in inflation-adjusted dollars since 1976 is 2.9 percent, making the inflation-adjusted rate of change between 2015 and 2016 lower than average.
The year 2009 was the last year of the Great Recession. For the years 2009 to 2016, the rate of change in total inflation-adjusted giving is 26.9 percent. Total charitable giving has grown $82.68 billion in inflation-adjusted dollars since 2009.
In 2016, total giving and giving by foundations and individuals matched or exceeded their previous inflation-adjusted highs. On the recipient side of giving, all but three charitable subsectors have matched or exceeded their previous highs; giving to international affairs, foundations, and individuals have not yet surpassed their prior peaks.
Total giving, 1976–2016 (in billions of dollars)
40 | Giving USA FoundationTM | Giving USA 2017
Giving USA The Numbers
400
350
300
250
200
150
100
50
01976 1981 1986 1991 1996 2001 2006 2011 2016
390.05Inflation-adjusted dollarsCurrent dollarsInflation-adjusted dollars in recession

Giving by individuals, 1976–2016 (in billions of dollars)
Estimated charitable giving by individuals (and households) was $281.86 billion in 2016, an increase of 3.9 percent from 2015 (in current dollars). Adjusted for inflation, giving by individuals increased 2.6 percent in 2016.13
The total amount estimated for giving by individuals in 2016 includes itemized and non-itemized charitable contributions. Contributions include gifts of cash, securities, and property.
For the year 2016, it is estimated that giving by itemizing individuals grew 4.0 percent and giving by non-itemizing individuals grew 3.4 percent.14
In a reversal of recent trends, very large “mega-gifts” by individuals were not as prominent in 2016. The total amount of charitable giving by individuals includes an estimated $1.495 billion in mega-gifts.15
Giving USA The Numbers
Giving USA FoundationTM | Giving USA 2017 | 41
1976 1981 1986 1991 1996 2001 2006 2011 2016
26.3245.99
67.0981.93
107.35
173.06
224.76213.91
281.86228.29
267.57
234.50
164.14144.50
146.81121.35
111.05
Inflation-adjusted dollarsCurrent dollars
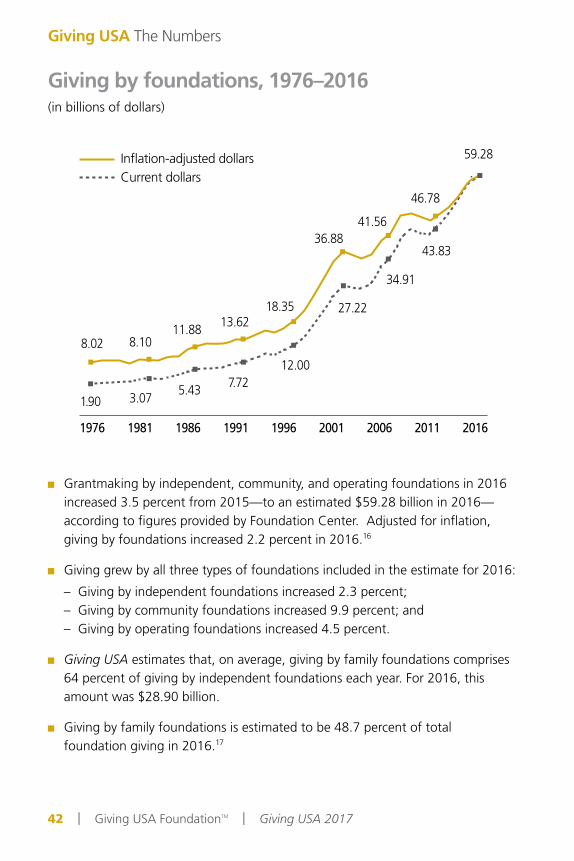
Grantmaking by independent, community, and operating foundations in 2016 increased 3.5 percent from 2015—to an estimated $59.28 billion in 2016—according to figures provided by Foundation Center. Adjusted for inflation, giving by foundations increased 2.2 percent in 2016.16
Giving grew by all three types of foundations included in the estimate for 2016:
– Giving by independent foundations increased 2.3 percent; – Giving by community foundations increased 9.9 percent; and – Giving by operating foundations increased 4.5 percent.
Giving USA estimates that, on average, giving by family foundations comprises 64 percent of giving by independent foundations each year. For 2016, this amount was $28.90 billion.
Giving by family foundations is estimated to be 48.7 percent of total foundation giving in 2016.17
Giving by foundations, 1976–2016(in billions of dollars)
42 | Giving USA FoundationTM | Giving USA 2017
Giving USA The Numbers
1976 1981 1986 1991 1996 2001 2006 2011 2016
1.90 3.07 5.43 7.7212.00
27.22
34.91
43.83
59.28
46.78
41.5636.88
18.3513.6211.88
8.108.02
Inflation-adjusted dollarsCurrent dollars

Giving by bequest, 1976–2016(in billions of dollars)
Charitable giving by bequest is estimated to have declined 9.0 percent in current dollars between 2015 and 2016, to $30.36 billion.18
Adjusted for inflation, giving by bequest declined 10.1 percent in 2016.
The total amount for giving by bequest in 2016 includes an estimated amount for charitable bequests from estates with assets of $5 million and above, estates with assets between $1 million and $5 million, and estates with assets below $1 million. For 2016:
– Estimated bequest giving from estates with assets of $5 million and above amounted to $17.15 billion.
– Estimated bequest giving from estates with assets between $1 million and $5 million amounted to $6.53 billion.
– Estimated bequest giving from estates with assets below $1 million amounted to $6.68 billion.
Giving USA The Numbers
Giving USA FoundationTM | Giving USA 2017 | 43
1976 1981 1986 1991 1996 2001 2006 2011 2016
2.30 3.585.70
7.68
12.03
20.1521.90
25.18
30.3626.87
26.0727.30
18.39
13.5412.47
9.459.70
Inflation-adjusted dollarsCurrent dollars

Charitable giving by corporations increased by an estimated 3.5 percent in 2016 from 2015, totaling $18.55 billion. Adjusted for inflation, giving by corporations increased 2.3 percent in 2016.19
Corporate giving includes cash and in-kind contributions made through corporate giving programs, as well as grants and gifts made by corporate foundations.
According to Foundation Center, corporate foundation grantmaking rose 0.3 percent in 2016, amounting to $5.53 billion.20
In 2016, U.S. Gross Domestic Product (GDP) increased 3.0 percent over 2015,21 and corporate pre-tax profits rose 2.7 percent.22 Both of these economic indicators have been found to positively affect corporate giving.
Analysis of data from CECP’s 2017 Giving in Numbers survey of leading global companies, conducted in association with The Conference Board, reveals that nearly half (48 percent) of 209 of the largest U.S. and internationally based companies increased their giving from 2014 to 2016.23
Giving by corporations, 1976–2016(in billions of dollars)
44 | Giving USA FoundationTM | Giving USA 2017
Giving USA The Numbers
1976 1981 1986 1991 1996 2001 2006 2011 2016
1.332.64
5.03 5.25
7.51
11.66
14.52
15.58
18.5516.63
17.29
15.80
11.489.26
11.01
6.97 5.61
Inflation-adjusted dollarsCurrent dollars

Giving by source: Percentage of the total in five-year spans, 1977–2016(in billions of inflation-adjusted dollars, 2016 = $100)
Giving USA The Numbers
Giving USA FoundationTM | Giving USA 2017 | 45
Giving by individuals has declined considerably as a percentage of total giving over the last 40 years, from 84 percent in the first five-year period beginning in 1977 to 72 percent in the last five-year period beginning in 2012.24
Giving by foundations has grown substantially as a percentage of total giving over the last 40 years, from 6 percent in the first five-year period to 15 percent in the last five-year period.
Giving by bequest has captured between 6 percent and 9 percent of total giving over the last 40 years, reaching its highest points in the 1992–1996 period and the 1997–2001 period.
Giving by corporations has consistently comprised between 5 percent and 6 percent of total giving. For the last four five-year periods, corporate giving was at 5 percent.
1977–1981 1982–1986 1987–1991 1992–1996 1997–2001 2002–2006 2007–2011 2012–20165% 6% 6% 6% 5% 5% 5% 5%
7% 7% 9% 9% 8% 8% 8%7% 8% 10% 11% 14% 15%
6%
6%6%
84% 81% 80% 78% 76% 76% 73% 72%
Individuals Foundations Bequests Corporations

Total giving by source in five-year spans, 1977–2016 (in billions of inflation-adjusted dollars, 2016 = $100)
Individuals Foundations Bequests Corporations
46 | Giving USA FoundationTM | Giving USA 2017
Giving USA The Numbers
The average rate of change in total giving by source between each five-year period in the last 40 years was 15.2 percent.25 Total giving saw especially strong growth between the two five-year periods beginning in 1992 and 2002. Between the five-year periods beginning in 1992 and 1997, total giving grew 45.3 percent. Between the five-year periods beginning in 1997 and 2002, total giving rose 16.3 percent.
Giving by individuals grew the most between the five-year periods beginning in 1992 and 1997, at 42.4 percent. This giving source realized a decline between the five-year periods beginning in 2002 and 2007, at -5.9 percent.26
Giving by foundations increased the most between the five-year periods beginning in 1992 and 1997, at 80.5 percent. This giving source did not decline once between any of these five-year periods.27
Giving by bequest saw its largest period of growth between the five-year periods beginning in 1992 and 1997, at 49.5 percent. Giving by bequest did not realize any declines between any five-year periods in the last 40 years.
Giving by corporations increased the most between the five-year periods beginning in 1977 and 1982, with a 45.3 percent gain. This giving source realized its smallest growth period between the five-year periods beginning in 2002 and 2007, at 0.6 percent.28
47.5 51.7 55.2 70.9 79.2 79.7 89.354.8 66.5 83.8 125.3 131.0 136.4 146.548.5 64.5 81.2146.6
188.5 231.2 272.8
32.743.139.6
764.1
984
721.8
904
649.2
800 1,087.7
1,430
1,264.4
1,663
1,189.7
1,637
1,326.3
1,835
711
596.0
1977–1981 1982–1986 1987–1991 1992–1996 1997–2001 2002–2006 2007–2011 2012–2016

Trends in total giving, 1976–2016(in billions of dollars)
Total charitable giving reached $390.05 billion in 2016, increasing by $10.16 billion in current dollars from 2015.29
The average year-to-year change in total giving between 1976 and 2016 was an increase of $8.96 billion (in current dollars), making the current-dollar change in total giving between 2015 and 2016 much larger than the 40-year average.
Because $100.00 in 2016 was worth $98.80 in 2015, the rise in the total amount given between 2015 and 2016 in inflation-adjusted dollars was less than what it was in current dollars. Total giving increased $5.53 billion in inflation-adjusted dollars between 2015 and 2016.
The average year-to-year inflation-adjusted change in total giving between 1976 and 2016 was an increase of $6.39 billion, making the inflation-adjusted change in total giving between 2015 and 2016 lower than the average for the 40-year period.
Since 1977, total giving in current dollars grew the most in the 10-year period 1977–1986, at 136.4 percent. The slowest 10-year period of growth for total current-dollar giving was 2007-2016, at 25.4 percent.
Since 1977, total giving in inflation-adjusted dollars grew the most in the 10-year period 1997-2006, at 45.2 percent. The slowest 10-year period of growth for total inflation-adjusted giving was 2007–2016, at 8.3 percent.
Giving USA The Numbers
Giving USA FoundationTM | Giving USA 2017 | 47
1976 1981 1986 1991 1996 2001 2006 2011 2016
31.8555.28
83.25102.58
138.89
232.09
296.09 298.50
390.05
318.57352.49
314.48
212.36180.92182.17
145.87134.38
Inflation-adjusted dollarsCurrent dollars

Several economic factors relate to how much donors give to charity each year. Gross Domestic Product (GDP) is one of those factors. GDP is defined as the market value of all goods and services produced within a country’s borders within a specific period of time. It is one of the most important factors considered in measuring the status of a nation’s economic health.30
GDP increased in inflation-adjusted dollars by 1.7 percent between 2015 and 2016.31 This rate of change is compared with inflation-adjusted growth in total giving of 1.4 percent. Total giving as a percentage of GDP in 2016 was 2.1 percent.
Prior to the 40-year period 1976–2016, total giving was consistently at or above 2.0 percent of GDP. This percentage fell to below 2.0 percent throughout most of the 1970s, 1980s, and 1990s. Total giving as a percentage of GDP rose to 2.0 percent and above through most of the 2000s but then dropped to 1.9 percent in the years 2009 to 2011. Total giving as a percentage of GDP was 2.1 percent for three of the four years, 2013–2016.
Total giving as a percentage of Gross Domestic Product, 1976–2016 (in inflation-adjusted dollars, 2016 = $100)
48 | Giving USA FoundationTM | Giving USA 2017
Giving USA The Numbers
1976 1981 1986 1991 1996 2001 2006 2011 20161976 1981 1986 1991 1996 2001 2006 2011 2016
1.7% 1.7% 1.8% 1.7% 1.7%
1.9%
2.2% 2.1% 2.1%

Total charitable giving graphed with the Standard & Poor’s 500 Index, 1976–2016(in billions of inflation-adjusted dollars, 2016 = $100)
Research has found a statistically significant correlation between changes in total giving and values on the Standard & Poor’s 500 Index (S&P 500). Because stock market values are an indicator of financial and economic security, households and corporations are more likely to give when the stock market is up.
The direction of change and the robustness of growth in total giving generally lags slightly behind the S&P 500. However, policy changes that affect giving can mediate the connection between giving and stock values.
The S&P 500 generally sees more dramatic changes from year to year than total giving. The inflation-adjusted range of change in the S&P 500 in the last 10-year period (2007 to 2016) was -40.7 percent to 27.7 percent.32 This is compared with inflation-adjusted total giving ranging from a change of -8.0 percent to 9.1 percent during this same period.
The S&P 500 grew 8.2 percent in inflation-adjusted dollars between 2015 and 2016. This is compared with an increase in inflation-adjusted total giving of 1.4 percent.
Giving USA The Numbers
Giving USA FoundationTM | Giving USA 2017 | 49
1976 1981 1986 1991 1996 2001 2006 2011 2016 Tota
l cha
ritab
le g
iving
, infl
atio
n ad
just
ed to
201
6 do
llars
S&P
500
Inde
x, in
flatio
n ad
just
ed to
201
6 do
llars 2,200
2,000
1,800
1,600
1,400
1,200
1,000
800
600
400
200
0
400
350
300
250
200
150
100
50
0
S&P 500 in 2016 dollars
Total giving in 2016 dollars
1976 1981 1986 1991 1996 2001 2006 2011 2016

Disposable personal income is tied to a household’s total income, which is a key determinant in how much a household gives. For many households, how much they give depends on their spendable income, or disposable (personal) income. This type of income is that which is available after taxes have been paid.33
In 2016, disposable income increased 3.9 percent (in current dollars) from 2015. This is compared with growth in disposable income of 3.8 percent between 2014 and 2015.34
Individual giving as a percentage of disposable personal income (in current dollars) remained stable at 2.0 percent in 2016,�the same percentage as in the years 2012 to 2015.
In the last 40 years, individual giving as a percentage of disposable personal income was at its highest in 2000, when it reached 2.4 percent. Its lowest point was in 1995, when it dropped to 1.7 percent.
Individual giving as a percentage of disposable personal income, 1976–2016(in current dollars)
50 | Giving USA FoundationTM | Giving USA 2017
Giving USA The Numbers
1976 1981 1986 1991 1996 2001 2006 2011 2016
2.0% 2.1% 2.1%2.3% 2.2%
1.8%2.0%
1.8% 1.9%

Corporate giving as a percentage of corporate pre-tax profits, 1976–2016(in current dollars)
Corporate pre-tax profits are a significant factor in how much corporations give each year, and changes in corporate giving closely follow corporate pre-tax profits.
Giving by corporations, which includes grants from corporate foundations, is estimated to be 0.8 percent of corporate pre-tax profits for 2016.35 This is level with the 0.8 percent figure in 2015 and 2014.
Corporate giving as a percentage of corporate pre-tax profits was at its highest point in the mid-1980s, when it reached 2.0 percent in 1986.
In the last four decades, since 1976, corporate giving as a percentage of corporate pre-tax profits has averaged 1.1 percent. The average rate of growth of corporate giving was 7.2 percent, and the average rate of growth of corporate pre-tax profits was also 7.2 percent during the same period.
Giving USA The Numbers
Giving USA FoundationTM | Giving USA 2017 | 51
0.7%
1.1%
2.0%
1.6%
0.8% 0.9% 0.8%
1.2%1.0%
1976 1981 1986 1991 1996 2001 2006 2011 20161976 1981 1986 1991 1996 2001 2006 2011 2016

Contributions to the religion subsector comprised 32 percent of all donations received by charities in 2016.36
Giving to religious organizations increased 3.0 percent in current dollars from 2015, totaling $122.94 billion. Adjusted for inflation, giving to religion grew 1.8 percent from 2015.
Contributions to religion in 2016 totaled the highest inflation-adjusted amount recorded to date.
64 percent of religious organizations surveyed by the Nonprofit Research Collaborative reported increases in giving in 2016 over 2015.37
Online giving to religious organizations analyzed by the Blackbaud Index grew in 2016 over 2015 and outpaced growth from giving through more traditional methods.38
Giving to religion, 1976–2016(in billions of dollars)
52 | Giving USA FoundationTM | Giving USA 2017
Giving USA The Numbers
1976 1981 1986 1991 1996 2001 2006 2011 2016
14.1825.05
41.68
50.0061.90
79.87
94.63101.78
122.94108.62112.65
108.22
94.6588.1891.20
66.0959.83
Inflation-adjusted dollarsCurrent dollars

Giving to education, 1976–2016(in billions of dollars)
Giving to the education subsector amounted to 15 percent of total giving in 2016.39
Contributions to education organizations increased 3.6 percent between 2015 and 2016, to $59.77 billion. Adjusted for inflation, giving to education organizations increased 2.3 percent.
For the year 2016, contributions to education totaled the highest inflation-adjusted value recorded to date.
According to the Council for Aid to Education (CAE), contributions to higher education institutions increased 1.7 percent in 2016, though this gain is nearly eliminated upon adjusting for inflation.40
Giving to higher education in 2016 was boosted by several million-dollar gifts, in support of fellowships, endowments, and medical research initiatives.41
Giving USA The Numbers
Giving USA FoundationTM | Giving USA 2017 | 53
1976 1981 1986 1991 1996 2001 2006 2011 2016
3.595.93
8.4612.10
17.94
28.07
40.07
42.92
59.77
45.8147.70
38.04
27.4321.34
18.5115.6515.15
Inflation-adjusted dollarsCurrent dollars
1976 1981 1986 1991 1996 2001 2006 2011 2016

Contributions to the human services subsector comprised 12 percent of all donations received by charities in 2016.42
Giving to human services organizations grew 4.0 percent in 2016, totaling $46.80 billion. Adjusted for inflation, giving to human services increased 2.7 percent between 2015 and 2016.
Contributions to human services in 2016 totaled the highest inflation-adjusted amount recorded to date.
The majority of human services organizations surveyed by the Nonprofit Research Collaborative reported increases in giving in 2016 over 2015. In addition, a larger percentage of human services organizations reported increases in giving than did the percentage of charitable organizations overall.43
Human services organizations analyzed by the Blackbaud Index saw a greater increase in online giving than giving through other methods. Charitable receipts received in 2016 increased the most during the three-month period of September, October, and November, as compared to 2015.44
Giving to human services, 1976–2016(in billions of dollars)
Giving USA The Numbers
54 | Giving USA FoundationTM | Giving USA 2017
1976 1981 1986 1991 1996 2001 2006 2011 2016
4.03 4.59 3.777.50
11.97
24.28
30.74
37.40
46.80
39.9136.60
32.90
18.30
13.23
8.2512.11
17.00
Inflation-adjusted dollarsCurrent dollars

Giving to foundations, 1978–2016*(in billions of dollars)
Giving to foundations amounted to 10 percent of total giving in 2016.45
Giving to foundations increased 3.1 percent in 2016, to $40.56 billion in contributions. Adjusted for inflation, giving to foundations increased 1.8 percent.
The estimate for giving to foundations includes gifts made to independent, community, and operating foundations.
Giving to foundations reached its highest inflation-adjusted mark in 2014, at $44.41 billion.
Giving USA The Numbers
Giving USA FoundationTM | Giving USA 2017 | 55
1976 1981 1986 1991 1996 2001 2006 2011 2016*Giving to foundations began to be reported in 1978.
4.962.39
4.46
12.63
25.67
27.10 30.20
40.5632.23
32.26
34.78
19.31
7.8710.85
6.31
Inflation-adjusted dollarsCurrent dollars

Contributions to the health subsector comprised 8 percent of all donations received by charities in 2016.46
Giving to health organizations grew 5.7 percent in 2016, totaling $33.14 billion. Adjusted for inflation, giving to health increased 4.4 percent between 2015 and 2016.
For the year 2016, contributions to health totaled the highest inflation-adjusted value recorded to date.
Compared with charitable organizations of all types, a greater proportion of health organizations surveyed by the Nonprofit Research Collaborative reported increases in giving in 2016 as compared with 2015.47
Online giving to healthcare organizations analyzed by the Blackbaud Index grew 11.9 percent in 2016 over 2015.48
Large gifts to health went to support medical research, medical centers and hospitals, and health charities in 2016.49
Giving to health, 1976–2016(in billions of dollars)
Giving USA The Numbers
56 | Giving USA FoundationTM | Giving USA 2017
1976 1981 1986 1991 1996 2001 2006 2011 2016
3.74 4.63 4.37
7.63
18.35
16.41
24.2225.86
33.1427.60
28.83
22.24
28.06
13.46
9.5612.22
15.78
Inflation-adjusted dollarsCurrent dollars

Giving to public-society benefit, 1976–2016(in billions of dollars)
Giving to public-society benefit organizations amounted to 8 percent of total giving in 2016.50
Contributions to the public-society benefit subsector increased 3.7 percent in 2016, to $29.89 billion in contributions. Adjusted for inflation, giving to public-society benefit organizations increased 2.5 percent.
The total for contributions to public-society benefit reached its highest inflation-adjusted value in 2016.
Online giving to public-society benefit organizations analyzed by the Blackbaud Index grew 12.7 percent compared with 2015, far outpacing giving received through all types of channels combined.51
Public-society benefit organizations surveyed by the Nonprofit Research Collaborative reported mixed results for 2016 charitable gifts received. Only 29 percent of public-society benefit organizations reported an increase in giving in 2016 from 2015, while 40 percent of respondents reported that giving had stayed the same as 2015.52
Giving USA The Numbers
Giving USA FoundationTM | Giving USA 2017 | 57
1976 1981 1986 1991 1996 2001 2006 2011 2016
1.48 2.13
7.666.73
9.40
16.56
23.16
21.35
29.89
22.79
27.57
22.44
14.37
11.87
16.76
5.626.24
Inflation-adjusted dollarsCurrent dollars
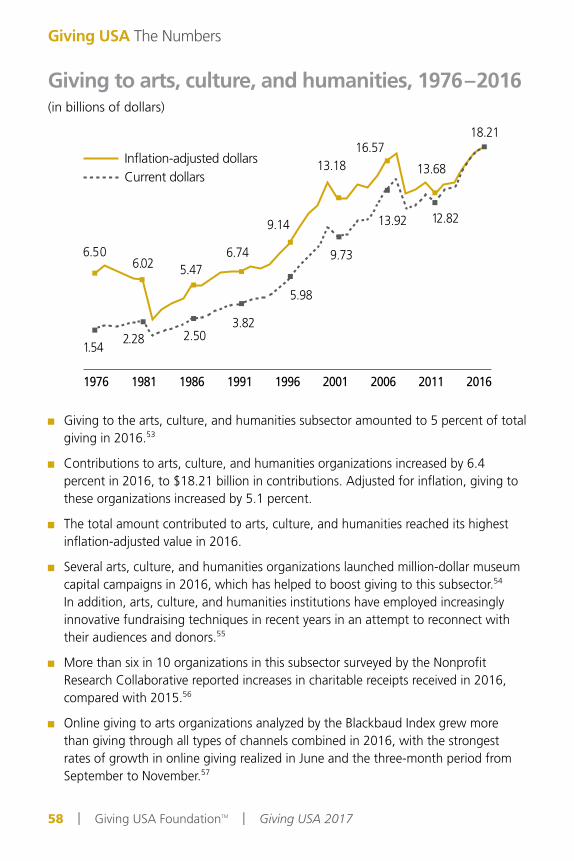
Giving to the arts, culture, and humanities subsector amounted to 5 percent of total giving in 2016.53
Contributions to arts, culture, and humanities organizations increased by 6.4 percent in 2016, to $18.21 billion in contributions. Adjusted for inflation, giving to these organizations increased by 5.1 percent.
The total amount contributed to arts, culture, and humanities reached its highest inflation-adjusted value in 2016.
Several arts, culture, and humanities organizations launched million-dollar museum capital campaigns in 2016, which has helped to boost giving to this subsector.54 In addition, arts, culture, and humanities institutions have employed increasingly innovative fundraising techniques in recent years in an attempt to reconnect with their audiences and donors.55
More than six in 10 organizations in this subsector surveyed by the Nonprofit Research Collaborative reported increases in charitable receipts received in 2016, compared with 2015.56
Online giving to arts organizations analyzed by the Blackbaud Index grew more than giving through all types of channels combined in 2016, with the strongest rates of growth in online giving realized in June and the three-month period from September to November.57
Giving to arts, culture, and humanities, 1976–2016(in billions of dollars)
Giving USA The Numbers
58 | Giving USA FoundationTM | Giving USA 2017
1976 1981 1986 1991 1996 2001 2006 2011 2016
1.542.28 2.50
3.82
5.98
9.73
13.92 12.82
18.21
13.68
16.5713.18
9.14
6.745.476.02
6.50
Inflation-adjusted dollarsCurrent dollars

Giving to international affairs, 1987–2016*(in billions of dollars)
Contributions to the international affairs subsector comprised 6 percent of all donations received by charities in 2016.58
Giving to international affairs organizations increased 5.8 percent in 2016, totaling $22.03 billion. Adjusted for inflation, giving to international affairs increased 4.6 percent between 2015 and 2016.
The total for contributions to the international affairs subsector has not yet exceeded its previous highest inflation-adjusted value, which was recorded in 2008 at $22.93 billion.
Sampled international affairs organizations analyzed by the Blackbaud Index saw the second largest rate of growth in charitable receipts received, as compared with all other types of organizations in 2016.59 However, online giving to the international affairs subsector slowed in 2016 as compared to 2015, with the biggest losses in spring and summer and the largest gains in fall.60
Giving USA The Numbers
Giving USA FoundationTM | Giving USA 2017 | 59
1976 1981 1986 1991 1996 2001 2006 2011 2016
1.622.99
6.68
13.5115.18
22.03
16.2016.08
9.05
4.572.86
*Giving to the international affairs subsector began to be tracked separately in 1987.
Inflation-adjusted dollarsCurrent dollars

Giving to the environment/animals subsector amounted to 3 percent of total giving in 2016.61
Contributions to environmental and animal organizations rose 7.2 percent between 2015 and 2016, to $11.05 billion. Adjusted for inflation, giving to these organizations increased 5.8 percent.
For the year 2016, contributions to environment and animals totaled the highest inflation-adjusted value recorded to date.
Online giving to environmental and animal organizations analyzed by the Blackbaud Index was much stronger than giving to these organizations via all types of channels combined in 2016.62
A majority of environment/animal organizations reported increases in charitable receipts received in 2016, as compared with 2015, according to the Nonprofit Research Collaborative.63
Support for causes related to land and fresh water conservation, as well as ocean health, has been growing in recent years, helping to increase giving to this subsector.64
Giving to environment/animals, 1987–2016*(in billions of dollars)
Giving USA The Numbers
60 | Giving USA FoundationTM | Giving USA 2017
1976 1981 1986 1991 1996 2001 2006 2011 2016
1.49
2.60
5.30
7.39
8.16
11.05
8.718.80
7.18
3.98
2.63
*Giving to the environment/animals subsector began to be tracked separately in 1987.
Inflation-adjusted dollarsCurrent dollars

Giving by type of recipient: Percentage of the total in five-year spans, 1977–2016*(adjusted for inflation, 2016 = $100; does not include “unallocated”)
Giving to religious organizations has been declining as a share of total giving to recipient organizations since the five-year period beginning in 1982, when it reached 58 percent of the total. In the last five-year period, 2012–2016, religious giving comprised 32 percent of the total.65
The education subsector has received between 10 percent and 15 percent of total recipient contributions in the past four decades. Giving to education has been at its strongest in the last four five-year periods.
The share of total giving to human services organizations remained at 12 percent for the five-year period beginning 2012. Giving to this subsector dropped to single-digit percentage levels for the five-year periods beginning 1982, 1987, and 1992 but rose again to between 10 percent and 12 percent of the total for the last two decades.
ReligionEducationHuman services
*Giving to foundations began to be reported in 1978, and giving to environment/animals and international affairs began to be tracked in 1987. Not all percentages are shown. Giving USA uses the CPI to adjust for inflation.
FoundationsHealthPublic-society benefit
Arts, culture, and humanitiesInternational affairsEnvironment/animals
1977–1981 1982–1986 1987–1991 1992–1996 1997–2001 2002–2006 2007–2011 2012–2016
32%34%37%39%47%52%
12%
11%
4%
11%
5%5%
55%58%
10%
6%7%
8%3%
6%
12%
7%5%7%
7%4%
13%
9%
10%
7%4%
6%
14%14%
10%
12%
8%
7%5%
11%
10%
8%
8%5%5%
15%14%
12%12%
11%
9%
7%5%6%
12%
9%
8%4%5%
Giving USA The Numbers
Giving USA FoundationTM | Giving USA 2017 | 61

Foundations have received between 4 percent and 12 percent of total contributions over the last 40 years. As a share of the total, giving to foundations saw its highest levels of giving in the last four five-year periods.
Giving to the health subsector has comprised between 6 percent and 11 percent of the total over the last four decades.
The public-society benefit subsector has received between 5 percent and 8 percent of total recipient giving in the last 40 years.
Giving to arts, culture, and humanities organizations has consistently totaled between 3 percent and 5 percent of all charitable dollars received by organizations over the last four decades.
Giving to international affairs organizations began to be tracked in 1987. This subsector maintained or increased its share of total contributions received in all subsequent five-year periods except the last five-year period, 2012–2016.
Giving to environmental and animal organizations began to be tracked in 1987. Since then, giving to this subsector has steadily risen to 3 percent of total giving in the last two five-year periods.
Giving by type of recipient: Percentage of the total in five-year spans, 1977–2016*(adjusted for inflation, 2016 = $100; does not include “unallocated”)
Giving USA The Numbers
62 | Giving USA FoundationTM | Giving USA 2017
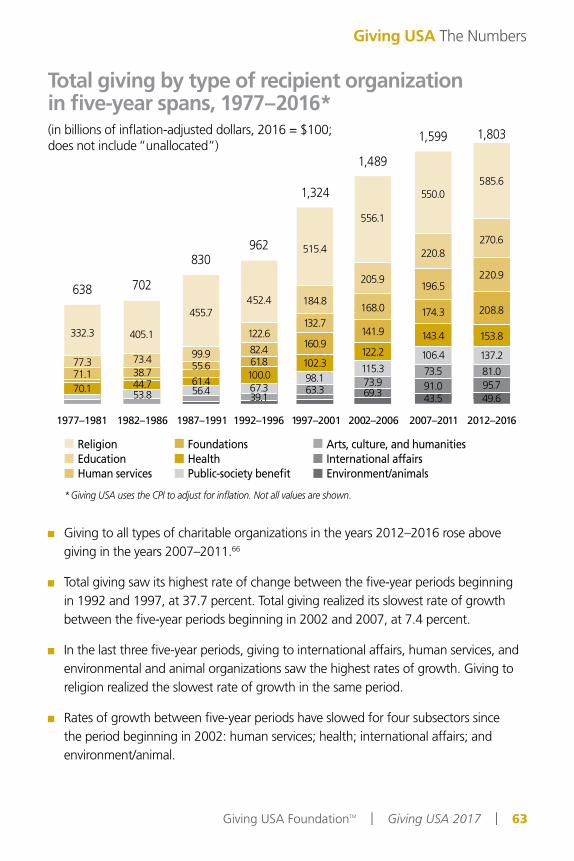
Total giving by type of recipient organization in five-year spans, 1977–2016*(in billions of inflation-adjusted dollars, 2016 = $100; does not include “unallocated”)
Giving to all types of charitable organizations in the years 2012–2016 rose above giving in the years 2007–2011.66
Total giving saw its highest rate of change between the five-year periods beginning in 1992 and 1997, at 37.7 percent. Total giving realized its slowest rate of growth between the five-year periods beginning in 2002 and 2007, at 7.4 percent.
In the last three five-year periods, giving to international affairs, human services, and environmental and animal organizations saw the highest rates of growth. Giving to religion realized the slowest rate of growth in the same period.
Rates of growth between five-year periods have slowed for four subsectors since the period beginning in 2002: human services; health; international affairs; and environment/animal.
Giving USA The Numbers
Giving USA FoundationTM | Giving USA 2017 | 63
ReligionEducationHuman services
*Giving USA uses the CPI to adjust for inflation. Not all values are shown.
FoundationsHealthPublic-society benefit
Arts, culture, and humanitiesInternational affairsEnvironment/animals
270.6220.8
205.9
184.8
585.6550.0
556.1
515.4
452.4455.7
405.1332.3
77.371.170.1
73.438.744.753.8
99.955.661.456.4
122.682.461.8100.067.339.1
1,8031,599
1,489
1,324
962830
702638220.9
196.5
168.0132.7
208.8174.3
141.9160.9
153.8143.4122.2
102.3137.2106.4
115.398.1
81.073.573.9
63.3 95.749.6
91.043.569.3
1977–1981 1982–1986 1987–1991 1992–1996 1997–2001 2002–2006 2007–2011 2012–2016

Number of volunteers, in millions of people, 2005–2015
Giving USA The Numbers
64 | Giving USA FoundationTM | Giving USA 2017
The Corporation for National and Community Service estimates that 62.6 million U.S. adult residents volunteered in 2015. This figure is flat (-0.3 percent) with 2014, when 62.8 million U.S. residents volunteered.67
In 2015, total volunteer hours by adults living in the U.S. amounted to 7.9 billion hours. This figure translates into an equivalent of $184 billion contributed to charities and communities across the nation that year.
In the years 2013 to 2015, the proportion of volunteers who also donated to charity was higher than the proportion of non-volunteers who donated, at 78.7 percent versus 40.3 percent.
65.461.2 60.8 61.8 63.4 62.8 62.664.3 62.8 62.664.5
2005 2006 2007 2008 2009 2010 2011 2012 2013 2014 2015

Volunteer rate as a share of the U.S. population, 2005–2015
According to the Corporation for National and Community Service’s (CNCS) annual Volunteering and Civic Engagement in the United States report, the number of U.S. residents volunteering as a share of the population was 24.9 percent in 2015—a decline from the 25.3 percent reported for 2014.68
The volunteer rate for adult residents of the United States has averaged 26.1 percent in the last decade. This figure continues to steadily decline. In the years 2003–2005, the volunteer rate was steady at 28.8 percent.
The greatest percentages of U.S. residents volunteered for religious (34.1 percent), educational (26.0 percent), and social or community service organizations (15.0 percent) in 2015. U.S. residents were most likely to collect or distribute food (24.2 percent) and engage in fundraising (24.0 percent) for these and other types of organizations.
Among various age groups in 2015, individuals between the ages of 35 and 44 were most likely to volunteer, at a rate of 29.8 percent. This group was followed by those in the 45−54 age group, who volunteered at a rate of 28.3 percent. Those between the ages of 20 and 24 were least likely to volunteer (18.5 percent).
Giving USA The Numbers
Giving USA FoundationTM | Giving USA 2017 | 65
2005 2006 2007 2008 2009 2010 2011 2012 2013 2014 2015
25.3%24.9%
25.4%26.5%26.8%26.3%26.8%26.4%26.2%26.7%
28.8%

The number of 501(c)(3) organizations, 2006–2016
The Internal Revenue Service (IRS) annually reports the number of charitable organizations registered under Section 501(c)(3) of the Internal Revenue Code. In 2016, the number of charitable organizations amounted to 1.24 million, a 4.4 percent increase over 2014.69
The decline of 15.7 percent between the years 2010 and 2011 is explained by the Pension Protection Act of 2006. This act set the requirement for all nonprofit organizations (excluding religious organizations), regardless of size, to file tax returns beginning in 2007. In September 2011, over 200,000 charitable organizations lost their tax-exempt status for failure to file legally required documents for three consecutive years. Most of these organizations were likely small and defunct.70
The growth of the charitable sector is generally quite variable from year to year. Taking out the rate of change in the number of charities between 2010 and 2011, the average rate of growth of the sector was 3.7 percent between the years 2006 and 2016.71 The total rate of growth in operating charitable organizations between these years was 16.2 percent.
Giving USA The Numbers
66 | Giving USA FoundationTM | Giving USA 2017
2006 2007 2008 2009 2010 2011 2012 2013 2014 2015 2016
1,184,5471,237,094
1,117,941
1,052,4951,081,8911,080,130
1,280,7391,238,201
1,186,9151,128,367
1,064,191

References 1. All data in this section are reported as estimates, which
are subject to revision. The estimates for total charitable giving for the years 2014 and 2015 were revised in this edition from estimates reported in Giving USA 2016. To provide the most accurate estimates for charitable giving, as new data become available, Giving USA revises its estimates for at least the last two years. See more about how Giving USA calculates charitable giving by sources and uses in the “Brief summary of methods used”section of this report.
2. Data were provided by Foundation Center in April 2017 and are subject to revision. Data on giving by and to foundations is available in Foundation Center’s Key Facts on U.S. Foundations reports, available at Foundation Center’s website at www.foundationcenter.org.
3. See Foundation Center’s Key Facts on Family Foundations reports at www.foundationcenter.org.
4. Same as note 1.5. Same as note 1.6. Same as note 2.7. Same as note 1.8. Same as note 2.9. Same as note 1.10. Same as note 1.11. Same as note 1.12. These figures do not include changes in giving of
less than one percent, which are considered flat for Giving USA purposes.
13. Same as note 1.14. The 4.0 percent increase for giving by itemizing
individuals/households includes Giving USA’s adjustment for mega-gifts.
15. See the “Brief summary of methods used” section of this report for more information.
16. Same as note 2.17. Same as note 3.18. Same as note 1.19. Same as note 1.20. Same as note 2.21. Gross Domestic Product,” Bureau of Economic
Analysis, U.S. Department of Commerce, 2016, retrieved April 2017, www.bea.gov
22. These data are in current dollars. “Corporate Profits Before Tax by Industry,” Bureau of Economic Analysis, U.S. Department of Commerce, 2016, retrieved April 2017, www.bea.gov
23. Each year, CECP, in association with the Conference Board, presents an in-depth analysis of the results of an annual survey or corporate giving trends in the publication Giving in Numbers, released free-of-charge to the public each fall. The report answers pressing questions reported by 250+ companies about the state of their corporate giving, rates of giving internationally, employee engagement, program management, and more. Giving in Numbers survey, CECP, in association with The Conference
Board, 2017, www.cecp.co. Note that not all companies answered all questions. Also, note that some of the data refer only to a matched set of companies that have participated in the survey in each year from 2014 to 2016, per the identified sample sizes in the references. Caution should be used in comparing results between Giving USA and CECP because CECP’s study is focused on businesses with more than $2 billion in annual revenue, while Giving USA includes businesses of all sizes. In addition, CECP’s sample is global, while Giving USA focuses solely on companies based in the United States.
24. Same as note 1.25. Same as note 1.26. For the purposes of Giving USA, rates of change less
than one percent are considered flat.27. Same as note 2.28. Same as note 26.29. Same as note 1.30. “Methodology Papers,” Bureau of Economic
Analysis, U.S. Department of Commerce, retrieved May 2017, www.bea.gov
31. Same as note 21.32. “S&P 500 Stock Price Index (S&P 500),” Federal Reserve
Bank of St. Louis, FRED® Economic Data, 2016, retrieved April 2017, http://research.stlouisfed.org
33. “Methodology Papers,” Bureau of Economic Analysis, U.S. Department of Commerce, retrieved May 2017, www.bea.gov.
34. “Personal Income and Its Disposition,” Bureau of Economic Analysis, U.S. Department of Commerce, 2016, retrieved April 2017, www.bea.gov
35. Same as note 22.36. Same as note 1.37. The Nonprofit Research Collaborative (NRC) annually
conducts surveys on fundraising trends across the nonprofit sector. In 2017, this collaboration included Giving USA Foundation, the Association of Fundraising Professionals, CFRE International, the Association of Philanthropic Counsel, National Association of Charitable Gift Planners, and Top Nonprofits. In early 2017, the NRC launched a survey to assess fundraising trends for the entire 2016 calendar year. The survey asked nonprofit leaders of public charities and foundations to report on changes in charitable revenue received and changes in the number of donors by specific donor type, among other questions. Data in this section come from the Winter 2017 Nonprofit Fundraising Survey from the Nonprofit Research Collaborative, May 1, 2017, www.npresearch.org. A convenience sample of nearly 1,019 respondents, 144 of them Canadian, constitutes the survey results.
38. This information was provided to Giving USA directly from Blackbaud in May 2017. The Blackbaud Index of Charitable Giving assesses changes in total
Giving USA The Numbers
Giving USA FoundationTM | Giving USA 2017 | 67

charitable giving from year to year using a three-month rolling median of the charitable revenue reported by a selected sample of U.S. nonprofits. This information reflects data on total charitable giving by 6,857 organizations across the nonprofit sector, representing total charitable revenue of $23.6 billion in 2016. Online giving data are reported by 4,958 nonprofits with charitable support amounting to $2.7 billion in 2016. Month-by-month Blackbaud Index data on both online and total giving are available at www.blackbaud.com/nonprofit-resources/blackbaud-index. Note that Blackbaud data are constantly being updated; therefore, figures published in Giving USA may vary from current figures.
39. Same as note 1.40. “Colleges and Universities Raise $41 Billion in 2016,”
Council for Aid to Education, February 7, 2017, www.cae.org.
41. Maria Di Mento,“The 2017 Philanthropy 50,” The Chronicle of Philanthropy, February 7, 2017, www.philanthropy.com; Maria Di Mento and Drew Lindsay, “America’s Biggest Donors Give Unusually Large Share of Gifts to Colleges,” The Chronicle of Philanthropy, February 7, 2017, www.philanthropy.com
42. Same as note 1.43. Same as note 37.44. Same as note 38.45. Same as note 1.46. Same as note 1.47. Same as note 37.48. Same as note 38.49. Maria Di Mento, “The 2017 Philanthropy 50,” The
Chronicle of Philanthropy, February 7, 2017, www.philanthropy.com
50. Same as note 1.51. Same as note 38.52. Same as note 37.53. Same as note 1.54. See the “Giving to arts, culture, and humanities”
chapter of this report for more information.55. Same as note 54.56. Same as note 37.57. Same as note 38.58. Same as note 1.59. Same as note 38.60. Month-by-month Blackbaud Index data on both
online and total giving are available at www.blackbaud.com/nonprofit-resources/blackbaud-index.
61. Same as note 1.62. Same as note 38.63. Same as note 37.64. See the “Giving to environment/animals” chapter of
this report for more information.65. Same as note 1.66. Same as note 1.67. Volunteering and Civic Engagement in the United
States, 2016, Corporation for National and Community Service, retrieved May 2017, www.volunteeringinamerica.gov/national
68. Same as note 37.
69. Table 25: “Tax Exempt Activities,” 2016 Data Book, IRS, retrieved May 2017, http://www.irs.gov/uac/ SOI-Tax-Stats-IRS-Data-Book
70. “Pension Protection Act,” United States Department of Labor, retrieved May 2017, http://www.dol.gov/EBSA/pensionreform.html
71. Same as note 69.
Giving USA The Numbers
68 | Giving USA FoundationTM | Giving USA 2017

3 Giving to and from Donor-Advised Funds
SPECIAL SECTION:
According to the latest data, contributions to donor-advised funds across the United States grew 11.4 percent to a high of $22.26 billion in 2015.1
Grantmaking from donor-advised funds to nonprofits also reached a record high in recent years, jumping 16.9 percent to $14.52 billion in 2015.2
Grantmaking from donor-advised funds to nonprofit subsectors varies—however, grantmaking from major fund sponsors tends to reflect wider giving trends, with many grants going toward organizations in the religion, education, and human services subsectors.3
Giving USA FoundationTM | Giving USA 2017 | 69

The information provided in this chapter derives from a
number of sources, and websites from the most recent year. This chapter is meant to provide context for the giving trends reported in this edition of Giving USA and to illustrate some of the practical implications of the data. It is not intended to be a comprehensive survey of the subsector, but rather a collection of examples from the field.
Introduction to the special section on donor-advised funds
Donor-advised funds have grabbed the attention of the philanthropic community in recent years, due to their increasing popularity and the amount of contributions directed toward these accounts. In previous editions of Giving USA, the analysis of donor-advised funds as charitable vehicles has been included in the public-society benefit chapter. However, given the substantial attention and growth of the donor-advised funds market, Giving USA is pleased to offer this special section on donor-advised funds, which highlights trends and recent news, and presents a coherent report of donor-advised fund data based on findings from the annual reports of donor-
70 | Giving USA FoundationTM | Giving USA 2017
Giving USA SPECIAL SECTION: Giving to and from Donor-Advised Funds

advised funds sponsored by national and single-issue charities, as well as community foundations.4 Future editions of Giving USA will publish similar chapters on donor-advised funds, and will include new estimates of giving to and from these vehicles, as well as data on the distribution of grantmaking from donor-advised funds to nonprofit subsectors.
Essentially operating as a type of charitable savings account, donor-advised funds (frequently referred to as DAFs) are investment vehicles that allow donors to contribute to their funds and take an immediate tax credit on those contributions.5 The assets held within the fund are invested, and fundholders direct grants from the fund to approved nonprofit entities.
Donor-advised funds have existed in the United States in differing forms since the 1930s.6 The New York Community Trust opened the first donor-advised fund in 1931, yet the definition and characteristics of these funds have varied through the years. Prior to the 1990s, most donor-advised funds were housed within community foundations or single-issue charities, such as Jewish federations. In 1991, Fidelity Charitable Gift Fund (Fidelity Charitable) was established by Fidelity Investments, becoming the first national donor-advised fund. Donor-advised funds did not originally have asset disclosure requirements under the IRS, but are now required to submit details about assets, grantmaking, and contributions through IRS Forms 990.
Donor-advised fund providers typically fall into three categories:7
National, also known as commercial fund providers or national charities, are often independent providers of donor-advised funds or are affiliated with financial institutions. Examples include Fidelity Charitable, Schwab Charitable, or National Philanthropic Trust (NPT).
Single-issue charities are fund providers that offer donor-advised funds, but work in a specific subsector such as religion or human services. For example, Jewish federations and higher education institutions frequently house donor-advised funds.
Community foundations are the oldest providers of donor-advised funds in the United States, which are managed and housed within the foundation. Examples of these providers include the Silicon Valley Community Foundation, the New York Community Trust, and the Greater Kansas City Community Foundation.
For the past six years, giving to donor-advised funds has consistently grown across all metrics. As reported by NPT’s 2016 Donor-Advised Fund Report, contributions to donor-advised funds represented 8.4 percent of all aggregate giving by individuals in 2015.8 A special donor-advised fund report by The Chronicle of Philanthropy estimates that
Giving USA FoundationTM | Giving USA 2017 | 71
Giving USA SPECIAL SECTION: Giving to and from Donor-Advised Funds

contributions to donor-advised funds will soon account for 10 percent of individual giving.9 According to the Chronicle, as of 2013, the top 85 largest sponsors of donor-advised funds held over $51 billion in year-end assets, all of which are restricted for charitable purposes.10 To compare, the asset amount held by these donor-advised funds in 2013 was greater than foundation giving ($49.9 billion) and combined charitable giving from corporate and bequest sources in the same year ($40.2 billion).11
The following sections detail trends in giving and disbursement for donor-advised funds in 2016 and recent years.
Trends in giving to and from donor-advised funds in 2016
In general, the major sponsors of donor-advised funds from all types of institutions report significant growth from 2015 to 2016.12 This growth occurred not only in contributions to donor-advised fund accounts, but in the number of accounts at each sponsoring organization and the grants disbursed.
According to NPT’s 2016 Donor-Advised Fund Report, contributions to all types of donor-advised funds grew 11.4 percent in 2015 over 2014, and aggregate
72 | Giving USA FoundationTM | Giving USA 2017
Giving USA SPECIAL SECTION: Giving to and from Donor-Advised Funds

grantmaking from these funds also grew by 16.9 percent.13 In addition, the number of donor-advised fund accounts and the average dollar amount of these accounts grew in 2015, at 11.1 percent and 8.8 percent, respectively.
The following sections detail the most up-to-date reporting from major donor-advised fund sponsors in the United States, as found in both independent studies and annual reports.
Contributions to donor-advised funds in 2016 and recent yearsData from 2016 and supporting data from 2015 show that donor-advised funds continue to grow in popularity with donors. These trends are highlighted by increases in the number of donor-advised fund accounts opened with major fund sponsors. A summary is provided below:
Renaissance Charitable Fund reported a 12.5 percent increase in funds opened, growing their accounts from 5,451 in 2015 to 6,130 in 2016.15
Fidelity Charitable realized an 11 percent increase in the number of its donor-advised fund accounts—from 72,170 in 2014 to 80,152 in calendar year 2015.16 Today, 132,468 donors give through Fidelity Charitable’s donor-advised fund accounts.
National Christian Foundation, one of the largest single-issue charity fund sponsors, reported 2,100 new giving funds for 2015.17
While still a small population of overall donors, donor-advised fund sponsors noted an increase in the percentage of donors that were either from Generation X (ages 35–50) or the Millennial generation (ages 18–34).18 Fidelity Charitable reported that 20 percent of its donors belong to these two generations.19 Similarly, Vanguard
Giving USA FoundationTM | Giving USA 2017 | 73
Giving USA SPECIAL SECTION: Giving to and from Donor-Advised Funds
Good to KnowDonor-advised funds are one of the hottest topics in the philanthropic community today.14 More than a trend, donor-advised funds are gaining recognition as a convenient and flexible way to practice charitable giving.
For donors, these giving vehicles have minimal costs, are easy to create, provide immediate tax deductions, offer a flexible timeline for giving, and help simplify charitable record-keeping. For nonprofits, they can lead to larger and more consistent donations, and can help simplify transactions.
Despite the attention paid to these tools, donor-advised funds also pose some challenges. Donors can remain anonymous in their giving (but rarely do), and fundholder names are not public, especially for national fund sponsors, so donors can be hard to find and connect with. Additionally, nonprofits cannot directly apply to a donor-advised fund for grants, unlike a foundation. Fundholders are also unable to make multi-year giving pledges—however, they can establish an “intent to give” instead.

Charitable reported that 17 percent of its accounts are managed by Generation X or Millennial donors, an increase of 4 percent from a few years ago.20
Changes in contributions to donor-advised funds varied across organizations, though many sponsors saw increases in giving over the last several years. Figure 1 compares aggregate contributions by major donor-advised fund sponsors, and tracks contribution changes as compared to fiscal year (FY) 2015.21
74 | Giving USA FoundationTM | Giving USA 2017
Figure 1Contributions to select donor-advised fund accounts, fiscal year (FY) 2015–2016
(billions of dollars)
Data: Jewish Communal Fund 2016 Annual Report, Jewish Communal Fund, 2016, www.jcfny.org; 2016 By The Numbers, Renaissance Charitable Foundation Inc., 2017, www.rcgf.org; 2016 Annual Report, National Philanthropic Trust, 2016, www.nptrust.org; 2016 Annual Report, Vanguard Charitable, 2016, www.vanguardcharitable.org; Schwab Charitable Annual Giving Report Fiscal Year 2016, Schwab Charitable, 2016, www.schwabcharitable.org
Giving USA SPECIAL SECTION: Giving to and from Donor-Advised Funds
Jewish Communal Fund
Renaissance Charitable Foundation
National Philanthropic Trust
Vanguard Charitable
Schwab Charitable
0.50 1.00 2.001.50 2.50
7.9%
-8.8%
22.0%
6.0%
-5.0% FY 2015 FY 2016

Tides (also known as Tides Foundation), reported $240 million in contributions in 2015, an 8 percent increase from 2014.22 While Tides is considered a large single-issue sponsor of donor-advised funds, the organization’s annual report does not break out giving to and from its donor-advised fund accounts.
It should be noted that Fidelity Charitable does not disclose aggregate contributions to its donor-advised fund accounts.23 Nevertheless, Fidelity Charitable tracks and annually discloses balances of its existing accounts, which can provide a snapshot of some contribution patterns. In 2015, the median account balance was $15,000, and 48,892 (61 percent) giving accounts held balances under $25,000. In the same year, 5,999 accounts (7.5 percent) held more than $250,000 in balance.
Additionally, in 2015, the National Christian Foundation reported $1.4 billion in contributions to its donor-advised funds, a 28 percent increase over 2014.24
Types of contributions to donor-advised funds
Donor-advised fund sponsors are able to flexibly accept a large number of assets, including non-cash or non-liquid assets.25 Many sponsors use the terms “non-liquid assets” and “non-cash assets” interchangeably, and these terms encompass all non-cash giving, such as gifts of securities,
mutual funds or complex assets. Fidelity Charitable reported that 66 percent of contributions in 2015 were from non-cash assets.26 Fidelity Charitable also began accepting the Internet currency Bitcoin as contributions in 2015.27
In 2016, Schwab Charitable Fund reported that 59 percent of donor contributions were in the form of non-cash investments or assets, after eliminating fees for the most common types of complex assets.28 Vanguard Charitable also indicated that 57 percent of contributed dollars were from non-cash assets.29 Though reporting a smaller percentage than the national donor-advised fund sponsors, National Christian Foundation found that 25.7 percent, or $360 million, of contributed dollars were in the form of non-cash assets.30
Grants issued by donor-advised funds in 2016 and recent yearsGenerally speaking, major donor-advised fund sponsors realized year-over-year growth in aggregate grants awarded, though the magnitude of these increases varied widely in 2016.31
As the largest fund sponsor in the United States, Fidelity Charitable reported that 2015 grantmaking exceeded $1 billion for the 10th consecutive year since 2007.32 The number of charities supported by Fidelity Charitable donors additionally has doubled in the same period of time.
Giving USA FoundationTM | Giving USA 2017 | 75
Giving USA SPECIAL SECTION: Giving to and from Donor-Advised Funds
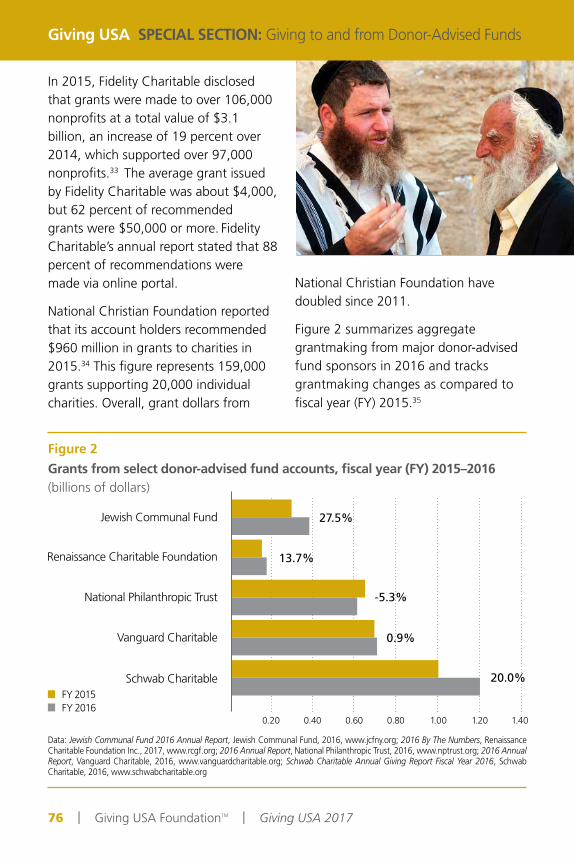
In 2015, Fidelity Charitable disclosed that grants were made to over 106,000 nonprofits at a total value of $3.1 billion, an increase of 19 percent over 2014, which supported over 97,000 nonprofits.33 The average grant issued by Fidelity Charitable was about $4,000, but 62 percent of recommended grants were $50,000 or more. Fidelity Charitable’s annual report stated that 88 percent of recommendations were made via online portal.
National Christian Foundation reported that its account holders recommended $960 million in grants to charities in 2015.34 This figure represents 159,000 grants supporting 20,000 individual charities. Overall, grant dollars from
National Christian Foundation have doubled since 2011.
Figure 2 summarizes aggregate grantmaking from major donor-advised fund sponsors in 2016 and tracks grantmaking changes as compared to fiscal year (FY) 2015.35
Giving USA SPECIAL SECTION: Giving to and from Donor-Advised Funds
Figure 2Grants from select donor-advised fund accounts, fiscal year (FY) 2015–2016 (billions of dollars)
Data: Jewish Communal Fund 2016 Annual Report, Jewish Communal Fund, 2016, www.jcfny.org; 2016 By The Numbers, Renaissance Charitable Foundation Inc., 2017, www.rcgf.org; 2016 Annual Report, National Philanthropic Trust, 2016, www.nptrust.org; 2016 Annual Report, Vanguard Charitable, 2016, www.vanguardcharitable.org; Schwab Charitable Annual Giving Report Fiscal Year 2016, Schwab Charitable, 2016, www.schwabcharitable.org
Jewish Communal Fund
Renaissance Charitable Foundation
National Philanthropic Trust
Vanguard Charitable
Schwab Charitable
0.20 0.40 0.800.60 1.00 1.20 1.40
27.5%
13.7%
-5.3%
0.9%
20.0% FY 2015 FY 2016
76 | Giving USA FoundationTM | Giving USA 2017

Tides reported it awarded 2,991 domestic grants, totaling $110 million, and an additional $39.8 million in international grants in 2015.36 Including other programs, a total of $164 million in grants were disbursed, a 24.2 percent increase from 2014. While Tides is considered a large single-issue sponsor of donor-advised funds, the organization’s annual report does not break out giving to and from its donor-advised funds.
Trends in subsector support from donor-advised funds
Subsector support by donor-advised funds varies depending on the nature of the fund sponsor. Generally, however, most grant account holders recommend gifts largely
to organizations within the religion, education, and human services subsectors, mirroring wider giving trends.37 Fund sponsors affiliated with a certain subsector, such as the National Christian Foundation or a fund housed within a higher education institution, may have higher payout rates to a different composition of subsectors.38
Table 1 summarizes the top subsectors supported by major donor-advised fund sponsors, according to information disclosed in annual reports from these institutions.39 Note that Fidelity Charitable discloses information from calendar year 2015. Additionally, sponsors may classify and group organizations into charitable subsectors using a different methodology than Giving USA.
Giving USA FoundationTM | Giving USA 2017 | 77
Giving USA SPECIAL SECTION: Giving to and from Donor-Advised Funds
Table 1Subsector grant distribution from major donor-advised fund sponsors (in 2015 and 2016)
Subsector
Fidelity Charitable
(calendar year 2015)
Schwab Charitable (FY 2016)
Vanguard Charitable (FY 2016)
NPT(FY 2016)
Education 26% 16% 29% 26%
Religion 16% 26% 13% 9%
Human services 10%28%*
21% 6%
Health 9% 8% 9%
International affairs 7% 5% N/A 23%
Public-society benefit 18% N/A N/A 21%
Other subsectors 14% 25% 29% 6%
Data: 2016 Giving Report, Fidelity Charitable Gift Fund, 2016, www.fidelitycharitable.org; Schwab Charitable Annual Giving Report Fiscal Year 2016, Schwab Charitable, 2016, www.schwabcharitable.org; 2016 Annual Report, Vanguard Charitable, 2016, www.vanguardcharitable.org; 2016 Annual Report, National Philanthropic Trust, 2016, www.nptrust.org
* Calculations from Schwab Charitable’s data included both human services and health subsectors

Given the prevalence of online platforms for donor-advised funds, large national fund sponsors disclosed that the majority of grant recommendations were completed online.40
Major fund sponsors have also obvserved trends in the types of organizations that receive grants. Charities that garnered the most volume of grants were well-established
organizations, such as Doctors Without Borders, The Salvation Army, United Way chapters, and Habitat for Humanity.41 Fidelity Charitable indicated that the number of grants issued to international organizations in 2015 had doubled since 2011.42 Vanguard Charitable noted a shift in the mission composition of the top 10 organizations that received grants from sponsored funds in favor of supporting organizations that placed more focus on the environment, refugee relief, and civil rights in fiscal year (FY) 2016.43
The Jewish Communal Fund’s top three supported sectors, by total amount in contributions for fiscal year 2016, were Jewish and non-Jewish educational institutions, community organizations, and international organizations, with many focusing on Israel.44
78 | Giving USA FoundationTM | Giving USA 2017
Giving USA SPECIAL SECTION: Giving to and from Donor-Advised Funds
Good to KnowDevelopment professionals should prepare nonprofits to receive and properly steward donor-advised funds, which means:45
1. Talk to community foundations to find out if they have clients with donor-advised funds who would be interested in your nonprofit’s work.
2. Search other nonprofits’ annual reports for names of people already connected to you for indicators that they have a donor-advised fund. It’s also wise to ask your board members if they have friends with donor-advised funds who could be potential donors.
3. Market donor-advised funds as a giving tool on your website and provide
other materials that explain how to make gifts from donor-advised funds.
4. Practice good stewardship with donor-advised fundholders. Have ongoing conversations with these individuals just as you do with other donors. They need to be kept up to date on your organization and its impact. Make sure your thank-you notes acknowledge the donor rather than the sponsoring organization.
5. Talk to donor-advised fundholders about planned giving—there’s a higher likelihood that donor-advised fundholders will have charitable provisions in their wills.

Geographic-based giving from donor-advised funds
In 2016, Fidelity Charitable released a special report analyzing the geography of giving from its sponsored funds.46 The report analyzed the top 30 metropolitan areas that have at least 400 Fidelity Charitable donor-advised fund accounts, and rated the top 10 metropolitan areas for each giving sector by percentage of total grants given. Select highlights from the report include:
San Francisco-Oakland-Fremont (CA) donors led in grants to the environment/animals and arts, culture, and humanities subsectors;
Washington-Arlington-Alexandria (District of Columbia, VA) donors led in grants to the international affairs subsector;
Boston-Cambridge-Quincy (MA) led in giving to healthcare organizations;
The Bridgeport-Stamford-Norwalk (CT) metropolitan area led for giving to education organizations;
Naples-Marco Island (FL) donors led for support of the human services subsector; and
Miami-Fort Lauderdale-Pompano Beach (FL) donors led for giving to public-society benefit organizations.
In 2015, 50 percent of grant dollars from Fidelity Charitable went to organizations in donors’ home states. 47
Additionally, Schwab Charitable reported that 62 percent of grants disbursed in 2016 supported charities in donors’ home states.48 The states that recommended the most grants were California, New York, and Illinois.
Single-issue charities and community foundations
NPT’s annual Donor-Advised Fund Report gathers data on national donor-advised funds, single-issue charities, and funds at community foundations.49
NPT’s 2016 report provided data for fiscal year 2015, which was collected from reported assets, contributions, and grants on IRS Forms 990.50 NPT’s analysis shows that single-issue charities realized the highest payout rate in 2015 at 33.1 percent, while community foundations had the largest average account size of $421,013. Other key figures include:
Total donor-advised fund assets at community foundations totaled $28.70 billion in 2015, an increase of 6.9 percent over 2014 ($26.85 billion).
Total donor-advised fund assets at single-issue charities were $11.11 billion in 2015, an increase of 10.3 percent over 2014 ($10.08 billion).
Community foundations saw a slight increase in total grant value distributed in 2015, a rise of 3 percent over 2014 ($4.02 billion to
Giving USA FoundationTM | Giving USA 2017 | 79
Giving USA SPECIAL SECTION: Giving to and from Donor-Advised Funds

$4.14 billion). In contrast, national charities and single-issue charities saw increases of 29.8 percent and 12.1 percent, respectively.
Community foundations and the donor-advised fund landscape
Community foundations originally pioneered the concept of donor-advised funds, though these giving vehicles have evolved over the years and look very different today.51 According to The Chronicle of Philanthropy’s donor-advised fund dataset, community foundations comprised the majority of the top 85 donor-advised fund sponsors in the United States in 2013.52 However, the bulk of donor-advised fund activity was concentrated within national sponsors such as Schwab Charitable or Vanguard Charitable; community foundations sponsored only 18 percent of all donor-advised fund accounts in the United States in 2013.
On average, community foundations comprised less than one-third (29.03 percent) of aggregate grantmaking from the top 85 donor-advised funds in the United States in 2009–2014, with national funds providing more than half of the share.53 Additionally, community foundations accounted for only slightly more than one-fourth of all contributions to donor-advised funds in 2009–2014 with national fund sponsors again collecting the large majority.
In terms of year-end assets, the top three community foundation sponsors in 2014 were the Silicon Valley Community Foundation (SCVF), the Greater Kansas City Community Foundation, and the New York Community Trust, each managing over $1 billion in donor-advised fund assets.54
In 2016, the Silicon Valley Community Foundation, the largest community foundation sponsor of donor-advised funds, released a searchable database of grantmaking from its donor-advised funds and other discretionary funds, such as corporate-advised funds and committee-advised funds.55 The grant platform currently contains information on giving from advised funds in 2015 and 2016.56
According to SVCF’s database, aggregate grantmaking from its donor-advised funds toward U.S. nonprofits totaled $1.12 billion in 2016, with 71.3 percent directed toward local community organizations.57 This is an increase of nearly 145.1 percent from 2015 grantmaking, which totaled $452.5 million. The 2016 boost was driven by a single large gift of $550 million to the Chan Zuckerberg Biohub. However, even without this large disbursement, grantmaking would still have increased 26.6 percent over the previous year. Areas widely supported by donor-advised fundholders at SVCF include educational organizations, organizations that build community, and organizations that support families.58
80 | Giving USA FoundationTM | Giving USA 2017
Giving USA SPECIAL SECTION: Giving to and from Donor-Advised Funds

Single-issue charities continue to realize the highest payout rates of any sponsor typeSingle-issue charities are donor-advised fund sponsors that operate in specific subsectors, such as religion or education.59 Large single-issue sponsors include the Jewish Communal Fund and the National Christian Foundation, although this category also includes donor-advised funds housed within higher education institutions and other issue-specific charities.60
Generally speaking, single-issue charities hold the smallest proportion of the donor-advised fund market.61 According to NPT’s 2016 Donor-Advised Fund Report, these sponsors realized $3.97 billion in contributions in 2015, as compared to $5.53 billion received by community foundations, and $12.77 billion received by national funds.
However, according to analysis from both NPT and The Chronicle of Philanthropy, single-issue charities display the highest payout rates of any fund sponsor.62 NPT estimates the payout rate from single-sissue charities was 33.1 percent in 2015, as compared to 21.1 percent from national funds and 15.4 from community foundations. Using the same payout rate calculation, analysis from the Chronicle indicates these sponsors displayed an average payout rate of 70.49 percent in 2013, as compared to 22.44 percent from national funds and 16.75 percent from community foundations.
High-net-worth donors and donor-advised funds
In 2016, several high-net-worth donors directed major gifts to their donor-advised funds instead of private or family foundations. The Philanthropy 50 is an annual ranking of the 50 largest donations in the United States for the previous calendar year, published by The Chronicle of Philanthropy.63 According to the latest iteration of the Philanthropy 50, three of the largest donations in the United States were directed to personal donor-advised funds:
Sheryl Sandberg, Facebook’s chief operating officer and author of Lean In, donated $107.2 million to the Sheryl Sandberg & Dave Goldberg Family Foundation, a donor-advised fund housed within Fidelity Charitable.64 The donation was comprised of Facebook stock proceeds. This was Sandberg’s first appearance on the Philanthropy 50 list, and the donation ranked as the 11th largest.65
Giving USA FoundationTM | Giving USA 2017 | 81
Giving USA SPECIAL SECTION: Giving to and from Donor-Advised Funds

Reed Hastings, co-founder and chief executive of Netflix, launched his donor-advised fund in January 2016 with an initial gift of $100 million.66 Housed in the Silicon Valley Community Foundation, the Hastings Fund specifically directs grantmaking to education initiatives.67 The donation was ranked as the 12th largest on the Philanthropy 50.
Joan and Irwin Jacobs awarded $51.6 million to their donor-advised fund, the Joan and Irwin Jacobs Fund, housed at the Jewish Community Foundation of San Diego.68 According to the Chronicle, the fund issues grants to San Diego-based health, arts, education, and human services organizations. The couple’s total 2016 donations, of which their donor-advised fund gift comprised the majority, were ranked as the 25th largest on the Philanthropy 50.
While certain mega-donors made substantial gifts to their donor-advised funds in 2016, other sources found different metrics of adoption among high-net-worth households. According to the 2016 U.S. Trust Study of High Net Worth Philanthropy, 88.7 percent of high-net-worth households gave via personal assets and income in 2015, rather than directing their giving through an investment vehicle, such as a donor-advised fund.69 A total of 3.0 percent of charitable giving among the surveyed population originated from a donor-advised fund or similar giving vehicle.
Only 4.2 percent of surveyed high-net-worth individuals reported already having a donor-advised fund, which indicates that a majority of wealthy donors prefer to give directly to nonprofits.70 Further, the study found that a greater percentage of younger donors (individuals 50 years of age or younger) gave via donor-advised funds, trusts, or family foundations than older cohorts (individuals over 50 years of age).
Estimating payout rates for donor-advised funds
Though donor-advised funds have enjoyed increasing popularity among the donor community, debate has emerged over the appropriate way to calculate payout rates from these funds, and whether or not those rates are reflective of donor-advised funds’ ability to disburse grants more effectively than other entities.71 The IRS currently does not mandate that donor-advised funds meet a certain payout rate threshold, as foundations are required to do.72
There are currently four different methods to calculate overall and fund-specific payout rates, and each of these calculations may produce a wide range of results.73 The following categories are summarized from The Chronicle of Philanthropy’s 2016 donor-advised fund data analysis.
82 | Giving USA FoundationTM | Giving USA 2017
Giving USA SPECIAL SECTION: Giving to and from Donor-Advised Funds

Grants divided by grants plus year-end assets
In 2015, Boston College Law School held a forum on donor-advised funds to explore topics such as payout rate, regulation, and the impact of these tools on philanthropy.74 As part of that forum, senior IRS statistician Paul Arnsberger presented an analysis on a stratified selection of various donor-advised fund sponsors’ IRS Forms 990 from the years 2006–2012.75
Arnsberger’s methodology calculates the share of grants distributed in a fiscal year against the total dollar amount available for grantmaking, which includes both assets left over at the end of the year and total grantmaking from the fiscal year.76 Annual grantmaking is added back into the end-of-year totals to provide an accurate picture of the total amount available for distribution at a given donor-advised fund sponsor. The Chronicle of Philanthropy also used this technique to calculate payout rate in its analysis of donor-advised funds.77
Generally speaking, this technique produces the lowest calculated payout rates as compared to the three other methods used.78
Grants divided by previous year’s assets value
The method that calculates payout rate by taking grants divided by asset value from the previous year is used by NPT in its annual Donor-Advised Fund Report.79 This methodology is similar to
the formula used in Foundation Center’s calculations for foundation payout rates: grants made in one fiscal year are divided by end-of-year assets of the previous fiscal year.
Grants divided by year-end assets
Grants divided by year-end assets is used by some donor-advised fund sponsors to calculate payout rates in their external reporting.80
Grants divided by average year-end assets over five years
According to the Chronicle’s analysis, calculations performed according to this method resulted in the highest reported payout rates.81 Some donor-advised fund sponsors also use this method for payout rate calculation, though newly established funds may not be able to use this technique. Major sponsors using this calculation include Schwab Charitable and Fidelity Charitable.82
According to the Chronicle’s analysis on donor-advised fund data from 2008–2014, payout rates for top funds vary based on the calculation’s methodology.83 Table 2 compares all four payout rate methodologies across selected major donor-advised fund sponsors for the year 2014.
While donor-advised funds do not have a legally mandated payout rate, U.S. foundations are required by law to grant out at minimum 5 percent of their assets annually in order to maintain their nonprofit status.84
Giving USA FoundationTM | Giving USA 2017 | 83
Giving USA SPECIAL SECTION: Giving to and from Donor-Advised Funds

Donor-advised funds continue to post strong gains on the Philanthropy 400
The Chronicle of Philanthropy annually compiles a list of the top 400 public charities and private foundations.85 The Philanthropy 400 ranks charities according to the level of private donations received in the previous fiscal year. Private donations include gifts from all private sources—individuals, corporations, and foundations. Gifts of cash, shares of stock, in-kind donations, real estate, and valuables are included. To determine the rankings, the Chronicle compiles information from IRS Forms 990, annual reports, financial statements, and a questionnaire.
Philanthropy 400 data issued in 2016 for giving in the fiscal year ending in 2015 include 18 organizations that are classified as donor-advised funds, compared with 17 reported in the prior year.86 Three of the top 10 organizations in the annual ranking are donor-advised fund sponsors. The top five donor-advised fund sponsors on the list with the greatest amount in private support are:87
Ranking 1st: Fidelity Charitable Gift Fund, Boston, MA, with $4.61 billion in private contributions, an increase of 19.7 percent from the previous year;
Ranking 4th: Schwab Charitable, San Francisco, CA, with $2.11 billion in
84 | Giving USA FoundationTM | Giving USA 2017
Giving USA SPECIAL SECTION: Giving to and from Donor-Advised Funds
Table 2Payout rate calculations, by donor-advised fund sponsor (2014)
Fund sponsor
Grants divided by grants plus year-end
assets
Grants divided by previous
year's assets
Grants divided by year-end
assets
Grants divided by five-
year asset average
Fidelity Charitable Gift Fund 14% 22% 17% 27%
Schwab Charitable 11% 17% 13% 21%
Vanguard Charitable 12% 17% 13% 20%
National Philanthropic Trust (NPT) 17% 25% 20% 32%
Foundation for the Carolinas 27% 57% 37% 64%
Jewish Communal Fund 17% 23% 21% 25%
National Christian Foundation 35% 57% 53% 66%
Data: Drew Lindsey, Joshua Hatch, and Brian O’Leary, “A New Way to Give: Inside the Donor-Advised-Fund Explosion,” The Chronicle of Philanthropy, October 27, 2016, www.philanthropy.com

private contributions, an increase of 16.2 percent;
Ranking 9th: National Christian Foundation, Alpharetta, GA, with $1.44 billion in private contributions, an increase of 26.8 percent;
Ranking 11th: Vanguard Charitable, Malvern, PA, with $1.21 billion in private contributions, an increase of 22.0 percent; and
Ranking 17th: National Philanthropic Trust, Jenkintown, PA, with $902.67 million in private contributions, an increase of 28.5 percent.
It should be noted that in previous years, donor-advised funds were referred to as commercial funds; however, in 2015, The Chronicle of Philanthropy revised this category.88
Fidelity Charitable takes top spot on Philanthropy 400For 26 years, The Chronicle of Philanthropy has published the Philanthropy 400, ranking the charities that have raised the most funds from private sources.89 In 2016, 25-year-old Fidelity Charitable, the largest national donor-advised fund provider in the United States, moved to the top of the chart.90 The ranking showed traditionally higher-ranked organizations like United Way Worldwide (2nd), Feeding America (3rd), and Salvation Army (6th) dropping lower on the list.
While Fidelity Charitable increased their contributions by 19.7 percent to $4.6
billion, United Way Worldwide, the former long-standing Philanthropy 400 leader, saw annual donations fall to $3.7 billion—a 4.2 percent decline—which dropped the organization to second place.91 While Fidelity Charitable was the 2016 report leader, other national donor-advised fund sponsors, such as Schwab Charitable (4th) and Vanguard Charitable (11th) also ranked highly on the list.
According to some, changing donor preferences may have played heavily in the Philanthropy 400’s 2016 shake-up.92 Fidelity Charitable president Pamela Norley cites ease of use and online platforms as attractive features of donor-advised funds, allowing donors to easily track their gifts and simplify their giving process. On the other hand, according to United Way Worldwide’s president Brian Gallagher, fundamental economic shifts such as wage stagnation and corporate consolidation have negatively impacted workplace giving programs that underpin the organization’s fundraising.
In an effort to stay abreast of new fundraising models, nonprofits of all types have added donor-advised funds to their fundraising programs—including United Way affiliates.93
Giving USA FoundationTM | Giving USA 2017 | 85
Giving USA SPECIAL SECTION: Giving to and from Donor-Advised Funds

References1 2016 Donor-Advised Fund Report, National Philanthropic
Trust, 2016, https://www.nptrust.org/daf-report/index.html
2 Same as note 1.3 2016 Giving Report, Fidelity Charitable Gift Fund, 2016,
http://www.fidelitycharitable.org/giving-report/index.shtml; Schwab Charitable Annual Giving Report Fiscal Year 2016, Schwab Charitable, 2016, https://www.schwabcharitable.org/public/file/P-8142068/; 2016
Further questions andfuture research
Given the large amount of attention surrounding donor-advised funds, Giving USA, with the support of the Giving USA FoundationTM and Fidelity
Charitable Gift Fund, has begun a study to examine giving to and from donor-advised funds. Specifically, Giving USA plans to produce estimates for giving from donor-advised funds to charitable subsectors—similar to Giving USA’s giving breakdowns to the top nine subsectors for overall giving.
Additionally, these estimates will provide new benchmarks for overall giving to and from donor-advised funds, as well as the number of donor-advised fund accounts. As Giving USA continues to track disbursement patterns from these funds, we will be able to provide trends on giving to charitable subsectors.
These new estimates will be released in a special report on donor-advised funds in 2018, and will also be featured in a special donor-advised fund chapter in Giving USA 2018 and in future Giving USA editions moving forward.
Annual Report, Vanguard Charitable, 2016, https://www.vanguardcharitable.org/2016/files/assets/basic-html/page-1.html; 2016 Annual Report, National Philanthropic Trust, 2016, https://www.nptrust.org/annual-report/pdfs/npt-annual-report-2016.pdf
4 It is important to note that with regard to overall giving estimates, donor-advised funds are still counted within the public-society benefit subsector.
5 “What is a Donor-Advised Fund (DAF)?” National
86 | Giving USA FoundationTM | Giving USA 2017
Chapter authored by Mallory St. Claire, Co-Managing Editor of Giving USA at the Indiana University Lilly Family School of Philanthropy, with contributions from Meg P. O’Halloran, Executive Director, CCS, and Christianna Luy, M.A., CFRE, Executive Director, CCS.
Good to Know sections written by Keith Curtis, Immediate Past Chair of the Giving USA FoundationTM and President of The Curtis Group, and Melissa James, Marketing Director of The Curtis Group.
Giving USA SPECIAL SECTION: Giving to and from Donor-Advised Funds

Philanthropic Trust, retrieved April 2017, www.nptrust.org/what-is-a-donor-advised-fund
6 Lila Corwin Berman, “Donor Advised Funds in Historical Perspective,” Boston College Law Forum on Philanthropy and the Public Good, October 31, 2015, https://www.bc.edu/content/dam/files/schools/law/pdf/academics/forum_philanthropy/02_Berman.pdf
7 Same as note 1.8 Same as note 1.9 Drew Lindsay, Joshua Hatch, and Brian O’Leary, “A New
Way to Give: Inside the Donor-Advised-Fund Explosion,” The Chronicle of Philanthropy, October 27, 2016, www.philanthropy.com
10 Same as note 9.11 Charitable giving estimates for 2013 were finalized in
Giving USA 2016.12 Same as note 9.13 Same as note 1.14 Good to Know section authored by Keith Curtis,
Immediate Past Chair of the Giving USA FoundationTM and President of The Curtis Group, and Melissa James, Marketing Director of The Curtis Group.
15 2016 By The Numbers, Renaissance Charitable Foundation Inc., 2017, https://static1.squarespace.com/static/58a1cc4c15d5dbc3ddbd167b/t/58dcfe98e58c62fce2fc03a8/1490878108568/2016+Infographic.pdf
16 2016 Giving Report, Fidelity Charitable Gift Fund, 2016, https://www.fidelitycharitable.org/docs/giving-report-2016.pdf; 2015 Giving Report, Fidelity Charitable Gift Fund, 2015, https://www.fidelitycharitable.org/docs/giving-report-2015.pdf
17 One: 2016 Ministry Report, National Christian Foundation, 2016, https://www.ncfgiving.com/download/3160
18 “The Generations Defined,” Pew Research Center, March 5, 2014, http://www.pewsocialtrends.org/2014/03/07/millennials-in-adulthood/sdt-next-america-03-07-2014-0-06/
19 Same as note 16.20 2016 Annual Report, Vanguard Charitable, 2016, https://
www.vanguardcharitable.org/2016/files/assets/basic-html/page-1.html
21 Jewish Communal Fund 2016 Annual Report, Jewish Communal Fund, 2016, https://www.jcfny.org/about-us/governance-and-financials; 2016 By The Numbers, Renaissance Charitable Foundation Inc., 2017, https://static1.squarespace.com/static/58a1cc4c15d5dbc3ddbd167b/t/58dcfe98e58c62fce2fc03a8/1490878108568/2016+Infographic.pdf; 2016 Annual Report, National Philanthropic Trust, 2016, https://www.nptrust.org/annual-report/pdfs/npt-annual-report-2016.pdf; 2016 Annual Report, Vanguard Charitable, 2016, https://www.vanguardcharitable.org/2016/files/assets/basic-html/page-1.html; Schwab Charitable Annual Giving Report Fiscal Year 2016, Schwab Charitable, 2016, https://www.schwabcharitable.org/public/file/P-8142068/
22 2015 Annual Report, Tides, 2016, http://www.tides.org/fileadmin/user/pdf/2015_Annual_Report_web.pdf; 2014 Annual Report, Tides, 2015, https://www.tides.org/fileadmin/media/2014_Tides_AnnualReport.PDF
23 2016 Giving Report, Fidelity Charitable Gift Fund, 2016, http://www.fidelitycharitable.org/giving-report/index.shtml
24 Same as note 17.25 “A Philanthropic Boom: ‘Donor-Advised Funds,’” The
Economist, May 23, 2017, www.economist.com26 Same as note 23.27 Stan Higgins, “Fidelity’s Charity Arm Raised $7 Million in
Bitcoin Donations in 2016,” Coin Desk, February 2, 2017, www.coindesk.com
28 Schwab Charitable Annual Giving Report Fiscal Year 2016, Schwab Charitable, 2016, https://www.schwabcharitable.org/public/file/P-8142068/
29 Same as note 20.30 Same as note 17.31 Same as note 21.32 Same as note 23.33 Same as note 16.34 Same as note 17.35 Same as note 21.36 Same as note 22.37 2016 Annual Report, Vanguard Charitable, 2016, https://
www.vanguardcharitable.org/2016/files/assets/basic-html/page-1.html; 2016 Giving Report, Fidelity Charitable Gift Fund, 2016, http://www.fidelitycharitable.org/giving-report/index.shtml; Schwab Charitable Annual Giving Report Fiscal Year 2016, Schwab Charitable, 2016, https://www.schwabcharitable.org/public/file/P-8142068/
38 Jewish Communal Fund 2016 Annual Report, Jewish Communal Fund, 2016, https://www.jcfny.org/about-us/governance-and-financials; One: 2016 Ministry Report, National Christian Foundation, 2016, https://www.ncfgiving.com/download/3160
39 2016 Giving Report, Fidelity Charitable Gift Fund, 2016, http://www.fidelitycharitable.org/giving-report/index.shtml; Schwab Charitable Annual Giving Report Fiscal Year 2016, Schwab Charitable, 2016, https://www.schwabcharitable.org/public/file/P-8142068/; 2016 Annual Report, Vanguard Charitable, 2016, https://www.vanguardcharitable.org/2016/files/assets/basic-html/page-1.html; 2016 Annual Report, National Philanthropic Trust, 2016, https://www.nptrust.org/annual-report/pdfs/npt-annual-report-2016.pdf
40 2016 Annual Report, Vanguard Charitable, 2016, https://www.vanguardcharitable.org/2016/files/assets/basic-html/page-1.html; 2016 Giving Report, Fidelity Charitable Gift Fund, 2016, http://www.fidelitycharitable.org/giving-report/index.shtml
41 2016 Giving Report, Fidelity Charitable Gift Fund, 2016, http://www.fidelitycharitable.org/giving-report/index.shtml; Schwab Charitable Annual Giving Report Fiscal Year 2016, Schwab Charitable, 2016, https://www.schwabcharitable.org/public/file/P-8142068/
42 Same as note 23.43 “More Charities Received Vital Aid from Vanguard
Charitable Donors in 2016,” Vanguard Charitable, February 1, 2017, www.vanguardcharitable.org
44 Jewish Communal Fund 2016 Annual Report, Jewish Communal Fund, 2016, https://www.jcfny.org/about-us/governance-and-financials/; Jewish Communal Fund 2015 Annual Report, Jewish Communal Fund, 2015,
Giving USA FoundationTM | Giving USA 2017 | 87
Giving USA SPECIAL SECTION: Giving to and from Donor-Advised Funds

https://www.jcfny.org/wp-content/uploads/2012/08/JCF-Annual-Report-2015.pdf
45 Good to Know section authored by Keith Curtis, Immediate Past Chair of the Giving USA FoundationTM and President of The Curtis Group, and Melissa James, Marketing Director of The Curtis Group.
46 Charitable Sector Support by City, Fidelity Charitable Gift Fund, 2016, https://www.fidelitycharitable.org/docs/charitable-sector-support-by-city.pdf
47 Same as note 23.48 Same as note 28.49 Same as note 1.50 Same as note 1.51 Same as note 6.52 Same as note 9.53 Same as note 9.54 Same as note 9.55 “Silicon Valley Community Foundation Searchable Grants
Catalog Shows ‘Where The Giving Goes,” Silicon Valley Community Foundation via PRWeb, June 10, 2016, www.prweb.com
56 “Grants: Where the Giving Goes,” Silicon Valley Community Foundation, retrieved March 2017, www.siliconvalleycf.org/grantees
57 Same as note 56. Note that donor-advised funds do not comprise the total of funds disbursed by the Silicon Valley Community Foundation. Other types of funds include discretionary grantmaking, corporate-advised funds, and community-advised funds.
58 Same as note 56. Note that the Silicon Valley Community Foundation’s coding and classification methodology may differ from Giving USA.
59 Same as note 1.60 Drew Lindsay, Joshua Hatch, and Brian O’Leary, “A New
Way to Give: Inside the Donor-Advised-Fund Explosion,” The Chronicle of Philanthropy, October 27, 2016, www.philanthropy.com; 2016 Donor-Advised Fund Report, National Philanthropic Trust, 2016, https://www.nptrust.org/daf-report/index.html
61 Same as note 1.62 Same as note 60.63 Maria Di Mento, “The 2017 Philanthropy 50,” The
Chronicle of Philanthropy, February 7, 2017, www.philanthropy.com
64 Maria Di Mento, “Facebook’s Sheryl Sandberg Gives More Than $107 Million to Charity,” The Chronicle of Philanthropy, December 1, 2017, www.philanthropy.com
65 Maria Di Mento, “Sheryl Sandberg,” The 2017 Philanthropy 50, The Chronicle of Philanthropy, February 7, 2017, www.philanthropy.com
66 Maria Di Mento, “Reed Hastings,” The 2017 Philanthropy 50, The Chronicle of Philanthropy, February 7, 2017, www.philanthropy.com
67 Emma Brown, “Netflix Chief Announces $100 Million Fund for Education,” The Washington Post, January 13, 2016, www.washingtonpost.com
68 Maria Di Mento, “Irwin and Joan Jacobs,” The 2017 Philanthropy 50, The Chronicle of Philanthropy, www.philanthropy.com
69 2016 U.S. Trust Study of High Net Worth Philanthropy, U.S. Trust, Indiana University Lilly Family School of Philanthropy, 2016, http://www.ustrust.com/publish/content/application/pdf/GWMOL/USTp_ARMCGDN7_oct_2017.pdf
70 Same as note 69.71 Alex Daniels and Drew Lindsay, “Flush With $51 Billion,
Donor-Advised Funds Face Questions About Payouts,” The Chronicle of Philanthropy, October 27, 2016, www.philanthropy.com
72 Howard Gleckman, “Should Congress Curb Donor-Advised Funds?” Forbes, April 22, 2014, www.forbes.com
73 Same as note 9.74 Ed Hayward, “BC Law School Launches Forum on
Philanthropy and the Public Good,” Boston College, October 2015, www.bc.edu
75 Paul Arnsberger, “Donor-Advised Funds: An Overview Using IRS Data,” Boston College Law Forum on Philanthropy and the Public Good, October 23, 2015, https://www.bc.edu/content/dam/files/schools/law/pdf/academics/forum_philanthropy/05_Arnsberger.pdf
76 Same as note 75.77 Same as note 9.78 Same as note 9.79 Same as note 1.80 Same as note 9.81 Same as note 9.82 Same as note 41.83 Same as note 9.84 Loren Renz, Understanding and Benchmarking
Foundation Payout, Foundation Center, September 28, 2012, http://foundationcenter.issuelab.org/resource/understanding_and_benchmarking_foundation_payout
85 Peter Olsen-Phillips, “How the 2016 Philanthropy 400 Was Compiled,” The Chronicle of Philanthropy, October 27, 2016, www.philanthropy.com
86 The Chronicle of Philanthropy does not use the NTEE coding system for categorizing nonprofit organizations as does Giving USA; therefore, listings here for the Chronicle may vary from how Giving USA categorizes organizations. “The 2016 Philanthropy 400,” The Chronicle of Philanthropy, October 27, 2016, www.philanthropy.com
87 Note that these financial reports are for fiscal years prior to 2016 and thus may not correspond to organizations’ most recent published results
88 “The 2016 Philanthropy 400,” The Chronicle of Philanthropy, October 27, 2016, www.philanthropy.com
89 Same as note 88.90 Drew Lindsey, Peter Olsen-Phillips, and Eden Stiffman,
“Fidelity Charitable Pushes United Way Out of Top Place in Ranking of the 400 U.S. Charities that Raise the Most,” The Chronicle of Philanthropy, October 27, 2016, www.philanthropy.com
91 Same as note 88.92 Same as note 90.93 Alex Daniels and Drew Lindsay, “Donor-Advised Funds
Reshape the Philanthropy Landscape,” The Chronicle of Philanthropy, October 27, 2016, www.philanthropy.com
88 | Giving USA FoundationTM | Giving USA 2017
Giving USA SPECIAL SECTION: Giving to and from Donor-Advised Funds

4 | Giving byIndividuals
Estimated charitable giving by individuals was $281.86 billion in 2016, an increase of 3.9 percent from 2015 (in current dollars). Adjusted for inflation, giving by individuals increased 2.6 percent in 2016.1
The total amount estimated for giving by individuals in 2016 includes itemized and non-itemized charitable contributions. Contributions include gifts of cash, securities, and property.
For the year 2016, it is estimated that giving by itemizing individuals grew 4.0 percent and giving by non-itemizing individuals grew 3.4 percent.2
Giving USA FoundationTM | Giving USA 2017 | 89

The information provided in this chapter derives from a
number of sources, including publicly available reports, news stories, and websites from the most recent year. This chapter is meant to provide context for the giving trends reported in this edition of Giving USA and to illustrate some of the practical implications of the data. It is not intended to be a comprehensive survey of the subsector, but rather a collection of examples from the field.
Trends in giving by individuals in 2016
Giving USA’s estimate for giving by individuals includes itemized and non-itemized charitable contributions. Contributions include gifts of cash, securities, and property.
Charitable giving by individuals and households is often dependent on disposable personal income, or income remaining after taxes have been paid.6 This is especially true for non-itemizing households, but it is also true for many households that itemize. As such, disposable personal income often mirrors the pattern seen in U.S. charitable giving by individuals. In 2016,
90 | Giving USA FoundationTM | Giving USA 2017
Giving USA Giving by Individuals
Practitioner Highlights Individual giving continues to be the primary source of philanthropic
giving, and may be increasingly driven by high-net-worth households as income inequality persists in the United States.3
New analyses on generational giving highlights Generation X as an overlooked philanthropic demographic. As compared to other age groups, Generation Xers are more likely to volunteer and focus their donations on a smaller, more select group of nonprofits.4
The continued decline in donor retention rates was partially mitigated by growth in other areas, such as online giving and new donor acquisition, in 2016. Donor acquisition, however, continues to be costly for nonprofits.5

U.S. disposable personal income was up 3.9 percent over 2015.7 Personal consumption is a similar factor to disposable personal income and explains the amount expended by consumers for goods and services.8 In 2016, personal consumption expenditures increased 3.9 percent over 2015.9 Both the growth in disposable personal income and personal consumption expenditures were up slightly in 2016, as compared with 2015.
Household giving is also influenced by monthly income and asset health. In 2016, personal income increased 3.6 percent.10 This figure is lower than the figure reported for the year 2015 (4.4 percent). The primary influence on asset health is the S&P 500 and is very closely related to overall giving by individuals and households. In 2016, the S&P 500 was up 9.5 percent from 2015.11
Growth in the S&P 500 has a greater effect on giving by itemizing households (those that claim their charitable contributions on their taxes) as these households are more likely to have assets impacted by the S&P 500.12 This explains, at least in part, why giving by itemizing households is estimated to have increased by 4.0 percent in 2016 from 2015.13 In addition, giving by non-itemizing households grew 3.4 percent between 2015 and 2016.
A trend to note in 2016 is the decline in mega-gifts by high-net-worth individuals. Giving USA annually adjusts the individual giving estimate with
mega-gift additions, to capture large or anomalous gifts in the previous calendar year. This year, mega-gifts tracked by Giving USA amounted to $1.495 billion, a decline of 47.5 percent from 2015’s adjustment of $2.85 billion. Despite this drop in mega-gifts, giving by individuals posted strong two-year growth (8 percent) between 2014 and 2016, outpacing the growth rate of overall giving (6.8 percent).14
To provide context for giving by individuals in 2016 and in recent years, the following sections detail recent individual and household giving trends revealed by the media and philanthropic research organizations in 2016 and 2017.
Donor retention continues to weaken, while giving by new and upgraded donors showed promise in 2016
Drawing data from four fundraising tracking platforms that represented more than 10,800 U.S. charitable organizations, the 2017 Fundraising Effectiveness Survey Report, conducted annually by the Association of Fundraising Professionals and the Urban Institute, reveals that the donor-retention rate declined 0.5 percent to 45 percent in 2016, as compared to 2015. The gift retention rate remained stagnant at 48 percent.15 Donor retention refers to the
Giving USA Giving by Individuals
Giving USA FoundationTM | Giving USA 2017 | 91

share of donors who made donations in both 2015 and 2016. Gift retention refers to the share of dollars raised in 2015 that were raised again in 2016.
Overall, analyzed organizations saw an increase of 3 percent in charitable receipts in 2016, representing $267 million in new dollars.16 Large organizations (those with more than $500,000 in revenue) realized an 8.6 percent gain, while small organizations (those with less than $100,000 in revenue) realized a decline of 10.4 percent. Medium-sized organizations saw revenue increase by 1.2 percent.
Giving by new donors captured 23.5 percent of 2016 revenue growth for the analyzed organizations.17 This gain was offset by the loss of giving by previously new donors, at a 15.4 percent decline (for a net of 8.1 percent). Recaptured donors, or those who had previously stopped giving, were responsible for 10.3 percent of revenue growth, only to be countered by a decline in giving by repeat lapsed donors, at 18.0 percent (for a net of -7.8
percent). Meanwhile, upgraded donors claimed 21.5 percent of revenue gains, but these gains were mitigated by a decline of 18.8 percent in downgraded donors (for a net of 2.7 percent).
Among all organizations, the donor growth rate, or the number of new donors, was 0.6 percent in 2016.18 This means that for every 10 new donors, 9.9 were lost. The total loss of donors in 2016 translated into a 95 percent gift attrition rate. That is, for every new $10 gift, $9.50 was lost. These losses amount to $4.6 billion for analyzed organizations.
Nonprofits have more control than they might realize over donor retention Drawing from research conducted by Adrian Sargeant, 30-year fundraising veteran Joanne Fritz writes that up to 50 percent of donors do not continue to give after their first year of support.19 While this statistic may seem discouraging, Fritz also emphasizes that that by improving donor retention by just 10 percent, an organization can improve the “lifetime value of a donor base up to 200 percent.”20
Fritz notes that the majority of the reasons why donors choose not to donate to an organization a second or third time are completely under the control of the organization.21 Oft-cited reasons by donors for not giving again include forgetting that they donated; not being reminded to give again; lack of, or irrelevant, communication
92 | Giving USA FoundationTM | Giving USA 2017
Giving USA Giving by Individuals

Over half of responding organizations report increases in charitable receipts in 2016
The Nonprofit Research Collaborative (NRC) annually conducts surveys on fundraising trends across the nonprofit sector. In 2017, this collaboration included Giving USA Foundation, the Association of Fundraising Professionals, CFRE International, the Association of Philanthropic Counsel, the National Association of Charitable Gift Planners, and Top Nonprofits.
In early 2017, the NRC surveyed U.S. and Canadian nonprofits to assess fundraising trends for the 2016 calendar year.23 The survey asked nonprofit leaders of public charities and foundations to report on changes in charitable revenue received and changes in the number of donors by specific donor type, among other questions.
For the year 2016, 60 percent of responding organizations reported that charitable receipts increased from the prior year. 24 This figure was a five percentage point decline from the prior 12-month period. Organizations that realized growth over the previous calendar year attributed the gains to increases in gifts made via email (57 percent of organizations), major gifts
Giving USA Giving by Individuals
Giving USA FoundationTM | Giving USA 2017 | 93
by the organization; or inappropriate asks. Fritz indicates that nonprofits can go a long way toward retaining donors by ensuring great customer service, cultivating commitment by the donors, and sending appropriately timed and personalized communications.
Good to KnowIt is typically much easier (and cheaper) to retain a satisfied donor than to acquire one who has never given to your organization.22 With the right data, message, resources, and communications, organizations can buck the national trend of declining donor retention rates. A basic retention “check-up” discussion within an organization should include questions such as:
When asking for support, are we clear about the use, purpose, and impact of making a gift?
Are our donors asked to support initiatives that will be repeated in future years? If not, what is the “bridge” between this gift and the next ask?
Do we thank donors promptly and personally, acknowledging their loyalty and level of giving?
Do we communicate back to our donors the impact of their gift before asking them for another?
Do we know which donors are “at risk” of not returning (for example: one-time, new, small, and event donors) and if so, what specific strategies do we have in place to retain them?
Do we ask donors regularly, across media, with consistent messaging? Is our philanthropic messaging aligned with our institutional messaging?

(55 percent), and board giving (45 percent), among other methods.
Table 1 shows all of the fundraising methods used for individual giving by responding organizations in 2016 and results for the percentage of organizations reporting that charitable revenue stayed the same or increased using these methods between 2015 and 2016.25
94 | Giving USA FoundationTM | Giving USA 2017
Giving USA Giving by Individuals
Table 1 Percentage of survey respondents reporting on fundraising methods used for individual giving in 2016 and changes in charitable receipts by fundraising method used in 2015–2016
Fundraising method
Percentage of respondents reporting use of
fundraising methodin 2016
Percentage of respondents reporting that charitable
revenue stayed the same or increased using fundraising
method, 2015 to 2016
Board giving 92 percent 85 percent
Major gifts 94 percent 79 percent
Direct response/mail 91 percent 75 percent
Special events 82 percent 74 percent
Email 81 percent 88 percent
Peer-to-peer 57 percent 90 percent
Telephone 27 percent 74 percent
SMS/text 10 percent 73 percent
Data: Winter 2017 Nonprofit Fundraising Study, May 2017, Nonprofit Research Collaborative, www.npresearch.org

Online giving up in 2016, driven by increases in monthly renewal giving and number of gifts
In spring 2017, M+R and NTEN released the 11th edition of its Benchmarks study, which investigates donor engagement and giving patterns among a sample of 133 nonprofits for the year 2016 as compared with the prior year.26 The researchers analyzed nearly 3.6 billion email messages and more than 8.3 million gifts made online, totaling $535 million in giving.
Results of the email analysis revealed:
The size of nonprofit email lists grew 10 percent, though growth was slower compared to 2015 (16 percent).
Email fundraising revenue grew 15 percent in 2016, lower than the 24 percent increase in 2015.
Email response rates for fundraising appeals declined 8 percent to 0.05 percent in 2016.
Results of the online fundraising analysis revealed:
Overall online giving dollars grew 14 percent for all reporting organizations in 2016 (compared with 15 percent in 2015), with monthly renewal giving increasing 23 percent.
One-time gifts made online grew 13 percent.
The overall number of online gifts grew 15 percent in 2016, and the average gift size increased by 0.7 percent.
Results of the social media analysis revealed:
The number of Facebook fans across reporting nonprofits grew 23 percent in 2016, while the number of Twitter followers grew 50 percent and Instagram followers grew 101 percent. Wildlife/animal welfare organizations had, by a very significant margin, the highest median number of social media fans, on average, on Facebook and Twitter. The competition was fiercer on Instagram: wildlife/animal welfare organizations also had, on average, the highest median number of Instagram followers, but this figure just barely surpassed that of environmental and international organizations.
The overall Facebook engagement rate (defined as the number of people who click or comment on a post as a percentage of people the post reached) in 2016 was 4.6 percent, with education organizations and human rights organizations demonstrating the highest levels of engagement.
Giving USA Giving by Individuals
Giving USA FoundationTM | Giving USA 2017 | 95

Giving by ultra-high-net-worth donors
The estimated net worth of the 400 wealthiest Americans rose to a record $2.4 trillion in 2016, growing 2.6 percent from 2015.27 Growing stock prices helped to bump the net worth of America’s wealthiest in 2016.28 This is according to the Forbes 400 list, released annually.29 Each Forbes 400 member was worth an average of $6 billion in 2016, with Bill Gates leading the pack at an estimated worth of $81 billion. Well-known philanthropists Jeff Bezos, Warren Buffett, Mark Zuckerberg, and Larry Ellison rounded out the top five spots, respectively.
Entry onto the 2016 list required a minimum of $1.7 billion, the same as in 2015 and up from the $1.55 million
required in 2014.30 Those in the 60-79 age bracket captured the largest portion of assets by age, at 54 percent. Those in the technology and finance/investment industries comprised a combined 45 percent of the assets. Other key facts of the 2016 Forbes 400 include:
51 (12.75 percent) members are women;31
22 (5.5 percent) are newcomers;32 and
42 (10.5 percent) are naturalized U.S. citizens.33
Fourteen of the 2016 Forbes 400 billionaires are under the age of 40.34 The majority (64 percent) of this younger set are tech entrepreneurs, while the remaining individuals inherited their wealth. The wealth of these youngest billionaires totaled an estimated $113.7 billion in 2016. Snapchat founder and CEO Evan Spiegel is the youngest member of this group, at just 26 years old. Facebook founder and CEO Mark Zuckerberg is the wealthiest, with $55.5 billion in assets.
Detail drawn from a number of reports and media sources on giving by the wealthy are reported in the following sections.
Philanthropy is being driven increasingly by wealthy Americans, says reportUsing data from the Internal Revenue Service (IRS), Foundation Center, Target Analytics, and Giving USA, the Institute
96 | Giving USA FoundationTM | Giving USA 2017
Giving USA Giving by Individuals

for Policy Studies and Inequality.org released a report outlining the impact of financial inequality on charitable giving over the last 10 years.35 The report identifies trends, potential long-term effects, and strategies for addressing the effects. The report’s main conclusion is that charities are receiving larger donations from a limited pool of high-income households, while seeing a smaller number and dollar amount of gifts from relatively lower-income households.
The analysis highlights a chart from IRS Statistics of Income (SOI) data indicating that inflation-adjusted itemized contributions grew 40 percent for households with an income of $100,000 or more from 2003 to 2013, with the greatest increase in households with incomes of $10 million or more (104 percent).36 Conversely, charitable deductions for households earning less than $100,000 decreased 34 percent in the same time period, with the greatest declines for households earning an income between $20,000 and $25,000 (-5.7 percent).
According to the report, the effects of income inequality on the charitable sector may include charities struggling to maintain a consistent budget, as they receive a handful of large gifts at unpredictable times, rather than a smaller but steady stream of charitable dollars. Larger gifts dedicated to specific projects also reduce the share
of donations that can be used for operating costs.37 The report also argues that the increased focus on high-net-worth donors may pose risks to civil society, such as charities shifting their mission to better fit with high-net-worth donors’ prerogatives and increased opportunities for abuse of the philanthropic system.
The report issues recommendations for nonprofits to address these concerns, including continued focus and attention on donor retention and acquisition at all giving levels, mission education, strong nonprofit leadership.38 In addition, the report suggests changing tax policy, using foundation governance to increase payout percentage, limiting foundations’ ability to operate in perpetuity, and encouraging independent boards.
Wealthy Millennials are set to make their mark within their family foundations and beyond The 2017 BNP Paribas Individual Philanthropy Report by The Economist explored the philanthropic aspirations and activities of Millennials engaged with their own family’s foundation.39 The Economist’s Intelligence Unit conducted interviews with affluent Millennials from around the world between November 2016 and January 2017.
According to the study, which drew data from Capgemini’s World Wealth Report and Wealth-X’s 2016 Changing
Giving USA Giving by Individuals
Giving USA FoundationTM | Giving USA 2017 | 97

Philanthropy: Trend Shifts in Ultra Wealthy Giving, among others, U.S. high-net-worth individuals were worth $16.6 trillion in 2015.40 As such, it is estimated that $30 trillion could be passed on to the currently young Millennial generation. Considering that ultra-high-net-worth individuals give an average 12 percent of their net worth for philanthropic purposes, family foundations have the potential to make an exceptional impact on U.S. communities in the near future.41
The study found that while wealthy Millennials take their family’s philanthropic traditions seriously, they do not shy away from making their own unique mark.42 These individuals especially embrace emerging strategies for leveraging the impact they are making, such as using impact investing and engaging in collaborations with others across the globe. If their family foundation does not satisfy their charitable objectives, Millennials are likely to use social entrepreneurship to create their own organizations. Among other results, the study found that these young change-makers are heavily engaged in social media, actively explore innovative strategies to garner support, and are serious about measuring impact.
The Giving Pledge continues to grow in 2016The Giving Pledge “is an effort to help address society’s most pressing problems by inviting the world’s wealthiest
individuals and families to commit to giving more than half of their wealth to philanthropy or charitable causes either during their lifetime or in their will.”43 According to Foundation Center’s Glasspockets website, which has a special section on the Giving Pledge, the number of Giving Pledge signatories totaled 158 as of mid-May 2017.44 This figure is an increase of 30 pledgers from early 2015,45 with 17 pledgers joining in 2016.46
New American pledgers include Airbnb co-founders Nathan Blecharczyk (and wife Elizabeth), Joe Gebbia, and Brian Chesky; Salesforce founder Marc Benioff (and wife Lynne); and Intuit founder Scott Cook and Software Publishing Corporation founder Signe Ostby, among others.47
The vast majority of pledgers reside in the United States, and their total amount in assets was estimated to be
98 | Giving USA FoundationTM | Giving USA 2017
Giving USA Giving by Individuals

$680 billion as of early 2017.48 Statistics from Glasspockets suggest that Giving Pledge philanthropists have a wide range of interests, but health, human services, and education are primary areas of support. Pledgers are typically older, with 102 of the pledgers aged 65 or older. That being said, Giving Pledge donors’ median age is trending downwards to 67 years of age, dropping from 2015’s median of 69.49
Philanthropy’s largest contributions in 2016Each year The Chronicle of Philanthropy compiles a list of the 50 most generous philanthropists in the United States, including living individuals/families and estates.50 Totals are calculated by considering gifts and pledges of cash and stock to U.S. nonprofits, but without double-counting cash payments of past pledges. In 2016, Philanthropy 50 donors contributed $5.6 billion, a decline of 20 percent from the $7.0 billion reported for the year 2015 and a decline of 45 percent from the $10.2 billion reported for the year 2014. The reported Philanthropy 50 contributions for the year 2016 were the lowest since 2010 ($3.3 billion).51 The Chronicle cites the lack of large bequests, a rocky 2016 stock market, and a contentious presidential election as likely reasons for the decline.
Gifts reported on the 2016 Philanthropy 50 list ranged from $25.1 million to $900 million.52 The median gift from the top 50
donors in 2016 was $55 million, much lower than the median gift of $91.1 million reported for the year 2015.53 Per the usual trend, colleges and universities received the largest portion of the Philanthropy 50 donations, at 48 percent.
The largest donation on the Philanthropy 50 list was made by Nike co-founder Phil Knight and his wife, Penny.54 The couple pledged $500 million to the University of Oregon for scientific research and gave $400 million to Stanford University for graduate scholarships.55
Four female business leaders also made the 2016 list, including Burt’s Bees co-founder Roxanne Quimby, Facebook COO Sheryl Sandberg, real-estate investor Suzanne Dworak-Peck, and hotel and casino entrepreneur Elaine Wynn.56 A $90 million gift from Quimby helped to create and maintain the Katahdin Woods and Waters National Monument Park in Maine, and Dworak-Peck’s $60 million went to the University of Southern California.57
More than 91 percent of high-net-worth households give to charity, with over half giving to more than five organizations In October 2016, U.S. Trust, in collaboration with the Indiana University Lilly Family School of Philanthropy, released the 2016 U.S. Trust Study of High Net Worth Philanthropy on high-net-worth households’ philanthropic
Giving USA Giving by Individuals
Giving USA FoundationTM | Giving USA 2017 | 99

motivations, aspirations, and giving trends.58 This biennial study is the fifth in a series that began in 2006 and defines high-net-worth households as those with at least $1 million in assets (excluding the value of their home) and/or at least $200,000 in annual income. More than 1,400 households participated in the study in 2016 and reported on their 2015 giving habits, as well as future giving aspirations.
Results from the study revealed that 91.0 percent of high-net-worth households gave to charity in 2015.59 This figure is compared with 58.8 percent of U.S. households in the general population in 2012. A much greater percentage of high-net-worth households give to secular organizations (88.3 percent) than to religious organizations (49.6 percent). Still, both giving rates are higher than for general population households in 2012 (49.7 percent and 36.4 percent, respectively).
More than half (51.8 percent) of high-net-worth households gave to five or more organizations in 2015, and nearly a quarter (22.8 percent) gave to two or fewer organizations.60 Among all reporting households, the greatest percentage (63.0 percent) gave to support basic needs organizations. Followed by the 49.6 percent that gave to support religious purposes, roughly four-in-10 reporting households each gave to support health, combination, or youth/family services charities. While
many households gave to multiple organizations and for multiple causes, the greatest percentages of charitable dollars given by reporting households supported religious (36.1 percent) and basic needs (27.9 percent) causes.
When asked how they choose which organizations to suppport, more than half of responding households indicated that personal values (78.3 percent), interest in a specific issue (64.2 percent), having firsthand experience (55.1 percent), or giving to a reputable or recognized charity (51.0 percent) informed their giving.61 In addition, top motivations reported for giving in general by responding households included believing in the mission of the recipient organization (54.1 percent), believing that the gift would make a difference (44.0 percent), and for personal satisfaction (38.7 percent).
Majority of wealthy donate and volunteer; 31 percent cite impact investing as an interestOf the 684 high-net-worth and ultra-high-net-worth individuals responding to a 2016 U.S. Trust survey, U.S. Trust Insights on Wealth and Worth, 74 percent reported donating to nonprofits.62 In addition, 61 percent of respondents reported that they volunteer their time, skills, or service and 47 percent reported that they serve on a board. When it comes to impact investing, 27 percent of respondents
100 | Giving USA FoundationTM | Giving USA 2017
Giving USA Giving by Individuals

with $10 million or more in assets indicated that they currently own impact investments while an additional 31 percent are interested in adding this type of financial activity. Fifty-eight percent report that when investing, they consider societal impact. Top impact investment interests cited by these respondents include: environmental protection; healthcare quality and access; and disease prevention, treatment, and cure.
Generation X: America’s philanthropic middle child
Research on generational giving often focuses on the oldest and youngest sets of Americans. Boomers (born between 1946 and 1963) and Matures/Silents (born 1945 and earlier) are central in generational giving research because of their giving power and high rates of participation.63 On the other end of the spectrum, while sometimes deemed the “me generation,” research indicates that the Millennial generation (born between 1981 and 1995) is particularly involved and generous when it comes to social issues.64
At one time considered the “slackers,” Generation X (born between 1964 and 1981) is often labeled as skeptical yet self-reliant.65 Hard evidence shows that Generation X faces serious financial constraints, especially following the Great Recession.66 Anecdotal evidence
suggests that Generation X is stretched thin for time, but is interested in supporting a focused number of charities with small or midlevel gifts.67
A report from Pew Charitable Trust notes that Generation Xers have high debt as compared to their parents, with 97 percent of surveyed Generation Xers holding some form of debt at a median of $7,232, while only 82 percent of their parents held debt, and did so at a much lower median amount ($1,237).68 In addition, with an age range of mid-30s to early 50s, many members of Generation X are also are busy advancing their careers and caring for children and aging parents.69
However, philanthropic research has shown that Generation Xers are in fact generous, despite their financial and time limitations. One study found that Generation Xers give an average of $732 annually and, as a whole, comprise 20 percent of annual U.S. giving—a sizable chunk for a relatively small generation (66 million, as compared with Boomers numbering 75 million).70 Another annual study consistently finds that Generation Xers have the highest volunteer rates (28.9 percent) compared to other generations, reflecting Generation X’s hands-on approach.71
Despite the experiences, efforts, and values of Generation X, philanthropic practitioners may be misattuned to this generation’s giving and volunteering power.72 Instead, practitioners may
Giving USA Giving by Individuals
Giving USA FoundationTM | Giving USA 2017 | 101

be too focused on securing high-level gifts and bequests from Boomers and cultivating relationships with Millennials to worry about Generation Xers. Some giving experts think this is a mistake. Dara Royer, chief development and marketing officer at Mercy Corps, notes, “Even though Generation X might not be the most valued donors in the organizations’ files today, they absolutely will be tomorrow.”73
Employing fundraising practices aligned with the following Generation X giving trends may be helpful for organizations. As compared with other generations, members of Generation X:74
are more likely to volunteer;
are more likely to focus giving on fewer organizations (than older generations); and
are more likely to give small to mid-level gifts over a longer period of time, which are more likely to translate into bequests.
Tough 2016 political season did not change Millennials’ engagement in social causes
The 2016 Millennial Impact Report, researched by Achieve and sponsored by the Case Foundation, combines three waves of survey collection data during 2016 to provide a comprehensive
understanding of Millennials’ engagement with social causes.75 The researchers paid specific attention to potential effects of the political season on Millennials’ cause activities. Key takeaways from the research indicate that Millennials:
did not change their cause preferences substantially during a contentious political season;
did not increase their engagement with social causes during the political season;
consider themselves to be advocates rather than activists;
desire that government work more collaboratively; and
are issue-driven when it comes to voting and politics.
Analysis of the data reveals that Millennials’ top issues are education, employment/wages, healthcare, and the economy.76 However, differences in responses by race and education levels were apparent, with Hispanic, African American, and high school/non-degreed respondents selecting crime/criminal justice as their top issue. Forty-three percent of Millennials reported that they volunteered. Among these respondents, 64 percent volunteered for disaster relief efforts, 61 percent for international issues, and 59 percent for arts and culture organizations.
When asked whether they engaged with a cause in the past year, differences
102 | Giving USA FoundationTM | Giving USA 2017
Giving USA Giving by Individuals

were seen between male and female respondents.77 Across all survey waves, male respondents were much more likely to report donating to a cause, as compared to female respondents (waves 1 through 3 demonstrated donation rates among men at 63 percent, 40 percent, and 53 percent, repectively, as compared to women’s donation rates of 40 percent, 33 percent, and 30 percent, respectively).
Similar differences between males and females were seen for volunteer rates and supporting community projects, and results were also similar across survey waves.78 It was not clear in the report why males consistently reported higher rates of community involvement. In general, conservative-leaning Millennials engaged with causes at a higher rate than liberal-leaning Millennials, whether through material support, volunteering, or participating in demonstrations.
Puerto Rican general population households give at a higher rate than mainland households
A 2016 study titled Giving in Puerto Rico reveals that 74.9 percent of Puerto Rican households in the general population gave to charity in 2014.79 This giving rate is higher than households in the mainland U.S. Among high-net-worth Puerto Rican households, 88.4 percent gave to charity that year, which is lower than in the mainland U.S. The study was researched and written by the Indiana University Lilly Family School of Philanthropy in partnership with the Flamboyan Foundation and Kinesis Foundation. Using survey methodology, the study examined responses of 847 Puerto Rican households, 95 of which were considered high-net-worth, concerning their philanthropic behaviors and preferences.
Puerto Ricans at all income levels reported three primary reasons for their giving: supporting their communities, spontaneous giving to support an immediate need, and believing that their gift will make a difference.80 These households tend to focus their giving on a small number of organizations (a median of two), and the majority (52.8 percent) focus their giving on issues specific to Puerto Rico. In 2014, households within the Puerto Rican general population gave
Giving USA Giving by Individuals
Giving USA FoundationTM | Giving USA 2017 | 103

an average of $286, while high-net-worth households gave an average of $1,171. For general population households, the religious subsector received the largest average gift amount ($118) compared to other charitable recipients by category. High-net-worth donors gave their largest average gift amount to higher education ($241).
When asked about their volunteering patterns, 38.6 percent of Puerto Rican households in the general population reported volunteering in 2014.81 That year, 42.1 percent of high-net-worth Puerto Rican households volunteered. While most Puerto Ricans volunteer less than once per month, a greater percentage of general population Puerto Rican households volunteer than their mainland U.S. counterparts (38.6 percent compared to 33.7 percent).
When asked about barriers to giving, the top answer provided by both the general population and high-net-worth households was a lack of income for giving.82 Other cited barriers to giving include not having enough information about charities or nonprofits, lack of trust in leaders, and a desire to give informally.
Charities Aid Foundation World Giving Index 2016
The Charities Aid Foundation (CAF) World Giving Index 2016 compiles global data from 140 countries on philanthropic donations and activity over a five-year period (2011–2015).83 For 2016, the U.S. ranked second (with a score of 61 percent) on the World Giving Index’s overall ranking of philanthropic activity, following Myanmar (with a score of 70 percent). The annual report uses data from the Gallup World View World Poll, which surveys representative samples of individuals living in urban centers. Respondents reported on their philanthropic behavior for the previous month. Table 2 provides a summary of the top five countries ranked on the list in 2016.
Index results reveal that the percentage of Americans who helped a stranger fell in 2016, from 76 percent in 2015 to 73 percent.84 Nevertheless, the percentage of Americans who volunteered rose to 46 percent, from 44 percent in 2015. The U.S. received the following rankings, in terms of the percentage of people in the population reporting:
9th place for helping a stranger;
5th place for volunteering; and
13th place for giving money.
104 | Giving USA FoundationTM | Giving USA 2017

Volunteer rates decline slightly in 2015
The Corporation for National and Community Service (CNCS) reported in its annual Volunteering and Civic Life in America study that 24.9 percent of American residents volunteered in 2015, or 62.6 million volunteers.85 The number of American volunteers declined slightly from 2014 (62.8 million). Volunteers provided 7.9 billion service hours in 2015, worth $184 billion. The largest proportion of volunteers (34.1 percent) gave their time serving a religious organization, followed by an educational or youth service organization (26.0 percent).86
Individuals in the age range 35-44 were most likely to volunteer in the 2013 to 2015 period, at a rate of 29.8
percent, followed by those in the age range of 45-54 (28.3 percent).87 Among volunteers in the years 2013 to 2015, the largest percentages fundraised (24.0 percent) or collected/prepared/distributed food (24.2 percent).88
An interactive website that allows viewers to compare volunteering rates and trends over time and by state can be accessed at www.VolunteeringinAmerica.gov.
IRS disclosure mandate
In June 2016, the U.S. House of Representatives voted to terminate the current IRS requirement that nonprofits disclose information about contributors of $5,000 or more on yearly tax filings.89 Legislators who supported the bill cited free speech and the protection of donors as reasons for halting this rule.
Giving USA Giving by Individuals
Giving USA FoundationTM | Giving USA 2017 | 105
Table 2The top 5 countries listed on the World Giving Index 2016
2016 Ranking
Country2016 WGI
Score2015 WGI
Score
1 Myanmar 70 66
2 United States 61 61
3 Australia 60 59
4 New Zealand 59 61
5 Sri Lanka 57 56
Data: World Giving Index 2015 and World Giving Index 2016, Charities Aid Foundation, 2016 and 2017, www.cafonline.org

Opponents worried that ending the mandate would embolden wealthier donors to influence political elections and policy, undermine transparency within the nonprofit sector, and reduce state- and federal-level efforts to enforce tax laws. Ultimately, the bill did not pass the Senate and died at the end of the 114th Congress on January 3, 2017.90
References1 All data in this section are reported as estimates,
which are subject to revision. To provide the most accurate estimates for charitable giving, as new data become available, Giving USA revises its estimates for at least the last two years. See more about how Giving USA calculates charitable giving by sources
Key findings from annual studies summarized
Table 3 presents data from the IRS on charitable deductions claimed on individual tax returns for the years 2012–2014.
and uses in the “Brief summary of methods used” section of this report.
2 The 4.0 percent increase for giving by itemizing individuals/households includes Giving USA’s adjustment for mega-gifts.
3 Practitioner highlight authored by Editorial Review
106 | Giving USA FoundationTM | Giving USA 2017
Giving USA Giving by Individuals
Table 3
IRS statistics on charitable deductions claimed on individual tax returns, 2012–2014
IRS statistics on charitable deductions claimed on individual tax returnsTax years: 2012–2014www.irs.gov/taxstats
2012 2013 2014
Percentage of individual tax returns with itemized deduction for charitable gifts (cash only)
75 percent 75 percent 75 percent
Average charitable deductions taken on individual tax returns (cash only)
$4,449 $4,441 $4,708
Chapter authored by Melanie A. McKitrick, L.S.W., M.S.W., M.P.A., former Managing Editor of Giving USA and currently a mental health therapist in Indianapolis, IN.
Good to Know section and Practitioner Highlights written by Giving USA Editorial Review Board member Kathy Howrigan and staff at the Indiana University Lilly Family School of Philanthropy.

Board member Kathy Howrigan.4 Practitioner highlight authored by staff at the Indiana
University Lilly Family School of Philanthropy. 5 Practitioner highlight authored by Editorial Review
Board member Kathy Howrigan.6 “Disposable Income,” Investopedia, retrieved April
2017, www.investopedia.com7 “National Data: GDP and Personal Income,”
Bureau of Economic Analysis, U.S. Department of Commerce, retrieved April 2017, www.bea.gov
8 “Chapter 5: Personal Consumption Expenditures,” Concepts and Methods of the U.S. National Income and Product Accounts, Bureau of Economic Analysis, U.S. Department of Commerce, October 2009, https://www.bea.gov/national/pdf/nipahandbookch5.pdf
9 Same as note 7.10 Same as note 7.11 “S&P 500 Stock Price Index (S&P 500),” Federal
Reserve Bank of St. Louis, FRED® Economic Data, 2016, retrieved April 2017, www.research.stlouisfed.org
12 Same as note 11.13 This estimate includes Giving USA’s addition of mega-
gifts. See the “Brief summary of methods used” section of this report for additional information.
14 This information is in current dollars.15 2017 Fundraising Effectiveness Survey Report,
Association of Fundraising Professionals, Urban Institute, 2017, http://afpfep.org/wp-content/uploads/2017/04/FEP2017Report4212017.pdf
16 Same as note 15.17 Same as note 15.18 Same as note 15. 19 Joanne Fritz, “How To Get First Time Donors To
Give Again,” The Balance, March 17, 2017, www.thebalance.com, para. 5
20 Joanne Fritz, “How To Get First Time Donors To Give Again,” The Balance, March 17, 2017, www.thebalance.com, para. 6
21 Joanne Fritz, “How To Get First Time Donors To Give Again,” The Balance, March 17, 2017, www.thebalance.com
22 Good to Know section authored by Editorial Review Board member Kathy Howrigan.
23 The Nonprofit Research Collaborative (NRC) annually conducts surveys on fundraising trends across the nonprofit sector. In 2017, this collaboration included the Giving USA Foundation, the Association of Fundraising Professionals, CFRE International, the Association of Philanthropic Counsel, the National Association of Charitable Gift Planners, and Top Nonprofits. In early 2017, the NRC launched a survey to assess fundraising trends for the entire 2016 calendar year. The survey asked nonprofit leaders of public charities and foundations to report on changes in charitable revenue received and changes in the number of donors by specific donor type, among other questions. Data in this section come from two reports from the Nonprofit Research Collaborative
at www.npresearch.org: Winter 2017 Nonprofit Fundraising Study, May 2017, and Winter 2016 Nonprofit Fundraising Survey, March 2016. The March 2016 report includes 1,197 respondents, 71 of them Canadian. The May 2017 report includes 1,019 respondents, 144 of them Canadian. A convenience sample of respondents constitute both survey results.
24 Same as note 23.25 Same as note 23.26 Benchmarks 2017, M+R and NTEN, 2017, www.e-
benchmarksstudy.com. Note that this study uses a convenience sample of 133 organizations with online revenue totaling over $535 million and that the organizations types reported in this study do not necessarily match those used in Giving USA.
27 “The Forbes 400,” Forbes, October 4, 2016, www.forbes.com
28 Kerry A. Dolan, “Inside the 2016 Forbes 400: Facts and Figures About America’s Richest People,” Forbes, October 4, 2016, www.forbes.com, para. 1
29 Same as note 27.30 Carl O’Donnell and Will Sanderson, “What Does It
Take To Make The Forbes 400? Increasingly More and More,” Forbes, October 3, 2014, www.forbes.com
31 Same as note 27.32 Kerry A. Dolan, “Inside the 2016 Forbes 400: Facts
and Figures About America’s Richest People,” Forbes, October 4, 2016, www.forbes.com
33 Jennifer Wang, “More Than 10% of the Forbes 400 are Immigrants, 14 of Whom are Richer Than Trump,” Forbes, October 4, 2016, www.forbes.com
34 Kate Vinton, “The Youngest Billionaires on the Forbes 400: 14 Under 40,” Forbes, October 4, 2016, www.forbes.com
35 Chuck Collins, Helen Flannery, and Josh Hoxie, Gilded Giving: Top-Heavy Philanthropy in an Age of Extreme Inequality, November 2016, http://www.ips-dc.org/wp-content/uploads/2016/11/Gilded-Giving-Final-pdf.pdf
36 Same as note 35.37 Same as note 35.38 Same as note 35.39 Sarah Murray and Melanie Noronha, Passing the
Torch: Next-Generation Philanthropists (2017 BNP Paribas Individual Philanthropy Report), The Economist, 2017, http://sustainablegiving.economist.com/wp-content/uploads/sites/18/2017/04/2017-BNP-PARIBAS-PHILANTHROPY-REPORT_FINAL.pdf
40 Same as note 39.41 Those with at least $30 million in assets excluding
personal property. 42 Same as note 39.43 “What is the Giving Pledge?” The Giving Pledge,
retrieved May 2017, www.givingpledge.org44 “A Closer Look,” GlassPockets, Foundation Center,
retrieved May 2017, www.glasspockets.org. Note that the site is continually updated; therefore, figures published in Giving USA may vary from current figures.
45 Giving USA 2015: The Annual Report on Philanthropy
Giving USA Giving by Individuals
Giving USA FoundationTM | Giving USA 2017 | 107

for the Year 2014, Giving USA Foundation, 2015, www.givingusa.org
46 Homepage, Glasspockets, Foundation Center, retrieved April 2017, www.glasspockets.org
47 “Lynne and Marc Benioff,” Glasspockets, Foundation Center, retrieved April 2017, www.glasspockets.org
48 Same as note 44.49 Same as note 46, para. 5.50 Maria Di Mento and Drew Lindsay, “Philanthropy 50:
Nike Mogul Tops Chart While Tech Giants Flex Charity Muscle,” The Chronicle of Philanthropy, February 7, 2017, www.philanthropy.com
51 Maria Di Mento and Nidhi Singh, “Philanthropy 50: Where They Live, Where They Give, and More,” The Chronicle of Philanthropy, February 7, 2017, www.philanthropy.com
52 Maria Di Mento, “2017 Philanthropy 50,” The Chronicle of Philanthropy, February 7, 2017, www.philanthropy.com
53 Same as note 51.54 Same as note 50.55 Same as note 52.56 Same as note 52.57 Maria Di Mento, “Roxanne Quimby,” 2017
Philanthropy 50, The Chronicle of Philanthropy, February 7, 2017, www.philanthropy.com
58 2016 U.S. Trust Study of High Net Worth Philanthropy, the Indiana University Lilly Family School of Philanthropy in collaboration with U.S. Trust, 2016, http://www.ustrust.com/publish/content/application/pdf/GWMOL/USTp_ARMCGDN7_oct_2017.pdf
59 Same as note 58.60 Same as note 58.61 Same as note 58.62 2016 U.S. Trust Insights On Wealth and Worth, U.S.
Trust, Bank of America, 2016, http://www.ustrust.com/publish/content/application/pdf/GWMOL/USTp_ARXDJKR8_2017-05.pdf
63 Bridget Hartnett and Ron Matan, Generational Differences in Philanthropic Giving, Sobel & Co., LLC, 2014, http://sobel-cpa.com/sites/default/files/NFP%20Fall%202014%20Whitepaper.pdf; Mark Rovner and Pam Loeb, The Next Generation of American Giving, Blackbaud, 2013, www.blackbaud.com
64 Cara Newlon, “Millennials: The Giving Generation?” USA Today, December 11, 2013, www.usatoday.com, para. 1; Mark Rovner and Pam Loeb, The Next Generation of American Giving, Blackbaud, 2013, www.blackbaud.com,
65 Bridget Hartnett and Ron Matan, Generational Differences in Philanthropic Giving, Sobel & Co., LLC, 2014, http://sobel-cpa.com/sites/default/files/NFP%20Fall%202014%20Whitepaper.pdf; “Generation X: Alternative Goes Mainstream,” National Geographic, retrieved April 2017, www.nationalgeographic.com; Lavanya Ramanathan, “We Thought Gen X Was a Bunch of Slackers; Now They’re the Suits,” The Washington Post, March 1, 2017, washingtonpost.com, para. 3
66 The Retirement Readiness of Generation X: The
Lasting Effects of the ‘Great Recession’ on Gen-Xers’ Retirement Outlook, Insured Retirement Institute, 2014, www.irionline.org; Gina Ragusa, “Gen X is Dazed and Confused When it Comes to Retirement,” The Street, May 23, 2016, www.thestreet.com
67 Heather Joslyn, “Generation X Comes of Age as Donor Group with Big Potential,” The Chronicle of Philanthropy, September 6, 2016, www.philanthropy.com
68 A New Financial Reality: The Balance Sheets and Economic Mobility of Generation X, The Pew Charitable Trusts, 2014, http://www.pewtrusts.org/~/media/assets/2014/09/pew_generation_x_report.pdf
69 Same as note 67.70 Andrew Shoaff, “Generational Fundraising Tops:
A Companion to the Next Generation of American Giving,” Blackbaud, https://www.blackbaud.com/files/resources/downloads/08.13.CORP.NextGenGiving.Tipsheet.pdf; Heather Joslyn, “Generation X Comes of Age as Donor Group with Big Potential,” The Chronicle of Philanthropy, September 6, 2016, www.philanthropy.com
71 “Generation X,” Corporation for National & Community Service, retrieved April 2017, www.nationalservice.gov; “New Report: Service Unites Americans; Volunteers Give Service Worth $184 Billion,” Corporation for National & Community Service, November 15, 2016, www.nationalservice.gov
72 Same as note 67.73 Same as note 67, para. 12.74 “Generation X,” Corporation for National &
Community Service, retrieved April 2017, www.nationalservice.gov
75 The 2016 Millennial Impact Report, Achieve, 2017, http://achievemulti.wpengine.com/mi/files/2017/03/FinalReport_MIR2016_031717-WEB.pdf
76 Same as note 75.77 Same as note 75.78 Same as note 75. 79 Giving in Puerto Rico, The Indiana University
Lilly Family School of Philanthropy, Flamboyan Foundation, and Kinesis Foundation, 2016, http://flamboyanfoundation.org/wp/wp-content/uploads/2016/09/Giving-in-Puerto-Rico-Full-Report-FINAL1.pdf
80 Same as note 79.81 Same as note 79.82 Same as note 79.83 World Giving Index 2016, Charities Aid Foundation,
2017, www.cafonline.org 84 Same as note 83.85 “Volunteering and Civic Life in America,”
Corporation for National & Community Service, retrieved April 2017, www.nationalservice.gov
86 “National – Main Organization,” Corporation for National & Community Service, retrieved April 2017, https://data.nationalservice.gov
87 “National – Age Group Rates,” Corporation for National & Community Service, retrieved April 2017,
108 | Giving USA FoundationTM | Giving USA 2017
Giving USA Giving by Individuals

https://data.nationalservice.gov 88 “National – Volunteer Activities,” Corporation for
National & Community Service, retrieved April 2017, https://data.nationalservice.gov
89 “House Approves Bill To End IRS Donor-Disclosure Mandate,” The Chronicle of Philanthropy, June 15, 2016, www.philanthropy.com; “H.R. 5053 (114th): Preventing IRS Abuse and Protecting Free Speech Act,” GovTrack, www.govtrack.us
90 “H.R. 5053 (114th): Preventing IRS Abuse and Protecting Free Speech Act,” GovTrack, www.govtrack.us
Giving USA Giving by Individuals
Giving USA FoundationTM | Giving USA 2017 | 109

110 | Giving USA FoundationTM | Giving USA 2017
Au
stin
Pre
sbyt
eria
n T
heo
log
ical
Sem
inar
y, p
hoto
by
Jody
Hor
ton
Giving USA Giving by Individuals

Grantmaking by independent, community, and operating foundations increased 3.5 percent from 2015—to an estimated $59.28 billion in 2016. Adjusted for inflation, giving by foundations increased 2.2 percent in 2016.1
Giving from all three types of foundations included in the estimate grew in 2016:
– Giving by independent foundations increased 2.3 percent;
– Giving by operating foundations increased 4.5 percent; and
– Giving by community foundations increased 9.9 percent.
Giving USA estimates that, on average, giving by family foundations comprises 64 percent of giving by independent foundations each year. For 2016, this amount was estimated to be $28.90 billion, or 48.7 percent of total giving by all foundations included in the foundation giving estimate.2
Giving USA FoundationTM | Giving USA 2017 | 111
5 | Giving byFoundations
Au
stin
Pre
sbyt
eria
n T
heo
log
ical
Sem
inar
y, p
hoto
by
Jody
Hor
ton

The information provided in this chapter derives from a
number of sources, including publicly available reports, news stories, and websites from the most recent year. This chapter is meant to provide context for the giving trends reported in this edition of Giving USA and to illustrate some of the practical implications of the data. It is not intended to be a comprehensive survey of the subsector, but rather a collection of examples from the field.
Trends in giving by foundations in 2016
Estimates released by Giving USA in this edition show that giving by foundations totaled $59.28 billion in 2016, a 3.5 percent increase (in current dollars) over 2015. Giving by foundations has seen steady growth since 2011, when the sector bounced back from the declines realized after the Great Recession (2007–2009). After a sharp increase in 2014, the growth in giving by foundations in 2015 and 2016 has been relatively moderate.
Giving USA’s estimate for giving by foundations is based on data provided by Foundation Center and includes grants issued by independent, community, and operating foundations.
112 | Giving USA FoundationTM | Giving USA 2017
Giving USA Giving by Foundations
Practitioner Highlights Giving from community foundations increased the most in 2016, growing
by 9.9 percent following a 5 percent increase in their assets in 2015.3
A growing trend in foundation giving is the increased programmatic focus on funding initiatives addressing inequality and poverty. In 2016, more foundations joined institutions like the Ford Foundation, who have committed funding to addressing these issues.4
Innovative collaborations such as Blue Meridian Partners, a partnership of 12 major national foundations, are encouraging and financing nonprofit expansion to address targeted social issues for vulnerable populations.5

Independent foundations are sometimes called private foundations, and this category also includes family foundations. The estimate does not include giving by corporate foundations, which is provided in the “Giving by corporations” chapter.
Total giving by independent, community, and operating foundations in 2016 is estimated to be $59.28 billion.6 The share of giving by each foundation type for 2016 is included in Figure 1. The share of total grantmaking by each foundation type in 2016 was roughly the same as in 2015, according to revised estimates issued by Foundation Center. Independent foundations contributed the vast majority of grantmaking dollars in 2016, at 76.2 percent. Operating foundations and community foundations granted 10.9 percent and 13.0 percent the total in 2016, respectively.
Independent foundations increased their giving by an estimated 2.3 percent in 2016, to $45.15 billion.7 Overall, just
two-fifths of independent foundations responding to Foundation Center’s 2016 Foundation Giving Forecast Survey indicated that they had increased their giving.8 Some factors contributing to the relatively flat growth in giving may be the 3.8 percent overall growth in independent foundation assets in the prior year (the lowest in five years). Part of the slower growth in assets may be attributed to a decline in gifts to independent foundations (down 12 percent). Independent foundations, including family foundations, account for the vast majority of foundation giving each year.
Community foundation giving grew 9.9 percent in 2016 over 2015, to $7.68 billion.9 Sixty-one percent of community foundations responding to Foundation Center’s 2016 Foundation Giving Forecast Survey reported having increased their giving that year.10 Community foundations benefited from an increase of roughly 5 percent in their assets in 2015 although they reported a drop in gifts received. Among community foundations, the largest foundations reported faster growth, while smaller community foundations reported more modest growth for 2016.
Operating foundations increased grantmaking by an estimated 4.5 percent in 2016, to $6.45 billion.11 Grantmaking by these foundations improved in 2016, as compared with 2015, which saw a decline in operating foundation grantmaking of 16 percent.
Giving USA Giving by Foundations
Giving USA FoundationTM | Giving USA 2017 | 113

Grantmakers value and practice transparency but more work is needed
In February 2016, the Center for Effective Philanthropy released Sharing What Matters: Foundation Transparency.12 A survey of 145 independent and community foundation CEOs, as well as 15,000 grantees and a review of 70 foundation websites, indicated that transparency is valued by both funders and grantees. However, respondents also reported that there is still room for improvement.
Leaders from both foundations and nonprofit organizations see transparency as a vital component of funders’
operations.13 Foundation CEOs reported that their transparency efforts are directed toward grantees and potential grantees, rather than other foundations, governments, or the general public. Community foundation leaders also name donors as a critical audience for transparency efforts. Foundations are most transparent about their grantmaking processes as well as their goals and funding strategies. However, funders disclose less about their evaluation practices in spite of the fact that their leaders believe it would benefit both the organization and its grantees.
The report concluded that, in order to become more effective funders and partners, foundations need to be transparent about their strategy to affect social change as well as the lessons
114 | Giving USA FoundationTM | Giving USA 2017
Giving USA Giving by Foundations
Figure 1
Share of foundation grantmaking by foundation type (independent, community, and operating) in 2016(in billions of dollars, totaling $59.28 billion)
Note: Numbers are rounded in the figure.
Data provided by Foundation Center. For more information about Foundation Center data, visit www.foundationcenter.org.
Independentfoundations
$45.15
Operatingfoundations
$6.45
Communityfoundations
$7.68
76.2%
13.0%
10.9%

learned from their grantmaking.14 It is especially important to share assessments with other nonprofit organizations and the public, even if a program or strategy has failed to achieve the desired impact.
Smaller foundations focused on expanding local impact in 2016
Exponent Philanthropy’s 2017 Foundation Operations and Management Report revealed that smaller foundations, those that operate with minimal to no staff, expanded their scope of activities beyond grantmaking in 2016.15 In a survey of nearly 2,000 small, U.S.-based foundations, 79 percent indicated that they send board members to visit their grantees on-site. In addition, 43 percent held grantee convenings and 63 percent reported collaborating with other funders. Leadership succession and improving the impact of grantmaking were top concerns for Exponent Philanthropy’s member foundations.
Surveyed foundations also focused on local impact in 2016: 83 percent of foundations funded local causes and 40 percent funded state-level organizations.16 Collectively, the foundations awarded about $4 billion in grants, or 5.2 percent of the surveyed foundations’ total assets. The report
also provided results for the funding priorities of its members in 2016. Education and human services were top priorities for responding foundations. Seventy-five percent of the surveyed foundations reported giving to education, and 60 percent reported giving to human services.
Rural philanthropy remains a challenge for funders
In recent years, both large and small foundations in the United States have attempted to expand their local impact, particularly in rural communities, as these communities have traditionally been overlooked by grant dollars. A 2015 study from the U.S. Department of Agriculture (USDA), Foundation Grants to Rural Areas From 2005 to 2010: Trends and Patterns, estimated that
Giving USA Giving by Foundations
Giving USA FoundationTM | Giving USA 2017 | 115
_______________________________________
In recent years, both large and small foundations in the United States have attempted to expand their local impact, particularly in rural communities, as these communities have traditionally been overlooked by grant dollars.
_______________________________________

grants that assisted rural areas in 2010 totaled between $2.2 and $2.5 billion, comprising about 6–7 percent of that year’s total domestic grantmaking.17 Nearly 20 percent of Americans live in rural counties, and grantmaking was only $88 per resident in 2010, less than half the average for residents of urban metro counties.
The lack of attention paid to rural areas has been a well-documented shortcoming in institutional philanthropy. Rural Philanthropy: Building Dialogue From Within, a 2007 study from the National Committee for Responsive Philanthropy, argued that foundations should collaborate to build nonprofit infrastructure and talent in rural areas.18 In 2011, the Council on Foundations signed a memorandum of understanding with the USDA, establishing a partnership to promote economic development in rural areas.19 Despite these efforts, on the heels of the USDA report in 2015, then-former Secretary of Agriculture Tom Vilsack
called on foundations to increase the investment of their permanent assets in rural communities across the country.20
In 2016, some foundations worked to address the imbalance in rural-urban philanthropy. Smaller funders have focused on increasing local involvement, fostering partnerships with other resident funders, and building strong relationships with their grantees.21 Larger foundations took a slightly different approach, leveraging public and private funds to empower local organizations as they worked to permanently reduce poverty in their communities.22
Rural Philanthropy Days connect nonprofits to fundersNonprofit organizations in rural Colorado have found success attracting both educational and funding opportunities through annual conferences called Rural Philanthropy Days.23 The Community Resource Center, a nonprofit capacity-building
116 | Giving USA FoundationTM | Giving USA 2017
Giving USA Giving by Foundations

organization in Colorado, and the Anschutz Family Foundation joined forces in 1997 to create the formal, statewide event that exists today. The events are intended to attract foundation attention and support to rural areas on a regular basis.
Twelve statewide grantmakers, including the Adolph Coors Foundation, the Anschutz Family Foundation, and The Colorado Trust, fund Colorado’s Rural Philanthropy Days, which celebrated its 25th anniversary in 2016.24 These core foundations work with two predetermined rural regions of the state each year to plan a conference in their area.25 During the three-day conference, nonprofit organizations network with funders, attend professional development seminars, and pitch programmatic ideas to foundation representatives.
The connectivity events have shown results: before 1991, 3 percent of grantmaking from core Colorado foundations went to communities outside the urban corridor of Colorado Springs to Fort Collins.26 Now, these funders direct between 15–18 percent of their grants to rural areas. This represents a considerable investment in these regions, with over $403 million directed to rural communities since 1991.27
With similar success, the Carl B. & Florence E. King Foundation, the Permian Basin Area Foundation, and the Nonprofit Management
Center of the Permian Basin became founding sponsors of West Texas Rural Philanthropy Days in 2011.28 Modeled after the Colorado Rural Philanthropy Days, the West Texas days also provide networking opportunities and workshops to attendees. The event is held every two years, with the 2015 conference attracting over 130 representatives from more than 90 west Texas nonprofit organizations.
Public-private partnership aims to empower rural communitiesIn October 2016, the Mary Reynolds Babcock Foundation (MRBF) announced the creation of a collaborative fund between itself, the USDA, several other foundations, and private financial institutions.29 The purpose of the fund is to provide capital to local lenders, called community development financial institutions (CDFIs), who have a demonstrated history of helping to alleviate poverty in key rural communities.30
The $423 million fund, called the Uplift America Fund, is managed by MRBF. The USDA provided $401 million to the fund from their Community Facilities program, which will be issued in low-interest loans to CDFIs who then re-lend the money to local projects to build or maintain community facilities.31 Seven foundations (MRBF, Bank of America Charitable Foundation, Ford Foundation, F.B. Heron Foundation, JPMorgan Chase
Giving USA Giving by Foundations
Giving USA FoundationTM | Giving USA 2017 | 117

Foundation, Northwest Area Foundation, and Winthrop Rockefeller Foundation) contributed $22 million to the fund to provide capacity building grants to CDFIs. Additionally, private financial institutions, primarily Bank of America, provided financial guarantees up to $100 million. The combination of access to capacity grants and financial guarantees make CDFIs stronger candidates to receive the USDA loan funds.
Geographic focus areas of the fund include Appalachia, rural communities in the south, communities near the Texas-Mexico border, and Native American reservations.32 These loans are intended be used for a variety of developmental purposes such as the construction of schools, clinics, childcare centers, food pantries, and programmatic funding for education, healthcare, and other community infrastructure.33
Community foundation asset growth slowed, but grantmaking continued to increase
In 2016, CF Insights published findings from a survey of 271 community foundations, accounting for more than 90 percent ($71 billion) of total estimated assets held by U.S. community foundations for fiscal year 2015.35 The survey revealed that after several years of expansion, community foundations experienced a slowdown in asset growth. Total assets for the 100 largest community foundations grew by 3.2 percent between 2014 and 2015, compared to an increase of 10.7 percent between 2013 and 2014. The report noted that the slower asset growth is likely a function of lower investment yields in the general market. Gifts to the largest 100 community foundations also dropped slightly, from $7.6 billion in 2014 to $7.2 billion in 2015.
However, grantmaking from those foundations still increased from $5.2 billion in 2014 to $5.8 billion in 2015.36 This increase was attributed to continued growth in giving to donor-advised funds housed within the foundations, and efficient operating cost-to-asset ratios for larger community foundations. The report found that as a
118 | Giving USA FoundationTM | Giving USA 2017
Giving USA Giving by Foundations
Good to KnowIt is vital that grantmaking foundations and grant seekers agree on ways to measure effectiveness and provide social impact.34 Both parties should seek to create more discussions between donors, foundations, and local nonprofits to establish shared social impact goals in order to increase cooperation rather than foster competition between different stakeholders. Foundations should serve as a leader and model for transparency in how funds are distributed and for reporting on the effectiveness of initiatives.

community foundation’s size increased, the percentage of non-endowed and donor-advised fund assets as a share of total assets also increased. The same relationship held for donor-advised fund distribution rates: the larger the community foundation, the larger the portion disbursed.
More foundations committed to confronting inequality and poverty in 2016
In recent years, an increasing number of grantmakers have declared equality promotion and poverty reduction as key programmatic focus areas.37 In 2016, The San Francisco Foundation, The James Irvine Foundation (San Francisco, CA), the Weingart Foundation (Los Angeles, CA), and the Meyer Memorial Trust (Portland, OR) also changed their strategic and programmatic foci to alleviating poverty and inequality. In 2021, The James Irvine Foundation will transition its grantmaking priorities to focus on combatting poverty, as well as advocating for economic and political opportunities for Californians who live in poverty.38
In December 2016, the Center for Effective Philanthropy released a report, The Future of Foundation Philanthropy: The CEO Perspective, revealing that 65 percent of the 208 foundation CEOs
surveyed agreed that wealth and inequality was a pressing issue that will challenge society in the coming years.39 In the same survey, 48 percent of CEOs indicated that wealth and inequality would drive foundation giving in the future.
The focus on inequality and poverty reduction in 2016 continues a trend established in 2015, when the Ford Foundation announced that it would allocate $1 billion between 2016 and 2020 to reduce inequality across the globe.40 This followed the 2013 announcement that The California Endowment pledged $50 million over seven years to combat inequality and to establish the Executives’ Alliance to Expand Opportunities for Boys and Men of Color, a collection of 43 grantmakers that funded President Barack Obama’s My Brother’s Keeper initiative.41
Giving USA Giving by Foundations
Giving USA FoundationTM | Giving USA 2017 | 119

Funder collaboration seeks to address youth poverty issuesIn September 2016, Blue Meridian Partners, a capital aggregation collaboration led by the Edna McConnell Clark Foundation, was launched.42 Capital aggregation collaborations are designed to bring like-minded funders together to finance nonprofit organizations’ growth plans upfront and streamline the reporting process.43 The nonprofit organizations agree to meet certain performance markers in order to receive the upfront funding. By pooling funds, grantmakers aim to achieve greater impact than through individual grantmaking. The Edna McConnell Clark Foundation used this model in 2012 when it launched the PropelNext initiative to fund youth-serving organizations in San Francisco and Southern California.44 Blue Meridian Partners intends to expand this model to the national level.
Blue Meridian Partners consists of 12 funders, including The Duke Endowment, the William and Flora Hewlett Foundation, and The David and Lucile Packard Foundation, among others.45 As of December 2016, the collaboration had attracted $850 million in gifts toward its goal of $1 billion.46
The collaboration is targeted to invest at least $1 billion in programs to help disadvantaged children and youth.47 The partnership also hopes to identify and scale evidence-based programs
that directly serve disadvantaged youth from birth to age 30. Blue Meridian Partners aims to fund programs that indirectly serve this population by transforming the educational, judicial, and administrative public systems that disadvantaged youth interact with. The partnership will disburse flexible, unrestricted grants of up to $200 million per grantee, dependent upon progress toward the pre-established performance markers.
Foundations partner to support immigrant populationsNew and established groups of funders have committed to supporting undocumented immigrant communities facing an uncertain future in the United States. In December, Los Angeles Mayor Eric Garcetti partnered with three California foundations to establish the $10 million L.A. Justice Fund, intended to provide legal counsel to immigrants threatened with deportation.48 The California Community Foundation, the Weingart Foundation, and The California Endowment pooled $5 million to match a $5 million government grant from the city. The new fund is housed in the California Community Foundation.
Meanwhile, The New York Community Trust continued its Fund for New Citizens collaboration, which was originally established in 1987.49 Over 30 funders have contributed to the fund, including the Annie E. Casey
120 | Giving USA FoundationTM | Giving USA 2017
Giving USA Giving by Foundations

Foundation, the Ford Foundation, the J.M. Kaplan Fund, Open Society Foundations, and The Rockefeller Foundation. Since its inception, the fund has issued over $20 million to recipients, including 60 grassroots immigrant organizations across the five boroughs of New York City. Grantees have supplied legal assistance and social services to immigrant communities and advocated on behalf of these populations.
Foundation support for socioeconomic inequality researchOther funders have invested in research related to inequality, including Lumina Foundation, the Russell Sage Foundation, and the William T. Grant Foundation.50 The Atlantic Philanthropies made significant grants in 2016 to propel this research, including a $91
million grant to the London School of Economics and Political Science to establish an inequality studies fellowship and a $10 million grant to Cornell University’s Center for the Study of Inequality. In February, the Bill & Melinda Gates Foundation made a $3.7 million grant to the Urban Institute to establish the U.S. Partnership on Mobility from Poverty.51 The initiative is comprised of 24 experts that, between 2016 and 2017, will investigate scalable, permanent mechanisms that promote upward mobility for the poor.
Philanthropy watchdog calls for more funding for underserved communitiesIn December, the National Committee for Responsive Philanthropy (NCRP) released a report entitled Pennies for Progress: A Decade of Boom for Philanthropy, A Bust for Social Justice.52 The NCRP analyzed
Giving USA Giving by Foundations
Giving USA FoundationTM | Giving USA 2017 | 121
Giving USA Giving by Foundations

Foundation Center data and found that although foundations saw their assets grow 70 percent between 2002–2013, leading to an increase of $6 billion in foundation grantmaking, less than half of grant dollars were committed to underrepresented populations over that same time, according to NCRP’s calculations.
The NCRP defined social justice grantmaking as “philanthropic contributions to nonprofit organizations…that work for structure change in order to increase the opportunity of those who are the least well off politically, economically, and socially.”53 It defined underserved communities to include children, immigrants and refugees, sex workers, and incarcerated peoples, among others.
In the report, the NCRP called on foundations to provide more funding for underserved communities and social justice grantmaking.54 NCRP recommended that prospective social justice funders follow three guidelines:
Disburse at least 25 percent of annual grant dollars on social justice causes;
Provide unrestricted support to grantees, so organizations can direct funds as needed; and
Increase the number of multi-year grants awarded, allowing grantees to plan for long-term activities.
Foundations announce intentions to spend down assets, but perpetuity still the norm
In December 2016, the Edna McConnell Clark Foundation announced its intentions to spend the entirety of its approximately $1 billion endowment over the next 10 years.56 The foundation was moved to spend down its assets to have a greater impact on its core focus: helping youth in poverty. Blue Meridian Partners, the funder collaboration it established, will continue to operate independently.
122 | Giving USA FoundationTM | Giving USA 2017
Giving USA Giving by Foundations
Good to KnowHow can nonprofit organizations that address issues of social justice and inequality keep pace with the growth in available funds?55 It’s all about measuring and communicating impact. Organizations need to show potential funders their ability to affect systemic change in addressing these issues.
Metrics and statistics can be great tools for demonstrating impact: deciding what to measure, how to measure it, and how to gather the data is a challenging but necessary undertaking. Perhaps even more effective, though, is the ability to capture donors’ attention and imagination in a way that inspires them to think big and transformational when it comes to their giving. That means organizations have to think big themselves. Show donors what their gift can allow your organization to accomplish.

The Edna McConnell Clark Foundation joins other foundations who have opted to spend their endowments. The Raikes Foundation plans to fully disburse its assets by 2038, and the S.D. Bechtel, Jr. Foundation and the Stephen Bechtel Fund will do the same by 2020.57 The Quixote Foundation, a foundation in Washington State that focused on racial equity, reproductive health, and the environment, made its last grant in early 2017.58 The Atlantic Philanthropies, one of the most prominent spend-down foundations, ended their active grantmaking in 2016 and will shut down entirely by 2020.59 The Bill & Melinda Gates Foundation, which has the largest endowment in the United States, will exhaust its assets within two decades of its founders’ deaths.60
However, foundation perpetuity is still the most widely chosen model. In a December 2016 report from the Center
for Effective Philanthropy, The Future of Foundation Philanthropy: The CEO Perspective, only 16 percent of 208 foundation CEOs surveyed believed that the spend-down of assets was a promising strategy.61
Philanthropic prize competitions grow in popularity
In 2016, more grantmakers embraced philanthropic prize competitions to spur innovation for social benefit. In prize competitions, organizations or individuals are generally invited to present ideas in-person to a panel of judges, who are sometimes members of a funder’s board or independent experts.62 Government, corporations, and foundations have used prizes in the past, but funding for these competitions
Giving USA Giving by Foundations
Giving USA FoundationTM | Giving USA 2017 | 123
has ballooned to $302 million between 1991 and 2007, up from $55 million before 1990.63 Just over 80 percent of the 2007 prize competition funds went to organizations working in aviation, science, engineering, and the environment. Arts and culture organizations claimed 9.5 percent of those funds and the remainder was distributed to a variety of subsectors.
As funding for these competitions has expanded, the prize style has also changed: many foundations have shifted from “recognition awards” to “resources awards.”64 Recognition awards, such as the Nobel Prizes or the Pulitzer Prizes, only provide funding after a project or initiative has been completed. Resource awards fund the implementation of proposed ideas or programs. Foundations are using prize competitions to grant funds outside their normal focus areas and to find novel, innovative ideas from different sectors or industries.
These prize competitions are not without criticism.65 According to Vinay Prasad, an assistant professor of medicine at Oregon Health & Science
University, competitions sometimes recognize and reward efforts that already have sufficient funding or public support. In addition, philanthropic prizes do not always take the scalability potential of a project into account, and the design of these competitions can also downplay the long work that is necessary for breakthroughs.
The following sections detail new prize competitions by major foundations launched in 2016.
MacArthur Foundation competition aims to solve critical problemsIn June 2016, the John D. and Catherine T. MacArthur Foundation launched a new $100 million philanthropic prize competition called 100&Change to solve “a critical problem affecting people, places, or the planet.”66 The MacArthur Foundation, which recently pivoted its grantmaking to focus on a few key issues, sees the competition as an opportunity to discover new initiatives to fund.67
Foundations award urban development innovationsIn 2016, two foundations, The Rockefeller Foundation and the John S. and James L. Knight Foundation, organized separate competitions to fund innovative urban development ideas.68 The Rockefeller Foundation partnered with the Unreasonable Institute, a social enterprise incubator, to launch the Future Cities Accelerator in August.
124 | Giving USA FoundationTM | Giving USA 2017
Giving USA Giving by Foundations
_______________________________________
In 2016, more grantmakers embraced philanthropic prize competitions to spur innovation for social benefit.
_______________________________________
This new initiative awarded $100,000 each to 10 nonprofit and for-profit organizations that presented proposals to better the lives of underserved and marginalized populations within U.S. metropolitan areas in January 2017. The winners included organizations dedicated to literacy, education, workforce development, and human services.69 Each winner will also receive training on how to scale their programs as well as fundraising and sustainability guidance.
In October, the John S. and James L. Knight Foundation launched the final phase of its Knight Cities Challenge, a three-year program that will grant $15 million total to individuals and organizations that present innovative urban development plans.70 The foundation hopes to identify ideas that will attract a talented workforce, develop economic opportunities, or promote civic engagement in the
26 communities where the Knight family operated newspapers. Previous winners represent a variety of groups: community development corporations, civic engagement operations, cultural heritage organizations, and social service providers.71
Foundations increase funding for human rights in 2014
A report from Foundation Center and the International Human Rights Funders Group, Advancing Human Rights: Update on Global Foundation Grantmaking, revealed that foundations gave $2.7 billion to human rights causes in 2014, the latest year with comprehensive data.72 The report defines human rights grantmaking as funding to support marginalized or underrepresented communities and to promote progress toward the enactment of rights enumerated in the United Nations Universal Declaration of Human Rights and in later international treaties.
Examples of marginalized or underrepresented communities include children, indigenous peoples, migrants, and people with disabilities.73 Specific examples of human rights include equality under the law, freedom from discrimination, freedom to participate in political process, and freedom from violence. Finally, strategies to promote human rights include advocacy, grassroots organizing, and coalition-building.
Giving USA Giving by Foundations
Giving USA FoundationTM | Giving USA 2017 | 125

Giving to human rights causes increased by 17 percent from the previous year’s total of $2.3 billion.74 Among the top private funders in the U.S. in 2014 were the Ford Foundation, Atlantic Philanthropies, Open Society Foundations, and The California Endowment. Grants were directed to a diverse set of recipients, spanning 50 countries across the globe. In 2014, grantmakers made equitable access to healthcare their first concern.75 Other priorities included equality rights and freedom from discrimination, environmental and resource rights, as well as social and cultural rights.
References1 Data were provided by Foundation Center in April 2017
and are subject to revision. Data on giving by and to foundations is available in Foundation Center’s Key Facts on U.S. Foundations reports, available at Foundation Center’s website at www.foundationcenter.org
2 See Foundation Center’s Key Facts on Family Foundations reports at www.foundationcenter.org
3 Practitioner highlight authored by staff at the Indiana University Lilly Family School of Philanthropy.
4 Practitioner highlight authored by Editorial Review Board member Rebecca Lamb.
5 Practitioner highlight authored by Editorial Review Board member Jessica Browning.
6 Same as note 1.7 Same as note 1.8 This summary paragraph was written by Foundation
Center, May 2017.
Foundations tended to respond to global crises with additional funding. As the world grappled with an Ebola epidemic in West Africa, funders responded with $425.8 million for global health organizations.76 The West Bank and the Gaza Strip jumped from the seventh to third largest recipient of funding from more than one country after fighting broke out once again in 2014. However, even as the need for support for migrants and refugees intensified, funding for migrant- and refugee-supporting organizations remained steady at 11 percent of total human rights grantmaking.
9 Same as note 1.10 Same as note 8.11 Same as note 8.12 Sharing What Matters: Foundation Transparency,
Center for Effective Philanthropy, 2016, http://research.effectivephilanthropy.org/sharing-what-matters-foundation-transparency
13 Same as note 12.14 Same as note 12.15 2017 Foundation Operations and Management
Report, Exponent Philanthropy, 2017, http://www.exponentphilanthropy.org/connections/news/news-item/2017/02/01/new-report-details-shifts-in-foundation-operations-grantmaking
16 Same as note 15.17 John L. Pender, Foundation Grants to Rural Areas from
2005 to 2010: Trends and Patterns, United States
126 | Giving USA FoundationTM | Giving USA 2017
Giving USA Giving by Foundations
Chapter authored by Josh Moore, M.A., Consultant at Thomas P. Miller and Associates, with material written by staff at Foundation Center and the Indiana University Lilly Family School of Philanthropy.
Good to Know sections and Practitioner Highlights written by Giving USA Editorial Review Board members Jessica Browning, Rebecca Lamb, and Nina Giviyan-Kermani, with contributions from staff at the Indiana University Lilly Family School of Philanthropy.

Department of Agriculture, 2015, https://www.ers.usda.gov/webdocs/publications/eib141/53165_eib141_summary.pdf
18 Rachel Swierzewski, Rural Philanthropy: Building Dialogue From Within, National Committee for Responsive Philanthropy, 2007, https://www.mtu.edu/research/administration/sponsored-programs/enhancement/pdf/rural-philanthropy.pdf
19 “Council on Foundations, USDA Announce Partnership for Rural Economic Opportunity,” Philanthropy News Digest, August 23, 2011, www.philanthropynewsdigest.org
20 Rick Cohen, “Agriculture Secretary Vilsack Calls out Philanthropy for Decreased Investment in Rural America,” Nonprofit Quarterly, September 10, 2015, www.nonprofitquarterly.org
21 “RPD General Information,” Community Resource Center, retrieved April 2017, www.crcamerica.org; “Rural Philanthropy Days,” The Anschutz Family Foundation, retrieved April 2017, www.anschutzfamilyfoundation.org; “West Texas Rural Philanthropy Days,” Carl B. & Florence E. King Foundation, retrieved April 2017, www.kingfoundation.com; “Frequently Asked Questions,” Nonprofit Management Center, retrieved April 2017, www.nmc-pb.org/about/faq
22 Susanna Hegner, “New Public-Private Partnership Leverages $423M to Reduce Rural Poverty,” Mary Reynolds Babcock Foundation, October 5, 2016, www.mrbf.org
23 “RPD General Information,” Community Resource Center, retrieved April 2017, www.crcamerica.org
24 “Rural Philanthropy Days,” The Anschutz Family Foundation, retrieved April 2017, www.anschutzfamilyfoundation.org
25 Same as note 23.26 Darci Tomky, “Nonprofits, Funders to Come Together at
Rural Philanthropy Days,” Fort Morgan Times, April 2, 2016, www.fortmorgantimes.com
27 “Rural Philanthropy Days Impact,” The Anschutz Family Foundation, retrieved April 2017, www.anschutzfamilyfoundation.org
28 “West Texas Rural Philanthropy Days,” Carl B. & Florence E. King Foundation, retrieved April 2017, www.kingfoundation.com; “Frequently Asked Questions,” Nonprofit Management Center, retrieved April 2017, www.nmc-pb.org/about/faq
29 Same as note 22.30 “About the Program,” Uplift America, retrieved April
2017, www.upliftamerica.org/about-the-program; same as note 22.
31 Nicole Wallace, “New Partnership Makes $401 Million in Loans Available to Rural Areas,” The Chronicle of Philanthropy, October 6, 2016, www.philanthropy.com
32 “About the Program,” Uplift America, retrieved March 2017, www.upliftamerica.org/about-the-program
33 Same as note 22.34 Good to Know section authored by Editorial Review Board
member Nina Giviyan-Kermani and staff at the Indiana University Lilly Family School of Philanthropy.
35 2015 Columbus Survey Findings, CF Insights, Foundation Center, 2015, http://www.issuelab.org/
resources/25234/25234.PDF 36 Same as note 35.37 Rebecca Koenig, “Foundations Bet It All on Advancing
Equity,” The Chronicle of Philanthropy, September 14, 2016, www.philanthropy.com; Alex Daniels, “Another Big Grant Maker Redirects Its Giving Toward Poverty,” The Chronicle of Philanthropy, January 28, 2016, www.philanthropy.com
38 Alex Daniels, “Another Big Grant Maker Redirects Its Giving Toward Poverty,” The Chronicle of Philanthropy, January 28, 2016, www.philanthropy.com
39 The Future of Foundation Philanthropy: The CEO Perspective, The Center for Effective Philanthropy, 2016, http://research.effectivephilanthropy.org/the-future-of-foundation-philanthropy
40 Darren Walker, “What’s Next for the Ford Foundation?” Equal Changes Blog, Ford Foundation, June 11, 2015, www.fordfoundation.org
41 Alex Daniels, “Foundations Join Forces to Fight Inequality,” The Chronicle of Philanthropy, June 1, 2015, www.philanthropy.com; “The California Endowment Announces $50 Million Commitment to Sons & Brothers Across California,” The California Endowment, October 9, 2013, www.tcenews.calendow.org
42 Albert Chung, “Blue Meridian Partners: A Collaborative Form of ‘Big Bet’ Philanthropy Aims to Give $1B to Youth Programs,” Nonprofit Quarterly, September 9, 2016, www.nonprofitquarterly.org
43 “Capital Aggregation,” Edna McConnell Clark Foundation, retrieved March 2017, www.emcf.org/capital-aggregation
44 “California PropelNext,” Edna McConnell Clark Foundation, retrieved March 2017, www.emcf.org/capital-aggregation/california-propelnext
45 “Our Partners,” Edna McConnell Clark Foundation, retrieved March 2017, www.emcf.org/our-strategies/blue-meridian-partners/our-partners
46 Alex Daniels, “Edna McConnell Clark Foundation to Spend Down $1 Billion Endowment,” The Chronicle of Philanthropy, December 13, 2016, www.philanthropy.com
47 “Blue Meridian Partners,” Edna McConnell Clark Foundation, retrieved March 2017, http://www.emcf.org/our-strategies/blue-meridian-partners
48 “Mayor Garcetti Announces Legal Fund to Fight for Immigrant Rights,” Eric Garcetti Mayor’s Office, City of Los Angeles, December 19, 2016, www.lamayor.org
49 “New York’s Grantmakers Help New York’s Immigrants,” The New York Community Trust, retrieved April 2017, www.nycommunitytrust.org
50 Scott Carlson, “Big Money Comes to Inequality Research,” The Chronicle of Philanthropy, October 3, 2016, www.philanthropy.com
51 “Urban Institute Announces New Partnership to Develop Solutions for Social Mobility in America,” The Urban Institute, February 5, 2016, www.urban.org
52 Ryan Schlegel, Pennies for Progress: A Decade of Boom for Philanthropy, A Bust for Social Justice, 2016, The National Committee for Responsive Philanthropy, https://www.ncrp.org/wp-content/uploads/2016/11/Pennies-for-Progress-highres.pdf
Giving USA Giving by Foundations
Giving USA FoundationTM | Giving USA 2017 | 127

128 | Giving USA FoundationTM | Giving USA 2017
53 Same as note 52, pg. 954 Same as note 52.55 Good to Know section authored by Editorial Review Board
member Rebecca Lamb.56 Same as note 46.57 Same as note 46.58 “What We Support,” Quixote Foundation, retrieved
March 2017, www.quixotefoundation.org 59 Megan O’Neil, “Atlantic Philanthropies Pledges $197
Million for Fellowship and Institute,” The Chronicle of Philanthropy, May 31, 2016, www.philanthropy.com
60 Same as note 59.61 Same as note 39. 62 Renya Reed Wasson, “The Future of Prize Philanthropy,”
Stanford Social Innovation Review, Summer 2016, www.ssir.org
63 “And the Winner Is: Capturing the Promise of Philanthropic Prizes,” McKinsey & Company, 2009, http://www.issuelab.org/resource/and_the_winner_is_capturing_the_promise_of_philanthropic_prizes_24, pg. 17
64 Same as note 62.65 Vinay Prasad, “The Folly of Big Science Awards,” The New
York Times, October 2, 2015, www.nytimes.com 66 “New MacArthur Competition to Award $100 Million to
Help Solve a Critical Problem of Our Time,” John D. and Catherine T. MacArthur Foundation, June 2, 2016, www.macfound.org, para. 1
67 Ben Paynter, “Inside MacArthur’s $100 Million Plan to Change the World,” Fast Company, June 7, 2016, www.fastcoexist.com
68 “The Rockefeller Foundation and Unreasonable Institute Launch $1 Million Competition for Next Generation Leaders to Identify Innovative Solutions to Urban Challenges,” The Rockefeller Foundation, August 12, 2016, www.rockefellerfoundation.org
69 “Our Results,” Future Cities Accelerator, retrieved April 2017, www.futurecitiesaccelerator.org
70 Ben Paynter, “The Knight Foundation’s Cities Challenge Wants to Find Creative Ways To Improve Urban Life,” Fast Company, October 20, 2016, www.fastcoexist.com
71 “2016 Knight Cities Challenge Winners,” Knight Cities Challenge, retrieved April 2017, www.knightcities.org/winners2016
72 Anna Koob and Sarah Tansey, Advancing Human Rights; Update on Global Foundation Grantmaking, Foundation Center and International Human Rights Funders Group, 2017, http://humanrightsfunding.org/report-2017
73 “What Do Human Rights Grant Support?” Foundation Center and International Human Rights Funders Group, retrieved April 2017, www.humanrightsfunding.org
74 Same as note 72.75 Lizz Carroll and Sarah Tansey, “New Data Reveal Shifts,
Gap in Human Rights Funding,” Foundation Center and International Human Rights Funders Group, February 8, 2017, www.foundationcenter.org
76 Same as note 75.
Giving USA Giving by Foundations

Charitable giving by bequest is estimated to have declined 9.0 percent in current dollars—to $30.36 billion—between 2015 and 2016.1
Adjusted for inflation, giving by bequest declined 10.1 percent in 2016.
The total amount for giving by bequest in 2016 includes an estimated amount for charitable bequests from estates with assets of $5 million and above, estates with assets between $5 million and $1 million, and estates with assets below $1 million. For 2016:
– Estimated bequests from estates $5 million and above amounted to $17.15 billion.
– Estimated bequests from estates with assets between $5 million and $1 million amounted to $6.53 billion.
– Estimated bequests from estates with assets below $1 million amounted to $6.68 billion.
Giving USA FoundationTM | Giving USA 2017 | 129
6 | Giving byBequest

The information provided in this chapter derives from a
number of sources, including publicly available reports, news stories, and websites from the most recent year. This chapter is meant to provide context for the giving trends reported in this edition of Giving USA and to illustrate some of the practical implications of the data. It is not intended to be a comprehensive survey of the subsector, but rather a collection of examples from the field.
Trends in giving by bequest in 2016
Giving USA’s estimate for giving by bequest includes itemized and non-itemized charitable contributions. Contributions include gifts of cash, securities, and property. Bequest giving tends to fluctuate year to year, primarily due to very large gifts made in some years and not in others. It is typical for bequest giving to be significantly impacted in one year by a handful of large gifts.
Each year, the amount that decedents leave in charitable bequests largely
130 | Giving USA FoundationTM | Giving USA 2017
Giving USA Giving by Bequest
Practitioner Highlights “Smaller” donors are making bigger bequest gifts. The 20.4
percent increase in bequest giving from estates with assets less than $1 million indicates that smaller charities can focus more effort on planned giving.2
Legacy societies are effective—but the key to their success is to have clear messaging and few requirements for participation. An active legacy society nurtures its membership steadily and helps maintain the importance of the society in the donor’s life over long periods of time.3
“Younger” donors can make planned gifts, particularly in naming a favored charity as a beneficiary of a 401(k) or 403(b) pension plan while they are working. Interacting with donors in this way becomes an opportunity to cultivate long-term donor relationships.4

reflects estate values, which include wealth from homes, investments, and sometimes other types of property. The fall in giving by bequest in 2016 incorporates:
An estimated change of -14.3 percent in bequest giving from estates with assets greater than $5 million5 that filed estate taxes in 2016 compared with 2015;6
An estimated change of -16.3 percent in bequest giving from estates with assets between $1 million and $5 million; and
An estimated change of 20.4 percent in bequest giving from estates with assets less than $1 million.
About 5 percent of estates leave a charitable bequest each year. Despite recent estate tax law changes, there appears to have been no measured change in the percentage of estates that have left a bequest in recent years. This is according to Giving USA’s estimates for giving by estates that file tax returns and those that do not file tax returns.
To provide context for giving by bequest in 2016 and in recent years, this chapter begins with an explanation of the impact that recent tax law changes have had on bequest giving. That section is followed by the most recent charitable bequest trends revealed by the media and philanthropic research organizations in 2016 and 2017. Details about charitable bequest filings by different
estate income groups follow and are shown in Tables 1 and 2 of this chapter. The chapter ends with a review of current research on planned giving and bequests, updated legislation regarding gifts from IRAs, and data from Internal Revenue Service (IRS) tax records on charitable trusts and bequests.
The impact of tax law changes on charitable bequests
Estate, gift, and generation-skipping transfer taxes are forms of taxation on the transfer of wealth between individuals.7 Gifts to charities are one of a relatively small number of deductions that can reduce gross taxable estate.8 Charitable bequests can also reduce an estate’s income tax if the donor names
Giving USA Giving by Bequest
Giving USA FoundationTM | Giving USA 2017 | 131

a charity as the beneficiary of an IRA, commercial annuity, or other assets that are treated as Income in Respect of a Decedent (IRD). Individuals may also direct charitable bequests to be paid first from IRD in their will.9
There are two main components of estate tax rules: the exemption threshold and the maximum tax rate.10 The exemption threshold is the amount of assets held in an estate that is exempt from taxation. The maximum estate tax rate is the highest rate the IRS can tax the remaining components of an estate’s assets. Most economic studies agree that the size and number of charitable bequests are influenced by the estate tax. Higher tax rates have been shown to increase the dollar value of bequests, such that the amount donated to charities exceeds the amount of tax revenue that would have been collected had there been no charitable deduction or a lower tax rate.
Early precursors of the modern estate tax were used primarily to finance wars.11 The first federal tax on wealth transfer at death was levied in 1797 to build naval assets and ended in 1802.
An inheritance tax helped to finance the Civil War between 1862 and 1870. A continuous estate tax has been in force since 1916, albeit with several modifications over the years.
Between 2002 and 2009, the Economic Growth and Tax Relief Reconciliation Act of 2001 (EGTRRA) gradually reduced the estate tax rate and increased the estate tax filing threshold, resulting in an uncertain environment for estate planning.12 For the year 2010 only, the estate tax was repealed. In January 2013, the American Taxpayer Relief Act of 2012 established a permanent revision of estate tax law, with a top rate of 40 percent and an exemption amount indexed for inflation.13 For 2016, the exemption threshold for estates was $5.45 million.14 As a result,
132 | Giving USA FoundationTM | Giving USA 2017
Giving USA Giving by Bequest

the number of taxable estates declined dramatically. In 2000, 2 percent of estates were taxable. In 2015, the IRS reported that taxable estates in 2013 represented two-tenths of 1 percent of Americans who had died.15
The estimate that Giving USA produces for estates that do not file estate tax returns but contain charitable bequests has grown larger over the last few years. This is due to the changes in the filing threshold, resulting in fewer estates that file tax returns and claim charitable bequests. Between 2001 and 2014, the number of estates filing returns with deductions for charitable bequests declined more than 85 percent (from 18,718 to 2,636).16 The estate tax filing threshold increased incrementally from $675,000 in 2000 to $5.12 million in 2012.17 The exemption threshold is now indexed to inflation and is $5.49 million for 2017.18
While the number of estate tax filings for charitable bequests declined considerably over these years, the deduction amounts claimed did not decline as dramatically. This is due to the fact that the very largest estates account for the largest proportion of charitable bequest amounts claimed in any given year—generally more than half the total. IRS tax records show that the total deduction amount claimed by all estates filing in 2015 was $20.0 billion, compared to an average of $16.41 billion annually across the period 2001–2014.19
The estate tax as an election issueThe Democratic and Republican presidential nominees envisioned different roles for the estate tax in the 2016 presidential election.20 Hillary Clinton, the Democratic nominee, advocated lowering the exemption from the then $5.45 million to $3.5 million, and increasing the tax rate on estates in excess of the exemption from 40 percent to 45 percent. Donald J. Trump, the Republican nominee, campaigned on repealing the estate tax entirely. Any significant changes to the estate tax structure would likely affect the tax treatment of appreciated assets at death, with potential implications for charitable bequests and other planned gifts.21
Large bequests announced in 2016
Each year, The Chronicle of Philanthropy reports on the 50 donors who provide the largest gifts and pledges in the United States in its Philanthropy 50 list.22 Giving by Philanthropy 50 donors in 2016 totaled $5.6 billion, $1.3 billion lower than the amount reported for the year 2015. This figure includes gifts made during life (inter vivos) as well as estate gifts. In 2016, gifts from three estates accounted for $543 million. In comparison to 2015, six entries on the list were estate gifts, totaling $1.7 billion.
A bequest of approximately $400 million from Dr. Howard and Lottie Marcus (San
Giving USA Giving by Bequest
Giving USA FoundationTM | Giving USA 2017 | 133

Diego, CA) was the largest estate gift of the year, and the third largest gift overall on the Philanthropy 50 in 2016.23 Their gift, a bequest to American Associates, Ben-Gurion University of the Negev, will establish a permanent endowment at the Israeli university through its nonprofit American arm. It is believed to be the largest gift ever made to benefit an Israeli university, and culminates many years of interest in and giving to the university’s Zuckerberg Institute for Water Research.24
Other notable bequest gifts from the Philanthropy 50 include:25
$108 million from the estate of Kenyon Gillespie (Seatauket, NY) to the Stamford Hospital Foundation (Stamford, CT) and others, and;
$35 million from the estate of Dorothy Braude Edinburg (Boston, MA) to the Art Institute of Chicago (Chicago, IL).
In some cases, nonprofits that are noted to have received bequests in a particular year, including those represented on the Philanthropy 50 list, must wait one or two years after the death of the donor to receive the gift. The complexity of resolution of the estate affects the length of time that an organization must wait for a gift to be paid. For the same reason, the gift amounts noted above are estimates. Sometimes, contingent on the provisions in a donor’s will, the transfer may take decades.
NRC report provides new insights in reported bequests received in 2016
The Nonprofit Research Collaborative (NRC) annually conducts surveys on fundraising trends for the preceding year across the nonprofit sector.26 In 2017, this collaboration included Giving USA Foundation, the Association of Fundraising Professionals, the Association of Philanthropic Counsel, CFRE International, the National Association of Charitable Gift Planners, and Top Nonprofits. In early 2017, the survey asked nonprofit leaders of public charities and foundations to report on trends for the year 2016, including changes in charitable revenue received and changes in the number of donors by specific donor type, among other questions.
This year, the Winter 2017 Nonprofit Fundraising Survey includes a special
134 | Giving USA FoundationTM | Giving USA 2017
Giving USA Giving by Bequest

section on bequests.27 A convenience sample of 371 survey participants responded to questions about estate gifts. In 2016, 69 percent of responding organizations reported receiving planned gifts, which includes both new commitments and actual fund disbursement.
Additional insights from the report for the year 2016 include:28
Among respondents receiving bequests, nearly one in five (19 percent) reported receiving $1 million or more.
Of those receiving bequests, 33 percent reported an average amount between $25,000 and $100,000.
Organizations with larger operating budgets tended to report larger average bequest gifts.
IRS statistics on estates claiming charitable deductions in 2015
In late 2016, the IRS released estate tax data for returns filed for the year 2015.29 The current dataset provides information for estates that filed an estate tax return (IRS Form 706) in 2015. Estates most often file Form 706 the year after the decedent’s death. Most forms filed in 2015 were for individuals who died in 2014, for which the taxable threshold was $5.34 million. Since 2013, the maximum estate tax rate has been
40 percent. Because the exemption threshold exceeds the threshold for the highest marginal tax rate, the taxable portion of most estates was subject to a flat 40 percent tax.30
In 2015, 11,917 estates filed returns with the IRS.31 Of those returns, 22.1 percent claimed a charitable deduction. Estates worth $50 million or more claimed the largest proportion of all estates filing charitable deduction claims, at 49.2 percent, followed by estates worth between $20 million and $50 million, at 32.6 percent. Table 1 provides the percentage of estates that claimed a charitable deduction, by estate size, for 2015.
The total value of estates for tax purposes in 2015 was $167.5 billion.32 The total value of the charitable bequests made on these returns was $20 billion. Estates worth $50 million or more claimed by far the largest proportion of the total amount of charitable deductions in 2015 (62.3 percent), followed by estates worth between $20 million and $50 million (14.2 percent). Table 2 shows the proportion of total charitable deduction amounts claimed by estate size for 2015. Note that Giving USA creates estimates for both filing and non-filing estates, so these reported IRS results are lower than those reported in this edition of Giving USA for 2015 bequest giving estimates.
Giving USA Giving by Bequest
Giving USA FoundationTM | Giving USA 2017 | 135

136 | Giving USA FoundationTM | Giving USA 2017
Giving USA Giving by Bequest
Table 2 Percentage of total charitable deduction amounts claimed by all estates, by estate size, 2015
Charitable deduction claim total
(in thousands)
Percentage of claims to total charitable
deductions
All filing estates $20,003,162 —
Estates under $5 million $92,792 0.5%
Estates $5 million to under $10 million $2,381,194 11.9%
Estates $10 million to under $20 million $2,233,679 11.2%
Estates $20 million to under $50 million $2,837,387 14.2%
Estates $50 million or more $12,458,110 62.3%
Data: “SOI Tax Stats - Estate Tax Statistics Filing Year Table 1,” IRS, retrieved January 2017, www.irs.gov
Table 1 Percentage of all estates that claimed a charitable deduction, by estate size, 2015
Number of filing estates
Number claiming
charitable deduction
Percentage claiming
charitable deduction
All filing estates 11,917 2,636 22.1%
Estates under $5 million 1,387 211 15.2%
Estates $5 million to under $10 million 6,849 1,314 19.2%
Estates $10 million to under $20 million 2,325 603 25.9%
Estates $20 million to under $50 million 958 312 32.6%
Estates $50 million or more 398 196 49.2%
Data: “SOI Tax Stats - Estate Tax Statistics Filing Year Table 1,” IRS, retrieved January 2017, www.irs.gov

Community foundations encourage charitable bequests from local populations
Community foundations, especially those in rural areas of the country, have recently launched campaigns encouraging local residents to bequeath 5 percent of their estate to the foundations as part of an organic, grassroots “hometown-as-heir movement.”34 With names like “Keep 5 Local” (West Virginia) and “5% for the
Future” (Flint, MI), these local campaigns were motivated by new projections on wealth transfer and the likelihood that community wealth may leave when the residents move away.
The Center for Rural Entrepreneurship (Lincoln, NE) has provided county-level research to support these bequest campaigns.35 These efforts are motivated by new findings on generational wealth movement: John Havens and Paul Schervish (both from Boston College) updated their Wealth Transfer Microsimulation Model in 2014 to predict a transfer of $59 trillion between generations by 2061.36 Motivated by these findings, the Center for Rural Entrepreneurship estimated the wealth-transfer potential of individual counties, giving community foundations data to help motivate local residents to plan a gift.37
The Kansas Association of Community Foundations, whose program is called Keep 5 in Kansas, identifies four steps to a successful program:38
Educate potential donors about non-cash gifts;
Cultivate relationships with financial advisors;
Ensure community foundations have the capacity to receive and manage complex gifts; and
Reach out to partners to market the campaigns.
Their strategy appears to be bearing fruit: the Kansas Association of
Giving USA Giving by Bequest
Giving USA FoundationTM | Giving USA 2017 | 137
Good to KnowPotential changes to tax legislation captured attention in 2016.33 As IRS data shows, when the threshold for filing an estate tax increases, charitable bequests decline. Potential tax reform may further erode the tax incentives for charitable giving. In light of these uncertainties, it is important to communicate your organization’s mission to potential donors, since mission is the basis for motivating bequests.Charities should focus messaging on what they seek to do and accomplish in order to cultivate bequests. Charities may show the mission of the organization in action in order to nurture donors’ faith in that organization. It is clear from research that greater bequest opportunities occur when donors are asked to support long-term interests and causes. Tax laws may change, but donors’ belief in mission does not.

Community Foundations more than doubled their assets between 2010 and 2015, after initiating the program.39
Highlights from the 2016 Planned Giving Study
A new report from Pentera and the Indiana University Lilly Family School of Philanthropy examined data on planned gifts to better understand planned giving and donor life cycle trajectories within higher education.40 Using a combination of publicly available data from the top 120 higher education institutions by endowment value (as identified by the 2014 Digest of Education Statistics), and case studies of five universities, the report addresses both landscape and in-depth aspects of legacy societies and the donor-institution relationship.
Of the top 120 higher education institutions, more than 90 percent had established legacy societies.41 Most did not have a minimum dollar threshold for membership in the societies, which tend to function primarily for recognition and appreciation of planned gift donors. Both opt-out and opt-in membership models are used, although the opt-in model appears more prevalent.
Closer examination of the five case study universities revealed that bequests were the most popular planned giving vehicle, accounting for approximately 42
percent of planned gifts.42 Universities tended to receive notification of gifts most frequently in the last quarter of the year, but changes in existing gifts tended to happen during tax season.
Consistent with expectations, the study found that the likelihood of making a planned gift increased significantly at age 50; but for those giving vehicles that typically do not have age restrictions, interest increased at about 45 years of age.43 Most planned giving donors (73 percent) were alumni of the given institution; but among those who did make planned gifts, whether or not they were alumni did not tend to affect the gift size. Approximately one-fifth of planned giving donors made multiple planned gifts to the same university. The factor most correlated with the decision to make multiple planned gifts is living within the same state as the university.
138 | Giving USA FoundationTM | Giving USA 2017
Giving USA Giving by Bequest

Language impacts successful bequest gifts
A series of studies in 2016 found that language, specifically when phrasing the “charitable ask,” is crucial to determining the success of courting a planned gift.
Phrasing charitable bequest materialsWhen encouraging prospective donors to consider a bequest, does the phrasing of the request matter? New research from Russell N. James III (Texas Tech University) published in Voluntas: International Journal of Voluntary and Nonprofit Organizations confirms that phrasing does make a difference.44 A survey of 9,964 individuals tested responses to 23 possible ways to ask someone to make a charitable bequest.
Individuals were more likely to respond positively when phrasing indicated social norms, such as “many people like to leave a gift to charity in their wills,” or “to support causes that have been important in their/your life/lives.”45 Individuals also preferred phrasing that avoided “extraneous death terms,” such as “that will take effect at my death.”46 Referring to the charitable bequest as “a gift to charity in your will” was received more positively than the terms “leave a legacy” or “bequest.”47
Donor stories encourage charitable bequest giving intentionsDonor stories can reinforce social norms of generosity. A study conducted by Russell N. James III (Texas Tech University) and Claire Routley (Plymouth University, UK) and published in the International Journal of Nonprofit and Voluntary Sector Marketing investigated the question of whether prospective donors react differently to stories of donors who are deceased compared to those who are still alive.48 James and Routley used an experimental process to test whether using stories of living donors or deceased donors made a difference in stated bequests for a national sample of 2,518 adult volunteers. All treatment groups outperformed the control group, which did not read donor stories at all; but those reading stories in which the donor was currently living were more likely to indicate intent to make a bequest gift themselves than those who read otherwise identical stories with a deceased donor.
What’s in a name? Fundraiser job titles may affect gift planning outcomesThe titles of an organization’s planned giving representatives may influence the likelihood of prospective donors to make contact.49 In a national survey conducted by Russell N. James III (Texas Tech University) published in Nonprofit
Giving USA Giving by Bequest
Giving USA FoundationTM | Giving USA 2017 | 139
Management and Leadership in 2016, 3,188 participants ranked job titles used by American fundraising professionals within the context of four scenarios requiring charitable planning. Scenarios included contemplated gifts of stock, real estate, charitable gift annuity, and charitable bequest. A total of 63 job titles were evaluated on a scale from “Would definitely contact” to “Would never contact.”
Job titles that showed a focus on the gift, such as incorporating “gift planning” or “planned giving,” generally performed well.50 Titles focusing on the donor also performed well—“Director of Donor Advising” was the job title most positively ranked. By contrast, titles focusing on the institution, such as those using the words “development” or “advancement,” were routinely less preferred. The three job titles least likely to be approached were “Chief Advancement Officer,” “Director of Institutional Advancement,” and, in the worst performing position, “Director of Advancement.”
IRS data on bequests and deferred giving
Beyond charitable bequests, there are several different types of deferred giving vehicles, which include trusts, gift annuities, and life insurance.51 A trust is a legal document that designates a third party, a trustee, to hold the assets of an estate or grantor. The grantor
can designate one or several individuals or entities as beneficiaries, including charities. Charitable trusts, as defined by the IRS, are described below.
Tax deductions for giving to charitable trusts are taken during the tax year the transaction was completed and the trust was created.52 Trusts, therefore, act similarly to foundations and donor-advised funds as they collect assets and distribute funds to beneficiaries at specified intervals. The primary difference, however, is that with charitable trusts, a non-charitable beneficiary receives income at some point during the duration of the trust agreement. Trusts are therefore ideal for individuals and estates that wish to provide income for non-beneficiaries and charitable organizations alike.
The IRS provides the following definitions for different types of trusts that provide income to charities, whether during the life of the trust or when the trust terminates. This information is shown below.53 For more information, go to http://www.irs.gov/uac/SOI-Tax-Stats-Split-Interest-Trust-Statistics.
Charitable remainder annuity trusts distribute income in a series of fixed payments to one or more non-charitable beneficiaries for a defined period of time, after which the remaining value of the trust is transferred to a charitable beneficiary.
140 | Giving USA FoundationTM | Giving USA 2017
Giving USA Giving by Bequest

Charitable remainder unitrusts distribute a percentage of the fair market value to one or more non-charitable beneficiaries for a defined period of time, after which remaining value of the trust is transferred to a charitable beneficiary.
Charitable lead trusts distribute a sequence of payments to a charitable beneficiary for a period of time, after which the remaining trust assets are transferred to a non-charitable beneficiary.
Pooled income funds allow donors to donate assets to a charity. The pooled assets are invested as a group and each donor receives income based on the ratio of his or her contribution to the total value of the investment pool. After the death of the donor, his or her prorated share of the investment pool is withdrawn and given to the charitable organization.
Table 3 presents three years of data released annually by the IRS about charitable bequests and deferred giving.
Giving USA Giving by Bequest
Giving USA FoundationTM | Giving USA 2017 | 141
Table 3Three years of IRS statistics on bequests and deferred giving54
Estate tax returns filed (2013–2015)
2013 2014 2015
Federal estate tax filing threshold* $5.25 million $5.34 million $5.43 million
Total number of estate tax returns filed 10,568 11,931 11,917
Number with charitable deduction 2,528 2,743 2,636
Charitable deductions itemized on returns $13.6 billion $18.7 billion $20.0 billion
Percentage of estates filing estate taxreturn claiming a charitable deduction 23.9 percent 23.0 percent 22.1 percent
Percentage of gross estate value from all estate tax returns claimed in charitable deductions
9.8 percent 10.9 percent 11.9 percent
* Exemption amounts are indexed for inflation, beginning with $5.0 million in 2011 as the base year. In 2016, the exemption amount was $5.45 million and in 2017 it is $5.49 million.

References1 All data in this section are reported as estimates, which
are subject to revision. To provide the most accurate estimates for charitable giving, as new data become available, Giving USA revises its estimates for at least the last two years. See more about how Giving USA calculates charitable giving by sources and uses in the “Brief summary of methods used” section of this report.
2 Practitioner highlight authored by Editorial Review Board member William C. McMorran.
3 Practitioner highlight authored by Editorial Review Board member William C. McMorran.
4 Practitioner highlight authored by Editorial Review Board member William C. McMorran.
5 “Estate Tax,” IRS, retrieved February 2016, www.irs.gov6 This figure includes the addition of the mega-bequest
estimate. See the “Brief summary of methods used” section of this report for more detail.
7 “Overview of the Federal Tax System as in Effect for 2017,” The Joint Committee on Taxation, Congress of the United States, 2017, www.jct.gov
8 Same as note 5.9 Christopher R. Hoyt, “Income Tax Deductions for
Charitable Bequests of IRD,” Social Science Research Network, September 24, 2015, www.papers.ssrn.com
10 “History, Present Law, and Analysis of the Federal Wealth Transfer Tax System,” The Joint Committee on Taxation, Congress of the United States, March 16, 2015, www.jct.gov
11 Same as note 10.12 Joseph Rosenberg, C. Eugene Steurle, and Katherine
Toran, “What Does the Fiscal Cliff Deal Mean for Nonprofits?” Urban-Brookings Tax Policy Center, Urban Institute Center on Nonprofits and Philanthropy, January 9 2013, www.urban.org
13 Same as note 10.14 Same as note 5.15 Same as note 10; Peter Baker, “House Votes To Repeal
Estate Tax,” The New York Times, April 16, 2015, www.nytimes.com
16 “SOI Tax Stats - Estate Tax Statistics Filing Year Table 1,” IRS, retrieved January 2017, www.irs.gov
17 Same as note 10.
18 Same as note 5.19 Same as note 16; Giving USA: The Annual Report on
Philanthropy for the Year 2015 (2016), Giving USA Foundation, June 2016, www.givingusa.org
20 Robert W. Wood, “Clinton Vows Estate Tax Hikes, While Trump Vows Repeal,” Forbes, August 9, 2016, www.forbes.com
21 Ashlea Ebeling, “Will Trump Victory Yield Estate Tax Repeal?” Forbes, November 9, 2016, www.forbes.com; Greg Lacurci, “Estate Tax Repeal No Slam Dunk Under Trump and Republican-held Congress,” Investment News, November 9, 2016, www.investmentnews.com
22 Maria Di Mento, “The 2017 Philanthropy 50,” The Chronicle of Philanthropy, February 7, 2017, www.philanthropy.com
23 Same as note 22.24 “Dr. Howard and Lottie Marcus’ Estate Give $400 Million
Gift to Ben-Gurion University,” Jewish Business News, June 24, 2016, www.jewishbusinessnews.com
25 Same as note 22.26 The Nonprofit Research Collaborative (NRC) annually
conducts surveys on fundraising trends across the nonprofit sector. In 2017, this collaboration included the Giving USA Foundation, the Association of Fundraising Professionals, CFRE International, the Association of Philanthropic Counsel, the National Association of Charitable Gift Planners, and Top Nonprofits. In early 2017, the NRC launched a survey to assess fundraising trends for the entire 2016 calendar year. The survey asked nonprofit leaders of public charities and foundations to report on changes in charitable revenue received and changes in the number of donors by specific donor type, among other questions. Data in this section come from the Winter 2017 Nonprofit Fundraising Survey report from the Nonprofit Research Collaborative, May 2017, www.npresearch.org. A convenience sample of 1,019 respondents, 144 of them Canadian, constitutes the survey results.
27 Same as note 26.28 Same as note 26.29 Same as note 16.
142 | Giving USA FoundationTM | Giving USA 2017
Giving USA Giving by Bequest
Chapter authored by Ruth Hansen, CFRE, Lecturer, University of Wisconsin-Whitewater College of Business and Economics and doctoral candidate at the Indiana University Lilly Family School of Philanthropy, with material written by staff at the Indiana University Lilly Family School of Philanthropy.
Good to Know sections and Practitioner Highlights written by Giving USA Editorial Review Board member William C. McMorran.

30 Same as note 10; “What’s New – Estate and Gift Tax,” IRS, retrieved January 2017, www.irs.gov
31 Same as note 16.32 Same as note 16.33 Good to know section authored by Editorial Review Board
member William C. McMorran.34 Heather Joslyn, “The 5% Solution,” The Chronicle of
Philanthropy, November 29, 2016, www.philanthropy.com, para. 10
35 Heather Joslyn, “The 5% Solution,” The Chronicle of Philanthropy, November 29, 2016, www.philanthropy.com; “Transfer of Wealth Studies,” Center for Rural Entrepreneurship, retrieved January 2017, www.energizingentrepreneurs.org
36 John J. Havens and Paul G. Schervish, Millionaires and the Millennium: New Estimates of the Forthcoming Wealth Transfer and the Prospects for a Golden Age of Philanthropy, Boston College Social Welfare Research Institute, 1999, https://www.bc.edu/content/dam/files/research_sites/cwp/pdf/m_m.pdf; John J. Havens and Paul G. Schervish, A Golden Age of Philanthropy Still Beckons: National Wealth Transfer and Potential for Philanthropy Technical Report, Boston College Center on Wealth and Philanthropy, 2014, https://www.bc.edu/content/dam/files/research_sites/cwp/pdf/A%20Golden%20Age%20of%20Philanthropy%20Still%20Bekons.pdf. Note that the current estimate for wealth transfer from 2007 to 2061 listed on the Boston College Center on Wealth and Philanthropy website is $59 trillion (https://www.bc.edu/research/cwp/publications/by-topic/wealthtransfer.html).
37 Heather Joslyn, “The 5% Solution,” The Chronicle of Philanthropy, November 29, 2016, www.philanthropy.com
38 Same as note 37.39 Same as note 37.40 Una Osili, Xiaonan Kou, Jonathan Bergdoll, Mallory St.
Claire, and Le Yang, The 2016 Planned Giving Study, 2016, www.scholarworks.iupui.edu
41 Same as note 40.42 Same as note 40.43 Same as note 40.44 Russell N. James III, “Phrasing the Charitable Bequest
Inquiry,” VOLUNTAS: International Journal of Voluntary and Nonprofit Organizations, 2016, 27(2), 998-1011
45 Same as note 44, pgs 1007-100846 Same as note 44, pg. 100647 Same as note 44, pg. 100548 Russell N. James III and Claire Routley, “We the Living:
The Effects of Living and Deceased Donor Stories on Charitable Bequest Giving Intentions,” International Journal of Nonprofit and Voluntary Sector Marketing, 2016, 21(2), 109-117
49 Russell N. James III, “Testing the Effectiveness of Fundraiser Job Titles in Charitable Bequest and Complex Gift Planning,” Nonprofit Management & Leadership, 2016, 27 (2), pgs. 165-179
50 Russell N. James III, “Testing the Effectiveness of Fundraiser Job Titles in Charitable Bequest and Complex Gift Planning,” Nonprofit Management & Leadership, 2016, 27 (2), pg. 172
51 Note that these gifts are not necessarily given in the form of bequests. Eden Stiffman, “Important Planned Giving Terms and Phrases,” The Chronicle of Philanthropy, February 27, 2015, www.philanthropy.com
52 Same as note 51.53 This information is directly quoted from the IRS website.54 “SOI Tax Stats – Split-Interest Tax Statistics,” IRS, retrieved
April, 2017, www.irs.gov
Giving USA Giving by Bequest
Giving USA FoundationTM | Giving USA 2017 | 143

Lynn
have
n Ri
ver N
OW
144 | Giving USA FoundationTM | Giving USA 2017
Giving USA Giving by Bequest

Lynn
have
n Ri
ver N
OW
7 | Giving byCorporations
Charitable giving by corporations increased by an estimated 3.5 percent in 2016, to $18.55 billion. Adjusted for inflation, giving by corporations increased 2.3 percent in 2016 as compared with 2015.1
Corporate giving includes cash and in-kind contributions made through corporate giving programs, as well as grants and gifts made by corporate foundations.
Corporate foundation grantmaking rose 0.36 percent in 2016, amounting to $5.53 billion.2
In 2016, U.S. Gross Domestic Product (GDP) increased 3.0 percent over 2015, and corporate pre-tax profits rose 2.7 percent.3 Both of these economic indicators have been found to positively affect corporate giving.
Giving USA FoundationTM | Giving USA 2017 | 145

The information provided in this chapter derives from a number
of sources, including publicly available reports, news stories, and websites from the most recent year. This chapter is meant to provide context for the giving trends reported in this edition of Giving USA and to illustrate some of the practical implications of the data. It is not intended to be a comprehensive survey of the subsector, but rather a collection of examples from the field.
Trends in giving by corporations in 2016
Giving USA’s estimate for corporate giving includes cash and in-kind contributions made through corporate giving programs, as well as grants and gifts made by corporate foundations.
Giving by corporations and their foundations is largely dependent upon companies’ profits and the economic environment in which corporations operate. In general, when the economic climate is positive, corporations tend to give more. There may be some lag time, however, between corporate profitability and charitable giving. In
146 | Giving USA FoundationTM | Giving USA 2017
Giving USA Giving by Corporations
Practitioner Highlights Frequently, the corporate giving sector reflects variable economic
conditions on a larger scale. Overall, corporate giving is largely dependent on company profits and the economic environment in which these companies operate, and may additionally be impacted by business cycles and corporate giving strategy.4
When corporations were asked to predict how 2017 contributions will change compared with 2016 in CECP’s Giving in Numbers survey, predictions for 2017 lean toward steady levels of giving.5
New studies released in 2016 illustrate that opportunities for employee engagement in corporate philanthropy are a driving factor in the recruitment, loyalty, and retention of a company’s workforce..6

addition, corporate giving patterns may reflect business cycles, which will vary by industry and specific types of corporations. As an example, some corporations may save profits in good times to give during economic slumps or downturns. Other companies may choose to give as a direct reflection of current economic conditions or company profits.
The variable conditions in which corporations have been giving in recent years are reflected in the increased volatility of the corporate giving sector. Revised Giving USA estimates indicate a slight decline in corporate giving between 2014 and 2015, at -0.8 percent. In the previous year, giving grew by 13.9 percent for 2014, and contracted by -7.9 percent in 2013.
Despite the variability in corporate giving as an effect of business cycles and corporate giving strategy, certain economic factors are consistently linked with current corporate giving patterns. These factors especially include Gross Domestic Product (GDP) and corporate pre-tax profit. In 2016, U.S. GDP increased 3.0 percent.7 This increase was slightly lower than 2015, when U.S. GDP rose 3.7 percent over 2014. In addition, in 2016, corporate pre-tax profits rose 2.7 percent.8 This increase follows a contraction of -5.5 percent in 2015.
Estimated corporate foundation grantmaking increased 0.36 percent in 2016.9 Updated estimates for 2015 indicates that giving from these
foundations increased 7.0 percent over 2014, following a decline of -4.3 percent from the previous year. This volatility makes the five-year average growth in corporate grantmaking a modest 2.1 percent between 2011 and 2016. According to Foundation Center, gifts to corporate foundations grew 8.0 percent to $5.01 billion between 2014 and 2015, and total assets grew 2.9 percent.10
Despite a relatively robust 8.0 percent growth in new gifts into corporate foundations in 2015, assets were up just under 3 percent in 2016.11 Less than two-fifths (37 percent) of the corporate foundations responding to Foundation Center’s 2016 Foundation Giving Forecast Survey reported having increased their giving in 2016. Among corporate foundations, the larger foundations (those awarding between $10–$25 million annually) reported a decline in giving while the largest of the corporate foundations (those awarding more than $25 million annually) held steady with little to no change in giving for 2016.
Historically, some corporations have chosen to contribute additional funds
Giving USA Giving by Corporations
Giving USA FoundationTM | Giving USA 2017 | 147
________________________________________
Giving by corporations and their foundations is largely dependent upon companies’ profits and the economic environment in which corporations operate. ________________________________________

to their foundations during years with stronger earnings to ensure more stable levels of giving in years when earnings are less strong. Thus, a robust increase in gifts into corporate foundations may not directly translate into an equivalently marked gain in corporate foundation giving. Similarly, declines in corporate giving to their foundations may not be equally reflected in corporate grantmaking totals for the same year.
Analysis of data from CECP’s 2017 Giving in Numbers survey of leading global companies, conducted in association with The Conference Board, reported that nearly half (48 percent) of 209 of the largest U.S. and internationally based companies increased their giving in the period 2014 to 2016.12 Among these companies, 24 percent increased their total giving by 25 percent or more.
The following sections detail recent corporate giving trends revealed by the media and philanthropic research organizations in 2016 and 2017, beginning with a detailed overview of CECP’s 2017 Giving in Numbers survey on corporate contributions made in the years 2014 to 2016 by a matched-set sample of the largest global companies.
Largest companies show overall increased giving rates, strengthening the business case of corporate community investment
According to CECP, in association with The Conference Board, 48 percent of companies increased total giving from 2014 to 2016, a growth of 2 percent.13 The sample includes 209 of the largest U.S.-based (89 percent of reporting companies) and internationally based companies with more than $2 billion in annual revenue. According to the survey, this growth shows that the business case for societal engagement is strong, with companies increasingly seeing community investment as essential to their operations
These preliminary findings, and those detailed in the following sections, are based on CECP’s annual Giving in Numbers survey of leading global companies, conducted in association with The Conference Board. This survey is the industry’s leading analysis of corporate contributions, with 250+ of the world’s largest companies reporting on 2016 contributions. Companies participating in this study had aggregate revenues of $7.5 trillion and median revenues of $15.6 billion in 2016.14
148 | Giving USA FoundationTM | Giving USA 2017
Giving USA Giving by Corporations

Almost half of companies increased giving from 2014 to 2016.15 The healthcare industry drove the largest changes in total giving between 2014 and 2016 in terms of both increases and declines. Among companies whose giving declined between 2014 and 2016, the healthcare industry accounted for the largest share of the aggregate drop (76 percent); by comparison, the financial industry contributed to only 7 percent of the aggregate drop. Overall, the healthcare industry reduced total giving by 37 percent between 2014 and 2016.
However, with 64 percent of healthcare companies expanding giving, the healthcare industry also accounted for half of the aggregate increase in giving between 2014 and 2016.16 This phenomenon can be attributed to differences in giving from subindustries within the healthcare subsector. Nearly the entire increase in total giving from the healthcare industry came from pharmaceutical companies (comprising
96 percent of the healthcare industry’s rise in giving). Pharmaceutical companies have maintained their structure of cash and in-kind giving, which includes product donations.
In terms of the number of healthcare companies that decreased giving, most of the decline was derived from companies in the healthcare facilities/medical equipment subindustry.17 This subindustry has seen a substantial decrease in product donations and in some cases, companies have scaled back efforts to measure those product donations. Companies in this subindustry also may be conducting reassessments of strategic program priorities and beneficiaries.
In terms of increased giving, the communications industry had the highest proportion of companies with growth in giving (89 percent between 2014 and 2016); however their share in the aggregate gain was not as high as the healthcare industry (31 percent
Giving USA Giving by Corporations
Giving USA FoundationTM | Giving USA 2017 | 149

of the aggregate gain).18 Among the percentage of companies that reduced giving, the energy industry had the highest proportion of companies whose giving declined, at 90 percent between 2014 and 2016.
Among 209 reporting companies, nearly one quarter (24 percent) increased giving over 25 percent over the three-year period.19 For those companies that decreased their giving, 16 percent reduced total giving by more than 25 percent.20 Figure 1 shows the full distribution of companies by changes in their total giving between 2014 and 2016.
Cash giving continued to represent the largest proportion of corporate contributions in the years 2014 to 2016. Cash giving comprised an average of 84 percent of total giving in 2016 for companies in the three-year matched set, which represents the same average from 2014, as illustrated in Figure 2.21 Although non-cash giving accounted for a smaller average proportion of companies’ total giving, at 16 percent in 2016, most companies made non-cash contributions.22 The percentage of companies reporting a value for non-cash contributions increased from 62 percent in 2014 to 65 percent in 2016.
150 | Giving USA FoundationTM | Giving USA 2017
Giving USA Giving by Corporations
Figure 1Distribution of companies by changes in total giving, 2014–2016(inflation-adjusted, matched-set data)
Note: These data include a matched set of 209 companies that responded to the Giving in Numbers survey each year from 2014 to 2016.Data: CECP, in association with The Conference Board, 2017, Giving in Numbers survey on 2016 contributions, www.cecp.co
16%15% 15%
6%
13%11%
24%
Decreased by more
than 25%
Decreased between 10% and
25%
Decreased between 2% and
10%
Flat Increased between 2% and
10%
Increased between 10% and
25%
Increased by more
than 25%
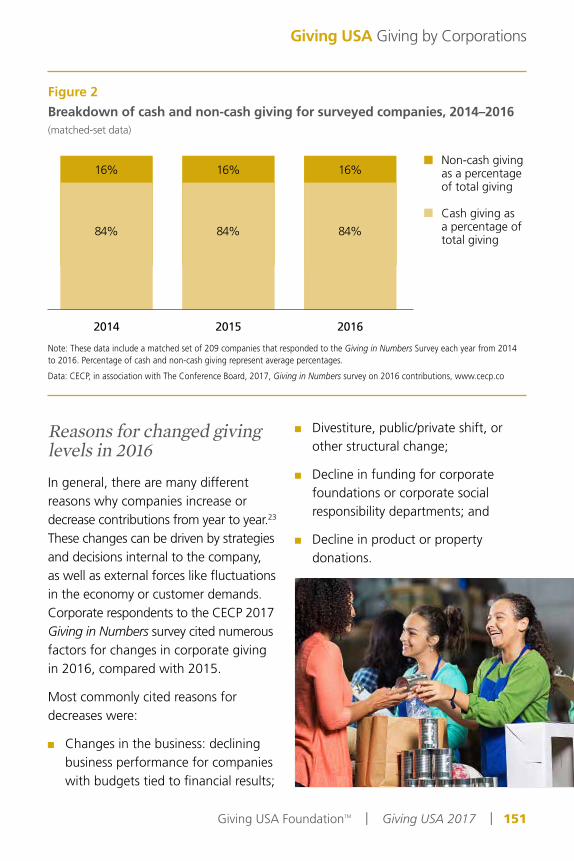
Reasons for changed giving levels in 2016 In general, there are many different reasons why companies increase or decrease contributions from year to year.23 These changes can be driven by strategies and decisions internal to the company, as well as external forces like fluctuations in the economy or customer demands. Corporate respondents to the CECP 2017 Giving in Numbers survey cited numerous factors for changes in corporate giving in 2016, compared with 2015.
Most commonly cited reasons for decreases were:
Changes in the business: declining business performance for companies with budgets tied to financial results;
Divestiture, public/private shift, or other structural change;
Decline in funding for corporate foundations or corporate social responsibility departments; and
Decline in product or property donations.
Giving USA Giving by Corporations
Giving USA FoundationTM | Giving USA 2017 | 151
Figure 2Breakdown of cash and non-cash giving for surveyed companies, 2014–2016 (matched-set data)
Note: These data include a matched set of 209 companies that responded to the Giving in Numbers Survey each year from 2014 to 2016. Percentage of cash and non-cash giving represent average percentages.
Data: CECP, in association with The Conference Board, 2017, Giving in Numbers survey on 2016 contributions, www.cecp.co
2014 2015 2016
84%
16%
84%
16%
84%
16%Non-cash giving as a percentage of total giving
Cash giving as a percentage of total giving

Most commonly cited reasons for increases were:
Strategic review of societal investment areas;
Changes in the business environment, such as improved business performance for companies with corporate social responsibility (CSR) budgets tied to financial results;
Operational changes, such as launching a new foundation or a change in the grantmaking process;
Increase in product or property donations; and
International giving expansion.
Thirty-five percent of companies that maintained their giving level in 2016 versus 2015 cited they did not expect significant changes in giving in 2017.24 In addition, 35 percent of companies that maintained their giving level in 2016
versus 2015 expected giving to increase between 2 percent to 10 percent.
Funding by program area in 2016CECP’s 2017 Giving in Numbers survey respondents were asked to classify their 2016 total giving into nine discrete program areas.25 Companies typically seek to align giving with their area of business and core competencies. For companies reporting on their program area allocations, the greatest average percentage of contributions (29 percent) went to fund education organizations: 17 percent to K–12 education and 13 percent to higher education.26 Similar to past years, health and social services programs also received a large portion of corporate gifts, at 26 percent of the average budget. Figure 3 shows the average program area allocations across all companies that reported on their program area allocation in the survey on 2016 contributions.
152 | Giving USA FoundationTM | Giving USA 2017
Giving USA Giving by Corporations

Predictions for 2017 corporate givingAll companies reporting to CECP’s 2017 Giving in Numbers were asked to predict how 2017 contributions will change compared with 2016 by contribution type: total giving, direct cash, foundation cash, and non-cash.27 Overall, predictions for 2017 lean toward steady levels of giving. Approximately 43 percent of responding companies predict that giving levels
will be the same in 2017. Thirty-four percent of responding companies predict an increase in total giving in 2017. When looking at predictions for specific contribution types, almost half of companies (47 percent) reported that they do not expect a change in non-cash giving in 2017.
Giving USA Giving by Corporations
Giving USA FoundationTM | Giving USA 2017 | 153
Figure 3Program area allocations, 2016 (average percentages)
Note: The sample size for these data was 178 companies. Note that these program areas do not correspond with Giving USA recipient subsectors, and thus the findings cannot be directly compared.
Data: CECP, in association with The Conference Board, 2017, Giving in Numbers survey on 2016 contributions, www.cecp.co
Education,K–1217%
Health &social services
26%
Education,Higher13%Community
& economicdevelopment
14%Culture & arts6%
Education combined
30%Other14%
Civic & public affairs4%
Environment3%
Disaster relief3%

A higher percentage of sampled nonprofits report no increase or a decline in corporate fundraising receipts in 2016 as compared to 2015
The Nonprofit Research Collaborative (NRC) annually conducts surveys on fundraising trends across the nonprofit sector. In 2017, this collaboration included the Giving USA Foundation, the Association of Fundraising Professionals, CFRE International, the Association of Philanthropic Counsel, the National Association of Charitable Gift Planners, and Top Nonprofits.
In early 2017, the NRC launched a survey to assess fundraising trends for
the entire 2016 calendar year.28 The survey asked nonprofit leaders of public charities and foundations to report on changes in charitable revenue received in 2016, among other questions.
The vast majority of all surveyed nonprofit organizations reported soliciting corporations/corporate foundations to raise funds (92 percent) in 2016.29 Table 1 shows survey results for changes in year-to-year giving from corporations in 2015 and 2016.
154 | Giving USA FoundationTM | Giving USA 2017
Giving USA Giving by Corporations
Table 1Percentage of survey respondents reporting changes in amounts received from corporations in 2016, compared with 2015
Direction of change All of 2015 All of 2016
Amount received from corporations and their foundations
Up 55% 45%
Same 28% 35%
Down 17% 20%
Data: Winter 2017 Nonprofit Fundraising Study, May 2017, and Winter 2016 Nonprofit Fundraising Study, March 2016, Nonprofit Research Collaborative, www.npresearch.org

Research offers new insights into the drivers and role of corporate giving
Corporate social responsibility (CSR) can be defined broadly as the economic, legal, ethical, and voluntary (philanthropic) responsibilities that companies should assume.30 Corporate philanthropic initiatives, as an essential component of CSR efforts, encompass various practices, such as matching gifts, cash or in-kind donations, cause-related marketing, and employee engagement programs. Scholars have long examined the factors that are correlated with corporate giving and CSR in general. Several studies published in 2016 offer new insights into this topic. The findings from these studies are summarized below.
Peer effect matters in corporate giving A study published in 2016 by Christopher Marquis (Cornell University) and András Tilcsik (University of Toronto) sheds light on how corporate giving decisions are made—specifically, how companies respond to their peers’ philanthropic practices.31 The study analyzed data on charitable donations made by Fortune 1000 U.S. companies from 1980 to 2006, and confirmed a peer effect on corporate giving.
According to the study, a company’s charitable donations are closely
correlated with the donations made by its “institutional equivalents,”—peer firms that operate both in the same industry and in the same geographic community—and such correlation does not occur with non-institutional equivalents.32 A given company is more likely to “feel” such a peer effect if that company is larger (as measured by sales revenue) or performs better financially (as measured by return on assets).
In addition, the greater the difference between the average amount of charitable donations made by industry peers and by geographic peers, the stronger the peer effect of institutional equivalents.33 This implies that when industry peers and geographic peers differ substantially from each other in the level of charitable giving, signaling inconsistent behavioral cues, institutional equivalents become the most important reference group for a company when making decisions about charitable giving.
When a company does not have institutional equivalents, its charitable donations are strongly correlated with donations made by both industry peers and geographic peers, especially when these two groups of peers donated at a similar level, or the company is large.34 When industry and geographic peers differ greatly in the level of charitable giving, the peer effect tends to be weak, as a company receives inconsistent cues from peers and thus tends to make giving decisions independently.
Giving USA Giving by Corporations
Giving USA FoundationTM | Giving USA 2017 | 155

Corporate cash giving positively links to financial performance due to its informational valueIn a working paper published in December 2016, Hao Liang (Singapore Management University) and Luc Renneboog (Tilburg University, the Netherlands) analyzed data from a global sample of publicly listed companies between 2004 and 2013.35 The researchers found a positive relationship between total corporate charitable donations and corporate financial performance (as measured by three variables: return on assets; sales growth; and Tobin’s Q ratio, the ratio of market-to-book value of total assets). The researchers further examined cash and in-kind donations separately, and demonstrated that cash donations have a stronger correlation with corporate financial performance than in-kind gifts.
Another study analyzing 2002–2012 data on U.S. public firms similarly found that cash giving is positively related to a firm’s future financial performance (as measured by Tobin’s Q ratio, return on assets, and Fama-French five-factor adjusted excess return, an asset pricing model of stock returns).36 The researchers of this study—Kiyoung Chang (University of South Florida Sarasota-Manatee), Hoje Jo (Santa Clara University), and Ying Li (University of Washington)—further deconstructed corporate cash donations into two
components: expected cash giving and unexpected cash giving. Expected cash giving accounts for the donations that can be explained by firm characteristics, such as assets, leverage, research and development activities, advertising, industry, or governance. By contrast, unexpected cash giving represents the donations that are not related to firm characteristics. The researchers found that only unexpected cash giving is positively associated with a firm’s future financial performance.
Findings from this study suggest that corporate cash giving, especially unexpected cash giving, has an informational value, signaling strong financial performance and available cash flow to shareholders, whereas in-kind gifts do not have such implications.37 The positive relationship between unexpected cash giving and future financial performance is more pronounced when a company has stronger governance, shows higher sales growth, or has lower expenses on dividends, advertising, or repurchases.
Corporate foundation giving is related to reduced corporate misconductFrederick Bereskin, Terry Campbell II (both at University of Delaware), and Simi Kedia (Rutgers University) examined the relationship between charitable donations made through corporate foundations and firm-level misconduct in their 2016 study.38 The researchers
156 | Giving USA FoundationTM | Giving USA 2017
Giving USA Giving by Corporations

identified the positive role of corporate foundation giving in mitigating corporate wrongdoing. According to this study, corporate foundation giving is positively correlated with higher likelihoods of employee whistleblowing and forced CEO turnover after the discovery of corporate wrongdoing. Moreover, corporate foundation giving is negatively associated with the likelihood of misconduct, suggesting that firms with foundation giving are less likely to get involved in wrongdoing. This negative relationship was found to be independent of the implementation of the regulatory requirements, as it remained strong both before and after the implementation of the Sarbanes-Oxley Act of 2002.
Employee participation in philanthropy associated with productivity and commitment
Employees—important internal stakeholders of corporations—now see CSR efforts, particularly philanthropic initiatives, as essential practices that companies should engage in. Moreover, employees also want to play an active role in their company’s philanthropic activities. Several reports and studies published in 2016 demonstrate that employees’ involvement in these activities not only influences employee recruitment, but
also increases employees’ productivity and commitment. Key findings from these studies are summarized in the following sections.
Employees seek companies with strong CSR commitments, and prefer active hands-on opportunities and flexible options in engagementThe 2016 Cone Communications Employee Engagement Study revealed that corporate CSR efforts are important factors influencing employee recruitment, loyalty, and job satisfaction.39 In April 2016, this study surveyed a random sample of 1,020 adults aged 20+ who worked at companies with at least 1,000 employees. According to the survey, employees not only valued their companies’ social and environmental commitments, but also wanted to actively get involved in these efforts and to help their companies improve such efforts. To achieve professional growth, make a difference, and receive financial incentives are the top three factors encouraging employee engagement in CSR activities at the workplace.
Among all respondents in the 2016 Cone survey, the following trends were noted:40
77 percent reported that it was “important” for their company to provide “hands-on activities around environmental responsibility,”and;41
Giving USA Giving by Corporations
Giving USA FoundationTM | Giving USA 2017 | 157

78 percent indicated that they wanted to offer ideas and suggestions to actively help their companies improve responsible practices.
Companies’ involvement in CSR activities is an important factor that drives employee recruitment, loyalty, and retention. This is even more essential among younger employees. In the same 2016 Cone survey, the following generational differences were found:42
70 percent of all respondents (vs. 79 percent of young Generation Xers aged 36–44, and 83 percent of mature Millennials aged 27–35) indicated that they would feel more loyal to the company if the company helped employees make an impact on social/environmental issues;
58 percent (vs. 68 percent of young Generation Xers, and 79 percent of mature Millennials) reported considering a company’s CSR commitments when choosing the employer;
55 percent (vs. 76 percent of mature Millennials) said that they would choose an employer that was socially responsible even if they received a lower salary; and
51 percent (vs. “two-thirds” of mature Millennials) reported that they would not work for a company that did not have
strong CSR efforts.43
When it comes to volunteering opportunities, employees preferred more options to provide the flexibility for them to choose how and when they volunteer.44 According to the same 2016 Cone survey, more than half (53 percent) of employees indicated preferring a balance of skill-based and non-skill-based volunteering activities, whereas an almost equal one-fourth reported preferring activities that are entirely skill-based or entirely non-skill-based. Company-wide days of service, company-led activities, micro-volunteerism, paid service leave, after-hour services, and service trips all received wide support from employees, each indicated by more than half of all survey respondents as very or somewhat important.
Company-led volunteer activities and dedicated all-company days of service were the top two options selected by Millennial employees (83 percent and 81 percent, respectively).45 Male employees were more likely than female employees to choose paid service leave (67 percent of men vs. 56 percent of women), after-hour services (60 percent of men vs. 55 percent of women), and service trips (59 percent of men vs. 48 percent of women).
158 | Giving USA FoundationTM | Giving USA 2017
Giving USA Giving by Corporations

Research finds a positive relationship between employee matching programs and productivityIn their 2016 study, Ning Gong and Bruce Grundy (both at the University of Melbourne) found a positive relationship between the provision of an employee
matching program, labor productivity, and employee satisfaction.47 The researchers analyzed data from a sample of Standard & Poor’s 1,500 companies between 2010 and 2013. They found that companies with an employee matching program have higher labor productivity (as measured by pre-tax operating income before depreciation, divided by the number of employees) than companies that do not offer an employee matching program.
Although the study cannot establish a causal relationship between employee matching programs and productivity, the researchers did not find a similar positive relationship between the total amount of corporate charitable contributions and productivity.48 In addition, the study showed that companies with an employee matching program are more likely to be ranked as Fortune Magazine’s “100 Best Companies to Work for,” which was determined based on employee surveys and thus was used as a measure of employee satisfaction.
Corporate philanthropy motivates virtual employees to go above and beyondIncreasingly, many companies have virtual employees who work remotely with no or limited direct, face-to-face interactions with their employers. In 2015, about one quarter (24 percent) of employed persons completed some or all of their work at home, up by 5 percent from 2003.49 This 2015 share was even
Giving USA Giving by Corporations
Giving USA FoundationTM | Giving USA 2017 | 159
Good to Know
Increasingly, companies and businesses are looking to support the nonprofit organizations their employees are passionate about, and they tend to invest in the nonprofits where their employees volunteer.46 If you are running a nonprofit, consider the following points to help you become more attractive to volunteers and their corporate employers:
Offer volunteer opportunities that attract people who have a passion for your organization but limited discretionary time. Provide a variety of times when individuals can volunteer, including evenings and weekends.
Ensure that your website is compelling, easy to navigate, and provides information on volunteer opportunities for people of all ages and levels of experience.
Prepare your organization to host volunteers. Be ready to answer questions, alert your staff to the volunteers’ arrival, and remember that every touchpoint with your organization matters.
Be sure corporate employers know how valuable those volunteers—their employees—are to the success and wellbeing of the people you serve.

higher among those in management, business, and financial operations (38 percent), as well as professional occupations (35 percent).
A new study by Vanessa Burbano (Columbia University) illuminates an aspect of employee engagement among this group of non-traditional employees.50 Based on findings from two field experiments conducted with virtual workers in two online marketplaces, this study found that receiving information about a company’s charitable program increases the quantity and quality of unrequired, extra work completed by virtual workers. This positive impact is particularly strong among virtual workers with a higher level of prosocial motivation or those who volunteered or donated to a charity in the past year.
Employee philanthropic involvement predicts stronger attitudinal and behavioral commitmentA study published in 2016 by Steffen Raub (Ecole Hôtelière de Lausanne, HES-SO, University of Applied Sciences Western Switzerland) revealed that involvement in a company’s philanthropic activities cultivates positive attitudinal and behavioral commitment to the company.51 The researcher first surveyed employees and supervisors at a chemical-pharmaceutical company, and further conducted an experimental study with college students (prospective employees) at a U.S. public university.
The findings showed that an employee’s participation in a company’s philanthropic activities leads to an employee’s stronger emotional attachment to the company and stronger behavioral commitment (measured by willingness to spread goodwill to promote the reputation of the company). This positive impact can be partially explained by employees’ perception of positive, benevolent motivations of companies that engage in philanthropy.
Corporate cause sponsorships continued growing in 2016
While corporate sponsorships for charitable causes are not included in Giving USA data, they are important ways for companies to engage in and give back to the community. In January 2017, IEG issued its 32nd annual industry review and forecast of corporate sponsorship spending.52 Sponsorship spending in North America reached $22.3 billion in 2016, approximately 4.2 percent higher than the previous year. Total sponsorships are expected to increase by 4.1 percent in 2017 to $23.2 billion. Sponsorships for charitable causes, specifically, totaled $1.99 billion in 2016, up by 3.3 percent from 2015 and accounting for 9.1 percent of all sponsorships. Corporate cause sponsorships are predicted to continue growing in 2017, reaching $2.06 billion.
160 | Giving USA FoundationTM | Giving USA 2017
Giving USA Giving by Corporations

Most companies in The Chronicle of Philanthropy’s survey of corporate giving donated less than 1 percent of pre-tax profits in cash in 2015
Revised Giving USA estimates for giving in 2015 show that giving by corporations declined 0.8 percent between 2014 and 2015. In June 2016, The Chronicle of Philanthropy released findings from its annual survey of corporate giving for 2015.53 The Chronicle surveyed the top 150 U.S. companies on Fortune Magazine’s list and reported results from 68 large U.S. companies. The total amount of cash giving by these 68 companies and their foundations grew by just 2 percent in 2015, reaching $4.8 billion. The top three corporate donors of cash gifts were Gilead Sciences (at nearly $447 million), Walmart (at $301 million), and Wells Fargo (at $281 million). In addition to Wells Fargo, four other financial firms also made to the list of top 10 cash donors.
According to this Chronicle survey, four companies donated at least 4 percent of their pre-tax profits in cash in 2015.54 These corporations include: General Mills (6 percent), Chevron (5 percent), Nationwide (4 percent), and Xerox (4 percent). Most companies surveyed donated less than 1 percent of their
2015 pre-tax profits in cash.
As in previous years, pharmaceutical companies topped the list of corporate in-kind donors in 2015.55 The largest in-kind donor was Pfizer, at $3.1 billion, followed by Gilead Sciences (at $1.9 billion), and Merck (at $1.7 billion). The other two companies that donated at the $1-billion level or above in in-kind gifts in 2015 were Walmart (at $1.1 billion) and Google (at $1 billion).
Key findings from other studies summarized
Table 2 presents three years of data from The Chronicle of Philanthropy released annually about corporate giving.
Giving USA Giving by Corporations
Giving USA FoundationTM | Giving USA 2017 | 161

References1 All data in this section are reported as estimates, which
are subject to revision. To provide the most accurate estimates for charitable giving, as new data become available, Giving USA revises its estimates for at least the last two years. See more about how Giving USA calculates charitable giving by sources and uses in the “Brief summary of methods used” section of this report.
2 Note that Giving USA does not use this specific figure in its corporate giving estimate as other adjustments are made. See the “Brief summary of methods used” section in the report for additional detail. Data were provided by Foundation Center in April 2017 and are subject to revision. Data on giving by and to foundations is available in Foundation Center’s Key Facts on U.S. Foundations reports, available at Foundation Center’s website at www.foundationcenter.org.
3 These data are in current dollars. “Corporate Profits Before Tax by Industry,” Bureau of Economic Analysis, U.S. Department of Commerce, 2016, retrieved April 2017, www.bea.gov; “Gross Domestic Product,” Bureau of Economic Analysis, U.S. Department of Commerce, 2016, retrieved April 2017, www.bea.gov
4 Practitioner highlight authored by Editorial Review Board
member Helen Starman. 5 Practitioner highlight authored by Editorial Review Board
member Helen Starman. 6 Practitioner highlight authored by Editorial Review Board
member Lisa Buckley. 7 “Gross Domestic Product,” Bureau of Economic Analysis,
U.S. Department of Commerce, 2016, retrieved April 2017, www.bea.gov
8 These data are in current dollars. “Corporate Profits Before Tax by Industry,” Bureau of Economic Analysis, U.S. Department of Commerce, 2016, retrieved April 2017, www.bea.gov
9 Same as note 2.10 Data were provided by Foundation Center in April 2017
and are subject to revision.11 This summary paragraph was written by Foundation
Center, May 2017.12 Each year, CECP, in association with The Conference
Board, presents an in-depth analysis of the results of an annual survey of corporate giving trends in the publication Giving in Numbers, released free-of-charge to the public each fall. The report answers pressing questions reported by 250+ companies about the state of their
162 | Giving USA FoundationTM | Giving USA 2017
Giving USA Giving by Corporations
Chapter authored by Xiaonan Kou, doctoral candidate in Philanthropic Studies and Associate Director of Research at Indiana University Lilly Family School of Philanthropy. The summary of results from the 2017 CECP Giving in Numbers survey report was written by staff at CECP.
Good to Know sections and Practitioner Highlights written by Giving USA Editorial Review Board members Lisa Buckley and Helen Starman.
Table 2Key findings from The Chronicle of Philanthropy
The Chronicle of Philanthropy Report on the largest corporate donors for years 2013−2015
www.philanthropy.com
2013 2014 2015
Company reported with the highest amount in cash donations
Wal art$311.6 million
Wal art$322.4 million
Gilead Sciences$446.7 million
Company reported with the highest amount in product donations
Halliburton$4.1 billion
Halliburton$2.6 billion
Pfizer$3.1 billion
corporate giving, rates of giving internationally, employee engagement, program management, and more. Giving in Numbers survey, CECP, in association with The Conference Board, 2017, www.cecp.co. Note that not all companies answered all questions. Also, note that some of the data refer only to a matched set of companies that have participated in the survey in each year from 2014 to 2016, per the identified sample sizes in the references. Caution should be used in comparing results between Giving USA and CECP because CECP’s study is focused on businesses with more than $2 billion in annual revenue, while Giving USA includes businesses of all sizes. In addition, CECP’s sample is global, while Giving USA focuses solely on companies based in the United States.
13 Same as note 12.14 Same as note 12, n=232.15 Same as note 12, n=209. The giving increase consisted of
at least 2.0 percent between 2014 and 2016; the giving decrease consisted of at least -2.0 percent between 2014 and 2016.
16 Same as note 12, n=209. The giving increase consisted of at least 2.0 percent between 2014 and 2016; the giving decrease consisted of at least -2.0 percent between 2014 and 2016.
17 Same as note 12, n=209. The giving increase consisted of at least 2.0 percent between 2014 and 2016; the giving decrease consisted of at least -2.0 percent between 2014 and 2016.
18 Same as note 12, n=209. The giving increase consisted of at least 2.0 percent between 2014 and 2016; the giving decrease consisted of at least -2.0 percent between 2014 and 2016.
19 Same as note 12, n=49.20 Same as note 12, n=33.21 Same as note 12. These data include a matched set of
209 companies that responded to the Giving in Numbers Survey each year from 2014 to 2016. Percentage of cash and non-cash giving represent average percentages.
22 CECP, in association with The Conference Board, collects total contribution data in three giving types disbursed during the 12 months of the survey year: Direct Cash includes cash giving from corporate headquarters or regional offices; Foundation Cash includes cash giving from the corporation foundation; and Non-Cash includes product donations, pro bono service, and other non-cash contributions (e.g., computers, office supplies, etc.) assessed at Fair Market Value.
23 Same as note 12.24 Same as note 12.25 Same as note 12, n=178. Also, note that these program
areas do not correspond with Giving USA recipient subsectors, and thus the findings cannot be directly compared.
26 Same as note 12, n=178.27 Same as note 12.28 The Nonprofit Research Collaborative (NRC) annually
conducts surveys on fundraising trends across the nonprofit sector. In 2017, this collaboration included the Giving USA Foundation, the Association of Fundraising Professionals, CFRE International, the Association of
Philanthropic Counsel, the National Association of Charitable Gift Planners, and Top Nonprofits. In early 2017, the NRC launched a survey to assess fundraising trends for the entire 2016 calendar year. The survey asked nonprofit leaders of public charities and foundations to report on changes in charitable revenue received and changes in the number of donors by specific donor type, among other questions. Data in this section come from the Winter 2017 Nonprofit Fundraising Survey report from the Nonprofit Research Collaborative, May 2017, www.npresearch.org. A convenience sample of 1,019 respondents, 144 of them Canadian, constitutes the survey results.
29 Same as note 28.30 Archie B. Carroll, “The Pyramid of Corporate Social
Responsibility: Toward the Moral Management of Organizational Stakeholders,” Business Horizons, 1991, 34(4), 39-48
31 Christopher Marquis and András Tilcsik, “Institutional Equivalence: How Industry and Community Peers Influence Corporate Philanthropy,” Organization Science, 2016, 27(5), 1325-1341
32 Same as note 31, pg. 1325.33 Same as note 31.34 Same as note 31.35 Hao Liang and Luc Renneboog, “Corporate Donations
and Shareholder Value,” December 2016, European Corporate Governance Institute Working Paper, 2016, No. 491/2016, 1-53
36 Kiyoung Chang, Hoje Jo, and Ying Li, “Is There Informational Value in Corporate Giving?” Journal of Business Ethics, 2016, 1-24
37 Same as note 36.38 Frederick Bereskin, Terry Campbell II, and Simi Kedia,
“Corporate Philanthropy, Employees and Misconduct,” Social Sciences Research Network, February 23, 2016, https://papers.ssrn.com/sol3/papers.cfm?abstract_id=2370482
39 2016 Cone Communications Employee Engagement Study, Cone Communications, June 2016, http://www.conecomm.com/research-blog/2016-employee-engagement-study
40 Same as note 39.41 Same as note 39, pg. 642 Same as note 39.43 Same as note 39, pg. 544 Same as note 39.45 Same as note 39.46 Good to Know section authored by Editorial Review Board
member Lisa Buckley.47 Ning Gong and Bruce D. Grundy, “Can Socially-
Responsible Firms Survive Competition? An Analysis of Corporate Employee Matching Grants,” Social Sciences Research Network, April 15, 2017, https://papers.ssrn.com/sol3/papers.cfm?abstract_id=2007643
48 Same as note 47.49 “American Time Use Survey—2015 Results,” Bureau of
Labor Statistics, U.S. Department of Labor,” June 24, 2016, www.bls.gov
50 Vanessa C. Burbano, “Getting Virtual Workers to Do More
Giving USA Giving by Corporations
Giving USA FoundationTM | Giving USA 2017 | 163

by Doing Good: Field Experimental Evidence,” Working Paper, April 2016, https://corporate-sustainability.org/wp-content/uploads/Getting-Virtual-Workers.pdf
51 Steffen Raub, “When Employees Walk the Company Talk: The Importance of Employee Involvement in Corporate Philanthropy,” Human Resource Management, 2016, 1-14
52 What Sponsors Want and Where Dollars Will Go in 2017, IEG, 2017, www.sponsorship.com
53 Alex Daniels and Peter Olsen-Phillips, “Cash Giving from Business Edges Up, Chronicle Survey Shows,” The Chronicle of Philanthropy, June 1, 2016, www.philanthropy.com
54 Same as note 53.55 Same as note 53; “Financial-Services and Drug Companies
Top List of Corporate Donors,” The Chronicle of Philanthropy, June 1, 2016, www.philanthropy.com
164 | Giving USA FoundationTM | Giving USA 2017
Giving USA Giving by Corporations

Giving USA follows the National Taxonomy of Exempt Entities (NTEE) system to classify most types of charitable organizations on the recipient side of giving. The exceptions are giving to religion and giving to foundations. For more information about how organizations are categorized within the charitable subsectors, refer to the following NTEE summary table. To look up a specific organization, go to the National Center for Charitable Statistics website at http://nccs.urban.org/.
Giving USA FoundationTM | Giving USA 2017 | 165
Introduction to the Giving USA Uses of Contributions Chapters

166 | Giving USA FoundationTM | Giving USA 2017
Giving USA

8 |
Giving USA FoundationTM | Giving USA 2017 | 167
The arts, culture, and humanities subsector includes the following categories:
A-Arts, culture, & humanities• arts & culture (multipurpose
activities)• media & communications• visual arts• museums• performing arts• humanities• historical societies & related
historical activities
The education subsector includes the following categories:
B-Education• elementary & secondary education
(preschool–grade 12)• vocational/technical schools• higher education• graduate/professional schools• adult/continuing education• libraries• student services & organizations
The environment/animals subsector includes the following categories:
C-Environment• pollution abatement & control• natural resources conservation
& protection• botanic/horticulture activities• environmental beautification &
open spaces• environmental education &
outdoor survival
D-Animal-related• animal protection & welfare• humane societies• wildlife preservation & protection• veterinary services• zoos & aquariums• specialty animals & other services
Summary of the National Taxonomy of Exempt Entities

168 | Giving USA FoundationTM | Giving USA 2017
Giving USA Summary of the National Taxonomy of Exempt Entities
The health subsector includes the following categories:
E-Health care• hospitals, nursing homes, & primary
medical care• health treatment, primarily
outpatient• reproductive health care• rehabilitative medical services• health support services• emergency medical services• public health & wellness education• health care financing/insurance
programs
F-Mental health & crisis intervention
• addiction prevention & treatment• mental health treatment & services• crisis intervention• psychiatric/mental health• halfway houses (mental health)/
transitional care
G-Diseases, disorders, & medical disciplines• birth defects & genetic diseases• cancer• diseases of specific organs• nerve, muscle, & bone diseases• allergy-related diseases• specifically named diseases• medical disciplines/specialties
H-Medical research• identical hierarchy to diseases/
disorders/medical disciplines in major field “G.” Example: G30 represents American Cancer Society & H30 represents cancer research
The human services subsector includes the following categories:
I- Crime & legal-related
• police & law enforcement agencies• correctional facilities & prisoner
services• crime prevention• rehabilitation of offenders• administration of justice/courts• protection against/prevention of
neglect, abuse, & exploitation• legal services
J-Employment• vocational guidance & training (such
as on-the-job programs)• employment procurement assistance• vocational rehabilitation• employment assistance for the
handicapped• labor unions/organizations• labor-management relations
K-Food, agriculture, & nutrition• agricultural services aimed at food
procurement• food service/free food distribution• nutrition promotion• farmland preservation
L-Housing & shelter• housing development/construction• housing search assistance• low-cost temporary shelters, such as
youth hostels• homeless/temporary shelter• housing owners/renters
organizations• housing support services

Giving USA Summary of the National Taxonomy of Exempt Entities
Giving USA FoundationTM | Giving USA 2017 | 169
M-Public safety, disaster preparedness & relief• disaster prevention, such as
flood control• disaster relief (U.S. domestic)• safety education• civil defense & preparedness
programs
N-Recreation & sports• camps• physical fitness & community
recreation• sports training• recreation/pleasure or social clubs• amateur sports• Olympics & Special Olympics
O-Youth development• youth centers (such as boys/
girls clubs)• scouting• youth mentoring• agricultural development
(such as 4-H)• business development, Junior
Achievement• citizenship programs• religious leadership development
P-Human services• multipurpose service organizations• children & youth services• family services• personal social services• emergency assistance (food,
clothing)• residential/custodial care• centers promoting independence
of specific groups, such as senior or women’s centers
The international affairs subsector includes the following categories:
Q-International, foreign affairs, & national security• international exchange programs• international development• international relief services (foreign
disaster relief )• international peace & security• foreign policy research & analysis
(U.S. domestic)• international human rights
The public-society benefit subsector includes the following categories:
R-Civil rights, social action, & advocacy• equal opportunity & access• voter education/registration• civil liberties
S-Community improvement & capacity building• community/neighborhood
development• community coalitions• economic development, urban
& rural• business services• community service clubs
(such as Junior League)
T-Philanthropy, voluntarism, & grantmaking foundations• philanthropy associations/societies• private (independent & operating)
foundations, funds (e.g., women’s funds), community foundations, & corporate foundations*
* Giving USA does not create estimates for giving to foundations using the NTEE system. See the “Brief summary of methods used” section of this report for more information.

170 | Giving USA FoundationTM | Giving USA 2017
Giving USA Summary of the National Taxonomy of Exempt Entities
• community funds & federated giving• voluntarism promotion• donor-advised funds
U-Science & technology• scientific research & promotion• physical/earth sciences• engineering/technology• biological sciences
V-Social science• social science research/studies• interdisciplinary studies
W-Public & societal benefit• public policy research, general• government & public administration• transportation systems• public utilities, including
telecommunications• consumer rights/education/
protection• military & veterans organizations• financial institutions
The religion subsector includes the following categories:
X-Religion/spiritual development• houses of worship of all types,
including churches, mosques, & synagogues
• religious media & communications• interfaith coalitions
Not included in Giving USA’s estimates:
Y-Mutual & membership benefit• insurance providers & services (other
than health)• pension/retirement funds• fraternal beneficiary funds• cemeteries & burial services
Z-Unknown• Z99 unknown

Contributions to the religion subsector comprised 32 percent of all donations received by charities in 2016.1
Giving to religious organizations increased 3.0 percent in current dollars from 2015, totaling $122.94 billion. Adjusted for inflation, giving to religion grew 1.8 percent from 2015.
Contributions to religion in 2016 totaled the highest inflation-adjusted amount recorded to date.
Giving USA FoundationTM | Giving USA 2017 | 171
9 | Giving toReligion

Historically, Giving USA has defined giving to religion
narrowly, focusing only on congregations, missions, religious media, and other related organizations. Giving USA has not included in the religion subsector those organizations whose mission is religious in nature but also work to fulfill other needs. As an example, although The Salvation Army considers itself “part of the universal Christian Church,”5 Giving USA categorizes the organization
within the human services subsector according to the NTEE coding system.6 Another illustration is the Lutheran Theological Seminary in Philadelphia.7 This religious school is categorized as an educational institution for the purposes of Giving USA, despite its religious ties. If Giving USA were to include giving to all houses of worship and to all religiously-oriented charities, it is estimated that up to 75 percent of all giving could be considered religious in nature.8
172 | Giving USA FoundationTM | Giving USA 2017
Giving USA Giving to Religion
Practitioner Highlights Though giving to religion remains consistent, it is the slowest growing
subsector out of the nine nonprofit subsectors tracked by Giving USA. As the number of religiously affiliated Americans continues to decline, giving levels to the subsector may be further impacted.2
#GivingTuesday events offer religious organizations the valuable opportunity to connect with donors, and have produced positive results for some congregations and organizations in recent years. Religious groups should consider setting a targeted fundraising goal for the day and encourage support through emails and social media posts to donors.3
While giving through online methods to this subsector grew in 2016, religious organizations still lag behind other nonprofits when it comes to properly utilizing this giving method.4

The information provided in this chapter derives from a number of sources, including publicly available reports, news stories, and websites from the most recent year. This chapter is meant to provide context for the giving trends reported in this edition of Giving USA and to illustrate some of the practical implications of the data. It is not intended to be a comprehensive survey of the subsector, but rather a collection of examples from the field.
Trends in giving to religion in 2016
Giving to religion marked its sixth consecutive year of growth in 2016.9 In the last five-year period (2012 to 2016), giving to this subsector grew at an average rate of 3.8 percent per year—making it the slowest growing subsector out of nine. Giving to religion failed to outpace the five-year average rate of growth in total giving of 5.6 percent. However, the two-year (2015 and 2016) growth rate in giving to religion was a healthy 6.0 percent.
Other reports issued in 2017 note generally positive trends in giving to religious organizations in 2016. The results of these reports are provided throughout the rest of this opening narrative and chapter. Different methodological and sampling approaches account for the differences seen between these sources and Giving USA data. Some highlights from 2016 on giving to this subsector include:
Sector growth in 2016 was reflected in the 64 percent of surveyed religious organizations reporting an increase over 2015 giving, according to the Nonprofit Research Collaborative’s (NRC) Winter 2017 Nonprofit Fundraising Survey.10
In spring 2017, Blackbaud reported that among its sample of nearly 6,800 nonprofits, giving to faith-based organizations realized an increase of 1.7 percent between 2015 and 2016.11 Faith-based organizations saw the greatest year-over-year monthly increase in overall charitable revenue in the three-month period ending in October (5.8 percent). Giving declined, however, to this subsector in the three-month periods ending in July (-1.6 percent) and August (-1.7 percent).12
To provide additional context for giving to religion in 2016 and in recent years, the following sections provide detail on recent trends, related campaigns, and news for this subsector.
Giving USA Giving to Religion
Giving USA FoundationTM | Giving USA 2017 | 173

Online giving to religion continued to grow in 2016
Two reports noted generally positive results for giving to religious organizations in 2016 via online methods, as more groups continue to offer online giving options for their members. While different methodological and sampling approaches account for the differences seen between these sources and Giving USA data, these sources highlight trends seen by specific types of religious organizations.
Online giving was much stronger for the sample of Blackbaud faith-based organizations than was overall giving to these same organizations, increasing 8.9 percent in 2016.13 Faith-based organizations realized the greatest year-over-year monthly increases in online charitable revenue in the three-month periods ending in September (20 percent) and November (18.8 percent), while growth increased more slowly in the three-month period ending in March (6.6 percent).14
According to Blackbaud’s Luminate Online Benchmark Report 2016, online giving continued to grow in 2016, with faith-based organizations realizing an increase of 3 percent of total online revenue.15 Previous versions of the Luminate Online Benchmark Report have maintained separate categories for Christian and Jewish
organizations, but the newest version of the report combines them into one category (faith-based organizations).
Faith-based organizations saw a median online transaction amount per usable email of $27.36, a number that stayed level with 2015.16 First-time online transactions as a share of total fundraising declined by 10 percent for these groups from 2015, reaching 18.7 percent in 2016. Repeat online transactions grew by 3 percent as a share of total fundraising from 2015 to reach 81.3 percent in 2016. Sustained online transactions rose 13 percent from 2015 to reach 29.1 percent of total online fundraising in 2016.
The 2016 State of the Plate Report, a constituency survey of Christian clergy and laity produced by Tithe.ly and other faith-based support services, found a dramatic uptick in the percentage of congregations offering online giving (from 29 percent in 2010 to 79 percent in 2016) and cell phone text giving (from 4 percent in 2010 to 46 percent in 2016).17
Trends in American religion in 2016
While giving to some Christian organizations has continued to grow, giving to other organizations, particularly smaller congregations, has remained the same or declined.18 The 2016 State of the Plate Report reported that slightly more surveyed churches (41 percent) reported
174 | Giving USA FoundationTM | Giving USA 2017
Giving USA Giving to Religion

that giving grew 5 percent or more, compared to the 39 percent reporting that giving had remained flat. A smaller share (20 percent) reported giving had dropped by 5 percent or more.
A January 2016 survey of 1,000 Protestant pastors by LifeWay Research reported similar findings, indicating that 41 percent of responding churches reported increased offerings from 2014 to 2015, while 21 percent experienced a decline in offerings in 2015 from 2014.19 Many respondents (39 percent) noted that 2015 offerings were consistent with their budgeted forecast, while 32 percent characterized the 2015 results as lower than anticipated.20 Smaller congregations saw fewer gains: 39 percent of churches with 50–99 members saw increased revenue from 2014 to 2015, compared to 50 percent of churches with membership of 100–249 and 53 percent of churches with membership of 250 or more.
Yearbook of American and Canadian Churches revivedCompiled first in 1916, the Yearbook of American and Canadian Churches has served as one of the best annual reports on American religious giving. Published by the National Council of Churches in the USA (National Council of Churches), this resource provided tables of annual giving trends and membership totals. Giving USA, empty tomb, inc., and other scholars relied on these annual reports to estimate religious giving in America.
Despite the importance of the report, the National Council of Churches ceased publishing the Yearbook in 2012 due to budget difficulties. Recently, the Association of Statisticians of American Religious Bodies (ASARB) entered into an agreement with the National Council of Churches to begin collecting and publishing data once again.21 ASARB is currently collecting data from denominational statisticians.22 For more information about this important project or to provide data, please contact [email protected].
Religious organizations benefit from #GivingTuesdayIn the past few years, faith-based organizations have fared well on #GivingTuesday, the one-day online fundraising movement taking place on the Tuesday following Thanksgiving in November.23 Success stories from the 2016 #GivingTuesday include:
MEOR, an organization that engages young people to foster connections with their Jewish heritage and identity, doubled their revenue from the 2015 #GivingTuesday by hosting an online campaign featuring a quadruple match for every gift made within a 24-hour period, raising in total over $2 million.24
The Advance, the global mission agency of The United Methodist Church, raised almost $854,000 to support mission projects worldwide.25
Giving USA Giving to Religion
Giving USA FoundationTM | Giving USA 2017 | 175
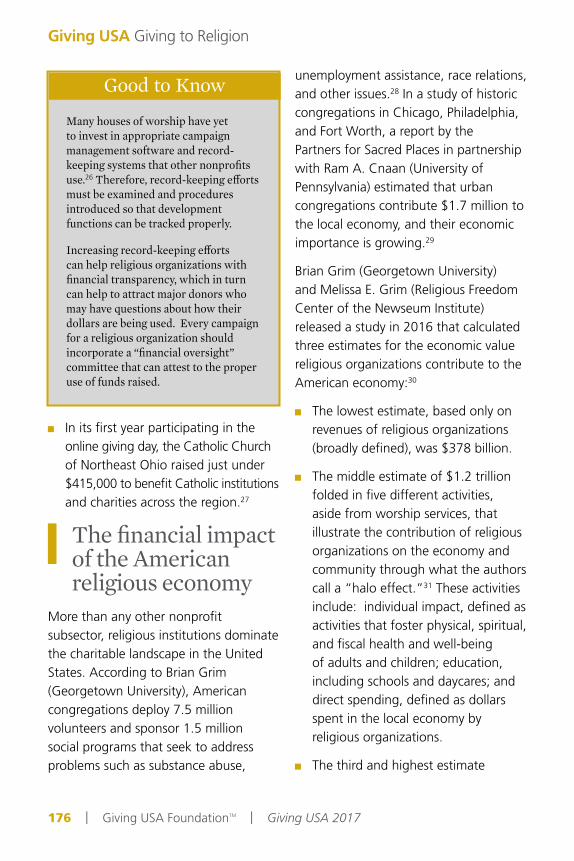
In its first year participating in the online giving day, the Catholic Church of Northeast Ohio raised just under $415,000 to benefit Catholic institutions and charities across the region.27
The financial impact of the American religious economy
More than any other nonprofit subsector, religious institutions dominate the charitable landscape in the United States. According to Brian Grim (Georgetown University), American congregations deploy 7.5 million volunteers and sponsor 1.5 million social programs that seek to address problems such as substance abuse,
unemployment assistance, race relations, and other issues.28 In a study of historic congregations in Chicago, Philadelphia, and Fort Worth, a report by the Partners for Sacred Places in partnership with Ram A. Cnaan (University of Pennsylvania) estimated that urban congregations contribute $1.7 million to the local economy, and their economic importance is growing.29
Brian Grim (Georgetown University) and Melissa E. Grim (Religious Freedom Center of the Newseum Institute) released a study in 2016 that calculated three estimates for the economic value religious organizations contribute to the American economy:30
The lowest estimate, based only on revenues of religious organizations (broadly defined), was $378 billion.
The middle estimate of $1.2 trillion folded in five different activities, aside from worship services, that illustrate the contribution of religious organizations on the economy and community through what the authors call a “halo effect.”31 These activities include: individual impact, defined as activities that foster physical, spiritual, and fiscal health and well-being of adults and children; education, including schools and daycares; and direct spending, defined as dollars spent in the local economy by religious organizations.
The third and highest estimate
176 | Giving USA FoundationTM | Giving USA 2017
Giving USA Giving to Religion
Good to KnowMany houses of worship have yet to invest in appropriate campaign management software and record-keeping systems that other nonprofits use.26 Therefore, record-keeping efforts must be examined and procedures introduced so that development functions can be tracked properly.
Increasing record-keeping efforts can help religious organizations with financial transparency, which in turn can help to attract major donors who may have questions about how their dollars are being used. Every campaign for a religious organization should incorporate a “financial oversight” committee that can attest to the proper use of funds raised.

of $4.8 trillion also added in the approximated wealth of religious Americans, drawing on the hypothesis that religiously affiliated individuals make financial decisions based on their respective religious beliefs, so all individual economic activity could be considered religious in nature. The estimate was calculated by multiplying the median household income by the number of religiously affiliated adults in America, which was 77.2 percent of the population at the time of this analysis.
Further research indicates there may be a relationship between certain types of congregations closing and faltering economic viability in a community. A study of a midwestern urban community by Nancy Kinney (University of Missouri-St. Louis) and Todd Combs (Washington University) investigated nine variables that affect economic health in the communities where churches had closed.32 Kinney and Combs found a correlation between the closure of a congregation and the declining social and economic viability of a community, with even stronger correlations in cases where the congregation in question was geographically based, historically African American, or whose mission included increasing social capital in neighborhoods.
EFCA member organizations report a 2.2 percent increase in donations for 2015
In December 2016, the Evangelical Council for Financial Accountability (ECFA) released findings from its 2016 Annual State of Giving Report analyzing financial statements (primarily audits) for fiscal years 2014 and 2015 submitted by its 1,816 member organizations.33 ECFA is an independent accreditation agency that helps Christian ministries achieve standards of transparency.34 Members of ECFA span Protestant ministries, other Christian denominations, houses of worship, educational organizations, and other faith-related charities.35
The 2016 Annual State of Giving Report reveals that annual cash contributions to ECFA member organizations amounted to $12.5 billion in 2015, a 2.2 percent increase over 2014.36 Non-cash giving to ECFA member organizations totaled $3.5 billion, an increase of 7.5 percent over the previous year.
Smaller mid-sized religious organizations (those with annual revenues of $1–$5 million) fared the best in 2015, with a 6.5 percent increase in cash revenue.37 Only those smallest religious organizations (those with revenue under $1 million) experienced losses, with -1.1 percent
Giving USA Giving to Religion
Giving USA FoundationTM | Giving USA 2017 | 177

decline in cash revenue. The most sizeable giving increases occurred in the following charitable categories: short-term missions (25.2 percent), camps and conferences (21.2 percent), and alcohol/drug rehabilitation (13.1 percent).
Denominational giving trends
The number of Americans identifying themselves as religiously affiliated has dropped in recent years, according to several reports. This phenomenon of declining religious affiliation has been recorded across multiple generations, according to the Pew Research Center’s most recent Religious Landscape Study.38 As reported in previous editions of Giving USA, religious affiliation is linked to charitable religious giving.
In 2016, empty tomb, inc. released the 26th edition of The State of Church Giving Through 2014: Speaking
Truth to Power. The report found that membership in 11 mainline Protestant denominations represented 5 percent of the total American population in 2014, a 62 percent decline since 1968 when membership totaled 13.2 percent.39 By comparison, Roman Catholic membership stood at 35 percent of the population in 2014, a 23 percent decline since 1968.40 Membership in 15 Evangelical denominations represented 7 percent of the U.S. population in 2014, a decline of 9 percent in terms of population share since 1968.
Pew Research Center estimated that in 2013, 2.2 percent of U.S. adults identified as Jewish, including those identifying by religion (1.8 percent), those identifying as Jewish without religion (0.5 percent), and those with a “Jewish background” (1.0 percent).41 Pew Research Center predicts that the share of those identifying as Jewish by religion will fall from 1.8 percent to 1.4 percent by
178 | Giving USA FoundationTM | Giving USA 2017
Giving USA Giving to Religion

2050. In contrast, the Muslim population currently represents approximately 1.0 percent of the total American population, and that number is expected to double to 2.1 percent by 2050.42
The following sections detail denomi-national giving trends as reported by organizations in the United States.
Presbyterian Church USA (PCUSA)In 2015, the Presbyterian Church USA (PCUSA) reported that charitable giving totaled $2.08 billion.43 Although PCUSA membership declined almost 6.0 percent between 2014 and 2015, total undesignated giving to PCUSA increased 0.5 percent from $1.74 billion in 2014 to $1.75 billion in 2015. Similarly, total giving to funds dedicated to capital and building improvements increased from $214 million in 2014 to $225 million in 2015. The Board of Pensions of PCUSA and the Presbyterian Foundation each received $1.0 million as part of Lilly Endowment Inc.’s National Initiative to Address Economic Challenges Facing Pastoral Leaders.44
Presbyterian Church in America (PCA)Confirming their fourth straight year of increased giving, the Presbyterian Church in America (PCA) reported total contributions of $784 million in 2015, a 15.1 percent increase over total giving in 2011 and a 2.7 percent increase over total giving in 2014.45 Though some
categories faltered in 2011–2015, from 2014 to 2015, the PCA experienced gains in giving for assembly causes, Presbyterian causes, congregational benevolences, and the Congregational Building Fund. Per capita giving stands at $2,724, and per capita benevolence giving stands at $461. The number of congregations within the PCA increased by 2.3 percent between 2014 and 2015, and membership increased by 3.3 percent over the same period.
Baptist denominations and congregationsIn 2014, American Baptist Churches USA reported total giving at $253 million, a 13 percent decline when compared to 2013 ($291 million).46 Membership in American Baptist Churches USA also declined 10.7 percent from 2013 to 2014. The Southern Baptist Convention additionally reported declines in 2014 as compared to the previous year. In 2014, the Southern Baptist Convention received total contributions of $9.7 billion, a 13.5 percent drop compared to 2013 ($11.2 billion). Over the same period, membership in the Southern Baptist Convention declined 14.8 percent.
The Church of the NazareneThe Church of the Nazarene reported total church income of $730.4 million in 2016 for congregations in the United States.47 Churches in the U.S. and Canada realized an income increase of approximately 1.4 percent
Giving USA Giving to Religion
Giving USA FoundationTM | Giving USA 2017 | 179

over 2015, however membership declined 1.4 percent in the same time period. Per capita income for these congregations was $1,163. In terms of fund disbursement, U.S. and Canadian churches gave $67.0 million to Global Mission, $31.3 million to District Mission, and $14.0 million to educational institutions in 2016.
The United Methodist ChurchIn 2015, The United Methodist Church (UMC) reported congregational income of $5.4 billion.48 Almost 90 percent of UMC congregations receive $75,000 or more in annual income. In 2016, UMC held its General Conference, the denomination’s legislative body meeting occurring once every four years.49 The General Conference passed a $604 million budget for the global denominational body, slightly higher than both the baseline $599 million budget proposed by the United Methodist General Council on Finance and Administration and the Connectional Table, and the $603.1 million budget approved in 2012.
The most notable financial campaign for the UMC in 2016 was the conclusion of a $93 million fundraising initiative to build a new sanctuary and make other renovations at The United Methodist Church of the Resurrection in Leawood, Kansas, which launched in 2014.50 Members of the congregation contributed $64 million toward the overall construction costs. Although
the considerable cost of the project has attracted criticism, church officials estimate that the congregation will give $1.2 billion to outreach ministries over the next 50 years.
In 2016, The Duke Endowment granted $10.3 million to 26 United Methodist congregations and affiliated organizations in North Carolina.51 The grants will increase congregational vitality and outreach in rural communities. Of the total, $1.8 million was awarded to the Rural Advancement Foundation International to increase congregational food ministry programs. Over $1 million funded individual churches and congregations that target community home repair, multicultural outreach, and service to schools.
An additional large gift was made in 2016 by singer Taylor Swift, who made a substantial donation to the Louisiana Annual Conference of the UMC to help victims of flooding as part of a million-dollar contribution to the affected area.52
Lutheran denominationsThe Evangelical Lutheran Church in America (ELCA) received $21.9 million in charitable contributions and bequests for the fiscal year ending January 31, 2017.53 The ELCA received $45.2 million in mission support in 2016, a 4.2 percent decline over the previous year.54 Membership figures are not available for 2016; however, in 2015, membership totaled 3.67 million, a decline of 2.6
180 | Giving USA FoundationTM | Giving USA 2017
Giving USA Giving to Religion

percent from 2014.55 In 2015, 26.5 percent of ELCA’s baptized members attended worship, down from 30.3 percent in 1995.
In 2015, The Lutheran Church-Missouri Synod (LCMS) reported that baptized members totaled 2.1 million, a 1.8 percent drop from 2014.56 Despite the membership drop, LCMS received $1.41 billion in contributions in 2015, a 4.9 percent increase over the previous year. The church reported membership of 6,101 congregations in 2015, almost level with the year prior.
The Episcopal ChurchIn 2015, the Episcopal Church reported $1.31 billion in plate and pledge donations.57 The average pledge in 2015 was $2,707. Between 2010 and 2015, 24 percent of Episcopal congregations grew in membership by 10 percent or more, while 40 percent of Episcopal congregations saw membership decline by 10 percent or more over the same period. In 2015, average Sunday worship attendance saw a 3.6 percent drop from the previous year.
In 2014, The Domestic and Foreign Missionary Society of the Episcopal Church received slightly more than $32 million in contributions in 2014 and almost $37 million in 2015.58 Over the next three years, the Episcopal Church’s budget anticipates that 62 percent of its $125.1 million budget will be received in the form of gifts from local dioceses.59
Catholic givingThe Catholic Church is facing financial challenges due to declining attendance rates, low levels of giving by parishioners, rising costs, and settlement expenses, according to Charles Zech of the Villanova University Center for Church Management and Business Ethics.60 According to Zech, Catholic households donate between 1.2–2.2 percent of their salaries to the church; by comparison, Protestant household rates of giving are doubled.61 Meanwhile, many dioceses face rising capital costs, as rapid congregation growth in the southern and western regions of the country have increased demand for new parishes and schools, while aging buildings in northeastern and midwestern inner cities require renovation.
Giving USA Giving to Religion
Giving USA FoundationTM | Giving USA 2017 | 181

In October 2016, the Archdiocese of Chicago successfully completed a three-year capital campaign, raising $368 million against a goal of $350 million.62 The campaign, titled “To Teach Who Christ Is,” received major gifts of $140 million (against a goal of $100 million), most of which were personally solicited by the cardinal and archbishop of the archdiocese. Each parish participating in the campaign keeps 60 percent of funds raised toward its parish goal, and 100 percent of excess funds raised. The proceeds from this campaign will be used for scholarship funds and facility renovation. According to Chicago Catholic, the To Teach Who Christ Is campaign was the largest capital campaign conducted by a Catholic diocese.
Nondenominational and Evangelical giving
The empty tomb, inc.’s The State of Church Giving through 2014: Speaking Truth to Power report reveals that giving as a share of income remained higher among Evangelical Protestant denominations than mainline Protestant denominations between 1968 and 2014.65 However, over the same time period, the rate of decline in giving among Evangelical communities was higher (average annual percentage change in total contributions as a percentage of income through 2014 of -0.87 percent) than mainline Protestant denominations, which have maintained a more consistent pattern of giving (average annual percentage change in total contributions as a percentage of income through 2014 of -0.32 percent). Table 1 compares total contributions as a percentage of income for both populations.
182 | Giving USA FoundationTM | Giving USA 2017
Giving USA Giving to Religion
Good to KnowReligious organizations looking toward once-in-a-generation capital campaigns should take time to understand the importance that large gifts play in the success of these fundraising initiatives.63
Major donors are seeking to advance the educational, pastoral, and charitable missions of their affiliated faith-based organization in a transformational way—either by taking advantage of promising opportunities or addressing pressing needs. The Archdiocese of Chicago’s To Teach Who Christ Is campaign surpassed their goal of major gift fundraising, and leaders of the diocese were personally involved with stewarding these gifts.64 Religious organizations should have a fundraising goal for major gifts, and practice good donor stewardship with potential and pledged donors.

Since 1968, membership in Evangelical communities has increased in number, while membership in mainline Protestant denominations has dropped.67
Jewishgiving
Although data for giving to and from Jewish federations are available, relatively little national research exists on the giving practices of American Jews to their local synagogues. The last nationally representative study was released in 2014, and surveyed nearly 3,000 American Jews on their philanthropic behavior.68 Giving USA has reported on these findings in previous editions.
An examination of the Indiana University Lilly Family School of Philanthropy’s Philanthropy Panel Study (PPS) finds that Jewish households are overall more generous ($2,526 total average annual giving) than households of other
religious affiliations ($1,749 Protestant; $1,178 other; $1,142 Catholic; total average annual giving).69 Christopher J. Einolf (DePaul University) theorizes that the strength of Jewish philanthropy may result from a combination of factors, including historical marginality that forced Jewish communities to start their own philanthropic organizations to support the community instead of turning to government programs.70 However, according to the PPS, only 35 percent of Jewish giving is considered religious, while 49 percent of Catholic giving and 67 percent of Protestant giving is considered religious.
It is possible that many Jewish households direct their charitable donations to non-congregational institutions such as Jewish federations, which do not meet Giving USA’s definition of religious giving.71 According to findings from the PPS, Jewish
Giving USA Giving to Religion
Giving USA FoundationTM | Giving USA 2017 | 183
Table 1 Total contributions from the National Association of Evangelicals and National Council of Churches66 (total giving as a percentage of income)
Year National Association of Evangelicals
National Council of Churches
1968 5.98% 3.21%
1985 4.71% 2.84%
2014 3.20% 2.54%
Data: John L. Ronsvalle and Sylvia Ronsvalle, The State of Church Giving Through 2016: Speaking Truth to Power, empty tomb, inc., September 2016, www.emptytomb.org

households give $888 on average to religious purposes. When examining only those households who give religiously, religious giving increases to $2,291.72
New reports on American Jewish communities Annually, the Berman Jewish DataBank (DataBank), sponsored by The Jewish Federations of North America, releases quantitative findings on assorted topics concerning North American Jewish communities.73 Location-specific federations, such as the Jewish Federation of St. Louis or the Jewish Federation of Nashville, support studies on the Jewish communities of metropolitan areas across the United States.74 These studies frequently include questions regarding Jewish philanthropy. In 2016 and 2017, three studies were released surveying the Jewish communities of Boston, Houston, and Broward County, Florida.75
Released in 2016, the Greater Boston Jewish Community Study: 2015 utilized a multi-mode survey with a sample size of approximately 6,000 Jewish households.76 According to the report, 38 percent of Jewish adults surveyed did some volunteer activity in the previous month leading up to the survey in 2015, and 32 percent who volunteered did so exclusively or mostly for Jewish organizations. The most frequent forms of volunteering were serving on a nonprofit board or committee
and assisting with fundraising or programming.
Sponsored by the Jewish Federation of Greater Houston, The 2016 Jewish Federation of Greater Houston Population Study: A Portrait of the Houston Jewish Community was released in January 2017 and offers results of 1,200 random telephone interviews with Jewish households in 2016.77 Almost all (92 percent) of Jewish households in Houston indicated they donated to at least one charity, with 63 percent donating to some type of Jewish charity (this number included Jewish federations). When asked about motivations to donate to Jewish-related organizations, helping Jewish people locally with food and shelter, providing Jewish child education, and providing services for Jewish elderly were among the top-ranked reasons given by respondents.
Broward County, Florida is the eighth largest American Jewish community in the U.S. and the largest Jewish community in Florida.78 The Jewish Federation of Broward County sponsored The 2016 Jewish Federation of Broward County Population Study: A Portrait of the Broward Jewish Community surveying 1,201 Jewish households in April–June 2016. According to the study’s findings, 72 percent of surveyed households reported giving to non-Jewish charities in the past year, while 61 percent indicated they had given to a Jewish charity
184 | Giving USA FoundationTM | Giving USA 2017
Giving USA Giving to Religion
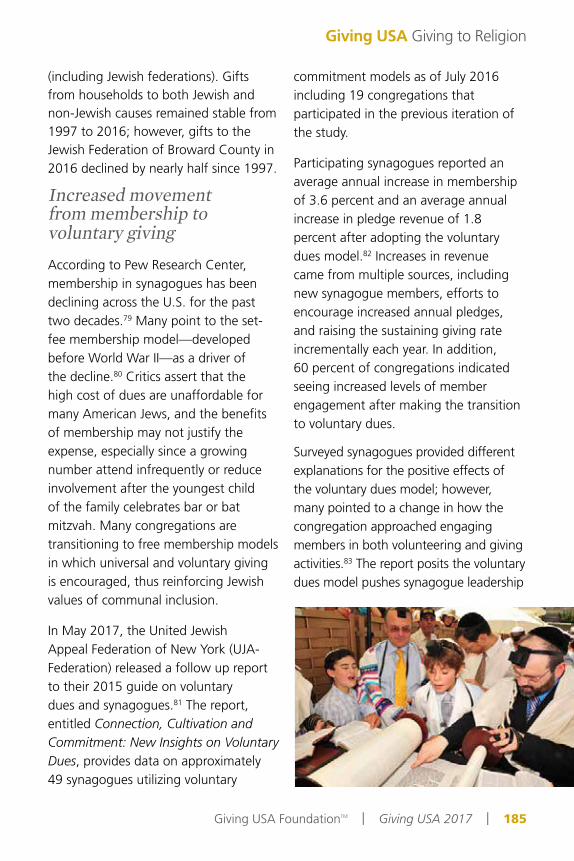
(including Jewish federations). Gifts from households to both Jewish and non-Jewish causes remained stable from 1997 to 2016; however, gifts to the Jewish Federation of Broward County in 2016 declined by nearly half since 1997.
Increased movement from membership to voluntary givingAccording to Pew Research Center, membership in synagogues has been declining across the U.S. for the past two decades.79 Many point to the set-fee membership model—developed before World War II—as a driver of the decline.80 Critics assert that the high cost of dues are unaffordable for many American Jews, and the benefits of membership may not justify the expense, especially since a growing number attend infrequently or reduce involvement after the youngest child of the family celebrates bar or bat mitzvah. Many congregations are transitioning to free membership models in which universal and voluntary giving is encouraged, thus reinforcing Jewish values of communal inclusion.
In May 2017, the United Jewish Appeal Federation of New York (UJA-Federation) released a follow up report to their 2015 guide on voluntary dues and synagogues.81 The report, entitled Connection, Cultivation and Commitment: New Insights on Voluntary Dues, provides data on approximately 49 synagogues utilizing voluntary
commitment models as of July 2016 including 19 congregations that participated in the previous iteration of the study.
Participating synagogues reported an average annual increase in membership of 3.6 percent and an average annual increase in pledge revenue of 1.8 percent after adopting the voluntary dues model.82 Increases in revenue came from multiple sources, including new synagogue members, efforts to encourage increased annual pledges, and raising the sustaining giving rate incrementally each year. In addition, 60 percent of congregations indicated seeing increased levels of member engagement after making the transition to voluntary dues.
Surveyed synagogues provided different explanations for the positive effects of the voluntary dues model; however, many pointed to a change in how the congregation approached engaging members in both volunteering and giving activities.83 The report posits the voluntary dues model pushes synagogue leadership
Giving USA Giving to Religion
Giving USA FoundationTM | Giving USA 2017 | 185

to engage and communicate more deeply with their members, thus broadening the interaction congregants experience with their religious community.
Muslim giving: new report maps trends in Muslim American philanthropy
Muslim Americans are increasingly turning to philanthropy as a vehicle to foster a sense of identity, while also creating connections within the community. Research by Sabithulla Khan (Georgetown University) examined giving data from 2002–2012 and found that Muslim Americans increased giving to secular causes as compared to the American population, on average.84
Khan notes the increased secular giving may be a reaction to increased scrutiny of Muslim charities in the U.S. after the 9/11 terrorist attacks.85 According to Khan’s analysis, increased focus on Muslim religious identity has enticed many Muslims to focus their giving on local community causes and to form a Muslim “American identity.”86
Many donations from Muslim Americans have supported humanitarian and
emergency relief efforts, though the report suggested a trend toward giving to long-term social service support both domestically and internationally.87 Additionally, the data does not indicate that Muslim Americans reduced their giving to Muslim organizations in the years after 9/11. Analysis from 2002–2012 indicated that giving to the three largest Muslim American organizations increased during that timeframe.
The incidence of giving to international causes is higher among Muslims than the national average.88 Khan found that 9 percent of Muslim Americans gave to international causes, whereas only about 4 percent of the entire American population did so, on average.89
While Muslim Americans gave less to religious causes as compared to the American population on average ($492 versus $793), this group has successfully applied philanthropy toward a growing number of religious capital projects.90 Khan references a study by the Council on American-Islamic Relations (CAIR), which notes “substantial growth in the number of mosques in the U.S.,” increasing 74 percent from 2000 to reach
186 | Giving USA FoundationTM | Giving USA 2017
Giving USA Giving to Religion
__________________________________________________________________________________
Muslim Americans are increasingly turning to philanthropy as a vehicle to foster a sense of identity, while also creating connections within the community.
__________________________________________________________________________________

2,106 mosques in 2011.91 Additionally, Khan notes an increasing trend toward building community centers, Islamic schools, and others institutions.92
Support for Muslim organizations grew after November 2016 electionMuslim Advocates, a national organization that provides legal, financial, and security education resources to mosque leaders, reported an increase in donations from new donors following the November 2016 presidential election.93 Executive Director Farhana Khera noted that most of the $10,000 received in the week following the election came from non-Muslim donors. The last time the organization noted such a large surge in donations was in December 2015, when it received $20,000 in 24 hours after then-Republican presidential candidate Donald Trump advocated for a ban on Muslims entering the U.S.
Center for American Muslim Philanthropy symposium and journal launchedIn September, the Center on American Muslim Philanthropy (CAMP) held its first annual Symposium on Muslim Philanthropy and Civil Society at Indiana University-Purdue University Indianapolis.94 The center was formed to support and promote scholarly research, strategic philanthropy, and professional development in the field of Muslim philanthropy.95
The symposium, titled “Philanthropy and Civic Engagement: Imagining Faith through Practice,” was offered in partnership with the Lake Institute on Faith and Giving at the Indiana University Lilly Family School of Philanthropy.96 Presented research will be published in the inaugural Journal on Muslim Philanthropy and Civil Society in 2017.
Religious organizations on the 2016 Philanthropy 400 realize modest contribution increases
The Chronicle of Philanthropy annually compiles a list of the top 400 public charities and private foundations.97 The Philanthropy 400 ranks charities according to the level of private donations received in the previous fiscal year. Private donations include gifts from all private sources—individuals, corporations, and foundations. Gifts of cash, shares of stock, in-kind donations, real estate, and valuables are included. To determine the rankings, the Chronicle compiles information from IRS Forms 990, annual reports, financial statements, and a questionnaire.
Philanthropy 400 data issued in 2016 for giving in the fiscal year ending in 2015 included 12 religious organizations, with no change in representation from the previous year.98 Note that because
Giving USA Giving to Religion
Giving USA FoundationTM | Giving USA 2017 | 187

188 | Giving USA FoundationTM | Giving USA 2017
religious organizations do not have to report revenue to the IRS, those organizations making the top 400 list were those that self-reported. There are likely many other religious organizations that would qualify for the Philanthropy 400. The top five religious organizations on the list with the greatest amount in private support are:
Ranking 43rd: Cru, Orlando, FL, with $513.68 million in private contributions, an increase of 3.6 percent from the previous year;
Ranking 104th: Young Life, Colorado Springs, CO, with $243.26 million in private contributions, an increase of 8.9 percent;
Ranking 144th: Christian Broadcasting
Network, Virginia Beach, VA, with $183.14 million in private contributions, an increase of 5.9 percent;
Ranking 145th: Wycliffe Bible Translators, Orlando, FL, with $182.39 million in private contributions, an increase of 2.4 percent; and
Ranking 168th: Educational Media Foundation, Rocklin, CA with $162.48 million in private contributions, an increase of 6.8 percent.
These same top five religious organizations appeared as the top five in the past three years, although Wycliffe Bible Translators and the Christian Broadcasting Network traded positions in 2015.99
Chapter authored by Rev. Thad S. Austin, doctoral student, the William and Edie Enright Fellow at the Indiana University Lilly Family School of Philanthropy, and Graduate Assistant at the Lake Institute on Faith & Giving; and Heather A. O’Connor, CFRE, doctoral student at the Indiana University Lilly Family School of Philanthropy, with additional material written by staff at the Indiana University Lilly Family School of Philanthropy.
Good to Know sections and Practitioner Highlights written by Giving USA Editorial Review Board members Richard J. Dunham, Thomas Kissane, Robert Evans, and staff at the Indiana University Lilly Family School of Philanthropy.

References1 All data in this section are reported as estimates, which
are subject to revision. To provide the most accurate estimates for charitable giving, as new data become available, Giving USA revises its estimates for at least the last two years. See more about how Giving USA calculates charitable giving by sources and uses in the “Brief summary of methods used” section of this report.
2 Practitioner highlight authored by Editorial Review Board member Thomas Kissane.
3 Practitioner highlight authored by Editorial Review Board member Richard J. Dunham.
4 Practitioner highlight authored by Editorial Review Board member Thomas Kissane.
5 “About Us,” The Salvation Army International, retrieved April 2017, www.salvationarmy.org/ihq/about, para. 1
6 “National Taxonomy of Exempt Entities,” National Center for Charitable Statistics, retrieved April 2017, www.nccs.urban.org
7 “Mission and Vision,” Lutheran Theological Seminary at Philadelphia, retrieved April 2017, www.ltsp.edu
8 Melanie A. McKitrick, et al., Connected to Give: Faith Communities, Jumpstart Labs, 2014, http://connectedtogive.org/wp-content/uploads/2014/11/ConnectedToGive_FaithCommunities_Jumpstart2014_v1.3.pdf, pg. 6
9 This information is in current dollars. 10 The Nonprofit Research Collaborative (NRC) annually
conducts surveys on fundraising trends across the nonprofit sector. In 2017, this collaboration included the Giving USA Foundation, the Association of Fundraising Professionals, CFRE International, the Association of Philanthropic Counsel, the National Association of Charitable Gift Planners, and Top Nonprofits. In early 2017, the NRC launched a survey to assess fundraising trends for the entire 2016 calendar year. The survey asked nonprofit leaders of public charities and foundations to report on changes in charitable revenue received and changes in the number of donors by specific donor type, among other questions. Data in this section come from the Winter 2017 Nonprofit Fundraising Survey report from the Nonprofit Research Collaborative, May 2017, www.npresearch.org. A convenience sample of 1,019 respondents, 144 of them Canadian, constitutes the survey results.
11 This information was provided to Giving USA directly from Blackbaud in May 2017. The Blackbaud Index of Charitable Giving assesses changes in total charitable giving from year to year using a three-month rolling median of the charitable revenue reported by a selected sample of U.S. nonprofits. This information reflects data on total charitable giving reported by 6,857 organizations across the nonprofit sector, representing total charitable revenue of $23.6 billion in 2016. Online giving data are reported by 4,958 nonprofits with charitable support amounting to $2.7 billion in 2016. Month-by-month Blackbaud Index data on both online and total giving are available at www.blackbaud.com/nonprofit-resources/
blackbaud-index. Note that Blackbaud data are constantly being updated; therefore, figures published in Giving USA may vary from current figures.
12 Year-over-year monthly giving data are from the Blackbaud Index, May 2017, https://www.blackbaud.com/nonprofit-resources/blackbaud-index
13 Same as note 11.14 Same as note 12.15 Luminate Online Benchmark Report 2016, Blackbaud,
2017, www.blackbaud.com. Data from this report cover the fiscal year July 1, 2015 to June 30, 2016 for a sample of 631 nonprofit organizations that use Luminate Online cloud-based software by Blackbaud.
16 Same as note 15.17 Brian Kluth, 2016 State of the Plate Report, Tithe.ly, 2016,
http://get.tithe.ly/wp-content/uploads/2016/11/State-of-the-Plate-2016-Church-Giving-Research.pdf
18 Same as note 17.19 Protestant Pastors Views on the Economy, LifeWay
Research, 2016, http://lifewayresearch.com/wp-content/uploads/2016/03/Economy-January-2016.pdf
20 Same as note 19.21 “About Us,” The Yearbook of American and
Canadian Churches, retrieved April 2017, www.yearbookofchurches.org/about; “Association of Statisticians of American Religious Bodies Projects,” Association of Statisticians of American Religious Bodies, retrieved April 2017, www.asarb.org
22 “FAQ,” The Yearbook of American and Canadian Churches, retrieved April 2017, www.yearbookofchurches.org/faq
23 “About,” #GivingTuesday, retrieved May 2017, www.givingtuesday.org/about. In 2013, 40 percent of all online donations made through #GivingTuesday were directed toward faith-based organizations, and in 2014, that number was 21 percent, according to a report by Blackbaud. See #GivingTuesday Trends: A Closer Look at the Online Fundraising Impact in the United States, Blackbaud, 2015, https://www.blackbaud.com/files/resources/downloads/givingtuesday-trends.pdf
24 Evans Consulting Group, “#GivingTuesday 2016: Better than Ever, but is a Plateau in Sight?,” eJewish Philanthropy, December 8, 2016, www.ejewishphilanthropy.com; “#BeTheSpark,” Charidy, retrieved April 2017, www.charidy.com/bethespark
25 Elliott Wright, “Global Ministries Celebrates Giving Tuesday Outcome,” Global Ministries, The United Methodist Church, November 30, 2016, www.umcmission.org
26 Good to Know section authored by Editorial Review Board member Robert Evans.
27 “Diocese of Cleveland Raises $414,199 on Giving Tuesday,” Catholic Community Foundation, November 30, 2016, www.catholiccommunity.org
28 Brian Grim, “Summary: The Socio-Economic Contributions of Religion to American Society: An Empirical Analysis,” FaithCounts, 2016, http://faithcounts.com/wp-content/
Giving USA Giving to Religion
Giving USA FoundationTM | Giving USA 2017 | 189
190 | Giving USA FoundationTM | Giving USA 2017
Giving USA Giving to Religion
uploads/Summary-Sheet.pdf29 The Economic Halo Effect of Historic Sacred Places,”
Partners for Sacred Places, 2016, http://www.sacredplaces.org/uploads/files/16879092466251061-economic-halo-effect-of-historic-sacred-places.pdf
30 Brian Grim and Melissa E. Grim, “The Socio-Economic Contributions of Religion to American Society: An Empirical Analysis,” Interdisciplinary Journal of Research on Religion, 2016, 12(3), 1-31, http://www.religjournal.com/pdf/ijrr12003.pdf. For a critique of Grim’s methodology, see: Michael Schulson, “Holey Holey Holey: The Problem with a New Study Valuing Religion at $1.2 Trillion Per Year,” Religion Dispatches, September 28, 2016, www.religiondispatches.org
31 Same as note 30, pg. 1432 Nancy T. Kinney and Todd Bryan Combs, “Changes in
Religious Ecology and Socioeconomic Correlates for Neighborhoods in a Metropolitan Region,” Journal of Urban Affairs, 2016, 38(3)
33 2016 ECFA Annual State of Giving Report, Evangelical Council for Financial Accountability, 2016, http://www.ecfa.org/Content/2016-State-of-Giving. Note that ECFA categories vary from Giving USA’s use of the NTEE coding system. Direct comparisons between Giving USA and ECFA data cannot be made.
34 “Seven Standards of Responsible Stewardship,” Evangelical Council for Financial Accountability, retrieved May 2014, http://www.ecfa.org/Content/Standards
35 Note that ECFA categories vary from Giving USA’s use of the NTEE coding system. Direct comparisons between Giving USA and ECFA data cannot be made.
36 Same as note 33.37 Same as note 33.38 Michael Lipka, “A closer look at America’s rapidly growing
religious ‘nones,’” Pew Research Center, May 13, 2015, www.pewresearch.org; America’s Changing Religious Landscape, Pew Research Center, May 12, 2015, www.pewforum.org/2015/05/12/americas-changing-religious-landscape
39 John L. Ronsvalle and Sylvia Ronsvalle, The State of Church Giving Through 2014: Speaking Truth to Power, empty tomb, inc., September 2016, www.emptytomb.org
40 Same as note 39.41 A Portrait of Jewish Americans, Pew Research Center,
2013, http://www.pewforum.org/files/2013/10/jewish-american-full-report-for-web.pdf, pg. 23
42 Besheer Mohamed, “A New Estimate of the U.S. Muslim Population,” Pew Research Center, January 6, 2016, www.pewresearch.org
43 Office of the General Assembly, “Summaries of Statistics—Comparative Summaries,” Presbyterian Church USA, retrieved April 2017, http://www.pcusa.org/site_media/media/uploads/oga/pdf/2015_comparative_summaries_.pdf; “Summaries of Statistics—Comparative Summaries,” Presbyterian Church USA, retrieved April 2017, http://www.pcusa.org/site_media/media/uploads/oga/pdf/2015_comparative_summaries_.pdf. Charitable giving is defined by PCUSA as the total of contributions, capital and giving funds, and bequests.
44 Rob Bullock and Susan Reimann, “Two Agencies of Presbyterian Church (U.S.A.) Receive $1 Million Grants
from Lilly Endowment,” Presbyterian Foundation, February 8, 2016, www.presbyterianfoundation.org
45 “Presbyterian Church in America Statistics Five-Year Summary,” Presbyterian Church in America, retrieved April 2017, http://www.pcaac.org/wp-content/uploads/2016/05/5-Year-Summary-2015.jpg
46 Same as note 39. Total giving is calculated by combining “congregational finances” with “benevolences.”
47 “Church of the Nazarene Growth, 2006–2016: Annual Statistics from the General Secretary’s Reports,” Church of the Nazarene, 2017, http://www.nazarene.org/sites/default/files/docs/GenSec/Statistics/2016AnnualStatistical.pdf
48 “2015 Distribution Tables,” General Council on Finance and Administration, United Methodist Church, retrieved April 2017, www.umc.org/gcfa/data-services-statistics
49 Heather Hahn, “GC2016 Passes $604 Million General Church Budget,” The United Methodist Church News Service, May 20, 2016, www.umc.org
50 Rob Roberts, “Inside the Church of the Resurrection’s New Sanctuary [PHOTOS] - Kansas City Business Journal,” Kansas City Business Journal, December 16, 2016, www.bizjournals.com
51 “Duke Endowment Awards $10.3 Million for North Carolina Churches,” Philanthropy News Digest , September 12, 2016, www.philanthropynewsdigest.org
52 “Taylor Swift Donates to Louisiana Annual Conference,” Louisiana Conference of The United Methodist Church, September 26, 2016, www.la-umc.org
53 “2016 Operating Results Summary for the Twelve Months Ending January 31, 2017,” Evangelical Lutheran Church in America, retrieved April 2017, http://download.elca.org/ELCA%20Resource%20Repository/FY_2016_Report.pdf?_ga=1.39853035.815076360.1490403112
54 “Evangelical Lutheran Church in America 2016 Synods Detail Remittance Report as of 1/31/2017,” Evangelical Lutheran Church in America, retrieved April 2017, http://download.elca.org/ELCA%20Resource%20Repository/FY_2016_Mission_Support.pdf?_ga=1.244215884.815076360.1490403112
55 “Baptized Membership and Average Attendance, 1988–2015,” ELCA Office of the Presiding Bishop, retrieved February 2017, http://download.elca.org/ELCA%20Resource%20Repository/ELCA_Membership_1988_2010.pdf?_ga=1.38737002.815076360.1490403112
56 John W. Sias, “(Commentary) Annual Statistical Reporting: Beyond the Numbers,” Reporter, The Lutheran Church Missouri Synod, November 28, 2016, www.blogs.lcms.org
57 “Episcopal Domestic Fast Facts: 2015,” Office of Research, The Episcopal Church, retrieved April 2017, www.episcopalchurch.org/files/domestic_fast_facts_2015_.pdf
58 Grant Thornton, “Consolidated Financial Statements and Uniform Guidance Supplementary Information Together with Reports of Independent Certified Public Accountants,” The Domestic and Foreign Missionary Society of the Protestant Episcopal Church in the United States of America and Affiliates, June 23, 2016, www.episcopalchurch.org/files/dfms_12-31-15_14_omb_a-133_final_0.pdf
59 Mally Lloyd and Stephen Lane, The General Convention: Adopted Budget, The Episcopal Church, June 30, 2015,

www.episcopalchurch.org/files/documents/2016-18_gc_adopted_budget_book_modified_07272015_0.pdf
60 David Briggs, “Fewer Cheerful Givers: The Financial Crisis Facing U.S. Churches,” The Association of Religion Data Archives, November 6, 2015, www.blogs.thearda.com; Charles E. Zech, et al., Catholic Parishes of the 21st Century, 2017, Oxford: Oxford University Press
61 Charles E. Zech, et al., Catholic Parishes of the 21st Century, 2017, Oxford: Oxford University Press, pg. 77
62 Michelle Martin, “To Teach Who Christ Is Campaign Surpasses $350 Million Goal,” Chicago Catholic, October 21, 2016, www.chicagocatholic.com
63 Good to Know section authored by Editorial Review Board member Thomas Kissane.
64 Same as note 62.65 Same as note 39.66 Same as note 39.67 Same as note 39.68 Steven M. Cohen and J. Shawn Landres, “Connected
to Give Synagogues and Movements: Findings Form the National Study of American Jewish Giving” Jumpstart, 2014, http://connectedtogive.org/wp-content/uploads/2014/01/ConnectedToGive_SynagoguesMovements_Jumpstart2014_v1.pdf
69 Philanthropy Panel Study fielded in 2013, surveying giving in 2012
70 Christopher J. Einolf, “Cross-National Differences in Charitable Giving in the West and the World,” VOLUNTAS: International Journal of Voluntary and Nonprofit Organizations, 2016, 28 (2), 1–20
71 Giving to Jewish federations is included in the public-society benefit subsector for the purposes of Giving USA.
72 Same as note 69.73 “About the Berman Jewish DataBank,” Berman Jewish
DataBank, The Jewish Federations of North America, retrieved April 2017, www.jewishdatabank.org/About
74 Same as note 73; “U.S. Local Communities,” Berman Jewish DataBank, The Jewish Federations of North America, retrieved April 2017, www.jewishdatabank.org
75 “2015 Greater Boston Jewish Community Study,” Berman Jewish DataBank, The Jewish Federations of North America, retrieved April 2017, www.jewishdatabank.org; “2016 Broward County (FL) Jewish Community Study,” Berman Jewish DataBank, The Jewish Federations of North America, retrieved April 2017, www.jewishdatabank.org; Ira M Sheskin, The 2016 Jewish Federation of Greater Houston Population Study: A Portrait of the Houston Jewish Community, Jewish Federation of Greater Houston, 2017, http://www.jewishdatabank.org/Studies/downloadFile.cfm?FileID=3448
76 Janet Krasner Aronson, Matthew Boxer, Matthew A. Brookner, Charles Kadushin, Leonard Saxe, 2015 Greater Boston Jewish Community Study, Cohen Center for Modern Jewish Studies and Steinhardt Social Research Institute at Brandeis University and Combined Jewish Philanthropies, 2016, http://www.jewishdatabank.org/Studies/downloadFile.cfm?FileID=3571
77 Ira M. Sheskin, The 2016 Jewish Federation of Greater Houston Population Study: A Portrait of the Houston Jewish Community, Jewish Federation of Greater Houston, 2017, http://www.jewishdatabank.org/Studies/downloadFile.cfm?FileID=3448
78 Ira M. Sheskin, The 2016 Jewish Federation of Broward County Population Study: A Portrait of the Broward Jewish Community, Jewish Federation of Broward County, 2017, http://www.jewishdatabank.org/Studies/downloadFile.cfm?FileID=3432; “2016 Broward County (FL) Jewish Community Study,” Berman Jewish DataBank, The Jewish Federations of North America, retrieved April 2017, www.jewishdatabank.org
79 Luis Lugo, “A Portrait of Jewish Americans,” Pew Research Center, 2013, www.pewforum.org
80 Knopf Rabbi Michael, “What’s Driving Jews Away from Synagogues? Not Dues, but ‘Membership,’” Haaretz, May 26, 2016, www.haaretz.com
81 Connection, Cultivation, and Commitment: New Insights on Voluntary Dues, SYNERGY, UJA-Federation of New York, 2017, https://www.ujafedny.org/assets/787642
82 Same as note 81.83 Same as note 81. 84 Sabithulla Khan, “Mapping American Muslim Giving
between 2002-12-Major Trends, Challenges and Opportunities,” Journal of Social Sciences, 2017, 13(1), 28-39
85 Same as note 84.86 Same as note 84, pg. 987 Same as note 84.88 “Muslim Americans: No Signs of Growth in Alienation or
Support for Extremism,” Pew Research Center’s Religion & Public Life Project, Pew Research Center, August 30, 2011, www.pewforum.org
89 Same as note 84.90 Same as note 84.91 Same as note 84, pg. 29; Ihsan Bagby, The American
Mosque 2011: Basic Characteristics of the American Mosque; Attitudes of Mosque Leaders, Council on American-Islamic Relations, Islamic Society of North America, and Islamic Circle of North America, 2011, https://www.cair.com/images/pdf/The-American-Mosque-2011-part-1.pdf
92 Sabithulla Khan, interview by Heather O’Connor, March 30, 2017.
93 Timothy Sandoval, “Nonprofits See Unprecedented Support Following Trump’s Win,” The Chronicle of Philanthropy, November 15, 2016, www.philanthropy.com
94 “Symposium on Muslim Philanthropy,” Center on American Muslim Philanthropy, retrieved April 2017, www.usmuslimphilanthropy.org
95 “About Us,” Center on American Muslim Philanthropy, retrieved April 2017, www.usmuslimphilanthropy.org/about-us
96 Same as note 94.97 Peter Olsen-Phillips, “How the 2016 Philanthropy 400 Was
Compiled,” The Chronicle of Philanthropy, October 27, 2016, www.philanthropy.com
98 The Chronicle of Philanthropy does not use the NTEE coding system for categorizing nonprofit organizations as does Giving USA; therefore, listings here for the Chronicle may vary from how Giving USA categorizes organizations. “The 2016 Philanthropy 400,” The Chronicle of Philanthropy, October 27, 2016, www.philanthropy.com
99 “The 2016 Philanthropy 400,” The Chronicle of Philanthropy, October 27, 2016, www.philanthropy.com
Giving USA Giving to Religion
Giving USA FoundationTM | Giving USA 2017 | 191

192 | Giving USA FoundationTM | Giving USA 2017
Giving USA Giving to Religion

Giving to the education subsector amounted to 15 percent of total giving in 2016.1
Contributions to education organizations increased 3.6 percent between 2015 and 2016, to $59.77 billion. Adjusted for inflation, giving to education organizations increased 2.3 percent.
The total amount contributed to education in 2016 reached its highest inflation-adjusted value ever.
Giving USA FoundationTM | Giving USA 2017 | 193
10 | Giving toEducation

Trends in giving to education in 2016
Giving to education marked its seventh consecutive year of growth in 2016, at an average rate of 8.2 percent per year.5 In the last five-year period (2012 to 2016), giving to this subsector experienced an average annual rate of growth of 6.9 percent—making it the fourth-fastest growing subsector out of nine. Giving to education also outpaced the five-year average rate of growth in total giving of 5.6 percent.
Several reports issued in 2017 note mixed trends in giving to education
The information provided in this chapter derives from a
number of sources, including publicly available reports, news stories, and websites from the most recent year. This chapter is meant to provide context for the giving trends reported in this edition of Giving USA and to illustrate some of the practical implications of the data. It is not intended to be a comprehensive survey of the subsector, but rather a collection of examples from the field.
194 | Giving USA FoundationTM | Giving USA 2017
Giving USA Giving to Education
Practitioner Highlights With total contributions to education reaching its highest
inflation-adjusted level ever, there is a positive climate for raising more funds to support education. However, much of this growth has been driven by the continuing trend of multi-million-dollar gifts, underlying the continued importance of donor stewardship.2
Despite research that shows younger donors consider education as a top social issue, this concern is not translating into financial support of their alma maters. Giving days and crowdfunding have helped engage more young alumni as donors.3
According to the Council for Advancement and Support of Education’s (CASE) Fundraising Index (CFI), giving to community colleges increased at a higher rate than did giving to other education institutions in 2016. This growth may be fueled by the development of more sophisticated fundraising and outreach initiatives at community colleges.4

organizations in 2016, specifically for higher education. The results of these reports are provided throughout the rest of this opening narrative and chapter. Different methodological and sampling approaches account for the differences seen between these sources and Giving USA data. Some highlights from 2016 on giving to this subsector include:
Responding institutions of higher education to the Council for Aid to Education’s (CAE) annual Voluntary Support of Education (VSE) survey reported minor gains in received contributions—1.7 percent between fiscal years 2015 and 2016.6 Though gifts from alumni and non-alumni individuals were strong in 2015, contributions from these sources declined in 2016, at -8.5 percent and -6.0 percent, respectively, while gifts from corporations and foundations rose. Corporate support grew 14.8 percent, and gifts from foundations grew 7.3 percent. Funding for current operations stayed level as a proportion of total giving, as did giving for student financial aid.
According to the members of the Council for Advancement and Support of Education’s (CASE) Fundraising Index (CFI), fundraising increased by 4.5 percent for reporting education institutions in 2016.7 Community colleges showed the most positive fundraising results, followed by public higher education institutions. Private
institutions of higher education and pre-collegiate independent schools showed slower growth.
For U.S.-based higher education institutions, in particular, scores of billion-dollar campaigns continued in 2016. Several campaigns met or exceeded their fundraising goals in 2016, while other institutions raised their goals as a result of sustained and strong engagement of donors of all types.
In spring 2017, Blackbaud reported that among its sample of over 6,800 nonprofits, giving to institutions of higher education realized a decline of 2.2 percent between 2015 and 2016.8 These organizations realized the greatest year-over-year monthly increases in overall charitable revenue in the three-month periods ending in
Giving USA Giving to Education
Giving USA FoundationTM | Giving USA 2017 | 195

October (4.2 percent) and November (7.9 percent), while giving declined in the three-month period ending in July (-1.4 percent).9
� Blackbaud reported a strong increase of 13.0 percent for giving to K–12 organizations between 2015 and 2016.10 K–12 organizations realized the greatest year-over-year monthly increases in overall charitable revenue in the three-month period ending in April (6.7 percent), while giving leveled out in May (no change over the previous year) and dropped in July (-3.8 percent).11
To provide additional context for giving to education in 2016 and in recent years, the following sections provide detail on recent trends, related campaigns, and news for this subsector.
Online giving to education posts healthy growth in 2016
Three different reports noted stronger results for giving to education organizations in 2016 via online methods. While different methodological and sampling approaches account for the differences seen between these sources and Giving USA data, these sources highlight trends seen by specific types of education organizations.
In 2016, both higher education and K–12 organizations analyzed by Blackbaud experienced strong growth in online giving (13.2 percent and 9.8 percent, respectively).12 Higher education organizations realized the greatest year-over-year monthly increases in online charitable revenue in the three-
196 | Giving USA FoundationTM | Giving USA 2017
Giving USA Giving to Education

month period ending in November (23.3 percent), while growth slowed slightly in the three-month periods ending in July (9.9 percent) and August (10.0 percent).13 K–12 organizations realized the greatest year-over-year monthly increases in online charitable revenue in the three-month period ending in November (17.1 percent), while growth in giving to these organizations reached its lowest point in July (7.1 percent).
According to Blackbaud’s Luminate Online Benchmark Report 2016, which included data from 631 Luminate Online customers with at least three years of consecutive usage, giving to higher education via online channels dropped 6 percent in the previous year.14 The report also revealed that higher education’s revenue from first-time online donors as a percent of total dollars raised dropped 5 percent to 36 percent, while repeat online giving as a percent of total dollars raised increased 4 percent to 64 percent.
In a different study, the Benchmarks 2017 report by M+R and NTEN found that while the number of online gifts received by a sample of education organizations increased by 33 percent from 2015 to 2016, the size of those gifts dropped by 8.5 percent.15 Fewer people—7.8 percent fewer—visited sites operated by these education organizations, and sampled education organizations tied with civil rights organizations for the lowest website revenue per visitor at $0.46.
Fundraising results from 2015 to 2016 stayed constant
Compared to all other sectors, education organizations responding to the Nonprofit Research Collaborative’s (NRC) Winter 2017 Nonprofit Fundraising Survey reflected trends from other studies in reporting changes in charitable contributions from 2015 to 2016.16 Over half (59 percent) of sampled higher education organizations reported an increase in charitable donations, compared to 64 percent of sampled K–12 organizations. These percentages are constant with, if slightly lower than, the 64 percent of all surveyed education organizations that reported an increase in contributions in the prior year.
Giving USA Giving to Education
Giving USA FoundationTM | Giving USA 2017 | 197

Council for Aid to Education reports a 1.7 percent increase in charitable revenue to institutions of higher education from 2015 to 2016
Contributions to higher educational institutions reached $41 billion in 2016, a 1.7 percent increase from last year, according to the annual Voluntary Support of Education (VSE) survey implemented by the Council for Aid to Education (CAE).17 However, the survey noted the aggregate gain in dollars was nearly eliminated upon adjusting for inflation.
While funds dedicated to “other” causes and research have surpassed all other causes consistently over the past few decades, funds dedicated to specific academic divisions and financial aid have stayed constant. Among the surveyed universities, donations committed to student financial aid has long comprised about 16 percent of total contributions.18 2016 was no different, with the share committed to financial aid totaling 16.8 percent.
According to the VSE survey, the 20 highest-fundraising universities secured $11.12 billion in donations, representing 27.1 percent of all reported donations.19 Harvard University raised $1.19 billion, followed by Stanford University’s
$951.15 million. While none of the top 20 organizations moved from their spot in 2015–2016, the aggregate amount raised dropped slightly from the 2015 total of $11.36 billion.
The VSE study also reveals that personal giving to educational organizations declined, while giving from institutions such as corporations and foundations rose in 2016.20 Giving from corporations and foundations increased from 2015 to 2016, at 14.8 percent and 7.3 percent, respectively.21
Compared to 2015, contributions from alumni and non-alumni dropped 8.5 percent and 6 percent, respectively.22 These reductions come on the heels of strong growth (10.2 percent and 23.1 percent, respectively) in 2015. Alumni giving still counts for the second-largest source of support, providing 24.2 percent of the total. CAE indicated that higher-than-average 2015 personal giving to higher education may create an artificial negative comparison: personal giving to higher education increased 6.7 percent from 2014 to 2016.23
Figure 1 shows the percentage of total amounts raised by higher education institutions, by source of giving, for academic (or fiscal) years 2007–2008 to 2015–2016.
198 | Giving USA FoundationTM | Giving USA 2017
Giving USA Giving to Education

CASE member organizations report increased donations through mid-2016
According to the Council for Advancement and Support of Education’s (CASE) Fundraising Index (CFI), fundraisers at schools, colleges and universities estimated donations to reporting organizations grew 4.5 percent during the academic year (based on the fiscal year of July 1, 2015 to June 30, 2016).24 This realized growth in fundraising was lower than predicted at the beginning of the academic year
(6.2 percent). CASE conducts the CFI survey twice a year, surveying fundraising professionals in education about estimated and predicted charitable giving levels.
Of all types of surveyed educational institutions, community colleges realized the greatest increase in giving at 7.2 percent.25 Other reported increases between 2015 and 2016 include:
7.1 percent for public higher education institutions;
3.2 percent for private higher education institutions; and
3.3 percent for independent schools.
Giving USA Giving to Education
Giving USA FoundationTM | Giving USA 2017 | 199
Figure 1Percentage of total amounts raised by higher education institutions, by source of giving, for academic years 2007–2008 to 2015–2016
Note: “Other” includes giving by federated fundraising organizations, religious organizations, some donor-advised funds, and other organizations. Data: Council for Aid to Education (CAE), Voluntary Support of Education (VSE) surveys, 2007–2016, www.cae.org
2007 2008 2009 2010 2011 2012 2013 2014 2015 2016
30.4%28.6% 28.8% 29.6% 30.0% 28.6% 29.5% 29.6% 29.9% 28.8%
Foundations
Alumni
Non-alumniindividuals
Corporations
Other
24.2%27.8% 27.5% 25.6% 25.4% 25.7% 24.8% 26.6% 26.3% 26.9%
18.3%19.0% 19.4% 17.9% 17.6% 18.6% 18.8% 18.3% 17.4% 19.9%
16.1%16.1% 15.5% 16.6% 16.9% 16.6% 16.9% 15.1% 15.4% 14.3%
11.0%8.5% 8.8% 10.3% 10.2% 10.4% 9.9% 10.4% 11.1% 10.2%

Among all types of educational institutions surveyed, fundraisers at community colleges predicted the strongest fundraising growth rate for the 2017 academic year at 7.3 percent over 2016.26 Overall, surveyed fundraising practitioners predicted an increase of 5.2 percent in 2017 giving over 2016.
Giving to education by high-net-worth individuals
According to the Wealth-X and Arton 2016 report on the Wealth-X Ultra-High-Net-Worth (UHNW) Database, Changing Philanthropy: Trend Shifts in Ultra Wealthy Giving, education remains the most popular philanthropic cause for ultra-high-net-worth individuals, attracting 47 percent of all UHNW donations.27 According to the report, 25 percent of UHNW donors fund education in general, while 22 percent support higher education specifically. The report notes that while higher education institutions represent just a share of the education sector, they tend to attract the largest donations.
Closer analysis of the 2017 Philanthropy 50, The Chronicle of Philanthropy’s annual ranking of the 50 biggest American donors, reveals similar trends.28 In 2016, the amount of money donated to colleges and universities represented almost half (48 percent) of the total $5.6 billion recorded. The Chronicle reported that 2016 marked
the highest share given to higher education in the past five years.
The donor couple topping the 2017 Philanthropy 50—Phil Knight, co-founder of Nike, and his wife Penny—gave $900 million in total to higher education, with $500 million to the University of Oregon and $400 million to Stanford University.29 The $500 million donation to the University of Oregon, to be paid out over 10 years, launched the Phil and Penny Knight Campus for Accelerating Scientific Impact in an effort to boost life sciences research on the Eugene campus.30 The $400 million donation to Stanford founded the Knight-Hennessy Scholars Program, a graduate-level scholarship aimed at sponsoring 100 high-achieving students worldwide to “find creative solutions to the world’s greatest challenges.”31 Additional donations have grown this program to become the largest fully-endowed scholarship program in the world, at $750 million.
The Chronicle notes that approximately 28 of the 50 donors on the 2017 ranking donated to higher education, supporting 20 colleges and universities in 2016.32 Stanford University was the largest benefactor of donations from the Philanthropy 50, receiving $550 million in total.
200 | Giving USA FoundationTM | Giving USA 2017
Giving USA Giving to Education

Large gifts to higher education target health researchIn 2016, high-net-worth donors directed large gifts to higher education institutions for medical research or public health purposes.
In April 2016, the University of California-San Francisco (UCSF) Weill Institute for Neuroscience was established with a $185 million donation from the Weill Family Foundation, representing the largest charitable donation ever received by the institution.33 Similarly, the Johns Hopkins Bloomberg School of Public Health reported its largest-ever donation from Michael Bloomberg, who gave $300 million to research opioid addiction, gun violence, drug addiction, obesity, adolescent health, and environmental threats, all of which contribute to a decline in Americans’ life expectancy, according to school researchers.34
Below are additional $100-million-plus donations or pledges toward universities’ science and health research in 2016:
The Bill & Melinda Gates Foundation awarded $210 million to the University of Washington for a new research hub to “improve the health and well-being of people worldwide,” and target issues such as poverty and healthcare access.35
Atlantic Philanthropies gave $177 million to UCSF and Trinity College Dublin (University of Dublin) to jointly operate and create the Global Brain Health Institute (GBHI) to advance dementia research, treatment, and policy.36 This gift represents the largest program grant in Atlantic Philanthropies’ history.
Patricia and Phillip Frost awarded $100 million for science and engineering programs at the University of Miami in January 2016.37 As of January 2017, the University of Miami publicized plans for the donation to create the Frost Institutes for Science and Engineering, unifying the university’s scientific research initiatives.38
Giving USA Giving to Education
Giving USA FoundationTM | Giving USA 2017 | 201

to the 2016 Millennial Impact Report, researched by Achieve and supported by the Case Foundation.40 The research team released results in three waves in 2016, reflecting 2,100 responses in the latest iteration of this study. In all three survey waves, respondents reported that education was the top issue interesting them most.
Despite the interest in education, sources indicate that young alumni donate less to their alma maters than older graduates.41 A 2014 study conducted by The Chronicle of Philanthropy and Achieve shows that half of surveyed Millennial alumni donated to their alma mater, and 75 percent indicated they would donate to a different organization before contributing to their former school.42
Higher education institutions may also be ill-equipped to cultivate Millennial donors. According to the 2016 Voluntary Alumni Engagement in Support of Education (VAESE) Benchmarking Report, 87 percent of alumni relations professionals felt they did poorly or needed to expand efforts to engage with their young alumni.43 Eighty-two percent of surveyed institutions request donations from graduates within a year of their graduation, which VAESE suggests may alienate recent graduates who aren’t prepared to give financially.
The following sections detail studies and trends with regard to higher education institutions philanthropically engaging young alumni.
Engaging young alumni in giving to higher education
Education remained the top social issue of interest to the Millennial generation (born 1980–2000, aged 18–36), according
202 | Giving USA FoundationTM | Giving USA 2017
Giving USA Giving to Education
Good to KnowEducational institutions often make assumptions about their constituents’ affiliation to the institution, but these assumptions may or may not reflect donors’ passion for and relationship with the organization.39 Fundraisers should consider approaching potential donors based on what is known about their affiliation, and then test other points of affiliation. Consider the following action steps:
Acknowledge previous giving to the institution, especially in terms of frequency and level of giving.
Draft a message to current parents very differently than alumni parents. In addition, undergraduate alumni and graduate alumni (or graduates versus non-graduates) should be addressed accordingly.
Other potential message differentiators may be reunion fundraising, news around a school or unit, student activities, geography, age, or previous areas supported. Messaging should be tested for relevance and layered on top of (not in place of ) previous giving and affiliation.
Even with segmentation, it is critical to communicate a core message of impact clearly and consistently across all media.

Emotional attachment key for cultivating young alumni donorsReleased in 2016, results from the 2014 Gallup-Purdue Index (the Index) suggest that students who are emotionally attached to their alma maters are more likely to donate.44 The Index considers students “emotionally attached” if they strongly agree with the statements: “I can’t imagine a world without [College name]” and “[College name] was the perfect school for people like me.”45
The Index revealed that only 18 percent of American graduates are emotionally attached to their former institutions, as measured by graduates’ strong agreement with the statements.46 The report also rated specific elements of the college experience, such as extracurricular involvement or internship experience, as almost tripling the likelihood that graduates will develop emotional links to their institution.
The importance of emotional engagement is further underlined by a 2016 study from Cygnus Applied Research, which surveyed active American donors on their 2015 giving.47 Sixty-eight percent of alumni who gave to their alma maters considered themselves “engaged in campus life apart from academic study,” when they attended college, and after graduation, 80 percent of giving alumni indicated they remained connected with their
former institution.48 In addition, Achieve’s research on Millennial alumni giving patterns indicates that 77 percent of surveyed donors gave to causes because they had an emotional connection with the organization.49
Online engagement proves fruitful for Millennial donors According to Achieve’s Millennial Alumni Report, 73 percent of Millennial alumni surveyed indicated that they wanted to receive emails from their alma mater about university news, underlining the importance of digital engagement with young alumni groups.50
For some colleges and universities, investment in online engagement with their young alumni has proven fruitful. As an example, Stanford University currently utilizes social media to deliver personalized thank-you photos for each young alumni who donates.51 Other universities, such as the University of Southern California (USC), are experimenting with folding crowdfunding-like campaigns into large annual funds.
In March 2016, the College of William and Mary (Williamsburg, VA) partnered with their own students to launch a crowdfunding campaign aimed at funding undergraduate research scholarships.52 Students ran micro-campaigns with goals of $6,000 each, and allowed participants to share campaigns on social media. The campaign raised over $300,000 toward
Giving USA Giving to Education
Giving USA FoundationTM | Giving USA 2017 | 203

the fellowships. Other colleges that have managed crowdfunding campaigns cite the ease of using online platforms and the ability to share campaigns on social media as useful features, reporting many graduates promoting or sharing the campaigns with their own peer networks.53
Further, promising statistics from 2016 #GivingTuesday campaigns indicate that online efforts paid off with regard to engaging younger donors. According to data from #GivingTuesday campaigns hosted via higher education crowdfunding platform GiveCampus, half of all donors to these campaigns were Millennials.54 Underlying the importance of web platforms, GiveCampus found 46 percent of visitors to the campaigns came via mobile device, and 30 percent were directed to the pages from a Facebook or Twitter post. Fewer (14 percent) donated due to a friend’s appeal via email or social media.
Billion-dollar higher education campaigns opened and/or in progress in 2016
Giving USA’s tracking of billion-dollar higher education campaigns revealed five new billion-dollar campaigns that opened to the public in 2016 at the following institutions: Massachusetts Institute of Technology (MIT), Colorado State University, University of Georgia, Iowa State University, and University of Washington.55
In addition, two previously announced campaigns at Wake Forest University (WFU) and Mississippi State University (MSU) increased their original goals to $1 billion, joining the ranks of current campaigns in progress.56 WFU extended its campaign to 2020 with a new goal of $1 billion after surpassing its initial $600 million goal in 2016, two years ahead of schedule. MSU also announced raising $600 million in 2016 after a six-year campaign, pushing the campaign to $1 billion by 2020.
Thirty-eight billion-dollar campaigns were identified as being in progress in 2016, including those that opened in 2016 (see Table 1).
Several billion-dollar higher education campaigns completed in 2016
Eight higher education institutions concluded billion-dollar campaigns in 2016 based on announcements in online reports and websites. All these institutions met or exceeded the campaign goals (see Table 2).
204 | Giving USA FoundationTM | Giving USA 2017
Giving USA Giving to Education

Table 1Billion-dollar higher education campaigns opened or in progress in 2016
Institution Opened or announced
Plan to close Goal ($) Raised ($) As of
Auburn University57 2015 2018 $1B $1B September 2016
Boston University58 2012 2019 $1.5B $1B June 2016
Brown University59 2015 N/A $3B $1.3B February 2017
Case Western Reserve University60 2011 2016 $1.5B $1.2B May 2015
Clemson University61 2006 2016 $1B $1.1B July 2016
College of William and Mary62 2015 2020 $1B $691.7M March 2017
Colorado State University63 2016 2020 $1B $769.3M April 2017
Duke University64 2012 2017 $3.3B $3.3B July 2016
Florida State University65 2014 2018 $1B $939M September 2016
George Washington University66 2014 2018 $1B $990M May 2017
Harvard University67 2013 2018 $6.5B $7B+ June 2016
Indiana University68 2015 2020 $2.5B $1.9B April 2017
Iowa State University69 2016 2020 $1.1B $710M April 2017
Johns Hopkins University70 2010 2018 $5B $4.8B March 2017
Kansas State University71 2015 2020 $1.4B $882M June 2016
Massachusetts Institute of Technology72 2016 N/A $5B $2.9B October 2016
Michigan State University73 2014 2018 $1.5B $1.2B July 2016
Giving USA Giving to Education
Giving USA FoundationTM | Giving USA 2017 | 205

Mississippi State University74 2013 2020 $1B $669M October 2016
New York University75 2013 2017 $1B $500M February 2016
Northeastern University76 2013 2017 $1.25B $475M June 2015
Northwestern University77 2014 N/A $3.75B $3.31B February 2017
Purdue University78 2015 2019 $2.02B $1.42B March 2017
Texas A&M79 2015 2020 $4B $2.3B August 2016
The University of Chicago80 2014 2019 $5B $3.6B March 2017
University of Akron81 2012 2020 $1B $1.2B May 2014
University of Alabama82 2013 2018 $1B $786.7M April 2017
University of California, Los Angeles83 2014 2019 $4.2B $3.1B May 2017
University of Georgia84 2016 2020 $1.2B $680M November 2016
University of Michigan85 2013 2018 $4B $3.97B April 2017
University of Missouri86 2015 N/A $1.3B $762M July 2016
University of Oregon87 2014 N/A $2B $1B June 2016
University of South Florida88 2009 2018 $1.5B $984M May 2017
University of Southern California89 2011 2021 $6B $6B March 2017
University of Washington90 2016 2020 $5B $4B March 2017
206 | Giving USA FoundationTM | Giving USA 2017
Giving USA Giving to Education
Institution Opened or announced
Plan to close Goal ($) Raised ($) As of
Table 1 (Continued)
Billion-dollar higher education campaigns opened or in progress in 2016

Giving USA Giving to Education
Giving USA FoundationTM | Giving USA 2017 | 207
Institution Opened or announced
Plan to close Goal ($) Raised ($) As of
Table 1 (Continued)
Billion-dollar higher education campaigns opened or in progress in 2016
University of Wisconsin-Madison91 2015 2020 $3.2B $1.73B October 2016
Wake Forest University92 2013 2020 $1B $625M October 2016
Washington University in St. Louis93 2012 2018 $2.5B $2.53B May 2017
West Virginia University94 2012 2017 $1B $1.1B May 2017
M=Million, B=Billion The “as of” date refers to the most recent date the raised amount was confirmed. N/A=Not available
Table 2Billion-dollar higher education campaigns closed in 2016
Institution Opened or announced
Plan to close Goal ($) Raised ($) As of
Boston College95 2008 2016 $1.5B $1.6B September 2016
Georgetown University96 2006 2016 $1.5B $1.7B October 2016
The Ohio State University97 2009 2016 $2.5B $3B September 2016
University of California Santa Barbara98 2012 2016 $1B $1B+ June 2016
University of Arizona99 2014 2016 $1.5B $1.6B December 2016
University of Iowa100 2013 2016 $1.7B $1.98B February 2017
University of Kansas101 2012 2016 $1.2B $1.7B June 2016
University of Rochester102 2011 2016 $1.2B $1.4B July 2016
M=Million, B=Billion The “as of” date refers to the most recent date the raised amount was confirmed.

Higher education endowments continue to experience investment declines, yet sustain increases in spending levels
According to the joint 2016 National Association of College and University Business Officers (NACUBO)-Commonfund Institute Study of Endowments (NCSE), higher education endowments realized, on average, a decline in returns of 1.9 percent for the 2016 fiscal year (July 1, 2015 to June 30, 2016).103 This negative return rate pulled down the 10-year average annual return from 6.3 percent to 5.0 percent. This study gathered data from 805 U.S. colleges and universities with $515.1 billion in combined endowment assets.104
Regardless of the latest returns, 74 percent of surveyed U.S. colleges and universities increased their endowment spending dollars in fiscal year 2016 to support their institutions’ mission.105 The median increase in endowment spending among surveyed institutions was 8.1 percent, which surpassed the inflation rate.
Overall, responding institutions to the NACUBO-NCSE survey reported that, on average, endowment funds comprised 9.7 percent of their operating budget, the same level as reported in
fiscal year 2015.106 The “median total of new gifts” to endowments saw a slight increase, from $2.7 million in fiscal year 2015 to $2.8 million in fiscal year 2016.107 The average total of new gifts was $12.9 million, compared with the 2015 average of $10.0 million. For fiscal year 2016, as in the previous fiscal year, 44 percent of surveyed institutions reported that the gifts to their endowments increased. By comparison, 48 percent of these institutions reported in fiscal year 2016 that they experienced a decline in endowment gifts.
208 | Giving USA FoundationTM | Giving USA 2017
Giving USA Giving to Education
Good to KnowWith 74 percent of U.S. colleges and universities reporting that they have increased their endowment spending, what impact could this have on asking donors to invest in the endowment?108 Often called the “toughest money to raise,” the upcoming generational wealth transfer and the opportunity to cultivate planned gifts align well with funding endowment campaigns. Yet, donors will expect transparency and information about the endowment spending policy to ensure proper stewardship of their gifts.

Million-dollar donations to libraries in 2016
In 2016, several public and university libraries received sizable donations from individuals, including alumni and anonymous donors. Some of the donations helped build endowments for these libraries, or went to specific projects in some cases.
The University of North Carolina (UNC) University Library received a $5 million donation to its Louis Round Wilson Special Collections Library from alumna Florence Fearrington, the largest gift to date in support of the university’s libraries.109 Additionally, the Powell Library at the University of California, Los Angeles (UCLA) received a $5 million gift from Norman Powell, son of the university librarian for whom the library was named, to establish an endowment fund to support future university librarians and to fund the library’s collections and research services.110
In addition to gifts from individuals, libraries also received contributions from foundations in 2016. In October, the Indianapolis Public Library Foundation announced that Indianapolis-based Lilly Endowment awarded $3.1 million to create the Center for African-American Literature and Culture, which will be housed at the Indianapolis Central Library.111 The funding will also support digitizing Indianapolis public institutions’
historical records in advance of the city’s 2020 bicentennial celebration.
Additional gifts from foundations in support of libraries included $2.78 million from the Hugh and Hazel Darling Foundation to endow Chapman University’s Dale E. Fowler School of Law’s library, and $1.5 million from the Andrew W. Mellon Foundation to Stanford University Libraries to improve how libraries catalogue and share bibliographic data online.112
Colleges and universities realized slight drop in representation on the 2016 Philanthropy 400 list
The Chronicle of Philanthropy annually compiles a list of the top 400 public charities and private foundations.113 The Philanthropy 400 ranks charities according to the level of private donations received in the previous fiscal year. Private donations include gifts from all private sources—individuals, corporations, and foundations. Gifts of cash, shares of stock, in-kind donations, real estate, and valuables are included. To determine the rankings, the Chronicle compiles information from IRS Forms 990, annual reports, financial statements, and a questionnaire.
Philanthropy 400 data issued in 2016 for giving in the fiscal year ending
Giving USA Giving to Education
Giving USA FoundationTM | Giving USA 2017 | 209

in 2015 include 105 colleges and universities—40 private and 65 public institutions—compared to 107 reported in the prior year, and 11 education charities (compared with 10 reported in the prior year). The top five colleges and universities on the list with the greatest amount in private support are:114
Ranking 8th: Stanford University, Stanford, CA, with $1.63 billion in private contributions, an increase of 75.0 percent from the previous year;
Ranking 14th: Harvard University, Cambridge, MA, with $1.05 billion in private contributions, a decline of 9.5 percent;
Ranking 27th: University of Southern California, Los Angeles, CA, with $653.03 million in private contributions, a decline of 10.8 percent;
Ranking 33rd: Cornell University, Ithaca, NY, with $590.64 million in private contributions, an increase of 8.2 percent; and
Ranking 34th: Johns Hopkins University, Baltimore, MD, with $582.68 million in private contributions, a decline of 5.2 percent.
Step Up for Students (Jacksonville, FL) retained its spot as the top education-related charity in 2016 from 2015.115 Ranking 48th, with $457.85 million in private support, contributions to this organization increased 37.4
percent from the previous year. A new education-related charity, the Challenger School Foundation (Sandy, UT) joined the Philanthropy 400 for the first time in 2016 with $135.48 million in contributions. The private K–8 school network ranked 204th after receiving a substantial bequest from the estate of founder Barbara Baker.116
Grantmakers for Education releases benchmarking report for 2015
Grantmakers for Education (GFE) released Benchmarking 2015: Trends in Education Philanthropy in 2016.117 A report series starting in 2008, the Benchmarking reports survey GFE members representing almost 300 organizations and 1,400 individuals, with private and family foundations comprising the majority of responding organizations. According to the report, GFE members made grants worth nearly $1.9 billion in 2015, and the data suggests granting will grow through 2016.
GFE members were surveyed on areas of programmatic focus.118 Survey participants indicated that equity was a top programmatic focus, continuing trends from previous years—in 2015, 90 percent of funders placed equity as a core component of their mission. Postsecondary success attracted the largest share of funding dollars (10 percent), while top priorities by the number of funders included the following
210 | Giving USA FoundationTM | Giving USA 2017
Giving USA Giving to Education

areas: teacher professional development (65 percent); “out of/after school” programming (51 percent); administrative leadership (49 percent); and science, technology, engineering, and math (STEM) programming (46 percent).119
In addition, responding grantmakers emphasized the interconnected nature of education philanthropy.120 In 2015, 70 percent of grantmakers funded initiatives supporting education
spanning more than one learning stage, from K–12 to postsecondary to workforce education.
Key findings from annual studies
Table 3 presents three years of data from studies released annually about giving to the education subsector. Website addresses are provided so readers can access the full reports.
Giving USA Giving to Education
Giving USA FoundationTM | Giving USA 2017 | 211
Table 3Key findings from studies on giving to education organizations
National Association of Independent Schools (NAIS)National Independent School Facts at a Glance Taken from reports dated: 2014, 2015, and 2016
www.nais.org
2013–2014 2014–2015 2015–2016
Median annual giving per student $1,384 $1,361 $1,256
Median endowment per student $14,241 $18,863 $13,564
Giving by alumni Median Gift Participation rate
$3099.9 percent
$31310 percent
$2868.7 percent
Giving by parents Median Gift Participation rate
$94267.6 percent
$96168.1 percent
$87963.2 percent
Giving by trustees Median Gift Participation rate
$4,541100 percent
$4,278100 percent
$4,187100 percent
IRS Statistics of Income Bulletin121
Tax-exempt education organizations: 2011–2013www.irs.gov
2011 2012 2013
Number of returns 47,928 48,181 49,356
Charitable revenue $89.68 billion $98.46 billion $101.56 billion

References1 All data in this section are reported as estimates, which
are subject to revision. To provide the most accurate estimates for charitable giving, as new data become available, Giving USA revises its estimates for at least the last two years. See more about how Giving USA calculates charitable giving by sources and uses in the “Brief summary of methods used” section of this report.
2 Practitioner highlight authored by Editorial Review Board member Angela E. White.
3 Practitioner highlight authored by Editorial Review Board member Angela E. White.
4 Practitioner highlight authored by Editorial Review Board members Jessica Browning and Angela E. White.
5 This information is in current dollars6 “Colleges and Universities Raise $41 Billion in 2016,” Council
for Aid to Education, February 7, 2017, www.cae.org 7 “CASE Fundraising Index Survey: U.S. Educational
Fundraisers See Lower Growth in FY16 but Predict Stronger Gains in FY17,” Council for Advancement and Support of Education, August 19, 2016, www.case.org
8 This information was provided to Giving USA directly from Blackbaud in May 2017. The Blackbaud Index of Charitable Giving assesses changes in total charitable giving from year to year using a three-month rolling median of the charitable revenue reported by a selected sample of U.S. nonprofits. This information reflects data on total charitable giving reported by 6,857 organizations across the nonprofit sector, representing total charitable revenue of $23.6 billion in 2016. Online giving data are reported by 4,958 nonprofits with charitable support amounting to $2.7 billion in 2016. Month-by-month Blackbaud Index data on both online and total giving are available at www.blackbaud.com/nonprofit-resources/blackbaud-index. Note that Blackbaud data are constantly being updated; therefore, figures published in Giving USA may vary from current figures.
9 Year-over-year monthly giving data are from the Blackbaud Index, May 2017, https://www.blackbaud.com/nonprofit-resources/blackbaud-index
10 Same as note 8.11 Same as note 9.12 Same as note 8.13 Same as note 9.14 Luminate Online Benchmark Report 2016, Blackbaud,
2017, www.blackbaud.com. Data from this report cover the fiscal year July 1, 2015 to June 30, 2016 for a sample
of 631 nonprofit organizations that use Luminate Online cloud-based software by Blackbaud.
15 Benchmarks 2017, M+R and NTEN, 2017, www.e-benchmarksstudy.com. Note that this study uses a convenience sample of 133 organizations with online revenue totaling over $535 million and that the organizations types reported in this study do not necessarily match those used in Giving USA.
16 The Nonprofit Research Collaborative (NRC) annually conducts surveys on fundraising trends across the nonprofit sector. In 2017, this collaboration included the Giving USA Foundation, the Association of Fundraising Professionals, CFRE International, the Association of Philanthropic Counsel, the National Association of Charitable Gift Planners, and Top Nonprofits. In early 2017, the NRC launched a survey to assess fundraising trends for the entire 2016 calendar year. The survey asked nonprofit leaders of public charities and foundations to report on changes in charitable revenue received and changes in the number of donors by specific donor type, among other questions. Data in this section come from the Winter 2017 Nonprofit Fundraising Survey report from the Nonprofit Research Collaborative, May 2017, www.npresearch.org. A convenience sample of 1,019 respondents, 144 of them Canadian, constitutes the survey results.
17 Same as note 6. 18 “Colleges and Universities Raise Record $40.30 Billion in
2015,” Council for Aid to Education, January 27, 2016, www.cae.org
19 Same as note 18.20 Same as note 6. 21 Same as note 6.22 Same as note 6. 23 Sue Cunningham, “Behind the 2016 Voluntary Support of
Education Survey Results,” Council for Advancement and Support of Education, Feb 7, 2017, www.case.org
24 Same as note 7.25 Same as note 7.26 Same as note 7.27 Changing Philanthropy: Trend Shifts in Ultra Wealthy
Giving, Wealth-X, December 12, 2016, http://www.wealthx.com/articles/2016/the-wealth-x-and-arton-capital-philanthropy-report-2016. Wealth-X defines higher education causes as “colleges, universities and other post-secondary educational institutions,” and education causes as “primary schools, high schools, scholarship funds, and
212 | Giving USA FoundationTM | Giving USA 2017
Giving USA Giving to Education
Chapter authored by Qi Gao, M.A., and Xinyi Zhao, M.A., with contributions from staff at the Indiana University Lilly Family School of Philanthropy.
Good to Know sections and Practitioner Highlights written by Giving USA Editorial Review Board members Jessica Browning, Angela E. White, and Kathy Howrigan.

social organizations or foundations specifically focused on education. All education-related philanthropy, except those covered in Higher Education,” pg. 51
28 Maria Di Mento and Drew Lindsay, “America’s Biggest Donors Give Unusually Large Share of Gifts to Colleges,” The Chronicle of Philanthropy, February 7, 2017, www.philanthropy.com
29 Maria Di Mento and Drew Lindsay, “Philanthropy 50: Nike Mogul Tops Chart While Tech Giants Flex Charity Muscle,” The Chronicle of Philanthropy, February 7, 2017, www.philanthropy.com
30 Chris Sinclair, “Announcing the Phil and Penny Knight Campus for Accelerating Scientific Impact,” The University of Oregon Senate, October 17, 2016, www.senate.uoregon.edu; Andrew Theen, “Phil and Penny Knight Will Give $500 Million to University of Oregon for Science Complex,” The Oregonian, March 23, 2017, www.oregonlive.com
31 Julia Prodis Sulek, “Stanford Taps Nike’s Phil Knight for $400 million Gift, Creates World’s Biggest Scholars Program,” The Mercury News, February 23, 2016, www.mercurynews.com; “The Program,” Stanford University, retrieved March 2017, www.knight-hennessy.stanford.edu, para. 2
32 Same as note 28.33 Pete Farley, “$185M Gift Launches UCSF Weill Institute
for Neurosciences,” University of California San Francisco, April 25, 2016, www.ucsf.edu
34 Andrea K. McDaniels and Meredith Cohn, “Michael Bloomberg Gives $300 million to Hopkins for U.S. Health Initiative, The Baltimore Sun, September 15, 2016, www.baltimoresun.com
35 Phuong Le, “Gates Foundation Gives University of Washington $210 Million,” U.S. News & World Report, October 25, 2016, www.usnews.com, para. 1
36 Alex Daniels, “Atlantic Philanthropies Gives $177 Million to Study Dementia,” The Chronicle of Philanthropy, November 16, 2015, www.philanthropy.com; “Atlantic Philanthropies Gives $177 Million to Establish Global Brain Health Institute to Tackle Dementia,” Atlantic Philanthropies, November 16, 2015, www.atlanticphilanthropies.org
37 Douglas Hanks, “Frosts Give $100 Million to UM for Science, Engineering,” Miami Herald, January 29, 2016, www.miamiherald.com
38 “Creation of the Frost Institutes for Science and Engineering,” News & Events, University of Miami, January 23, 2017, www.news.miami.edu
39 Good to Know section authored by Editorial Review Board member Kathy Howrigan.
40 The 2016 Millennial Impact Report, The Millennial Impact Project, 2016, http://www.themillennialimpact.com/2016-report/
41 Katelyn Umholtz, “Millennials Donate Less to Alma Maters than Previous Generations, Study Finds,” The Red & Black, September 25, 2014, www.redandblack.com
42 Millennial Alumni Report: A Study of Millennial Alumni of Four-Year Universities in the United States, Achieve and The Chronicle of Philanthropy¸ 2014, http://www.achieveagency.com//wp-content/uploads/2016/11/Achieve_Millennial-Alumni-Report.pdf
43 2016 VAESE Benchmarking Report: Voluntary Alumni Engagement in Support of Education, Alumni Access, 2016, http://cdn2.hubspot.net/hubfs/263750/Alumni_Access_-_2016_VAESE_Alumni_Relations_Benchmarking_Survey_Report.pdf. The VAESE is conducted by Alumni Access, an alumni service provider. 469 alumni relations professionals were surveyed globally, 97 percent were from the United States.
44 Blake Lohnes and Nader Nekvasil, “Alumni Attachment, Giving Linked to Undergraduate Experience,” Gallup, September 1, 2016, www.gallup.com
45 Same as note 44, para. 246 Same as note 44.47 Penelope Burk, The Burk Donor Survey, Cygnus Applied
Research, Inc., 2016, http://www.cygresearch.com/files/free/2016_BURK_SURVEY_REPORT-US-Exec-Summary.pdf
48 Same as note 47, pg. 849 Same as note 42.50 Same as note 42.51 Megan O’Neil, “Colleges are Inventing New Ways to
Attract Recent Graduates to Donate,” The Chronicle of Philanthropy, September 8, 2014, www.philanthropy.com
52 Danielle Douglas-Gabriel, “Colleges are Going Online to Crowdsource Donations, and They’re Raising Millions,” The Washington Post, August 19, 2016, www.washingtonpost.com
53 Same as note 52.54 Kestrel Linder, “Schools Raise Millions on Giving
Tuesday—Much of it from Millennials,” eCampus News, December 2, 2016, www.ecampusnews.com
55 Laura Krantz, “MIT launches $5 billion fund-raising campaign,” Boston Globe, May 6, 2016, www.bostonglobe.com; John Aguilar, “Colorado State announces $1 billion fundraising effort,” The Denver Post, February 13, 2016, www.denverpost.com; Lee Shearer, “UGA sets $1.2 billion fundraising goal,” Online Athens, November 18, 2016, www.onlineathens.com; Vanessa Miller, “Iowa State announces largest-ever fundraising campaign: University is already halfway to $1.1 billion goal,” The Gazette, October 1, 2016, www.thegazette.com; Victor Balta, “University of Washington launches historic $5 billion philanthropic campaign,” UW Today, University of Washington, October 21, 2016, www.washington.edu/news
56 Katie Neal, “Wake Will Lead: WFU Sets New Goal to Raise $1 Billion by 2020,” Wake Forest News, Wake Forest University, October 27, 2016, www.news.wfu.edu; Checky Herrington, “As Support for ‘Infinite Impact’ Soars, Mississippi State Extends Fundraising Campaign Goal to $1 Billion,” Mississippi State University, April 28, 2016, www.msstate.edu/newsroom
57 “Because This is Auburn,” Auburn University, retrieved March 2017, www.develop.auburn.edu/about; “Because This is a Billion Dollar Milestone,” Auburn University, September 2, 2016, www.develop.auburn.edu/news
58 Joel Brown, “Campaign for Boston University Goal Boosted to $1.5 Billion,” BU Today, Boston University, September 18, 2015, www.bu.edu/today; J.D. Capelouto, “Boston University Reaches $1B Fund-raising Goal,” April 14, 2016, The Boston Globe, www.bostonglobe.com; Joel
Giving USA Giving to Education
Giving USA FoundationTM | Giving USA 2017 | 213

Brown, “Campaign for BU Passes $1 Billion Mark,” BU Today, Boston University, April 19, 2016, www.bu.edu/today; Rich Barlow, “Record Financial Year for University,” BU Today, Boston University, September 27, 2016, www.bu.edu/today
59 Mark Nickel, “Brown Launches BrownTogether, a $3 Billion Comprehensive Campaign,” Brown University, October 23, 2015, www.news.brown.edu; “Campaign Goals and Progress,” Brown University, retrieved March 2017,www.brunonia.brown.edu
60 “More Fundraising Records Fall,” The Daily, Case Western Reserve University, August 6, 2015, www.cwru-daily.com; ForwardThinking, Case Western Reserve University, 2015, https://case.edu/forwardthinking/pdf/Issue3.pdf
61 Robin S. Denny, “Clemson University Capital Campaign Surpasses Goal, Tops $1.06 Billion,” The Newsstand, Clemson University, July 18, 2016, www.newsstand.clemson.edu; “Clemson Forever,” Clemson University, retrieved March 2017, www.clemson.edu/giving
62 “William & Mary Launches Campaign to Raise $1 Billion,” College of William & Mary, October 23, 2015, www.wm.edu; “For the Bold,” College of William & Mary, retrieved March 2017, www.forthebold.wm.edu
63 “CSU launches Billion Dollar Campaign,” Colorado State University, February 16, 2016, www.libarts.colostate.edu/news; “Campaign Progress—April 2017,” Colorado State University, retrieved April 2017, www.giving.colostate.edu
64 “Duke Forward Campaign Reaches Fundraising Goal Ahead of Schedule,” The Duke Chronicle, Duke University, July 12, 2016, www.dukechronicle.com
65 “Florida State Kicks Off $1 Billion Raise the Torch Campaign,” Florida State University News, Florida State University, October 17, 2014, www.news.fsu.edu; “Campaign Overview,” Florida State University, retrieved March 2017, www.raisethetorch.fsu.edu
66 Elise Zaidi, “Fundraising Campaign Reaches $968 Million,” The GW Hatchet, February 10, 2017, www.gwhatchet.com; “Campaign Progress,” George Washington University, retrieved May 2017, www.campaign.gwu.edu/campaign-progress
67 John S. Rosenberg, “Harvard Capital Campaign Crosses $7-Billion Mark,” Harvard Magazine, September 1, 2016, www.harvardmagazine.com; “With Two Years to Go, Campaign’s Impact Expands,” Harvard Gazette, September 1, 2016, www.news.harvard.edu
68 “IU Launches Historic $2.5B Bicentennial Campaign, Announces $20M Gift from David H. Jacobs,” Indiana University, September 28, 2015, www.news.iu.edu; campaign progress provided directly to Giving USA from the Indiana University Foundation.
69 Karen Simon, “Leath Announces $1.1 Billion Campaign,” Iowa State University, October 6, 2016, hwww.inside.iastate.edu; “What is Forever True, For Iowa State?” Iowa State University Foundation, retrieved May 2017, www.foundation.iastate.edu
70 “Campaign Progress Report,” Johns Hopkins University, retrieved May 2017, www.rising.jhu.edu/progress
71 “Vision and Progress,” Kansas State University, retrieved May 2017, www.inspire.k-state.edu; “Kansas State University Alumni and Friends Give $150.6 Million for
Fiscal Year 2016,” Kansas State University Foundation, www.found.ksu.edu; “Kansas State University Launches $1 Billion Innovation and Inspiration Campaign; $766 million raised to date,” October 10, 2015, K-State News, Kansas State University, www.k-state.edu
72 “MIT Campaign for a Better World Ends FY16 with $2.9 Billion,” MIT News, Massachusetts Institute of Technology, October 20, 2016, www.news.mit.edu
73 “MSU Raises $272 Million for Best Fundraising Year in University’s History,” MSU Today, Michigan State University, July 27, 2016, www.msutoday.msu.edu
74 “MSU Capital Campaign Nears $669 Million,” Mississippi State University Alumnus, Mississippi State University, 2016, www.alumnus.msstate.edu; Carl Smith, “MSUP Fundraising Goal to $1B,” The Dispatch, April 29, 2016, www.cdispatch.com
75 Kyle Sturmann, “What Exactly Is the Momentum Campaign?” Washington Square News, February 18, 2016, www.nyunews.com; “Momentum: NYU Launches $1 Billion Scholarship Campaign,” NYU Alumni Connect, November 15, 2013, www.alumni.nyu.edu; “Introducing the Momentum Campaign,” New York University, retrieved May 2017, www.nyu.edu/giving/momentum
76 “Aiming Higher,” Northeastern News, October 30, 2015, www.news.northeastern.edu; “Northeastern to Launch $1 Billion Comprehensive Campaign,” Northeastern News, May 23, 2013, www.news.northeastern.edu; Karin Kiewra, “Unstoppable Momentum,” Northeastern Magazine, 2015, www.northeastern.edu/magazine
77 “Goals and Progress,” Northwestern University, February 28, 2017, www.wewill.northwestern.edu; Jodi S. Cohen, “Northwestern University to Launch Area’s Largest Fundraising Campaign,” Chicago Tribune, March 14, 2014, www.articles.chicagotribune.com
78 Charles Henry, “Purdue Launches $2.019 Billion ‘Ever True’ Campaign,” Purdue University, October 9, 2015, www.purdue.edu; “Campaign Progress,” Purdue University, retrieved May 2017, www.giving.purdue.edu
79 “Lead by Example Campaign Surpasses Halfway Mark, Foundation Provides University Record Amount,” Texas A&M Today, November 15, 2016, www.today.tamu.edu
80 “The University of Chicago Campaign: Inquiry and Impact,” The University of Chicago, retrieved May 2017, www.campaign.uchicago.edu; “University Sets Goal of $4.5 Billion for The University of Chicago Campaign: Inquiry and Impact,” UChicago News, May 8, 2014, www.news.uchicago.edu
81 “Accelerate,” The University of Akron Department of Development, retrieved May 2017, www.uakron.edu/development/campaign-for-ua.dot; Vision 2020: Toward 150 Years of Distinction & A New Gold Standard of University Performance, The University of Akron, 2012, www.uakron.edu
82 Amy Bickers, “Building A Billion: Gifts in All Sizes Push UAB Towards Its Boldest Goal Ever,” University of Alabama at Birmingham, December 08, 2016, www.uab.edu/give/campaign; Jim Bakken, “$1 Billion Goal Announced for UAB’s Largest-ever Fundraising Campaign,” UAB News, October 23, 2013, www.uab.edu/news; “The $1B Campaign for UAB: Give Something,
214 | Giving USA FoundationTM | Giving USA 2017
Giving USA Giving to Education

Change Everything,” www.uab.edu/give/campaign 83 “Centennial Campaign Progress,” University of California
at Los Angeles, retrieved March 2017, www.giveto.ucla.edu; Cynthia Lee, “UCLA Sets Fundraising Record with $664 Million in 2015–16,” UCLA Newsroom, July 28, 2016, www.newsroom.ucla.edu
84 “UGA announces $1.2 billion fundraising campaign,” UGA Today, University of Georgia, November 18, 2016, www.news.uga.edu
85 “Campaign Progress,” University of Michigan, retrieved May 2017, www.leadersandbest.umich.edu/campaign/progress; Martin Slagter, “U-M’s Victors for Michigan Campaign Raises $3.4B and Nears Goal,” MLive.com, July 13, 2016, www.mlive.com
86 “Mizzou Breaks Single-Year Fundraising Record, Raises $170 Million,” University of Missouri, July 13, 2016, www.munews.missouri.edu; Nathan Hurst, “MU Announces $1.3 Billion Fundraising Campaign, Largest Effort in School History,” University of Missouri, October 8, 2015, www.munews.missouri.edu
87 “UO Surpasses $1 Billion to Reach the Halfway Mark of Campaign,” University of Oregon, July 19, 2016, www.around.uoregon.edu; “UO Raises $214 Million Toward $2 Billion Goal,” The Columbian, August 3, 2015, www.columbian.com
88 “About the Campaign,” USF Foundation, retrieved May 2017, www.unstoppable.usf.edu; Jay Wilson, “USF Surpasses $600 Million USF: Unstoppable Campaign Goal,” University of South Florida News, July 10, 2013, www.news.usf.edu
89 “Giving to USC,” University of Southern California, retrieved April 2017, www.campaign.usc.edu; Lynn Lipinski, “USC Announces Fundraising Campaign Continuation as it Reaches Goal Ahead of Schedule,” USC News, February 15, 2017, www.news.usc.edu
90 Victor Balta. “University of Washington Launches Historic $5 Billion Philanthropic Campaign,” UW Today, October 21, 2016, www.washington.edu/news; “About the Campaign,” University of Washington, retrieved May 2017, www.washington.edu/boundless/about
91 “Status Update,” University of Wisconsin-Madison, October 13, 2016, www.about.uwadvancement.org; John Allen, “UW Kicks Off Comprehensive Campaign at Kohl Center Event,” University of Wisconsin-Madison, October 15, 2015, www.news.wisc.edu
92 “Message from President Hatch: Wake Will Lead,” Inside WFU, October 27, 2016, www.inside.wfu.edu; Katie Neal, “Wake Will Lead: WFU Sets New Goal to Raise $1 Billion by 2020,” Wake Forest News, Wake Forest University, October 27, 2016, www.news.wfu.edu
93 “Washington University in St. Louis Announces New Goal for Campaign,” Washington University in St. Louis, Jan 22, 2016, www.together.wustl.edu; “Together, We Lead,” Washington University in St. Louis, retrieved May 2017, www.together.wustl.edu
94 “WVU’s ‘State of Minds’ Fundraising Campaign Tops Historic $1 Billion Goal,” WVU Today, West Virginia University, September 30, 2016, www.wvutoday-archive.wvu.edu; “A State of Minds,” The Campaign for West Virginia University, retrieved May 2017, www.
astateofminds.com 95 “Marking a Milestone,” BC News, Boston College,
October 03, 2016, www.bc.edu 96 “Board Celebrates Successful Capital Campaign,
Dedication of New Buildings,” Georgetown University, October 14, 2016, www.georgetown.edu; “For Generations to Come: The Campaign For Georgetown,” Georgetown University, retrieved March 2017, www.campaign.georgetown.edu; “The Campaign for Georgetown and ‘The Power of Many’ Break University Fundraising Records,” Georgetown University, retrieved March 2017, www.giving.georgetown.edu
97 “But for Ohio State Campaign Tops $3 billion,” The Ohio State University, September 29, 2016, www.news.osu.edu
98 The Annual Report of Private Giving,” University of California at Santa Barbara, 2016, https://giving.ucsb.edu/Content/Documents/private-giving-15-16.pdf
99 “Arizona NOW Campaign Finishes at $1.59B,” UANews, University of Arizona, February 15, 2017, www.uanews.arizona.edu; Elizabeth Baker, “UA’s Arizona Now Campaign Aims to Raise $1.5 Billion,” UANews, University of Arizona, April 14, 2014, www.uanews.arizona.edu
100 “For Iowa. Forever More: The Campaign for the University of Iowa Concludes as the Most Successful Fundraising Campaign in the History of the University and the State of Iowa,” University of Iowa Foundation, February 5, 2017, www.uifoundation.org; “UI announces ‘For Iowa. Forever More.’ Campaign,” Iowa Now, University of Iowa, May 2, 2013, www.now.uiowa.edu
101 Erin Martin Kane, “Far Above: The Campaign for Kansas Raises More than $1.6 Billion,” The University of Kansas, August 2, 2016, www.news.ku.edu
102 “Meliora Challenge Campaign Exceeds Expectations with Historic $1.37 Billion,” University of Rochester, July 7, 2016, www.rochester.edu/newscenter; “Final Report on the Meliora Challenge,” Rochester University, retrieved March 2017, www.campaign.rochester.edu
103 “Educational Endowments Report -1.9% Return for FY2016 as 10-Year Return Falls to 5.0%,” National Association of College and University Business Officers, January 31, 2017, http://www.nacubo.org/Documents/about/pressreleases/2016%20NCSE%20Press%20Release%20FINAL.pdf
104 Same as note 103.105 Same as note 103.106 Same as note 103.107 Same as note 103, pg. 8108 Good to Know section authored by Editorial Review Board
member Angela E. White.109 “Alumna Florence Fearrington Gives $5 Million to Wilson
Special Collections Library,” University of North Carolina at Chapel Hill News, University of North Carolina at Chapel Hill, October 18, 2016, www.uncnews.unc.edu
110 Stephanie Michaud, “UCLA Powell Library Gets $5 Million from Another Powell!” MyNewsLA.com, December 15, 2016, www.mynewsla.com
111 “IndyPL Announces Major Grants for New Projects,” Indianapolis Public Library Foundation, October 3, 2016, www.indyplfoundation.org
112 Mary Platt, “Naming Gift to Law Library Also Brings
Giving USA Giving to Education
Giving USA FoundationTM | Giving USA 2017 | 215

Chapman a Winston Churchill Bust,” Chapman University, June 24, 2016, www.blogs.chapman.edu; Gabrielle Karampelas, “Stanford Libraries Leads Collaborative Grant to Leverage Linked Data for Enhanced Access to Information,” Stanford Libraries, Stanford University, April 22, 2016, www.library.stanford.edu
113 Peter Olsen-Phillips, “How the 2016 Philanthropy 400 Was Compiled,” The Chronicle of Philanthropy, October 27, 2016, www.philanthropy.com
114 The Chronicle of Philanthropy does not use the NTEE coding system for categorizing nonprofit organizations as does Giving USA; therefore, listings here for the Chronicle may vary from how Giving USA categorizes organizations. Note that Giving USA categorizes gifts to libraries under the giving to education subsector. “The 2016 Philanthropy 400,” The Chronicle of Philanthropy, October 27, 2016, www.philanthropy.com
115 “The 2016 Philanthropy 400,” The Chronicle of Philanthropy, October 27, 2016, www.philanthropy.com
116 Heather Joslyn, Drew Lindsay, Timothy Sandoval, and Eden Stiffman, “Nonprofits That Saw Big Gains in the Philanthropy 400,” The Chronicle of Philanthropy, October 27, 2016, www.philanthropy.com
117 Benchmarking 2015: Trends in Education Philanthropy. Grantmakers for Education. 2016, http://edfunders.org/sites/default/files/Benchmarking_2015_web.pdf
118 Same as note 117.119 Same as note 117, pg. 6120 Same as note 117.121 Information received from Paul Arnsberger, Internal
Revenue Service, April 2017, www.irs.gov
216 | Giving USA FoundationTM | Giving USA 2017
Giving USA Giving to Education

Giving toHumanServices
Contributions to the human services subsector comprised 12 percent of all donations received by charities in 2016.1
Giving to human services organizations grew 4.0 percent in 2016, totaling $46.80 billion. Adjusted for inflation, giving to human services increased 2.7 percent between 2015 and 2016.
Contributions to human services in 2016 totaled the highest inflation-adjusted amount recorded to date.
Giving USA FoundationTM | Giving USA 2017 | 217
11 |

The information provided in this chapter derives from a number
of sources, including publicly available reports, news stories, and websites from the most recent year. This chapter is meant to provide context for the giving trends reported in this edition of Giving USA and to illustrate some of the practical implications of the data. It is not intended to be a comprehensive survey of the subsector, but rather a collection of examples from the field.
Trends in giving to human services in 2016
Giving to human services marked its third consecutive year of growth in 2016.5 In the last five-year period (2012 to 2016), giving to this subsector experienced an average annual rate of growth of 4.6 percent—making it the third-slowest growing subsector of nine. Giving to human services failed to outpace the five-year average rate of growth in total giving of 5.6 percent. However, the two-year (2015 and 2016) growth rate in giving to human services
218 | Giving USA FoundationTM | Giving USA 2017
Giving USA Giving to Human Services
Practitioner Highlights Multiple sources confirm a continued upward trend in giving to human
services organizations. In part, giving to the human services subsector was supported by grant dollars from donor-advised funds: human services organizations ranked first or second in total grant dollars awarded by the three largest national donor-advised fund sponsors.2
National and regional human service nonprofits responded to domestic disasters in 2016, such as the flooding in the southern region of the United States. However, the funding efforts for these disasters were sparse compared to other events in previous years.3
Many nonprofit organizations, foundations, and government agencies are joining forces to tackle challenging issues in the human services sector, including homelessness and disasters like the Flint water crisis in 2016.4

(8.1 percent) exceeded the two-year growth rate in total giving (6.8 percent).
Several reports issued in 2017 reveal positive results for giving to human services organizations in 2016. The results of these reports are provided throughout the rest of this opening narrative and chapter. Different methodological and sampling approaches account for the differences seen between these sources and Giving USA data. Some highlights from 2016 on giving to this subsector include:
Sixty-seven percent of human services organizations responding to the Nonprofit Research Collaborative’s Winter 2017 Nonprofit Fundraising Survey reported an increase in charitable contributions received between 2015 and 2016.6 This percentage was higher than the 60 percent of all organizations that reported an increase in contributions in the same period.7
In spring 2017, Blackbaud reported that among its sample of over 6,800 nonprofits, giving to human services organizations realized an increase of 1.7 percent between 2015 and 2016.8 Human services organizations realized the greatest year-over-year monthly increase in overall charitable revenue in the three-month period ending in November (10.9 percent), while giving to these organizations reached its lowest point in May, with a 2.8 percent decline.9
In 2016, more human services organizations appeared on the annual Chronicle of Philanthropy’s Philanthropy 400 list of the top U.S. charities than in the previous year.10 Three social service organizations placed in the top five, as specified by total funds raised from private sources. For the second time in the history of the Philanthropy 400, United Way Worldwide failed to place at the top. Rather, United Way Worldwide landed in 2nd place, followed by Feeding America (3rd) and Catholic Charities USA (4th).
To provide additional context for giving to human services in 2016 and in recent years, the following sections offer detail on recent trends, related campaigns, and news for this subsector.
Giving USA Giving to Human Services
Giving USA FoundationTM | Giving USA 2017 | 219

Online giving to human services was largely positive in 2016
Three different reports noted mostly positive results for giving to human services organizations in 2016 via online methods. While different methodological and sampling approaches account for the variations seen between these sources and Giving USA data, these reports highlight trends seen by specific types of human services organizations.
In spring 2017, Blackbaud reported online giving to its sample of human services organizations realized an increase of 11.8 percent between 2015 and 2016.11 Human services organizations saw the greatest year-over-year monthly increase in online charitable revenue in the three-month period ending in November (24.4 percent), while online giving to these organizations slowed the most in the three-month period ending in March (4.2 percent).12
According to Blackbaud’s Luminate Online Benchmark Report 2016, total online revenue for human and social services organizations rose 7.0 percent in 2016.13 Likewise, total online revenue for food banks rose 6.0 percent. Year-over-year growth in online revenue for human services organizations outpaced
the growth in overall online revenue, which was 4.9 percent. Similar to trends seen for all types of organizations, human and social service organizations and food banks saw a decline in first-time online transactions as a percentage of total fundraising, but noted an increase in repeat and sustainer (monthly recurring) online transactions.
In addition, the Benchmarks 2017 report by M+R and NTEN reported positive results for online giving to a sample of hunger/poverty organizations for the year 2016.14 These organizations experienced a 6 percent increase in online revenue in 2016 over 2015, driven by strong growth in email-driven revenue (39 percent), monthly (recurring) online revenue (37 percent), and number of online gifts (11 percent). Total online giving to this subsector was hampered by a 3.1 percent decline in average gift size.
Grants from national donor-advised funds to human services strong in 2015 and 2016 fiscal years
For the year 2016, Giving USA estimates that 12 percent of all charitable giving went to the human services subsector. For the three largest national (or commercial) donor-advised funds, the percentage of total grantmaking to human services organizations ranged between 10
220 | Giving USA FoundationTM | Giving USA 2017
Giving USA Giving to Human Services

percent and 28 percent in fiscal years 2015 and 2016.15 Specific results for grantmaking to human services organizations in this period include:16
In calendar year 2015, Fidelity Charitable Gift Fund (Fidelity Charitable) made 733,936 grants totaling $3.1 billion, with the human services subsector receiving the second-largest percentage of grants by dollars (10 percent) and volume (18 percent).17 Donors often ask that Fidelity Charitable makes a charitable selection on their behalf with the designation “where needed most.”18 Among all human services grants, 58 percent had such a designation.
In fiscal year 2016, Schwab Charitable issued approximately
$1.2 billion in grants to the human services subsector (28 percent to health and human service organizations, and 10 percent to social services and benefits).19 In addition, the majority of Schwab Charitable’s top five organizations in terms of largest volume of grants received in fiscal year 2016 were human service organizations, including: Feeding America, The Salvation Army, United Way, and Habitat for Humanity.
In fiscal year 2016, Vanguard Charitable made 71,185 grants totaling $704.5 million to charities, with human services organizations capturing 21 percent of total grant dollars.20 Human services was the second-largest category of recipient organizations.
The Flint water crisis
On April 25, 2014, following the city council’s cost-savings recommendation, the city of Flint, MI, switched its water supply source from Lake Huron to the Flint River.21 This switch produced a cascade of serious problems for the city’s residents that continue to the date of this publication. These issues include contamination of the water supply by different types of deadly bacteria, the level of chemicals used to treat the bacteria-laden water, and highly toxic levels of lead. Lead is particularly
Giving USA Giving to Human Services
Giving USA FoundationTM | Giving USA 2017 | 221
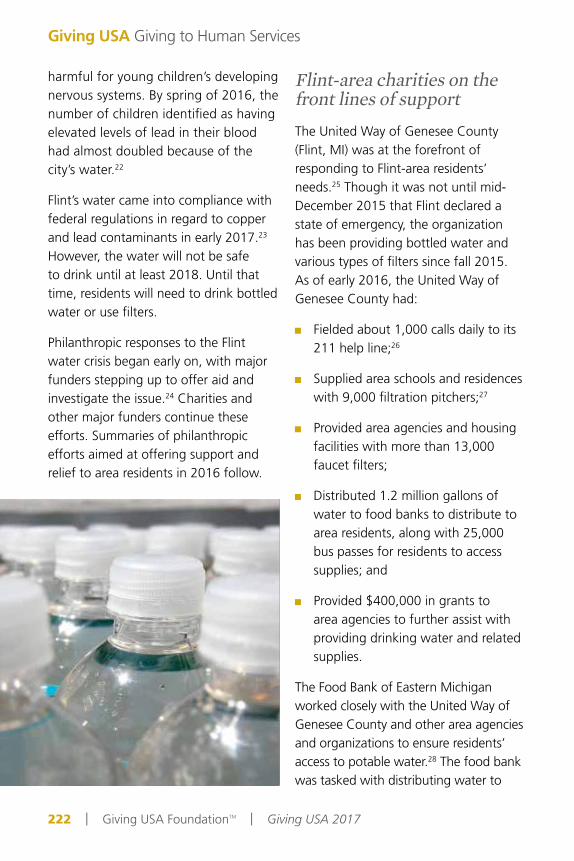
harmful for young children’s developing nervous systems. By spring of 2016, the number of children identified as having elevated levels of lead in their blood had almost doubled because of the city’s water.22
Flint’s water came into compliance with federal regulations in regard to copper and lead contaminants in early 2017.23 However, the water will not be safe to drink until at least 2018. Until that time, residents will need to drink bottled water or use filters.
Philanthropic responses to the Flint water crisis began early on, with major funders stepping up to offer aid and investigate the issue.24 Charities and other major funders continue these efforts. Summaries of philanthropic efforts aimed at offering support and relief to area residents in 2016 follow.
Flint-area charities on the front lines of supportThe United Way of Genesee County (Flint, MI) was at the forefront of responding to Flint-area residents’ needs.25 Though it was not until mid-December 2015 that Flint declared a state of emergency, the organization has been providing bottled water and various types of filters since fall 2015. As of early 2016, the United Way of Genesee County had:
Fielded about 1,000 calls daily to its 211 help line;26
Supplied area schools and residences with 9,000 filtration pitchers;27
Provided area agencies and housing facilities with more than 13,000 faucet filters;
Distributed 1.2 million gallons of water to food banks to distribute to area residents, along with 25,000 bus passes for residents to access supplies; and
Provided $400,000 in grants to area agencies to further assist with providing drinking water and related supplies.
The Food Bank of Eastern Michigan worked closely with the United Way of Genesee County and other area agencies and organizations to ensure residents’ access to potable water.28 The food bank was tasked with distributing water to
222 | Giving USA FoundationTM | Giving USA 2017
Giving USA Giving to Human Services

dozens of partners including churches, schools, and neighborhood centers, in Flint and the surrounding area. In late January 2016, the food bank got a boost when Governor Rick Snyder approved a $28 million supplemental budget request.29 Funding from the request supported 100 truckloads of nutritional food delivered over the course of 2016 that specifically aimed to reduce the effects of lead exposure.
The American Red Cross (ARC) of East Central Bay-Michigan also played a key role in supporting residents during and after the peak of the water crisis.30 The ARC brought in nearly 1,000 volunteers to help distribute potable water and supplies in late 2015 and early 2016 and helped convene area agencies in coordinating relief efforts.
Long-standing philanthropic powerhouses play important role in ensuring justice in the Flint water caseEarly in the Flint incident, both philanthropic institutions and nonprofits played key parts in exposing the water issue and addressing the ramifications. A journalist with the American Civil Liberties Union (ACLU) of Michigan broke the scandal behind Flint’s water crisis.31 The journalist’s position was in part funded by the Ford Foundation, which had given the ACLU an additional $250,000 grant in 2012 to investigate the effects of Michigan’s controversial new law that allowed a Governor-appointee
(rather than an elected official) to act as emergency manager.32 The journalist chose to investigate Flint because a Governor-appointed emergency manager was then in control of the city.
In February 2016, the ACLU of Michigan, the National Resources Defense Council (NRDC), Concerned Pastors for Social Action, and other organizations and groups filed a class-action lawsuit on behalf of Flint residents.33 The lawsuit calls for the state to comply with federal protocols that aim to keep drinking water safe and to rebuild Flint’s water infrastructure swiftly, without costs incurred to residents.
In addition to the Ford Foundation and the ACLU, the Charles Stewart Mott Foundation has played a key role in bringing relief to area residents.34 After it was revealed that children were exposed to elevated levels of lead in the water supply, the foundation provided $100,000 in immediate funding for water filters and pledged to cover one-third the cost ($4 million) to reconnect Flint with the Detroit water system.
Collaboration is key for Flint-area fundersIn May 2016, 10 foundations—including the Charles Stewart Mott Foundation—announced a collaborative effort to help Flint recover from the water crisis.35 The foundations, which also include the Carnegie Corporation of New York, the FlintNOW Foundation,
Giving USA Giving to Human Services
Giving USA FoundationTM | Giving USA 2017 | 223

the Ford Foundation, the W.K. Kellogg Foundation, The Kresge Foundation, and others, committed a combined $125 million toward a six-point plan. Initiatives as outlined by the plan include funding programming for lead-exposed children’s recovery, assisting early childhood education, and instigating plans to stimulate the local Flint economy.
One important outcome of the multi-funder collaboration was the opening of Cummings Great Expectations: An Early Childhood Program in October 2016.36 The center provides free pre-K learning programs specifically aimed at countering the effects of lead exposure. Long-term operating costs will be paid for by state and federal funds and foundation grants. Other recipients of the partnership include Flint Rising, an advocacy organization developed in response to the
water crisis; Mott Community College; and the Community Foundation of Greater Flint, among others.
Homelessness issues and trends
According to the 2016 U.S. Conference of Mayors’ Report on Hunger and Homelessness, on one January night in 2016, there were 544,084 persons experiencing homelessness in the U.S.37 While a large number, the rate of homelessness has been on the decline over the last several years—a 12.9 percent drop between 2009 and 2016 and a 2.6 percent drop between 2015 and 2016.
The decline in the number of U.S. residents currently homeless is attributed to an increase in permanent housing, rapid rehousing solutions, and interventions targeting the most vulnerable populations like veterans, those with mental illness, and youth.38 Increases in permanent housing were in part shaped by the U.S. Department of Housing and Urban Development’s shifting budget priorities: in June 2016, HUD began to make cuts to transitional housing and increase spending on long-term and permanent housing solutions, even factoring into their spending decisions whether local groups are fighting some municipalities’ criminalization of homelessness.39
The summaries below demonstrate efforts by nonprofits and nonprofit funders working with one another
224 | Giving USA FoundationTM | Giving USA 2017
Giving USA Giving to Human Services
Southwest Autism Research and Resource Center

and with their communities in 2016 to dramatically reduce the number of persons experiencing homelessness and to create long-term solutions for this serious national issue.
Homeless vet populationdeclines in several majorcities in 2016Homelessness among U.S. veterans nationwide declined 47 percent between 2010 and 2016.40 In 2016, homelessness among this population declined 17 percent from one year prior and the Veterans Affairs’ (VA) office announced that many cities and counties, including Philadelphia, Houston, Dayton, Austin, and more, had effectively achieved the goal of zero homelessness among veterans.41 Other major cities like New
York and Boston have put an end to chronic homelessness among vets. These stats run counter to many of the long-standing trends on homelessness annually announced in Giving USA and other publications. The drastic decline in veterans experiencing homelessness is the result of a 2009 VA initiative “Opening Doors,” which was the first federal-level strategic plan specifically aimed at eliminating homelessness among veterans.42
Since the inception of the strategic plan, which incorporated evidence-based practices like Housing First, the VA has partnered with local and state governments and public and private entities tasked with the single goal of helping veterans get off the streets.43 The VA provides or contracts with
Giving USA Giving to Human Services
Giving USA FoundationTM | Giving USA 2017 | 225

local nonprofits to provide residential placements, healthcare, job training, and other services to assist veterans with long-term housing success.
The task of identifying, tallying, and assisting vets experiencing homelessness has been a monumental undertaking, but one that Loree Sutton, New York City’s Commissioner to the Mayor’s Office of Veterans’ Affairs, notes comes down to building relationships among a coalition of charities.44 In New York, organizations like Catholic Charities and the Jericho Project took on the role of efficiently placing veterans into homes, while the Office of Veterans’ Affairs and other city departments provided administrative assistance, manpower, and logistical support.
Cities take action to addresshomelessnessIn 2016, for the second year running, the U.S. Department of Housing and Urban Development (HUD) named Los Angeles (L.A.) as the city with the most residents experiencing chronic homelessness.45 In 2016, the L.A. Homeless Services Authority estimated the current L.A. homeless population at almost 47,000, a 6 percent increase over 2015.
In June 2016, the supervisors of Los Angeles County voted unanimously to call for the governor to issue a state of emergency in regard to the homelessness crisis.46 While California
Governor Jerry Brown declined to issue the state of emergency, the County supervisors’ move highlighted the continued need for the city and state to rapidly address the problem. On Election Day, November 8, 2016, L.A. residents voted for a $1.2 billion bond measure called “Measure H,” a key aspect of the County’s Homeless Initiative developed earlier in the year.47 The initiative is comprised of 47 strategies focused on the reduction and prevention of homelessness, and involves the collaboration of over 100 community organizations, several public agencies, and 30 cities.
Almost immediately after the passage of Measure H, C3 (county, city, and community) teams were on the ground
226 | Giving USA FoundationTM | Giving USA 2017
Giving USA Giving to Human Services

engaging with populations experiencing homelessness and providing critical services like medical care.48 The city fast-tracked the placement of currently homeless residents and provided comprehensive services to the most vulnerable citizens.49
In the long-term, nonprofit funders like the California Community Foundation (CCF) and nonprofit housing developers like People Assisting The Homeless (PATH), Mercy Housing California, and others will work together to provide permanent housing for L.A.’s currently homeless population.50 In early 2016, CCF, the Conrad N. Hilton Foundation, and the Weingart Foundation announced a collaborative effort to fund $16 million in loans and grants toward establishing permanent housing in L.A. These funds are in addition to $138 million the Mayor’s Office committed in early 2016 toward building permanent housing and adjunct services.
Seattle initiative aims to curb student homelessnessNorthwest-area funders including the Raikes Foundation, the Bill & Melinda Gates Foundation, the Paul G. Allen Family Foundation, and Campion Foundation joined forces with Columbia Legal Services and Building Changes to address homelessness among K–12 students in Washington State.51 The funders will provide a combined $1.8 million toward the Schoolhouse
Washington initiative, which aims to create strategies that assist students experiencing homelessness, as well as their families and schools. Over the past decade, the number of grade K–12 students experiencing homelessness increased 111 percent in Washington public schools, with a large percentage of these youth having minority racial and ethnic backgrounds.
San Francisco public-private partnership to provide housing for familiesIn December 2016, San Francisco announced the creation of the Heading Home Campaign, a public-private collaboration to house 800 area families in three years.52 The $30 million initiative, of which $15 million came from private funders including Marc and Lynne Benioff and the Hellman Foundation, will rapidly house or re-house families in need through rental assistance and supportive services. San Francisco-based nonprofits like Hamilton Families and many others will work closely with the local school system and the city to support the collaboration.
Giving USA Giving to Human Services
Giving USA FoundationTM | Giving USA 2017 | 227

As hunger increases, U.S. communities respond
The 2016 U.S. Conference of Mayors’ Report on Hunger and Homelessness report reveals that 41 percent of the large cities surveyed by the conference saw an increase in emergency food assistance requests from their respective residents between 2015 and 2016.53 In addition, 71 percent of these cities reported an increase in first-time requests.
In general, the report reveals that hunger among Americans impacts many demographics.54 Two-thirds of those requesting assistance were doing so on behalf of families and more than half were employed. Moreover, nearly one in five persons requesting assistance were elderly and less than 10 percent were experiencing homelessness. The most common reason cited for need of food assistance was low wages, while high housing costs, general poverty, and high medical costs were cited as other reasons.
The summaries below provide detail on how nonprofits and communities worked together in 2016 to solve issues of hunger and nutrition across the U.S.
Gleaning in 2016According to the U.S. Department of Agriculture (USDA), gleaning is “the act of collecting excess fresh foods
from farms, gardens, farmers’ markets, grocers, restaurants, state/county fairs, or any other sources in order to provide it to those in need.”55 Gleaning aims to capture the more than 100 billion pounds of food that goes to waste annually in the U.S., which amounts to 20 percent of the national food supply. In comparison to the food waste numbers, approximately 49 million U.S. citizens, or 15 percent of the U.S. population, are at risk of hunger.56
Since President Bill Clinton’s signing of the Good Samaritan Act in 1996, which enabled the donation of food free of liability, organizations that rely on the gleaning process have grown substantially.57 Today, Feeding America, a national network of food banks and public and private partners, Farmers Market Coalition, Ample Harvest, and community and faith-based organizations partner with food donors all across the U.S. to provide low-income communities access to nutritious food and nutrition education through the process of gleaning.58
In 2015 and 2016, the largest U.S. food banks and gleaners reported the following results:
In fiscal year 2016, Feeding America secured 1.3 billion pounds in retail donations and rescued 2.8 billion pounds of food from being discarded.59 Through its 200 food banks and 60,000 pantries and meal programs, 4 billion meals were served
228 | Giving USA FoundationTM | Giving USA 2017
Giving USA Giving to Human Services

by Feeding America in 2016, an 8 percent increase over 2015. Feeding America’s total revenue raised through public support, including food donations, increased 11 percent in 2016 over 2015.
One of the nation’s largest food banks, the Houston Food Bank, distributed 79 million meals in fiscal year 2015–2016.60 In 2015, the latest year for which data are publicly available, the food bank received $152 million in donated food and household items, or 85 percent of its total revenue.61 Annually, the Houston Food Bank and its area partners feed 800,000 Houston-area residents.62
The Society of St. Andrew, one of the nation’s longest-running gleaners, saved and distributed more than 28 million pounds of food and approximately 85 million servings through the work of nearly 32,500 volunteers in 2015.63 Donated produce in 2015 captured 85 percent of the organization’s total revenue of $16.5 million, while private contributions of $2.5 million comprised the majority of the remaining revenue.
The Greater Boston Food Bank (GBFB) distributed 57.7 million pounds of food, or 48.1 million meals, to residents in the Boston metro area in 2016.64 GBFB raised $15.5 million in total revenue, including 2.6 million
pounds of food that were donated from 440 food donation partners.
The Oregon Food Bank received $34.6 million in food donations, or 50.3 million pounds of food, in fiscal year 2016, amounting to 78 percent of total in-kind donations and pass-through revenue.65 In addition, the food bank received $12.8 million in private contributions. Through its Fresh Alliance program, the food bank donated 18 million pounds of food, amounting to 15 million meals.
Nonprofit grocery storesattend to the needs of thoseliving in food deserts According to USDA, an estimated 23 million Americans live in food deserts.66 A food desert is a geographic area where fresh and nutritious food is inaccessible within a specified radius. Food deserts have become a problem in recent years, especially as major grocery chains close up stores in low-income rural and urban communities.67 Food deserts disproportionately affect minority and low-income households and contribute to higher rates of obesity and heart disease in these communities.
To address the needs of those living in food deserts, nonprofit grocery stores are being created to fill the food gap in low-income rural and urban communities.68 As one example, in late 2016, with $500,000 in raised funds, Mission Waco, a faith-based charity,
Giving USA Giving to Human Services
Giving USA FoundationTM | Giving USA 2017 | 229

opened the Jubilee Food Market, a nonprofit store in the middle of a Waco, Texas, food desert. The store is housed in a renovated building that once was home to a Safeway grocery and will help many residents avoid having to walk more than two miles to the nearest grocer that supplies fresh food.69
In South Dakota, Lake Grocery is an employee-owned community grocery that has been in operation since 2010.70 The nonprofit store relies on donations for capital improvements and offers low-
cost grocery items to the community. In Bowden, North Dakota, a similar story emerged with the development of the Bowden Community Grocery.72 The nonprofit store was established through the purchase of $10 memberships and $50 equity shares from community residents.
Domestic disaster-recovery efforts in 2016
Nonprofits and philanthropic action have long played a central role in assisting people in need following both natural and man-made disasters. Yet, despite nonprofits’ experience in this arena, disaster response continues to be reactive rather than proactive.73 Disaster-focused nonprofits typically fundraise after the disaster strikes and when need is greatest.
The Center for Disaster Philanthropy (CDP), in partnership with Foundation Center, recommends that philanthropy’s current approach, focusing on crisis-driven response, is unsustainable and does not meet the needs of disaster victims.74 Leaders from CDP and Foundation Center call for increased intention and collaboration among groups in addressing needs following disasters. Domestic disasters, specifically 2016 flooding events, may provide evidence that nonprofits continue to espouse reactive disaster strategies.
230 | Giving USA FoundationTM | Giving USA 2017
Giving USA Giving to Human Services
Good to KnowThe human services sector saw notable growth in online giving toward the end of 2016.71 Organizations have the opportunity to capitalize on online giving by focusing on retaining first-time donors and encouraging loyal donors to upgrade their gifts or become monthly sustainers. Consider the following strategies:
Send new online donors a brief online survey asking what motivated their gift, how they would like to hear from you, and whether they want to learn more about any particular areas of your work.
Explicitly ask loyal donors for an upgraded or monthly gift and make the case in your appeals for what increased impact and/or sustainable support will have on those you serve.
Consider asking your board or other key supporters to issue a matching challenge specifically targeting upgraded or new monthly donations.

Giving USA Giving to Human Services
Giving USA FoundationTM | Giving USA 2017 | 231
Flooding in southern Louisiana In August 2016, devastating floods swept through southern Louisiana, causing more than $10 billion in damage.75 By comparison, the economic impact caused by Hurricane Sandy in 2012 amounted to $8.3 billion.76 More than 60,000 homes and 6,000 businesses were damaged by the flood, and the vast majority of the homes did not have flood insurance coverage.
Soon after the rain lifted, several organizations were on the ground: the American Red Cross (ARC), the Disabled American Veterans (DAV) Disaster Relief Response Team, All Hands Volunteer, Second Harvest Food Bank of Greater New Orleans and Acadiana, and Volunteer Louisiana, among others.77 These organizations, along with the Federal Emergency Management Agency’s (FEMA) Disaster Recovery Centers and Transitional Shelter Assistance program, provided aid to thousands of area residents and volunteers.78
Despite the magnitude of the flood, contributions and volunteers to support relief efforts were slow to arrive.79 Commentators and agency leaders speculated that the U.S. presidential election and the 2016 Summer Olympic Games consumed media coverage while Americans were likewise distracted.80
Key organizations struggled to raise funds for southern Louisiana relief efforts.81 The ARC received contributions totaling $7.8 million within a week following the end of the torrential rains, $22 million less than the organization needed to provide services. The Baton Rouge Area Foundation received $750,000 in online contributions and $2 million in pledges, less than a third of what the foundation received following Hurricane Katrina in the same period. The Salvation Army received slightly more than $450,000 and $1.5 million in pledges in the first week of the disaster, but struggled to rally all of its resources due to damage to both its facilities and the homes of would-be responders.
Islamic Relief USA responds to Hurricane Matthew disaster in North Carolina and other domestic disasters in 2016 Hurricane Matthew formed in the Caribbean in late September 2016 and made its way up the eastern coast of the southern U.S. through the first few days of October.82 Many coastal islands and cities saw major flooding and damage from high winds; 20 people were killed and 4,000 people were placed in shelters.83 Days after the hurricane lifted on October 9, volunteers from Islamic Relief USA’s (IRUSA) Disaster Response Team (DRT) arrived in North Carolina to assist with relief and recovery efforts.84 IRUSA is a National Voluntary

Organizations Active in Disasters (VOAD) member, an association of disaster-relief organizations.85 The DRT partners with the American Red Cross to provide disaster relief domestically.
IRUSA was founded in 1993 and today receives $100 million annually in charitable contributions.86 While most of its disaster-relief response efforts are focused on international crises in primarily Muslim conflict zones, it also provides domestic services. Beyond assisting with Hurricane Matthew relief, in 2016 IRUSA volunteers provided services at other disaster sites: in Louisiana after the flood, in Oklahoma following deadly tornados, in Flint, Michigan to help with the water crisis, in Washington State following wildfires, and others.87
Updated Human Needs Index released for 2016
In 2015, The Salvation Army, in partnership with the Indiana University Lilly Family School of Philanthropy, released The Human Needs Index (HNI).88 The index is a multidimensional tool that tracks poverty and its effects. The HNI pulls data from 7,500 Salvation Army service centers nationwide and tracks seven elements of basic human needs: meals provided, groceries, clothing, housing, furniture, medical assistance, and help with energy bills.89
According to the index, the national score indicates the overall level of human need for basic social services.90
232 | Giving USA FoundationTM | Giving USA 2017
Giving USA Giving to Human Services

A zero score represents zero need. According to the latest update released in May 2017 for the year 2016, the national HNI was 1.239, remaining level with the 2015 HNI of 1.245.91 For state-level patterns, the new report wave revealed that Nevada, Wyoming, Pennsylvania, Alaska, and Arkansas had the highest levels of need in 2016, with Wyoming experiencing the largest increase over 2015.92 Kansas, Nevada, Pennsylvania, Michigan, North Dakota, and Kansas continued to display high levels of poverty, consistently ranking as states with the most need since 2014.
The Salvation Army moves to increase online giving
According to two different Blackbaud reports, online giving to human services nonprofits posted strong gains in 2016, underlining the importance of digital payment methods to these organizations.93 In 2015, just 2 percent of The Salvation Army’s 2015 Red Kettle drive contributions were made online.94 To increase donors’ online presence and engagement with the 125-year campaign, The Salvation Army launched its “Red Kettle Reason” campaign in late 2016.95 The campaign enables individuals to create their own fundraising webpages to solicit contributions from personal networks and for specific Salvation Army causes.
Despite the move, total revenue from the traditional holiday campaign was down slightly in 2016, at $147.3 million, compared to 2015 ($149.6 million).96 Donations were reportedly affected by poor weather, according to officials from the organization.97 Nevertheless, a spontaneous publicity stunt by NFL player Ezekiel Elliot and planned efforts by the Green Bay Packers resulted in large spikes of donations to the campaign in mid-December.98
United Way Worldwide knocked from first place on the Philanthropy 400, other human services charities see strong increases in private revenue in 2016
The Chronicle of Philanthropy annually compiles a list of the top 400 public charities and private foundations.99 The Philanthropy 400 ranks charities according to the level of private donations received in the previous fiscal year. Private donations include gifts from all private sources—individuals, corporations, and foundations. Gifts of cash, shares of stock, in-kind donations, real estate, and valuables are included. To determine the rankings, the Chronicle compiles information from IRS Forms 990, annual reports, financial
Giving USA Giving to Human Services
Giving USA FoundationTM | Giving USA 2017 | 233

statements, and a questionnaire.
Philanthropy 400 data for giving in the fiscal year ending in 2016 includes 48 charities that are classified as social service organizations (compared with 44 charities reported in the prior year) and nine charities classified as youth organizations (compared with eight reported in the prior year). The top five human services organizations on the list with the greatest amount in private support are:100
Ranking 2nd: United Way Worldwide, Alexandria, VA, with $3.7 billion in private contributions, a decline of 4.2 percent from the previous year;
Ranking 3rd: Feeding America, Chicago, IL, with $2.1 billion in private contributions, an increase of 6.6 percent;
Ranking 5th: Catholic Charities USA, Alexandria, VA, with $2.0 billion in private contributions, a decline of 4.2 percent;
Ranking 6th: The Salvation Army, Alexandria, VA, with $1.9 billion in private contributions, a decline of 10.0 percent; and
Ranking 12th: The Y, Chicago, IL, with $1.2 billion in private contributions, an increase of 28.6 percent.
As shown above, a few of the largest human services organizations that annually lead the top 400 list saw declines in giving between 2015 and 2016, while others saw impressive increases.101 Gifts made to Habitat for Humanity International rose 16.3 percent, and food banks, such as the Midwest Food Bank, the Houston Food Bank, and the Northern Illinois Food Bank, all saw private giving rise.102 Also highlighted for exceptionally strong growth in 2016, Junior Achievement Worldwide realized a 10.2 percent increase over 2015. The increase in giving was attributed to a $25 million campaign, board development, and targeted appeals.
Key findings from annual studies
Table 1 presents three years of data from studies released annually about giving to the human services subsector. Website addresses are provided so readers can access the full reports.
234 | Giving USA FoundationTM | Giving USA 2017
Giving USA Giving to Human Services

References1 All data in this section are reported as estimates, which
are subject to revision. To provide the most accurate estimates for charitable giving, as new data become available, Giving USA revises its estimates for at least the last two years. See more about how Giving USA calculates charitable giving by sources and uses in the “Brief summary of methods used” section of this report.
2 Practitioner highlight authored by Editorial Review Board member Helen Starman.
3 Practitioner highlight authored by staff at the Indiana University Lilly Family School of Philanthropy.
4 Practitioner highlight authored by Editorial Review Board member Sarah K. Anderson.
5 This information is in current dollars. Giving to human services was flat in 2013 and therefore is not considered an increase.
6 The Nonprofit Research Collaborative (NRC) annually conducts surveys on fundraising trends across the nonprofit sector. In 2017, this collaboration included the Giving USA Foundation, the Association of Fundraising Professionals, CFRE International, the Association of Philanthropic Counsel, the National Association of Charitable Gift Planners, and Top Nonprofits. In early 2017, the NRC launched a survey to assess fundraising trends for the entire 2016 calendar year. The survey asked nonprofit leaders of public charities and foundations to report on changes in charitable revenue received and changes in the number of donors by specific donor type, among other questions. Data in this section come from
the Winter 2017 Nonprofit Fundraising Survey report from the Nonprofit Research Collaborative, May 2017, www.npresearch.org. A convenience sample of 1,019 respondents, 144 of them Canadian, constitutes the survey results.
7 Same as note 6.8 This information was provided to Giving USA directly
from Blackbaud in May 2017. The Blackbaud Index of Charitable Giving assesses changes in total charitable giving from year to year using a three-month rolling median of the charitable revenue reported by a selected sample of U.S. nonprofits. This information reflects data on total charitable giving reported by 6,857 organizations across the nonprofit sector, representing total charitable revenue of $23.6 billion in 2016. Online giving data are reported by 4,958 nonprofits with charitable support amounting to $2.7 billion in 2016. Month-by-month Blackbaud Index data on both online and total giving are available at www.blackbaud.com/nonprofit-resources/blackbaud-index. Note that Blackbaud data are constantly being updated; therefore, figures published in Giving USA may vary from current figures.
9 Year-over-year monthly giving data are from the Blackbaud Index, May 2017, https://www.blackbaud.com/nonprofit-resources/blackbaud-index
Giving USA Giving to Human Services
Giving USA FoundationTM | Giving USA 2017 | 235
Table 1 Key findings from other studies about giving to human services organizations
IRS Statistics of Income Bulletin103 Tax-exempt human services organizations: 2011–2013
www.irs.gov
2011 2012 2013
Number of returns 105,444 107,115 109,575
Charitable revenue $88.77 billion $90.92 billion $95.68 billion
Chapter authored by Melanie A. McKitrick, L.S.W., M.S.W., M.P.A., former Managing Editor of Giving USA and currently a mental health therapist in Indianapolis, IN.
Good to Know sections and Practitioner Highlights written by Giving USA Editorial Review Board members Helen Starman, Sarah K. Anderson, and staff at the Indiana University Lilly Family School of Philanthropy.

10 The Chronicle of Philanthropy does not use the NTEE coding system for categorizing nonprofit organizations as does Giving USA; therefore, listings here for the Chronicle may vary from how Giving USA categorizes organizations. “The 2016 Philanthropy 400,” The Chronicle of Philanthropy, October 27, 2016, www.philanthropy.com
11 Same as note 8.12 Same as note 9.13 Luminate Online Benchmark Report 2016, Blackbaud,
2017, www.blackbaud.com. Data from this report cover the fiscal year July 1, 2015 to June 30, 2016 for a sample of 631 nonprofit organizations that use Luminate Online cloud-based software by Blackbaud.
14 Benchmarks 2017, M+R and NTEN, 2017, www.e-benchmarksstudy.com. Note that this study uses a convenience sample of 133 organizations with online revenue totaling over $535 million and that the organizations types reported in this study do not necessarily match those used in Giving USA.
15 Annual Giving Report 2015, Schwab Charitable, 2015, https://www.schwabcharitable.org/public/file/P-9621623; 2015 Giving Report, Fidelity Charitable Gift Fund, 2015, http://www.fidelitycharitable.org/docs/giving-report-2015.pdf; 2015 Annual Report, Vanguard Charitable, 2015, http://www.simplyvariable.com/vanguardcharitable/files/assets/common/downloads/VanguardCharitableAnnualReport2015.pdf
16 Fiscal years vary among donor-advised fund sponsors, as do the release dates of their annual reports.
17 This is the latest data available at the time of this publication. 2016 Giving Report, Fidelity Charitable Gift Fund, 2016, https://www.fidelitycharitable.org/docs/giving-report-2016.pdf
18 Same as note 17, pg. 18.19 Annual Giving Report Fiscal Year 2016, Schwab
Charitable, 2017, https://www.schwabcharitable.org/public/file/P-8142068
20 Vanguard Charitable 2016 Annual Report, Vanguard Charitable, 2016, https://www.vanguardcharitable.org/2016/#20
21 “Flint Water Crisis Fast Facts,” CNN, April 10, 2017, www.cnn.com
22 Ridgway White, “Flint’s Crisis Raises Questions – and Cautions – About the Role of Philanthropy,” Philanthropy News Digest, April 8, 2016, www.philanthropynewsdigest.org
23 Liam Stack, “Lead Levels in Flint Water Drop, but Residents Still Can’t Drink It,” The New York Times, January 24, 2017, www.nytimes.com
24 Eden Stiffman, “Flint Philanthropies Consider Long-Term Response to Water Crisis,” The Chronicle of Philanthropy, February 3, 2017, www.philanthropy.com
25 Same as note 24.26 Same as note 24.27 “Flint Water Fund,” Char-Em United Way, retrieved April
2017, www.charemunitedway.org 28 Same as note 27.29 “Gov. Rick Snyder: Flint Families Will Have Better Access
To Nutritious Food through Partnership with Food Bank of Eastern Michigan,” The Office of Governor Rick Snyder, February 24, 2017, www.michigan.gov
30 Same as note 24.31 Same as note 24.32 Eden Stiffman, “Flint Philanthropies Consider Long-Term
Response to Water Crisis,” The Chronicle of Philanthropy, February 3, 2017, www.philanthropy.com; Amy Roe, “ACLU Reporter Who Exposed Flint’s Poisoned Water: Problem Flowed From a Toxic Concentration of Power,” American Civil Liberties Union, May 6, 2016, www.aclu-wa.org
33 Same as note 24.34 Same as note 22.35 “Ten Philanthropies Will Help Flint Recover and Rise from
Water Crisis,” Council of Michigan Foundations, May 11, 2016, www.michiganfoundations.org
36 Marti Benedetti, “How Philanthropic Dollars Are Helping Flint,” Crain’s Detroit Business, October 21, 2016, www.crainsdetroit.com
37 The U.S. Conference of Mayors’ Report on Hunger and Homelessness, The United States Conference of Mayors and National Alliance to End Homelessness, 2016, https://endhomelessness.atavist.com/mayorsreport2016
38 Same as note 37.39 “Shelters Take Hit as Government Changes Strategy on
Homeless,” The Chronicle of Philanthropy, June 9, 2016, www.philanthropy.com
40 “2016 Accomplishments,” U.S. Department of Veteran Affairs, retrieved April 2017, www.va.gov
41 “2016 Accomplishments,” U.S. Department of Veteran Affairs, retrieved April 2017, www.va.gov; “Ending Veteran Homelessness,” U.S. Department of Veterans Affairs, retrieved April 2017, www.va.gov; “VA is Working To End Homelessness Among Veterans,” U.S. Department of Veterans Affairs, retrieved April 2017, www.va.gov
42 “VA is Working To End Homelessness Among Veterans,” U.S. Department of Veterans Affairs, retrieved April 2017, www.va.gov
43 Same as note 42.44 Brian MacQuarrie, “Cities Across US Slash Homelessness
for Veterans,” The Boston Globe, March 14, 2016, www.bostonglobe.com
45 Maya Sugarman, “LA Has More Chronically Homeless than Any Other City. Here’s What It Is and What We’re Doing About It,” 89.3 KPCC, November 18, 2016, www.scpr.org
46 Abby Sewell, “L.A. County Supervisors Call for a State Emergency Declaration on Homelessness,” Los Angeles Times, June 14, 2016, www.latimes.com
47 “Measure H,” The Los Angeles County Homeless Initiative, retrieved April 2017, www.homeless.lacounty.gov/measure-h, para. 1
48 “The Power of Help,” The Los Angeles County Homeless Initiative, retrieved April 2017, www.homeless.lacounty.gov
49 Gale Holland and Doug Smith, “L.A. Votes to Spend $1.2 Billion to House the Homeless. Now Comes the Hard Part,” The Los Angeles Times, November 9, 2016, www.latimes.com
50 “Local Foundations Partner to Provide $16 Million for Housing Plan To Help Combat Homelessness in Los Angeles,” California Community Foundation, May 10,
236 | Giving USA FoundationTM | Giving USA 2017
Giving USA Giving to Human Services

2016, www.calfund.org51 “Foundations Launch Initiative to Support Homeless
Students in Washington State,” Philanthropy News Digest, September 25, 2016, www.philanthropynewsdigest.com
52 “San Francisco Launches Effort To Reduce Family Homelessness,” Philanthropy News Digest, December 13, 2016, www.philanthropynewsdigest.com
53 Same as note 37.54 Same as note 37.55 “Let’s Glean!” United We Serve Toolkit, The U.S.
Department of Agriculture, retrieved April 2017, https://www.usda.gov/sites/default/files/documents/usda_gleaning_toolkit.pdf; pg. 2
56 “Let’s Glean!,” United We Serve Toolkit, The U.S. Department of Agriculture, retrieved April 2017, https://www.usda.gov/sites/default/files/documents/usda_gleaning_toolkit.pdf; “U.S. and World Population Clock,” United States Census Bureau, 2016, www.census.gov/popclock
57 “What Is Gleaning?,” Food Forward, September 23, 2015, www.foodforward.org
58 Same as note 55.59 Data are based on the fiscal year. Nourishing Healthy
Futures: 2016 Annual Report, Feeding America, 2016, http://www.feedingamerica.org/about-us/about-feeding-america/annual-report/2016-feeding-america-annual-report.pdf
60 “Houston Food Bank Fact Sheet,” Houston Food Bank, retrieved May 2017, http://www.houstonfoodbank.org/media/155322/houston_food_bank_09.2016_bw.pdf
61 The Houston Food Bank and Subsidiaries, Consolidated Financial Statements and Independent Auditors’ Report for the Years Ended June 30, 2016 and 2015, Houston Food Bank, 2016, http://www.houstonfoodbank.org/media/158055/houston_food_bank_2016_fs.pdf
62 “About Us,” Houston Food Bank, retrieved May 2017, www.houstonfoodbank
63 2015 Annual Report, Society of St. Andrew, 2016, http://www.endhunger.org/PDFs/2016/2015_Annual_Report_Comp.pdf; Homepage, Society of St. Andrew, retrieved April 2017, www.endhunger.org
64 Data are based on the fiscal year. “GBFB FY16 Impact,” The Greater Boston Food Bank, retrieved April 2017, www.gbfb.org
65 Data are based on the fiscal year. Stats for all Oregon Food Bank’s distributions are not available. 2015–2016 Annual Report, Oregon Food Bank, 2017, http://www.oregonfoodbank.org/wp-content/uploads/2016/10/Annual-Report_2016.pdf
66 Same as note 55.67 Gayle Nelson, “Funding the Nonprofit Grocery Store: A
Variety of Models at Work,” Nonprofit Quarterly, April 1, 2016, www.nonprofitquarterly.org
68 Same as note 67.69 “Jubilee Market,” Mission Waco, retrieved April 2017,
www.missionwaco.org70 Bill Krikac, “Lake Grocery is Community-Owned Success
Story,” Clark County Courier via Dakotafire Media, July 30, 2015, www.dakotafire.net; Gayle Nelson, “Funding the Nonprofit Grocery Store: A Variety of Models at
Work,” Nonprofit Quarterly, April 1, 2016, www.nonprofitquarterly.org
71 Good to Know section authored by Editorial Review Board member Sarah K. Anderson.
72 Meg Luther Lindholm, “When the Local Grocery Store Failed, These Folks Stepped in To Lend It a Lifeline,” NPR, March 28, 2016, www.npr.org
73 Measuring the State of Disaster Philanthropy, Center for Disaster Philanthropy and Foundation Center, 2016, http://www.issuelab.org/resources/25866/25866.pdf
74 Same as note 73.75 Chris Dolce, “Louisiana’s Historic August Flooding
Cost More than $8 Billion, Officials Say,” The Weather Channel, September 5, 2016, www.weather.com; “Louisiana Flooding to Cost Economy $10 Billion; 80% of Damaged Homes Uninsured,” Claims Journal, September 9, 2016, www.claimsjournal.com
76 Holly Yan, “Louisiana’s Mammoth Flooding: By the Numbers,” CNN, August 22, 2016, www.cnn.com
77 Amy Chillag, Jennifer Grubb, Jacqueline Gulledge, and Christopher Dawson, “How To Help Louisiana Flood Victims,” CNN, August 29, 2016, www.cnn.com; Deborah Barfield Berry, “Louisiana Flood Victims Desperate for Volunteers, Money,” USA Today, August 26, 2016, www.usatoday.com
78 “Federal Support for Louisiana Continues, $127 Million in Financial Assistance Provided to Louisiana Flood Survivors So Far,” Federal Emergency Management Agency, August 23, 2016, www.fema.gov; Amy Chillag, Jennifer Grubb, Jacqueline Gulledge, and Christopher Dawson, “How To Help Louisiana Flood Victims,” CNN, August 29, 2016, www.cnn.com; Deborah Barfield Berry, “Louisiana Flood Victims Desperate for Volunteers, Money,” USA Today, August 26, 2016, www.usatoday.com
79 Holly Yan and Rosa Flores, “Louisiana Flood: Worst US Disaster Since Hurricane Sandy, Red Cross Says,” CNN, August 19, 2016, www.cnn.com; Deborah Barfield Berry, “Louisiana Flood Victims Desperate for Volunteers, Money,” USA Today, August 26, 2016, www.usatoday.com
80 Deborah Barfield Berry, “Louisiana Flood Victims Desperate for Volunteers, Money,” USA Today, August 26, 2016, www.usatoday.com; Ashley May and Mary Bowerman, “Louisiana Flooding Is Worst Disaster Since Sandy, but People Aren’t Talking about It,” USA Today, August 18, 2016, www.usatoday.com
81 Timothy Sandoval, “Slow Start for Donations to Aid La. Flood Victims,” The Chronicle of Philanthropy, August 23, 2016, www.philanthropy.com
82 “Hurricane Matthew Recap: Destruction from the Caribbean to the United States,” The Weather Channel, October 9, 2016, www.weather.com
83 “Hurricane Matthew,” Islamic Relief USA, retrieved April 2017, www.irusa.org; “Hurricane Matthew Recap: Destruction from the Caribbean to the United States,” The Weather Channel, October 9, 2016, www.weather.com
84 Abigail Hauslohner, “Their First Goal in Rural N.C. Was Disaster Relief. The Other: Being the Face of Islam in a Red State,” The Washington Post, October 20, 2016,
Giving USA Giving to Human Services
Giving USA FoundationTM | Giving USA 2017 | 237

www.washingtonpost.com; Madison Iszler, “Islamic Relief Group Helps North Carolina Recover from Hurricane Matthew,” News Observer, October 24, 2016, www.newsobserver.com
85 “VOAD Members,” National Voluntary Organizations Active in Disasters, retrieved April 2017, www.nvoad.org
86 Abigail Hauslohner, “Their First Goal in Rural N.C. Was Disaster Relief. The Other: Being the Face of Islam in a Red State,” The Washington Post, October 20, 2016, www.washingtonpost.com
87 Madison Iszler, “Islamic Relief Group Helps North Carolina Recover from Hurricane Matthew,” News Observer, October 24, 2016, www.newsobserver.com
88 Human Needs Index: A Timely, Multidimensional View of Poverty-Related Need, Indiana University Lilly Family School of Philanthropy, 2015, http://humanneedsindex.org/wp-content/uploads/2015/09/Executive-Summary.pdf
89 “Human Needs Index Fact Sheet,” The Salvation Army and Indiana University Lilly Family School of Philanthropy, retrieved May 2017, http://humanneedsindex.org/wp-content/uploads/2017/05/HNI-Fact-Sheet.pdf
90 Same as note 89.91 “Western and Rust Belt States Experiencing Persistently
High Levels of Need for Basic Services,” The Salvation Army, May 2017, http://humanneedsindex.org/wp-content/uploads/2017/05/HNI_PressRelease_May2017.pdf
92 Infographic: About Human Needs Index 2017, The Salvation Army and Indiana University Lilly Family School of Philanthropy, May 17, 2017, http://humanneedsindex.org/wp-content/uploads/2017/05/HNI-Infographic-2017-1.pdf
93 This information was provided to Giving USA directly from Blackbaud in May 2017. The Blackbaud Index of Charitable Giving assesses changes in total charitable giving from year to year using a three-month rolling median of the charitable revenue reported by a selected sample of U.S. nonprofits. This information reflects data on total charitable giving reported by 6,857 organizations across the nonprofit sector, representing total charitable revenue of $23.6 billion in 2016. Online giving data are reported by 4,958 nonprofits with charitable support amounting to $2.7 billion in 2016. Month-by-month Blackbaud Index data on both online and total giving are available at www.blackbaud.com/nonprofit-resources/blackbaud-index. Note that Blackbaud data are constantly being updated; therefore, figures published in Giving USA may vary from current figures; Luminate Online Benchmark Report 2016, Blackbaud, 2017, www.blackbaud.com. Data from this report cover the fiscal year July 1, 2015 to June 30, 2016 for a sample of 631 nonprofit organizations that use Luminate Online cloud-based software by Blackbaud.
94 Eden Stiffman, “Salvation Army’s Online Red Kettle Drive Lets Donors Earmark Gifts,” The Chronicle of Philanthropy, November 9, 2016, www.philanthropy.com
95 “#Red Kettle Reason,” The Salvation Army, retrieved April 2017, https://www.multivu.com/players/English/7958031-salvation-army-redkettlereason
96 “#Red Kettle Reason,” The Salvation Army, retrieved April 2017, https://www.multivu.com/players/English/7958031-
salvation-army-redkettlereason; “The Salvation Army’s 125th Red Kettle Campaign Sets New Fundraising Record with Nearly $150 Million Raised,” The Salvation Army, February 22, 2016, www.salvationarmyusa.org
97 Jessica Golden, “Salvation Army Donations Up 61% After Cowboy Elliott Jumps in Red Kettle,” CNBC, December 19, 2016, www.cnbc.com
98 Same as note 97.99 Peter Olsen-Phillips, “How the 2016 Philanthropy 400
Was Compiled,” The Chronicle of Philanthropy, October 27, 2016, www.philanthropy.com.
100 Same as note 10.101 Heather Joslyn, Drew Lindsay, Timothy Sandoval, and
Eden Stiffman, “Nonprofits That Saw Big Gains in the Philanthropy 400, The Chronicle of Philanthropy, October 27, 2016, www.philanthropy.com
102 “The 2016 Philanthropy 400,” The Chronicle of Philanthropy, October 27, 2016, www.philanthropy.com
103 Information received from Paul Arnsberger, Internal Revenue Service, April 2017, www.irs.gov
238 | Giving USA FoundationTM | Giving USA 2017
Giving USA Giving to Human Services

Giving to foundations amounted to 10 percent of total giving in 2016.1
Contributions to foundations increased 3.1 percent in 2016, to $40.56 billion in contributions. Adjusted for inflation, giving to foundations increased 1.8 percent. It is often the case that the annual shifts in foundations’ charitable receipts can be attributed to the difference in large gifts received from year to year.
The estimate for giving to foundations includes gifts made to independent, community, and operating foundations.
Giving to foundations reached its highest inflation-adjusted mark in 2014, at $44.41 billion.
Giving USA FoundationTM | Giving USA 2017 | 239
12 | Giving toFoundations

Independent, community, and operating foundations are
included in the estimate for giving to foundations. Independent foundations are also referred to as private foundations, and family foundations are included in this category. Giving USA excludes data on gifts made to the operating foundations established by corporations, which are calculated as part of the estimate for giving by corporations each year.
The information provided in this chapter derives from a number of sources, including publicly available reports, news stories, and websites from the most recent year. This chapter is meant to provide context for the giving trends reported in this edition of Giving USA and to illustrate some of the practical implications of the data. It is not intended to be a comprehensive survey of the subsector, but rather a collection of examples from the field.
Trends in giving to foundations in 2016
Charitable giving to foundations recovered in 2016 over 2015. After declining by 10.1 percent in 2015
240 | Giving USA FoundationTM | Giving USA 2017
Giving USA Giving to Foundations
Practitioner Highlights Giving to foundations can experience fluctuating growth rates, as
this subsector is dependent on the health of the financial market and bequests, which are difficult to predict. Giving to foundations has rebounded from its decline in 2015 by growing by 3.1 percent in 2016.2
Differences in fundraising and contributions persist between larger and smaller foundations (based on asset size). For instance, the largest 50 foundations received 44 percent of all foundation contributions in 2014.3
Creating a marketing event such as a giving day provides an opportunity to boost awareness around the benefits of giving to a foundation, to raise the organization’s presence and credibility, and to empower people to reach out about options for foundation-oriented giving.4

following a four-year period of rigorous growth, the sector showed gains once again in 2016.5 In the last five-year period (2012–2016), giving to foundations experienced an average annual growth rate of 5.5 percent. This rate of growth is on pace with the five-year annual average change in total giving of 5.6 percent.
As of May 2017, Foundation Search noted the existence of 122,232 charitable foundations.6 Of these foundations, 86,345 were private foundations and 1,065 were community foundations. Since May 2016, the number of private foundations identified in Foundation Search’s database declined 2 percent, and the number of community foundations declined 0.8 percent. An additional 1,405 foundations were company-sponsored, while the remaining organizations were counted as public charities.
Assets held within private foundations totaled $781 billion as of May 2017, a decline of 0.6 percent from one year prior.7 Assets of community foundations increased slightly, at 1.5 percent, from $71.3 billion to $72.4 billion, during this time period.
Giving to foundations tends to range considerably from year to year. Gifts to this subsector are often very large and dependent on the health of assets. Many gifts made to foundations are also made in the form of bequests. The timing of bequests is difficult to predict,
as estates sometimes choose to pay these gifts out several years after the decedent’s death.
To provide additional context for giving to foundations in 2016 and in recent years, the following sections provide detail on recent trends, related campaigns, and news for this subsector.
Trends in giving by mega-donors in 2016
Donations by America’s most generous donors, including living donors and estates, totaled $5.6 billion in 2016.8 This figure represents a 23.3 percent decline from 2015, when the total amount given by listed donors was $6.9 billion, according to The Chronicle of Philanthropy’s 2016 Philanthropy 50 list. The median gift made by these donors in 2016 was $55 million—44.5 percent below 2015.9 According to the article, a lack of sizable bequests, the nation’s focus on the 2016 presidential election, and unsteady stock market performance may have contributed to this decline in overall giving.10 Giving to foundations accounted for $684.1 million, or 12.2 percent of the total amount of donations over $1 million.11
Major gifts to foundations in 2016 included:
$284.0 million from Laura and John Arnold to the Laura and John Arnold Foundation in Houston, TX;12
Giving USA Giving to Foundations
Giving USA FoundationTM | Giving USA 2017 | 241

$141.4 million from Melinda and Bill Gates to the Bill & Melinda Gates Foundation in Seattle, WA;13
$75.0 million from Napster co-founder Sean Parker to the Parker Foundation in San Francisco, CA, which focuses on giving to health and life sciences;14 and
$64.25 million from real-estate developers Susan and John Sobrato to the Sobrato Family Foundation in California, which operates in the Silicon Valley area and targets local nonprofits.15
2016 marks the 10th year of Warren Buffett’s billion dollar charitable donationsIn 2006, billionaire Berkshire Hathaway CEO Warren Buffett pledged to give more than $30 billion over 20 years to the Bill & Melinda Gates Foundation and additional gifts to the foundations established by his family.16 Buffett donates Berkshire Hathaway shares to these foundations once each year, typically decreasing the percentage of stock he owns by 5 percent each year.17 In 2016, Buffett continued to honor his pledge by gifting 19.61 million class “B” Berkshire stock shares valued at about $2.86 billion in total.18 (Since The Chronicle of Philanthropy includes the entire amount of philanthropic pledges only in the year pledges are announced, these gifts are not included in this year’s Philanthropy 50 list.) Buffett’s 2016 gifts included:19
An estimated $2.2 billion (14.9 million shares) to the Bill & Melinda Gates Foundation in Seattle, WA;
An estimated $218.4 million (1.5 million shares) to the Susan Thompson Buffett Foundation in Omaha, NE, in honor of Mr. Buffett’s first wife, the late Mrs. Susan Thompson Buffett; and
An estimated $153 million (1.05 million shares) each to the three foundations operated by Buffett’s children: the Howard G. Buffett Foundation in Decatur, IL, founded by Howard G. Buffett; the NoVo
242 | Giving USA FoundationTM | Giving USA 2017
Giving USA Giving to Foundations

Foundation in New York, NY, co-founded by Jennifer and Peter Buffett; and the Sherwood Foundation in Omaha, NE, founded by Buffett’s daughter Susan Buffett.
In total, Buffett has gifted over $24.3 billion since 2006, with the bulk of the giving going to the Bill & Melinda Gates Foundation.20 At Buffett’s request, Bill and Melinda Gates wrote an open letter explaining gains and long-term goals in child and global health, the primary focuses of the foundation in the last 10 years.21
Study finds high-net-worth individuals express plans to establish private foundations rather than donor-advised fundsThe 2016 U.S. Trust Study of High Net Worth Philanthropy, a survey of America’s wealthiest households, revealed that high-net-worth individuals favor giving through private foundations rather than donor-advised funds.22 Although high-net-worth individuals are almost three times as likely to manage giving through a donor-advised fund (4.2 percent) compared to a private foundation (1.4 percent), more donors plan to establish a private foundation (1.7 percent) than a donor-advised fund (0.5 percent) in the next three years. The study gathered data from 1,435 survey respondents with an average income of $200,000 or more and/or with a net worth of $1 million or more (excluding the value of the respondent’s primary home).
Community foundation giving days raised millions in 2016
Giving days, broadly defined as short-term online fundraising campaigns, encompass a diverse range of fundraising operations but are frequently hosted by community foundations. A 2016 Knight Foundation Giving Day Initiative report, Beyond the dollars: The long-term value of giving days for community foundations, traced up to 49 different giving day campaigns from 18 organizers over four years after initially starting from a small pilot sample.23 This report found that online giving campaigns have long-term benefits for community foundations. These high-profile giving days increase public awareness of community foundations and empower these institutions to reach more diverse donors even after the giving day has completed.
In 2016, top community foundation giving day campaigns included:
$37.3 million raised by the Communities Foundation of Texas on its North Texas Giving Day;24
$9.1 million raised by The Miami Foundation on its Give Miami Day;25 and
$7.8 million raised by Silicon Valley Community Foundation during Silicon Valley Gives.26
Giving USA Giving to Foundations
Giving USA FoundationTM | Giving USA 2017 | 243

Giving days boost donor engagement and awarenessThe Knight Foundation’s Giving Day Initiative report found the main benefits of giving days included increased donor awareness, improved capacity to solicit donations from a wider array of donors, higher levels of trust in community foundations, and more democratized philanthropy in the community.27 Giving days boost community foundations’ credibility and introduce them to new audiences, with 48 percent of donors and nonprofits indicating that they heard about community foundations for the first time because of giving days.
Giving days were also found to spur community foundations to adopt online fundraising and social media strategies, driving growth in online donations and followers.28 In addition to raising awareness for multiple nonprofits and local causes, giving day organizers also report increases in donations to their own organizations, with 36 percent of donors stating that giving days inspired them to give more than they would have otherwise.
North Texas Giving Day broke national recordIn September 2016, the Communities Foundation of Texas raised the largest amount for a single online community giving day through its eighth annual North Texas Giving Day, raising $37.3 million from 81,890 donors in 18 hours.29 The 2016 online giving campaign, the largest in the U.S., supported 2,518 nonprofit organizations in northern Texas. Contributions came from 39 countries and all 50 states, and for the first time in the history of the event, every participating nonprofit received a gift.30 Since 2009, the North Texas Giving Day has raised over $156 million for nonprofits serving 16 north Texas counties.
244 | Giving USA FoundationTM | Giving USA 2017
Giving USA Giving to Foundations
Good to KnowGiving days have proven to be a useful fundraising vehicle for community foundations, resulting in increased awareness of the organizations and engagement of their constituents.31 The benefits brought to community foundations by giving days can translate to any organization, especially since these events are particularly appealing to younger donors.
To maximize the benefits of a giving day, have a plan for follow-up and continued engagement with those who gave on your giving day. In the spirit of donor-centricity, develop customized stewardship plans that will appeal to the new donors you have attracted. Most importantly, start by saying “thank you!”

Community foundation asset growth slowed in 2015
After several years of rapid expansion, community foundation asset growth decelerated in fiscal year 2015, according to the 2015 Columbus Survey Findings of community foundations, released in July 2016.32 According to the survey, 271 community foundations reported a median asset increase of less than 1 percent.
Gifts to the 100 largest community foundations in the U.S. totaled $7.2 billion in fiscal year 2015, a 5.3 percent decline from 2014, when giving totaled $7.6 billion.33 Although changes in gift totals varied among these foundations, the median change in gifts was an increase of 7.8 percent. Growth in community foundation assets was accompanied by an increased percentage of non-endowed assets and donor-advised fund assets, along with a rise in distribution rates from donor-advised funds.
The 2015 survey revealed that administrative fees based on fund assets garner the most revenue for community foundations of every size, although smaller community foundations with less than $100 million in assets are more dependent than larger community foundations on fundraising
for operations and endowment distribution.34 Almost half (48 percent) of community foundations generated surplus revenue in 2015.35
The Columbus Survey is an annual survey conducted by Foundation Center’s CF Insights, which tracks foundation growth and operational activity using data provided by participating community foundation respondents.36
Trends in giving to foundations in recent years
Giving to foundations is typically volatile from year to year, reflecting both the economic climate and contributions of exceptionally large gifts by both living donors and estates. Revised giving estimates, as released by Giving USA in this edition, show that giving to foundations totaled $39.83 billion in 2015, falling 10.3 percent from 2014.37 This decline in giving to foundations followed an increase of 5.6 percent between 2013 and 2014 and a flat rate of change between 2012 and 2013.
Foundation Center releases extensive data about charitable foundations throughout the year, including data on foundations’ assets and revenues. Giving USA’s estimates for giving to foundations relies on historical data from Foundation Center. Foundation Center details the top 50 U.S.
Giving USA Giving to Foundations
Giving USA FoundationTM | Giving USA 2017 | 245

foundations, in terms of gifts received for fiscal year 2014, on its website: data.foundationcenter.org.38
The sections below provide data on gifts made to the largest community, independent/private, and operating foundations for the year 2014 (the latest year in which detailed data are available).
Gifts received by 50 largest foundations in 2014Foundation Center’s fiscal year 2014 list of the 50 largest U.S. foundations, according to contributions received, shows a total of $24.8 billion in contributions.39 These top 50 foundations received 44 percent of all foundation contributions in 2014. As the recipient of the most gifts in fiscal year 2014, the Bill & Melinda Gates
Foundation alone received 17 percent of contributions to the top 50 ($4.4 billion).
The top 10 foundations received a total of $12.3 billion in contributions in fiscal year 2014.40 Six of these foundations are operating foundations, while two are independent foundations, and one is a community foundation. The six operating foundations, which received a total of $4.5 billion, were the operating foundations of pharmaceutical companies. These foundations provide patient assistance in the form of medications.
Gifts received by independent foundations in 2014Independent foundations, including family foundations, received a total of $34.9 billion in 2014.41 Total assets of these foundations amounted to
246 | Giving USA FoundationTM | Giving USA 2017
Giving USA Giving to Foundations

$712.4 billion. The top 50 independent foundations received a combined total of $15.9 billion (46 percent of the overall total). The top independent foundation, in terms of gifts received, was the Bill & Melinda Gates Foundation ($4.4 billion).
In total, family foundations received 80 percent of contributions given to all independent foundations in 2014.42 Family foundations received a total of $28.0 billion that year. Total assets of these foundations amounted to $400.9 billion. The top 50 family foundations received a combined total of $14.3 billion (51 percent of the total). While the Bill & Melinda Gates Foundation led family foundations in terms of largest amount of gifts received, the
Foundation to Promote Open Society received the second-highest amount in 2014 ($659.6 million).
Gifts received by operating foundations in 2014Operating foundations received a total of $8.1 billion in 2014.44 Total assets of these foundations amounted to $44.1 billion. The top 50 operating foundations received a combined total of $7.4 billion (92 percent of the overall total). The top operating foundation, in terms of gifts received, was the AbbVie Patient Assistance Foundation ($857.1 million).
Gifts received by community foundations in 2014Community foundations received a total of $9.2 billion in 2014.45 Total assets of these foundations amounted to $82.0 billion. The top 50 community foundations received a combined total of $6.7 billion, or 72 percent of the overall total. The top community foundation, in terms of gifts received, was the Silicon Valley Community Foundation ($2.0 billion).
Key findings from Foundation Center’s report on giving to foundations
Table 1 presents three years of data from Foundation Center’s Foundation Stats database.
Giving USA Giving to Foundations
Giving USA FoundationTM | Giving USA 2017 | 247
Good to Know
The research demonstrates that the health of the financial market impacts giving to foundations.43 With that in mind, it is important for practitioners working with this subsector to:
Recruit members to the board to help interpret trends in the market that may affect giving and provide analysis to the fundraising team;
Factor in the predictions made by financial advisors when creating annual fundraising goals; and
Ensure staff are able to inform donors accurately about their options for giving.

References1 All data in this section are reported as estimates,
which are subject to revision. To provide the most accurate estimates for charitable giving, as new data become available, Giving USA revises its estimates for at least the last two years. See more about how Giving USA calculates charitable giving by sources and uses in the “Brief summary of methods used” section of this report.
2 Practitioner highlight authored by Editorial Review Board member Nina Giviyan-Kermani.
3 Practitioner highlight authored by Editorial Review Board member Rebecca Lamb.
4 Practitioner highlight authored by Editorial Review Board member Nina Giviyan-Kermani.
5 This information is in current dollars.6 “FoundationSearch database,” Metasoft, retrieved
May 2017, www.foundationsearch.com 7 Same as note 6.8 Maria Di Mento, “The 2017 Philanthropy 50,” The
Chronicle of Philanthropy, February 7, 2017, www.philanthropy.com; Maria Di Mento, “How The Chronicle of Philanthropy Compiled Its List of the Top 50 Donors,” The Chronicle of Philanthropy, February 7, 2017, www.philanthropy.com; Maria Di Mento and Nidhi Singh, “Philanthropy 50: Where They Live, Where They Give, and More,” The Chronicle of Philanthropy,
February 7, 2017, www.philanthropy.com9 Maria Di Mento and Nidhi Singh, “Philanthropy 50:
Where They Live, Where They Give, and More,” The Chronicle of Philanthropy, February 7, 2017, www.philanthropy.com
10 Maria Di Mento and Drew Lindsay, “Philanthropy 50: Nike Mogul Tops Chart While Tech Giants Flex Charity Muscle,” The Chronicle of Philanthropy, February 7, 2017, www.philanthropy.com
11 Same as note 9.12 Maria Di Mento, “John and Laura Arnold,” The
2017 Philanthropy 50, The Chronicle of Philanthropy, February 7, 2017, www.philanthropy.com
13 Maria Di Mento, “Bill and Melinda Gates,” The 2017 Philanthropy 50, The Chronicle of Philanthropy, February 7, 2017, www.philanthropy.com
14 Maria Di Mento, “Sean Parker,” The 2017 Philanthropy 50, The Chronicle of Philanthropy, February 7, 2017, www.philanthropy.com; “Focus Areas,” The Parker Foundation, retrieved May 2017, www.parker.org/focus-areas/life-sciences
15 Maria Di Mento, “John and Susan Sobrato,” The 2017 Philanthropy 50, The Chronicle of Philanthropy, February 7, 2017, www.philanthropy.com; “SFF Overview & Impact,” The Sobrato Organization, retrieved May 2017, www.sobrato.com/sobrato-
248 | Giving USA FoundationTM | Giving USA 2017
Giving USA Giving to Foundations
Table 1 Key findings from Foundation Center on giving to foundations*
Foundation Center’s Foundation StatsGifts received by foundation type: 2013–2015
www.foundationcenter.org
2013 2014 2015
Independent foundations $33.28 billion $36.37 billion $32.02 billion
Community foundations $8.35 billion $9.01 billion $8.60 billion
Operating foundations $8.42 billion $8.05 billion $7.53 billion
Total $50.05 billion $53.43 billion $48.15 billion
Chapter authored by Allison Mitchell, M.A., Donor Relations Manager at Northeast Arc.
Good to Know section and Practitioner Highlights written by Giving USA Editorial Review Board members Nina Giviyan-Kermani and Rebecca Lamb.
*Most recent data received from Foundation Center in April 2017

philanthropies/sobrato-family-foundation/overview16 Warren Buffet, “My Philanthropic Pledge,” Giving
Pledge, retrieved April 2017, www.givingpledge.org 17 “Warren Buffet Gave Away Another $2.8 Billion to
Charities,” Fortune, July 14, 2016, www.fortune.com18 Same as note 10.19 Same as note 10.20 Same as note 17.21 Bill and Melinda Gates, “Warren Buffett’s Best
Investment,” Gates Notes, February 14, 2017, www.gatesnotes.com
22 2016 U.S. Trust Study of High Net Worth Philanthropy, U.S. Trust, Indiana University Lily Family School of Philanthropy, 2016, http://www.ustrust.com/publish/content/application/pdf/GWMOL/USTp_ARMCGDN7_oct_2017.pdf
23 Beyond the dollars: The long-term value of giving days for community foundations, ThirdPlateau Social Impact Strategies, The Knight Foundation, 2016, http://givingdayplaybook.org/assets/files/Third-Plateau.pdf
24 “North Texas Giving Day,” Communities Foundation of Texas, retrieved April 2017, www.northtexasgivingday.org
25 “Give Miami Day,” The Miami Foundation, retrieved April 2017, www.givemiamiday.org
26 “Silicon Valley Gives,” Silicon Valley Gives 2016 via Razoo, retrieved April 2017, www.svgives.razoo.com
27 Same as note 23.28 Same as note 23.29 “2016 North Texas Giving Day Results,” Communities
Foundation of Texas, retrieved April 2017 , www.cftexas.org
30 “North Texas Giving Day Surpasses Own National Record; Raises $37 Million in 18 Hours,” Communities Foundation of Northern Texas, retrieved April 2017, www.cftexas.org
31 Good to Know authored by Editorial Review Board member Rebecca Lamb.
32 The Community Foundation: 2015 Columbus Survey Findings, CF Insights, Foundation Center, July 2016, http://admin.issuelab.org/permalink/download/25234
33 Same as note 32. 34 Same as note 32.35 Same as note 32.36 Same as note 32.37 This information in inflation-adjusted dollars.38 “Fiscal Totals of the 50 Largest Foundations in
the U.S. by Gifts Received,” Foundation Stats, Foundation Center, retrieved March 2017, www.data.foundationcenter.org
39 Same as note 38.40 Same as note 38.41 Same as note 38.42 Same as note 38.43 Good to Know authored by Editorial Review Board
member Nina Giviyan-Kermani.44 Same as note 38.45 Same as note 38.
Giving USA Giving to Foundations
Giving USA FoundationTM | Giving USA 2017 | 249

Giving USA Giving USA
250 | Giving USA FoundationTM | Giving USA 2017
Giving USA Giving to Foundations
Un
ited
Way
of
Gre
ater
Ph
ilad
elp
hia
an
d S
ou
ther
n N
ew J
erse
y

Contributions to the health subsector comprised 8 percent of all donations received by charities in 2016.1
Giving to health organizations grew 5.7 percent in 2016, totaling $33.14 billion. Adjusted for inflation, giving to health increased 4.4 percent between 2015 and 2016.
Giving to health in 2016 reached its highest recorded inflation-adjusted giving level to date.
Giving USA FoundationTM | Giving USA 2017 | 251
13 | Giving toHealth
Un
ited
Way
of
Gre
ater
Ph
ilad
elp
hia
an
d S
ou
ther
n N
ew J
erse
y

The information provided in this chapter derives from a
number of sources, including publicly available reports, news stories, and websites from the most recent year. This chapter is meant to provide context for the giving trends reported in this edition of Giving USA and to illustrate some of the practical implications of the data. It is not intended to be a comprehensive survey of the subsector, but rather a collection of examples from the field.
Trends in giving to health in 2016
In 2016, giving to health increased for the fifth consecutive year at an average rate of 5.2 percent over a five-year period.5 After experiencing a sharp decline of 6.6 percent in 2011, the health sector has rebounded with growth. This subsector’s five-year average growth rate is now only slightly lower than the five-year average growth rate in total giving of 5.6 percent for 2012–2016. Health is the fourth-fastest growing subsector in 2016 after being the slowest growing of 2015.
252 | Giving USA FoundationTM | Giving USA 2017
Giving USA Giving to Health
Practitioner Highlights Continuing a trend seen across other philanthropic subsectors,
healthcare donors are becoming more interested in funding collaborative initiatives to drive systemic change. Health organizations should think strategically about how they market their work and results when engaging and stewarding donors.2
Online giving to this subsector grew in 2016, and studies found that healthcare organizations see higher online giving results with retained and repeat donors rather than new donors.3
Giving to traditional peer-to-peer fundraising events continues to decline, while new, specialized, “do-it-yourself” events appear every year. Given the prevalence of this trend, organizations should start considering how best to utilize these fundraising events in the future.4

Several reports issued in 2017 note generally positive trends in giving to health organizations in 2016. The results of these reports are provided throughout the rest of this opening narrative and chapter. Different methodological and sampling approaches account for the differences seen between these sources and Giving USA data. Some highlights from 2016 on giving to this subsector include:
In spring 2017, Blackbaud reported that among its sample of over 6,800 nonprofits, giving to healthcare organizations declined 3.7 percent, while giving to medical research increased 3.0 percent between 2015 and 2016.6 Healthcare organizations realized the greatest year-over-year monthly increases in overall charitable revenue in the three-month period ending in April (7.5 percent), but saw its lowest points in the three-month periods ending in August (-0.4 percent) and September (-1.9 percent).7 For medical research organizations, giving peaked in the three-month periods ending in January (9.5 percent) and February (8.9 percent), but declined or only grew moderately for the rest of
the year, reaching its lowest point in August (-5.6 percent).
Giving to health in 2016 was characterized by collaborative efforts, as exemplified by several major gifts to the sector. Mark Zuckerberg and Priscilla Chan’s organization, the Chan Zuckerberg Initiative, announced plans to dedicate $3 billion to eradicating disease by promoting partnerships between biological scientists and engineers.8 In addition, Sean Parker’s $250 million commitment established the Parker Institute for Cancer Immunotherapy, an innovative collaboration across six institutes that pledge to share data and techniques in order to accelerate results.9
Following trends in recent years, individuals featured on The Chronicle of Philanthropy’s list of the 50 most generous donors also prioritized medical research in 2016.10 These individuals collectively pledged $424 million to medical research at health research institutes or universities. These gifts went to support research into cancer prevention and treatment and other health causes. The largest gift to this subsector was from Larry Ellison, who gave $200 million to the University of Southern California to create an interdisciplinary institute to study the treatment and prevention of cancer.11 Other large gifts from individuals and foundations in 2016 focused on immunotherapy.
Giving USA Giving to Health
Giving USA FoundationTM | Giving USA 2017 | 253
________________________________________
Health is the fourth-fastest growing subsector in 2016 after being the slowest growing of 2015.
________________________________________

To provide additional context for giving to health in 2016 and in recent years, the following sections provide detail on recent trends, related campaigns, and news for this subsector.
Online giving to health was strong in 2016
Three different reports noted positive results for giving to health organizations in 2016 via online methods. While different methodological and sampling approaches account for the differences seen between these sources and Giving USA data, these sources highlight trends seen by specific types of health organizations.
According to Blackbaud, online giving to its sample of healthcare organizations realized an increase of 11.9 percent between 2015 and 2016.12 Healthcare organizations realized the greatest year-over-year monthly increases in online charitable revenue in the three-month periods ending in May (20.7 percent) and June (17.6 percent), while the greatest decline in online giving growth occurred in the three-month period ending in September (5.2 percent).13 For medical research organizations, online giving declined by 3.2 percent over 2015, which was the largest drop of the 10 subsectors tracked. Online giving peaked in the three-month period ending in January (10.7 percent), before
dropping to reach its lowest point in the three-month period ending in May (-7.6 percent).
According to Blackbaud’s Luminate Online Benchmark Report 2016, health services and research organizations were combined into one section, while hospital foundations and hospitals were combined into another category.14 Health services and research organizations realized a decline of 3 percent in total online revenue in 2016 as compared to the previous year, while hospital foundations and hospitals saw an increase of 3 percent.
The Luminate report also found that first-time online transaction amounts as a percent of total revenue declined for both health services and research organizations (4 percent) and hospital foundations and hospitals (8 percent).15 However, both categories saw an increase in repeat online transaction amounts as a percent of total funds raised, at 4 percent and 8 percent, respectively. Health services and research organizations had an increase in the amount of revenue from sustainer donors as a percent of revenue (17 percent), while hospital foundations and hospitals saw a decline (4 percent).
In a different study, the Benchmarks 2017 report by M+R and NTEN also reported positive results for online giving to a sample of health organizations.16 From 2015 to 2016, these organizations
254 | Giving USA FoundationTM | Giving USA 2017
Giving USA Giving to Health
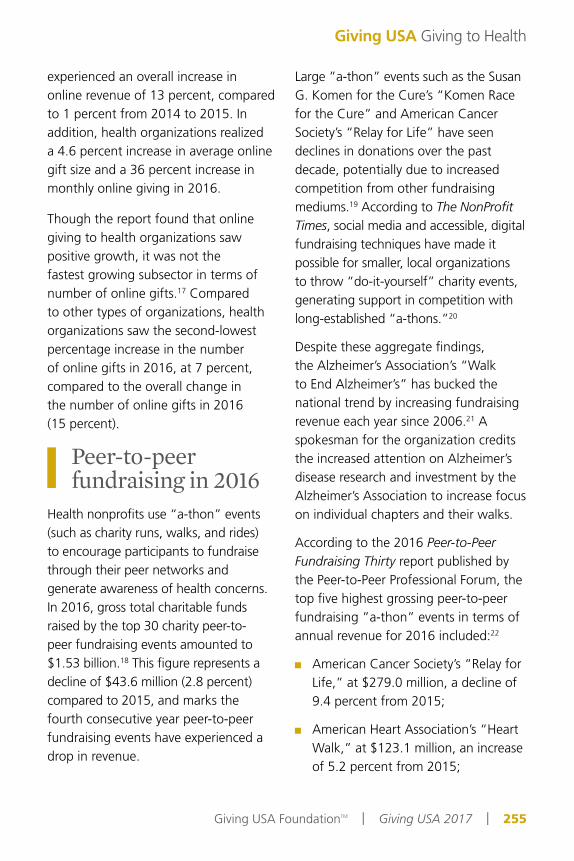
experienced an overall increase in online revenue of 13 percent, compared to 1 percent from 2014 to 2015. In addition, health organizations realized a 4.6 percent increase in average online gift size and a 36 percent increase in monthly online giving in 2016.
Though the report found that online giving to health organizations saw positive growth, it was not the fastest growing subsector in terms of number of online gifts.17 Compared to other types of organizations, health organizations saw the second-lowest percentage increase in the number of online gifts in 2016, at 7 percent, compared to the overall change in the number of online gifts in 2016 (15 percent).
Peer-to-peer fundraising in 2016
Health nonprofits use “a-thon” events (such as charity runs, walks, and rides) to encourage participants to fundraise through their peer networks and generate awareness of health concerns. In 2016, gross total charitable funds raised by the top 30 charity peer-to-peer fundraising events amounted to $1.53 billion.18 This figure represents a decline of $43.6 million (2.8 percent) compared to 2015, and marks the fourth consecutive year peer-to-peer fundraising events have experienced a drop in revenue.
Large ”a-thon” events such as the Susan G. Komen for the Cure’s “Komen Race for the Cure” and American Cancer Society’s “Relay for Life” have seen declines in donations over the past decade, potentially due to increased competition from other fundraising mediums.19 According to The NonProfit Times, social media and accessible, digital fundraising techniques have made it possible for smaller, local organizations to throw “do-it-yourself” charity events, generating support in competition with long-established “a-thons.”20
Despite these aggregate findings, the Alzheimer’s Association’s “Walk to End Alzheimer’s” has bucked the national trend by increasing fundraising revenue each year since 2006.21 A spokesman for the organization credits the increased attention on Alzheimer’s disease research and investment by the Alzheimer’s Association to increase focus on individual chapters and their walks.
According to the 2016 Peer-to-Peer Fundraising Thirty report published by the Peer-to-Peer Professional Forum, the top five highest grossing peer-to-peer fundraising ”a-thon” events in terms of annual revenue for 2016 included:22
American Cancer Society’s “Relay for Life,” at $279.0 million, a decline of 9.4 percent from 2015;
American Heart Association’s “Heart Walk,” at $123.1 million, an increase of 5.2 percent from 2015;
Giving USA Giving to Health
Giving USA FoundationTM | Giving USA 2017 | 255

American Heart Association’s “American Heart Association Youth Programs,” at $85.8 million, an increase of 8.7 percent from 2015;
March of Dimes’ “March for Babies,” at $85.7 million, a decline of 10.5 percent from 2015; and
Alzheimer’s Association’s “Walk to End Alzheimer’s,” at $82.4 million, an increase of 6.4 percent over 2015.
While overall revenue declined, some of the top 30 peer-to-peer organizations saw substantial gains in 2016: Memorial Sloan-Kettering Cancer Center’s “Cycle for Survival “earned $30.0 million, an increase of 20 percent over 2015; and the American Lebanese Syrian Associated Charities (ALSAC)/St. Jude Children’s Research Hospital’s “St. Jude Heroes” earned $16.4 million, an increase of 17.1 percent.23
256 | Giving USA FoundationTM | Giving USA 2017
Giving USA Giving to Health
Good to KnowAs fundraising revenue from peer-to-peer fundraising events declines on a national scale, it is wise to remember that these events are more than revenue generators—they are important tools for prospect engagement and communications. Organizations considering how to get the most out of peer-to-peer fundraising should take the following action steps:24
Be clear about what your organization is trying to accomplish through your event;
Track results accordingly—set metrics for your fundraising events that include net revenue, attendance, public awareness, and messaging; and
If you are overly dependent on revenue from events, take the time to create a plan to diversify your sources of fundraising revenue.

Zika virus funding trickled despite public health emergency
In 2016, a mosquito-borne virus captured international headlines and became the latest global public health emergency. Originally identified in Uganda in 1947, the Zika virus spread rapidly throughout the western hemisphere in 2015 and 2016.25 Dangers from the virus are mainly caused by mother-to-fetus transmission, where the virus has been linked to microcephaly, Guillain-Barré syndrome, and other severe brain defects in the baby.26
The first reports of the outbreak started in Brazil in May 2015.27 The virus then spread rapidly through South and Central America, as well as the Caribbean, with the first case present in the United States in December 2015. By February 2016, the World Health Organization (WHO) had declared Zika a public health emergency due to its rapid spread and connection to birth defects in infants.
According to the United Nations International Children’s Fund (UNICEF), philanthropic support to Zika was “critically underfunded” and received minimal contributions from private donors, in comparison to the amount of donations received in response to the recent Ebola outbreak.28
Many private donations have focused on funding detection, education, and
prevention in relation to the virus’s outbreak:
The Pfizer Foundation donated $4 million in response to Zika, awarding $1 million each to the CDC Foundation, the Florida Department of Health, the Texas Department of State Health Services, and the Pan-American Health Organization for screening, education, tracking, and prevention;29
The Bill & Melinda Gates Foundation donated $3.75 million to the CDC Foundation, supporting a “This Is How We Stop Zika” awareness campaign;30 and
The Paul G. Allen Foundation and Vulcan Inc. donated $1.5 million to the American Red Cross to contain the spread of the Zika virus and directed an additional $550,000 to Chembio Diagnostic Systems to develop a diagnostic test for the infection.31
Though the direct financial response was lukewarm, the Centers for Disease Control (CDC) Foundation reported receiving millions of dollars in product donations to help combat the Zika virus.32
Giving USA Giving to Health
Giving USA FoundationTM | Giving USA 2017 | 257

In-kind donations to combat ZikaMany companies donated products or expertise in an effort to contain the Zika outbreak.
SC Johnson pledged almost $1.5 million in pest control products to the International Federation of the Red Cross and Red Crescent Societies (IFRC).33 In May 2016, the CDC Foundation launched the Zika Contraception Access Network (Z-CAN), a network offering a range of contraceptive options to women in Puerto Rico.34 The network is supported by in-kind donations from pharmaceutical companies including Merck and Allergan, which donated contraceptive options, and nonprofit medical providers such as Upstream USA, which donated training and support staff.
While Google donated $1 million to UNICEF to address the Zika virus, staff volunteers at Google also collaborated with UNICEF to develop a map to help predict the potential spread of the Zika virus, which ultimately helped government and non-governmental organizations focus their relief and mitigation efforts.35 The tracking tool will be in place for future epidemics.36
New health organizations prioritize collaboration across fields and institutions
Many large gifts to health in 2016 were targeted toward medical research, and these gifts established or supported institutions that emphasized collaboration between multiple entities.37 According to a Bloomberg analysis, some of these alliances may be considered unconventional by medical research standards.
The following sections highlight some of these larger initiatives that launched in 2016.
Neuroscience gift breaks university records In April 2016, the University of California, San Francisco (UCSF) Weill Institute for Neuroscience was
258 | Giving USA FoundationTM | Giving USA 2017
Giving USA Giving to Health
established with a $185 million donation from the Weill Family Foundation, representing the largest charitable donation ever received by the institution.38 Focusing on “high-risk, high-reward research projects,” the new UCSF institute also seeks to unite neuroscience researchers and physicians in pursuit of new neuroscience breakthroughs.39 Additionally, the initiative will bring all UCSF neuroscience and psychiactric departments under one institutional umbrella.
Chan Zuckerberg Initiative’s $3 billion investment in study of diseaseAnnounced in 2016, the Chan Zuckerberg Initiative (CZI), the philanthropically oriented limited liability company (LLC) of Facebook CEO Mark Zuckerberg and wife Dr. Priscilla Chan, pledged to dedicate $3 billion over the next 10 years toward basic scientific research that will lead to advancements in the study of disease.40
CZI’s strategy centers on collaboration between scientists and engineers to study intersections of disease, technology, and treatment.41 CZI’s first grant, $600 million, supports the Chan Zuckerberg BioHub, an interdisciplinary research initiative created in 2015 that connects scientists and engineers from the University of California, Berkeley; Stanford University; and the University of California, San Francisco (UCSF).
Major gifts to cancer treatment focus on collaborationIn April 2016, Sean Parker, co-founder of Napster and founding president of Facebook, donated $250 million from the Parker Foundation to establish the Parker Institute for Cancer Immunotherapy (PICI).42 PICI is composed of six prominent treatment and research centers in the United States: Memorial Sloan Kettering Cancer Center (MSKCC), Stanford Medicine, the University of California, Los Angeles (UCLA); the University of California, San Francisco (UCSF); the University of Texas MD Anderson Cancer Center, and Penn Medicine.43 PICI provides a new model for health research, wherein the centers will require standardization of data, procedures, and clinical trials.44
The institute also serves as an umbrella holder for all intellectual property (IP) of future discoveries so that breakthroughs and the corresponding revenue from one center can immediately be shared with all centers.
In 2016, Johns Hopkins University received $125 million to establish a cancer immunology institute within their Sidney Kimmel Comprehensive Cancer Center (Baltimore, MD).45 With lead $50 million gifts from both former New York mayor Michael Bloomberg and Jones Apparel Group founder Sidney Kimmel, the institute seeks to recruit biomedical engineers, immunologists, geneticists,
Giving USA Giving to Health
Giving USA FoundationTM | Giving USA 2017 | 259

microbiologists, and cancer researchers to spearhead the advancement of cancer immunotherapy research.
The University of Southern California (USC) additionally received a gift of $200 million from Oracle founder Larry Ellison in May 2016 to establish the Lawrence J. Ellison Institute for Transformative Medicine of USC. USC notes the gift is “among the largest made to cancer research and treatment in recent years.”46 The institute aims to assemble interdisciplinary researchers to collaborate on cancer cure research, in addition to developing new treatments and more accurate detection tools.
Foundations focus on accelerating medical results and finding disease treatments
In recent years, disease-focused foundations have sought to expedite research findings, drug trials, and new treatments. In 2016, the National Institutes of Health (NIH) reported increases in grant applications, but the share of those funded applications continued to hover just below 20 percent, reflecting an increasingly competitive environment for health research grants.47
The following sections include highlights from recent initiatives in drug development as promoted by the philanthropic sector.
Philanthropy continues to play important role in drug developmentFollowing the 2008 economic crash, philanthropy emerged as a way to fill funding gaps for research and development left by pharmaceutical companies.48 Foundations dedicated to addressing disease have become crucial in providing additional support for drug research and clinical trials. Philanthropic organizations are able to assume more risk than pharmaceutical companies or academic research groups, which is necessary as drugs may not work initially or become profitable.49 Disease-fighting foundations can also bring private and public resources together to focus on drug development.
A study published in 2015 by Mark D. Lim (FasterCures, a Center of the Milken Institute), Martha A. Brumfield (Critical Path Institute), and Michel Goldman (Institute for Interdisciplinary Innovation in Healthcare) gave 10 examples of drug development public-private research consortia that operate with support and guidance from philanthropic disease organizations, including the Juvenile Diabetes Research Foundation (JDRF), the Michael J. Fox Foundation for Parkinson’s Research, and the PKD (Polycystic Kidney Disease) Foundation.50 These disease-focused foundations help identify priorities for drug development and provide
260 | Giving USA FoundationTM | Giving USA 2017
Giving USA Giving to Health

researchers with a large patient base ready to provide medical histories and to participate in drug trials.51
Partnering with health philanthropies has also made it possible for academic researchers to participate in drug development without involving a pharmaceutical company. In 2016, the Vanderbilt Center for Neuroscience Drug Discovery (VCNDD) received permission from the U.S. Food and Drug Administration (FDA) to begin early-stage drug trials for schizophrenia treatment.52 The William K. Warren Foundation donated $1 million to help prepare the drug for trials, bringing the total amount that the foundation donated to VCNDD since 2014 to $8.25 million.53
Alzheimer’s disease treatments make gains in 2016Many Alzheimer’s disease-related nonprofits have directed funds to drug therapies. In 2016, the Alzheimer’s Association granted $4.3 million to Washington University in St. Louis to enable earlier detection and develop drug therapies for the disease.54 The Alzheimer’s Drug Discovery Foundation awarded $1.5 million in five grants to support studies seeking to develop early detection tests and drug studies in May and June of 2016.55
In addition, the Alzheimer’s Drug Discovery Foundation and the
Association for Frontotemporal Degeneration (AFTD) created a joint fund in 2016 called The Treat FTD Fund, which focuses on developing treatments for Alzheimer’s disease, FTD, and other neurodegenerative diseases.56 The fund launched with a combined $10 million contribution of $5 million from the Samuel I. Newhouse Foundation and $5 million jointly from the Lauder Foundation, Leonard A. Lauder, and Ronald S. Lauder.
Media coverage helps raise funds for underserved health causes
In 2016, widespread media coverage spotlighted several health causes that do not typically garner national attention or substantial fundraising dollars. While not an exhaustive list, some of these campaigns are highlighted in the sections below.
Humans of New York raises $3.8 million for Memorial Sloan Kettering Cancer CenterIn May 2016, Brandon Stanton’s popular social media blog “Humans of New York” raised $3.8 million for the pediatric program of the Memorial Sloan Kettering Cancer Center (MSKCC) in three weeks after featuring a series of photographs and stories about the center’s patients, patient’s families,
Giving USA Giving to Health
Giving USA FoundationTM | Giving USA 2017 | 261

and doctors.57 While one-third of the funds will be directed to family support services at MSKCC, the rest will go toward pediatric cancer research. Most notably, $1.2 million will go toward research on Diffuse Intrinsic Pontine Glioma (DIPG), a fatal brain cancer that affects 200 children per year and, until recently, did not have any known treatments.58
Comedian John Oliver sheds light on medical debt forgivenessMedical debt constitutes the highest share (38 percent) of consumer debt, overshadowing student loans (25 percent), and is the main cause of personal bankruptcy.59 Medical debt is frequently sold to debt collection agencies, much like mortgages, which enables buyers to purchase debt for pennies on the dollar so the agency and hospital are able to recoup a portion of the debt owed.60
Medical Debt Resolution Inc, also known as RIP Medical Debt, is a nonprofit organization that clears medical debt by paying the debt collection agency directly.61 By using this approach, the payment is considered a gift and therefore the individual whose debt has been absolved is not responsible for paying taxes on the forgiven debt.
In 2016, comedian John Oliver’s Last Week Tonight show formed a debt collection
agency that purchased approximately $60,000 in medical debt and partnered with RIP Medical Debt to ensure the debt was forgiven. The total debt purchased by Last Week Tonight equates to over $14.9 million in unpaid medical bills and assisted over 9,000 individuals and families.62
The Monday after the show aired, RIP Medical Debt reported an uptick in giving.63 By the end of 2016, RIP Medical Debt reported that they had raised enough to forgive approximately $6 million in medical debt for veterans, active duty military, and first responders. Foundations in California and Wisconsin also forgave an additional $3 million in debt through RIP Medical Debt.64
262 | Giving USA FoundationTM | Giving USA 2017
Giving USA Giving to Health
Good to KnowFollowing in the footsteps of “viral” giving stories, the health subsector continues to benefit from widespread social media campaigns, celebrity involvement, and the targeted spotlighting of areas of need.65 While these snapshots are irreplaceable in terms of name recognition and short-term immediate giving surges, organizations must consider how to capitalize upon these moments and transition them into long-term donor engagement success.
In order to do so, organizations must learn from and incorporate the impact of these giving stories into multi-channel marketing strategies, while also not underestimating the importance of well-deployed stewardship for these new donors.
Foundations team up to promote health insurance education in 2016
Five large foundations—The Commonwealth Fund, The John A. Hartford Foundation, the Robert Wood Johnson Foundation, the Peterson Center on Healthcare, and the SCAN Foundation—established a collaboration in 2016 to address issues realized by high-need, high-cost (HNHC) patients, with a specific focus on how those patients receive information about insurance and care.66 According to the New England Journal of Medicine, this subgroup comprises 5 percent of the total United States population, yet accounts for 50 percent of consumed healthcare resources.67 The network, which had yet to be named in 2016, aims to collaborate with health system leaders and other stakeholders nationwide to educate them on the challenges of caring for HNHC populations.68
A blueprint for the network was provided by the New Jersey-based Camden Coalition of Healthcare Providers (Camden Coalition).69 In 2016, $8.7 million in donations from AARP, the Robert Wood Johnson Foundation, and Atlantic Philanthropies supported Camden Coalition’s creation of the National Center for Complex Health and Social Needs. The goal of the Camden
Coalition is to research and develop strategies to provide better care for HNHC patients while they are hospitalized and to ensure they receive the education necessary to continue their care at home properly. Due to the complex nature of HNHC patient care, these populations often rely on multiple doctors for their health care plan and require additional assistance to navigate the healthcare system in the United States.
Mental health organizations made strides in 2016
2016 saw several charitable gifts to the mental health sector that seek to improve understanding of mental health and improve treatment options, whether by creating new facilities, taking a more holistic approach to treatment, or reaching out to underserved communities.
Texas short-term stay facility seeks new ways to address psychiatric crisesConstruction began in 2016 for a new short-term, holistic care facility serving patients experiencing a psychiatric crisis called the Judge Guy Herman Center for Mental Health Crisis Care (Austin, TX).70 The new institute is connected to Austin Travis County Integral Care, a public mental health organization.
Giving USA Giving to Health
Giving USA FoundationTM | Giving USA 2017 | 263

Named for a local judge who advocates for the importance of mental healthcare, the Judge Guy Herman Center for Mental Health Crisis Care is the result of an $8.9 million pledge to build and cover operating costs from St. David’s Foundation (which leverages proceeds from St. David’s HealthCare), and Central Health (a Travis County, TX medical network), which agreed to lease the land for the center for $1 per year.71 In addition to psychiatric services, the center will offer medical care and social services, with the goal of providing an alternative, calmer place for people experiencing temporary psychiatric crises.
Mental health facilities launched and under constructionThe Big Lots Foundation gave $50 million in August 2016 toward building a pediatric behavioral-health treatment and research center at Nationwide Children’s Hospital (Columbus, OH) that will include 48 inpatient beds and programs that provide holistic behavioral health treatments to children and adolescents. The center will employ psychiatrists, psychologists, social workers, nurses, and parent support specialists.72 The new center will be the largest treatment and research center focusing solely on children and adolescent behavioral health in the U.S.73
In addition, Providence St. Joseph Health announced the launch of the Institute for Mental Health and Wellness, a $100
264 | Giving USA FoundationTM | Giving USA 2017
Giving USA Giving to Health

million program that will make grants focusing on research and services for mental health in the locations where the hospital system operates, which include Alaska, Washington, Oregon, California, Montana, New Mexico, and Texas.74
Crisis Text Line takes innovative approaches to funding and data sharingIn 2016, mental health nonprofit Crisis Text Line, a text-based crisis hotline for teens, received an influx of $23.8 million in donations from donors in the technology industry, including the founders of Craigslist (Craig Newmark), Zynga (Mark Pincus), and LinkedIn (co-founder Reid Hoffman).75 Taking a “tech startup” mentality, Crisis Text Line pursued unrestricted seed funding in its initial stages, which has enabled the text line to increase staff and grow quickly in terms of clients served, all while maintaining its technology infrastructure.76 After their successful second-round fundraising effort, Crisis Text Line raised $35 million total in granted funds.
In February 2016, Crisis Text Line made anonymized data available to university researchers with the goal of furthering research in mental health and promoting evidence-based policy creation.77 In addition, the organization launched a set of public, open-source data visualization tools called Crisis Trends that feature daily updated, aggregate data from all 50 states. The tool grants organizations
access to geographic-specific data in order to best meet the needs of the teenagers in their area.
Annual trends in giving to nonprofit healthcare organizations, fiscal years 2004–2015
The Association for Healthcare Philanthropy’s (AHP) 2016 annual Report on Giving, based on data from 199 nonprofit healthcare institutions, reveals that corporate/foundation gifts and major gifts were the largest sources of healthcare funds raised in fiscal year 2015 (28.7 percent and 23.4 percent, respectively).78 Those large sources were followed by annual gifts (15.4 percent), special events (15.0 percent), and planned giving (9.1 percent).
Hospitals and health systems that invest in philanthropy saw a more than four-fold return for every dollar invested in 2015.79 According to the report, for every $1 spent on fundraising programs, the median return on investment (ROI), a measure of effectiveness, was $4.29 in fiscal year 2015 (up from $4.05 in fiscal year 2014). The cost to raise a dollar (CTRD), a measure of fundraising efficiency, was 23 cents (down from 25 cents in fiscal year 2014). Figure 1 shows the annual trend in giving to U.S. nonprofit healthcare organizations for fiscal years 2004–2015, as reported by AHP.
Giving USA Giving to Health
Giving USA FoundationTM | Giving USA 2017 | 265

Health charities, hospitals, and medical centers ranked fewer on the Philanthropy 400
The Chronicle of Philanthropy annually compiles a list of the top 400 public charities and private foundations.80 The Philanthropy 400 ranks charities according to the level of private donations received in the previous fiscal year. Private donations include gifts from all private sources—individuals, corporations, and foundations. Gifts of cash, shares of stock, in-kind donations, real estate, and valuables are included. To determine the rankings, the
Chronicle compiles information from IRS Forms 990, annual reports, financial statements, and a questionnaire.
Philanthropy 400 data issued in 2016 for giving in the fiscal year ending in 2015 include 28 organizations that are classified as health charities (compared with 29 reported in the previous year) and 27 charities classified as hospitals and medical centers (compared with 30 reported in the previous year). The top five health organizations on the list with the greatest amount in private support are:81
Ranking 15th: American Lebanese Syrian Associated Charities/St. Jude Children’s Research Hospital,
266 | Giving USA FoundationTM | Giving USA 2017
Giving USA Giving to Health
Data: FY 2015 AHP Report on Giving, USA, Association for Healthcare Philanthropy, 2016, www.ahp.org
Figure 1Annual trend in giving to healthcare organizations, fiscal years (FY) 2004–2015(median value for all institutions, in billions of dollars)
$12
$10
$8
$6
$4
$2
$0
$9.63 $9.65$9.22$8.94$8.94$8.26
$7.64$8.59$8.35
$7.90$7.09
$6.10
2004 2005 2006 2007 2008 2009 2010 2011 2012 2013 2014 2015

Giving USA Giving to Health
Giving USA FoundationTM | Giving USA 2017 | 267
Memphis, TN, with $1.03 billion in private contributions, an increase of 8.4 percent from the previous year;
Ranking 22th: American Cancer Society, Atlanta, GA, with $809.9 million in private contributions, an increase of 0.3 percent;
Ranking 23rd: Patient Access Network Foundation, Washington, DC, with $801.2 in private contributions, an increase of 21.5 percent;
Ranking 28th: American Heart Association, Dallas, TX, with $645.5 million in private contributions, an increase of 14.3 percent; and
Ranking 32nd: University of California San Francisco Medical Center, San
Francisco, CA, with $608.6 million in private contributions, an increase of 36.8 percent.
While the 2016 Philanthropy 400 saw fewer health, hospital, and medical center nonprofits ranked, new health organizations were added to the list: Nationwide Children’s Hospital Foundation (Columbus, OH), was ranked 308th with private support totaling $91.8 million, including donations to their capital campaign.82 In addition, the Amyotrophic Lateral Sclerosis (ALS) Association, famous for their 2014 “Ice Bucket Challenge” viral fundraising campaign, joined the list at 199th, with total private contributions of $137.95 million.83
Key findings from annual studies
Table 1 presents three years of data from studies released annually about giving to healthcare and health-related causes. Website addresses are provided so readers may access the complete reports.
Table 1Key findings from other studies about giving to health organizations
Association for Healthcare Philanthropy’s Report on GivingResults for fiscal years ending 2013–2015
www.irs.gov
2013 2014 2015
Estimated total giving to member organizations, including pledges $9.22 billion $9.63 billion $11.04 billion
Median return on $1 spent for fundraising (ROI), all institutions $3.55 $4.05 $4.29

References1 All data in this section are reported as estimates,
which are subject to revision. To provide the most accurate estimates for charitable giving, as new data become available, Giving USA revises its estimates for at least the last two years. See more about how Giving USA calculates charitable giving by sources and uses in the “Brief summary of methods used” section of this report.
2 Practitioner highlight authored by Editorial Review Board member Merrell Milano.
3 Practitioner highlight authored by Editorial Review Board member Merrell Milano.
4 Practitioner highlight authored by Editorial Review Board member Merrell Milano.
5 This information is in current dollars6 This information was provided to Giving USA directly
from Blackbaud in May 2017. The Blackbaud Index of Charitable Giving assesses changes in total charitable giving from year to year using a three-month rolling median of the charitable revenue reported by a selected sample of U.S. nonprofits. This information reflects data on total charitable giving reported by 6,857 organizations across the nonprofit sector, representing total charitable revenue of $23.6 billion in 2016. Online giving data are reported by 4,958 nonprofits with charitable support amounting to $2.7 billion in 2016. Month-by-month Blackbaud Index data on both online and total giving are available at www.blackbaud.com/nonprofit-resources/blackbaud-
index. Note that Blackbaud data are constantly being updated; therefore, figures published in Giving USA may vary from current figures.
7 Year-over-year monthly giving data are from the Blackbaud Index, May 2017, https://www.blackbaud.com/nonprofit-resources/blackbaud-index
8 Kathleen Chaykowski, “Chan Zuckerberg Initiative Promises to Spend $3 Billion to Research and Cure All Diseases,” Forbes, September 21, 2016, www.forbes.com
9 Laura Lorenzetti, “Sean Parker Launches an Unprecedented Cancer Research Effort,” Fortune, April 12, 2016, www.fortune.com
10 Maria Di Mento, “The 2017 Philanthropy 50,” The Chronicle of Philanthropy, February 7, 2017, www.philanthropy.com
11 Maria Di Mento, “Larry Ellison,” The 2017 Philanthropy 50, The Chronicle of Philanthropy, February 7, 2017, www.philanthropy.com
12 Same as note 6.13 Same as note 7.14 Luminate Online Benchmark Report 2016, Blackbaud,
2017, www.blackbaud.com. Data from this report cover the fiscal year July 1, 2015 to June 30, 2016 for a sample of 631 nonprofit organizations that use Luminate Online cloud-based software by Blackbaud.
15 Same as note 14.16 Benchmarks 2017, M+R and NTEN, 2017, www.e-
benchmarksstudy.com. Note that this study uses a convenience sample of 133 organizations with
268 | Giving USA FoundationTM | Giving USA 2017
Giving USA Giving to Health
Chapter authored by Anna Pruitt, Ph.D., Co-Managing Editor of Giving USA, Indiana University Lilly Family School of Philanthropy, and Hannah Travis, M.A., Alumni Relations Coordinator, Keystone School (San Antonio, TX).
Good to Know sections and Practitioner Highlights written by Giving USA Editorial Review Board members Merrell Milano and Angela E. White.
Table 1 (continued.)
Key findings from other studies about giving to health organizations
IRS Statistics of Income Bulletin84
Tax-exempt health organizations: 2011–2013www.irs.gov
2011 2012 2013
Number of returns 35,267 35,188 35,435
Charitable revenue $69.28 billion $68.02 billion $74.27 billion

online revenue totaling over $535 million and that the organizations types reported in this study do not necessarily match those used in Giving USA.
17 Same as note 16.18 “As Some Programs Grow, Overall Revenues at
Nation’s Top Peer-to-Peer Fundraising Campaigns Continue to Decline, New Study Shows,” Peer-to-Peer Professional Forum, March 1, 2017, https://www.peertopeerforum.com/wp-content/uploads/P2P30-RELEASE-EMBARGOED-3.1.17.pdf
19 “More Charities See Significant Revenue From Peer-to-Peer Fundraising,” Philanthropy News Digest, February 27, 2017, www.philanthropynewsdigest.org; Andy Segedin, “Top Peer-to-Peer Events Struggling, Down 7%,” The NonProfit Times, February 24, 2017, www.thenonprofittimes.com
20 Andy Segedin, “Top Peer-to-Peer Events Struggling, Down 7%,” The NonProfit Times, February 24, 2017, www.thenonprofittimes.com
21 Same as note 20.22 Same as note 18.23 “2016 Peer-to-Peer Fundraising Top 30 Ranked by
Gross Revenue,” Peer-to-Peer Professional Forum, retrieved February 2017, www.peertopeerforum.com/resources/research
24 Good to Know section authored by Editorial Review Board member Angela E. White.
25 “Zika Virus,” Fact Sheets, World Health Organization, retrieved February 2017, www.who.int
26 “Overview, Zika Virus,” Centers for Disease Control, retrieved February 2017, www.cdc.gov
27 Mary Kay Kindhauser, Tomas Allen, Veronika Frank, Ravi Shankar Santhana, and Christopher Dye, “Zika: The Origin and Spread of a Mosquito-borne Virus,”Bulletin of the World Health Organization, World Health Organization, February 9, 2016, www.who.int
28 Kimberly Leonard, “Where Are the Private Donations for Zika?” US News & World Report, July 25, 2016, www.usnews.com, para. 7
29 “Addressing the Zika Crisis,” Pfizer, October 24, 2016, www.pfizer.com
30 Same as note 28.31 Ariana Eunjung Cha, “Philanthropist Paul Allen
Annonces $2 Million in Grants for Zika Diagnostic, Mosquito Control,” The Washington Post, February 19, 2016, www.washingtonpost.com
32 Same as note 28.33 “SC Johnson and IFRC Join Efforts to Protect Families
from the Zika Virus,” PR Newswire, May 4, 2016, www.prnewswire.com
34 “CDC Foundation Brings Together Partners with CDC to Provide Contraceptive Options for Women in Puerto Rico,” CDC Foundation, May 31, 2016, www.cdcfoundation.org
35 Sue-Lynn Moses, “Who Cares About Containing the Zika Virus?” Inside Philanthropy, March 11, 2016, www.insidephilanthropy.com
36 Alexandra Gibbs, “Google is donating $1 million to UNICEF to fight Zika,” CNBC, March 3, 2016, www.cnbc.com
37 Caroline Chen, “A Few Billionaires Are Turning Medical Philanthropy on Its Head,” Bloomberg, December 2, 2016, www.bloomberg.com
38 Pete Farley, “$185M Gift Launches UCSF Weill Institute for Neurosciences,” University of California San Francisco, April 25, 2016, www.ucsf.edu
39 Same as note 38, para. 440 Same as note 8.41 Same as note 8.42 “The Foundation,” The Parker Foundation, retrieved
March 2017, www.parker.org/about 43 “Overview: The Parker Institute: A Better Model
for Cancer Research,” Parker Institute for Cancer Immunotherapy, retrieved March 2017, www.parkerici.org
44 Same as note 43.45 Laurie McGinley, “Bloomberg, Others Give Hopkins
$125 Million for Cancer Research that Helped Jimmy Carter” The Washington Post, March 29, 2016, www.washingtonpost.com
46 Lynn Lipinski, “$200 Million Gift Launches Lawrence J. Ellison Institute for Transformative Medicine of USC,” USC News, May 11, 2016, www.news.usc.edu, para. 2
47 Mike Lauer, “FY2016 By The Numbers,” Extramural Nexus, National Institutes of Health, February 3, 2017, www.nexus.od.nih.gov
48 Sarah Murray, “Private Foundations: Searching for the Sweet Spot,” Financial Times, June 24, 2016, www.ft.com
49 Cassandra Willyard, “Funding: Donor Drugs,” Nature, 2016, 533, 43-45
50 Mark D. Lim, Martha A. Brumfield, and Michel Goldman, “Philanthropies as Partners for Drug Development in Public-Private Partnerships,” Journal of Medicines Development Sciences, 2016, 1(1), 10-13
51 Same as note 50.52 Lisa M. Jarvis, “Academic Drug Discovery Centers
Adapt to Shifts in Funding Sources,” Chemical & Engineering News, March 27, 2017, www.cen.acs.org
53 Bill Snyder, “Foundation’s Support Speeds Search for New Schizophrenia Drugs at Venderbilt,” Research News, Vanderbilt University, August 15, 2016, www.news.vanderbilt.edu
54 “Alzheimer’s Association Awards $4.3 Million to Washington University,” Philanthropy News Digest, May 5, 2016, www.philanthropynewsdigest.org
55 “Five New Grants Fund Promising Treatments & Biomarkers,” Alzheimer’s Drug Discovery Foundation, July 7 , 2016, www.alzdiscovery.org
56 “Lauder and Newhouse Families Announce New Initiative to Find Treatments for Frontotemporal Dementia,” Alzheimer’s Drug Discovery Foundation, May 13, 2016, www.alzdiscovery.org
57 Leah Samuel, “The Faces of Childhood Cancer Stir Hearts –and Raise Millions for Research,” Stat, May 25, 2016, www.statnews.com
58 “How Humans of New York Changed Everything for One MSK Doctor,” Memorial Sloam Kettering Cancer Center, retrieved March 2017, www.giving.mskcc.
Giving USA Giving to Health
Giving USA FoundationTM | Giving USA 2017 | 269
org; Leah Samuel,“The Faces of Childhood Cancer Stir Hearts—and Raise Millions for Research,” Stat, May 25, 2016, www.statnews.com
59 Olga Khazan, “Why Americans Are Drowning in Medical Debt,” The Atlantic, October 8, 2014, www.theatlantic.com
60 “How It Works,” RIP Medical Debt, retrieved February 2017, www.ripmedicaldebt.org/how-it-works
61 “FAQ,” RIP Medical Debt, retrieved February 2017, www.ripmedicaldebt.org/faq
62 Jana Kasperkevic, “John Oliver Buys and Forgives $15 Million in Medical Debt,” The Guardian, June 6, 2016, www.theguardian.com
63 “John Oliver and Charity Team to Undo Millions in Medical Debt,” The Chronicle of Philanthropy, retrieved March 2017, www.philanthropy.com
64 Stephanie Eidelman, “Is RIP Really a Way Out for Some with Medical Debt?” insideARM, December 19, 2016, www.insidearm.com
65 Good to Know section authored by Editorial Review Board member Merrell Milano.
66 Paul Karon, “The Elephant in the Waiting Room: Behind a New Healthcare Collaborative,” Inside Philanthropy, August 4, 2016, www.insidephilanthropy.com
67 David Blumenthal, Bruce Chernof, Terry Fulmer, John Lumpkin, and Jeffrey Selberg. “Caring for High-Need, High-Cost Patients - An Urgent Priority.” New England Journal of Medicine, 2016, 375 (10), 909-911
68 Same as note 66.69 Paul Karon, “Lower Costs Yet Better Care?
Funders See a Key in Helping High-Need Parents,” Inside Philanthropy, March 31, 2016, www.insidephilanthropy.com
70 Mary Ann Roser, “Vision for Austin Psychiatric Crisis Center Moving to Reality,” My Statesman, March 29, 2016, www.mystatesman.com
71 Same as note 70.72 Rebecca Koenig, “Big Lots Gives $50 Million to
Build Youth Mental-Health Facility,” The Chronicle of Philanthropy, August 31, 2016, www.philanthropy.com
73 “Big Lots Has Bold Plan to Help Kids Everywhere,” Nationwide Children’s Hospital, retrieved March 2017, www.nationwidechildrens.org
74 “Providence St. Joseph Health Celebrates First Day as a New Organization by Committing to be a Catalyst for Improving Mental Health,” Providence St. Joseph Health, July 6, 2016, www.psjhealth.org; Courtney Perkes, “Why Providence St. Joseph Will Spend $100 Million on Health Care,” Daily Breeze, July 6, 2016, www.dailybreeze.com
75 Leena Rao, “Melinda Gates, Steve Ballmer, Reid Hoffman Back Text-Based Counseling Service,” Fortune, June 15, 2016, www.fortune.com
76 Nicole Wallace, “Crisis Text Line Gets $23.8 Million to Expand,” The Chronicle of Philanthropy, June 16, 2016, www.philanthropy.com, para. 3
77 “Crisis Text Line Opens Nation’s Largest Set of Crisis Data for Limited Research,” PR Newswire, February 17, 2016, www.prnewswire.com
78 FY 2015 AHP Report on Giving, USA, Association for Healthcare Philanthropy, 2016, www.ahp.org
79 Same as note 78.80 Peter Olsen-Phillips, “How the 2016 Philanthropy
400 Was Compiled,” The Chronicle of Philanthropy, October 27, 2016, www.philanthropy.com.
81 The Chronicle of Philanthropy does not use the NTEE coding system for categorizing nonprofit organizations as does Giving USA; therefore, listings here for the Chronicle may vary from how Giving USA categorizes organizations. “The 2016 Philanthropy 400,” The Chronicle of Philanthropy, October 27, 2016, www.philanthropy.com
82 “The 2016 Philanthropy 400 2016,” The Chronicle of Philanthropy, October 27, 2016, www.philanthropy.com
83 Same as note 82; “Every Drop Adds Up,” ALS Association, retrieved April 2017, www.alsa.org/fight-als/ice-bucket-challenge.html
84 Information received from Paul Arnsberger, Internal Revenue Service, April 2017, www.irs.gov
270 | Giving USA FoundationTM | Giving USA 2017
Giving USA Giving to Health

14 | Giving toPublic-SocietyBenefit
Giving USA FoundationTM | Giving USA 2017 | 271
Giving to public-society benefit organizations amounted to 8 percent of total giving in 2016.1
Contributions to the public-society benefit subsector increased 3.7 percent in 2016, to $29.89 billion in contributions. Adjusted for inflation, giving to public-society benefit organizations increased 2.5 percent.
The total amount contributed to public-society benefit in 2016 reached its highest inflation-adjusted value to date.

The information provided in this chapter derives from a number
of sources, including publicly available reports, news stories, and websites from the most recent year. This chapter is meant to provide context for the giving trends reported in this edition of Giving USA and to illustrate some of the practical implications of the data. It is not intended to be a comprehensive survey of the subsector, but rather a collection of examples from the field.
Trends in giving to public-society benefit in 2016
In 2016, giving to public-society benefit grew for the seventh consecutive year at an average rate of 8.2 percent per year.5 In the last five-year period (2012 to 2016), giving to this subsector experienced an average annual rate of growth of 7.0 percent—tying it at third place with giving to foundations in terms of growth out of the nine subsectors. Giving to the public-society benefit subsector was above the five-year average rate of growth in total giving of 5.6 percent. This subsector saw its smallest gain of the last five years
272 | Giving USA FoundationTM | Giving USA 2017
Giving USA Giving to Public-Society Benefit
Practitioner Highlights The public-society benefit subsector reached a historically high level
of private support in 2016, buoyed in part by momentous social and political events during the calendar year. 2
For the first time, Fidelity Charitable Gift Fund, the largest donor-advised fund sponsor in the United States, surpassed United Way Worldwide as the top charity that raised the most private funds in the previous fiscal year on The Chronicle of Philanthropy’s Philanthropy 400 ranking. 3
Online giving and agile social media messaging were particularly relevant to this sector in 2016, allowing public-society benefit organizations to fundraise in tandem with widely-covered current events.4
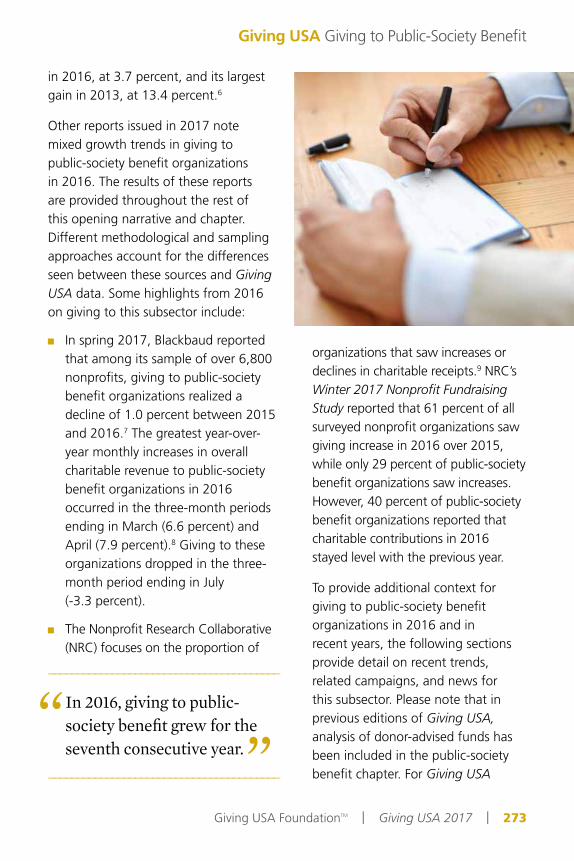
in 2016, at 3.7 percent, and its largest gain in 2013, at 13.4 percent.6
Other reports issued in 2017 note mixed growth trends in giving to public-society benefit organizations in 2016. The results of these reports are provided throughout the rest of this opening narrative and chapter. Different methodological and sampling approaches account for the differences seen between these sources and Giving USA data. Some highlights from 2016 on giving to this subsector include:
In spring 2017, Blackbaud reported that among its sample of over 6,800 nonprofits, giving to public-society benefit organizations realized a decline of 1.0 percent between 2015 and 2016.7 The greatest year-over-year monthly increases in overall charitable revenue to public-society benefit organizations in 2016 occurred in the three-month periods ending in March (6.6 percent) and April (7.9 percent).8 Giving to these organizations dropped in the three-month period ending in July (-3.3 percent).
The Nonprofit Research Collaborative (NRC) focuses on the proportion of
organizations that saw increases or declines in charitable receipts.9 NRC’s Winter 2017 Nonprofit Fundraising Study reported that 61 percent of all surveyed nonprofit organizations saw giving increase in 2016 over 2015, while only 29 percent of public-society benefit organizations saw increases. However, 40 percent of public-society benefit organizations reported that charitable contributions in 2016 stayed level with the previous year.
To provide additional context for giving to public-society benefit organizations in 2016 and in recent years, the following sections provide detail on recent trends, related campaigns, and news for this subsector. Please note that in previous editions of Giving USA, analysis of donor-advised funds has been included in the public-society benefit chapter. For Giving USA
Giving USA Giving to Public-Society Benefit
Giving USA FoundationTM | Giving USA 2017 | 273
________________________________________
In 2016, giving to public-society benefit grew for the seventh consecutive year.
________________________________________

2017, discussion of these giving vehicles has been shifted to a special section on donor-advised funds for more in-depth exploration.
Online giving to public-society benefit organizations saw healthy increases in 2016
Three different reports noted positive results for giving to public-society benefit organizations in 2016 via online methods. While different methodological and sampling approaches account for the differences seen between these sources and Giving USA data, these sources highlight trends seen by specific types of public-society benefit organizations.
Online giving growth was much stronger for the sample of Blackbaud public-society benefit organizations than was overall giving to these same organizations, increasing 12.7 percent in 2016—more than all categories except higher education.10 The greatest year-over-year monthly increases in online charitable revenue to public-society benefit organizations in 2016 occurred in the three-month periods ending in February (20.7 percent) and November (22.8 percent).11 Growth in online giving to these organizations slowed in the three-month periods ending in July (5.8 percent) and August (7.3 percent).
According to Blackbaud’s Luminate Online Benchmark Report 2016, public affairs organizations realized growth in repeat online revenue and monthly recurring, or sustainer, online revenue as a percentage of total fundraising, increasing by 4 percent and 9 percent in 2016, respectively.12 Public affairs organizations’ aggregate online revenue growth was flat in 2016 as compared with 2015.
In a different study, the Benchmarks 2017 report by M+R and NTEN also reported very positive results for online giving to a sample of rights organizations.13 In 2016, these organizations experienced an overall increase in online revenue of 35 percent. This was the highest increase in online giving for all types of responding organizations. This jump was driven by large increases in revenue for one-time online giving (23 percent) and monthly online giving (51 percent).
2016 U.S. presidential election
The public-society benefit subsector includes organizations dedicated to voter education and participation. As 2016 was an election year, such organizations were active on all fronts leading up to the November 8 Election Day.14 The following sections detail these organizations’ efforts to engage voters as well the impacts of the election on giving.
274 | Giving USA FoundationTM | Giving USA 2017
Giving USA Giving to Public-Society Benefit

Voter education and engagement organizations saw increased activity in 2016 In 2016, several nonprofits launched or reignited initiatives centered on observing and evaluating polling locations and promoting voter registration. The Transformative Justice Coalition released a 2016 report analyzing voting rights and existing barriers to full voting access in 2015.15 Particularly, the report summarized the challenges that marginalized communities (specifically various racial, social, and economic minorities) may experience with regard to voting rights. The report also discusses numerous voter suppression efforts and provided
strategies for intervention such as supporting voter registration reforms, enhancing communication, and establishing voter assistance hotlines. Project Vote, a nonpartisan, nonprofit organization working to ensure equal voting representation, also released a series of publications addressing representational bias, registration guidelines, and voter repression and fraud concerns.16
Nonprofit initiatives around voters’ rights in 2016 included many cross-sector collaborations and partnerships. Organizations typically not involved in civic awareness stepped up to serve as platforms for voter engagement. Planned Parenthood—which serves over 2.5 million patients per year, most from marginalized backgrounds—launched a voter registration campaign in August 2016 called “My Vote, My Voice.”17
Other projects focused on voter representation on Election Day. Nonprofit VOTE was one of many organizations providing “get-out-the-vote” toolkits, particularly throughout communities that have traditionally been under-represented at the polls.18
In an effort to monitor the success of 2016 polling sites, the Voting Technology Project tracked how long voters had to wait to cast their ballots.19 With a $450,000 grant from the Democracy Fund, project researchers from the California Institute of Technology (Caltech) and the Massachusetts Institute
Giving USA Giving to Public-Society Benefit
Giving USA FoundationTM | Giving USA 2017 | 275

of Technology (MIT) conducted studies on November 8 as part of an effort to streamline registration and reduce time spent waiting at polling locations.
The Democracy Fund is also currently working with the Center for Civic Design to develop a location-independent ballot that could be cast from an electronic device, though product adoption is likely years away.20 The Democracy Fund additionally sponsors the Open Source Election Technology (OSET) Institute to develop comprehensive voting software that would generate ballots and process votes.21
Charitable giving post-election boosts civil rights organizationsAfter Donald J. Trump’s presidential victory on November 8, several public-society benefit organizations and other advocacy groups that support women, civil rights, minority populations, and immigrants reported “unprecedented levels of support.”22 Some of the post-election bumps in donations within the first week following Election Day, many of which came from first-time donors, included:
The American Civil Liberties Union (ACLU) reported receiving over $7.2 million in donations;23
The National Immigration Law Center received more than $115,000 from nearly 2,000 new donors;24
Planned Parenthood reported receiving over 200,000 donations;25 and
The Council on American-Islamic Relations received 500 new volunteer applications.26
Philanthropic response to the June 2016 shooting at Pulse nightclub
On June 12, 2016, 29-year-old Omar Mateen executed the deadliest mass public shooting in U.S. history in Orlando, Florida.27 Opening fire at Pulse, a nightclub catering to LGBTQ clientele, Mateen killed 49 individuals and injured 53 others.28
Within days of the tragedy, LGBTQ organizations and crowdfunding campaigns collaborated to serve shooting victims and their families. Equality Florida, the state’s largest LGBTQ advocacy group, led the creation of a crowdfunding campaign to provide for the physical and psychological needs of the victims.29 Three days after the shooting, more than $4.2 million from over 90,000 donors had been committed through Equality Florida’s GoFundMe page. In total, the campaign raised more than $7 million.30
Equality Florida also led partnership efforts with the local government of Orlando, the National Center for Victims of Crime, and other community partners to distribute the donations from the Pulse Victims Fund.31 Similarly, The Center, another LGBTQ advocacy group, raised more than $355,000
276 | Giving USA FoundationTM | Giving USA 2017
Giving USA Giving to Public-Society Benefit
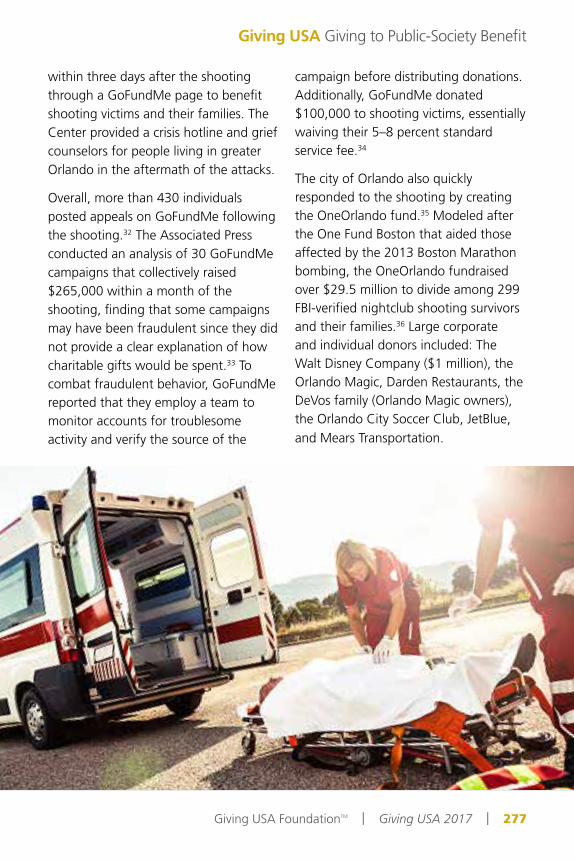
within three days after the shooting through a GoFundMe page to benefit shooting victims and their families. The Center provided a crisis hotline and grief counselors for people living in greater Orlando in the aftermath of the attacks.
Overall, more than 430 individuals posted appeals on GoFundMe following the shooting.32 The Associated Press conducted an analysis of 30 GoFundMe campaigns that collectively raised $265,000 within a month of the shooting, finding that some campaigns may have been fraudulent since they did not provide a clear explanation of how charitable gifts would be spent.33 To combat fraudulent behavior, GoFundMe reported that they employ a team to monitor accounts for troublesome activity and verify the source of the
campaign before distributing donations. Additionally, GoFundMe donated $100,000 to shooting victims, essentially waiving their 5–8 percent standard service fee.34
The city of Orlando also quickly responded to the shooting by creating the OneOrlando fund.35 Modeled after the One Fund Boston that aided those affected by the 2013 Boston Marathon bombing, the OneOrlando fundraised over $29.5 million to divide among 299 FBI-verified nightclub shooting survivors and their families.36 Large corporate and individual donors included: The Walt Disney Company ($1 million), the Orlando Magic, Darden Restaurants, the DeVos family (Orlando Magic owners), the Orlando City Soccer Club, JetBlue, and Mears Transportation.
Giving USA Giving to Public-Society Benefit
Giving USA FoundationTM | Giving USA 2017 | 277

Finally, two Orlando-area hospitals, Florida Hospital and Orlando Regional Medical Center, of Orlando Health, waived the medical bills of 50-plus shooting victims, amounting to approximately $5 million in unreimbursed costs.37 Similarly, the Orlando City Council voted to provide the Heart of Florida United Way with more than $123,000 to maintain staff for an additional two months at the newly opened Orlando United Assistance Center. The center began offering services June 27, 2016 after the Orange County government collaborated with the City of Orlando to create a space that provided basic mental healthcare, grief counseling, support groups, rent assistance, and other services to families and survivors.38
At the time of the grant, city officials were brainstorming ways to keep the Center open long-term to address the ongoing needs of the community.
Veterans groups and reintegration programs receive support and scrutiny in 2016
Veterans groups received several mega-gifts in 2016, particularly those that work to help transition soldiers back into the workforce and to provide treatment and support for soldiers suffering from post-traumatic stress disorder (PTSD).
The largest gift in 2016 to veterans’ causes was a $325 million pledge by Steven Cohen to his organization, the Cohen Veterans Network, to provide support for veterans suffering from PTSD and to fund medical research focusing on PTSD.40 The Walmart Foundation additionally gave a total of $2.6 million to organizations that work specifically to reintegrate veterans into the workforce, with $1.6 million to Swords to Plowshares and $1 million to the American GI Forum National Outreach Program.41 The Support Center, a nonprofit and community development financial institution based in North Carolina, also received a $1 million loan and $500,000 grant from Wells Fargo Diverse Community Capital program to assist small businesses owned by African-Americans, Latinos, and veterans.42
278 | Giving USA FoundationTM | Giving USA 2017
Giving USA Giving to Public-Society Benefit
Good to KnowOnline giving, which saw healthy increases in 2016, provided public-society benefit organizations with an agile and fluid giving mechanism that worked in coordination with social media efforts.39 The combination of social media and online giving campaigns allowed these organizations the opportunity to communicate with and engage donors in the wake of social and political events that spurred philanthropic giving. The 2016 election campaign and the shooting at the Orlando Pulse nightclub, in particular, were discussed heavily in the social media sphere. Following these events were remarkably high levels of donations and engagement, seen for instance in the case of ACLU donations post-election.

Several higher education institutions with programs catering to U.S. veterans also received multi-million-dollar gifts in 2016. The Leonard N. Stern School of Business at New York University reported a $15 million endowment gift to provide scholarships to U.S. military veterans or active-duty MBA candidates.43 The University of Chicago’s Booth School of Business also received a $10 million gift from an alumnus to fund scholarships for U.S. veteran MBA candidates.44 The Institute for Veterans and Military Families (IVMF) at Syracuse University received considerable support, with a $5 million grant from the Walmart Foundation and a commitment of $13.8 million through 2020 from JPMorgan Chase & Co., who helped co-fund IVMF when it began five years prior.45
Other initiatives and collaborations around veteran’s affairs in 2016 include:
The Cohen Veterans Network turned its attention to PTSD and mental health, with five clinics open to date and a goal of opening 25 in the next five years;46
One Mind, peer-to-peer patient network PatientsLikeMe, Give an Hour, and Veterans of Foreign Wars (VFW) joined together for the VFW Mental Wellness Campaign, a national campaign to raise awareness for mental health in military and veteran communities;47 and
The Bob Woodruff Foundation, which provides grants to nonprofits
working with veterans, issued grants to several organizations focusing on PTSD and mental health, including Warriors at Ease, Warrior Canine Connection, The Red Badge Project, Hope For The Warriors, American Red Cross, and PsychArmor Institute, in addition to the Museum of Glass in Tacoma, WA, which provides glass-blowing classes for recovering veterans.48
Vast network of veterans support organizations lead some donors to call for restructurationIn 2016, the Schultz Family Foundation released a report on veteran’s affairs organizations and philanthropic support.49 The report studied the military philanthropic landscape and was compiled in conjunction with a consulting firm that surveyed 40,000 organizations that work with veterans and their families. Additionally, interviews were conducted at military bases, with hospitals that serve veterans, and with veterans and their families.
According to some donors, the abundance of veteran organizations results in overlap and fragmentation; the network could benefit from external direction and oversight.50 Another perceived disadvantage of the sector is how young many programs are, with the vast majority of organizations seeking to support post-9/11 veterans of the wars in Iraq and Afghanistan.
Giving USA Giving to Public-Society Benefit
Giving USA FoundationTM | Giving USA 2017 | 279

In terms of programmatic areas of priority, the report found that PTSD and brain injuries are areas in need of the most support, in addition to addressing veterans’ economic stability.51
Pay-for-success programs launch initiatives in three new states
Pay-for-success (PFS) programs experienced growth in 2016 as multiple states across the U.S. announced new deals targeted toward addressing public health, child health, and homelessness.
Also known as social impact bonds (SIBs), PFS programs help local and state governments fund social programs by allowing private investors to put up starting or expansionary capital for a select initiative.52 In this public-private partnership, investors are repaid by governments only if the intended social outcomes are achieved. Introduced as a way for governments to test out new programs, PFS programs require independent evaluators to determine if benchmarks have successfully been met before the investor is reimbursed.
The John F. Kennedy School of Government at Harvard University (Harvard Kennedy School), through its Government Performance Lab, supported PFS initiatives that started at state and local levels in 2016, with programs in Connecticut, South
Carolina, and Denver, Colorado launching in February.53
Connecticut Governor Dannel Malloy announced a $12 million effort to commence a four-year initiative focused on preventing the children of 500 families from entering the foster care system.54 While a funder has not been named, several parties were considering participation in the state’s first social impact bond.
Similarly, Governor Nikki Haley of South Carolina announced a four-year, $30 million program to send maternal and child health nurses into low-income homes with a pregnant mother, with the goal of improving birth outcomes and early child development.55 Medicaid will contribute $13 million, and the remaining $17 million will be funded by The Duke Endowment ($8 million), BlueCross BlueShield of South Carolina Foundation ($3.5 million), The Boeing Company ($800,000), Greenville County, South Carolina First Steps to School Readiness ($700,000), the Laura and John Arnold Foundation ($491,000), and other private funders ($4 million).
Denver’s PFS initiative seeks to provide 250 housing units across the city for the currently homeless, operating on the theory that providing stable homes will reduce costs for the criminal justice system and emergency medical systems, whose interactions
280 | Giving USA FoundationTM | Giving USA 2017
Giving USA Giving to Public-Society Benefit

with individuals experiencing homelessness can be costly for taxpayers.56 Foundation support will provide $8.7 million in funding, drawing from sources such as The Denver Foundation and the Laura and John Arnold Foundation, with an additional $15 million provided from federal government resources.
The state of Colorado is also pursuing other pay-for-success opportunities. On April 19, 2016, Governor’s Office of State Planning and Budgeting received an award valued at $284,227 from the University of Utah Sorenson Impact Center to assist with a feasibility study examining the potential to create early intervention programs for youth who interact with several different state services.57 The PFS program would attempt to prevent long-term interactions by young people with state systems, especially in regard to the juvenile justice system.
Giving to federated campaigns in 2016
Federated campaigns or federated funds are investment vehicles designed to raise contributions and disburse funds to member organizations. The following sections detail trends in giving to large federated campaigns in recent years.
Jewish federations experienced a healthy year for giving.Like many nonprofit organizations, Jewish federations experienced a downturn in charitable donations following the 2008 economic recession.58 In 2016, The Jewish GDP study, published by The Jewish Week, reported total revenue among federations increased substantially in fiscal years 2013–2014.59 While gifts to federations vary, the vast majority saw revenue increases due to improved stock market performance in the period after the recession. The Jewish GDP analyzes publicly disclosed financial data from Jewish nonprofit organizations.
In 2016, Jewish federations and other associated organizations launched new initiatives in concert with other federations. Examples include:
Jewish United Fund of Metropolitan Chicago (JUF) raised $84.3 million via their annual campaign in 2016.60 Funds raised will support more than 70 social service programs that reach
Giving USA Giving to Public-Society Benefit
Giving USA FoundationTM | Giving USA 2017 | 281

over 500,000 Chicago-area residents, regardless of faith, as well as provide assistance to millions of Jews across the world.
The International Fellowship of Christians and Jews (IFCJ), in partnership with the American Jewish Joint Distribution Committee (JDC) announced a $52 million partnership to launch IFCJ’s Food and Medicine Lifeline.61 The fund will invest $13 million annually over four years to provide elderly and impoverished Jews in former Soviet Union countries with food and medicine. Many of the intended recipients will be Holocaust survivors.
The Genesis Prize Foundation (GPF) and Jewish Funders Network (JFN) introduced a new matching grant initiative called Breaking Barriers in honor of Itzhak Perlman, winner of the 2016 Genesis Prize.62 The second matching grant collaboration between GPF and JFN, the program will match grants between $25,000–$75,000 in the U.S. and Canada to support organizations serving Jewish people with disabilities.
United Way Worldwide no longer in top spot on the Philanthropy 400For the second time since The Chronicle of Philanthropy first published the Philanthropy 400 in 1991, United Way Worldwide was not listed as the top
charity that raised the most private funds in the previous fiscal year.63 Instead, Fidelity Charitable Gift Fund (Fidelity Charitable), the country’s largest national donor-advised fund sponsor, took first place. The Philanthropy 400 is an annual ranking of the top 400 nonprofits in terms of private support received in the previous fiscal year.64
With more than $15 billion in assets under management, Fidelity Charitable doubled the total dollar amount of grants disbursed from sponsored funds from four years ago, awarding over $3 billion in grants in 2015.65 Presently, the organization is positioned to surpass the Bill & Melinda Gates Foundation as the nation’s largest grantmaker.
Fidelity Charitable’s position marks the first time a donor-advised fund sponsor has topped the Philanthropy 400 list.66 Similarly, other donor-advised fund organizations rose in ranking on the list, including Schwab Charitable (4th place) and Vanguard Charitable (11th place).67
In contrast, United Way’s fundraising efforts, when adjusted for inflation, were less than two-thirds of donations collected in 1990, and nearly $1 billion behind Fidelity Charitable’s 2015 contributions.68 Analysts, including United Way’s president Brian Gallagher, indicated the decline in giving could be explained by changes in wages or corporate consolidations and downsizing that affect the organization’s workplace giving campaigns, among other factors.69
282 | Giving USA FoundationTM | Giving USA 2017
Giving USA Giving to Public-Society Benefit

Given these takeaways, some sources feel United Way chapters can benefit from demonstrating impact regarding critical community issues.70 For many supporters, United Way still remains a valuable convener of nonprofits collaborating to address multidimensional problems.
Trends in grantmaking and support for nonprofit capacity building
In 2016, several organizations whose missions focus on building capacity within social and economic systems received increased attention and investment. Funders interested in developing resources for nonprofits and communities made strategic grants across the nation, both through collaborative partnerships and as part of stand-alone initiatives.
Survey on contingency funding finds that grantees are hesitant to ask for additional resourcesIn 2016, Open Road Alliance released a report that summarized the results of a 2015 survey on the availability of contingency funding.71 Contingency funding is defined as “requests for additional funding during the lifetime of the grant related to unforeseen disruptive events.”72 The report gathered
data from 200 funders and 200 grantees and analyzed the frequency of requests for contingency grants, typical donor responses, current policies surrounding these funds, and consequences for not receiving the grants.
Entitled Contingency Funding in Philanthropy: Open Road Alliance Survey, the report found that 20 percent of projects require additional funding to complete successful projects at peak capacity on the set grant schedule.73 These risks are not often assessed by either funders or grantees prior to project initiation. Despite hesitation of grantees to communicate with funders about the risks, most funders not only have the capacity to respond, but they would likely give the requested funds.
While many grantee respondents were concerned that requests for additional funds would hurt their chances in receiving grants from these funders in the future, funders report that these requests do not impact a recipient’s standing with the institution.74
New support for building nonprofit and community data capacityContinuing the trend of innovations in fundraising, investment in data capacity for nonprofits was another area of interest for funders in 2016.
DataKind, a New York nonprofit, received a $2 million gift from the Omidyar Network in 2016.75 DataKind
Giving USA Giving to Public-Society Benefit
Giving USA FoundationTM | Giving USA 2017 | 283

engages data scientists in providing pro-bono work to organizations across the globe, and seeks to offer solutions to social problems through data and modern analysis techniques.76 Omidyar Network’s three-year gift will focus on increasing the capacity of DataKind to provide services and foster collaboration. It will also foster the development of new analytical strategies for application in charitable contexts.
In 2016, the NetGain partnership made a combined total of $18 million in grants directed toward public interest technology.77 Formed in 2015, the NetGain partnership is comprised of the Ford Foundation, the John D. and Catherine T. MacArthur Foundation, the John S. and James L. Knight Foundation, Open Society Foundations, and the Mozilla Foundation. The grants were directed toward developing public interest technology, defined as Internet or technological tools specifically designated to improve and engage with civil society and the government.
Results for 2016 show healthy growth in contributions received by public-society benefit organizations
The Chronicle of Philanthropy annually compiles a list of the top 400 public charities and private foundations.78
The Philanthropy 400 ranks charities according to the level of private donations received in the previous fiscal year. Private donations include gifts from all private sources—individuals, corporations, and foundations. Gifts of cash, shares of stock, in-kind donations, real estate, and valuables are included. To determine the rankings, the Chronicle compiles information from IRS Forms 990, annual reports, financial statements, and a questionnaire.
Philanthropy 400 data issued in 2016 for giving in the fiscal year ending in 2015 include 18 organizations that are classified as donor-advised funds (compared with 17 reported in the prior year), nine Jewish federations (same as the number reported in the prior year), seven public affairs organizations (compared with six reported in the prior year), and four charities classified as “other” (same as the number reported in the prior year).79 For the purposes of this chapter, donor-advised fund rankings on the Philanthropy 400 will be discussed in the special section on donor-advised funds. Typically, donor-advised funds are the highest ranked public-society benefit organizations on the Philanthropy 400.
The top five public-society benefit organizations (not including donor-advised funds) on the list with the greatest amount in private support are:80
Ranking 60th: Combined Jewish Philanthropies of Greater Boston,
284 | Giving USA FoundationTM | Giving USA 2017
Giving USA Giving to Public-Society Benefit

Boston, MA, with $392.04 million in private contributions, an increase of 34.9 percent from the previous year;
Ranking 74th: Jewish Federations of North America, New York, NY, with $332.01 million in private contributions, an increase of 18.1 percent;
Ranking 84th: Pew Charitable Trusts, Philadelphia, PA, with $302.01 million in private contributions, with no change from the previous year;
Ranking 101st: Network for Good, Washington DC, with $253.77 million in private donations, an
increase of 10 percent; and
Ranking 142nd: American Civil Liberties Union Foundation, New York, NY, with $184.04 million in private contributions, an increase of 23.3 percent.
Key findings from annual studies
Table 1 presents three years of data from studies released annually about contributions to organizations in the public-society benefit subsector. Website addresses are provided so readers can access the full reports.
Giving USA Giving to Public-Society Benefit
Giving USA FoundationTM | Giving USA 2017 | 285
Table 1 Key findings from other studies about giving to public-society benefit organizations
IRS Statistics of Income Bulletin81 Tax-exempt public-society benefit organizations: 2011–2013
www.irs.gov
2011 2012 2013
Number of returns 24,718 25,226 26,949
Charitable revenue $49.92 billion $53.56 billion $60.49 billion
Chapter authored by Meg P. O’Halloran, Executive Director, CCS, and Christianna Luy, M.A., CFRE, Executive Director, CCS.
Good to Know sections and Practitioner Highlights written by Giving USA Editorial Review Board members Grant Forssberg and Karen Rotko-Wynn.

References1 All data in this section are reported as estimates, which
are subject to revision. To provide the most accurate estimates for charitable giving, as new data become available, Giving USA revises its estimates for at least the last two years. See more about how Giving USA calculates charitable giving by sources and uses in the “Brief summary of methods used” section of this report.
2 Practitioner highlight authored by Editorial Review Board member Grant Forssberg.
3 Practitioner highlight authored by Editorial Review Board member Karen Rotko-Wynn.
4 Practitioner highlight authored by Editorial Review Board member Grant Forssberg.
5 This information is in current dollars.6 This information is in current dollars.7 This information was provided to Giving USA directly
from Blackbaud in May 2017. The Blackbaud Index of Charitable Giving assesses changes in total charitable giving from year to year using a three-month rolling median of the charitable revenue reported by a selected sample of U.S. nonprofits. This information reflects data on total charitable giving reported by 6,857 organizations across the nonprofit sector, representing total charitable revenue of $23.6 billion in 2016. Online giving data are reported by 4,958 nonprofits with charitable support amounting to $2.7 billion in 2016. Month-by-month Blackbaud Index data on both online and total giving are available at www.blackbaud.com/nonprofit-resources/blackbaud-index. Note that Blackbaud data are constantly being updated; therefore, figures published in Giving USA may vary from current figures.
8 Year-over-year monthly giving data are from the Blackbaud Index, May 2017, https://www.blackbaud.com/nonprofit-resources/blackbaud-index
9 The Nonprofit Research Collaborative (NRC) annually conducts surveys on fundraising trends across the nonprofit sector. In 2017, this collaboration included the Giving USA Foundation, the Association of Fundraising Professionals, CFRE International, the Association of Philanthropic Counsel, the National Association of Charitable Gift Planners, and Top Nonprofits. In early 2017, the NRC launched a survey to assess fundraising trends for the entire 2016 calendar year. The survey asked nonprofit leaders of public charities and foundations to report on changes in charitable revenue received and changes in the number of donors by specific donor type, among other questions. Data in this section come from the Winter 2017 Nonprofit Fundraising Survey report from the Nonprofit Research Collaborative, May 2017, www.npresearch.org. A convenience sample of 1,019 respondents, 144 of them Canadian, constitutes the survey results.
10 Same as note 7.11 Same as note 8.12 Luminate Online Benchmark Report 2016, Blackbaud,
2017, www.blackbaud.com. Data from this report cover the fiscal year July 1, 2015 to June 30, 2016 for a sample
of 631 nonprofit organizations that use Luminate Online cloud-based software by Blackbaud.
13 Benchmarks 2017, M+R and NTEN, 2017, www.e-benchmarksstudy.com. Note that this study uses a convenience sample of 133 organizations with online revenue totaling over $535 million and that the organizations types reported in this study do not necessarily match those used in Giving USA.
14 Alex Daniels, “Nonprofits Work at Polls to Smooth Voting and Rebut ‘Rigged’ Claims,” The Chronicle of Philanthropy, November 3, 2016, www.philanthropy.com
15 Barbara Arnwine, Fostering an Inclusive Democracy: A Strategic Vision to Protect and Expand Voting Rights, Transformative Justice Coalition and W.K. Kellogg Foundation, 2016, http://www.tjcoalition.org/wp-content/uploads/2016/08/FOSTERING-AN-INCLUSIVE-DEMOCRACY-08.4.16-with-new-cover.pdf
16 ”Publications,” ProjectVote, retrieved April 2017, www.pojectvote.org/publications
17 Anna Merod, “Planned Parenthood Launches Voter Registration Campaign,” NBC News, August 6, 2016, www.nbcnews.com
18 Rebecca Koenig, “Campaign Enters Final Lap, Nonprofits Ratchet Up Voting Work,” The Chronicle of Philanthropy, September 13, 2016, www.philanthropy.com
19 Same as note 14.20 Same as note 14.21 Same as note 14.22 Timothy Sandoval, “Nonprofits See Unprecedented
Support Following Trump’s Win,” The Chronicle of Philanthropy, November 15, 2016, www.philanthropy.com, para. 3
23 Timothy Sandoval, “Nonprofits See Unprecedented Support Following Trump’s Win,” The Chronicle of Philanthropy, November 15, 2016, www.philanthropy.com
24 Same as note 23.25 Allison Carter, “46,000 people have donated to Planned
Parenthood in Mike Pence’s name since the election,” The Indianapolis Star, November 15, 2016, www.indystar.com. Please note that Planned Parenthood is technically classified as a health nonprofit according to NTEE coding, although it does participate in advocacy activities.
26 Adam Chandler, “The Post-Election Surge in Donations,” The Atlantic, November 14, 2016, www.theatlantic.com
27 Matt Vasilogambros, “Was Orlando the Deadliest Mass Shooting in U.S. History?” The Atlantic, June 15, 2016, www.theatlantic.com
28 Gal Tziperman Lotan, Charles Minshew, Mike Lafferty and Andrew Gibson, “Orlando Nightclub Shooting Timeline: Three Hours of Terror Unfold,” Orlando Sentinel, July 1, 2016, www.orlandosentinel.com
29 Alicia Adamczyk, “#Orlando United: How to Donate to Help Victims of the Orlando Nightclub Shooting,” Money, Time, June 15, 2016, www.time.com/money
30 Same as note 29.31 Same as note 29.32 The Associated Press, “Report Finds Questionable
286 | Giving USA FoundationTM | Giving USA 2017
Giving USA Giving to Public-Society Benefit

Giving USA Giving to Public-Society Benefit
Giving USA FoundationTM | Giving USA 2017 | 287
GoFundMe Campaigns After Orlando Shooting,” The Chronicle of Philanthropy, August 29, 2016, www.philanthropy.com33 Jeff Donn, “Scams, Waste Exposed after 400+ Pulse
Shooting Related Fundraisers Show Up Online,” The Daytona Beach News Journal, August 27, 2016,
www.news-journalonline.com34 Caitlin Dewey, “How GoFundMe is Making Sure All
of Those Orlando Victim Fundraisers are Legit,” The Washington Post, June 14, 2016, www.washingtonpost.com
35 Same as note 29.36 Kate Santich, “One Orlando Fund to Give Families of
Those Killed at Pulse $350,000 Each,” Orlando Sentinel, September 26, 2016, www.orlandosentinel.com; Alicia Adamczyk, “#Orlando United: How to Donate to Help Victims of the Orlando Nightclub Shooting,” Money, Time, June 15, 2016, www.time.com/money
37 Camila Domonoske, “Orlando Hospitals Say They Won’t Bill Victims of Pulse Nightclub Shooting,” NPR, August 25, 2016, www.npr.org; Kate Santich, “One Orlando Fund to Give Families of Those Killed at Pulse $350,000 Each,” Orlando Sentinel, September 26, 2016, www.orlandosentinel.com
38 Jeff Weiner, “Orlando Eyes Deal to Keep Center for Pulse Victims Open for Years,” Orlando Sentinel, September 11, 2016, www.orlandosentinel.com
39 Good to Know section authored by Editorial Review Board member Grant Forssberg.
40 Paul Sullivan, “Disgraced Hedge Fund Manager Focuses on Aiding Veterans,” The New York Times, November 4, 2016, www.nytimes.com
41 “Walmart Celebrates Anniversary of Veterans Welcome Home Commitment with Announcement of 130,828 Veteran Hires,” BusinessWire, May 24, 2016, www.businesswire.com
42 Rebecca Koenig, “Grants Roundup: Wells Fargo and Sam’s Club Back Small-Business Development,” The Chronicle of Philanthropy, May 11, 2016, www.philanthropy.com
43 “NYU Stern Receives $15 Million for Veterans MBA Program,” Philanthropy News Digest, November 3, 2016, www.philanthropynewsdigest.org
44 “Alumnus Eric Gleacher Gives $10 Million to Fund Scholarships for Veterans at Chicago Booth,” UChicago News, University of Chicago, April 4, 2016, www.news.uchicago.edu
45 “JPMorgan Chase and Syracuse University Renew Partnership to Support Institute for Veterans and Military Families (IVMF),” JPMorgan Chase & Co., February 29, 2016, www.jpmorganchase.com; “National Veteran Reintegration Program Simplifies Life for Veteran Families with Support from the Walmart Foundation,” Walmart, November 9, 2016, www.news.walmart.com
46 Same as note 40.47 “VFW Partners with Give an Hour for Mental Wellness
Campaign,” Give an Hour, September 9, 2016, www.giveanhour.org
48 “2016 Fall Grants,” The Bob Woodruff Foundation, December 15, 2016, www.bobwoodrufffoundation.org
49 Michael S. Schmidt and Nicholas Fandos, “Donors to Veterans’ Causes Face Crowded Field of Charities,” The New York Times, November 4, 2016, www.nytimes.com
50 Same as note 49. 51 Same as note 49.52 Alex Daniels, “Anatomy of a Pay-for-Success Deal to
Keep Men from Returning to Jail,” The Chronicle of Philanthropy, March 8, 2016, www.philanthropy.com
53 “Biggest Week Yet for Pay for Success in the U.S.,” Government Performance Lab, Harvard Kennedy School, Harvard University, February 16, 2016, www.govlab.hks.harvard.edu
54 Lenny Bernstein, “‘Government Only Pays for the Positive Outcomes.’ A Strikingly New Approach to Social Problems,” The Washington Post, February 16, 2016, www.washingtonpost.com
55 “Fact Sheet: South Carolina Nurse-Family Partnership Pay for Success Project,” South Carolina Department of Health and Human Services, retrieved April 2017, https://www.scdhhs.gov/sites/default/files/2-16-16-SC-NFP-PFS-Fact-Sheet_3.pdf
56 “Fact Sheet: Denver Social Impact Bond Program to Address Homelessness,” Corporation for Supportive Housing (CSH), retrieved April 2017, http://www.csh.org/wp-content/uploads/2011/12/Denver-SIB-FactSheet.pdf
57 “University of Utah Sorenson Impact Center, Grantee Information, Colorado,” Corporation for National & Community Service, retrieved April 2017, www.nationalservice.gov; “Colorado Awarded First Pay for Success Grant for Early Intervention Services for At-Risk Youth,” Colorado Governor John Hickenlooper’s Office, April 19, 2016, www.colorado.gov
58 Jeffrey R. Solomon, “Lessons from The Jewish GDP,” The New York Jewish Week, February 4, 2015, www.jewishweek.timesofisrael.com
59 Mark Pearlman, “Some Federations Rebounding from The Great Recession,” The New York Jewish Week, January 6, 2016, www.jewishweek.timesofisrael.com
60 “Jewish Community Raises $84.3 Million for 2016 JUF Annual Campaign to Care for the Most Vulnerable,” JUF News, Jewish United Fund of Metropolitan Chicago, January 19, 2017, www.juf.org
61 “The Fellowship, JDC Announce Milestone $52M ‘Food and Medicine Lifeline’ for Poor, Elderly Jews in the FSU,” International Fellowship of Christians and Jews, September 26, 2016, www.ifcj.org
62 “Matching Grants Honoring Itzhak Perlman will Support Inclusion of People with Disabilities in Jewish Life,” The Genesis Prize, November 9, 2016, www.genesisprize.org
63 Drew Lindsey, Peter Olsen-Phillips, and Eden Stiffman, “Fidelity Charitable Pushes United Way Out of Top Place in Ranking of the 400 U.S. Charities That Raise the Most,” The Chronicle of Philanthropy, October 27, 2016, www.philanthropy.com
64 Peter Olsen-Phillips, “How the 2016 Philanthropy 400 Was Compiled,” The Chronicle of Philanthropy, October 27, 2016, www.philanthropy.com
65 Same as note 63, para. 5.66 Same as note 63, para. 2.67 Alex Daniels and Drew Lindsay, “Donor-Advised Funds

288 | Giving USA FoundationTM | Giving USA 2017
Giving USA Giving to Public-Society Benefit
Reshape the Philanthropy Landscape,” The Chronicle of Philanthropy, October 27, 2016, www.philanthropy.com
68 Same as note 63.69 Ron Lieber, “United Way Searches for Its Place in a World
of One-Click Giving,” The New York Times, December 23, 2016, www.nytimes.com
70 Same as note 69.71 Contingency Funding in Philanthropy: Open Road
Alliance Survey, Open Road Alliance, 2016, http://openroadalliance.org/wp-content/uploads/2017/01/ORA-2015-Risk-in-Philanthropy-Survey.pdf
72 Same as note 71, pg. 4.73 Same as note 71.74 Same as note 71.75 “Omidyar Network Renews Investment in DataKind to
Increase Social Impact through Data Science,” Omidyar Network, October 13, 2016, www.omidyar.com
76 “About Us,” DataKind, Accessed April 2017, www.datakind.org/about
77 “Five Major Foundations Announce Groundbreaking Plans to Develop Public Interest Technologists,” Knight Foundation, February 16, 2016, www.knightfoundation.org
78 Same as note 64.79 The Chronicle of Philanthropy does not use the NTEE
coding system for categorizing nonprofit organizations as does Giving USA; therefore, listings here for the Chronicle may vary from how Giving USA categorizes organizations. “The 2016 Philanthropy 400,” The Chronicle of Philanthropy, October 27, 2016, www.philanthropy.com
80 “The 2016 Philanthropy 400,” The Chronicle of Philanthropy, October 27, 2016, www.philanthropy.com
81 Information received from Paul Arnsberger, Internal Revenue Service, April 2017, www.irs.gov
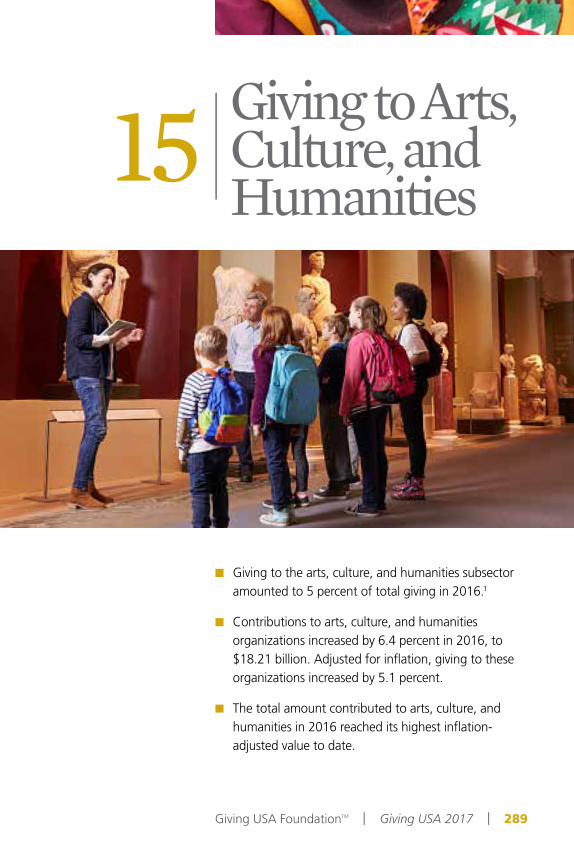
15 | Giving to Arts, Culture, andHumanities
Giving USA FoundationTM | Giving USA 2017 | 289
Giving to the arts, culture, and humanities subsector amounted to 5 percent of total giving in 2016.1
Contributions to arts, culture, and humanities organizations increased by 6.4 percent in 2016, to $18.21 billion. Adjusted for inflation, giving to these organizations increased by 5.1 percent.
The total amount contributed to arts, culture, and humanities in 2016 reached its highest inflation-adjusted value to date.

The information provided in this chapter derives from a number
of sources, including publicly available reports, news stories, and websites from the most recent year. This chapter is meant to provide context for the giving trends reported in this edition of Giving USA and to illustrate some of the practical implications of the data. It is not intended to be a comprehensive survey of the subsector, but rather a collection of examples from the field.
Trends in giving to arts, culture, and humanities organizations in 2016
In 2016, giving to arts, culture, and humanities organizations grew for the fifth consecutive year at an average rate of 7.4 percent per year.5 Giving to this subsector was above the five-year (2012 to 2016) average growth rate of 5.6 percent in total giving. Compared with the other charitable subsectors, giving to arts, culture, and humanities realized the second-highest average increase, behind giving to international affairs, in terms of five-year growth.
290 | Giving USA FoundationTM | Giving USA 2017
Giving USA Giving to Arts, Culture, and Humanities
Practitioner Highlights Despite a competitive giving climate, multi-million-dollar capital
campaigns for arts organizations, particularly museums, are meeting or exceeding their goals. In 2016, three museums announced the successful completion of capital campaigns, and five additional museums announced new $60–$80 million campaigns.2
Arts, culture, and humanities organizations have employed a variety of innovative tactics to engage donors and increase the contributed revenue that supports their missions.3
This sector continues to work on sustaining the balance between engaging new donors and increasing donor retention. For instance, public radio stations, even with strong support from sustainers, must seek out new donors. 4

Several reports issued in 2017 note generally positive trends in giving to arts, culture, and humanities organizations in 2016. The results of these reports are provided throughout the rest of this opening narrative and chapter. Different methodological and sampling approaches account for the differences seen between these sources and Giving USA data. Some highlights from 2016 on giving to this subsector include:
The majority of arts organizations realized sustained fundraising results in 2016.6 For all types of arts organizations, 61 percent responding to the Nonprofit Research Collaborative’s (NRC) Winter 2017 Nonprofit Fundraising Survey reported an increase in charitable contributions received between 2015 and 2016, the same as the previous year.
In spring 2017, Blackbaud reported that, among its sample of over 6,800 nonprofits, giving to arts organizations rose 3 percent in 2016 over 2015.7 Arts organizations realized the greatest year-over-year monthly increases in overall charitable revenue in the three-month period ending in June (10.3 percent), while giving declined in the three-month period ending in December (-3.2 percent).8
To provide additional context for giving to arts, culture, and humanities, the following sections provide detail on recent trends, related campaigns, and news for this subsector.
Online giving to arts and culture was mixed in 2016
Three reports noted somewhat mixed results for giving to arts organizations in 2016 via online methods. While different methodological and sampling approaches account for the differences seen between these sources and Giving USA data, these sources highlight trends seen by specific types of arts organizations.
Online giving to sampled arts and culture organizations was even brighter than overall giving to this subsector in 2016, according to Blackbaud. Arts and culture organizations experienced a 12.8 percent increase in online charitable revenue compared with 2015, the second highest jump out of all subsectors surveyed.9
According to Blackbaud’s Luminate Online Benchmark Report 2016, arts and culture organizations realized a median
Giving USA Giving to Arts, Culture, and Humanities
Giving USA FoundationTM | Giving USA 2017 | 291
_______________________________________
Compared with the other charitable subsectors, giving to arts, culture, and humanities realized the second-highest average increase, behind giving to international affairs, in terms of five-year growth.
_______________________________________

online transaction revenue of $9.15 for every constituent with a usable email in fiscal year 2016, a decline of 2 percent over 2015.10 Public broadcasting stations, however, remained at the same level—$13.78—in 2016, as compared to 2015. Sampled arts and culture organizations reported a median 36.2 percent of total online fundraising from first-time online transactions, an 11 percent decline from the previous year. Public broadcasting stations declined by 7 percent, in comparison, to reach a median 30.3 percent in 2016.
Across the sector, however, repeat online revenue as a percent of total online fundraising increased in 2016 compared to 2015.11 Arts and culture organizations reported this figure at 63.9 percent, an 8 percent increase over the previous year. Public broadcasting stations reported 71.1 percent, a 3 percent increase. Rates of sustainer revenue as a percentage of total online fundraising varied across the sector,
with arts and culture organizations reporting this figure at 7.2 percent, a 1 percent increase relative to 2015. Public broadcasting stations were stronger performers, reporting 36.2 percent, a 10 percent increase relative to 2015.
In a different study, the Benchmarks 2017 report by M+R and NTEN found strong results for online giving to a sample of cultural organizations.12 In 2016, these organizations experienced an overall increase in online revenue of 20 percent, far surpassing the 7 percent growth realized in the previous year. Among all sectors in 2016, cultural organizations realized the second-highest increase in revenue over the previous year, with only rights organizations experiencing stronger growth. Public media organizations saw a growth rate of 8 percent over 2015. According to the survey sample, monthly giving constituted almost one-third (31 percent) of public media organizations’ total online revenue.
292 | Giving USA FoundationTM | Giving USA 2017
Giving USA Giving to Arts, Culture, and Humanities
Good to KnowAs more donors turn to online platforms for their gift transactions, arts, culture, and humanities institutions can increase the likelihood that they will retain these donors by engaging them through multiple channels, not just digital.13 Mailings, onsite signage and engagement, and even phone contacts are still important to these donors, although they may still elect to use a digital platform when the time comes to make a contribution.

Capital campaigns for arts and culture institutions
In 2016, museums across the United States launched multi-million-dollar capital campaigns to remodel, expand facilities, and/or increase endowments. Many are using these capital campaigns to rebrand their institutions, such as
Capital campaigns closed by arts and culture institutions in other areas of the U.S. in 2016 included:
In June, the U.S. Holocaust Memorial Museum (Washington, DC) announced that it had exceeded its goal of $540 million in its ongoing capital campaign, raising a total of $556 million.21
the Institute of Contemporary Art, Los Angeles, previously known as the Santa Monica Museum of Art.14
Table 1 lists a selection of the various arts, culture, and humanities institutions that publicly launched capital campaigns in 2016, along with their campaign goals, announcement dates, and amounts raised prior to the public announcements.
In October, the Cleveland Museum of Art announced that it had reached its goal of $320 million at its centennial event.22 The capital campaign financed a total renovation of the building, completed in 2013. Over the course of this 15-year campaign, individuals donated 61 percent of
Giving USA Giving to Arts, Culture, and Humanities
Giving USA FoundationTM | Giving USA 2017 | 293
Table 1Multi-million-dollar arts, culture, and humanities capital campaigns launched in 2016
Museum Campaign goal Date of public announcement
Amount raised prior to public announcement
The New Museum (New York, NY)15 $80.0 million May 2016 $43.0 million
Museum of Contemporary Art San Diego16 $75.0 million October 2016 $56.7 million
Dallas Holocaust Museum17 $61.0 million October 2016 $43.0 million
Chicago Shakespeare Theater18 $55.0 million March 2016 $40.4 million
The Bronx Museum of the Arts19 $25.0 million May 2016 $7.0 million
Institute of Contemporary Art, Los Angeles20 $5.0 million May 2016 $1.9 million

the total, with museum trustees contributing $122 million.
In March, the Tobin Center for the Performing Arts (San Antonio, TX) announced that it had completed its eight-year capital campaign.23 Contributions to the campaign totaled $58 million. The Center credits a $5 million contribution from the Will Smith Foundation to christen the Will Naylor Smith Plaza for helping the campaign exceed its goal by $4 million.24
New Smithsonian museum opens in Washington, DC
The newest addition to the Smithsonian Institution, the National Museum of African American History and Culture (NMAAHC), opened to the public
in September 2016, 13 years after federal authorization for the museum’s construction.25 The new institution has collected almost 40,000 objects and artifacts related to African American history and culture, many of them donated by the American public through traveling donation drives that connected historical experts to potential donors. The museum’s effort to collect objects from the public successfully secured such artifacts as: Harriet Tubman’s hymnal, donated by Charles L. Blockson; Nat Turner’s bible, donated by Mark Person; and Muhammad Ali’s boxing gear.26
Private individuals have contributed $245 million to the museum’s $540 million capital campaign.27 Almost three-quarters (74 percent) of donors giving $1 million or more are African American. Additionally, African American social
294 | Giving USA FoundationTM | Giving USA 2017
Giving USA Giving to Arts, Culture, and Humanities

institutions, such as congregations and black sororities and fraternities, represent over one-quarter (28 percent) of institutional support.
In August, NMAAHC announced a $5 million gift from retired NBA star and businessman Michael Jordan.28 In addition to the cash donation, Jordan also donated one of his jerseys from the 1996 NBA Finals to be displayed with memorabilia from other top African American athletes. In recognition of the donation, the “Game Changer” section of the museum’s sports gallery will be renamed Michael Jordan Hall. Other large gifts include:
$20 million from billionaire investor Robert F. Smith, awarded in September. The only individual making a larger gift to the museum was Oprah Winfrey ($21 million).29 Smith is a longtime patron of organizations focused on African American life and culture. In recognition of his gift, the Explore Your Family History Center will be renamed the Robert F. Smith Explore Your Family History Center.
$2.5 million donation from NBA star LeBron James’ LeBron James Family Foundation and Maverick Carter, James’ business partner, was awarded in November.30 The gift will benefit the Muhammad Ali exhibit, which explores the boxer’s career, social activism, and humanitarian endeavors.
Initiatives to support local and community art in 2016
Local and community place-based art projects are emerging as an important method of community development.31 Promoting community and public art impacts many aspects of local development, including the reinforcement of the region’s cultural identity, promotion of tourism and economic growth, and boosts neighborhoods as attractive residential and commercial destinations. Successful place-based art initiatives frequently rely on multi-sector partnerships and community buy-in, underscoring the collaborative nature of many new art projects.32
The following sections highlight trends and new initiatives in 2016 to bring arts and community-building closer together.
ArtPlace America provides public-private support to local artsArtPlace America (ArtPlace) is a collaboration between private foundations, federal agencies, and financial institutions to provide local arts organizations with grant funding to encourage arts-centered community planning and development efforts.33 ArtPlace seeks to fund collaborative projects that combine public arts with sectors like agriculture, housing, and workforce development. In 2016, ArtPlace announced that it would grant
Giving USA Giving to Arts, Culture, and Humanities
Giving USA FoundationTM | Giving USA 2017 | 295
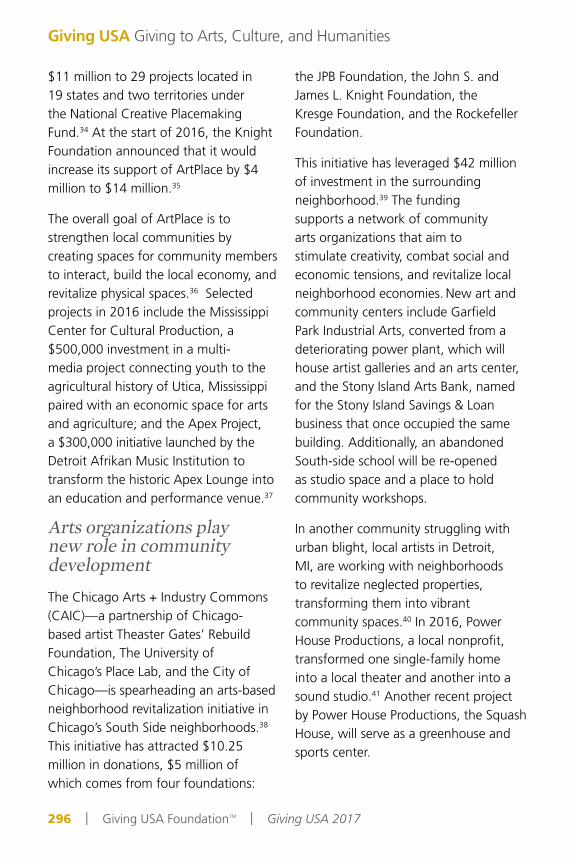
$11 million to 29 projects located in 19 states and two territories under the National Creative Placemaking Fund.34 At the start of 2016, the Knight Foundation announced that it would increase its support of ArtPlace by $4 million to $14 million.35
The overall goal of ArtPlace is to strengthen local communities by creating spaces for community members to interact, build the local economy, and revitalize physical spaces.36 Selected projects in 2016 include the Mississippi Center for Cultural Production, a $500,000 investment in a multi-media project connecting youth to the agricultural history of Utica, Mississippi paired with an economic space for arts and agriculture; and the Apex Project, a $300,000 initiative launched by the Detroit Afrikan Music Institution to transform the historic Apex Lounge into an education and performance venue.37
Arts organizations play new role in community developmentThe Chicago Arts + Industry Commons (CAIC)—a partnership of Chicago-based artist Theaster Gates’ Rebuild Foundation, The University of Chicago’s Place Lab, and the City of Chicago—is spearheading an arts-based neighborhood revitalization initiative in Chicago’s South Side neighborhoods.38 This initiative has attracted $10.25 million in donations, $5 million of which comes from four foundations:
the JPB Foundation, the John S. and James L. Knight Foundation, the Kresge Foundation, and the Rockefeller Foundation.
This initiative has leveraged $42 million of investment in the surrounding neighborhood.39 The funding supports a network of community arts organizations that aim to stimulate creativity, combat social and economic tensions, and revitalize local neighborhood economies. New art and community centers include Garfield Park Industrial Arts, converted from a deteriorating power plant, which will house artist galleries and an arts center, and the Stony Island Arts Bank, named for the Stony Island Savings & Loan business that once occupied the same building. Additionally, an abandoned South-side school will be re-opened as studio space and a place to hold community workshops.
In another community struggling with urban blight, local artists in Detroit, MI, are working with neighborhoods to revitalize neglected properties, transforming them into vibrant community spaces.40 In 2016, Power House Productions, a local nonprofit, transformed one single-family home into a local theater and another into a sound studio.41 Another recent project by Power House Productions, the Squash House, will serve as a greenhouse and sports center.
296 | Giving USA FoundationTM | Giving USA 2017
Giving USA Giving to Arts, Culture, and Humanities

New collaboration addresses rural arts and culture placemaking In February 2016, Art of the Rural (AOTR) and the Rural Policy Research Institute (RUPRI) launched the website “Next Generation: The Future of Arts & Culture Placemaking in Rural America.”42 A collaborative digital platform, the Next Generation initiative seeks to link private and public sector actors to promote rural creative placemaking in underserved areas of the United States.43 Creative placemaking, according to the National Endowment for the Arts (NEA), is a collaboration between multiple public and private community stakeholders to “strategically shape the physical and social character of a [community] around arts and cultural activities.”44
Backed by the University of Iowa and the NEA, Next Generation offers a digital learning commons, an annual summit to promote cross-sector collaboration, and support to regional networks of placemaking.45
Even as sustainer donations remain strong, public radio stations must continue to seek new donors
A Target Analytics study of 32 public radio stations nationwide, representing over 1 million donors and $185 million in donations, reports that just over half (52 percent) of all new donors immediately signed up for sustained giving programs, a considerable increase from 31 percent in 2011.46 Carissa Ciuca, director of individual giving at local radio station WXPN (Philadelphia, PA), shared three strategies they’ve used to increase their share of sustainers from 15 percent in 2012 to 71 percent in 2016: a marketing campaign that communicates the station’s unique identity, transparent goal-setting, and partnering with listeners to widen the station’s audience.47
These sustainers are integral to a public radio station’s bottom line. The 2016 Member Motivation Survey, conducted by fundraising firm Carl Bloom Associates, found that 86 percent of participants in sustaining giving programs planned on supporting public radio stations indefinitely, and were more likely to make major gifts or planned gifts.48 The survey was conducted among members of 17 public radio stations in spring 2016.
Giving USA Giving to Arts, Culture, and Humanities
Giving USA FoundationTM | Giving USA 2017 | 297

Regardless of this success, public radio stations must continually seek out new donors.49 Target Analytics estimates that a donor pool made up of almost entirely sustainers would lose about 30 percent of donors annually. In addition, the number of new donors added annually by surveyed stations has fallen every year since the study was initiated in 2011.
The National Endowment for the Arts: 50 years of grantmaking
The National Endowment for the Arts (NEA), the principal public grantmaker for the arts in the United States, celebrated its 50th anniversary in 2016 with public events and activities throughout the year.50 According to the latest publicly available data, projects in non-metropolitan areas accounted for 13 percent of NEA grants and metropolitan areas accounted for 87 percent of grants, with major metropolitan areas of over 4.6 million people making up 40 percent of NEA grants.51 Through May 2016, the NEA announced thousands of grants to local and regional arts and culture organizations, amounting to almost $110 million.52
The first round of fiscal year 2016 funding granted $27.7 million, directing $26.4 million to 996 grants in the Art Works program, the
NEA’s major funding category.53 The remaining $1.3 million was directed to the Challenge America program, which seeks to provide underserved communities greater access to the arts.
The second round of funding granted $82.36 million, directing $26 million to 1,002 grants in the Art Works program.54 State and regional partnership agreements across the United States and its territories attracted 63 grants, totaling $50 million. In addition, $4.3 million in 64 awards was disbursed as part of the “Our Town” category, an initiative that seeks to support creative placemaking in local communities so as to enhance the overall livability of the selected neighborhoods. Finally, Arts Midwest received the remainder of the grant dollars to facilitate the NEA’s Shakespeare in American Communities program.
Innovations in fundraising and marketing for arts organizations
As museums and arts organizations in the United States continue to evolve their missions and explore new ways to interface with the public, fundraising and marketing serve as platforms to test new innovations in philanthropy.
298 | Giving USA FoundationTM | Giving USA 2017
Giving USA Giving to Arts, Culture, and Humanities

The following sections detail new methods that arts, culture, and humanities organizations employed in 2016 to deepen their connections with donors and the greater community.
San Francisco museum revamps black tie galaIn April 2016, the Exploratorium, a “science, art, and human perception” museum in San Francisco, CA, transformed its annual fundraising gala.55 Transitioning from the traditional black-tie format, the museum reduced the event’s speaking agenda in favor of providing active entertainment and the chance to interact with museum learning exhibits. Over 500 guests attended, raising $1.6 million with an event budget of $400,000. A 15-minute pledge drive, in which attendees made their gifts on a tablet provided at every table, raised an additional $272,000. During the drive, gift amounts, without names, appeared in real-time on large screens. This drive will allow the Exploratorium to hire 43 neighborhood high school students as docents.
Art Institute of Chicago utilizes big data to maximize visitorsIn recent years, the Art Institute of Chicago (the Institute) has developed its internal data analytics program into a tool for fundraising.56 Utilizing the location data of visitor cell phones accessing Wi-Fi, the museum
can track and determine the art consumption patterns of patrons and adjust marketing to drive foot traffic. Asking ticket purchasers to provide their ZIP Code has also provided a glimpse into regional attendance. After employees noticed an increase in local visitors following the announcement of the Institute’s new TripAdvisor designation as the “number 1 museum in the world,” geographically targeted marketing earned the Institute $1.8 million more than expected in attendance revenue in 2015.
Smithsonian gallery encourages guests to use social media, improving visitor experience and promotional reach
The Renwick Gallery of the Smithsonian American Art Museum (Washington, DC) reopened in 2015 following a two-year, $30 million renovation.57 In 2016, the gallery reported a significant uptick in visitors since its re-opening, increasing attendance almost 1,000 percent from 3,000 visitors per week to 30,000.
Gallery curator Nicholas Bell credits new “Photography Encouraged” signs, combined with colorful, structural pieces inviting visitor engagement, for this rise in attendance.58 Guests have tagged the museum almost 40,000 times on Instagram with hashtags like #renwickgallery captioning colorful pictures of themselves and the installations. The Renwick Gallery’s
Giving USA Giving to Arts, Culture, and Humanities
Giving USA FoundationTM | Giving USA 2017 | 299
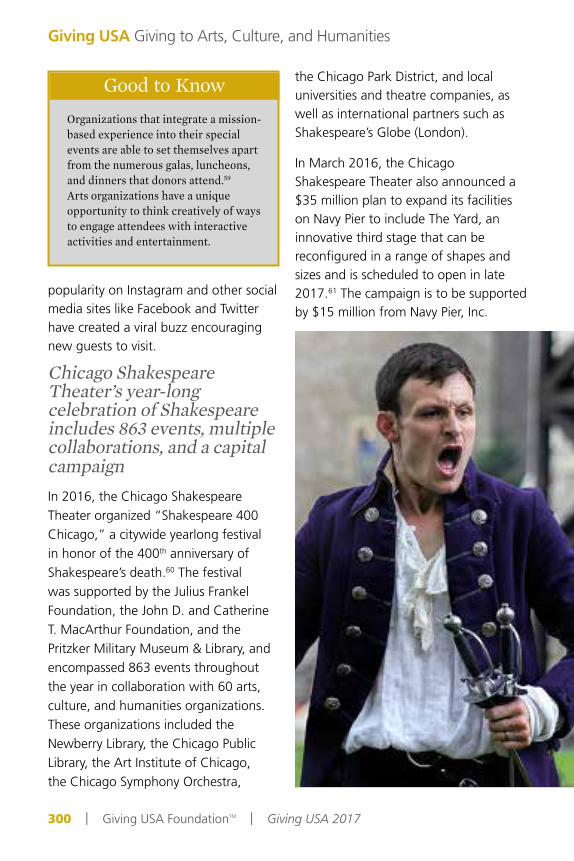
popularity on Instagram and other social media sites like Facebook and Twitter have created a viral buzz encouraging new guests to visit.
Chicago Shakespeare Theater’s year-long celebration of Shakespeare includes 863 events, multiple collaborations, and a capital campaignIn 2016, the Chicago Shakespeare Theater organized “Shakespeare 400 Chicago,” a citywide yearlong festival in honor of the 400th anniversary of Shakespeare’s death.60 The festival was supported by the Julius Frankel Foundation, the John D. and Catherine T. MacArthur Foundation, and the Pritzker Military Museum & Library, and encompassed 863 events throughout the year in collaboration with 60 arts, culture, and humanities organizations. These organizations included the Newberry Library, the Chicago Public Library, the Art Institute of Chicago, the Chicago Symphony Orchestra,
the Chicago Park District, and local universities and theatre companies, as well as international partners such as Shakespeare’s Globe (London).
In March 2016, the Chicago Shakespeare Theater also announced a $35 million plan to expand its facilities on Navy Pier to include The Yard, an innovative third stage that can be reconfigured in a range of shapes and sizes and is scheduled to open in late 2017.61 The campaign is to be supported by $15 million from Navy Pier, Inc.
300 | Giving USA FoundationTM | Giving USA 2017
Giving USA Giving to Arts, Culture, and Humanities
Good to KnowOrganizations that integrate a mission-based experience into their special events are able to set themselves apart from the numerous galas, luncheons, and dinners that donors attend.59 Arts organizations have a unique opportunity to think creatively of ways to engage attendees with interactive activities and entertainment.

Museums and libraries slip in rankings on the Philanthropy 400, while arts and culture and public broadcasting gain ground
The Chronicle of Philanthropy annually compiles a list of the top 400 public charities and private foundations.62 The Philanthropy 400 ranks charities according to the level of private donations received in the previous fiscal year. Private donations include gifts from all private sources—individuals, corporations, and foundations. Gifts of cash, shares of stock, in-kind donations, real estate, and valuables are included. To determine the rankings, the Chronicle compiles information from IRS Forms 990, annual reports, financial statements, and a questionnaire.
Philanthropy 400 data issued in 2016 for giving in the fiscal year ending in 2015 include four charities classified as arts and culture organizations (compared with three reported in the prior year), nine museums and libraries (compared with 12 reported in the prior year), and five public broadcasting organizations (compared with four reported in the prior year).63 The top five arts organizations on the list with the greatest amount in private support are:
Ranking 105th: The Metropolitan Museum of Art, New York, NY, with $242.95 million in private contributions, a decline of 14.2 percent from the previous year;
Ranking 122nd: Public Broadcasting Service, Arlington, VA, with $206.08 million in private contributions, a decline of 17.2 percent;
Ranking 123rd: The Smithsonian Institution, Washington, DC, with $202.87 million in private contributions, an increase of 4.9 percent;
Ranking 151st: Metropolitan Opera Association, New York, NY, with $177.22 million in private contributions, an increase of 37.6 percent; and
Ranking 162nd: American Museum of Natural History, New York, NY, with $171.17 million in private donations, an increase of 91.1 percent.
One arts organization, the Park Avenue Armory (the Armory) appeared on the Philanthropy 400 list for the first time in 2016, ranking 376th with $71.26 million in private contributions.64 Located in New York, NY, the Armory, housed in a former 19th century National Guard military facility and social club, provides youth arts education as well as visual and performing arts spaces.65
Giving USA Giving to Arts, Culture, and Humanities
Giving USA FoundationTM | Giving USA 2017 | 301

NCAR data show positive overall fundraising trends for arts organizations, but with large variations by organization type
The National Center for Arts Research (NCAR) released an update in 2016 to their multi-year data analysis and aggregation of fundraising performance in the arts and culture sector.66 This updated report analyzes 2014 data from over 4,200 organizations, with a subset of over 2,700 arts organizations reporting for the years 2011–2014. NCAR analysis includes two indices: the Return on Fundraising Index, which details total contributed revenue divided by total fundraising expenses,
including personnel; and the Unrestricted Contributions Index, which measures what share of unrestricted contributed revenue covers cash expenses.
In 2014, the Unrestricted Contributions Index was 56.9 percent, meaning that the average arts and culture organization paid a little over half of its cash expenses with unrestricted contributed revenue.67 This share was the highest at community arts organizations (71 percent) and the lowest at general performing arts organizations (41 percent).
The Return on Fundraising Index reveals that, following the 2012 contraction of the U.S. economy, arts organizations had generally rebounded or experienced only slight reductions in their fundraising returns in 2014, with the exception of the general performing arts.68 On average, arts and culture organizations realized a $9.42 gain for every fundraising dollar spent. This ratio has climbed steadily upward from the $7.55 average in 2012. Art museums realized the highest return on investment, at $13.39, while general performing arts realized the lowest at $6.39.
Despite positive overall performance, individual subsectors as defined by NCAR realized mixed fundraising returns in 2014 as compared to 2011.69 Out of 11 arts and culture subsectors, five saw declines in their average Return on Fundraising index. Table 2 compares Return on Fundraising Index trends per subsector in 2011 and 2014.
302 | Giving USA FoundationTM | Giving USA 2017
Giving USA Giving to Arts, Culture, and Humanities

According to NCAR’s analysis, the return on fundraising investment is tied almost inversely to size.70 Overall, small organizations realized the largest return on fundraising investment at $13.88 in 2014, compared to medium ($8.79) and large ($9.45) organizations.71 And, while small, medium, and large organizations have all realized increases in fundraising investment return, the growth in returns at small organizations from 2011 (17 percent) outpaces that of medium (11.8 percent) or large (10.4 percent) organizations.
Geography is also linked to the success of arts organizations in generating return on fundraising: San Francisco-based arts organizations realized the lowest per-dollar return on investment at $5.75.72 Of all the surveyed individual markets, Los Angeles, due in part to lower fundraising expenses and higher contributed revenues, realized the highest per-dollar return on investment at $13.00.
Giving USA Giving to Arts, Culture, and Humanities
Giving USA FoundationTM | Giving USA 2017 | 303
NCAR subsector 2011 2014Percent change,
2011–2014
Arts education $8.79 $7.98 -9.2%
Art museums $11.01 $13.39 21.6%
Community arts organizations $9.77 $10.71 9.6%
Dance $6.98 $7.93 13.6%
Music $7.50 $8.42 12.3%
Opera $9.08 $8.56 -5.7%
Performing arts centers $9.81 $9.20 -6.2%
Symphony orchestras $6.72 $10.33 53.7%
Theatre $6.94 $7.69 10.8%
Other museums $7.53 $7.17 -4.8%
General performing arts $7.23 $6.39 -11.6%
Data: “Return on Fundraising Index,” Southern Methodist University, National Center for Arts Research, accessed April 2017, http://mcs.smu.edu/artsresearch2014/reports/what-fundraising-return-investment#/averages/arts-sector. All 2014 data points are revised from former NCAR estimates.
Table 2 NCAR Return on Fundraising Index trend, per subsector (total contributed revenue/total expenses, including staff costs)

Orchestra Facts: 2006–2014 reveals promising stability of individual support for orchestras
In 2016, the League of American Orchestras (the League) released Orchestra Facts: 2006–2014, the first publication in a regular series examining orchestra finances and operations within the United States.73 The longitudinal study series draws from National Center of Arts Research (NCAR) and DataArts (formerly Cultural Data Project) datasets, surveys of member orchestras, and the League’s annual Orchestra Statistical Report. Orchestra Facts is modeled on
Theatre Communications Group’s Theatre Facts, a similar annual report on the state of the national nonprofit theatre field.
While audience attendance declined 10.5 percent from 2010 to 2014, contributed income remained stable.74 Contributed income totaled 43 percent of surveyed orchestras’ total income, and of that contributed income in 2014, individual donors provided 46 percent (trustees, 11 percent; non-trustee individuals, 35 percent). Non-trustee donors tended to give smaller amounts; about three-quarters of the donations from non-trustee donors were in amounts under $250.
Figure 1 provides a breakout of average contributed income sources to orchestras according to Orchestra Facts in 2014.75
304 | Giving USA FoundationTM | Giving USA 2017
Giving USA Giving to Arts, Culture, and Humanities
Figure 1
Average contributed income by source, 2014 (percentage of total contributed income)
Other
Government
Corporations
FoundationsTrustees
Individuals (non-trustees)
10%
7%
35%
23%
11%13%
Data: Orchestra Facts: 2006–2014, League of American Orchestras, November 2016, http://americanorchestras.org/knowledge-research-innovation/orchestra-facts-2006-2014.html. Contributed income data collected from the 2014 Orchestra Statistical Report, published by the League of American Orchestras.

Key data from annual studies summarized
Table 3 presents three years of data from several studies appearing annually about giving to arts, culture, and humanities organizations. Website addresses are provided so readers can access the full reports.
Giving USA Giving to Arts, Culture, and Humanities
Giving USA FoundationTM | Giving USA 2017 | 305
Theatre Communications GroupTheatre Facts: 2013–2015
www.tcg.org
2013 2014 2015
Total private contributions to trend theatres* $3.12 million $3.31 million $3.74 million
Average contributions to trend theatres from: Individuals Foundations Corporations Trustees
$919,428$608,153$248,949$412,129
$930,702$695,309$240,939$465,707
$1,014,650$771,838$250,724$667,893
Contributions as a percentage of total income to trend theatres** 42.0 percent 43.1 percent 46.5 percent
IRS Statistics of Income Bulletin76
Tax-exempt arts organizations: 2011–2013www.irs.gov
2011 2012 2013
Number of returns 27,107 27,064 28,275
Charitable revenue $17.39 billion $18.63 billion $19.76 billion
* Trend theatres are nonprofit theatres that have participated in Theatre Communications Group’s annual survey for at least five years. Private contributions in this table include those made by corporations, foundations, trustees, and individuals, as well as in-kind gifts, donations raised through fundraising events, and other types of contributions. There were 125 theatres included in the sample for the years 2013, 2014, and 2015; results updated in the most current year’s edition of the trend theatre dataset.
** Other contributions not included in this table are part of this calculation. These other sources include government support, fundraising events, United Arts funds, in-kind services and goods, and other contributions.
Table 3 Key findings from other studies about giving to arts, culture, and humanities organizations

References1 All data in this section are reported as estimates,
which are subject to revision. To provide the most accurate estimates for charitable giving, as new data become available, Giving USA revises its estimates for at least the last two years. See more about how Giving USA calculates charitable giving by sources and uses in the “Brief summary of methods used” section of this report.
2 Practitioner highlight authored by Editorial Review Board member Karen Rotko-Wynn.
3 Practitioner highlight authored by Editorial Review Board member Laura MacDonald.
4 Practitioner highlight authored by Editorial Review Board member Jenny Goldberg.
5 This information is in current dollars. 6 The Nonprofit Research Collaborative (NRC) annually
conducts surveys on fundraising trends across the nonprofit sector. In 2017, this collaboration included the Giving USA Foundation, the Association of Fundraising Professionals, CFRE International, the Association of Philanthropic Counsel, the National Association of Charitable Gift Planners, and Top Nonprofits. In early 2017, the NRC launched a survey to assess fundraising trends for the entire 2016 calendar year. The survey asked nonprofit leaders of public charities and foundations to report on changes in charitable revenue received and changes in the number of donors by specific donor type, among other questions. Data in this section come from the Winter 2017 Nonprofit Fundraising Survey report from the Nonprofit Research Collaborative, May 2017, www.npresearch.org. A convenience sample of 1,019 respondents, 144 of them Canadian, constitutes the survey results.
7 This information was provided to Giving USA directly from Blackbaud in May 2017. The Blackbaud Index of Charitable Giving assesses changes in total charitable giving from year to year using a three-month rolling median of the charitable revenue reported by a selected sample of U.S. nonprofits. This information reflects data on total charitable giving reported by 6,857 organizations across the nonprofit sector, representing total charitable revenue of $23.6 billion in 2016. Online giving data are reported by 4,958
nonprofits with charitable support amounting to $2.7 billion in 2016. Month-by-month Blackbaud Index data on both online and total giving are available at www.blackbaud.com/nonprofit-resources/blackbaud-index. Note that Blackbaud data are constantly being updated; therefore, figures published in Giving USA may vary from current figures.
8 Year-over-year monthly giving data are from the Blackbaud Index, May 2017, https://www.blackbaud.com/nonprofit-resources/blackbaud-index
9 Same as note 7.10 Luminate Online Benchmark Report 2016, Blackbaud,
2017, www.blackbaud.com. Data from this report cover the fiscal year July 1, 2015 to June 30, 2016 for a sample of 631 nonprofit organizations that use Luminate Online cloud-based software by Blackbaud.
11 Same as note 10.12 Benchmarks 2017, M+R and NTEN, 2017, www.e-
benchmarksstudy.com. Note that this study uses a convenience sample of 133 organizations with online revenue totaling over $535 million and that the organizations types reported in this study do not necessarily match those used in Giving USA.
13 Good to Know section authored by Editorial Review Board member Laura MacDonald.
14 Deborah Vankin, “Santa Monica Museum of Art Changes its Name and Selects New Location in Downtown L.A.,” Los Angeles Times, May 6, 2016, www.latimes.com
15 Randy Kennedy, “New Museum Plans Expansion After Raising $43 Million,” The New York Times, May 10, 2016, www.nytimes.com
16 Same as note 14.17 “Building a Foundation of Hope,” Dallas
Holocaust Museum, October 27, 2016, www.dallasholocaustmuseum.org
18 Hedy Weiss and Fran Spielman, “Shakespeare Theater announces $35 million expansion on Navy Pier,” Chicago Sun Times, March 2, 2016, www.chicago.suntimes.com; “Our City, Our Shakespeare,” Chicago Shakespeare Theater, retrieved May 2017, www.chicagoshakes.com/about_us/building/ocos
19 “Bronx Museum of the Arts Plans to Expand and
306 | Giving USA FoundationTM | Giving USA 2017
Giving USA Giving to Arts, Culture, and Humanities
Chapter authored by Ian Ermatinger-Salas, M.A., Grantwriter at Pepperdine University (Malibu, CA), with contributions from staff at the Indiana University Lilly Family School of Philanthropy.
Good to Know sections and Practitioner Highlights written by Giving USA Editorial Review Board members Laura MacDonald, Karen Rotko-Wynn, and Jenny Goldberg.

Raise $25 Million,” The New York Times, May 25, 2016, www.nytimes.com
20 Same as note 14.21 Peggy McGlone, “$20 Million Gift Will Fund Update
to Holocaust Museum’s Permanent Exhibition,” The Washington Post, June 12, 2016, www.washingtonpost.com
22 “Cleveland Museum of Art Completes $320M Campaign, Which Paid for Big Expansion,” cleveland.com, October 23, 2016, www.cleveland.com
23 “Tobin Center Capital Campaign Surpasses Goal,” The Tobin Center for the Performing Arts, March 9, 2016, www.tobincenter.org
24 Same as note 23; “Will Naylor Smith River Walk Plaza,” Tobin Center for the Performing Arts, retrieved April 2017, www.tobincenter.org
25 “The National Museum of African American History and Culture,” The New York Times, September 15, 2016, www.nytimes.com
26 “The Collection,” National Museum of African American History & Culture, retrieved April 2017, www.nmaahc.si.edu/explore/collection
27 “How the African American Museum is Raising the Bar for Black Philanthropy,” The Washington Post, May 24, 2016, www.washingtonpost.com
28 “Michael Jordan Donates Record $5 Million Gift to New Smithsonian Museum,” Artnet News, August 9, 2016, www.news.artnet.com
29 “‘Who is this Robert Smith?’: A Quiet Billionaire Makes Some Noise with $20 Million Gift to the African American Museum,” The Washington Post, September 24, 2016, www.washingtonpost.com
30 “LeBron James Donates $2.5M to African American History Museum’s Muhammad Ali Exhibit,” NBC Washington, November 17, 2016, www.nbcwashington.com
31 Teresa Wiltz, “Can the Arts Help Save Rural America?” The Huffington Post, October 20, 2016, www.huffingtonpost.com
32 William Cleveland, “Arts-based Community Development: Mapping the Terrain,” Americans for the Arts, 2011, www.americansforthearts.org
33 “About ArtPlace,” ArtPlace America, retrieved April 2017, www.artplaceamerica.org/about
34 “Announcing the 2016 National Creative Placemaking Fund Projects,” ArtPlace America, December 6, 2016, www.artplaceamerica.org
35 Anne Tschida, “Putting the Arts at the Center of Community Development,” Knight Foundation, January 28. 2016, www.knightfoundation.org
36 Same as note 33.37 National Creative Placemaking Fund 2016
Funded Projects, ArtPlace America, 2016, www.artplaceamerica.org/view/pdf?f=/sites/default/files/public/pictures/20161208_artplace.pdf
38 Audrey Wachs, “Theaster Gates Project Gets $10 Million to Revitalize Chicago’s South Side,” The Architects Newspaper, September 9, 2016, www.archpaper.com
39 Christopher Maier, “Building Up Chicago’s South
Side Through Ambitious Art,” CityLab, September 9, 2016, www.citylab.com; Same as note 38.
40 Leyland DeVito, “How One Architect is Attempting to Reimagine Detroit’s Blight,” Hour Detroit, October 3, 2016, www.hourdetroit.com
41 Same as note 35.42 “Next Generation: the Future of Arts & Culture
Placemaking in Rural America,” Grantmakers in the Arts, February 24, 2016, www.giarts.org
43 “What is Next Generation?” Next Generation: The Future of Arts & Culture Placemaking in Rural America, retrieved April 2017, www.ruralgeneration.org
44 Jason Schupbach, “Defining Creative Placemaking,” National Endowment for the Arts, September 2012, www.arts.gov, para. 2; Ann Markusen and Anne Gadwa, Creative Placemaking, National Endowment for the Arts, 2010, https://www.arts.gov/sites/default/files/CreativePlacemaking-Paper.pdf, pg. 3
45 Same as note 42.46 April Simpson, “While Sustainers are Growing,
Experts Say Public Radio Still Needs New Donors,” Current, September 16, 2016, www.current.org
47 April Simpson, “Philadelphia’s WXPN Reaches Membership Milestone,” Current, August 25, 2016, www.current.org
48 Christina McPhillips, “Why Stations Should Look to Younger Sustainers for Bequests, Major Gifts,” Current, August 5, 2016, www.current.org
49 Same as note 48.50 “The White House Honors NEA 50th Anniversary
with Televised Music Special,” National Endowment for the Arts, January 5, 2016, www.arts.gov
51 “$82.3 Million in Grants Will Support Art Projects Nationwide,” National Endowment for the Arts, May 10, 2016, www.arts.gov
52 “$27 Million Awarded for Arts Projects,” National Endowment for the Arts, December 8, 2015, www.arts.gov; Same as note 51.
53 Same as note 52.54 Same as note 51.55 Peter Olsen-Phillips, “A Museum Reboots Its Gala,
Connects to Its Mission, and Raises $1 Million,” The Chronicle of Philanthropy, June 28, 2016, www.philanthropy.com; “About Us,” Exploratorium, retrieved May 2017, www.exploratorium.edu/about-us, para. 1
56 Rebecca Koenig, “Data Analysis Boosts Revenue at Art Institute of Chicago,” The Chronicle of Philanthropy, October 25, 2016, www.philanthropy.com
57 Megan O’Neil, “Instagram Fame Drives Up Museum’s Attendance Nearly 1000%,” The Chronicle of Philanthropy, March 2, 2016, www.philanthropy.com
58 Same as note 57.59 Good to Know authored by Editorial Review Board
member Karen Rotko-Wynn. 60 “About,” Shakespeare 400 Chicago, retrieved May
2017, www.shakespeare400chicago.com/about.html; “Here’s to an incredible year—thank you, Chicago!”
Giving USA Giving to Arts, Culture, and Humanities
Giving USA FoundationTM | Giving USA 2017 | 307
Shakespeare 400 Chicago, retrieved May 2017, www.shakespeare400chicago.com/events.html
61 Hedy Weiss and Fran Spielman, “Shakespeare Theater announces $35 million expansion on Navy Pier,” The Chicago Sun Times, March 2, 2016, www.chicago.suntimes.com
62 Peter Olsen-Phillips, “How the 2016 Philanthropy 400 Was Compiled,” The Chronicle of Philanthropy, October 27, 2016, www.philanthropy.com.
63 The Chronicle of Philanthropy does not use the NTEE coding system for categorizing nonprofit organizations as does Giving USA; therefore, listings here for the Chronicle may vary from how Giving USA categorizes organizations. Note that Giving USA categorizes gifts to libraries under the giving to education subsector. “The 2016 Philanthropy 400,” The Chronicle of Philanthropy, October 27, 2016, www.philanthropy.com
64 “The 2016 Philanthropy 400,” The Chronicle of Philanthropy, October 27, 2016, www.philanthropy.com
65 “About the Armory,” Park Avenue Armory, retrieved April 2017, www.armoryonpark.org/about_us
66 “The NCAR Report on Fundraising Trends in Arts and Culture,” Southern Methodist University, National Center for Arts Research, September 7, 2016, www.mcs.smu.edu
67 “Return on Fundraising Index,” Southern Methodist University, National Center for Arts Research, retrieved April 2017, http://mcs.smu.edu/artsresearch2014/reports/what-fundraising-return-investment#/averages/arts-sector. Note that NCAR utilizes NTEE classifications with regards to categorizing organizations in the arts and culture subsector. Giving USA similarly classifies subsectors according to NTEE codes.
68 Same as note 67.69 Same as note 67.70 Same as note 67.71 Note that NCAR classifies small, medium, and large
organizations in terms of budget; but this scale varies based on the organization’s subsector.
72 Same as note 67.73 Orchestra Facts: 2006–2014, League of
American Orchestras, November 2016, http://americanorchestras.org/knowledge-research-innovation/orchestra-facts-2006-2014.html
74 Same as note 73.75 Same as note 73.76 Information received from Paul Arnsberger, Internal
Revenue Service, April 2017, www.irs.gov
308 | Giving USA FoundationTM | Giving USA 2017
Giving USA Giving to Arts, Culture, and Humanities

16 | Giving toInternationalAffairs
Giving USA FoundationTM | Giving USA 2017 | 309
Contributions to the international affairs subsector comprised 6 percent of all donations received by charities in 2016.1
Giving to international affairs organizations increased 5.8 percent in 2016, totaling $22.03 billion. Adjusted for inflation, giving to international affairs increased 4.6 percent between 2016 and 2015.
The total for contributions to the international affairs subsector has not yet returned to its previous highest inflation-adjusted value, which was recorded in 2008 at $22.64 billion.

The information provided in this chapter derives from a
number of sources, including publicly available reports, news stories, and websites from the most recent year. This chapter is meant to provide context for the giving trends reported in this edition of Giving USA and to illustrate some of the practical implications of the data. It is not intended to be a comprehensive survey of the subsector, but rather a collection of examples from the field.
Trends in giving to international affairs in 2016
Giving to international affairs realized its sixth consecutive year of growth in 2016, at an average rate of 8.0 percent per year.5 In the last five-year period (2012 to 2016), giving to this subsector experienced an average annual rate of growth of 7.8 percent—making it the fastest-growing subsector out of nine. This rate of growth is compared with the five-year annual average change in total giving of 5.6 percent. Shifts in the overall giving distribution increased
310 | Giving USA FoundationTM | Giving USA 2017
Giving USA Giving to International Affairs
Practitioner Highlights Although online giving was a weak channel for giving to
international affairs organizations in 2016, monthly giving increased over the previous year, indicating that these organizations may be successfully retaining donors.2
The emerging trend towards non-traditional giving methods, such as crowdfunding, expands the avenues by which international affairs organizations can ask for and receive funds, allowing them to prioritize those methods that can have the greatest and most immediate impact.3
While international affairs nonprofits declined in representation on The Chronicle of Philanthropy’s Philanthropy 400 in 2016, private support to these organizations continues to increase, highlighting the importance of major giving programs and approaches.4

the proportion of charitable dollars to international organizations from 4 percent to 6 percent in 2016.
Several reports issued in 2017 also note growth in overall contributions to international affairs organizations in 2016, but with mixed results in online giving. The results of these reports are provided throughout the rest of this opening narrative and chapter. Different methodological and sampling approaches account for the differences seen between these sources and Giving USA data. Some highlights from 2016 on giving this subsector include:
In spring 2017, Blackbaud reported that among its sample of over 6,800 nonprofits, giving to international affairs realized an increase of 4.2 percent between 2016 and 2015.6 International affairs organizations realized the greatest year-over-year monthly increases in overall charitable revenue in the three-month periods ending in October (10.3 percent) and November (6.3 percent), recovering after dropping to their lowest points in February (-3.6 percent) and July (-8.2 percent).7
Online giving was weaker for the sample of Blackbaud international affairs organizations than was overall giving to these organizations, declining 0.4 percent in 2016.8 Year-over-year monthly changes in online giving to international affairs organizations peaked in the three-
month periods ending in January (11.1 percent) and November (11.4 percent), with negative growth realized in the middle of the year.9 Giving to these organizations reached a negative period of year-over-year change in the three-month period ending in May (-15.4 percent) and June (-13.0 percent).
According to Blackbaud’s Luminate Online Benchmark Report 2016, disaster and international relief organizations realized a 1 percent decline in total online revenue in fiscal year 2016 as compared with 2015.10 Despite this overall drop, disaster and international relief organizations saw increases in both repeat online transactions (6 percent) and sustainer (or monthly) online revenue (26 percent) as a percentage of total online giving.
Another study, the Benchmarks 2017 report by M+R and NTEN, also reported a strong decline for online giving to a sample of international organizations.11 In 2016, these organizations experienced an overall
Giving USA Giving to International Affairs
Giving USA FoundationTM | Giving USA 2017 | 311
________________________________________
In the last five-year period (2012 to 2016), giving to this subsector experienced an average annual rate of growth of 7.8 percent—making it the fastest-growing subsector out of nine.
________________________________________

drop in online revenue of 12 percent, as compared with a large increase of 45 percent in 2015 over 2014. The international subsector was the only sector that experienced a decline in online giving in 2016 over the previous year. Despite the overall drop in revenue, monthly giving revenue increased by 20 percent for these organizations in 2016 over the previous year. According to the report, online giving to international organizations is driven by high-profile global disasters, which may contribute to the volatility in revenue.
To provide additional context for giving to international affairs in 2016 and in recent years, the following sections provide detail on recent trends, related campaigns, and news for this subsector.
Humanitarian and disaster aid—trends and innovations in 2016
Giving to international affairs organizations encompasses giving toward humanitarian and disaster aid organizations within the United States. In 2016, global actors explored new ways of addressing the world’s most pressing concerns and complex humanitarian situations.
Inaugural World Humanitarian Summit emphasizes flexibility and local responseIn May 2016, the United Nations (UN) convoked the first ever World Humanitarian Summit in Istanbul, Turkey.12 Organized as a response to increased global humanitarian need, the Summit included both domestic and multilateral aid bodies and global non-governmental organizations (NGOs), such as Amnesty International, the American Red Cross, CARE International, and Catholic Relief Services.13 Leaders of the conference agreed to a set of commitments called “the Grand Bargain,” with regard to the humanitarian aid sector moving forward.14 Those commitments include:
Expand support and funding for local and national aid agencies;
312 | Giving USA FoundationTM | Giving USA 2017
Giving USA Giving to International Affairs

Increase the use of cash-based aid options;
Make the movement of funds more transparent;
Reduce donation earmarking in favor of more flexible spending options; and
Emphasize multi-year planning and funding for aid agencies.
Specifically, by 2020, signatories committed to direct at least 25 percent of aggregate humanitarian aid funding to local organizations.15 Currently, national and local aid organizations receive a small portion of funding directed to NGOS: 2.1 percent in 2015, and 0.8 percent in 2014, according to figures from the UN Office for the Coordination of Humanitarian Affairs (OCHA) Financial Tracking Service (FTS) via the Global Humanitarian Assistance Report 2016.16 Overall, international, national, and local NGOs accounted for approximately 19 percent of direct humanitarian funding in 2015, or nearly $4.2 billion.
Ahead of the summit, local NGOs and aid groups working in Africa, Asia, and the Middle East formed a collaborative network called the Network for Empowered Aid Response (NEAR).17 Intended to boost aid dollars to local charities and furnish international partnerships, NEAR also plans to create a collective pool of funds for distribution to approved members.18
Responding to a survey by Thompson Reuters Foundation, 25 international aid charities working to provide relief for the Syrian war and the Nepal earthquake expressed support for shifting resources to local aid groups, though noting some concern for the organizations’ ability to meet donor compliance standards.19 Approximately 90 percent of respondents who worked in Nepal following the April 2015 earthquake indicated that funding from bilateral and multilateral agencies should go to national-local organizations. Only slightly more than 50 percent of charities working in Syria agreed that aid resources should be directed toward similar organizations. However, the majority of all survey respondents endorsed directing at least 20 percent of their humanitarian funding to local aid groups.
Focus on new methods of aid distribution: cash transfers vs. in-kind Emerging in 2016 were new discussions around innovative and impactful forms of humanitarian aid delivery. Following the May 2016 World Humanitarian Summit in Istanbul, conference attendees pledged to increase cash-based programming and strengthen the current evaluation and tracking framework behind using cash as aid.20 Currently, 6 percent of humanitarian aid (from both government and private sources) is given in cash form.21
Giving USA Giving to International Affairs
Giving USA FoundationTM | Giving USA 2017 | 313

Cash has some advantages over other forms of aid. Recently, select international and domestic relief disaster organizations have highlighted the complications behind in-kind goods donated for disaster relief.22 Aid workers have described contributions of unneeded items, and donated goods spoiling because workers cannot sift through the items in time. The United Kingdom-based Overseas Development Institute (ODI) has concluded that cash transfers are cheaper to deliver than in-kind aid, which could serve as a solution to stretch aid budgets further.23
In recent years, new and innovative programs have demonstrated the potential of cash-based aid initiatives:
During the West African Ebola crisis, digital payments of cash through mobile phones or wallets was credited with streamlining aid delivery, reducing corruption, and eliminating redundancy of payments.24
In Jordan, biometric iris scans have enabled Syrian refugees to effectively access monthly cash assistance.25
Cash-for-work programs run by the International Rescue Committee (IRC) in Lebanon for both Lebanese natives and Syrian refugees have increased self-sufficiency and allowed refugees to participate in the local economy.26
2016 already reflected positive momentum for cash-based aid. The
United Nations High Commission on Refugees (UNHCR) reported disbursing the highest amount ever in cash-based transfers from their aid programs, directing approximately $430 million to displaced persons.27 And, as the May 2016 World Humanitarian Summit predicts, this trend will only grow. In 2015, the International Rescue Committee (IRC) released a plan detailing its new strategy to provide cash over in-kind donations, with a goal of increasing the proportion of cash-based aid from 6 percent to 25 percent by 2020.28
Disaster Philanthropy Playbook offers best practices for funder responses
In early 2016, the Center for Disaster Philanthropy (CDP) and the Council of New Jersey Grantmakers (CNJG) released the Disaster Philanthropy Playbook, a website compiling best practices and strategies in philanthropic responses to disasters.29 Targeted toward funders, donors, associations, nonprofits, and governments, the site is organized around grantmaking focus areas, and allows users to select and save resources in a customized Playbook.30
Syrian crisis comes to a head in 2016
The Syrian civil war entered its fifth year in 2016, and humanitarian need, specifically for refugees of the conflict, continued to capture headlines.31 In December 2016, forces loyal to the
314 | Giving USA FoundationTM | Giving USA 2017
Giving USA Giving to International Affairs

Syrian government besieged Aleppo, Syria’s largest city and long-time rebel stronghold.32 The battle resulted in several accusations of war crimes against civilians perpetuated by government forces, and approximately 16,000 civilians fled the city, according to the UN.33 As with the photo of a drowned Syrian toddler in 2015, the Aleppo siege stunned with pictures of shell-shocked children and families fleeing the violence.34 In addition, both government and rebel forces were accused of blocking aid convoys into the city, further contributing to deprivation within the war zone.35
According to the most updated statistics from the UNHCR, global forced displacement reached record highs in 2015, with an estimated 65.3 million individuals forcibly displaced.36 Refugees constituted 21.3 million of those individuals, and more than half of these refugees came from Syria, Afghanistan, and Somalia.
The Syrian refugee crisis remains underfunded, despite global attention and media coverage. The total humanitarian need for internally and externally displaced Syrians during 2016 amounted to $7.7 billion; at the end of 2016 only 55 percent had been funded, leaving a funding gap of nearly $3.47 billion.37
In light of these sobering findings, the following sections detail philanthropic responses and humanitarian aid to Syrian refugees and citizens still experiencing conflict within the country.
Technology continues to play a role in solutions for refugeesIn recent years, Internet connectivity and the free flow of information for displaced peoples has emerged as an important part of addressing humanitarian crises.38 In a world of increasing smartphone usage, many refugees use social media platforms
Giving USA Giving to International Affairs
Giving USA FoundationTM | Giving USA 2017 | 315

as communication tools and rely on the Internet to apply for asylum and to conduct interviews with embassies through Skype.
In response, aid agencies are attempting to leverage technology solutions to address refugee issues. For example, the ICRC created a digital platform called Trace the Face where refugees searching for family members can post their photos and re-establish contact with their loved ones.39 Additionally, starting in September 2015, the public-private partnership NetHope began to set up wireless Internet hotspots throughout the European refugee migration route.40 NetHope is an alliance of aid organizations and private companies, including Facebook and Cisco.
In recent years, virtual reality (VR) has emerged as a new and effective tool used by organizations to fundraise for various causes and to increase empathy among donors.41 The UN was the first to utilize the technology as a fundraising schema when they released the short film Clouds Over Sidra at the Third International Humanitarian Pledging Conference for Syria in Kuwait in March 2015. The film documents the life of Sidra, a 12-year-old Syrian girl, living in the Za’atari Refugee Camp in Jordan. The screening resulted in $3.8 billion in donations worldwide to humanitarian work in Syria, 70 percent higher than originally projected.42
Since this success, other organizations have partnered with various VR
production companies to create their own 360-degree videos to use in funding and awareness campaigns. In October 2016, IRC partnered with YouVisit and actress Rashida Jones to announced its first VR film titled Four Walls.43 Other organizations who launched VR campaigns to highlight the Syrian refugee crisis in 2016 include Doctors Without Borders, Amnesty International, and World Vision.44
Private funding support for Syria and the global refugee crisis The crisis in Syria is reflective of a global refugee situation affecting 21 million individuals worldwide.45 In June 2016, President Barack Obama called on the U.S. private sector to support aid organizations addressing the refugee crisis, as well as the Syrian crisis specifically.46 In response to his request, the U.S. Department of State and USA for UNHCR established the Partnership for Refugees network.47 Over 50 U.S. companies—including Airbnb, Citibank, Facebook, Goldman Sachs, and Google—pledged to raise and dedicate funds to addressing various aspects of the global refugee crisis. For example, refugee investment firm Alight Fund pledged to raise $100 million to be used for microloans to invest in 50,000 entrepreneurs, including both refugees and members of those communities hosting refugees.48
In an additional collaborative response, a U.S. coalition of 30 humanitarian
316 | Giving USA FoundationTM | Giving USA 2017
Giving USA Giving to International Affairs

organizations, called InterAction, pledged in September 2016 to invest $1.2 billion over the next three years to global humanitarian issues, including the situation in Syria.49 Other large non-government initiatives to address refugees and humanitarian emergencies in 2016 included:
Billionaire investor George Soros announced a $500 million plan to invest in social impact initiatives, businesses, and companies that aid displaced populations, as well as companies founded by refugees and migrants, through Open Society Foundations.50
The IRC received a $15 million grant to be paid over five years from the Stavros Niarchos Foundation to support emergency response and infrastructure, which includes its work in Syria.51
The Bill & Melinda Gates Foundation issued two grants to organizations providing support and relief for Syrians affected by the violence. World Vision received $550,000 to aid in their work in Syria, while the IRC received $450,000 to provide humanitarian assistance in Syria as well as Iraq.52
In addition, the IKEA Foundation announced two grants for the Syrian crisis totaling $10.6 million in March 2016.53 Grant recipients follow:
Doctors Without Borders received $6.4 million to support emergency medical services for families and children still living in Syria, as well as to those living as refugees in Iraq and Lebanon. The money will also be used to train new medical workers.
Save the Children received $4.2 million. Through this grant, Save the Children partnered with 17 local organizations to ensure access to education and healthcare for the 41,000 vulnerable children living in Syria.
Giving USA Giving to International Affairs
Giving USA FoundationTM | Giving USA 2017 | 317

First annual Humanitarian Index reveals perception issues about refugee crisisIn April 2016, the Aurora Prize for Awakening Humanity, a humanitarian prize established in remembrance of the Armenian genocide, released the first iteration of the Humanitarian Index, an annual report on the general public’s perceptions around global humanitarian issues.54 Over 4,000 online interviews were fielded by research firm Edelman Intelligence in six countries, including the U.S., in March and April 2016. According to the report, the perception issues identified by the survey contribute to the slow response to Syrian refugee issues and other refugee crises.
Findings indicate a knowledge gap regarding the existing Syrian refugee crisis, and perception issues about refugees in general.55 Surveyed populations dramatically underestimated the total number of displaced persons from the Syrian crisis, in some cases by more than 4 million. Surveyed populations also overestimated the number of refugees accepted in their home country.
Notably, the report identifies a “compassion gap” in surveyed populations.56 In the U.S., 69 percent of people surveyed felt that refugees deserved help, and 50 percent would help refugees if they could. However, less than 30 percent had donated either time, goods, or money in 2015 for
refugee relief. Many questioned their ability to make a difference in the face of the crisis.
However, 28 percent of American respondents indicated that they took action after hearing personal stories about victims and current refugees, signaling that storytelling may be an effective fundraising tool.58
Humanitarian aid to less-exposed needs
In 2016 and recent years, international global crises continued unabated, yet some did not garner substantial attention from
318 | Giving USA FoundationTM | Giving USA 2017
Giving USA Giving to International Affairs
Good to KnowThe “compassion gap” revealed by the Aurora Prize for Awakening Humanity’s Humanitarian Index exposes a significant opportunity for international affairs organizations.57 To learn from these results and enact steps to mitigate them, organizations must develop a communications and engagement plan that emphasizes the results of the organization’s vision and mission. Best practices include: Focus on approaches that align the
organization’s mission with a tangible impact on an individual basis;
Incorporate storytelling as an integral motivational tool in multi-channel solicitations; and
Use knowledge about the audience to remind prospective donors how their own stories are linked to and affected by those being told by the organization.
global and domestic media. In addition, these issues often do not receive sufficient aid resources from governments.59 The following sections highlight some of these under-exposed global conflicts and philanthropic responses.
Conflict and unrest in YemenDecember 2016 marked a year and a half of civil war in Yemen after an escalation of violence between newly elected president Abdrabbuh Mansour Hadi and the Houthi rebel movement forced Hadi to flee the capital of Sanaa.60 Since then, an international coalition has intervened in an attempt to end the conflict and restore governmental rule in Yemen. The civil war has resulted in air strikes and blockades, preventing access to humanitarian aid, medicine, and basic necessities.
Prior to the violence, Yemen already struggled with food security, poverty, and unemployment.61 The civil unrest has only intensified the needs of the poorest Middle Eastern country, and OCHA estimates that as of December 2016, 18.8 million out of a population of 27.4 million Yemeni are in need of humanitarian assistance, with 10.3 million in “acute need.”62
In 2016, OCHA published a humanitarian response plan requesting $1.63 billion to address immediate concerns in Yemen—as of October 2016, the UN body had received 47 percent of that total, or $762.4 million.63 International NGO Save the Children
set a funding goal of $42.3 million in 2016 toward the conflict, and as of September 2016, had received $30.2 million.64 Save the Children reports that since March 2015, they had distributed aid to 1 million Yemeni, more than half of whom were children.
Many individuals and NGOs working in Yemen, including the UN and organizations such as Amnesty International, believed this humanitarian crisis had been forgotten by the global community.65 Due to the conflict being overshadowed by larger humanitarian disasters such as the Syrian civil war, the Yemeni conflict has been dubbed “The Forgotten War.”66
Hurricane Matthew strikes Haiti in October 2016On October 4, 2016, Hurricane Matthew tore across the Caribbean island nation of Haiti, causing widespread flooding and devastation.67 The hurricane caused extensive displacement, a cholera outbreak, loss of property, and killed close to 1,000 people. In total, the Category 4 storm affected 2.1 million Haitians, 1.4 million of whom required humanitarian aid following the destruction.68
In October 2016, OCHA drafted a flash appeal requesting $119 million and then increased the request to $139 million in November to address the 750,000 Haitians in severe need of shelter and other essential supplies.69 By November,
Giving USA Giving to International Affairs
Giving USA FoundationTM | Giving USA 2017 | 319

only 26 percent ($36 million) of the appeal had been funded.70 As of March 2017, OCHA had received 64 percent ($88.6 million) of the appeal.
During a visit to Haiti in the days following the hurricane, the UN Secretary-General Ban Ki-moon and declared the humanitarian response insufficient and suggested that the cause could be donor fatigue.71 Nevertheless, several organizations and foundations did respond to the disaster, including:
$5 million pledged from Catholic Relief Services (CRS) to relief and restoration efforts;72
$2.8 million from the Bill & Melinda Gates Foundation in emergency grants to the International Medical Corps and CARE International;73
$2 million pledged from retailer Walmart and the Walmart Foundation of cash and in-kind donations;74 and
$1 million from the UPS Foundation in monetary and in-kind donations to all areas affected by Hurricane Matthew (including Haiti), which included logistical and mobilization support.75 In addition, UPS helped deliver 600,000 pounds of relief supplies, 300,000 high-energy biscuit packets from the World Food Programme, and 100 tons of antibiotics and water purification tablets to Haiti.76
Further, many organizations turned to crowdfunding methods to raise money for Haiti relief. On both CrowdRise and GoFundMe there were over 1,000 active campaigns raising funds for Hurricane Matthew relief efforts as of February 2017.77
United Airlines launched one such campaign, pledging to match the first $100,000 raised on CrowdRise.78 As of February 2017, the campaign helped raise $388,595. Proceeds went to relief organizations such as the American Red Cross and Operation USA.
Despite these efforts, in early 2017 global development NGO Oxfam warned that the disaster response in Haiti needed to be increased, as many Haitians are still without basic necessities and at risk of hunger and food insecurity due to an approximate 80 percent loss of crops.79 In November 2016, Oxfam released a $6 million fundraising goal in line with a six-to-12-month plan to support relief efforts in Haiti.80
Basic necessity shortages in Venezuela prompt individual actionIn 2014, a decline in the global oil market left Venezuela, the country with the richest oil reserves in the world, in a severe economic recession.81 In 2016, inflation rose from 180 to 800 percent, preventing the country from maintaining imports.82
As a result, Venezuelans are experiencing critical shortages of basic goods like food and medicines.83
320 | Giving USA FoundationTM | Giving USA 2017
Giving USA Giving to International Affairs

Malnutrition, infant mortality, and maternal mortality rates have risen, and hospitals have experienced an 85 percent decline in medical supplies, leaving many hospitals closed or struggling to function.84 Many NGOs are calling the situation in Venezuela a humanitarian crisis.85
Despite these circumstances, Venezuelan president Nicolas Madura has denied the need for humanitarian aid, and has stopped shipments of supplies from aid groups from entering the country.86 Any humanitarian groups within the country, such as Doctors Without Borders, have a limited ability to act.87
To fill the lack of official government and nonprofit aid, individual citizens have filled the gap by sending private supply packages to Venezuela. For example, individuals living in the U.S. have been
buying and shipping necessities like rice, beans, toothpaste, and aspirin to their relatives in Venezuela.88 The shipping company Goin’ Postal in Katy, TX began shipping 20 tons of supplies to Venezuela per week.89 Supply initiatives have also occurred in and around Miami and South Florida, where
courier companies like Vikrom report a 50 percent increase in shipments to Venezuela from last year.90
Pharmacies in Florida have been accepting prescriptions from Venezuela while some shipping services, like Terra Overseas, send those medicines free of charge.91 Additionally, many Venezuelan expatriates have created GoFundMe campaigns in an effort to raise money to send goods to Venezuela.92 One woman raised over $4,000 and was able to send eight boxes of medical kits to relatives in the country.93
Domestic opposition to President Maduro, as well as various national and international humanitarian groups and governments, continued to petition the Venezuelan government to open channels for official humanitarian aid at the close of 2016.94
Alternative financing for international causes
When the UN ratified the newly minted Sustainable Development Goals (SDGs) in 2015, these development targets came with large price tags. According to the United Nations Conference on Trade and Development (UNCTAD), there is a $2.5 trillion annual average funding gap in regards to critical SDG sectors in developing countries.95 As such, blended finance initiatives, such as combining philanthropy with debt and equity, are being explored to meet the scale of investment required.96
Giving USA Giving to International Affairs
Giving USA FoundationTM | Giving USA 2017 | 321
________________________________________
To fill the lack of official government and nonprofit aid, individual citizens have filled the gap by sending private supply packages to Venezuela.
________________________________________

The following sections discuss new financing formats for international organizations and nonprofits involved in development work.
New inroads to impact investing for humanitarian organizationsCatholic Relief Services (CRS) announced in December 2016 their intent to make an impact investment of $500,000 in Lafaza, a U.S.-based company that sells ethically sourced vanilla from Madagascar.97 CRS had previously established a relationship with Lafaza through a partnership and then a grant. This 2016 disbursement hopes to effect social change in the farming community in Madagascar and create financial returns for CRS.
Multi-sector collaboration with Root Capital, the U.S. Agency for International Development (USAID),
and an investment from the MGR Foundation created this opportunity.98 Based on its success thus far, CRS has earmarked 5 percent of its cash reserves for investing in established impact funds and continues to plan for investment in socially-focused enterprises.
Development impact bondsDevelopment impact bonds (DIBs) are an adapted form of social impact bonds, or pay-for-success (PFS) initiatives.99 Showing growth in both the U.S. and the U.K., social impact bonds involve an investor providing capital for a certain intervention program, which is administered by a service provider, nonprofit, or government agency.100 A third party evaluates the success of the program based on pre-determined impact metrics, and the government pays the initial investor depending on the effectiveness of the intervention. DIBs operate on the same principles, though the payout provider is typically a donor agency or foundation instead of the government, as governments in developing nations typically do not have the resources or credit rating to give investors confidence.
DIBs are currently still in the testing phases of efficacy, however these early efforts are being supported by philanthropic platforms and international humanitarian and development agencies.101 Worldwide, there are currently two operational DIBs, as the rollout of these financing tools has been
322 | Giving USA FoundationTM | Giving USA 2017
Giving USA Giving to International Affairs

slowed by difficulties in coordinating multiple international stakeholders.
In 2016, the International Committee of the Red Cross (ICRC), impact investing firm Kois Invest, and blended finance platform Convergence began an effort to create a $30 million DIB centered on livelihood creation for Syrian refugees in major destination countries.102 The project is currently in the feasibility study stage of development.
In July 2016, one of the first DIBs released preliminary impact data from its first year of operation with encouraging results.103 The UBS Optimus Foundation and the Children’s Investment Fund Foundation (CIFF) have collaborated to back the Educate Girls bond, which aims to enroll more girls in school and boost educational outcomes in 140 communities in Rajasthan, India. Successful implementation of this project will trigger a payout for UBS, but also an incentive payment to the India-based NGO Educate Girls.
International affairs organizations declined in representation on the Philanthropy 400 in 2016
The Chronicle of Philanthropy annually compiles a list of the top 400 public charities and private foundations.104
The Philanthropy 400 ranks charities according to the level of private donations received in the previous fiscal year. Private donations include gifts from all private sources—individuals, corporations, and foundations. Gifts of cash, shares of stock, in-kind donations, real estate, and valuables are included. To determine the rankings, the Chronicle compiles information from IRS Forms 990, annual reports, financial statements, and a questionnaire.
Philanthropy 400 data issued in 2016 for giving in the fiscal year ending in 2015 include 57 international organizations (as compared to 60 reported in the previous year). The top five international organizations on the list with the greatest amount in private support are:105
Ranking 7th: The Task Force for Global Health, Decatur, GA, with $1.65 billion in private contributions, a decline of 9.6 percent from the previous year;
Ranking 13th: Food for the Poor, Coconut Creek, FL, with $1.16 billion in private contributions, an increase of 27.3 percent;
Ranking 19th: Direct Relief, Santa Barbara, CA, with $888.64 million in private contributions, an increase of 97.7 percent;
Ranking 21st: World Vision, Federal Way, WA, with $826.38 million in private contributions, a decline of 0.8 percent; and
Giving USA Giving to International Affairs
Giving USA FoundationTM | Giving USA 2017 | 323

Ranking 24th: Compassion International, Colorado Springs, CO, with $765.16 million in private contributions, an increase of 7.3 percent.
Several international organizations on the Philanthropy 400 realized double-or triple-digit growth rates in private donations for fiscal year 2016 over 2015.106 Direct Relief (+97.7 percent), MAP International (+71.6 percent), The Carter Center (+144.8 percent), and Jewish National Fund (+171.7 percent) all saw strong growth in private giving.
Other reports on giving to the international affairs subsector for previous years
Revised giving estimates, as released by Giving USA in this edition, show that giving to the international affairs subsector totaled $20.82 billion in 2015, an increase of 14.1 percent from 2014.107
Many research organizations study charitable revenue and reports based on IRS Forms 990, surveys, or other data sources. In 2016 and 2017, several studies were released about charitable giving and revenue trends for prior years, providing explanation for the revised estimates for giving to this subsector. Some of these reports are summarized below.
Individual donors drove increases in private giving to humanitarian assistance in 2015Global private spending for international food and other humanitarian aid reached an estimated high of $6.2 billion in 2015, according to the Global Humanitarian Assistance Report 2016, published by Development Initiatives (DI).108 This figure represents an estimate of private revenue to all humanitarian nonprofits from individuals, foundations, trusts, and corporations.
Total global private spending rose nearly 13 percent, providing approximately 22 percent of total international humanitarian assistance.109 According to the report, 2015 was the third consecutive year that humanitarian assistance from private donors increased globally. Giving from private sources is mainly driven by individuals: from 2010–2014, individual gifts accounted for 69 percent of private humanitarian aid. Further, individuals comprised 64 percent of humanitarian funding to NGOs tracked by DI in 2014.
The report found the Syrian crisis response garnered the most reported private donations in 2015, mainly directed to NGO actors.110 UN OCHA Financial Tracking Service (FTS) found that giving was driven by individuals—private donors tripled their Syrian crisis funding in 2015 over 2014 for a total of $398 million.
Figure 1 details private humanitarian aid by donor type in the 2010–2014 period.
324 | Giving USA FoundationTM | Giving USA 2017
Giving USA Giving to International Affairs

Giving USA Giving to International Affairs
Giving USA FoundationTM | Giving USA 2017 | 325
Data: X-axis reflects cumulative totals. Global Humanitarian Assistance Report 2016, Global Humanitarian Assistance, 2016, globalhumanitarianassistance.org
Individuals
Trusts and foundations
Companies and corporations
National societies
Other
0.0 1.0 2.0 3.0 4.0 5.0 6.0
2014
2013
2012
2011
2010
3.9
3.8
3.7
4.1
3.9
0.3
0.3
0.3
0.3
0.4
0.3
0.6
0.1
0.3
0.1
0.4
0.4
0.3
0.3
0.5
0.5
0.4
0.6
0.7
1.1
Figure 1 Non-state international humanitarian assistance by donor type (2010–2014)(contributions in billions of U.S. dollars)

Disaster philanthropy snapshot of 2014 The Center for Disaster Philanthropy and Foundation Center jointly published the third annual Measuring the State of Disaster Philanthropy 2016: Data to Drive Decisions report on philanthropic disaster giving in 2014.111 The report tracks sources of international disaster funding, including crowdfunding platforms, small foundations, and multilateral government giving for both domestic and international disaster philanthropy.
Reporting data sources indicated that approximately $22.53 billion was given to disaster and humanitarian aid in 2014, with the majority of funds targeting immediate disaster response and relief efforts.112 Multilateral and bilateral government agencies gave the majority of aid, totaling nearly $22.12 billion or 98.2 percent of the total amount. Figure 2 details the breakdown of disaster giving from non-governmental sources, including crowdfunding and corporate giving:
326 | Giving USA FoundationTM | Giving USA 2017
Giving USA Giving to International Affairs
Data: Measuring the State of Disaster Philanthropy 2016: Data to Drive Decisions, The Center for Disaster Philanthropy and Foundation Center, 2016, disasterphilanthropy.org
Note: This report does not comprehensively include all crowdfunding measurements, as individual online giving data is difficult to capture. Two of the largest crowdfunding platforms, Global Giving and Network for Good, were surveyed for the report.
Foundations (top 1,000 in U.S.)
Corporate giving(estimate)
Crowdfunding(GlobalGiving andNetwork for Good)
Foundations(smalller, public,international)
Figure 2Non-governmental sources of funding for disaster philanthropy(percentage of total non-government giving, 2014)
9.0%
14.7%
22.9%
53.3%

Key findings from annualstudies summarizedTable 1 presents three years of data from studies released annually about contributions to international aid, development, and relief organizations. Website addresses are provided so that readers can access the full reports.
Giving USA Giving to International Affairs
Giving USA FoundationTM | Giving USA 2017 | 327
Chapter authored by Mallory St. Claire, Co-Managing Editor of Giving USA, Indiana University Lilly Family School of Philanthropy, and Chelsea Naylor, M.A., master’s degree student at the Indiana University Lilly Family School of Philanthropy.
Good to Know sections and Practitioner Highlights written by Giving USA Editorial Review Board member Merrell Milano.
References1 All data in this section are reported as estimates, which
are subject to revision. To provide the most accurate estimates for charitable giving, as new data become available, Giving USA revises its estimates for at least the last two years. See more about how Giving USA calculates charitable giving by sources and uses in the “Brief summary of methods used” section of this report.
2 Practitioner highlight authored by Editorial Review Board member Merrell Milano.
3 Practitioner highlight authored by Editorial Review Board
member Merrell Milano. 4 Practitioner highlight authored by Editorial Review Board
member Merrell Milano. 5 This information is in current dollars6 This information was provided to Giving USA directly
from Blackbaud in May 2017. The Blackbaud Index of Charitable Giving assesses changes in total charitable giving from year to year using a three-month rolling median of the charitable revenue reported by a selected sample of U.S. nonprofits. This information reflects data
Table 1 Key findings from other studies about giving to human services organizations
IRS Statistics of Income Bulletin113 Tax-exempt international organizations: 2011–2013
www.irs.gov
2011 2012 2013
Number of returns 5,744 6,941 6,571
Charitable revenue $24.48 billion $22.59 billion $23.37 billion

on total charitable giving reported by 6,857 organizations across the nonprofit sector, representing total charitable revenue of $23.6 billion in 2016. Online giving data are reported by 4,958 nonprofits with charitable support amounting to $2.7 billion in 2016. Month-by-month Blackbaud Index data on both online and total giving are available at www.blackbaud.com/nonprofit-resources/blackbaud-index. Note that Blackbaud data are constantly being updated; therefore, figures published in Giving USA may vary from current figures.
7 Year-over-year monthly giving data are from the Blackbaud Index, May 2017, https://www.blackbaud.com/nonprofit-resources/blackbaud-index
8 Same as note 6.9 Same as note 7.10 Luminate Online Benchmark Report 2016, Blackbaud,
2017, www.blackbaud.com. Data from this report cover the fiscal year July 1, 2015 to June 30, 2016 for a sample of 631 nonprofit organizations that use Luminate Online cloud-based software by Blackbaud.
11 Benchmarks 2017, M+R and NTEN, 2017, www.e-benchmarksstudy.com. Note that this study uses a convenience sample of 133 organizations with online revenue totaling over $535 million and that the organizations types reported in this study do not necessarily match those used in Giving USA.
12 “About the Summit,” World Humanitarian Summit, retrieved March 2017, www.worldhumanitariansummit.org/summit
13 “List of Participating Organizations,” About the Summit, World HumanitarianSummit, May 18, 2016, https://consul-tations.worldhumanitariansummit.org/bitcache/a244c5f-633c1044ca336ace730b8286a49f343ff?vid=580174&dis-position=inline&op=view
14 “The Grand Bargain—A Shared Commitment to better Serve People in Need,” World Humanitarian Summit, The United Nations, May 23, 2016, https://consultations2.worldhumanitariansummit.org/bitcache/075d4c18b82e0853e3d393e90af18acf-734baf29?vid=581058&disposition=inline&op=view
15 Same as note 14.16 Global Humanitarian Assistance Report 2016, Global
Humanitarian Assistance and Development Initiatives, 2016, http://www.globalhumanitarianassistance.org/wp-content/uploads/2016/07/GHA-report-2016-full-report.pdf
17 Megan Rowling, “New Aid Network to Boost Local Charities Helping People in Crisis,” Reuters, May 22,2016, www.reuters.com
18 Same as note 17.19 Tom Esslemont, “Exclusive: Pump More Aid Dollars Into
Local Response, Say Global Charities,” Reuters, May 10, 2016, www.reuters.com
20 Same as note 14.21 Doing Cash Differently: How Cash Transfers can Transform
Humanitarian Aid, Overseas Development Institute, September 2015, https://www.odi.org/sites/odi.org.uk/files/odi-assets/publications-opinion-files/9828.pdf
22 “When Disaster Relief Brings Anything but Relief,” CBS News, April 24, 2016, www.cbsnews.com
23 Same as note 21.24 Ruth Goodwin-Groen, “Five Ways Digital Payments Are
Coming to the Rescue in Emergencies,” The Huffington Post, May 21, 2016, www.huffingtonpost.com
25 Phillip Kaeding, “The Case for Cash in Humanitarian Emergencies,” Inter Press Service, June 28, 2016, www.ipsnews.net; Molly McCluskey, “Cash and Tech Replaces Bags of Rice in Urban Humanitarian Aid,” Diplomatic Courier, November 4, 2016, www.diplomaticourier.com
26 Tina Rosenberg, “For Refugees in Lebanon, Cash Instead of Camps,” The New York Times, September 13, 2016, www.nytimes.com
27 “UNHCR: Programmes for Direct Cash-Aid to the Displaced Reaches Record $430 m in 2016,” United Nations High Commissioner for Refugees, December 16, 2016, www.unhcr.org
28 “The IRC’s Cash Strategy 2015-2020,” International Relief Council, retrieved March 2017, www.rescue.org
29 Megan O’Neil, “New ‘Playbook’ Helps Foundations and Nonprofits Respond to Disasters,” The Chronicle of Philanthropy, January 15, 2016, www.philanthropy.com
30 “How to Use the Playbook,” Disaster Philanthropy Playbook, retrieved March 2017, www.disasterplaybook.org
31 “Syrian civil war timeline: Tracking five years of conflict,” Independent, March 13, 2016, www.independent.co.uk
32 David Sim, “The Fall of Aleppo Timeline: How Assad Captured Syria’s Biggest City,” International Business Times, December 16, 2016, www.ibtimes.co.uk
33 Hwaida Saad and Nick Cumming-Bruce, “Thousands Flee Parts of Aleppo, Syria, as Assad’s Forces Gain Ground,” The New York Times, November 29, 2016, www.nytimes.com; Anne Bernard, “Battle Over Aleppo Is Over, Russia Says, as Evacuation Deal Reached,” The New York Times, December 13, 2016, www.nytimes.com
34 Abdi Latif Dahir, “A Heartbreaking Photo Puts a Face to Aleppo’s Escalating Disaster,” Quartz, August 18, 2016, www.qz.com
35 Matt Broomfield, “Aleppo Evacuation: Here are 16 Syrian Aid Organizations that Need Your Help,” Independent, December 19, 2016, www.independent.co.uk
36 Global Trends: Forced Displacement in 2015, The United Nations High Commissioner for Refugees, 2015, http://www.unhcr.org/576408cd7.pdf
37 “Total Funding to the Syrian Crisis 2016,” The United Nations High Commissioner for Refugees Financial Tracking Service, retrieved March 2017, www.ftsarchive.unocha.org
38 Charlotte Potts, “How Technology Can Change the Refugee Crisis,” Deutsche Welle, May 31, 2016, www.dw.com; Lin Taylor, “Internet in Greek Migrant Camps as Important as Food, Water: Aid Groups,” Thomas Reuters Foundation via Reuters, July 22, 2016, www.news.trust.org
39 Charlotte Potts, “How Technology Can Change the Refugee Crisis,” Deutsche Welle, May 31, 2016, www.dw.com
40 Lin Taylor, “Internet in Greek Migrant Camps as Important as Food, Water: Aid Groups,” Thomas Reuters Foundation via Reuters, July 22, 2016, www.news.trust.org
328 | Giving USA FoundationTM | Giving USA 2017
Giving USA Giving to International Affairs

41 Adi Robertson, “The UN Wants to See How Far VR Empathy Will Go,” The Verge, September 19, 2016, www.theverge.com
42 “Syrian Refugee Crisis,” United Nations Virtual Reality, retrieved March 2017, www.unitednationsvirtualreality.wordpress.com
43 “How Virtual Reality Lets Us See the Syrian Refugee Crisis With Fresh Eyes,” International Rescue Committee, October 20, 2016, www.rescue.org
44 “Doctors Without Borders to Illustrate Global Refugee Crisis With Interactive Exhibit,” Doctors Without Borders, July 18, 2016, www.doctorswithoutborders.org; “World Vision Provides 3D Experiences of the People and Areas that They Want a Potential Donor to see Without Having to Travel,” World Vision, retrieved March 2017, www.worldvision.org; “Fear of the Sky,” Amnesty International, retrieved March 2017, www.360syria.com; Steven Overly, “How Nonprofits Use Virtual Reality to Tackle Real-World Issues,” The Washington Post, October 12, 2016, www.washingtonpost.com
45 Salil Shetty, “Tackling the Global Refugee Crisis: Sharing, not Shirking Responsibility,” Amnesty International, October 4, 2016, www.amnesty.org
46 “Here’s How U.S. Businesses Are Stepping Up to Aid Refugees,” The White House Archives, June 30, 2016, www.obamawhitehouse.archives.gov
47 Sue-Lynn Moses, “Are We Finally Making Significant Progress in the Global Refugee Crisis?” Inside Philanthropy, December 12, 2016, www.insidephilanthropy.com
48 “Refugee Crisis,” U.S. Chamber of Commerce Foundation, retrieved March 2017, www.uschamberfoundation.org; same as note 47.
49 “CRS, InterAction Pledge $1.2 Billion in Humanitarian Support,” Philanthropy News Digest, September 19, 2016, www.philanthropynewsdigest.org
50 George Soros, “Why I’m Investing $500 Million in Migrants,” The Wall Street Journal, September 20, 2016, www.wsj.com
51 “International Rescue Committee Receives $15 Million Gift From the Stavros Niarchos Foundation,” International Relief Council, November 3, 2016, www.rescue.org
52 “International Relief Council,” Bill & Melinda Gates Foundation, retrieved March 2017, www.gatesfoundation.org; “World Vision,” Bill & Melinda Gates Foundation, retrieved March 2017, www.gatesfoundation.org
53 “IKEA Foundation Awards $10.6 Million for Syrian Refugee Children,” Philanthropy News Digest, March 22, 2016, www.philanthropynewsdigest.org
54 Humanitarian Index, Aurora Prize Media, April 22, 2016, http://auroraprizemedia.com/humanitarian-index-2016
55 Same as note 54.56 Same as note 54, pg. 1657 Good to Know authored by Editorial Review Board
member Merrell Milano.58 Same as note 54. 59 Global Humanitarian Overview 2017, United Nations
Office for the Coordination of Humanitarian Affairs, 2017, http://interactive.unocha.org/publication/2017_appeal/#p=1
60 “Yemen Conflict: How Bad is the Humanitarian Crisis,” BBC, March 28, 2017, www.bbc.com
61 Same as note 60.62 2017 Humanitarian Needs Overview: Yemen, United
Nations Office for the Coordination of Humanitarian Affairs via ReliefWeb, 2017, http://reliefweb.int/sites/reliefweb.int/files/resources/YEMEN%202017%20HNO_ Final.pdf, pg. 2
63 “Yemen: Humanitarian Dashboard,” United Nations Office for the Coordination of Humanitarian Affairs via ReliefWeb, retrieved March 2017, www.reliefweb.int
64 “Humanitarian Response: Yemen,” Save the Children, retrieved March 2017, www.savethechildren.org
65 Hakim Almasmari and Angela Dewan, “Yemen: The ‘Forgotten War’ Cloaked in the Shadow of Syria,” CNN, October 9, 2016, www.cnn.com; Samuel Osborne, “The World has Forgotten the Yemen War, Says Senior UN Humanitarian Official,” Independent, December 7, 2016, www.independent.co.uk; Fregal Keane, “Yemen Conflict: UN Official Accuses World of Ignoring Crisis,” BBC, December 6, 2016, www.bbc.com; “Yemen : The Forgotten War,” Amnesty International, retrieved March 2017, www.amnesty.org
66 Hakim Almasmari and Angela Dewan, “Yemen: The ‘Forgotten War’ Cloaked in the Shadow of Syria,” CNN, October 9, 2016, www.cnn.com, para. 4
67 “Hurricane Matthew: ‘1.4 Million Need Help in Haiti,’” Al Jazeera, October 11, 2016, www.aljazeera.com; Azam Ahmed, “Cholera Deepens Haiti’s Misery After Hurricane,” The New York Times, October 15, 2016, www.nytimes.com
68 “Haiti: Hurricane Matthew Humanitarian Dashboard,” United Nations Office for the Coordination of Humanitarian Affairs via ReliefWeb, retrieved March 2017, www.reliefweb.int
69 Hurricane Matthew Priorities and Achievements: Critical Needs Overview, United Nations Office for the Coordination of Humanitarian Affairs via ReliefWeb, November 5, 2016, http://reliefweb.int/sites/reliefweb.int/files/resources/critical-needs-hurricaine-matthew-haiti.pdfs
70 Same as note 68.71 Vin Shahrestani, “Ban Ki-moon Speaks Out After
Desperate Haitians Loot UN Aid Trucks,” The Telegraph, October 16, 2016, www.telegraph.co.uk
72 “Catholic Relief Services Commits $5 Million to Hurricane Matthew Response in Haiti,” Catholic Relief Services, October 7, 2016, www.crs.org
73 Sue-Lynn Moses, “As Haiti Struggles to Recover From Disaster (Again), Who’s Helping?” Inside Philanthropy, October 27, 2016, www.insidephilanthropy.com
74 “Walmart and the Walmart Foundation Announce $2 Million Towards Hurricane Matthew Relief and Recovery Efforts,” Walmart, October 11, 2016, www.news.walmart.com
75 “UPS Mobilizes Global Logistics Network for Hurricane Matthew with $1 Million in Financial and In-Kind Support,” UPS, October 4, 2016, www.pressroom.ups.com
76 Same as note 75.77 “Help Fund Efforts for Hurricane Matthew Relief,”
Giving USA Giving to International Affairs
Giving USA FoundationTM | Giving USA 2017 | 329

CrowdRise, retrieved March 2017, https://www.crowdrise.com/Hurricane-Matthew-Relief; “Results for Hurricane Matthew Haiti,” GoFundMe, retrieved March 2017, https://www.gofundme.com/mvc.php?route=catego-ry&term=Hurricane%20Matthew%20Haiti
78 “Join United in Helping Hurricane Matthew Relief Efforts,” CrowdRise, retrieved March 2017, https://www.crowdrise.com/UAMatthewRelief
79 “It’s Been Three Months Since Hurricane Matthew Hit Haiti, and Aid to the Region is as Important as Ever,” Oxfam, January 4, 2017, www.oxfamamerica.org
80 “Oxfam Plans a 6-to-12 Month Response to Help Haiti Recover from Hurricane Matthew,” Oxfam, November 15, 2016, www.oxfamamerica.org
81 Jonathan Watts, “Venezuela on the Brink: A Journey Through a Country in Crisis,” The Guardian, October 11, 2016, www.theguardian.com
82 “Venezuela Inflation Rate,” Trading Economics, retrieved March 2017, www.tradingeconomics.com
83 Patrick Gillespie, “Venezuela Food Crisis Deepens as Shipments Plummet,” CNN Money, August 11, 2016, www.money.cnn.com
84 Same as note 81; Osmary Hernandez, Mariano Castillo and Deborah Bloom, “Venezuelan Food Crisis Reflected in Skipped Meals and Weight Loss,” CNN, February 21, 2017, www.cnn.com; Manuel Rueda, “Venezuela Blocks Humanitarian Aid as Crisis Gets Crazier,” Fusion, June 1, 2016, www.fusion.net; José Miguel Vivanco, “Venezuela Has No More Time To Waste,” Human Rights Watch, www.hrw.org
85 José Miguel Vivanco, “Venezuela Has No More Time To Waste,” Human Rights Watch, www.hrw.org; Elizabeth Dickinson, “Venezuela’s Humanitarian Crisis is Worse Than You Think,” Devex, October 27, 2016, www.devex.com
86 Elizabeth Dickinson, “Venezuela’s Humanitarian Crisis is Worse Than You Think,” Devex, October 27, 2016, www.devex.com; Sabrina Martín, “Venezuelan Government Confiscates Medicine Shipment from Chile,” PanamPost, www.panampost.com; “Venezuelan Government Still Blocking Humanitarian Supplies, Catholic Charity Reports,” CatholicCulture.org, November 29, 2016, www.catholicculture.org
87 Sofia Barbarani, “Venezuelans Forced to Live Off Scraps, But Aid Shut Out,” IRIN, November 22, 2016, www.irinnews.org
88 Whitney Eulich, “How Venezuelans Are Filling Aid Needs Even as Government Denies Crisis,” The Christian Science Monitor, August 3, 2016, www.csmonitor.com
89 Lomi Kriel, “Houstonians Sending Aid to Venezuelan Relatives in Crisis,” Houston Chronicle, August 4, 2016, www.houstonchronicle.com
90 Tim Padgett, “Does Survival in Venezuela Depend on Shippers in Miami?” WLRN, August 22, 2016, www.wlrn.org
91 Same as note 90; “Florida Pharmacies Taking Orders from Crisis-Hit Venezuela,” DailyMail, May 10, 2016, www.dailymail.co.uk
92 “Results for Venezuela,” GoFundMe, retrieved March 2017, https://www.gofundme.com/mvc.php?route=category&term=Venezuela&country=US
93 Same as note 88.94 Manuel Rueda, “Venezuela Blocks Humanitarian Aid as
Crisis Gets Crazier,” Fusion, June 1, 2016, www.fusion.net95 The Development Co-Operation Report 2016: The
Sustainable Development Goals as Business Opportunities, Organisation for Economic Co-operation and Development, 2016, https://www.imf.org/external/np/seminars/eng/2016/GlobalLaborMarkets/pdf/Schutte_Wilson_Session2.pdf
96 Di Dai, “Blended Finance Initiatives to facilitate $100 billion in support of Sustainable Development Goals,” World Economic Forum, July 14, 2015, www.weforum.org
97 Adva Saldinger, “New CRS Deal Marks First Foray into Impact Investment,” Devex, December 23, 2016, www.devex.com
98 “Catholic Relief Services Announces First-Ever Impact Investment Loan in Madagascar,” Catholic Relief Services, December 19, 2016, www.crs.org
99 Adva Saldinger, “Have Development Impact Bonds Moved Beyond the Hype?” Devex, July 8, 2016, www.devex.com
100 “Introduction to Social Impact Bonds,” Social Finance, retrieved March 2017, http://www.socialfinance.org.uk/wp-content/uploads/2015/05/Introduction-to-Social-Impact-Bonds.pdf
101 Same as note 99. 102 Adva Saldinger, “Development Impact Bond Looks to
Boost Refugee Employment,” Devex, October 4, 2016, www.devex.com
103 Adva Saldinger, “A Look Inside the Educate Girls Development Impact Bond and the First-Year Results,” Devex, July 5, 2016, www.devex.com
104 Peter Olsen-Phillips, “How the 2016 Philanthropy 400 Was Compiled,” The Chronicle of Philanthropy, October 27, 2016, www.philanthropy.com.
105 The Chronicle of Philanthropy does not use the NTEE coding system for categorizing nonprofit organizations as does Giving USA; therefore, listings here for the Chronicle may vary from how Giving USA categorizes organizations. “The 2016 Philanthropy 400,” The Chronicle of Philanthropy, October 27, 2016, www.philanthropy.com
106 Same as note 105.107 This information is in inflation-adjusted dollars. 108 Global Humanitarian Assistance Report 2016,
Development Initiatives, 2016, http://www.globalhumanitarianassistance.org/wp-content/uploads/2016/07/GHA-report-2016-full-report.pdf. Note that humanitarian aid is only a portion of the type of contributions tracked in the international affairs subsector, which also includes organizations related to international peace and security, international exchanges, and other activities.
109 Same as note 108.110 Same as note 108.111 Measuring the State of Disaster Philanthropy 2016,
Foundation Center and the Center for Disaster Philanthropy, 2016, http://admin.issuelab.org/permalink/download/25866
112 Same as note 111.113 Information received from Paul Arnsberger, Internal
Revenue Service, April 2017, www.irs.gov
330 | Giving USA FoundationTM | Giving USA 2017
Giving USA Giving to International Affairs
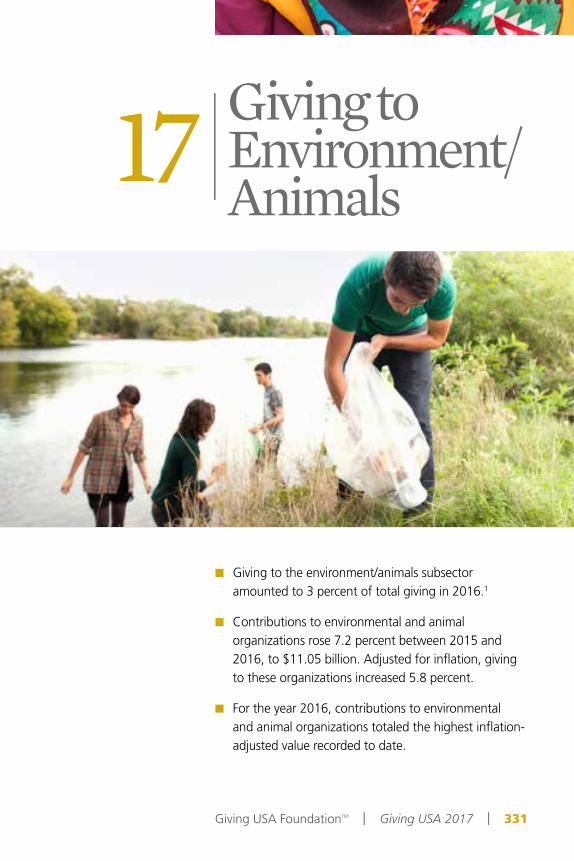
17 | Giving toEnvironment/Animals
Giving USA FoundationTM | Giving USA 2017 | 331
Giving to the environment/animals subsector amounted to 3 percent of total giving in 2016.1
Contributions to environmental and animal organizations rose 7.2 percent between 2015 and 2016, to $11.05 billion. Adjusted for inflation, giving to these organizations increased 5.8 percent.
For the year 2016, contributions to environmental and animal organizations totaled the highest inflation-adjusted value recorded to date.

The information provided in this chapter derives from a
number of sources, including publicly available reports, news stories, and websites from the most recent year. This chapter is meant to provide context for the giving trends reported in this edition of Giving USA and to illustrate some of the practical implications of the data. It is not intended to be a comprehensive survey of the subsector, but rather a collection of examples from the field.
Trends in giving to environment/animals subsector in 2016
In 2016, giving to environmental and animal organizations experienced the fastest growth out of nine subsectors at 7.2 percent, with a two-year growth rate of 13.5 percent.5 In the last five-year period (2012 to 2016), giving to environmental and animal organizations experienced an average annual rate of growth of 6.4 percent—making it the fifth-fastest growing subsector out of nine. Giving to environmental and animal organizations also outpaced the five-year average rate of growth in total giving of 5.6 percent.
332 | Giving USA FoundationTM | Giving USA 2017
Giving USA Giving to Environment/Animals
Practitioner Highlights The high rate of growth in giving to the environment/animals
subsector in 2016 was complemented by strong increases in online giving for these causes.2
The 2016 Standing Rock protest against the construction of the Dakota Access Pipeline is an example of success in crowdfunding, as these activists primarily raised funds through social media and crowdfunding platforms. In addition to financial donations, donors also contributed supplies to support protestors.3
Donors marshalled support around several environmental and animal causes in 2016, including land, marine, and animal conservation. Several large gifts in 2016 went to land trusts and conservation efforts.4

Several reports issued in 2017 note mixed trends in giving to environmental and animal organizations in 2016. The results of these reports are provided throughout the rest of this opening narrative and chapter. Different methodological and sampling approaches account for the differences seen between these sources and Giving USA data. Some highlights from 2016 on giving this subsector include:
In spring 2017, Blackbaud reported that among its sample of over 6,800 nonprofits, giving to environmental and animal-welfare organizations declined 2.2 percent in 2016 over 2015.6 Environmental and animal-welfare organizations realized the greatest year-over-year monthly increases in overall charitable revenue in the three-month periods ending in January (6.5 percent) and June (5.8 percent).7 A drop in year-over-year monthly giving was realized in the three-month period ending in July (-1.4 percent).
Fifty-nine percent of environmental organizations responding to the Nonprofit Research Collaborative’s Winter 2017 Nonprofit Fundraising Survey reported an increase in charitable contributions received between 2015 and 2016.8 This percent change from 2015 to 2016 is nearly in line with the 60 percent of all organizations that reported an increase in contributions in the same period.
To provide additional context for giving to environmental and animal organizations in 2016 and in recent years, the following sections provide detail on recent trends, related campaigns, and news for this subsector.
Online giving to environmental and animal organizations posts strong growth in 2016
Three different reports noted positive results for giving to environmental and animal organizations in 2016 via online methods. While different methodological and sampling approaches account for the differences seen between these sources and Giving USA data, these sources highlight trends seen by specific types of environmental and animal organizations.
Year-over-year online giving was much stronger for the sample of Blackbaud environmental and animal-welfare organizations than overall giving to these same organizations in 2016, increasing 10.2 percent.9 Environmental and animal-welfare organizations realized the greatest year-over-year monthly increases in online charitable revenue in the three-month periods ending in February (15.4 percent) and November (23.7 percent).10 The lowest increase was realized in the three-month period ending in May (4.3 percent).
Giving USA Giving to Environment/Animals
Giving USA FoundationTM | Giving USA 2017 | 333

According to Blackbaud’s Luminate Online Benchmark Report 2016, surveyed animal-welfare organizations reported a 9 percent increase in aggregate online revenue over fiscal year 2015, while environment and wildlife organizations saw an increase of 16 percent.11 Both types of organizations saw an increase in the proportion of monthly donors (sustainers) comprising total fundraising revenue from 2015 to 2016, at 7 percent for environment and wildlife organizations and 5 percent for animal-welfare organizations.
In a different study, the Benchmarks 2017 report by M+R and NTEN also
reported increases in online giving from 2015 to 2016 for a sample of both environmental (15 percent) and wildlife/animal-welfare organizations (16 percent).12 Both types of organizations saw growth in revenue from monthly and one-time online giving, with growth in monthly donated revenue surpassing one-time donations for both of these organizations in 2016.
Standing Rock and Dakota Access Pipeline protests
In early 2016, the Texas-based company Energy Transfer Partners received final approval to begin construction on the Dakota Access Pipeline (DAPL), which proposed to carry approximately 450,000 barrels of crude oil daily from North Dakota’s Bakken oil fields, through South Dakota and Iowa, to Patoka, Illinois.13 In April 2016, citizens of the Standing Rock Lakota Nation, as well as citizens of other Lakota, Nakota, and Dakota nations, established the Sacred Stone Camp at the Standing Rock Sioux Reservation to protest the continuation of the pipeline.
The protest centered on concern for the environment, in particular the waterways under which the pipeline would cross.14 Furthermore, protestors sought to preserve sacred Native American cultural sites such as burial grounds, through which the pipeline runs.
334 | Giving USA FoundationTM | Giving USA 2017
Giving USA Giving to Environment/Animals

By May 2016, news of the protest began to spread throughout the country, and Standing Rock quickly became a staging ground for a major grassroots resistance movement, which included the Oceti Sakowin (commonly called the Sioux), various other Native American tribes and First Nations, and other groups.15 The number of protestors at the sight reached 10,000 in December.16
In addition to widespread participation in the protests, individuals also contributed to the movement through donations.17 Contrary to a traditional fundraising approach, where funds are funneled through one primary source, the Sacred Stone camp utilized a decentralized form of fundraising with the Internet and crowdfunding sites as its primary platforms for generating philanthropic support.
Table 1 is a summary of the four primary online campaigns related to the Standing Rock protests, based on total donations as of February 2017. Other websites, such as the Standing Rock Sioux Tribe’s website, facilitated donations as well.18 Though final fundraising numbers were unavailable at the time of publication, Stand with Standing Rock publicized that it had received 49,214 contributions as of May 2017.19
Beyond monetary support, organizers also asked individuals and organizations to donate supplies.20 In October 2016, Mark Ruffalo, actor and co-founder of The Solutions Project, joined with the CEO of Native Renewables and Navajo leader Wahleah Johns to deliver solar trailers to the protestors in North Dakota.21 The trailers were funded by Empowered by Light and constructed by Navajo Nation Leaders.
Giving USA Giving to Environment/Animals
Giving USA FoundationTM | Giving USA 2017 | 335
Table 1Major crowdfunding campaigns for Standing Rock protests in 2016
Site Campaign Total donations
Number of partici-
pants
Timespan of campaign
GoFundMe The Official Sacred Stone Camp22 $3.1 million 61,621 9 months
FundRazr Sacred Stone Legal Defense Fund23 $2.9 million 53,166 6 months
GoFundMeVeterans Stand
for Standing Rock #NoDAPL24
$1.15 million* 25,991 3 months
CrowdRiseOfficial Support for Standing Rock Sioux Tribe Against DAPL25
$299,517 unavail-able unavailable
*This total based on data retrieved January 2017.

Giving USA Giving to Environment/Animals
Native American environmental activismIn the context of Native American and indigenous nonprofits, alliance organizations such as the Indigenous Environmental Network and the Native American Rights Fund work at the
intersection of Native rights and natural resource protection.26 In recent years, other Native organizations and protest camps have spearheaded pipeline protests throughout North America similar to the DAPL movement.27 Table 2 provides information highlighting some of these Native-led protests.
336 | Giving USA FoundationTM | Giving USA 2017
Giving USA Giving to Environment/Animals
Table 2Native-led pipeline protests in the United States, 2016
Pipeline name Location Protest camp/opposition group
Sabal Trail Pipeline Alabama, Georgia, Florida Sacred Water Camp; Water Is Life Camp
Trans-Pecos Pipeline Texas and Chihuahua, Mexico The Two Rivers Camp
Pilgrim Pipeline New York and New Jersey Split Rock Prayer Camp
Diamond Pipeline Oklahoma, Arkansas, Tennessee Arkansas Rising
Data: “Standing Rock to the World: 10 Indigenous and Environmental Struggles You Can Support in 2017,” Camp of the Sacred Stones, January 1, 2017, www.sacredstonecamp.org/blog

Climate change funding in 2016
Climate change continued to be a priority for both national and international bodies in 2016. Following the 2015 United Nations (UN) Framework Convention on Climate Change’s 21st Conference of the Parties (COP21), the Paris Agreement, a multilateral commitment to address and mitigate global warming, was ratified on October 5, 2016 after receiving the minimum number of signatory nations.29 Additionally, the UN held a follow-up conference, the 22nd Conference of the Parties (COP22), in Marrakech, Morocco in November 2016.30 The summit produced the Marrakech
Action Proclamation, a supplementary document urging for continued global effort and action on climate change mitigation.
Local responses to climate change mitigation Though climate change response frequently manifests at a global scale, local and regional place-based foundations also attempted to direct grantmaking to climate change issues in 2016.31
In 2015, The Fund for New Jersey (the Fund) pivoted much of its grantmaking activities toward environment-based initiatives after an internal review process.32 Building on emissions-reduction campaigns conducted by the San Diego Foundation, the Barr Foundation in Boston, and the RE-AMP Network, the Fund directed 73 percent of its 2016 second quarter grants, totaling $650,000, to organizations that focus on the environment and climate change.33
A focus on place-based change is also echoed in the mission of the Solutions Project’s 100% Campaign, which strives to celebrate “clean energy leaders” making “100% clean energy a reality.”34 The Solutions Project defines clean energy as energy derived from the sun, wind, and water. In service of this goal, the Solutions Project collaborated with Stanford University to produce an interactive U.S. map illustrating each state’s current clean energy production
Giving USA Giving to Environment/Animals
Giving USA FoundationTM | Giving USA 2017 | 337
Good to KnowSocial media-driven campaigns that helped to fund opposition to the Dakota Access Pipeline represented some of the most visible instances of crowdfunding in 2016, and their success provides insight into strategies organizations across all sectors can use when considering crowdfunding:28
Set a realistic goal that will have a meaningful impact on your work;
Use a video to bring your story to life;
Have your first gift lined up before the campaign launches, so you can show progress early on; and
Rally your supporters to share on social media for the duration of the campaign.

levels and the economic and social benefits each state would realize following a shift to clean energy.35 The Solutions Project also launched a new initiative called the Fighter Fund in August 2016, which awards rapid response grants of up to $15,000 to rapidly aid grassroots clean energy organizations.36
Environment and climate change-focused organizations report uptick in donations after 2016 presidential electionSeveral environmental and climate change organizations noted an increase in donations and memberships following the 2016 U.S. presidential election. Many groups attributed this upsurge to the results of the election and President-elect Donald J. Trump’s campaign rhetoric pledging to withdraw from the Paris Agreement as potentially galvanizing donors to support environmental causes.37
The Sierra Club reported that, between Election Day (Tuesday, November 8, 2016) and the following Monday, 7,500 individuals signed up as monthly donors, more than the total number of monthly donors that had joined between January 1 and November 8 of that same year.38 Furthermore, the Center for Biological Diversity disclosed that they received $400,000 in donations in November, some of which began the evening of November 8 as officials called the election. The Boston Globe reported the Conservation Law Foundation received a 222 percent increase in donations in the first two weeks following the election.39 Finally, environmental law firm EarthJustice (San Francisco, CA) reported raising $11 million and receiving a 300 percent increase in the number of gifts over $10,000, all in the month following the election.40
Global climate change divestment reaches $5 trillion in 2016Divestment is the process of strategically removing investments from specific industries, such as the fossil fuel industry.41 In the context of climate change advocacy, divestment/investment movements target fossil fuel industries and attempt to move funds from such industries into clean energy or less ecologically harmful companies. The divestment movement began in 2011 on college campuses and has since become a widespread and popular action taken by various parties to mitigate climate change.
338 | Giving USA FoundationTM | Giving USA 2017
Giving USA Giving to Environment/Animals
_______________________________________
Several environmental and climate change organizations noted an increase in donations and memberships following the 2016 U.S. presidential election.
_______________________________________

A December 2016 Arabella Advisors report indicates that a global total of $5 trillion had either been committed to divest or had already been divested since 2011 by 688 institutions and over 58,000 individuals.42 The share of divested assets has almost doubled from $2.6 trillion in September 2015 to $5 trillion in December 2016. In the same 15-month period, institutions that joined the divestment movement grew from 436 to 688, and individuals from just 2,000 to over 58,000.
No single type of organization represents more than 25 percent of divestment commitments.43 Of the total divestment commitments, philanthropic foundations and faith-based organizations represent the largest share (both at 23 percent), while local governments constitute 17 percent. Smaller shares include educational institutions (14 percent), pension funds (12 percent), and nongovernmental organizations (6 percent). For-profit asset managers only represent 3 percent of the committed divestments. While “mission-driven institutions”—such as foundations, educational institutions, and faith-based organizations—account for 54 percent of all new divestment commitments made from September 2015 to December 2016, “profit-driven institutions” currently account for 92 percent of the total assets committed to be divested.44
Organizations that divested assets report the ratification of the Paris Agreement and fossil fuels’ relative financial risk as factors that motivated divesting, among others.45
Alternative financing for environmental concerns
Social impact investments, green bonds, climate bonds, and other blended finance vehicles have emerged in recent years as mechanisms to leverage private capital to finance solutions for environmental problems. A biennial report released in 2016 by The Forum for Sustainable and Responsible Investment (US SIF) indicates that the total amount of U.S. assets managed under “sustainable, responsible and impact (SRI)” strategies grew 33 percent from $6.57 trillion in 2014 to $8.72 trillion in 2016.46 In addition, Moody’s Investor Service reports that in 2016, the global total of issued green bonds increased 120 percent to $93 billion in 2015–2016.47
In 2014, JPMorgan Chase & Co. sponsored The Nature Conservancy (TNC) to create NatureVest, an investment program that combines conservation efforts with financial returns for investors.48 In May 2016, JPMorgan Chase renewed their sponsorship of NatureVest with $6 million in funding. TNC reports having facilitated almost $200 million in investments since 2014, all aimed at improving the environment.49 In June, TNC received the 2016 Financial Times (FT) / International Finance Corporation (IFC) Transformational Business Award after NatureVest helped restructure
Giving USA Giving to Environment/Animals
Giving USA FoundationTM | Giving USA 2017 | 339

the debt of Seychelles through impact investing, utilizing $5 million from various foundations and organizations.50
Another conservation group, Blue Forest Conservation, announced the creation of the Forest Resilience Bond, with support from The Rockefeller Foundation and The David and Lucile Packard Foundation.51 Forest bonds were developed to finance forest restoration in California in order to decrease wildfires and increase water flow in the region. The investment strategy attempts to harness public and private capital of constituents who would benefit from these outcomes, like the government and utility companies.
In an additional move of support from the private sector, Apple announced in February 2016 the issuance of $1.5 billion in bonds to support renewable energy, energy efficiency, and resource conservation.52 This bond issue is the largest amount any U.S. corporation has invested in green bonds to date.
Trends and initiatives in land conservation in 2016
In 2016, the Land Trust Alliance released findings from a five-year census (2010–2015) of land trust organizations.53 The 2015 National Land Trust Census Report found that over the five-year period, land trusts conserved 9 million acres, bringing the national total of privately
340 | Giving USA FoundationTM | Giving USA 2017
Giving USA Giving to Environment/Animals
conserved land within the United States to 56 million acres.
In addition, the share of land protected by local and state land trusts, compared to national land trusts, has risen from 32 percent in 2005 to 37 percent in 2015.54 The majority of acres are still conserved by national land trusts (63 percent in 2015). The Land Trust Alliance’s census recorded that local, state, and national land trusts managed $2.18 billion in endowments and other funding in 2015.
Large gifts to land conservation in 2016 from both individuals and foundationsIn 2016, U.S. president Barack Obama protected over 3.5 million acres of land throughout the United States under the Antiquities Act, a Congressional proclamation allowing the U.S. president to establish national monuments from federal lands.55
In August, Obama established the Katahdin Woods and Waters National Monument in Maine.56 The 87,500 acres of land, worth $70 million, were donated by cosmetic company Burt’s Bees co-founder Roxanne Quimby.57 Quimby also donated $20 million to the National Park Foundation to establish an endowment to maintain the park.
Quimby’s gift ranked number 17 on The Chronicle of Philanthropy’s Philanthropy 50 list, an annual ranking of the 50

largest philanthropic donations in the U.S.58 Another large gift worth $50 million, given by Annette Simmons to the Trinity Trust, ranked number 28 on the same list.59 The Trinity Trust, now known as the Trinity Park Conservancy, works to develop the Trinity River Park in conjunction with the Trinity River Corridor Project (Dallas, TX).60
Additional large gifts from individuals in 2016 included a $2 million donation from Mike and Sue Raney to restore trails in the Olympic National Park in Washington State.61 An anonymous donor contributed $3 million to The Morton Arboretum (Lisle, IL), which focuses on environmental protection, appreciation, and education.62
In March, the Gordon and Betty Moore Foundation announced a plan to direct at least $90 million to facilitate land
conservation by providing business incentives for companies that make environmentally friendly decisions.63
National Park Service Centennial Campaign breaks fundraising goalIn August 2016, the National Park Service (NPS) celebrated its 100th anniversary.64 To commemorate the centennial, in February 2016 the National Park Foundation announced a fundraising campaign with a goal of $350 million, the largest philanthropic endeavor in the history of the foundation.65 As of December 31, 2016, the campaign reported that $373.4 million had been donated.66 The funds aim to ensure the longevity of the NPS by protecting existing parks, connecting Americans to the national parks, and inspiring future stewards.
Giving USA Giving to Environment/Animals
Giving USA FoundationTM | Giving USA 2017 | 341

Animal conservation efforts in 2016
Animal conservation made numerous strides in 2016, with the giant panda officially changing classifications from endangered to vulnerable status.67 Additionally, in April, the U.S. Fish and Wildlife Service (FWS) announced that four subspecies of island fox, each native to its own island within California’s Channel Islands, had recovered from near-extinction.68 These four subspecies were officially listed as endangered under the Endangered Species Act in 2004, but populations were threatened as early as the late 1990s.
The success of this conservation was accomplished through collaborative preservation efforts spearheaded by the FWS with the NPS, The Nature Conservancy (TNC), and the Catalina Island Conservancy (CIC), that each own and manage different portions of the land on which the foxes live.69 To combat dangers to the fox population, the FWS researched and recommended recovery plans, such as captive breeding and vaccination, to each of the land managers (NPS, TNC, CIC). Landowners then managed the recovery plan specific to the foxes that lived on their land, which aided in the rehabilitation of each of the endangered subspecies. These collaborative efforts resulted in the fastest recovery of a U.S. mammal on the Endangered Species Act list in history.70
The following sections detail trends and efforts toward supporting animal conservation in 2016.
Giraffes now listed as a vulnerable speciesThe fundraising efforts for giraffe conservation in 2016 came on the heels of the species’ new classification as “vulnerable” in the 2016 International Union for Conservation of Nature (IUCN) assessment, after previously being classified as a species of “least concern” in 2010.71 The IUCN changed the classification after recording an approximate 40 percent decline in giraffe populations since 1985.72 Giraffes are threatened by illegal hunting, an increase in mining and agriculture, habitat loss, and civil unrest.73
342 | Giving USA FoundationTM | Giving USA 2017
Giving USA Giving to Environment/Animals
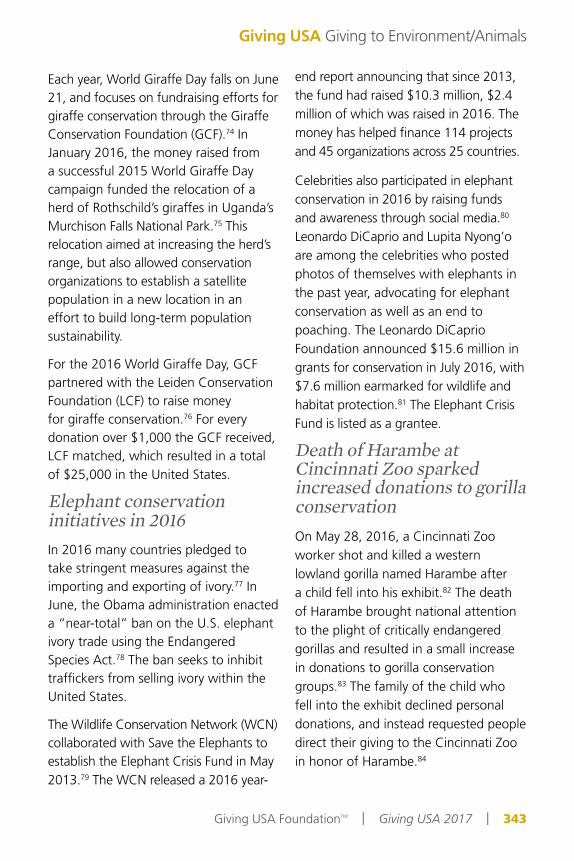
Each year, World Giraffe Day falls on June 21, and focuses on fundraising efforts for giraffe conservation through the Giraffe Conservation Foundation (GCF).74 In January 2016, the money raised from a successful 2015 World Giraffe Day campaign funded the relocation of a herd of Rothschild’s giraffes in Uganda’s Murchison Falls National Park.75 This relocation aimed at increasing the herd’s range, but also allowed conservation organizations to establish a satellite population in a new location in an effort to build long-term population sustainability.
For the 2016 World Giraffe Day, GCF partnered with the Leiden Conservation Foundation (LCF) to raise money for giraffe conservation.76 For every donation over $1,000 the GCF received, LCF matched, which resulted in a total of $25,000 in the United States.
Elephant conservation initiatives in 2016In 2016 many countries pledged to take stringent measures against the importing and exporting of ivory.77 In June, the Obama administration enacted a “near-total” ban on the U.S. elephant ivory trade using the Endangered Species Act.78 The ban seeks to inhibit traffickers from selling ivory within the United States.
The Wildlife Conservation Network (WCN) collaborated with Save the Elephants to establish the Elephant Crisis Fund in May 2013.79 The WCN released a 2016 year-
end report announcing that since 2013, the fund had raised $10.3 million, $2.4 million of which was raised in 2016. The money has helped finance 114 projects and 45 organizations across 25 countries.
Celebrities also participated in elephant conservation in 2016 by raising funds and awareness through social media.80 Leonardo DiCaprio and Lupita Nyong’o are among the celebrities who posted photos of themselves with elephants in the past year, advocating for elephant conservation as well as an end to poaching. The Leonardo DiCaprio Foundation announced $15.6 million in grants for conservation in July 2016, with $7.6 million earmarked for wildlife and habitat protection.81 The Elephant Crisis Fund is listed as a grantee.
Death of Harambe at Cincinnati Zoo sparked increased donations to gorilla conservationOn May 28, 2016, a Cincinnati Zoo worker shot and killed a western lowland gorilla named Harambe after a child fell into his exhibit.82 The death of Harambe brought national attention to the plight of critically endangered gorillas and resulted in a small increase in donations to gorilla conservation groups.83 The family of the child who fell into the exhibit declined personal donations, and instead requested people direct their giving to the Cincinnati Zoo in honor of Harambe.84
Giving USA Giving to Environment/Animals
Giving USA FoundationTM | Giving USA 2017 | 343

The Cincinnati Zoo dedicated a webpage to honor Harambe, which provided a platform for individuals to donate money to the Mbeli Bai Study (MBS) in the Republic of Congo.85 The MBS is the longest-running study of western lowland gorillas and aims to inform conservation strategies and ensure the long-term protection of gorillas.86 Additionally, the Gladys Porter Zoo in Brownsville, Texas, where Harambe was born, established The Harambe Fund and all monies donated were transferred to the MBS.87 At the time of writing, donation totals were unavailable.88
Marine conservation efforts in 2016
In 2016, U.S. president Barack Obama invoked the Antiquities Act on two separate occasions to protect marine life.89 First, the Papaha-naumokua-kea
Marine National Monument in the Pacific Ocean near Hawaii was expanded by 442,781 square miles, making it the largest protected marine area in the world. Second, President Obama created the Northeast Canyons and Seamounts Marine National Monument off the coast of New England, making it the first marine monument in the Atlantic Ocean.90 These executive actions coincided with an increase in global attention paid to the state of the oceans.
Our Ocean Conference generates philanthropic commitments for marine protectionismThe third annual Our Ocean Conference was hosted by Secretary of State John Kerry in Washington, DC, in September 2016.91 The conference brings together world leaders, foundations, nonprofit organizations,
344 | Giving USA FoundationTM | Giving USA 2017
Giving USA Giving to Environment/Animals

and scientists to address issues affecting the health and sustainability of the world’s oceans. In 2016, conference participants announced 136 global initiatives representing $5.24 billion in investments. Since its inception in 2014, the Our Ocean Conference has garnered $9.2 billion in commitments.92
Many of the 2016 pledges were made by foundations, and some of the largest commitments include:93
$550 million pledged over five years from The David and Lucile Packard Foundation to promote ocean protection and health;
$250 million committed over five years from the Walton Family Foundation to secure ocean conservation in North and South America and Indonesia;
$220 million pledged over five years from the Gordon and Betty Moore Foundation in support of ocean conservation and research;
$100 million pledged from The Nature Conservancy to create sustainable ocean management plans, to protect coral reefs and reef fisheries, and to develop financing solutions to ensure stewardship of protected areas; and
$100 million committed over five years from the Marisla Foundation to address overfishing, marine mammal protection, and plastic pollution.
Water protection and resilience received new attention in 2016
Concern for fresh water sources has increased in recent years due to diminishing water resources and drought, particularly in the western United States.94 Though historically an underfunded area, freshwater protection received new funding and attention in 2016.
The Water Funder Initiative (WFI) aims to identify and invest in innovative solutions to ensure sustainable and resilient water sources.95 The initiative is a collaboration among several foundations, including the S. D. Bechtel, Jr. Foundation, The William and Flora Hewlett Foundation, The Rockefeller Foundation, and the Walton Family Foundation.96
Currently, WFI focuses on the western U.S., where the scarcity and depletion of fresh water has been most evident in recent years, specifically in California.97 In August, the network announced a $10 million funding commitment over five years to aid in the restoration and preservation of the Salton Sea in California, which has shrunk in recent years due to drought.98 It is estimated that total restoration of the Salton Sea could cost up to $2.5 billion.99 The $10 million disbursement will work in conjunction with a $30 million commitment from the federal government made by President Obama to restore the lake.100
Giving USA Giving to Environment/Animals
Giving USA FoundationTM | Giving USA 2017 | 345

Environmental and animal-welfare organizations realize slightly lower representation on the Chronicle’s 2016 Philanthropy 400
The Chronicle of Philanthropy annually compiles a list of the top 400 public charities and private foundations.101 The Philanthropy 400 ranks charities according to the level of private donations received in the previous fiscal year. Private donations include gifts from all private sources—individuals, corporations, and foundations. Gifts of cash, shares of stock, in-kind donations, real estate, and valuables are included. To determine the rankings, the Chronicle compiles information from
IRS Forms 990, annual reports, financial statements, and a questionnaire.
Philanthropy 400 data issued in 2016 for giving in the fiscal year ending in 2015 include 16 charities classified as environmental and animal-welfare organizations, as compared to 17 reported in the prior year. The top five environmental and animal-welfare organizations on the list with the greatest amount in private support are:102
Ranking 29th: The Nature Conservancy, Arlington, VA, with $630.7 million in private contributions, an increase of 5.5 percent from the previous year;
Ranking 121st: Foothills Land Conservancy, Maryville, TN, with $206.2 million in private contributions, with no change from the previous year;
Ranking 138th: The Humane Society of the United States, Washington, DC, with $187.1 million in private contributions, an increase of 5.3 percent;
Ranking 143rd: ClimateWorks Foundation, San Francisco, CA, with $183.6 million in private contributions, with no change from the previous year; and
Ranking 158th: The American Society for the Prevention of Cruelty to Animals, New York City, NY, with $173.4 million in private contributions, an increase of 6 percent.
346 | Giving USA FoundationTM | Giving USA 2017
Giving USA Giving to Environment/Animals

References1 All data in this section are reported as estimates, which
are subject to revision. To provide the most accurate estimates for charitable giving, as new data become available, Giving USA revises its estimates for at least the last two years. See more about how Giving USA calculates charitable giving by sources and uses in the “Brief summary of methods used” section of this report.
2 Practitioner highlight authored by Editorial Review Board member Sarah K. Anderson.
3 Practitioner highlight authored by Editorial Review Board member Sarah K. Anderson.
4 Practitioner highlight authored by staff at the Indiana University Lilly Family School of Philanthropy.
5 This information is in current dollars.6 This information was provided to Giving USA directly
from Blackbaud in May 2017. The Blackbaud Index of Charitable Giving assesses changes in total charitable giving from year to year using a three-month rolling median of the charitable revenue reported by a selected
sample of U.S. nonprofits. This information reflects data on total charitable giving reported by 6,857 organizations across the nonprofit sector, representing total charitable revenue of $23.6 billion in 2016. Online giving data are reported by 4,958 nonprofits with charitable support amounting to $2.7 billion in 2016. Month-by-month Blackbaud Index data on both online and total giving are available at www.blackbaud.com/nonprofit-resources/blackbaud-index. Note that Blackbaud data are constantly being updated; therefore, figures published in Giving USA may vary from current figures.
7 Year-over-year monthly giving data are from the Blackbaud Index, May 2017, https://www.blackbaud.com/nonprofit-resources/blackbaud-index
8 The Nonprofit Research Collaborative (NRC) annually conducts surveys on fundraising trends across the nonprofit sector. In 2017, this collaboration included the Giving USA Foundation, the Association of Fundraising Professionals, CFRE International, the Association of
Giving USA Giving to Environment/Animals
Giving USA FoundationTM | Giving USA 2017 | 347
Key findings from annual studies
Table 3 presents three years of data from studies released annually about
contributions to organizations in the environment/animals subsector. Website addresses are provided so readers can access the full reports.
Table 3
Key findings from other studies about giving to environmental and animal organizations
IRS Statistics of Income Bulletin103
Tax-exempt environmental and animal organizations: 2011–2013www.irs.gov
2011 2012 2013
Number of returns 11,763 12,913 13,551
Charitable revenue $10.81 billion $11.45 billion $11.74 billion
Chapter authored by Chelsea Naylor, M.A., master’s degree student at the Indiana University Lilly Family School of Philanthropy.
Good to Know sections and Practitioner Highlights written by Giving USA Editorial Review Board member Sarah K. Anderson and staff at the Indiana University Lilly Family School of Philanthropy.

Philanthropic Counsel, the National Association of Charitable Gift Planners, and Top Nonprofits. In early 2017, the NRC launched a survey to assess fundraising trends for the entire 2016 calendar year. The survey asked nonprofit leaders of public charities and foundations to report on changes in charitable revenue received and changes in the number of donors by specific donor type, among other questions. Data in this section come from the Winter 2017 Nonprofit Fundraising Survey report from the Nonprofit Research Collaborative, May 2017, www.npresearch.org. A convenience sample of 1,019 respondents, 144 of them Canadian, constitutes the survey results.
9 Same as note 6.10 Same as note 7.11 Luminate Online Benchmark Report 2016, Blackbaud,
2017, www.blackbaud.com. Data from this report cover the fiscal year July 1, 2015 to June 30, 2016 for a sample of 631 nonprofit organizations that use Luminate Online cloud-based software by Blackbaud.
12 Benchmarks 2017, M+R and NTEN, 2017, www.e-benchmarksstudy.com. Note that this study uses a convenience sample of 133 organizations with online revenue totaling over $535 million and that the organizations types reported in this study do not necessarily match those used in Giving USA.
13 “Dakota Access Pipeline,” Camp of the Sacred Stones, retrieved February 2017, www.sacredstonecamp.org
14 Same as note 13.15 “Sacred Stone Camp,” Camp of the Sacred Stones,
retrieved February 2017,www.sacredstonecamp.org/about 16 “Dakota Access Pipeline Fight—By the Numbers,”
InsideClimate News, December 23, 2016, www.insideclimatenews.org
17 Jenny Schlecht, “Fundraising for Sacred Stone Camp tops $800,000,” The Bismarck Tribune, www.bismarcktribune.com; The Associated Press, “Dakota Access Pipeline Protesters Crowdsource for $5,000, Get $1 Million,” CBS News, October 31, 2016, www.cbsnews.com
18 Jenna Amatulli, “How you can help the Standing Rock Sioux fight The Dakota Access Pipeline,” The Huffington Post, November 22, 2016, www.huffingtonpost.com
19 “Donate,” Stand with Standing Rock, retrieved May 2017, www.standwithstandingrock.net/donate
20 Same as note 18.21 “Media Advisory: Mark Ruffalo Arrives Tuesday to
Standing Rock,” The Solutions Project, October 27,2017, www.thesolutionsproject.org
22 “The Official Sacred Stone Camp,” GoFundMe, retrieved February 2017, www.gofundme.com/sacredstonecamp
23 “Sacred Stone Legal Defense Fund,” FundRazr, retrieved February 2017, www.fundrazr.com/sacredstone
24 “Veterans for Standing Rock #NoDAPL,” GoFundMe, retrieved February 2017, www.gofundme.com/veterans-for-standing-rock-nodapl
25 “Official Support for Standing Rock Sioux Tribe Against DAPL,” CrowdRise, retrieved February 2017,
www.crowdrise.com/official-support-for-standing-rock-sioux-tribe-against-dapl
26 “About,” Indigenous Environmental Network, retrieved
May 2017, www.ienearth.org/about; “Protect Tribal Natural Resources,” Native American Rights Fund, retrieved May 2017, www.narf.org/our-work/protection-tribal-natural-resources
27 “Standing Rock to the World: 10 Indigenous and Environmental Struggles You Can Support in 2017,” Camp of the Sacred Stones, January 1, 2017, www.sacredstonecamp.org/blog
28 Good to Know section authored by Editorial Review Board member Sarah Anderson.
29 “Paris Agreement,” United Nations, United Nations Treaty Collection, October 5, 2016, https://treaties.un.org/doc/Publication/CN/2016/CN.735.2016-Eng.pdf
30 “Marrakech Action Proclamation for Our Climate and Sustainable Development,” United Nations, United Nations Framework Convention on Climate Change, November 17, 2016, https://unfccc.int/files/meetings/marrakech_nov_2016/application/pdf/marrakech_action_proclamation.pdf
31 James E. Canales and Kate Wolford, “Fighting Global Climate Change Requires Foundations to Give Local,” The Chronicle of Philanthropy, June 1, 2016, www.philanthropy.com
32 Kiki Jamieson, “How Place-Based Funders Are Taking Aim at Climate Change,” Council on Foundations, July 29, 2016, www.cof.org; Having an Impact on Climate Change: Policies to Spur Reductions of Greenhouse Gas Emissions, The Fund for New Jersey, June 2015, http://fundfornj.org/sites/default/files/Having%20an%20Impact%20on%20Climate%20Change%20-%20Policies%20to%20Spur%20Reductions%20of%20Greenhouse%20Gase%20Emissions%20.pdf
33 Kiki Jamieson, “How Place-Based Funders Are Taking Aim at Climate Change,” Council on Foundations, July 29, 2016, www.cof.org; “Summary of Grants Awarded for 2016,” The Fund for New Jersey, retrieved April 2017, http://fundfornj.org/grants-awarded/2016
34 “FAQ” 100% Campaign, The Solutions Project, retrieved February 2017, www.100.org/faq, para. 2
35 “100% Renewable Energy Vision,” The Solutions Project, retrieved February 2017, www.thesolutionsproject.org/infographic/#
36 “Press Release: Fighter Fund Launch,” The Solutions Project, August 1, 2016, www.thesolutionsproject.org
37 Chris Mooney and Brady Dennis, “Scott Pruitt Calls for an ‘Exit’ from the Paris Accord, Sharpening the Trump White House’s Climate Rift,” The Washington Post, April 14, 2017, www.washingtonpost.com
38 Lydia O’Connor, “Environmental Orgs See Surge in Donations, Volunteers Following Trump’s Win,” The Huffington Post, November 11, 2016, www.huffingtonpost.com
39 Sacha Pfeiffer, “Rage Donations Become an Anti-Trump Movement,” The Boston Globe, November 21, 2016, www.bostonglobe.com
40 Jim Ash, “A Trump Backlash is Turning the Environmental Movement Even Greener,” WLRN, December 16, 2016, www.wlrn.org
41 “About,” DivestInvest Philanthropy, retrieved February 2017, www.divestinvest.org/philanthropy/about
348 | Giving USA FoundationTM | Giving USA 2017
Giving USA Giving to Environment/Animals

42 The Global Fossil Fuel Divestment and Clean Energy Investment Movement, Arabella Advisors, 2016, https://www.arabellaadvisors.com/wp-content/uploads/2016/12/Global_Divestment_Report_2016.pdf
43 Same as note 42.44 Same as note 42.45 Same as note 42.46 Report on U.S. Sustainable, Responsible and Impact
Investing Trends 2016, The Forum for Sustainable and Responsible Investment, 2016, http://www.ussif.org/files/SIF_Trends_16_Executive_Summary(1).pdf, pg. 12
47 “Announcement: Moody’s: Global Green Bond Issuance Could Rise to USD206B in 2017 After Record in 2016,” Moody’s Investors Service, January 18, 2017, www.moodys.com
48 “About NatureVest,” NatureVest, The Nature Conservancy, retrieved February 2017, www.naturevesttnc.org/about-us
49 “The Nature Conservancy and JPMorgan Chase Announce NatureVest Program Funding Renewal at Bi-Annual Gala,” The Nature Conservancy, May 26, 2016, www.nature.org
50 “The Nature Conservancy Receives the 2016 FT/IFC Transformational Business Awards’ Achievement in Transformational Finance,” The Nature Conservancy, June 9, 2016, www.nature.org
51 “Our Focus: Forest Resilience Bond,” Blue Forest Conservation, retrieved February 2017, www.blueforestconservation.com; James Rufus Koren, “Start-up is Pitching a New Type of Bond to Fix California’s Wildfire and Water Woes,” Los Angeles Times, November 25, 2016, www.latimes.com
52 Valerie Volcovici, “Apple Issues $1.5 Billion in Green Bonds in First Sale,” Reuters, February 17, 2016, www.reuters.com
53 2015 National Land Trust Census Report: Our Common Ground and Collective Impact, Land Trust Alliance, 2016, http://s3.amazonaws.com/landtrustalliance.org/2015NationalLandTrustCensusReport.pdf
54 Same as note 53.55 Dana Varinsky, “Here’s Every Piece of Land Obama has
Put Under Protection During his Presidency,” Business Insider, December 30, 2016, www.businessinsider.com; “American Antiquities Act of 1906,” Congress of the United States, June 8, 1906, https://www.nps.gov/history/local-law/anti1906.htm
56 Dana Varinsky, “Here’s Every Piece of Land Obama has Put Under Protection During his Presidency,” Business Insider, December 30, 2016, www.businessinsider.com; Sophie Cocke, “Obama Expands Papahanaumokuakea Marine Rserve; Plans Oahu Trip,” Honolulu Star Advertiser, August 25, 2016, www.staradvertiser.com
57 Maria Di Mento, “Roxanne Quimby,” 2017 Philanthropy 50, The Chronicle of Philanthropy, February 7, 2017, www.philanthropy.com
58 Maria Di Mento, “2017 Philanthropy 50,” The Chronicle of Philanthropy, February 7, 2017, www.philanthropy.com
59 Maria Di Mento, “Annette Simmons,” The 2017 Philanthropy 50, The Chronicle of Philanthropy, February 7, 2017, www.philanthropy.com
60 “Trinity Park Conservancy,” Trinity Park Conservancy, retrieved February 2017, www.thetrinitytrust.org
61 “Mike and Sue Raney,” Big Charitable Gifts: Where Donors Have Given $1 Million or More, The Chronicle of Philanthropy, retrieved March 2017, www.philanthropy.com
62 “Anonymous,” Big Charitable Gifts: Where Donors Have Given $1 Million or More, The Chronicle of Philanthropy, retrieved March 2017, www.philanthropy.com; “About the Arboretum,” The Morton Arboretum, retrieved February 2017, www.mortonarb.org
63 Alex Daniels, “Foundation Pledges $90 Million to Push Incentives for Conservation,” The Chronicle of Philanthropy, March 25, 2016, www.philanthropy.com
64 “100 Years: Let’s Celebrate!” National Parks Service, retrieved March 2017, www.nps.gov
65 “National Park Foundation Announces $350 Million Centennial Campaign for American’s National Parks,” National Park Foundation, February 15, 2016, www.nationalparks.org
66 “The Centennial Campaign for America’s National Parks,” National Park Foundation, retrieved March 2017, www.campaign.nationalparks.org
67 Liam Stack, “The Giant Panda is No Longer Endangered. It’s ‘Vulnerable,’” The New York Times, September 6, 2016, www.nytimes.com
68 “Evading Extinction: The Recovery of Island Foxes on California’s Channel Island,” U.S. Fish & Wildlife Service, April 7, 2016, www.fws.gov
69 Recovery Plan for Four Subspecies of Island Fox, U.S. Fish & Wildlife Service, 2015, https://www.fws.gov/ventura/docs/recplans/Recovery%20Plan%20for%20Four%20Subspecies%20of%20Island%20Fox_2-27-15%20final.pdf
70 Same as note 68.71 “Giraffa Camelopardalis,” The IUCN Red List of
Threatened Species, retrieved February 2017, www.iucnredlist.org
72 “New Bird Species and Giraffe Under Threat—IUCN Red List,” IUCN, December 8, 2016, www.iucn.org
73 Same as note 72.74 “World Giraffe Day,” Giraffe Conservation Foundation,
retrieved May 2017, www.giraffeconservation.org/world-giraffe-day
75 “Operation Twiga in Action,” Giraffe Conservation Foundation, March 15, 2016, www.giraffeconservation.org
76 “GCF News—August 2016,” Giraffe Conservation Foundation, August 25, 2016, www.giraffeconservation.org
77 Oliver Milman, “Ban on domestic ivory trade passes at international summit,” The Guardian, September 11, 2016, www.theguardian.com
78 “Administration Takes Bold Step for African Elephant Conservation: Completes Near-Total Elephant Ivory Ban to Cut off Opportunities for Traffickers,” U.S. Fish & Wildlife Service, June 2, 2016, www.fws.gov, para. 1
79 Elephant Crisis Fund 2016 Year End Report, Save the Elephants, 2016, https://wildnet.org/sites/default/files/ECF_2016_Year_End_Report.pdf
80 Alex Williams, “How the Elephant Became the Newest Celebrity Cause,” The New York Times, May 21, 2016, www.nytimes.com
81 “LDF Makes Historic Grant Announcement and Welcomes Terry Tamminen as Global CEO,” Leonardo DiCaprio
Giving USA Giving to Environment/Animals
Giving USA FoundationTM | Giving USA 2017 | 349

Foundation, July 13, 2016, www.leonardodicaprio.org 82 “Outrage After Gorilla Killed at Cincinnati Zoo to Save
Child,” CBS News, May 29, 2016, www.cbsnews.com 83 Shanika Gunaratna, “After Harambe’s Death, Gorilla
Activists Point to ‘Bigger Picture,’” CBS News, June 2, 2016, www.cbsnews.com
84 Elizabeth Chuck, “Family of Boy Who Fell in Harambe Exhibit Asks for Donations to Go to Zoo,” NBC News, June 1, 2016, www.nbcnews.com
85 “Honoring Harambe,” Cincinnati Zoo & Botanical Garden, retrieved February 2017, www.cincinnatizoo.thankyou4caring.org
86 “Mbeli Bai Study,” Mbeli Bai Study, retrieved February 2017, www.mbelibaistudy.org
87 “Remembering Harambe—The Harambe Fund,” Gladys Porter Zoo, retrieved February 2017, www.gpz.org
88 Mbeli Mail, Mbeli Bai Study, December 2016, http://media.wix.com/ugd/f7203c_a17f1287f8a0442abddad8ccd77ac829.pdf
89 Dana Varinsky, “Here’s Every Piece of Land Obama has Put Under Protection During his Presidency,” Business Insider, December 30, 2016, www.businessinsider.com
90 “First Marine National Monument Created in Atlantic,” National Oceanic and Atmospheric Administration, September 19, 2016, www.noaa.gov
91 “Our Ocean One Future,” Our Ocean, retrieved February 2017, www.ourocean2016.org
92 Our Ocean 2016 Initiatives, Our Ocean, 2016, https://static1.squarespace.com/static/57309927cf80a12c4b62c84b/t/57ffc4ffbebafba9d1102794/1476379907973/2016+Our+Ocean+Commitments+Final+10.14.pdf
93 Same as note 92.94 Tate Williams, “’Extremes Are Becoming the Norm.’
Why Water is the Next Big Issue for Philanthropy,” Inside Philanthropy, May 9, 2016, www.insidephilanthropy.com
95 Toward Water Sustainability: A Blueprint for Philanthropy, Water Funder Initiative, 2016, http://waterfunder.org/wp-content/uploads/2016/03/Water-Funder-Initiative-Blueprint-Exec-Sum-March-15-2016.pdf
96 “Participants,” Water Funder Initiative, retrieved February 2017, www.waterfunder.org/participants
97 Same as note 95.98 “Water Funder Initiative Foundations Announce
a $10 Million Goal for Salton Sea Efforts,” The Rockefeller Foundation, August 31, 2016, www.rockefellerfoundation.org
99 “Water Funder Initiative Pledge $10 Million for Salton Sea,” Philanthropy News Digest, September 2, 2016, www.philanthropynewsdigest.org
100 Padma Nagappan, “California is Running Out of Time to Save the Salton Sea,” News Deeply, August 31, 2016, www.newsdeeply.com
101 Peter Olsen-Phillips, “How the 2016 Philanthropy 400 Was Compiled,” The Chronicle of Philanthropy, October 27, 2016, www.philanthropy.com.
102 The Chronicle of Philanthropy does not use the NTEE coding system for categorizing nonprofit organizations as does Giving USA; therefore, listings here for the Chronicle may vary from how Giving USA categorizes organizations. “The 2016 Philanthropy 400,” The Chronicle of Philanthropy, October 27, 2016, www.philanthropy.com
103 Information received from Paul Arnsberger, Internal Revenue Service, April 2017, www.irs.gov
350 | Giving USA FoundationTM | Giving USA 2017
Giving USA Giving to Environment/Animals

18 | Data Tables for Chartsin The Numbers
This section provides data on giving by donor and recipient type for the last 40 years in current and inflation-adjusted dollars. Also included are 40-year trend data on:
total giving as a percentage of GDP
individual giving as a percentage of disposable personal income
corporate giving as a percentage of corporate pre-tax profits
Giving USA FoundationTM | Giving USA 2017 | 351

Giving by source, 1976–2016(in billions of current dollars)
Percent changeIndividuals
Percent changeBequests
Percent changeFoundations
Percent change
Corp-orations
Percent changeTotalYear
352 | Giving USA FoundationTM | Giving USA 2017
Giving USA Data Tables for Charts in The Numbers
Notes: All figures are rounded. Data on giving by foundations provided by Foundation Center. See the “Brief summary of methods used” section of the full report for revisions made to Giving USA data for years prior to 2016.
© 2017 Giving USA Foundation™
1976 31.85 11.5 1.33 15.7 1.90 15.2 2.30 3.1 26.32 11.91977 35.21 10.5 1.54 15.8 2.00 5.3 2.12 -7.8 29.55 12.31978 38.57 9.5 1.70 10.4 2.17 8.5 2.60 22.6 32.10 8.61979 43.11 11.8 2.05 20.6 2.24 3.2 2.23 -14.2 36.59 14.01980 48.63 12.8 2.25 9.8 2.81 25.4 2.86 28.3 40.71 11.31981 55.28 13.7 2.64 17.3 3.07 9.3 3.58 25.2 45.99 13.01982 59.11 6.9 3.11 17.8 3.16 2.9 5.21 45.5 47.63 3.61983 63.21 6.9 3.67 18.0 3.60 13.9 3.88 -25.5 52.06 9.31984 68.58 8.5 4.13 12.5 3.95 9.7 4.04 4.1 56.46 8.51985 71.69 4.5 4.63 12.1 4.90 24.1 4.77 18.1 57.39 1.61986 83.25 16.1 5.03 8.6 5.43 10.8 5.70 19.5 67.09 16.91987 82.20 -1.3 5.21 3.6 5.88 8.3 6.58 15.4 64.53 -3.81988 88.04 7.1 5.34 2.5 6.15 4.6 6.57 -0.2 69.98 8.41989 98.30 11.7 5.46 2.2 6.55 6.5 6.84 4.1 79.45 13.51990 98.48 0.2 5.46 0.0 7.23 10.4 6.79 -0.7 79.00 -0.61991 102.58 4.2 5.25 -3.8 7.72 6.8 7.68 13.1 81.93 3.71992 111.29 8.5 5.91 12.6 8.64 11.9 9.54 24.2 87.20 6.41993 116.58 4.8 6.47 9.5 9.53 10.3 8.86 -7.1 91.72 5.21994 120.05 3.0 6.98 7.9 9.66 1.4 11.13 25.6 92.28 0.61995 123.10 2.5 7.35 5.3 10.56 9.3 10.41 -6.5 94.78 2.71996 138.89 12.8 7.51 2.2 12.00 13.6 12.03 15.6 107.35 13.31997 162.46 17.0 8.62 14.8 13.92 16.0 16.25 35.1 123.67 15.21998 176.56 8.7 8.46 -1.9 17.01 22.2 13.41 -17.5 137.68 11.31999 203.19 15.1 10.23 20.9 20.51 20.6 17.82 32.9 154.63 12.32000 229.66 13.0 10.74 5.0 24.58 19.8 20.25 13.6 174.09 12.62001 232.09 1.1 11.66 8.6 27.22 10.7 20.15 -0.5 173.06 -0.62002 232.72 0.3 10.79 -7.5 26.98 -0.9 21.16 5.0 173.79 0.42003 237.45 2.0 11.06 2.5 26.84 -0.5 18.08 -14.6 181.47 4.42004 260.26 9.6 11.36 2.7 28.41 5.8 18.53 2.5 201.96 11.32005 292.43 12.4 15.20 33.8 32.41 14.1 24.00 29.5 220.82 9.32006 296.09 1.3 14.52 -4.5 34.91 7.7 21.90 -8.8 224.76 1.82007 311.06 5.1 14.22 -2.1 40.00 14.6 23.79 8.6 233.05 3.72008 299.61 -3.7 12.40 -12.8 42.21 5.5 31.24 31.3 213.76 -8.32009 274.78 -8.3 13.79 11.2 41.09 -2.7 19.12 -38.8 200.78 -6.12010 288.16 4.9 15.82 14.7 40.95 -0.3 23.40 22.4 207.99 3.62011 298.50 3.6 15.58 -1.5 43.83 7.0 25.18 7.6 213.91 2.82012 332.61 11.4 17.22 10.5 46.37 5.8 24.64 -2.1 244.38 14.22013 332.53 0.0 15.86 -7.9 49.88 7.6 24.35 -1.2 242.44 -0.82014 365.16 9.8 18.07 13.9 54.91 10.1 31.09 27.7 261.09 7.72015 379.89 4.0 17.92 -0.8 57.29 4.3 33.35 7.3 271.33 3.92016 390.05 2.7 18.55 3.5 59.28 3.5 30.36 -9.0 281.86 3.9

Giving USA FoundationTM | Giving USA 2017 | 353
Giving USA Data Tables for Charts in The Numbers
Notes: All figures are rounded. Data on giving by foundations provided by Foundation Center. See the “Brief summary of methods used” section of the full report for explanation of the revisions made to Giving USA data for years prior to 2016. Giving USA uses the Consumer Price Index to calculate inflation, 2016 = $100.
© 2017 Giving USA Foundation™
Giving by source, 1976–2016 (in billions of inflation-adjusted dollars)
Percent changeIndividuals
Percent changeBequests
Percent changeFoundations
Percent change
Corp-orations
Percent changeTotalYear
1976 134.38 5.4 5.61 9.4 8.02 8.8 9.70 -2.6 111.05 5.71977 139.18 3.6 6.09 8.6 7.91 -1.4 8.38 -13.6 116.80 5.21978 141.80 1.9 6.25 2.6 7.98 0.9 9.56 14.1 118.01 1.01979 142.75 0.7 6.79 8.6 7.42 -7.0 7.38 -22.8 121.16 2.71980 141.78 -0.7 6.56 -3.4 8.19 10.4 8.34 13.0 118.69 -2.01981 145.87 2.9 6.97 6.3 8.10 -1.1 9.45 13.3 121.35 2.21982 147.04 0.8 7.74 11.0 7.86 -3.0 12.96 37.1 118.48 -2.41983 152.31 3.6 8.84 14.2 8.67 10.3 9.35 -27.9 125.45 5.91984 158.38 4.0 9.54 7.9 9.12 5.2 9.33 -0.2 130.39 3.91985 160.02 1.0 10.33 8.3 10.94 20.0 10.65 14.1 128.10 -1.81986 182.17 13.8 11.01 6.6 11.88 8.6 12.47 17.1 146.81 14.61987 173.78 -4.6 11.01 0.0 12.43 4.6 13.91 11.5 136.43 -7.11988 178.58 2.8 10.83 -1.6 12.47 0.3 13.33 -4.2 141.95 4.01989 190.14 6.5 10.56 -2.5 12.67 1.6 13.23 -0.8 153.68 8.31990 181.03 -4.8 10.04 -4.9 13.29 4.9 12.48 -5.7 145.22 -5.51991 180.92 -0.1 9.26 -7.8 13.62 2.5 13.54 8.5 144.50 -0.51992 190.24 5.2 10.10 9.1 14.77 8.4 16.31 20.5 149.06 3.21993 193.66 1.8 10.75 6.4 15.83 7.2 14.72 -9.7 152.36 2.21994 194.25 0.3 11.29 5.0 15.63 -1.3 18.01 22.4 149.32 -2.01995 193.85 -0.2 11.57 2.5 16.63 6.4 16.39 -9.0 149.26 0.01996 212.36 9.5 11.48 -0.8 18.35 10.3 18.39 12.2 164.14 10.01997 242.84 14.4 12.88 12.2 20.81 13.4 24.29 32.1 184.86 12.61998 260.03 7.1 12.46 -3.3 25.05 20.4 19.75 -18.7 202.77 9.71999 292.78 12.6 14.74 18.3 29.55 18.0 25.68 30.0 222.81 9.92000 320.30 9.4 14.98 1.6 34.28 16.0 28.24 10.0 242.80 9.02001 314.48 -1.8 15.80 5.5 36.88 7.6 27.30 -3.3 234.50 -3.42002 310.71 -1.2 14.41 -8.8 36.02 -2.3 28.25 3.5 232.03 -1.12003 309.99 -0.2 14.44 0.2 35.04 -2.7 23.60 -16.5 236.91 2.12004 330.70 6.7 14.43 -0.1 36.10 3.0 23.55 -0.2 256.62 8.32005 359.25 8.6 18.67 29.4 39.82 10.3 29.48 25.2 271.28 5.72006 352.49 -1.9 17.29 -7.4 41.56 4.4 26.07 -11.6 267.57 -1.42007 360.02 2.1 16.46 -4.8 46.30 11.4 27.53 5.6 269.73 0.82008 334.02 -7.2 13.82 -16.0 47.06 1.6 34.83 26.5 238.31 -11.62009 307.37 -8.0 15.43 11.6 45.96 -2.3 21.39 -38.6 224.59 -5.82010 317.00 3.1 17.40 12.8 45.05 -2.0 25.74 20.3 228.81 1.92011 318.57 0.5 16.63 -4.4 46.78 3.8 26.87 4.4 228.29 -0.22012 347.55 9.1 17.99 8.2 48.45 3.6 25.75 -4.2 255.36 11.92013 342.46 -1.5 16.33 -9.2 51.37 6.0 25.08 -2.6 249.68 -2.22014 370.35 8.1 18.33 12.2 55.69 8.4 31.53 25.7 264.80 6.12015 384.52 3.8 18.14 -1.0 57.99 4.1 33.76 7.1 274.63 3.72016 390.05 1.4 18.55 2.3 59.28 2.2 30.36 -10.1 281.86 2.6

354 | Giving USA FoundationTM | Giving USA 2017
Giving USA Data Tables for Charts in The Numbers
Notes: All figures are rounded. Gifts to environment/animals and international affairs began to be tracked in 1987, and gifts to foundations began to be tracked in 1978. See the “Brief summary of methods used” section of the full report for explanation of the revisions made to Giving USA data for years prior to 2016.
© 2017 Giving USA Foundation™
Contributions by type of recipient organization, 1976–2016(in billions of current dollars)
Percent change
Percent changeHealth
Percent change
Human services
Percent changeEducation
Percent changeReligion
Percent changeTotalYear
Public-society benefit
1976 31.85 11.5 14.18 10.7 3.59 12.5 4.03 2.8 3.74 2.2 1.48 21.31977 35.21 10.5 16.98 19.7 3.89 8.4 4.10 1.7 3.93 5.1 1.29 -12.81978 38.57 9.5 18.35 8.1 4.32 11.1 4.22 2.9 4.10 4.3 1.50 16.31979 43.11 11.8 20.17 9.9 4.70 8.8 4.31 2.1 4.28 4.4 1.82 21.31980 48.63 12.8 22.23 10.2 5.07 7.9 4.45 3.2 4.48 4.7 2.28 25.31981 55.28 13.7 25.05 12.7 5.93 17.0 4.59 3.1 4.63 3.3 2.13 -6.61982 59.11 6.9 28.06 12.0 4.94 -16.7 2.88 -37.3 3.06 -33.9 3.21 50.71983 63.21 6.9 31.84 13.5 5.33 7.9 3.04 5.6 3.46 13.1 3.77 17.41984 68.58 8.5 35.55 11.7 6.37 19.5 3.34 9.9 3.87 11.8 4.68 24.11985 71.69 4.5 38.21 7.5 6.75 6.0 3.68 10.2 4.59 18.6 4.09 -12.61986 83.25 16.1 41.68 9.1 8.46 25.3 3.77 2.4 4.37 -4.8 7.66 87.31987 82.20 -1.3 43.51 4.4 8.08 -4.5 3.99 5.8 4.71 7.8 4.86 -36.61988 88.04 7.1 45.15 3.8 8.79 8.8 4.45 11.5 5.59 18.7 5.20 7.01989 98.30 11.7 47.77 5.8 11.31 28.7 6.52 46.5 6.42 14.8 6.02 15.81990 98.48 0.2 49.79 4.2 11.83 4.6 6.69 2.6 7.75 20.7 6.56 9.01991 102.58 4.2 50.00 0.4 12.10 2.3 7.50 12.1 7.63 -1.5 6.73 2.61992 111.29 8.5 50.95 1.9 13.21 9.2 9.14 21.9 8.52 11.7 7.15 6.21993 116.58 4.8 52.89 3.8 14.36 8.7 9.67 5.8 8.79 3.2 8.27 15.71994 120.05 3.0 56.43 6.7 14.09 -1.9 9.67 0.0 8.98 2.2 8.11 -1.91995 123.10 2.5 58.07 2.9 16.47 16.9 10.67 10.3 17.92 99.6 8.76 8.01996 138.89 12.8 61.90 6.6 17.94 8.9 11.97 12.2 18.35 2.4 9.40 7.31997 162.46 17.0 64.69 4.5 22.00 22.6 14.35 19.9 13.62 -25.8 11.23 19.51998 176.56 8.7 68.25 5.5 23.98 9.0 16.32 13.7 12.77 -6.2 12.51 11.41999 203.19 15.1 71.25 4.4 26.63 11.1 17.56 7.6 13.58 6.3 13.58 8.62000 229.66 13.0 76.95 8.0 28.81 8.2 20.79 18.4 15.30 12.7 15.00 10.52001 232.09 1.1 79.87 3.8 28.07 -2.6 24.28 16.8 16.41 7.3 16.56 10.42002 232.72 0.3 82.98 3.9 27.25 -2.9 22.71 -6.5 15.70 -4.3 14.22 -14.12003 237.45 2.0 84.12 1.4 29.59 8.6 23.49 3.4 17.78 13.2 15.96 12.22004 260.26 9.6 87.51 4.0 31.66 7.0 26.10 11.1 19.06 7.2 17.66 10.72005 292.43 12.4 90.86 3.8 34.99 10.5 30.35 16.3 20.33 6.7 20.76 17.62006 296.09 1.3 94.63 4.1 40.07 14.5 30.74 1.3 24.22 19.1 23.16 11.62007 311.06 5.1 97.79 3.3 42.69 6.5 31.45 2.3 25.28 4.4 19.99 -13.72008 299.61 -3.7 98.22 0.4 35.89 -15.9 35.44 12.7 24.14 -4.5 17.95 -10.22009 274.78 -8.3 99.56 1.4 34.96 -2.6 35.95 1.4 26.08 8.0 17.31 -3.62010 288.16 4.9 97.54 -2.0 42.22 20.8 36.78 2.3 27.68 6.1 19.21 11.02011 298.50 3.6 101.78 4.3 42.92 1.7 37.40 1.7 25.86 -6.6 21.35 11.12012 332.61 11.4 105.77 3.9 46.85 9.2 41.14 10.0 26.18 1.2 22.88 7.22013 332.53 0.0 110.42 4.4 48.06 2.6 40.46 -1.7 29.05 11.0 25.95 13.42014 365.16 9.8 115.95 5.0 53.15 10.6 43.31 7.0 31.19 7.4 27.15 4.62015 379.89 4.0 119.35 2.9 57.72 8.6 45.00 3.9 31.36 0.6 28.82 6.12016 390.05 2.7 122.94 3.0 59.77 3.6 46.80 4.0 33.14 5.7 29.89 3.7

Giving USA FoundationTM | Giving USA 2017 | 355
Giving USA Data Tables for Charts in The Numbers
Notes: All figures are rounded. Gifts to environment/animals and international affairs began to be tracked in 1987, and gifts to foundations began to be tracked in 1978. See the “Brief summary of methods used” section of the full report for explanation of the revisions made to Giving USA data for years prior to 2016.
© 2017 Giving USA Foundation™
Contributions by type of recipient organization, 1976–2016 (in billions of current dollars)
Un-allocated
Gifts to individuals
Percent change
Gifts to foundations
Percent change
Environment/animals
Percent change
International affairs
Percent change
Arts, culture, humanitiesYear
1976 1.54 3.4 3.291977 1.84 19.5 3.181978 1.87 1.6 1.61 2.601979 1.98 5.9 2.21 37.3 3.641980 2.12 7.1 1.98 -10.4 6.021981 2.28 7.5 2.39 20.7 8.281982 0.97 -57.5 4.00 67.4 10.291983 1.41 45.4 2.71 -32.3 10.061984 1.69 19.9 3.36 24.0 7.901985 1.89 11.8 4.73 40.8 5.981986 2.50 32.3 4.96 4.9 7.591987 2.60 4.0 1.45 0.84 5.16 4.0 7.001988 3.01 15.8 1.46 0.7 0.94 11.9 3.93 -23.8 9.521989 3.42 13.6 1.64 12.3 1.08 14.9 4.41 12.2 9.711990 3.69 7.9 2.06 25.6 1.29 19.4 3.83 -13.2 4.991991 3.82 3.5 1.62 -21.4 1.49 15.5 4.46 16.4 7.231992 4.16 8.9 2.12 30.9 1.59 6.7 5.01 12.3 9.441993 4.26 2.4 1.94 -8.5 1.79 12.6 6.26 25.0 8.351994 4.60 8.0 2.47 27.3 1.99 11.2 6.33 1.1 7.381995 5.29 15.0 2.63 6.5 2.23 12.1 8.46 33.6 -7.401996 5.98 13.0 2.99 13.7 2.60 16.6 12.63 49.3 -4.871997 7.18 20.1 3.14 5.0 2.91 11.9 13.96 10.5 9.381998 8.10 12.8 4.11 30.9 3.79 30.2 19.92 42.7 6.811999 8.80 8.6 5.36 30.4 4.52 19.3 28.76 44.4 13.152000 10.56 20.0 6.28 17.2 4.87 7.7 24.71 -14.1 26.392001 9.73 -7.9 6.68 6.4 5.30 8.8 25.67 3.9 19.522002 9.93 2.1 7.97 19.3 4.66 -12.1 19.16 -25.4 28.142003 11.11 11.9 9.44 18.4 4.98 6.9 21.62 12.8 19.362004 11.23 1.1 11.52 22.0 5.78 16.1 20.32 -6.0 1.74 27.682005 12.43 10.7 12.71 10.3 6.47 11.9 24.46 20.4 3.11 35.962006 13.92 12.0 13.51 6.3 7.39 14.2 27.10 10.8 3.83 17.522007 14.92 7.2 15.78 16.8 8.05 8.9 37.67 39.0 3.37 14.072008 12.29 -17.6 20.57 30.4 7.71 -4.2 30.14 -20.0 3.60 13.662009 12.59 2.4 16.39 -20.3 7.32 -5.1 32.39 7.5 4.20 -11.972010 13.38 6.3 13.89 -15.3 7.93 8.3 26.07 -19.5 4.88 -1.422011 12.82 -4.2 15.18 9.3 8.16 2.9 30.20 15.8 6.10 -3.272012 13.89 8.3 16.01 5.5 8.92 9.3 40.13 32.9 5.84 5.002013 14.11 1.6 16.82 5.0 8.62 -3.3 40.83 1.7 7.22 -9.002014 16.22 15.0 18.25 8.5 9.74 12.9 43.79 7.2 6.83 -0.412015 17.12 5.6 20.82 14.1 10.31 5.9 39.35 -10.1 7.30 2.742016 18.21 6.4 22.03 5.8 11.05 7.2 40.56 3.1 7.12 -1.46

356 | Giving USA FoundationTM | Giving USA 2017
Giving USA Data Tables for Charts in The Numbers
Notes: All notes in the giving by recipient type (current dollar) table are applicable to this inflation-adjusted table. Giving USA uses the Consumer Price Index to calculate inflation, 2016=$100. All figures are rounded. See the “Brief summary of methods used” section of the full report for explanation of the revisions made to Giving USA data for years prior to 2016.
© 2017 Giving USA Foundation™
Contributions by type of recipient organization, 1976–2016 (in billions of inflation-adjusted dollars)
Percent change
Percent changeHealth
Percent change
Human services
Percent changeEducation
Percent changeReligion
Percent changeTotalYear
Public-society benefit
1976 134.38 5.4 59.83 4.6 15.15 6.4 17.00 -2.9 15.78 -3.4 6.24 14.51977 139.18 3.6 67.11 12.2 15.38 1.5 16.21 -4.6 15.53 -1.6 5.10 -18.31978 141.80 1.9 67.46 0.5 15.88 3.3 15.51 -4.3 15.07 -3.0 5.51 8.01979 142.75 0.7 66.79 -1.0 15.56 -2.0 14.27 -8.0 14.17 -6.0 6.03 9.41980 141.78 -0.7 64.81 -3.0 14.78 -5.0 12.97 -9.1 13.06 -7.8 6.65 10.31981 145.87 2.9 66.09 2.0 15.65 5.9 12.11 -6.6 12.22 -6.4 5.62 -15.51982 147.04 0.8 69.80 5.6 12.29 -21.5 7.16 -40.9 7.61 -37.7 7.99 42.21983 152.31 3.6 76.72 9.9 12.84 4.5 7.33 2.4 8.34 9.6 9.08 13.61984 158.38 4.0 82.10 7.0 14.71 14.6 7.71 5.2 8.94 7.2 10.81 19.11985 160.02 1.0 85.29 3.9 15.07 2.4 8.21 6.5 10.25 14.7 9.13 -15.51986 182.17 13.8 91.20 6.9 18.51 22.8 8.25 0.5 9.56 -6.7 16.76 83.61987 173.78 -4.6 91.99 0.9 17.08 -7.7 8.44 2.3 9.96 4.2 10.27 -38.71988 178.58 2.8 91.58 -0.4 17.83 4.4 9.03 7.0 11.34 13.9 10.55 2.71989 190.14 6.5 92.40 0.9 21.88 22.7 12.61 39.6 12.42 9.5 11.64 10.31990 181.03 -4.8 91.53 -0.9 21.75 -0.6 12.30 -2.5 14.25 14.7 12.06 3.61991 180.92 -0.1 88.18 -3.7 21.34 -1.9 13.23 7.6 13.46 -5.5 11.87 -1.61992 190.24 5.2 87.09 -1.2 22.58 5.8 15.62 18.1 14.56 8.2 12.22 2.91993 193.66 1.8 87.86 0.9 23.85 5.6 16.06 2.8 14.60 0.3 13.74 12.41994 194.25 0.3 91.31 3.9 22.80 -4.4 15.65 -2.6 14.53 -0.5 13.12 -4.51995 193.85 -0.2 91.45 0.2 25.94 13.8 16.80 7.3 28.22 94.2 13.80 5.21996 212.36 9.5 94.65 3.5 27.43 5.7 18.30 8.9 28.06 -0.6 14.37 4.11997 242.84 14.4 96.70 2.2 32.88 19.9 21.45 17.2 20.36 -27.4 16.79 16.81998 260.03 7.1 100.52 4.0 35.32 7.4 24.04 12.1 18.81 -7.6 18.42 9.71999 292.78 12.6 102.67 2.1 38.37 8.6 25.30 5.2 19.57 4.0 19.57 6.22000 320.30 9.4 107.32 4.5 40.18 4.7 29.00 14.6 21.34 9.0 20.92 6.92001 314.48 -1.8 108.22 0.8 38.04 -5.3 32.90 13.4 22.24 4.2 22.44 7.32002 310.71 -1.2 110.79 2.4 36.38 -4.4 30.32 -7.8 20.96 -5.8 18.99 -15.42003 309.99 -0.2 109.82 -0.9 38.63 6.2 30.67 1.2 23.21 10.7 20.84 9.72004 330.70 6.7 111.19 1.2 40.23 4.1 33.16 8.1 24.22 4.4 22.44 7.72005 359.25 8.6 111.62 0.4 42.99 6.9 37.29 12.5 24.98 3.1 25.50 13.62006 352.49 -1.9 112.65 0.9 47.70 11.0 36.60 -1.9 28.83 15.4 27.57 8.12007 360.02 2.1 113.18 0.5 49.41 3.6 36.40 -0.5 29.26 1.5 23.14 -16.12008 334.02 -7.2 109.50 -3.3 40.01 -19.0 39.51 8.5 26.91 -8.0 20.01 -13.52009 307.37 -8.0 111.36 1.7 39.11 -2.2 40.21 1.8 29.17 8.4 19.36 -3.22010 317.00 3.1 107.30 -3.6 46.45 18.8 40.46 0.6 30.45 4.4 21.13 9.12011 318.57 0.5 108.62 1.2 45.81 -1.4 39.91 -1.4 27.60 -9.4 22.79 7.92012 347.55 9.1 110.52 1.7 48.96 6.9 42.99 7.7 27.36 -0.9 23.91 4.92013 342.46 -1.5 113.72 2.9 49.50 1.1 41.67 -3.1 29.92 9.4 26.72 11.82014 370.35 8.1 117.60 3.4 53.90 8.9 43.92 5.4 31.63 5.7 27.54 3.12015 384.52 3.8 120.80 2.7 58.42 8.4 45.55 3.7 31.74 0.3 29.17 5.92016 390.05 1.4 122.94 1.8 59.77 2.3 46.80 2.7 33.14 4.4 29.89 2.5

Giving USA FoundationTM | Giving USA 2017 | 357
Giving USA Data Tables for Charts in The Numbers
Notes: All notes in the giving by recipient type (current dollar) table are applicable to this inflation-adjusted table. Giving USA uses the Consumer Price Index to calculate inflation, 2016= $100. All figures are rounded. See the “Brief summary of methods used” section of the full report for explanation of the revisions made to Giving USA data for years prior to 2016.
© 2017 Giving USA Foundation™
Contributions by type of recipient organization, 1976–2016 (in billions of inflation-adjusted dollars)
Un-allocated
Gifts to individuals
Percent change
Gifts to foundations
Percent change
Environment/animals
Percent change
International affairs
Percent change
Arts, culture, humanitiesYear
1976 6.50 -2.3 13.881977 7.27 11.8 12.581978 6.88 -5.4 5.92 9.571979 6.56 -4.7 7.32 23.6 12.051980 6.18 -5.8 5.77 -21.2 17.561981 6.02 -2.6 6.31 9.4 21.851982 2.41 -60.0 9.95 57.7 25.601983 3.40 41.1 6.53 -34.4 24.241984 3.90 14.7 7.76 18.8 18.251985 4.22 8.2 10.56 36.1 13.341986 5.47 29.6 10.85 2.7 16.621987 5.50 0.5 3.07 1.78 10.91 0.6 14.781988 6.11 11.1 2.96 -3.6 1.91 7.3 7.97 -26.9 19.31989 6.62 8.3 3.17 7.1 2.09 9.4 8.53 7.0 18.781990 6.78 2.4 3.79 19.6 2.37 13.4 7.04 -17.5 9.161991 6.74 -0.6 2.86 -24.5 2.63 11.0 7.87 11.8 12.741992 7.11 5.5 3.62 26.6 2.72 3.4 8.56 8.8 16.161993 7.08 -0.4 3.22 -11.0 2.97 9.2 10.40 21.5 13.881994 7.44 5.1 4.00 24.2 3.22 8.4 10.24 -1.5 11.941995 8.33 12.0 4.14 3.5 3.51 9.0 13.32 30.1 -11.661996 9.14 9.7 4.57 10.4 3.98 13.4 19.31 45.0 -7.451997 10.73 17.4 4.69 2.6 4.35 9.3 20.87 8.1 14.021998 11.93 11.2 6.05 29.0 5.58 28.3 29.34 40.6 10.021999 12.68 6.3 7.72 27.6 6.51 16.7 41.44 41.2 18.952000 14.73 16.2 8.76 13.5 6.79 4.3 34.46 -16.8 36.802001 13.18 -10.5 9.05 3.3 7.18 5.7 34.78 0.9 0.00 26.452002 13.26 0.6 10.64 17.6 6.22 -13.4 25.58 -26.5 0.00 37.572003 14.50 9.4 12.32 15.8 6.50 4.5 28.22 10.3 0.00 25.282004 14.27 -1.6 14.64 18.8 7.34 12.9 25.82 -8.5 2.21 35.182005 15.27 7.0 15.61 6.6 7.95 8.3 30.05 16.4 3.82 44.172006 16.57 8.5 16.08 3.0 8.80 10.7 32.26 7.4 4.56 20.872007 17.27 4.2 18.26 13.6 9.32 5.9 43.60 35.2 3.90 16.282008 13.70 -20.7 22.93 25.6 8.60 -7.7 33.60 -22.9 4.01 15.242009 14.08 2.8 18.33 -20.1 8.19 -4.8 36.23 7.8 4.70 -13.372010 14.72 4.5 15.28 -16.6 8.72 6.5 28.68 -20.8 5.37 -1.562011 13.68 -7.1 16.20 6.0 8.71 -0.1 32.23 12.4 6.51 -3.492012 14.51 6.1 16.73 3.3 9.32 7.0 41.93 30.1 6.10 5.222013 14.53 0.1 17.32 3.5 8.88 -4.7 42.05 0.3 7.44 -9.292014 16.45 13.2 18.51 6.9 9.88 11.3 44.41 5.6 6.93 -0.422015 17.33 5.3 21.07 13.8 10.44 5.7 39.83 -10.3 7.39 2.782016 18.21 5.1 22.03 4.6 11.05 5.8 40.56 1.8 7.12 -1.46

358 | Giving USA FoundationTM | Giving USA 2017
Giving USA Data Tables for Charts in The Numbers
Notes: GDP data from: “National Data, GDP and Personal Income,” Bureau of Economic Analysis, U.S. Department of Commerce, retrieved April 2017, http://www.bea.gov/iTable/index_nipa.cfm. Giving USA uses the Consumer Price Index to calculate inflation, 2016 = $100. All figures are rounded. See the “Brief summary of methods used” section of the full report for explanation of the revisions made to Giving USA data for years prior to 2016.
© 2017 Giving USA Foundation™
Giving as a percentage of gross domestic product (GDP), 1976–2016 (in billions of inflation-adjusted dollars)
Giving as a percentage of GDPGDPTotal givingYear
1976 134.38 7,924 1.71977 139.18 8,245 1.71978 141.80 8,665 1.61979 142.75 8,715 1.61980 141.78 8,347 1.71981 145.87 8,472 1.71982 147.04 8,321 1.81983 152.31 8,766 1.71984 158.38 9,333 1.71985 160.02 9,703 1.61986 182.17 10,044 1.81987 173.78 10,296 1.71988 178.58 10,655 1.71989 190.14 10,944 1.71990 181.03 10,993 1.61991 180.92 10,889 1.71992 190.24 11,178 1.71993 193.66 11,427 1.71994 194.25 11,827 1.61995 193.85 12,069 1.61996 212.36 12,385 1.71997 242.84 12,869 1.91998 260.03 13,386 1.91999 292.78 13,928 2.12000 320.30 14,345 2.22001 314.48 14,393 2.22002 310.71 14,657 2.12003 309.99 15,027 2.12004 330.70 15,597 2.12005 359.25 16,086 2.22006 352.49 16,495 2.12007 360.02 16,757 2.12008 334.02 16,409 2.02009 307.37 16,129 1.92010 317.00 16,462 1.92011 318.57 16,561 1.92012 347.55 16,881 2.12013 342.46 17,191 2.02014 370.35 17,640 2.12015 384.52 18,256 2.12016 390.05 18,569 2.1

Giving USA FoundationTM | Giving USA 2017 | 359
Giving USA Data Tables for Charts in The Numbers
Notes: Disposable personal income data from: Personal Income and Its Disposition, Table 2.1, data retrieved April 2017 from www.bea.gov. All figures are rounded. See the “Brief summary of methods used” section of the full report for explanation of the revisions made to Giving USA data for years prior to 2016.
© 2017 Giving USA Foundation™
Individual giving as a percentage of disposable personal income (DPI), 1976–2016 (in billions of current dollars)
Giving as a percentage of DPI
DPIIndividual givingYear
1976 26.32 1,302.30 2.01977 29.55 1,435.00 2.11978 32.10 1,607.30 2.01979 36.59 1,790.90 2.01980 40.71 2,002.70 2.01981 45.99 2,237.10 2.11982 47.63 2,412.70 2.01983 52.06 2,599.80 2.01984 56.46 2,891.50 2.01985 57.39 3,079.30 1.91986 67.09 3,258.80 2.11987 64.53 3,435.30 1.91988 69.98 3,726.30 1.91989 79.45 3,991.40 2.01990 79.00 4,254.00 1.91991 81.93 4,444.90 1.81992 87.20 4,736.70 1.81993 91.72 4,921.60 1.91994 92.28 5,184.30 1.81995 94.78 5,457.00 1.71996 107.35 5,759.60 1.91997 123.67 6,074.60 2.01998 137.68 6,498.90 2.11999 154.63 6,803.30 2.32000 174.09 7,327.20 2.42001 173.06 7,648.50 2.32002 173.79 8,009.70 2.22003 181.47 8,485.80 2.12004 201.96 9,002.30 2.22005 220.82 9,400.80 2.32006 224.76 10,036.90 2.22007 233.05 10,507.00 2.22008 213.76 10,994.40 1.92009 200.78 10,942.50 1.82010 207.99 11,237.90 1.92011 213.91 11,801.40 1.82012 244.38 12,403.70 2.02013 242.44 12,395.80 2.02014 261.09 13,022.70 2.02015 271.33 13,519.80 2.02016 281.86 14,045.90 2.0

360 | Giving USA FoundationTM | Giving USA 2017
Giving USA Data Tables for Charts in The Numbers
Notes: Corporate pre-tax profits data from: “Corporate Profits Before Tax by Industry,” Bureau of Economic Analysis, U.S. Department of Commerce, Table 6.17D, retrieved April 2017 from http://www.bea.gov/iTable/index_nipa.cfm. All figures are rounded. See the “Brief summary of methods used” section of the full report for explanation of the revisions made to Giving USA data for years prior to 2016.
© 2017 Giving USA Foundation™
Corporate giving as a percentage of pre-tax corporate profits, 1976–2016 (in billions of current dollars)
Giving as a percentageof corporate pre-tax profits
Corporatepre-tax profitsCorporate givingYear
1976 1.33 180 0.71977 1.54 211 0.71978 1.70 246 0.71979 2.05 272 0.81980 2.25 254 0.91981 2.64 244 1.11982 3.11 199 1.61983 3.67 234 1.61984 4.13 269 1.51985 4.63 257 1.81986 5.03 246 2.01987 5.21 323 1.61988 5.34 390 1.41989 5.46 390 1.41990 5.46 412 1.31991 5.25 425 1.21992 5.91 474 1.21993 6.47 519 1.21994 6.98 599 1.21995 7.35 684 1.11996 7.51 741 1.01997 8.62 802 1.11998 8.46 723 1.21999 10.23 781 1.32000 10.74 772 1.42001 11.66 713 1.62002 10.79 789 1.42003 11.06 969 1.12004 11.36 1,255 0.92005 15.20 1,653 0.92006 14.52 1,851 0.82007 14.22 1,748 0.82008 12.40 1,382 0.92009 13.79 1,473 0.92010 15.82 1,841 0.92011 15.58 1,807 0.92012 17.22 2,131 0.82013 15.86 2,156 0.72014 18.07 2,263 0.82015 17.92 2,138 0.82016 18.55 2,195 0.8

Overview of methodology for 2016 estimates
Giving USA estimates primarily rely on econometric methods developed by leading researchers in philanthropy and the nonprofit sector and are reviewed and approved by the members of the Giving USA Advisory Council on Methodology (ACM). Members of the ACM include research directors from national nonprofit organizations, as well as scholars from such disciplines as economics and public affairs, all of whom are involved in studying philanthropy and the nonprofit sector.
Giving USA FoundationTM | Giving USA 2017 | 361
19 | Brief Summaryof Methods Used
The Indiana University Lilly Family School of Philanthropy prepares all of the estimates in Giving USA for the Giving USA Foundation. Giving USA develops estimates for giving by each type of donor (sources) and for recipient organizations categorized by subsectors (uses). Most of Giving USA’s annual estimates are based on econometric analyses and tabulations of tax data, economic indicators, and demographics.
Sources of the data used in the estimates include the Internal Revenue Service (IRS), Bureau of Economic Analysis (BEA), the Philanthropy Panel Study (PPS), Council for Aid to Education (CAE), the Evangelical Council for Financial Accountability (ECFA), U.S. Census Bureau, and others. Estimates for giving by foundations are provided by Foundation Center. The methods for estimating giving to religious organizations and foundations are not based on econometric models.
Econometric models cannot capture giving related to anomalous events, like natural and man-made disasters, or very large gifts called “mega-gifts.” In these instances, Giving USA uses additional estimates for contributions given by donor type or to particular subsectors.
For the year 2016, Giving USA added estimates for mega-gifts from individual donors (or couples) and mega-bequests. The threshold amount for mega-gifts of all types was $200 million. See the “Giving by individuals” and “Giving by
bequest” sections of this summary for more information about these gifts.
Revisions for prior years Current Giving USA estimates are developed before final tax data, some economic indicators, and some demographic data are available. The estimates are revised and updated as final versions of these data become available—for example, final tax return information about itemized deductions made by individuals, corporations, and estates. Publications for these statements are released about two full years from the tax filing year.
The relationship between charitable giving and broader economic trends is less certain when people change their giving as a result of infrequent events, such as tax law changes, high mortgage foreclosure rates, extreme stock market volatility, and natural disasters. As a result, the difference between Giving USA’s initial total estimate and the revised total estimate for some years ranges outside of the norm. This is true for 2005, when contributions to support Hurricane Katrina relief efforts boosted giving significantly beyond what could have been estimated, especially since limits on charitable deductions were temporarily suspended and individuals were allowed to claim deductions into tax-year 2006 for certain types of contributions. This is also true for years that fell during the Great Recession (2007–2009), specifically the year 2009.
362 | Giving USA FoundationTM | Giving USA 2017
Giving USA Brief Summary of Methods Used

As a result, the difference between the initial and revised total estimate for that year is larger than usual, at -9.5 percent.
For 2009, the -9.5 percent difference between the initial and revised total estimates, as released in this edition, is largely attributable to the difference in the individual giving estimate, which realized a total change of 11.7 percent between Giving USA 2010 and Giving USA 2014. In 2011, Giving USA enhanced the model for estimating giving by individuals to more effectively capture itemized giving during times of economic distress. As a result of this change, the average difference between the original and revised estimates for giving by individuals for the years 2010 to 2015 as released in Giving USA editions 2011 to 2017 is 1.0 percent (or 2.2 percent in absolute terms).
By comparison, Giving USA analyzed IRS data on itemized giving by individuals for the last six years available. For the years 2009–2014, the average percentage difference between the IRS’ initial and final estimates for individual giving is 9.0 percent (and also 9.0 percent in absolute terms). The IRS tends to underestimate individual giving between its initial and revised estimates; thus, differences are usually positive. Go to www.irs.gov/taxstats for more information.
The following sections provide an overview of the methods used to develop the estimates for 2016 and prior years, beginning with the sources of giving and followed by the recipients of giving by subsector.1
Giving USA Brief Summary of Methods Used
Giving USA FoundationTM | Giving USA 2017 | 363

Estimating giving by individuals
The Giving USA estimate for giving by itemizing individuals (and households) is based on a projection that incorporates historical trends in itemized giving and changes in economic variables related to personal income and wealth. These factors include personal consumption expenditures, the Standard & Poor’s 500 Index, and personal income-tax rates. In spring 2011, Partha Deb, an econometrician at Hunter College in New York, tested Giving USA’s model for estimating giving by individuals and found that personal consumption was a more accurate predictor of giving by itemizing individuals for recent years than personal income—a variable that had been used previously.
In addition, for estimating itemized charitable giving by individuals for the years 2010 to 2016, Giving USA used a blended forecasting model to capture the most recent IRS data available, including preliminary data on itemized giving.
In the past, prior to the 2011 edition, Giving USA used only final IRS data from two years prior in the econometric model to estimate the most recent year for giving by these individuals.
To estimate non-itemized charitable giving by individuals through 2016, Giving USA used the latest dataset available from the Philanthropy Panel Study (PPS) series, which is part of a longitudinal study of more than 9,000 households who are asked, among other questions, about their charitable giving behaviors every other year. Each year, Giving USA adjusts the
364 | Giving USA FoundationTM | Giving USA 2017
Giving USA Brief Summary of Methods Used

Giving USA Brief Summary of Methods Used
Giving USA FoundationTM | Giving USA 2017 | 365
data for changes in household income and the changing number of non-itemizing households for the current year. The most recent PPS dataset available to Giving USA for the purposes of estimating individual giving in this edition was for the year 2012 (PPS 2013).2
In some years, individuals make an extraordinary number of contributions in response to particular events. In the past, these events included relief and recovery efforts following the September 11 terrorist attacks and Hurricane Katrina, among others. To ensure that Giving USA is accurately capturing giving related to relief efforts of natural and man-made disasters, estimates of these related relief efforts are added to base estimates for charitable giving that Giving USA initially creates. In 2016,
Giving USA did not identify any large gifts or donation efforts to disasters, either domestically or internationally. This does not mean that overall disaster giving did not occur in 2016.
In addition, in some years, particular individuals make very large gifts, called “mega-gifts,” to charitable organizations. Giving USA 2016 includes a conservative estimate of $1.495 billion for gifts of this magnitude that were likely paid in 2016 by individuals. These mega-gifts are added into the individual giving estimate amount for 2016, because Giving USA’s estimation model cannot capture these very large gifts otherwise. Table 1 lists these gifts, while Table 2 shows the components of the estimates for giving by individuals in 2014, 2015, and 2016.
Table 1Mega-gifts announced in 2016 and likely paid in 2016, included in the Giving USA estimate for giving by individuals in 2016
Donor(s) Amount of gift Recipient(s)
Michael Bloomberg $600 million Various organizations
Phil and Penny Knight $400 million Stanford University
Paul Allen $295 million Various organizations
Larry Ellison $200 millionUniversity of Southern California
Total $1.495 billion
Data: Maria Di Mento, “The 2017 Philanthropy 50, The Chronicle of Philanthropy, February 7, 2017, www.philanthropy.com; “Big Charitable Gifts: Where Donors Have Given $1 Million or More,” The Chronicle of Philanthropy, retrieved April 2017, www.philanthropy.com.

Estimating giving by bequest
The method for estimating contributions by bequest in 2016 includes three primary components: an estimate for bequests made by estates with assets at $5 million or more, an estimate for estates with assets between $5 million
and $1 million, and an estimate for estates with assets below $1 million.
Table 3 details the breakdown of giving by bequest from these three estate categories.
To estimate bequest giving by estates with assets of $5 million or more (what Giving USA terms as “filing estates”), Giving USA followed the procedure
366 | Giving USA FoundationTM | Giving USA 2017
Giving USA Brief Summary of Methods Used
Table 2Estimates for giving by individuals, 2014 to 2016 (in billions of dollars)*
2014
2014 itemized contributions (using IRS final data for itemized contributions in 2014) 210.60
Estimate for giving by non-itemizers (using PPS 2012 data) +50.49
Total estimated individual giving 261.09
2015
2014 itemized contributions (using IRS final data for itemized contributions in 2014) 210.60
Estimated change in itemized giving for 2015 over 2014 (using IRS preliminary data for itemized contributions in 2015) +11.02
Estimate for giving by non-itemizers (using PPS 2012 data) +49.71
Total estimated individual giving 271.33
2016
2014 itemized contributions (using IRS final data for itemized contributions in 2014) 210.60
Estimated change in itemized giving for 2015 over 2014 (using IRS preliminary data for itemized contributions in 2014) +11.02
Estimated change in itemized giving for 2016 over 2015 (using IRS preliminary data for itemized contributions in 2015) +7.36
Estimate for mega-gifts likely paid in 2016 +1.495
Estimate for giving by non-itemizers (using PPS 2012 data) +51.38
Total estimated individual giving 281.86
* Figures are rounded and may not exactly equal the total.

introduced in Giving USA 2005. This procedure uses data collected by the Council for Aid to Education (CAE) about bequests received at institutions of higher education. CAE data are incorporated into the estimate for bequest giving because it has been demonstrated that the trend in bequest giving to higher education closely follows overall charitable bequest deduction trends as reported by the IRS.
Giving USA incorporated CAE data by generating a ratio using historical amounts contributed by estates to higher education for the years 2013 to 2016, as provided by CAE, to final IRS tax data on filed charitable bequest deductions for the same years. For 2016, CAE reported to Giving USA that institutions of higher education received
$2.76 billion from estates. Giving USA took this CAE amount and divided by 0.1645 (the ratio) to get $16.75 billion (rounded).
To the $16.75 billion figure, Giving USA added an amount of $400 million for “mega-bequests,” which are very large estate gifts that are likely to have completed the estate tax filing process in
Giving USA Brief Summary of Methods Used
Giving USA FoundationTM | Giving USA 2017 | 367
Table 3Estimate for giving by bequest, 2016 (in billions of dollars)*
Council for Aid to Education (CAE) findings: bequest receipts for higher education institutions, 2015–2016 2.76
CAE result divided by 0.1645 (four-year average, 2012–2016) to yield base estimate of all giving by estates that file estate tax returns 16.75
“Mega-bequests” likely paid in 2016 +0.4
Total estimated giving by estates with assets of $5 million or more 17.15
Total estimated giving by estates with assets between $5 million and $1 million +6.53
Total estimated giving by estates with assets below $1 million +6.68
Total estimate for giving by bequest 30.36
* Figures are rounded and may not exactly equal the total. The italicized figure is not added into the total.

2016. These mega-bequests are added onto the giving by bequest estimate amount for 2016 because Giving USA’s estimation model cannot capture these very large gifts otherwise. These estates are identified by examining announced gifts reported as paid in 2016. Table 4 shows the mega-bequests added to Giving USA’s estimate for bequest giving in 2016.
Added to the total figure resulting from the CAE estimate and mega-bequests ($17.15 billion) are two estimates of contributions made by estates with assets below $5 million. The first method estimates giving by estates with assets between $1 million and $5 million, and the second method estimates giving by estates with assets below $1 million. The methods used to estimate giving by estates below the filing threshold is deliberately conservative and is likely to underestimate total charitable bequests given in any year. In the absence of firm data about bequests from estates with gross estate value below the tax filing threshold, Giving USA has adopted this conservative approach that sets a lower boundary on the estimate.
“Wealthy non-filers” represent those estates with assets between $1 and $5 million that had previously been largely captured in the filing data but no longer are, due to changes in the tax law. Using historical IRS data, it was found that these estates had represented
approximately 30 percent of the total amount in estate tax filings. Using this relationship, along with a modifier that represents the slight decline in giving due to the lack of a tax incentive,3 Giving USA now creates an estimate for wealthy non-filers for every year post-2011 in which IRS bequest information is available, as well as for the estimation year based off of the filing estate estimate. For the year 2016, this amount is $6.53 billion.
The estimate for contributions made by estates below the federal estate tax filing threshold and below $1 million in assets most heavily relies on the following information:
Number of deaths of adults ages 55 and above;
Average net worth for adults ages 55 and above;
The percentage of each group, by age, that leaves a bequest (4.7 percent is standard); and
The average percentage of net estate value left to charity by adults ages 55 and above for those estates with less than $1 million in assets
Giving USA estimates that non-wealthy, non-filing estates made $6.68 billion in charitable bequests in 2016. Added together, estates with assets below $5 million made an estimated $13.21 billion in charitable bequests in 2016.
368 | Giving USA FoundationTM | Giving USA 2017
Giving USA Brief Summary of Methods Used

Estimating giving by foundations
Giving by foundations data for 2016 are provided to Giving USA by Foundation Center for giving by independent, community, and operating foundations.4 Foundation Center also provides estimates for giving by corporate foundations. That component is moved from Foundation Center’s estimate of giving by all types of foundations and is calculated in the Giving USA estimate for giving by corporations.
Go to www.foundationcenter.org for more information about Foundation Center’s estimates for giving by foundations in 2016 and prior years.
Estimating giving by corporations
The estimate for giving by corporations in 2016 is based on the most recent data available for itemized contributions
claimed by companies on federal tax returns for years 2013 and prior. For estimating corporate giving in 2016, Giving USA:
Uses an econometric model developed by Chin, Brown, and Rooney in 2004.5 This model relies on final IRS corporate income and tax data for the year 2013 and economic variables, including the S&P 500 index and Gross Domestic Product (GDP);
An estimated amount of change in charitable contributions for 2013–2014, 2014–2015, and 2015–2016, based on the model using the latest data available on changes in corporate pretax profits, the GDP, and the consumer price index, all available from the Bureau of Economic Analysis.
The 2016 estimate for giving by corporations involves one additional year of prediction than is typically done by Giving
Giving USA Brief Summary of Methods Used
Giving USA FoundationTM | Giving USA 2017 | 369
Table 4Mega-bequests announced as paid in 2016, included in the Giving USA bequest estimate for 2016
Estate Amount Recipient(s)
Lottie and Howard Marcus $400 million American Associates, Ben-Gurion
University of the Negev
Total $400 million
Data: Maria Di Mento, “The 2017 Philanthropy 50, The Chronicle of Philanthropy, February 7, 2017, www.philanthropy.com; “Big Charitable Gifts: Where Donors Have Given $1 Million or More,” The Chronicle of Philanthropy, retrieved April 2017, www.philanthropy.com

USA. In previous years, final IRS corporate income and tax data was available in early March, but due to new requirements surrounding IRS disclosure avoidance rules, this release has been delayed.
Foundation Center estimates corporate foundation grantmaking to be $5.53 billion in 2016. From that amount, Giving USA subtracted $5.28 billion for the estimated amount that corporations gave to their own foundations in 2016.
For the year 2015, Giving USA added an estimate of $22.74 million for corporate contributions made to support Nepal earthquake relief efforts.6 This is a conservative estimate for corporate giving for disaster-relief purposes in 2015. In 2016, there was no disaster-related giving adjustment needed.
Table 5 illustrates components of the estimate for giving by corporations for 2013, 2014, 2015, and 2016.
370 | Giving USA FoundationTM | Giving USA 2017
Giving USA Brief Summary of Methods Used

Giving USA Brief Summary of Methods Used
Giving USA FoundationTM | Giving USA 2017 | 371
Table 5Estimates for giving by corporations, 2013 to 2016 (in billions of dollars)
2013
2013 itemized deductions for charitable contributions (IRS) 16.67
Less gifts to foundations in 2013 (FC*) -6.19
Plus corporate foundation grants made (FC*) +5.38
Estimated total 15.86
2014
2013 itemized deductions for charitable contributions (IRS) 16.67
Estimated change in corporate giving, 2014 +0.883
Sub-total before adjustments for foundations 17.56
Less gifts to foundations in 2014 (FC*) -4.64
Plus corporate foundation grants made (FC*) +5.15
Estimated total 18.07
2015
2013 itemized deductions for charitable contributions (IRS) 16.67
Estimated change in corporate giving in 2014 +0.883
Estimated change in corporate giving in 2015 -0.153
Sub-total before adjustments for foundations 17.40
Less gifts to foundations in 2015^ -5.01
Plus corporate disaster giving +0.02
Plus corporate foundation grants made (FC*) +5.51
Estimated total 17.92
2016
2013 itemized deductions for charitable contributions (IRS) 16.67
Estimated change in corporate giving in 2014 +0.883
Estimated change in corporate giving in 2015 -0.153
Estimated change in corporate giving in 2016 +0.898
Sub-total before adjustments for foundations 18.30
Less gifts to foundations in 2016^ -5.28
Plus corporate foundation grants made (FC*) +5.53
Estimated total 18.55
Data sources are in parentheses.* Updated figures provided by Foundation Center (FC) in April 2017.^ Calculated this year by taking the three-year rolling average of gifts to corporate foundations from their corporate affiliates.Note: Figures are rounded in the report.

Estimating giving to recipient organizations
Giving USA relies on data provided by other research organizations for components of the estimates for giving by type of recipient, which include organizations in the religion; education; human services; health; arts, culture, and humanities; environment/animals; public-society benefit; and international affairs subsectors, as well as for giving to foundations.
The following sections briefly describe the data sources and methods used for developing estimates for recipient subsectors.
Estimating giving to the religion subsector
The estimate for giving to religious organizations relies on the following data:
A baseline estimate developed in 1986 and tested in 2005 of $50 billion in contributions to religious organizations;7 and
A percentage change in giving to religious organizations developed by collecting amounts given to congregations and other types of religious organizations as reported by members of the Evangelical Council for Financial Accountability (ECFA).8
Methodology for estimating giving to religion for prior yearsIn this edition, Giving USA updated its estimate for giving to religion based on its receipt of 2015 fiscal year data from the ECFA. For the year 2015, Giving USA estimates that giving to religion amounted to $119.35 billion, an increase of 2.9 percent over 2014 (in current dollars).9
Methodology for estimating giving to religion in 2016Because denominational contribution data are typically released a year or more after Giving USA releases its initial estimates for giving by subsector, for the current year’s estimate of giving to religious organizations, Giving USA used the average inflation-adjusted rate of change for giving by these organizations for the last three years for which data are available: 2013 to 2015. In inflated dollars, the three-year average is an increase of 3.0 percent.
This figure is applied as the rate of change for current dollar giving to religion between 2015 and 2016, which results in $122.94 billion to religious organizations for 2016. The inflation-adjusted change in giving becomes 3.0 percent for 2016.
372 | Giving USA FoundationTM | Giving USA 2017
Giving USA Brief Summary of Methods Used

Estimating giving to foundations
Historically, Giving USA relied solely on Foundation Center’s final data on giving to foundations for its estimate. While Giving USA continues to use Foundation Center’s data for giving to foundations, since 2005, Giving USA has made adjustments for the following items:
Adjusting for Warren Buffett’s gifts to the Bill & Melinda Gates Foundation, which began in 2006. Giving USA’s Advisory Council on Methodology agreed to adjust for these gifts because they are quickly distributed to nonprofit organizations across the charitable subsectors;
Adding in mega-gifts made to foundations in particular years; and
Adjusting for pharmaceutical donations to operating foundations that are then redistributed to Patient Assistance Programs that provide individuals with medications.
Table 6 shows giving to foundation estimates for the years 2011 to 2015, including a breakdown of Foundation Center’s original estimates and Giving USA’s adjustments.
Giving USA Brief Summary of Methods Used
Giving USA FoundationTM | Giving USA 2017 | 373
Table 6Calculations for giving to foundations, 2011 to 2015 (in billions of dollars)
Foundation Center data for giving to foundations
Estimated pharmaceutical
gifts
Verified Warren
Buffett gifts to the Bill &
Melinda Gates Foundation
Final calculation
2011 37.80 -6.10^ -1.50 =30.20
2012 47.49 -5.84 ^ -1.52 =40.13
2013 50.05 -7.22^ -2.00 =40.83
2014 53.43 -6.83^ -2.81 =43.79
2015 48.15 -7.30^ -2.84 =39.35
^ This is based on verified Forms 990 contributions paid out to individuals via 10 top patient assistance programs (PAPs) for 2011–2015. These figures are a very conservative estimate for overall giving to PAPs for these years. Italicized figures were updated this year.

Methodology for estimating giving to foundations in 2016Giving USA estimates that giving to foundations totaled $40.56 billion in 2016. Because Foundation Center data for giving to foundations in 2016 will not be available until 2018, Giving USA created the 2016 estimate by incorporating the following steps:
Calculating an estimate for giving to all foundations in 2016 by averaging the last three years of data provided by Foundation Center. This amount equals $50.54 billion;
Calculating an estimate for giving by pharmaceutical companies’ operating foundations to Patient Assistance Programs that are then passed on to individuals. This amount equals $7.12 billion, which was then subtracted from the estimated $50.54 billion given to foundations (as noted above); and
Subtracting the verified amount in contributions made by Warren Buffett to the Bill & Melinda Gates Foundation in 2016. This contribution totaled $2.87 billion.
It should be noted that in prior years, Giving USA’s estimate for giving to foundations included adjustments for mega-gifts to foundations; in 2016, no gifts greater than $200 million were paid out to foundations.
Estimating giving to other subsectors
For estimating charitable contributions to all recipient subsectors other than religion and foundations, Giving USA relies upon data provided by the Internal Revenue Service (IRS) and DataLake, LLC, a nonprofit analytics firm.10 This dataset tabulates charitable contributions made to nonprofit organizations within each subsector. The data are based on organizations’ Forms 990 and 990-EZ.
Periodically, the IRS refines its dataset provided to Giving USA to ensure accurate categorization of organizations across the subsectors. This is because charities can “move” from one subsector to another over time, following the National Taxonomy of Exempt Entities (NTEE) coding system. For 2015, Giving USA received a dataset from the IRS for tax years 1992 to 2012, including data for non-itemizing organizations. Estimates for the years 1992 to 2013 are final data from the IRS, and the years 2014 to 2016 are derived from Giving USA’s econometric model for estimating giving to these organizations, as described below.11 See the NTEE code section of this report for more detail about how charities are organized by the IRS.
The econometric process that Giving USA uses incorporates historical trends in charitable giving to organizations (as provided by the IRS) and changes in
374 | Giving USA FoundationTM | Giving USA 2017
Giving USA Brief Summary of Methods Used

economic variables. The model predicts the dollar amount of change in giving to each subsector for 2014 through 2016 by incorporating inflation-adjusted changes in:
The Standard & Poor’s 500 Index; Personal income; Total giving two years ago (lagged); and Contributions to the same subsector
one year earlier (lagged).
The model was developed and tested by Partha Deb, an econometrician and a specialist in time-series forecasting. This model was first implemented with Giving USA 2008.
In some years, Giving USA incorporates additional amounts to the estimated totals for giving within particular subsectors to capture contributions given under unusual circumstances or
for gifts that are exceptionally large.
For 2014 education giving, Giving USA added $213 million for a mega-gift likely paid that year.
For the year 2015, Giving USA added the following amounts to the charitable subsector estimates for donors’ support of the Nepalese earthquake disaster-relief efforts: $71 million to human services organizations and $92 million to international affairs organizations.12 Giving USA also added $1.93 billion to the 2015 education estimate for mega-gifts likely paid in 2015.
For 2016, Giving USA added $1.0 billion to the estimate for giving to education, reflecting gifts likely paid in 2016.13 These gifts were in the amount of $200 million or more and are reflected in the lists of mega-gifts noted for estate and individual donors.
Giving USA Brief Summary of Methods Used
Giving USA FoundationTM | Giving USA 2017 | 375
Common questions
Below are summary responses to common questions about Giving USA estimates and data.
What is excluded from Giving USA estimates?
Giving USA researchers develop estimates for philanthropic giving to charitable organizations located in the United States. Giving USA does not estimate all forms of revenue to non- profit organizations. Among the types of revenue not included in Giving USA are allocations to nonprofit organizations from other charitable organizations, such as United Ways or communal funds; fees for services; payments that are not tax deductible as gifts; gross proceeds from special events; government grants; and membership dues.
Why can’t all giving be allocated to a recipient?
Each year, a portion of total charitable receipts reported by Giving USA is labeled as “unallocated,” meaning that Giving USA cannot attribute all giving to a subsector. Below are reasons why unallocated giving occurs:
All Giving USA figures are estimates. Giving USA estimates giving for years when final tax, economic, or demographic data are not yet available.
Estimates done in different ways should not match. It is not expected that the estimate for giving by source will exactly match the estimate for giving to recipients. Government agencies, such as those that release GDP figures, also acknowledge differences between estimates developed using one method and those developed using a different method.
Nonprofits formed after 2011 are not included in the IRS Forms 990 and 990-EZ values used by Giving USA in this edition. In order to have a complete record that represents the nonprofit sector, Giving USA used data from the year 2010 and adjusted for the increase in the number of organizations formed since that time.
Gifts made to government agencies are charitable contributions but are not tracked in Giving USA’s estimates.
Giving USA does not track charitable gifts received by government agencies, such as school districts (with one exception noted in the following bullet point); parks and recreation departments; civic improvement programs; state institutions of higher education; and public libraries. There is no single national list of public organizations that receive gifts. They cannot be identified and surveyed.
376 | Giving USA FoundationTM | Giving USA 2017
Giving USA Brief Summary of Methods Used

Donations to school districts, especially by foundations, have grown significantly in recent years. Giving USA sometimes includes large publicly reported gifts ($1 million or more) to public schools to supplement the estimate for giving to education and to balance gifts made on the source’s side of the estimates. Other donations to public schools, such as school fundraisers, are not included.
Foundation grants paid to organizations in other countries that are not registered as charities in the United States appear on the sources side of the estimates but are not tracked by type of recipient. In 2010, grantmaking to organizations located overseas comprised 36 percent of all international grantmaking (in terms of dollars), according to Foundation Center.
A gift made during the calendar year may not appear in a fiscal year by a charity filing an IRS Forms 990 or 990-EZ. Giving USA uses the data that charities report as the basis for the estimates. Therefore, if a charity reports on a fiscal year rather than a calendar year, total annual charitable contributions for that organizations will not correspond with donors’ receipts, which are reported to the IRS on a calendar-year basis.
Some donors make arrangements for significant deferred charitable gifts without telling the nonprofit. For
instance, a donor can create a trust through a financial institution and take the allowed deduction, subject to IRS rules for valuing such gifts. Unless the donor informs the nonprofit organization that will ultimately receive some of the trust’s proceeds, the nonprofit is unaware of the gift and does not report it as revenue.
A donor might claim a different amount for a deduction than the recipient charity records as a receipt. This discrepancy can occur for an in-kind gift in which the donor claims fair market value and the charity reports as charitable revenue the amount it received from the sale of the item (or some other value based on a different scale than the one the donor used).
Why does Giving USA make revisions?
Giving USA’s results are a series of estimates that primarily rely on econometric methodologies and are not a tabulation of actual charitable receipts from the prior year. The estimates are revised as additional information, such as final charitable receipts, becomes available. Government agencies, including the IRS, the Bureau of Economic Analysis, and many others, routinely issue preliminary estimates that are revised as more data are obtained and analyzed. Giving USA uses this updated information in the estimation models for estimating both sources of giving and uses of giving each year.
Giving USA Brief Summary of Methods Used
Giving USA FoundationTM | Giving USA 2017 | 377

References1 For more information on the original model, see: Partha
Deb, Mark Wilhelm, Patrick Rooney, and Melissa Brown, “Estimating Charitable Deductions in Giving USA,” Nonprofit and Voluntary Sector Quarterly, December 4, 2003, 548–567
2 At the time of publication, the newest wave of the Philanthropy Panel Study, examining household giving in 2014, was published. This new metric will be used in future editions of Giving USA.
3 David Joulfaian, “Estate Taxes and Charitable Bequests by the Wealthy,” Working Paper 7663, National Bureau of Economic Research, April 2000, www.nber.org
4 Data on giving by and to foundations are available in Foundation Center’s Key Facts on U.S. Foundations reports, available at Foundation Center’s website at www.foundationcenter.org
5 A more technical explanation of the Giving USA estimating procedure for giving by corporations appears in a paper written in 2004 by William Chin, Melissa Brown, and Patrick Rooney, which is available at www.philanthropy.iupui.edu/research
6 This estimate was based on data gathered by the Indiana University Lilly Family School of Philanthropy using a number of sources, including websites of charitable organizations providing relief services, news reports, and other research institutions. For more information, contact the school or go to www.philanthropy.iupui.edu
7 An examination of Giving USA’s estimate for giving to the religion subsector, compared with estimates developed using two other methods, appears in the paper, “Reconciling Estimates of Religious Giving,” written in 2005 by J.C. Harris, Melissa Brown, and Patrick Rooney. The three methods yield estimates within 5 percent of one another, offering some reassurance that using 1986 findings as a baseline is at least as good as some other approaches.
8 Data about Evangelical Council for Financial Accountability (ECFA) members’ charitable receipts were obtained directly from ECFA in March 2017. Giving USA only uses religious organizations in its dataset that can be categorized as “X” according to the NTEE coding system.
9 Same as note 8.10 These data, provided by DataLake, LLC, are based on
the Internal Revenue Service’s Statistics of Income (SOI) dataset through tax year 2013, which incorporates data from organizations’ Forms 990 and 990-EZ. Giving USA and DataLake, LLC, collaborate each year to adjust the SOI dataset, as necessary, to capture the most accurate data for estimating giving across the subsectors using Giving USA’s econometric model.
11 Estimates for years prior to 1992 were established using different methodologies, including surveys.
12 Same as note 6.
13 Maria Di Mento, “The 2017 Philanthropy 50, The Chronicle of Philanthropy, February 7, 2017, www.philanthropy.com; “Big Charitable Gifts: Where Donors Have Given $1 Million or More,” The Chronicle of Philanthropy, retrieved April 2017, www.philanthropy.com
378 | Giving USA FoundationTM | Giving USA 2017
Giving USA Brief Summary of Methods Used

20 | Glossary
Giving USA FoundationTM | Giving USA 2017 | 379
Charitable bequest: A gift to one or more nonprofit organizations included in one’s will and disbursed after death. These gifts are tax-deductible.
Charitable revenue: Philanthropic gifts received by a charitable organization. These gifts include cash, securities, and gifts of property and other in-kind donations.
Charity or charitable organization: For Giving USA purposes, an entity recognized as tax-exempt under section 501(c)(3) of the Internal Revenue Code. Charitable organizations are exempt from federal income taxes because of their religious, educational, scientific, or public purpose. They are eligible to receive tax-deductible gifts. See also Private foundation, Public charity.
Direct public support: Used on Form 990, line 1a, up until the year 2007, this term referred to an organization’s charitable revenue. Although no longer on the form, this term is still used to refer to this type of revenue. Organizations now report this information in Part VIII, line 1f, of the form.
Donor-advised fund: An account by which donors may provide charitable gifts. This type of account is facilitated by community foundations or financial services companies. Donors typically contribute large amounts in the form of tax-deductible assets to these accounts in order to grow the assets, and donors usually choose to have significant control over the funds and direct which nonprofits will be recipients of the gifts.
Foundation: A type of organization set up as a trust or corporation for the primary purpose of grantmaking to other nonprofit organizations and individuals. These organizations can be private or public. Private foundations are funded by single entities, whereas public grantmaking charities are funded by many, such as individuals, foundations, and government agencies. These organizations are classified within the public-society benefit subsector by the National Center for Charitable Statistics (NCCS) under the NTEE code “T” and include private/independent, corporate, and operating types, as well as public types. Giving USA analyzes giving to

380 | Giving USA FoundationTM | Giving USA 2017
Giving USA Glossary
foundations separately from other public-society benefit organizations. See also Charity or charitable organization, Private foundation, Public charity.
Gift: Transfer of cash, property, or other asset by an individual, corporation, estate, or foundation. Gifts do not include government grants or contracts.
Indirect public support: Used on Form 990, line 1b, up until the year 2007, this term referred to an organization’s revenue received from another nonprofit, a federated fund, a donor-advised fund, or another type of transfer. Organizations now separately report this information in Part VIII, lines 1a, 1c, and 1d, on the form.
IRS Form 990: An annual return filed with the Internal Revenue Service by nonprofit, tax-exempt organizations (even those that are not charities) with gross annual receipts of $25,000 or more. Organizations with gross annual receipts between $25,000 and $100,000 and assets less than $250,000 may submit Form 990-EZ, the “short form.” Beginning in October 2010, organizations with less than $25,000 in gross annual receipts are now required to file Form 990-N, or risk losing tax-exempt status. Private foundations are required to file Form 990-PF, with additional information required.
Mega-bequest or mega-gift: A gift large enough to affect the rounded change in total giving by about one percentage point from one year to the next in Giving USA’s estimates. The threshold for mega-gifts in the 2017 edition is $200 million and only includes gifts that were likely paid in 2016.
National Taxonomy of Exempt Entities (NTEE): A definitive classification system developed by the National Center for Charitable Statistics (NCCS) for organizing nonprofit organizations according to tax-exempt purpose. The NTEE classification system is also used by the IRS to recognize tax-exempt status. See the “Summary of the NTEE” in this report for a listing of the 26 major groups (named by letters of the alphabet) and examples of organizations within each group. Major groups are clustered into 10 subsectors as follows. See also Subsector.
Subsector Major groups
Arts, culture, & humanities AEducation BEnvironment/animals C, D Health E, F, G, HHuman services I, J, K, L, M, N, O, P International affairs Q Public-society benefit R, S, T, U, V, WReligion XMutual/membership benefit* YUnknown, unclassified Z
*This subsector is not tracked by Giving USA

Giving USA Glossary
Giving USA FoundationTM | Giving USA 2017 | 381
Nonprofit organization: An organization in which net revenue is not distributed to individuals or other stakeholders, but is used to further the organization’s mission. The organization is not owned, but rather is governed by a board of trustees. Not all nonprofit organizations are charities.
Nonprofit sector: A sector of the economy, apart from the government, for which profit is not a motive. Organizations may be exempt from federal, state, and local taxes. Includes houses of worship; charitable organizations formed under section 501(c)(3) of the Internal Revenue Code; and organizations formed under other sections of the Code, such as advocacy organizations, membership organizations, and others.
NTEE: See National Taxonomy of Exempt Entities.
Planned gift: According to the Association of Fundraising Professionals, a planned gift is structured and integrates personal, financial, and estate-planning goals with the donor’s lifetime or testamentary (will) giving. Planned giving vehicles include bequests, charitable trusts, charitable annuities, and other types.
Private foundation: Private foundation status is granted to an organization formed for a charitable purpose under section 501(c)(3) of the Internal Revenue Code that does not receive
one-third or more of its support from public donations. Most, but not all, private foundations give grants to public charities. See also Charity or charitable organization, Public charity.
Public charity: An organization that qualifies for such status under Section 509(a) of the Internal Revenue Code. Public charities include tax-exempt organizations formed for certain purposes (a church; an educational organization, including public schools; a hospital or medical research facility; or an endowment operated for the benefit of a higher education institution). An organization formed for other purposes can also be a public charity if it receives a substantial part of its support from the general public. Support from a governmental unit is considered public support by proxy via taxes. Complete information about public charities can be found in IRS Publication 557. Note that some, but not all, charitable organizations formed under section 501(c)(3) are public charities. See also Charity or charitable organization, Private foundation.
Public support: Used on Form 990, line 1d, up until the year 2007, this term referred to an organization’s revenue received indirectly (transfers from other organizations) and/or directly (charitable donations or grants). Organizations now separately report this information in Part VIII, line 1e, on the form.

382 | Giving USA FoundationTM | Giving USA 2017
Giving USA Glossary
Reporting organization: A charitable organization that files an IRS Form 990.
Sector: The portion of the national economy that fits certain criteria for ownership and distribution of funds, goods, and services. Examples include the business sector, the government sector, and the nonprofit sector. See also Subsector.
Subsector: A subset of organizations within the nonprofit sector that serves related purposes. See also National Taxonomy of Exempt Entities, Sector.
Tax-deductible: A contribution to an organization is deductible for income-
tax purposes if the organization is a church or is registered with and recognized by the IRS as a tax-exempt, nonprofit charity.
Tax-exempt: An organization may be exempt because it is a church or because of registration within a state or with the Internal Revenue Service. State exemptions may cover sales tax, property tax, and/or state income tax. Approved registration with the IRS will exempt an organization from federal income tax. Organizations that have more than $5,000 in annual gross revenue are legally responsible for registering with the IRS on a yearly basis.

21 |
Giving USA FoundationTM | Giving USA 2017 | 383
Alliance for Nonprofit Management 1732 First Avenue #28522New York, NY 10128888.776.2434www.allianceonline.org
American Alliance of Museums (AAM) 2451 Crystal Drive, Suite 1005Arlington, VA 22202202.289.1818www.aam-us.org
American Council on Education (ACE) One Dupont Circle NWWashington, DC 20036202.939.9300www.acenet.edu
Americans for the Arts1000 Vermont Avenue, NW, Sixth FloorWashington, DC 20005202.371.2830www.americansforthearts.org
Arabella Advisors1201 Connecticut Avenue NW, Suite 300Washington, DC 20036202.595.1020www.arabellaadvisors.com
Association for Healthcare Philanthropy (AHP)313 Park Avenue, Suite 400Falls Church, VA 22046703.532.6243www.ahp.org
Association for Research on Nonprofit Organizations and Voluntary Action (ARNOVA) 441 W. Michigan St.Indianapolis, IN 46202317.684.2120www.arnova.org
Association of Art Museum Directors (AAMD)120 E. 56th Street, Suite 520New York, NY 10022212.754.8084www.aamd.org
Sources ofPhilanthropicInformation
Giving USA is grateful for information from other organizations. The following resource guide is intended to assist users of Giving USA who want to expand their search for data or information. The list is in alphabetical order by organization name and includes organizations’ contact information and website addresses.
This list is not exhaustive of all entities that provide resources on charitable giving and nonprofits. Rather, the list includes sources of reports and data the researchers of Giving USA have consulted in producing Giving USA this year and in the past.

384 | Giving USA FoundationTM | Giving USA 2017
Giving USA Sources of Philanthropic Information
Association of Fundraising Professionals (AFP)4300 Wilson Blvd, Suite 300Arlington, VA 22203703.684.0410www.afpnet.org
Association of Professional Researchers for Advancement (APRA)330 N. Wabash Avenue, Suite 2000Chicago, IL 60611312.321.5196www.aprahome.org
Barna GroupPO Box 1030Ventura, CA 93002805.639.0000www.barna.com
BBB Wise Giving Alliance 3033 Wilson Blvd, Suite 600Arlington, VA 22201703.276.0100www.give.org
Blackbaud, Inc.2000 Daniel Island DriveCharleston, SC 29492800.443.9441To locate Blackbaud’s research: www.blackbaud.com/nonprofit-resources
BoardSource750 Ninth Street NW, Suite 650Washington, DC 20001202.349.2541www.boardsource.org
Bureau of Economic Analysis (BEA)U.S. Department of Commerce4600 Silver Hill Rd.Washington, DC 20233301.278.9004www.bea.gov
Engage for Good63 Overlook PlaceRye, NY 10580914.921.3914www.engageforgood.com
CECP5 Hanover Square, Suite 2102New York, NY 10004212.825.1000www.cecp.co
Center for Community Change1536 U Street NWWashington, DC 20009202.339.9300www.communitychange.org
Center for Disaster Philanthropy1201 Connecticut Avenue NW, Suite 300Washington, DC 20036202.595.1026www.disasterphilanthropy.org
Center on Nonprofits and PhilanthropyThe Urban Institute2100 M Street NWWashington, DC 20037202.833.7200www.urban.org/policy-centers/center-nonprofits-and-philanthropy

Giving USA Sources of Philanthropic Information
Giving USA FoundationTM | Giving USA 2017 | 385
Charities Aid Foundation25 Kings Hill AvenueKings Hill, West MallingKent ME 19 4TAEngland 011.44.03000.123.000www.cafonline.org CharityChannel LLC424 Church Street, Suite 2000Nashville, TN 37219949.589.5938www.charitychannel.com
The Chronicle of Philanthropy1255 23rd Street NW, Seventh Floor Washington, DC 20037202.466.1200www.philanthropy.com
CIVICUS: World Alliancefor Citizen Participation1775 Eye Street NW, Suite 1150Washington, DC 20006www.civicus.org
The Columbus Foundation1234 E. Broad StreetColumbus, OH 43205614.251.4000www.columbusfoundation.org
The Communications Network718 Seventh Street NW, Second Floor Washington, DC 20001202.909.1214www.comnetwork.org
Cone Communications855 Boylston StreetBoston, MA 02116617.227.2111www.conecomm.com
The Conference Board845 Third AvenueNew York, NY 10022212.759.0900www.conference-board.org The Conference Board EuropeChaussée de La Hulpe 178, Sixth Floor B-1170 BrusselsBelgium 011.32.2.675.5405www.conference-board.org/regions/europe
The Conference Board of Canada 255 Smyth RoadOttawa, Ontario, K1H 8M7 Canada1.613.526.3280www.conferenceboard.ca
Connected to Give1801 Avenue of the Stars, Suite 210Los Angeles, CA 90067310.424.3670www.connectedtogive.org
Corporation for National & Community Service (CNCS)1201 New York Avenue NWWashington, DC 20525202.606.5000www.nationalservice.gov
Corporation for Public Broadcasting (CPB)401 Ninth Street NWWashington, DC 20004202.879.9600www.cpb.org

386 | Giving USA FoundationTM | Giving USA 2017
Giving USA Sources of Philanthropic Information
Council for Advancement and Support of Education (CASE)1307 New York Avenue NW, Suite 1000 Washington, DC 20005202.328.2273To locate CASE publications: http://www.case.org/Publications_and_ Products.html Council for Aid to Education (CAE)215 Lexington Avenue, Floor 16New York, NY 10016212.661.5800www.cae.org Council on Foundations2121 Crystal Drive, Suite 700Arlington, VA 22202703.879.0600www.cof.org CQ - Roll Call, Inc.1625 Eye Street, NW, Suite 200Washington, DC 20006202.650.6500www.cqrollcall.com Dance/USA1029 Vermont Avenue NW, Suite 400Washington, DC 20005202.833.1717www.danceusa.org DataLake, LLCNonprofit Researchwww.datalake.net
DMA Nonprofit Federation225 Reinekers Lane, Suite 325Alexandria, VA 22314 www.nonprofitfederation.org
European Foundation Centre (EFC)Rue Royale 941000 Brussels, Belgium 011.32.2.512.8938www.efc.be
Evangelical Council for Financial Accountability (ECFA)440 W. Jubal Early Drive, Suite 100 Winchester, VA 22601540.535.0103www.ecfa.org Forbes Insights, Forbes Media499 Washington BlvdJersey City, NJ 07310800.295.0893www.forbes.com/forbesinsights
Foundation Center32 Old Slip, 24th FloorNew York, NY 10005212.620.4230www.foundationcenter.org
Foundation Source55 Walls Drive, Suite 302Fairfield, CT 06824800.839.0054www.foundationsource.com
The Fund Raising School301 N. University Blvd., Suite 3000Indianapolis, IN 46202317.274.7063www.philanthropy.iupui.edu
The Giving Institute225 W. Wacker DriveChicago, IL 60606www.givinginstitute.org

Giving USA Sources of Philanthropic Information
Giving USA FoundationTM | Giving USA 2017 | 387
Grenzebach Glier and Associates401 N. Michigan Avenue, Suite 2800Chicago, IL 60611312.372.4040www.grenzebachglier.com
GuideStar: The National Database of Nonprofit Organizations4801 Courthouse Street, Suite 220Williamsburg, VA 23188www.guidestar.org HUD ExchangeU.S. Department of Housing andUrban Development451 Seventh Street SWWashington, DC 20410202.708.1112www.hudexchange.info Independent Sector1602 L Street NW, Suite 900Washington, DC 20036202.467.6100www.independentsector.org Indiana University Lilly FamilySchool of Philanthropy301 N. University Blvd., Suite 3000Indianapolis, IN 46202317.274.4200www.philanthropy.iupui.edu Intergovernmental Panel on Climate Change (IPCC)7bis Avenue de la Paix, C.P. 2300CH- 1211 Geneva 2Switzerland 011.41.22.730.8208www.ipcc.ch
Internal Revenue Service (IRS) Statistical Information Services1111 Constitution Avenue NW K-Room 4112Washington, DC 20224202.803.9285www.irs.gov(click on tax stats, facts & figures)
The International Center forNot-for-Profit Law (ICNL)1126 16th Street NW, Suite 400Washington, DC 20036202.452.8600www.icnl.org International Society for Third-Sector Research (ISTR)5801 Smith Avenue, McAuley Hall #245Baltimore, MD 21209410.735.4221www.istr.org
Jewish Federations of North America 25 Broadway, 17th FloorNew York, NY 10004 202.785.5900www.jewishfederations.org
The Kresge Foundation3215 W. Big Beaver RoadTroy, MI 48084248.643.9630www.kresge.org
Lake Institute on Faith & Giving301 University Blvd., Suite 3000Indianapolis, IN 46202317-278-8976www.philanthropy.iupui.edu/lake-institute

388 | Giving USA FoundationTM | Giving USA 2017
Giving USA Sources of Philanthropic Information
League of American Orchestras33 West 60th StreetNew York, NY 10023212.262.5161www.americanorchestras.org
LISC Institute for Comprehensive Community Development501 Seventh AvenueNew York, NY 10018212.455.9594www.instituteccd.org
M & R Benchmarks Study1901 L Street NW, Suite 800Washington, DC 20036202.223.9541www.mrbenchmarks.com
Marts & Lundy, Inc.1200 Wall Street WestLyndhurst, NJ 07071800.526.9005www.martsandlundy.com
Maurice and Marilyn Cohen Center for Modern Jewish Studies, Brandeis University415 South Street, MS 014Waltham, MA 02454781.736.2060www.brandeis.edu/cmjs
National Association of Independent Schools (NAIS)1129 20th Street NW, Suite 800Washington, DC 20036202.973.9700www.nais.org
National Catholic Development Conference734 15th St. NW, Suite 700Washington, D.C. 20005202.637.0470www.ncdc.org
National Center for Charitable Statistics (NCCS)The Urban Institute2100 M Street NW, Fifth FloorWashington, DC 20037866.518.3874www.nccs.urban.org
National Committee for Responsive Philanthropy (NCRP)1900 L Street NW, Suite 825Washington, D.C. 20036202.387.9177www.ncrp.org
National Council for Voluntary Organisations (NCVO)8 All Saints StreetLondon, N1 9RLEngland011.44.020.7713.6161www.ncvo.org.uk National Council of Churches110 Maryland Avenue NE, Suite 108Washington, DC 20002202.544.2350www.nationalcouncilofchurches.us
National Council of Nonprofits1001 G Street NW, Suite 700 EastWashington, DC 20001202.962.0322www.councilofnonprofits.org

Giving USA Sources of Philanthropic Information
Giving USA FoundationTM | Giving USA 2017 | 389
National Endowment for the Arts400 Seventh Street SWWashington, DC 20506202.682.5400www.arts.gov
National Law Center on Homelessness& Poverty (NLCHP)2000 M Street NW, Suite 210Washington, DC 20036202.638.2535To locate the NLCHP’s research:www.nlchp.org/reports
National Philanthropic Trust165 Township Line Road, Suite 1200Jenkintown, PA 19046215.277.3010www.nptrust.org
Network for Good1140 Connecticut Avenue NW, Suite 700Washington, DC 20036888.284.7978www.networkforgood.com
Newtithing Group1 Maritime Plaza, Suite 1545San Francisco, CA 94111www.newtithing.data360.org Nonprofit Finance Fund5 Hanover Square, Ninth FloorNew York, NY 10004212.457.4700www.nonprofitfinancefund.org
Nonprofit Leadership Alliance1801 Main Street, Suite 200Kansas City, MO 64108816.561.6415www.nonprofitleadershipalliance.org
The Nonprofit Quarterly (NPQ)112 Water Street, Suite 400Boston, MA 02109617.227.4624www.nonprofitquarterly.com
Nonprofit Research Collaborative (NRC) 530.690.5746www.npresearch.org
The NonProfit Times201 Littleton Road, Second FloorMorris Plains, NJ 07950973.401.0202www.thenonprofittimes.com
OPERA America330 Seventh AvenueNew York, NY 10001212.796.8620www.operaamerica.org
Pew Research Center1615 L Street NW, Suite 800Washington, DC 20036202.419.4300www.pewresearch.org
Planned Giving TodayMary Ann Liebert, Inc.140 Huguenot Street, Third Floor New Rochelle, NY 10801 914.740.2100www.liebertpub.com President’s Committee on the Arts and the Humanities (PCAH)400 Seventh Street SWWashington, DC 20506202.682.5409www.pcah.gov

390 | Giving USA FoundationTM | Giving USA 2017
Giving USA Sources of Philanthropic Information
Program on Philanthropy andSocial Innovation (PSI)The Aspen InstituteOne Dupont Circle NW, Suite 700 Washington, DC 20036202.736.5800To locate the Program on PSI:www.aspeninstitute.org/policy-work/ nonprofit-philanthropy
Tax Foundation1325 G Street NW, Suite 950Washington, DC 20005202.464.6200www.taxfoundation.org
Taxwise GivingPO Box 299Old Greenwich, CT 06870800.243.9122www.taxwisegiving.com
Theatre Communications Group (TCG)520 Eighth Avenue, 24th FloorNew York, NY 10018212.609.5900www.tcg.org
The United States Conference of Mayors 1620 Eye Street NWWashington, DC 20006202.293.7330www.usmayors.org
United Way Worldwide701 N. Fairfax StreetAlexandria, VA 22314703.836.7112www.unitedway.org
VolunteerMatch550 Montgomery Street, Eighth FloorSan Francisco, CA 94111www.volunteermatch.org
Women’s Funding Network156 2nd StreetSan Francisco, CA 94105415.441.0706www.womensfundingnetwork.org
Women’s Philanthropy Institute301 N. University Blvd., Suite 3000Indianapolis, IN 46202317.278.8990www.philanthropy.iupui.edu

AbilaAdvancement ResourcesAlexander HaasThe Alford Group Aly Sterling Philanthropy Arnoult & Associates, Inc.Arthur Alley Associated AskRIGHT Benefactor Group Bentz Whaley Flessner Blackbaud, Inc.Campbell & Company Carlson Fundraising, LLC Carlton & Company CCS Fundraising Corporate DevelopMint Cramer & Associates The Curtis Group Dini Spheris DonorDrive DonorPerfect DonorSearch Dunham+Company Evans Consulting Group Global Advancement, LLC
Green Oak Consulting Group Graham-Pelton Consulting, Inc. Grenzebach Glier and AssociatesHeaton Smith Group Heller Consulting The Hodge Group Jeffery Byrne + Associates, Inc. Johnson, Grossnickle and Associates KCI-Ketchum Canada, Inc.The Lapin Group, LLC Marts & Lundy, Inc. The Monument Group NeonCRM The Phoenix Philanthropy Group Prasad Consulting & Research Richner & Richner, LLC Ruotolo Associates, Inc.SofTrek Sterling Associates Ter Molen Watkins & Brandt, LLC TrueSense Marketing Westfall Gold Winkler Group The Yunker Group, Inc.
The Giving Institute Member Organizations
The Giving Institute, the parent organization of Giving USA Foundation™, consists of member organizations that have embraced and embodied the core values of ethics, excellence, and leadership in advancing philanthropy. Serving clients of every size and purpose, from local institutions to international organizations, The Giving Institute member organizations embrace the highest ethical standards and maintain a strict code of fair practices. For more information on selecting fundraising counsel, visit www.givinginstitute.org.
Giving USA FoundationTM | Giving USA 2017 | 391

Giving USA FoundationTM 2017 Board of Directors
392 | Giving USA FoundationTM | Giving USA 2017
Giving USA FoundationTM OfficersAggie Sweeney, CFRE, Campbell & Company, Chair
Richard J. Dunham, Dunham+Company, Vice Chair
M. Anne Murphy, CFRE, Dini Spheris, Secretary/Treasurer
W. Keith Curtis, The Curtis Group, Immediate Past Chair
Jon BiedermannDonorPerfect
Joshua Birkholz Bentz Whaley Flessner
Jeffrey D. ByrneJeffrey Byrne + Associates, Inc.
John GlierGrenzebach Glier and Associates
Ted GrossnickleJohnson, Grossnickle and Associates
Rachel Hutchisson Blackbaud, Inc.
Christopher K. LooneyCCS Fundraising
Laura MacDonaldBenefactor Group
Tom MesarosThe Alford Group
Sarah Williams Marts & Lundy, Inc.
Giving USA FoundationTM Directors
Giving USA Foundation™ is a public service initiative of The Giving Institute. It is supported through the generosity of member organizations, other foundations, corporations, and the general public. Its goals are to advance the cause of philanthropy through research, education, and public understanding.

The Giving Institute 2017 Board of Directors
Giving USA FoundationTM | Giving USA 2017 | 393
The Giving Institute OfficersJeffrey D. Byrne, Jeffrey Byrne + Associates, Inc., Chair
Rachel Hutchisson, Blackbaud, Inc., 1st Vice Chair
Peter J. Fissinger, CFRE, Campbell & Company, Treasurer
David H. King, CFRE, Alexander Haas, Immediate Past Chair
Derek Alley, Arthur Alley Associated, Secretary
Erin Shy Abila
Ben Golding Advancement Resources
Brenda B. AsareThe Alford Group
Aly SterlingAly Sterling Philanthropy
Leo P. Arnoult, CFREArnoult & Associates, Inc.
Daniel McDiarmid, CFREAskRIGHT
Laura MacDonald, CFREBenefactor Group
Joshua M. BirkholzBentz Whaley Flessner
L. Gregg CarlsonCarlson Fundraising, LLC
William L. Carlton, ACFRE Carlton & Company
Christopher Looney CCS Fundraising
June Bradham, CFRECorporate DevelopMint
Michelle Cramer, CFRE Cramer & Associates
Wendy S. McGrady The Curtis Group
Angela HodsonDini Spheris
Todd LevyDonorDrive
Jon Biedermann DonorPerfect
Bill TedescoDonorSearch
Richard J. Dunham Dunham+Company
Robert EvansEvans Consulting Group
The Giving Institute Directors

The Giving Institute 2017 Board of Directors
394 | Giving USA FoundationTM | Giving USA 2017
Robert K. Lewis, CFRE Global Advancement, LLC
Craig LeachGraham-Pelton Consulting, Inc.
William C. McMorranGreak Oak Consulting Group
John GlierGrenzebach Glier and Associates
Dave SmithHeaton Smith Group
Keith HellerHeller Consulting
Russell HodgeThe Hodge Group
Ted GrossnickleJohnson, Grossnickle and Associates
Marnie SpearsKCI-Ketchum Canada, Inc.
Avrum LapinThe Lapin Group, LLC
Phillippe G. HillsMarts & Lundy, Inc.
Alan R. Hutson, Jr., M.P.A., CFRE The Monument Group
Jeff GordyNeonCRM
Richard TollefsonThe Phoenix Philanthropy Group
Poonam PrasadPrasad Consulting & Research Cedric A. Richner, CFRE Richner & Richner, LLC
George Ruotolo, Jr., CFRE Ruotolo Associates, Inc.
Steve Birnbaum SofTrek Corporation
Barbara BushongSterling Associates
Clyde WatkinsTer Molen Watkins & Brandt, LLC
Kurt WorrellTrueSense Marketing
Bob WestfallWestfall Gold
Jennifer RichardWinkler Group
James Yunker, Ed.D.The Yunker Group, Inc.
The Giving Institute Directors (Continued)

Editorial Review Board Laura MacDonald, CFRE, Co-Chair Benefactor Group
Wendy S. McGrady, Co-ChairThe Curtis Group
Sarah K. Anderson Campbell & Company
June BradhamCorporate DevelopMint
Jessica Browning, M.A., M.B.A. Winkler Group
Lisa BuckleyBenefactor Group
Richard J. Dunham Dunham+Company
Robert Evans Evans Consulting Group
Grant ForssbergGrenzbach Glier and Associates
Nina Giviyan-KermaniNeonCRM
Kathy L. HowriganMarts & Lundy, Inc.
Thomas Kissane CCS Fundraising
Rebecca Lamb, CFRE Dini Spheris
Avrum D. Lapin The Lapin Group, LLC
William C. McMorranGreen Oak Consulting Group
Nicole McWhorterDini Spheris
Merrell Milano Bentz Whaley Flessner
Diana Newman Benefactor Group
Anna Pruitt, Ph.D.Indiana University
Nathan RellesDonorPerfect
Karen Rotko-Wynn, CFRE The Alford Group
Lauren SheehanDonorPerfect
Helen StarmanRichner & Richner, LLC
Mallory St. ClaireIndiana University
Angela E. White, CFRE Johnson, Grossnickle and Associates
Lisa WolfWestfall Gold
Giving USA Committees
Giving USA FoundationTM | Giving USA 2017 | 395

Resource Development Committee
Giving USA Committees
396 | Giving USA FoundationTM | Giving USA 2017
Christopher Looney, ChairCCS Fundraising
L. Gregg CarlsonCarlson Fundraising, LLC W. Keith Curtis The Curtis Group
Ted GrossnickleJohnson, Grossnickle and Associates
Marc KellenbergerThe Phoenix Philanthropy Group
Thomas W. Mesaros The Alford Group
M. Anne Murphy, CFREDini Spheris Dave SmithHeaton Smith Group Aggie Sweeney, CFRECampbell & Company

Marketing Committee for The GivingInstitute and Giving USA Foundation™
Giving USA Committees
Richard J. Dunham, Chair Dunham+Company
Jean BeanThe Giving Institute and Giving USA FoundationTM
Greg GormanGreg Gorman Communications
Rachel HutchissonBlackbaud, Inc. Todd LevyDonorDrive
Giving USA FoundationTM | Giving USA 2017 | 397

Giving USA Committees
The Advisory Council on MethodologyFor Giving USA Foundation™ Joshua M. Birkholz, Bentz Whaley Flessner, Council Chair
Aggie Sweeney, CFRE, Campbell & Company
Leo Arnoult, M.A., CFRE, Arnoult & Associates, Inc.
Erin Berggren, CAE, Giving USA FoundationTM and The Giving Institute W. Keith Curtis, The Curtis Group Richard J. Dunham, Dunham+Company
Laura MacDonald, CFRE, Benefactor Group Sarah Williams, Marts & Lundy, Inc.
For the Indiana University Lilly Family School of Philanthropy
Amir Pasic, Ph.D., Eugene R. Tempel Dean Patrick M. Rooney, Ph.D., Associate Dean for Academic Affairs and Research Una O. Osili, Ph.D., Director of Research
Mallory St. Claire, B.S., Co-Managing Editor, Giving USA Anna Pruitt, Ph.D., Co-Managing Editor, Giving USA Jon Bergdoll, M.S., Statistician
398 | Giving USA FoundationTM | Giving USA 2017

Giving USA FoundationTM | Giving USA 2017 | 399
Giving USA Committees
Rev. Dr. Richard S. Belous, Unity Worldwide Ministries, Senior Minister Unity Center of Tulsa
Karen Brunn, United Way Worldwide
Heather Campbell, Princeton University
James Cheng, Memorial Sloan Kettering Cancer Center
Randy Cohen, Americans for the Arts
Nathan Dietz, Do Good Institute, University of Maryland
John Durnford, DataLake, LLC
Kristen A. Grønbjerg, Ph.D., Indiana University Lilly Family School of Philanthropy
Jennifer Holt, St. Jude’s Children’s Research Hospital
Nadine T. Jalandoni, Independent Sector
Russell N. James III, J.D., Ph.D., Texas Tech University
Ann E. Kaplan, Council for Aid to Education
Jesse D. Lecy, Maxwell School of Syracuse University
Alex Oftelie, IBM
Alexander Parkinson, The Conference Board
David Wolcheck, Foundation Center
The Advisory Council on Methodology (Continued)

The Giving USA Foundation™ Team
Erin Berggren, CAE, The Giving Institute & Giving USA Foundation™ Executive Director
Jean Bean, The Giving Institute & Giving USA Foundation™ Director of Marketing and Communications
Michelle Goldberg, The Giving Institute & Giving USA Foundation™ Account Manager
Mariam Gunja, The Giving Institute & Giving USA Foundation™ Account Associate
Spenser Davis, The Giving Institute & Giving USA Foundation™ Account Associate
Thomas Radde, The Giving Institute & Giving USA Foundation™ Digital Marketing Manager
Media: Johnny Ford, Public Communications Inc.
Giving USA Staff and Consultants
400 | Giving USA FoundationTM | Giving USA 2017

The Giving USA Team at the IndianaUniversity Lilly Family School of PhilanthropyAmir Pasic, Ph.D., Eugene R. Tempel Dean
Patrick M. Rooney, Ph.D., Associate Dean for Academic Affairs and Research
Una O. Osili, Ph.D., Director of Research
Mallory St. Claire, B.S., Co-Managing Editor, Giving USA
Anna Pruitt, Ph.D., Co-Managing Editor, Giving USA
Adriene L. Davis Kalugyer, Manager of Public Affairs
Jon Bergdoll, M.S., Statistician
Chelsea Naylor, M.A., Research Assistant
Acknowledgments:
Melanie A. McKitrick, writing and editing assistance
Grace Baranowski, editing assistance
Giving USA volunteer authors (cited at the end of each chapter)
Contractors: Jon Durnford, DataLake, LLC
J. Heidi Newman, Mark My Word!
Giving USA Staff and Consultants
Giving USA FoundationTM | Giving USA 2017 | 401

Member firms, in seeking at all times to provide candid, rigorous counsel, and the highest quality of service to every client, adhere to the following ethical standards:
Member firms pledge to honor the confidentiality of client prospect and donor lists, their business affairs, and the right to privacy enjoyed by every institution, volunteer and donor.
Fundraising consulting member firms charge clients based upon the professional services provided. Their fees are never based upon charitable gifts raised or a percentage of contributions.
Member firms disclose to clients and prospective clients any professional, personal, or client relationships that might be construed as conflicts of interest.
Member firms continuously seek to ensure that their clients will deploy gifts for the purposes for which they were given.
Member firms do not guarantee fundraising results, promise access to the donors of current or previous client institutions, or otherwise engage in marketing methods that are misleading to prospective clients, to the public or to individual donors.
Member firms do not accept or maintain custody of gifts, or of gift funds that have been contributed to client institutions.
Member firms do not make undisclosed payments or provide special consideration to volunteers, officers, directors, trustees, employees, beneficiaries or advisors to a not-for-profit firm as compensation for influencing the selection of the organization or its services.
Member firms do not make exaggerated or erroneous claims relative to the past achievements of their organizations, of their staff professionals, or of their client institutions.
402 | Giving USA FoundationTM | Giving USA 2017
The Giving Institute Professional Code of Ethics
GIVING USA 2015288GIVING USA FOUNDATION™
THE GIVING INSTITUTE PROFESSIONAL CODE OF ETHICS
Member firms, in seeking at all times to provide candid and rigorous counsel, and the highest quality of services to every client, adhere to the following ethical standards:
▶ Member firms pledge to honor the confidentiality of client prospect and donor lists, their business affairs, and the right to privacy enjoyed by every institution, volunteer and donor.
▶ Fundraising consulting member firms clients based upon the professional services provided. Their fees are never based upon charitable gifts raised or a percentage of contributions.
▶ Member firms disclose to clients and prospective clients any professional, personal, or client relationships that might be construed as conflicts of interest.
▶ Member firms seek at all times to ensure that their clients will deploy gifts for the purposes for which they were given.
▶ Member firms do not guarantee fundraising results, promise access to the donors of current or previous client institutions, or otherwise engage in marketing methods that are misleading to prospective clients, to the public or to individual donors.
▶ Member firms do not accept or maintain custody of gifts, or of gift funds that have been contributed to client institutions.
▶ Member firms do not make undisclosed payments or provide special consideration to volunteers, officers, directors, trustees, employees, beneficiaries or advisors to a not-for-profit firm as compensation for influencing the selection of the organization or its services.
▶ Member firms do not make exaggerated or erroneous claims relative to the past achievements of their organizations, of their staff professionals, or of their client institutions.
Professional Code of Ethics Standards of Practice

A Statement of Best Practices Adopted by Its Members
Member firms pledge to respect the mission and values of each client organization and the central importance of each of its stakeholders.
Member firms pledge to provide only those services that will advance the mission of each client organization, and which will support the values they espouse.
Member firms will readily share the professional credentials and experience of each of their staff professionals.
Member firms will always endeavor to put into place written service agreements with each of their client organizations.
Member firms will be transparent and fair with respect to how they bill fees and expenses.
Member firms will provide credible references for their previous client work and ensure ready access to those client references.
Member firms affirm their commitment to the appropriate recognition and stewardship of each gift, irrespective of its size or source.
Member firms counsel their clients on the value of institutional stakeholders, and their professional staff taking the lead in the solicitation of every gift.
Members are committed to the shared standards of Best Practice for Global Philanthropy and Civil Society, wherever they come to exist.
The Giving Institute Standards of Practice
Giving USA FoundationTM | Giving USA 2017 | 403
Standards of Practice
EVERY DONOR
MATTERS.Develop and grow your most valuable relationships for free at donorperfect.com/Giving-USA.

Become part of the AFP community—33,000 fundraisers strong across the globe—dedicated to advancing philanthropic causes through ethical and effective fundraising. Use the AFP network to learn, grow, share and change the world while abiding by the highest ethical standards in the profession.
7

Powering
Established in 2007, the Association of Advancement Services Professionals provides education, best practices, and networking opportunities to those who guide the sound and effective advancement and overall business decisions of not-for-profit organizations.
www.advserv.org
your fundraising efforts
Join our membership of more than 1,100 advancement services professionals.

Are you a nonprofit looking to maximize your fundraising potential?
Or are you a professional in the nonprofit sector who needs in-depth nonprofit data? A way to streamline grantmaking?
A free platform to expand your nonprofit’s reach?
If so, you need GuideStar, the world's largest free resource for nonprofit organizations.
Learn more at learn.guidestar.org/givingusa

THERE HAS NEVER BEEN A BETTER TIME TO
ADVOCACYAccess tools to demonstrate the value of prospect development professionals.
• Body of Knowledge• Salary Survey• Industry Partnerships• Awards & Scholarships• Code of Ethics
NETWORKINGFrom in-person events to daily interaction, Apra members share, learn and grow as a community.
• Apra Member Directory• 29 Regional Chapters• Social Media Community• PRSPCT-L
Visit www.Aprahome.org to join Apra or renew your membership today!
EDUCATIONFor all stages of your career.
• Chapters Share the Knowledge
• New Researchers & Data Analytics Symposia
• Prospect Development• Comprehensive Online
Curriculum• Webinars & Podcasts• NEW! Plug In to Prospect
Research Virtual Event
PROFESSIONAL DEVELOPMENTApra is the premier source to learn, grow and expand prospect development knowledge.
• Presentation Opportunities• Career Center• Chapter Leadership• Committee Participation• Connections
JOIN APRAUnlock the Benefits of Membership with the Premier Organization for Prospect Development Professionals

CASE Washington, D.C.
CASE Asia-Pacific Singapore
CASE Europe London
CASE Latin America Mexico City
www.case.org #caseadvance
CASE is pleased to support Giving USA 2017 and the Giving Institute.
CASE is an organization committed to advancing education. We believe in fostering and supporting educational philanthropy and are honored to be a partner in this effort to provide nonprofit data and information.
GIVING-USA_CASE_AD.indd 6 6/9/2017 2:05:00 PM


For seven decades, CCS has empowered many of the world’s greatest organizations to advance some of the most important causes in history. We plan, manage, and implement programs that achieve fundraising goals and mission impact. Together with our clients, we’re delivering meaningful and measurable change for our communities and world.
We partner with non-profits for transformational change.
[email protected] | ccsfundraising.com

Progress ConversationFor more than 60 years, the Giving USA annual report has
provided the nonprofit sector with data that informs our most
important conversations. Formal or informal. In the board
room or at the coffee shop. These exchanges allow us all to
contribute ideas and innovations to grow philanthropy and
spread its transformational power.
Let’s keep the conversation going.
www.martsandlundy.com
Consulting. Analytics. Training. Communications

Fundraising
Strategic Planning
Governance
Data Analytics
Corporate Partnership Strategy
Leadership Development
Chicago (312) 929-4646 | New York (845) 439-1242 Seattle (206) 548-0451 | www.alford.com
Empowering organizations to reimagine what it means
to make a difference
DEEPEN IMPACT

A campaign can be a daunting challenge, but after 40 years, we’ve learned the rules that work—and our tailored, action-oriented plans will guide you through it. From providing expert guidance in advancement planning, fundraising or communications to helping your organization recruit the brightest talent, Campbell & Company brings together the people, resources and ideas you need for success.
(877) 957-0000 TOLL-FREE www.campbellcompany.com

dunhamandcompany.com
WHEN YOU WANT MORE.More people reached More hearts touched More lives transformed
In less than two years, Dunham+Company hasn’t just helped Biblica triple the size of our donor fi le. They’ve helped us reinvigorate, inspire, and retain our core supporters, as well as increase our broad-base annual income more than 60%. We’re providing more Bibles to more people in more countries than ever before.
Dr. Carl A. Moeller, CEO Biblica – The International Bible Society
In less than two years, Dunham+Company hasn’t just helped Biblica triple the size of our donor In less than two years, Dunham+Company hasn’t just helped Biblica triple the size of our donor
We’re providing more Bibles to more people in more countries than ever before.

A donor’s ability to claim itemized deductions is subject to a variety of limitations depending on the donor’s specific tax situation. Consult your tax advisor for more information.
Schwab Charitable is the name used for the combined programs and services of Schwab Charitable Fund™, an independent nonprofit organization. Schwab Charitable Fund has entered into service agreements with certain affiliates of The Charles Schwab Corporation.
©2017 Schwab Charitable Fund. All rights reserved. REF (0517-ZTOX) ADP97444-00 (5/17)
A Schwab Charitable™ donor-advised fund account is a tax-smart, efficient way to help meet your charitable giving goals. To learn more or to open an account, call us at 1-800-746-6216 or visit www.schwabcharitable.org.
Giving is good. Giving wisely is great.
I’ve never been a relief worker.
But I knowI can make a difference.
GIVINGUSA-AD03.indd 1 5/12/17 2:11 PM
16 years
330 nonprofits
More than $1,300,000,000 raised
[email protected] 816.237.1999 www.FundraisingJBA.com
Committed to nonprofit fundraising success.

ADVANCE YOUR MISSIONAbila nonprofit software and services help you improve decision making, execute with greater precision, increase constituent engagement, and generate and manage more mission-critical funding. Abila solutions are built on decades of nonprofit domain experience, and are designed to help you more strategically advance your goals and mission.
LEARN MORE AT
abila.com
We help you connect your vision with your donors’ aspirations. Benefactor Group provides nonprofit
consulting services that support campaign fundraising, nonprofit technology, endowment building, leadership
development and executive transition.
PROUD MEMBER
Our mission is helping you meet yours.We’ll be there for you. With you. Working alongside you to plan your future,
build awareness and raise substantial amounts of money.
Since 1989, The Curtis Group has promoted philanthropy and provided personalized development services to nonprofits. Visit our website to learn more.
757.496.2224 | www.curtisgroupconsultants.com
The Richmond Symphony is one of the nearly 200 nonprofits we have served across the Mid-Atlantic.
insight � Customized predictive models.
� Deep insight into program and
portfolio patterns.
� Highly accurate campaign forecasts
and simulations.
� Practical performance metrics
system design.
� Powerful talent analytics.
� Collaborative counsel to hire, develop,
and deploy your own analytics program.
(952) 921-0111 n www.bwf.com
Minneapolis, MN n Washington, DC
It doesn’t matter how close you
look if you can’t see the value.
Gain an accurate and deep understanding
of your data with Bentz Whaley Flessner.
Giving USA 2016 version 6.indd 1 5/13/2016 9:21:26 AM

Dini Spheris is a dynamic, national consultancy with expertise in fundraising, leadership coaching and performance optimization. For more than 48 years we have served
as a trusted partner with our clients.
( 8 0 0 ) 8 3 6 - 0 4 1 1 | W W W. D I N I S P H E R I S . C O M
H O U S T O N • D A L L A S • D E N V E R
Get to know your
DAF donorsDonors to Fidelity Charitable® have supported more than 240,000 charities, in nearly every philanthropic sector, with over $26 billion
in donor-recommended grants.1 Donor-advised funds are also one
of the fastest-growing charitable vehicles, with contributions now representing 8.39% of total individual giving in the United States.2
Fidelity Charitable® makes charitable giving accessible, simple,
and effective for our donors, who in turn support your charitable mission with an enduring dedication to philanthropy.
Our donors are your donors. Get to know them.
To learn more about donor-advised funds and those who use them:
Visit FidelityCharitable.org
or Call us at 800.682.4438
1 From Fidelity Charitable inception in 1991 through March 31, 20172 2016 Giving USA Report and 2016 Donor-Advised Fund Report, National Philanthropic Trust
Fidelity Charitable is the brand name for the Fidelity Investments® Charitable Gift Fund, an independent public charity with a donor-advised fund program. Various Fidelity companies provide services to Fidelity Charitable. Fidelity, the Fidelity Charitable name, and the Fidelity Charitable logo are registered service marks, of FMR LLC, used by Fidelity Charitable under license. 759557.2.0