Embed Size (px)
Citation preview

The Annuity Market in India: Do Consumers Get Their Money’s Worth?
What are the Key Public Policy Issues?*
Estelle James
Urban Institute
Renuka Sane
The OASIS Foundation
* We thank Ajay Shah, Arpan Thanawala, Sanjay Shah, S.P. Subhedar, officials of LIC, Tata AIG and
AIG India for their helpful comments and insights. We especially thank Xue Song for her calculations
of the MWR.
Email:[email protected] and [email protected].

Abstract
Annuities markets around the world are small but are likely to grow further as a result of reforms in
the public social security systems and private pensions plans, which partially replace the defined benefit
plans with funded defined contribution plans. When people retire, they may choose or are sometimes
required to annuitize these defined contribution savings. Therefore it is important to learn whether or
not annuities markets exist and what kinds of market failure can be anticipated. Several papers have
analyzed markets in US, UK, Canada, Switzerland, Australia, Israel, Chile and Singapore. This paper
extends the analysis by examining the annuities market in India.
The paper focuses on the analyses of the expected present discounted value (EPDV) of cash flows
from the annuity, and the money’s worth ratio (MWR), which is the EPDV divided by the initial premium
cost. It points to several key weaknesses in the annuities market that need to be corrected to enable the
development of a healthy annuity industry in India. It also summarizes some of the key policy choices
that must be made to enable it to play an effective role in the broader pension reform.

The Annuity Market in India: do Consumers get their Money’s Worth?
What are the Key Policy Issues?
1. Introduction
According to the Project OASIS Report, less than 11% of the estimated working population in
India is eligible to participate in a formal pension system and about 90% of the population does not
come under the purview of any such mechanism.1 The pension system for government employees is
running into troubled waters due to the strain it is placing on government finances. Meanwhile, private
sector workers covered by the Employees Provident Fund (EPF), a defined contribution scheme, are
faced with inadequate terminal accumulations, primarily as a result of low returns and liberal withdrawals.
Moreover, the EPF does not provide a lifetime income stream. Rather, participants receive their money
upon retirement in a lump sum. If they live 15-20 years after retirement, as many undoubtedly will,
they may run out of money. Doubts also persist over the efficiency, transparency and sustainability of
the defined benefit plan for private sector workers, the Employees Pension Scheme (EPS).
The impending pension reforms and subsequent transition to a social security system that incorporates
more productive individual accounts, heighten the importance of a vibrant annuity industry. Most
attention so far, both in India and elsewhere, has focused on the accumulation stage, during which
retirement savings accounts are built up, without giving much thought to the decumulation phase,
which appears to be far off in the future. However, retirement savings will eventually be withdrawn and
consumed. The challenge is to design a decumulation phase such that people don’t run out of income
before they die, and also make this cost-effective. If EPF is reformed to permit higher rates of return
and accumulations, annuities will assume greater importance as they provide an opportunity to convert
these savings into a guaranteed flow of retirement income for life. Therefore, it is important to learn
how the annuities markets operate, to analyse whether the annuity market in India can be relied on to
provide reliable retirement income at reasonable prices, and to anticipate possible market failures in
order to take preventative action.
The annuity industry in India is small. Both demand and supply are minimal. The opening of the
insurance sector has ushered in new potential players, but the variety of products offered has been
limited and the response of the industry cautious. In this paper, we deal with issues that are central to

the healthy development of this industry. Taking the present situation as a starting point, we ask: do
annuities in India provide good value for money? Are annuitants likely to get back the premium they
pay in, plus interest, over time? The money’s worth ratio (MWR) analysis is one measure of the value
of an annuity. The MWR tells us how much of the initial premium the annuitant eventually gets back as
income. It is the ratio of expected discounted lifetime benefits to initial capital cost. An MWR of 1
indicates that the consumer is getting back in present expected value exactly what he put in, plus
interest that equals the discount rate. The MWR depends on payouts of annuity products (how much is
received each month), mortality of the population (how long the annuitant will live) and the interest
rate used for discounting. Consumers want to be sure that they can expect to get back their premium
plus a reasonable rate of return, companies want to be sure they are not paying more than is affordable,
and regulators want to be sure that consumers are treated fairly and that companies will keep their
promises. Thus, they all care about the MWR.
This study summarizes what we already know about the Indian annuity market and identifies steps
that must be taken by the government and the industry to enable the industry to grow. Specifically, we
argue that:
• Better data are needed on expected mortality rates of different sub-groups within the diverse Indian
population, and on probable improvements in these rates over time.
• Long term financial instruments, including long term government bonds (possibly price-indexed)
must be further developed, to enable insurance companies to match the long term liabilities implied
by annuities.
• Investment regulations and regulatory authority should be modernized.
• New products, including variable (participating, for-profit) annuities with and without floors, need
to be constructed, to attract consumers with diverse preferences for risk. This, in turn implies more
complex standards and regulations.
• Mechanisms should be developed for dispersing information about products and payouts offered
by various insurance companies, as they enter the market.
Section 2 presents key statistics on the annuity industry in India—its size, products and potential
growth. Section 3 analyzes the money’s worth ratio. We present data on payouts of different annuity
products as well as the interest and mortality rates that are used to determine these payouts, and we

show how the industry has reacted to recent changes in these variables. Sections 4 and 5 examine data
on administrative and marketing costs, and on investment returns, which enter into the company’s
calculations in an important way. We argue that companies cover their costs and profits out of the
spread between the rate of return they earn on their investments and the rate they pay consumers.
Falling interest rates in the Indian markets and unavailability of long term bonds, combined with
increasing longevity among annuitants, have resulted in decreased payouts in recent months. Section 6
discusses the key policy choices that government and industry leaders must make in the near future, to
enable a healthy growth of this industry. The Conclusion summarizes our empirical results and the next
steps forward.
2. The annuity market in India
One would expect that the absence of a social security system that pays a lifetime income stream,
combined with low coverage of formal company schemes, would lead to a high demand among people
approaching retirement for annuity products. On the contrary, the demand for annuities in India has
been minuscule. The annuity industry has not been able to penetrate the insurance market, or for that
matter the psyche of the Indian customer. The Indian annuity industry is characterized by low rates of
participation by the public, a small number of providers, and limited product innovation. The industry
is currently dominated by the Life Insurance Corporation of India (LIC). With the opening of the
insurance sector entry is expected from HDFC Standard life, Tata AIG, and ICICI Prudential. Mutual
funds are also in the process of obtaining permission from the Securities and Exchanges Board of India
(SEBI) for offering annuity products. But as of now, LIC is virtually the entire market.
Table 1 presents summary data on the size of the annuity business versus the life insurance business
for the industry. We see that:
1) The annuity business has been growing since 1996, but the growth rate has been very uneven,
ranging from –64% to +1555% in different years.
2) In 2000, new annuity business was still only 1.3% of new life business in terms of new
policies, and 2.3% in terms of new premiums.
3) Added to this individual annuity business is a large group business from superannuation
plans, which include pension investments and annuities.

Most annuities are tax-advantaged savings vehicles (deferred annuities), rather than immediate life
annuities. LIC offers three alternative annuity schemes—the New Jeevan Akshay-I, New Jeevan
Suraksha-I and New Jeevan Dhara-I. The deferred annuities, which dominate sales, serve primarily as
tax-advantaged saving schemes. Prudential ICICI and HDFC Standard Life also provide deferred annuity
schemes. A third company sells variable annuities in its group superannuation schemes.
While we focus on the individual business, the group annuity business is substantial, as it is mandatory
in employer-run Superannuation Funds to annuitize two-thirds of the account upon retirement. During
the accumulation stage, employers place the accounts in trust funds or insurance company for
management. At retirement, the funds are handed over to an insurance company (usually LIC), which
then offers a group annuity. Recently the trend has been towards offering an “open-market option” that
allows individuals the choice of insurance company for annuitization. This open-market option could
facilitate the development of a market for individual annuities. However, experience from the UK
suggests that most workers do not exercise this option or are even aware of it.
Table 1: Size of Annuity and life insurance markets in India
1996 97 98 99 2000
Annuities-new business
Premiums (lakhs of Rs) 183 14494 4893 9789 17262
# policies (lakhs) .11 1.82 .66 1.05 2.23
Av Rs per policy 1664 7964 7414 9323 7741
% growth (# policies) 1555% -64% 59% 112%
Business in force-# policies (lakhs) 7.58 9.59
Life insurance-new bus.
Premiums (lakhs of Rs) 281363 334539 384112 486341 600828
# policies (lakhs) 110.21 122.68 133.11 148.44 169.77
Av Rs per policy 1706 1867 2010 2208 2423
Business in force-# policies (lakhs) 708.78 776.66 849.15 916.37 1012.9
Annuities as % of life insurance-new business
Premiums .065 4.33 1.27 2.01 2.9
# policies .09 1.48 .49 .71 1.31

A recent study by the National Council for Applied Economic research (NCAER) and the Securities
and Exchange Board of India (SEBI) throws some light on the low present and projected demand for
annuities. The most popular savings vehicle, by far, consists of fixed deposits. Only the group that had
income exceeding Rs.10000 (US$208) monthly had a large share of savings in LIC, and most of this
was not in immediate annuities. Insurance clearly is a luxury of the higher income class. Annuities are
viewed by them as tax-advantaged saving measures instead of old-age security. Between 1987 and
1992, tax relief was provided for Jeevan Dhara and Jeevan Askhay and growth in demand was
phenomenal. When the tax-relief was withdrawn in April 1992, the individual pension business stopped
growing and many Jeevan Dhara policies were surrendered. In 1996, tax relief was provided for a new
deferred annuity, the Jeevan Suraksha plan. Accordingly as Table 1 shows, the number of individual
policies sold increased by 1554.5%. In 2000-01 LIC sold a total of 3.44 lakh annuity policies, of which
Jeevan Suraksha accounted for 3.07 lakh, and other (immediate) annuities were a mere 0.37 lakh. The
fact that the deferred annuity schemes, which are basically accumulation instruments, are much more
popular than the immediate annuity is consistent with the experience of other countries such as the US,
Canada and Australia.2 This suggests that making longevity insurance attractive on a voluntary basis
will be an up-hill battle.
Some reasons for the low participation in the annuity market may be:3
• Myopia. People do not see a need for annuitizing their savings.
• Bequests. People may wish to leave their assets to their families rather than using it all up in
an annuity.
• Precautionary saving. People may save for precautionary reasons and want access to their
money when needed for emergency purposes (sickness, dowries or weddings, etc); annuities
normally do not allow flexibility in the time stream of income.
• Control over investment strategy. Annuities may be seen as inflexible instruments, which do
not give the annuitant any control over risk-return trade-offs or investment strategy.
• Adverse selection. The high longevity of annuitants (see below) leads to low payouts, which
in turn makes annuities unattractive to the average population member.

• High discount rates. While the insurance company must discount according to rates they
receive on investments, many people have higher discount rates; this may be true, in particular,
of middle and low-income groups who need their money for immediate or near-term
consumption.
While the last reason may prevent people from annuitizing unless it becomes mandatory, the other
reasons for low demand can be mitigated by innovative product development that gives people an
opportunity to incorporate bequests into annuities, allows some flexibility in timing of payouts, gives
annuitants a choice of investment strategy, with corresponding sharing of risks and returns, and includes
options attractive to groups with low life expectancies.4 It is important, both for the industry and for
public policy, to analyze the reasons for the low purchase of annuities as a first step toward reversing
this trend.
3. Money’s Worth Ratio
We structure this paper as a search by financial analysts for the MWR. However, insurance companies,
consumers, regulators and policy makers must carry out the same search for their own reasons. Companies
must figure out how large are the payouts that they can offer, consumers must calculate the expected
value to them of alternative annuity products (versus no annuitization at all), regulators must ensure
that the system as a whole is solvent and policy makers must understand the industry in order to set the
rules of the game.
Do annuities provide good value for money? Are annuitants likely to get back the premiums they
pay in, over time? To answer these questions, we calculate the money’s worth ratio (MWR), that is, the
present value of the expected future payments relative to the initial premium cost. Concretely, the
MWR for a single life annuity is:

where:
T = Maximum attainable age
a = Age (in years) of annuitant at start of contract
t = Number of months beyond annuity starting date
Pa,t
= Probability of individual being alive t months after age a
Aa
= Monthly annuity payment for annuity purchased at age a
Ca
= Cost of policy for individual purchasing annuity at age a
it
= Nominal monthly t-period spot rate
The numerator of the expression is the “expected present discounted value” (EPDV)
of the lifetime income stream from the annuity, while the denominator Ca is the initial capital cost. If
the MWR is 100%, this means that consumers can expect to get back what they paid in, in addition to
longevity and investment insurance. 100%-MWR is often referred to as the “load factor”. If the MWR
is considerably less than 100% (a high load factor), consumers are getting back a lot less than they put
in, and this may not be a good deal for them. If it is much
Table 2: Monthly payout for New Jeevan Akshay-I, Rs100,000 premium—immediate annuities
at 65, June, 2002
Product Monthly payout
SPIA 844
5 YG 833
10 YG 800
15 YG 756
20 YG 707
Joint SPIA 747
Escalating SPIA 707
Return of purchase price 580

greater than 100% this raises the prospect that insurance companies are offering too much in order to
gain market share in the short run and may not be able to keep their promises in the long run; possibly
regulators should be concerned.
The MWR clearly, depends on market payouts, interest rates and mortality rates. Interest rates turn
future payouts into present discounted values while mortality rates turn them into expected values,
depending on survival probabilities.
3.1 Payouts and their variation by product
Suppose a worker starts his career by earning Rs.31,043 per year, works for 40 years with a real
annual wage growth of 2% (due to economy wide growth + age earnings growth) and contributes 2%
of his wage every year to a retirement savings account on which he earns a real rate of return of 5%.
Then at the end of 40 years his final annual wage is Rs.67,200 and his retirement saving accumulation
is Rs.100,000 (abstracting from inflation). If he turns this accumulation into an annuity, what will he
earn in exchange for his Rs.100,000? In this section we investigate how the answer to this question
varies by product that is chosen.
Table 2 shows the payouts an annuitant will get if he purchases an immediate annuity through the
New Jeevan Akshay-I scheme floated by the LIC. The data allows us to measure trade offs between
different types of insurance that a worker might want to buy. In June 2002, an annuitant could get
Rs.844 per month for an individual nominal single premium immediate annuity (SPIA), but if he wants
to purchase a partial bequest in the form of a 10 year guaranteed payment he must forego 5.5% of the
monthly benefit and gets only Rs.800. If he wants a joint annuity that will provide 50% of the benefit to
the spouse upon his death, he will have to forego 12.9% and receive only Rs.747. Annuities that escalate
at a fixed rate of 3% per year start out with a monthly payout of Rs.707. The payout automatically
increases each year, so after 6 years it passes the Rs.844 that the annuitant would have got with a non-
escalating SPIA. An escalating annuity may be a crude way for payouts to keep pace with expected
inflation; but it does not protect workers against unexpected increases in inflation. Only an annuity
indexed to the price level will offer this, and this insurance is not offered in India.

3.2 Interest Rates
Ideally, the discount rate used should reflect consumers’ time and risk preferences, which should
also coincide with the rates available on alternative investments. Using the term structure of government
interest rates as a risk- free rate would be appropriate for consumers who hold other savings, prefer (or
are at the margin of making) risk-free investments, and consider annuities completely safe. For consumers
with a preference for riskier assets, or those who consider annuities unsafe, a higher discount rate is
appropriate. (Brown, Mitchell and Poterba 2000) used the AA corporate bond structure as their risky
discount rate. (James, Vittas and Xue (2001)) use treasury + 1.4%, as a better reflection of the risk in
the typical insurance company portfolio. Consumers who have no voluntary savings, are liquidity
constrained or are borrowing rather than investing might have an even higher discount rate.5
We use the government rate as a risk-free benchmark by which to measure the relative return to
consumers. However, since most low earners have little voluntary savings and many high earners
probably want to invest in riskier assets with a higher expected return, it is likely that for many potential
annuitants the appropriate discount rate is higher than the government rate. Moreover, the portfolios in
which insurance companies invest are not completely safe. Therefore we also present results for a
‘risky’ rate: the government term structure + 1.4%. As we shall see it roughly corresponds to the rate of
return on investments that would be just high enough to cover insurance company costs, and is a better
approximation of their actual portfolios.
Interest rates in the Indian economy were regulated until 1997-98, when medium and long-term
rates were approximately 12-13%. In the deregulated world they started falling and by 2000-2001 had
dropped by 2-3 percentage points. As discussed below, the interest rate on government bonds has
continued falling during the past year, and this should change annuity payouts and possibly the MWR.
We collected payout data for two points in time—October 31, 2001 and June 19, 2002. Over this
period, medium and long-term rates fell from 9-10% to less than 8%. Additionally, the term structure
became much less steep, as short-term rates continued to hover around 7% (see Figure 1). This drop in
nominal rates occurred because of changes in the broad macro-economy, and corresponded to a drop in
real rates, as the inflation rate was roughly constant at 5%.

We would expect the falling and flatter term structure to have the following effects on payouts and
MWR:
1) Lower interest rates over-all would lead to lower payouts (because they provide a lower return
on insurance company investments), but if the payouts were actuarially fair the MWR would be
unaffected, by definition.
2) In contrast, a flatter yield curve—i.e. a drop that is concentrated in the medium and long term—
might lead to lower MWRs (because insurance companies may have previously obtained higher
rates of return by mismatching assets and liabilities and investing in long term instruments, but
can no longer reap such gains if long term rates fall disproportionately; hence, to cover their
costs insurance companies must increase their load).
3) Insurance companies may follow smoothing policies that temporarily hold annuity prices constant
through time as interest rates change. In such cases, current interest rates would not be a good
predictor of current annuity payouts or MWRs. This may be happening due to regulations or
due to the absence of competitive pressures (in monopolized markets, as in India). 6
3.3 Mortality Tables
India-specific v. UK data. Calculation of the present value of expected lifetime payouts depends
on mortality rates of annuitants. Annuitant mortality rates are likely to be much lower than population-
wide mortality data, because annuitants come from higher income urban groups with longer expected
lifetimes. Moreover, the relevant mortality rates must be adjusted for improvements that have been
taking place from year to year, in expected life spans. Such mortality tables, adjusted for expected
improvements, are known as cohort mortality tables, since they change for each birth cohort.
Unfortunately, until recently annuitant mortality data did not exist in India and even now the data that
exist are from “period table,” based on cross-sectional data, unadjusted for anticipated mortality
improvements. by

Figure 1 Sovereign Yield Curve
1.
Sovereign Yield Curve
6.00%
6.50%
7.00%
7.50%
8.00%
8.50%
9.00%
9.50%
10.00%
10.50%
11.00%
1 y3 yr5 yr7 yr9 yr11 y13 y15 y17 y19 y
19-Oct-07-Jan-0217-Jun-021-Jul-02

In the absence of India-specific data, the LIC has been using different British tables. In 1985 the
LIC adopted the a(90) ultimate table, which is based on mortality experience of male and female
annuitants in the UK over the period 1967-70. Different adjustments have been made to this table from
time to time for pricing immediate annuities for Indian and European lives—both male and female—as
well as for arriving at total liabilities of the annuity business. Without carefully corrected data, however,
the basis for such adjustments is questionable.
Population versus annuitant mortality. In 1994-96 LIC carried out an investigation of mortality
among all its insured lives, primarily those covered by life insurance. The latest investigation was
carried out for the period 1996-98, where only group immediate annuities purchased by trustees of
Occupational Pension Schemes were considered. (Individual annuities were not included). The report
on the new data was submitted in January 2000. During 2000-2001 LIC had to decide how to react to
this new information.
The 1996-98 table exhibits much lower mortality rates than the 1994-96 tables, as members under
occupational pension plans are officers, executives and higher paid employees, who tend to live longer.
Accordingly, our calculations for the 96-98 table show a very high life expectancy at age 65 of 82.3,
which is comparable to developed countries and therefore not a correct estimate of the life-expectancy
of the total Indian population. The 1994-96 life table captures a wider population as it includes all sorts
of working as well as non-working groups. Moreover, purchasers of life insurance would be expected
to have higher mortality than annuitants, due to adverse selection. With a life expectancy at 65 of 79.3,
it is probably more representative of the broad EPF population. Therefore in the discussion below we
refer to the 94-96 data as the EPF population mortality and the 1996-98 data as the annuitant mortality.
Note that life expectancy for the population as a whole is 2-3 years lower than our estimates for the EPF
population. The LIC has not been able to calculate impaired life mortality as it does not have data on
which lives are impaired. Nor has it been able to obtain the trend of mortality improvement in the past,
which might help in estimating expected future improvement. All the insurance companies in India
follow these same period mortality tables, although in their pricing policies they include an ad hoc
“safety factor” that they were not willing to divulge to us, in lieu of a formal mortality improvement
factor.

Need for data on differentiated mortality. Given the heterogeneity in the Indian market, one
would expect vast differences in mortality across various sections of society. Different population
groups, in effect, represent different risks and should therefore be placed into different pricing-payout
categories. If this does not happen, the large body of low and middle earners, whose life expectancy is
likely to be lower than that of high earners, will feel that annuities are not a good deal for them and will
not purchase annuities voluntarily. This can imply market inefficiency because low risk (low longevity)
workers are thereby excluded from the insurance market, or perverse redistribution if everyone is
required to purchase annuities, since low earners will end up subsidizing high earners. For risk
differentiation to take place (in order to avoid perverse redistribution and to encourage the voluntary
purchase of annuities), India requires mortality data that are broken down by population groups—men
versus women, urban versus rural, and lower versus higher education. As of today, such disaggregated
data do not exist.
In most countries differentiation by gender is most basic, as women at 65 typically live 3-4 years
longer than men. However, female longevity seems very close to male longevity in India (according to
World Bank population data). Since virtually all purchasers of annuities are men, we use male mortality
in the following calculations. In selected countries breakdowns by socio-economic status are available.
Given the wide variation in incomes and access to medical facilities in India, such differentiation
would be particularly crucial here. The paucity of data makes it extremely difficult to estimate how
much adverse selection is taking place, but we do observe that life expectancy for the annuity purchasers
is greater than for the EPF population or for the population as a whole (see further discussion of adverse
selection below).
Estimating the mortality improvement factor. Even if India knew the life expectancy of retirees
in the past, this would not accurately tell us how long an average 65 year-old would live in the present
or future, because life expectancy has been improving over time. We will live longer than our parents
and our children will live longer than we. In pricing annuities, insurance companies must take longevity
improvements into account and in evaluating their expected value, prospective consumers must do so
too. This is the way period mortality tables are converted into cohort tables.

However, it is very difficult to estimate how rapidly life expectancy will grow. Some demographers
believe that biogenetic research will extend human life indefinitely, while others believe we are close
to the limit. Uncertainty about future mortality improvements is particularly great in countries like
India, because they depend on broad factors such as improvement in water, sanitation and nutrition and
the diffusion of medical technology and products from more industrialized countries, which may proceed
at a very uneven pace, in addition to more predictable steadier forces. One possible approach is to make
the MWR calculations for two sets of improvement factors, so we obtain some perspective on the
degree of uncertainty involved. In the past, much of the improvement in life expectancy has occurred in
the first year of a child’s life, but in the future much of it will be concentrated in the final years of an old
person’s life. In other countries, life expectancy at 65 has increased at a rate close to 1 month per year,
but this has varied considerably across time and regions. In some countries the shift from period to
cohort tables increases life expectancy by 1-2 years, or 5-10%, while in other countries the projected
improvement is close to 0.
A fundamental prerequisite to a well-functioning annuity market is a set of mortality tables that
captures mortality differences across the population and make it possible for companies to offer suitable
products. If the annuity market in India has to evolve, well-developed mortality tables, including
estimated improvement factors, are the first step.
3.4 The Changing Value of the MWR
We calculate the MWR using the government bond term structure as the risk-free discount rate and
the government bond rate + 1.4% as the risky discount rate. Additionally, we use two alternative mortality
tables—the 94-96 table and the 96-98 table. The latter applies to a select group of high-income annuitants
with much greater longevity, the former is a more general cross-section of the EPF population, and
both have much lighter mortality than the average population member. Previous studies of the MWR in
other countries have shown rates that are close to, and sometime exceed 100%. But many of these other
countries have quite competitive insurance industries. We sought to determine whether the MWR would
also be high in India, in which the LIC has had a near-monopoly for many years.

We first obtained payout data for October 31, 2001. During 2001-02, as observed above, interest
rates fell dramatically. Therefore, we obtained a second set of payout data for July 19, 2002, to measure
the response of the annuity market. Table 3 shows that most payouts fell by 23-26%, and for the
product that guaranteed return of purchase price, payouts fell by 33%.
Table 3: Annual payout for Rs. 100,000 premium in New Jeevan Akshay- I immediate annuities
at age 65—June 19, 2002 versus October 31, 2001
Annual payout
Product 2002 2001 New/old ratio
SPIA 10,128 13,240 .77
5 YG 9996 13,020 .77
10 YG 9600 12,540 .77
15 YG 9072 11,970 .76
20 YG 8484 11,410 .74
Joint SPIA (50%) 8964 12,140 .74
Escalating SPIA 8484 11,400 .74
Return of purchase price 6960 10,330 .67
We sought to determine the degree to which this sharp drop in payouts is explained by: 1) changes
in interest rates, 2) the shift in mortality tables from 94-96 to 96-98, or 3) other factors. We hypothesized
above that falling interest rate levels would lead to lower payouts but constant MWRs, ceteris paribus,
and greater longevity would have this same effect, but other factors might reduce the MWR. Table 4
throws light on how much each of these factors contributes to the change in payouts.
Columns 1 and 2 display the MWRs calculated using original payouts with the old interest rates;
column 1 shows MWRs for the average EPF population member and column 2 for the average annuitant.
For the single premium immediate annuity (SPIA), the difference in MWRs due to selection is 8%. But
for both groups, the MWRs on all products are very high—approximately 100% for the EPF population
and 107-11% for annuitants. From the vantage point of the average annuitant who used this discount
rate, the expected value of payouts far exceeded the initial premium (col. 2). From the vantage point of
the supplier, LIC, it was coming to realize that this pricing policy involved a large potential loss, given
the greater longevity of its annuitant group compared with the EPF population ((MWR in col. 1 around
100% but in col. 2 far > 100%). The MWR is particularly high for the 15 and 20 year guaranteed
products. Such high MWRs indicate that insurance companies felt they would be able to earn a higher,
possibly riskier rate of return in the long run, to cover their costs and profits and, furthermore, they did
not anticipate sharply higher mortality. Both of these expectations were undercut in 2000-2002.
Columns 3 and 4 show what happened to these MWRs when interest rates fell in 2002—suddenly
MWRs shot up by 8-9%. LIC now found itself in a perilous position—it was returning an expected
stream of benefits that were 18% more than the present value of premiums collected. Of this 18% total,
about half was attributable to the fact that annuitant life expectancy was greater than that for the EPF
population as a whole (the difference between columns 1 and 2)—information that they had developed
two years previously. The other half was due to the sudden decrease in interest rates, which meant that
they could no longer earn as high a rate of return on investments as they had in the past (the difference
between columns 2 and 4). We conjecture that LIC (correctly) found this to be a non-sustainable situation
and decided to adjust payouts downward.
Columns 5 and 6 show the MWRs based on the new payouts and new interest rates. For annuitants,
the MWRs have fallen to roughly 90% for most products, and for the average EPF population member,
they have fallen considerably below that. (For the SPIA, the MWRs are 89% and 81%, respectively).
Therefore we find that payouts were adjusted by much more than was necessary to restore financial
balance. If the object of LIC had been to get back to its 2001 position (MWRs in col. 2), payouts could
have been adjusted downward by only 7%. If the object was to use this opportunity, as well, to take
account of the new information about life expectancy, and get the MWR of annuitants back to 100%,
payouts could have been adjusted downward by 15%. Instead, payouts were adjusted downward by
25%, on average. Thus, about 30% of the cut in payouts is explained by the interest rates drop and
another 30% by the shift to the use of lighter annuitant mortality tables. The decision to impose a much
higher load factor—about 10% of the premium—explains the remaining 40% of the cut. This experience
in India contrasts with cross-country comparisons in which interest rate differentials play the major
role in explaining payouts differentials (James and Song 2001).

Why has the load factor risen so dramatically, from less than nothing to 10% of the premium? We
hypothesized above that a flattening out of the yield curve would lead to higher loads, because this
would reduce the gain to the LIC from mismatching short-term liabilities against long-term assets
(expecting that sufficient liquidity would be provided by new premiums). These results are consistent
with that hypothesis. It is also possible that the drop in interest rates led LIC to expect still further
drops, and therefore to greater reinvestment risk. It would require a higher load to cover that risk.
Closely related, regulatory and/or socio-political factors may have led LIC to follow a smoothing
policy and delay reductions in payouts in 2001, even when annuities were known to be underpriced
based on the new longevity information. The sharp drop in interest rates in 2002 may have given the
LIC a political opportunity to adjust payouts to these longer-term factors. Moreover, the reevaluation
of expected longevity may have led to a realization that the company had lost money on previous
annuity sales, and it may have decided to recoup this loss by making a larger profit on its new annuitants.
This would imply an ex post intergenerational redistribution from new retirees who will receive inferior
payouts, to old retirees, who already locked in higher payouts. As the insurance market becomes more
competitive, LIC will not have the market power to bring about such intergenerational redistributions,
but it still has that capacity now. Finally, we know that the company decided to build in an ad hoc safety
factor in view of future mortality improvements, and part of the new load undoubtedly reflects that
decision. In other words, 2002 may have been seen as an opportune moment for delayed and anticipatory
adjustments (reacting to past actuarial losses and anticipated future drops in interest and interest rates),
rather than simply a moment for adjusting to the immediate interest rate changes.
We do not know which of these explanations played the largest role in LIC’s decision to cut payouts,
but we do know that this decision means that the expected present value of payments that annuitants
will receive is only 90% of the initial premium, instead of over 109%, as it was one year ago. (For other
MWR calculations see Appendix).

Table 4: Impact on the MWR of the shift to lower payouts: how much was due to lower
interest rates, higher mortality or other factors?
Old payouts & int. rates, EPF pop. Old payouts & int. rates, annuitants O l d
payouts, new int., EPF pop. Old payouts, new int., annuitants New payouts & int.
rates, EPF pop. New payouts & int. rates, annuitants
SPIA 99.8 108.8 105.9 116.5 81.1 89.2
5YG 101.3 109.1 107.3 116.7 82.4 89.6
10YG 104.7 110.0 110.9 117.6 84.9 90.1
15YG 107.8 110.8 115.4 119.2 87.5 90.4
20YG 109.6 110.9 118.8 120.6 88.4 89.6
50% to spouse on death 99.7 107.1 106.4 115.4 78.6
85.2
3% escalating 103.5 115.1 111.2 125.1 82.7 93.1
3.5 The lower MWR when discounting at the ‘risky’ discount rate
Some individuals may use a higher discount rate in evaluating the worth of an annuity. This would
include people with a higher time preference and those who prefer to accept higher risk in exchange for
a higher expected return. Some people would prefer to have a consumption stream that is more heavily
weighted toward early retirement, rather than later retirement by which time they may die or be too ill
to enjoy their money. We therefore evaluated the old and new payouts at a riskier rate of treasuries +
1.4%. Not surprisingly, the MWR falls substantially. Comparing columns 1 and 2 in Table 5 with
columns 1 and 6 of Table 4, we see that the higher discount rate leads to a drop of about 7% in the
MWR. Recent studies indicate that the rate of time preference may be much higher than government +
1.4% for many people.7 For individuals with higher discount rates, the perceived load factor from
current payouts would be higher still. The smaller MWR perceived by many potential consumers may
go far toward explaining why the demand for annuities has been low in India and most other countries.
Giving consumers the possibility of a higher return through a variable annuity in which risk is shared
between annuitant and insurance company may be a way to satisfy one segment of this excluded market.

Table 5: The money’s worth ratio with the risky rate
Old payouts, old risky rate, 94-6 mortality table New payouts, new
risky rate, 96-8 mortality table
SPIA 92.75 81.72
5YG 94.22 82.16
10YG 97.15 82.55
15YG 99.5 82.49
20YG 100.35 81.24
50% to spouse on death 92.2 77.69
3% Escalating 95.3 84.26
3.6 The lower MWR for the average population member—adverse selection?
Table 4 also exhibits lower MWRs for the 1994-96 assured life table than the 96-98 annuitants table
(compare columns 1 versus 2, 5 versus 6). As a typical example: using the risk-free rate, an average
EPF worker who bought an individual level SPIA in June 2002 will get an MWR of only 81% compared
with 89% for the average annuitant. The average population member, who does not purchase insurance,
would have a still lower MWR. This phenomenon, sometimes ascribed to adverse selection, is often
given as the reason for low purchase of annuities. In interpreting these data, it is important to distinguish
between ‘active’ selection that is due to asymmetric information about expected longevity and ‘passive’
selection that is due to positive correlations between socio-economic status, longevity and purchase of
annuities. The latter can be handled by the judicious use of risk classification by insurance companies
(placing individuals into appropriate risk categories according to observable characteristics that are
correlated with risk) while the former is an example of market failure due to unobservable risk factors.8
This is discussed further in the section on policy issues.
Here we simply note that some annuity products imply much less selection than others. For example,
the MWR of annuities with 15 or 20-year guarantees is almost the same for the EPF and annuitant

populations. Since payment over a long period is required, to the estate if the primary beneficiary dies
early, such products do not place short lived annuitant at a big disadvantage (although it may be his
family rather than he himself who enjoys the benefits). This is an illustration of a product that is likely
to have much appeal if the annuity industry plays an important role in a reformed pension system. In
contrast, the accelerating annuity, whose benefits are back-loaded, will appeal to people who expect to
live a long time. As discussed further in the Conclusion, such product variation is one way to
accommodate population diversity.
4 Administrative Costs
Insurance companies must cover their costs and profits out of the load they charge on annuities and
other products, plus their investment earnings. To understand their loads, therefore, it is necessary to
understand their administrative costs and investment returns. This section and the next deal with these
issues.
It is difficult to obtain cost information, but we present data from the LIC published annual reports
and from the Pocketbook of Statistics. Unfortunately, these data do not disaggregate between annuities
and life insurance. One of the biggest cost items internationally is marketing costs—much as it is for
the accumulation stage of retail retirement accounts. According to the LIC report, commissions to
agents and salaries to other staff account for 9.13% and 9.52% of total premium income respectively,
and other management costs amount to 2.5%. LIC officials claim that sales commissions on annuities
are much lower—on immediate annuities only 2% and on deferred annuities 7.5% on first year premiums
and 2% thereafter, rates that are quite low by international standards. Immediate annuity commissions
may be lower than for life insurance because the entire premium is paid up front and doesn’t require
constant new “selling” each year, in contrast to other policies that must be renewed annually. The
absence of product differentiation further limits opportunities for marketing and sales commissions.
However, the opening up of the insurance sector in India combined with a growth in number of private
players may increase marketing expenses in the future.
c
In addition to marketing expenses, annuities involve record-keeping and communication costs.
These are likely to be low as a percent of total premium because each annuity policy, is relatively large

compared with the average life insurance account and costs are a fixed amount per account, hence
small relative to premiums (Table 1). The need to invest reserves incurs another cost element. Bond
investments by large investors incur costs of less than 30 basis points elsewhere, but costs may be
higher in India. Finally, reinvestment and mortality risk are real costs that must be compensated.
International evidence suggests that the keys to lower administrative costs in the annuity stage, as
in the accumulation stage, of retirement savings accounts, are large account size and low marketing
expenses. These conditions, especially the second one, seem to be satisfied reasonably well in India
compared with other countries. In all, it seems unlikely that administrative and marketing costs exceed
12% of premiums, a range that is consistent with that in other countries (James, Vittas and Song 2001).
This could be paid through a 12% load (if MWR = 88%), or (if MWR = 100%) through investment
earnings that exceed the government term structure by at least 1.5 percentage points. It is possible that
the LIC counted on higher investment earnings in the past but is now relying on a higher load.
5. Investment Portfolios and Returns of Annuity Companies
In well-developed insurance markets, insurance is a spread business. Companies pay annuitants the
risk-free government rate but invest in a mixed portfolio that includes corporate bonds, mortgage-
backed securities and some equities. They cover their costs and profits, in part, on the spread between
the risk-free and the risky rate. They intermediate this risk, providing a safer investment to annuitants,
by a variety of techniques, including portfolio diversification, product diversification, reinsurance,
using stockholders as buffers in case of financial difficulty, and giving policy-holders high priority in
case of bankruptcy. The spread enables insurance companies to provide a high MWR, sometimes
exceeding 100%, to annuitants.
Of course, the spread comes at the expense of a riskier portfolio, including higher default risk and
reinvestment risk. Regulation is required to prevent excessive risk that will make it difficult for companies
to keep their promises later on. However, over-regulation prevents the companies from earning the
spread, and results in higher cost to potential consumers. Therefore, a narrow line must be walked by
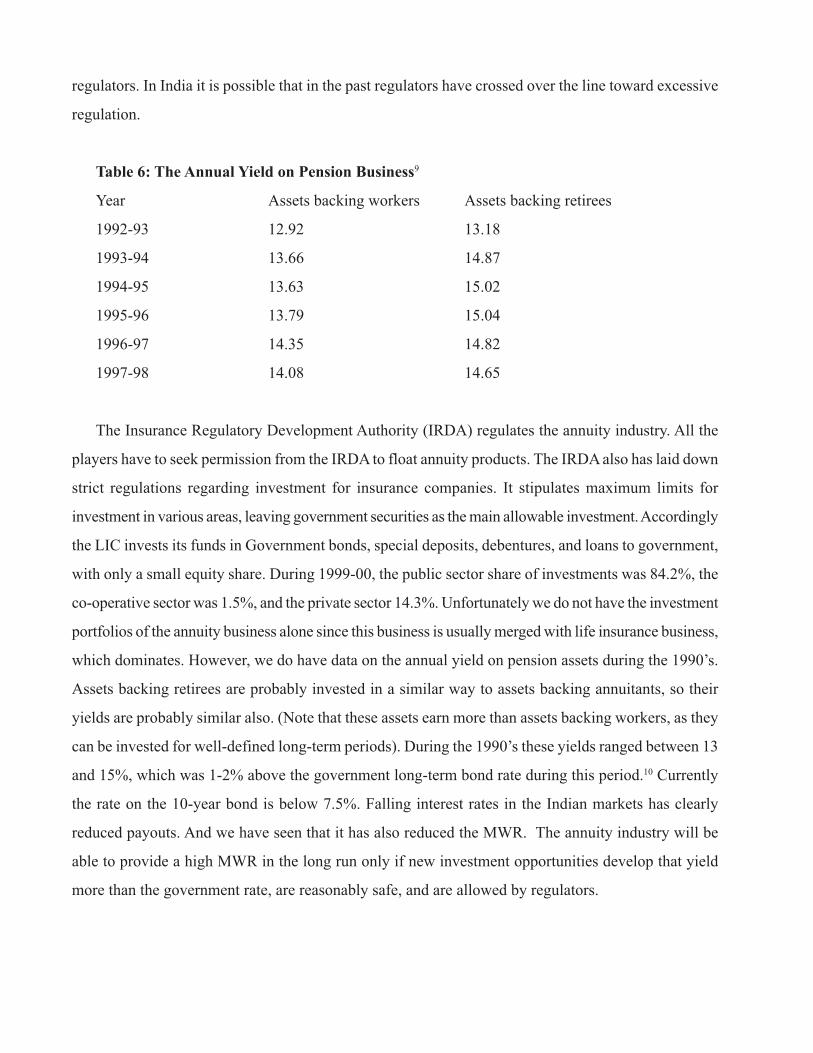
regulators. In India it is possible that in the past regulators have crossed over the line toward excessive
regulation.
Table 6: The Annual Yield on Pension Business9
Year Assets backing workers Assets backing retirees
1992-93 12.92 13.18
1993-94 13.66 14.87
1994-95 13.63 15.02
1995-96 13.79 15.04
1996-97 14.35 14.82
1997-98 14.08 14.65
The Insurance Regulatory Development Authority (IRDA) regulates the annuity industry. All the
players have to seek permission from the IRDA to float annuity products. The IRDA also has laid down
strict regulations regarding investment for insurance companies. It stipulates maximum limits for
investment in various areas, leaving government securities as the main allowable investment. Accordingly
the LIC invests its funds in Government bonds, special deposits, debentures, and loans to government,
with only a small equity share. During 1999-00, the public sector share of investments was 84.2%, the
co-operative sector was 1.5%, and the private sector 14.3%. Unfortunately we do not have the investment
portfolios of the annuity business alone since this business is usually merged with life insurance business,
which dominates. However, we do have data on the annual yield on pension assets during the 1990’s.
Assets backing retirees are probably invested in a similar way to assets backing annuitants, so their
yields are probably similar also. (Note that these assets earn more than assets backing workers, as they
can be invested for well-defined long-term periods). During the 1990’s these yields ranged between 13
and 15%, which was 1-2% above the government long-term bond rate during this period.10 Currently
the rate on the 10-year bond is below 7.5%. Falling interest rates in the Indian markets has clearly
reduced payouts. And we have seen that it has also reduced the MWR. The annuity industry will be
able to provide a high MWR in the long run only if new investment opportunities develop that yield
more than the government rate, are reasonably safe, and are allowed by regulators.

A particular gap in the Indian financial market at present is the absence of very long term instruments.
The average term of corporate bonds in India is about seven years. Only recently were government
securities with a term of twenty years introduced. Most companies are therefore at risk of a huge asset-
liability mismatch. According to one official from Tata AIG, new entrants to the annuities market
would be deterred by the high reinvestment risk, given that the annuity liability is very long term yet
long-term financial instruments are scarce. All market players we spoke to were consonant with the
view that a vibrant secondary market for securities is needed if the annuity industry is to take off.
Further, the development of the debt market becomes crucial for the development of the annuity industry.
Regulators will also have to face the critical question of whether and how much investment to permit in
Indian and foreign equity markets. Another bottleneck is the unavailability of indexed-linked bonds,
which makes it difficult for Indian insurers to provide a real annuity or other price-indexed insurance
products, as they can in the UK and Chile (Brown, Mitchell and Poterba (2000); James, Song and
Vittas (2001)).
.
6. Policy issues
We have alluded, in this paper, to several controversial issues that need to be thought through at the
policy level at an early stage of the industry’s development. For example:
• Should insurance companies be permitted to put people into different risk categories based on
gender, race, caste, location, health, family history, DNA, occupation, etc.?
Whenever permitted, insurance companies operating in well developed markets generally collect
information that allows them to place people into different risk categories, which will be charged
different prices. This helps companies avoid adverse selection due to asymmetric information and it
permits pricing that low risk (low longevity) groups would find attractive. If annuity companies were
to face a potentially increased market due to pension reform, we can predict that they would begin to
categorize people according to characteristics that are known to be correlated with longevity—gender,
caste, income, education, health status, etc. This gathering of information and risk categorization would
benefit groups such as the poor, uneducated and sick, who are expected to die at a relatively early age.
It avoids the perverse redistributions away from these groups toward more advantaged groups that
occurs when everyone is placed in a common pool. If differentiated, these vulnerable groups will get

better monthly payouts for a given premium and their financial wealth will improve. However, such
information collection and risk categorization might violate important social norms and personal privacy.
For example, in the US it would probably be illegal to differentiate according to gender or race. Indian
policy-makers need to think through which kinds of risk classification would be permitted, encouraged,
and prohibited, in the Indian context. And then they would have to begin building the differentiated
mortality tables that would allow the desirable kinds of risk classification to take place.
• How much and what kinds of product variety should be encouraged?
On the one hand, having a range of permissible products enables people to satisfy their diverse
preferences about bequests, timing of distributions, control over investments, etc. On the other hand,
consumers will be better able to evaluate the risks and make price comparisons, and regulators will be
better able to determine appropriate standards, if the product is somewhat standardized. Some limited
range of products would satisfy both set of objectives, but policy-makers need to decide where to draw
the line. In thinking this through, at least two types of products ought to be strongly encouraged: joint
annuities and annuities with guaranteed payment periods.
Many women will not work in the formal labor market for most of their adult lives, and therefore
don’t acquire a pension of their own. Yet, they may outlive their husbands for many years. How will
they have some reasonable financial security in their old age, as the informal extended family system
of support weakens? Joint annuities are probably the best way to provide security to surviving spouses
and for this reason, many countries with funded individual accounts require this.11 It should probably
be strongly encouraged in India also. (Of course, joint annuities imply a smaller monthly payout to the
primary beneficiary, as we have already noted).
Companies should also be encouraged or required to provide annuity products with guarantee
payment periods, such as 15 or 20 years, and indeed we see that LIC does this already. Guaranteed
terms and joint annuities reduce cross-subsidies between groups with high and low life expectancies
and thereby reduce adverse selection. Our MWR analysis showed that the low longevity population
and high longevity annuitants received similar expected payments from the 15 and 20 year period
certain products. Low risk workers are therefore likely to choose these products, which give them
better terms than other products. If risk classification is limited, by social policy or absence of good

mortality data, offering such products into which the low risks can self-select themselves is a plausible
way to prevent perverse redistributions and adverse selection out of the annuity market altogether. In
the context of a pension reform, it is vital to provide information to consumers in a way that allows
them to figure out which product is best for them.
Another form of product is the variable (participating) annuities in which annual payouts vary with
investment returns. Usually such annuities feature some annuitant control over investment strategy,
and part of the investment is in stocks. Low income annuitants may feel they cannot take this risk—a
fixed joint annuity may be best for them. But, as we saw at the beginning of this paper, high-income
annuitants have a strong preference for variable annuities, and for the higher investment return they
allow. The challenge is to develop a regulatory regime that permits variable annuities while limiting the
risk and ensuring that consumers understand their pros and cons.
Price-indexed annuities are another product with great appeal to analysts and policly-makers, since
they protect annuitants from unexpected inflation. If the inflation rate is 5%, the purchasing power of a
nominal annuity will be cut in half in 14 years. Many annuitants will live longer than 14 years after
retirement. Without an indexed annuity they may find themselves in relative poverty when they are
very old. However, to acquire an indexed annuity means taking a sharp reduction in the initial monthly
payout, to compensate for the fact that it will rise through time—and many potential annuitants with
high discount rates would not like this trade-off. Moreover, in India it will be costly and practically
impossible for insurance companies to provide price-indexed annuities in the absence of index-linked
financial instruments for investment. As noted above, the absence of indexed government bonds is one
of the weaknesses of the Indian financial market. Until they are available, a promise by insurance
companies to index annuities is not credible, they would probably be dubious about providing such a
product and it should not be encouraged.
• Should annuitization of retirement savings be mandatory or voluntary?
This is likely to be one of the most controversial issues in India. On the one hand, the rationale for
mandatory social security is that people are myopic, may not save enough for their old age, and may
live in poverty or become a charge on the public treasury when they become very old—the moral

hazard problem. This suggests that steps are needed to ensure that people who have accumulated savings
in mandatory pension accounts don’t spend these savings too quickly. Moreover, mandatory annuitization
is sometimes seen as a way to avoid adverse selection and thereby increase payouts. On the other hand,
people have many legitimate reasons for not wanting to turn their entire savings accumulation into a
fixed income stream. Those with no other resources to meet emergency needs have a large precautionary
demand for savings and a high discount rate for a fixed income stream. Those in poor health or with
low survival probabilities for other reasons see a small expected value from a long-term income stream.
Forcing these groups to annuitize may not make them better off. / While mandatory annuitization provides
longevity insurance to everyone, it redistributes to those with long expected lifetimes—unless extensive
risk and price differentiation are permitted. In India, most industry people we spoke to favored mandatory
annuitization, as the only way to prevent a quick consumption of retirement savings. But mandatory
annuitization presupposes a well-developed annuity industry with the potential for risk and product
differentiation, and many steps need to be taken before this is achieved in India.
• Finally, what special regulations are needed?
Currently most insurance companies do not segregate the assets backing their annuity business,
making it difficult to apply different investment regulations. Is asset segregation advisable as the annuity
business grows? Annuity guarantees span long time periods—as much as 40 years after retirement and
even longer in the case of deferred annuities. How do we avoid the danger that companies may make
overly-optimistic assumptions regarding future mortality rates and investment returns, in order to increase
their current market share, even though this may result in large future losses and inability to pay? What
kinds of reserves, reinsurance, or use of derivatives are needed to back their guarantees credibly? What
provisions should be made for good disclosure and consumer education? Also, as pointed out earlier,
taxation policy serves as a major incentive/disincentive for purchasing annuities. On the one hand, tax
incentives seem to have a large impact on the demand for annuities, so can be viewed as an attractive
alternative to mandatory annuitization. On the other hand, tax incentives cost the government foregone
revenues and imply a non-transparent tax redistribution toward high earners who are most likely to
purchase annuities. Mandatory annuitization avoids these tax costs but incurs other disadvantages
mentioned above.

Conclusion
The underdevelopment of the Indian annuity industry manifests itself in its small size relative to
other kinds of insurance, absence of well-developed mortality tables which are a prerequisite to sound
pricing and funding policies, and the paucity of long term financial instruments with which to match
assets and liabilities. It is perhaps symptomatic of the undeveloped state of the industry that unrealistically
generous payouts with very high money’s worth ratios—far exceeding 100%—were offered until this
year. However, the substantial drop in payouts by LIC in 2002 was much greater than warranted by
falling interest rates and resulted in a decline in MWRs to 90%, an increase in the load from less than
nothing to over 10%. Further analysis is needed to understand why the LIC decided on such a dramatic
cut at this time, but we have suggested several reasons, including fears of further drops in interest and
mortality rates and recognition of actuarial losses in the past.
We have identified institutional gaps that the industry and government will have to address
expeditiously, in order for annuities to play an important role in the forthcoming pension reform.
• Long term securities, including government and corporate bonds and mortgage-backed securities,
will have to be issued, to reduce reinvestment risk and permit a better matching of assets and
liabilities.
• Debt markets and secondary markets for securities will have to be better developed.
• Mortality tables must be constructed for different segments of the population, and careful
estimates made of potential improvement factors, with sensitivity analysis for alternative
scenarios.
• New annuity products should be created that have broader popular appeal.
• Analyses should be undertaken of administrative and marketing costs, with the object of
determining ways to keep them low.
• New regulatory procedures and indicators are needed to govern an industry that is expected to
increase in size and complexity. This must include mechanisms for communicating information
to potential consumers about the benefits, costs and risks of alternative annuity products. Tax
policy also needs to be rethought—should annuitization be encouraged by tax advantages (but
will this have adverse distributional consequences, in view of the high income elasticity of
demand for annuities?)

We have also discussed key controversial issues that need to be thought through at the policy level.
The most important include:
• Should insurance companies be permitted to put people into different risk categories based on
gender, race, caste, location, health, family history, DNA, occupation, etc.?
• How much and what kinds of product variety should be encouraged?
• Should annuitization of retirement savings be mandatory or voluntary?
• Finally, what special regulations are needed?
We hope that this paper has laid out an agenda for future empirical research and policy analysis that
would enable annuity markets to efficiently play the important role they are likely to have in India’s
forthcoming pension reform.

Appendix
Table A: MWR using new and old payouts for both sets of mortality tables, using the
government term structure of interest rates prevailing at the relevant times (Oct. 31, 2001 for old
payouts and June 19, 2002 for new payouts).
1994-96 mortality table 1996-98 mortality table
New payouts Old payouts New Payouts Old Payouts
SPIA 81.05 99.83 89.15 108.79
5YG 82.36 101.32 89.57 109.12
10YG 84.93 104.65 90.06 109.98
15YG 87.45 107.82 90.37 110.78
20YG 88.35 109.63 89.64 110.94
50% to spouse on death 78.59 99.69 85.23 107.09
Escalating at 3% 82.72 103.49 93.13 115.05

Table B: Comparison of MWRs calculated using the old and new interest rates for the new
payouts.
1994-96 mortality table 1996-98 mortality table
Old interest rates New interest rates Old interest rates New interest rates
SPIA 76.42 81.05 83.22 89.16
5YG 77.79 82.36 83.72 89.57
10YG 80.11 84.93 84.14 90.1
15YG 81.72 87.46 83.9 90.4
20YG 81.52 88.36 82.44 89.64
50% to spouse on death 73.61 78.6 79.02 85.23
Escalating at 3% 77.02 82.72 85.6 93.13

Table C: MWR with the risky rate—government term structure + a 1.4%.
(Old payouts using interest rates as of 31 October 2001 and new payouts using interest rates
as of 19 June 2002)
1994-96 mortality table 1996-98 mortality table
New payouts Old payouts New Payouts Old Payouts
SPIA 74.9 92.75 81.72 100.38
5YG 79.19 94.22 82.16 100.75
10YG 78.45 97.15 82.55 101.47
15YG 80.25 99.5 82.49 101.8
20YG 80.3 100.35 81.24 101.32
50% to spouse on death 75.24 92.2 77.69 98.33
Escalating at 3% 75.66 95.3 84.26 104.95

References
Brown, Jeffery, Olivia Mitchell and James Poterba. 2000. “The role of real annuities and indexed
bonds in an Individual Account Retirement Program.”
Bernheim, Douglas, Lorenzo Forni, Jagadeesh Gokhale and Lawrence Kotlikoff, “Mismatch Between
Life Insurance Holdings and Financial Vulnerabilities—Evidence from the Health and Retirement
Survey” American Economic Review, forthcoming 2003.
Finkelstein, Amy and James Poterba. 2000. “Adverse Selection in Insurance Markets: Policyholder
Evidence from the UK Annuity Market”. MIT and NBER.
Gupta, P. C. 1998. “LIC’s Experience with Management of Pension and Superannuation Funds.”
Commissioned by Project OASIS.
James, Estelle, Alejandra Cox-Edwards and Rebeca Wong. 2002. “The Gender Impact of Pension
Reform: A Cross-Country Analysis, World Bank discussion paper.
James, Estelle and Xue Song. 2001. Annuities Markets Around the World: Money’s Worth and Risk
Intermediation,” CeRP Working Paper 16/01.
James, Estelle, Xue Song and Dimitri Vittas. 2001.“Annuities Markets Around the World.” American
Economic Association meetings, January 2001.
James, Estelle and Dimitri Vittas. 1999.”Annuities Markets in Comparative Perspective: Do Consumers Get
Their Money’s Worth?” Conference on New Ideas for Old Age Security, World Bank.
James, Estelle and Dimitri Vittas. 1999. “The Decumulation (Payout) Phase of Defined Contribution Pillars.”
Presented at APEC meeting, Chile, 1999, and published in conference volume.

Mitchell, Olivia, James Poterba and Mark J. Warshawsky. 1997. “New Evidence on Money’s Worth
of Individual Annuities.” Working Paper 6002, National Bureau of Economic Research.
Murthi, Mamta, J Michael Orszag and Peter R. Orszag. 1999. The Value for Money of Annuities in
the UK: Theory, Experience and Policy.
The Project OASIS Report. 2000. Submitted to the Ministry of Social Justice and Empowerment.
Shane, Frederick, George Loewenstein and Ted O’Donoghue. 2002. “Time discounting and Time
Preference: A Critical Review.”
Journal of Economic Literature. Vol XL, No. 2, June 2002.
Wadsworth, Mike, Alec Findlater and Tom Boardman. 2001. “Reinventing Annuities”, Presented to
the Actuarial Inn Staple Society.
(Footnotes)1 The formal system consists of 1) a pay as you go defined benefit (DB) scheme for government employees, 2) a defined
contribution (DC) scheme for private sector workers called the Employees Provident Fund (EPF), which takes in
contributions from the employee, employer and the government, and 3) the Employees Pension Scheme (EPS) which
offers defined benefits of up to a maximum of 50\% of the average of the last 12 month’s salary. Besides these are Gratuity
and Superannuation schemes (which can be DB or DC), run by the employer. Under the Superannuation scheme, one third
of assets can be commuted tax-free upon retirement. Other retirement plans include the UTI retirement plan and the
Kothari Pioneer Pension Plan, which are mutual fund schemes in which the worker saves until age 58. At the age of 58, the
worker can take the money out as a lump sum or leave it invested and receive a pension in the form of dividends declared
on the underlying securities in the plan.
2 Unlike the case in other countries where deferred annuities are popular, purchasers of “deferred annuities” in India are
required to annuitize upon retirement.†They can take out 25% of their premiums plus interest as a lump sum,†but 75%
must be converted to a life annuity at terms prevailing on the date of conversion. In the past, LIC specified the conversion
terms on the date the deferred annuity was initially purchased. Recently, this arrangement was changed and the conversion
terms are now unspecified until retirement. In effect, this passes the intermediary investment and mortality risk on to the
prospective annuitants. This change in LIC policy may be a response to declining interest and mortality rates and a
realization that these declines may continue. It is consistent with the higher load that LIC now imposes on immediate
annuities—the topic of this paper.††
3 For further elaboration of reasons for low levels of annuitization see James and Vittas 1999.4 For a further discussion see “Reinventing Annuities”, Wadsworth, Findlater and Boardman (2001); James and Song
2001.5 For a comprehensive discussion of discount rates see Shane, Loewenstein and O’Donoghue 2002.6
This was the case, for example, in Switzerland, where insurance companies were required to guarantee at least 4% nominal
during the accumulation stage and to use a 7.2% actuarial factor at the payout stage, since 1985. With interest rates falling,
these requirements have decreased only recently. In Singapore, companies are expected to hold their annuity rates constant

for 6 months. In contrast, in the freer and more competitive Canadian and US markets, annuity payouts can change every
day.
7 For many references see Shane, Loewenstein and O’Donoghue 2002.8 For analyses of active and passive adverse selection in the UK see Finkelstein and Poterba (2000) and Murthi, Orszag
and Orszag (1999).9 See Gupta (1998)10 See “Reports on Currency and Finance”, RBI.11 For empirical evidence that families carry out insufficient saving and insurance to cover surviving spouses, see
Benheim et al. 2002. For evidence on the importance of joint annuities in maintaining the standard of living of widows
in social security systems that include individual accounts see James, Cox-Edwards and Wong 2002.