Embed Size (px)
Citation preview
The Approach to Mutation-Selection Balance in an Infinite Asexual Population, and theEvolution of Mutation RatesAuthor(s): Toby JohnsonSource: Proceedings: Biological Sciences, Vol. 266, No. 1436 (Dec. 7, 1999), pp. 2389-2397Published by: The Royal SocietyStable URL: http://www.jstor.org/stable/51693 .
Accessed: 07/05/2014 19:45
Your use of the JSTOR archive indicates your acceptance of the Terms & Conditions of Use, available at .http://www.jstor.org/page/info/about/policies/terms.jsp
.JSTOR is a not-for-profit service that helps scholars, researchers, and students discover, use, and build upon a wide range ofcontent in a trusted digital archive. We use information technology and tools to increase productivity and facilitate new formsof scholarship. For more information about JSTOR, please contact [email protected].
.
The Royal Society is collaborating with JSTOR to digitize, preserve and extend access to Proceedings:Biological Sciences.
http://www.jstor.org
This content downloaded from 169.229.32.136 on Wed, 7 May 2014 19:45:29 PMAll use subject to JSTOR Terms and Conditions

4TH THE ROYAL I9i SOCIETY
The approach to mutation-selection balance
in an infinite asexual population, and the
evolution of mutation rates
Toby Johnson Institute of Cell, Animal and Population Biology, University of Edinburgh, West Mains Road, Edinburgh EH9 3JT, UK (toby.johnson @ ed. ac. uk)
A method is described for calculating the dynamics of the distribution of fitness in an infinite asexual
population which is subject to unconditionally deleterious mutations with independent effects. This method is applied to the problem of calculating the frequency of a mutator subpopulation, at equilibrium between mutation and indirect selection due to association with deleterious mutations. Many mutator alleles are produced by loss-of-function mutations in polymerase or mismatch repair genes. Previous calculations have ignored the fact that this creates a flux of higher fitness individuals into the mutator
subpopulation. This flux raises the mean fitness of the mutator subpopulation, and when this factor is taken into account, the frequency of the mutator may be more than an order of magnitude greater than recent theoretical work has suggested.
Keywords: mutation-selection balance; mutator; evolution of mutation rates
1. INTRODUCTION
The balance between selection and deleterious mutation is a classic and well-studied problem in theoretical
population genetics. The same model can apply to both an asexual population (for example, Kimura &
Maruyama 1966; Haigh 1978; Dawson 1999), and to a
single polyallelic locus (for example, Kimura 1965; Turelli 1984; Keightley & Hill 1988; Burger 1998). If mutations are unconditionally deleterious, then it is well known that the equilibrium mean fitness of an infinite population, relative to the most fit genotype, is equal to the fraction of individuals who do not mutate each generation. For
example, if mutations arise as a Poisson process at rate U
per generation, then the population mean fitness is e-,
regardless of the distribution or magnitude of mutational effects, or the degree of epistasis (Kimura & Maruyama 1966).
In this paper, I describe a method for calculating exactly the dynamics of the distribution of fitness in an infinite asexual population, subject to selection and
unconditionally deleterious mutation, for the case of no
epistasis. The method is complementary to previous analyses, because (i) it applies for an arbitrary, either discrete or continuous, distribution of mutational effects, provided the mutations act multiplicatively on fitness, and
(ii) it allows calculation of the dynamics of the mean and variance (and higher moments) of fitness, without the need to explicitly consider the whole distribution, but
(iii) it does not extend easily to models which include recombination, drift or epistasis.
I use this method to show that a population approaches the equilibrium distribution of fitness over a time-scale
proportional to 1/ , where s is the mean reduction in log
Proc. R. Soc. Lond. B (1999) 266, 2389-2397 Received 9 August 1999 Accepted 7 September 1999
fitness caused by each mutation. The pace of the
dynamics also slows as the variance of the distribution of mutational effects increases. If, as has been suggested (Ohta 1973; Davies et al. 1999), there is a large class of mutations with small effects on fitness, then the dynamics would be very slow and it would not always be appro- priate to assume that a population is close to equilibrium. For example, in an asexual population, a newly arisen variant which swept to fixation would cause clonal
replacement of the entire population (Atwood et al. 1951). The resulting homogenous population would have a mean fitness of unity relative to its fittest genotype, and would then begin to approach an equilibrium mean fitness e-u relative to that genotype. If the interval between selective sweeps were short compared to the time-scale of approach to equilibrium, then the popula- tion might always be far from equilibrium. A population passing through a series of small bottlenecks would
experience a similar effect. The evolution of mutation rates is also a classic
problem in theoretical population genetics. Indirect selection, due to association with deleterious and lethal mutations, will favour lower mutation rates. This may be opposed by indirect selection due to beneficial mutations, and by a physiological cost of high fidelity replication. Many authors have calculated a single value to which the mutation rate would evolve, under some combination of these forces (for reviews, see Dawson 1998, 1999; Johnson 1999). More recently, computer simulations have been used to explore the phenomenon of strong mutator alleles
hitchhiking to high frequency on beneficial mutations (Taddei et al. 1997a; Tenaillon et al. 1999).
There are both evolutionary and structural reasons for
believing that a random mutation affecting the DNA
389 ? 1999 The Royal Society
This content downloaded from 169.229.32.136 on Wed, 7 May 2014 19:45:29 PMAll use subject to JSTOR Terms and Conditions

2390 T Johnson Frequency ofa mutator allele
polymerase or the mismatch repair system is more likely to reduce the fidelity than to increase it (Drake 1993, references cited therein). Therefore, there will be a muta- tional bias from wild-type towards mutator (mutation- rate-increasing) alleles. In this paper, I calculate the
frequency of a mutator allele at equilibrium between this mutational bias and indirect selection due to deleterious mutations. This frequency is important in determining the probability of a hitchhiking event (Chao & Cox
1983), and in determining how variation at mutator loci is maintained in nature. It has been calculated previously by Ninio (1991), who considered lethal mutations only, ignoring slightly deleterious mutations, and by Tenaillon et al. (1999), who made an assumption equivalent to
assuming that all deleterious mutations are lethal (see below). Therefore a more thorough examination of the role of slightly deleterious mutations in opposing muta- tional bias is warranted.
Consider a mutator allele of strength m (one which elevates the mutation rate to mU) segregating in an asexual population. The classic equilibrium result of Kimura & Maruyama (1966) has often been used to determine the indirect selection acting on a mutator, in the following way (Leigh 1970; Kondrashov 1995; Drake et al. 1998; Dawson 1999). Assume that the population consists of two subpopulations, wild-type and mutator, between which there is no recombination. The equili- brium mean fitnesses of these two subpopulations are e-u and e-mU respectively, and hence the marginal fitness of the mutator allele is e-(m-1)U relative to the wild-type allele. For small mU, the indirect selection against the mutator is approximately (m - 1) U, the amount by which it increases the mutation rate. For one-way mutation from
wild-type to mutator at rate ,/, the frequency of the mutator allele at mutation-indirect selection (MIS) balance has been assumed in recent theoretical work
(Tenaillon et al. 1999) to be given by
mutator frequency = 1 exp[- (1) I - exp[-(m - l) U]'
which, for small (m - 1) U, is approximately A/[(m - 1) U]. (This is analogous to the frequency of a deleterious allele at mutation-selection balance, approximately ,/is, where s is the direct selection against the allele.) When all mutations are lethal, the subpopulations instantly attain their equilibrium mean fitnesses, and equation (1) is correct. Tenaillon et al. (1999), echoing a sentiment of Fisher (1930, p. 136), assumed that all deleterious muta- tions are ultimately lethal,'because they are evolutionary dead ends'.
However, in general it is misleading to consider such a
population as two separate subpopulations, with no gene flow between the two. There is a constant flux of indivi- duals from the wild-type subpopulation to the mutator
subpopulation, produced by mutation at the mutator locus. If deleterious mutations are ultimately, but not
instantly, lethal, then these recruits approach the mutator fitness distribution slowly. This will raise the fitness of the mutator subpopulation substantially, and mutators will be found at higher frequency than predicted by equation (1). For a strong mutator (m = 1000 and with ~s 0.05), Tenaillon et al. (1999) observed MIS balance frequencies
in simulations to be twice the value predicted by equation (1). The method developed in this paper is well suited to quantifying this effect, because the distribution of fitness in the mutator subpopulation is a mixture of distributions derived from the wild-type subpopulation, which will have approached some way towards the mutator equilibrium distribution, according to how
recently they became mutators.
2. MODEL
(a) Definitions The model used here is described in a quite general
way, because it gives rise to simple recursions which have other potential applications. I assume that there is an
effectively infinite, strictly asexual population. The nega- tive log fitness of an individual is denoted x, which may be a discrete or continuous variate. (More simply, fitness w = e-X.) I assume that no new beneficial mutations arise, and therefore there must be at least one fittest genotype, which has fitness w = 1 (and hence x is never negative). The population is described by the distribution of x. The
population may be partitioned with respect to some discrete character (such as the presence of a mutator
allele). In this case, the contributions to the distribution of x made by each subpopulation are fo (x), fi (x),... and the distribution of x in the whole population has density
f(x) j= ifi(x). The fraction of type i in the population is therefore the integral off (x).
Generations are assumed to be discrete and non-
overlapping. There are only two events in the life cycle, selection and mutation, so the ordering does not matter. It is more convenient to choose the census point to be after mutation but before selection. The number of mutations arising per individual, per generation, is a Poisson variate with some mean (U in the wild-type subpopulation). The mutation rate is assumed to be
independent of the fitness of an individual. I assume that mutations have multiplicative effects on fitness, and so
they have additive effects on x. Each mutation increases x by some amount s, drawn independently from a distribution of effects with density d(s). Mutations are
unconditionally deleterious, so that s is always positive. It should be noted that the use of s in this paper is
different to the classical use of the symbol for the selection coefficient in discrete time models (e.g. Kimura &
Maruyama 1966; Haigh 1978; Dawson 1998, 1999), because here a given mutation does not reduce fitness by a factor exactly (1 - s), but by a factor e-s. When s is
small, the two are roughly equal, but here s = oo corre-
sponds to a lethal mutation. The quantity x may also be thought of as the number
of deleterious mutations carried by each individual, scaled by their effects on fitness. The genetic assumptions underlying this model are that the number of loci is
effectively infinite, so that the frequencies of deleterious alleles are vanishingly small, and therefore there is no back-mutation or recurrent mutation. This model has been studied extensively when deleterious mutations have
equal effect (e.g. Kimura & Maruyama 1966; Haigh 1978; Dawson 1999). It is also a special case of the random walk mutation model, in the sense of Burger (1998).
Proc. R. Soc. Lond. B (1999)
This content downloaded from 169.229.32.136 on Wed, 7 May 2014 19:45:29 PMAll use subject to JSTOR Terms and Conditions
Frequency ofa mutatorallele T.Johnson 2391
The Laplace transform (LT) of a distribution denoted here by an overtilde, and is defined as
f (z) e-ZXf (x)dx.
[The related moment generating function for x is gi by Mx(z) f( - z).] The fraction of the population type i is fo f(x)dx =fJ(0). The moments of fitness a have simple expressions in terms of the LT. Let (.) den the expectation, when an individual is chosen at rand from the population. If the fitness of a randomly cho individual of type i is wi, then the nth moment of fitn taken about w = 0, is given by
/00 /(e-x)nf(x)dx (n)
((wi) n) =) ( f(x)dx f(0)
Jo
and hence for a randomly chosen individual from whole population (wn) =f(n) = ZEif(n).
(b) Recursionfor selection Each individual contributes to the next generation
proportion to its fitness. Let f'(x) be the contributior distribution of x by individuals of type i after selecti Then
f'(x) =f(x) (w)
The recursion for selection in terms of the LT is given 1
f'(tz) = fi(xede-Xdx = z 1
(c) Recursionfor mutation Let fi(x) be the contribution to the distribution of x
individuals of type i after mutation. Then (for mutat rate U), take the sum over 0, 1, 2, ... mutations follows:
f"(x) =Uf(x) + Ue-u(f'd)(x)+ e-( dd)(x)+.
where an asterisk (*) denotes the convolution of dis butions. Then the recursion for mutation in terms of LT is given by
00
(z) = (x) e-zxdx
= o .
3. ANALYSIS
(a) Rate of approach to equilibrium First, consider a single population with no mutators.
For this simple model, writef(z) =fo (z). For one genera- tion of selection followed by mutation, the complete recursion is found by combining equations (5) and (7), giving
f(z + 1) eU(d(z)-1) f"(z) -= - fe1 f (1)T (8)
(i) Equilibrium I denote quantities at equilibrium by a superscript
asterisk. Equilibrium fitness distributions exist for any chosen maximum fitness present in the population, so without loss of generality suppose that the fittest geno- type, with fitness w = 1, is present in the population. Then (w) =f*(l) = e-u (Kimura & Maruyama 1966; see also equation (16) below), and a set of higher moments f* (2), f* (3), ..., at equilibrium can be found for any d(s) by rearranging equation (8) as follows, and
applying it recursively.
(9)
For example, consider a distribution of effects composed of n discrete classes, with a fraction ai being in the ith class and having effect si on log-fitness. Then d(s) = E iL oai(S(s-si), where 5(-) is Dirac's delta func- tion. In this case, the expression for the zth moment at equilibrium may be shown to equal
(5) f*(z) = He exp[ - - e-s )- . (10)
Using the convolution theorem for LTs, it can be seen that the numbers of mutations in different classes are indepen- dently Poisson distributed, with the mean for the ith class being aiU/(1 - e-si). For a single class of mutation, this is identical to Haigh's (1978) result, because (1 - e-s) is the selection coefficient in the classical sense.
(ii) Dynamics Consider a population which is initially genetically
homogenous. This could be shortly after a selective sweep has caused clonal replacement in an asexual population, after a severe population bottleneck, or at the beginning of a laboratory experiment founded from a single clone. By defining fitnesses relative to this initial state, we have x = 0 for all individuals at time zero. Thus f(O)(z) = 1, where the superscript (0) denotes time zero. To show the method of solution more clearly, define ?(z) such that f(z) takes the form eU?(). [The related cumulant gener- ating function for x is given by x (z) = Uq (-z).] The recursion for O(z) is simply
(7)
This simple expression is obtained by making use of the convolution theorem for Laplace transforms, i.e. the LTof the distribution of the sum of independent random vari- ables is the product of their individual LTs.
q"(z)= +(z 1) - q(l) + d(Z) - l, (11)
with initial conditions O( (z) - 0. It can then be proved by induction that after t generations (with t > 1, and noting that d(O) = 1 for any d(s)), we have
Proc. R. Soc. Lond. B (1999)
f* (z + 1) =-f* (z)f* (1)e-u(d(z)-l)
This content downloaded from 169.229.32.136 on Wed, 7 May 2014 19:45:29 PMAll use subject to JSTOR Terms and Conditions
2392 T. Johnson Frequency ofa mutator allele
(2) ( ( + ) (1 - ) e( (z
When t is large and z is a small integer, many of the terms in the summation in equation (12) cancel. To find the lower moments, we need evaluate only for small z. A useful simpler form of equation (12) is then (for integer z > 1 andt >z + 1),
Z-1
(z) = (d(t + i)-d(i)). (13) i=O
Note that to find the population mean fitness at time t, we must evaluate the LTof the distribution of mutational effects, d(z), at z = t. Important special cases of equation (13) show that the mean and variance of fitness at time t > 3 are
(w) = eU(d(t)-), (14)
and
var(w) = (w2) (w)2 =eUd(tl)+d(t)-d(1)-1) e2U(d(t)-i). (15)
For any distribution with finite mean, d(t) is a function only of the product st. This is because d(z) can always be obtained from the LT of the equivalent distribution with mean unity (which does not depend on s) by substituting sz for z (see ? 4(a) for examples). Therefore, the dynamics of the lower moments of fitness always proceed over a time-scale proportional to 1/s. In real populations, some mutations are lethal, and so 7 = oo. Although lethal mutations affect the distribution of fitness after mutation (which is when (w) is calculated), they are always elimi- nated by selection, and hence a component of the dynamics corresponding to these lethal mutations is instantaneous, but the pace of the dynamics as a whole is governed by 7, calculated ignoring the lethal mutations.
As t tends to infinity, d(t + i) tends to zero for any proper distribution. Equation (13) then tells us that (for all integer z > 1),
f* (z)= exp -U d(i)) (16) i=0
This satisfies the recursion equation (9), which verifies that finding the limiting state of the dynamics as t -> oo gives the same result as finding the equilibrium directly.
(b) Frequency of a mutator allele In this section I consider a model where there is one
way mutation at rate At from wild-type (fo) to mutator (fl) of strength m. The main quantity of interest is the frequency of the mutator allele, fj(0). At equilibrium, this will give us the MIS balance frequency. Combining recursions (5) and (7) with
f"(z) -(1 -)fi"(z), - (17)
fi"(Z) =f'(z) + tfo'(z), (18)
gives rise to the following complete recursions (for one generation of selection followed by deleterious mutation followed by mutator mutation):
1
f"(z) =fl(z + 1)e.oUm(d(z-) ffo ( 1) +f, (1)
+fo (z+lf) I 1 eU(d(z) ().
fo(l) ?f- (1) (20)
I have been unable to solve equations (19) and (20) directly to find the equilibrium, or even to determine directly whether a unique equilibrium exists. Instead, I take the same approach as for the single population in ? 3(a), and determine the limit to the dynamics as t -- oo.
(i) Dynamics Consider the initial conditions of a wild-type popula-
tion at equilibrium (not a homogenous population, as considered above), with mutators initially absent. This has sufficiently simple dynamics to describe analytically. For these initial conditions (O) (z) =f*(z) (the equilibrium distribution) and f() (z) = 0, it may be shown that the following are always true:
fo t(z) = fo' (0)f* (z), (21)
f*( ) fl.(0) =o(0)(l - (1)- /(
Equation (21) tells us that the distribution of fitnesses within the wild-type subpopulation stays the same shape, which is an obvious property of the model, because muta- tion is one-way. Equation (22) tells us how the size of the wild-type subpopulation changes over time.
The change of variables, y(z) =fi(z)/f(O), decouples the recursions (19) and (20), and the entire system is now described exactly by the single recursion
Y,(z)=7(z -) exp[U(l+m(d(z)-l))] A*(z), 1- Tb if (23)
with initial condition 7() (z) = 0. A proof by induction shows that the state of the population at time t is described exactly by the equation
t-I
i=0 (1 -
l)+
(24)
In this equation, the sum in the exponent may have no terms (when i = 0) and is then considered to equal zero. The special case of equation (24), when z = 0, can be used to determine the mutator frequency at time t by noting that the mutator allele frequency is given by
fi(0) = (0)/(1 + 'y(0)). I have been unable to find an exact expression for the
limit of equation (24) as t - oo. By noting that both
summands are monotonic series, strict upper and lower bounds on parts of the sum can be found in terms of
integrals. For many distributions of mutational effects
(including equal effects, exponential and gamma distri-
butions, and any mixture of such distributions), the inner
Proc. R. Soc. Lond. B (1999)
i=:O
(19)
(22)
x exp -U(m -1) E ( - d(z +j))1 ) j=o
This content downloaded from 169.229.32.136 on Wed, 7 May 2014 19:45:29 PMAll use subject to JSTOR Terms and Conditions

Frequency ofa mutatorallele T.Johnson 2393
1 0
C'i a)
o ct
0
o
ce
0)
? 2 4 6 8 10 200 400 600 800 1000
Figure 1. Dynamics of population mean fitness. An initially homogenous population has fitness w = 1. Four different distributions of mutational effect are shown, gamma with shape parameter 3 = 0.2 (dot-dash line), exponential (solid line), gamma with p = 5 (short dashes) and equal effects (long dashes). All four populations ultimately approach the same equilibrium, with mean fitness (w) = e-U, over a time-scale (t in generations) inversely proportional to the mean effect of deleterious mutations, s. The rate of approach is slower for distributions of mutational effects with large variance.
integral can then be solved analytically. The mutator allele frequency can be bounded numerically, to any desired accuracy, by adding exact terms in the sum for small i (typically up to 100) to the lower and upper bounds on the rest of the sum. These calculations have been automated in a Mathematica (Wolfram 1996) note-
book, available on request from the author. It may appear that, because of the complexity of this
analytical 'solution' for the mutator frequency at time t and at equilibrium, that nothing has been gained over
simply numerically iterating the recursions (19) and (20). However, this is not as straightforward an approach as it
might seem, because these are recursions for functions, so one must iterate either algebraic expressions or histogram- type descriptions of the distributions of fitness. Although finding the mutator frequency as t -- o involves evalu-
ating a sum with an infinite number of terms, because the term for time t does not depend on y, upper and lower bounds on individual terms can be summed without errors compounding as the number of terms increases.
(ii) Approximationfor the mutator allelefrequency Examination of equation (24) gives little understanding
of how the frequency of a mutator allele depends on the model parameters. The following approximate result, valid when s and ,t are small, is therefore illustrative. The LT of any distribution of mutational effects with finite
expectation is d(z) = 1 - sz + O((7z)2), so approximating to leading order in s ignores all information about the
shape of the distribution. Clearly,7 << 1 alone does not
justify making the approximation d(z +j) 1 - s(z +j), because when t is large or infinite, j will be large in some terms of equation (24). However, these problematic terms, for which s(z +j) < 1, are small relative to the complete sum, and can be ignored to a good approximation. Then, assuming also that ,/ << U(m - 1)s, the inner sum of
equation (24) reduces to an arithmetic series. When the outer sum is replaced by an integral, it can then be solved
by completing the square, giving the approximate result
mutator frequency V (2 J2U (m- exp )U(m-l )
x {1-erf [- U(m-1)7)]}, (25)
where erf[.] is the error function. Numerical results (not shown) show that this approximation is reasonable when s s 10-2 and m > 100.
4. RESULTS
(a) Rate of approach to equilibrium Although the analysis above is valid for any
distribution of mutational effects, in this section I concentrate on only a few simple distributions. If all mutations have an equal effect of increasing x by some amount s, then d(z) = e-s. Kimura (1979) modelled mutational effects with a gamma distribution, for which
d(z) = [1 + (sz//3)]- , because for an appropriate choice of shape parameter / there is a large class of mutations of
nearly neutral effect. When /3 = 0.2 the distribution is
L-shaped. Alternatively, when 3 = 1 the distribution is
exponential, and when 3 = 5 the distribution is unimodal centred near the mean, resembling a Gaussian curve.
Figure 1 shows how the mean fitness of a single popula- tion approaches its equilibrium (w) = e-U, from an initi-
ally homogenous population with w = 1, as predicted by equation (14). Curves are plotted for four different shaped distributions of mutational effects, but all with the same mean effect s. The dynamics scale in a simple manner with the mutation rate U and the mean effect of deleter- ious mutations s, but are very dependent on the shape of the distribution of mutational effects. All the populations shown in figure 1 are ultimately approaching the same
equilibrium value for mean fitness, but at very different rates. The smaller the shape parameter 3, the slower the
approach to equilibrium.
(b) Frequency of a mutator allele
Figures 2-4 were constructed by plotting both upper and lower bounds on the frequency of a mutator allele at t = oo, evaluating enough terms in the sum of equation (24) exactly to make the bounds indistinguishable and
appear as a single curve. All of these results were calculated using u = 5 x 10⁻⁷. This is a reasonable estimate for Escherichia coli (Taddei et al. 1997b). The results remain general because, when /t is small, the mutator frequency is linear in /u, for both this calculation and when all deleterious mutations are assumed lethal
Proc. R. Soc. Lond. B (1999)
This content downloaded from 169.229.32.136 on Wed, 7 May 2014 19:45:29 PMAll use subject to JSTOR Terms and Conditions
2394 T. Johnson Frequency ofa mutator allele
10-3
u C) a a a a' a a
a a a) a
10-4
10-6 1CT6
10 100 1000 m
10 000
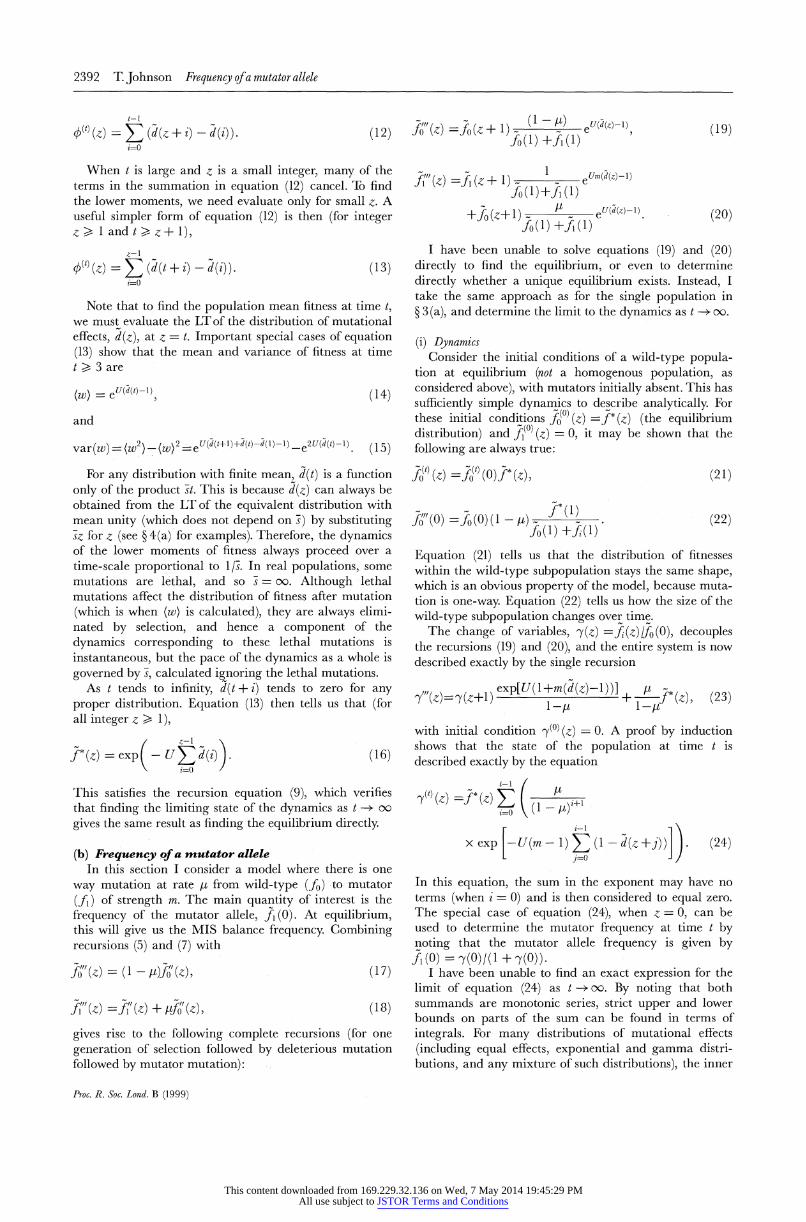
Figure 2. Log-log plot of mutator allele frequency against mutator strength, m, for three different values of mean deleterious mutation effect: s = 10-3 (dash-dot line), s = 10-2 (solid line) and s = 10-' (long dashes). Distributions of mutational effects are all exponential. The mutator allele frequency according to equation (1), when all deleterious mutations are lethal, is shown for comparison (short dashes). Other parameters are t = 5 x 10⁻⁷ and U = 2 x 10⁻⁴.
o
10- l
10-4 10-3 10-2 10-1
Figure 3. Log-log plot of mutator allele frequency against mean effect of deleterious mutations, s, for three different distributions of mutational effects: gamma with shape parameter 3 = 0.2 (dash-dot line), exponential (solid line) and equal effect (long dashes). The mutator allele frequency according to equation (1) (short dashes) does not vary with s. Other parameters are -- = 5 x 10⁻⁷, U = 2 x 10⁻⁴ and m= 100.
(equation (1)). All of the results also use U = 2 x 10⁻⁴, which is a lower bound for E. coli estimated from mutation accumulation data (Kibota & Lynch 1996). This also does not affect the generality of the results, because the exact mutator frequency depends on the parameter U(m - 1), and so the effects of varying U are effectively explored by varying m (as in figure 2).
Figure 2 shows the frequency of a mutator allele at MIS balance, as a function of its strength m. All curves are drawn for an exponential distribution of effects. For weak mutators (m = 10) and deleterious mutations of
large effect (S = 10-1), the mutator frequency given by equation (1) is not too inaccurate. However, for either
strong mutators (m = 1000), or deleterious mutations of small effect (s = 10-3), equation (1) is very inaccurate. For m = 1000, 3 = 1 and s = 10-3 the error is a factor of 17.
0.2 0.4 0.6 0.8 1 1
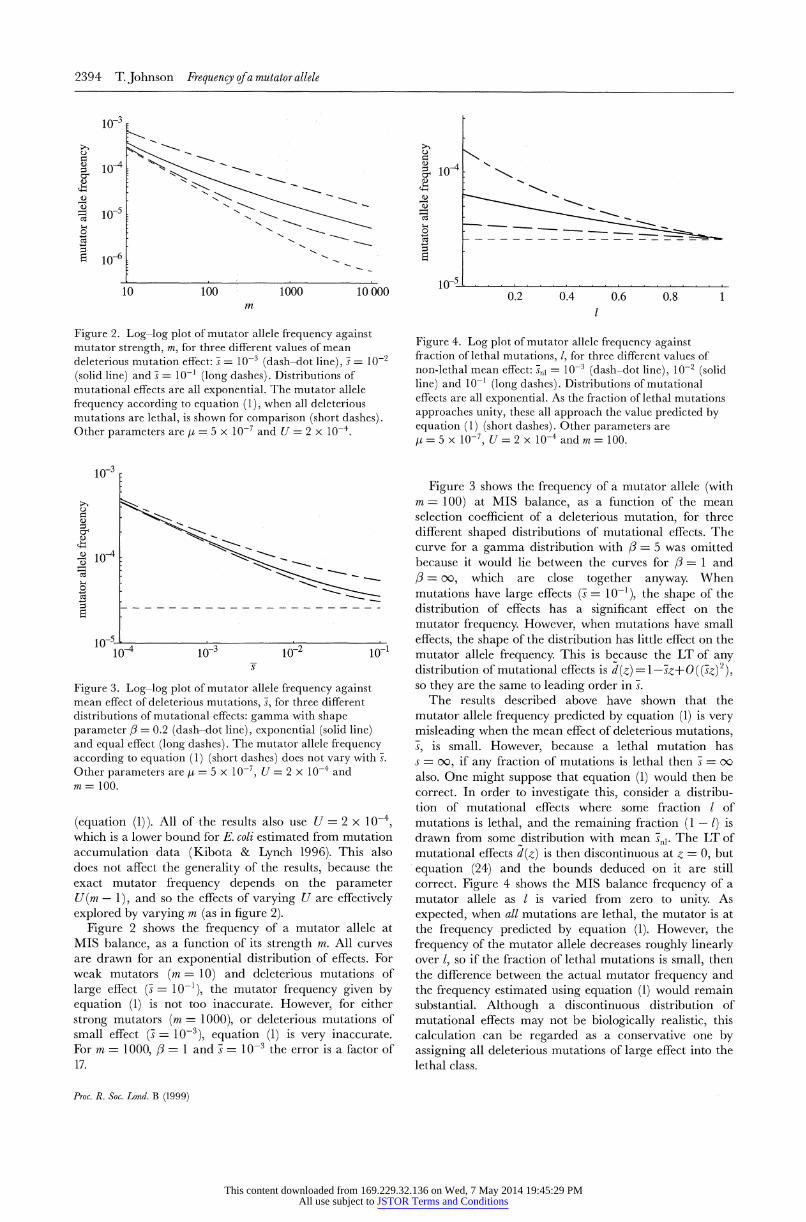
Figure 4. Log plot of mutator allele frequency against fraction of lethal mutations, 1, for three different values of non-lethal mean effect: SJn = 10-3 (dash-dot line), 10-2 (solid line) and 10-1 (long dashes). Distributions of mutational effects are all exponential. As the fraction of lethal mutations approaches unity, these all approach the value predicted by equation (1) (short dashes). Other parameters are f = 5 x 10⁻⁷, U - 2 x 10⁻⁴ and m = 100.
Figure 3 shows the frequency of a mutator allele (with m- 100) at MIS balance, as a function of the mean selection coefficient of a deleterious mutation, for three different shaped distributions of mutational effects. The curve for a gamma distribution with /3 = 5 was omitted because it would lie between the curves for 3 = 1 and /3= oo, which are close together anyway. When mutations have large effects (s = 10-1), the shape of the distribution of effects has a significant effect on the mutator frequency. However, when mutations have small effects, the shape of the distribution has little effect on the mutator allele frequency. This is because the LT of any distribution of mutational effects is d(z) =1-z+O((sz)2), so they are the same to leading order in s.
The results described above have shown that the mutator allele frequency predicted by equation (1) is very misleading when the mean effect of deleterious mutations, s, is small. However, because a lethal mutation has s = oo, if any fraction of mutations is lethal then = x00
also. One might suppose that equation (1) would then be correct. In order to investigate this, consider a distribu- tion of mutational effects where some fraction I of mutations is lethal, and the remaining fraction (1 - 1) is drawn from some distribution with mean 7nl. The LT of mutational effects d(z) is then discontinuous at z = 0, but
equation (24) and the bounds deduced on it are still correct. Figure 4 shows the MIS balance frequency of a mutator allele as I is varied from zero to unity. As
expected, when all mutations are lethal, the mutator is at the frequency predicted by equation (1). However, the
frequency of the mutator allele decreases roughly linearly over 1, so if the fraction of lethal mutations is small, then the difference between the actual mutator frequency and the frequency estimated using equation (1) would remain substantial. Although a discontinuous distribution of mutational effects may not be biologically realistic, this calculation can be regarded as a conservative one by assigning all deleterious mutations of large effect into the lethal class.
Proc. R. Soc. Lond. B (1999)
10-4 C) a a
(U
a a' a
a a- a- a ai a--
\ 'S.~ s,
"I ~ ~ ~ ~ ~ I
- - - - - - - - - - - -
10-5
This content downloaded from 169.229.32.136 on Wed, 7 May 2014 19:45:29 PMAll use subject to JSTOR Terms and Conditions
Frequency ofa mutator allele T. Johnson 2395
5. DISCUSSION
(a) Rate of approach to equilibrium I have shown here that, if an asexual population is
initially genetically homogenous, then it will approach its
equilibrium mean fitness over a time-scale proportional to 1/s, and that the constant of proportionality depends on the shape of the distribution. The verbal explanation for this is as follows. The population is above its equili- brium mean fitness. In each generation, mutation causes a reduction in population mean fitness by U s, regardless of the shape of the distribution. However, the variance in fitness increases in proportion to the variance of muta- tional effects. The greater the variance, the more selection will increase mean fitness each generation (Fisher 1930, p. 37). Hence, the greater the variance in mutational
effects, the more effectively selection can oppose the decline in fitness caused by mutation, and the slower the
approach towards equilibrium will be. One would there- fore expect the opposite to be true for populations initi-
ally below their equilibrium mean fitness: a more rapid approach towards equilibrium for a greater variance in mutational effects.
The use of an infinite population model for selective
sweeps which start from a single novel mutant is justified if the selective sweep happens over a more rapid time- scale than the dynamics under deleterious mutation and selection. If the selection coefficient favouring the geno- type sweeping to fixation Sb > s then it will reach substantial population size while it is still (reasonably) genetically homogenous. This may be biologically plau- sible, because Sb is the selection coefficient of a beneficial mutation conditional on it surviving drift and outcom-
peting any other beneficial mutations which are segre- gating at the same time (see Gerrish & Lenski 1998).
(b) Frequency of a mutator allele In the introduction, I argued that estimating the
frequency of a mutator allele by assuming that all deleter- ious mutations are ultimately lethal, as equation (1) does, would be misleading when newly arisen mutator alleles
approach the mutator distribution of fitness slowly. The results confirm that this is the case if the mean effect of deleterious mutations is small, especially if the distri- bution of mutational effects has a high variance, and if lethal mutations are rare. Therefore, a summary of what is known and may be inferred about these parameters is
appropriate. In this section, I use s to denote the classical selection coefficient, which is approximately equal to s in this model when it is small.
In a mutation accumulation experiment, Kibota &
Lynch (1996) estimated U > 2 x 10⁻⁴ and s < 0.012 for E. coli. However, the inequality 7s < 0.012 is an equality only when mutations have equal effects. If all mutations affect fitness (E. coli has little repeated DNA, and has biased codon usage) then U - 3 x 10⁻³, the total
genomic mutation rate (Drake et al. 1998, references cited
therein). Because the mutation accumulation data provides a robust estimate of the product U s, then 7 ~ 8 x 10⁻⁴ in the laboratory environment in which Kibota & Lynch (1996) assayed fitness.
Elena et al. (1998) have estimated the distribution of selective effects of random transposable element insertions
in E. coli. They found most support for a model where 97% of mutations have selective effects from a gamma distribution with / = 3.03 and s = 0.016, and the remainder have selection coefficients (in the classical sense) distributed uniformly between zero and unity. However, the distribution of spontaneous mutational effects has not been estimated for any asexual microbe, and data from mutation accumulation experiments with other organisms are equivocal. For example, when a gamma distribution of effects was fitted to data for Caenor- habditis elegans, Keightley & Caballero (1997) found most support for very high values of /, i.e. a distribution with mostly equal effects, and rejected distributions with/3 < 1. In contrast, with data for Drosophila melanogaster, Fry et al. (1999) found most support for P3 < 1 and rejected distri- butions with very large values of 3. These and other data are reviewed by Lynch et al. (1999). Davies et al. (1999) examined C. elegans lines exposed to ethylmethane sulpho- nate (EMS), and found highest support for a bimodal distribution of effects. Both this and the work of Elena et al. (1998) suggest that a single gamma distribution cannot adequately describe the distribution of mutational effects.
Mukai (1964) estimated that U > 0.1411 for the second chromosome of D. melanogaster, and that the rate of lethal mutations was approximately 0.0063: hence the fraction of lethal mutations 1 < 0.043. Ashburner et al. (1999) estimate that loss of function in 53/218 =24% of protein coding genes in D. melanogaster results in lethality. This sets an absolute upper limit on 1, because not all mutations will cause loss of function, and mutations in regulatory sequences are not allowed for. There has been no direct measurement of the rate of lethal mutations in microbes; Painter (1975) considered 1 ~ 0.01 a reasonable estimate for E. coli growing on minimal media.
In this model, back mutation from mutator to wild- type has been ignored. It is not clear whether such back mutations do occur in nature (Sniegowski et al. 1997; Taddei et al. 1997a), but if they did, and if the mutator accelerated its own rate of back mutation so that the rate was substantial (more than the base pair reversion rate of about 10-9), then the flux of lower fitness individuals into the wild-type subpopulation would further reduce the fitness difference between the two subpopulations. This effect remains to be quantified. In finite populations, the average number of generations until extinction of a given copy of a deleterious allele is small (Kimura & Ohta 1969). By analogy, one might expect most (indirectly deleterious) mutator alleles to be relatively young, and therefore the mutator subpopulation would be even closer to the wild-type distribution of fitness than predicted by the infinite population model studied here. However, greater fixation probabilities of slightly deleterious muta- tions in the small mutator subpopulation (see Ohta 1992) would lower the fitness of the mutator subpopulation. Further work is required to determine the significance of these finite population effects.
This work suggests a qualitatively new conclusion about the evolution of mutation rates in asexual organ- isms. Previous work (see references in Drake et al. (1998) and Dawson (1998)) has all concluded that the evolution of mutation rates in asexual populations is independent of the selection coefficients of deleterious mutations. Here I have shown that this is not true, and that the frequencies
Proc. R. Soc. Lond. B (1999)
This content downloaded from 169.229.32.136 on Wed, 7 May 2014 19:45:29 PMAll use subject to JSTOR Terms and Conditions

2396 T. Johnson Frequency of a mutatorallele
of mutator alleles (and hence the population mean muta- tion rate) will vary inversely with the strength of selection
against deleterious mutations. The quantitative difference between this and previous
results is also important. The higher frequency of mutator alleles means that they are more likely to hitchhike to fixation (Chao & Cox 1983). Furthermore, the distri- bution of fitness in a mutator subpopulation at MIS balance will be far from its independent equilibrium, and so fixation probabilities of beneficial mutations arising in the mutator background will be higher than might be
supposed from the mutator mutation rate alone (see Peck
1994; Barton 1995). Once a mutator allele is fixed by hitchhiking, it may take a long time to reach its equili- brium distribution of fitness (figure 1), and hence to suffer the disadvantage of its higher mutation rate. Indeed, Sniegowski et al. (1997) found no significant differences between mean fitnesses of lines of E. coli with wild-type mutation rates and lines which had been fixed for strong mutator alleles for about 1000, about 6000 and about 7000 generations. All of these considerations add theor- etical support for the idea that strong mutator alleles can
play a role in the evolution of pathogenicity and antibiotic resistance in bacteria (LeClerc et al. 1996).
If the mean effect of deleterious mutations in nature is
small, and the variance in effects large, then weak mutator frequencies of up to 0.2% might be maintained
by mutational bias alone (,u = 5 x 10⁻⁷, U = 2 x 10⁻⁴, m = 10, s = 10-4, 3 = 0.2). This is compatible with Gross and Siegel's (1981) observation of only one mutator in 408 isolates of E. coli. However, other workers have found mutators at higher frequencies. Jyssum (1960) estimated a
frequency of 4% (4/110), LeClerc et al. (1996) estimated 2% (4/212), and Matic et al. (1997) observed weak mutators at a frequency of 14% (69/504). The increased time and energy costs of high fidelity DNA replication (Kirkwood et al. 1986; Kondrashov 1995; Dawson 1998), or hitchhiking of mutators on beneficial mutations (Mao et al. 1997; Sniegowski et al. 1997; Taddei et al. 1997a; Tenaillon et al. 1999), may be responsible for maintaining these high mutator frequencies. However, previous analy- tical work examining these hypotheses has assumed that asexual populations are at equilibrium under selection and mutation, and simulations have assumed deleterious mutations of equal and large effect (s 7 0.05), and must therefore be critically re-examined.
I am grateful to N. H. Barton, B. Charlesworth, K. J. Dawson, P. J. Gerrish, M. Kirkpatrick, G. T. McVean, P. D. Sniegowski and three anonymous referees for helpful and thought-provoking comments. P. J. Gerrish and 0. Tenaillon kindly provided unpublished results. This work was supported by the Biotechno- logy arid Biological Sciences Research Council, postgraduate studentship number 97/B1/G/03163, and by a travel grant from the Scottish International EducationTrust.
REFERENCES
Ashburner, M. (and 26 others) 1999 An exploration of the sequence of a 2.9-Mb region of the genome of Drosophila mela- nogaster: the Adh region. Genetics 153, 179-219.
Atwood, K. C., Schneider, L. K. & Ryan, F. J. 1951 Selective mechanisms in bacteria. Cold Spring Harb. Symp. Quant. Biol. 16, 345-354.
Barton, N. H. 1995 Linkage and the limits to natural selection. Genetics 140, 821-841.
Burger, R. 1998 Mathematical properties of mutation-selection models. Genetica 102/103, 279-298.
Chao, L. & Cox, E. C. 1983 Competition between high and low mutating strains of Escherichia coli. Evolution 37, 125-134.
Davies, E. K., Peters, A. D. & Keightley, P. D. 1999 High frequency of cryptic deleterious mutations in Caenorhabditis elegans. Science 285, 1748-1751.
Dawson, K. J. 1998 Evolutionarily stable mutation rates. J. Theor. Biol. 194, 143-157.
Dawson, K. J. 1999 The dynamics of infinitesimally rare alleles, applied to the evolution of mutation rates and the expression of deleterious mutations. Theor. Popul. Biol. 55, 1-22.
Drake, J. W. 1993 General antimutators are improbable. J. Mol. Biol. 229, 8-13.
Drake, J. W., Charlesworth, B., Charlesworth, D. & Crow, J. F. 1998 Rates of spontaneous mutation. Genetics 148, 1667-1686.
Elena, S. F., Ekunwe, L., Hajela, N., Oden, S. A. & Lenski, R. E. 1998 Distribution of effects caused by random insertion mutations in E. coli. Genetica 102/103, 349-358.
Fisher, R. A. 1930 The genetical theory of natural selection. Oxford, UK: Clarendon Press.
Fry, J. D., Keightley, P. D., Heinsohn, S. L. & Nuzhdin, S. V 1999 New estimates of the rates and effects of mildly deleter- ious mutation in Drosophila melanogaster. Proc. Natl Acad. Sci. USA 96, 574-579.
Gerrish, P. J. & Lenski, R. E. 1998 The fate of competing beneficial mutations in an asexual population. Genetica 102/ 103, 127-144.
Gross, M. D. & Siegel, E. C. 1981 Incidence of mutator strains in Esherichia coli and coliforms in nature. Mutat. Res. 91, 107-110.
Haigh, J. 1978 The accumulation of deleterious genes in a popu- lation-Muller's ratchet. Theor. Popul. Biol. 14, 251-267.
Johnson, T. 1999 Beneficial mutations, hitchhiking and the evolution of mutation rates in sexual populations. Genetics 151, 1621-1631.
Jyssum, K. 1960 Observations on two types of genetic instability in Escherichia coli. Acta Pathol. Microbiol. Scand. 48, 113-120.
Keightley, P. D. & Caballero, A. 1997 Genomic mutation rates for lifetime reproductive output and lifespan in Caenorhabditis elegans. Proc. Jatl Acad. Sci. USA 94, 3823-3827.
Keightley, P. D. & Hill, W. G. 1988 Quantitative variability maintained by mutation-stabilizing selection balance in finite populations. Genet. Res. 52, 33-43.
Kibota, T. T. & Lynch, M. 1996 Estimate of the genomic muta- tion rate deleterious to overall fitness in E. coli. Nature 381, 694-696.
Kimura, M. 1965 A stochastic model concerning the mainte- nance of genetic variability in quantitative characters. Proc. Natl Acad. Sci. USA 54, 731-736.
Kimura, M. 1979 Model of effectively neutral mutations in which selective constraint is incorporated. Proc. Jatl Acad. Sci. USA 76, 3440-3444.
Kimura, M. & Maruyama, T. 1966 The mutational load with epistatic gene interactions in fitness. Genetics 54, 1337-1351.
Kimura, M. & Ohta, T. 1969 The average number of genera- tions until extinction of an individual mutant gene in a finite population. Genetics 63, 701-709.
Kirkwood, T. B. L., Rosenberger, R. F & Galas, D. J. (eds) 1986 Accuracy in molecular processes: its control and relevance to living systems. London: Chapman & Hall.
Kondrashov, A. S. 1995 Modifiers of mutation-selection balance: general approach and the evolution of mutation rates. Genet. Res. 66, 53-70.
LeClerc, J. E., Baoguang, L., Payne, W. L. & Cebula, T. A. 1996 High mutation frequencies among Escherichia coli and Salmonella pathogens. Science 274, 1208-1211.
Proc. R. Soc. Lond. B (1999)
This content downloaded from 169.229.32.136 on Wed, 7 May 2014 19:45:29 PMAll use subject to JSTOR Terms and Conditions
Frequency ofa mutator allele T. Johnson 2397
Leigh, E. G. 1970 Natural selection and mutability. Am. Jat. 104, 301-305.
Lynch, M., Blanchard, J., Houle, D., Kibota, T., Schultz, S., Vassilieva, L. & Willis, J. 1999 Perspective: spontaneous dele- terious mutation. Evolution 53, 645-663.
Mao, E. F., Lane, L., Lee, J. & Miller, J. H. 1997 Proliferation of mutators in a cell population. J. Bacteriol. 179, 417-422.
Matic, I., Radman, M., Taddei, F., Picard, B., Doit, C., Denamur, E. & Elion, J. 1997 Highly variable mutation rates in commensal and pathogenic Escherichia coli. Science 277, 1833-1834.
Mukai, T. 1964 The genetic structure of natural populations of Drosophila melanogaster. I. Spontaneous mutation rate of poly- genes controlling viability. Genetics 50, 1-19.
Ninio, J. 1991 Transient mutators: a semiquantitatve analysis of the influence of translation and transcription errors on muta- tion rates. Genetics 129, 957-962.
Ohta, T. 1973 Slightly deleterious mutant substitutions in evolu- tion. Nature 246, 96-98.
Ohta, T. 1992 The nearly neutral theory of molecular evolution. A. Rev. Ecol. Syst. 23, 263-286.
Painter, P. R. 1975 Mutator genes and selection for the mutation rate in bacteria. Genetics 79, 649-660.
Peck, J. R. 1994 A ruby in the rubbish: beneficial mutations and the evolution of sex. Genetics 137, 597-606.
Sniegowski, P. D., Gerrish, P. J. & Lenski, R. E. 1997 Evolution of high mutation rates in experimental populations of E. coli. Nature 387, 135-136.
Taddei, E, Radman, M., Maynard Smith, J., Toupance, B., Gouyon, P. H. & Godelle, B. 1997a Role of mutator alleles in adaptive evolution. Nature 387, 700-703.
Taddei, F., Matic, I., Godelle, B. & Radman, M. 1997b To be a mutator, or how pathogenic and commensal bacteria can evolve rapidly. Trends Microbiol. 5, 427-428.
Tenaillon, O.,Toupance, B., Le Nagard, H., Taddei, F & Godelle, B. 1999 Mutators, population size, adaptive landscape, and the adaptation of asexual populations. Genetics 152, 485-493.
Turelli, M. 1984 Heritable genetic variation via mutation selec- tion balance: Lurch's zeta meets the abdominal bristle. Theor. Popul. Biol. 25, 138-193.
Wolfram, S. 1996 The mathematica book. Cambridge: Wolfram Media/Cambridge University Press.
As this paper exceeds the maximum length normally permitted, the author has agreed to contribute to production costs.
Proc. R. Soc. Lond. B (1999)
This content downloaded from 169.229.32.136 on Wed, 7 May 2014 19:45:29 PMAll use subject to JSTOR Terms and Conditions