Embed Size (px)
Citation preview

This document and trademark(s) contained herein are protected by law as indicated in a notice appearing later in this work. This electronic representation of RAND intellectual property is provided for non-commercial use only. Unauthorized posting of RAND PDFs to a non-RAND Web site is prohibited. RAND PDFs are protected under copyright law. Permission is required from RAND to reproduce, or reuse in another form, any of our research documents for commercial use. For information on reprint and linking permissions, please see RAND Permissions.
Limited Electronic Distribution Rights
This PDF document was made available from www.rand.org as a public
service of the RAND Corporation.
6Jump down to document
THE ARTS
CHILD POLICY
CIVIL JUSTICE
EDUCATION
ENERGY AND ENVIRONMENT
HEALTH AND HEALTH CARE
INTERNATIONAL AFFAIRS
NATIONAL SECURITY
POPULATION AND AGING
PUBLIC SAFETY
SCIENCE AND TECHNOLOGY
SUBSTANCE ABUSE
TERRORISM AND HOMELAND SECURITY
TRANSPORTATION ANDINFRASTRUCTURE
WORKFORCE AND WORKPLACE
The RAND Corporation is a nonprofit research organization providing objective analysis and effective solutions that address the challenges facing the public and private sectors around the world.
Visit RAND at www.rand.org
Explore Pardee RAND Graduate School
View document details
For More Information
Browse Books & Publications
Make a charitable contribution
Support RAND

This product is part of the Pardee RAND Graduate School (PRGS) dissertation series.
PRGS dissertations are produced by graduate fellows of the Pardee RAND Graduate
School, the world’s leading producer of Ph.D.’s in policy analysis. The dissertation has
been supervised, reviewed, and approved by the graduate fellow’s faculty committee.
PARDEE RAND GRADUATE SCHOOL
Retention of Military PhysiciansThe Differential Effects of Practice Opportunities Across the Three Services
Benjamin F. Mundell
This document was submitted as a dissertation in September 2010 in partial fulfillment of the requirements of the doctoral degree in public policy analysis at the Pardee RAND Graduate School. The faculty committee that supervised and approved the dissertation consisted of Sue Hosek (Chair), Paul Heaton, and Mark Friedberg.
The RAND Corporation is a nonprofit institution that helps improve policy and decisionmaking through research and analysis. RAND’s publications do not necessarily reflect the opinions of its research clients and sponsors.
R® is a registered trademark.
All rights reserved. No part of this book may be reproduced in any form by any electronic or mechanical means (including photocopying, recording, or information storage and retrieval) without permission in writing from RAND.
Published 2010 by the RAND Corporation1776 Main Street, P.O. Box 2138, Santa Monica, CA 90407-2138
1200 South Hayes Street, Arlington, VA 22202-50504570 Fifth Avenue, Suite 600, Pittsburgh, PA 15213-2665
RAND URL: http://www.rand.orgTo order RAND documents or to obtain additional information, contact
Distribution Services: Telephone: (310) 451-7002; Fax: (310) 451-6915; Email: [email protected]
The Pardee RAND Graduate School dissertation series reproduces dissertations that have been approved by the student’s dissertation committee.
- iii -
ABSTRACT
This dissertation looks at the link between practice opportunities and physician retention. Data on physicians who entered the Army, Air Force, or Navy and became fully qualified – finishing post-medical school training – between June 1996 and June 2009 are used to explore this question. Two other factors that are commonly believed to be correlated with retention – whether a physician pursues a military or civilian residency and deployment history – are also examined. Physicians are a vital part of a well functioning military health system and therefore the accession and retention of military physicians who have the skills necessary for caring for wounded soldiers is especially important.
Most agree that increasing wages for military physicians would increase retention. What is not well understood is the link between increased practice opportunities and retentions. This dissertation suggests that such a link does exist. Additionally, it appears that the effects attributed to residency type – civilian or military – are less significant than the results reported in other studies on physician retention. Physicians, as a group, face less deployment than other military career fields and yet deployments early in a physician’s career are negatively correlated with retention. Deployments later in a physician’s career are positively correlated with retention and likely the result of a preference for deployments and military service. The findings should be of interest to personnel and policymakers concerned about managing the physician career fields in the three military services as well as those who engage in military medical manpower research.

- v -
CONTENTS
Abstract.............................................................iii
Figures..............................................................vii
Tables................................................................ix
Acknowledgments.................................................... .xi
Glossary, List of Symbols, Etc......................................xi
1. Introduction.......................................................12. Background ........................................................5
The Military Health System.......................................8Becoming a Military Physician .................................9
Retention of Military Physicians................................13Career Choice and satisfaction among physicians.................17
Physician Specialty ..........................................18Practice Setting .............................................19Location .....................................................21Career Choice ................................................22
3. Data...............................................................24Personnel data..................................................24
Active Duty Pay File .........................................25Reserve Pay File .............................................25Work Experience File .........................................26Tracking a Physician’s Career ................................26
Measuring Practice opportunities................................304. Methods............................................................34
Theoretical Framework...........................................34The Medical School and Residency Decision ....................34Deciding to Remain in the Military ...........................36
An Empirical Model of Physician Retention.......................385. Empircal Results of the Physician Retention Model..................46
Descriptive Statistics..........................................46Demographics, Deployment, Initial Assignment, and Specialty ..46Initial Assignment ...........................................50Specialty Transition .........................................54Survival Curves ..............................................61
Duration Analysis Results.......................................636. Policy Changes and the Effects on Physician Duration...............73
Framework for Policy Changes....................................73CHanges in Practice Opportunities...............................74Changees in Residency mix.......................................79Changes in Deployments..........................................81
7. Conclusion.........................................................87Findings........................................................87Policy Implications.............................................88Future Research.................................................90
- vi -
A. Regular Military Compensation.....................................93
B. Determing when a physician is fully qualified......................95The fully Qualified Algorithm...................................95
C. Additional Physician Specialty Transition Tables...................99D. Additional Survival Curves For each specialty.....................109E. Additional Duration Analysis Results..............................122
Works Cited..........................................................127
- vii -
FIGURES
Figure 2.1 – MHS Organizational Chart .................................8
Figure 5.1 – Survival Curves for all Army physicians .................61
Figure 5.2 - Survival Curves for all Air Force physicians ............62
Figure 5.3 - Survival Curves for all Navy physicians .................62
Figure 6.1- Army physician duration, Facility changes ................75
Figure 6.2- Air Force physician duration, Facility changes ...........75
Figure 6.3- Navy physician duration, Facility changes ................76
Figure 6.4- Army physician duration, Residency change ................80
Figure 6.5- Air Force physician duration, Residency change ...........80
Figure 6.6- Navy physician duration, Residency change ................81
Figure 6.7- Changes in deployment lengths during initial service obligation, Army .............................................83
Figure 6.8- Changes in deployment lengths during initial service obligation, Air Force ........................................83
Figure 6.8- Changes in deployment lengths during initial service obligation, Navy .............................................84
Figure 6.9 – Changes in cumulative months deployed post initial service obligation, Army .............................................85
Figure 6.10 – Changes in cumulative months deployed post initial service obligation, Air Force ................................85
Figure 6.11 – Changes in cumulative months deployed post initial service obligation, Navy .....................................85
Figure D.1 – Army General Medicine ..................................110
Figure D.2 – Air Force General Medicine .............................110
Figure D.3 – Navy General Medicine ..................................110
Figure D.4 – Army Family Practice ...................................111
Figure D.5 – Air Force Family Practice ..............................111
Figure D.6 – Navy Family Practice ...................................111
Figure D.7 – Army Internal Medicine .................................112
Figure D.8 – Air Force Internal Medicine ............................112
Figure D.9 – Navy Internal Medicine .................................112
Figure D.10 – Army Occupational Medicine ............................113
Figure D.11 – Air Force Occupational Medicine .......................113
Figure D.12 – Navy Occupational Medicine ............................113

- viii -
Figure D.13 – Army Surgeons .........................................114
Figure D.14 – Air Force Surgeons ....................................114
Figure D.15 – Navy Surgeons .........................................114
Figure D.16 – Army Anesthesiology ...................................115
Figure D.17 – Air Force Anesthesiology ..............................115
Figure D.18 – Navy Anesthesiology ...................................115
Figure D.19 – Army Other Medicine- Dermatology, Pathology, Neurology, Ophthalmology ...............................................116
Figure D.20 – Air Force Other Medicine- Dermatology, Pathology, Neurology, Ophthalmology ....................................116
Figure D.21 – Navy Other Medicine- Dermatology, Pathology, Neurology, Ophthalmology ...............................................116
Figure D.22 – Army OB/Gyn ...........................................117
Figure D.23 – Air Force OB/Gyn ......................................117
Figure D.24 – Navy OB/Gyn ...........................................117
Figure D.25 – Army Emergency Medicine ...............................118
Figure D.26 – Air Force Emergency Medicine ..........................118
Figure D.27– Navy Emergency Medicine ................................118
Figure D.28 – Army Psychology .......................................119
Figure D.29 – Air Force Psychology ..................................119
Figure D.30 – Navy Psychology .......................................119
Figure D.31 – Army Radiology ........................................120
Figure D.32 – Air Force Radiology ...................................120
Figure D.33 – Navy Radiology ........................................120
Figure D.34 – Army Pediatrics .......................................121
Figure D.35 – Air Force Pediatrics ..................................121
Figure D.36 – Navy Pediatrics .......................................121
- ix -
TABLES
Table 2.1 – Median Civilian and Military Pay Differential..............6
Table 2.2 – Civilian and Military accession numbers and percentages, June 1996 to June 2004 .......................................12
Table 3.1 – Medical Specialties at each Air Force medical center, 201031
Table 3.2 – Medical Specialties at each Army medical center, 2010.....32Table 3.3 – Medical Specialties at each Army medical center, 2010.....33
Table 5.1 - Demographic and Deployment Descriptive Statistics.........47
Table 5.2 - Specialty Descriptive Statistics..........................49
Table 5.3 – Army initial assignments comparisons for specialties by residency type, June 1996 to June 2004 .......................51
Table 5.3 – continued.................................................51Table 5.4 – Air Force initial assignments comparisons for specialties
by residency type, June 1996 to June 2004 ....................52
Table 5.4 – continued.................................................52Table 5.4 – Navy initial assignments comparisons for specialties by
residency type, June 1996 to June 2004 .......................53
Table 5.5 - Specialty Transition for all services, percentage.........56
Table 5.6 - Specialty Transition for Army physicians, percentage......57Table 5.7 - Specialty Transition for Air Force physicians, percentage.58Table 5.8 - Specialty Transition for Navy physicians, percentage......59
Table 5.7- Duration analysis results, deployment measured in cumulative months .......................................................65
Table 5.8- Duration analysis results, deployment measured in cumulative episodes .....................................................66
Table 5.8 – First Board certified by years of service post-residency..68
Table B.1 – Physician Specialties and associated years of GME.........97
Table C.1 – Specialty Transition for all services – Civilian Residency, percentage ..................................................100
Table C.2 - Specialty Transition for all services – Military Residency, percentage ..................................................101
Table C.3 - Specialty Transition for Army – Civilian Residency, percentage ..................................................102
Table C.4 - Specialty Transition for Army – Military Residency, percentage ..................................................103
Table C.5 - Specialty Transition for Air Force – Civilian Residency, percentage ..................................................104
- x -
Table C.6 - Specialty Transition for Air Force – Military Residency, percentage ..................................................105
Table C.7 - Specialty Transition for Navy – Civilian Residency, percentage ..................................................106
Table C.8 - Specialty Transition for Navy – Military Residency, percentage ..................................................107
Table E.1 – No Frailty, Facility and deployment episode indicators...123Table E.2 – No Frailty, Facility and deployment month indicators.....124Table E.3 – Frailty, Facility and deployment episode indicators......125Table E.4 – Frailty, Facility and deployment month indicators........126
- xi -
ACKNOWLEDGMENTS
I would like to thank my dissertation committee: Sue Hosek (chair),
Mark Friedberg, and Paul Heaton. I am deeply indebted to them for the
time they spent mentoring me and reviewing my work. Their feedback and
insight helped ensure that this dissertation presented quality analysis
in a manner useful to policy makers. I thank Paul for his contributions
to my methodology and modeling work and Mark for his insights and
comments about the physician profession and helping ensure my final
product highlighted the policy implications of my analysis. A special
thank you goes to Sue Hosek, my chair. Sue’s extensive knowledge of the
military healthcare system has been invaluable to my research and her
mentoring has made me a better researcher and policy analyst.
I am truly grateful to the following individual who provided direct
support during my dissertation process. Laurie McDonald for working
with me to ensure I had the correct and necessary personnel data to
perform my analysis. Jim Hosek for helping me form my dissertation idea
and ensuring I pursued a topic with policy relevance. Sean Nicholson,
who served as my outside reader and offered refinements and general
comments that further strengthened my dissertation.
I owe additional thanks to several of my PRGS classmates who
listened to my various analytical ideas and offered feedback throughout
the process. I would like to thank Brandon Dues, Adam Gailey, Ethan
Scherer, Dave Schulker, and Chris Sharon for providing comments on my
analytical techniques, general feedback on my dissertation, and making
sure I did not spend all my time at the office.
Finally, I would like to thank my parents, William and Beth
Mundell, and my grandparents, William and Joanne Culbert, for providing
moral support and encouragement throughout the dissertation process.
- xi -
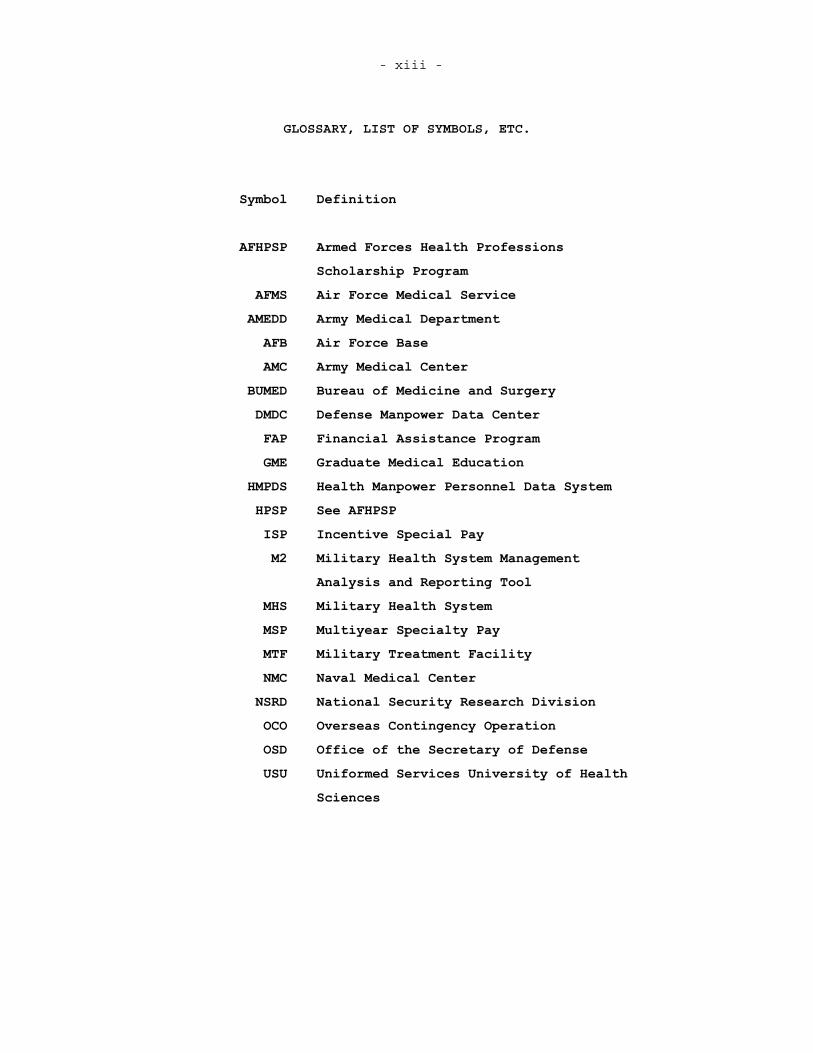
GLOSSARY, LIST OF SYMBOLS, ETC.
Symbol Definition
AFHPSP Armed Forces Health Professions Scholarship Program
AFMS Air Force Medical Service AMEDD Army Medical Department AFB Air Force Base AMC Army Medical Center
BUMED Bureau of Medicine and Surgery DMDC Defense Manpower Data Center FAP Financial Assistance Program GME Graduate Medical Education
HMPDS Health Manpower Personnel Data System HPSP See AFHPSP ISP Incentive Special Pay M2 Military Health System Management
Analysis and Reporting Tool MHS Military Health System MSP Multiyear Specialty Pay MTF Military Treatment Facility NMC Naval Medical Center NSRD National Security Research Division OCO Overseas Contingency Operation OSD Office of the Secretary of Defense USU Uniformed Services University of Health
Sciences
- 1 -
1. INTRODUCTION
The ongoing operations in Southwest Asia and around the world in support of the fight against terrorism have increased the operations tempo of military personnel to levels not previously seen in the All-Volunteer Force era. This increase in operations during the first decade of the 21st Century has brought along with it an increase in casualties sustained by troops and a need for well-trained medical personnel. Physicians are a vital part of a well-functioning military health system and therefore the accession and retention of military physicians who have the skills necessary for caring for wounded soldiers is especially important. Furthermore, certain specialties that provide much of the deployed medical capabilities – surgeons and critical care specialists – are necessary to support military operations.
While both accession and retention are important, optimal retention – keeping some but not all military physicians – is necessary to maintain a force experienced in military medicine, familiar with military organizational structure, and to develop senior medical leaders. Three factors that likely affect the military’s effort to retain physicians are the pay differential between military and civilian physician positions, deployments, and the ability of military physicians to maintain and improve clinical skills – which I refer to
as “practice opportunities.” 1 The effects of the military pay relative to civilian pay and deployment are fairly well documented. Most agree that increasing wages for military doctors, specifically specialists, would lead to increased retention.
What is not well understood is the link between the ability to concentrate on clinical skills – to include seeing interesting and varied cases – and retention. Prior to Operation Iraqi Freedom, the
1 Practice opportunities, in the broadest sense, are the
opportunities a physician has to see what he or she deems an interesting case-mix. This could be having a large variety of cases, a large concentration of complex cases, or both. The exact methods for measuring practice opportunities will be defined later in the dissertation.
- 2 -
Air Force found that 78% of Air Force general surgeons reported that they were not busy enough. Additionally, 74% of general surgeons reported that a negative aspect of being in the Air Force was “the lack of adequate clinical cases” which was seen as a “threat to skills retention” (Murdock, 2007). Rattelman found increased levels of dissatisfaction with professional development opportunities among physicians at three MTFs that were the first to adopt TRICARE – the federally provided insurance for military beneficiaries – compared to physicians at six MTFs that had not adopted TRICARE (Rattelman, 1996).Now that TRICARE covers all military dependents, it could be that overall physician satisfaction with the military practice setting has decreased. This feeling is not unique to the military as numerous reports on civilian physician retention report a major reason for changing practice settings stems from a lack of professional development opportunities (Misra-Hebert et al, 2004). Having physicians that who enjoy their work environment and are current in their clinical skills is essential for a well-functioning military health system.
The Army Medical Department, Navy Bureau of Medicine and Surgery (responsible for both Navy and Marine healthcare), and Air Force Medical Service – backed up by an extensive network of civilian providers – are critical components of a ready and effective fighting force. While the medical services have broadly similar missions, they are organized and execute this mission in different manners. Each of the three services requires the proper personnel, equipment, and training to accomplish its mission. Since the advent of the All-Volunteer Force, recruiting and retaining personnel is a constant issue facing each branch of the armed services.
Recently the Air Force has raised the concern that it is unable to recruit and retain physicians as well as the other services because it has fewer inpatient medical facilities. The Air Force Medical Service (AFMS) has also experienced a general downsizing of Military Treatment Facilities (MTFs), including hospitals to clinics, since the end of the Cold War, which limits a physician’s practice opportunities.All three medical services’ operations tempos – deployments in support of military operations – have increased in recent years to support Operation Iraqi Freedom (OIF), Operation Enduring Freedom (OEF) – operations in Afghanistan, and humanitarian relief efforts, making it
- 3 -
increasingly important for the services to recruit and retain capable physicians who have the ability to practice in settings that keep them clinically current.
The goal of this dissertation is to analyze the effects of practice opportunities on physician retention, especially critical care specialists, in the Army, Navy, and Air Force. I will use a microeconomic framework to examine the practice opportunity-retention relationship. For the purpose of this dissertation physician retention will be any action that extends the physicians’ active duty service commitment after their initial service commitment has expired.Typically, a physician will accept multiyear specialty pay (MSP), a bonus, which leads to an additional commitment. Other actions, such as a permanent change of station or additional training, also increase the service commitment. To examine the effects of practice opportunities on physician retention, I will use a duration analysis model, which looks at the probability of a physician leaving in a given month conditional on surviving up to that month. The data for the analysis will come from the Defense Manpower Data Center (DMDC), which contains personnel data for all three services. The change in MTF size since the end of the Cold War creates additional variance in practice opportunities over time.
I use two techniques to analyze the effects of practice opportunities on physicians- descriptive statistics on service-level physician duration patterns and econometric analysis of the observed initial retention decision. The general hypothesis being tested is that physicians who have fewer and less interesting practice opportunities are less likely to remain in the military and should have shorter active duty durations, ceteris peribus. Initially, I compare retention rates across the three services and over time to show how the retention patterns between the services differ at the aggregate level.Next, I look at how changes in practice opportunities, driven in part by changes in workload and MTF size, affect each service’s ability to retain physicians using an econometric model that looks at retention outcomes of physicians from June 1996 through June 2009. Additional factors such as a military-civilian pay differential, the sometimes
- 4 -
undesirable location of military facilities, and multiple deployments2 – a negative factor for other officers – are also likely to dissuade a physician from remaining in the military.
Understanding effects of practice opportunities on the military’s ability to retain physicians is important as AMEDD, BUMED, and AFMS continue face a high operations tempo. As the three medical services continue to support current operations in Southwest Asia, it is vital that AMEDD, BUMED, and AFMS have the best personnel available and are able to provide excellent care to wounded servicemen. Optimal physician retention – the ability to maintain a ready force with experienced senior leadership – is a key element to providing this capability.
This dissertation suggests that a link between increased practice opportunities and retention does exist. Additionally, it appears that the effects attributed to residency type – civilian or military – are less significant than the results reported in other studies on physician retention. Physicians, as a group, face less deployment than other military career fields and yet deployments early in a physician’s career are negatively correlated with retention. Deployments later in physician’s career are positively correlated with retention and likely the result of a learned preference for deployments and military service.
2 Both Hosek and Martorell (2009) and Fricker (2002) look at
deployment effects on military personnel. Hosek and Martorell look at enlisted retention and find some deployment is beneficial, but too much reduces retention. Fricker’s findings are similar for officers; retention is possibly increased by deployments relative to those who do not deploy, particularly non-hostile deployments.
- 5 - 2. BACKGROUND
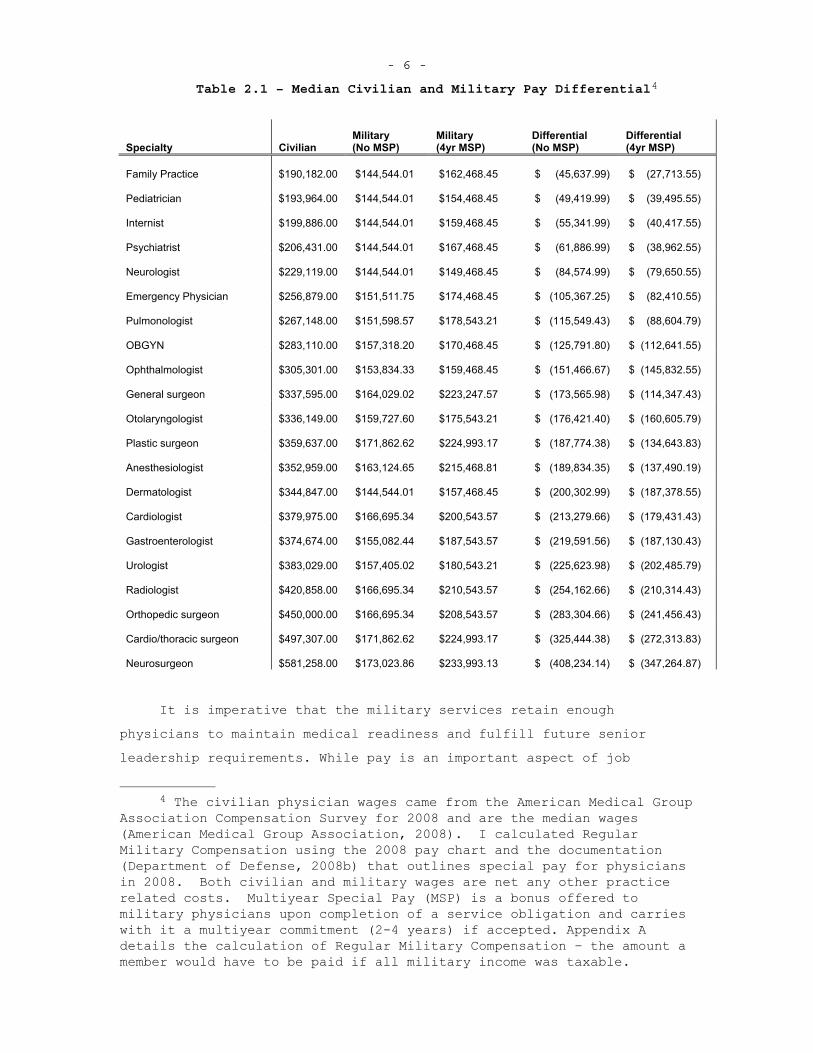
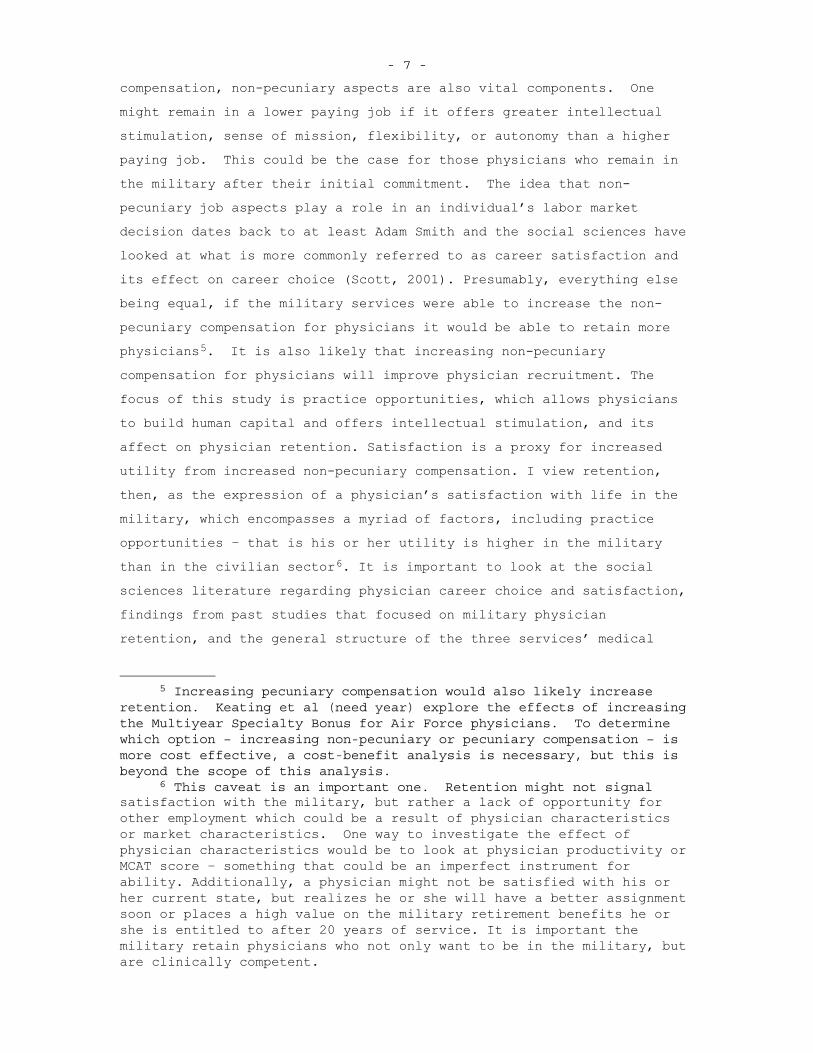
Each of the three services has the responsibility to recruit, train, and retain physicians. While this task exists for all career fields, the lengthy education and training periods for physicians compared to most other career fields adds to the difficulty of this task – a fully trained physician requires a greater investment than most other career fields.3 Many military physicians receive less monetary compensation compared to civilian physicians within the same specialty, adding further difficulty to retaining physicians . While the military has implemented various physician bonuses, these are still not at levels that provide military physicians compensation that is equivalent to their civilian counterparts, as shown in Table 1.
3 Another career field that requires fairly lengthy training is the
pilot career field. There are some similarities between this and the physician career field- members of both have outside opportunities that offer greater pay than the military. The services, particularly the Navy and Air Force, have mitigated retention issues by extending the service commitment for those who complete aviation training. One major difference between military pilots and military physicians is that military aviation usually has desirable aspects and opportunities – the type of flying and missions – that are not available in civilian aviation. It is not clear that military’s comparative advantage holds for physicians.
- 6 -
Table 2.1 – Median Civilian and Military Pay Differential4
Specialty Civilian Military (No MSP)
Military (4yr MSP)
Differential (No MSP)
Differential (4yr MSP)
Family Practice $190,182.00 $144,544.01 $162,468.45 $ (45,637.99) $ (27,713.55)
Pediatrician $193,964.00 $144,544.01 $154,468.45 $ (49,419.99) $ (39,495.55)
Internist $199,886.00 $144,544.01 $159,468.45 $ (55,341.99) $ (40,417.55)
Psychiatrist $206,431.00 $144,544.01 $167,468.45 $ (61,886.99) $ (38,962.55)
Neurologist $229,119.00 $144,544.01 $149,468.45 $ (84,574.99) $ (79,650.55)
Emergency Physician $256,879.00 $151,511.75 $174,468.45 $ (105,367.25) $ (82,410.55)
Pulmonologist $267,148.00 $151,598.57 $178,543.21 $ (115,549.43) $ (88,604.79)
OBGYN $283,110.00 $157,318.20 $170,468.45 $ (125,791.80) $ (112,641.55)
Ophthalmologist $305,301.00 $153,834.33 $159,468.45 $ (151,466.67) $ (145,832.55)
General surgeon $337,595.00 $164,029.02 $223,247.57 $ (173,565.98) $ (114,347.43)
Otolaryngologist $336,149.00 $159,727.60 $175,543.21 $ (176,421.40) $ (160,605.79)
Plastic surgeon $359,637.00 $171,862.62 $224,993.17 $ (187,774.38) $ (134,643.83)
Anesthesiologist $352,959.00 $163,124.65 $215,468.81 $ (189,834.35) $ (137,490.19)
Dermatologist $344,847.00 $144,544.01 $157,468.45 $ (200,302.99) $ (187,378.55)
Cardiologist $379,975.00 $166,695.34 $200,543.57 $ (213,279.66) $ (179,431.43)
Gastroenterologist $374,674.00 $155,082.44 $187,543.57 $ (219,591.56) $ (187,130.43)
Urologist $383,029.00 $157,405.02 $180,543.21 $ (225,623.98) $ (202,485.79)
Radiologist $420,858.00 $166,695.34 $210,543.57 $ (254,162.66) $ (210,314.43)
Orthopedic surgeon $450,000.00 $166,695.34 $208,543.57 $ (283,304.66) $ (241,456.43)
Cardio/thoracic surgeon $497,307.00 $171,862.62 $224,993.17 $ (325,444.38) $ (272,313.83)
Neurosurgeon $581,258.00 $173,023.86 $233,993.13 $ (408,234.14) $ (347,264.87)
It is imperative that the military services retain enough physicians to maintain medical readiness and fulfill future senior leadership requirements. While pay is an important aspect of job
4 The civilian physician wages came from the American Medical Group
Association Compensation Survey for 2008 and are the median wages (American Medical Group Association, 2008). I calculated Regular Military Compensation using the 2008 pay chart and the documentation (Department of Defense, 2008b) that outlines special pay for physicians in 2008. Both civilian and military wages are net any other practice related costs. Multiyear Special Pay (MSP) is a bonus offered to military physicians upon completion of a service obligation and carries with it a multiyear commitment (2-4 years) if accepted. Appendix A details the calculation of Regular Military Compensation – the amount a member would have to be paid if all military income was taxable.
- 7 -
compensation, non-pecuniary aspects are also vital components. One might remain in a lower paying job if it offers greater intellectual stimulation, sense of mission, flexibility, or autonomy than a higher paying job. This could be the case for those physicians who remain in the military after their initial commitment. The idea that non-pecuniary job aspects play a role in an individual’s labor market decision dates back to at least Adam Smith and the social sciences have looked at what is more commonly referred to as career satisfaction and its effect on career choice (Scott, 2001). Presumably, everything else being equal, if the military services were able to increase the non-pecuniary compensation for physicians it would be able to retain more physicians5. It is also likely that increasing non-pecuniary compensation for physicians will improve physician recruitment. The focus of this study is practice opportunities, which allows physicians to build human capital and offers intellectual stimulation, and its affect on physician retention. Satisfaction is a proxy for increased utility from increased non-pecuniary compensation. I view retention, then, as the expression of a physician’s satisfaction with life in the military, which encompasses a myriad of factors, including practice opportunities – that is his or her utility is higher in the military than in the civilian sector6. It is important to look at the social sciences literature regarding physician career choice and satisfaction, findings from past studies that focused on military physician retention, and the general structure of the three services’ medical
5 Increasing pecuniary compensation would also likely increase
retention. Keating et al (need year) explore the effects of increasing the Multiyear Specialty Bonus for Air Force physicians. To determine which option – increasing non-pecuniary or pecuniary compensation – is more cost effective, a cost-benefit analysis is necessary, but this is beyond the scope of this analysis.
6 This caveat is an important one. Retention might not signal satisfaction with the military, but rather a lack of opportunity for other employment which could be a result of physician characteristics or market characteristics. One way to investigate the effect of physician characteristics would be to look at physician productivity or MCAT score – something that could be an imperfect instrument for ability. Additionally, a physician might not be satisfied with his or her current state, but realizes he or she will have a better assignment soon or places a high value on the military retirement benefits he or she is entitled to after 20 years of service. It is important the military retain physicians who not only want to be in the military, but are clinically competent.
- 8 -
branches. Doing so provides the proper context necessary to analyze the effects of practice opportunities on military physician retention.
THE MILITARY HEALTH SYSTEM
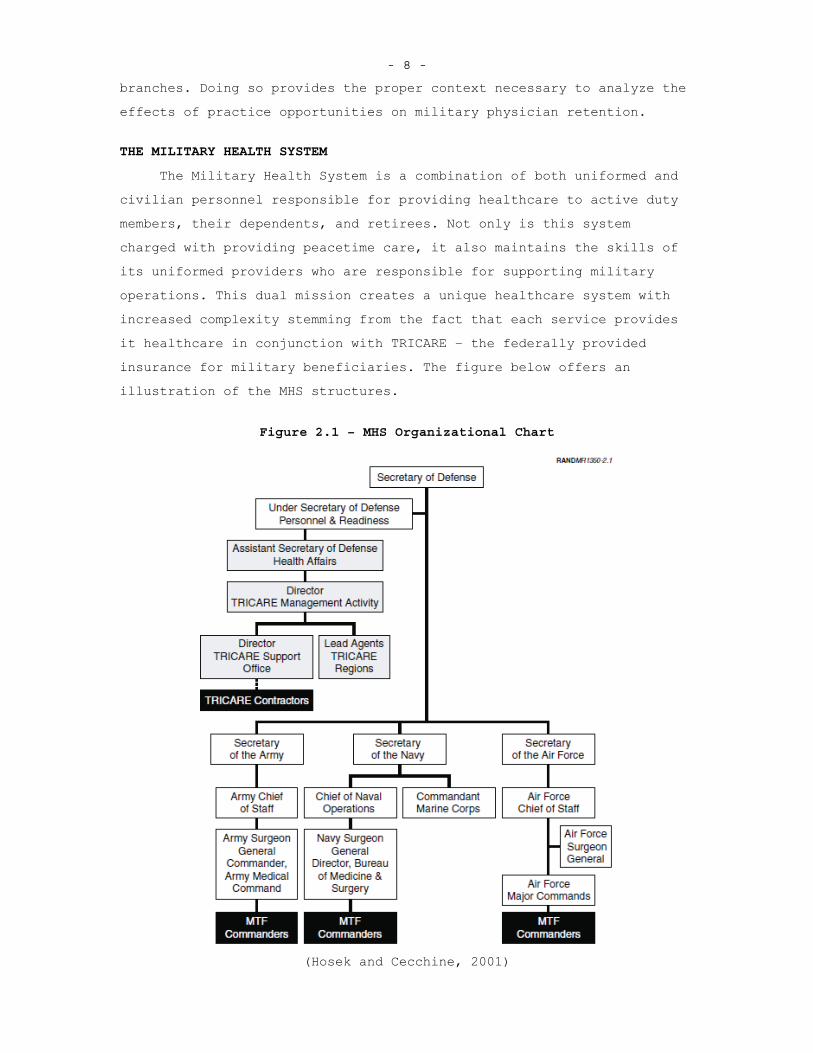
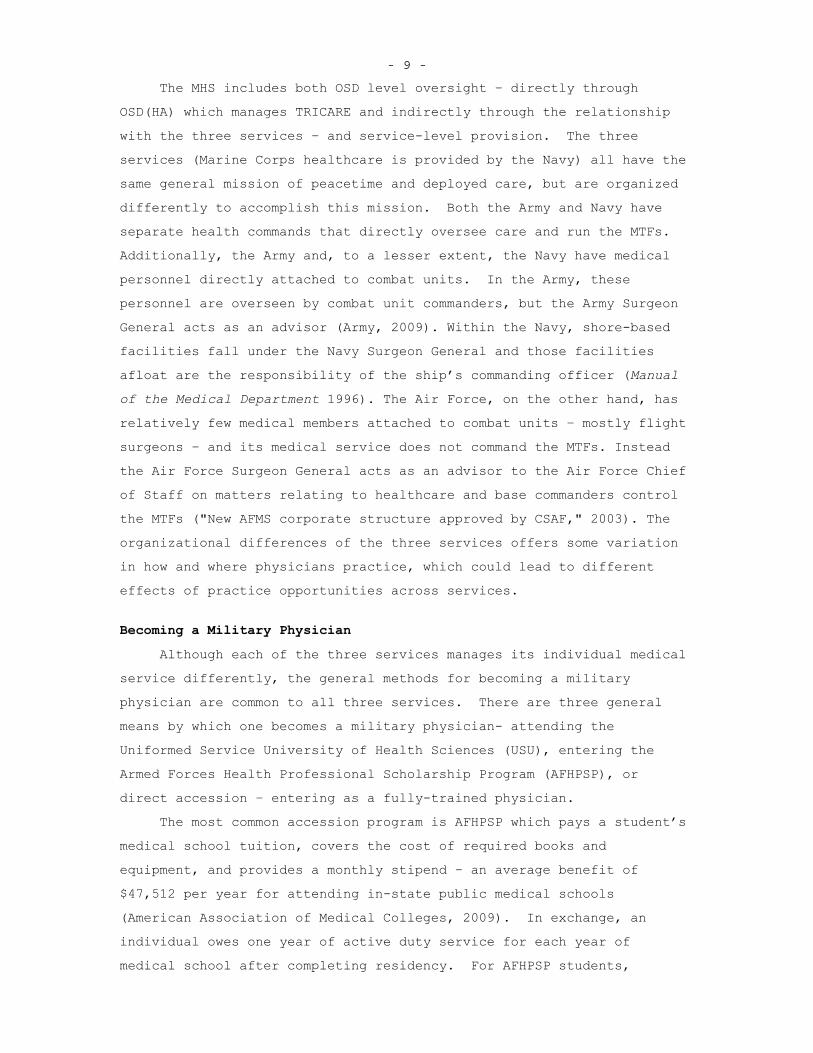
The Military Health System is a combination of both uniformed and civilian personnel responsible for providing healthcare to active duty members, their dependents, and retirees. Not only is this system charged with providing peacetime care, it also maintains the skills of its uniformed providers who are responsible for supporting military operations. This dual mission creates a unique healthcare system with increased complexity stemming from the fact that each service provides it healthcare in conjunction with TRICARE – the federally provided insurance for military beneficiaries. The figure below offers an illustration of the MHS structures.
Figure 2.1 – MHS Organizational Chart
(Hosek and Cecchine, 2001)
- 9 -
The MHS includes both OSD level oversight – directly through OSD(HA) which manages TRICARE and indirectly through the relationship with the three services – and service-level provision. The three services (Marine Corps healthcare is provided by the Navy) all have the same general mission of peacetime and deployed care, but are organized differently to accomplish this mission. Both the Army and Navy have separate health commands that directly oversee care and run the MTFs.Additionally, the Army and, to a lesser extent, the Navy have medical personnel directly attached to combat units. In the Army, these personnel are overseen by combat unit commanders, but the Army Surgeon General acts as an advisor (Army, 2009). Within the Navy, shore-based facilities fall under the Navy Surgeon General and those facilities afloat are the responsibility of the ship’s commanding officer (Manualof the Medical Department 1996). The Air Force, on the other hand, has relatively few medical members attached to combat units – mostly flight surgeons – and its medical service does not command the MTFs. Instead the Air Force Surgeon General acts as an advisor to the Air Force Chief of Staff on matters relating to healthcare and base commanders control the MTFs ("New AFMS corporate structure approved by CSAF," 2003). The organizational differences of the three services offers some variation in how and where physicians practice, which could lead to different effects of practice opportunities across services.
Becoming a Military Physician
Although each of the three services manages its individual medical service differently, the general methods for becoming a military physician are common to all three services. There are three general means by which one becomes a military physician- attending the Uniformed Service University of Health Sciences (USU), entering the Armed Forces Health Professional Scholarship Program (AFHPSP), or direct accession – entering as a fully-trained physician.
The most common accession program is AFHPSP which pays a student’s medical school tuition, covers the cost of required books and equipment, and provides a monthly stipend – an average benefit of $47,512 per year for attending in-state public medical schools (American Association of Medical Colleges, 2009). In exchange, an individual owes one year of active duty service for each year of medical school after completing residency. For AFHPSP students,
- 10 -
residency is done through either a military or civilian Graduate Medical Education (GME) program – the opportunity to do a civilian residency depends on the specific service’s policies and the specialty one is pursuing.
Those who pursue the USU route are commissioned as an O-1 and receive the pay and benefits associated with this rank for the four years that they are at medical school. Upon completing USU, an individual attends a residency – almost always military – and owes seven years of active duty after completing residency. An additional benefit of USU is that the four years of service during medical school count towards retirement pay after an individual reaches 20 years of service, which does not include medical school time.
The least common way for an individual to become a military physician is through direct accession, which can take two forms- a military-funded civilian residency or entering as a fully trained physician. The Financial Assistance Program (FAP) offers residents a stipend – $1,992 a month – while they are completing their residency in exchange for an active duty service commitment of two years for the first year of participation in FAP and six months for each additional six months of training. There are also individuals who complete medical school and residency on their own and then join the military; usually they are obligated for three years.
Direct-entry physicians, at a minimum, hold the rank of O-3 and are awarded additional years of service credit depending on prior military service or civilian experience. After entering the military, a physician must remain on active duty for the time required to complete their initial service obligation.7 The physician can remain on active duty or separate after completing his or her initial service obligation, assuming a physician has not accumulated any additional obligations as a result of further education or training. If a physician remains on active duty, he or she is eligible for multiyear special pay (MSP) – if one is offered in his or her specialty – which
7 There are some – less than 5% of military physicians – that leave
before their apparent service obligations. This could be a result of medical disqualification, disciplinary actions, or simple coding mistakes. The data does not allow for identification of the reason for leaving early. Nonetheless, it is quite rare that a physician would leave before completing his or her initial service obligation.
- 11 -
carries with it an additional commitment of two to four years depending on the level of MSP an individual accepts. Additionally, an individual can remain on active duty without accepting MSP and is only obligated to stay on a yearly basis.
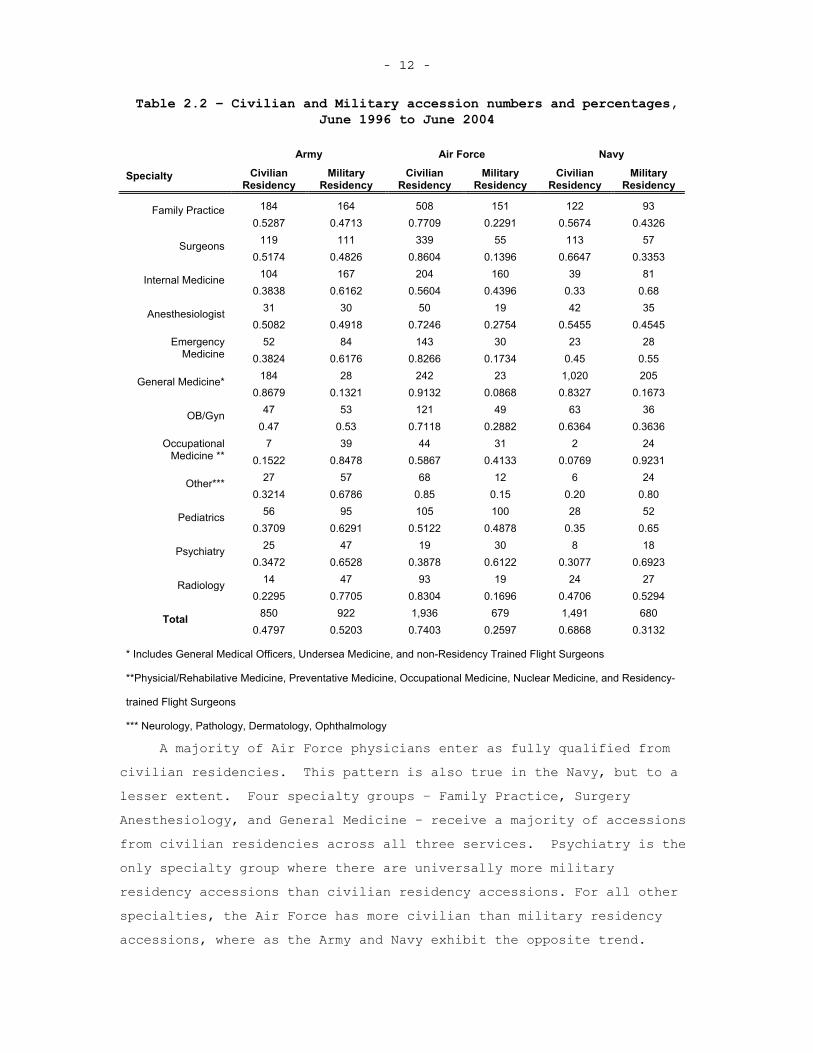
It is important to be aware of these various methods for becoming a military physician when analyzing physician retention. The choice of how one becomes a fully trained military physician appears to be correlated with the initial retention decision and must be handled appropriately in the retention analysis. For example, those who attend the Uniformed Services University of Health Sciences for medical school, on average, remain in the Air Force the longest. It is possible that this pattern occurs because the increased exposure to military life during this training period refine individuals’ tastes for the military or alternatively, those willing to undergo this type of training initially have a higher affinity for military service.Additionally, those who participate in the scholarship program and attend a military residency as opposed to a civilian residency remain in the Air Force for a longer period. It is likely that those who attend military residencies after HPSP have a higher taste for military service than those who attend civilian residencies for the same specialty. Ideally, I could use an instrumental variable approach to mitigate this selection issue, but I lack the data necessary for a valid instrument. Additional heterogeneity within the military physician population is also likely to affect the retention decision and needs to be accounted for in the analysis. The table below illustrates the breakdown of those physicians attending civilian or military residencies by service and initial fully qualified specialty group. This is for all physicians who entered active duty and became fully qualified between June 1996 and June 2004.
- 12 -
Table 2.2 – Civilian and Military accession numbers and percentages, June 1996 to June 2004
Army Air Force Navy
Specialty Civilian Residency
Military Residency
Civilian Residency
Military Residency
Civilian Residency
Military Residency
184 164 508 151 122 93 Family Practice 0.5287 0.4713 0.7709 0.2291 0.5674 0.4326
119 111 339 55 113 57 Surgeons0.5174 0.4826 0.8604 0.1396 0.6647 0.3353
104 167 204 160 39 81 Internal Medicine 0.3838 0.6162 0.5604 0.4396 0.33 0.68
31 30 50 19 42 35 Anesthesiologist 0.5082 0.4918 0.7246 0.2754 0.5455 0.4545
52 84 143 30 23 28 Emergency Medicine 0.3824 0.6176 0.8266 0.1734 0.45 0.55
184 28 242 23 1,020 205 General Medicine* 0.8679 0.1321 0.9132 0.0868 0.8327 0.1673
47 53 121 49 63 36 OB/Gyn 0.47 0.53 0.7118 0.2882 0.6364 0.3636
7 39 44 31 2 24 OccupationalMedicine ** 0.1522 0.8478 0.5867 0.4133 0.0769 0.9231
27 57 68 12 6 24 Other*** 0.3214 0.6786 0.85 0.15 0.20 0.80
56 95 105 100 28 52 Pediatrics0.3709 0.6291 0.5122 0.4878 0.35 0.65
25 47 19 30 8 18 Psychiatry 0.3472 0.6528 0.3878 0.6122 0.3077 0.6923
14 47 93 19 24 27 Radiology 0.2295 0.7705 0.8304 0.1696 0.4706 0.5294
850 922 1,936 679 1,491 680 Total0.4797 0.5203 0.7403 0.2597 0.6868 0.3132
* Includes General Medical Officers, Undersea Medicine, and non-Residency Trained Flight Surgeons
**Physicial/Rehabilative Medicine, Preventative Medicine, Occupational Medicine, Nuclear Medicine, and Residency-
trained Flight Surgeons
*** Neurology, Pathology, Dermatology, Ophthalmology
A majority of Air Force physicians enter as fully qualified from civilian residencies. This pattern is also true in the Navy, but to a lesser extent. Four specialty groups – Family Practice, Surgery Anesthesiology, and General Medicine – receive a majority of accessions from civilian residencies across all three services. Psychiatry is the only specialty group where there are universally more military residency accessions than civilian residency accessions. For all other specialties, the Air Force has more civilian than military residency accessions, where as the Army and Navy exhibit the opposite trend.
- 13 -
These differences likely arise from each service’s differing physician accession policies.
A physician’s assignment changes every three to four years and with each assignment comes additional practice opportunities. While a physician has some say in an assignment – he or she can list assignment preferences – the ultimate decision falls on the respected service. It is the case that a military service can place a physician in an assignment that is different in scope from previous assignments in order to provide career development opportunities. Another form of career development – specifically focused on clinical skills – comes in the form of assigning a physician to a civilian trauma center prior to deployment to refresh and hone clinical skills necessary for deployments. Assignments within the military medical system and special training opportunities allow the medical services to affect a physician’s career development and, to some extent, his or her practice opportunities.
RETENTION OF MILITARY PHYSICIANS
In the era of the All-Volunteer Force, retention and recruitment are necessary to maintain an experienced force. Retention is particularly important for the development of a senior leadership corps and is often seen as the preferred method of maintaining the desired manning levels8. The military has developed bonuses as a means to retain individuals – bonus values are ideally high enough to induce the desired level of physician retention. Additionally it is conceivable
8 Of course 100% retention is neither desired nor possible as there
are limits as to how long an individual can remain on active duty.Retention of quality physicians requires less investment than recruiting and training an individual, all else equal. For this reason, the military often concentrates on retention. It could be the case where marginal benefit of retaining an individual is less than recruiting a replacement and Keating et al (Need year) point to this for the Air Force Medical Corps, i.e. it is less costly to recruit an individual than it is to retain an additional physician. This is true if the skill to cost ratio is more in the recruitment case than the retention case. Additionally, optimal retention should retain those individuals for who military service is a good fit and force out those who are not suited for military service. This aspect is not examined in this dissertation, but policymaker should be mindful of the effects of retention tools and the ability to retain the desired individuals.
- 14 -
that retention or reenlistment bonuses offer additional compensation – beyond other “hardship” pay -- for some of the additional hardships of military service – for example deployments or extended training periods.
During the beginning of the 21st Century, the military has seen an increase in deployments as a direct result of overseas contingency operations. Hosek and Martorell (2009) look at the effects of recent deployments on reenlistment rates for soldiers, sailors, marines, and airmen and find that deployment is beneficial up to a certain level (~7-11 months) but longer deployments have negative effects on retention. Additionally, it appears that increased reenlistment bonuses over this period help services – mainly the Army – retain individuals in spite of the increased levels of deployment.9 Fricker (2002) finds similar results for officers, though deployments for his analysis were before the recent increase in operations tempo.
Other job aspects also affect retention. Retaining the optimal number of individuals is important regardless of career field, but arguably saves additional costs for those career fields that require a fair amount of initial training provided or paid for by the military.The pilot career field is one that is traditionally targeted with retention bonuses and research on pilots may yield useful insights for this study of physicians. Initial training takes at least a year and another additional year is needed for a pilot to be fully trained. To maximize its return on the training investment, the military seeks to retain pilots beyond their initial service. Elliot et al (2004) create a model of military pilots’ decisions to leave the military and consider both monetary and nonmonetary incentives associated with outside opportunities – namely flying commercially. In addition to the increased pay profile military pilots faced in civilian employment at the time of the study, Elliot et al also note that “high operational tempo [and] less enjoyable activities and missions” lead to increased dissatisfaction and a higher likelihood of leaving. From this result, it appears that monetary incentives in addition a lack of excitement or
9 As Hosek and Martorell point out there is inherent endogeneity in
setting reenlistment bonus values. They offer an explanation for the possible effects of the bias this induces on the deployment effect (see Hosek and Martorell, 2009 Appendix C).
- 15 -
little difference between military and civilian job opportunities are reasons for leaving the military.
As with pilots, physicians require a large investment of time and money before they are fully qualified to perform their job. At a minimum, it takes seven years beyond college to have residency trained physicians. Retention of military physicians, along with recruitment, allows the military to maintain the necessary number of physicians. Standard military compensation is less than civilian pay for many military physicians. To mitigate the financial draw of civilian life, the military has established various bonuses to better compensate physicians. One such bonus is the multiyear special pay (MSP), which physicians receive if they commit to additional years of service (usually between two to four years) after their initial service obligation.
Keating et al (2009) examines the historic effects within the Air Force Medical Corps of the MSP bonus and finds that physicians are more likely to stay in the Air Force when offered higher MSP levels. Beyond MSP level, there are other additional characteristics that help predict the physician’s propensity to remain in the Air Force past the initial service obligation. For example, primary care physicians tend to stay longer than specialists based on the mean years of service for these physicians (Keating et al, 2009). The fact that the Air Force retains primary care physicians at a higher rate than specialists could be for two reasons –military primary care physicians have near pay parity with their civilian counterparts and/or the structure of the AFMS, which offers more possible practice locations for primary care physicians than other physician specialties, creating an additional incentive to stay (though the ultimate location is decided based on the needs of the Air Force).
While many physicians enter the military through medical school, some enter directly after residency. This is less common now, but occurred routinely following the creation of the All-Volunteer force. Daubert (1985) analyzes the retention of direct-accession physicians during the early 1908s in the Air Force and found that not only was the civilian-military wage differential a factor in the decision to leave, but also the lack of professional development opportunities – a common theme in focus group analysis that Daubert performed. Additionally, Daubert found that those who worked at smaller hospitals were less
- 16 -
likely to stay, though this result is no longer significant after controlling for specialty. Though direct accessions are now a smaller source of military physicians, these findings are likely applicable to all military physicians as most have similar training backgrounds upon entering military service.
Along with the Air Force, the Navy and Army have also placed a premium on retaining physicians. McMahon (1989) developed a retention model for Navy physicians and reported results similar to those observed in the Air Force. While McMahon notes that working conditions likely affected retention rates, it was difficult to quantify this element at the time of the study and therefore was not included in the empirical model. Similar to physicians in the Air Force, Navy HPSP trained physicians who attend civilian residencies were twice as likely to leave at the end of their initial service obligation as compared to those who attend military residencies. Navy physicians also responded to monetary incentives and it appeared that civilian-military pay influenced the retention decision. In a more recent look at Navy physicians, Christensen et al (2002) reported retention trends among HPSP physicians that attended civilian residencies that were similar to those reported by McMahon (1989).
The decision for an individual to remain in the military depends on various aspects of both his or her personal and professional life. The stress from deployments, long hours, decreased pay, and strains that military life places on families may outweigh the gains an individual receives from serving. For physicians, the decision to remain in the military may mean lower pay than civilian counterparts, reduced autonomy, and time away from family due to training and deployments. The results regarding education decisions of military physicians are important to note when analyzing physician retention, as it appears that prior to entering the military the individuals are beginning to make decisions about how long they plan to remain in the military. It is possible that military physicians, especially those located in smaller hospitals or those who are subspecialists, face reduced practice opportunities. In addition to the other hardships associated with military service, not being able to practice one’s craft might offer an additional reason to leave the military. Knowing how practice opportunities affect retention offers policy makers within
- 17 -
the military medical system another tool by which to increase physician retention.
CAREER CHOICE AND SATISFACTION AMONG PHYSICIANS
As with any job, physicians who are satisfied with their work environment are likely to continue practicing their trade. Given the importance of physicians to the overall healthcare system and the increasing demand for medical care, it is important that physicians are satisfied with their careers so that they continue practicing and providing quality care.10 Therefore, numerous efforts to examine and quantify physician satisfaction have taken place since the middle of the 20th century. While very few of these studies focus specifically on military physicians, the general results offer insight into what drives physician satisfaction and are applicable to military physicians.
Physician career or job satisfaction contains various elements and attributes of an individual physician’s practice setting. While no universally defined set of attributes is used to measure physician job satisfaction, most studies focus on a few broad categories- daily activities, prestige, autonomy, and ability to provide quality care.Using focus groups or survey results, these studies are able to link certain job characteristics to physician career satisfaction.
In one early study on physician job satisfaction, McMurray et al (1997) used data from a nationally representative survey of physicians in large practice groups and focus groups to determine what elements of a physician’s job affected career satisfaction. The survey data was analyzed using qualitative methods with responses coded to match possible measures of career satisfaction as determined by a group of physicians and social scientists. To further determine elements that affected career satisfaction, physician focus groups were also utilized. This analysis led to a modification of previous career satisfaction measures. Broadly, the measures of career satisfaction were broken into eight groups- relationships, demographic influences, day-to-day practice characteristics, administrative and organizational
10 Various articles (Linn et al, 1985, Haas et al, 2000, Feldman et
al, 1998, Linzer et al, 2009)allude to the link between quality of care and physician satisfaction. While this is not the focus of this report, there is good reason to believe that retaining satisfied physicians leads to better healthcare for military personnel.
- 18 -
issues, autonomy, income and prestige, quality of care, and job expectations.11
Particular traits within the day-to-day practice characteristics and expectations categories – workload, intellectual stimulation, case mix/patient variety, and discrepancy between job expectations and experience – are especially relevant to the question of practice opportunity effects on physician retention. While McMurray et al do not specifically identify how these particular elements affect physician career satisfaction, the attention called to those particular elements provides further insight into what might factor into physician career satisfaction. Not only is it important to explore the factors that affect physician career satisfaction for the entire physician population, it is also important to examine the effects conditional on specialty, practice setting, and location. Additionally, examining the initial specialty choice and practice setting is important for understanding physician career satisfaction. While it is likely the case that an individual’s preferences vary across all these factors, finding general themes illuminates possible policy implications of incentives or changes to these factors. While increased satisfaction does not guarantee increased retention, there is likely a link between the two.
Physician Specialty
It is almost a certainty that different specialists will derive satisfaction from different factors. Looking at survey data of physicians, there is evidence that many of the procedural specialties – for example OBGYN, orthopedic surgery, and otolaryngology – are more likely to be dissatisfied than family practice physicians. Furthermore some of the cognitive specialties – Dermatology, Geriatric Internal Medicine, and Pediatrics – report higher relative satisfaction (Leigh et al, 2002). This is not to say that all procedure-based physicians are dissatisfied and consultation-based physicians are satisfied, rather it illustrates the differences across specialties and even within the medical and surgical categories.12
11 A follow-up to this report (Williams et al, 1999) identified 10
satisfaction factors and 3 global factors. 12 It is important to note that Leigh, et al (2002) find that
increased income, relative to the $100,000-149,999 range, leads to
- 19 -
While it is evident that job satisfaction varies by specialty, it is also important to look at the variation over time. Changes to practice organizations, changes in payment systems, and technologicaladvances over the last 40 years have modified the way physicians practice their trade. It is likely that those physicians who have experienced any of these changes have also altered their perception of their job. On a macro level, this hypothesis is unconfirmed; as it appears that physician satisfaction remained unchanged from 1997 to 2002, though this is a relatively short time-period over which such a change might not have time to manifest itself. It is important to note that clinical autonomy – specifically the ability to spend adequate time with patients, provide quality care, and refer to proper specialists – increases satisfaction on the micro level. Additionally, local market conditions have a noticeable effect on physician satisfaction (Landon et al, 2003).
Although there are differences in what affects career satisfaction across specialties, common elements are also persistent. Personal accomplishment, the ability to help others, and particularly the ability to control one’s schedule and hours worked are strong predictors of satisfaction, irrespective of specialty (Keeton et al, 2007). Looking specifically at primary care physicians in Great Britain, it is the case that younger physicians value the ability to concentrate on special interests – a proxy for intellectual satisfaction (Scott, 2001). It is important to note that age is a strong predictor of satisfaction, notably being younger than 35 or older than 65 increases the odds of being satisfied (Leigh et al, 2002). Both common aspects – such as specialty and practice types – and individual factors are influential determinants of physician career satisfaction.
Practice Setting
One of the greatest changes in the physician career field over at least the last 20 years is the shift from small private practice settings to large group and multispecialty settings (Tu and Ginsburg, 2006). Undoubtedly, this shift affects the career satisfaction of
increased odds of satisfaction. Higher pay is usually associated with more specialization and training.
- 20 -
physicians. For primary care providers there are notable differences in the perception of longer patient visits. Those primary care providers in traditional settings – small private practices – report that such visits increase job satisfaction whereas those in large practices have an opposing view (Breslau et al, 1978). The difference may be accounted for by preferences of the physicians that cause them to choose their practice setting, but there are also organizational effects. The current Medicare billing schedule incentivizes physicians to keep each patient visit within set time limits. It is possible that visit times could vary over these two settings and likely that larger practices follow stricter schedules because of the additional administrative resources available to them. If one interprets longer visits (beyond the maximum billable time for a given condition) as a proxy for more complex cases, it is possible that the non-pecuniary effects of this intellectual stimulation for private practice primary care physicians outweighs the opportunity cost of decreasing patient volume.
Additional insight into practice setting effects also comes from looking at similar organizational structures across countries. When comparing physicians in academic settings from the United States and Germany, one finds that autonomy is an important factor for physician career satisfaction in both nations. Yet it appears that US physicians are more satisfied than German physicians – one explanation being that US physicians practice in a relatively flexible environment as compared to German physicians (Janus et al, 2008).
This organizational comparison seems to extend to the comparison between military and civilian physicians. When looking at the satisfaction of Navy physicians, one finds that similar elements influence their job satisfaction as compared to civilian physicians.Navy physicians work in a generally rigid environment – where there is less clinical and individuals autonomy relative to most civilian settings – based on the military regulations that constrain them, which could account for an increased level of dissatisfaction. Two elements of this environment have a strong relation with practice opportunities- administrative burden and professional development (Brannman, 2000).The dissatisfaction with the administrative burden stems from the perceived importance placed on leadership development by senior leaders in each medical service, which physicians refer to as a devaluation of
- 21 -
clinical excellence (Brannman, 2000). Similarly, professional development dissatisfaction stems from the inability to pursue additional medical training, usually in the form of subspecialty fellowships. Both elements of satisfaction are closely related and speak to the non-pecuniary aspects, albeit negative ones, associated with being a Navy physician.
Location
Many countries, especially those more developed, have policies to incentivize physicians to locate in rural areas – often underserved and seemingly less desirable. Newhouse et al (1982) look at this problem using standard economic theory and determine that it is not market failure that is leading to fewer physicians in rural areas, but rather the fact that these areas do not offer the patient numbers and types necessary for a physician to sustain a viable practice. While Newhouse et al find that physicians do, to some extent, prefer to live in cities because of the non-pecuniary benefits that come with urban living, this is not what drives the physician location decision.
One aspect that confounds physician location analysis in the US is the heterogeneity in practice settings and payment options, which could be correlated with location (though this was less of a factor when Newhouse et al performed their analysis). Canada, with its single payer system, has fairly homogeneous practice settings for physicians and therefore makes it possible to further isolate the non-pecuniary effects of a location. Bolduc et al (1996) use data from Quebec that tracks incentives for physicians to locate in certain regions within the province. The analysis finds that the coefficients on availability of entertainment, services, and resources are positive, but not statistically significant in determining where a physician locates his or her practice. Such a result offers little conclusive evidence on the non-pecuniary effects of locations.. It is likely that physicians account for the practice opportunities of a region and the desirability of a location when determining where to practice.13 Although military physicians have less choice in location, the decision to join a certain
13 Note that these two aspects are almost certainly correlated;
those locations with desirable attributes are also likely to attract more individuals leading to increased practice opportunities.
- 22 -
service – Army, Navy, or Air Force – might be related to location preferences. Navy physicians are more likely to be stationed in large metropolitan areas compared to Air Force physicians, who can be stationed at relatively austere locations.
Career Choice
Physicians in the US have two major choices related to their clinical career- specialty type and whether to pursue a private practice – which I consider as any non-government position -- or public sector job. Additionally, physicians in private practice must decide between starting a solo practice and joining a preexisting practice.Within the private or public sector, a physician could also work in academic, consultation, or research positions. Specialty choice has received much attention over the years, especially given the increasing wage differentials between primary care physicians and specialists or sub-specialists, along with the perceived under-provision of primary care physicians. Nicholson (2002) uses an economic framework to examine the choice of physician specialty and accounts for the uncertainty in this choice that stems from the residency match process. One interesting aspect of the specialty decision and therefore the residency system is that the market does not clear as more individuals desire specialties than there are slots for these specialties.Additionally, wages do not differ by residency program within a specialty. Nicholson also looks at the non-pecuniary aspects of specialty choice to further explain the decision process, though it appears that there is little relationship between observable individual attributes and the preference for non-pecuniary aspects of specialties. Overall his results indicate that the biggest driver of specialty choice is expected income.
The other choice that affects expected income is the decision to work in the private or public sector. Making the decision to become a military doctor or enter private practice is of particular interest to this study. One major advantage of entering the military to become a physician is the fact that the military pays for medical school and provides a generous stipend in exchange for four years of military service following residency training. Of course an individual is limited in some other choices, but does not incur debt from medical
- 23 -
school. The two accession programs that provide medical training are the AFHPSP and UPU, these two programs provide the military with a majority of its physicians.
Dauber et al (1982) examine the effects of modifying the AFHPSP compensation scheme to further entice individuals to join the military for medical training. While one would imagine that higher compensation during medical school would lead to increased participation, the study finds this has little effect. Instead, medical students desire an increase in compensation during the initial service obligation – parity with their civilian counterparts matters. This result points to a willingness amongst medical students to forgo near-term compensation for greater rewards in the future.
Given the unique constraints of military service – a more rigid practice setting, limited locations and frequent moves, and decreased monetary compensation relative to the civilian workplace – many medical students are likely to see military medicine as an undesirable career choice. Yet some medical students choose military service and a subset remain for an entire career. Based on the aforementioned literature, it is possible that some individuals are able to practice in desirable locations, have increased practice opportunities, or derive utility from being in the military. Where a large pay disparity exists for military physicians, such as for subspecialists (as previously shown in Table 1), there is certainly a combination of non-pecuniary factors that drive physicians to remain in the military beyond their initial service commitment.
- 24 - 3. DATA
For the analysis of the physician retention decision, I use four administrative datasets that track personnel and procedures/cases physicians see. The personnel datasets utilized are the Active Duty Military Pay File, Reserve Pay File, Work Experience File, and Proxy PERSTEMPO. All four files are from the Defense Manpower Personnel Data Center (DMDC) – the entity within DoD responsible for maintaining personnel data for the Department of Defense. Additionally, the DMDC data provides the duty locations of a physician which corresponds to the specific MTF he or she is assigned to and can be used as a proxy for practice opportunities. I use data that runs from June 1996 to June 2009 and only analyze physicians who become fully qualified between June 1996 and June 2004 who are not USU graduates. I drop USU graduates from the analysis because these individuals incur an initial service obligation of almost twice what an HPSP grad receives – seven years as opposed to four years – and therefore have little chance of seeing these individuals make any retention decisions in the data available.14 This allows me to potentially see each individual past his or her initial service obligation. Below is a description of the data sets and the methodology I will use to measure practice opportunities for physicians.
PERSONNEL DATA
The four data sets used to create the individual physician personnel records all originate from DMDC and therefore can be linked using scrambled individual identifiers. By linking a scrambled identifier, I can create a fairly comprehensive personnel record for each physician that tracks him or her on a monthly basis from the point he or she entered the military until the point he or she left or up to the present date – whichever is earlier. Because many physicians enter
14 USU accessions only account for ~10% of accessions and therefore
leaving these individuals out should not have a great effect on my results. Additionally, most USU physicians have at least 10 years of service before they are eligible to separate meaning they are halfway to receiving their pensions. Keating et al (2009) finds that many of these individuals end up staying to 20 years so retention within this group is likely not a large concern.
- 25 -
the military through the reserve components (HPSP participants are paid with reserve funds) it is necessary to track individuals across both the reserve and active duty components. To do this, I use three administrative files from DMDC- the Reserve Pay File, the Active Duty Pay File, and the Work Experience (WEX) File. I offer a brief description of each file below.
Active Duty Pay File
The Active Duty Pay File is created by DMDC on a monthly basis (going back to August 1991) and records a service member’s pay and demographic data. There is a record for each service member each month they are on active duty. Because of data accuracy issues, I use data starting in June 1996 and ending with the most recent data, June 2009.For physicians, this file records the base pay and any additional bonuses they receive, to include MSP. Those who accessed through USU are initially seen in the file as O-1s for four years where as all other physicians first appear as O-3s or higher. The Active Duty Pay File contains a “Projected Separation Date” field the tracks the separation date, but unfortunately this date is not coded for most individuals and cannot be used to determine the initial service obligation. I am able to see a physician’s pay data throughout his or her career and can use this in my retention analysis. With the additional pay data, I am able to control for civilian-military wage differentials by specialty and year using specialty-service-year dummies, which likely affect retention.
Reserve Pay File
The Reserve Pay File is similar to the Active Duty Pay File, but tracks payment an individual receives during his time in the reserves.This file begins with monthly records in August 1993. Again, because of accuracy issues, I use files beginning in June 1996 and ending with the most recent data, June 2009. This file is useful for determining physician accession source since those who received HPSP are paid with reserve funds and hold a commission in the reserve component of the service they plan to enter upon completion of training. An HPSP recipient will hold the grade of O-1 for two to four years and will be paid with reserve funds each month except during the 45-day period each year that he is on active duty. Those participating in FAP hold the
- 26 -
grade of O-3 and are paid with reserve funds except while performing their mandatory 15-day active duty commitment.
Work Experience File
The Work Experience File tracks an individual service member’s military career across reserve and active duty service. The file begins in 1993 and I use from June 1996 to June 2009. New records are not necessarily created monthly, as this is a transition file. An episode is generated when a member changes services, components, jobs, transitions from enlisted corps to the officer corps, is promoted, or leaves the service. I use this file to indentify those physicians who transitioned from the reserves to active duty. This is a further indication that an individual participated in HPSP or FAP. I am able to determine the accession program for each individual by combining WEX with the Reserve Pay file.
Tracking a Physician’s Career
In order to look at physician duration, it is necessary to know
when an individual physician begins his or her initial service
obligation. Any physician who receives financial assistance from the
military in order to complete his or her medical training must serve at
least three years on active duty and many are obligated for four years
(one year for each year of medical school financed by DoD). The initial
obligation does not begin until a physician has finished all of his or
her training – internships, residencies, and fellowships that
immediately follow residencies. Therefore a physician entering from
civilian residencies begins to serve his or her initial service
obligation immediately. A physician who enters a military residency
does not begin to serve his or her initial service obligation until
completing the residency program even though he or she is on active duty
while in the military residency program. For this reason, it is
necessary to estimate when a military resident becomes fully qualified.
The military follows the same convention for residency and fellowship
lengths as the civilian sector so it is possible to estimate the date
when an individual becomes fully qualified based on his or her initial
specialty.
(the font changes here)Both pay files report various demographics on individuals, the compensation they receive, the pay grade they hold in a given month, and the location where they are stationed. The WEX
- 27 -
file tracks individuals as they change between the reserve and active duty component, when job codes change, and when pay grade changes. The transition between reserve and active duty is particularly important for physicians as it is partly indicative of accession source.Theoretically, those physicians who access via HPSP or FAP will have a WEX episode and will also have Reserve Pay file records. Those HPSP physicians that complete a military residency will be coded as an O-3 on active duty for at least 6 years. Direct accession and USU physicians will not have a reserve to active duty transition or Reserve Pay file records. Additionally, USU physicians will hold the pay grade of O-1 for 4 years on active duty while attending USU and also spend 6 years as an O-3 since they complete military residencies.
Unfortunately, the DMDC data are not “clean” and these simple rules don’t always work for determining an individual physician’s accession source. Those individuals who attend USU are easily identified, using both the fact that they remain O-1s for four years and that USU has a unique location code. To determine who attends HPSP and a military residency, I use the fact that those individuals should spend 6 years as a physician at the grade of O-3. Additionally, each service has designators within each personnel code for whether or not a physician is attending a residency and there are accession type codes in the personnel records.15 I am, therefore, able to determine which individuals attended USU and which ones completed military residencies after attending HPSP or USU. This is important, since a physician cannot leave the military until after completing residency training and his or her initial service obligation. Beginning the duration analysis prior to a physician beginning to serve his or her initial service obligation would create a downward bias in the hazard rates, as physicians are unable to leave during military residencies.16 The
15 Unfortunately only ~30% of Air Force individuals have residency
designators, only ~15% for the Army, and ~23% for the Navy. It also the case that ~25% of individuals have no commissioning source code, but using the other information (USU and HPSP related info), I am able to reduce the number of individuals with no commissioning information to ~12%. It is likely that most of theses individuals are HPSP alumni who attended civilian residencies, but I refrain from coding them all as such since there are likely a few who are direct accession – none of their medical education occurred within the military.
16 It could also be argued that the initial service obligation should be excluded from the duration analysis model, but the obligation
- 28 -
ability to identify when an individual is in a residency program allows for a more relevant retention model since a physician in training is not typically deployable, restricting the military’s utilization of such individuals.
The pay files and WEX also offer information on retention and duration of a physician’s active duty military service. While I would ideally like to explore factors that affect the initial retention decision, as this is the first time a physician can leave military service and is the focus of many of the policy levers used to increase physician retention (bonuses and additional training), the data do not allow for accurate identification of this decision point. I attempted to use an algorithm based on specialty, commissioning source, and residency type to determine when a physician is eligible to separate and was unsuccessful.17 This suggests that a binomial choice model that only considers the first retention decision is not feasible with the given data and another approach, specifically duration analysis, is necessary. I am still able to use the WEX data to determine how long a physician remains on active duty. Furthermore, I use the data that identifies a physician’s specialty to determine when he or she is a fully trained physician – it is assumed that those who enter upon completing a civilian residency are fully trained. A full description of the algorithm for determining when a physician is fully qualified is presented in Appendix B.
length is difficult to determine on an individual level with the data I have. In order to control for inability for physicians to leave during this time, the baseline hazard must change over time requiring a non-parametric or piecewise baseline hazard function. Additionally, if initial service obligation is correlated with any of the other explanatory variables, leaving it out of the analysis would lead to an omitted variable bias. Because I am looking mostly at individuals who attend HPSP and almost all career a four year initial service obligation, it is unlikely initial service obligation is correlated with any of the explanatory variables.
17 Originally, I attempted to determine a physician’s initial service obligation by adding his or her residency length to the initial medical service date and then adding on the associated commitment from his or her accession source. This produced retention rates that were much higher than expected at the 3-year and 4-year points after the initial service obligation began (Keating et. al finds retention rates in the Air Force Medical Corps for 3-year- ~60% for those entering out of medical school and ~60% for those entering out of a residency program, and 4-year- ~50% and ~25%, respectively. I find rates 3-year- ~79% and ~77%, and 4-year- ~53% and ~61%.)
- 29 -
It is important to begin analyzing physicians after they are fully trained since ~40% of physicians enter active duty service as fully-trained, while the rest complete a military residency (Defense, 2009).Not accounting for this would make it appear that physicians who complete a military residency are more likely to remain on active duty longer than those who enter fully trained. Of course this is true, but it is only because of how the active duty service commitment works – those who enter as fully trained physicians begin serving their commitment immediately, whereas those who enter directly from medical school must still complete a residency before they begin to serve their initial obligation. A decision to leave the military is observed if a WEX episode is generated that indicates a physician left active duty. Additionally, most physicians who remain beyond their initial obligation do so by accepting MSP and/or Incentive Special Pay (ISP) – both carrying additional service obligations – for which data are included in the Active Duty Pay file and these need to be accounted for in the retention analysis model.18
Using the pay data and WEX file, it is possible to track the military careers of those physicians entering after June 1996. To further assess aspects of an individual physician’s military career, I link Proxy PERSTEMPO to the personnel records to determine when and for how long a physician was deployed. For this analysis, I only consider deployments in support of post-9/11 operations. Data limitations make
it difficult to track the nature of pre-9/11 deployments. It is also
the case that during this period, there were few lengthy deployments,
especially for physicians. Given that there is a commonly held belief
among policymakers that deployments can lead to decreased retention
rates, it is important to examine the effect of deployment on physician
retention.
18 Physicians can also extend their active duty commitment by
accepting additional training opportunities, such as fellowships or residencies if they have not completed such training. In conversations with Army personnel, educational incentives are utilized as retention tools more so than MSP. A physician can also remain on active duty after completing his initial obligation without extending his commitment past a one-year period. This action will also be considered retention because it adds to the end strength of the medical corps.
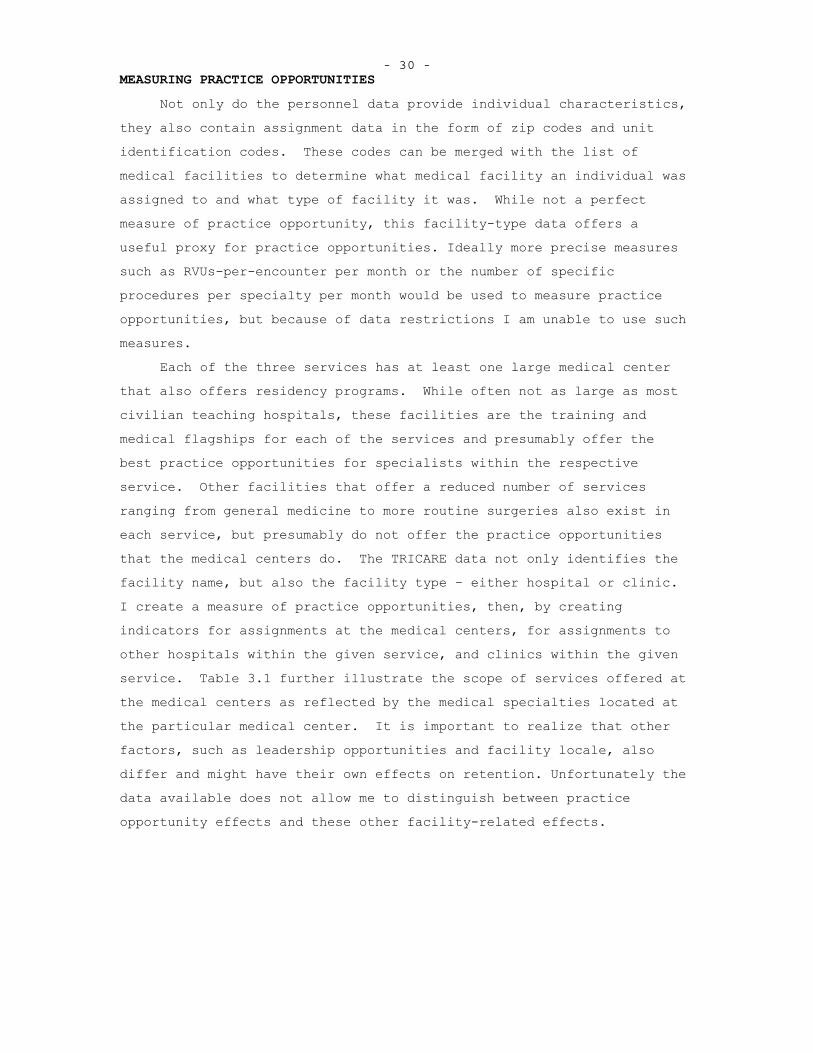
- 30 - MEASURING PRACTICE OPPORTUNITIES
Not only do the personnel data provide individual characteristics, they also contain assignment data in the form of zip codes and unit identification codes. These codes can be merged with the list of medical facilities to determine what medical facility an individual was assigned to and what type of facility it was. While not a perfect measure of practice opportunity, this facility-type data offers a useful proxy for practice opportunities. Ideally more precise measures such as RVUs-per-encounter per month or the number of specific procedures per specialty per month would be used to measure practice opportunities, but because of data restrictions I am unable to use such measures.
Each of the three services has at least one large medical center that also offers residency programs. While often not as large as most civilian teaching hospitals, these facilities are the training and medical flagships for each of the services and presumably offer the best practice opportunities for specialists within the respective service. Other facilities that offer a reduced number of services ranging from general medicine to more routine surgeries also exist in each service, but presumably do not offer the practice opportunities that the medical centers do. The TRICARE data not only identifies the facility name, but also the facility type – either hospital or clinic.I create a measure of practice opportunities, then, by creating indicators for assignments at the medical centers, for assignments to other hospitals within the given service, and clinics within the given service. Table 3.1 further illustrate the scope of services offered at the medical centers as reflected by the medical specialties located at the particular medical center. It is important to realize that other factors, such as leadership opportunities and facility locale, also differ and might have their own effects on retention. Unfortunately the data available does not allow me to distinguish between practice opportunity effects and these other facility-related effects.
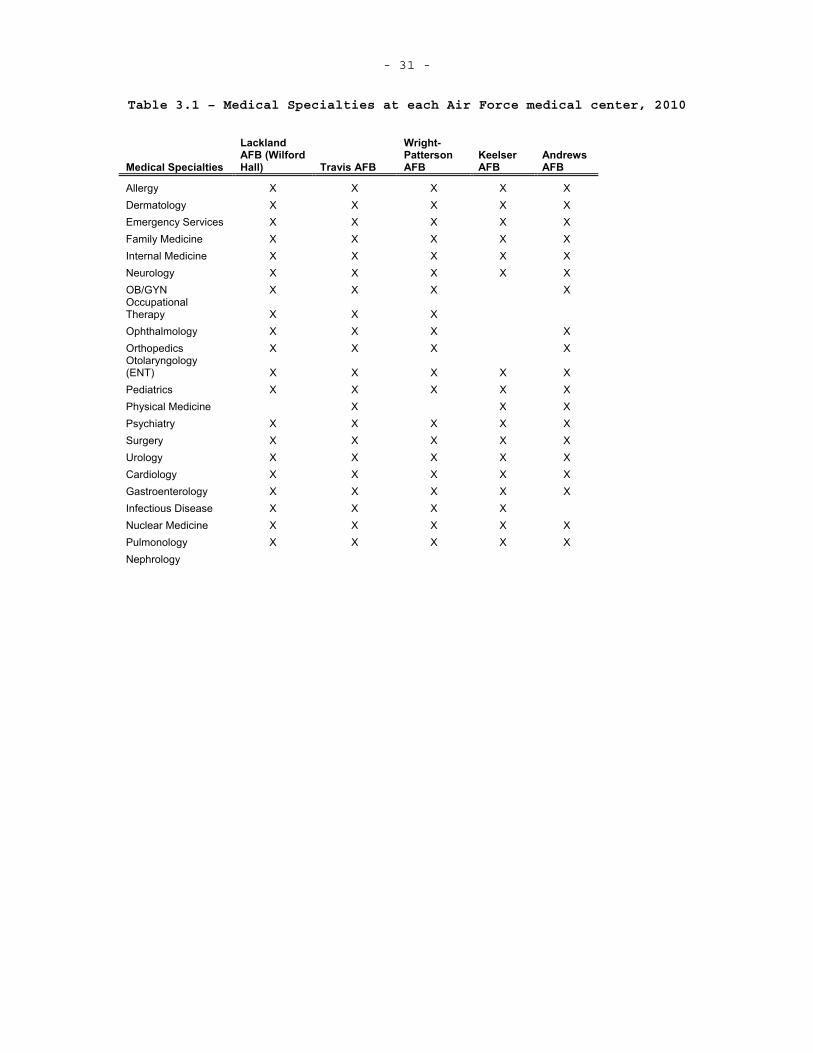
- 31 -
Table 3.1 – Medical Specialties at each Air Force medical center, 2010
Medical Specialties
Lackland AFB (Wilford Hall) Travis AFB
Wright-Patterson AFB
KeelserAFB
Andrews AFB
Allergy X X X X XDermatology X X X X X Emergency Services X X X X XFamily Medicine X X X X XInternal Medicine X X X X XNeurology X X X X X OB/GYN X X X X OccupationalTherapy X X X Ophthalmology X X X X Orthopedics X X X X Otolaryngology (ENT) X X X X XPediatrics X X X X X Physical Medicine X X XPsychiatry X X X X X Surgery X X X X X Urology X X X X X Cardiology X X X X X Gastroenterology X X X X X Infectious Disease X X X XNuclear Medicine X X X X XPulmonology X X X X X Nephrology
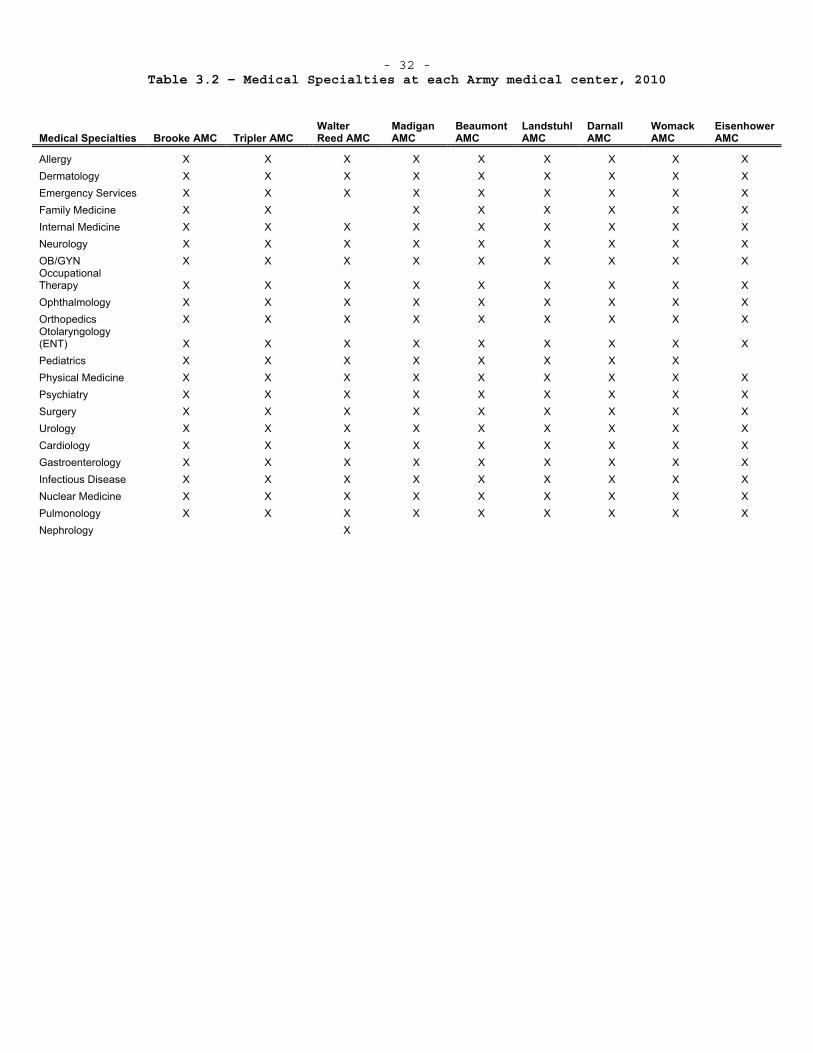
- 32 - Table 3.2 – Medical Specialties at each Army medical center, 2010
Medical Specialties Brooke AMC Tripler AMC Walter Reed AMC
Madigan AMC
Beaumont AMC
Landstuhl AMC
DarnallAMC
WomackAMC
Eisenhower AMC
Allergy X X X X X X X X X Dermatology X X X X X X X X X Emergency Services X X X X X X X X X Family Medicine X X X X X X X XInternal Medicine X X X X X X X X X Neurology X X X X X X X X X OB/GYN X X X X X X X X X OccupationalTherapy X X X X X X X X X Ophthalmology X X X X X X X X X Orthopedics X X X X X X X X X Otolaryngology (ENT) X X X X X X X X X Pediatrics X X X X X X X X Physical Medicine X X X X X X X X X Psychiatry X X X X X X X X X Surgery X X X X X X X X X Urology X X X X X X X X X Cardiology X X X X X X X X X Gastroenterology X X X X X X X X X Infectious Disease X X X X X X X X X Nuclear Medicine X X X X X X X X X Pulmonology X X X X X X X X X Nephrology X
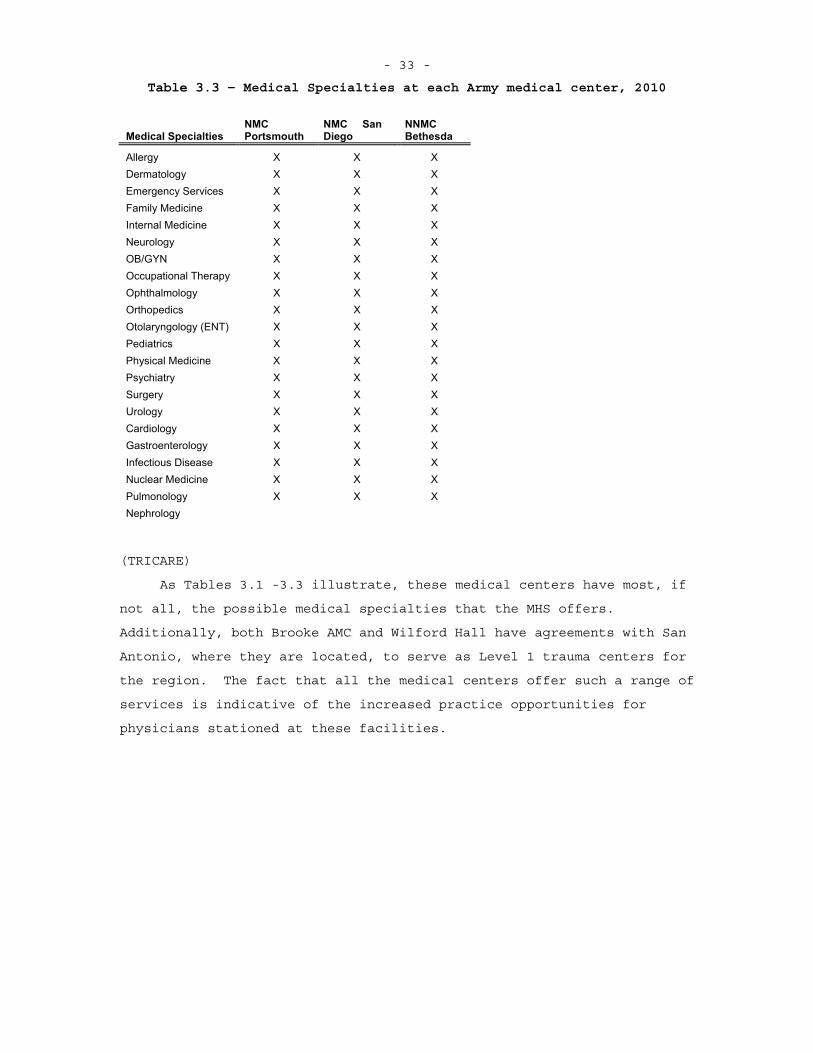
- 33 -
Table 3.3 – Medical Specialties at each Army medical center, 2010
Medical Specialties NMCPortsmouth
NMC San Diego
NNMCBethesda
Allergy X X X Dermatology X X X Emergency Services X X X Family Medicine X X XInternal Medicine X X XNeurology X X X OB/GYN X X X Occupational Therapy X X XOphthalmology X X X Orthopedics X X X Otolaryngology (ENT) X X XPediatrics X X X Physical Medicine X X XPsychiatry X X X Surgery X X X Urology X X X Cardiology X X X Gastroenterology X X X Infectious Disease X X XNuclear Medicine X X XPulmonology X X X Nephrology
(TRICARE)
As Tables 3.1 -3.3 illustrate, these medical centers have most, if
not all, the possible medical specialties that the MHS offers.
Additionally, both Brooke AMC and Wilford Hall have agreements with San
Antonio, where they are located, to serve as Level 1 trauma centers for
the region. The fact that all the medical centers offer such a range of
services is indicative of the increased practice opportunities for
physicians stationed at these facilities.
- 34 -
4. METHODS In this section I present the analytical framework used to determine the effects of practice opportunities on physician retention. A theoretical model is used to provide an overview of how an individual physician makes the medical school/residency and retention decisions. These two decisions are considered separately in order to illustrate the choices involved in each decision, but could be jointly considered.
THEORETICAL FRAMEWORK
The Medical School and Residency Decision
The decision to become a military physician is treated as a utility maximization problem. Once an individual decides to become a physician, presumably during their college years, he or she decides how to fund his or her education. I assume an individual can decide to finance medical school privately or utilize a military program. There are two military programs to fund medical school – HPSP and USU. Under HPSP, a medical student receives a monthly stipend to cover living expenses and tuition is paid for by the military. In return, the individual must serve at least 3 years on active duty after completing training. Depending on the service and specialty choice, an individual can complete either a military or civilian residency. The USU program is different in that an individual attends the federally funded medical school in Bethesda, MD. While in medical school, he or she serves on active duty with the pay grade of O-1. Upon completing training, an individual must spend 7 years on active duty. If an individual chooses to privately fund medical school, he or she can still join the military after medical school, either through FAP, which provides a stipend during residency, or being directly commissioned in to one of the services. All physicians are commissioned as O-3s unless they have prior medical experience or commissioned service, which can cause an individual to be commissioned at a higher pay grade. In looking at the decision to become a military physician, I only consider the options where the outcome is becoming a military physician and additionally treat the private funding options – FAP or direct commission – as one in the same. Further, I assume that the funding and
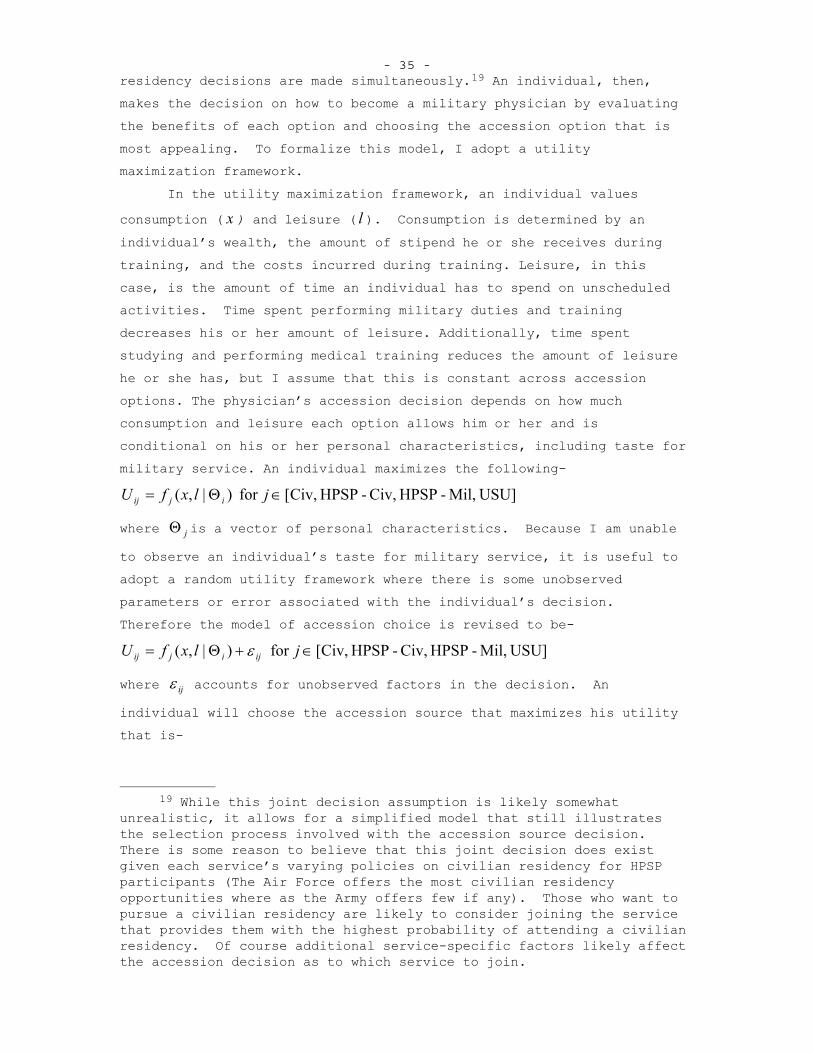
- 35 - residency decisions are made simultaneously.19 An individual, then, makes the decision on how to become a military physician by evaluating the benefits of each option and choosing the accession option that is most appealing. To formalize this model, I adopt a utility maximization framework. In the utility maximization framework, an individual values
consumption ( x ) and leisure ( l ). Consumption is determined by an individual’s wealth, the amount of stipend he or she receives during training, and the costs incurred during training. Leisure, in this case, is the amount of time an individual has to spend on unscheduled activities. Time spent performing military duties and training decreases his or her amount of leisure. Additionally, time spent studying and performing medical training reduces the amount of leisure he or she has, but I assume that this is constant across accession options. The physician’s accession decision depends on how much consumption and leisure each option allows him or her and is conditional on his or her personal characteristics, including taste for military service. An individual maximizes the following-
USU]Mil,-HPSP Civ,-HPSP Civ,[for )|,( jlxfU ijij
where j is a vector of personal characteristics. Because I am unable
to observe an individual’s taste for military service, it is useful to adopt a random utility framework where there is some unobserved parameters or error associated with the individual’s decision.Therefore the model of accession choice is revised to be-
USU]Mil,-HPSP Civ,-HPSP Civ,[for )|,( jlxfU ijijij
where ij accounts for unobserved factors in the decision. An
individual will choose the accession source that maximizes his utility that is-
19 While this joint decision assumption is likely somewhat
unrealistic, it allows for a simplified model that still illustrates the selection process involved with the accession source decision.There is some reason to believe that this joint decision does exist given each service’s varying policies on civilian residency for HPSP participants (The Air Force offers the most civilian residency opportunities where as the Army offers few if any). Those who want to pursue a civilian residency are likely to consider joining the service that provides them with the highest probability of attending a civilian residency. Of course additional service-specific factors likely affect the accession decision as to which service to join.
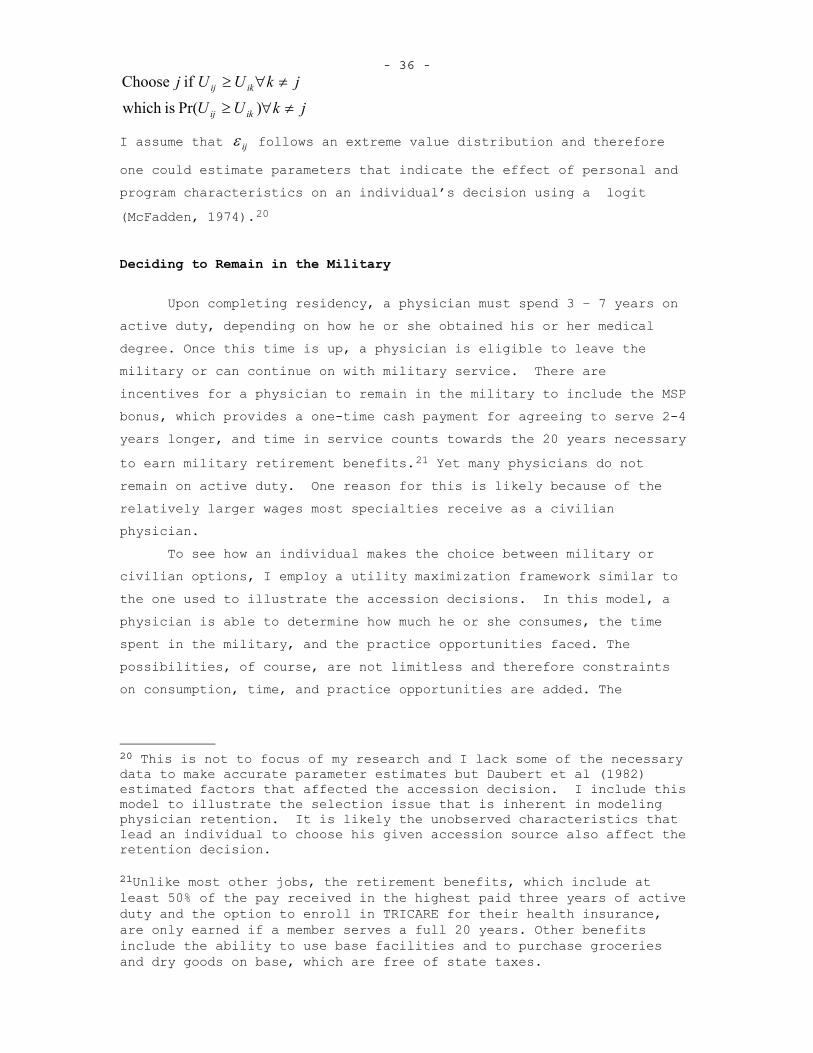
- 36 -
jkUUjkUUj
ikij
ikij
)Pr( iswhich
if Choose
I assume that ij follows an extreme value distribution and therefore
one could estimate parameters that indicate the effect of personal and program characteristics on an individual’s decision using a logit
(McFadden, 1974).20
Deciding to Remain in the Military
Upon completing residency, a physician must spend 3 – 7 years on
active duty, depending on how he or she obtained his or her medical degree. Once this time is up, a physician is eligible to leave the military or can continue on with military service. There are incentives for a physician to remain in the military to include the MSP bonus, which provides a one-time cash payment for agreeing to serve 2-4 years longer, and time in service counts towards the 20 years necessary
to earn military retirement benefits.21 Yet many physicians do not remain on active duty. One reason for this is likely because of the relatively larger wages most specialties receive as a civilian physician.
To see how an individual makes the choice between military or civilian options, I employ a utility maximization framework similar to the one used to illustrate the accession decisions. In this model, a physician is able to determine how much he or she consumes, the time spent in the military, and the practice opportunities faced. The possibilities, of course, are not limitless and therefore constraints on consumption, time, and practice opportunities are added. The
20 This is not to focus of my research and I lack some of the necessary data to make accurate parameter estimates but Daubert et al (1982) estimated factors that affected the accession decision. I include this model to illustrate the selection issue that is inherent in modeling physician retention. It is likely the unobserved characteristics that lead an individual to choose his given accession source also affect the retention decision.
21Unlike most other jobs, the retirement benefits, which include at least 50% of the pay received in the highest paid three years of active duty and the option to enroll in TRICARE for their health insurance, are only earned if a member serves a full 20 years. Other benefits include the ability to use base facilities and to purchase groceries and dry goods on base, which are free of state taxes.
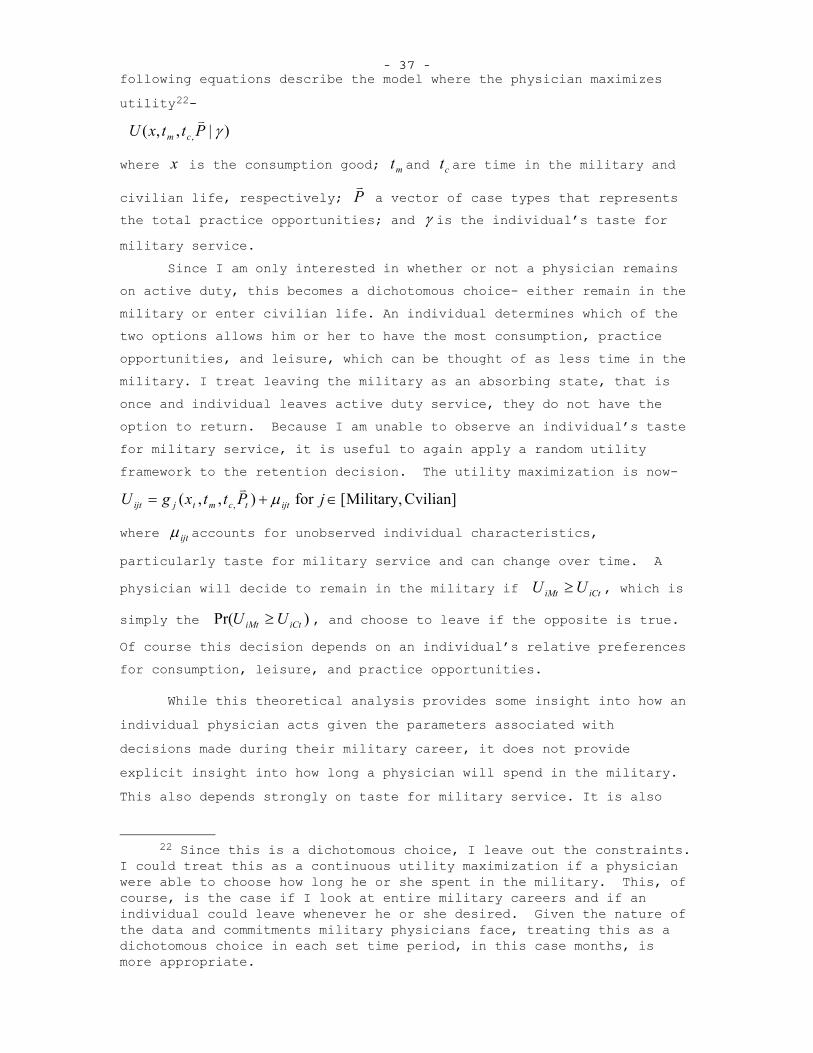
- 37 - following equations describe the model where the physician maximizes
utility22-
)|,,( ,PttxU cm
where x is the consumption good; mt and ct are time in the military and
civilian life, respectively; P a vector of case types that represents the total practice opportunities; and is the individual’s taste for
military service.Since I am only interested in whether or not a physician remains
on active duty, this becomes a dichotomous choice- either remain in the military or enter civilian life. An individual determines which of the two options allows him or her to have the most consumption, practice opportunities, and leisure, which can be thought of as less time in the military. I treat leaving the military as an absorbing state, that is once and individual leaves active duty service, they do not have the option to return. Because I am unable to observe an individual’s taste for military service, it is useful to again apply a random utility framework to the retention decision. The utility maximization is now-
Cvilian] Military,[for ),,( , jPttxgU ijttcmtjijt
where ijt accounts for unobserved individual characteristics,
particularly taste for military service and can change over time. A
physician will decide to remain in the military if iCtiMt UU , which is
simply the )Pr( iCtiMt UU , and choose to leave if the opposite is true.
Of course this decision depends on an individual’s relative preferences for consumption, leisure, and practice opportunities.
While this theoretical analysis provides some insight into how an individual physician acts given the parameters associated with decisions made during their military career, it does not provide explicit insight into how long a physician will spend in the military. This also depends strongly on taste for military service. It is also
22 Since this is a dichotomous choice, I leave out the constraints.
I could treat this as a continuous utility maximization if a physician were able to choose how long he or she spent in the military. This, of course, is the case if I look at entire military careers and if an individual could leave whenever he or she desired. Given the nature of the data and commitments military physicians face, treating this as a dichotomous choice in each set time period, in this case months, is more appropriate.
- 38 -
important to note that military physicians can perform many jobs after completing only a year of post-medical school training, which might also effect a physician’s decision to remain in the military. The distribution of taste for military service can be estimated using dynamic programming, but not with the available data. It is important then to realize that there is an underlying parameter that affects both the accession and retention decisions that cannot be estimated using the available data and the econometric model must account for this.
AN EMPIRICAL MODEL OF PHYSICIAN RETENTION
I model the physician retention decisions using the duration analysis framework, where a “failure” event is leaving active duty service. For this analysis let 1 indicate the decisions to leave the military and 0 the decision to remain. I observe the result of this decision on a monthly basis since I have a person-month panel for military physicians. Using duration analysis, I am able to answer question regarding what affects the amount of time an individual spends as an active duty physician. Duration analysis has an added advantage in that it is able to easily handle right-censored data, in this case active duty physician careers that do not terminate before June 2009(Cameron and Trivedi, 2005, Jenkins, 2005, Lancaster, 1990).
Given the nature of the data I have available, it is appropriate to use a discrete-time duration analysis model. The physician personnel data contains monthly data points, during which a physician can decide to leave the military. It is possible that a physician could leave only a few days after the 15th of the month – when the data is collected – and not appear to leave until the middle of the next month.Furthermore, there are multiple failures in a single time period – commonly referred to as “ties” in the duration analysis literature. Ties are a further indication that a discrete-time approach should be taken, especially when using a proportional hazard model(Jenkins, 2005).23
23 The Cox Proportional Hazard (PH) model is estimated using
partial likelihood estimation, which relies on ordering events. With ties, it is difficult to order each event since one does not know which of the tied failure events happened first. There are methods for
- 39 -
Conceptually, the discrete-time hazard and survival functions are the same as the continuous time. Instead of evaluating these functions as the limit of dt goes to 0, they are evaluated over time intervals and, therefore, failure events must take place in the interval ),[ 1 nn tt .
The general form for the hazard function is24-NnttTtTtth nnnnn ,..,1for )](,|Pr[)|( 111 xx
This hazard is interpreted as the probability of failure in a given time interval, ),[ 1 nn tt , conditional on reaching the given time interval.
Recall that the survival function is the probability of remaining in a certain state past a given time, which implies that an individual must survive through each previous time interval. Since the hazard function is the probability an individual fails in a given time interval conditional on making to that interval, the survival function is just the product of one minus the hazard function for each preceding time
interval-1
1
))(|(1)|(n
bbbn txthtS x . With these definitions, it is now
possible to develop the specific duration model used in the analysis of physician retention. There are two methods for estimating survival and hazard functions- non-parametric univariate analysis and multivariate analysis (usually relying on maximum likelihood estimating techniques) (Jenkins, 2005, Cameron and Trivedi, 2005). Both are useful in examining duration data. The univariate analysis provides a general overview of the survival function and how it differs based on a single variable. The multivariate analysis provides further insight into how specific individual characteristics affect survival time.
The univariate technique I use is the Kaplan-Meier estimator for the survival function. The basic formula for estimator is-
ttn n
nn
njrdrtS
|
)( , where nr is the number of individuals at risk at the
beginning the time interval ),[ 1 nn tt (the sum of spells ending in that interval and those censored in that period) and nd is the number of
individuals that fail in the time interval (Cameron and Trivedi, 2005,
dealing with ties in STATA. Alternatively, a discrete-time PH model can be used – this is the approach I adopt. See Jenkins (2005) for further details.
24 I use Stephen Jenkins’ convention for discrete hazard rates (Jenkins, 2005).
- 40 -
Jenkins, 2005). The Kaplan-Meier estimator provides a good overview of the survival function for key variables and can be estimated for separate groups within the data. In the case of physician retention, I will look at Kaplan-Meier survival curves for different physician specialties and accession sources.
It is necessary to use a multivariate regression technique to determine the effects of individual characteristics; specifically the practice opportunity effect on active duty physician duration. There are two general approaches for multivariate regression models in duration analysis- parametric and proportional hazard models.Parametric models require an explicit functional form for the baseline hazard, while proportional hazard models make it possible to estimate effects of individual characteristics without specifying a functional form for the baseline hazard (Cameron and Trivedi, 2005, Jenkins, 2005). The general form for a proportional hazard model is-
)'exp()()|( 0 xx ttwhere )|( xt is the conditional hazard, )(0 t is the baseline hazard that
varies only with t, and )'exp(x is the scaling factor that depends on
the covariates – hence the name “proportional hazard.” The survival function that corresponds to this hazard function is-
t
o
dsstS )'exp()(exp),|( 0 xx
(Cameron and Trivedi, 2005). Note that this is conditional on in
addition to x as the survival function is estimated after estimating the
parameters from the hazard function. While the above model is for the continuous-time case, it is possible to use this formulation to develop a discrete-time proportional hazard model. Recall that the discrete-time hazard is the probability and individual failure occurs in the time period ),[ 1 nn tt conditional on
surviving up to the beginning of the time period. This can be written
as)|(
)|()|()|(
1
1
xxxx
n
nnn tS
tStSth , where )|( xtS is the survival function.
Following the approach outlined by Cameron and Trivedi, the discrete-time proportional hazard model is-
)))'(exp(lnexp(1)|( 10 nnn thth xx
wheren
n
t
tn dtthh1
)(00 and the corresponding survival function is-
- 41 - 1
110 )))'(exp(lnexp()|(
n
mnnn thtS xx
The maximum likelihood approach is used to estimate the parameters of the hazard function. Maximum likelihood estimation seeks to maximize likelihood of seeing specific events that actually occurs in the data by choosing values for the parameters of interest. In the case of discrete-time duration analysis, the specific event of interest is seeing a failure in a time period and the parameters that are chosen to maximize the associated likelihood are the effects of various covariates, , and the baseline hazards in each time period, nh0 . The
likelihood of seeing a failure in a given time period is the probability that an individual (or multiple individuals) survive to the time period and that the individual (or multiple individuals) fail in the time period-
ii
niin
K
i
n
mninN ththhhL )))'(exp(lnexp(1)))'(exp(lnexp(),...,,( 10
1
1
110001 xx
where covariates for individuals are allowed to vary over time periods and i is an indicator for uncensored observations – equal to one if
ii CT , where iT is the failure time of individual i and iC is the
censoring time – if applicable (Meyer, 1990). It is necessary to have at least one failure in each time interval for this estimation method to work, that is 1i for at least one individual for each interval
),[ 1 nn tt . Note that by specifying a discrete-time proportional hazard
function, the model with the associated likelihood function is the complementary log-log binary choice model whose cumulative density function is )'exp(exp(1 x (Cameron and Trivedi, 2005). For this
reason, I will utilize the complementary log-log model to estimate the effects of practice opportunities on physician retention. A failure occurs when a physician decides that working in the private sector is more desirable than remaining in the military. The random utility model for this decision was presented earlier. I observe this decision along with the various covariates that affect this decision and can model this decision in each time period, with some error which distributed extreme value type 1-
)0*( valueextreme 1 type~
*
itit
it
itititititit
yy
SPODxy
I
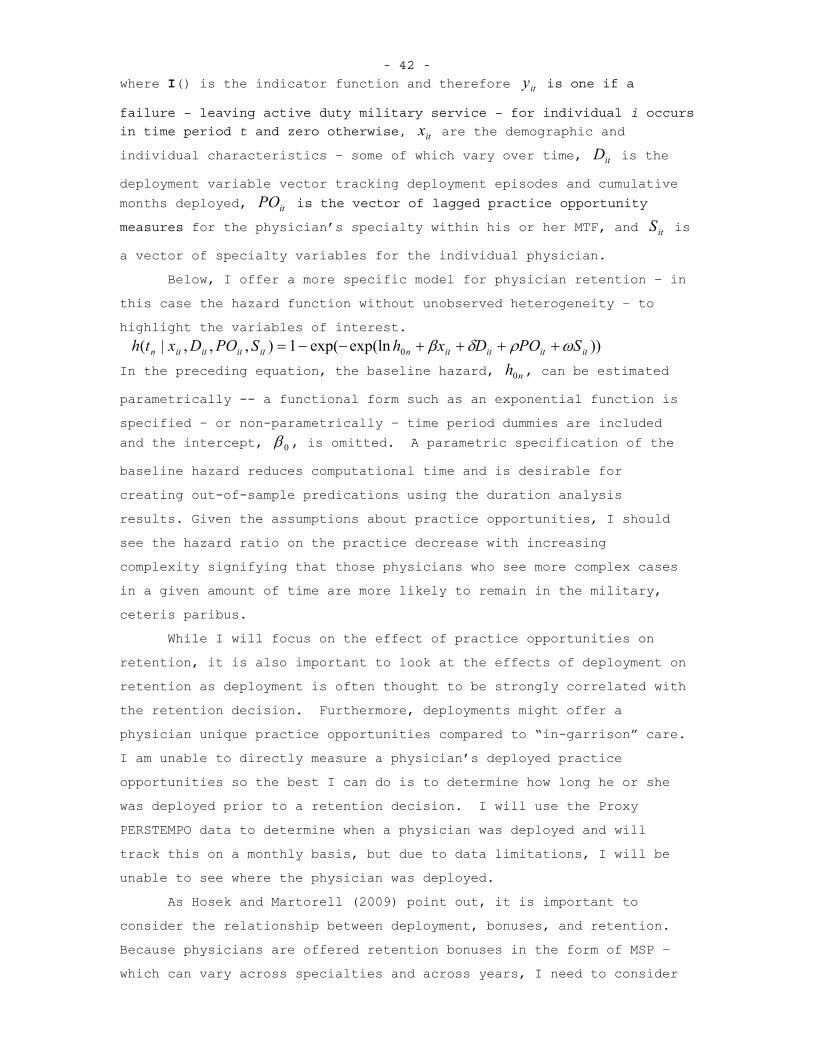
- 42 -
where I() is the indicator function and therefore ity is one if a
failure – leaving active duty military service – for individual i occurs
in time period t and zero otherwise, itx are the demographic and individual characteristics – some of which vary over time, itD is the
deployment variable vector tracking deployment episodes and cumulative months deployed, itPO is the vector of lagged practice opportunity
measures for the physician’s specialty within his or her MTF, and itS is
a vector of specialty variables for the individual physician. Below, I offer a more specific model for physician retention – in
this case the hazard function without unobserved heterogeneity – to highlight the variables of interest.
))exp(lnexp(1),,,|( 0 ititititnititititn SPODxhSPODxthIn the preceding equation, the baseline hazard, nh0 , can be estimated
parametrically -- a functional form such as an exponential function is specified – or non-parametrically – time period dummies are included and the intercept, 0 , is omitted. A parametric specification of the
baseline hazard reduces computational time and is desirable for creating out-of-sample predications using the duration analysis results. Given the assumptions about practice opportunities, I should see the hazard ratio on the practice decrease with increasing complexity signifying that those physicians who see more complex cases in a given amount of time are more likely to remain in the military, ceteris paribus. While I will focus on the effect of practice opportunities on retention, it is also important to look at the effects of deployment on retention as deployment is often thought to be strongly correlated with the retention decision. Furthermore, deployments might offer a physician unique practice opportunities compared to “in-garrison” care.I am unable to directly measure a physician’s deployed practice opportunities so the best I can do is to determine how long he or she was deployed prior to a retention decision. I will use the Proxy PERSTEMPO data to determine when a physician was deployed and will track this on a monthly basis, but due to data limitations, I will be unable to see where the physician was deployed.
As Hosek and Martorell (2009) point out, it is important to consider the relationship between deployment, bonuses, and retention.Because physicians are offered retention bonuses in the form of MSP – which can vary across specialties and across years, I need to consider
- 43 -
the possible biases of the estimated deployment effect, , and the
bonus effect, if I chose to include a such a term. By controlling for specialty, I am able to mitigate some of the potential bonus bias, but, as discussed by Hosek and Martorell, this does not eliminate bias stemming from “supply” shocks. I am also able to mitigate the potential deployment bias by controlling for specialty if deployment is exogenous within a specialty. Yet, even if deployment is exogenous within specialty, the estimated deployment effect could still be biased if there is a positive correlation between bonus levels and deployment and the estimated deployment effect is biased. Hosek and Martorell note that this could cause the deployment effect to be overstated. Of course one way to eliminate this possible scenario would be to add year-specialty-service interactions, as bonuses are set on a yearly basis within each specialty and the services decide whether or not to offer the bonus, but this does not allow for an estimation of the bonus effect on retention.25 For this analysis, I use the year-specialty-service interaction as the effect of MSP on physician retention is not the focus of this dissertation. Furthermore, the data I have only allows me to see the realization accepting MSP and not the offer of MSP, that is I am unable to see who is offered MSP but does not accept it and controlling for accepted MSP amount introduces a bias since accepting MSP is directly correlated with retention.
Using the previously outlined duration analysis approach and controlling for physician characteristics such as specialty, gender, age, and training source, it is possible to estimate the effect of practice opportunities on the decision to remain in the military. The decision on what type of accession program to attend can be thought of as an endogenous regressor and therefore estimated effect of accession source on retention will be biased. This bias is an issue if accession source is correlated with practice opportunities (or any other treatment variables of interest) and if I am interested in the effect
25 Since the effect of MSP on retention is not the focus of this
dissertation, using the year “fixed-effect” approach is likely sufficient. If bonuses are set in a manner that is meant to compensate an individual for the negative effects of deployment, not controlling for bonus level will lead to an overestimate of the deployment effect. Therefore, the bonus effect is not of interest, per se, but bonus levels need to be controlled for in so far as they affect the retention decision and are correlated with deployments.
- 44 -
of accession source on retention. Based on conversations with military physicians, it appears that a physician’s initial assignment location does not depend on accession source. Practice opportunities during the initial service obligation are also independent of accession source since the opportunities are measured at the location level.26 The only bias left is that on the estimate of the effect of accession on retention. Because this is not a principal variable of interest, I am not concerned about this bias and accession source dummies – residency type – are included in my model.
One method for dealing with effects of the unobserved tastes for military service is to use a duration model that accounts for mixing – groups with unobserved characteristics that affect their baseline hazards – commonly referred to as “frailty”. As Jenkins points out, ignoring unobserved heterogeneity leads to over-estimates of negative duration dependence, that is the hazard will appear to drop more quickly over time then it actually is since there are individuals who are prone to leave more quickly based on an unobserved characteristic and have higher baseline hazards than those who remain on active duty longer27. This leads to an under-estimation of the hazard ratios.These issues exist because there is essentially a failure to control for a characteristic that would “group” individuals into different risk pools if a corresponding covariate could be added to the model. It could be the case that observed characteristics such as accession source and physician type explain some of the retention decision, but there is an unobserved characteristic, such as taste for military service, that also affects the decision. If this unobserved characteristic is uncorrelated with the covariates, it is possible to estimate its distribution and determine if unobserved heterogeneity is affecting the modeled hazard ratios.
26 Following assignments are certainly not random as physicians –
like other military officers – are rated on their performance, which factors in to the assignment decisions. Therefore, a military physician has some sense of where he or she will be assigned following his or her initial assignment. It is also the case that subspecialists have a limited number of facilities where they can be assigned, further reducing the uncertainty in follow-on assignments.
27 It could be the case that heterogeneity follows a more “complex” distribution, in which case the negative duration dependence could be reduced if the unobserved factors follow a fairly uniform distribution across individuals.
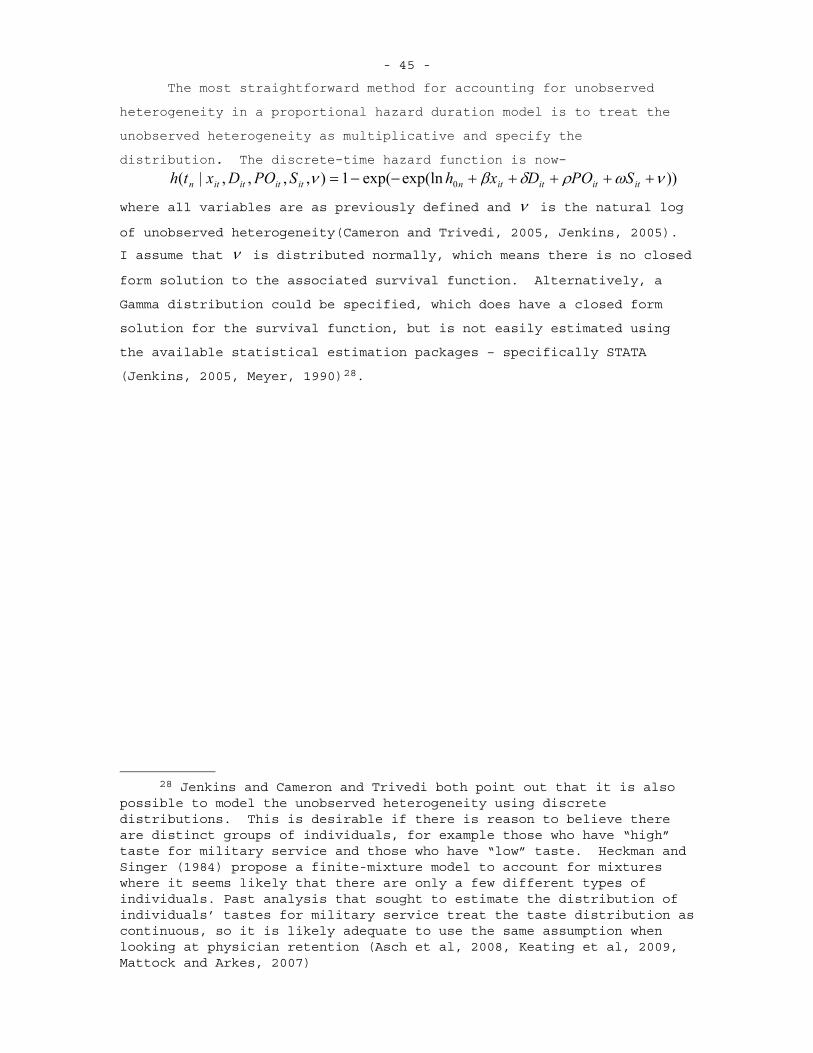
- 45 -
The most straightforward method for accounting for unobserved heterogeneity in a proportional hazard duration model is to treat the unobserved heterogeneity as multiplicative and specify the distribution. The discrete-time hazard function is now-
))exp(lnexp(1),,,,|( 0 ititititnititititn SPODxhSPODxth
where all variables are as previously defined and is the natural log
of unobserved heterogeneity(Cameron and Trivedi, 2005, Jenkins, 2005).
I assume that is distributed normally, which means there is no closed
form solution to the associated survival function. Alternatively, a
Gamma distribution could be specified, which does have a closed form
solution for the survival function, but is not easily estimated using
the available statistical estimation packages – specifically STATA
(Jenkins, 2005, Meyer, 1990)28.
28 Jenkins and Cameron and Trivedi both point out that it is also
possible to model the unobserved heterogeneity using discrete distributions. This is desirable if there is reason to believe there are distinct groups of individuals, for example those who have “high” taste for military service and those who have “low” taste. Heckman and Singer (1984) propose a finite-mixture model to account for mixtures where it seems likely that there are only a few different types of individuals. Past analysis that sought to estimate the distribution of individuals’ tastes for military service treat the taste distribution as continuous, so it is likely adequate to use the same assumption when looking at physician retention (Asch et al, 2008, Keating et al, 2009, Mattock and Arkes, 2007)
- 46 - 5. EMPIRCAL RESULTS OF THE PHYSICIAN RETENTION MODEL
In this chapter, I present the results from the physician retention
model. First, I provide summary statistics of the various demographic
covariates used in the model. Summary statistics for the practice
opportunity variables – the principal variable of interest – are
presented by specialty and by service. To illustrate the difference in
active duty service durations for different physicians and subgroups, I
present Kaplan-Meier survival curves for specialties within the three
services grouped by military and civilian residency. Finally, results
of the discrete-time duration model for those non-USU physicians that
entered active duty service and became fully qualified between June 1996
and June 2004 are presented.29
DESCRIPTIVE STATISTICS
Demographics, Deployment, Initial Assignment, and Specialty
The personnel data from DMDC contains various demographic
variables that further characterize the individual physicians in the
three military services. Additionally, there are variables on
deployment episodes. Physician specialty codes are also included in the
data and important to the questions of practice opportunity effects on
physician retention. One major distinguishing factor amongst military
physicians is the type of residency they attend – that is whether they
attend a civilian or military residency. Since I made note of this
decision earlier, I present the demographic data broken out by service
and by residency type in the following table with standard errors in
parentheses.
29 USU-trained physicians almost all enter military residencies and
are required to serve on active duty for 7 years prior to being able to leave. Most have at least 10 years on active duty before being able to leave – that is a physician who attended USU is halfway to receiving his or her pension before he or she can leave. For this reason and others, USU physicians typically remain on active duty well past the initial service obligation. There are very few physicians in my data that attend USU and leave active duty, making duration analysis less useful for this population. Additionally, only about 10 – 12% of physician accessions a year are USU graduates.
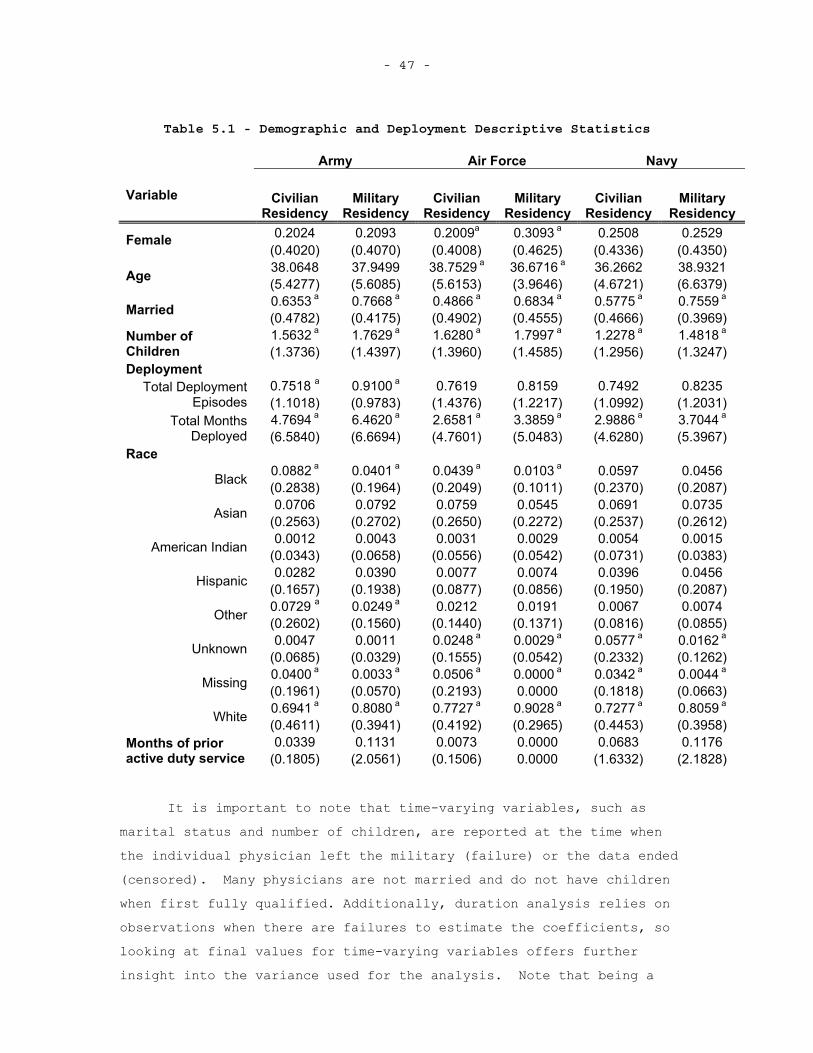
- 47 -
Table 5.1 - Demographic and Deployment Descriptive Statistics
Army Air Force Navy
Variable CivilianResidency
Military Residency
CivilianResidency
Military Residency
CivilianResidency
Military Residency
0.2024 0.2093 0.2009a 0.3093 a 0.2508 0.2529 Female(0.4020) (0.4070) (0.4008) (0.4625) (0.4336) (0.4350) 38.0648 37.9499 38.7529 a 36.6716 a 36.2662 38.9321 Age (5.4277) (5.6085) (5.6153) (3.9646) (4.6721) (6.6379) 0.6353 a 0.7668 a 0.4866 a 0.6834 a 0.5775 a 0.7559 a
Married (0.4782) (0.4175) (0.4902) (0.4555) (0.4666) (0.3969) 1.5632 a 1.7629 a 1.6280 a 1.7997 a 1.2278 a 1.4818 aNumber of
Children (1.3736) (1.4397) (1.3960) (1.4585) (1.2956) (1.3247) Deployment
0.7518 a 0.9100 a 0.7619 0.8159 0.7492 0.8235 Total Deployment Episodes (1.1018) (0.9783) (1.4376) (1.2217) (1.0992) (1.2031)
4.7694 a 6.4620 a 2.6581 a 3.3859 a 2.9886 a 3.7044 aTotal Months Deployed (6.5840) (6.6694) (4.7601) (5.0483) (4.6280) (5.3967)
Race 0.0882 a 0.0401 a 0.0439 a 0.0103 a 0.0597 0.0456 Black (0.2838) (0.1964) (0.2049) (0.1011) (0.2370) (0.2087) 0.0706 0.0792 0.0759 0.0545 0.0691 0.0735 Asian (0.2563) (0.2702) (0.2650) (0.2272) (0.2537) (0.2612) 0.0012 0.0043 0.0031 0.0029 0.0054 0.0015 American Indian (0.0343) (0.0658) (0.0556) (0.0542) (0.0731) (0.0383) 0.0282 0.0390 0.0077 0.0074 0.0396 0.0456 Hispanic (0.1657) (0.1938) (0.0877) (0.0856) (0.1950) (0.2087)
0.0729 a 0.0249 a 0.0212 0.0191 0.0067 0.0074 Other (0.2602) (0.1560) (0.1440) (0.1371) (0.0816) (0.0855) 0.0047 0.0011 0.0248 a 0.0029 a 0.0577 a 0.0162 a
Unknown (0.0685) (0.0329) (0.1555) (0.0542) (0.2332) (0.1262) 0.0400 a 0.0033 a 0.0506 a 0.0000 a 0.0342 a 0.0044 a
Missing (0.1961) (0.0570) (0.2193) 0.0000 (0.1818) (0.0663) 0.6941 a 0.8080 a 0.7727 a 0.9028 a 0.7277 a 0.8059 a
White (0.4611) (0.3941) (0.4192) (0.2965) (0.4453) (0.3958) 0.0339 0.1131 0.0073 0.0000 0.0683 0.1176 Months of prior
active duty service (0.1805) (2.0561) (0.1506) 0.0000 (1.6332) (2.1828)
It is important to note that time-varying variables, such as marital status and number of children, are reported at the time when the individual physician left the military (failure) or the data ended (censored). Many physicians are not married and do not have children when first fully qualified. Additionally, duration analysis relies on observations when there are failures to estimate the coefficients, so looking at final values for time-varying variables offers further insight into the variance used for the analysis. Note that being a
- 48 -
military resident does not expose one to more deployment or other military-specific characteristics since all data are taken from the point after a physician is fully qualified.
There are a few differences within each service between those who pursued a military versus a civilian residency. Those who pursue a military residency are slightly younger when they separate from the Air Force and not statistically significant differences in the Army and Navy. Those who attend a military residency are also more likely to be married and have more children. Additionally, those who pursue a military residency tend to have slightly more months of deployment across all three services and those in the Army experience more deployment episodes over their observable active duty careers.30 While it is true that those who attend a military residency spend more time in the military and would therefore have more opportunities to be deployed as a civilian-trained physician, it is generally the case that physicians are not deployed while in training program. Another interesting difference is the racial breakdown – there are higher percentages of white, non-Hispanic individuals who attend military residencies in all three services. Overall, the individuals who attend civilian and military residencies seem to be fairly comparable based on observables, though it is still important to control for residency type in the duration analysis model since there are some differences between the two groups within each service.
Beyond the demographics, it is also important to look at differences between specialties for those who attend civilian and military residencies. It could be that certain specialties have limited slots for civilian or military residencies and therefore the specialty choice determines what type of residency a physician is likely to pursue. The percentage of each type of physician specialty within a service and residency type is reported in the Table 5.2 below.
30 The nature of the data makes it possible to observe a civilian
resident physician longer than a military resident of the same specialty, so theoretically civilian physicians could have more exposure to deployment risk, though this appears to not be the case. Since the deployment data is only post-9/11 data, the number of military and civilian fully qualified physicians is in a steady state. To further mitigate this issue of deployment risk exposure, and other risk exposure, years of service post-residency indicators are included in the duration analysis model.
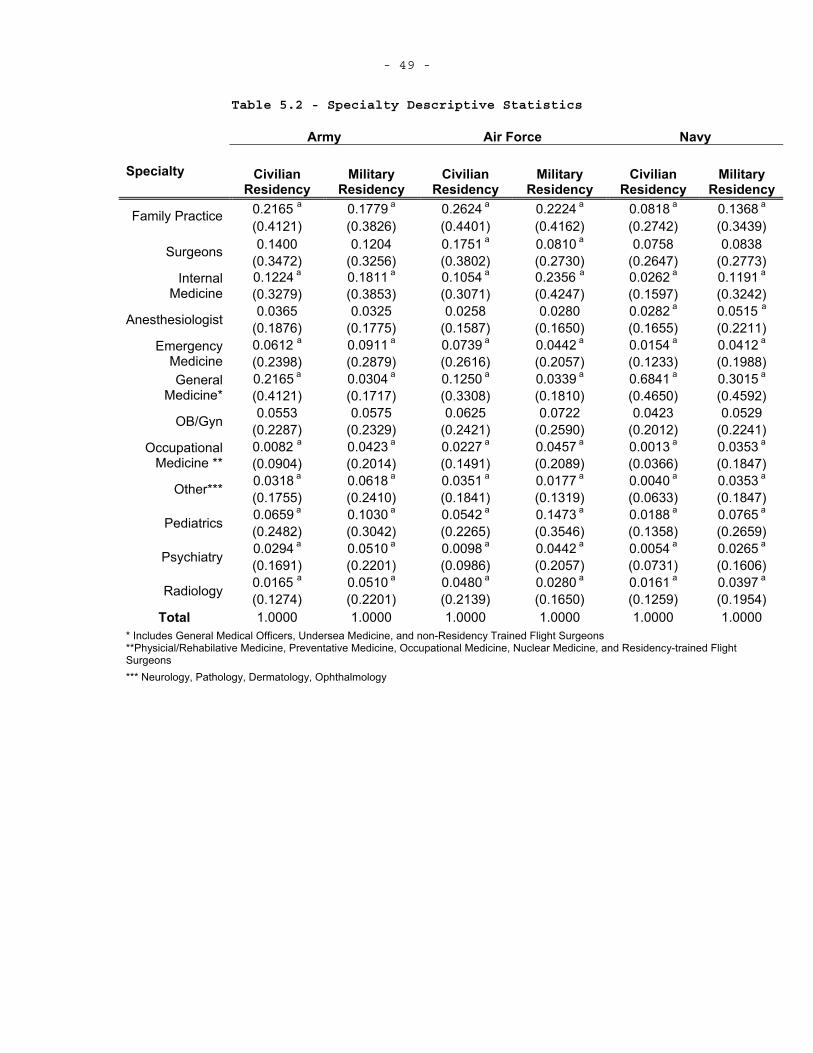
- 49 -
Table 5.2 - Specialty Descriptive Statistics
Army Air Force Navy
Specialty CivilianResidency
Military Residency
CivilianResidency
Military Residency
CivilianResidency
Military Residency
0.2165 a 0.1779 a 0.2624 a 0.2224 a 0.0818 a 0.1368 aFamily Practice
(0.4121) (0.3826) (0.4401) (0.4162) (0.2742) (0.3439) 0.1400 0.1204 0.1751 a 0.0810 a 0.0758 0.0838 Surgeons
(0.3472) (0.3256) (0.3802) (0.2730) (0.2647) (0.2773) 0.1224 a 0.1811 a 0.1054 a 0.2356 a 0.0262 a 0.1191 aInternal
Medicine (0.3279) (0.3853) (0.3071) (0.4247) (0.1597) (0.3242) 0.0365 0.0325 0.0258 0.0280 0.0282 a 0.0515 aAnesthesiologist (0.1876) (0.1775) (0.1587) (0.1650) (0.1655) (0.2211)
0.0612 a 0.0911 a 0.0739 a 0.0442 a 0.0154 a 0.0412 aEmergency Medicine (0.2398) (0.2879) (0.2616) (0.2057) (0.1233) (0.1988)
0.2165 a 0.0304 a 0.1250 a 0.0339 a 0.6841 a 0.3015 aGeneral Medicine* (0.4121) (0.1717) (0.3308) (0.1810) (0.4650) (0.4592)
0.0553 0.0575 0.0625 0.0722 0.0423 0.0529 OB/Gyn (0.2287) (0.2329) (0.2421) (0.2590) (0.2012) (0.2241) 0.0082 a 0.0423 a 0.0227 a 0.0457 a 0.0013 a 0.0353 aOccupational
Medicine ** (0.0904) (0.2014) (0.1491) (0.2089) (0.0366) (0.1847) 0.0318 a 0.0618 a 0.0351 a 0.0177 a 0.0040 a 0.0353 a
Other*** (0.1755) (0.2410) (0.1841) (0.1319) (0.0633) (0.1847) 0.0659 a 0.1030 a 0.0542 a 0.1473 a 0.0188 a 0.0765 a
Pediatrics (0.2482) (0.3042) (0.2265) (0.3546) (0.1358) (0.2659) 0.0294 a 0.0510 a 0.0098 a 0.0442 a 0.0054 a 0.0265 a
Psychiatry (0.1691) (0.2201) (0.0986) (0.2057) (0.0731) (0.1606) 0.0165 a 0.0510 a 0.0480 a 0.0280 a 0.0161 a 0.0397 a
Radiology (0.1274) (0.2201) (0.2139) (0.1650) (0.1259) (0.1954) Total 1.0000 1.0000 1.0000 1.0000 1.0000 1.0000
* Includes General Medical Officers, Undersea Medicine, and non-Residency Trained Flight Surgeons **Physicial/Rehabilative Medicine, Preventative Medicine, Occupational Medicine, Nuclear Medicine, and Residency-trained FlightSurgeons*** Neurology, Pathology, Dermatology, Ophthalmology
- 50 -
The above specialties are those the physician held when he or she was first fully qualified – having completed the necessary training for the specialty he or she held. Similar to the demographic variables, there are statistically significant differences between specialty percentages for those who attend civilian and military residencies.Only OB/Gyns have no statistically significant differences across residency types within each service. For all three services, more Internists come from military residencies than civilian residencies. This trend also holds for psychiatry, occupational medicine, and pediatrics. There are several other specialties within the services where the percentages from military and civilian residencies differ and this is denoted in Table 5.2.
Initial Assignment
Since I use MTF assignment as a proxy for practice opportunities, it is important to look at initial assignments by specialty and residency type. It could be the case that attending a military or civilian residency could be directly correlated to an individual physician’s initial assignment. If this is indeed the case, the medical facility effect is biased as it is affected by a selection mechanism if I do not control for residency type. Below are tables for each service illustrating the initial assignments for each specialty group by residency type.
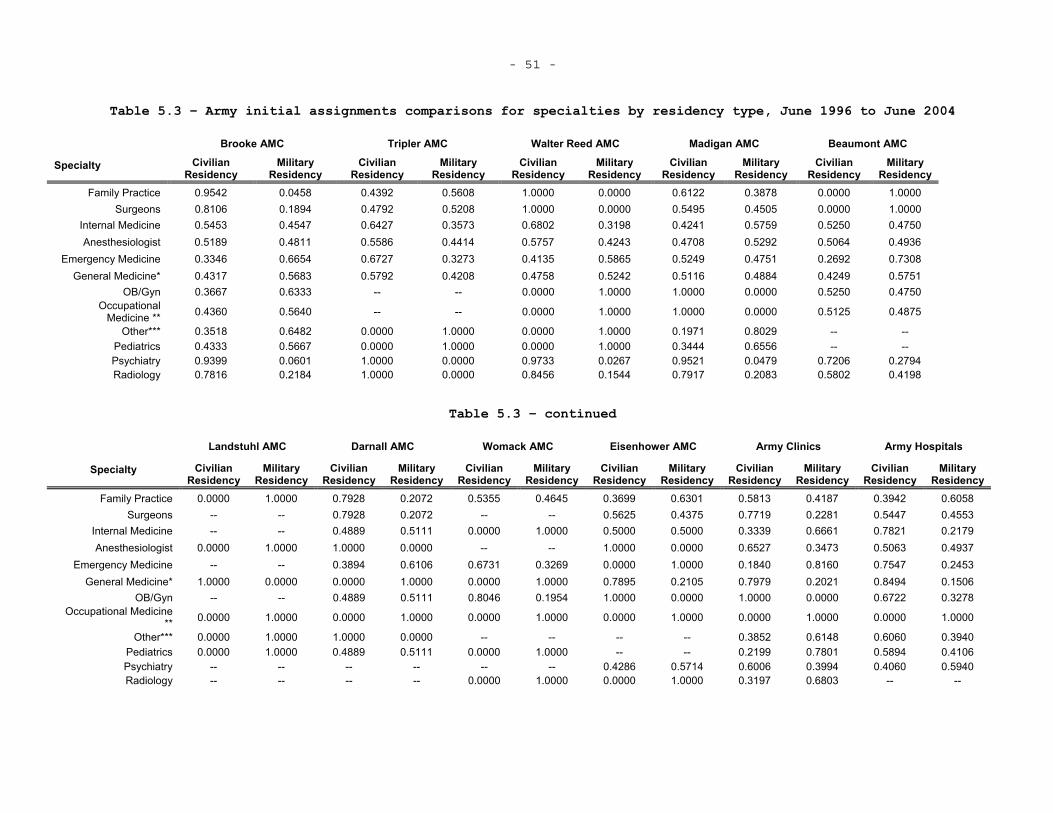
- 51 -
Table 5.3 – Army initial assignments comparisons for specialties by residency type, June 1996 to June 2004
Brooke AMC Tripler AMC Walter Reed AMC Madigan AMC Beaumont AMC
Specialty Civilian Residency
Military Residency
Civilian Residency
Military Residency
Civilian Residency
Military Residency
Civilian Residency
Military Residency
Civilian Residency
Military Residency
Family Practice 0.9542 0.0458 0.4392 0.5608 1.0000 0.0000 0.6122 0.3878 0.0000 1.0000 Surgeons 0.8106 0.1894 0.4792 0.5208 1.0000 0.0000 0.5495 0.4505 0.0000 1.0000
Internal Medicine 0.5453 0.4547 0.6427 0.3573 0.6802 0.3198 0.4241 0.5759 0.5250 0.4750 Anesthesiologist 0.5189 0.4811 0.5586 0.4414 0.5757 0.4243 0.4708 0.5292 0.5064 0.4936
Emergency Medicine 0.3346 0.6654 0.6727 0.3273 0.4135 0.5865 0.5249 0.4751 0.2692 0.7308 General Medicine* 0.4317 0.5683 0.5792 0.4208 0.4758 0.5242 0.5116 0.4884 0.4249 0.5751
OB/Gyn 0.3667 0.6333 -- -- 0.0000 1.0000 1.0000 0.0000 0.5250 0.4750 Occupational
Medicine ** 0.4360 0.5640 -- -- 0.0000 1.0000 1.0000 0.0000 0.5125 0.4875
Other*** 0.3518 0.6482 0.0000 1.0000 0.0000 1.0000 0.1971 0.8029 -- --Pediatrics 0.4333 0.5667 0.0000 1.0000 0.0000 1.0000 0.3444 0.6556 -- --Psychiatry 0.9399 0.0601 1.0000 0.0000 0.9733 0.0267 0.9521 0.0479 0.7206 0.2794 Radiology 0.7816 0.2184 1.0000 0.0000 0.8456 0.1544 0.7917 0.2083 0.5802 0.4198
Table 5.3 – continued
Landstuhl AMC Darnall AMC Womack AMC Eisenhower AMC Army Clinics Army Hospitals
Specialty Civilian Residency
Military Residency
Civilian Residency
Military Residency
Civilian Residency
Military Residency
Civilian Residency
Military Residency
Civilian Residency
Military Residency
Civilian Residency
Military Residency
Family Practice 0.0000 1.0000 0.7928 0.2072 0.5355 0.4645 0.3699 0.6301 0.5813 0.4187 0.3942 0.6058 Surgeons -- -- 0.7928 0.2072 -- -- 0.5625 0.4375 0.7719 0.2281 0.5447 0.4553
Internal Medicine -- -- 0.4889 0.5111 0.0000 1.0000 0.5000 0.5000 0.3339 0.6661 0.7821 0.2179 Anesthesiologist 0.0000 1.0000 1.0000 0.0000 -- -- 1.0000 0.0000 0.6527 0.3473 0.5063 0.4937
Emergency Medicine -- -- 0.3894 0.6106 0.6731 0.3269 0.0000 1.0000 0.1840 0.8160 0.7547 0.2453 General Medicine* 1.0000 0.0000 0.0000 1.0000 0.0000 1.0000 0.7895 0.2105 0.7979 0.2021 0.8494 0.1506
OB/Gyn -- -- 0.4889 0.5111 0.8046 0.1954 1.0000 0.0000 1.0000 0.0000 0.6722 0.3278 Occupational Medicine
** 0.0000 1.0000 0.0000 1.0000 0.0000 1.0000 0.0000 1.0000 0.0000 1.0000 0.0000 1.0000
Other*** 0.0000 1.0000 1.0000 0.0000 -- -- -- -- 0.3852 0.6148 0.6060 0.3940 Pediatrics 0.0000 1.0000 0.4889 0.5111 0.0000 1.0000 -- -- 0.2199 0.7801 0.5894 0.4106 Psychiatry -- -- -- -- -- -- 0.4286 0.5714 0.6006 0.3994 0.4060 0.5940 Radiology -- -- -- -- 0.0000 1.0000 0.0000 1.0000 0.3197 0.6803 -- --
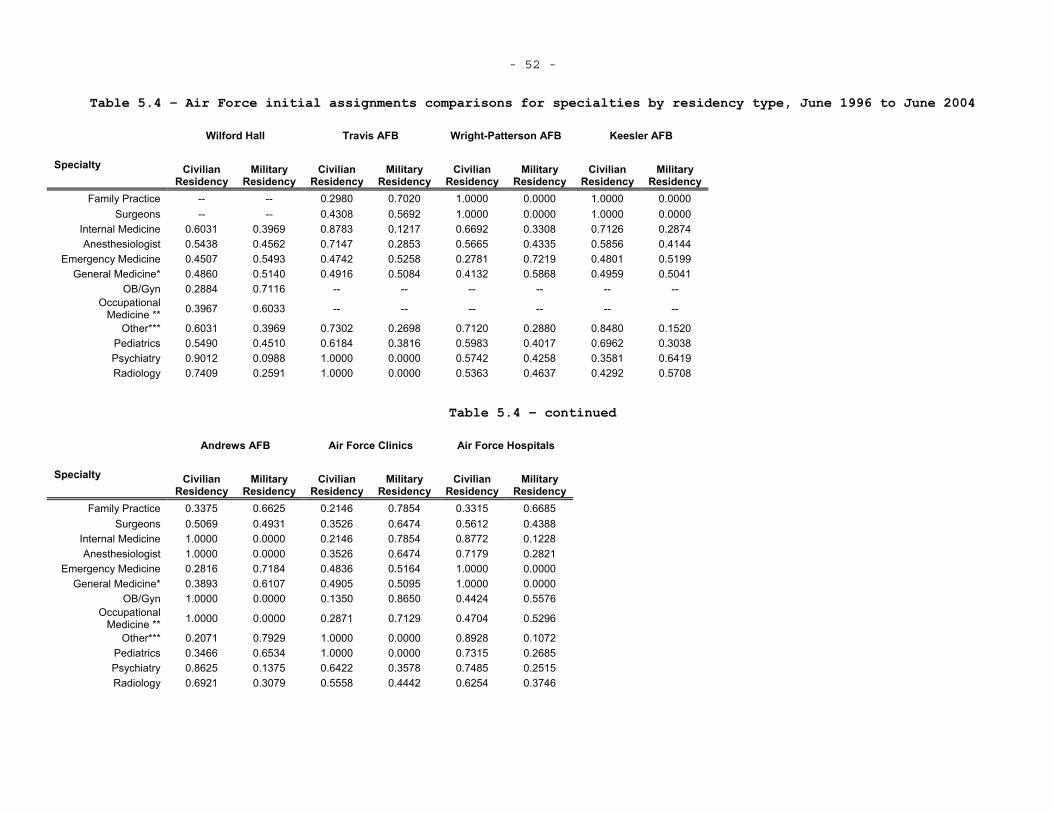
- 52 -
Table 5.4 – Air Force initial assignments comparisons for specialties by residency type, June 1996 to June 2004
Wilford Hall Travis AFB Wright-Patterson AFB Keesler AFB
Specialty Civilian Residency
Military Residency
Civilian Residency
Military Residency
Civilian Residency
Military Residency
Civilian Residency
Military Residency
Family Practice -- -- 0.2980 0.7020 1.0000 0.0000 1.0000 0.0000 Surgeons -- -- 0.4308 0.5692 1.0000 0.0000 1.0000 0.0000
Internal Medicine 0.6031 0.3969 0.8783 0.1217 0.6692 0.3308 0.7126 0.2874 Anesthesiologist 0.5438 0.4562 0.7147 0.2853 0.5665 0.4335 0.5856 0.4144
Emergency Medicine 0.4507 0.5493 0.4742 0.5258 0.2781 0.7219 0.4801 0.5199 General Medicine* 0.4860 0.5140 0.4916 0.5084 0.4132 0.5868 0.4959 0.5041
OB/Gyn 0.2884 0.7116 -- -- -- -- -- -- Occupational
Medicine ** 0.3967 0.6033 -- -- -- -- -- --
Other*** 0.6031 0.3969 0.7302 0.2698 0.7120 0.2880 0.8480 0.1520 Pediatrics 0.5490 0.4510 0.6184 0.3816 0.5983 0.4017 0.6962 0.3038 Psychiatry 0.9012 0.0988 1.0000 0.0000 0.5742 0.4258 0.3581 0.6419 Radiology 0.7409 0.2591 1.0000 0.0000 0.5363 0.4637 0.4292 0.5708
Table 5.4 – continued
Andrews AFB Air Force Clinics Air Force Hospitals
Specialty Civilian Residency
Military Residency
Civilian Residency
Military Residency
Civilian Residency
Military Residency
Family Practice 0.3375 0.6625 0.2146 0.7854 0.3315 0.6685 Surgeons 0.5069 0.4931 0.3526 0.6474 0.5612 0.4388
Internal Medicine 1.0000 0.0000 0.2146 0.7854 0.8772 0.1228 Anesthesiologist 1.0000 0.0000 0.3526 0.6474 0.7179 0.2821
Emergency Medicine 0.2816 0.7184 0.4836 0.5164 1.0000 0.0000 General Medicine* 0.3893 0.6107 0.4905 0.5095 1.0000 0.0000
OB/Gyn 1.0000 0.0000 0.1350 0.8650 0.4424 0.5576 Occupational
Medicine ** 1.0000 0.0000 0.2871 0.7129 0.4704 0.5296
Other*** 0.2071 0.7929 1.0000 0.0000 0.8928 0.1072 Pediatrics 0.3466 0.6534 1.0000 0.0000 0.7315 0.2685 Psychiatry 0.8625 0.1375 0.6422 0.3578 0.7485 0.2515 Radiology 0.6921 0.3079 0.5558 0.4442 0.6254 0.3746
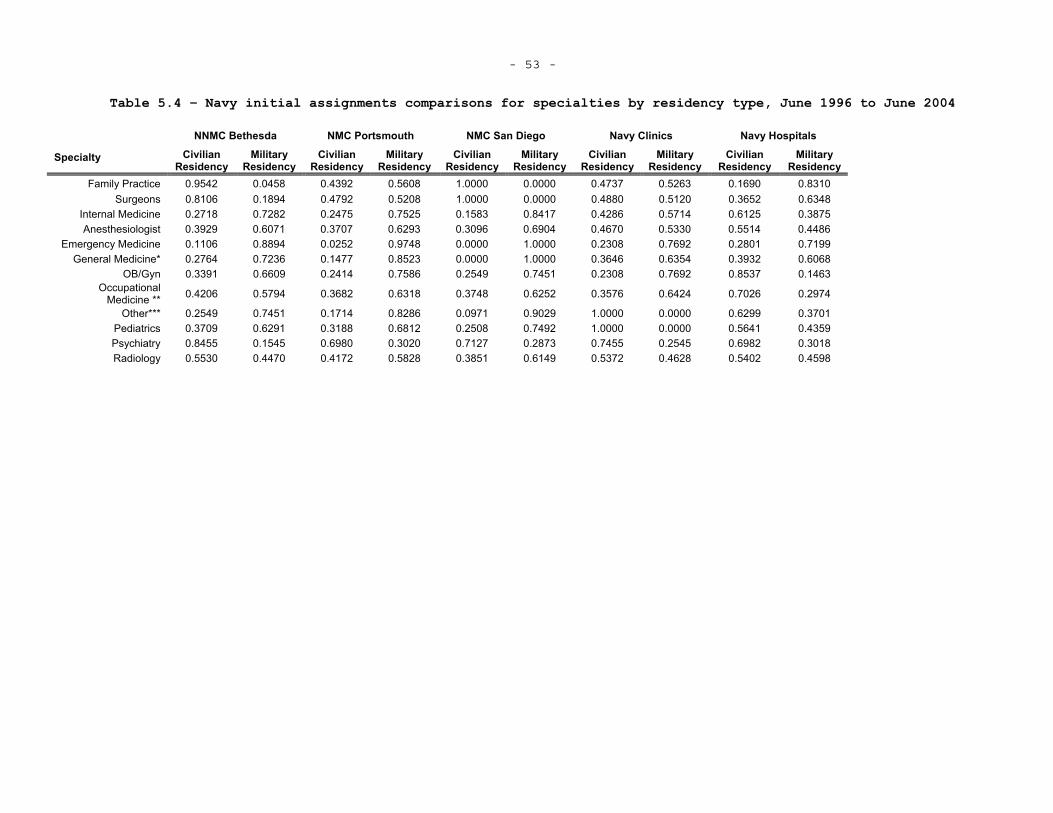
- 53 -
Table 5.4 – Navy initial assignments comparisons for specialties by residency type, June 1996 to June 2004
NNMC Bethesda NMC Portsmouth NMC San Diego Navy Clinics Navy Hospitals
Specialty Civilian Residency
Military Residency
Civilian Residency
Military Residency
Civilian Residency
Military Residency
Civilian Residency
Military Residency
Civilian Residency
Military Residency
Family Practice 0.9542 0.0458 0.4392 0.5608 1.0000 0.0000 0.4737 0.5263 0.1690 0.8310 Surgeons 0.8106 0.1894 0.4792 0.5208 1.0000 0.0000 0.4880 0.5120 0.3652 0.6348
Internal Medicine 0.2718 0.7282 0.2475 0.7525 0.1583 0.8417 0.4286 0.5714 0.6125 0.3875 Anesthesiologist 0.3929 0.6071 0.3707 0.6293 0.3096 0.6904 0.4670 0.5330 0.5514 0.4486
Emergency Medicine 0.1106 0.8894 0.0252 0.9748 0.0000 1.0000 0.2308 0.7692 0.2801 0.7199 General Medicine* 0.2764 0.7236 0.1477 0.8523 0.0000 1.0000 0.3646 0.6354 0.3932 0.6068
OB/Gyn 0.3391 0.6609 0.2414 0.7586 0.2549 0.7451 0.2308 0.7692 0.8537 0.1463 Occupational
Medicine ** 0.4206 0.5794 0.3682 0.6318 0.3748 0.6252 0.3576 0.6424 0.7026 0.2974
Other*** 0.2549 0.7451 0.1714 0.8286 0.0971 0.9029 1.0000 0.0000 0.6299 0.3701 Pediatrics 0.3709 0.6291 0.3188 0.6812 0.2508 0.7492 1.0000 0.0000 0.5641 0.4359 Psychiatry 0.8455 0.1545 0.6980 0.3020 0.7127 0.2873 0.7455 0.2545 0.6982 0.3018 Radiology 0.5530 0.4470 0.4172 0.5828 0.3851 0.6149 0.5372 0.4628 0.5402 0.4598
- 54 -
It is important to recall that the fraction of civilian residents by
specialty changes and that some of the above facilities only have certain
specialties (see Tables 2.2 and 3.1-3.3). For this reason, it is necessary
to look at the percentage of military and civilian residents initially
assigned to facilities by specialty. It is the case that some of the
medical centers have a higher percentage of civilian residents initially
assigned to them within a specialty, but there appears to be little pattern
across medical centers. I also run a logit that looks at the effect of
residency type on being assigned to a medical center, and find little
evidence that such a correlation exists.
Specialty Transition
The nature of military physician accessions – where physicians can
come in and perform many jobs with only one year of post-medical school
training – allows many physicians to begin his or her career in general
medicine and pursue additional training to enter a specialty during his or
her time on active duty careers31. Not only do these transitions change a
physician’s service commitment – additional training increases active duty
service commitments – they also change his or her practice opportunities
since the type of patients and procedures he or she changes with specialty.
Note that the physician is still unable to decide his or her practice
opportunity within a given specialty, but can change his or her potential
practice opportunity set by changing specialty. To explore how much this
occurs, I present tables similar to those in Keating et al (2009) that show
physician specialty transition from the initial specialty when first on
active duty to the final specialty recorded in the data. The DMDC data are
cleaned to reduce miscoding and certain physician specialties are grouped
31 It is also the case, especially with the Navy, that the DMDC
personnel data does not identify the physician type or appears to have a “placeholder” physician code early on in a physician’s career. This is likely when he or she is still completing residency and there are codes that indicate whether or not an individual is currently attending a military residency program.

- 55 -
in order to present the data in a more manageable way. Presented are
tables for the total dataset and then by service32.
32 Tables for residency attended by service are presented in Appendix
C.
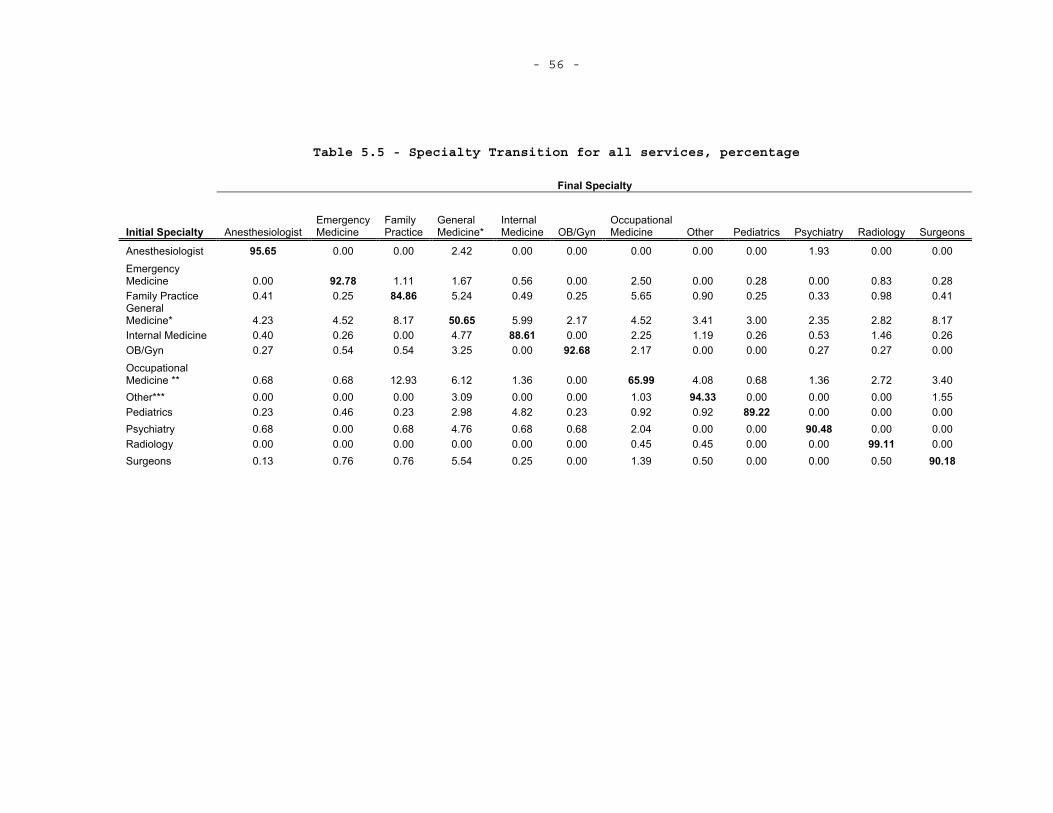
- 56 -
Table 5.5 - Specialty Transition for all services, percentage
Final Specialty
Initial Specialty Anesthesiologist Emergency Medicine
Family Practice
General Medicine*
InternalMedicine OB/Gyn
OccupationalMedicine Other Pediatrics Psychiatry Radiology Surgeons
Anesthesiologist 95.65 0.00 0.00 2.42 0.00 0.00 0.00 0.00 0.00 1.93 0.00 0.00 Emergency Medicine 0.00 92.78 1.11 1.67 0.56 0.00 2.50 0.00 0.28 0.00 0.83 0.28 Family Practice 0.41 0.25 84.86 5.24 0.49 0.25 5.65 0.90 0.25 0.33 0.98 0.41 General Medicine* 4.23 4.52 8.17 50.65 5.99 2.17 4.52 3.41 3.00 2.35 2.82 8.17 Internal Medicine 0.40 0.26 0.00 4.77 88.61 0.00 2.25 1.19 0.26 0.53 1.46 0.26 OB/Gyn 0.27 0.54 0.54 3.25 0.00 92.68 2.17 0.00 0.00 0.27 0.27 0.00 OccupationalMedicine ** 0.68 0.68 12.93 6.12 1.36 0.00 65.99 4.08 0.68 1.36 2.72 3.40 Other*** 0.00 0.00 0.00 3.09 0.00 0.00 1.03 94.33 0.00 0.00 0.00 1.55 Pediatrics 0.23 0.46 0.23 2.98 4.82 0.23 0.92 0.92 89.22 0.00 0.00 0.00 Psychiatry 0.68 0.00 0.68 4.76 0.68 0.68 2.04 0.00 0.00 90.48 0.00 0.00 Radiology 0.00 0.00 0.00 0.00 0.00 0.00 0.45 0.45 0.00 0.00 99.11 0.00Surgeons 0.13 0.76 0.76 5.54 0.25 0.00 1.39 0.50 0.00 0.00 0.50 90.18
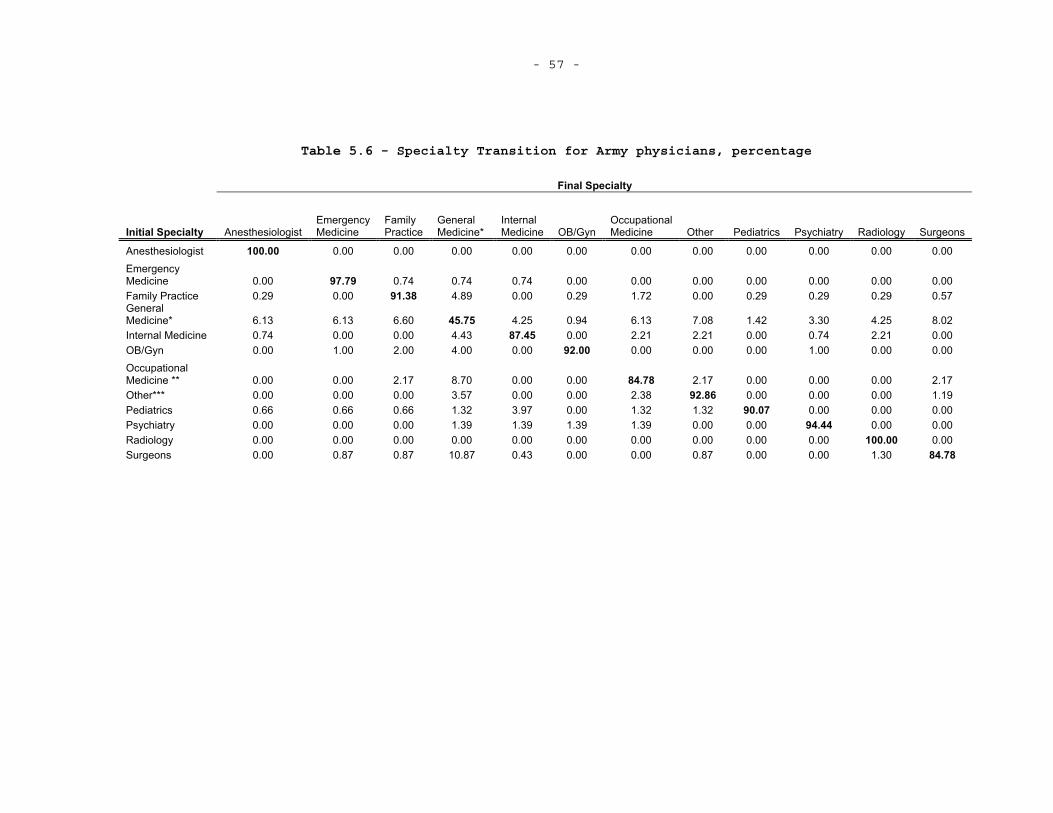
- 57 -
Table 5.6 - Specialty Transition for Army physicians, percentage
Final Specialty
Initial Specialty Anesthesiologist Emergency Medicine
Family Practice
General Medicine*
InternalMedicine OB/Gyn
OccupationalMedicine Other Pediatrics Psychiatry Radiology Surgeons
Anesthesiologist 100.00 0.00 0.00 0.00 0.00 0.00 0.00 0.00 0.00 0.00 0.00 0.00 Emergency Medicine 0.00 97.79 0.74 0.74 0.74 0.00 0.00 0.00 0.00 0.00 0.00 0.00 Family Practice 0.29 0.00 91.38 4.89 0.00 0.29 1.72 0.00 0.29 0.29 0.29 0.57 General Medicine* 6.13 6.13 6.60 45.75 4.25 0.94 6.13 7.08 1.42 3.30 4.25 8.02 Internal Medicine 0.74 0.00 0.00 4.43 87.45 0.00 2.21 2.21 0.00 0.74 2.21 0.00 OB/Gyn 0.00 1.00 2.00 4.00 0.00 92.00 0.00 0.00 0.00 1.00 0.00 0.00 OccupationalMedicine ** 0.00 0.00 2.17 8.70 0.00 0.00 84.78 2.17 0.00 0.00 0.00 2.17 Other*** 0.00 0.00 0.00 3.57 0.00 0.00 2.38 92.86 0.00 0.00 0.00 1.19 Pediatrics 0.66 0.66 0.66 1.32 3.97 0.00 1.32 1.32 90.07 0.00 0.00 0.00 Psychiatry 0.00 0.00 0.00 1.39 1.39 1.39 1.39 0.00 0.00 94.44 0.00 0.00 Radiology 0.00 0.00 0.00 0.00 0.00 0.00 0.00 0.00 0.00 0.00 100.00 0.00Surgeons 0.00 0.87 0.87 10.87 0.43 0.00 0.00 0.87 0.00 0.00 1.30 84.78
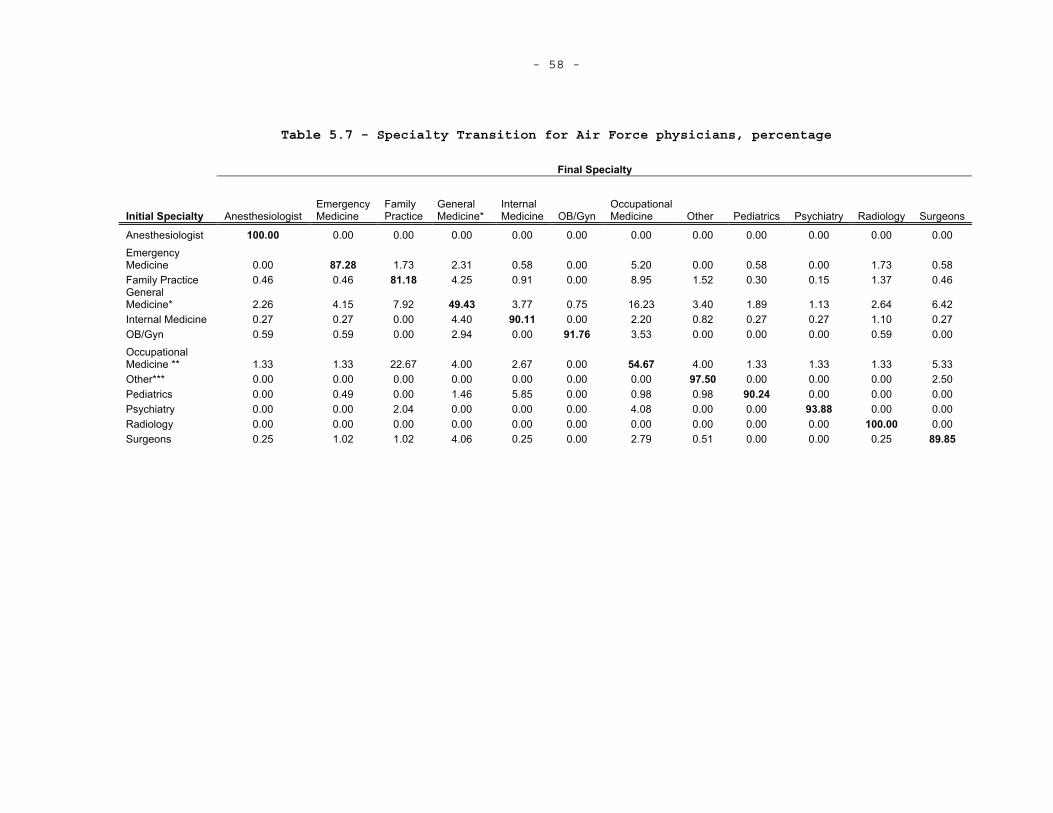
- 58 -
Table 5.7 - Specialty Transition for Air Force physicians, percentage
Final Specialty
Initial Specialty Anesthesiologist Emergency Medicine
Family Practice
General Medicine*
InternalMedicine OB/Gyn
OccupationalMedicine Other Pediatrics Psychiatry Radiology Surgeons
Anesthesiologist 100.00 0.00 0.00 0.00 0.00 0.00 0.00 0.00 0.00 0.00 0.00 0.00 Emergency Medicine 0.00 87.28 1.73 2.31 0.58 0.00 5.20 0.00 0.58 0.00 1.73 0.58 Family Practice 0.46 0.46 81.18 4.25 0.91 0.00 8.95 1.52 0.30 0.15 1.37 0.46 General Medicine* 2.26 4.15 7.92 49.43 3.77 0.75 16.23 3.40 1.89 1.13 2.64 6.42 Internal Medicine 0.27 0.27 0.00 4.40 90.11 0.00 2.20 0.82 0.27 0.27 1.10 0.27 OB/Gyn 0.59 0.59 0.00 2.94 0.00 91.76 3.53 0.00 0.00 0.00 0.59 0.00 OccupationalMedicine ** 1.33 1.33 22.67 4.00 2.67 0.00 54.67 4.00 1.33 1.33 1.33 5.33 Other*** 0.00 0.00 0.00 0.00 0.00 0.00 0.00 97.50 0.00 0.00 0.00 2.50 Pediatrics 0.00 0.49 0.00 1.46 5.85 0.00 0.98 0.98 90.24 0.00 0.00 0.00 Psychiatry 0.00 0.00 2.04 0.00 0.00 0.00 4.08 0.00 0.00 93.88 0.00 0.00 Radiology 0.00 0.00 0.00 0.00 0.00 0.00 0.00 0.00 0.00 0.00 100.00 0.00Surgeons 0.25 1.02 1.02 4.06 0.25 0.00 2.79 0.51 0.00 0.00 0.25 89.85
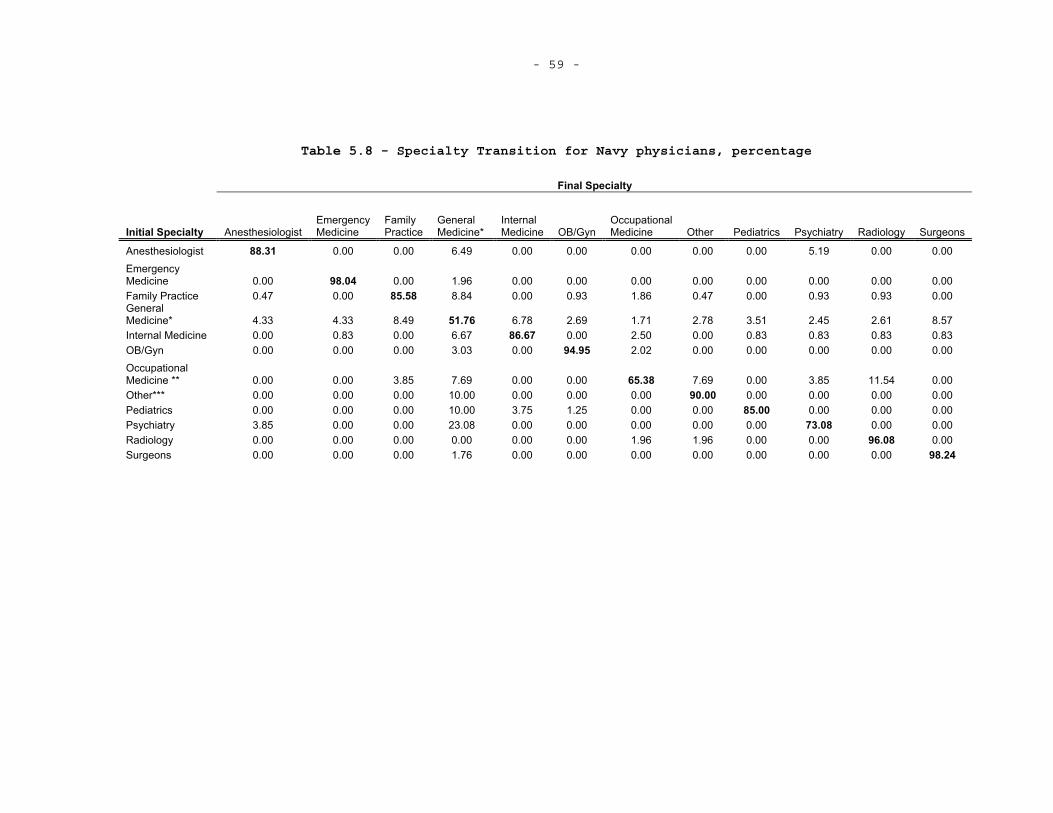
- 59 -
Table 5.8 - Specialty Transition for Navy physicians, percentage
Final Specialty
Initial Specialty Anesthesiologist Emergency Medicine
Family Practice
General Medicine*
InternalMedicine OB/Gyn
OccupationalMedicine Other Pediatrics Psychiatry Radiology Surgeons
Anesthesiologist 88.31 0.00 0.00 6.49 0.00 0.00 0.00 0.00 0.00 5.19 0.00 0.00 Emergency Medicine 0.00 98.04 0.00 1.96 0.00 0.00 0.00 0.00 0.00 0.00 0.00 0.00 Family Practice 0.47 0.00 85.58 8.84 0.00 0.93 1.86 0.47 0.00 0.93 0.93 0.00 General Medicine* 4.33 4.33 8.49 51.76 6.78 2.69 1.71 2.78 3.51 2.45 2.61 8.57 Internal Medicine 0.00 0.83 0.00 6.67 86.67 0.00 2.50 0.00 0.83 0.83 0.83 0.83 OB/Gyn 0.00 0.00 0.00 3.03 0.00 94.95 2.02 0.00 0.00 0.00 0.00 0.00 OccupationalMedicine ** 0.00 0.00 3.85 7.69 0.00 0.00 65.38 7.69 0.00 3.85 11.54 0.00 Other*** 0.00 0.00 0.00 10.00 0.00 0.00 0.00 90.00 0.00 0.00 0.00 0.00 Pediatrics 0.00 0.00 0.00 10.00 3.75 1.25 0.00 0.00 85.00 0.00 0.00 0.00 Psychiatry 3.85 0.00 0.00 23.08 0.00 0.00 0.00 0.00 0.00 73.08 0.00 0.00 Radiology 0.00 0.00 0.00 0.00 0.00 0.00 1.96 1.96 0.00 0.00 96.08 0.00Surgeons 0.00 0.00 0.00 1.76 0.00 0.00 0.00 0.00 0.00 0.00 0.00 98.24
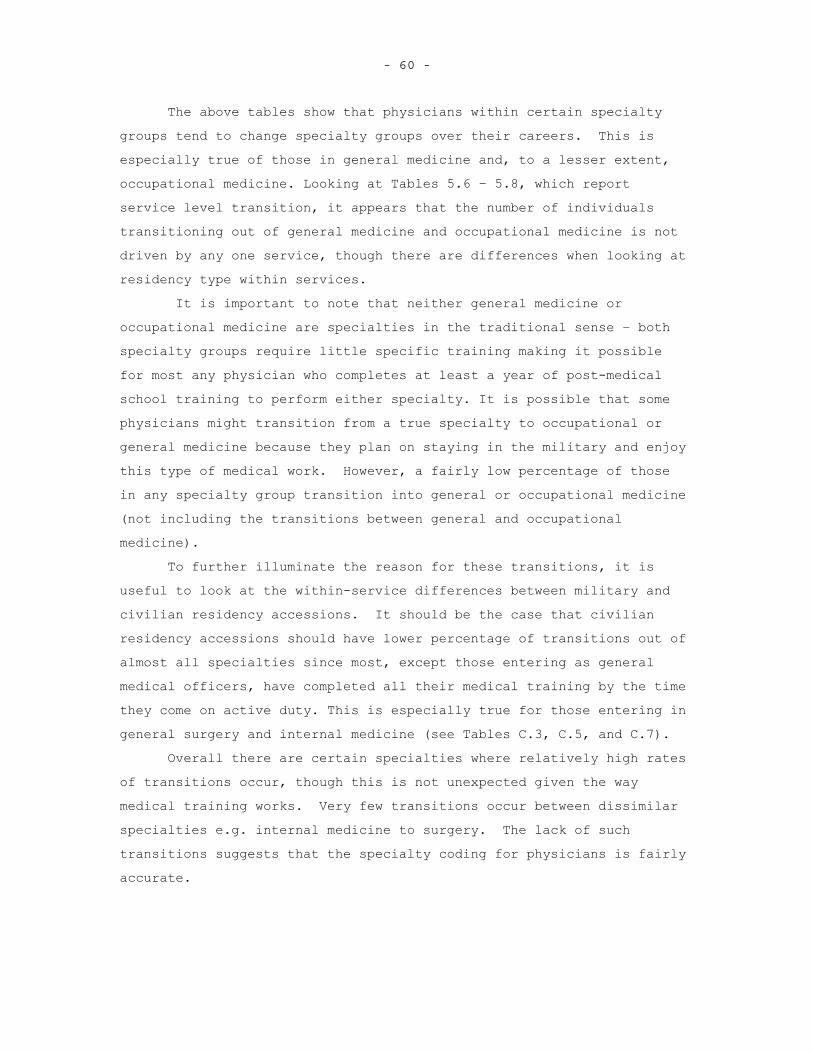
- 60 -
The above tables show that physicians within certain specialty groups tend to change specialty groups over their careers. This is especially true of those in general medicine and, to a lesser extent, occupational medicine. Looking at Tables 5.6 – 5.8, which report service level transition, it appears that the number of individuals transitioning out of general medicine and occupational medicine is not driven by any one service, though there are differences when looking at residency type within services.
It is important to note that neither general medicine or occupational medicine are specialties in the traditional sense – both specialty groups require little specific training making it possible for most any physician who completes at least a year of post-medical school training to perform either specialty. It is possible that some physicians might transition from a true specialty to occupational or general medicine because they plan on staying in the military and enjoy this type of medical work. However, a fairly low percentage of those in any specialty group transition into general or occupational medicine (not including the transitions between general and occupational medicine). To further illuminate the reason for these transitions, it is useful to look at the within-service differences between military and civilian residency accessions. It should be the case that civilian residency accessions should have lower percentage of transitions out of almost all specialties since most, except those entering as general medical officers, have completed all their medical training by the time they come on active duty. This is especially true for those entering in general surgery and internal medicine (see Tables C.3, C.5, and C.7).
Overall there are certain specialties where relatively high rates of transitions occur, though this is not unexpected given the way medical training works. Very few transitions occur between dissimilar specialties e.g. internal medicine to surgery. The lack of such transitions suggests that the specialty coding for physicians is fairly accurate.
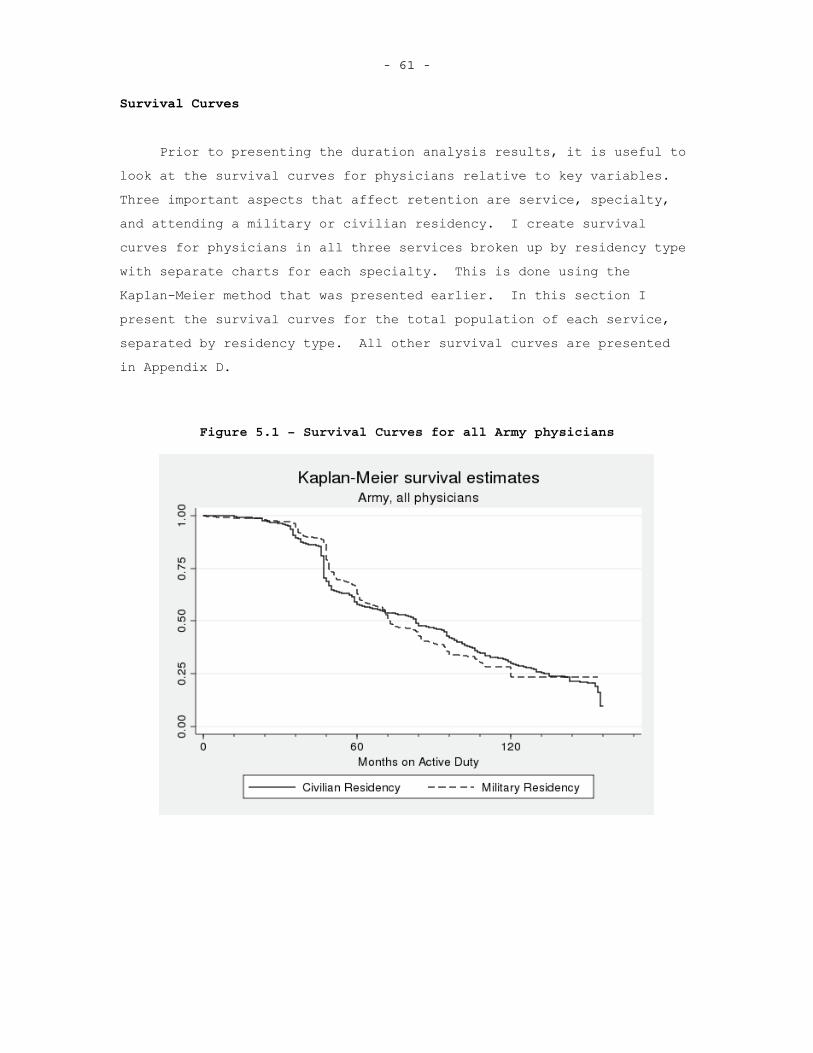
- 61 -
Survival Curves
Prior to presenting the duration analysis results, it is useful to look at the survival curves for physicians relative to key variables.Three important aspects that affect retention are service, specialty, and attending a military or civilian residency. I create survival curves for physicians in all three services broken up by residency type with separate charts for each specialty. This is done using the Kaplan-Meier method that was presented earlier. In this section I present the survival curves for the total population of each service, separated by residency type. All other survival curves are presented in Appendix D.
Figure 5.1 – Survival Curves for all Army physicians
- 62 - Figure 5.2 - Survival Curves for all Air Force physicians
Figure 5.3 - Survival Curves for all Navy physicians
- 63 -
To make these curves for military and civilian residents more
comparable, I set time to zero when a physician becomes fully qualified
– when a military resident completes his or her residency and when a
civilian resident enters active duty. The military resident curves for
all three services appear to fall off at a slower rate, most noticeably
in the Navy (Figure 5.3). Such a trend indicates that there is
something different about individuals who attend military residencies
compared to those who do not. Looking at survival curves for each
specialty, this trend generally holds for all specialties.
While the survival curves do offer a nice illustration of the
larger duration trends for key variables, it is difficult to make any
sound conclusions about what affects active duty physician duration from
these figures alone. It is important to realize that there are likely
more variables at play within each survival curve. To investigate the
different effects of various characteristics it is necessary to use a
multivariate regression approach.
DURATION ANALAYSIS RESULTS
I now present the results from the discrete-time duration analysis model. The results are generated using STATA and use the complimentary log-log binary choice model that accounts for unobserved heterogeneity to generate the hazard ratios for the specified variables. Overall the multivariate duration analysis indicates that practice opportunities, residency program, board certification, and deployments affect physician retention. Based on the results, it also appears that there is statistically signification unobserved heterogeneity – that is unobserved characteristics– that effect physician retention. This is consistent with the idea that “taste” for military service plays in to retention decisions, but does not definitively prove or quantify this “taste.”
Two separate models are run for different specifications of deployments – cumulative months and cumulative episodes. Furthermore, deployments are divided into initial service obligation and post initial service obligation deployments. Based on past work (Hosek and
- 64 -
Martorell (2009)) it is possible that deployments have different effects during different service periods.33 The hazard ratios for the variables that correspond to these four categories are presented in Tables 5.7 and 5.8 below34. A hazard ratio for a specific variable is the conditional probability of leaving active duty in a given time period conditional on surviving up to the given time period, ceteris paribus. Furthermore, a hazard ratio of one for any variable indicates that an individual physician with that characteristic is no more or less likely to leave in a given time period than a physician who does not posses the characteristic, ceteris paribus. Additional duration model results are presented in Appendix E.
33 Note that I assume all individuals are obligated initially for
four years. It is true that most are under such an obligation, but some are obligated for less. Changing the obligation to three years as opposed to four does not meaningfully change the results.
34 Note that service is not directly included in this duration analysis as a control since it is highly correlated with the practice opportunities variables – medical facilities are generally only staffed by physicians from a single service.
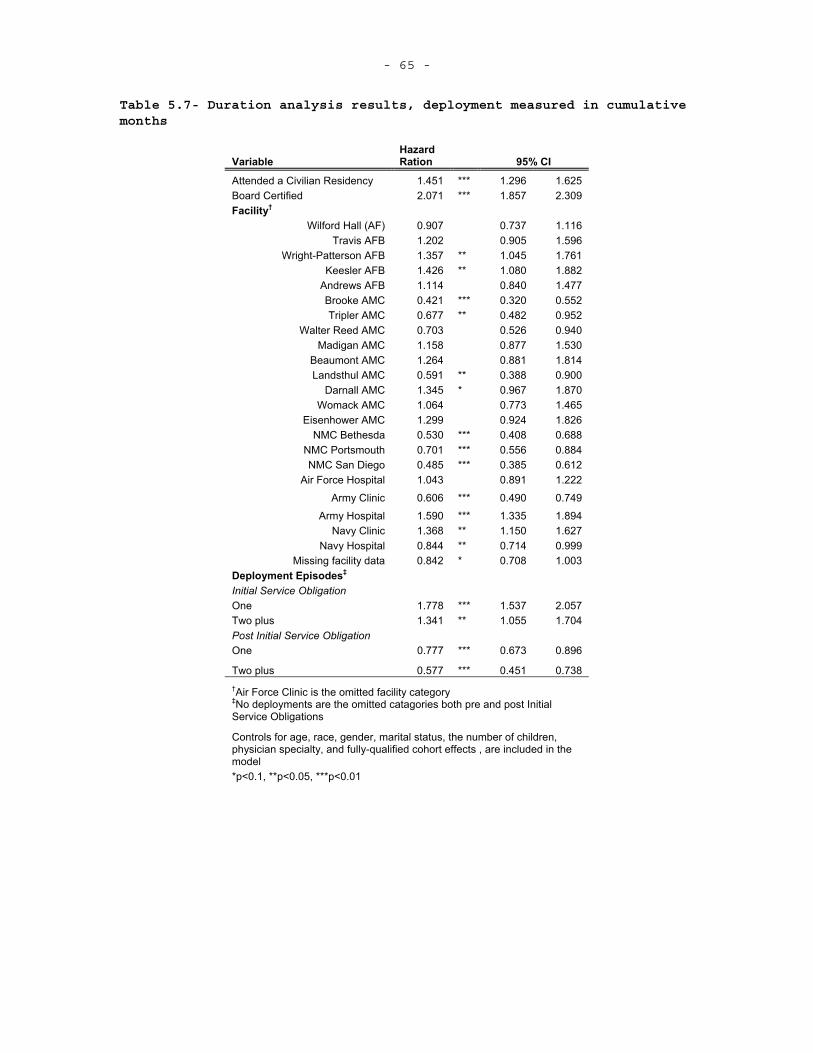
- 65 -
Table 5.7- Duration analysis results, deployment measured in cumulative months
VariableHazardRation 95% CI
Attended a Civilian Residency 1.451 *** 1.296 1.625 Board Certified 2.071 *** 1.857 2.309 Facility†
Wilford Hall (AF) 0.907 0.737 1.116 Travis AFB 1.202 0.905 1.596
Wright-Patterson AFB 1.357 ** 1.045 1.761 Keesler AFB 1.426 ** 1.080 1.882
Andrews AFB 1.114 0.840 1.477 Brooke AMC 0.421 *** 0.320 0.552 Tripler AMC 0.677 ** 0.482 0.952
Walter Reed AMC 0.703 0.526 0.940 Madigan AMC 1.158 0.877 1.530
Beaumont AMC 1.264 0.881 1.814 Landsthul AMC 0.591 ** 0.388 0.900
Darnall AMC 1.345 * 0.967 1.870 Womack AMC 1.064 0.773 1.465
Eisenhower AMC 1.299 0.924 1.826 NMC Bethesda 0.530 *** 0.408 0.688
NMC Portsmouth 0.701 *** 0.556 0.884 NMC San Diego 0.485 *** 0.385 0.612
Air Force Hospital 1.043 0.891 1.222
Army Clinic 0.606 *** 0.490 0.749
Army Hospital 1.590 *** 1.335 1.894 Navy Clinic 1.368 ** 1.150 1.627
Navy Hospital 0.844 ** 0.714 0.999 Missing facility data 0.842 * 0.708 1.003
Deployment Episodes‡ Initial Service Obligation One 1.778 *** 1.537 2.057Two plus 1.341 ** 1.055 1.704 Post Initial Service Obligation One 0.777 *** 0.673 0.896
Two plus 0.577 *** 0.451 0.738 †Air Force Clinic is the omitted facility category ‡No deployments are the omitted catagories both pre and post Initial Service Obligations
Controls for age, race, gender, marital status, the number of children, physician specialty, and fully-qualified cohort effects , are included in the model*p<0.1, **p<0.05, ***p<0.01
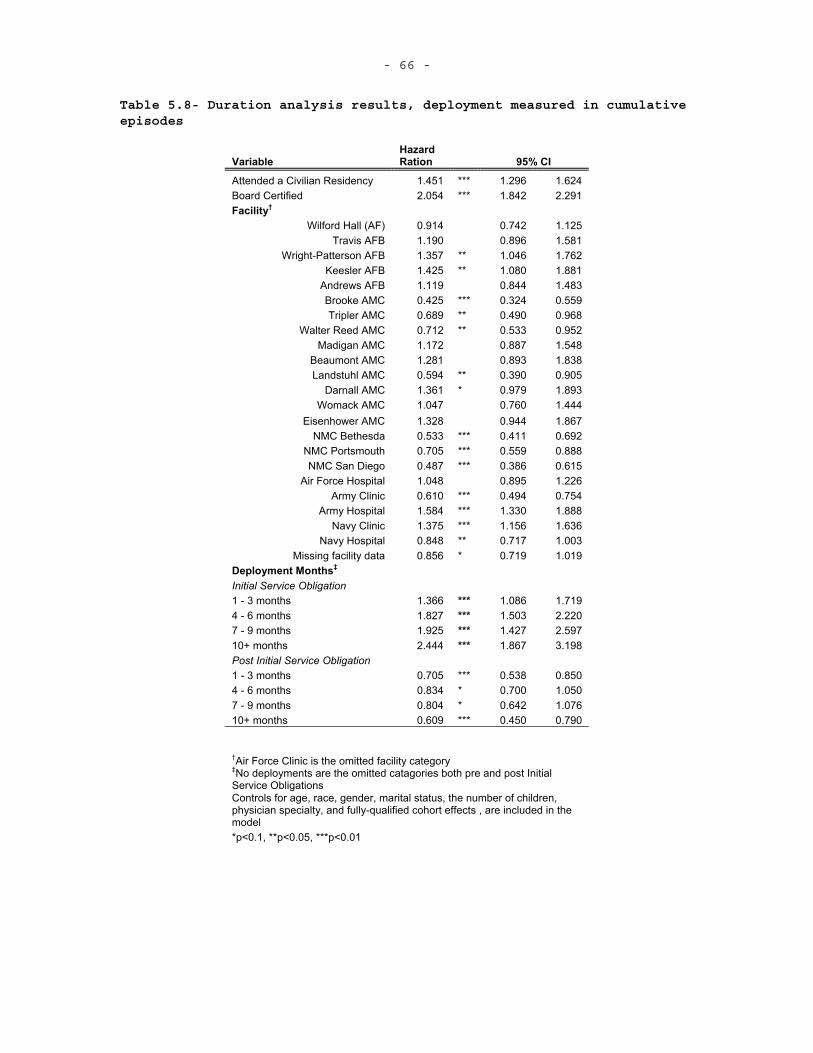
- 66 -
Table 5.8- Duration analysis results, deployment measured in cumulative episodes
VariableHazardRation 95% CI
Attended a Civilian Residency 1.451 *** 1.296 1.624 Board Certified 2.054 *** 1.842 2.291 Facility†
Wilford Hall (AF) 0.914 0.742 1.125 Travis AFB 1.190 0.896 1.581
Wright-Patterson AFB 1.357 ** 1.046 1.762 Keesler AFB 1.425 ** 1.080 1.881
Andrews AFB 1.119 0.844 1.483 Brooke AMC 0.425 *** 0.324 0.559 Tripler AMC 0.689 ** 0.490 0.968
Walter Reed AMC 0.712 ** 0.533 0.952 Madigan AMC 1.172 0.887 1.548
Beaumont AMC 1.281 0.893 1.838 Landstuhl AMC 0.594 ** 0.390 0.905
Darnall AMC 1.361 * 0.979 1.893 Womack AMC 1.047 0.760 1.444
Eisenhower AMC 1.328 0.944 1.867 NMC Bethesda 0.533 *** 0.411 0.692
NMC Portsmouth 0.705 *** 0.559 0.888 NMC San Diego 0.487 *** 0.386 0.615
Air Force Hospital 1.048 0.895 1.226 Army Clinic 0.610 *** 0.494 0.754
Army Hospital 1.584 *** 1.330 1.888 Navy Clinic 1.375 *** 1.156 1.636
Navy Hospital 0.848 ** 0.717 1.003 Missing facility data 0.856 * 0.719 1.019
Deployment Months‡ Initial Service Obligation 1 - 3 months 1.366 *** 1.086 1.719 4 - 6 months 1.827 *** 1.503 2.220 7 - 9 months 1.925 *** 1.427 2.597 10+ months 2.444 *** 1.867 3.198 Post Initial Service Obligation 1 - 3 months 0.705 *** 0.538 0.850 4 - 6 months 0.834 * 0.700 1.050 7 - 9 months 0.804 * 0.642 1.076 10+ months 0.609 *** 0.450 0.790
†Air Force Clinic is the omitted facility category ‡No deployments are the omitted catagories both pre and post Initial Service Obligations Controls for age, race, gender, marital status, the number of children, physician specialty, and fully-qualified cohort effects , are included in the model*p<0.1, **p<0.05, ***p<0.01
- 67 -
Training Variables – Both attending a civilian residency and being board certified are correlated with a higher probability of a physician leaving in a given time period, conditional on surviving the pervious time period.
As noted earlier, there is reason to believe that the selection into a civilian residency as opposed to a military residency out of medical school is correlated with the decision to remain in the military. The hazard ratio from the duration analysis indicates that this is indeed the case and that attending a civilian residency is associated with ~45% increase in the likelihood of leaving active duty in a given month, ceteris paribus. This correlation could exist because individuals who want to leave active duty soon after the initial service obligation chose civilian residencies to avoid additional time in the military. Alternatively, completing a military residency could cause an individual to have a greater affinity for military service. It should be noted that time spent in the military during a residency counts towards an individual’s 20 years of service needed to receive retirement benefits and this likely factors strongly in to a military resident attendee’s retention decision.
Upon completing a residency, a physician can choose to pursue board certification in his or her specialty. Military physicians are not required to pursue this, but there is a bonus – ranging from ~$200/month to $500/month increasing in years of service – paid to those who are board certified (Department of Defense, 2008b). The DMDC pay date indicates when physicians receive the board certification pay and I take the first month a physician receives this bonus as when he or she was first board certified. For military physicians who entered prior to 2003 and completed a residency between June 1996 and June 2004, ~75% are board certified. This is lower than their civilian counterparts, where ~90% of physicians in the U.S. are board certified, and could be partly because of the relatively high percentage of general medical officers in the military – who are not board eligible. (American Board of Medical Specialties, 2007).
It is also useful to see when physicians are becoming board certified. In the civilian market, physicians typically become board certified within a few months of completing a residency. Additionally,
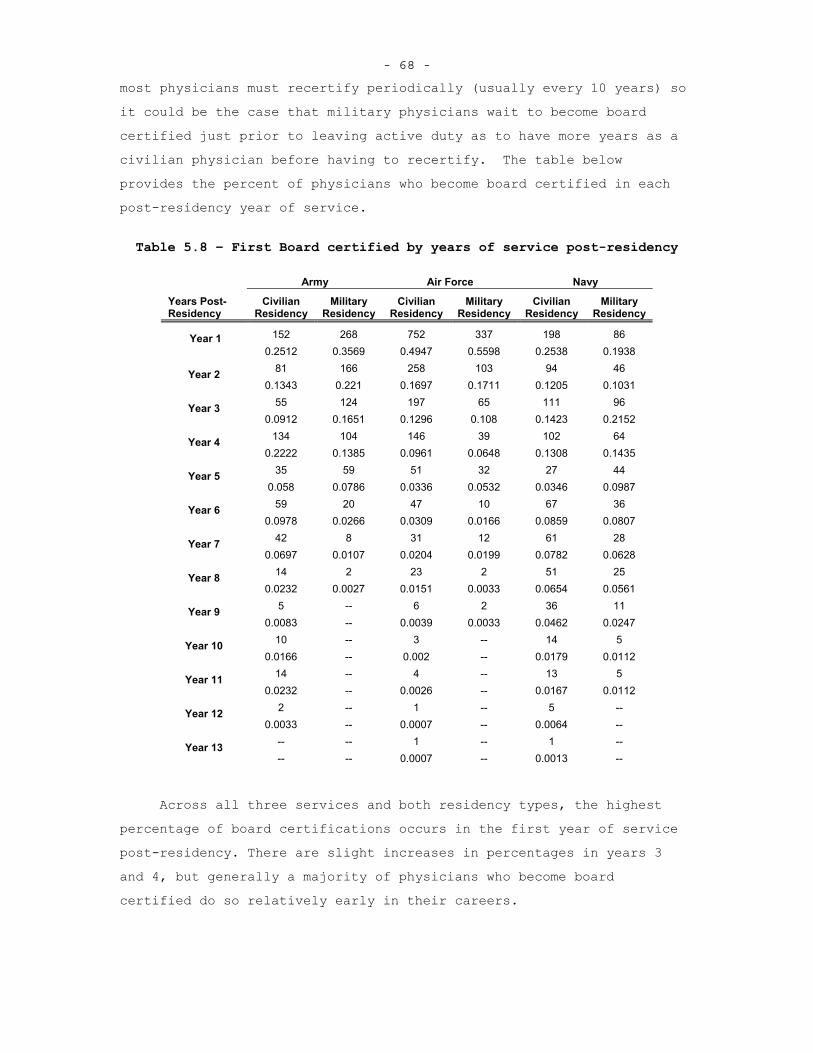
- 68 -
most physicians must recertify periodically (usually every 10 years) so it could be the case that military physicians wait to become board certified just prior to leaving active duty as to have more years as a civilian physician before having to recertify. The table below provides the percent of physicians who become board certified in each post-residency year of service.
Table 5.8 – First Board certified by years of service post-residency
Army Air Force Navy
Years Post-Residency
Civilian Residency
Military Residency
Civilian Residency
Military Residency
Civilian Residency
Military Residency
152 268 752 337 198 86 Year 1 0.2512 0.3569 0.4947 0.5598 0.2538 0.1938
81 166 258 103 94 46 Year 2 0.1343 0.221 0.1697 0.1711 0.1205 0.1031
55 124 197 65 111 96 Year 3 0.0912 0.1651 0.1296 0.108 0.1423 0.2152
134 104 146 39 102 64 Year 4 0.2222 0.1385 0.0961 0.0648 0.1308 0.1435
35 59 51 32 27 44 Year 5 0.058 0.0786 0.0336 0.0532 0.0346 0.0987
59 20 47 10 67 36 Year 6 0.0978 0.0266 0.0309 0.0166 0.0859 0.0807
42 8 31 12 61 28 Year 7 0.0697 0.0107 0.0204 0.0199 0.0782 0.0628
14 2 23 2 51 25 Year 8 0.0232 0.0027 0.0151 0.0033 0.0654 0.0561
5 -- 6 2 36 11 Year 9 0.0083 -- 0.0039 0.0033 0.0462 0.0247
10 -- 3 -- 14 5 Year 10 0.0166 -- 0.002 -- 0.0179 0.0112
14 -- 4 -- 13 5 Year 11 0.0232 -- 0.0026 -- 0.0167 0.0112
2 -- 1 -- 5 -- Year 12 0.0033 -- 0.0007 -- 0.0064 --
-- -- 1 -- 1 -- Year 13 -- -- 0.0007 -- 0.0013 --
Across all three services and both residency types, the highest percentage of board certifications occurs in the first year of service post-residency. There are slight increases in percentages in years 3 and 4, but generally a majority of physicians who become board certified do so relatively early in their careers.
- 69 -
Board certification is not required for civilian physicians, but being board certified is a signal of clinical skill and presumably makes a physician more marketable. Similar to the residency decision, a physician who is board certified is more likely to leave active duty – about ~73% -- in a give month, ceteris paribus. It could be the case that the value placed on being board certified outside the military is more than the bonus offered inside the military and therefore once a physician is board certified a civilian career becomes more attractive.Alternatively, a physician could be planning to leave military service and becomes board certified to conform to the norms of the civilian market. In the latter case, the effect of board certification on retention is biased, over-estimates the effect, and should be omitted from the duration analysis model. Based on the percentages in Table 5.8, the latter explanation seems to be fairly unlikely and it is more likely that those who never become board certified are making a decision to remain in the military. Of those who are board certified, ~48% leave active duty from June 1996 to June 2009. Additionally, ~43% of those who are not board certified at the time of separation leave active duty during this time. It is unlikely that the aforementioned endogeneity bias is at play in this decision.
While it appears that training has an effect on retention, it is not the only characteristic that affects the physician retention decision. Job characteristics also have an effect on physician retention.Clinical Setting – Since physicians spend a many years training to perform their profession, it seems likely that they have a desire to put this training to good use. Based on the theoretical model I presented earlier, a physician evaluates his or her practice opportunities and wage offers in the military and civilian sector and decides to remain or leave the military based on which setting maximizes his or her utility. In this framework, a physician will remain in the military if the consumption bundle offered by the military setting is greater than or equal to what is available in the civilian market. Since military wages for physicians are less than or equal to civilian wages, it is the case that some other element of military service must induce physicians to remain on active duty.
- 70 -
Practice opportunities, which are represented using clinical setting classifications, could be one such element. Larger medical centers, which offer greater services, offer increased practice opportunities to the physicians who are stationed there since there is less primary care and more specially care at these facilities. Based on the number of TRICARE beneficiaries enrolled, services offered, and physicians stationed at a facility, each service appears to have at least one major medical center. Additionally, other MTFs are listed and medical centers. I include an assignment dummy for every MTF that is listed as a medical center, regardless of size. All other facilities are classified as clinics or hospitals in their respective services. For the duration analysis, all hazard ratios are relative to Air Force Clinics. Seven of the medical centers – Brooke AMC, Tripler AMC, Landstuhl AMC, Walter Reed AMC, NNMC Bethesda, NMC San Diego, and NMC Portsmouth, have statistically significant effects on retention and being stationed at one of these facilities is associated with at least a 30% decrease in the probability in leaving during a given month relative to a similar physician who is stationed at an Air Force clinic.35 Additionally, I test the joint significance of major medical centers – based on enrollment numbers and services offered – and find that large medical centers have a statistically significant effect while small ones do not (All seven mentioned above are considered “large” medical centers). While it is possible that other factors are causing this increase in retention rate among those who are stationed at medical centers, it is the case that at least some of this effect is attributable to increased practice opportunities.36
35 Army clinics and Navy hospitals also have a positive effect on
physician retention. 36 It is true that five of the facility classifications – Darnall
AMC, Keesler AFB, Wright-Patterson AFB, Army hospitals, and Navy clinics, appear to have increased probabilities of attrition for a given month. Based on the size and scope of services each of these facilities offer, this result is consistent with the hypothesis that practice opportunities are correlated with increased retention. It is likely that there are some additional organizational effects of these facilities that are related to the increased hazards ratios. Additional factors such as location or organizational culture could also affect retention, though undoubtedly some of the effect is due to increased
- 71 -
Deployments – Since the beginning of the current operations in Southwest Asia, military physicians have been tasked with providing medical care to the wounded soldiers, sailors, Marines, and airmen. Deployments offer a unique opportunity for a physician to execute his or her wartime mission of caring for the wounded, but also expose him or her to dangerous settings while being separated from family and friends. The ability to execute a wartime mission also translates in to increased practice opportunities for a physician since he or she is going to treat patients and wounds not otherwise seen in the non-deployed setting. Other reports that look at deployment effects for enlisted and officers (Hosek and Martorell, 2009, and Fricker, 2002) find that generally that deployment has not had a negative effect on retention, especially when deployments are relatively short, although deployment effects were negative in the Army for enlisted members in 2006.
Two specifications for deployment are included in the physician duration models- the cumulative number of deployment episodes and the cumulative number of months deployed. I use dummy variables, similar to Hosek and Martorell (2009) to classify both months and episodes and further distinguish between deployments during a physician’s initial service obligation and after his or her initial service obligation by assuming that all individuals are obligated for four years of service.This is important since a physician can not leave after a deployment episode during his or her initial service obligation, but can do so once he or she has served out the initial commitment. Looking at cumulative months deployed during a physician’s initial service obligation, I find that all deployment lengths have a negative and
practice opportunities. An alternative specification that looks at cumulative months assigned to facility types was also run and the trends are generally the same – more cumulative months assigned to a medical center are correlated with increased retention. Also, it could be the case that large medical centers have different effects for different specialties. I run specification that attempts to account for this by looking at a facility-non-primary-care interaction. I find that the effect on being assigned to a large medical center is greater for a specialist, in magnitude, but not statistically different than primary care physicians.
- 72 -
statistically significant effect on physician duration. Cumulative months of deployment that occur after the initial service obligation are associated with increased physician duration, though only the coefficients for 1-3 month and 10 and more months are statistically significant at the 5% level. The effects of cumulative episodes are similar to the cumulative month effects, both during and after the initial service obligation.
The above results suggest that there are training and practice opportunity effects for physicians. Additionally, if deployment episodes translate in to increased practice opportunities, being exposed to wartime cases for short durations appears to increase retention, at least for those who decide to remain beyond the initial service obligation. It is likely that the practice opportunity effects contained with in the deployment effects are counteracted by the hardships that come with deployment. Overall, the results suggest a statistically significant correlation exists between retention and practice opportunity that supports the hypothesis that increased practice opportunities are associated with increased physician retention.
- 73 - 6. POLICY CHANGES AND THE EFFECTS ON PHYSICIAN DURATION
While the duration analysis results offer some insight into how practice opportunities and other variables affect physician retention, it’s often useful to create alternate scenarios that illustrate what would have happened from June 1996 to June 2009 if certain policy parameters were changed. In this section, I present policy simulation results that are generated using the parameters from the duration analysis results. It is important to realize that these results are not proof that physician retention would change in one direction or the other, but rather predictions regarding what might have occurred over the 13 year span analyzed had certain parameters been different. Both policy analysts and policymakers must acknowledge the fact that a model is only as good as the assumptions that underlie it. With this in mind, I present how physician durations might have been different for Surgeons, Family Practice, Internal Medicine, Psychiatry, and Anesthesiology if these individuals were exposed to differed practice opportunities, different residencies, and different deployments.
FRAMEWORK FOR POLICY CHANGES
Using the results from the duration analysis regression, it is
possible to illustrate how changes in practice opportunities, residency
mix, and deployments affect physician retention. It is important to
realize that these predictions assume that all other characteristics for
individuals remain the same and that there is some mechanism by which
the variables of interest are able to change the amount of time a
physician spends on active duty.
When looking at the effects of changing certain variables in the
duration model, the outcome of interest is the change in mean expected
duration of a physician’s active duty career. Expected duration is
calculated using the predicted survival function which is based on the
regression results. After running the duration model, it is possible to
have STATA predict probabilities of failure for each person-month
observation based on the covariate values for each observation. This
probability is the discrete-time hazard for each person in a given
- 74 -
month. Recall that the survival function is simply the probability of
surviving a given month conditional on surviving all previous months.
The expected duration, then, is simply the sum of the survival function
evaluated at each time period up until the last time period-
ttSTET
tii
1)()( , where )(TEi is the expected duration for an individual
physician over all observed months, )(tSi is the survival function
evaluated at each time period, and t is the time-period over which the survival function is evaluated. Given the above formula for expected
duration, the mean expected duration for a group of physicians is simply
the sum of all the expected durations divided by total number of
physicians in the group. Using this formulation, I now present the
changes to mean expected duration that come about from changing key
parameters in the duration model.
CHANGES IN PRACTICE OPPORTUNITIES
To examine how changes in practice opportunities might affect physician duration, I look at what would have happened to the mean expected durations for surgeons, internists, anesthesiologists, psychiatrists, and family practice physicians by service from the period of June 1996 to June 2009 had each service been able to increase the size of some of their MTFs to create additional large medical centers. For the Army, I look at making Beaumont, Darnall, and Madigan AMCs the same as Tripler AMC. For the Air Force, I look at making Wilford Hall, Travis AFB, and Nellis AFB into the same size as Brooke AMC – recall that none of the Air Force medical centers had positive effects on physician duration, but Wilford Hall recently merged with Brooke AMC. For the Navy, which already has three large medical centers, I look at increasing the size of NMC Portsmouth to be similar to NMC San Diego. Below are figures that report the results, by service.
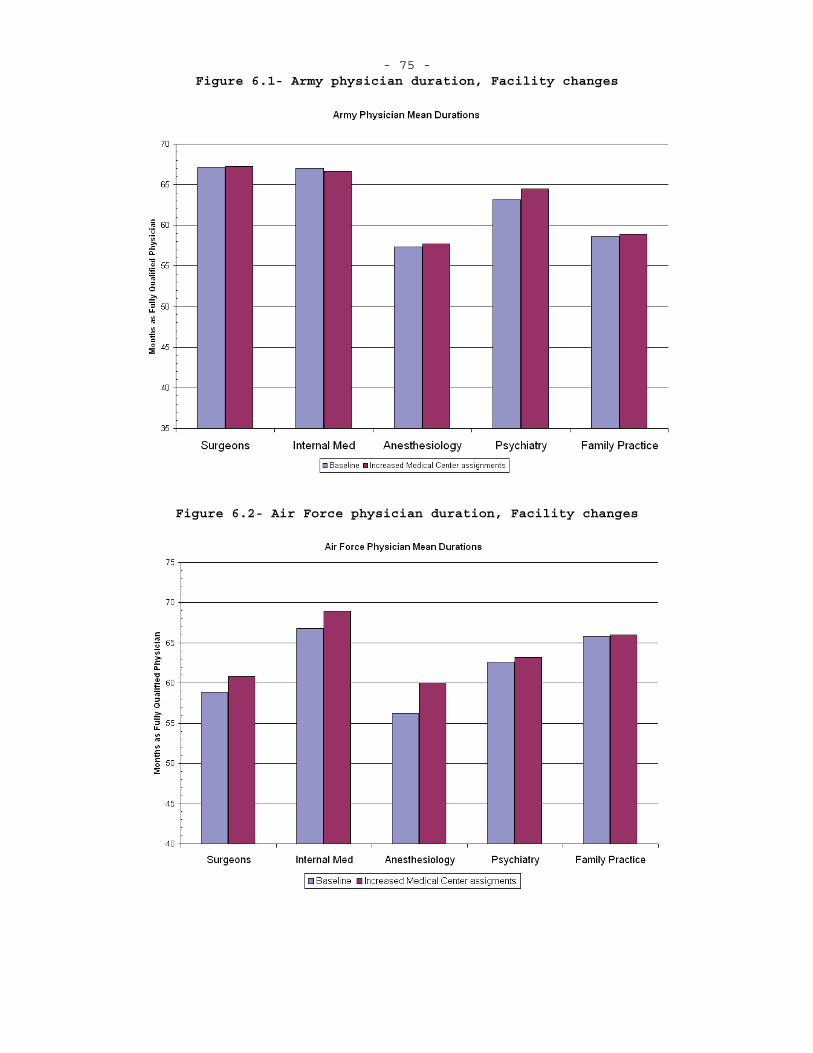
- 75 - Figure 6.1- Army physician duration, Facility changes
Figure 6.2- Air Force physician duration, Facility changes
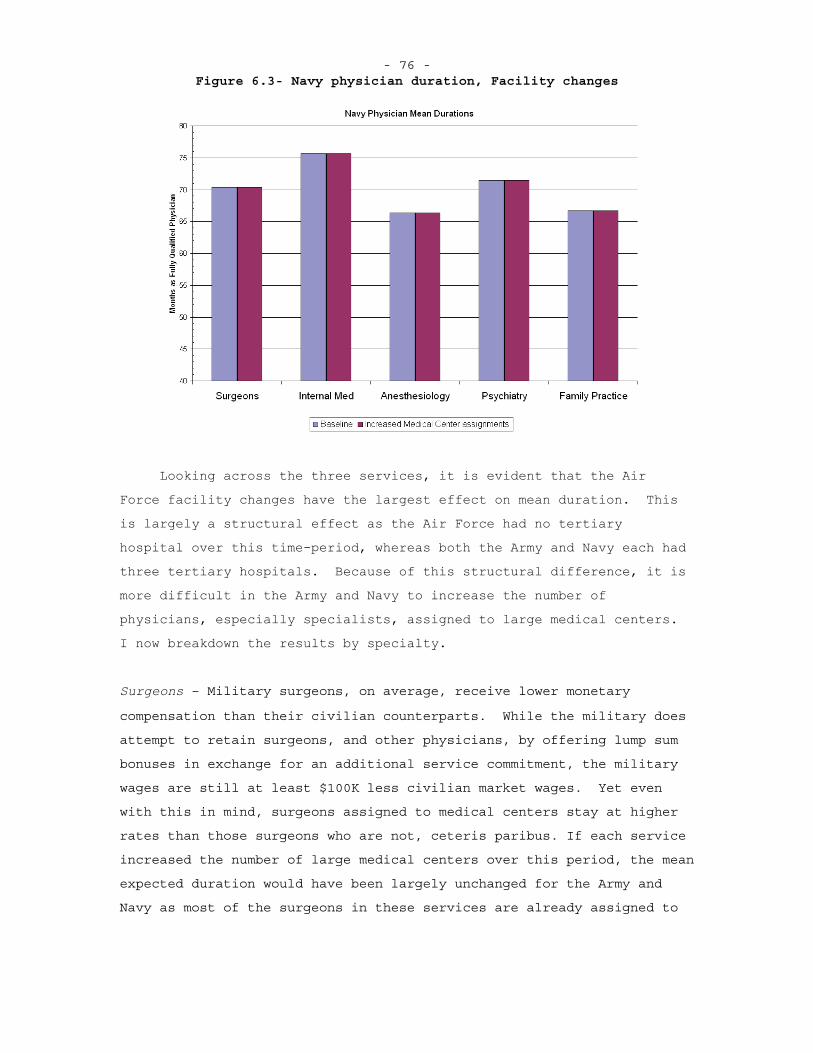
- 76 - Figure 6.3- Navy physician duration, Facility changes
Looking across the three services, it is evident that the Air Force facility changes have the largest effect on mean duration. This is largely a structural effect as the Air Force had no tertiary hospital over this time-period, whereas both the Army and Navy each had three tertiary hospitals. Because of this structural difference, it is more difficult in the Army and Navy to increase the number of physicians, especially specialists, assigned to large medical centers. I now breakdown the results by specialty.
Surgeons – Military surgeons, on average, receive lower monetary
compensation than their civilian counterparts. While the military does
attempt to retain surgeons, and other physicians, by offering lump sum
bonuses in exchange for an additional service commitment, the military
wages are still at least $100K less civilian market wages. Yet even
with this in mind, surgeons assigned to medical centers stay at higher
rates than those surgeons who are not, ceteris paribus. If each service
increased the number of large medical centers over this period, the mean
expected duration would have been largely unchanged for the Army and
Navy as most of the surgeons in these services are already assigned to
- 77 -
large medical centers. For the Air Force, there would have been about a
2 month increase in mean duration and this is largely due to the fact
that the Air Force went from essentially zero to three large medical
centers in the simulation. The increase in the Air Force could also be
thought of as additional 4% of surgeons signing up for 4-year
commitments.
Internists – Those practicing internal medicine and the associated
subspecialties receive compensation in the military that is similar to
what the civilian market offers (though cardiologists make significantly
more outside the military, ~$180K more). It is likely that the facility
the internist is assigned to greatly affect his or her practice
opportunities. Those assigned to clinics and small hospitals are likely
to provide mostly primary care, whereas those in medical centers face
more complex cases. If each service increased the number of large
medical centers over this period, the mean expected duration would have
been largely unchanged for the Army and Navy as most of the internists
in these services are already assigned to large medical centers. For the
Air Force, there would have been about a 3 month increase in mean
duration and this is largely due to the fact that the Air Force went
from essentially zero to three large medical centers in the simulation.
The increase in the Air Force could also be thought of as additional
6.25% of surgeons signing up for 4-year commitments.
Anesthesiologists -- As evident in the above figures, anesthesiologists have the lowest mean expected durations of these five specialty groups. Anesthesiologists tend to be highly paid in the civilian market and tend to perform similar cases regardless of settings. It could be that the practice opportunities in the military are not enough to offset the civilian pay advantage. It is important to realize, though, that specialty choice is endogenous and comparing retention rates across specialties can be misleading since it could be the case that individuals who have a lower propensity to remain on active duty choose
- 78 -
certain specialties.37 If each service increased the number of large
medical centers over this period, the mean expected duration would have
been largely unchanged for the Navy as most of the anesthesiologists in
these services are already assigned to large medical centers. For the
Air Force, there would have been about a 3 month increase in mean
duration and this is largely due to the fact that the Air Force went
from essentially zero to three large medical centers in the simulation.
Psychiatrists – Those practicing psychiatry receive compensation in the
military that is similar to what the civilian market offers.
Additionally, the services have placed greater emphasis on retaining
psychiatrists since the onset of the conflicts in Afghanistan and Iraq.
If each service increased the number of large medical centers over this
period, the mean expected duration for all three services does not
change in a statistically significant manner.
Family Practice – Family Practice physicians are similar to internists
in that their practice opportunities vary greatly across facility types.
In both settings, family practice physicians are performing the role of
the primary caregiver, but likely see a wider range of patient types at
the medical facilities since family practice physicians act as the
attending physician for those in the hospital. If each service increased
the number of large medical centers over this period, the mean expected
duration for all three services does not change in a statistically
significant manner.
Based to the above predictions, it appears that assigning all five physician specialties to medical centers as opposed to clinics or
37 Looking at the data, every specialty, with the exception of
OB/Gyn, has about a 70-30 split in those staying and those leaving over the data time period. OB/Gyn is closer to a 50-50 split. This, at least at first pass, would seem to indicate that there is a fairly low correlation between the specialty decision and the retention decision. In the duration analysis model, most every specialty coefficient was small and not statically different from 0, further indicating the minimal correlation between specialty choice and retention.
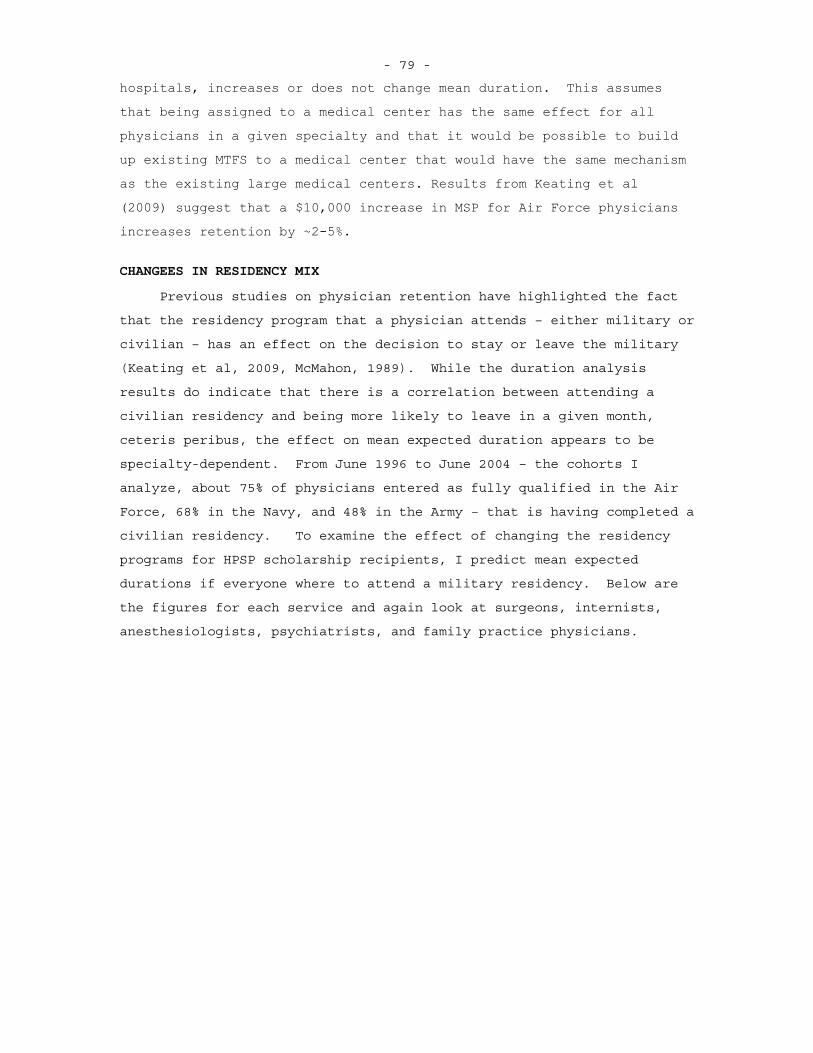
- 79 -
hospitals, increases or does not change mean duration. This assumes that being assigned to a medical center has the same effect for all physicians in a given specialty and that it would be possible to build up existing MTFS to a medical center that would have the same mechanism as the existing large medical centers. Results from Keating et al (2009) suggest that a $10,000 increase in MSP for Air Force physicians increases retention by ~2-5%.
CHANGEES IN RESIDENCY MIX
Previous studies on physician retention have highlighted the fact
that the residency program that a physician attends – either military or
civilian – has an effect on the decision to stay or leave the military
(Keating et al, 2009, McMahon, 1989). While the duration analysis
results do indicate that there is a correlation between attending a
civilian residency and being more likely to leave in a given month,
ceteris peribus, the effect on mean expected duration appears to be
specialty-dependent. From June 1996 to June 2004 – the cohorts I
analyze, about 75% of physicians entered as fully qualified in the Air
Force, 68% in the Navy, and 48% in the Army – that is having completed a
civilian residency. To examine the effect of changing the residency
programs for HPSP scholarship recipients, I predict mean expected
durations if everyone where to attend a military residency. Below are
the figures for each service and again look at surgeons, internists,
anesthesiologists, psychiatrists, and family practice physicians.
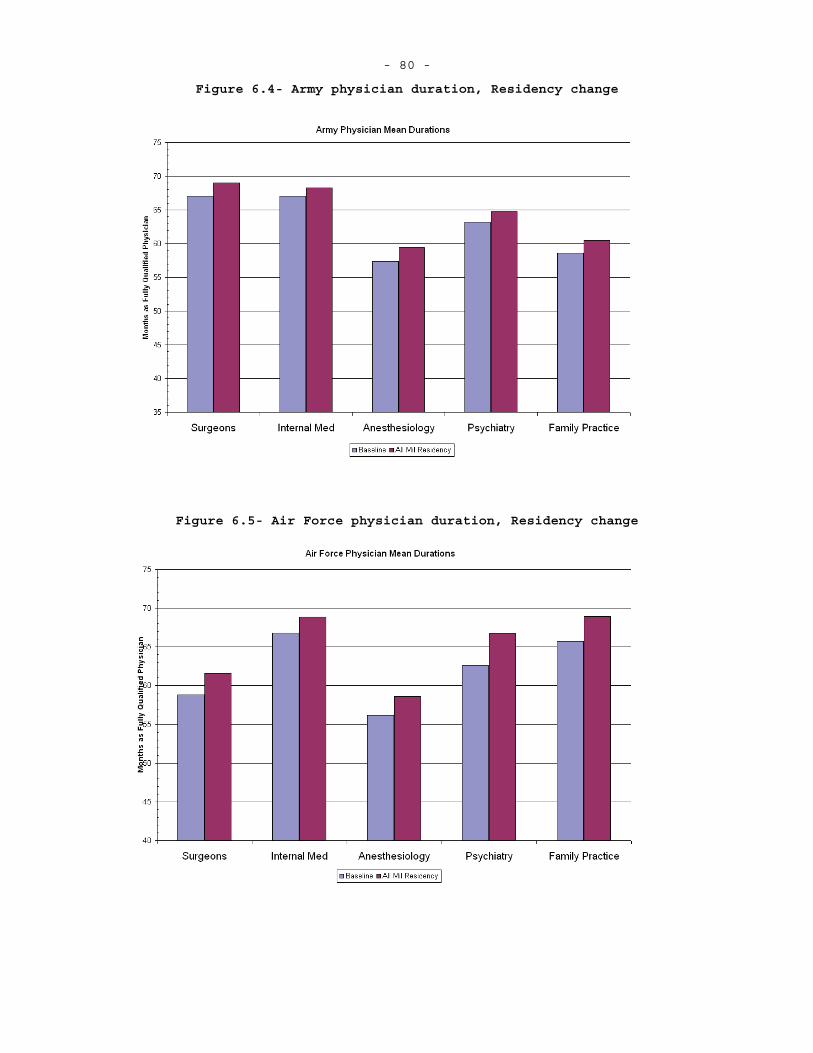
- 80 -
Figure 6.4- Army physician duration, Residency change
Figure 6.5- Air Force physician duration, Residency change
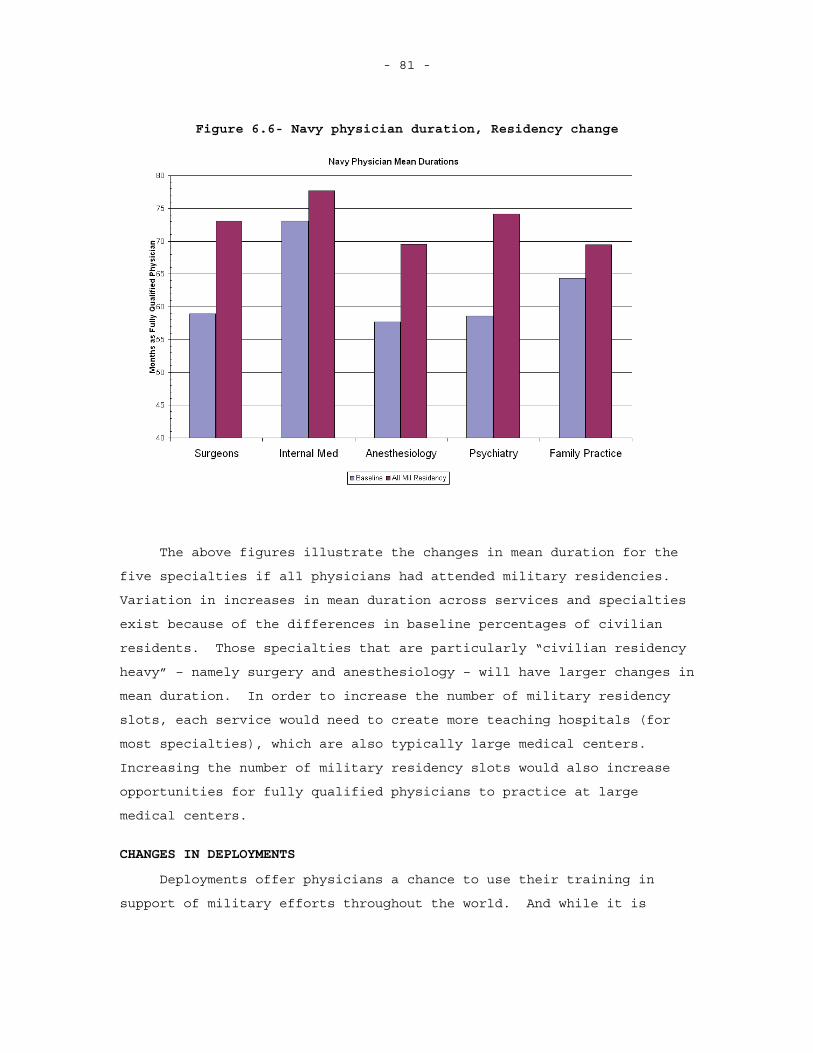
- 81 -
Figure 6.6- Navy physician duration, Residency change
The above figures illustrate the changes in mean duration for the
five specialties if all physicians had attended military residencies.
Variation in increases in mean duration across services and specialties
exist because of the differences in baseline percentages of civilian
residents. Those specialties that are particularly “civilian residency
heavy” – namely surgery and anesthesiology – will have larger changes in
mean duration. In order to increase the number of military residency
slots, each service would need to create more teaching hospitals (for
most specialties), which are also typically large medical centers.
Increasing the number of military residency slots would also increase
opportunities for fully qualified physicians to practice at large
medical centers.
CHANGES IN DEPLOYMENTS
Deployments offer physicians a chance to use their training in
support of military efforts throughout the world. And while it is
- 82 -
likely that deployments change a physician’s practice opportunity, he or
she also has to endure the hardships of being separated from his or her
family and friends. The duration analysis model indicates that
deployments do affect physician retention. To further examine the
effects of deployments on physician retention, I create scenarios where
those who are deployed remain deployed for a set number of months. In
the dataset slightly less than 50% of physicians in the three services
ever deploy before leaving or the data period ends and of those who
deploy, most are deployed once for less than six months.38 With
increased operations over the last few years, it is necessary to deploy
more physicians. It is important to know how increased deployment
episode lengths affect overall retention. Below are figures indicating
mean expected durations for the five specialties already explored in the
practice opportunity and residency analysis. Each bar represents the
mean duration for new cumulative deployment months lengths of 1-3,4-6,
7-9, and 10 or more months. Changes are only made for those who were
deployed. I present results for cumulative months deployed during the
initial service obligation and after initial service obligation.
38 It is important to note that deployments vary across specialties
ranging from ~25% ever deploying for OB/Gyn and Radiologists to almost 75% for General Surgeons and Emergency Medicine physicians.
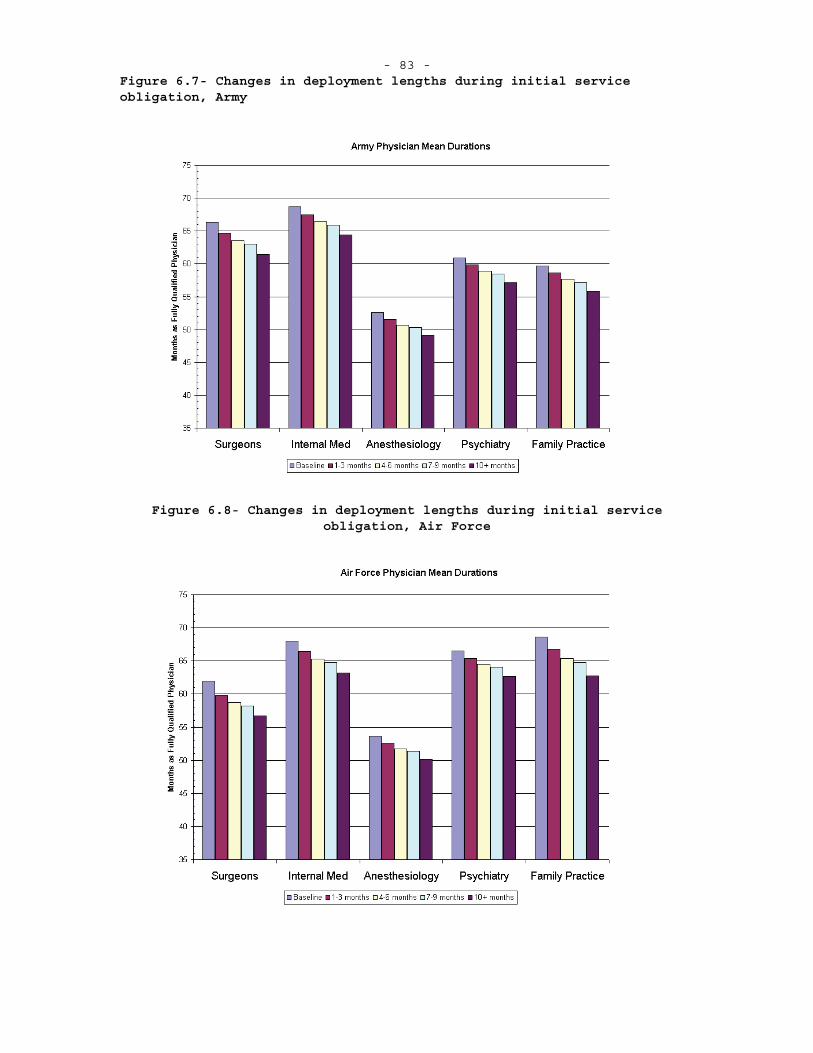
- 83 - Figure 6.7- Changes in deployment lengths during initial service obligation, Army
Figure 6.8- Changes in deployment lengths during initial service obligation, Air Force
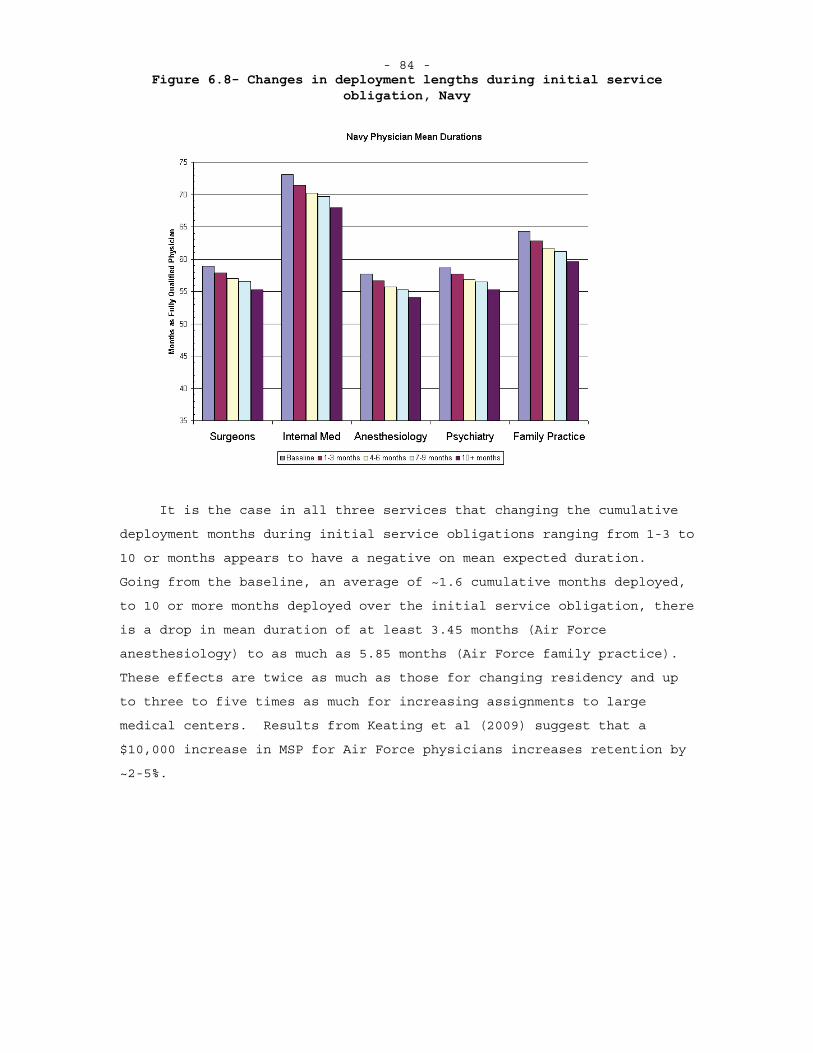
- 84 - Figure 6.8- Changes in deployment lengths during initial service
obligation, Navy
It is the case in all three services that changing the cumulative
deployment months during initial service obligations ranging from 1-3 to
10 or months appears to have a negative on mean expected duration.
Going from the baseline, an average of ~1.6 cumulative months deployed,
to 10 or more months deployed over the initial service obligation, there
is a drop in mean duration of at least 3.45 months (Air Force
anesthesiology) to as much as 5.85 months (Air Force family practice).
These effects are twice as much as those for changing residency and up
to three to five times as much for increasing assignments to large
medical centers. Results from Keating et al (2009) suggest that a
$10,000 increase in MSP for Air Force physicians increases retention by
~2-5%.
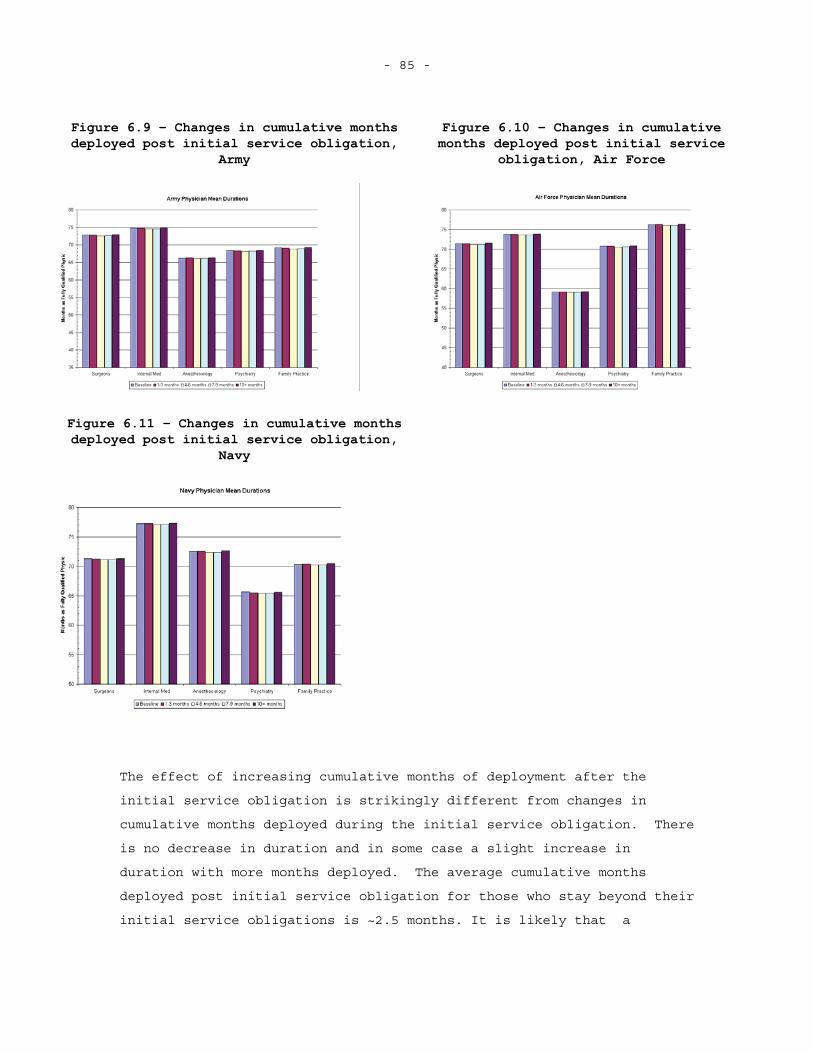
- 85 -
Figure 6.9 – Changes in cumulative months deployed post initial service obligation,
Army
Figure 6.10 – Changes in cumulative months deployed post initial service
obligation, Air Force
Figure 6.11 – Changes in cumulative months deployed post initial service obligation,
Navy
The effect of increasing cumulative months of deployment after the
initial service obligation is strikingly different from changes in
cumulative months deployed during the initial service obligation. There
is no decrease in duration and in some case a slight increase in
duration with more months deployed. The average cumulative months
deployed post initial service obligation for those who stay beyond their
initial service obligations is ~2.5 months. It is likely that a

- 86 -
physician who remains beyond the initial service obligation has decided
that he or she is alright with deploying or even gains some utility from
doing so. Deployments after the initial service obligation, then, are
affecting a different set of individuals than deployments during the
initial service obligation.
- 87 - 7. CONCLUSION
In this dissertation I illustrate that there is a relationship between facility type – a proxy for practice opportunities – and increased physician duration on active duty. Additionally the prediction results from the duration analysis model suggest that the effect of residency type for AFHPSP participants is not a large factor in changing physician duration.
FINDINGS
While other reports have looked at military physician retention at
a service level, I know of no recent studies that look at retention
across all three services or use the duration analysis framework. Other
studies (Keating et al, 2009, McMahon, 1989) have used binary outcome
models to look at what affects the initial retention decision for
physicians and find that the military-civilian wage differential appears
to have the greatest effect. I make no attempt to estimate the direct
effect of the wage differential and instead control for this using
specialty and year dummies.
No study has attempted to estimate the effect of practice
opportunities on military physician retention. While the measure I have
for practice opportunities – facility type – is a crude measure, the
results of the duration analysis model suggest that there is a practical
and statistically significant effect on physician retention. The
prediction results suggest that had more physicians been assigned to
large medical centers from June 1996 to June 2009, there would have been
a modest increase in average active duty duration of ~0.62 months across
all three services in the first 5.5 years of post residency service.
When looking at the effects of residency type on active duty
duration it is important to account for the structural differences that
go along with the two different residency types. Civilian residency
accessions begin their initial service obligation immediately after they
enter active duty service where as military residency accessions must
complete a 3 to 6 year residency before beginning their initial service
obligation. Therefore I begin all of the duration analysis with the
- 88 -
time zero being when a physician becomes fully qualified, regardless of
residency type. Using this approach, there is less of a difference in
active duration when delineated by residency type than previously
reports. Furthermore, if all physicians were required to complete a
military residency, there would have been a modest increase of ~1.8
months across all three services in the first 5.5 years of post
residency service.
The deployment results are the most noticeable in the simulations
and suggest that increasing deployment lengths or episodes during a
physician’s initial service obligation decrease physician retention.
Increases in deployment lengths or episodes after a physician has served
out his or her initial service obligation have no negative effect on
physician retention and even appears to have a slight positive effect in
some cases.
POLICY IMPLICATIONS
Previous studies on military physician retention have suggested
that it is necessary to increase monetary compensation for military
physicians in order to increase retention rates. This is surely the
case and the three services offer several bonuses in an attempt to
induce physicians to stay. Yet even with the current levels of bonuses,
military physician pay still lags behind civilian physician pay by 15%
for family practice physicians and up to 60% for neurosurgeons. The
three services could decide to increase physician pay to close this gap,
but short of this, other options need to be explored.
One such option is to increase practice opportunities for
physicians, which is, among other things, a form of non-monetary
compensation. The results of this dissertation suggest placing more
physicians in medical centers as opposed to leaving some in clinics and
small hospitals would have increased the average active duty duration of
all military physicians by ~1.5% between June 1996 and June 2009. Not
only would such a move modestly increase active duty duration it is also
likely to increase physician proficiency and the quality of care as
increased clinical volume is associated with improvements in both
(Birkmeyer et al, 2002, Harmon et al, 1999, Begg et al, 1998). Of
course such policy change would require the three military services to
- 89 -
contract out most of the care that is currently performed at the clinics
and small hospitals. The cost of contracting out healthcare provisions
for active duty members at military bases where clinics and small
hospitals used to be must be weighed against the benefits (and costs –
medical centers would likely need to grow in order to handle the
additional physicians) of increased practice opportunities and
retention. Additionally, this policy assumes that it is possible to
“scale up” existing medical centers or replicate them in other areas of
the country.
Increasing the number of physicians located at medical centers
would also increase the number of military residents that the military
could handle as most military residencies take place at one of the
medical centers. The results of the duration analysis suggest that
increase the percent of military residency trained physicians has a
positive effect on active duty duration and it could be possible that
such training is more cost-effective. Again the costs and benefits
would need to be evaluated.
Based on the findings of this dissertation, it appears that
increasing deployment episode lengths at all for physicians during the
initial service obligation period who were deployed decrease the mean
expected duration for physicians. Yet increasing the deployment episode
lengths for physician who have already completed the initial service
obligation has no noticeable negative effect on physician retention.
Therefore it might be desirable to deploy physicians who have already
completed the initial service obligation for longer periods of time to
increase effectiveness and troop familiarity with a unit’s physicians.
Policy makers should be cautious, though, as there are few physicians in
the data who experience multiple long deployments. Additionally, there
is likely some selection in those who remain past the initial service
obligation. These physicians likely have a stronger “taste” for
military service, but this might not be enough to overcome the
additional burden of being deployed more than their “fair share.” It is
entirely possible that these physicians sought out such opportunities
and basing policy on the actions of these potential outliers could be
detrimental.
- 90 - FUTURE RESEARCH
While the results of this dissertation show there is a correlation
between facility type and active duty duration, it does not definitively
show that increased practice opportunities lead to increased active duty
duration. There could be other factors about medical centers such as
location or management style that are causing the increased retention.
To further investigate this correlation, more precise measures of
practice opportunities such as RVUs/encounter or CPT codes for
procedures and diagnoses performed are needed. If these measures for
practice opportunity provided results that reinforce this initial
analysis, it would further strengthen the hypothesis that increased
practice opportunities suggest increased active duty duration for
military physicians.
Even with improved practice opportunity measures, it is necessary
to examine the feasibility of increasing practice opportunities for
physicians. This dissertation points to increasing the number of
physicians assigned to military medical centers, but it might be more
cost-effective to assign military physicians to civilian medical
centers. Policy makers need to evaluate the implications of “scaling up”
or building additional military medical centers and compare these to the
benefits of placing military physicians in civilian medical centers.
Eibner (2008) points out that this type of arrangement is beneficial to
most medical personnel, but has drawback for some of the enlisted
medical techs as they might be more difficult to place in civilian
facilities. The AFMS already runs such a program on a short-term basis
designed to enhance physicians’ skills immediately prior to deployment.
Presumably, it would be possible to look at the practice opportunities
these physicians see during their short time in this program and compare
them to the opportunities available at military medical centers
(comparing RVUs/encounter would be a good place to start). Such a
comparison would provide a quick look at where the practice
opportunities exist.
Military physicians ultimately exist to provide wartime care to
wounded military members. Fulfilling this role likely provides
physicians with a sense of pride along with additional practice
opportunities. Using data that captures practice opportunities

- 91 -
available to physicians while deployed would further allow for the
disentangling of the sense-of-duty effects, the hardship effects, and
the practice opportunity effects that appear to make short duration
deployments beneficial for increased active duty duration.

- 93 -
Appendix
A. REGULAR MILITARY COMPENSATION
Regular Military Compensation is the amount of pre-tax income a military member would have to receive in order to have the same take-home pay he or she receives because of the tax-exempt status of allowances. Each member is paid the appropriate basic pay, which is taxable, allowances, and any specialty pays that the individual is eligible for. The two most frequent allowances that a military member receives are the Basic Assistance for Housing (BAH) allowance and the Basic Assistance for Subsistence (BAS) allowance. Both BAH and BAS are tax-exempt. An individual receives BAH if he or she is living in quarters not furnished by the government (either renting or owning a dwelling place ) and is based on an individuals pay grade and whether or not he or she has dependents. If the individual has dependents (one or more) the BAH rate increases, but does not increase as he or she gains more dependents. Furthermore, BAH is adjusted based on the location where an individual is stationed and based on the local rental market. The military provides BAS as a means of subsidizing a military member’s monthly food cost and BAS does not change if the member gains a dependent as it is intended only to cover the cost of food for the military member. All other military payments are taxable, with some exceptions if the member is performing certain duties – typically being deployed to a combat zone.
In order to compare military compensation to civilian compensation it is necessary to determine the pre-tax value of all military compensation. To do this, I determine the take home earnings for an individual under the military pay scheme from the 2008 pay chartand determine the pre-tax income the military would have to pay the individual to yield his or her current take-home pay (Department of Defense, 2008a). I exclude state income tax and use the average 2008 BAH rate for those holding the pay grade of O-4, which most physicians hold when they reach the end of their initial service obligation.
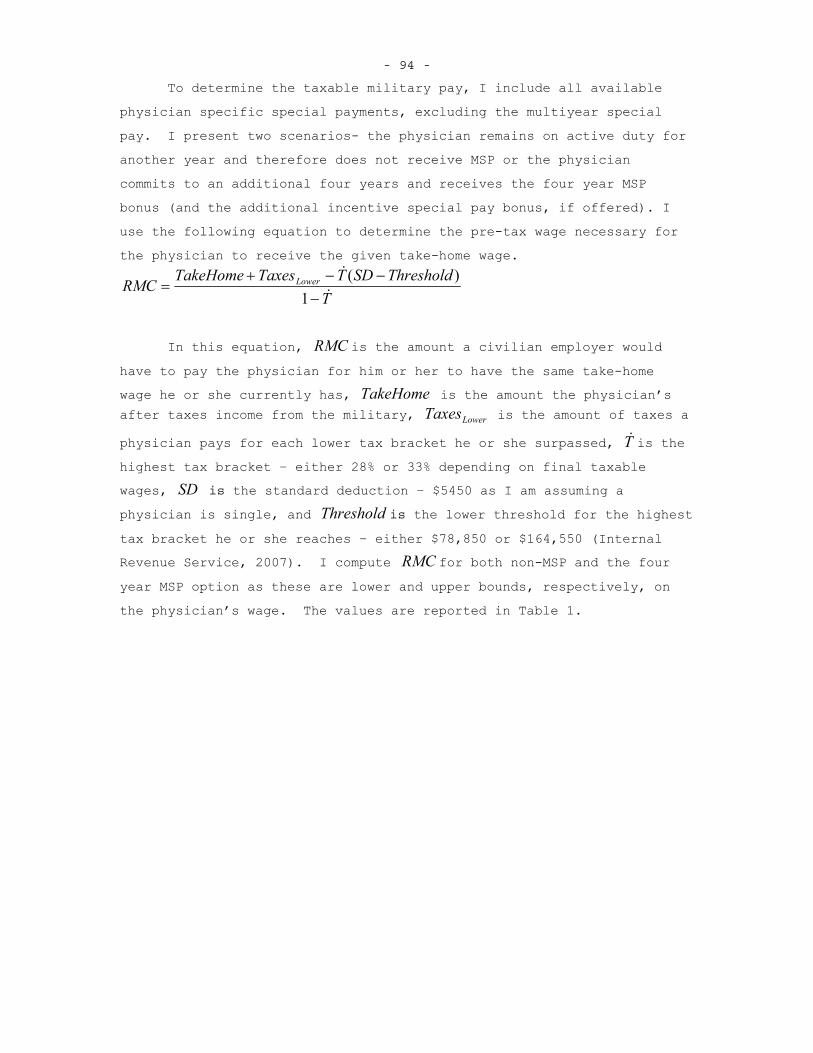
- 94 -
To determine the taxable military pay, I include all available physician specific special payments, excluding the multiyear special pay. I present two scenarios- the physician remains on active duty for another year and therefore does not receive MSP or the physician commits to an additional four years and receives the four year MSP bonus (and the additional incentive special pay bonus, if offered). I use the following equation to determine the pre-tax wage necessary for the physician to receive the given take-home wage.
TThresholdSDTTaxesTakeHomeRMC Lower
1)(
In this equation, RMC is the amount a civilian employer would
have to pay the physician for him or her to have the same take-home wage he or she currently has, TakeHome is the amount the physician’s after taxes income from the military, LowerTaxes is the amount of taxes a
physician pays for each lower tax bracket he or she surpassed, T is the highest tax bracket – either 28% or 33% depending on final taxable wages, SD is the standard deduction – $5450 as I am assuming a physician is single, and Threshold is the lower threshold for the highest tax bracket he or she reaches – either $78,850 or $164,550 (Internal Revenue Service, 2007). I compute RMC for both non-MSP and the four
year MSP option as these are lower and upper bounds, respectively, on the physician’s wage. The values are reported in Table 1.
- 95 - B. DETERMING WHEN A PHYSICIAN IS FULLY QUALIFIED
In order to perform the duration analysis for military physicians, it is necessary to determine when an individual is first “at risk” of leaving the military. While it is true that different accession programs have different initial service commitments, most physicians are required to spend at least three years on active duty once he or she is initially fully qualified, that is completed an internship or residency required for his or her given specialty. The initially fully qualified designator is quite important for two reasons- those who enter from civilian residencies are fully qualified on their first day on active duty whereas those who enter after completing medical school and enter a military residency have at least a year until they are fully qualified; additional training, which changes a physicians specialty, also adds to his or her service obligation so looking at the final specialty for some physicians is the similar to looking at their decisions to stay in the military, which is problematic. Below I outline the framework used to determine a physician’s initial fully qualified specialty and when this occurs.
THE FULLY QUALIFIED ALGORITHM
There are two major factors that determine when a physician is fully qualified- whether or not he or she attended a civilian or military residency and whether or not he or she held multiple specialties during his or her career (or at least appears to in the data).
Those who enter from a civilian residency are assumed to be fully qualified upon entry to active duty and therefore their initial spatiality is what they enter as, assuming they don’t hold another specialty during their career, and the initial fully qualified date is the date they are first on active duty as a physicians. It is sometimes the case that individuals who attend civilian residencies change specialties within the first year of active duty, which is likely do to data entry issues and not actual specialty changes. These individuals are coded as being fully quailed upon entry to active duty,
- 96 -
but are classified as the physician type that requires the greatest amount of training that they are coded as in their first year. For example an individual might initially appear in the personnel data as a general medical officer but changes to an ophthalmologist in his or her fourth month. Because ophthalmology requires 4 years of residency, it is unlikely this individual became an ophthalmologist in only 3 months; therefore I code them as an ophthalmologist. Coding the initial specialty for civilian resident accession as fully qualified is fairly straightforward. It is the coding of military residency attendees that becomes a bit more difficult.
Physicians who attend military residencies are somewhat different than civilian residency attendees in that they do not begin their initial service obligation upon entering active duty. It is not until they have completed post-graduate medical training, at least one year’s worth, that their initial service obligation begins. Those who hold only one specialty are relatively straightforward to code and are.They are fully qualified after completing their associated residency.The American Medical Association publishes the Graduate Medical
Education Directory on a yearly basis and outlines the years of graduate medical education (GME) required for each specialty.
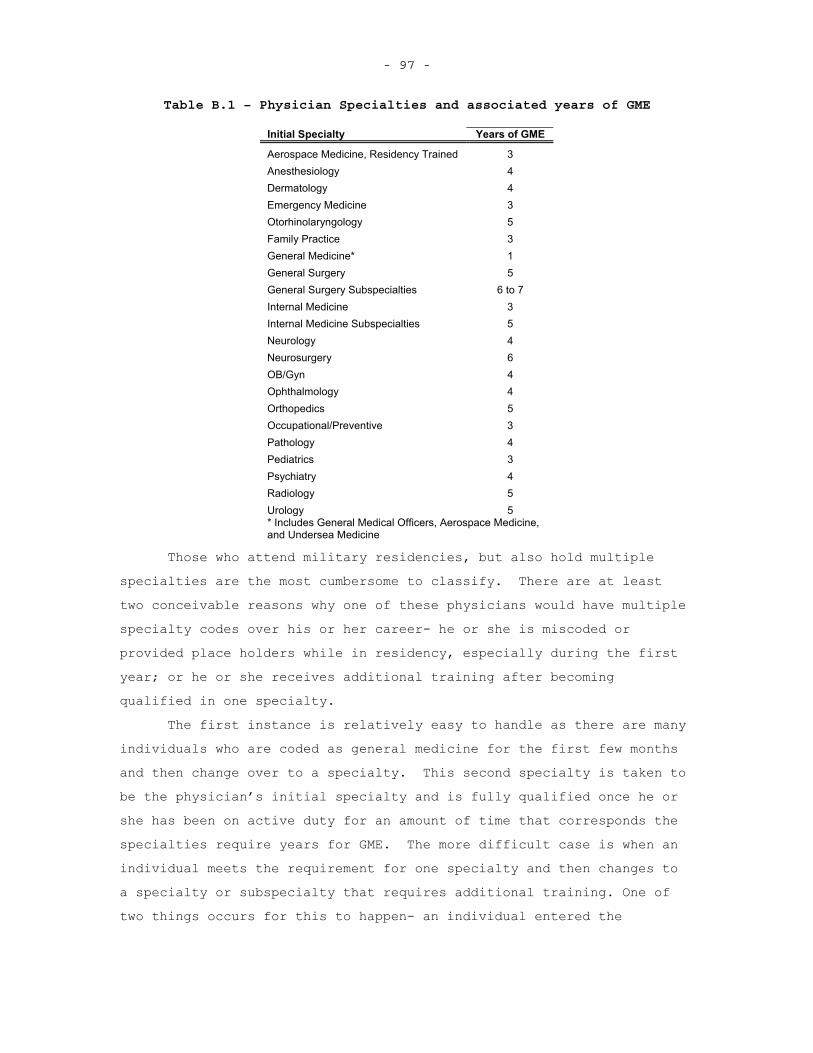
- 97 -
Table B.1 – Physician Specialties and associated years of GME
Initial Specialty Years of GME
Aerospace Medicine, Residency Trained 3 Anesthesiology 4 Dermatology 4 Emergency Medicine 3Otorhinolaryngology 5 Family Practice 3General Medicine* 1General Surgery 5General Surgery Subspecialties 6 to 7 Internal Medicine 3Internal Medicine Subspecialties 5Neurology 4 Neurosurgery 6 OB/Gyn 4 Ophthalmology 4 Orthopedics 5 Occupational/Preventive 3Pathology 4 Pediatrics 3 Psychiatry 4 Radiology 5 Urology 5 * Includes General Medical Officers, Aerospace Medicine, and Undersea Medicine
Those who attend military residencies, but also hold multiple specialties are the most cumbersome to classify. There are at least two conceivable reasons why one of these physicians would have multiple specialty codes over his or her career- he or she is miscoded or provided place holders while in residency, especially during the first year; or he or she receives additional training after becoming qualified in one specialty.
The first instance is relatively easy to handle as there are many individuals who are coded as general medicine for the first few months and then change over to a specialty. This second specialty is taken to be the physician’s initial specialty and is fully qualified once he or she has been on active duty for an amount of time that corresponds the specialties require years for GME. The more difficult case is when an individual meets the requirement for one specialty and then changes to a specialty or subspecialty that requires additional training. One of two things occurs for this to happen- an individual entered the
- 98 -
military residency with the assignment to become a subspecialist or he or she completed a given specialty, practiced for a few years, and decided to pursue a fellowship in the military. In this second instance, and individual not only makes a decision to change specialty, but also to spend more time in the military because of the additional service obligation the comes with additional training. Classifying one of these individuals initially in the subspecialty he or she pursues is misleading and could impose a bias on the hazard ratio estimates for this subspecialty, since the retention and specialty decisions are one in the same. Therefore, if an individual does not hold a subspecialty code prior to the total amount of time it takes to become that particular subspecialty, he or she is coded in the associated specialty. For example, an individual who is coded first as an Interknit and then as a Gastroenterologist would have to be coded as a Gastroenterologist prior to 5 years of active duty service – the time it takes to become a Gastroenterologist. Otherwise this individual is coded an Internist.
While this algorithm is not perfect and will likely misclassify some physicians, it is preferred to using the final specialty of a physician as this is more clearly an endogenous regressor closely associated with the active duty duration for many physicians.
- 99 - C. ADDITIONAL PHYSICIAN SPECIALTY TRANSITION TABLES
This Appendix contains additional physician specialty charts, broken down by service and military and civilian residencies. These charts further illustrate differences between those physicians who attend military and civilian residencies and how the transition from initial specialty to final specialty.
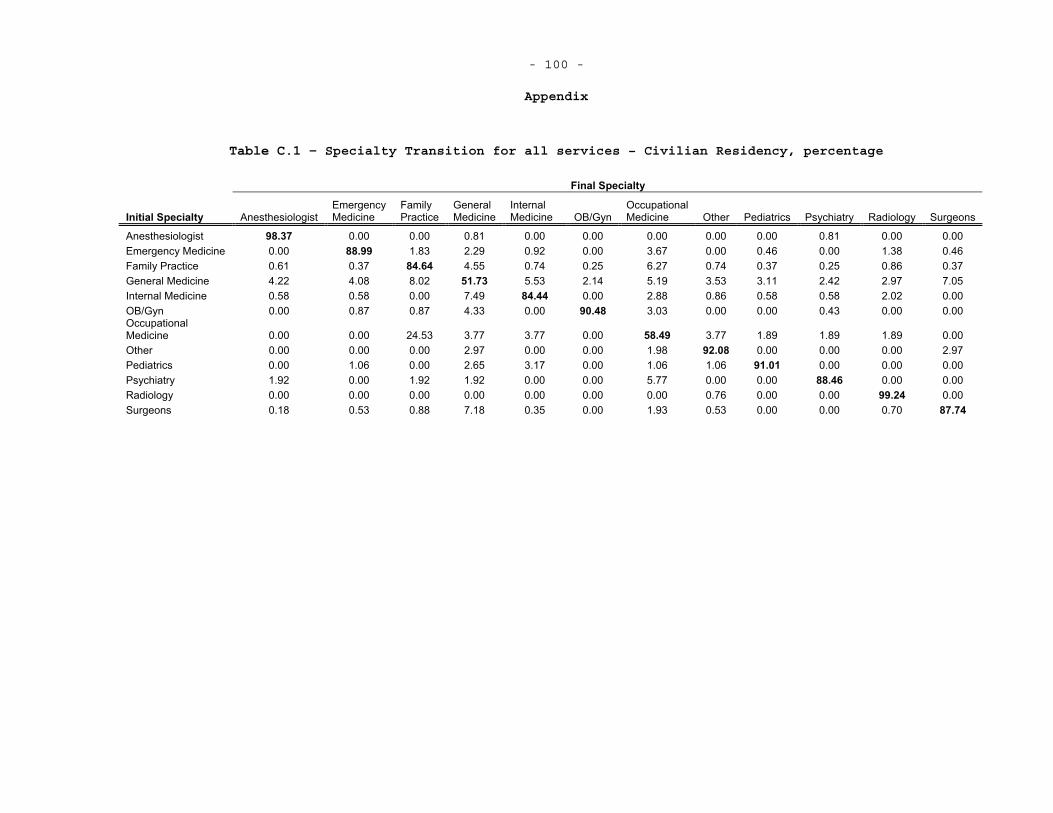
- 100 -
Appendix
Table C.1 – Specialty Transition for all services – Civilian Residency, percentage
Final Specialty
Initial Specialty Anesthesiologist Emergency Medicine
Family Practice
General Medicine
InternalMedicine OB/Gyn
OccupationalMedicine Other Pediatrics Psychiatry Radiology Surgeons
Anesthesiologist 98.37 0.00 0.00 0.81 0.00 0.00 0.00 0.00 0.00 0.81 0.00 0.00 Emergency Medicine 0.00 88.99 1.83 2.29 0.92 0.00 3.67 0.00 0.46 0.00 1.38 0.46 Family Practice 0.61 0.37 84.64 4.55 0.74 0.25 6.27 0.74 0.37 0.25 0.86 0.37 General Medicine 4.22 4.08 8.02 51.73 5.53 2.14 5.19 3.53 3.11 2.42 2.97 7.05 Internal Medicine 0.58 0.58 0.00 7.49 84.44 0.00 2.88 0.86 0.58 0.58 2.02 0.00 OB/Gyn 0.00 0.87 0.87 4.33 0.00 90.48 3.03 0.00 0.00 0.43 0.00 0.00 OccupationalMedicine 0.00 0.00 24.53 3.77 3.77 0.00 58.49 3.77 1.89 1.89 1.89 0.00 Other 0.00 0.00 0.00 2.97 0.00 0.00 1.98 92.08 0.00 0.00 0.00 2.97 Pediatrics 0.00 1.06 0.00 2.65 3.17 0.00 1.06 1.06 91.01 0.00 0.00 0.00 Psychiatry 1.92 0.00 1.92 1.92 0.00 0.00 5.77 0.00 0.00 88.46 0.00 0.00 Radiology 0.00 0.00 0.00 0.00 0.00 0.00 0.00 0.76 0.00 0.00 99.24 0.00Surgeons 0.18 0.53 0.88 7.18 0.35 0.00 1.93 0.53 0.00 0.00 0.70 87.74
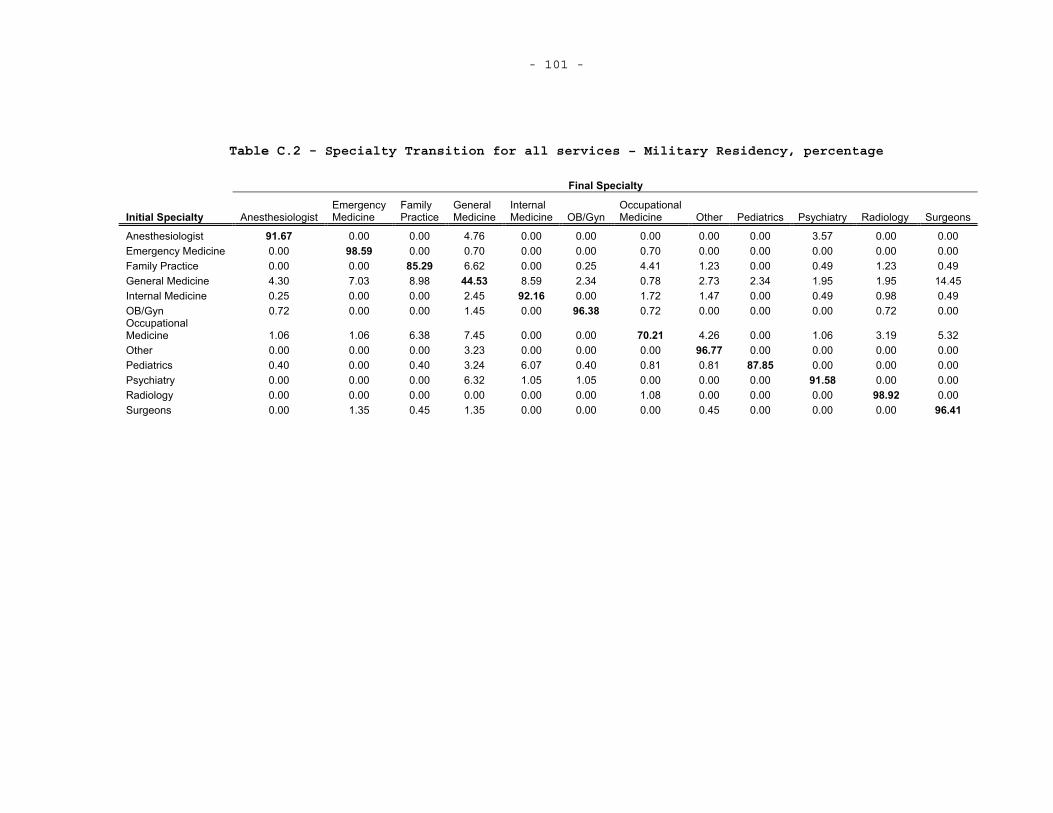
- 101 -
Table C.2 - Specialty Transition for all services – Military Residency, percentage
Final Specialty
Initial Specialty Anesthesiologist Emergency Medicine
Family Practice
General Medicine
InternalMedicine OB/Gyn
OccupationalMedicine Other Pediatrics Psychiatry Radiology Surgeons
Anesthesiologist 91.67 0.00 0.00 4.76 0.00 0.00 0.00 0.00 0.00 3.57 0.00 0.00 Emergency Medicine 0.00 98.59 0.00 0.70 0.00 0.00 0.70 0.00 0.00 0.00 0.00 0.00 Family Practice 0.00 0.00 85.29 6.62 0.00 0.25 4.41 1.23 0.00 0.49 1.23 0.49 General Medicine 4.30 7.03 8.98 44.53 8.59 2.34 0.78 2.73 2.34 1.95 1.95 14.45 Internal Medicine 0.25 0.00 0.00 2.45 92.16 0.00 1.72 1.47 0.00 0.49 0.98 0.49 OB/Gyn 0.72 0.00 0.00 1.45 0.00 96.38 0.72 0.00 0.00 0.00 0.72 0.00 OccupationalMedicine 1.06 1.06 6.38 7.45 0.00 0.00 70.21 4.26 0.00 1.06 3.19 5.32 Other 0.00 0.00 0.00 3.23 0.00 0.00 0.00 96.77 0.00 0.00 0.00 0.00 Pediatrics 0.40 0.00 0.40 3.24 6.07 0.40 0.81 0.81 87.85 0.00 0.00 0.00 Psychiatry 0.00 0.00 0.00 6.32 1.05 1.05 0.00 0.00 0.00 91.58 0.00 0.00 Radiology 0.00 0.00 0.00 0.00 0.00 0.00 1.08 0.00 0.00 0.00 98.92 0.00Surgeons 0.00 1.35 0.45 1.35 0.00 0.00 0.00 0.45 0.00 0.00 0.00 96.41
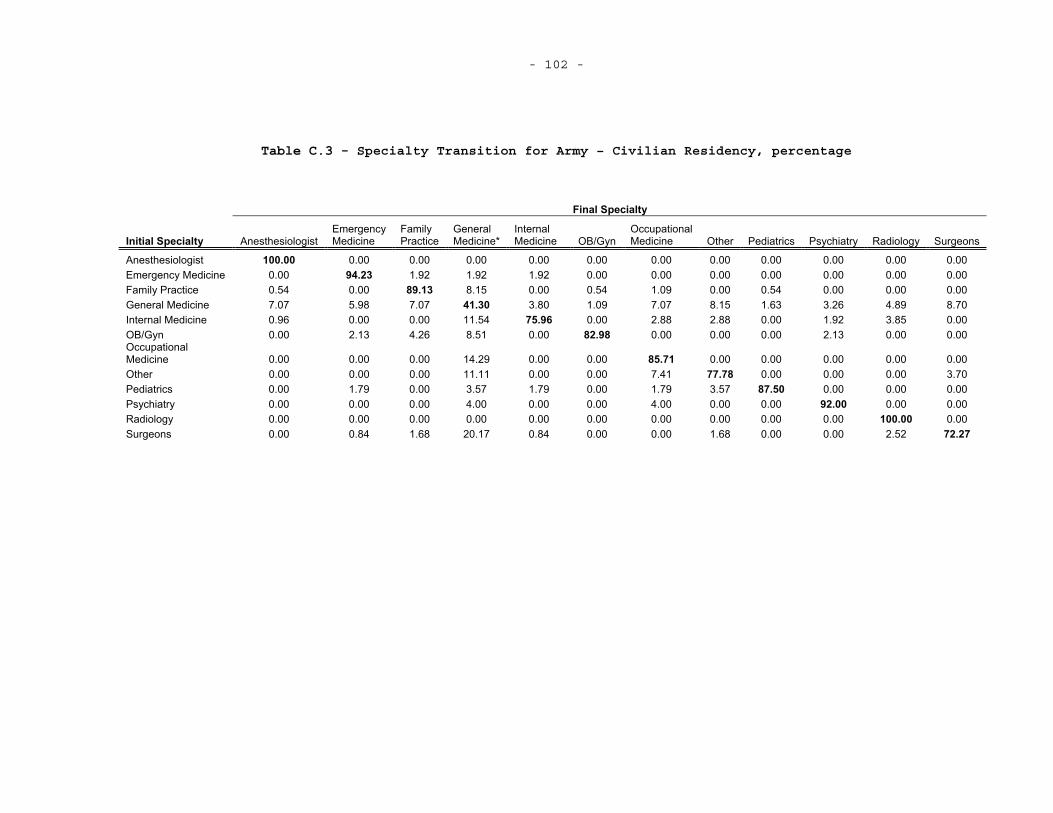
- 102 -
Table C.3 - Specialty Transition for Army – Civilian Residency, percentage
Final Specialty
Initial Specialty Anesthesiologist Emergency Medicine
Family Practice
General Medicine*
InternalMedicine OB/Gyn
OccupationalMedicine Other Pediatrics Psychiatry Radiology Surgeons
Anesthesiologist 100.00 0.00 0.00 0.00 0.00 0.00 0.00 0.00 0.00 0.00 0.00 0.00 Emergency Medicine 0.00 94.23 1.92 1.92 1.92 0.00 0.00 0.00 0.00 0.00 0.00 0.00 Family Practice 0.54 0.00 89.13 8.15 0.00 0.54 1.09 0.00 0.54 0.00 0.00 0.00 General Medicine 7.07 5.98 7.07 41.30 3.80 1.09 7.07 8.15 1.63 3.26 4.89 8.70 Internal Medicine 0.96 0.00 0.00 11.54 75.96 0.00 2.88 2.88 0.00 1.92 3.85 0.00 OB/Gyn 0.00 2.13 4.26 8.51 0.00 82.98 0.00 0.00 0.00 2.13 0.00 0.00 OccupationalMedicine 0.00 0.00 0.00 14.29 0.00 0.00 85.71 0.00 0.00 0.00 0.00 0.00 Other 0.00 0.00 0.00 11.11 0.00 0.00 7.41 77.78 0.00 0.00 0.00 3.70 Pediatrics 0.00 1.79 0.00 3.57 1.79 0.00 1.79 3.57 87.50 0.00 0.00 0.00 Psychiatry 0.00 0.00 0.00 4.00 0.00 0.00 4.00 0.00 0.00 92.00 0.00 0.00 Radiology 0.00 0.00 0.00 0.00 0.00 0.00 0.00 0.00 0.00 0.00 100.00 0.00Surgeons 0.00 0.84 1.68 20.17 0.84 0.00 0.00 1.68 0.00 0.00 2.52 72.27

- 103 -
Table C.4 - Specialty Transition for Army – Military Residency, percentage
Final Specialty
Initial Specialty Anesthesiologist Emergency Medicine
Family Practice
General Medicine
InternalMedicine OB/Gyn
OccupationalMedicine Other Pediatrics Psychiatry Radiology Surgeons
Anesthesiologist 100.00 0.00 0.00 0.00 0.60 0.00 0.00 0.00 1.05 0.00 0.00 0.00 Emergency Medicine 0.00 100.00 0.00 7.14 0.00 0.00 0.00 0.00 0.00 0.00 0.00 0.90 Family Practice 0.00 0.00 93.90 3.57 0.00 0.00 2.56 0.00 1.05 0.00 0.00 0.00 General Medicine 0.00 0.00 1.22 75.00 0.00 0.00 7.69 0.00 0.00 0.00 0.00 0.90 Internal Medicine 0.00 0.00 0.00 7.14 94.61 0.00 0.00 0.00 5.26 2.13 0.00 0.00 OB/Gyn 0.00 0.00 0.00 0.00 0.00 100.00 0.00 0.00 0.00 2.13 0.00 0.00 OccupationalMedicine 0.00 0.00 2.44 0.00 1.80 0.00 84.62 0.00 1.05 0.00 0.00 0.00
Other 0.00 0.00 0.00 0.00 1.80 0.00 2.56 100.00 0.00 0.00 0.00 0.00 Pediatrics 0.00 0.00 0.00 0.00 0.00 0.00 0.00 0.00 91.58 0.00 0.00 0.00 Psychiatry 0.00 0.00 0.61 3.57 0.00 0.00 0.00 0.00 0.00 95.74 0.00 0.00 Radiology 0.00 0.00 0.61 0.00 1.20 0.00 0.00 0.00 0.00 0.00 100.00 0.00Surgeons 0.00 0.00 1.22 3.57 0.00 0.00 2.56 0.00 0.00 0.00 0.00 98.20

- 104 -
Table C.5 - Specialty Transition for Air Force – Civilian Residency, percentage
Final Specialty
Initial Specialty Anesthesiologist Emergency Medicine
Family Practice
General Medicine*
InternalMedicine OB/Gyn
OccupationalMedicine Other Pediatrics Psychiatry Radiology Surgeons
Anesthesiologist 100.00 0.00 0.00 0.00 0.00 0.00 0.00 0.00 0.00 0.00 0.00 0.00 Emergency Medicine 0.00 85.31 2.10 2.80 0.70 0.00 5.59 0.00 0.70 0.00 2.10 0.70 Family Practice 0.59 0.59 81.10 3.94 1.18 0.00 9.25 1.18 0.39 0.20 0.98 0.59 General Medicine 2.07 4.13 7.85 47.93 3.72 0.83 17.77 3.31 2.07 1.24 2.89 6.20 Internal Medicine 0.49 0.49 0.00 6.86 87.25 0.00 2.94 0.00 0.49 0.00 1.47 0.00 OB/Gyn 0.00 0.83 0.00 4.13 0.00 90.91 4.13 0.00 0.00 0.00 0.00 0.00 OccupationalMedicine 0.00 0.00 29.55 2.27 4.55 0.00 54.55 4.55 2.27 2.27 0.00 0.00 Other 0.00 0.00 0.00 0.00 0.00 0.00 0.00 97.06 0.00 0.00 0.00 2.94 Pediatrics 0.00 0.95 0.00 2.86 4.76 0.00 0.95 0.00 90.48 0.00 0.00 0.00 Psychiatry 0.00 0.00 5.26 0.00 0.00 0.00 10.53 0.00 0.00 84.21 0.00 0.00 Radiology 0.00 0.00 0.00 0.00 0.00 0.00 0.00 0.00 0.00 0.00 100.00 0.00Surgeons 0.29 0.59 0.88 4.72 0.29 0.00 3.24 0.29 0.00 0.00 0.29 89.38

- 105 -
Table C.6 - Specialty Transition for Air Force – Military Residency, percentage
Final Specialty
Initial Specialty Anesthesiologist Emergency Medicine
Family Practice
General Medicine
InternalMedicine OB/Gyn
OccupationalMedicine Other Pediatrics Psychiatry Radiology Surgeons
Anesthesiologist 100.00 0.00 0.00 0.00 0.00 0.00 0.00 0.00 0.00 0.00 0.00 0.00 Emergency Medicine 0.00 96.67 0.00 0.00 0.00 0.00 3.33 0.00 0.00 0.00 0.00 0.00 Family Practice 0.00 0.00 81.46 5.30 0.00 0.00 7.95 2.65 0.00 0.00 2.65 0.00 General Medicine 4.35 4.35 8.70 65.22 4.35 0.00 0.00 4.35 0.00 0.00 0.00 8.70 Internal Medicine 0.00 0.00 0.00 1.25 93.75 0.00 1.25 1.88 0.00 0.62 0.62 0.62 OB/Gyn 2.04 0.00 0.00 0.00 0.00 93.88 2.04 0.00 0.00 0.00 2.04 0.00 OccupationalMedicine 3.23 3.23 12.90 6.45 0.00 0.00 54.84 3.23 0.00 0.00 3.23 12.90 Other 0.00 0.00 0.00 0.00 0.00 0.00 0.00 100.00 0.00 0.00 0.00 0.00 Pediatrics 0.00 0.00 0.00 0.00 7.00 0.00 1.00 2.00 90.00 0.00 0.00 0.00 Psychiatry 0.00 0.00 0.00 0.00 0.00 0.00 0.00 0.00 0.00 100.00 0.00 0.00 Radiology 0.00 0.00 0.00 0.00 0.00 0.00 0.00 0.00 0.00 0.00 100.00 0.00Surgeons 0.00 3.64 1.82 0.00 0.00 0.00 0.00 1.82 0.00 0.00 0.00 92.73
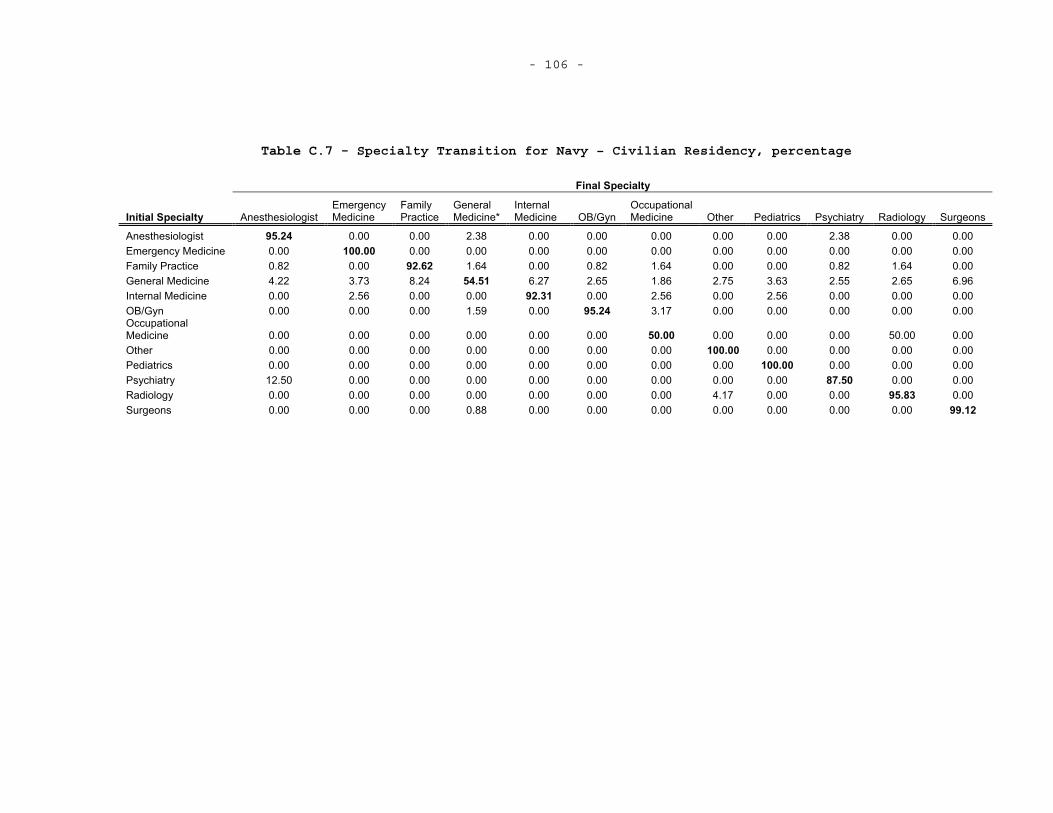
- 106 -
Table C.7 - Specialty Transition for Navy – Civilian Residency, percentage
Final Specialty
Initial Specialty Anesthesiologist Emergency Medicine
Family Practice
General Medicine*
InternalMedicine OB/Gyn
OccupationalMedicine Other Pediatrics Psychiatry Radiology Surgeons
Anesthesiologist 95.24 0.00 0.00 2.38 0.00 0.00 0.00 0.00 0.00 2.38 0.00 0.00 Emergency Medicine 0.00 100.00 0.00 0.00 0.00 0.00 0.00 0.00 0.00 0.00 0.00 0.00 Family Practice 0.82 0.00 92.62 1.64 0.00 0.82 1.64 0.00 0.00 0.82 1.64 0.00 General Medicine 4.22 3.73 8.24 54.51 6.27 2.65 1.86 2.75 3.63 2.55 2.65 6.96 Internal Medicine 0.00 2.56 0.00 0.00 92.31 0.00 2.56 0.00 2.56 0.00 0.00 0.00 OB/Gyn 0.00 0.00 0.00 1.59 0.00 95.24 3.17 0.00 0.00 0.00 0.00 0.00 OccupationalMedicine 0.00 0.00 0.00 0.00 0.00 0.00 50.00 0.00 0.00 0.00 50.00 0.00 Other 0.00 0.00 0.00 0.00 0.00 0.00 0.00 100.00 0.00 0.00 0.00 0.00 Pediatrics 0.00 0.00 0.00 0.00 0.00 0.00 0.00 0.00 100.00 0.00 0.00 0.00 Psychiatry 12.50 0.00 0.00 0.00 0.00 0.00 0.00 0.00 0.00 87.50 0.00 0.00 Radiology 0.00 0.00 0.00 0.00 0.00 0.00 0.00 4.17 0.00 0.00 95.83 0.00Surgeons 0.00 0.00 0.00 0.88 0.00 0.00 0.00 0.00 0.00 0.00 0.00 99.12

- 107 -
Table C.8 - Specialty Transition for Navy – Military Residency, percentage
Final Specialty
Initial Specialty Anesthesiologist Emergency Medicine
Family Practice
General Medicine
InternalMedicine OB/Gyn
OccupationalMedicine Other Pediatrics Psychiatry Radiology Surgeons
Anesthesiologist 80.00 0.00 0.00 11.43 0.00 0.00 0.00 0.00 0.00 8.57 0.00 0.00 Emergency Medicine 0.00 96.43 0.00 3.57 0.00 0.00 0.00 0.00 0.00 0.00 0.00 0.00 Family Practice 0.00 0.00 76.34 18.28 0.00 1.08 2.15 1.08 0.00 1.08 0.00 0.00 General Medicine 4.88 7.32 9.76 38.05 9.27 2.93 0.98 2.93 2.93 1.95 2.44 16.59 Internal Medicine 0.00 0.00 0.00 9.88 83.95 0.00 2.47 0.00 0.00 1.23 1.23 1.23 OB/Gyn 0.00 0.00 0.00 5.56 0.00 94.44 0.00 0.00 0.00 0.00 0.00 0.00 OccupationalMedicine 0.00 0.00 4.17 8.33 0.00 0.00 66.67 8.33 0.00 4.17 8.33 0.00 Other 0.00 0.00 0.00 12.50 0.00 0.00 0.00 87.50 0.00 0.00 0.00 0.00 Pediatrics 0.00 0.00 0.00 15.38 5.77 1.92 0.00 0.00 76.92 0.00 0.00 0.00 Psychiatry 0.00 0.00 0.00 33.33 0.00 0.00 0.00 0.00 0.00 66.67 0.00 0.00 Radiology 0.00 0.00 0.00 0.00 0.00 0.00 3.70 0.00 0.00 0.00 96.30 0.00Surgeons 0.00 0.00 0.00 3.51 0.00 0.00 0.00 0.00 0.00 0.00 0.00 96.49

- 108 -

- 109 - D. ADDITIONAL SURVIVAL CURVES FOR EACH SPECIALTY
This appendix presents additional survival curves. These curves
are for specific specialties which are divided into those physicians who
attend military or civilian residencies. Each set of survival curves is
presented for comparison of durations across services.
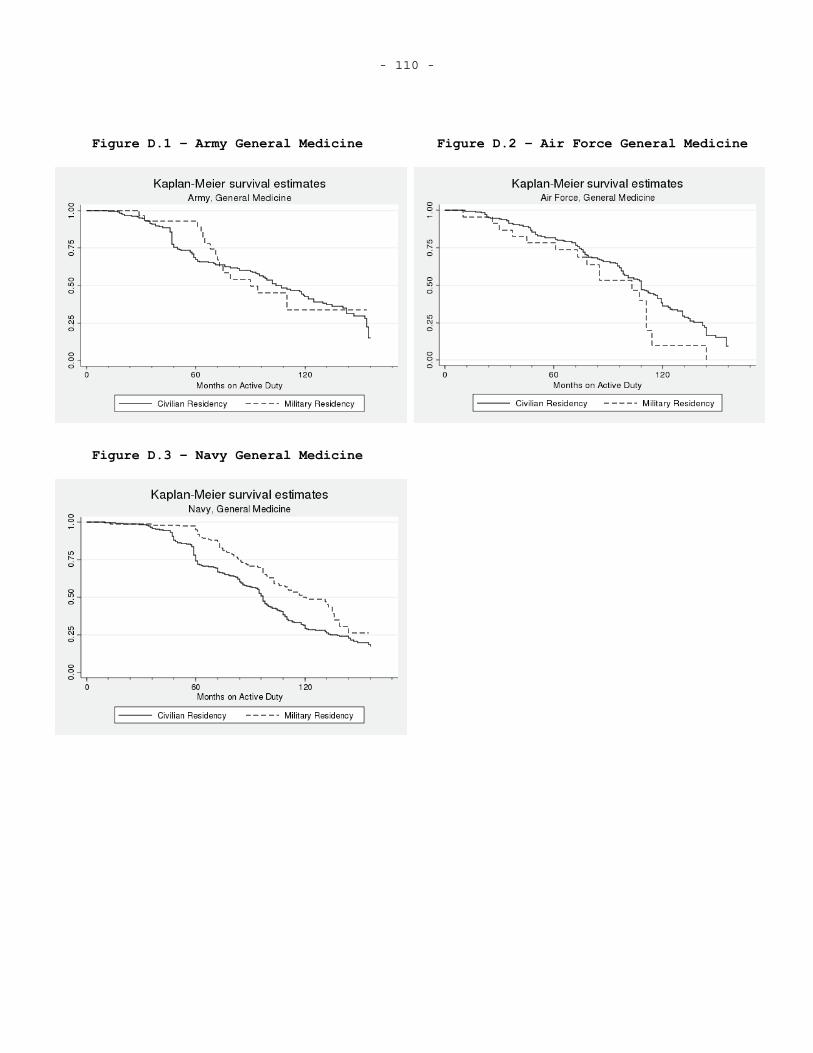
- 110 -
Figure D.1 – Army General Medicine Figure D.2 – Air Force General Medicine
Figure D.3 – Navy General Medicine
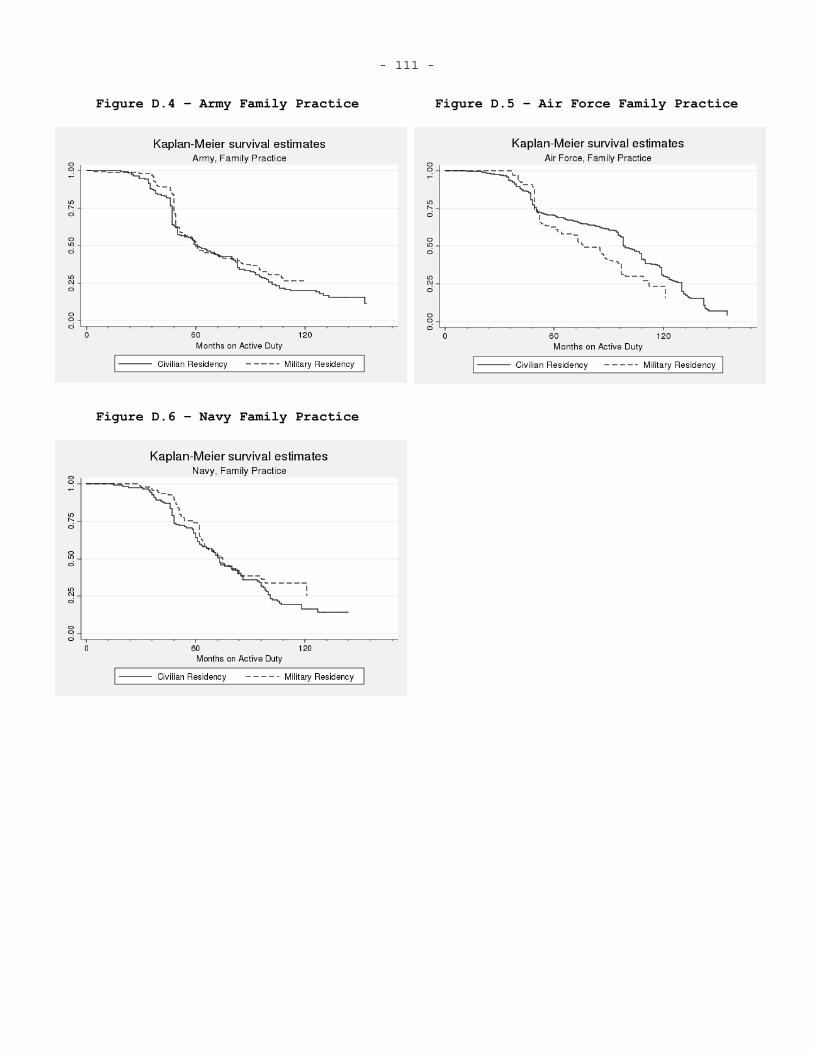
- 111 -
Figure D.4 – Army Family Practice Figure D.5 – Air Force Family Practice
Figure D.6 – Navy Family Practice
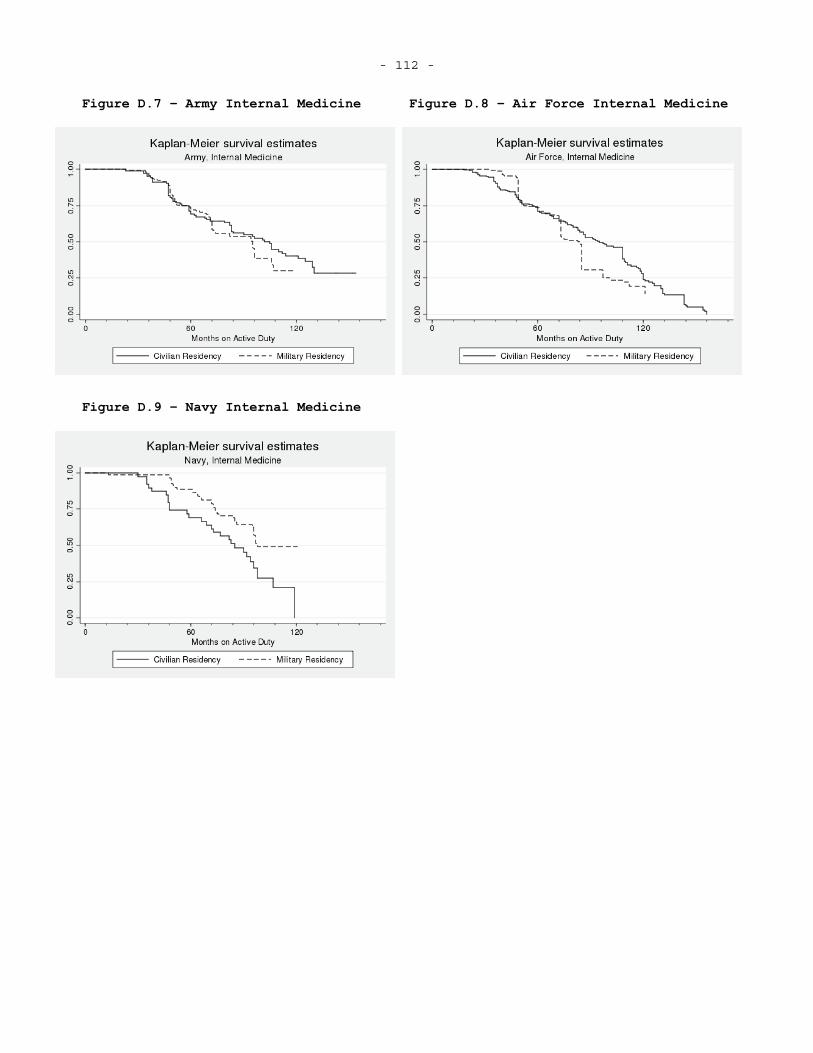
- 112 -
Figure D.7 – Army Internal Medicine Figure D.8 – Air Force Internal Medicine
Figure D.9 – Navy Internal Medicine
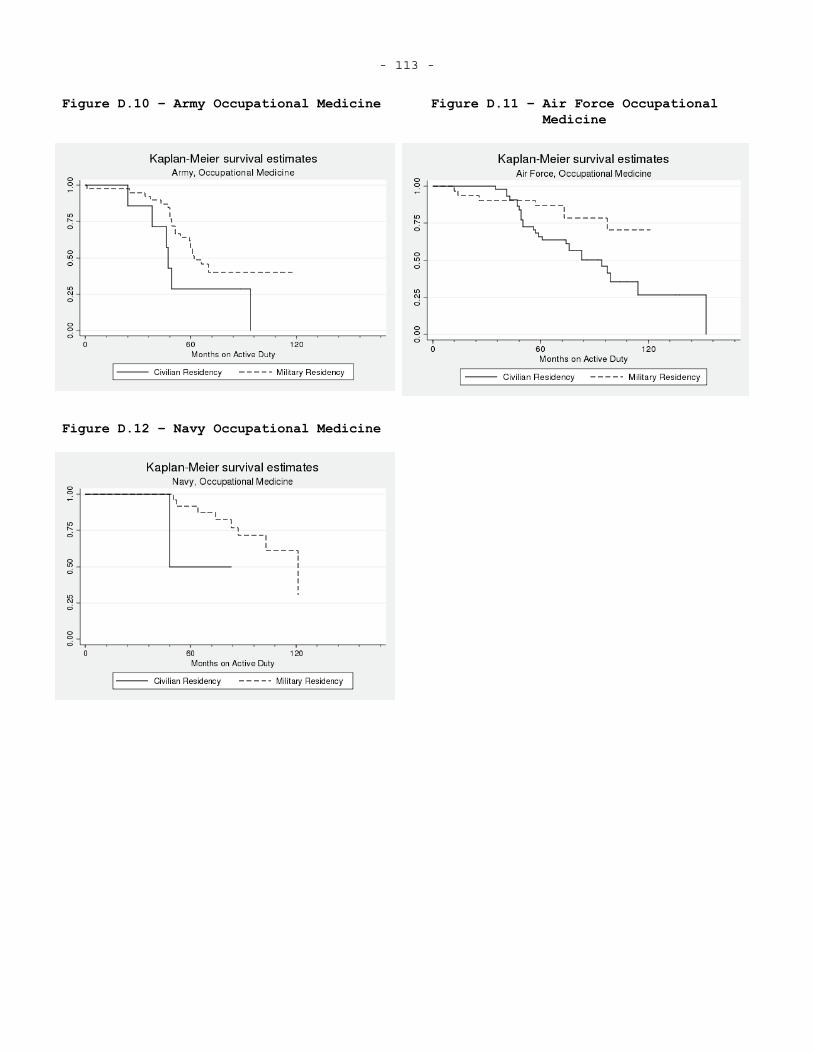
- 113 -
Figure D.10 – Army Occupational Medicine Figure D.11 – Air Force Occupational Medicine
Figure D.12 – Navy Occupational Medicine
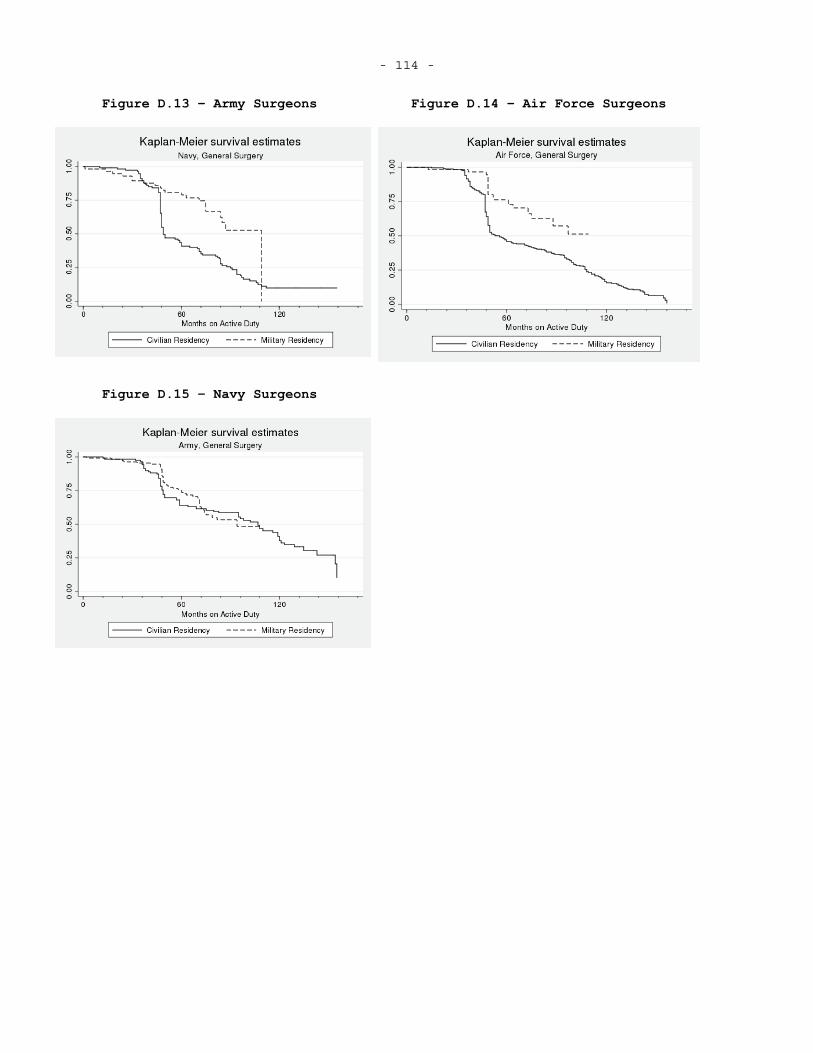
- 114 -
Figure D.13 – Army Surgeons Figure D.14 – Air Force Surgeons
Figure D.15 – Navy Surgeons
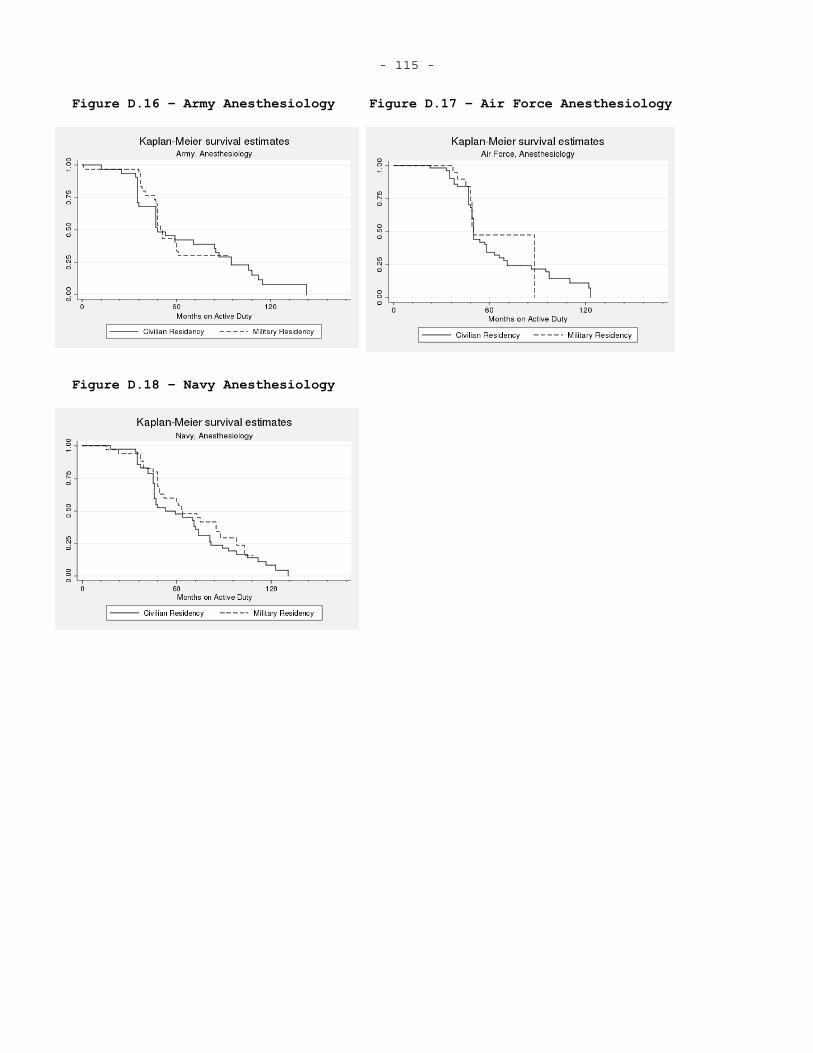
- 115 -
Figure D.16 – Army Anesthesiology Figure D.17 – Air Force Anesthesiology
Figure D.18 – Navy Anesthesiology
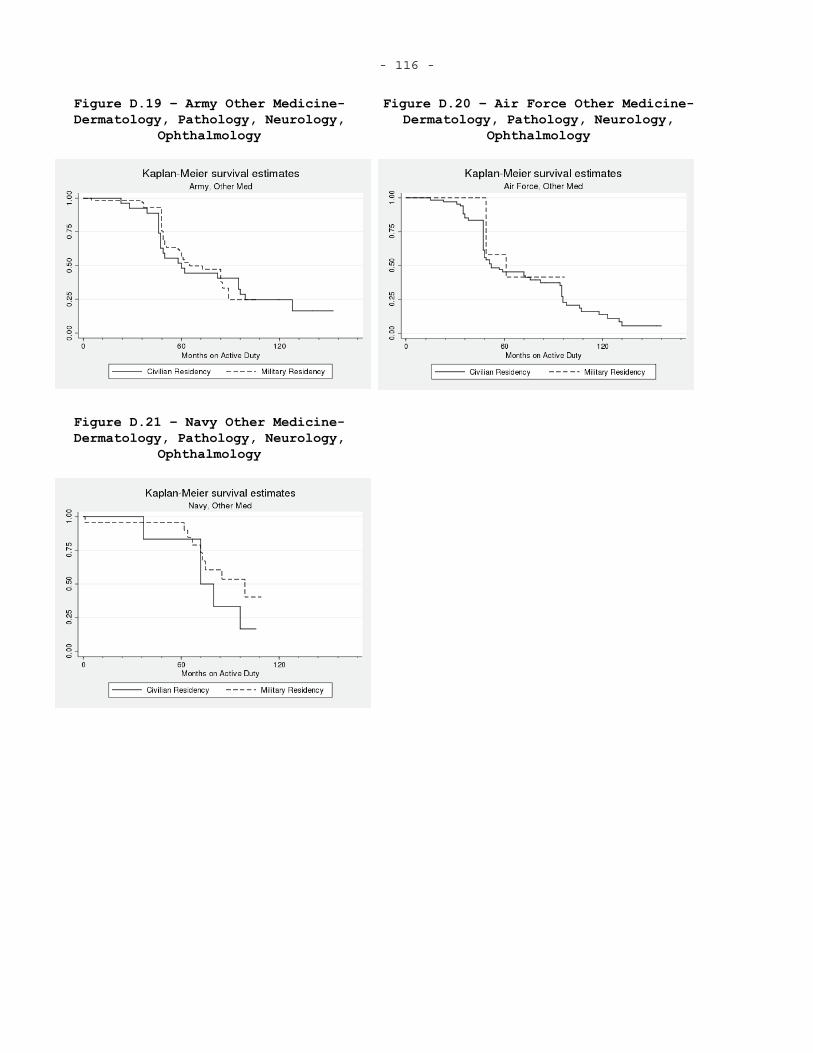
- 116 -
Figure D.19 – Army Other Medicine- Dermatology, Pathology, Neurology,
Ophthalmology
Figure D.20 – Air Force Other Medicine- Dermatology, Pathology, Neurology,
Ophthalmology
Figure D.21 – Navy Other Medicine- Dermatology, Pathology, Neurology,
Ophthalmology
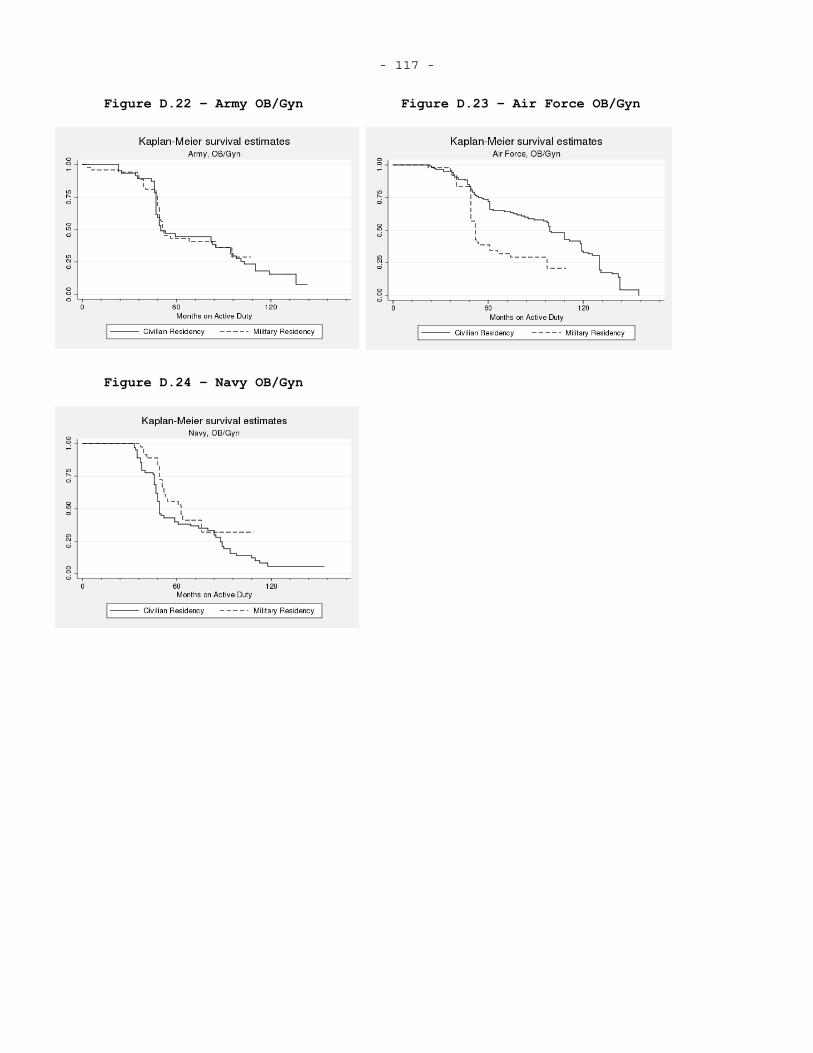
- 117 -
Figure D.22 – Army OB/Gyn Figure D.23 – Air Force OB/Gyn
Figure D.24 – Navy OB/Gyn
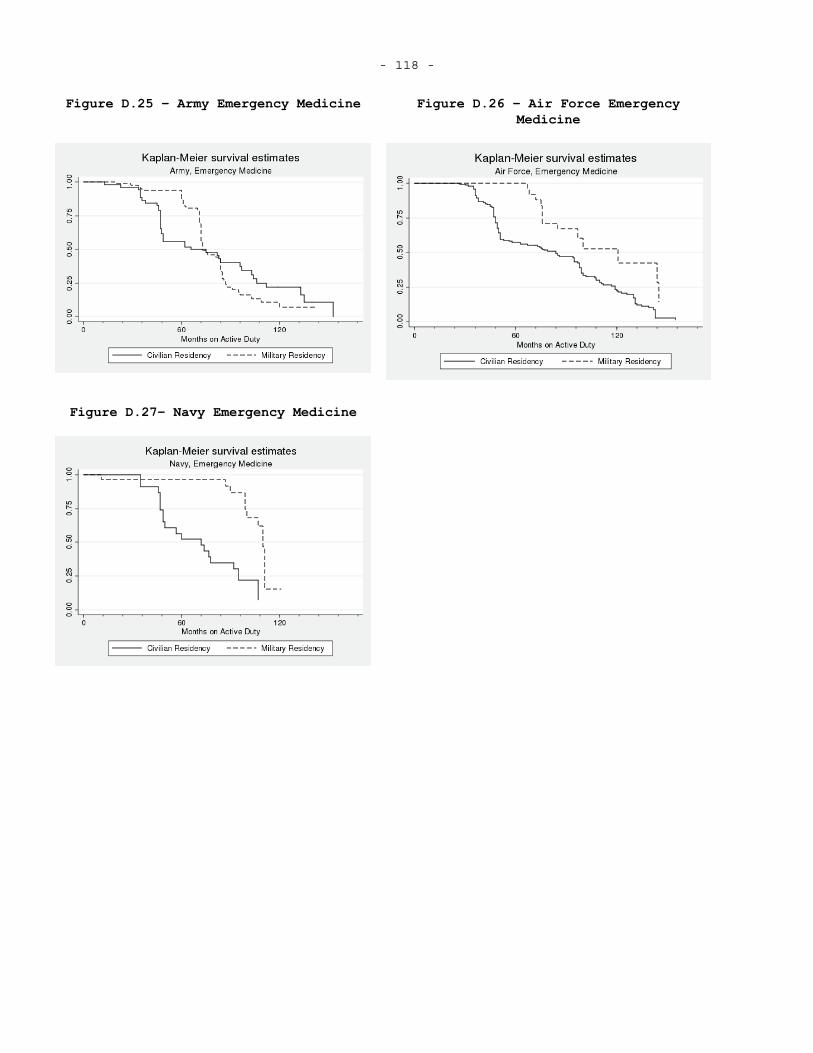
- 118 -
Figure D.25 – Army Emergency Medicine Figure D.26 – Air Force Emergency Medicine
Figure D.27– Navy Emergency Medicine
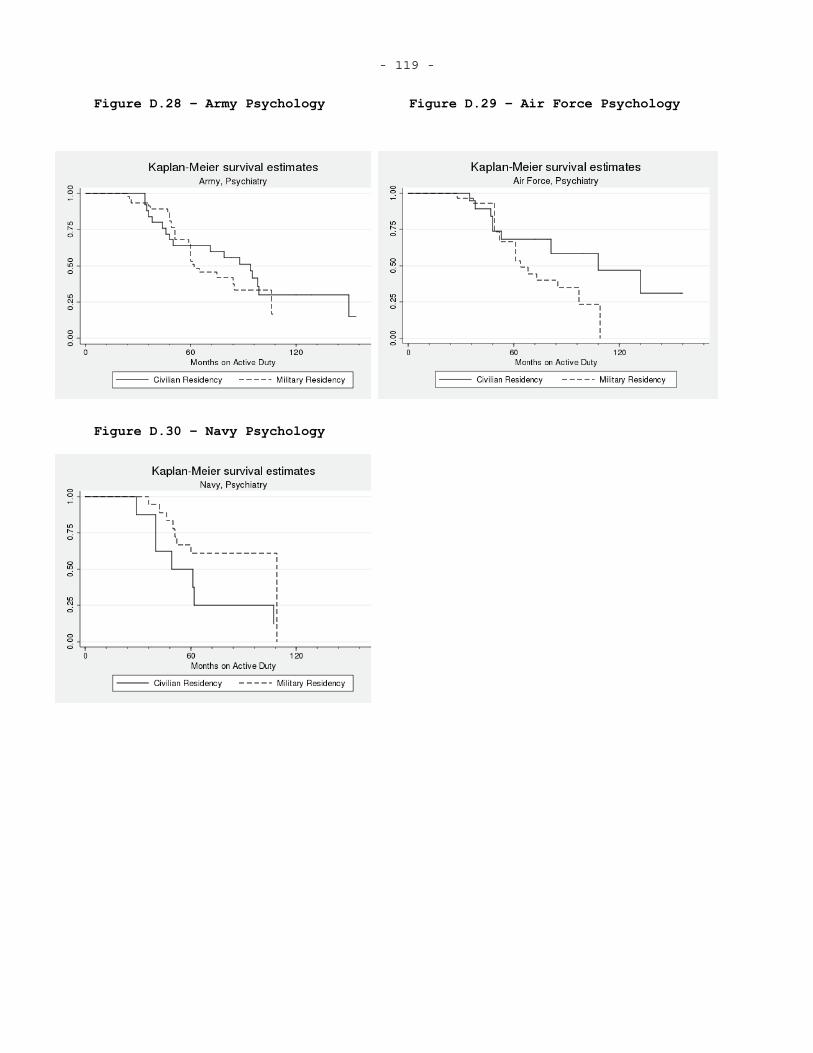
- 119 -
Figure D.28 – Army Psychology Figure D.29 – Air Force Psychology
Figure D.30 – Navy Psychology
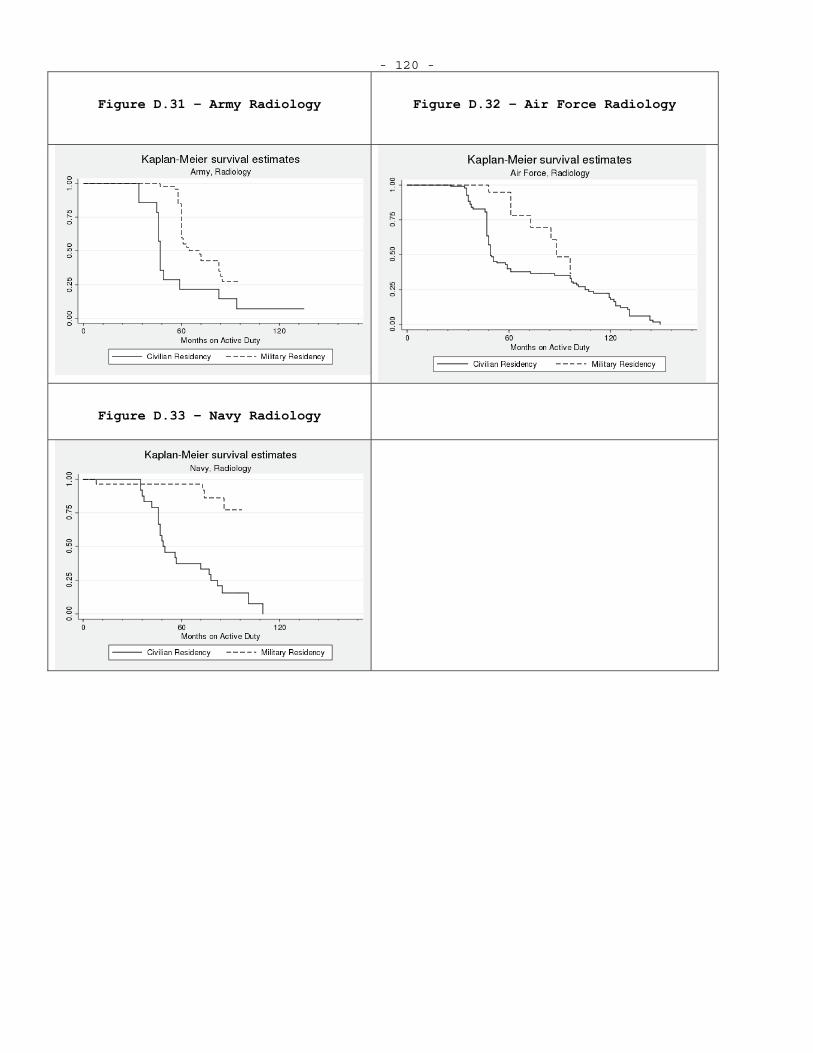
- 120 -
Figure D.31 – Army Radiology Figure D.32 – Air Force Radiology
Figure D.33 – Navy Radiology
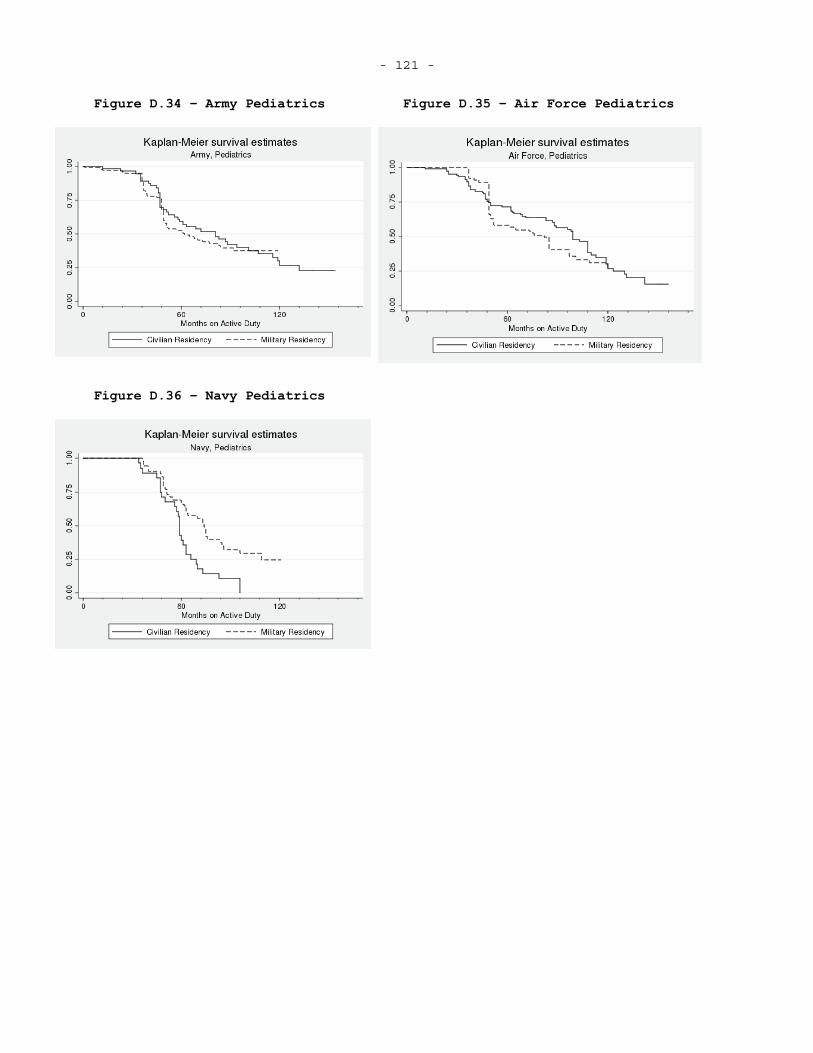
- 121 -
Figure D.34 – Army Pediatrics Figure D.35 – Air Force Pediatrics
Figure D.36 – Navy Pediatrics

- 122 - E. ADDITIONAL DURATION ANALYSIS RESULTS
This appendix contains additional duration analysis regression results with specifications that include service effects, models without frailty, and models with frailty.
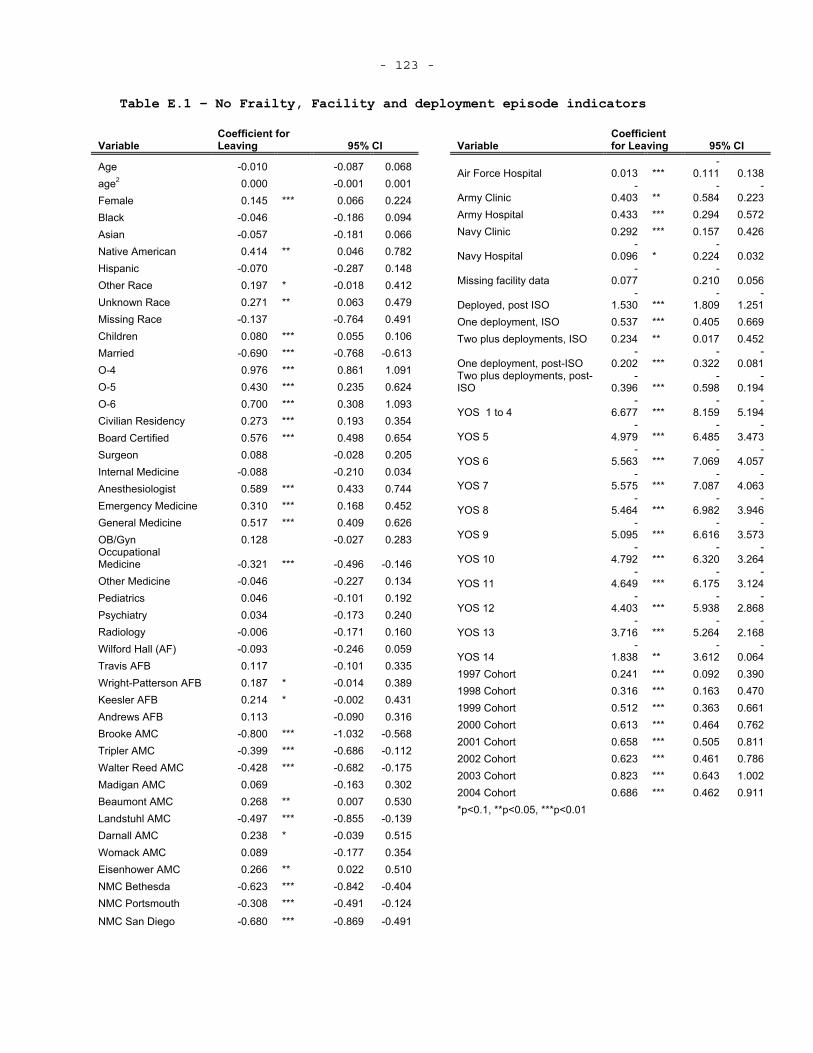
- 123 -
Table E.1 – No Frailty, Facility and deployment episode indicators
VariableCoefficient for Leaving 95% CI
Age -0.010 -0.087 0.068age2 0.000 -0.001 0.001Female 0.145 *** 0.066 0.224Black -0.046 -0.186 0.094Asian -0.057 -0.181 0.066Native American 0.414 ** 0.046 0.782 Hispanic -0.070 -0.287 0.148Other Race 0.197 * -0.018 0.412 Unknown Race 0.271 ** 0.063 0.479 Missing Race -0.137 -0.764 0.491 Children 0.080 *** 0.055 0.106Married -0.690 *** -0.768 -0.613O-4 0.976 *** 0.861 1.091O-5 0.430 *** 0.235 0.624O-6 0.700 *** 0.308 1.093Civilian Residency 0.273 *** 0.193 0.354 Board Certified 0.576 *** 0.498 0.654 Surgeon 0.088 -0.028 0.205Internal Medicine -0.088 -0.210 0.034 Anesthesiologist 0.589 *** 0.433 0.744 Emergency Medicine 0.310 *** 0.168 0.452 General Medicine 0.517 *** 0.409 0.626 OB/Gyn 0.128 -0.027 0.283OccupationalMedicine -0.321 *** -0.496 -0.146Other Medicine -0.046 -0.227 0.134 Pediatrics 0.046 -0.101 0.192Psychiatry 0.034 -0.173 0.240Radiology -0.006 -0.171 0.160Wilford Hall (AF) -0.093 -0.246 0.059 Travis AFB 0.117 -0.101 0.335 Wright-Patterson AFB 0.187 * -0.014 0.389 Keesler AFB 0.214 * -0.002 0.431 Andrews AFB 0.113 -0.090 0.316 Brooke AMC -0.800 *** -1.032 -0.568 Tripler AMC -0.399 *** -0.686 -0.112 Walter Reed AMC -0.428 *** -0.682 -0.175 Madigan AMC 0.069 -0.163 0.302 Beaumont AMC 0.268 ** 0.007 0.530 Landstuhl AMC -0.497 *** -0.855 -0.139 Darnall AMC 0.238 * -0.039 0.515 Womack AMC 0.089 -0.177 0.354 Eisenhower AMC 0.266 ** 0.022 0.510 NMC Bethesda -0.623 *** -0.842 -0.404 NMC Portsmouth -0.308 *** -0.491 -0.124
NMC San Diego -0.680 *** -0.869 -0.491
VariableCoefficient for Leaving 95% CI
Air Force Hospital 0.013 *** -
0.111 0.138
Army Clinic -
0.403 ** -
0.584-
0.223Army Hospital 0.433 *** 0.294 0.572 Navy Clinic 0.292 *** 0.157 0.426
Navy Hospital -
0.096 *-
0.224 0.032
Missing facility data -
0.077-
0.210 0.056
Deployed, post ISO -
1.530 *** -
1.809-
1.251One deployment, ISO 0.537 *** 0.405 0.669 Two plus deployments, ISO 0.234 ** 0.017 0.452
One deployment, post-ISO -
0.202 ***-
0.322-
0.081Two plus deployments, post-ISO
-0.396 ***
-0.598
-0.194
YOS 1 to 4 -
6.677 *** -
8.159-
5.194
YOS 5 -
4.979 ***-
6.485-
3.473
YOS 6 -
5.563 *** -
7.069-
4.057
YOS 7 -
5.575 *** -
7.087-
4.063
YOS 8 -
5.464 ***-
6.982-
3.946
YOS 9 -
5.095 *** -
6.616-
3.573
YOS 10 -
4.792 ***-
6.320-
3.264
YOS 11 -
4.649 *** -
6.175-
3.124
YOS 12 -
4.403 *** -
5.938-
2.868
YOS 13 -
3.716 ***-
5.264-
2.168
YOS 14 -
1.838 ** -
3.612-
0.0641997 Cohort 0.241 *** 0.092 0.390 1998 Cohort 0.316 *** 0.163 0.470 1999 Cohort 0.512 *** 0.363 0.661 2000 Cohort 0.613 *** 0.464 0.762 2001 Cohort 0.658 *** 0.505 0.811 2002 Cohort 0.623 *** 0.461 0.786 2003 Cohort 0.823 *** 0.643 1.002 2004 Cohort 0.686 *** 0.462 0.911 *p<0.1, **p<0.05, ***p<0.01
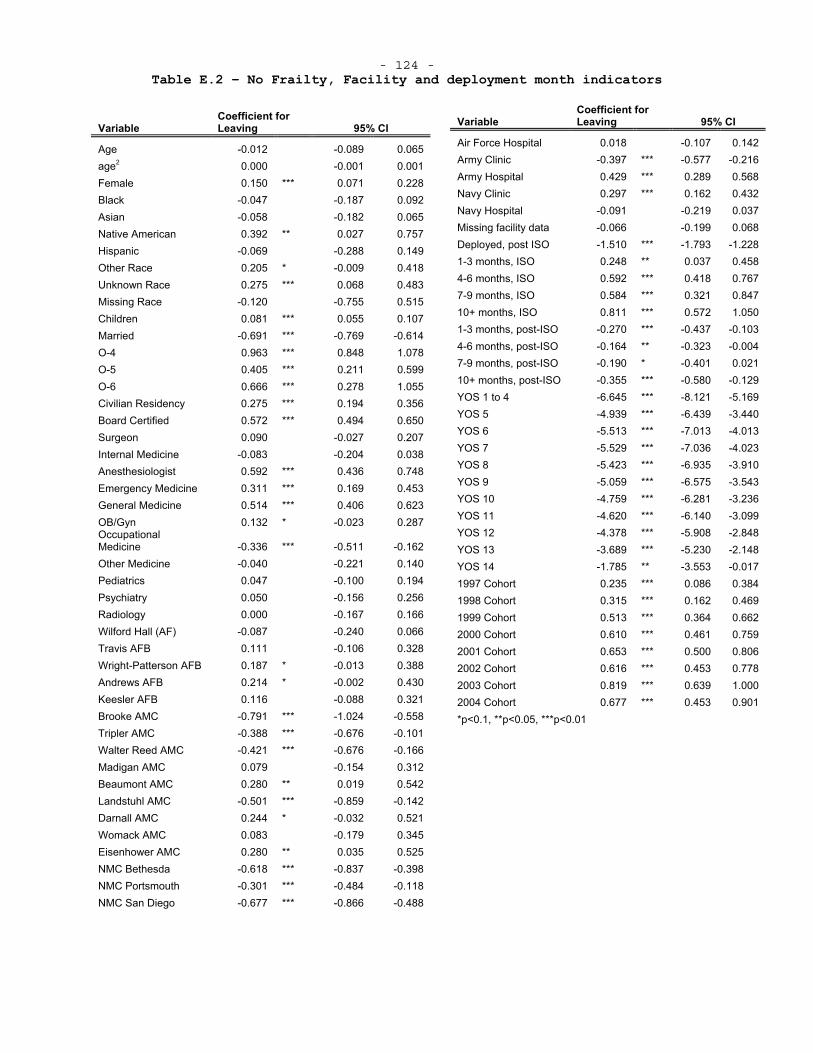
- 124 - Table E.2 – No Frailty, Facility and deployment month indicators
VariableCoefficient for Leaving 95% CI
Age -0.012 -0.089 0.065age2 0.000 -0.001 0.001Female 0.150 *** 0.071 0.228Black -0.047 -0.187 0.092Asian -0.058 -0.182 0.065Native American 0.392 ** 0.027 0.757 Hispanic -0.069 -0.288 0.149Other Race 0.205 * -0.009 0.418 Unknown Race 0.275 *** 0.068 0.483 Missing Race -0.120 -0.755 0.515 Children 0.081 *** 0.055 0.107Married -0.691 *** -0.769 -0.614O-4 0.963 *** 0.848 1.078O-5 0.405 *** 0.211 0.599O-6 0.666 *** 0.278 1.055Civilian Residency 0.275 *** 0.194 0.356 Board Certified 0.572 *** 0.494 0.650 Surgeon 0.090 -0.027 0.207Internal Medicine -0.083 -0.204 0.038 Anesthesiologist 0.592 *** 0.436 0.748 Emergency Medicine 0.311 *** 0.169 0.453 General Medicine 0.514 *** 0.406 0.623 OB/Gyn 0.132 * -0.023 0.287OccupationalMedicine -0.336 *** -0.511 -0.162Other Medicine -0.040 -0.221 0.140 Pediatrics 0.047 -0.100 0.194Psychiatry 0.050 -0.156 0.256Radiology 0.000 -0.167 0.166Wilford Hall (AF) -0.087 -0.240 0.066 Travis AFB 0.111 -0.106 0.328 Wright-Patterson AFB 0.187 * -0.013 0.388 Andrews AFB 0.214 * -0.002 0.430 Keesler AFB 0.116 -0.088 0.321 Brooke AMC -0.791 *** -1.024 -0.558 Tripler AMC -0.388 *** -0.676 -0.101 Walter Reed AMC -0.421 *** -0.676 -0.166 Madigan AMC 0.079 -0.154 0.312 Beaumont AMC 0.280 ** 0.019 0.542 Landstuhl AMC -0.501 *** -0.859 -0.142 Darnall AMC 0.244 * -0.032 0.521 Womack AMC 0.083 -0.179 0.345 Eisenhower AMC 0.280 ** 0.035 0.525 NMC Bethesda -0.618 *** -0.837 -0.398 NMC Portsmouth -0.301 *** -0.484 -0.118 NMC San Diego -0.677 *** -0.866 -0.488
VariableCoefficient for Leaving 95% CI
Air Force Hospital 0.018 -0.107 0.142 Army Clinic -0.397 *** -0.577 -0.216 Army Hospital 0.429 *** 0.289 0.568 Navy Clinic 0.297 *** 0.162 0.432 Navy Hospital -0.091 -0.219 0.037 Missing facility data -0.066 -0.199 0.068 Deployed, post ISO -1.510 *** -1.793 -1.228 1-3 months, ISO 0.248 ** 0.037 0.458 4-6 months, ISO 0.592 *** 0.418 0.767 7-9 months, ISO 0.584 *** 0.321 0.847 10+ months, ISO 0.811 *** 0.572 1.050 1-3 months, post-ISO -0.270 *** -0.437 -0.103 4-6 months, post-ISO -0.164 ** -0.323 -0.004 7-9 months, post-ISO -0.190 * -0.401 0.021 10+ months, post-ISO -0.355 *** -0.580 -0.129 YOS 1 to 4 -6.645 *** -8.121 -5.169 YOS 5 -4.939 *** -6.439 -3.440 YOS 6 -5.513 *** -7.013 -4.013 YOS 7 -5.529 *** -7.036 -4.023 YOS 8 -5.423 *** -6.935 -3.910 YOS 9 -5.059 *** -6.575 -3.543 YOS 10 -4.759 *** -6.281 -3.236 YOS 11 -4.620 *** -6.140 -3.099 YOS 12 -4.378 *** -5.908 -2.848 YOS 13 -3.689 *** -5.230 -2.148 YOS 14 -1.785 ** -3.553 -0.017 1997 Cohort 0.235 *** 0.086 0.384 1998 Cohort 0.315 *** 0.162 0.469 1999 Cohort 0.513 *** 0.364 0.662 2000 Cohort 0.610 *** 0.461 0.759 2001 Cohort 0.653 *** 0.500 0.806 2002 Cohort 0.616 *** 0.453 0.778 2003 Cohort 0.819 *** 0.639 1.000 2004 Cohort 0.677 *** 0.453 0.901 *p<0.1, **p<0.05, ***p<0.01
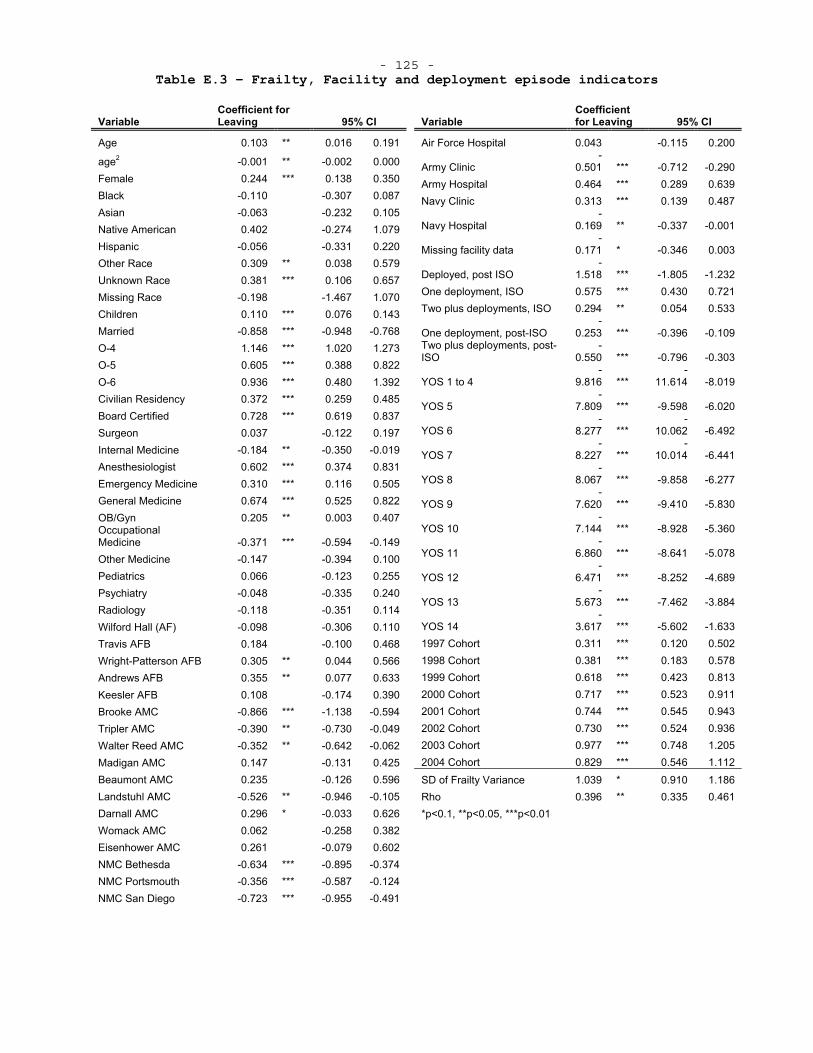
- 125 - Table E.3 – Frailty, Facility and deployment episode indicators
VariableCoefficient for Leaving 95% CI
Age 0.103 ** 0.016 0.191
age2 -0.001 ** -0.002 0.000Female 0.244 *** 0.138 0.350Black -0.110 -0.307 0.087Asian -0.063 -0.232 0.105Native American 0.402 -0.274 1.079 Hispanic -0.056 -0.331 0.220Other Race 0.309 ** 0.038 0.579 Unknown Race 0.381 *** 0.106 0.657 Missing Race -0.198 -1.467 1.070 Children 0.110 *** 0.076 0.143Married -0.858 *** -0.948 -0.768O-4 1.146 *** 1.020 1.273O-5 0.605 *** 0.388 0.822O-6 0.936 *** 0.480 1.392Civilian Residency 0.372 *** 0.259 0.485 Board Certified 0.728 *** 0.619 0.837 Surgeon 0.037 -0.122 0.197Internal Medicine -0.184 ** -0.350 -0.019 Anesthesiologist 0.602 *** 0.374 0.831 Emergency Medicine 0.310 *** 0.116 0.505 General Medicine 0.674 *** 0.525 0.822 OB/Gyn 0.205 ** 0.003 0.407OccupationalMedicine -0.371 *** -0.594 -0.149Other Medicine -0.147 -0.394 0.100 Pediatrics 0.066 -0.123 0.255Psychiatry -0.048 -0.335 0.240Radiology -0.118 -0.351 0.114Wilford Hall (AF) -0.098 -0.306 0.110 Travis AFB 0.184 -0.100 0.468 Wright-Patterson AFB 0.305 ** 0.044 0.566 Andrews AFB 0.355 ** 0.077 0.633 Keesler AFB 0.108 -0.174 0.390 Brooke AMC -0.866 *** -1.138 -0.594 Tripler AMC -0.390 ** -0.730 -0.049 Walter Reed AMC -0.352 ** -0.642 -0.062 Madigan AMC 0.147 -0.131 0.425 Beaumont AMC 0.235 -0.126 0.596 Landstuhl AMC -0.526 ** -0.946 -0.105 Darnall AMC 0.296 * -0.033 0.626 Womack AMC 0.062 -0.258 0.382 Eisenhower AMC 0.261 -0.079 0.602 NMC Bethesda -0.634 *** -0.895 -0.374 NMC Portsmouth -0.356 *** -0.587 -0.124 NMC San Diego -0.723 *** -0.955 -0.491
VariableCoefficient for Leaving 95% CI
Air Force Hospital 0.043 -0.115 0.200
Army Clinic -
0.501 *** -0.712 -0.290 Army Hospital 0.464 *** 0.289 0.639 Navy Clinic 0.313 *** 0.139 0.487
Navy Hospital -
0.169 ** -0.337 -0.001
Missing facility data -
0.171 * -0.346 0.003
Deployed, post ISO -
1.518 *** -1.805 -1.232 One deployment, ISO 0.575 *** 0.430 0.721 Two plus deployments, ISO 0.294 ** 0.054 0.533
One deployment, post-ISO -
0.253 *** -0.396 -0.109 Two plus deployments, post-ISO
-0.550 *** -0.796 -0.303
YOS 1 to 4 -
9.816 *** -
11.614 -8.019
YOS 5 -
7.809 *** -9.598 -6.020
YOS 6 -
8.277 ***-
10.062 -6.492
YOS 7 -
8.227 *** -
10.014 -6.441
YOS 8 -
8.067 *** -9.858 -6.277
YOS 9 -
7.620 *** -9.410 -5.830
YOS 10 -
7.144 *** -8.928 -5.360
YOS 11 -
6.860 *** -8.641 -5.078
YOS 12 -
6.471 *** -8.252 -4.689
YOS 13 -
5.673 *** -7.462 -3.884
YOS 14 -
3.617 *** -5.602 -1.633 1997 Cohort 0.311 *** 0.120 0.502 1998 Cohort 0.381 *** 0.183 0.578 1999 Cohort 0.618 *** 0.423 0.813 2000 Cohort 0.717 *** 0.523 0.911 2001 Cohort 0.744 *** 0.545 0.943 2002 Cohort 0.730 *** 0.524 0.936 2003 Cohort 0.977 *** 0.748 1.205 2004 Cohort 0.829 *** 0.546 1.112 SD of Frailty Variance 1.039 * 0.910 1.186 Rho 0.396 ** 0.335 0.461*p<0.1, **p<0.05, ***p<0.01
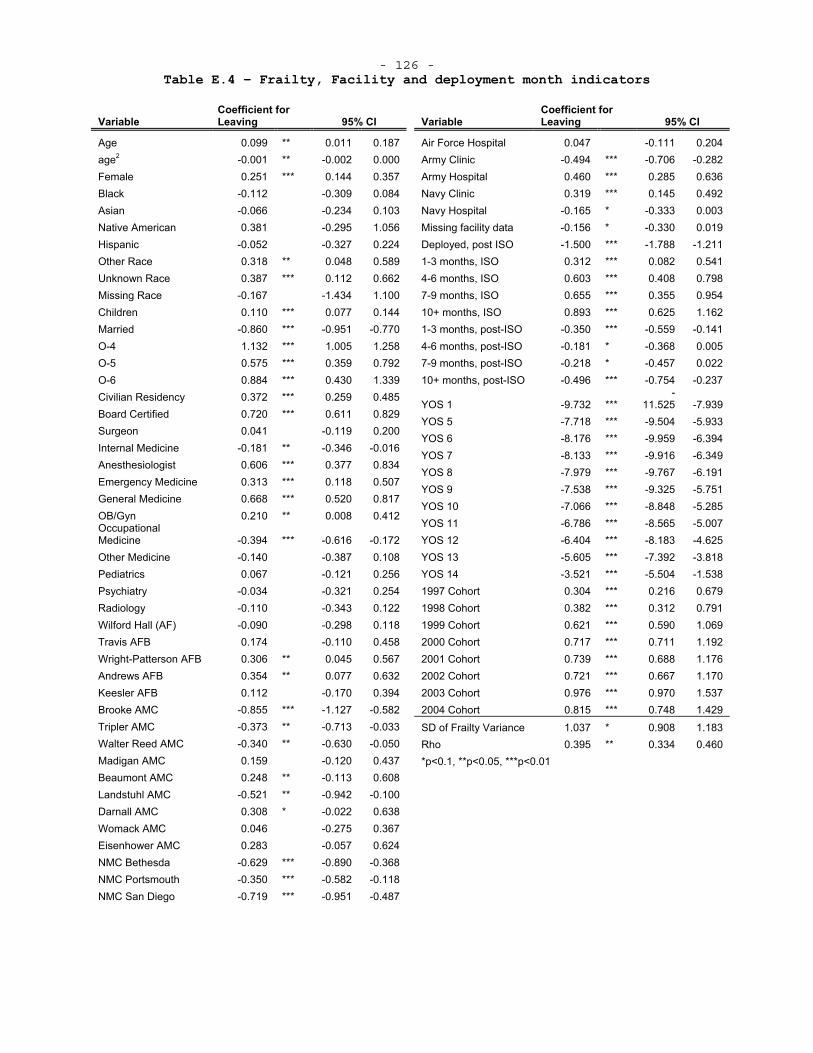
- 126 - Table E.4 – Frailty, Facility and deployment month indicators
VariableCoefficient for Leaving 95% CI
Age 0.099 ** 0.011 0.187age2 -0.001 ** -0.002 0.000Female 0.251 *** 0.144 0.357Black -0.112 -0.309 0.084Asian -0.066 -0.234 0.103Native American 0.381 -0.295 1.056 Hispanic -0.052 -0.327 0.224Other Race 0.318 ** 0.048 0.589 Unknown Race 0.387 *** 0.112 0.662 Missing Race -0.167 -1.434 1.100 Children 0.110 *** 0.077 0.144Married -0.860 *** -0.951 -0.770O-4 1.132 *** 1.005 1.258O-5 0.575 *** 0.359 0.792O-6 0.884 *** 0.430 1.339Civilian Residency 0.372 *** 0.259 0.485 Board Certified 0.720 *** 0.611 0.829 Surgeon 0.041 -0.119 0.200Internal Medicine -0.181 ** -0.346 -0.016 Anesthesiologist 0.606 *** 0.377 0.834 Emergency Medicine 0.313 *** 0.118 0.507 General Medicine 0.668 *** 0.520 0.817 OB/Gyn 0.210 ** 0.008 0.412OccupationalMedicine -0.394 *** -0.616 -0.172Other Medicine -0.140 -0.387 0.108 Pediatrics 0.067 -0.121 0.256Psychiatry -0.034 -0.321 0.254Radiology -0.110 -0.343 0.122Wilford Hall (AF) -0.090 -0.298 0.118 Travis AFB 0.174 -0.110 0.458 Wright-Patterson AFB 0.306 ** 0.045 0.567 Andrews AFB 0.354 ** 0.077 0.632 Keesler AFB 0.112 -0.170 0.394 Brooke AMC -0.855 *** -1.127 -0.582 Tripler AMC -0.373 ** -0.713 -0.033 Walter Reed AMC -0.340 ** -0.630 -0.050 Madigan AMC 0.159 -0.120 0.437 Beaumont AMC 0.248 ** -0.113 0.608 Landstuhl AMC -0.521 ** -0.942 -0.100 Darnall AMC 0.308 * -0.022 0.638 Womack AMC 0.046 -0.275 0.367 Eisenhower AMC 0.283 -0.057 0.624 NMC Bethesda -0.629 *** -0.890 -0.368 NMC Portsmouth -0.350 *** -0.582 -0.118 NMC San Diego -0.719 *** -0.951 -0.487
VariableCoefficient for Leaving 95% CI
Air Force Hospital 0.047 -0.111 0.204 Army Clinic -0.494 *** -0.706 -0.282 Army Hospital 0.460 *** 0.285 0.636 Navy Clinic 0.319 *** 0.145 0.492 Navy Hospital -0.165 * -0.333 0.003 Missing facility data -0.156 * -0.330 0.019 Deployed, post ISO -1.500 *** -1.788 -1.211 1-3 months, ISO 0.312 *** 0.082 0.541 4-6 months, ISO 0.603 *** 0.408 0.798 7-9 months, ISO 0.655 *** 0.355 0.954 10+ months, ISO 0.893 *** 0.625 1.162 1-3 months, post-ISO -0.350 *** -0.559 -0.141 4-6 months, post-ISO -0.181 * -0.368 0.005 7-9 months, post-ISO -0.218 * -0.457 0.022 10+ months, post-ISO -0.496 *** -0.754 -0.237
YOS 1 -9.732 *** -
11.525 -7.939 YOS 5 -7.718 *** -9.504 -5.933 YOS 6 -8.176 *** -9.959 -6.394 YOS 7 -8.133 *** -9.916 -6.349 YOS 8 -7.979 *** -9.767 -6.191 YOS 9 -7.538 *** -9.325 -5.751 YOS 10 -7.066 *** -8.848 -5.285 YOS 11 -6.786 *** -8.565 -5.007 YOS 12 -6.404 *** -8.183 -4.625 YOS 13 -5.605 *** -7.392 -3.818 YOS 14 -3.521 *** -5.504 -1.538 1997 Cohort 0.304 *** 0.216 0.679 1998 Cohort 0.382 *** 0.312 0.791 1999 Cohort 0.621 *** 0.590 1.069 2000 Cohort 0.717 *** 0.711 1.192 2001 Cohort 0.739 *** 0.688 1.176 2002 Cohort 0.721 *** 0.667 1.170 2003 Cohort 0.976 *** 0.970 1.537 2004 Cohort 0.815 *** 0.748 1.429
SD of Frailty Variance 1.037 * 0.908 1.183 Rho 0.395 ** 0.334 0.460*p<0.1, **p<0.05, ***p<0.01
- 127 - WORKS CITED
American Association of Medical Colleges, "U.S. Medical Schools Tuition and Student Fees - First Year Students 2008-2009 And 2007-2008," 2009, http://services.aamc.org/tsfreports/report_median.cfm?year_of_study=2009 (as of 3 March, 2010).
American Board of Medical Specialties, "Study Profiles Effective Doctor-Patient Communication
Key Component of Specialty Certification," 2007. Online at http://www.abms.org/News_and_Events/news_archive/release_ABMS_Study_06_07.aspx (as of 2 August 2010).
American Medical Group Association, "American Medical Group Association Compensation Survey Data 2008 Report," 2008, http://www.cms.hhs.gov/AcuteInpatientPPS/Downloads/AMGA_08_data.pdf (as of 18 Feb, 2010).
Army, US, "Introduction to the US Army Medical Department," 2009, http//www.armymedicine.army.mil/about/introduction.html#business (as of November 19, 2009).
Begg, Colin B., Laura D. Cramer, William J. Hoskins, and Murray F. Brennan, "Impact of Hospital Volume on Operative Mortality for Major Cancer Surgery," JAMA, Vol. 280, No. 20, November 25, 1998, 1998, pp. 1747-1751.
Birkmeyer, John D., Andrea E. Siewers, Emily V. A. Finlayson, Therese A. Stukel, F. Lee Lucas, Ida Batista, H. Gilbert Welch, and David E. Wennberg, "Hospital Volume and Surgical Mortality in the United States," New England Journal of Medicine, Vol. 346, No. 15, 2002, pp. 1128-1137.
Bolduc, Denis, Bernard Fortin, and Marc-Andre Fournier, "The Effect of Incentive Policies on the Practice Location of Doctors- A Multinomial Probit Analysis," Journal of Labor Economics, Vol. 14, No. 4, 1996, pp. 703-732.
Brannman, Shayne, Coir Rattelman, Susan Schutte, Provider Satisfaction Study, Alexandria, VA- Center for Naval Analysis, CAB D0002045.A2, 2000.
Breslau, Naomi, Alvin H. Novack, and Gerrit Wolf, "Work Settings and Job Satisfaction- A Study of Primary Care Physicians and Paramedical Personnel," Medical Care, Vol. 16, No. 10, 1978, pp. 850-862.
Cameron, A. Collin and Pravin K. Trivedi, Microeconometrics- Methods and Applications, New York- Cambring University Press, 2005.
Christensen, Eric, Shayne Brannman, Michele Almendarez, Jaquelyn Sanders, and Theresa Kimble, Navy Specialty Physician Study- Historical Overview, Retention Analysis, and Synopsis of Current Civilian-Sector Practices, Alexandria, VA- Center for Naval Analysis, CRM D0004916.A2/Final, 2002.
Daubert, Victoria L, Retention of Volunteer Physicians in the U.S. Air Force, Santa Monica, CA- RAND Corporation, R-3185-AF, 1985.
Daubert, Victoria, Daniel Relles, and Jr. Charles Roll, Medical Student Financing and the Armed Forces Health Professions Scholarship Program, Santa Monica, CA- RAND Corporation, R-2414-HA, 1982.
Defense, Department of, Fiscal Year 2008 Health Manpower Statics 2009. Department of Defense, 2008 Military Pay Chart, 2008a.
- 128 - ———, Summary of Major Changes to DoD 7000.14R, Volume 7A, Chapter 5
"Special Pay for Medical Officers", 2008b. Eibner, Christine, Maintaining Military Medical Skills During Peacetime-
Outlining and Assessing a New Approach, Santa Monica, CA- RAND Corporation, MG-638-OSD, 2008.
Elliot, Mark N., Kanika Kapur, and Carole Roan Gresenz, Modeling the Departure of Military Pilots from the Services, Santa Monica, CA- RAND Corporation, MR-1327-OSD, 2004.
Feldman, Debra S., Dennis H. Novack, and Edward Gracely, "Effects of Managed Care on Physician-Patient Relationships, Quality of Care, and the Ethical Practice of Medicine- A Physician Survey," Arch Intern Med, Vol. 158, No. 15, August 10, 1998, 1998, pp. 1626-1632.
Fricker, Ronald D., The Effects of Perstempo on Officer Retention in the U.S. Military, Santa Monica CA- RAND Corporation, MR-1556, 2002.
Haas, Jennifer, E. Cook, Ann Puopolo, Helen Burstin, Paul Cleary, and Troyen Brennan, "Is the professional satisfaction of general internists associated with patient satisfaction?," Journal of General Internal Medicine, Vol. 15, No. 2, 2000, pp. 122-128.
Harmon, John W., Daniel G. Tang, Toby A. Gordon, Helen M. Bowman, Michael A. Choti, Howard S. Kaufman, Jeffrey S. Bender, Mark D. Duncan, Thomas H. Magnuson, Keith D. Lillemoe, and John L. Cameron, "Hospital Volume Can Serve as a Surrogate for Surgeon Volume for Achieving Excellent Outcomes in Colorectal Resection," Annals of Surgery, Vol. 230, No. 3, 1999, p. 404.
Hosek, James and Francisco Martorell, How Have Deployments During the War on Terrorism Affected Reenlistment?, Santa Monica, CA- RAND Corporation, MG-873-OSD, 2009.
Hosek, Susan D. and Gary Cecchine, Reorganizing the Military Health System- Should There Be a Joint Command?, Santa Monica, CA- RAND Corporation, MR-1350-OSD, 2001.
Internal Revenue Service, Revenue Procedure 2007-66, Washington, DC, 2007.
Janus, Katharina, Volker E. Amelung, Laurence C. Baker, Michael Gaitanides, Friedrich W. Schwartz, and Thomas G. Rundall, "Job Satisfaction and Motivation among Physicians in Academic Medical Centers- Insights from a Cross-National Study," Journal of Health Politics, Policy and Law, Vol. 33, No. 6, 2008, pp. 1133-1167.
Jenkins, Stephen P., "Survival Analysis," 2005, http://www.iser.essex.ac.uk/study/resources/module-ec968 (as of 20 May, 2010).
Keating, Edward G., Marygail K. Brauner, Lionel A. Galway, Judith D. Mele, James J. Burks, and Bredan Saloner, Air Force Physician and Dentist Multiyear Special Pay- Current Status and Potential Reforms, Santa Monica, CA- RAND Corporation, 2009.
Keeton, Kristie, Dee E. Fenner, Timothy R. B. Johnson, and Rodney A. Hayward, "Predictors of Physician Career Satisfaction, Work-Life Balance, and Burnout," Obstetrics & Gynecology, Vol. 109, No. 4, 2007, pp. 949-955 910.1097/1001.AOG.0000258299.0000245979.0000258237.
Lancaster, Tony, The Econometric Analysis of Transition Data, New York Cambridge University Press, 1990. Landon, Bruce E., James Reschovsky, and David Blumenthal, "Changes in
Career Satisfaction Among Primary Care and Specialist Physicians,
- 129 - 1997-2001," JAMA, Vol. 289, No. 4, January 22, 2003, 2003, pp. 442-449.
Leigh, J. Paul, Richard L. Kravitz, Mike Schembri, Steven J. Samuels, and Shanaz Mobley, "Physician Career Satisfaction Across Specialties," Arch Intern Med, Vol. 162, No. 14, July 22, 2002, 2002, pp. 1577-1584.
Linn, Lawrence S., Robert H. Brook, Virginia A. Clark, Davies Allyson Ross, Arlene Fink, and Jacqueline Kosecoff, "Physician and Patient Satisfaction as Factors Related to the Organization of Internal Medicine Group Practices," Medical Care, Vol. 23, No. 10, 1985, pp. 1171-1178.
Linzer, Mark, Linda Baier Manwell, Eric S. Williams, James A. Bobula, Roger L. Brown, Anita B. Varkey, Bernice Man, Julia E. McMurray, Ann Maguire, Barbara Horner-Ibler, and Mark D. Schwartz, "Working Conditions in Primary Care- Physician Reactions and Care Quality," Annals of Internal Medicine, Vol. 151, No. 1, 2009, pp. 28-W29.
Manual of the Medical Department 1996 NAVMED P-117. McFadden, Daniel, "The Measurement of Urban Travel Demand," Journal of
Public Economics, Vol. 3, No. 4, 1974, pp. 303-328. McMahon, Joyce S, A Retention Model for Navy Physicians, Alexandria, VA-
Center for Naval Analysis, CRM 89-62, 1989. McMurray, Julia, Eric Williams, Mark Schwartz, Jeffrey Douglas, Judith
Van Kirk, T. Konrad, Martha Gerrity, Judy Bigby, Mark Linzer, and Sgim Career Satisfaction Study Group, "Physician job satisfaction," Journal of General Internal Medicine, Vol. 12, No. 11, 1997, pp. 711-714.
Meyer, Bruce D., "Unemployment Insurance and Unemployment Spells," Econometrica, Vol. 58, No. 4, 1990, pp. 757-782.
Misra-Hebert, Anita D., Robert Kay, and James K. Stoller, "A Review of Physician Turnover- Rates, Causes, and Consequences," American Journal of Medical Quality, Vol. 19, No. 2, March 1, 2004, 2004, pp. 56-66.
Murdock, Alan, "Rebuilding AF Surgery," Society of Air Force Clinical Surgeons, 2007.
"New AFMS corporate structure approved by CSAF," 2003, http://airforcemedicine.afms.mil/sg_newswire/oct_03/NewAFcorporateStructure.htm (as of 6 December, 2009).
Newhouse, Joseph P., Albert P. Williams, Bruce W. Bennett, and William B. Schwartz, "Does the Geographical Distribution of Physicians Reflect Market Failure?," The Bell Journal of Economics, Vol. 13, No. 2, 1982, pp. 493-505.
Nicholson, Sean, "Physician Specialty Choice under Uncertainty," Journal of Labor Economics, Vol. 20, No. 4, 2002, pp. 816-847.
Rattelman, Cori R., Tricare Tidewater- An Analysis of Military Physician Satisfaction, Alexandria, VA- Center for Naval Analysis, CRM95-199, 1996.
Scott, Anthony, "Eliciting GPs' preferences for pecuniary and non-pecuniary job characteristics," Journal of Health Economics, Vol. 20, No. 3, 2001, pp. 329-347.
TRICARE, "MTF Locator," http://www.tricare.mil/mtf/ (as of 30 July, 2010).
Tu, Ha T. and Paul B. Ginsburg, Losing Ground- Physician Income, 1995-2003- Center for Studying Health System Change, Tracking Report

- 130 - No. 15, June 2006, 2006, http://www.hschange.com/CONTENT/851/ (as of 10 Feb 2010).
Williams, Eric S., Thomas R. Konrad, Mark Linzer, Julia McMurray, Donald E. Pathman, Martha Gerrity, Mark D. Schwartz, William E. Scheckler, Judith Van Kirk, Elnora Rhodes, and Jeff Douglas, "Refining the Measurement of Physician Job Satisfaction- Results from the Physician Worklife Survey," Medical Care, Vol. 37, No. 11, 1999, pp. 1140-1154.