Embed Size (px)
Citation preview

77KKHH $$VVLLDDQQ &&UULLVVLLVV==A Statistical Point of View
Compiled by
Ming Chien Lo and Kar-yiu Wong
University of Washington
(This version: January 2, 1999)

The data presented in this manuscript are used to provide an idea of what has happened inthe current crisis in Asia. Before using them, readers are urged to check with officialsources for any possible typographical and other types of errors that may exist here.Updated data may be posted at the following web site:
http://weber.u.washington.edu/~karyiu/
This web site also has available a paper entitled “The Economics of Currency Crisis andCapital Control: A Survey,” by Sweta C. Saxena and Kar-yiu Wong, and an Asian homepage with more information about the current crisis.

1
Table of Content
Page
1 Table: Real GDP2 Table: Current Account3 Table: Government Budget Surplus or Deficit4 Table: Money Supply M15 Table: Money Supply M26 Table: Value of Import7 Table: Value of Export8 Table: Central Bank—Foreign Reserve (in Domestic Currency)9 Table: Central Bank—Foreign Reserve (in US$)10 Table: Land/Property/Housing Price Index11 Table: Unemployment Rate12 Table: Consumer Price Index; Total External Debt13 Diagrams: Exchange Rates14 Diagrams: Stock Price Index16-18 Description of Data

2
Real Gross Domestic Product
Hong Kong Indonesia Korea Japan Mayalasia Taiwan ThailandYear HK-M$ Rupiah-B$ Won-B$ Yen-B$ Ringgit-M$ TW-M$ Baht-M$
1960 71683.151961 80179.76 3504501962 87072.6 3781471963 94724 4135201964 105319.5 4639671965 111294.32 5156281966 56357 122700.21 5615831967 57647.3 136300.23 6217371968 64051.9 152532.08 6787581969 67898.3 170764.54 7394951970 73014.6 188323.1 36306.4 8235811971 78130.9 196588.87 39390.1 9297841972 85492.4 213128.98 41287.5 10536071973 174700 95162.8 230248.82 46571.8 11888121974 178700 102426.1 227427.7 50329.8 12026251975 179400 107526.1 234458.72 53670.4 12618961976 209000 114930.6 243778.42 59983 14368041977 233200 124999.6 254481.16 66172.2 15832091978 253300 134800.8 267897.44 72384.5 17984271979 282400 143233.9 282588.82 77547.1 19454301980 310800 157384.7 290550.95 75465.6 2087472 9137331981 339300 169041.5 299762.5 80149.6 2216116 9677061982 348300 168484.1 308927.07 86230.9 2294815 10195011983 368100 183353.3 316100.57 96146 2488657 10764321984 405000 195709 328483.44 104488.4 2752443 11383531985 406700 200544.2 342950.13 111329.8 2888758 11912551986 450411 212633.2 352879.82 124193.7 3225062 12571771987 508763 223107.3 367555.56 138499.2 3635979 13768471988 549302 236003.1 390325.13 154111 3921060 15598041989 563368 253601.7 409183.38 163950.3 4243891 17499521990 582549 271714.9 429985.32 179539 4472799 19453721991 612016 290870.1 446315.06 195935.7 4810705 21118611992 650347 309658.6 450876.32 205860.3 92866 5136014 22858651993 690223 329775.7 452281.45 217698.8 100617 5460471 24812781994 727506 354640.6 455196.95 236817.4 109915 5817402 26950541995 755833 383792.3 461893.32 257501.2 120309 6168052 29331681996 790399 414418.9 480013.25 275691.2 130628 6517625 30950411997 832311 433685.2 484077.82 290888.1 140863 6958600 3082660Q/YrQ1 1997 195401 120481.69 65168.5 1667579Q2 202328 112707 70741.5 1686965Q3 219399 120681.13 73621.3 1784716Q4 215183 130208 81356.8 1819340Q1 1998 189866 116259 62619.6 1765216Q2 191726 110868.06 66037.7 1774774
3
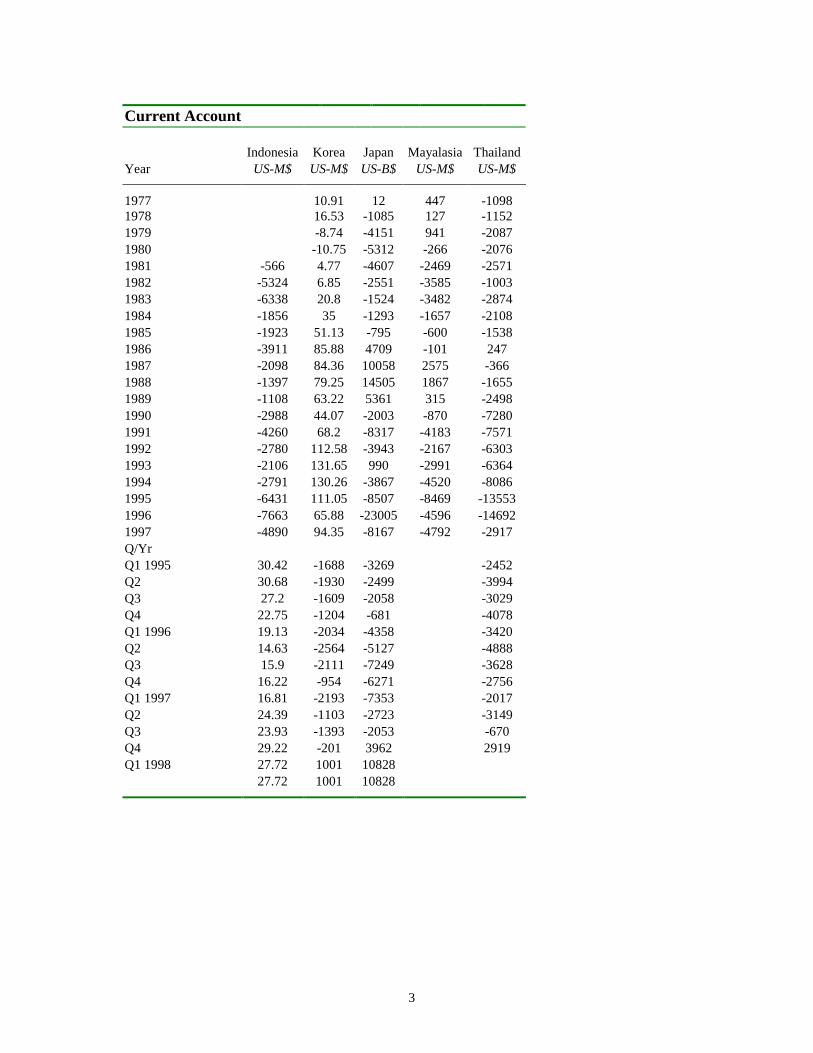
Current Account
Indonesia Korea Japan Mayalasia ThailandYear US-M$ US-M$ US-B$ US-M$ US-M$
1977 10.91 12 447 -10981978 16.53 -1085 127 -11521979 -8.74 -4151 941 -20871980 -10.75 -5312 -266 -20761981 -566 4.77 -4607 -2469 -25711982 -5324 6.85 -2551 -3585 -10031983 -6338 20.8 -1524 -3482 -28741984 -1856 35 -1293 -1657 -21081985 -1923 51.13 -795 -600 -15381986 -3911 85.88 4709 -101 2471987 -2098 84.36 10058 2575 -3661988 -1397 79.25 14505 1867 -16551989 -1108 63.22 5361 315 -24981990 -2988 44.07 -2003 -870 -72801991 -4260 68.2 -8317 -4183 -75711992 -2780 112.58 -3943 -2167 -63031993 -2106 131.65 990 -2991 -63641994 -2791 130.26 -3867 -4520 -80861995 -6431 111.05 -8507 -8469 -135531996 -7663 65.88 -23005 -4596 -146921997 -4890 94.35 -8167 -4792 -2917Q/YrQ1 1995 30.42 -1688 -3269 -2452Q2 30.68 -1930 -2499 -3994Q3 27.2 -1609 -2058 -3029Q4 22.75 -1204 -681 -4078Q1 1996 19.13 -2034 -4358 -3420Q2 14.63 -2564 -5127 -4888Q3 15.9 -2111 -7249 -3628Q4 16.22 -954 -6271 -2756Q1 1997 16.81 -2193 -7353 -2017Q2 24.39 -1103 -2723 -3149Q3 23.93 -1393 -2053 -670Q4 29.22 -201 3962 2919Q1 1998 27.72 1001 10828
27.72 1001 10828

4
Government Budget Surplus (+) or Deficit (-)
Indonesia Japan Korea Malaysia ThailandYear Rupiah-B$ Yen-B$ Won-B$ Ringgit-M$ Baht-M$
1980 -1102 -16872 -504 -3704 -256581981 -1172 -16826 -985 -9015 -213601982 -1191 -17583 -668 -10421 -411201983 -1862 -18843 143 -6933 -228241984 1219 -17290 337 -4775 -331831985 -948 -15603 195 -4407 -389791986 -3621 -15967 338 -7506 -341321987 -1037 -12195 905 -6153 -88601988 -4388 -9657 1681 -3290 360991989 -3362 -11645 444 -3410 653351990 798 -6781 164 -3437 1070491991 982 7759 -2220 -2640 1004551992 -1096 1473 -690 -1243 717931993 2018 -7318 236 354 556181994 3581 1730 4408 1012391995 10085 1711 1861 1349651996 6180 110 1815 341181997 -69 6627 -27931

5
Money Supply M1
Hong Kong Indonesia Korea Japan Mayalasia Thailand TaiwanM/Yr HK-M$ Rupiah-B$ Won-B$ Yen-B$ Ringgit-B$ Baht-B$ TW-M$
Jan-95 193205 44824 34114.1 137075.6 50457.4 353.3 1810315Feb-95 187773 47548 31522.8 139004.9 51026.8 353 1555959Mar-95 189313 45134 30920.8 148016 46444.4 352.1 1549632Apr-95 181596 44790 30873 152911.6 46776.1 353.3 1521320May-95 183681 45220 30363 142830.6 47768.1 369.2 1465539Jun-95 186027 47045 31626.3 150095.1 48320.1 364 1565896Jul-95 186109 47816 31089.9 147333 48196.1 354.1 1470856Aug-95 207340 48381 31481.6 145972 49302.8 368.4 1468020Sep-95 183926 48981 31370.5 155437.6 48580.6 367.5 1451822Oct-95 187584 50384 33542.1 150516.5 49496.6 363.1 1472974Nov-95 187876 50386 33929.1 153011.1 50494.2 358.3 1438139Dec-95 190437 52677 38872.8 171544 51923.9 388.3 1572730Jan-96 195832 52183 33750.2 156434.5 55872.9 385.1 1509946Feb-96 203463 54044 36407.4 158342.5 57954 426.5 1541029Mar-96 195627 53162 34269.5 174553.5 53730.8 421.9 1514869Apr-96 194941 54518 35088.8 172360.3 54730.4 411.1 1477130May-96 191998 53751 34059.6 163993.9 54079.4 418.9 1459643Jun-96 197440 56448 34588.4 176538.6 53956.2 393.1 1619564Jul-96 201295 57716 33543.2 166819.3 56541.8 408.2 1554974Aug-96 196054 57598 34152.9 168839 55554.4 399.3 1469824Sep-96 206368 59684 38062.8 169819.4 58013.8 408.3 1520331Oct-96 207215 59595 35887.8 165997.6 57980.5 395.4 1502236Nov-96 207235 60182 35400.1 174056.6 58839.6 406.8 1497896Dec-96 217460 64089 39542.1 188146.5 61430.6 423.7 1633442Jan-97 239237 65876 36725.3 171291.5 67492.9 419.3 1666221Feb-97 227828 64985 38497.2 174265.5 64094.3 436.2 1621635Mar-97 217780 63565 35246.2 184782.6 62172 440 1615046Apr-97 226780 64583 35756.3 185770.6 59543.1 418.2 1584850May-97 226089 65240 34654.4 185279 59488.5 430.1 1587432Jun-97 226855 69950 36284 185975.8 62175.6 396.4 1704278Jul-97 228038 69268 34450 180304.1 59891.4 393.5 1666930Aug-97 221189 65235 34647.8 182764 59925.7 428.4 1721421Sep-97 223656 66258 35340.1 180441 62388.1 400.5 1650187Oct-97 220830 67351 36317.1 178830 61699.4 407.3 1605907Nov-97 207294 69856 34736.9 191270 59945.7 407.9 1640399Dec-97 208093 78343 35036.1 204283 63198.7 428.8 1710876Jan-98 211545 92800 34890.9 192975.1 65187.7 443.8 1884832Feb-98 201445 92509 32555.8 196619.9 58194.3 430.6 1675347Mar-98 201921 98270 28143.2 197986.1 55125.1 405.9 1644918Apr-98 201136 95368 28792.9 199646.5 53479.6 409.6 1587959May-98 191036 103941 28954.2 198770.4 51188.3 389.1 1633514Jun-98 188212 109480 27921.4 199315.5 52208.1 381.7 1730258Jul-98 190099 105822 29674.9 194103.9 50640.4 400.4 1632613Aug-98 186236 104583 28981 191792.3 50345.6 383.9 1595101Sep-98 188737 102563 28590.1 193914 51769.2 394.7Oct-98 33193.8 391.6

6
Money Supply M2
Hong Kong Indonesia Korea Japan Mayalasia Thailand TaiwanM/Yr HK-M$ Rupiah-B$ Won-B$ Yen-B$ Ringgit-B$ Baht-B$ TW-M$
Jan-95 1015069 175869 134602 527914.9 164397.6 2827.9 11971350Feb-95 1034619 179432 131277.7 529659.1 166565.7 2843.3 11922880Mar-95 1063939 181382 131779.7 540177.7 164687.4 2846.7 11966690Apr-95 1089036 182385 133835.4 544006.3 165976.1 2869.1 11990900May-95 1097838 184877 133239.2 533145.5 170000.8 2948.6 11978330Jun-95 1127192 192126 136286.4 541246.2 176551.8 3026.3 12236920Jul-95 1149814 197250 136586.6 537719.4 176614.5 3044.4 12251290Aug-95 1163835 202085 138189.7 534328.7 183265.7 3108.7 12338460Sep-95 1177331 206079 139768.1 545462.4 185709.4 3135.5 12355270Oct-95 1198358 211148 142279 537507.8 187756.2 3184.7 12458870Nov-95 1177825 215788 145077.9 540403.6 192397.5 3216.7 12497940Dec-95 1210618 222638 153945.4 558804.3 198873.3 3310.6 12805360Jan-96 1223829 222865 147983.6 542025 205668 3356.9 12810890Feb-96 1253142 228032 151907 543584.2 210673.6 3428.1 12976180Mar-96 1269816 232493 151690.5 558779.4 209497 3470.3 12961390Apr-96 1275920 238936 153452.5 556485.6 212205 3479.1 12987510May-96 1274345 242153 155399 550494.6 213204 3514.3 13091940Jun-96 1307807 249443 159753.5 566161.1 214674 3537.3 13422940Jul-96 1322492 253392 159824 557139.3 217052 3536.1 13494030Aug-96 1340585 255284 162003 560505.6 219742 3546.1 13496170Sep-96 1366131 259926 169759.7 559274.8 222696.6 3574.1 13608370Oct-96 1403411 268320 168081 555628.7 229566 3590.5 13704790Nov-96 1475407 277359 170614.5 563131.6 229496 3644.4 13774060Dec-96 1465100 288632 178311.5 575298.1 240429.5 3726.6 13973870Jan-97 1505568 290853 177120 558859 246200 3714.9 14128960Feb-97 1556636 293240 182631.5 559360.3 250029 3753.3 14247100Mar-97 1521826 294581 182121 569827.8 249521.5 3846 14263140Apr-97 1573291 299277 183789.5 571976.5 248344.6 3857.4 14213780May-97 1597010 303667 183631.5 574630.6 252294.5 3910.6 14247250Jun-97 1637833 312839 187791 577331.1 260235.1 3958.1 14420800Jul-97 1668256 317533 189280.5 574695.4 258785.5 4047.5 14478360Aug-97 1647344 325911 195575.5 577583.8 266226.5 4139.4 14520630Sep-97 1674274 329074 197590 572222.8 270202 4166.3 14521550Oct-97 1602722 340744 199872 571063 275245.1 4239.7 14701790Nov-97 1593209 330559 204547 582298.8 276351.5 4250.2 14825620Dec-97 1610141 355643 203531.5 597493.8 292050.5 4339.3 15094350Jan-98 1599533 450697 204425.8 588046.8 294849.5 4416.3 15511150Feb-98 1620306 430241 209266.1 592630.4 290404.5 4414.2 15498840Mar-98 1638498 449824 204162.1 589797.8 288595.1 4408.7 15449220Apr-98 1642537 453396 207584 591428.3 284167.7 4416.2 15419610May-98 1630984 493909 217213.6 596835.5 281124.4 4433 15424510Jun-98 1646751 565785 218342.2 596827.9 281733.9 4502.5 15589910Jul-98 1715498 556522 228837.6 595445 282368 4589 15648760Aug-98 1724894 540861 236841.7 592997.5 285437.9 4602.9 15730490Sep-98 550404 239874.2 593125.9 286080.8 4680.2Oct-98 254437 4712.6Nov-98 259161

7
Value of Import
Hong Kong Indonesia Japan Korea Malaysia Thailand TaiwanYear HK-M$ US-M$ Yen-B$ US-M$ Ringgit-M$ Baht-M$ TW-M$
1976 43293 19229.168 8773.61977 48699 19131.779 10810.51978 62840 16727.624 14971.91979 85802 24245.348 20338.51980 111840 10833.4 31995.324 22291.5 1886861981 138551 13472.4 31464.146 26131.4 2167461982 143024 16870.9 32656.301 24250.8 1966161983 175466 16349.6 30014.784 26192 2366091984 223377 13903.8 32321.126 30631.4 2451551985 231406 10279.3 31084.933 31135.7 2511691986 275961 10749.5 21550.714 31584 2413581987 377954 12303.4 21736.911 41019.7 3343401988 498811 13248.6 24006.319 51810.7 41671.7 1423101 5131141989 562790 16359.6 28978.571 61464.7 60898.1 1385720 6626791990 642534 21931.4 33855.206 69843.6 79118.5 1471803 8444481991 778984 25850.4 31900.152 81524.7 100831 1690772 9588311992 955296 27591.6 29527.419 81775.4 101440.4 1817061 10332441993 1072598 28327.3 26826.355 83800.3 117414.8 2034746 11665961994 1240292 31988.8 28104.326 102348.1 155926.6 2261651 13690351995 1491267 40640.66 31548.753 135118.8 194426.6 2742851 17635921996 1535722 42922.69 37993.418 150339.1 197309.8 2815120 18328371997 1615205 41679.74 40956.182 144305.6 221681.87 3276094 1897381M/YrJan-97 131765 3720.5 3565.801 12510.3 16857 255491 158146Feb-97 102273 3116.84 3309.676 11484.1 13153.3 207888 140646Mar-97 128104 3823.6 3740.038 13055.9 16924.7 278802 153383Apr-97 139099 3556.4 3619.788 12801.7 17759.21 277460 150141May-97 134527 3609.2 3370.686 12272.7 17095.99 237423 143575Jun-97 131720 3572.2 3160.161 12287.1 19343 269165 151916Jul-97 150983 3651.2 3442.091 12643.4 18007.2 283358 163422Aug-97 139766 3285.3 3217.064 11498.3 18297.17 263042 161576Sep-97 133197 3452.5 3359.986 11546 18952.9 279653 172605Oct-97 152931 3459.7 3540.083 12280.3 22341 268417 169411Nov-97 133018 3254.1 3162.285 11710.1 20954.6 311845 154593Dec-97 137822 3178.2 3468.523 10215.7 21995.8 343550 177967Jan-98 113194 2583.1 3474.191 7526.7 20136.8 248739 178452Feb-98 106753 2257.4 2815.627 8005.8 20082.68 309801 148374Mar-98 123590 2365.15 3347.753 8357.6 20766.6 329944 148079Apr-98 133190 1922.92 3122.644 8244.9 19002.35 291534 139672May-98 124454 2023.8 2824.07 7654.3 18852.29 292023 126700Jun-98 123258 2150.46 3131.512 7749.6 17596.61 295615 150700Jul-98 123119 2444.7 3248.812 7100.2 20006.56 272507 147700Aug-98 119873 2181.3 3121.663 7119 18136.81 287225 136700Sep-98 115675 3054.85 7050.2 18915.07 291997 130300Oct-98 118711 3011.882 7339

8
Value of Export
Hong Kong Indonesia Japan Korea Malaysia Taiwan Thailand
Year HK-M$ US-M$ Yen-B$ US-M$ Ringgit-M$ Baht-M$ TW-M$1976 41557 19934.619 7715.61977 44834 21648.07 10046.41978 53740 20525.84 12710.61979 75913 22532.538 15055.31980 98352 21937.3 29382.471 17505 1331971981 122272 22256.2 33468.984 21253.6 1530011982 127517 21107.8 34432.5 21853.3 1599181983 160737 21145.3 34909.268 24445.1 1464721984 221481 21687 40325.293 29244.9 1752371985 235170 18477.6 41955.658 30283.2 1933661986 276526 14843.8 35289.712 34714.4 2333841987 378043 17123.6 33315.19 47280.8 2998531988 493086 19238.7 33939.184 60696.5 47253.7 1731804 4035701989 570512 22159 37822.534 62377.1 67826.6 1747800 5163261990 639876 25675.3 41456.937 65015.8 79646.4 1802783 5898131991 765885 29142 42359.892 71870.1 94496.6 2040785 7256301992 924953 33966.9 43012.28 76631.7 103656.8 2047963 8246431993 1046241 36802.3 40202.445 82235.9 121239.2 2239032 9358621994 1170051 40053.42 40497.552 96013.2 153816.2 2456011 11375981995 1344145 45417.97 41530.894 125058.1 185303.6 2949578 14063111996 1397938 49185.1 44731.305 129715.3 196700.9 3176625 14121111997 1456053 53493.3 50937.972 135881.8 221407.8 3481685 1814409M/YrJan-97 119374 4243 3541.32 9034.4 16754.1 118901 283520Feb-97 89059 4078 3990.396 9362.3 13521.8 112136 212689Mar-97 105525 4083.7 4540.246 11326.9 18677.6 134382 292756Apr-97 120988 4230.6 4426.957 11395.6 15633.1 113073 270694May-97 117003 4557.8 4102.664 11744.6 17252.2 127652 280615Jun-97 119043 4366.6 4119.574 12391.6 16543.5 122533 276885Jul-97 136632 4585.2 4281.188 11806.8 17153.3 144107 297719Aug-97 129492 4699.8 3936.13 11040.5 19450.9 156278 270702Sep-97 126863 4707.4 4423.516 11334.4 20162.8 180531 310363Oct-97 142957 4557.9 4645.992 12183 21650.4 192694 296202Nov-97 124679 4679 4224.844 11833.8 21637.3 187684 350163Dec-97 124438 4704.3 4705.145 12427.9 22970.8 224438 339377Jan-98 114432 4149 3860.156 9007.1 22726.6 225156 252411Feb-98 87959 3812.2 4094.008 11222.5 22544.8 220855 288264Mar-98 108585 4554.7 4589.305 12009.9 24501.9 207119 341652Apr-98 115986 3652.1 4346.836 12063.6 22605.1 169459 299105May-98 113256 3919.7 4042.486 11320.1 22610.6 166458 309645Jun-98 116683 4466.5 4346 11463.2 23661.3 191533 311625Jul-98 119083 4578.9 4561.465 10028.6 24159.1 192423 307308Aug-98 119140 4033.7 4014.308 9779.5 24387.3 178302 332019Sep-98 114219 4597.195 10846.9 25203.5 180500 329166Oct-98 117996 4382.613 10787.7

9
Central Bank--Foreign Reserve (in Domestic Currency)
Indonesia Japan Korea Malaysia ThailandM/Yr Rupiah-B$ Yen-T$ Won-B$ Ringgit-M$ Baht-B$
Jan-95 35264 4.89 21061 65621 747.52Feb-95 35701 5.96 20751 65787 751.15Mar-95 36656 8.65 20873 64345 1063.95Apr-95 36567 7.9 21367 64696 776.91May-95 37240 8.21 21758 65234 1095.13Jun-95 40175 8.07 21134 67236 859.02Jul-95 42306 8.12 23934 67857 848.79Aug-95 40601 10.38 24596 65584 865.89Sep-95 40151 12.53 24710 65350 896.17Oct-95 40826 11.62 25324 63976 895.31Nov-95 41125 11.79 26269 62942 907.92Dec-95 40163 11.54 25298 63790 929.73Jan-96 40147 11.61 26183 61311 953.25Feb-96 45724 14.19 27650 62863 971.25Mar-96 46421 16.65 26301 63809 980.51Apr-96 47111 15.4 28169 64888 977.52May-96 44886 15.49 28830 66642 986.57Jun-96 47011 16.37 29852 66772 1007.06Jul-96 47290 15.72 28355 67188 991.63Aug-96 48058 16.8 27010 67385 992.65Sep-96 46945 17.31 26862 67777 1002.01Oct-96 47642 16.02 26291 68481 1014.07Nov-96 53306 17 26570 69518 1007.52Dec-96 59886 17.49 28007 70023 988.75Jan-97 61765 18.17 27238 70491 1012Feb-97 64156 19.6 25953 71077 984.74Mar-97 63327 21.45 25331 72072 985.61Apr-97 66000 19.62 26339 70810 971.14May-97 68202 19.55 27536 69631 856.51Jun-97 69795 19.92 30002 70627 831.59Jul-97 71674 18.13 31126 61372 971.12Aug-97 78833 17.11 28604 62021 885.75Sep-97 89066 19.61 27638 62340 1075.17Oct-97 79399 19.48 27642 62331 1273.37Nov-97 87379 18.58 20994 61952 1047.32Dec-97 94201 16.86 14745 60049 1270.74Jan-98 191466 19.68 18134 58038 1468.13Feb-98 144280 21.82 20507 57481 1115.54Mar-98 139889 23.65 25972 58089 1069.63Apr-98 141638 18.97 34615 58139 1139.17May-98 199123 19.49 38622 58471 1099.44Jun-98 256888 19.05 34883 59318 1121.35Jul-98 247663 58860 1088.72Aug-98 193397 59052 1114.8

10
Central Bank--Foreign Reserve (in US$)
Indonesia Japan Korea Malaysia ThailandM/Yr US-B$ US-B$ US-B$ US-B$ US-B$
Jan-95 15.97825102 49.6194825 26.77132325 25.6682965 29.87689848Feb-95 16.13969259 61.41164348 26.40076336 25.75337639 30.10621242Mar-95 16.51915277 96.81029659 27.05508749 25.36463261 43.00525465Apr-95 16.41984733 94.32835821 28.04804411 26.1768157 31.60740439May-95 16.65474061 98.67788462 28.6251809 26.45873048 44.46325619Jun-95 17.8873553 95.39007092 27.87758871 27.56138553 34.83454988Jul-95 18.75265957 91.82404161 31.63780568 27.61220753 34.29454545Aug-95 17.91747573 104.7426842 31.89728959 26.24409764 34.51135911Sep-95 17.64879121 127.4669379 32.15773035 26.06493299 35.74670921Oct-95 17.86695842 114.2576205 33.08164598 25.14285714 35.61296738Nov-95 17.91158537 116.1004431 34.15106604 24.75594887 36.08585056Dec-95 17.40164645 112.2240591 32.65522138 25.09441385 36.90869393Jan-96 17.37213328 108.2517483 33.38390922 23.92157628 37.6035503Feb-96 19.69164513 135.530086 35.41693352 24.64732405 38.57227959Mar-96 19.86350021 156.6616485 33.60291299 25.15334279 38.86286167Apr-96 20.11571307 146.9465649 36.17439322 26.02807862 38.74435196May-96 19.06796941 143.1608133 36.59093794 26.65146971 38.93330702Jun-96 20.07301452 149.6070188 36.8270417 26.75696253 39.71056782Jul-96 20.09774756 145.6634544 34.86413378 26.92366259 39.24139296Aug-96 20.33770631 154.9243821 32.96314376 27.00801603 39.25069197Sep-96 20.06196581 155.9881049 32.71066732 27.01893562 39.41817467Oct-96 20.25595238 140.7732865 31.62636834 27.02486188 39.78305218Nov-96 22.51097973 149.4242771 32.0622662 27.51009102 39.49509996Dec-96 25.13050776 150.7758621 33.17578773 27.68801898 38.60796564Jan-97 25.77838063 148.9344262 31.62428887 28.34948723 39.11867027Feb-97 26.66500416 162.2785229 30.04167149 28.62545308 38.03553496Mar-97 26.17899959 172.9141475 28.23653996 29.07301331 37.95186754Apr-97 27.1270037 154.6708711 29.52471696 28.17971983 37.20842912May-97 27.95163934 167.8832117 30.87687822 27.71383085 33.19806202Jun-97 28.4877551 174.1258741 33.78223173 27.97330482 32.24466848Jul-97 27.57752982 153.3192389 34.89461883 23.32915194 30.28503711Aug-97 25.97462932 143.3598659 31.71175166 20.96720757 25.80104865Sep-97 27.19572519 162.0661157 30.21206821 19.52090183 29.43816225Oct-97 21.6346049 162.4010004 28.64159154 18.17230321 32.05866062Nov-97 23.95257675 145.6683653 18.03918199 17.67532097 26.09492961Dec-97 20.25827957 129.7422085 8.699115044 15.4292248 26.89567592Jan-98 155.0827423 11.89114754 12.70701055 26.7311824Feb-98 16.48914286 171.4734774 12.55786895 15.64534567 25.99114632Mar-98 16.80348348 179.0988262 18.77946493 15.92351974 27.56494176Apr-98 18.88506667 143.3862434 25.90943114 15.58059761 29.42679273May-98 140.1654081 27.44989339 15.02917363 27.33905259Jun-98 135.2502662 25.40640932 14.22835212 26.50131165Jul-98 14.22942101 26.66470732Aug-98 14.03160271 26.57132642

11
Land/Property/Housing Price Index
Hong Kong Japan Taiwan Thailand
Q/Yr 89=100 Mar-90=100 96=100 90=100
Q1 1990 106 100 77.88 88.7Q2 108 103.65 79.16 89.3Q3 113 107.3 80.87 90Q4 118 108.85 81.53 91.1Q1 1991 124 110.4 82.51 91.5Q2 141 110.45 83.92 92.3Q3 164 110.5 85.57 92.8Q4 183 109.45 85.86 93.3Q1 1992 200 108.4 86.21 93.8Q2 219 107 87.13 94.3Q3 224 105.6 88.3 94.5Q4 217 104 88.03 95.4Q1 1993 216 102.4 89.31 96.3Q2 232 101.15 90.06 96.6Q3 250 99.9 91.65 96.7Q4 251 98.8 92.09 97.6Q1 1994 288 97.7 93.5 99Q2 298 96.8 93.87 99.4Q3 295 95.9 95.44 100.1Q4 290 95.1 95.43 101.7Q1 1995 284 94.1 96.96 102.5Q2 280 93.25 97.54 104Q3 264 92.2 98.82 105.9Q4 261 91.1 98.58 106.9Q1 1996 277 90 99.88 107.6Q2 289 89 99.66 108.2Q3 298 88 100.59 108.3Q4 329 87.15 99.88 108.8Q1 1997 395 86.3 101.08 109.7Q2 429 85.55 100.93 110.7Q3 431 84.8 101.57 111.3Q4 416 84.05 101.01 114.6Q1 1998 354 83.3 102.55 116.1Q2 322 82.45 102.3Q3 81.6 102.74

12
Unemployment Rate
Hong Kong Japan Korea TaiwanM/Yr
Jan-95 2.2 2.9 2.3 1.38Feb-95 2.5 3 2.6 1.7Mar-95 2.8 3.1 2.4 1.53Apr-95 3.1 3.1 2.1 1.53May-95 2.9 3 1.9 1.63Jun-95 3.1 3.1 1.8 1.77Jul-95 3.2 3.1 1.8 1.95Aug-95 3.5 3.2 1.9 2.09Sep-95 3.5 3.2 1.9 2.03Oct-95 3.6 3.2 1.9 2.02Nov-95 3.6 3.4 1.8 1.95Dec-95 3.5 3.4 1.8 1.9Jan-96 3.3 3.4 2.1 2.03Feb-96 3.1 3.3 2.3 2.1Mar-96 3.2 3.2 2.2 2.24Apr-96 3.3 3.4 2 2.21May-96 3.2 3.5 1.9 2.35Jun-96 3.1 3.4 1.9 2.6Jul-96 2.9 3.4 1.8 2.97Aug-96 2.8 3.3 1.9 3.19Sep-96 2.6 3.3 1.8 3.03Oct-96 2.5 3.4 1.8 3.05Nov-96 2.7 3.3 2 2.86Dec-96 2.6 3.3 2.3 2.6Jan-97 2.5 3.3 2.6 2.68Feb-97 2.4 3.4 3.2 2.97Mar-97 2.5 3.3 3.4 2.79Apr-97 2.6 3.3 2.8 2.51May-97 2.5 3.5 2.5 2.67Jun-97 2.4 3.4 2.3 2.67Jul-97 2.4 3.4 2.2 2.85Aug-97 2.4 3.4 2.1 3.03Sep-97 2.2 3.4 2.2 2.84Oct-97 2.3 3.5 2.1 2.63Nov-97 2.4 3.5 2.6 2.6Dec-97 2.5 3.5 3.1 2.45Jan-98 2.5 3.5 4.5 2.35Feb-98 2.9 3.6 5.9 2.57Mar-98 3.5 3.9 6.5 2.34Apr-98 3.9 4.1 6.7 2.29May-98 4.1 4.1 6.9 2.37Jun-98 4.4 4.3 7 2.7Jul-98 4.8 4.1 7.6 2.93Aug-98 5 4.3 7.4 3.05Sep-98 5 4.3 7.3 2.98Oct-98 5.3 4.3 7.1 2.98

13
Consumer Price Index
Hong Kong Indonesia Japan Korea Malaysia Taiwan ThailandM/Yr 94-95=100 96=100 95=100 95=100 94=100 96=100 94=100Jan-95 98.2 100.2 97.8 102 95.74 102.4Feb-95 98.9 99.9 98.2 102.7 95.32 102.8Mar-95 99.3 99.8 99.2 102.6 95.45 103.1Apr-95 100.5 100.1 99.8 102.6 96.85 103.8May-95 101.2 100.3 100 103.2 96.67 105Jun-95 101.9 100.2 99.7 103.2 97.73 105.6Jul-95 102.1 99.7 100 103.7 97.15 106Aug-95 103 99.8 100.6 103.9 97.4 107Sep-95 103.9 100.4 101.5 103.4 97.98 108.3Oct-95 104.5 100.1 101 104.2 97.74 109.1Nov-95 104.7 99.8 100.8 104.7 98.12 109.2Dec-95 104.5 99.8 101.5 104.9 98.08 109.3Jan-96 104.7 98.56 99.7 102.5 105.5 97.93 109.6Feb-96 105.7 99.86 99.5 102.9 106.2 98.9 110.1Mar-96 106.3 99.2 99.7 103.6 105.9 98.32 110.5Apr-96 107.6 99.49 100.3 104.3 106.3 99.59 111May-96 107.8 100.13 100.5 104.9 106.9 99.45 111.4Jun-96 108.4 99.39 100.2 104.9 107.1 100.06 111.5Jul-96 108.4 100.08 100.1 105.4 107.3 98.56 111.7Aug-96 108.6 100.04 100 105.9 107.3 102.3 112.8Sep-96 109.7 100.22 100.4 106.1 107.7 101.74 113Oct-96 110.5 100.63 100.6 106.1 107.7 101.33 113.6Nov-96 110.9 101.04 100.3 106.1 108.2 101.26 114.1Dec-96 111.4 101.38 100.4 106.5 108.4 100.56 114.1Jan-97 111.3 103.1 100.3 107.3 108.9 99.86 114.3Feb-97 112.3 103.88 100.1 107.9 109.5 100.93 114.9Mar-97 112.5 103.91 100.2 108.3 109.3 99.4 115.5Apr-97 113.6 104.33 102.2 108.8 109.1 100.09 115.7May-97 114 104.65 102.4 108.9 109.6 100.21 116.2Jun-97 114.5 104.61 102.4 109.1 109.5 101.89 116.4Jul-97 115.3 105.45 102 109.3 109.6 101.81 117.1Aug-97 115.5 106.42 102.1 110.1 109.9 101.72 120.3Sep-97 115.9 107.58 102.8 110.6 110.2 102.37 120.8Oct-97 116.8 109.08 103.1 110.6 110.6 101 121.8Nov-97 117 109.94 102.4 110.7 111 100.73 122.8Dec-97 117.2 111.83 102.2 113.5 111.5 100.82 122.8Jan-98 117.3 119.85 102.1 116.2 112.6 101.85 124.2Feb-98 117.7 135.03 102 118.2 114.3 101.23 125.1Mar-98 118 142.15 102.4 118 114.9 101.85 126.5Apr-98 119 148.83 102.6 118.4 115.2 102.2 127.4May-98 119.2 156.63 102.9 117.8 115.5 101.87 128.1Jun-98 119 163.89 102.5 117.3 116.3 103.34 128.9Jul-98 119 177.92 101.9 117.3 116 102.67 128.9Aug-98 118.6 189.13 101.8 117.7 116.1 102.17 129.4Sep-98 118.8 196.23 102.6 118.2 116.3 102.79 129.2Oct-98 116.9 195.64 103.3 118.6 116.4 103.62 129Nov-98 195.84 118.2 128.6
14
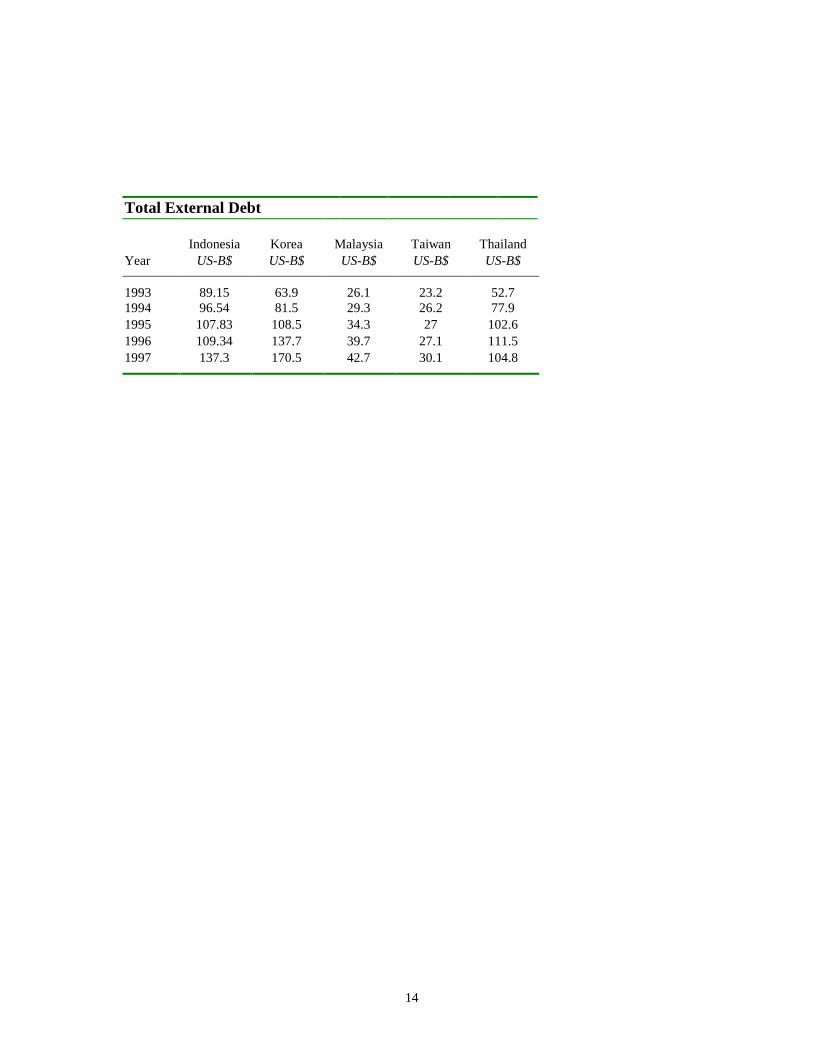
Total External Debt
Indonesia Korea Malaysia Taiwan ThailandYear US-B$ US-B$ US-B$ US-B$ US-B$
1993 89.15 63.9 26.1 23.2 52.71994 96.54 81.5 29.3 26.2 77.91995 107.83 108.5 34.3 27 102.61996 109.34 137.7 39.7 27.1 111.51997 137.3 170.5 42.7 30.1 104.8

15
7.725
7.730
7.735
7.740
7.745
7.750
7.755
95:01 95:07 96:01 96:07 97:01 97:07 98:01 98:07
HK$ per US$
Monthly Exchange Rate of Hong Kong Dollar (End Period)
2000
4000
6000
8000
10000
95:01 95:07 96:01 96:07 97:01 97:07 98:01 98:07
Rupiah per US$
Monthly Exchange Rate of Indonesian Rupiah (End Period)
80
100
120
140
160
95:01 95:07 96:01 96:07 97:01 97:07 98:01 98:07
Yen per US$
Monthly Exchange Rate of Japanese Yen (End Period)
600
800
1000
1200
1400
1600
1800
95:01 95:07 96:01 96:07 97:01 97:07 98:01 98:07
Won per US$
Monthly Exchange Rate of Korean Won (End Period)
2.0
2.5
3.0
3.5
4.0
4.5
5.0
95:01 95:07 96:01 96:07 97:01 97:07 98:01 98:07
Ringgit per US$
Monthly Exchange Rate of Malaysian Ringgit (End Period)
20
30
40
50
60
95:01 95:07 96:01 96:07 97:01 97:07 98:01 98:07
Baht per US$
Monthly Exchange Rate of Thai Baht (End Period)

16
6000
8000
10000
12000
14000
16000
18000
1/02/95 10/09/95 7/15/96 4/21/97 1/26/98 11/02/98
Hong Kong Heng Seng Index (1995.1.1-1998.11.30)
200
300
400
500
600
700
800
1/02/95 10/09/95 7/15/96 4/21/97 1/26/98 11/02/98
Indonesia Jakarta Composite Index (1995.1.1-1998.11.30)
900
1000
1100
1200
1300
1400
1500
1/02/95 10/09/95 7/15/96 4/21/97 1/26/98 11/02/98
Japan Nikkei 500 Index (1995.1.1-1998.11.30)
0
100
200
300
400
1/02/95 10/09/95 7/15/96 4/21/97 1/26/98 11/02/98
Malaysia Kuala Lumpur Stock Exchange Index (1995.1.1-1998.11.30
0
200
400
600
800
1000
1200
1400
1600
1/02/95 12/02/96 11/02/98
Thailand Bankok Stock Exchange Index (1995.1.1-1998.11.30)
800
1000
1200
1400
1600
1800
2000
6/30/95 4/05/96 1/10/97 10/17/97 7/24/98
Taiwan Stock Exchange 100 Index (1995.6.30-1998.11.30)
17
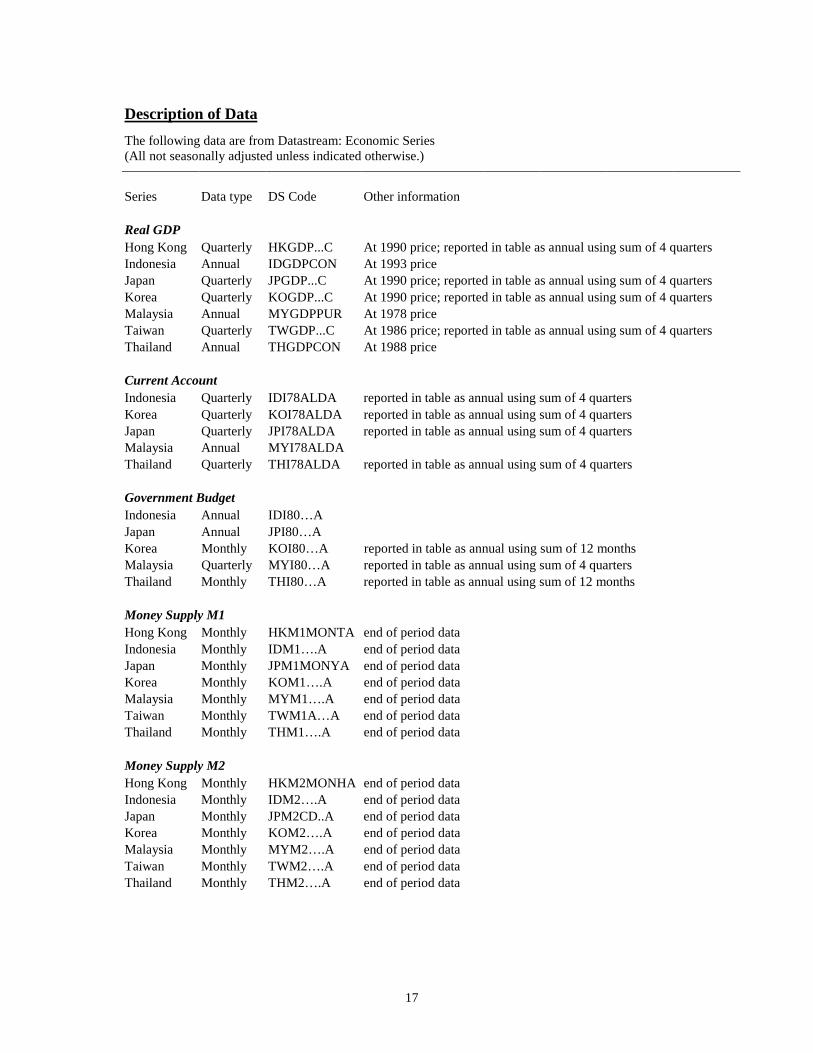
Description of Data
The following data are from Datastream: Economic Series(All not seasonally adjusted unless indicated otherwise.)
Series Data type DS Code Other information
Real GDPHong Kong Quarterly HKGDP...C At 1990 price; reported in table as annual using sum of 4 quartersIndonesia Annual IDGDPCON At 1993 priceJapan Quarterly JPGDP...C At 1990 price; reported in table as annual using sum of 4 quartersKorea Quarterly KOGDP...C At 1990 price; reported in table as annual using sum of 4 quartersMalaysia Annual MYGDPPUR At 1978 priceTaiwan Quarterly TWGDP...C At 1986 price; reported in table as annual using sum of 4 quartersThailand Annual THGDPCON At 1988 price
Current AccountIndonesia Quarterly IDI78ALDA reported in table as annual using sum of 4 quartersKorea Quarterly KOI78ALDA reported in table as annual using sum of 4 quartersJapan Quarterly JPI78ALDA reported in table as annual using sum of 4 quartersMalaysia Annual MYI78ALDAThailand Quarterly THI78ALDA reported in table as annual using sum of 4 quarters
Government BudgetIndonesia Annual IDI80…AJapan Annual JPI80…AKorea Monthly KOI80…A reported in table as annual using sum of 12 monthsMalaysia Quarterly MYI80…A reported in table as annual using sum of 4 quartersThailand Monthly THI80…A reported in table as annual using sum of 12 months
Money Supply M1Hong Kong Monthly HKM1MONTA end of period dataIndonesia Monthly IDM1….A end of period dataJapan Monthly JPM1MONYA end of period dataKorea Monthly KOM1….A end of period dataMalaysia Monthly MYM1….A end of period dataTaiwan Monthly TWM1A…A end of period dataThailand Monthly THM1….A end of period data
Money Supply M2Hong Kong Monthly HKM2MONHA end of period dataIndonesia Monthly IDM2….A end of period dataJapan Monthly JPM2CD..A end of period dataKorea Monthly KOM2….A end of period dataMalaysia Monthly MYM2….A end of period dataTaiwan Monthly TWM2….A end of period dataThailand Monthly THM2….A end of period data

18
Value of ImportHong Kong Monthly HKEXTIMPA reported in table as annual using sum of 12 monthsIndonesia Monthly IDIMPORTA reported in table as annual using sum of 12 monthsJapan Monthly JPIMPTCMA reported in table as annual using sum of 12 monthsKorea Monthly KOIMPORTA reported in table as annual using sum of 12 monthsMalaysia Monthly MYIMPORTA reported in table as annual using sum of 12 monthsTaiwan Monthly TWIMPORTA reported in table as annual using sum of 12 monthsThailand Monthly THIMPORTA reported in table as annual using sum of 12 months
Value of ExportHong Kong Monthly HKEXTTOTA reported in table as annual using sum of 12 monthsIndonesia Monthly IDEXPORTA reported in table as annual using sum of 12 monthsJapan Monthly JPEXPTCMA reported in table as annual using sum of 12 monthsKorea Monthly KOEXPORTA reported in table as annual using sum of 12 monthsMalaysia Monthly MYEXPORTA reported in table as annual using sum of 12 monthsTaiwan Monthly TWEXPORTA reported in table as annual using sum of 12 monthsThailand Monthly THEXPORTA reported in table as annual using sum of 12 months
Central Bank--Foreign Reserve (in Domestic Currency)Indonesia Monthly IDI11…AJapan Monthly JPI11…AKorea Monthly KOI11…AMalaysia Monthly MYI11…AThailand Monthly THI11…A
Central Bank--Foreign Reserve (in US$)Indonesia Monthly converted from domestic currency by divided by exchange rate (EP)Japan MonthlyKorea MonthlyMalaysia MonthlyThailand Monthly
Land/Property/Housing Price IndexHong Kong Quarterly HKPROPALF property price indexJapan Quarterly JPLANDPI land price indexTaiwan Quarterly TWCPHOUSF CPI--housingThailand Quarterly THCPIHOSF CPI--housing
Unemployment RateHong Kong Monthly HKTOTUN%E seasonally adjustedJapan Monthly JPTOTUN%E seasonally adjustedKorea Monthly KOTOTUN%FTaiwan Monthly TWTOTUN%F

19
Consumer Price IndexHong Kong Monthly HKCPA…FIndonesia Monthly IDCP….FJapan Monthly JPCNPRICFKorea Monthly KOCP….FMalaysia Monthly MYCP….FTaiwan Monthly TWCP….FThailand Monthly THCP….F
Exchange Rates (Domestic Currency per US$)Hong Kong Monthly HKI..AE. end of period dataIndonesia Monthly IDI..AE. end of period dataJapan Monthly JPI..AE. end of period dataKorea Monthly KOI..AE. end of period dataMalaysia Monthly MYI..AE. end of period dataTaiwan Monthly TWI..AE. end of period dataThailand Monthly THI..AE. end of period data
Stock Exchange IndexHong Kong Daily HNGKNGIIndonesia Daily JAKCOMPJapan Daily JAPA500Malaysia Daily KLSEMASTaiwan Daily TATP100Thailand Daily BNGKSET
ExternalDebtIndonesia Annual All data from Economist Intelligent Unit's Country ReportsKorea Annual Quarter 3, 1998Malaysia AnnualTaiwan AnnualThailand Annual