Embed Size (px)
Citation preview
Forschungsinstitut zur Zukunft der ArbeitInstitute for the Study of Labor
DI
SC
US
SI
ON
P
AP
ER
S
ER
IE
S
The Association between Immigration andLabor Market Outcomes in the United States
IZA DP No. 9436
October 2015
Gaetano BassoGiovanni Peri
The Association between Immigration
and Labor Market Outcomes in the United States
Gaetano Basso University of California, Davis
Giovanni Peri
University of California, Davis and IZA
Discussion Paper No. 9436 October 2015
IZA
P.O. Box 7240 53072 Bonn
Germany
Phone: +49-228-3894-0 Fax: +49-228-3894-180
E-mail: [email protected]
Any opinions expressed here are those of the author(s) and not those of IZA. Research published in this series may include views on policy, but the institute itself takes no institutional policy positions. The IZA research network is committed to the IZA Guiding Principles of Research Integrity. The Institute for the Study of Labor (IZA) in Bonn is a local and virtual international research center and a place of communication between science, politics and business. IZA is an independent nonprofit organization supported by Deutsche Post Foundation. The center is associated with the University of Bonn and offers a stimulating research environment through its international network, workshops and conferences, data service, project support, research visits and doctoral program. IZA engages in (i) original and internationally competitive research in all fields of labor economics, (ii) development of policy concepts, and (iii) dissemination of research results and concepts to the interested public. IZA Discussion Papers often represent preliminary work and are circulated to encourage discussion. Citation of such a paper should account for its provisional character. A revised version may be available directly from the author.
IZA Discussion Paper No. 9436 October 2015
ABSTRACT
The Association between Immigration and Labor Market Outcomes in the United States
In this paper we present important correlations between immigration and labor market outcomes of native workers in the US. We use data on local labor markets, states and regions from the Census and American Community Survey over the period 1970-2010. We first look at simple correlations and then we use regression analysis with an increasing number of controls for observed and unobserved factors. We review the potential methods to separate the part of this correlation that captures the causal link from immigrants to native labor outcomes and we show estimates obtained with 2SLS method using the popular shift-share instrument. One fact emerging from all the specifications is that the net growth of immigrant labor has a zero to positive correlation with changes in native wages and native employment, in aggregate and by skill group. We briefly review the literature on the channels and the mechanisms that allow local economies to absorb immigrants with no negative (and possibly positive) impact on the labor demand for natives.
NON-TECHNICAL SUMMARY We show that correlation of immigration and wages/employment of US natives were positive or null at all levels of geography and in aggregate as well as for skill groups, in the period 1970-2010. This suggests that we need to analyze theories of how local economies absorb immigrants without negative effects on native labor demand. JEL Classification: J21, J31, J61 Keywords: immigration, employment, wages, labor markets Corresponding author: Giovanni Peri University of California, Davis One Shields Avenue Davis, CA 95616 USA E-mail: [email protected]

1 Introduction
The labor market and, more generally, the economic impact of immigrants in the United
States are highly researched topics. Several influential articles have been written since the
1980’s on immigration and native wages and employment (Grossman 1982, Card 1990,
Borjas, Freeman and Katz 1997, Friedberg and Hunt 1995, Friedberg 2001). There has
been some disagreement on whether the association between immigrant and wages is
negative, positive or null (e.g. Borjas 2003, Card 2009 and Ottaviano and Peri 2012).
The economics of how immigrants affect native wages and employment can be framed in
a very simple labor demand and labor supply model for homogeneous workers. Such a
basic canonical model with a negatively sloped labor demand curve implies that in the
short run an increase in supply due to immigration, keeping everything else constant,
produces a decline in wage and/or in employment for native workers. In the long run as
capital adjusts this model predicts no effect on native wages and employment.
There are many reasons, however, to believe that the simple canonical model described
above is a gross oversimplification as it omits aspects that are crucial for the issue at
hand. Immigrants are not homogeneous to natives, technology and capital adjusts in
response to labor, firms create jobs in response to incentives, there are complementarity
across different workers, more workers allow for specialization and division of labor that
could enhance efficiency, and so on. All these factors imply that the marginal product of
native labor may change when the supply of immigrant changes, and it may change in a
direction that offsets or overturns the negative effects implied by the canonical model. In
other words, the change in supply of immigrant workers may correspond to an ambiguous
change in the demand for native workers. It could be positive or negative depending on
the relative strength of competition and complementarity/productivity effects.
A second issue limiting the relevance of the “supply shift with-everything-else-constant”
paradigm is that we rarely observe “sudden and short lived” changes in immigration rates.
The usual scenario is one in which a slow but persistent increase in immigration rates
shapes, over decades, the labor markets of the receiving countries. In this context several
adjustments take place concurrently with the immigrant inflow. Even the more remark-
able examples of immigration “booms” entailed net inflows only around 0.5 to 1% of the
population each year. One of these immigration episodes took place in Israel during the
period 1990-2000, due to Jewish immigrants from the ex-Soviet Union: in that episode,
the share of foreign-born increased by 10 percentage points of the population in a decade.
1
In another episode, from 1995 to 2008, the share of foreign-born in Spain increased by 11
percentage points due to immigration. By comparison, the period of largest US immigra-
tion, namely the years 1990-2010, experienced an increase in the share of foreign-born by 5
percentage points, hence an average of 0.25 percentage of the population each year. Most
of the other countries have had much smaller yearly rates for a period of few decades.1 It is
more useful, therefore, to think of a framework in which the inflow of immigrants changes
the long run equilibrium in the labor markets over decades. As both labor demand and
labor supply change in the long-run and immigration may affect both dynamics, there is
no clear prediction of the sign of the effects.
For these reasons it is useful to go to the data to learn about the long-run correlations
between changes in immigrant population and native wages and employment without a
pre-conceived expectation about their sign. We analyze these correlations for the US over
the period 1970-2010, considering several different dimensions pertaining geographical
areas and skill groups in Section 2 of this paper.
There are reasons to think that in the long run the correlation immigrant-native de-
mand can be negative if forces of competition, crowding and decreasing returns prevail.
But there are as many reasons to think that a positive correlation will prevail if agglomer-
ation economies, labor and capital complementarity, specialization and skill externalities
prevail. By analyzing the long-run correlations between these variables we obtain a pic-
ture of their joint movements in equilibrium. While correlations “per se” cannot reveal
what is their driving force, and hence they cannot identify the causal effects of immigra-
tion, they may suggest some scenarios and rule out others, especially if they are consistent
across decades and across geographical units. Moreover, other important long-run forces
driving changes in the labor market, such as technology, change in demographic groups
and changes in schooling attainments are, at least in part, observable. Thus, we can
absorb their variation and only distill the correlation that survives such controls to better
approximate the causal link between immigrants and native wages.
With these caveats in mind we will estimate a series of basic regressions that pro-
gressively absorb the variation of confounding (observable and unobservable) factors so
as to isolate a partial correlation between immigrant supply and native wages and em-
ployment. Overall we find correlations that are positive or not significantly different from
0 and rather stable across different periods, geographical units and specifications. These
1There have been some episodes of large refugee migrations in a short amount of time such as the
Bosnians in the mid 1990’s, but their flows were not too large.
2
correlations reveal that, unless specific unobserved factors systematically offset the crowd-
ing and competition effects by immigrants, the identified correlations do not support the
existence of negative and significant effects of immigration on native labor demand. We
present this analysis in Section 3.
Even the more sophisticated regression analysis, however, cannot really ensure that
we are fully identifying causation from immigration to native labor demand. While the
positive correlations are suggestive, and the robustness to controls is encouraging, we need
to have a more systematic way to separate the causal link between exogenous changes
in immigrant labor supply and native wages and employment. In Section 4 we discuss
the frequently used method of instrumental variables estimation, and the popular instru-
ments in this context, defined as “shift-share” (or “enclave-based”). That method aims
at isolating supply-driven changes in immigrants. We apply this instrumental variable
technique to our regression analysis and observe only a small change in the point esti-
mates of the correlation between immigrants and average native wages. The precision of
the estimates, however, deteriorates significantly. We also discuss in that section more
recent and promising methods that leverage policy changes and their variation across re-
gions or the discontinuity over time of migratory flows as source of exogenous variation of
immigrant labor supply. While those methods are interesting and promising, it is hard to
find policy changes and push-episodes for all countries and years. Hence the shift-share
instrument may still have an important role and it needs to be constructed accurately,
paying attention to important details.
Finally, acknowledging that most of the simple and sophisticated correlations and
2SLS correlations between immigrant labor supply and native wages are positive or null,
in Section 5 we identify some recent papers that analyze channels andmechanisms allowing
absorption of immigrant labor with positive effects on native labor demand. Section 6
concludes the paper.
2 Basic Aggregate Correlations
We first consider simple correlations between the growth of the foreign-born population
and the growth of wages and employment of natives. We aggregate US Census data
for 1970 (2% sample), 1980, 1990 and 2000 (5% samples) and the 2008-2012 American
Community Survey, which create a 5% sample around 2010 that we use for that year. As
main geographical unit of analysis we use 722 Commuting Zones (CZs) that encompass
3

the 48 adjoining US states and are defined as to comprise the same residents and workers
within themselves. They approximate local labor markets. We use the definition of
Commuting Zone, and the concordance over time, as developed by Autor and Dorn (2013).
Alternatively, we use 50 US states or 9 US Census regions as units of analysis. The
samples that measure population in working age include all individuals between 18 and 64
years old not residing in group quarters, while those measuring employment only include
individuals who worked a positive amount of weeks in the previous year. Finally, the
samples constructed to measure wages include working individuals who received strictly
positive wage income. We use the logarithm of weekly wages that we define as total
income from wages divided by weeks worked in the previous year.2
Let us define as the number of foreign-born in working age in location and
census year . We then define as the number of US born people in working age in
the same location and census year. Our measure of the increase in immigrants (foreign-
born) over an inter-census decade (for = 1970 1980 1990 2000) is the change in the
number of foreign-born standardized by the initial population: ∆() = (+10−)(+). This variable captures the increased number of immigrants relative
to the local population in working age. Correspondingly, we define as ∆ ln()
the inter-census change in the logarithm of average weekly wages of native workers and as
∆ ()
the inter-census change in native employment as share of the population
in working age in census year . These variables capture the change in native workers’
labor market outcomes over the considered decades measured as percentage points of the
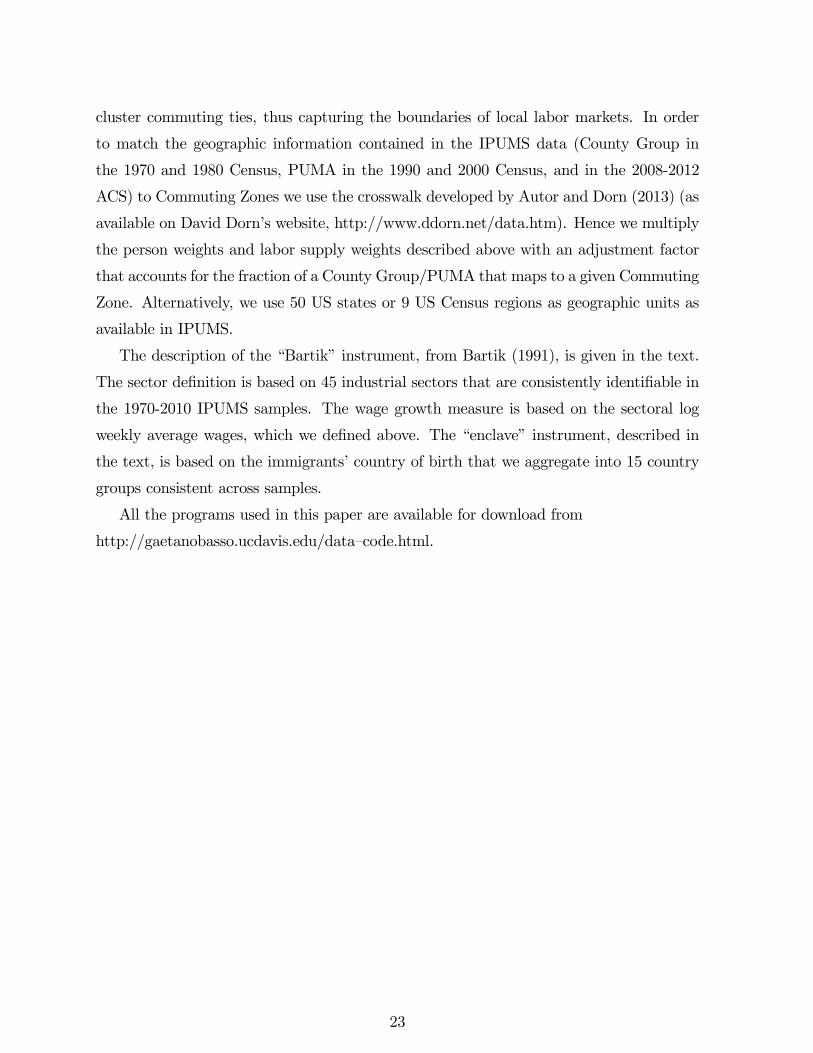
initial value. Figure 1 shows the variation of ∆() across US CZs considering the
whole 1970-2010 change and indicating with darker shades of grey the CZs with larger
increase of immigrants. Several CZs in California, Texas and Florida, but also on the
East Coast and in the Central States, show the largest values. Parts of the Midwest and
some Mountain States show the smallest increases. Figure 2 shows the geography of the
variable ∆ ln() across CZs also considering the change for the whole 1970-2010
period. We observe some fast growing wages in CZs of Texas, Florida and on the East
Coast, but also in the Mountain States.
As it is hard to discern positive or negative correlations from these maps we show in
2The detailed description of the samples, variables and their constructions using the IPUMS Census
and ACS data (Ruggles et al. 2015) is in the Data Appendix. In general, we have used the same definitions
of samples and variables as used in the book “Immigration Economics” By George Borjas (2014). All the
dollar amounts are expressed in $ as of 1999 adjusted using the BLS CPI-U All Items.
4
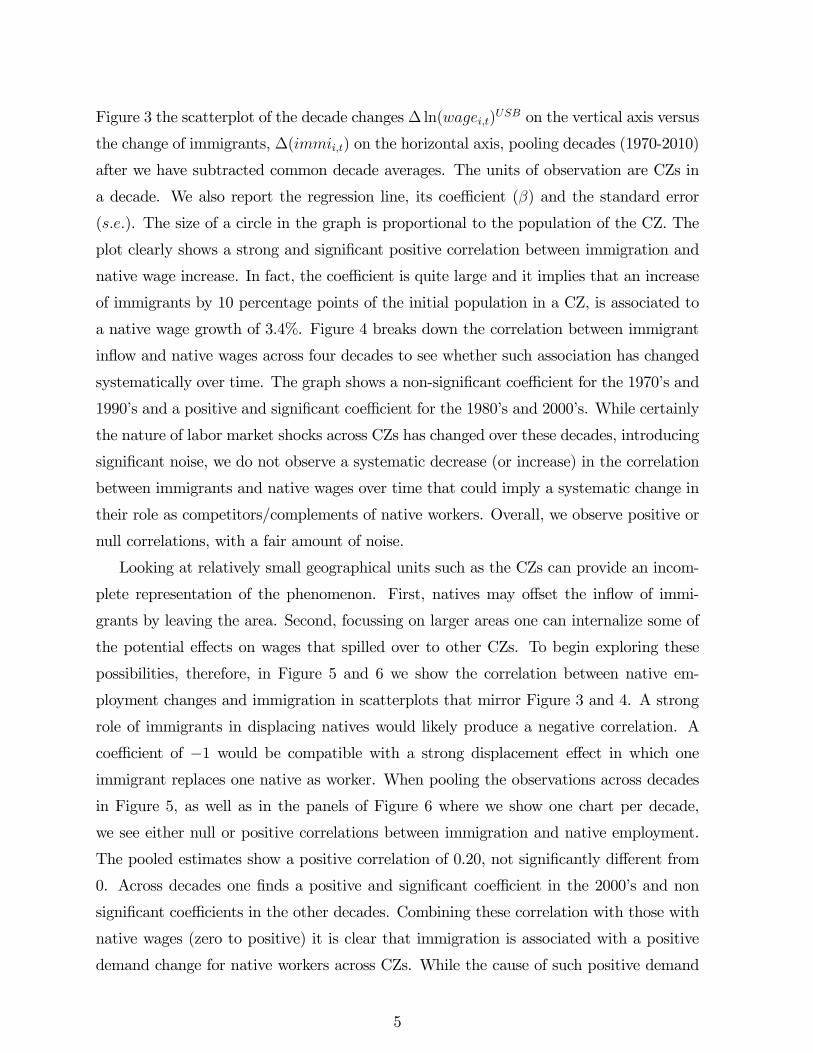
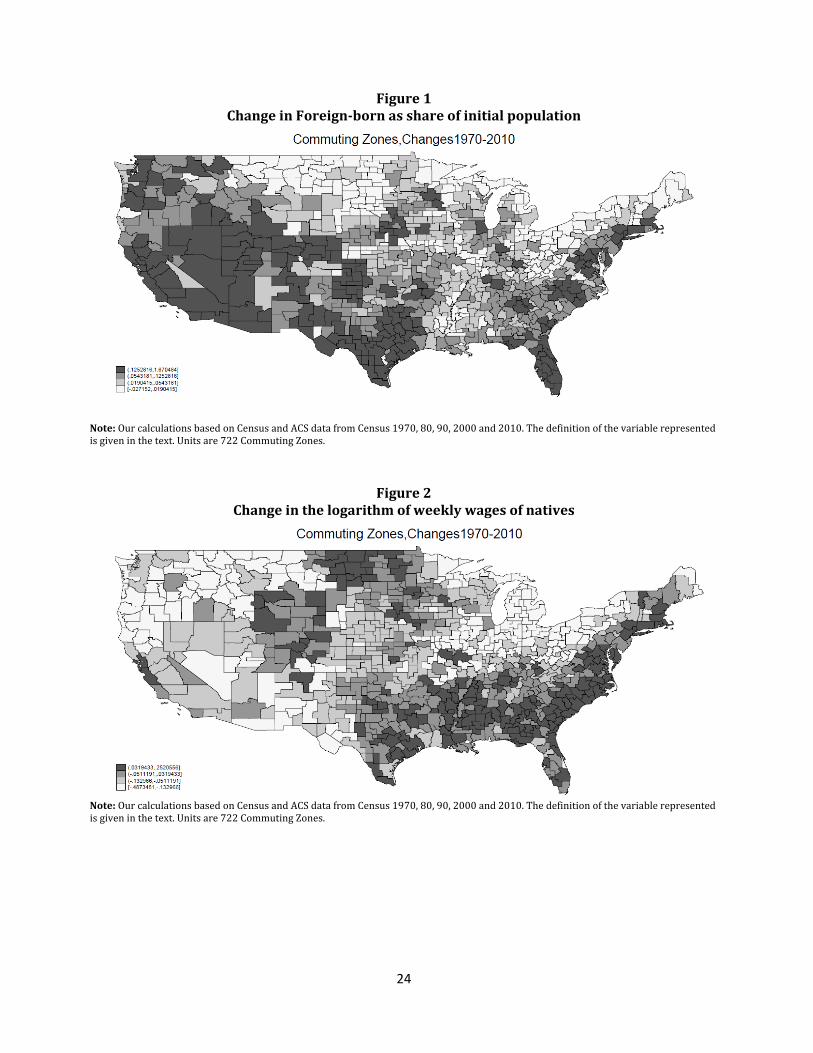
Figure 3 the scatterplot of the decade changes ∆ ln() on the vertical axis versus
the change of immigrants, ∆() on the horizontal axis, pooling decades (1970-2010)
after we have subtracted common decade averages. The units of observation are CZs in
a decade. We also report the regression line, its coefficient () and the standard error
(). The size of a circle in the graph is proportional to the population of the CZ. The
plot clearly shows a strong and significant positive correlation between immigration and
native wage increase. In fact, the coefficient is quite large and it implies that an increase
of immigrants by 10 percentage points of the initial population in a CZ, is associated to
a native wage growth of 3.4%. Figure 4 breaks down the correlation between immigrant
inflow and native wages across four decades to see whether such association has changed
systematically over time. The graph shows a non-significant coefficient for the 1970’s and
1990’s and a positive and significant coefficient for the 1980’s and 2000’s. While certainly
the nature of labor market shocks across CZs has changed over these decades, introducing
significant noise, we do not observe a systematic decrease (or increase) in the correlation
between immigrants and native wages over time that could imply a systematic change in
their role as competitors/complements of native workers. Overall, we observe positive or
null correlations, with a fair amount of noise.
Looking at relatively small geographical units such as the CZs can provide an incom-
plete representation of the phenomenon. First, natives may offset the inflow of immi-
grants by leaving the area. Second, focussing on larger areas one can internalize some of
the potential effects on wages that spilled over to other CZs. To begin exploring these
possibilities, therefore, in Figure 5 and 6 we show the correlation between native em-
ployment changes and immigration in scatterplots that mirror Figure 3 and 4. A strong
role of immigrants in displacing natives would likely produce a negative correlation. A
coefficient of −1 would be compatible with a strong displacement effect in which oneimmigrant replaces one native as worker. When pooling the observations across decades
in Figure 5, as well as in the panels of Figure 6 where we show one chart per decade,
we see either null or positive correlations between immigration and native employment.
The pooled estimates show a positive correlation of 0.20, not significantly different from
0. Across decades one finds a positive and significant coefficient in the 2000’s and non
significant coefficients in the other decades. Combining these correlation with those with
native wages (zero to positive) it is clear that immigration is associated with a positive
demand change for native workers across CZs. While the cause of such positive demand
5
change for native workers cannot be inferred from these correlations directly, we can es-
tablish two minimal findings. First, locations where immigrants go are those where native
labor markets are growing. This may certainly be driven by other factors, but at least
the inflow of immigrants does not reverse the positive demand shock. Second, we have
not found evidence of systematically changing correlation between native labor markets
outcomes and immigrants over decades.
Before trying to control more systematically for some observed and unobserved de-
terminants of native labor demand we consider an important differentiation in the labor
market for native workers. Workers of different skills are subject to different degrees of
immigrant competition and their schooling level is an important factor in determining
such competition. Workers with different schooling levels can be considered as different
and imperfectly substitutable labor inputs (see Borjas 2003, Ottaviano and Peri 2012
and Card 2009). In areas where immigrants are more skilled, highly educated natives
could suffer more competition than less educated natives. To the contrary, a larger inflow
of low educated immigrants produces competition for less educated natives and possibly
complements the skills of highly educated. On average, the inflow of immigrants in the
US during the considered period (1970-2010) has been largest among workers with no
high school degree (low-skilled). Hence separating workers with low education (at most
a high school degree) and those with high education (college educated or more), and
still considering aggregate immigration in CZs as explanatory variables, we want to see
if the correlation with native wages is consistent with a stronger competition effect on
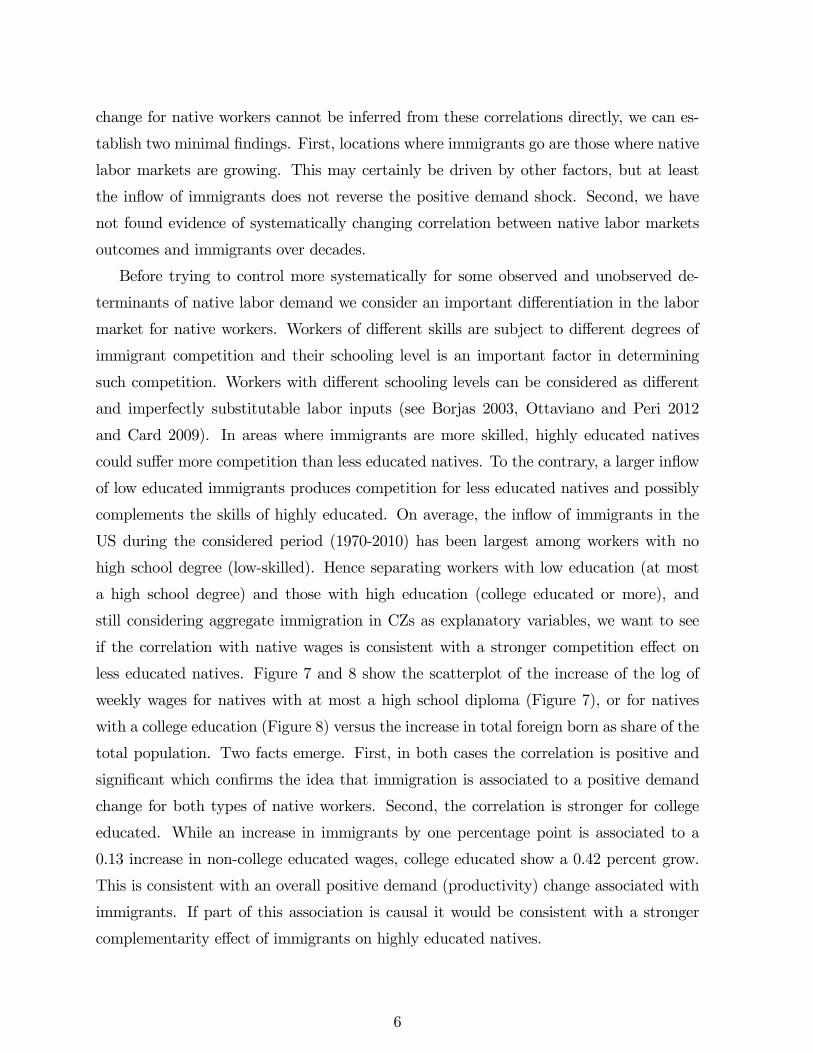
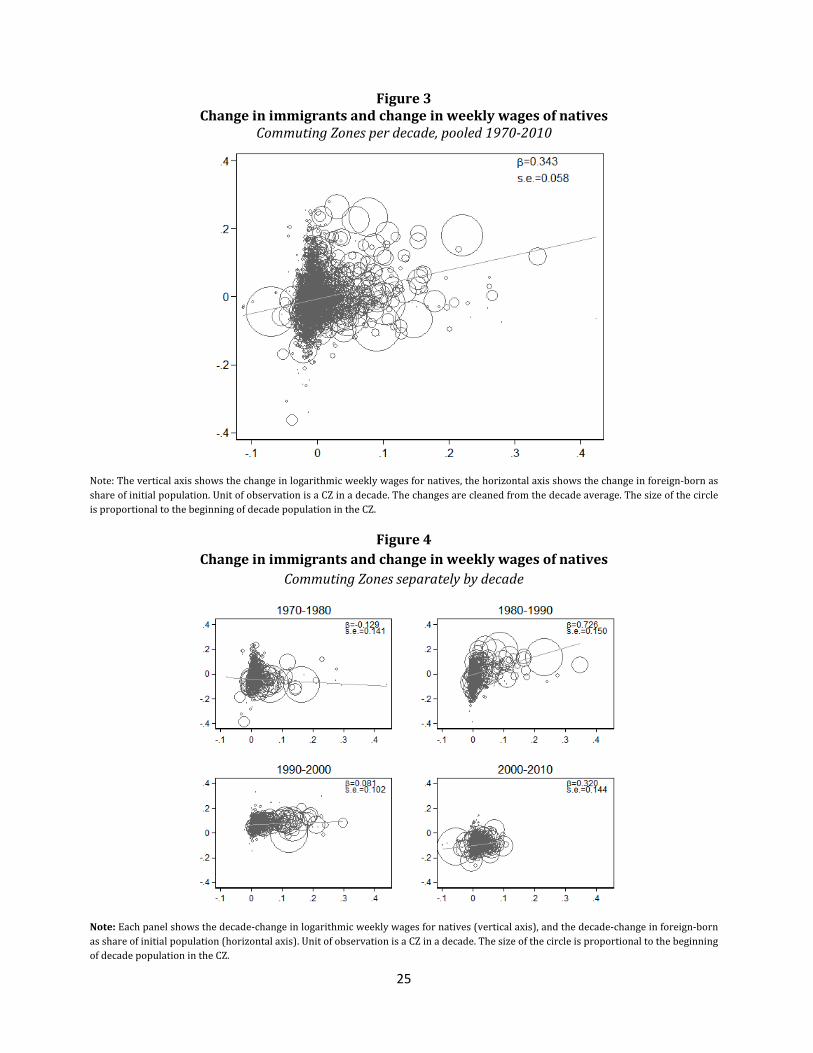
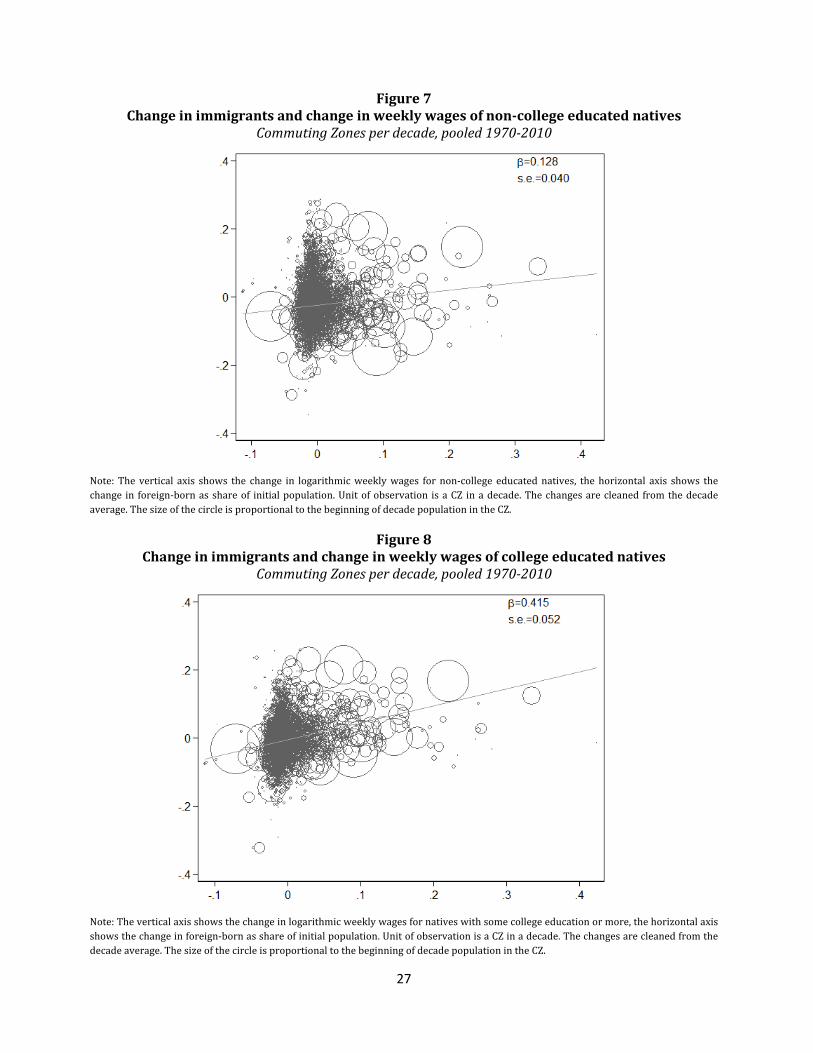
less educated natives. Figure 7 and 8 show the scatterplot of the increase of the log of
weekly wages for natives with at most a high school diploma (Figure 7), or for natives
with a college education (Figure 8) versus the increase in total foreign born as share of the
total population. Two facts emerge. First, in both cases the correlation is positive and
significant which confirms the idea that immigration is associated to a positive demand
change for both types of native workers. Second, the correlation is stronger for college
educated. While an increase in immigrants by one percentage point is associated to a
0.13 increase in non-college educated wages, college educated show a 0.42 percent grow.
This is consistent with an overall positive demand (productivity) change associated with
immigrants. If part of this association is causal it would be consistent with a stronger
complementarity effect of immigrants on highly educated natives.
6

3 Correlations and Regression Analysis
In order to analyze more systematically the correlations between immigrants and wage/employment
of natives we perform several regressions. Those allow us to control for an array of omitted
variables, some of them not observable (but common to location over time, or to decades
across locations) and some observable, or at least proxied by variables that can be con-
structed, such as measures of technological change. We run two types of regressions in
this section. The first set of regressions analyzes the impact of aggregate immigration in
a location (as proxied by the immigrant share in the working age population of that area)
either on native average performance (wage and employment) or on the performance of
college educated or non-college educated separately. The estimated regressions are of the
following type:
∆ ()
= + + ∆() + (1)
Where ()
is an outcome (such as wage or employment) for all US born workers,
or for an education group within them (college or non-college educated). The terms
and are fixed location and time effects. The term captures a zero-mean random
error. The coefficient of interest is and it describes the percent increase in the outcome
variables associated to an increase of immigrants by one percentage point of the total
population. These aggregate regressions aim at capturing the overall association between
immigrants as a whole and native outcomes. The limit of these regressions is that, if
other factors are not controlled for, the correlation is not informative of the causal effect
of immigrants on native outcomes.
A second group of regressions analyzes instead the correlation between immigrants and
native outcomes within skill-location cells. The skill cells are defined as four education
groups (no degree, high school degree, some college and college degree) by two experience
groups (at most twenty years of experience and more than twenty years of experience).
By selecting natives and immigrants in the same cell one is considering similar type of
workers, more likely to compete for similar jobs. By including fixed terms that control for
location-decade effects one is likely to absorb some of the omitted variables that may bias
the previous regression (1) hence reducing the risk of spurious correlations. However such a
strategy also absorbs with the fixed effects all the possible cross-skill complementarity and
aggregate externalities that immigrants workers generate. Namely, in these regressions
7

we estimate the effect of immigrants in the same skill group and location, considering
those in other skill-group in the same location as constant. While these regressions are
informative and allow us to include a much larger number of fixed effects as controls, one
has to emphasize the partial nature of the estimates that they produce. The estimated
regressions are of the form:
∆ ()
= + + + + + + ∆() + (2)
Where the index denotes the skill groups (eight of them divided into four education
by two experience groups) and the fixed effects include area, decade and skill effects plus
fixed effects for all the interactions between two of those attributes3. The value of in
these type of regressions has been considered as an estimate of the effect of immigrants
on natives in some studies (e.g. in Borjas 2014). However, even abstracting from omitted
variable bias this is at best, as pointed out in Ottaviano and Peri (2012), a partial, own-
skill effect of immigrants, reflecting only the impact on most similar natives’ wages and
absorbing the cross-skill complementarity and externalities in the area in the time-area
effects. If we were to omit the set of effects in the estimates then the regressions might
provide an average estimate of the own plus cross effects of immigrants, as long as other
omitted variables do not bias those effects.
3.1 Area Regressions: Average Effects
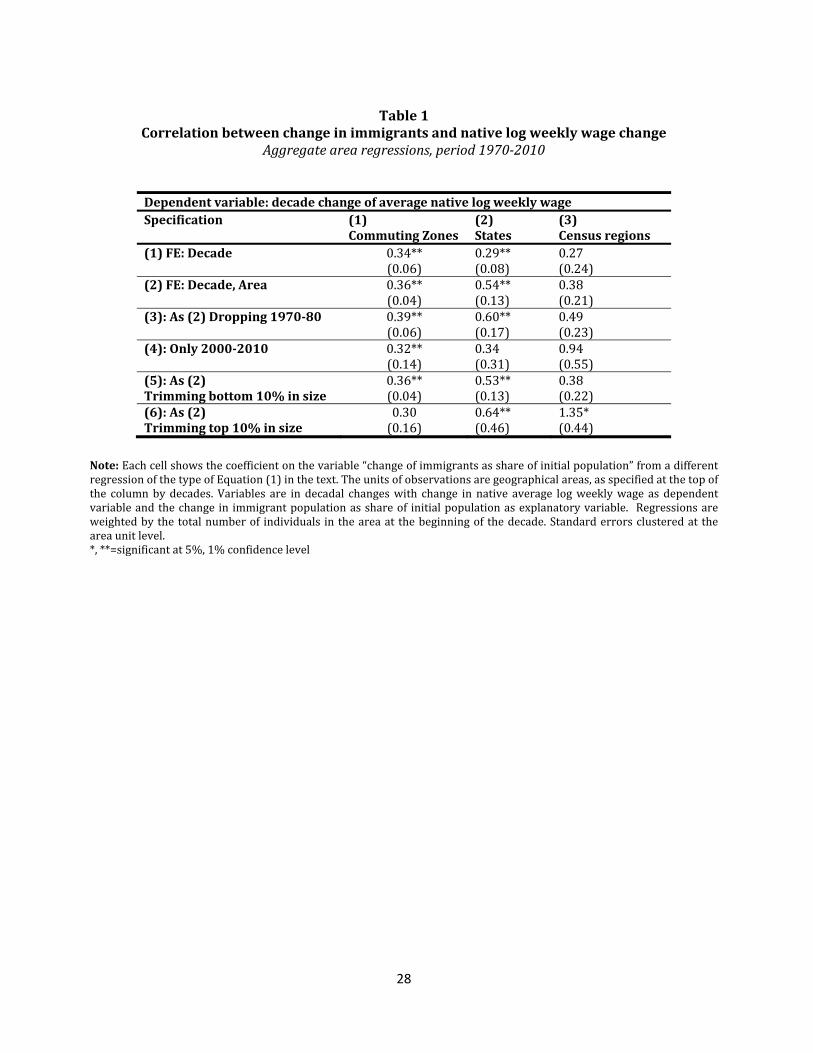
Table 1 shows the estimated coefficient from the aggregate regressions as in (1) when
the dependent variable is the change in logarithm of average weekly wage for natives. The
difference between columns is given by the geographical units of observation considered.
In column (1) the regression is run using observations for 722 Commuting Zones over
four decades. In column (2) we use 50 States over four decades and in column (3) we
use 9 Census regions over four decades. Across rows we estimate somewhat different
specifications. Row (1) includes only decade fixed effects while row (2) has decade and
geographic unit fixed effects. Row (2) is our preferred specification. In the row (3) we omit
the earlier decade (1970-80), while in row (4) we include the most recent decade of data
(2000-2010) only. Large changes in estimates across samples could reveal a systematically
changing nature of the link between immigration and wages consistent, for instance, of
3As usual, when including the cross-group effects one needs to omit the individual group effects, as
they are fully absorbed in the interactions.
8

significant spillovers out of the smaller geographical units. In the two bottom rows we
omit the smallest 10% of CZs and the largest 10% to see if extreme values drive the
correlation. Most of the estimated coefficients using CZs are not far from 0.4, and when
using larger geographical units the coefficient is also, usually around 0.4, but has some
variance as it can be as low as 0.27 and as large as 0.60.4 In most cases we cannot
reject the hypothesis that, for specifications in one row, the coefficients are the same
across all geographical units (columns 1 to 3). This suggests that spillovers of a potential
causal impact of immigrants are not so relevant as to invalidate correlations taken at the
level of a labor market. The relationship between immigrants and wages is stable across
specifications, geographical units and decades. While imprecision of the estimates limits
our confidence in any individual specification, taken together these estimates seems to
show a significantly positive correlation coefficient around 0.4.
Table 2 then shows the aggregate correlation between immigrants and native employ-
ment. In this case most of the estimates are not significantly different from 0. When
focussing on the last decade (row 4) and on smaller CZs (row 6) one gets imprecisely es-
timated positive correlations. Considering our preferred estimates in row (2) we observe
stable and consistently small and non-significant estimates of the correlation between im-
migration and native employment across all geographical units. No systematic difference
in the correlation between immigrants and native employment emerged across CZs, States
or Census regions when considering specifications in row (2). In particular, none of the
correlations is suggestive of displacement of natives that would imply a negative and sig-
nificant coefficient. Combining all wage and employment correlations, the area regressions
confirm the impression produced by the simple scatterplots. Immigration is associated,
on average, with an increase in demand for native workers and such association exists
at the very local (CZs) as well as the broader (Census region) geographical level. If im-
migrants are purely attracted by aggregate local demand shocks then these effects are
consistent with immigrants responding to those as natives do.5 But can we control for
some of those shocks? And can we analyze if the association between immigration and
native labor demand in specific skill groups is very different from this average effect? In
4The highest value for the region regression is 1.35 in the last row of column (3). As there are only 9
regions the regression is rather imprecise and standard error is quite large.5Recent analysis by Cadena and Kovak (2015) finds that low skilled immigrants respond to local
demand shocks more than natives. Their analysis is based on short-run variations but the high mobility
of immigrants can certainly be part of the reason for the positive correlation between native share of the
population and native wages and employment growth.
9

the next section we will analyze the skill structure of labor markets and the competition
effect of immigrants on similar workers.
3.2 Area-Skill-Cell Regressions: Partial Effects
Table 3 reports the estimates of coefficient for different specifications of regression (2).
In particular, those differ across columns for the geographical units used as observations
(in column (1) the units are Commuting Zones-by-skill in column (2) they are States-
by-skill in column (3) they are Census regions-by-skill). They differ across rows for the
progressive inclusion of more fixed effects (only area, skill and decade effects in row (1),
area-skill interactions and decade effects in row (2), area-skill and skill-decade interactions
in row (3) and all the two-way interactions in row (4)). The last row excludes the 1970-80
decade from the analysis.
The coefficients in row (4) estimate the own-skill partial effect of immigrants in the
skill-group and area once we control for total immigration in the area (that is captured
by the area-time fixed effects). Those values are close to 0. This is consistent with a
framework in which native and immigrants in a skill group are different enough that
the competition effect of similar immigrants is balanced by their complementarity effect
resulting in no wage impact. The other specifications, not including area-decade effects,
identify the average effect of combining own and cross-skill. Those are positive or close
to zero. In particular, the effects are attenuated and more imprecisely estimated at the
Census region level. This may be due to smaller variation as we are averaging across areas
with very different inflows of immigrants.
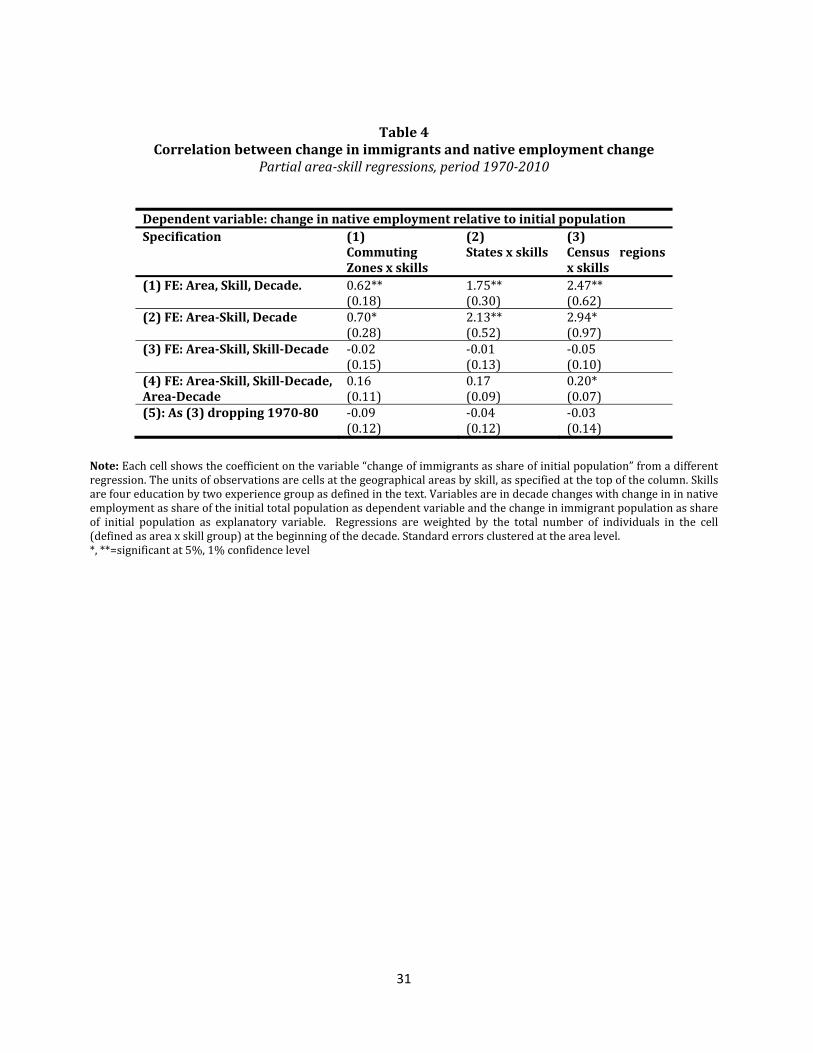
Table 4 shows the same specifications with the change in native employment as de-
pendent variable. Even in this case we observe positive and significant coefficients in the
first two rows, and non-significant coefficients in the other rows. These estimates are
consistent with a world in which either complementarity between immigrants and natives
prevails, or positive demand shocks for natives accompany inflow of immigrants in the
same area and skill group. They are not compatible, however, with a situation in which
supply driven changes in immigrants displace natives or depress their wages.
3.3 Area Regressions for More or Less Educated Natives
The combination of results from Tables 1 and 2 is consistent with a scenario in which
the inflow of immigrants is associated with a positive increase in demand for native work-
10
ers due to complementarity or externalities, together with a small competition effect on
native workers of similar skills. The cell-level analysis is useful to capture the fact that,
controlling for overall immigration in an area, skill groups with larger increase of immi-
grants do not experience especially negative or positive outcomes. Hence a part of the
positive aggregate effect in Table 1 must come from cross-group complementarity or ex-
ternalities. To learn how the complementarity-externality and competition effects (plus
potential omitted variables) influence wages and employment of natives in different skill
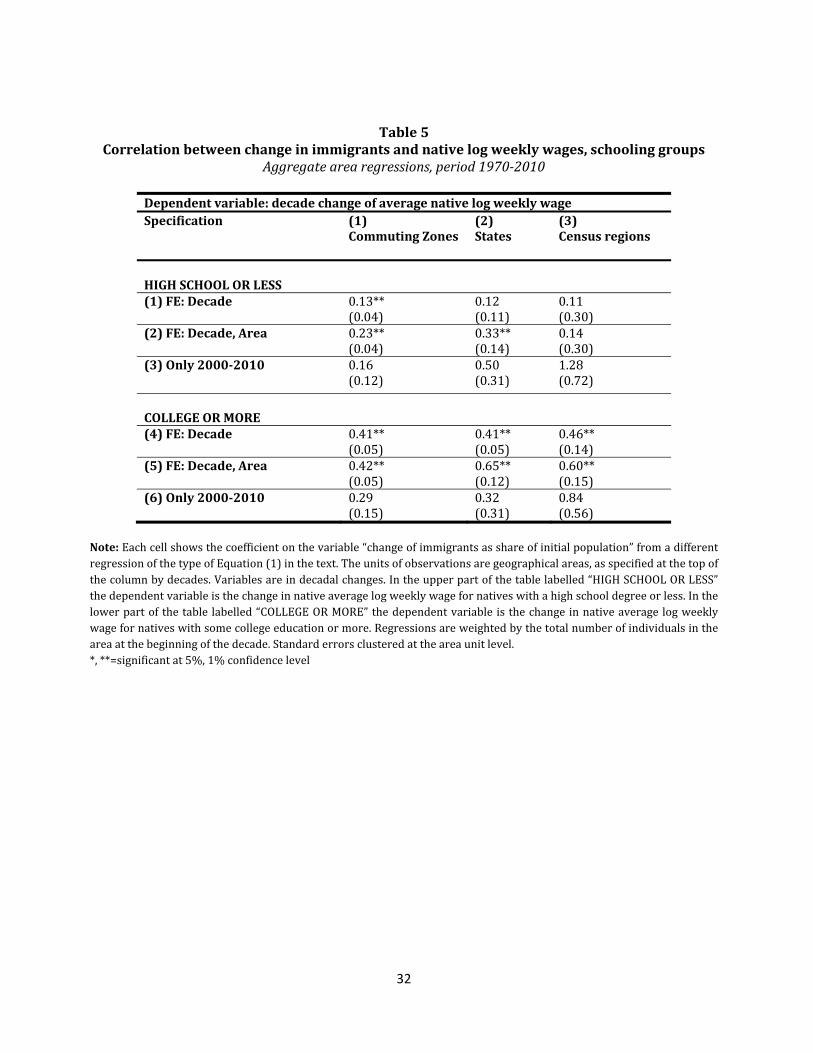
groups, we focus on more and less educated in separate regressions. In Table 5 we show
the effect on average log weekly wages of high school educated natives (upper part of the
table) and of college educated natives (lower part) separately. We estimate specification
(1) with the outcome ∆ ln() measured separately for each of the two education
groups. If immigration, as it appears so far, is accompanied by constant or increased labor
demand for native workers, with a larger boost for college educated natives, we should
observe zero or positive estimates in all entries and larger point estimates in the bottom
part of the table. This is exactly what we find. In specification (2), across columns, we
find correlation consistent with the fact that a 0.2-0.3% increase in less educated wages
is associated to one percentage point increase of immigrants in the population, and a
0.4-0.6% increase for college educated native wages is associated to the same increase of
immigrants. Limiting ourselves to the last decade, precision is lacking, but we find more
balanced effects on the two groups, consistently with the more college-intensive immigra-
tion of the recent decade. While only suggestive, these correlations overall are consistent
with immigration being beneficial to native labor demand, especially for college educated.
4 Omitted Variables and Identification of Causality
One important reason for the different performance of labor markets across locations dur-
ing the last decades has been the very different economic success of different industries.
High tech sectors in manufacturing and services have increased much their productivity,
propelled by the information and communication technology revolution and their de-
mand for workers especially of highly educated ones has surged. To the contrary part of
the manufacturing and service sector, characterized by simple, routine and non-cognitive
type of occupations have experienced stagnant wages and employment (e.g. Acemoglu
and Autor, 2011; Autor and Dorn 2013). As different geographical areas have different
specialization, some have suffered more from the decline of low performing industries and
11

other have benefitted more from the expansion of fast growing ones. Here we use the
different industry specialization of Commuting Zones in year 1970, and the differential
growth of wages across those industries, to construct an index of local sector-driven labor
demand. We then include this control that captures sector-driven labor demand growth
and we test whether the positive correlation between immigrants and native wage growth
survives.
Specifically, we construct an index of sector-specific growth, often called “Bartik”
instrument (from Bartik, 1991), as follows. Let us define as 1970 the share of employ-
ment in industry in the total employment of CZ , and let ∆ ln be the growth of
the log weekly average wages for workers in industry nationally between year 1970 and
year . Then the proxy for industry-driven growth in labor productivity (labor demand)
for workers in CZ will be defined as:
∆ =X
¡
1970∆ ln¢
for = 1980 1990 2000 2010 (3)
This index will be included as control in the regressions of Table 5. Table 6 shows
the results of specifications (1) and (2) of Table 5, estimated for CZs only and controlling
for ∆, the proxy for labor demand growth. Considering the more demanding
specification (2) we see that, while the demand growth proxied by ∆ is itself a
very important determinant of native wage growth for college and non-college educated,
its inclusion does not eliminate the positive and significant correlation between native
wages and growth in immigrant population. We still estimate a 0.2% increase in the wage
of non-college educated natives per percentage point of foreigners and a 0.4% increase for
wages of college educated natives.
An alternative way of making progress towards identification of the causal effect of im-
migrants on native labor market outcomes is, rather than controlling for demand changes,
to construct a proxy for the supply-driven shifts of the immigrant population. We then
use that as an instrumental variable for the changes in immigrants as share of the pop-
ulation. A popular way of doing this is to construct a so-called “shift-share” instrument
(as suggested by Altonji and Card 1991, Card 2001 and used in several papers since then)
using 0 the population of immigrants by nationality (), across US CZs () in year
0, that should be prior to the considered period, and augment these populations by the
aggregate growth factor of immigrants from that nationality in the US between year 0
and ,
0. This instrument is based on the idea that the distribution of foreign born of
12
nationality in CZ in 0 is uncorrelated with subsequent demand shifts and productivity
changes in that CZ. In our case we would instrument the variable ∆() with the
following imputed value:
d∆() =d − d−10d−10 + −10
where d =X
0 ∗
0
(4)
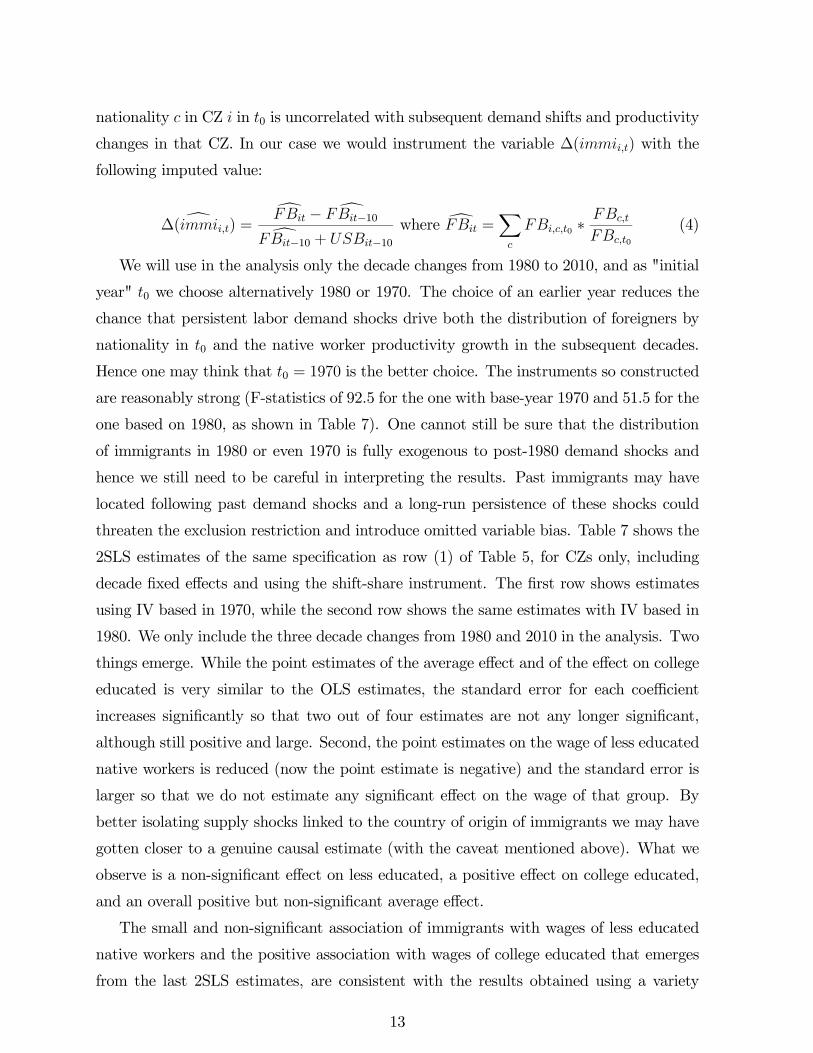
We will use in the analysis only the decade changes from 1980 to 2010, and as "initial
year" 0 we choose alternatively 1980 or 1970. The choice of an earlier year reduces the
chance that persistent labor demand shocks drive both the distribution of foreigners by
nationality in 0 and the native worker productivity growth in the subsequent decades.
Hence one may think that 0 = 1970 is the better choice. The instruments so constructed
are reasonably strong (F-statistics of 92.5 for the one with base-year 1970 and 51.5 for the
one based on 1980, as shown in Table 7). One cannot still be sure that the distribution
of immigrants in 1980 or even 1970 is fully exogenous to post-1980 demand shocks and
hence we still need to be careful in interpreting the results. Past immigrants may have
located following past demand shocks and a long-run persistence of these shocks could
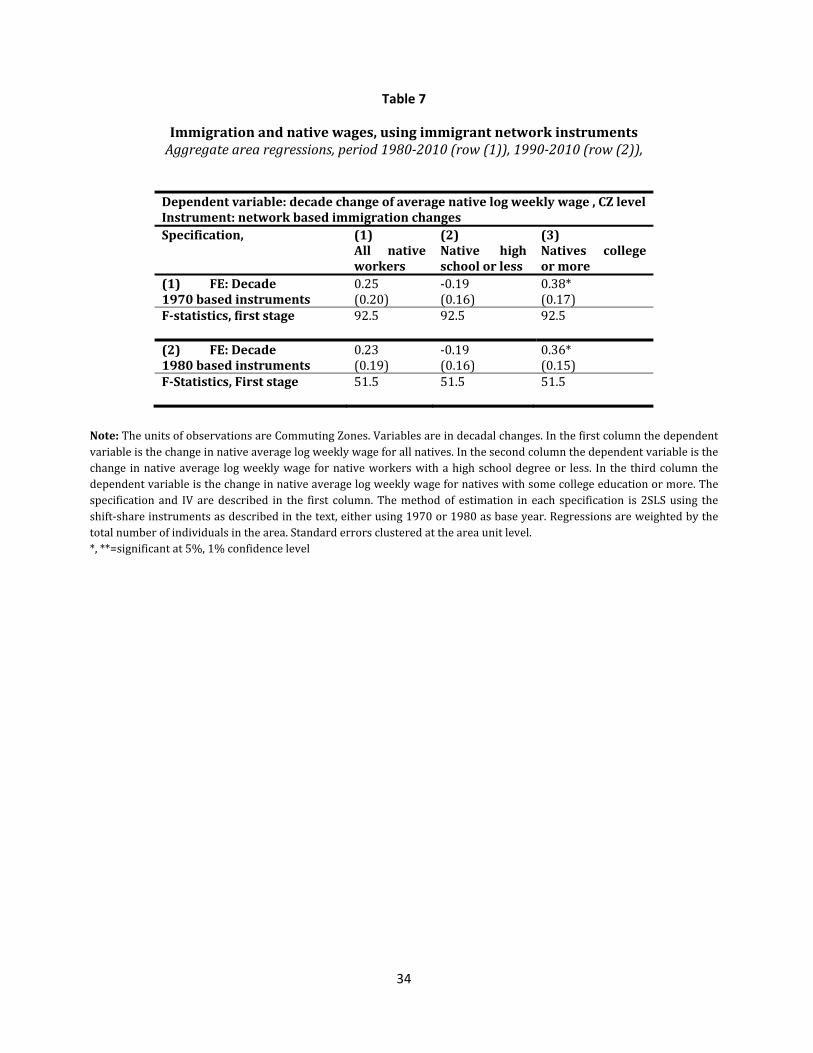
threaten the exclusion restriction and introduce omitted variable bias. Table 7 shows the
2SLS estimates of the same specification as row (1) of Table 5, for CZs only, including
decade fixed effects and using the shift-share instrument. The first row shows estimates
using IV based in 1970, while the second row shows the same estimates with IV based in
1980. We only include the three decade changes from 1980 and 2010 in the analysis. Two
things emerge. While the point estimates of the average effect and of the effect on college
educated is very similar to the OLS estimates, the standard error for each coefficient
increases significantly so that two out of four estimates are not any longer significant,
although still positive and large. Second, the point estimates on the wage of less educated
native workers is reduced (now the point estimate is negative) and the standard error is
larger so that we do not estimate any significant effect on the wage of that group. By
better isolating supply shocks linked to the country of origin of immigrants we may have
gotten closer to a genuine causal estimate (with the caveat mentioned above). What we
observe is a non-significant effect on less educated, a positive effect on college educated,
and an overall positive but non-significant average effect.
The small and non-significant association of immigrants with wages of less educated
native workers and the positive association with wages of college educated that emerges
from the last 2SLS estimates, are consistent with the results obtained using a variety
13
of methods and approaches. In the existing literature, both model based-approaches
(Peri and Sparber 2009, Ottaviano and Peri 2012, Ottaviano et al. 2013, D’Amuri and
Peri 2015, Peri 2012) and reduced form approaches (Ottaviano and Peri 2006, Ortega
and Peri 2015) show a positive average association of immigration with native wages,
and a smaller correlation with wages of less educated and a larger one with wages of
more educated natives. Overall, we think that the series of simple correlation presented
in this paper, while certainly not exhaustive, are urging us to understand better how
local economies in the US, and the national economy as a whole, absorb immigrants
and generate adjustment and new options for natives along several margins, which could
produce positive employment and wage effects.
Recent research trying to identify the effect of immigration on native wages has fo-
cussed on the possibility of using new identification strategies, namely changes in the
supply of immigrants not simply linked to the shift-share proxy. Often these papers rely
on changes in national policies that had differential regional effects, or combination of
policies and specific push-episodes from countries of origin that produce a sudden supply
shock. The problem is, often, that interesting policy changes and large push-driven mi-
grations are not available for all countries and hence this identification strategy is only
applicable to some specific cases. Some studies have tried to classify systematically immi-
gration policies across countries and they identify episodes of policy changes to see if and
how much they affected immigration (Ortega and Peri 2013, Docquier, Peri and Ruyssen
2014) with the intention of creating an international database of policies. Using such data
would allow us to use response to policy changes as supply shocks. Some recent papers
have used specific policies to that purpose. For instance, Foged and Peri (forthcoming)
uses the surge in Bosnian refugees to Denmark during the Bosnian war (1993-1995) and
the Danish refugee dispersal policy as exogenous supply shocks across Danish munici-
palities. The paper can then track the effects of differential refugees inflow on native
labor market outcomes and it finds a positive wage impact around 1% for an increase of
refugees by one percent of the population. This is due to refugees taking manual jobs and
pushing natives to take more complex jobs, with career upgrade and pay increases. Beerli
and Peri (2015) uses instead the opening of the Swiss border to mobility of workers from
the European Union between 1999 and 2004. Such process had different timing in two
types of Swiss regions and the authors use such different timing to perform a difference
in difference analysis of immigrant inflows and labor market outcomes. They find very
14
small and not significant average effects on native wages and employment.
Considering all evidence together it appears that to understand the connection between
immigration and native wages and employment one needs to envision mechanisms in which
local economies respond to immigration with a possible increase in the demand for native
workers. We will describe very briefly some of them in the next section.
5 Possible Adjustment Mechanisms
The key factors to understand the potentially positive effects of immigrants on demand
for native workers are three. First, immigrant and natives are different types of workers,
and they complement each other up to a certain degree. Second, immigrants may induce
changes in efficiency, specialization and technology adopted by native firms with positive
impact on all workers. Third, immigrants, especially the highly educated, may have
positive external effects due to their impact on innovation and new ideas. Let us briefly
review these arguments.
First, as pointed out in Ottaviano and Peri (2006) and Ottaviano and Peri (2012),
immigrants, even with similar schooling and education as natives, tend to do different
jobs from them. They bring different culture, different language skills, different abilities
and these factors differentiate them from natives. A natural dimension to think of this
differentiation is that immigrants have a comparative advantage in manual tasks relative
to language ones (Peri and Sparber 2009). Hence they will not so much compete directly
with natives, as they will create conditions for increased specialization where natives do
more communication-intensive jobs and immigrants do manual-type of tasks. This can
imply gains in productivity (Peri 2012, Ottaviano et al 2013). However, the differentiation
may also be along other dimensions. The services that immigrants provide, the products
that they manufacture are different from natives’. The complementarity/diversity of tasks
may drive efficient specialization and this implies gains in efficiency. But also the increased
diversity in productive services itself may be beneficial to production. The added benefits
from efficiency and diversity are the second reason that will result in higher wages and
more demand for the skills of native workers.
But it is not all. Some immigrants may have an especially positive effects on native
productivity and growth of the economy (Hunt and Gauthier-Loiselle 2010). Highly skilled
immigrants are largely scientists and engineers in the US (Peri, Shih and Sparber 2015)
and their contribution to ideas, innovation and new technologies drives higher productivity
15
and higher income for everybody in the US economy (Kerr and Lincoln 2010). A positive
externality from high human capital (as in Moretti 2004, or Docquier, Ozden and Peri
2014), or specifically from their role as scientists and engineers (as in Peri, Shih and
Sparber 2015), or simply from their diversity in abilities and ideas (as in Ortega and Peri
2014), are likely to be an added boost to US growth. In fact, in a dynamic perspective the
growth from more varied and better ideas can be the most important positive contribution
of immigrants to the US economy.6
6 Conclusions
In this review paper we have presented a battery of simple, yet increasingly demanding
correlations between immigrant population and native wages and employment across areas
of the United States. The prevailing fact emerging is an association of immigrants with
zero to positive changes in the demand for native workers. This is true at any geographical
level, for individual skill-level and in the aggregate and both when using employment and
wages. We have tried to rule out spurious determinants of this correlation by including
measures of local technology or common geographical factors, and the correlation has
remained, possibly attenuated for less educated native workers. Certainly we have not
been able to exhaust all omitted variables. Yet, these descriptive correlations result from
partial correlation coefficients with a rich set of controls and help us understand how
immigrant-induced supply shocks affect wages and employment of natives at the local
level. Moreover, we carefully defined our independent variable of interest as the flow of
migrants of a given skill group to an area between two census years, normalized by the
beginning of decade supply of labor in the same skill group. In contrast to this approach,
one could use the change in the stock of migrants in an area for a given skill group and
decade (see Borjas 2015). However, as recently noted by Card and Peri (forthcoming),
this latter approach would introduce a negative bias in the correlation between migration
and native wages, and a source of spurious correlation between migration and the change
in the number of natives in a given skill group.
Nevertheless, the prevalence of positive correlations implies that we should explore
seriously models and frameworks in which the local absorption of immigrants may gener-
6Borjas and Doran (2012, 2015) analyze the case study of academic mathematicians inflows to the US
after the collapse of the Soviet Union. While they find displacement of US academics to lower quality
academic jobs and nonAacademic positions, it is less clear how this event is generalizable to the effects
of high-skill migration on the economy due to the relatively rigid structure of the academic market.
16
ates an increase (or no change) in the demand for native workers. The literature briefly
reviewed in the previous section does this by collecting model-based empirical analysis
that provides a structural interpretation to the estimated parameters, and uses them to
assess the substitutability of immigrants and natives and the impact of immigrants (and
emigrants) on the productivity of natives. The literature often adopts a “production func-
tion” framework based on a nested CES approach, and search specifically for productivity
enhancing effects through spillovers, specialization, innovation. While the estimates re-
sulting from this approach may be sensitive to assumptions (as noted by Borjas 2014),
all the empirical evidence points to small effects of immigration on natives’ labor market
outcomes (Card and Peri forthcoming). More recently, researchers recognize that immi-
gration policies are the leverage that country have to affect immigration and its changes,
and they have tried to measure these policies and to leverage them in the analysis of the
impact of immigrants on economic outcomes. This quasi-experimental approach has also
revealed only small effects of migration on natives’ labor market outcomes consistent with
those estimated by the previous literature.
17

References
[1] Acemoglu, Daron and David Autor. (2011). “Skills, Tasks and Technologies: Implica-
tions for Employment and Earnings.” Handbook of Labor Economics, vol. 4B, pages
1043-1171.
[2] Altonji, Joseph G. and David Card (1991). “The Effects of Immigration on the Labor
Market Outcomes of Less-skilled Natives,” NBER Chapters, in: Immigration, Trade,
and the Labor Market, pages 201-234 National Bureau of Economic Research, Inc.
[3] Autor, David and David Dorn (2013). The Growth of Low-Skill Service Jobs and the
Polarization of the US Labor Market American Economic Review 2013, vol. 103(5),
pages 1553-1597.
[4] Autor, David, David Dorn and Gordon H. Hanson, (2013). “The China Syndrome:
Local Labor Market Effects of Import Competition in the United States,” American
Economic Review, American Economic Association, vol. 103(6), pages 2121-2168,
October.
[5] Bartik, Timothy J. (1991). “The Effects of Metropolitan Job Growth on the Size
Distribution of Family Income,” Upjohn Working Papers and Journal Articles 91-06,
W.E. Upjohn Institute for Employment Research.
[6] Beerli, Andreas and Giovanni Peri (2015). “The Labor Market Effects of Opening the
Border: New Evidence from Switzerland,” NBER Working Papers 21319, National
Bureau of Economic Research, Inc.
[7] Borjas, George J. (2003). “The Labor Demand Curve Is Downward Sloping: Reex-
amining The Impact Of Immigration On The Labor Market,” Quarterly Journal of
Economics, MIT Press, vol. 118(4), pages 1335-1374, November.
[8] Borjas, George J. (2014). “Immigration Economics" Harvard University Press.
[9] Borjas, George J., Richard B. Freeman and Lawrence F. Katz (1997). “How Much
Do Immigration and Trade Affect Labor Market Outcomes?,” Brookings Papers on
Economic Activity, Economic Studies Program, The Brookings Institution, vol. 28(1),
pages 1-90.
18
[10] Borjas, George J. and Kirk B. Doran (2012). “The Collapse of the Soviet Union and
the Productivity of American Mathematicians.” Quarterly Journal of Economics, vol.
127(3), pages 1143-1203.
[11] Borjas, George J. and Kirk B. Doran (2015). “Cognitive Mobility: Labor Market
Responses to Supply Shocks in the Space of Ideas,” Journal of Labor Economics,
University of Chicago Press, vol. 33(S1), pages S109-S145.
[12] Card, David (1990). “The impact of the Mariel boatlift on the Miami labor market,”
Industrial and Labor Relations Review, ILR Review, Cornell University, ILR School,
vol. 43(2), pages 245-257, January.
[13] Card, David (2001). “Immigrant Inflows, Native Outflows, and the Local Labor
Market Impacts of Higher Immigration,” Journal of Labor Economics, University
of Chicago Press, vol. 19(1), pages 22-64, January.
[14] Card, David (2009). “Immigration and Inequality,” American Economic Review,
American Economic Association, vol. 99(2), pages 1-21, May.
[15] Card, David and Giovanni Peri (forthcoming). “Immigration Economics: A Review,”
fortcoming in the Journal of Economic Literature, American Economic Association.
[16] D’Amuri, Francesco, Gianmarco I.P. Ottaviano and Giovanni Peri (2010). “The la-
bor market impact of immigration in Western Germany in the 1990s,” European
Economic Review, Elsevier, vol. 54(4), pages 550-570, May.
[17] D’Amuri, Francesco and Giovanni Peri (2014). “Immigration, Jobs, And Employ-
ment Protection: Evidence From Europe Before And During The Great Recession,”
Journal of the European Economic Association, European Economic Association,
vol. 12(2), pages 432-464, April.
[18] Docquier, Frédéric, Çaglar Ozden and Giovanni Peri (2014). “The Labour Market
Effects of Immigration and Emigration in OECD Countries,” Economic Journal,
Royal Economic Society, vol. 124(579), pages 1106-1145, September.
[19] Docquier, Frédéric, Giovanni Peri and Ilse Ruyssen (2014). “The Cross-country De-
terminants of Potential and Actual Migration,” International Migration Review, Wi-
ley Blackwell, vol. 48, pages S37-S99, September.
19

[20] Friedberg, Rachel M. (2001). “The Impact Of Mass Migration On The Israeli Labor
Market,” Quarterly Journal of Economics, MIT Press, vol. 116(4), pages 1373-1408,
November.
[21] Friedberg, Rachel M. and Jennifer Hunt (1995). “The Impact of Immigrants on Host
CountryWages, Employment andGrowth,” Journal of Economic Perspectives, Amer-
ican Economic Association, vol. 9(2), pages 23-44, Spring.
[22] Foged, Mette and Giovanni Peri (forthcoming). “Immigrants’ Effect on Native Work-
ers: New Analysis on Longitudinal Data,” forthcoming in the American Economic
Journal: Applied Economics.
[23] Grossman, Jean Baldwin (1982). “The Substitutability of Natives and Immigrants in
Production,” The Review of Economics and Statistics, MIT Press, vol. 64(4), pages
596-603, November.
[24] Hunt, Jennifer and Marjolaine Gauthier-Loiselle (2010). “How Much Does Immigra-
tion Boost Innovation?” American Economic Journal: Macroeconomics, American
Economic Association, vol. 2(2), pages 31-56.
[25] Kerr, William and William F. Lincoln (2010). “The Supply Side of Innovation: H-1B
Visa Reforms and U.S. Ethnic Invention.” Journal of Labor Economics, vol. 28(3),
pages 473-508.
[26] Ottaviano, Gianmarco I. P. and Giovanni Peri (2012). “Rethinking The Effect Of
Immigration On Wages,” Journal of the European Economic Association, European
Economic Association, vol. 10(1), pages 152-197, February.
[27] Ottaviano, Gianmarco I. P., Giovanni Peri and Greg C. Wright (2013). “Immigration,
Offshoring, and American Jobs,” American Economic Review, American Economic
Association, vol. 103(5), pages 1925-59, August.
[28] Ortega, Francesc and Giovanni Peri (2014). “Openness and income: The roles of
trade and migration,” Journal of International Economics, Elsevier, vol. 92(2), pages
231-251.
[29] Peri, Giovanni (2012). “The Effect Of Immigration On Productivity: Evidence From
U.S. States,” The Review of Economics and Statistics, MIT Press, vol. 94(1), pages
348-358, February.
20

[30] Peri, Giovanni and Chad Sparber (2009). “Task Specialization, Immigration, and
Wages,” American Economic Journal: Applied Economics, American Economic As-
sociation, vol. 1(3), pages 135-69, July.
[31] Peri, Giovanni, Kevin Shih and Chad Sparber (2015). “STEM Workers, H-1B Visas,
and Productivity in US Cities,” Journal of Labor Economics, University of Chicago
Press, vol. 33(S1), pages S225 - S255.
[32] Ruggles, Steven, Katie Genadek, Ronald Goeken, Josiah Grover, and Matthew Sobek
(2015). “Integrated Public Use Microdata Series: Version 6.0 [Machine-readable data-
base].” Minneapolis: University of Minnesota.
21
Appendix: Data
The data used to construct our dependent and independent variables are drawn from the
US Census public use microdata as available from IPUMS (Ruggles et al. 2015). We use
data from 1970 (aggregating two 1% metropolitan area samples), 1980, 1990 and 2000
(5% samples), as well as the 2008-2012 American Community Survey, which creates a
5% sample around 2010 that we use for that year. The samples that measure population
include all individuals age 18-64 not residing in group quarters, while the employment
sample only include individuals who worked a positive amount of weeks in the previous
year. The population and employment samples are weighted by the Census personal
weight. The samples used to measure wages include individuals age 18-64, who are not
attending school at the time of the survey, who worked a positive amount of hours and
weeks in the previous year, and who received strictly positive wage income. We also
exclude from the wage sample self-employed and unpaid family workers. The measure of
wage used throughout the paper is the logarithm of weekly wages that we define as the
total income from wages divided by weeks worked in the previous year. Top-coded income
from wages observations are multiplied by 1.5. All the dollar amounts are expressed in
$ as of 1999 adjusted using the BLS CPI-U All Items. The wage samples are weighted
by the product of the Census personal weight and the number of weeks worked in the
previous year.
All the dependent variables used in the paper are for the native population only. We
define as foreign born, or immigrants, all the individuals who are born abroad, including
those who become naturalized citizens. We define low-skilled workers (or “high school
or less”) as those with either 12 completed years of schooling and/or a high school or
equivalent diploma, and as high-skilled workers (or “college or more”) those with at least
one year of college or more. We also breakdown these definitions further into four groups:
high school dropouts (with less than 12 years of schooling), high school graduates (12
years of schooling and/or a high school or equivalent diploma), some college (at least one
year of college and/or an Associate’s degree), college graduates or more (Bachelor’s degree
or higher). Finally, we define two experience groups: workers with at most twenty years
of experience, and more than twenty years of experience.
We use as main geographical unit of analysis 722 Commuting Zones that encompass
the 48 adjoining US states, thus dropping Alaska and Hawaii. Commuting Zones are
clusters of counties that are characterized by strong within-cluster and weak between-
22
cluster commuting ties, thus capturing the boundaries of local labor markets. In order
to match the geographic information contained in the IPUMS data (County Group in
the 1970 and 1980 Census, PUMA in the 1990 and 2000 Census, and in the 2008-2012
ACS) to Commuting Zones we use the crosswalk developed by Autor and Dorn (2013) (as
available on David Dorn’s website, http://www.ddorn.net/data.htm). Hence we multiply
the person weights and labor supply weights described above with an adjustment factor
that accounts for the fraction of a County Group/PUMA that maps to a given Commuting
Zone. Alternatively, we use 50 US states or 9 US Census regions as geographic units as
available in IPUMS.
The description of the “Bartik” instrument, from Bartik (1991), is given in the text.
The sector definition is based on 45 industrial sectors that are consistently identifiable in
the 1970-2010 IPUMS samples. The wage growth measure is based on the sectoral log
weekly average wages, which we defined above. The “enclave” instrument, described in
the text, is based on the immigrants’ country of birth that we aggregate into 15 country
groups consistent across samples.
All the programs used in this paper are available for download from
http://gaetanobasso.ucdavis.edu/data—code.html.
23
24
Figure 1 Change in Foreign-born as share of initial population
Note: Our calculations based on Census and ACS data from Census 1970, 80, 90, 2000 and 2010. The definition of the variable represented is given in the text. Units are 722 Commuting Zones.
Figure 2 Change in the logarithm of weekly wages of natives
Note: Our calculations based on Census and ACS data from Census 1970, 80, 90, 2000 and 2010. The definition of the variable represented is given in the text. Units are 722 Commuting Zones.
25
Figure 3 Change in immigrants and change in weekly wages of natives
Commuting Zones per decade, pooled 1970-2010
Note: The vertical axis shows the change in logarithmic weekly wages for natives, the horizontal axis shows the change in foreign-born as share of initial population. Unit of observation is a CZ in a decade. The changes are cleaned from the decade average. The size of the circle is proportional to the beginning of decade population in the CZ. Figure 4
Change in immigrants and change in weekly wages of natives Commuting Zones separately by decade
Note: Each panel shows the decade-change in logarithmic weekly wages for natives (vertical axis), and the decade-change in foreign-born as share of initial population (horizontal axis). Unit of observation is a CZ in a decade. The size of the circle is proportional to the beginning of decade population in the CZ.

26
Figure 5 Change in immigrants and change native employment
Commuting Zones per decade, pooled 1970-2010
Note: The vertical axis shows the change in native employment relative to total employment at the beginning of the decade. The horizontal axis shows the change in foreign-born as share of initial population. Unit of observation is a CZ in a decade. The changes are cleaned from the decade average. The size of the circle is proportional to the beginning of decade population in the CZ. Figure 6
Change in immigrants and change in native employment Commuting Zones separately by decade
Note: Each panel shows the decade-changes in native employment relative to total employment at the beginning of the decade (vertical axis), and the decade-change in foreign-born as share of initial population. Unit of observation is a CZ in a decade. The size of the circle is proportional to the beginning of decade population in the CZ.
27
Figure 7 Change in immigrants and change in weekly wages of non-college educated natives
Commuting Zones per decade, pooled 1970-2010
Note: The vertical axis shows the change in logarithmic weekly wages for non-college educated natives, the horizontal axis shows the change in foreign-born as share of initial population. Unit of observation is a CZ in a decade. The changes are cleaned from the decade average. The size of the circle is proportional to the beginning of decade population in the CZ. Figure 8
Change in immigrants and change in weekly wages of college educated natives Commuting Zones per decade, pooled 1970-2010
Note: The vertical axis shows the change in logarithmic weekly wages for natives with some college education or more, the horizontal axis shows the change in foreign-born as share of initial population. Unit of observation is a CZ in a decade. The changes are cleaned from the decade average. The size of the circle is proportional to the beginning of decade population in the CZ.
28
Table 1
Correlation between change in immigrants and native log weekly wage change Aggregate area regressions, period 1970-2010
Dependent variable: decade change of average native log weekly wage Specification (1)
Commuting Zones (2)States
(3) Census regions
(1) FE: Decade 0.34**(0.06) 0.29**(0.08) 0.27 (0.24) (2) FE: Decade, Area 0.36**(0.04) 0.54**(0.13) 0.38 (0.21) (3): As (2) Dropping 1970-80 0.39**(0.06) 0.60**(0.17) 0.49 (0.23) (4): Only 2000-2010 0.32**(0.14) 0.34(0.31) 0.94 (0.55) (5): As (2) Trimming bottom 10% in size
0.36**(0.04) 0.53**(0.13) 0.38 (0.22) (6): As (2) Trimming top 10% in size
0.30(0.16) 0.64**(0.46) 1.35* (0.44) Note: Each cell shows the coefficient on the variable “change of immigrants as share of initial population” from a different regression of the type of Equation (1) in the text. The units of observations are geographical areas, as specified at the top of the column by decades. Variables are in decadal changes with change in native average log weekly wage as dependent variable and the change in immigrant population as share of initial population as explanatory variable. Regressions are weighted by the total number of individuals in the area at the beginning of the decade. Standard errors clustered at the area unit level. *, **=significant at 5%, 1% confidence level

29
Table 2
Correlation between change in immigrants and native employment change Aggregate area regressions, period 1970-2010
Dependent variable: change in native employment relative to initial population Specification (1)
Commuting Zones
(2)States
(3) Census regions
(1) FE: Decade 0.20(0.19) 0.32(0.29) 0.46 (0.36) (2) FE: Decade, Area 0.02(0.14) 0.05(0.10) 0.09 (0.23) (3): As (2) Dropping 1970-80 -0.05(0.11) -0.02(0.13) 0.03 (0.30) (4): Only 2000-2010 0.84**(0.31) 1.04**(0.23) 1.75** (0.40) (5): As (2) Trimming bottom 10% in size
0.02(0.14) 0.04(0.10) 0.14 (0.27) (6): As (2) Trimming top 10% in size
1.11**(0.40) 0.54*(0.27) 0.99* (0.39) Note: Each cell shows the coefficient on the variable “change of immigrants as share of initial population” from a different regression of the type of Equation (1) in the text. The units of observations are geographical areas, as specified at the top of the column. Variables are in decadal changes with change in native employment as share of initial population as dependent variable and the change in immigrant population as share of initial population as explanatory variable. Regressions are weighted by the total number of individuals in the area at the beginning of the decade. Standard errors clustered at the regional unit level. *, **=significant at 5%, 1% confidence level

30
Table 3 Correlation between change in immigrants and native log weekly wage change
Partial area-skill regressions, period 1970-2010
Dependent variable: decade change of average native log weekly wage Specification (1)
Commuting Zones x skills
(2)States x skills
(3) Census regions x skills
(1) FE: Area, Skill, Decade. 0.17**(0.02) 0.04(0.02) -0.03 (0.07) (2) FE: Area-Skill, Decade 0.18**(0.02) 0.05(0.04) -0.03 (0.09) (3) FE: Area-Skill, Skill-Decade 0.24**(0.03) 0.18**(0.05) 0.14 (0.12) (4) FE: Area-Skill, Skill-Decade, Area-Decade
0.05*(0.02) 0.04(0.03) 0.01 (0.08) (5): As (3) dropping 1970-80 0.28**(0.04) 0.24**(0.07) 0.25 (0.17)
Note: Each cell shows the coefficient on the variable “change of immigrants as share of initial population” from a different regression. The units of observations are cells at the geographical areas by skill, as specified at the top of the column. Skills are four education by two experience group as defined in the text. Variables are in decade changes with change in native average log weekly wage as dependent variable and the change in immigrant population as share of initial population as explanatory variable. Regressions are weighted by the total number of individuals in the cell (defined as area x skill group) at the beginning of the decade. Standard errors clustered at the area level. *, **=significant at 5%, 1% confidence level
31
Table 4 Correlation between change in immigrants and native employment change
Partial area-skill regressions, period 1970-2010
Dependent variable: change in native employment relative to initial population Specification (1)
Commuting Zones x skills
(2)States x skills
(3) Census regions x skills
(1) FE: Area, Skill, Decade. 0.62**(0.18) 1.75**(0.30) 2.47** (0.62) (2) FE: Area-Skill, Decade 0.70*(0.28) 2.13**(0.52) 2.94* (0.97) (3) FE: Area-Skill, Skill-Decade -0.02(0.15) -0.01(0.13) -0.05 (0.10) (4) FE: Area-Skill, Skill-Decade, Area-Decade
0.16(0.11) 0.17(0.09) 0.20* (0.07) (5): As (3) dropping 1970-80 -0.09(0.12) -0.04(0.12) -0.03 (0.14)
Note: Each cell shows the coefficient on the variable “change of immigrants as share of initial population” from a different regression. The units of observations are cells at the geographical areas by skill, as specified at the top of the column. Skills are four education by two experience group as defined in the text. Variables are in decade changes with change in in native employment as share of the initial total population as dependent variable and the change in immigrant population as share of initial population as explanatory variable. Regressions are weighted by the total number of individuals in the cell (defined as area x skill group) at the beginning of the decade. Standard errors clustered at the area level. *, **=significant at 5%, 1% confidence level
32
Table 5 Correlation between change in immigrants and native log weekly wages, schooling groups
Aggregate area regressions, period 1970-2010
Dependent variable: decade change of average native log weekly wage Specification (1)
Commuting Zones (2)States
(3) Census regions
HIGH SCHOOL OR LESS (1) FE: Decade 0.13**(0.04) 0.12(0.11) 0.11 (0.30) (2) FE: Decade, Area 0.23**(0.04) 0.33**(0.14) 0.14 (0.30) (3) Only 2000-2010 0.16(0.12) 0.50(0.31) 1.28 (0.72) COLLEGE OR MORE (4) FE: Decade 0.41**(0.05) 0.41**(0.05) 0.46** (0.14) (5) FE: Decade, Area 0.42**(0.05) 0.65**(0.12) 0.60** (0.15) (6) Only 2000-2010 0.29(0.15) 0.32(0.31) 0.84 (0.56)
Note: Each cell shows the coefficient on the variable “change of immigrants as share of initial population” from a different regression of the type of Equation (1) in the text. The units of observations are geographical areas, as specified at the top of the column by decades. Variables are in decadal changes. In the upper part of the table labelled “HIGH SCHOOL OR LESS” the dependent variable is the change in native average log weekly wage for natives with a high school degree or less. In the lower part of the table labelled “COLLEGE OR MORE” the dependent variable is the change in native average log weekly wage for natives with some college education or more. Regressions are weighted by the total number of individuals in the area at the beginning of the decade. Standard errors clustered at the area unit level. *, **=significant at 5%, 1% confidence level

33
Table 6 Immigration and native wages, including “Bartik” controls for change in labor demand
Aggregate area regressions, Commuting Zones period 1970-2010
Dependent variable: decade change of average native log weekly wage , CZ level Specification, (1)
All native workers (2)Native high school or less
(3) Natives college or more
(1) FE: Decade Coefficient onImmi) 0.28** (0.04) 0.07**(0.03) 0.36** (0.04) Coefficient on Bartik) 2.74** (0.29) 2.65**(0.40) 2.30** (0.26) (2) FE: Decade, Area Coefficient on Immi) 0.34** (0.06) 0.20**(0.06) 0.40** (0.05) Coefficient on Bartik) 2.52** (0.41) 2.49**(0.56) 2.16** (0.36)
Note: The units of observations are Commuting Zones. Variables are in decadal changes. In the first column the dependent variable is the change in native average log weekly wage for all natives. In the second column the dependent variable is the change in native average log weekly wage for native workers with a high school degree or less. In the third column the dependent variable is the change in native average log weekly wage for natives with some college education or more. The explanatory variables and specification are described in the first column. Regressions are weighted by the total number of individuals in the area at the beginning of the decade. Standard errors clustered at the area unit level. *, **=significant at 5%, 1% confidence level
34
Table 7
Immigration and native wages, using immigrant network instruments Aggregate area regressions, period 1980-2010 (row (1)), 1990-2010 (row (2)),
Dependent variable: decade change of average native log weekly wage , CZ level Instrument: network based immigration changes Specification, (1)
All native workers
(2)Native high school or less
(3)Natives college or more
(1) FE: Decade 1970 based instruments 0.25(0.20) -0.19(0.16) 0.38* (0.17) F-statistics, first stage 92.5 92.5 92.5 (2) FE: Decade 1980 based instruments 0.23(0.19) -0.19(0.16) 0.36* (0.15) F-Statistics, First stage
51.5 51.5 51.5 Note: The units of observations are Commuting Zones. Variables are in decadal changes. In the first column the dependent variable is the change in native average log weekly wage for all natives. In the second column the dependent variable is the change in native average log weekly wage for native workers with a high school degree or less. In the third column the dependent variable is the change in native average log weekly wage for natives with some college education or more. The specification and IV are described in the first column. The method of estimation in each specification is 2SLS using the shift-share instruments as described in the text, either using 1970 or 1980 as base year. Regressions are weighted by the total number of individuals in the area. Standard errors clustered at the area unit level. *, **=significant at 5%, 1% confidence level