Embed Size (px)
Citation preview

THE ASSOCIATION OF TOTAL QUALITY
MANAGEMENT AND FINANCIAL PERFORMANCE IN
SELECTED SOUTH AFRICAN INFORMATION
TECHNOLOGY ORGANISATIONS
Jaromir Vomacka
A research report submitted to the Faculty of Engineering and the Built Environment,
University of Witwatersrand, Johannesburg, in partial fulfilment of the requirements
for the degree of Master of Science in Engineering.
Johannesburg, 2008

Page i
Declaration
I declare that this research project is my own, unaided work. It is being submitted for
the degree of Master of Science of Engineering in the University of the
Witwatersrand, Johannesburg. It has not been submitted before for any degree or
examination in any other university.
___________________________________
Jaromir Vomacka
February 2008

Page ii
Abstract This study evaluates Total Quality Management (TQM) implementation and its
association with financial performance in ten South African Information Technology
(IT) organisations listed on the JSE. It uses a cross-sectional survey that uses
questionnaires and interviews to obtain data on TQM at the selected organisations. A
descriptive analysis of the data indicates that the organisations with higher TQM
scores prove to do better in the financial area, but the null hypothesis of no association
between TQM and financial performance cannot be rejected.
An exploration of current and future trends with regards to TQM, quality management
philosophies in general, and the IT industry in particular is also undertaken. The
traditional ideology behind TQM remains in place, but needs an adjustment. A model
is formed for an integrated management system that includes concerns for internal and
external influences in the IT sector.

Page iii
Acknowledgements
I wish to express my gratitude to the following people for assisting me in my
research:
Professor Snaddon, first, for guiding me to take on a Masters Degree in Industrial
Engineering. Second, for his patience and guidance in his role as my supervisor. He
continually steered me in the right direction when I got off track and dismayed.
The representatives at the various IT organisations selected who permitted and
facilitated my research. In addition to supplying me with any information I required,
they all spared some time to provide views and approaches to total quality
management at IT organisations in South Africa.
My parents whom without any of this would not be possible. They have always
believed in me and made me believe in myself. They have sacrificed much for me and
in allowing me to complete my studies. For their never-ending love, drive, support,
help, and enthusiasm, I dedicate this work to them with all my love and gratitude.

Page iv
Table of Contents
Declaration......................................................................................................................i Abstract ..........................................................................................................................ii Acknowledgements...................................................................................................... iii Table of Contents..........................................................................................................iv List of Figures ...............................................................................................................ix List of Tables ................................................................................................................ix PART ONE: INTRODUCTION....................................................................................1 Chapter One: Introduction........................................................................................1
1.1. Introduction....................................................................................................1 1.2. The Research Objectives................................................................................1 1.3. Layout of the Research Project ......................................................................2 1.4. Assumption ....................................................................................................3 1.5. Limitations of the Study.................................................................................3 1.6. Importance of Conclusions ............................................................................5
PART TWO: LITERATURE REVIEW........................................................................6 Chapter Two: Theories of Total Quality Management.........................................6
2.1. Introduction....................................................................................................6 2.2. Common Elements of Quality .......................................................................6 2.3. Into the 21st Century.......................................................................................8
Chapter Three: The Principles of Total Quality Management................................9 3.1. Introduction....................................................................................................9 3.2. Background – Quality and TQM ...................................................................9 3.3. Quality Management Entities ......................................................................13
3.3.1. ISO 9000 Standard...............................................................................13 3.3.2. ISO 9000: 2000 Standard.....................................................................14 3.3.3. The Malcolm Baldrige Quality Award ................................................16 3.3.4. The Deming Prize ................................................................................18 3.3.5. The American Quality Centre Benchmarking Awards........................18 3.3.6. South African Excellence Model (SAEM) ..........................................19 3.3.7. The European Quality Award ..............................................................19 3.3.8. Six Sigma .............................................................................................20 3.3.9. Investors in People (IiP).......................................................................20 3.3.10. Conclusion ...........................................................................................21
3.4. Quality Management Entities – IT Industry ................................................22 3.4.1. Capability Maturity Models Integration (CMMI)................................22 3.4.2. Information Technology Infrastructure Library (ITIL) .......................24 3.4.3. COBIT..................................................................................................25 3.4.4. Conclusion ...........................................................................................26
3.5. Top Management Involvement ....................................................................27 3.5.1. Communication....................................................................................29 3.5.2. Culture..................................................................................................30 3.5.3. Research Findings................................................................................32 3.5.4. Conclusion ...........................................................................................33
3.6. Information Systems ....................................................................................33 3.6.1. Management of Information and Data.................................................35 3.6.2. Management of Supplier Performance ................................................36 3.6.3. Benchmarking ......................................................................................37

Page v
3.6.4. Conclusion ...........................................................................................39 3.7. Strategic Quality Planning ...........................................................................40
3.7.1. Strategy Development..........................................................................41 3.7.2. The Vision, Mission, Goals, and Policies ............................................42 3.7.3. Benchmarking ......................................................................................42 3.7.4. Conclusion ...........................................................................................43
3.8. Human Resource Development and Management.......................................43 3.8.1. Involvement .........................................................................................44 3.8.2. Training, Education, and Overall Development ..................................46 3.8.3. Reward, Recognition, Benefits, and Compensation ............................48 3.8.4. Research Findings................................................................................48 3.8.5. Conclusion ...........................................................................................49
3.9. Management of Process Quality ..................................................................50 3.9.1. Just-In-Time (JIT)................................................................................51 3.9.2. Quality in Project Management ...........................................................52 3.9.3. Conclusion ...........................................................................................52
3.10. Customer Focus and Satisfaction.............................................................53 3.10.1. Customer Satisfaction Determination ..................................................54 3.10.2. Customer Satisfaction Management ....................................................55 3.10.3. Conclusion ...........................................................................................57
3.11. Management Structure and Teams...........................................................57 3.11.1. Organising for Quality Implementation...............................................58 3.11.2. Teams for TQM ...................................................................................60 3.11.3. Reengineering ......................................................................................61 3.11.4. Conclusion ...........................................................................................62
3.12. The Cost of Quality..................................................................................63 3.13. Trends in Management Philosophies .......................................................65 3.14. Conclusion ...............................................................................................67
Chapter Four: Financial Performance .................................................................69 4.1. Introduction..................................................................................................69 4.2. Measuring Financial Performance ...............................................................69
4.2.1. Financial Ratios ...................................................................................70 4.2.1.1. Sales Ratios..................................................................................71 4.2.1.2. Long-Term Solvency or Financial Leverage Ratios....................72 4.2.1.3. Short-Term Solvency or Liquidity Measures ..............................72 4.2.1.4. Asset Management Ratios............................................................72 4.2.1.5. Profitability Ratios .......................................................................73 4.2.1.6. Market Value Ratios ....................................................................74
4.2.2. Share Price ...........................................................................................74 4.2.3. Other Studies’ Indicators .....................................................................74
4.3. Conclusion ...................................................................................................75 Chapter Five: Quality and Financial Performance .................................................77
5.1. Introduction..................................................................................................77 5.2. Quality, Profitability, Market Share, and Competitiveness .........................77
5.2.1. Service Quality and Financial Performance ........................................80 5.2.2. Customer Retention and Profitability ..................................................81
5.3. Quality and Productivity ..............................................................................82 5.4. Quality and Stock Price Performance ..........................................................85 5.5. Research Findings........................................................................................86 5.6. Conclusion ...................................................................................................87

Page vi
PART THREE: THE RESEARCH PROCESS ...........................................................90 Chapter Six: Research Methodology ....................................................................90
6.1. Introduction..................................................................................................90 6.2. Research Question .......................................................................................90 6.3. Research Design...........................................................................................91 6.4. Sampling Design Process.............................................................................92
6.4.1. Define the Target Population ...............................................................93 6.4.2. Determining the Sample Frame ...........................................................94 6.4.3. Select a Sampling Technique...............................................................95 6.4.4. Determine the Sample Size..................................................................96 6.4.5. Execute the Sampling Process .............................................................98 6.4.6. Conclusion ...........................................................................................99
6.5. Data Collection ..........................................................................................100 6.5.1. Survey Instrument – Questionnaire ...................................................101
6.5.1.1. Measurement Techniques ..........................................................103 6.5.1.2. Dichotomous Questions .............................................................103 6.5.1.3. Itemised Rating Scales...............................................................104
6.5.2. Pilot Study..........................................................................................104 6.6. Questionnaire Evaluation...........................................................................106
6.6.1. Reliability...........................................................................................106 6.6.2. Validity ..............................................................................................106
6.6.2.1. Content Validity.........................................................................107 6.6.2.2. Criterion Validity .......................................................................108 6.6.2.3. Construct Validity......................................................................108 6.6.2.4. Internal and External Validity....................................................108
6.7. Statistical Analysis.....................................................................................109 6.7.1. Statistics Used....................................................................................110
6.7.1.1. Association of Variables ............................................................110 6.7.1.2. Multiple Linear Regression........................................................110
6.7.2. Statistical Package .............................................................................111 6.8. Method of Analysis – Total Quality Management ....................................111 6.9. Method of Analysis – Financial Performance ...........................................112
6.9.1. Financial Ratios .................................................................................114 6.9.2. Share Price .........................................................................................114
PART FOUR: ANALYSIS OF RESEARCH FINDINGS ........................................115 Chapter Seven: Results........................................................................................115
7.1. Introduction................................................................................................115 7.2. Total Quality Management Scores.............................................................115
7.2.1. Cronbach’s Alpha ..............................................................................115 7.2.2. Chi-Square Statistic ...........................................................................116 7.2.3. Treatment of Missing Responses .......................................................116 7.2.4. Total Quality Management Scores.....................................................117
7.3. Financial Performance Scores....................................................................118 7.3.1. Financial Ratios .................................................................................119 7.3.1.1. Sales Ratios........................................................................................119
7.3.1.2. Asset Management Ratios..........................................................120 7.3.1.3. Profitability Ratios .....................................................................121
7.3.2. Share Price .........................................................................................122 7.4. Multiple Linear Regression........................................................................123 7.5. Interview Results .......................................................................................125

Page vii
7.6. Extreme Company Analysis ......................................................................130 7.6.1. Company B vs. Company G ..............................................................130 7.6.2. Company I vs. Company D................................................................133
Chapter Eight: Discussion..................................................................................136 8.1. Summary of the Research ..........................................................................136 8.2. Total Quality Management ........................................................................136 8.3. Objective One ............................................................................................137
8.3.1. Attitude and Involvement of Top Management.................................139 8.3.2. Information Systems and Information Technology ...........................140 8.3.3. Strategic Quality Planning .................................................................141 8.3.4. Human Resource Development and Management.............................141 8.3.5. Management of Process Quality ........................................................142 8.3.6. Customer Focus and Satisfaction.......................................................143 8.3.7. Management Structure and Teams.....................................................143 8.3.8. Cost of Quality...................................................................................144 8.3.9. Conclusion .........................................................................................145
8.4. Objective Two............................................................................................146 8.5. Objective Three..........................................................................................147 8.6. Objective Four ...........................................................................................151
8.6.1. Internal Influences .............................................................................152 8.6.2. External Influences ............................................................................154 8.6.3. Overall Model ....................................................................................156
Chapter Nine: Conclusion and Directions for Future Research ........................160 9.1. Conclusion .................................................................................................160 9.2. Implications of the Study ...........................................................................161 9.3. Further Research ........................................................................................162
References..................................................................................................................164 Appendix A: The Economy and Industry ..................................................................178
1.1. Economic Analysis ....................................................................................178 1.1.1. Interest Rates, Gross Domestic Profit (GDP), and Inflation..............178 1.1.2. Exchange Rate ...................................................................................180 1.1.3. US Economy ......................................................................................180
1.2. Industry Selection ......................................................................................181 1.3. Industry Analysis .......................................................................................182
1.3.1. Government Influences......................................................................183 1.3.1.1. Black Economic Empowerment (BEE) .....................................183 1.3.1.2. King Report on Corporate Governance .....................................184 1.3.1.3. Government and Information Technology.................................184 1.3.1.4. Legislation..................................................................................185
1.3.2. Proudly South Africa .........................................................................185 1.3.3. New Partnership for Africa’s Development (NEPAD) .....................186
Appendix B: Forms of Business Organisations .........................................................187 Appendix C: Theories of Total Quality Management ...............................................188
1.1. W. Edwards Deming..................................................................................188 1.2. Joseph M. Juran .........................................................................................190 1.3. Armand V. Feigenbaum.............................................................................192 1.4. Philip Crosby .............................................................................................195
Appendix D: Managing Quality in Service Organisations ........................................200 Appendix E: Malcolm Baldrige Quality Award Criteria...........................................201 Appendix F: Investors in People (IiP) .......................................................................203

Page viii
Appendix G: Various IT Quality Entities ..................................................................204 Appendix H: Characteristics of Excellent Top Management ....................................206 Appendix I: Managers As Enablers ...........................................................................207 Appendix J: Supplier Evaluation ...............................................................................208 Appendix K: Employee Involvement ........................................................................210 Appendix L: Employee Education.............................................................................212 Appendix M: Just In Time (JIT) ................................................................................213 Appendix N: Factors Affecting Share Price Performance.........................................214
1.1. Capital Structure ........................................................................................214 1.1.1. Illusion of Wealth ..............................................................................215 1.1.2. Dividend Policy .................................................................................216
1.2. Mergers and Acquisitions ..........................................................................219 Appendix O: Cost of Total Quality Management......................................................220 Appendix P: Materials Used When Approaching Organisations ..............................221 Appendix Q: Questionnaire .......................................................................................223 Appendix R: Extraneous Variables............................................................................228 Appendix S: TQM Section Results............................................................................230 Appendix T: Source Data for Financial Indicators ....................................................237 Appendix U: Cronbach’s Alpha Statistical Results ...................................................240 Appendix V: Chi-Square Statistical Results .............................................................244 Appendix W: Simple Linear Regression ...................................................................250 Appendix X: Overview of Company Results ............................................................254

Page ix
List of Figures
Figure 1: 1995 Baldrige Award Criteria Framework...................................................17 Figure 2: Cultural Change Mechanisms (Source: Ross, 1994, p.42)...........................32 Figure 3: Correlation Between TQM Principles and Customer Satisfaction Variables
(Source: Agus, 2000) ...........................................................................................49 Figure 4: Customer Satisfaction: Three-Part System (Source: Ross, 1994)................56 Figure 5: How Activities Can Impact on Customers Directly (Source: Ross, 1994) ..59 Figure 6: The Organisation System (Source: Ross, 1994)...........................................59 Figure 7: Transition from Traditional to TQM Organisation (Source: Ross, 1994)....61 Figure 8: The Evolution of Management Theory (Source: Smit, 1999, p.38).............66 Figure 9: TQM Framework Used In This Research ....................................................68 Figure 10: Winning with Superior Perceived Quality .................................................78 Figure 11: Both Quality and Market Share Drive Profitability ...................................80 Figure 12: Profitability and Customer Retention (Source: Ross, 1994) ......................82 Figure 13: Productivity Wheel.....................................................................................84 Figure 14: Major Stages in a Statistical Sampling Study ............................................93 Figure 15: Percentage Change in Sales Results.........................................................120 Figure 16: Total Asset Turnover Results ...................................................................121 Figure 17: Return on Assets and Return on Equity Results.......................................122 Figure 18: Percentage Change in Share Price............................................................122 Figure 19: Company B vs. Company G, With Respect To Sales Results .................131 Figure 20: Company B vs. Company G, With Respect To Total Asset Turnover ....132 Figure 21: Company B vs. Company G, With Respect To ROA and ROE ..............132 Figure 22: Company I vs. Company D, With Respect To ROA and ROE................134 Figure 23: Company I vs. Company D, With Respect To Sales Results...................134 Figure 24: Integrated Management System with All Entities....................................159 List of Tables
Table 1: Quality Management Entities’ Breakdown ...................................................21 Table 2: Previous Studies' Indicators to Measure Financial Performance...................75 Table 3: Breakdown of Completed Questionnaires by Company ...............................98 Table 4: Section Weightings......................................................................................102 Table 5: Year Weightings ..........................................................................................113 Table 6: Final TQM Scores Displayed By Section....................................................117 Table 7: Final TQM Scores Displayed In Descending Order....................................117 Table 8: Implementation of TQM Principles.............................................................118 Table 9: Financial Performance Indicators and Scores..............................................119 Table 10: Summary Output of Multiple Linear Regression (TQM and Financial
Indicators) ..........................................................................................................124 Table 11: Summary Output of Multiple Linear Regression (ROE & TQM Principles)
............................................................................................................................125 Table 12: Information Gathered from Interviews......................................................129

Page 1
PART ONE: INTRODUCTION Chapter One: Introduction
1.1. Introduction
This study assesses the implementation of Total Quality Management (TQM) in the
organisations selected from the Information Technology (IT) sector of the
Johannesburg Stock Exchange (JSE), an exploration of these organisations’ financial
performance corresponding to TQM, and a determination of current and future trends
both worldwide and in South Africa with regards to TQM and quality management
philosophies in general and the IT industry in particular.
1.2. The Research Objectives
The main aim of the research is to evaluate the association between TQM and
financial performance in selected IT sector organisations listed on the JSE. The
impetus for the study was the lack of known work in this area in South Africa.
The following objectives set out for the study and the manner they are carried out are
as follows:
1. To determine the extent of application of TQM principles in the organisations.
These are revealed by analysing the results from the TQM questionnaires.
2. To examine financial performance of the organisations. This is tested by
calculating six financial indicators using financial statements.
3. To establish if there is any direct link between TQM and financial performance
overall and in each organisation individually. This is achieved by applying a
multiple linear regression to the TQM and financial performance scores. The null
hypothesis is that there is no association between the number of TQM principles
implemented and financial performance of organisations of the Information
Technology sector listed on the JSE.
4. To discuss evolution of TQM on the whole and, above all, in the IT industry. The
material to demonstrate changes coming about in TQM derives from interviews
Page 2
with the organisations’ representatives and is further complemented, as learnt
from literature review, by viewpoints of renowned experts.
1.3. Layout of the Research Project
The report is separated into Four Parts – introduction (chapter 1), literature review
(chapters 2 to 5), research process (chapter 6), and analysis, discussion, and
conclusion of research findings (chapters 7 to 9). From the literature review
undertaken, objectives and the hypothesis can be formulated. The methods used
(questionnaires and interviews) provide empirical results. The methods and results are
discussed and conclusions formed.
Chapter Two is the first chapter in the literature review. It examines the origins of
TQM by providing an overview of the relevant theories. The founders of the TQM
movement provide the original theory, forming a base for further expansion.
Chapter Three extends the defined core principles and common elements of TQM to
understand the TQM fundamentals and their evolution. Additionally, the modern
approach to quality is defined by detailing modern quality management entities such
as ISO9000:2000 and the Malcolm Baldrige Quality Award.
Chapter Four addresses various aspects of corporate finance and the ways of defining
and assessing financial performance. The chosen financial indicators are listed and
discussed and the reasons behind their choice explained.
Chapter Five describes how TQM may, theoretically, influence business performance.
Examples of past and current studies performed are used to provide various linkages
between quality, profitability, productivity, market share, and competitiveness.
Chapter Six outlines the research process used in this research containing details of
the survey methods used (questionnaires and interviews) along with the statistical
analysis implemented to validate the results. The method of analysis in obtaining the
results for both the TQM results and financial performance are also stated.

Page 3
The concluding three chapters, Seven to Nine, constitute Part Four. Chapter Seven
presents the findings. Chapter Eight details the results found in the research study by
means of discussing each objective set. The TQM and financial performance results
altogether with any link between them, as well as current trends in the IT industry
with respect to quality management are discussed. Chapter Nine covers the
conclusions, implications of the study, and recommendations for further research.
1.4. Assumption
Considering that this is a cross-sectional study where selected users provide
significant amounts of information, the major assumption is that the respondents are
truthful and knowledgeable.
1.5. Limitations of the Study
Limitations incurred in this study are:
• Sample bias – inferences cannot be drawn about the proportion of the
population (all IT organisations listed on the JSE) showing a principle of
TQM, this is because organisations in the study form a nonprobability sample.
• Nonparticipation bias – response rate affects the final sample (the lower the
response rate, the greater the sample bias), in unknown ways.
• The questionnaire is based on the guidelines for evaluation of applicants for
the Malcolm Baldrige National Quality Award and questions used previously
in the case studies of Ross (1994) to evaluate organisations. The researcher
attempts to ascertain its internal consistency reliability by Cronbach’s alpha
testing, and the statistical significance of the observed association between
questionnaire parts by the chi-square statistic. The questionnaire has, however,
been created for the purpose of the study and not been previously
independently validated.
• Interviews were informal, not uniformly pre-structured, and not requiring
unambiguous answers.

Page 4
• The type of method – cross-sectional survey provides a snap shot of the
organisations’ TQM implementation.
• Time – the assessment period was brief and time may affect the responses.
The study is limited to the South African Information Technology (IT) sector. The
current economic environment in South Africa could be an important factor to
consider in the study bearing in mind that economical conditions may affect growth
and financial conditions of organisations. The study focuses on the year in which the
study is done – 2005/2006. Appendix A provides an economic analysis, with certain
elements highlighted throughout the main text. Appendix A then describes why the
information technology (IT) sector is chosen. Political and legal influences on IT
organisations are discussed subsequently. The types of organisations that are
investigated in this research are public limited organisations listed on the information
technology (IT) sector of the Johannesburg Securities Exchange (JSE). Any reference
to firms, companies, organisations, businesses, etc. implies organisations of this
nature i.e. listed organisations dealing with IT issues. Extra information on these and
other types of organisations can be found in Appendix B.
The economic and industry analysis in Appendix A shows external factors that may
be presently shaping the IT industry. A positive outlook for the industry seems to be
in place (low interest rates spurring improved GDP growth encouraging progression
in cyclical sectors such as IT and a relatively stable exchange rate). Government
influences have also been discussed because they can affect financial performance of
organisations and remove emphasis from a quality management philosophy such as
TQM. These are topics such as corporate governance and ethics, sustainability issues,
and black economic empowerment (BEE) criteria.
For example, even if an organisation is not implementing TQM but has strong BEE
connections, deals with government initiatives, supplies communications
infrastructure, and manages the upgrade of network systems and computers for
society, its financial performance might be better to that one of an organisation with a
superior TQM system in place, but which is “poorly connected”. Appendix A
provides an example of this. Mustek sold a 25% share in itself and continued with the

Page 5
BEE initiative in terms of training (skills development) blue-collar workforce and
promoting advancement in the workplace. The BEE drives undertaken by Mustek
helps secure business deals with other private organisations and the government
(Kruger, 2005). This is one case where external influences on an organisation may
affect its financial performance. The same could apply to corporate governance and
proudly SA (see Appendix A).
It is assumed that listed organisations are interested in long-term prosperity, aware
and in favour of current trends in the industry and hence implementing what is
required. External factors are excluded when analysing the results. These external
factors are beyond the researcher’s control and are only introduced to complete a
current economic and industrial analysis, even though they may affect financial
performance.
With regards to the type of method used for measuring financial performance, only
published financial data from income statements and balance sheets are used in this
study. No attempt is made to use any kind of future values such as forward
price/earnings (P/E) ratios, forecasted headline earnings per share (HEPS), weighted
average cost of capital (WACC) with estimated cash flows etc. It is for this reason;
techniques such as the Free Cash Flow Model and Dividend Discount Model are not
used.
1.6. Importance of Conclusions
Data on the extent of TQM implementation in selected organisations are found and
assessed. The questionnaire allows an assessment of TQM in organisations.
The main focus analyses the association between TQM and financial performance. A
link may show the importance of TQM in South African IT organisations. If no
association is found, other justifications for implementing TQM must be made.
The research also highlights current or future trends of TQM and other quality
management entities in the IT industry in South Africa.
Page 6
PART TWO: LITERATURE REVIEW Chapter Two: Theories of Total Quality Management
2.1. Introduction
This section examines the origins of TQM discussing the theories developed and put
forward by the pioneers of the quality movement. The main focus is the common
threads between the theories. Pioneers in the field include W. Edwards Deming,
Joseph M. Juran, Armand V. Feigenbaum, and Philip Crosby. An explanation of each
ones’ separate view on quality can be found in Appendix C. These authors’
contributions are explained to form the base for the core principles of TQM.
The theories and advice given by the pioneers of TQM should still be taken into
consideration in the 21st century. TQM as a management philosophy will, overall, be
the same with minor additions and deletions over time.
2.2. Common Elements of Quality
The field of quality management has been strongly influenced by its pioneers whose
works have been presented in Appendix C. It would be a mistake to concentrate solely
on the views of one pioneer, because all, Deming, Juran, Feigenbaum and Crosby,
have, by their original thinking, documented the basis of quality and contributed
towards its development.
Deming calls quality management “continuous improvement” whilst Juran speaks of
“fitness for use”, and Crosby uses the phrase “conformance to requirements”.
Although using different words, all subscribe to the similar idea incorporated under
the TQM umbrella. Deming rationalises his theory of quality management in terms of
14 principles, which include design of product, specification of the service offered
and improving the quality of the working environment. Crosby, too, proposes 14 steps
to the quality management process and promotes the concepts of `zero defects' in his
`absolutes of quality'. Juran also prescribes steps for quality management. All these
Page 7
steps and principles have common binding elements that form some of the basic
principles of total quality. Generally, they belong to two different categories: those
focusing on technical processes and tools, and those focusing on managerial
dimensions (Ross, 1991, p.7). Deming provides manufacturers with methods to
measure the variations in a production process to determine the causes of poor quality.
Juran emphasises setting specific annual goals and establishing teams to work on
them. Crosby stresses a programme of zero defects whilst Feigenbaum teaches total
quality control aimed at managing by applying statistical and engineering methods
throughout the organisation. Despite these differences, certain common elements of
quality remain (Cortada, 1995, p.10; Ross, 1994, p.8):
• Management and the system, rather than the workers, are the cause of poor
quality. Managers often get in the way of an organisation’s transformation and
are at fault if the workers do not produce quality in all that they do.
• Prevention is the key as opposed to inspection.
• Top management involvement is a key ingredient and drives the quality
initiative.
• A quality culture needs to be integrated into the organisation.
• Human resource development such as training and education are vital in total
quality management. The manager must involve employees making sure that
they are empowered to make decisions regarding quality.
• Quality requires strategic planning with a set policy and plan to confirm the
proper implementation of quality. Quality must be approached specifically and
systematically.
• Quality is a continuous process and the programme for quality is therefore
always ongoing. Quality takes time to implement and quick fixes do not work.
• Customer expectations should be studied and followed for customer
satisfaction. Customers are the central focus of improvement processes.
• Organisations need to be restructured so that processes can communicate more
effectively and work together as opposed to different entities.
• The cost of quality should be calculated to determine weak points in the
activities of organisations.
• Quality is first; schedules and cost considerations only follow.

Page 8
2.3. Into the 21st Century
Organisations and technology change with changing challenges. Some challenges that
have changed are (Gruska, 2000, pp. S779-S788):
• altered labour markets - workforce with higher skill levels;
• increasing customer expectations - customers have come to expect continual
improvement of product and service quality;
• the advancement of technology;
• globalisation - the world is becoming a global village and global events
become the concern of all the world's population; and
• government intervention – government getting involved in business aspects of
private organisations.
Due to the new challenges, persistent learning and the importance of continuous TQM
may be encouraged. The improvement processes have been discussed by the TQM
pioneers and even though slightly adapted for the 21st century, they may still provide
an adequate base.
With some common elements for quality established, based on pioneers’ works, a
definition of TQM can be sought. A TQM scale can then be formulated from
associated quality management entities and TQM principles.

Page 9
Chapter Three: The Principles of Total Quality Management
3.1. Introduction
The pioneers’ theories and their common elements of quality supply the foundation
for the principles, or characteristics, of TQM. TQM is not a single process that can be
applied universally to any single organisation, but must be understood, customised
and applied over time throughout the organisation for continuous improvement. The
pioneers of TQM developed certain principles and highlighted key approaches and
implementations but it is up to the organisation to further develop those ideas into
practical methods that work for that particular organisation.
This chapter discusses TQM frameworks, models, and standards such as ISO 9000,
Malcolm Baldrige National Quality Award, European Quality Award, and Japanese
Deming Prize and their criteria to see if they can provide insight into the quality
movement and what is required for excellence. Each principle of TQM is also further
studied to provide more insight into quality. The chapter concludes with a look into
where TQM fits in with respect to management philosophies. This provides an
introduction into the evolution of quality, one of the objectives of this research.
3.2. Background – Quality and TQM
Porter and Tanner state that in the last two decades, many organisations have
experienced a period of great change in their markets and operations. International
competition has meant that many organisations have had to face an increasingly
turbulent and hostile environment. Customers have become more demanding,
competition has become more intense and sophisticated and the pace of technological
change has quickened (Porter and Tanner, 1996, p.1). As a result, many organisations
adopt TQM in response to these forces.
Zeithaml (1990, p.2) and Ross (1994, p.90) believe that quality has become
increasingly important in the business environment as it provides a competitive edge

Page 10
to those organisations that implement it. They believe that quality is one of the main
factors that contribute to organisational success and organisation growth.
Cortada (1995, p.6) and Balachandran (2004, p.144) agree that there are many
definitions for quality; however, they state many authors accept the notion that the
customer defines quality. They believe quality is what the customer says it is and is
measured by the extent of satisfaction of the customer and not what the provider says
it is. Ross states that TQM is a body of practices defined by both quality theorists and
practioners. It can be defined as the integration of all functions and processes within
an organisation to achieve continuous improvement of the quality of goods and
services. The goal is customer satisfaction (Ross, 1994, p.1). Porter and Tanner (1996,
p.1) maintains that TQM has an effect in every aspect of the business and becomes
engraved into every single process. It is a business approach that focuses on
improving the organisation’s effectiveness, efficiency, and responsiveness to
customers’ needs by actively involving people in process improvement activities.
Various authors agree that TQM is based on a number of ideas. The term ‘customer’
in TQM is expanded beyond the traditional definition to include everyone who
interacts with the organisation’s product or service, either internally or externally to
the organisation. TQM encompasses employees and suppliers, as well as the people
who buy the organisations’ products or services. It means thinking about quality in
terms of all functions of the organisation to integrate interrelated functions at all
levels of an organisation, a systems approach that considers every interaction between
the various functions of the organisation. Thus, the overall effectiveness of the
organisation is improved by more than the sum of the individual outputs from the
subsystems. The subsystems include all the organisational functions in the life cycle
of a product, such as design, planning, production, distribution, and field service. To
implement quality effectively, there must be collaboration among all functions of the
business activities, including market surveys, research and development, product
planning and design, subcontracting, manufacturing, inspection, sales, and customer
service, as well as financial, personnel, and educational activities. Every individual in
the organisation must be involved, from top management to supervisors and
production workers (Ozeki, 1990, p.3; Ross, 1994, pp.1-3; Smit, 1999, pp.50-53).

Page 11
Kanji (2000) and Drummond (1992) assert that TQM is a continuous process and
involves designing a timeless culture and organisation, always committed to customer
satisfaction. There are two strands to this - careful design of the product or service and
ensuring that the organisation’s system can consistently produce the design. These
objectives can only be achieved if the whole organisation is oriented towards them –
hence the term ‘total’ quality management. Hellsten and Klefsjo (2000) define TQM
as "a management system in continuous change, which is constituted of values,
methodologies and tools, the aim of which is to increase external and internal
customer satisfaction with a reduced amount of resources".
The definition of TQM in this research combines the classic definition with the
modern:
A management system that integrates all levels and functions within an
organisation to achieve continuous improvement of the quality of goods and
services, the aim of which is to increase external and internal customer
satisfaction.
With TQM defined, the applicability of TQM needs to incorporate both
manufacturing and service organisations as IT organisations may display elements of
both. Service organisations can be defined as those which deliver their products
personally to the customer – for example, banks, hotels, hospitals, and schools
(Drummond, 1992, p.91). In manufacturing organisations the customer is remote,
whereas in service organisations producer and consumer meet face to face. IT
organisations are both manufacturing and service. They may develop products, but
may also deal directly with the customer when developing projects. It is therefore
necessary to obtain some background knowledge of how quality in service
organisations should be handled. Service organisations present special problems of
management. These include (Drummond, 1992, p.94-96):
• Managing service delivery – service quality is affected not just by the fitness
of the product, but also by the manner of delivery. Service organisations have
no product with exact specifications.

Page 12
• Perishability – planning services requires careful matching of capacity to
demand, and this can be difficult to achieve. Unlike manufactured goods,
services cannot be stored.
• Interaction between producer and consumer – interaction effects perceptions
of quality. Different interactions, good and bad, must be dealt with differently.
Different strategies exist for different situations, e.g. a disaster can be turned
into triumph by overcompensating the customer with apologies and gifts.
• The intangible nature of quality – service quality is a highly subjective issue
and differs from person to person.
Zeithaml (1990, p.1) explains that virtually all organisations compete to some degree
on the basis of service. Considering that the main focus of TQM is customer
satisfaction, its implementation provides a greater edge against competition.
Balachandran (2004, p.143) describes that as organisation executives find it
increasingly difficult to establish sustainable, technology-based competitive
advantages (innovations can be duplicated and technologies are not exclusive), they
should direct more attention and resources to the quality of service and the manner in
which it is delivered. A service such as TQM may provide a truer source of
superiority. Some authors indicate that leading organisations are obsessed with
service excellence as they use services to be different, to earn the customers loyalty,
fan positive word-of-mouth advertising, and to seek some shelter from price
competition (Zeithaml, 1990, p.2; Balachandran, 2004, p. 143).
TQM, as defined in this study, incorporates managing quality in all organisations.
With IT firms being, manufacturers and service providers, the difference between
organisations (manufacturing or service), will not be referred to.
The discussion served to complete the view on quality in the organisations (more
information about managing quality in service organisations can be found in
Appendix D). With TQM defined for this study, the various components of quality to
be examined at each organisation can be sought. These are derived from various
quality management entities and the principles of TQM.

Page 13
3.3. Quality Management Entities
Quality management entities provide insight into elements of quality and how quality
initiatives can be implemented. Porter and Tanner (1996, p.5) explain that many
organisations’ introduction to quality has been via the quality systems route, e.g. ISO
9000. The South African Bureau of Standards (SABS) certifies organisations using
ISO 9000 standards to provide organisations with a competitive edge and enhance
customer satisfaction (SABS, 2006). There is still an increasing global trend towards
registration to the ISO 9000 quality standards. Whilst this trend reflects the continuing
importance of quality and the need to be recognised as a quality organisation, these is
external quality audits can degenerate into bureaucratic procedures, which limit
themselves to assessing the formal aspects of the quality system, making no attempt to
analyse the key strategic opportunities for improvement. Some organisations,
therefore, regard these standards as a preliminary qualification and only the first step
on the road to quality (Porter and Tanner, 1996, p.5).
A description of various quality management entities (standards, awards, prizes)
provides a different view of quality and introduces measures that may need to be
examined at the selected IT organisations.
3.3.1. ISO 9000 Standard
The term ISO 9000 refers to a set of quality management standards set up by
ISO (International Organisation for Standardisation). For some organisations, it has
become an international reference for quality management requirements in business
dealings. The ISO management system refers to the organisation's structure for
managing its processes or activities that transform inputs of resources into a product
or service which meet the organisation's objectives, such as satisfying the customer's
quality requirements, complying with regulations, or meeting environmental
objectives (ISO, 2006). Porter and Tanner (1996, p.6) believe it is one of the most
widely used quality frameworks, a useful first step, but is not a fully comprehensive
business excellence framework such as TQM. ISO 9000 can make a contribution to
Page 14
business improvement when used correctly; however, it can result in a bureaucratic
system that constrains the organisation if not. ISO 9000 is the most limited in scope of
all the quality frameworks (Porter and Tanner, 1996, p.7). McAdam and McKeown
(1999, pp.229-242) state that the main benefit of ISO 9000 is that it should produce an
effective quality system that will assist in eliminating errors and therefore save money
on rework and scrap, etc. by building in quality at every stage, therefore improving
customer satisfaction. It is claimed to provide marketing benefits, as certification to
ISO 9000 demonstrates an internationally recognised level of quality. ISO 9000 when
used correctly is one of many paths towards TQM implementation. McAdam and
McKeown found that the organisations that were gaining most from TQM had started
with ISO 9000, focused on external measures (e.g. customer satisfaction, etc.) as well
as internal measures (scrap, efficiency, etc.).
McAdam and McKeown (1999) also found that the majority of organisations
experienced benefits from implementing ISO 9000 and were five times more likely to
experience some benefits from ISO 9000 than none. They also did some research on
‘life for organisations after ISO 9000’. They found that the most frequently occurring
benefit was `fewer customer complaints', which should be expected if organisations
implement ISO 9000 properly. Also, increased productivity was experienced by 37%
in the organisations. In addition to this, the study showed that a significant number of
organisations experienced internal benefits, e.g. reduced costs (23%) and greater
control (14%) (McAdam and McKeown, 1999, pp.229-242).
3.3.2. ISO 9000: 2000 Standard
ISO first published its quality standards in 1987, revised them in 1994, and then
republished an updated version in 2000. These new standards are referred to as the
"ISO 9000 2000 Standards". Praxiom (2005) believes this new standard aims to
improve the overall performance of an organisation’s processes even further. It is
stated that ISO 9000:2000 builds on ISO 9000 by institutionalising the right attitude
by supporting it with the right policies, procedures, technologies, resources, and
structures. It helps establish a quality attitude by creating a quality system. This may
be the first step in achieving a world-class standard.

Page 15
This new standard seems to move away from a bureaucratic system to one that is
more of a management philosophy, just as TQM is. The eight principles in the new
standard are (Praxiom, 2005):
• focus on your customers;
• provide leadership;
• involve your people;
• use a process approach;
• take a systems approach;
• encourage continual improvement;
• get the facts before you decide; and
• work with your suppliers.
These principles seem to take some important elements out of TQM and provide a
starting point for the overall culture change needed for continuous quality
improvement.
Costa and Lorente (2004) studied how well ISO 9000:1994, ISO 9000:2000, and
TQM go together. The results show that initially the standard helps some
organisations reorganise their procedures and define responsibilities and duties.
However, only product quality improves after implementation and none of the
influential aspects such as the "soft" dimensions of leadership and human resource
management found in TQM necessary for organisations. These aspects were not
included in ISO 9000:1994 but they are in ISO 9000:2000. Their study points out that,
in practice, ISO 9000:1994 and TQM are two parallel quality systems in an
organisation. To get better results, it is important to adapt ISO requirements to
facilitate TQM implementation; otherwise, the only advantage of the registration is
the "permission" to sell in the market. ISO 9000:2000 makes this adaptation easier
and closes the gap between the two parallel quality systems making ISO 9000:2000
more of an organisation base for TQM (Costa and Lorente, 2004, pp.20-31).
Page 16
3.3.3. The Malcolm Baldrige Quality Award
The Malcolm Baldrige National Quality Award (MBNQA) is administered by the
National Institute of Standards, which is a branch of the US Department of
Commerce. The award was created in 1987 and the first winners were announced in
1988. Przasnyski (1999) describes that each year up to two organisations may win the
award in each of the three categories of manufacturing, service and small business
(fewer than 500 employees). There is a four-stage application review procedure,
including a site visit, and awards are evaluated on an absolute scale, so if in a
particular year no organisation achieves the required standard, no award is made.
Przasnyski (1999, p.391) and Porter and Tanner (1996, p.58) claim that meeting the
criteria for the award is not an easy matter and the framework deserves a more
detailed description to gain more knowledge into some TQM principles. The Baldrige
Award represents the development of a holistic TQM framework and well-defined
assessment processes. The award criteria have been requested by over 25 countries
that run their own award programmes and countries such as Australia, Singapore, and
Dubai have adopted this framework. Many states in the U.S.A. (United States of
America) have also modelled their own quality awards and criteria on the MBNQA
(Przasnyski, 1999, p.391; Porter and Tanner, 1996, p.58). The criteria have three
important roles in strengthening the U.S.A. competitiveness; these are to (Porter and
Tanner, 1996, p. 58):
• help improve quality performance practices and capabilities;
• facilitate communication and sharing of best practices; and
• serve as a working tool for managing performance, planning, training, and
assessment.
The framework has three basic elements as shown in Figure 1. The heart of the
framework is the “system” categories that control the processes which in turn deliver
the “goals” of superior customer, marketplace, and business performance. The senior
management leadership drives the systems themselves.

Page 17
Figure 1: 1995 Baldrige Award Criteria Framework
The award currently evaluates organisations on the following seven factors
(Balachandran, 2004, p. 152):
• Leadership – looks at the way senior executives guide the organisation and
how the organisation addresses its responsibilities to the public as a good
corporate citizen.
• Strategic Planning – looks at how it sets strategic direction and key action
plans.
• Customer and Market Focus – looks at how it determines requirements and
expectations of customers and how it acquires, satisfies and retains customers.
• Information Analysis – looks at management and analysis and improvement of
data and information to support key organisational processes and performance
management systems.
• Human Resource Focus – looks at how the workforce is enabled to develop its
full potential and how the workforce is aligned to organisational benefits.
• Process Management – looks at how the key production and delivery and
support processes are designed, managed, and improved.
• Business Results – looks at the performance and improvement in key business
areas, customer satisfaction, financial and marketplace performance.

Page 18
Przasnyski (1999) believes the award has set a national standard for quality in the
U.S.A. The award's core values, concepts, extensive scoring guidelines and
weightings are updated and revised annually to reflect current thinking. The 1996 and
2006 award criteria can be seen in Appendix E. They are freely available and provide
a detailed road map for organisations' quality management efforts (Przasnyski, 1999,
pp. 391-401). Some authors claim that corporations use the criteria as a basic
management guide for quality management programmes. It has effectively created a
new set of standards – a benchmark for quality in U.S.A. Industry and is a widely
used framework in existence (Przasnyski, 1999, pp. 391-401; Stoner, 1994, p.18;
Ross, 1994, p.13; Porter and Tanner, 1996, p.8).
3.3.4. The Deming Prize
The Deming prize was established in Japan to recognise excellence in the
implementation of organisation-wide quality control. A total quality framework has
been established for the award process that enables an organisation’s relative
achievement of quality control to be assessed against a series of quality criteria. Porter
and Tanner (1996, p.8) assert that despite the high profile of the Deming prize, there
has been ignorance in the West surrounding how judgements are made and what
weightings have been given to the different categories. It is also not known how
assessors are trained. This has made it difficult to transfer the framework and
assessment processes to an internal assessment system. This is not examined or used
in this study.
3.3.5. The American Quality Centre Benchmarking Awards
Porter and Tanner (1996, p.8) maintains that the American Productivity and Quality
Centre Benchmarking Awards are probably least known of all the awards. They are
included because the practice of benchmarking is growing at a tremendous rate. These
awards recognise benchmarking excellence and provide a platform for organisations
to distribute their knowledge, share best practice and further improvement of

Page 19
organisations. Benchmarking is only a single characteristic of TQM and although
benchmarking is examined in this study, these award criteria are not. Benchmarking
Awards’ criteria share common processes to the Malcolm Baldrige criteria.
3.3.6. South African Excellence Model (SAEM)
The South African Excellence Model (SAEM) is an awards programme run by the
South African Excellence Foundation (SAEF) to recognise outstanding achievements
in the field of organisational performance excellence. The SAEM is a diagnostic self-
assessment tool that allows organisations to identify their strengths and areas for
improvement, and to score their performance against internationally recognised
criteria for performance excellence (SAEF, 2005).
The SAEM was developed using the Malcolm Baldrige Model (USA) and the
European Foundation for Quality Management (EFQM) Model (Europe) as the points
of departure. Malcolm Baldrige Quality Award guidelines are a mixture of theories
developed by Crosby, Deming, Feigenbaum, and Juran i.e. based on TQM. This
implies that SAEM is also based on TQM (Gardner, 2005).
3.3.7. The European Quality Award
The European Quality Award is based on a framework of the European Foundation
for Quality Management’s European Model for TQM. The concept of the model is
that customer satisfaction, people satisfaction, and a favourable impact on society are
achieved through leadership driving policy and strategy, people management,
resources, and processes leading ultimately to excellence in business results. The
model was the first framework to place emphasis on business results, financial and
nonfinancial. Porter and Tanner (1996, p.9) state that the award is very similar to the
Baldrige process.
Page 20
3.3.8. Six Sigma
Six Sigma is a quality management programme that measures and improves the
operational performance of an organisation by identifying and correcting defects in
the organisation's processes and products (Wikipedia:Six Sigma, 2005). The central
idea behind Six Sigma is that if it is possible to measure how many "defects" there are
in a process, it is possible to systematically work out how to eliminate them and get as
close to "zero defects" as possible. This is similar to certain elements in the
philosophy of TQM. The term “zero defects” was first introduced by Crosby (1984)
and it was Deming and Juran who emphasised statistical quality control.
Stat-A-Matrix (2005) explains that both the Baldrige criteria and Six Sigma are built
on continual improvement. Unlike Baldrige, which is an assessment vehicle - a way
of measuring the effectiveness of a quality system and its business results, Six Sigma
is a way of raising the effectiveness and improving business results.
Six Sigma employs some of the same tried-and-true tools and techniques of TQM.
Both Six Sigma and TQM emphasise the importance of top-down support and
leadership. Pyzdek (2001) believes that both approaches make it clear that continuous
improvement of quality is critical to long-term business success. Six Sigma,
nevertheless, seems to be more specific with the guidelines that management should
follow for improvement. It makes implementing quality easier because it is more
defined and encapsulates some of the TQM principles.
3.3.9. Investors in People (IiP)
Investor in People (IiP) is an international standard that sets out a level of good
practice for the training and development of people to achieve business goals
(Bankseta, 2005). It recognises people as the greatest asset of an organisation and is
used as an effective business tool for harnessing the full potential of all employees by
motivating and deploying them throughout the organisation. Some discovered benefits
of IiP can be seen in Appendix F.

Page 21
IiP expands on one of the important principles of TQM that is, human resource
development. The benefits of both systems are similar and organisations that utilise
IiP philosophy should have superior human resource management.
3.3.10. Conclusion
Used correctly, quality standards such as ISO 9000, Malcolm Baldrige National
Quality Award, Six Sigma, and South African Excellence Model may make a
significant contribution to business improvement. The goals of TQM such as
customer satisfaction, continuous improvement, and organisational excellence are
dynamic targets and TQM frameworks can serve as a guide and benchmark to those
goals. Table 1 briefly summarises the considerations taken in choosing which entity
should be incorporated in this research.
Table 1: Quality Management Entities’ Breakdown
Entity Based On
Incorporated In Other Entities
Info Freely
AvailableEasily
Understood Using in
Research
ISO9000 Quality Management Principles X X X
ISO9000:2000 Quality Management Principles X X X
Deming Prize Malcolm Baldrige X Malcolm Baldrige Quality Award
Quality Management Principles X X X
American Quality Centre Award Benchmarking X European Quality Award Malcolm Baldrige X South African Excellence Model Malcolm Baldrige X
Six Sigma Specific Quality Management Principles X X X
Investors in People (IiP)
Human Resource Management X
The eight principles from ISO 9000:2000 are incorporated in this research and are
combined with the pioneers’ theories to continue forming the basis for TQM. The
Page 22
Malcolm Baldrige Award is, however, the most influential in this research and helps
to determine the core principles of TQM. This award seems as a benchmark of TQM
excellence as many other models and awards are derived from it (Deming Prize,
SAEM, European Quality Award). It has also been chosen because of its detailed
criteria which highlight core concepts throughout an organisation, internally and
externally, and are freely available. The Baldrige criteria change yearly and reports
from as early as 1989 to 2006 are analysed. More and more focus is being placed on
financial performance (45% in 2006 vs. 15% in 1989), but this is not being discussed
as a principle of TQM because it may be an outcome of applying TQM. The 1996
criteria are used in this study because only 25% (see Appendix E) of the results are
dependant on business performance.
The quality management entities discussed are general to organisations in any
industry. There are other entities that are more specific to the IT industry. Because
this study focuses on IT industry organisations, these quality management entities
need to be examined to complete the view of possible quality implementation
methods. These may provide insight into concepts that need to be examined at the
selected organisations.
3.4. Quality Management Entities – IT Industry
This section details the quality management entities, which are considered as modern
approaches towards quality management in the IT industry. These may highlight
trends in the IT industry, with regards to quality.
3.4.1. Capability Maturity Models Integration (CMMI)
Carnegie Mellon (2005) defines Capability Maturity Model Integration (CMMI) as an
approach for organisations that provides essential elements for effective process
improvement. It can be used to guide process improvement across a project, a
division, or an entire organisation. CMMI helps integrate traditionally separate
organisational functions, sets process improvement goals and priorities, provides

Page 23
guidance for quality processes, and provides a point of reference for appraising
current processes. CMMI is being adopted worldwide, including the Americas,
Europe, and Asia. The CMMI model improves upon previous quality entities in many
ways. CMMI best practice enables organisations to do the following (Carnegie
Mellon, July 2005):
• explicitly link management and engineering activities to their business
objectives;
• expand the scope of and visibility into the product life cycle and engineering
activities to ensure that the product or service meets customer expectations;
• incorporate lessons learned from additional areas of best practice (e.g.,
measurement, risk management, and supplier management);
• implement more robust high-maturity practices;
• address additional organisational functions critical to their products and
services; and
• fully comply with relevant ISO standards.
CMMI is a modular approach for implementing quality standards throughout an
organisation. This is because of the five levels of CMMI that the organisation
develops on through time. CMMI is derived from TQM ideas (Carnegie Mellon,
2005). Considering this, the greater the level of CMMI, the more TQM principles are
being applied. CMMI has the advantage of being able to guide process improvement
across projects, not only entire organisations. This is important in the IT sector as
many organisations take on unique big projects for clients. CMMI helps give a quality
standard for each project.
To illustrate the similarities between quality management entities, Carnegie Mellon
University (2005) states that a level three organisation in CMMI would have little
difficulty in obtaining ISO 9000:2000 (discussed above) certification. This is because
both CMMI and ISO have their roots in TQM.

Page 24
3.4.2. Information Technology Infrastructure Library (ITIL)
ITIL (the IT Infrastructure Library) is a standard in the area of IT service management
(ITIL, 2005). ITIL provides a cohesive set of best practice, drawn from the public and
private sectors internationally. It contains comprehensive publicly accessible
specialist documentation on the planning, provision and support of IT services. ITIL
consists of a series of books giving guidance on the provision of quality IT services,
and on the accommodation and environmental facilities needed to support it (OGC,
2005). Benefits of this approach include (ITIL, 2005):
• improved quality of IT services and bottom-line results;
• cost justifiable service quality;
• services that meet business, client, and user needs;
• documented roles and responsibilities;
• integrated, centralised processes; and
• IT processes aligned with corporate governance requirements.
Stoller (2005) explains that the key contribution of ITIL is that it establishes a practice
called IT Service Management (ITSM). ITSM translates into a set of services that
become a common language between the business and IT. In unmanaged
environments, users tend to see IT as a hodgepodge of laptops, software components,
servers, storage devices, routers, wireless devices, and online services. ITSM seeks to
change this by managing these resources comprehensively towards the delivery of
simple, recognisable services.
ITIL has been developed in recognition of organisations' growing dependency on IT.
This is a relatively fast paced and more modern field and because of this, TQM does
not cover the IT service of organisations in detail. TQM does, however, cover quality
in service organisations and the need for an appropriate IT infrastructure, whatever it
may be at the time. Stoller (2005) states that ITIL has derived from the same
principles used by Deming, this translates into its origin being from TQM. With the
help of IT best practice frameworks such as ITIL, organisations can get better value
out of their IT resources, and meet the needs of user and business stakeholders more
directly. Considering this, ITIL is a better defined policy than TQM regarding IT

Page 25
service management. Nonetheless, organisations would still benefit from TQM as it
addresses more of an overall management philosophy for continuous improvement
rather than the specific operation of IT service delivery.
At the moment, ITIL is the international best practice approach, providing
comprehensive guidance on how to manage the delivery and support of IT services
(Melliar, 2004). Over 100,000 IT professionals in the western world are ITIL-
certified, and IT leaders such as IBM, HP, and EDS have standardised their service
operations according to ITIL (Stoller, 2005). Dubie (2004) explains that a recent
survey done by International Network Services (INS) found that the adoption of ITIL
continues to grow and shows the framework second only to in-house practices as the
method used most often to manage IT service processes. It also highlights that of
those organisations not using ITIL, just over half plan to adopt it. The study also
comments on the fact that of the organisations using ITIL, 86% say the framework is
critical to achieving process management goals. Another study done by Forrester
Research through to 2008 predicts that there will be widespread adoption of ITIL best
practices by internal IT departments - from around 13% of large organisations in
2004, to around 40% in 2006 and 80% in 2008. They see ITIL being adopted and used
across the world as the standard for best practice in the provision of IT service
delivery (Fry, 2005).
3.4.3. COBIT
The Control Objectives for Information and related Technology (COBIT) is a set of
best practices (framework) for information management. COBIT provides managers
and IT users with a set of generally accepted measures, indicators, processes, and best
practices to assist them in maximising the benefits derived through the use of
information technology and developing appropriate IT governance and control in an
organisation. In 1998, COBIT became the internationally accepted framework for IT
governance and control.
The first edition was published in 1996 and the current, fourth edition in December
2005. COBIT has more recently found favour due to external developments. In its 4th

Page 26
edition, it has 34 high level objectives that cover 215 control objectives categorised in
four domains: Plan and Organise, Acquire and Implement, Deliver and Support, and
Monitor and Evaluate. The framework explains how IT processes deliver the
information that the business needs to achieve its objectives. This delivery is
controlled through 34 high-level control objectives, one for each IT process,
contained in the four domains. The framework identifies which of the seven
information criteria (effectiveness, efficiency, confidentiality, integrity, availability,
compliance and reliability) as well as which IT resources (people, applications,
technology, facilities and data) are important for the IT processes to fully support the
business objective.
3.4.4. Conclusion
Quality management initiatives may be approached in various ways. Organisations
need some sort of structure to support business process, goals, and means of providing
customer satisfaction. Different methodologies and standards for the IT industry
include:
• CMMI for control and structure in software (and system) development;
• ITIL for operational and tactical management of service delivery; and
• COBIT as an overall IT governance framework.
These methodologies might provide a modern view of quality implementation,
different terminology used cannot deny that many of the underlying principles strain
from TQM and strive towards similar thoughts. To a certain extent abandoning the
comprehensive management philosophy of TQM, the new standards provide a
modern approach to incorporate new business trends, replacing or building upon
individual TQM principles and providing more detail on specific topics. Which
framework, model or standard an organisation uses is heavily reliant on the
organisation’s structure and needs.
There have been other quality management entities used and studied in the field in
South Africa. For a comprehensive list, refer to Appendix G. These were adapted
from a provider of IT service management training and mentoring (Melliar, 2004).

Page 27
The table in the referred appendix illustrates the key aspects of each entity
summarising what the entity is, its objective, and the potential outcome of each. This
research does not include the quality management entities (awards, standards, prizes,
IT entities etc.) directly in investigating the organisations. A more general approach,
in the form of TQM, is needed to approach organisations, as these entities may be too
specific. This insures a variety of aspects can be examined at each organisation.
Quality as defined in this research and as seen from the pioneers and various quality
management entities are used to develop a framework for TQM in this research. Each
contribution cannot be weighed equally and particular emphasis is given to the
MBNQA criteria and weightings for the structure, confirmed by the principles of ISO
9000:2000 discussed in the previous section, as well as the theories for content into
the criteria. These core principles can be found in “disguises” in other quality
management practices. The universal principles discussed in turn are:
1. Top Management Involvement;
2. Information Systems;
3. Strategic Quality Planning;
4. Human Resource Development and Management;
5. Management of Process Quality;
6. Customer Focus and Satisfaction;
7. Management Structure and Teams; and
8. Cost of Quality.
The selected organisations are examined on these eight principles. Further
information is obtained on each principle by means of a literature survey. Each
principle is examined in detail at every one organisation to provide the information
required to assess an ability of the organisation as to the particular principle.
3.5. Top Management Involvement
Total quality begins with a strategic decision that needs to be made by top
management and then a strategic plan constructed and worked down throughout the
entire organisation i.e. at all levels of the organisation (Zeithaml, 1990, p.4; Crosby,

Page 28
1984, p.7; Ozeki, 1990, p.9). Some authors maintain that visible and active support
from the top could well be the difference between success and failure (Harrington,
1991, p. 28; Powell, 1995, pp. 15-37; Ahire, 1996, pp.23-56; Crosby, 1984, p.59;
Ross, 1994, p.34). This is because leadership of management is the input to all
processes in an organisation and total quality concentrates on quality performance in
facets of the business to achieve and maintain a competitive advantage. Top
management sets goals, policies, plans, and human organisation - all critical to the
TQM planning process (Zeithaml, 1990, p.2; Ross, 1994, p. 90; Harrington, 1991,
p.26; Deming, 1982, p.13). This does not mean that employees are not important in
the quality transformation, but they are not the instigators of quality.
Ross believes management must form a role model figure that is visible, committed,
and knowledgeable because an organisation’s culture reflects the atmosphere
portrayed and set by top management. Management must not reveal emphasis on
budget and business plans even though important, but must communicate the values,
continuous leadership, and philosophy of quality clearly throughout the organisation.
Top management must examine the organisation’s culture and, if it is found poor,
management must change their own thoughts about quality and portray a newer,
clearer image to the employees (Ross, 1994, pp. 33-43). For this to be successful,
management themselves must have a clear understanding of TQM principles and
theories.
Reimann (1991, pp.8-11), director of the Malcolm Baldrige National Quality Award,
has reviewed hundreds of applications, including those of the award winners. His
review of key excellence indicators of quality management is insightful and helpful.
A summary of the characteristics of excellent top management involvement can be
found in Appendix H.
Management or leadership of TQM is a vital ingredient in implementing it. True
TQM leadership builds a climate for excellence that prevails over operational
complexities, external market pressures, or any other impediments to quality that
might exist (Zeithaml, 1990, p. 4). Two important aspects of leadership are the way
employees and management communicate throughout the organisation and the culture
they form.

Page 29
3.5.1. Communication
Communication is defined as the exchange of information and understanding between
two or more persons or groups (Ross, 1994, p.37). This shows communication is not
the issuing of commands and should not be one-way (Juran, 1992, p.38). For
understanding to come about, the sender needs to get feedback that the receiver
understands. When the receiver such as an employee is involved in the quality
process, providing ideas, suggestions, and alternatives to top management, it can
further enhance the feedback.
Some authors claim that due to the structural nature of organisations, communication
between levels of management and the employees is a key to successful quality
implementation. The success of any human enterprise may depend on how effectively
people communicate with each other. Management’s vision of quality needs to be
portrayed correctly throughout the organisation. Top management as well as
managers and supervisors at all levels serve as translators and executors of top
management’s directive (Jeffries, 1992, p.153; Ross, 1994, p.37).
Jeffries explains that from an employee’s point of view, the introduction of TQM and
the change involved is usually accompanied by feelings of anxiety, discomfort, fear,
trepidation, and uncertainty. The sooner the organisation adopts effective two-way
communication and not only enters into a dialogue about what TQM is, the sooner
TQM will be achieved (Jeffries, 1992, p.37). The organisations and its managers must
also listen to the expectations, fears, reservations, concerns and aspirations of their
employees and realise how TQM is compatible with meeting those expectations and
eliminating those fears. Jeffries (1992, p.155) further states that getting TQM started
requires people to understand what TQM is about, how it affects them, what the
vision is, and what will it mean for them. In addition, everyone in the business needs
to know the direction of the business, what decisions are being made at senior levels,
the reasons for those decisions, and how they will be affected personally.
Communicating all of this is an ongoing process and is a message that needs
permanent reinforcement.

Page 30
This research takes into account the importance of two-way communication and
feedback by including it as points to evaluate organisations on.
3.5.2. Culture
Ross defines culture as the pattern of shared beliefs and values that provide the
members of an organisation’s rules of behaviour or accepted norms for conducting
operations. It is the philosophies, ideologies, values, assumptions, beliefs,
expectations, attitudes, and norms that knit an organisation together and are shared by
employees (Ross, 1994, p.40). The culture formed must create an organisational
infrastructure consistent with continuous quality management. This culture needs to
be instilled into the personalities of the employees and quality needs to be an entire
organisation’s goal and not just that of management. An organisation’s basic beliefs
need to be communicated effectively so that there is a general value system
transformation. Creating a quality culture within an organisation is increasingly
recognised as one of the primary conditions for the successful implementation of
TQM (Kanji, 2000, p. S979).
Kanji describes that it is also necessary to have a culture that is ready and open to
change. Therefore, one of the prime aims of TQM is a continuous improvement of the
processes and products. Continuous improvement engages a change. For that reason,
if employees are not open to a change, the chances of TQM’s success diminish
significantly (Kanji, 2000 p. S979).
Building a quality culture involves reversing fundamental assumptions about
managing organisations. Instead of change within the system, it is the system itself
that must be changed. Drummond (1992, p.18) states that assumptions such as the
concern for short-term profits must be reversed. He states that the TQM imperative is
customer satisfaction and the argument is that if organisations pay sufficient attention
to quality, profits will follow, whereas if they concern themselves solely with profits,
they will bankrupt themselves. Kanji (2000, p.S979) discovered that organisations
with adaptive quality cultures geared to satisfy the changing demands of customers,

Page 31
employees and shareholders outperform organisations without such a culture by
increasing their sales up to three times more. Therefore, a successful organisation
needs more than just sound business strategy; it needs a quality culture to support that
strategy.
Ross (1994, p.41) found that successful organisations have a central core culture
around which the rest of the organisation revolves. The culture of an organisation
must guide the employees so that no employee forgets about quality, and it must be
taught because quality means different things to different people. Quality must not be
merely stated, but embedded in the organisation by management (more information
on management as enablers of the TQM process can be seen in Appendix I). The
basic vehicle for embedding an organisational culture is a teaching process in which
desired behaviours and activities are learned through experiences, symbols, and
explicit behaviour (Ross, 1994, p.41). Demonstration by top management is essential
and must run along teaching, as the practices explained and taught must be exhibited
throughout the organisation. Some categories of behaviour that may be looked for are
(Ross, 1994, pp.41-42):
• signalling – making statements or taking actions that support the vision of
quality, such as mission statements, creeds, or charters directed toward
customer satisfaction;
• focus – every employee must know the mission, their part in it, and what has
to be done to achieve it. When all functions and systems are aligned to support
quality culture, everyone is more likely to support the same vision; and
• employee policies – instead of rewarding output or profit etc., rewards and
promotion systems can be based on quality. This links to aligning all
employees including managers to a single quality goal.
Employees follow strong management and leadership with clear categories of
behaviour and are able to see and be a part of quality in practice. Some components of
the quality system that provide cultural change are listed in Figure 2. Quality must
become a habit and form a routine part of the way the business is run. Employees then
take some responsibility away from top management as quality becomes engraved in
every level of the business. The revised, increased quality culture provides a more

Page 32
comfortable working environment and a base for success of the business, making
management’s goal of continuous improvement easier. Considering the culture affects
so many aspects of a business, it is incorporated in this research. Aspects such as
planning, organising, control, and communication outlined in Figure 2 are included.
Figure 2: Cultural Change Mechanisms (Source: Ross, 1994, p.42)
3.5.3. Research Findings
Yusof and Aspinwall (2000) did a study on critical success factors for TQM
implementation conducted in UK small and medium enterprises. Involvement of top
management and leadership was found to be the most critical factor for TQM
implementation as every organisation investigated stated that as the number one factor
(Yusof, 2000, pp. S448-S463). This was further enforced by three different studies
done by Powell (1995), Ahire (1996), and Agus (2000). Collectively, they discovered
that without the involvement and commitment of senior management, it is unlikely
that quality enthusiasm and improvement programmes could be introduced and
sustained. Studies of successful TQM programmes show that top management has
made a whole-hearted commitment to the concept and implementation of total quality,
and this commitment has filtered down through the entire organisation (Agus, 2000,
pp. S808-S820).
Another study was done by Juhl et al (2000) to determine the way that top
management, human resource (HR) system, manufacturing system and performance

Page 33
are related and whether this relationship is dependent upon different cultures. Using
data from the UK, representing one culture, and Australia and New Zealand to
represent another, it was indicated that a universal structure between the four business
components mentioned existed, and that this structure was independent of the cultural
setting within the areas chosen for this study. It was found that the quality of
management was unconditional, while the probability of both a high-quality HR
system and a high-quality manufacturing system was conditional upon top
management. Finally, the level of performance was conditional upon the joint effect
of the quality of the HR system and the quality of the manufacturing system. This
study adds to the fact that TQM starts and continues with the attitude and involvement
of top management.
3.5.4. Conclusion
Top management with regards to quality must be active, obvious, and informed with
continual education of employees to facilitate two-way communication and a quality
culture. Therefore the link between top management involvement and quality is a key
aspect of this research. Many questions are formed to try determine exactly how top
management have an impact on quality and quality culture (quality policies,
communication, involvement).
Concentrating on the various aspects of culture highlights the view that quality culture
affects many areas of an organisation. Emphasis is placed on determining whether a
quality culture is practiced at the selected organisations (attitudes, beliefs, visions etc.
about quality).
3.6. Information Systems
Quality programmes within an organisation are dependant on information systems.
This section investigates the characteristics of information systems and their link to
TQM. Information systems refer to information analysis and information technology.

Page 34
Cortada (1995, p.15) explains that for years, information technology (IT) was justified
solely on its ability either to reduce operating expenses (through automation of work)
or to help people make decisions. IT can now be used as a tool to support quality
activities. If an organisation uses process improvement or reengineering as the
primary strategy for quality improvement, then information technology has an
important role to play. This could include monitoring, storing information in
databases (useful in executing tasks or processes important to the customer), and, they
can shorten lines of communication, improve two-way communication, and speeding
up processes. IT can create these benefits (Cortada, 1995, pp.16-18):
• Shorten lines of communication and improve two-way communication using
electronic mail and report generation.
• Applications can be designed to make sure the right information is at the right
place at the right time.
• Computers can gather data on transactions and also on how processes are
doing (effectiveness).
• Computers help increase awareness of the environment using benchmarking.
• Computers make it possible to provide new or additional services to both
internal and external customers.
• Computers can give a fuller view of customers and clients and provide any
links between processes and clients.
• Computers improve efficiency of services and operations such as tracking
repair services.
Information is the critical enabler of TQM (Feigenbaum, 1983, p.827; Ross, 1994,
p.61). Ross explains that to implement quality procedures step by step into the
business until the entire organisation has quality processes requires information at
each step of the way. Proper information systems can track and improve areas laid
down by the principles of TQM. Further internal information is needed about each
division in an organisation and where problems exist. Information systems may
become the most important means for organisations to create distinctive quality and
unique service at the lowest possible cost and allow the TQM process to function.
Information is critical to all functions, and all functions need to be integrated by
information (Ross, 1994, p. 62). Information systems (IS) could include improving

Page 35
customer satisfaction with IS services, improving employee skills, implementing new
systems faster, and applying state-of-the-art technologies. Some quality based IS
activities are (Cortada, 1995, p.31):
• service to customers (internal and external);
• leadership involvement (rewards and inspects);
• continuous improvement (process focus);
• quality assurance (assessments);
• measurements (including self-assessments);
• supplier partnerships (shared management disciplines); and
• strategic quality planning (involves everyone).
Cortada (1995, p.31) and Ross (1994, p.62) claim that involving each of these
attributes will make sure all the processes work, improve the effectiveness, improve
the efficiency and change the culture of the organisation to a more quality orientated
one.
3.6.1. Management of Information and Data
Ross affirms that the way in which an organisation selects the data to manage its
performance is one of the building blocks of managing performance improvement.
There can be a wealth of information available, but an organisation needs to analyse
this data and distribute it correctly to the processes requiring it. The data selected falls
into many types, for example customer related, product or service performance,
supplier performance, cost, financial etc. (Ross, 1994, pp. 61-68).
Historically, organisations have automated the easy applications such as financial
accounting and production control (Ross, 1994, p.62). Ross (1994, p.62) states that
implementing TQM implies that instead of automating easy functions within an
organisation, more focus is needed on information systems to improve processes. The
development of these systems should integrate more functions. These systems should
run simultaneously in parallel rather than sequential order to reduce cycle time,
increase productivity, and produce fewer defects in products. TQM requires the

Page 36
organisation to reengineer the processes for better efficiency so that more and more
functions are integrated and work together instead of the older, separated style of
functioning. In successful organisations, there are few key goals and each goal is
linked to every level of the organisation in a well thought-out system. The award
winners of the Malcolm Baldrige Award have had data-rich systems (Reimann, 1991,
p.9).
Top management needs to be continuously involved in the quality process. With the
aid of correct information; it improves their ability to make decisions quickly
(Feigenbaum, 1983, p.99). The ability of obtaining information faster gives
management at all levels more time for innovation and change.
Information can be further used externally for customer satisfaction, the ultimate
focus of implementing TQM. Ross explains that this is done by using IT as a means in
developing new products/services and maintaining that link between customers and
their demands. The same attention should be spent on internal customers and their
processes. Customer feedback is imperative for a more effective operating process. It
is a good idea to design a system that measures the pulse of the market and the
customer base (Ross, 1994, p.70).
Ross (1994, pp. 64-65) discovered that by spreading information, standardising
information and measuring performance to get feedback of information within the
organisation, organisations could shorten cycle time, improve quality and reduce
costs.
3.6.2. Management of Supplier Performance
Porter and Tanner (1996), Reimann (1991), and Ray (1995) indicate that the process
of effective supplier evaluation and working with suppliers is vital to the procurement
process and a pre-requisite of a total quality output from the organisation. Total
quality cannot be achieved without quality inputs. Organisations must form a
partnership with their suppliers. This insures common quality communication and
team work as opposed to placing orders at the cheapest available suppliers. Feedback

Page 37
should exist between the customer, the organisation and the supplier. This identifies
performance improvement areas because the suppliers may have customer feedback
through the organisation and can then understand which areas need improvement
(Porter and Tanner, 1996, p.73; Reimann, 1991, p.10; Ray, 1995, p.44).
Ray discovered that the current trend of outsourcing is continuing to rise. However,
before activity can be contracted out, there needs to be careful consideration of its
suitability and its impact on the organisation. Much of the Japanese success in
manufacturing can be linked directly to processes of selection, supplier evaluation and
managing its supplier base. Many supplier evaluation processes are question and
answer based, whereby a positive response constitutes attainment. Many systems lack
the rigour of further and detailed investigation and analysis (Ray, 1995, p.44). The
key elements to be evaluated can be seen in Appendix J.
Effective supplier selection is a fundamental task of the buyer. A successful total
procurement process stems from the investment of time and effort into the process of
supplier evaluation (Ray, 1995, p.45).
3.6.3. Benchmarking
Reh (2005), Bicheno (1991), and Camp (1989, p.3) define benchmarking as a form of
information that organisations use to analyse other organisations to improve their
own. It is the process of determining who is the best, who sets the standard, and what
that standard is. The essence of benchmarking is the continuous process of comparing
an organisation’s strategy, products, and processes with those of world leaders and
best-in-class organisations to learn how they achieved excellence, and then setting out
to match and even surpass it. For many organisations, benchmarking has become a
key component in their TQM programmes and brings about an added competitive
advantage (Camp, 1989, p.3; Ross, 1994, p.235). Benchmarking can also save costs as
other organisations have already developed and implemented a system that works so it
is cheaper to use it instead of developing a new system. Slight modification may have
to be done, but the ideas are there to be utilised.

Page 38
Jarrar discovered that benchmarking or best practice management is increasingly
being recognised as a performance improvement effort for processes, business units,
and for entire corporations. Well-run organisations and market leaders alike cannot
afford to ignore this emerging discipline if they want to remain leaders in their
respective markets (Jarrar, 2000, p. S734). Benchmarking is a criterion for the
Malcolm Baldrige Award under “competitive comparisons and benchmarks”
indicating its importance. The benefits of benchmarking include (Ross, 1994, p.239;
Camp, 1989, p.3):
• Cultural Change – Benchmarking allows organisations to set realistic, rigorous
new performance targets, and this process helps convince employees of the
credibility of these targets. This adds to employee involvement.
• Performance Improvement – Benchmarking allows the organisation to define
specific gaps in performance and to select the process to improve them.
• Human Resources – Benchmarking provides a basis for training. Employees
begin to see the gap and know that doing something better does exist.
Consequently, both commitment level and involvement increase.
To implement benchmarking into an organisation’s common practice, management
commitment, organisation communication, and employee participation are vital
(Camp, 1989, p.6). It can be seen how the core principles of TQM are also needed for
other performance approaches. This indicates that if TQM is focused on and
implemented, other competitive advantages can be easily studied and implemented.
Benchmarking still has the customer’s requirements in mind. It is used to gain an
insight into how other organisations are implementing procedures in a set industry
that could be favourable for the customer.
Ross (1994) discovered that benchmarking and productivity also have a relationship.
Benchmarking allows an organisation to concentrate on areas that need defining and
true productivity is then derived when workers at all levels are solving problems of
the business.
With this increasing importance of benchmarking, it is important that organisations
have a `process' for collecting, assessing, validating, transferring and applying best

Page 39
practices. Best practice transfer has potential to achieve benefits, and is too important
to be left unmanaged (Jarrar, 2000, p. S741). Even if the organisations are leaders in a
particular field, successful international organisations and organisations in other
industries can be examined.
Concerning information systems and benchmarking, it is essential to measure any
quality improvement to determine its effect on the system. Recording, monitoring,
and measuring performance improvement is a feature of a quality drive (Jeffries,
1991, p.23). The measures are stored in an information system, easily accessible by
employees to determine performance improvement and target areas.
3.6.4. Conclusion
Cortada (1995, p.19) states that quality practices are being adopted at an increasing
pace by organisations of all kinds in the industrialised world. Information systems and
technology may be central to the success of any organisation’s quality
implementation. IT provides the support necessary for the quality movement as an
organisation’s processes can be aided with the use of IS. Implementation of quality
practices throughout the organisation requires the help of IS because technology can
be applied in the redesign or improvement of many processes (Cortada, 1995, p.113).
The practice of benchmarking may be applied in any organisation as this provides a
cost effective solution for obtaining working systems that can help any process
researched. Considering it is an easier approach then redeveloping management
processes and functions, it is the main focus in the information systems principle.
Attention is also given to rating suppliers and how data is used in various
developments.

Page 40
3.7. Strategic Quality Planning
Strategic quality planning is defined by Juran (1992, p.300) and indicates the main
concepts:
“Strategic Quality Planning is a structured process for establishing long-range
quality goals, at the highest levels of organisation, and defining the means to
be used to reach those goals.”
Juran and Ross state that the improvement of quality takes time and is implemented
slowly through the organisation to be made successful. Strategic quality planning is
required to implement quality correctly. There must be a quality-based strategy that is
developed through a formal structured approach over time. Most successful
organisations attribute their progress due to this type of strategy (Juran, 1991, pp.6-8;
Ross, 1994, p.91). The strategic planning should be done accurately through
programme and action planning so that when quality is implemented, it works
effectively.
A quality-based strategy incorporates many other characteristics of TQM such as
quality policies, plans, type of information required, organisational structure, and
human organisation to create that quality culture within an organisation that succeeds
(Juran, 1992, pp.303-313). It provides the basis upon which plans are developed and
communication achieved. A basic rule of strategic planning is that structure follows
strategy (Ross, 1994, p.91). The aim of planning is to ensure employee efforts are all
clearly focused and well directed. It involves specifying requirements and procedures
for all parts of production (Drummond, 1992, p.70). The pervasive role that quality
plays in strategic planning can best be understood by examining the components of a
strategy (Ross, 1994, pp.91-102):
• Mission – Primary overall purpose of an organisation and its expressed reason
for existence.
• Product/Market scope – Marketplace research.
• Competitive Edge – Differentiation of products tailored to customer with high
standards of product/service quality.

Page 41
• Supporting Policies – Guidelines for action and decision-making that facilitate
the attainment of objectives.
• Objectives – Set more specific objectives to identify the ends it hopes to
achieve by implementing a strategy. These objectives are set differently in all
departments so that each organisation division is striving for a goal, with all
objectives following the main quality culture of the organisation.
• Organisational Culture – The core concept that the organisation is aiming to
instil in the daily life of the business.
These components are developed through a process of strategy development.
3.7.1. Strategy Development
Ideally an organisation should have short-term (one to three years) and longer term
(three or more years) planning processes for customer satisfaction, top management,
and overall operational performance improvement (Porter and Tanner, 1996, p.68).
The ways in which these processes are deployed throughout the organisation are
important.
Strategy development covers matters regarding the development of the main strategies
and business plans with a particular consideration given to the type of inputs that are
used. Example inputs are (Porter and Tanner, 1996, p.69):
• customer requirements and the expected evolution of these requirements;
• projections of the competitive environment;
• risks such as financial, market, technological and societal risks; and
• the organisation’s capabilities and its suppliers’ capabilities.
Strategy development also covers how the strategies, policies, and business plans are
translated into actionable key business drivers that serve as a basis for deploying plan
requirements.
Page 42
3.7.2. The Vision, Mission, Goals, and Policies
Porter and Tanner (1996, p.4), Ross (1994, p.104), and Drummond (1992, p.60)
believe that successful organisations have a vision of their future with clear
organisational goals that they strive towards. Policies need to be developed to bring
this vision into the processes of the workplace. The vision is the starting point for all
TQM initiatives and should state clearly what the organisation is trying to achieve. It
acts as a beacon guiding and illuminating decision-making and action (Jeffries, 1992,
p.61). In many cases, organisations fail to translate their vision and mission into
actions that deliver improved performance (Porter and Tanner, 1996, p.4). A policy
sets the atmosphere for quality planning (Drummond, 1992, p.60). The key to a
successful translation is to understand in detail what the organisation needs to achieve
to realise its vision and develop appropriate action plans. A quality vision statement
makes explicit the organisation’s approach to (Jeffries, 1992, p.61):
• customer satisfaction;
• organisational performance;
• product/service quality;
• how employees are treated; and
• social responsibility.
Jeffries believes that the vision can be a powerful force for positive change. This
vision has to be produced by the top management within an organisation and cascaded
down correctly to each employee and monitored (Jeffries, 1992, p.67). This links with
implementing effective communication between management and employees. Top
management is the only group that is in a position to decide the core values the
organisation should adopt.
3.7.3. Benchmarking
Reimann (1991, p.9) maintains that benchmarking can be further used in long-term
horizon planning. The planning process should understand where the organisation
stands in respect to its competitors across a broad front. Quality planning does not
Page 43
focus only on the performance of the product but on the delivery, packaging, and
service. Many aspects can be analysed and measured to assess how important specific
product and service features are to the customer. Benchmarking provides an insight
into how the leaders and competitors are analysing and measuring these specific
features. Benchmarking was discussed under information systems.
3.7.4. Conclusion
With quality introducing such a major competitive edge, strategic planning is required
to plan the correct implementation of TQM within an organisation. An organisational
culture based on quality, needs to be developed and this takes time and planning.
Planning is the key to achieving conformity of quality and must incorporate every
aspect of a process. No strategy can be effective unless it is carefully planned and then
implemented. The business plan should integrate the quality goals, developed by top
management, with complementary strategies.
The mission, goals, policies and aspects of strategic planning and development are
incorporated in this research. The key is to try determining exactly how many
elements of quality planning are considered at the selected organisations. Aspects
such as human resource development, information development, and productivity
improvement are examined in the frame of quality planning. This provides an
overview of an organisation from a quality planning perspective.
3.8. Human Resource Development and Management
Ross (1994, p.121) states that quality improvement can result from a reduction in cost
or cycle time, an increase in throughput, or a decrease in the variation within a
process. It is true that many elements such as information systems or information
technology aid this, but it is also true that human resource development and
management adds value in all three cases. Human factors are one of the most
important dimensions in quality and productivity improvement (Porter and Tanner,
1996, p.5; Ross, 1994, p. 119). Employees need a vision in which they can believe

Page 44
and be a part of, an achievement culture that challenges them to be the best they can
be, a sense of team that nurtures and supports them, and role models that can show
them the way (Zeithaml, 1990, p.5; Reimann, 1991, p.10). Employees offer
continuous improvement in the systems of the organisations making quality happen.
Ross (1994, p.119) believes that one of the best ways to achieve organisational
success is by educating, involving, and empowering employees at all levels. This
creates tighter relationships between the business and the employee so the employees
try harder to excel both themselves and the organisation.
TQM is fundamentally about change. For some organisations the change may be
slight, but for other organisations the change may be much more significant.
Inevitably, culture of the organisation, new skill sets, and management style do
change. The one common denominator in this is people. Involvement, education,
training, and rewards, recognition, benefits, and compensations are key aspects of
human resource development and management.
3.8.1. Involvement
The involvement approach is based on the idea that organisations should be designed
from bottom to top, so that employees are in control of their destiny and able to
participate in the business of the organisation (Lawler III, 1992, p.1). Many authors
indicate that employee involvement (EI) is one of the key features of human resource
development and management (Porter and Tanner, 1996, p.1; Reimann, 1991, p.10;
Lawler III, 1992, p.1; Ross, 1994, p.120). Employee empowerment and involvement
and the energy that comes with feelings of ownership are necessary prerequisites for
continuous improvement. An empowered employee focuses on results and is not
inhibited by formalities of position, authority, or function, but believes that the
organisation expects awareness of end results to be achieved and to be acted on. An
empowered employee further believes in the expectations of the organisation and
therefore takes the initiative to ensure the customers’ needs are met. Empowered
employees find solutions to problems, rather than the reverse. Balachandran (2004,
p.191) stresses the importance that employees are urged to be included in the
management process and it is made noticeable that their ideas are considered and do

Page 45
impact the running of the business. Managers should encourage employees to
participate in activities such as problem solving. Employee knowledge can be an
untapped resource and involvement may develop an employee’s potential. Employees
are at the front of most processes and can aid in continuous development of quality by
suggesting ideas.
To participate in the business, employees at all levels need power, information,
knowledge, and rewards that are relevant to business performance. Appendix K shows
ways involvement can be created.
Lawler (1992) conducted a study of the Fortune 1000 organisations, to determine
whether organisations had incorporated employee involvement (EI) into their
approaches and the results that the EI efforts were producing for organisations. The
results suggest that due to EI, life is better for employees (positive on employee
outcomes such as worker satisfaction, quality of work life, and absenteeism), and
operating results are better for organisations (positive for performance outcomes such
as productivity, quality, turnover, and profitability) (Lawler III, 1992, p.61).
The study of the Fortune 1000 organisations was revisited in 1993 to provide more
detail into how EI and TQM complement each other. The evidence found
substantiates the close interrelationship and complementary nature of EI and TQM.
They help make each other more successful (Lawler III, 1996, pp.6-11):
• Organisations with more extensive forms of employee involvement report
higher outcomes from their TQM programmes than organisations with less
employee involvement.
• Employee involvement programmes are more successful when they are used
in conjunction with TQM programmes.
There is a particularly close link between the impact of production oriented TQM
practices and the use of EI approaches. The impact of production oriented TQM
practices is positive only when they are used in a manner that is highly participatory
(Lawler III, 1996, pp.6-11).

Page 46
The study also provides some interesting data on how TQM and EI programmes
should be positioned relative to each other. Performance outcomes are highest if
managers focus on TQM and see EI as part of it rather than the other way around. The
highest impact is achieved if EI and TQM are managed as an integrated programme.
Finally, using them both leads to better financial performance (Lawler III, 1996, pp.6-
11).
3.8.2. Training, Education, and Overall Development
Many authors indicate that when management finally understand what comprises
TQM and starts following the path to quality, it comes across the need to develop the
employees in the organisation (Crosby, 1984, p.7; Juran, 1992, p.15; Feigenbaum,
1983, p.201). Education and training is the development of personnel in all
organisational functions and levels. Employees are taught quality that contribute to
the organisation’s products. This is at minimum cost and consistent with full customer
satisfaction (Feigenbaum, 1983, p.201). Education provides a common language of
quality and employees begin to understand their role in the quality process, adding to
the culture of quality within an organisation. Each employee needs to be exposed to a
complete understanding of what quality means and how each can act to implement it
(Crosby, 1984, p.160). Education and training requires an investment in time and
money by the organisation involved in quality improvement, but it results in
improvement (Crosby, 1984, p.116). Criteria that employees need to be educated on,
as described by Crosby (1984), can be found in Appendix L.
Jeffries (1992, p.16) maintains that with TQM, training is geared to achieve one thing
and that is improving performance. Trainers who work towards this become difficult
to replace. The achievement of any organisation’s commercial objectives is dependent
more than anything else on the competence of the people employed (Jeffries, 1992,
p.32). Training aids in lifting employees up to a quality understanding. Training
examines aspects such as managing the organisation policy, how to gain commitment
of the employees for the organisation and how to evaluate it. TQM involves: knowing
about TQM, helping clarify the vision, spreading the word, working alongside
Page 47
managers, acting as a training resource, and working as an internal consultant
(Jeffries, 1992, p.40).
Balachandran (2004, p.187) believes top managers tend to neglect education and
training when business is good. A continually healthy bottom line is an opiate that
induces complacency. Customers are becoming more aware, more sophisticated, and
more demanding. Their loyalties cannot be taken for granted and like TQM being a
continuous process, employee development is too.
Jeffries (1992) performed a survey of 300 "improvement-driven" organisations to
understand the implications for training departments. It was found that in traditional
organisations, training often operates as a staff function separate from line operations
and without performance metrics to assess quantitatively whether the training
produces results in terms of organisational goals and plans. Typically, training in such
organisations has limited customer focus and satisfaction measurements tend to be
event based (for example, course evaluation forms). In high-performance
organisations, the training function is closer to customers because training is "driven"
by customers' needs, developed and designed in conjunction with customers, and
evaluated continuously. When carried out properly, training and education enables
both people and organisations to create more opportunities and at the same time make
more of any opportunities that arise, which is essential in TQM (Jeffries, 1992, p.73).
Linde believes that fundamentally the training process is about helping people to learn
and TQM involves learning at all levels. In high-performance organisations, training
is emerging to play a critical, integrative role as a driver of cultural change, process
alignment, job redesign, and continuous improvement. In a real sense, it is serving as
a change engine to help generate an organisation's resilience and core competencies.
Those are the success traits an organisation needs to compete effectively in a
constantly changing, often-turbulent business environment (Linde, 1997, pp.20-26).
Page 48
3.8.3. Reward, Recognition, Benefits, and Compensation
Reimann (1991) asserts the need for human resource plans that should be in place to
address the needs of the entire workforce. Rewards, recognition, benefits, and
compensation methods should be addressed towards quality. Quality is seen as one of
the areas for recognition, in the form of celebrations and rewards. It is important that
the senior executives give this recognition. The quality values need to be reinforced
and celebrations or central quality initiative days do just that. Crosby states that it is
good practice to give credit at the more local levels where the gains in quality are
being made. It is also good practice to have the employees included in the nomination
process. Those who receive the awards are deeply moved by being chosen by their
peers. They would not have been so moved, nor would the rest of the people, had
management alone made the choices. This provides the organisation with living,
talking, and visible leaders in the quality initiative that the colleagues may look up to
on a daily basis (1984, p.118).
3.8.4. Research Findings
Agus (2000) discovered that employee focus has a strong correlation with customer
satisfaction criteria, the reason behind implementing TQM, which suggests a
reinforcing impact of the critical role of human resource management in attaining
higher customer satisfaction and organisational growth. Figure 3 presents the
Spearman's correlation of TQM practices with customer satisfaction criteria. Principal
TQM practices (customer focus, supplier relationships, training and employee focus)
show strong correlation with customer satisfaction variables. Product quality and
product features demonstrate high correlation with top management commitment,
supplier relations, training and employee focus (Agus, 2000, pp.S808-S820).
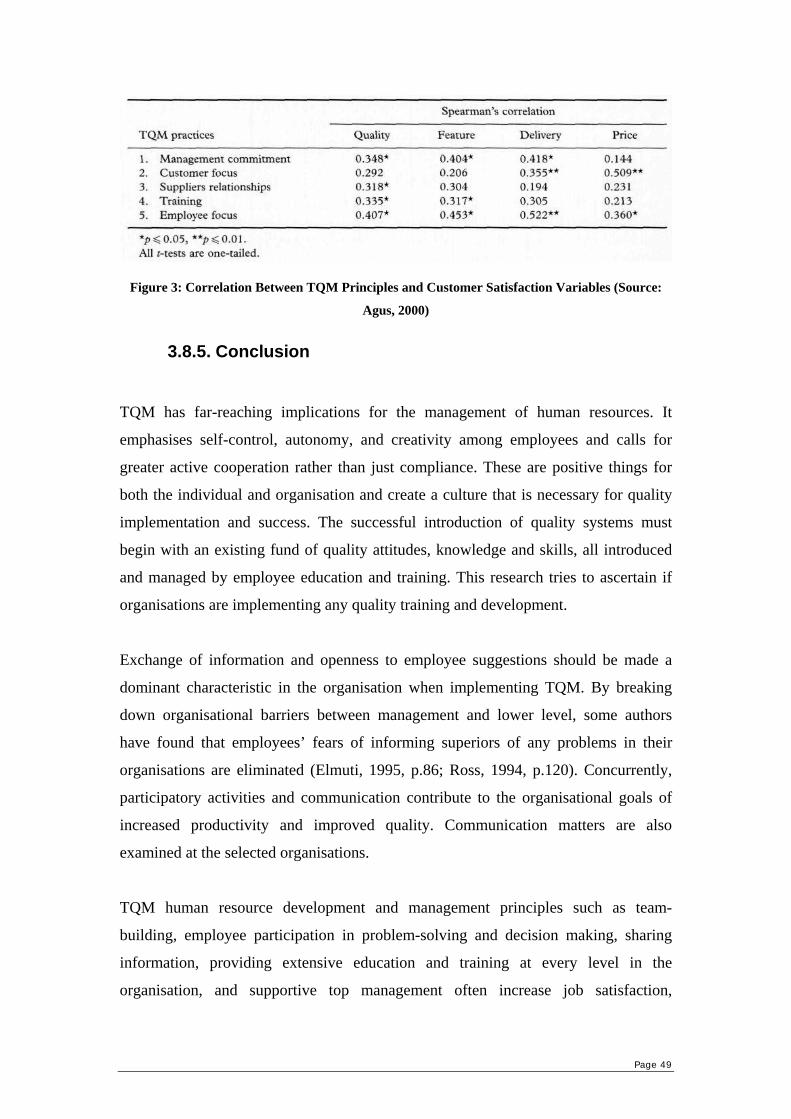
Page 49
Figure 3: Correlation Between TQM Principles and Customer Satisfaction Variables (Source:
Agus, 2000)
3.8.5. Conclusion
TQM has far-reaching implications for the management of human resources. It
emphasises self-control, autonomy, and creativity among employees and calls for
greater active cooperation rather than just compliance. These are positive things for
both the individual and organisation and create a culture that is necessary for quality
implementation and success. The successful introduction of quality systems must
begin with an existing fund of quality attitudes, knowledge and skills, all introduced
and managed by employee education and training. This research tries to ascertain if
organisations are implementing any quality training and development.
Exchange of information and openness to employee suggestions should be made a
dominant characteristic in the organisation when implementing TQM. By breaking
down organisational barriers between management and lower level, some authors
have found that employees’ fears of informing superiors of any problems in their
organisations are eliminated (Elmuti, 1995, p.86; Ross, 1994, p.120). Concurrently,
participatory activities and communication contribute to the organisational goals of
increased productivity and improved quality. Communication matters are also
examined at the selected organisations.
TQM human resource development and management principles such as team-
building, employee participation in problem-solving and decision making, sharing
information, providing extensive education and training at every level in the
organisation, and supportive top management often increase job satisfaction,

Page 50
productivity, quality, and overall organisational effectiveness (Elmuti, 1995, pp.86-
98; Lawler III, 1992, p.61). This can be seen by lower turnover, accident, and
absenteeism rates (Reimann, 1991, p.10; Lawler III, 1992, p.61). McAdam and
McKeown (1999) discovered in their research that top TQM organisations have high
levels of employee participation and training.
The combination of involvement, participation, training, and education in human
resource development and management towards quality are examined at each selected
organisation to determine its level and effectiveness.
3.9. Management of Process Quality
Process management is a way of looking at how a business is managed. This section
deals with the action planning and implementation of TQM. Once strategic quality
planning has taken place and objectives, goals, and ideas set, quality needs be
implemented. Talking about a quality culture is not sufficient; plans need to be
executed. Management of process quality is an ongoing process that implements
TQM throughout the organisation. The Baldrige Award examines the management of
process quality as one of its criteria for TQM. It explains what is entailed and is
defined as (Ross, 1994, p.143):
“The management of process quality category examines systematic processes the
organisation uses to pursue ever-higher quality and organisation operational
performance. The key elements of process management are examined, including
research and development (R&D), design, management of process quality for all
work units and suppliers, systematic quality improvement, and quality
assessment.”
Ross (1994, p.144) states that it is apparent that this definition is directly related to
how well the processes are managed – all of the processes in the organisation that
contribute directly or indirectly to quality as the customer defines it. This
management should be done continuously through all processes and not only selected
ones.

Page 51
Jeffries (1992, p.114) maintains that with TQM, the intention is to minimise non-
value-adding activities such as error creation, error inspection, time wasting and
maximise on value-adding activities such as error prevention, focused training, and
getting it right the first time. Process management should incorporate these factors to
produce a system that does these intentions.
Jeffries (1992) and Ross (1994) state that the traditional approach to quality control
was product inspection of the final product. TQM implies process and quality control
should be done over every process. Management of process quality ought to insure
that this stringent continuous quality care is occurring to improve all business aspects.
3.9.1. Just-In-Time (JIT)
Certain leading Japanese organisations attribute their success in reducing waste and
speeding production to the implementation of so-called ‘just in time’ methods of
working (Drummond, 1992, p.120). Drummond (1992) defines JIT as a system which
aims to produce and deliver finished goods just in time to be sold, sub-assemblies just
in time to be assembled into finished goods, fabricated parts just in time to go into
sub-assemblies, and purchased materials just in time to be transformed into fabricated
parts.
JIT is just researched to complete the characteristics of TQM, but is not discussed any
further and no organisation approached in this study is investigated with respect to
JIT. IT organisations do not have the same need for JIT in their workplace, as it is
usually not a production environment. More information about JIT can be found in
Appendix M.
Page 52
3.9.2. Quality in Project Management
Due to the nature of the IT industry, unique projects are undertaken and project
management is a regular occurrence that needs to be addressed. Some IT
organisations undertake large IT projects involving months of work and then even
years of further monitoring and maintenance. The quality management role should be
implemented differently based on project size, budget, and contractual requirements.
On smaller projects, the quality management role may be integrated into the
deliverer’s responsibilities. On larger projects, the project team may include a quality
assurance group, with an independent reporting relationship around the deliverer.
Jung and Wang (2006) explain that TQM alone may have a positive affect on project
management. They investigated the association between the TQM practice and the
continuous improvement aspect of international project management, as they found
that a growing number of organisations were adopting project management as part of
their management practices. The major finding of this study is that employee
relation's elements are the most contributing elements towards achieving continuous
improvement of project management. Investment made in employee training and
development, efficient communication mechanisms, employee work environment
flexibility and safety, and employee satisfaction, can make a significant contribution
to project management. The study also suggested that top management makes the
second largest impact. Management's leadership in commitment to quality through
vision and strategy, organisation-wide quality culture, and objectives for quality
performance, facilitates improvement of project management.
3.9.3. Conclusion
Once a quality strategy has been planned, it must be executed. Process management
deals with actions of the organisation and what it is doing to initiate the quality
movement and instil a quality culture.
Management of quality continually improves the functioning of the business as
variability decreases and standards are raised. The customer notices the effort and

Page 53
knows the organisation is serious about quality. Meeting the stringent characteristics
of TQM is dependant on good planning, implementation, monitoring, and adjusting
any discrepancies found. Strategic quality planning with management of process
quality achieves just this.
This research aims to determine how organisations measure the level of quality, if
organisations know the effectiveness of a quality initiative, if any, and if the
organisations keep monitoring the quality initiative. This is done by determining if
organisations have any TQM programmes, if employees have noticed any processes
that have been simplified or made more effective, and if organisations review
customer and employee inputs to improve quality.
3.10. Customer Focus and Satisfaction
Drummond, Ross, and Feigenbaum agree that quality begins and ends with the
customer. Customer focus and satisfaction is the interaction that occurs between the
customers, customer needs, and the business. Customers are the central focus of TQM
and quality control enters into all phases of the production process, starting with
customer’s specification, the sale to the customer through design engineering,
assembly to shipment of the product, installation, and field service; all making sure to
avoid customer dissatisfaction. TQM is implemented to increase profitability and
market share. This occurs because of an increased customer base due to satisfied
customers (Ross, 1994, p.205; Feigenbaum, 1983, p.825; Drummond, 1992, p.13).
Off all the Baldrige criteria, customer focus and satisfaction accounts for 25% of the
1996 points in the award, the most for a principle of TQM. The Baldrige Award
describes this category (Ross, 1994, p.205):
“This category examines the organisation’s relationship with customers and its
knowledge of customer requirements and of the key quality factors that drive
marketplace competition. Also examined are the organisation’s methods to
determine customer satisfaction, current trends, and levels of customer satisfaction
and retention, and these results relative to competition.”

Page 54
Balachandran (2004, p.142) explains that the way to increase competitiveness is to
acquire product differentiation, which is reflected in quality. The better the quality,
the more delighted the customer. Business after business is learning that ‘delighting
the customer’ means (Balachandran, 2004, p. 142):
• fewer customers lost;
• less time and money spent putting things right for dissatisfied customers;
• less time and money spent on advertising and marketing to find new
customers;
• less use of costly discounts and offers to attract new customers;
• more time to devote to anticipating and meeting the needs of the best
customers; and
• free (word of mouth) publicity from the satisfied customers.
With respect to the Malcolm Baldrige Award, the biggest difference between
applicants is the fact that the high-scoring organisations are proactive by customer
expectations (Reimann, 1991, p.11). This is done by surveys, understanding
implications of complaints, looking at product and service follow-ups, and by using
and integrating listening posts. The bottom line is to have a clear picture of customer
requirements.
3.10.1. Customer Satisfaction Determination
The organisation should understand how it determines customer satisfaction, customer
repurchase intentions, and customer satisfaction relative to its competitors (Porter and
Tanner, 1996, p.76). These processes ought to also be evaluated and improved.
Customer satisfaction determination also includes dissatisfaction indicators such as
complaints, claims, refunds, recalls, returns, downgrades, repairs, warranty work,
warranty costs, miss-shipments, and incomplete orders. Customers’ needs and
expectations can be monitored through (Balachandran, 2004, p. 162):
• market research and surveys;
• observation of customer behaviours and responses;

Page 55
• data on offers from competition;
• complaints;
• personal contact with customers;
• focus groups; and
• comment/feedback from users.
Monitoring tries to identify critical areas of expectations, and see what elements can
be built into either product features or processes to satisfy those expectations
(Balachandran, 2004, p. 163).
3.10.2. Customer Satisfaction Management
Porter and Tanner (1996, p.76) insist that the organisation must manage its
interactions and relationships with its customers. It should also use the information
gained from customers to improve its customer relationship management processes.
Processes should be set up to define key requirements for maintaining and building
relationships. These requirements should be translated into key quality measures that
may include responsiveness, product knowledge, follow-up, and ease of access.
Balachandran and Ross believe that customer satisfaction management deals with
communication with customers to get their feedback and consequently improve
quality. For instance, customer complaints can aid the process of finding the root
cause of problems in different processes of the organisation. They should not be
ignored because it is estimated that for every complaint a business receives, there are
26 other customers who feel the same way, but do not air their feelings to the
organisation (Balachandran, 2004, p. 173; Ross, 1994, pp.206-207). It is by
identifying these problems that can improve quality in the long-term making sure that
it does not happen again.
Ross (1994, p.207) and Balachandran (2004, p.174) state that customer complaints are
related to process variation. Both are undesirable and must be addressed. When a
complaint is attended to quickly and taken seriously, the likelihood of further negative
word of mouth is reduced. Repeated words of regret and compensation alone do not

Page 56
satisfy. Complaints should not be avoided, but, in any event, dealt with to ensure that
no other customers have the similar bad experience.
Customer satisfaction is the result of a three-part system (Ross, 1994, p.207):
1. company processes (operations);
2. company employees who deliver the product; and
3. service that is consistent with customer expectations.
Figure 4: Customer Satisfaction: Three-Part System (Source: Ross, 1994)
The shaded part in Figure 4 represents the extent of customer satisfaction. Ross (1994,
p.207) explains that the objective is to make all three circles converge into an
integrated system. Like any system, control is necessary. Thus, standards are set,
performance is measured, and variation, if any, is corrected.
This three-part model can be further extended for internal customers. It is just as
important to satisfy customer needs internally as it is externally. This can prove to be
quite tedious because what is good for the external customer might not be good for
the internal customer. The solution is to determine the needs of both parties involved
and design a process that would meet their expectations. Quality strategic planning
should be done to create this balance.

Page 57
3.10.3. Conclusion
The importance that customers obtain the desired product is recognised by Deming,
Juran, and Crosby. Customer retention is an opportunity for organisations to provide
continuous income. Ross (1994, p.216) estimates that customer defections can have a
greater impact than economies of scale, market share, or unit cost. The issue of
customer focus and satisfaction is a true quality focal point and both internal and
external customers should benefit and raise the standards of the organisation. Agus
(2000) discovered that effective TQM programmes assure that customers' needs are
identified early in the process of designing and producing a product.
The concept of internal and external customers and aspects associated with each are
included in this research to determine whether it is understood in the organisation.
Internally, it is examined whether internal policies follow external customer
requirements, whether organisations indeed take into consideration customer
requirements and if those requirements are made aware to the rest of the organisation.
Externally, whether customer policies such as warranties and complaints are
examined and recorded, and used to improve customer perception. This is then
extended to determine if any further commitments exist to customers.
3.11. Management Structure and Teams
This section describes an appropriate organisational infrastructure for the TQM
process. It is directed more at internal customer satisfaction and links with the
principles of customer satisfaction, human resource development, and top
management involvement discussed earlier. Structure refers to the arrangement of
responsibilities and functions (Balachandran, 2004, p. 164).
Balachandran explains that responsibilities and tasks should be assigned so that
employees are clear on what they must perform. This adds personal attachment and
ownership to processes, as nobody else will perform the task. This also increases ease
of checking up on processes, to recognise, reward, or discover any areas that need
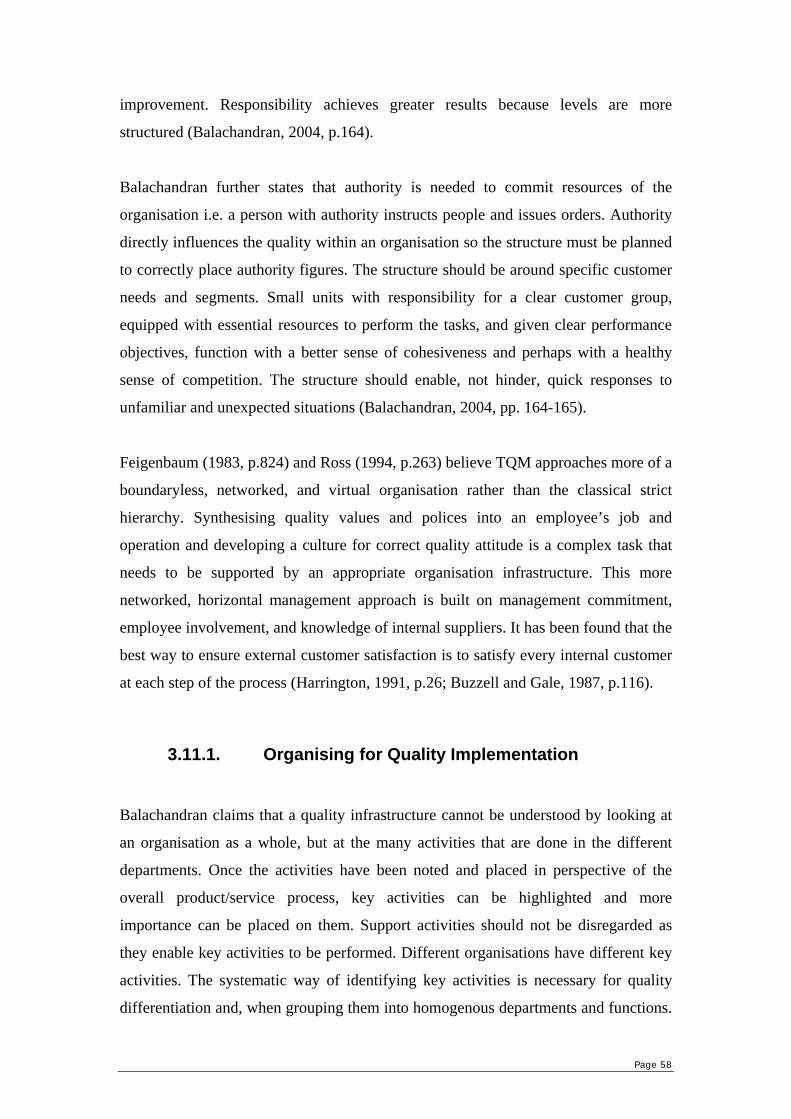
Page 58
improvement. Responsibility achieves greater results because levels are more
structured (Balachandran, 2004, p.164).
Balachandran further states that authority is needed to commit resources of the
organisation i.e. a person with authority instructs people and issues orders. Authority
directly influences the quality within an organisation so the structure must be planned
to correctly place authority figures. The structure should be around specific customer
needs and segments. Small units with responsibility for a clear customer group,
equipped with essential resources to perform the tasks, and given clear performance
objectives, function with a better sense of cohesiveness and perhaps with a healthy
sense of competition. The structure should enable, not hinder, quick responses to
unfamiliar and unexpected situations (Balachandran, 2004, pp. 164-165).
Feigenbaum (1983, p.824) and Ross (1994, p.263) believe TQM approaches more of a
boundaryless, networked, and virtual organisation rather than the classical strict
hierarchy. Synthesising quality values and polices into an employee’s job and
operation and developing a culture for correct quality attitude is a complex task that
needs to be supported by an appropriate organisation infrastructure. This more
networked, horizontal management approach is built on management commitment,
employee involvement, and knowledge of internal suppliers. It has been found that the
best way to ensure external customer satisfaction is to satisfy every internal customer
at each step of the process (Harrington, 1991, p.26; Buzzell and Gale, 1987, p.116).
3.11.1. Organising for Quality Implementation
Balachandran claims that a quality infrastructure cannot be understood by looking at
an organisation as a whole, but at the many activities that are done in the different
departments. Once the activities have been noted and placed in perspective of the
overall product/service process, key activities can be highlighted and more
importance can be placed on them. Support activities should not be disregarded as
they enable key activities to be performed. Different organisations have different key
activities. The systematic way of identifying key activities is necessary for quality
differentiation and, when grouping them into homogenous departments and functions.

Page 59
Key activities impact on customers directly (Balachandran, 2004, p. 144). Figure 5
shows how some of these activities can add value to the customer.
Figure 5: How Activities Can Impact on Customers Directly (Source: Ross, 1994)
An organisation structure that corresponds to different homogenous departments
based on key activities as opposed to the traditional departments such as accounting,
marketing, and research & development, each of single function and non-interacting,
is the most economic and effective way to deliver quality and therefore achieve a
competitive advantage (Ross, 1994, p.269). Figure 6 shows the concept of organising
for TQM. Inputs to the system are converted by organisation activities into an output.
The objectives of the system should first be determined by top management and be
aligned with the quality vision, quality goals, and quality strategies of the
organisation.
Figure 6: The Organisation System (Source: Ross, 1994)

Page 60
Jeffries (1992, p.68) believes commitment to the organisation’s vision should be
emphasised. Appointing someone at the executive level with specific overall
responsibility for quality can do this. This appointment has access to both top
management and base level employees to smooth the quality goals and policies and
improve communication throughout the levels of the organisation.
3.11.2. Teams for TQM
A critical component of TQM is employee involvement and the one on which the
management system should be based (Ross, 1994, p.278). Human resource
development and employee involvement were discussed earlier as a vital untapped
resource (see section 3.8.1). Ross (1994, p.278) describes that to increase involvement
and to generate new ideas constantly, quality teams need to be formed. These teams
vary slightly among different organisations incorporating different levels of
employees with varying tasks. Some of these may be quality councils, steering
committees, cross-functional teams, quality improvement teams, task teams, self-
managing work teams, and quality circles (Figure 7c). All are based on similar
principles trying to involve employees, increase quality, improve operations, and
optimise the efficiency and effectiveness of the total process. Quality circles are the
most original form based on these principles. It is defined as a small group of
employees doing similar or related work who meet regularly to identify, analyse, and
solve product-quality and production problems and to improve general operations
(Ross, 1994, p.278). This provides the core meaning for implementing teams for
TQM.
A team approach to business process improvement provides long-lasting results and
minimises implementation time (Harrington, 1991, p.55). This ensures quality within
the entire organisation over the long term and aids in internal customer satisfaction.
Harrington states that a quality team is the centre of the improvement activity and
brings about new growth and increased productivity within an organisation. Its efforts
bring about a new way of thinking about the business and the way each process
functions. Process improvement teams bring increased effectiveness, efficiency,
productivity, and profits (Harrington, 1991, p.62).

Page 61
Figure 7: Transition from Traditional to TQM Organisation (Source: Ross, 1994)
Ross believes that organisational structure should incorporate the ideals of TQM. The
organisational chart can be a starting point of making employees aware of a difference
in culture. The traditional organisational chart has the chairman at the top and the
cascading of authority to successive levels ignoring front-line supervisors and the
employees (Figure 7a). In this model, it is the same people who are ignored that
deliver the quality in the product or service. A new organisational chart should be
declared in organisations with TQM management, as shown in Figure 7b. This does
not change the hierarchy and flow of authority, just the degree of importance for
management to focus on. The manager is now a facilitator, a coach, and an integrator,
whose job is to remove barriers that prevent subordinates from doing their jobs (Ross,
1994, p.273). Quality is now the responsibility of everyone and not just the quality
assurance department. Using this new organisational view, employees also become
aware of their importance and can better understand their role in the organisation.
3.11.3. Reengineering
Balachandran (2004, p.213) states that Business Process Reengineering (BPR) is, by
definition, an attempt to rethink the fundamentals of the business process in critical
areas of performance, and to redesign the processes in ways that dramatically improve

Page 62
quality of service, speed and cost. It reinvents the organisational structure.
Reengineering recognises that the market may be turbulent, the customers are often
unpredictable, competition can be ruthless, margins shrink, and life cycles of products
are shortening. The context for BPR is nothing more than realities of change. The
realities are (Balachandran, 2004, p. 216):
• nothing is simple anymore due to rapid and perplexing change;
• whatever organisations do should be quick and radical due to the speed of
change;
• marginal or incremental adaptation is not enough; and
• organising should be around outcomes, not tasks.
BPR is not a prerequisite, but one way an organisation can go about changing its
processes. The management philosophy developed in TQM can be a drastic change on
the current organisation profile just as BPR can be. This research does not assess in
which way organisations implement change. It is included here to complete the
discussion on organisational structure and how organisations can implement change
and hence TQM.
3.11.4. Conclusion
TQM approaches more of a boundaryless, networked, and virtual organisation making
use of management and employee structures such as quality councils, steering
committees, cross-functional teams, and quality circles. This thinking moves away
from the classical, strict, vertical hierarchy where employees are only minimally
involved and not deemed as important.
This research assesses whether any quality teams exist and whether any meetings are
held to discuss quality aspects for improvement. It also tries to determine whether
these teams and meetings are effective in improving quality.

Page 63
3.12. The Cost of Quality
Quality is measured by the cost of quality (CoQ), which is the expense of non-
conformance, the cost of doing things wrong (Crosby, 1984, p.64). Some authors are
under the impression that the CoQ, or more specifically, “non-quality” is a major
concern for organisations and there appears to be general agreement that the costs of
not doing the things right the first time range between 20 and 30 percent of sales
(Crosby, 1984, p.86; Bicheno, 1991, p.47; Ross, 1994, p.332; Jeffries, 1992, p.117).
The potential for profit improvement is thus substantial.
Historically, it is assumed that increased quality implies increased cost, but as various
authors discovered, this is not the case. Feigenbaum (1983) introduced the concept
that quality is everyone’s job and should be incorporated throughout the organisation
in all activities. In 1979 Crosby (1979) introduced the concept that quality is free.
Today, the view among practitioners seems to fall into one of three categories (Ross,
1994, p.333):
1. Higher quality means higher costs – the additional benefits from improved
quality do not compensate for the additional expense.
2. The cost of improving quality is less than the resultant savings – the savings
result from less rework, scrap, and other direct expenses related to defects.
3. Quality costs are those incurred in excess of those that would have been
incurred if the product were built or the service performed exactly right the
first time – this view is held by adherents of the TQM philosophy. Costs
include not only those that are direct, but also those resulting from lost
customers, lost market share, and the many hidden costs and foregone
opportunities not identified by modern cost accounting systems.
Bicheno states that the cost of quality aims at the financial quantification of all
activities involved in the prevention and rectification of defects. The cost of non-
conformance or the CoQ should be calculated by organisations and used as a force for
directed improvement because costs can now be brought to the attention of
management. The CoQ pinpoints the source of quality costs and quantifies quality
with money. Money is the “language of management” and quality can then be

Page 64
followed and provide specific cost justification data for management (Bicheno, 1991,
p.46). The costs of quality are generally classified into four categories (Feigenbaum,
1983, p.826; Jeffries, 1992, pp.118-119; Balachandran, 2004, p. 148; Bicheno, 1991,
pp.46-47; Ross, 1994, p.334):
1. Prevention Costs – these include those activities that remove and prevent
defects from occurring in the production process. These ensure poor quality is
not produced.
2. Appraisal Costs – costs incurred to identify poor products after they occur but
before shipment to customers e.g. inspection.
3. Internal Failure Costs – costs incurred in the production process e.g. machine
downtime, poor quality materials, scrap, and rework.
4. External Failure Costs – costs incurred after the product is shipped e.g.
returns, warranty costs, and the hidden costs of customer dissatisfaction and
lost market share.
Bicheno believes that with the introduction of TQM, failure costs decline whilst
prevention costs level out. This comes about because employees as well as
management now participate and quality becomes the natural standard. Prevention
requires initial but not continuing investment, and as a result costs stabilise. Total
costs continue to decline all the way to the level of zero defects, so that the optimal is
reached with perfect quality (Bicheno, 1991, p.47).
Implementing TQM decreases non-conformance costs and this is the key to increase
profitability and gain market share. Prevention costs should be made a priority
because it is much less costly to prevent a defect than to correct one (Crosby, 1987,
p.67; Ross, 1994, p.336; Balachandran, 2004, p. 148).
It costs to implement quality, but weighed against the cost of non-conformance, there
should be no hesitation to implement TQM. TQM can increase each activity’s
effectiveness to improve overall efficiency. This increased efficiency and the savings
in cost of non-conformance, extrapolated over the longer-term, should add more
motivation to implement TQM.

Page 65
CoQ is included in this research to determine if management follow any monetary
impact of implementing TQM. The four categories of costs are used to assess
organisations.
3.13. Trends in Management Philosophies
This part is explored to gain an understanding of the relevance of TQM as a
management philosophy for the contemporary organisation. Smit (1999, p.36)
explains that a management theory is a group of assumptions put forth to clarify and
contend with the productivity issue. There is no clear answer to this issue, so
management experts put forward their own views.
Smit (1999, p.37) explains that the theories of management can be classified into two
main schools of thought, namely classical approaches and contemporary approaches.
At a certain point in time each of these theories was held to be the answer to the
productive attainment of the goals of the organisation. No theory dominates the field
of management. Instead, the eclectic approach – the practice of borrowing
management principles from different theories as dictated by circumstances – is the
state of the art in management theory and practiced today. Figure 8 shows the various
management approaches on a timeline. These theories should always be seen against
the dominant culture (economic, political, social, technological, ecological, and
international) of their time (Smit, 1999, p.37). It can be seen that TQM is one of the
more recent management practices.

Page 66
Figure 8: The Evolution of Management Theory (Source: Smit, 1999, p.38)
Smit (1999, p.47) maintains that the classical approaches to management provide the
foundation for management and organisations as they function today. These
approaches responded primarily to the pressing issues of their times, particular the
need for internal efficiency. As time passed, international communication increased
and multinational organisations became popular as trade alliances were formed. This
increased competitive challenges and organisations were forced to alter management
styles. This meant focusing on internal as well as external issues. TQM was one of the
approaches that was developed for this. This can be seen in certain principles of TQM
such as information systems (benchmarking against top multinational organisations)
and customer focus (letting the customer change processes in the organisation).
It would be naïve to think that the evolution of management philosophy has stopped.
Changes in the environment continually affect management approaches and trends in
quality management should be researched. By virtue of the eclectic approach, this
research investigates which TQM principles will remain and where TQM is bound for
in the near future. It also tries to ascertain if organisations seek to implement TQM,
understand any alterations, determine if any principles of TQM are no longer
important, and if there are any new quality management philosophies being
implemented at organisations. If so, they may be examined to determine its reliance
on any TQM principles and why they have come about.

Page 67
3.14. Conclusion
The principles of TQM, derived from the MBNQA and studied further through an in-
depth literature survey, have been examined for this research. With different quality
management entities discussed and further research on various principles done, it is
possible to determine exactly what needs to be assessed at each organisation and what
may arise. Each organisation is assessed on eight different principles. These are:
1. Top Management Involvement – includes culture, communication, and
involvement.
2. Information Systems – includes benchmarking and supplier evaluation.
3. Strategic Quality Planning – strategy development, and the mission, vision,
goals, and policies aligned with quality.
4. Human Resource Development – the education, training, involvement, and
rewards and recognition of employees.
5. Management of Quality – implementing and guiding the quality initiative by
measuring the actions of quality planning and changing processes.
6. Customer Focus and Satisfaction – systems in place to understand and assure
internal (customer knowledge and policies) and external (feedback,
warranties) customers satisfaction.
7. Management Structure and Teams – forming quality teams and the discussion
and handling of quality with employees.
8. Cost of Quality – prevention, appraisal, and internal and external failure costs.
All eight principles are thought to be required for a complete TQM system. Certain
dependencies may exist between some of these principles (management of quality
would be harder without correct strategic quality planning, organisation resources for
human resource development would be less plentiful if top management didn’t see the
need for customer satisfaction, with regards to quality, and hence were not involved).
There is no set pattern for implementing and these principles may intertwine at
various organisations as they best fit. The framework developed in this research and
how closely related the principles are can be seen in Figure 9.
Trends in management philosophies were introduced to discuss the need to
understand the evolution of TQM and how it may exist in the future. In this research,

Page 68
the selected organisations are assessed with regards to the perceived trends in quality
standards.
Figure 9: TQM Framework Used In This Research
Jeffries (1992, p.23) explains that once having established TQM, it needs to be
measured and there have been various attempts to measure it based on:
• customer satisfaction;
• profitability/performance;
• product/service quality; and
• valuing employees.
The aim in this research is to measure the implementation of TQM based on the eight
principles and asses it against financial performance (profitability/performance point
above). The next chapter focuses on the various aspects of financial performance and
the possible ways of measuring it.

Page 69
Chapter Four: Financial Performance
4.1. Introduction
Financial performance can be defined as an organisation's ability to generate new
resources, from day-to-day operations, over a given period of time and is usually
gauged by net income and cash from operations (Definition:Financial Performance,
2006).
This research deals with listed IT organisations. These types of organisations are
owned through shares (for a description of public limited organisations as a business
organisation – see Appendix B). A share is one of a number of equal portions of the
capital of an organisation and shareholders own the organisation through the purchase
of these shares (Goodspeed, 2004, p.5).
According to Firer et al (2004), the cash payoff to owners of common stocks comes in
two forms: capital gains (or losses) which arise through changes in the price of an
organisation’s shares; and dividends whereby shareholders are given a portion of the
organisation’s profits. Brealey and Myers (1991, p.675) state that a business has to
deal with many different factors regarding corporate finance that affect financial
performance. Such factors affecting capital gains (losses) and dividends could include
areas such as capital budgeting, dividend policy, stock issue procedures, mergers and
acquisitions, capital structure, and leasing. Some of these areas are discussed in
Appendix N because they may have a bearing on the financial performance of
organisations. In the end the financial manager should consider the combined effects
of these decisions on the organisation as a whole. This chapter considers various ways
financial performance can be measured.
4.2. Measuring Financial Performance
Financial data can be used to analyse an organisation’s overall performance, assess its
current financial standing, and determine any future potential (Goodspeed, 2004,

Page 70
p.24). This chapter describes the financial indicators chosen to depict the financial
situation of organisations, including selected financial ratios and any trends of these.
Goodspeed (2004, p.24) and Firer et al (2004, pp.21-30) stress that financial
statements provide both descriptive and quantitative information about the
organisation’s current status and past financial performance. Descriptive information
on the organisation’s operating results over the past reporting period is provided by
the chairman’s, director’s, and auditor’s reports while quantitative information is
contained in the income statement, balance sheet, and cash-flow statement. The
income statement and balance sheet are used in this research as the source of
information. Being listed organisations, this information is easily available.
Goodspeed (2004, pp.25-28) goes on to describe each financial statement. The income
statement contains information on an organisation’s income and expenditure over a
period of time (past reporting period). The balance sheet is a snapshot of the financial
situation of an organisation at a specific time. It is divided into two main sections: the
source of funds (capital and liabilities) and the application of funds (assets). Various
ways financial performance may be measured using the income statement and balance
sheet are discussed.
4.2.1. Financial Ratios
Various authors indicate that financial ratios are an effective way of comparing
organisations of different sizes and against the current industry trends, summarising
large quantities of financial data, and comparing organisation’s financial
performances (Brealey and Myers, 1991, p.675; Firer et al, 2004, p. 57). A ratio seen
in isolation has little, if any, meaning. However, its usefulness increases when it is
compared to (Goodspeed, 2004, p.32):
• other ratios in the same set of financial statements;
• similar ratios in previous sets of financial statements; and
• a standard of performance such as an industry benchmark.

Page 71
Financial ratios can be classified into six categories – sales, financial leverage,
liquidity, asset management, profitability, and market value ratios.
All values used for the financial ratios are that specific organisation’s year end
income statement and balance sheet values.
4.2.1.1. Sales Ratios
Sales relate to the turnover of the organisation and can be found in the income
statement. This is usually the first thing reported on because financial performance is
usually gauged by net income and cash from operations (Firer et al, 2004, p.27).
Percentage change in sales and percentage change in return on sales are used in this
study for each organisation. These indicators are based on the assumption that an
effective TQM programme retains the current customers and increases revenues.
The percentage change in sales is calculated year on year for each organisation, i.e.
timeofperiodprevioustheistandtimeofperiodatwhereSales
SalesSalesSales
t
tt
1:1
1
−=
−=Δ
−
−
Return on sales is the operating income divided by sales. Operating income is defined
as the earnings before any interest and tax payments, also termed “operating profit” or
“profit from operations”. Lemak and Reed (1997) discuss the advantage of using
operating income instead of net income to ascertain the impact on financial
performance of TQM. They state that operating income is a better measure of
performance than net income since it is not greatly affected by accounting methods,
tax strategies, or financial structure. The formula for return on sales is:
SalesIncomeOperatingSalesonturn =Re

Page 72
4.2.1.2. Long-Term Solvency or Financial Leverage Ratios
Many authors indicate that these long-term solvency measures address the
organisation’s long-term ability to meet its obligations. These ratios also measure the
capital structure of an organisation and indicate how heavily the organisation is or is
not burdened in debt. This may be important because shareholders get only what is
left over after the debt holders have been paid (Firer et al, 2004, p.60; Brealey and
Myers, 1991, p.677; Goodspeed, 2004, p.34). No attempt is made to measure the
financial leverage of the organisations in this study. It is assumed that since the
organisations are listed for a minimum of five years, they are not burdened with debt.
4.2.1.3. Short-Term Solvency or Liquidity Measures
Firer et al (2004) highlight that short-term solvency ratios are intended to provide
information about an organisation’s liquidity. The primary concern is the
organisation’s ability to pay its accounts over the short run without undue stress (Firer
et al, 2004, p.57). None of these ratios are used in this research because of their short-
term nature. Current assets and current liabilities also often do not exist long enough
for the two to get unmanageable. They also change fairly rapidly, so today’s amounts
may not be a reliable guide to the future (Firer et al, 2004, p.58). TQM is a long-term
endeavour and so more long-term indicators are sought.
4.2.1.4. Asset Management Ratios
Asset management or activity/turnover measures deal with efficient use of resources
employed in the organisation’s operations (Goodspeed, 2004, p.33). Total asset
turnover indicates the organisation’s ability to generate sales from its total asset base
(Goodspeed, 2004, p.34). This ratio is used to indicate asset management efficiency:
AssetsTotalSalesTurnoverAssetTotal =

Page 73
4.2.1.5. Profitability Ratios
Various authors dictate that profitability ratios are intended to measure how
efficiently the organisation uses its assets and how the organisation manages its
operations. The focus here is on the bottom line and profit generating ability of an
organisation (Firer et al, 2004, p.64; Goodspeed, 2004, p.37). Return on equity (ROE)
and return on assets (ROA) are the two indicators used to indicate profitability.
ROA relates net profit to sales. This measures the overall management efficiency of
an organisation (Goodspeed, 2004, p.37). It is based on the assumption that
implementing an effective TQM programme increases revenues. It requires net profit
and total assets as the inputs. This can be seen in the formula:
ROE indicates how effectively the organisation is being managed in the interest of
shareholders. ROE is an important indicator of performance (Goodspeed, 2004, p.37).
It requires net profit and total equity as the inputs. This can be seen in the formula:
EquityTotaltaxafterprofitNetROEEquityonturn =)(Re
In this research, total assets are defined as all the assets of an organisation, current and
non-current, as indicated on the balance sheet. Total equity is defined as total ordinary
shareholder’s funds. This includes capital and reserves and excludes minority
interests. Minority interest consists of the minority portion of the subsidiary
shareholder’s equity and hence must be paid by the shareholders of the group
organisation i.e. the main holding organisation (Feinberg, 2005, p.555).
AssetsTotaltaxafterprofitNetROAinmprofitNet =)(arg

Page 74
4.2.1.6. Market Value Ratios
Goodspeed (2004, p.49) indicates that this is a type of relative valuation technique
that expresses the price of a share as a ratio (multiple) of some quantity relevant to a
shares’ value such as earnings and book value. They are used to show how highly the
organisation is valued by investors. These measures can only be calculated directly
for publicly traded organisations (Firer et al, 2004, p.65). The most widely used
market value measure is the price/earnings (P/E) ratio. It measures how much
investors are willing to pay per Rand of current earnings. It takes into account the
share price and earnings-per share (EPS) and may indicate which shares are
undervalued and overvalued compared to each other and the JSE. It is not used in this
research as it may indicate the organisation being dealt with. The other problem is that
share prices may fluctuate daily yet the EPS figures used to calculate the ratio are
obtained in the year-end financial statements, therefore resulting in incorrect P/E
ratios or P/E ratios that do not best identify the current state of the organisation.
4.2.2. Share Price
The share price reflects the current value of the organisation from an investor’s point
of view (Dictionary, 2006). It is thought to be a stronger indicator of financial
performance used in this study, as one of the goals of managers is to increase
shareholders’ wealth i.e. increase the current value per share of existing shares (Firer
et al, 2004, p.10). Investors are continually analysing organisations and dealing in
shares of that organisation. Because of this, they are buying and selling shares hence
affecting the share price constantly.
4.2.3. Other Studies’ Indicators
Other studies that attempt to link TQM to financial performance were analysed to
determine how financial performance could be measured.
Eriksson (2003) used: change in sales, change in return on assets, change in return on
sales, change in total assets, and percentage change in number of employees.

Page 75
In Singhal and Hendricks (1997, 1999, 2001), six indicators of the financial
performance were used to illuminate the impact of TQM. These were: change in sales,
change in return on assets, change in return on sales, change in total assets, change in
number of employees, and change in operating income.
Easton and Jarrell (1998) also use similar indicators, net income, operating income,
sales, and inventory. Table 2 provides a summary of previous studies’ indicators to
evaluate the impact of TQM on the financial performance.
Table 2: Previous Studies' Indicators to Measure Financial Performance
Change In Sales Return on Assets Return on Sales Erksson X X X Singhal & Hendricks X X X Easton & Jarrell X Change in Assets Change in Employees Operating Income Erksson X X Singhal & Hendricks X X X Easton & Jarrell X
4.3. Conclusion
The six financial indicators chosen to measure the financial performance of the
organisations are:
1. percentage change in sales;
2. percentage change in return on sales;
3. total asset turnover;
4. return on assets (ROA);
5. return on equity (ROE); and
6. percentage change in share price.

Page 76
All the indicators chosen do not reflect original values i.e. if the total assets figure is
known, it would be easy to identify the organisation. For the sake of anonymity,
financial ratios and percentage changes are used. These financial indicators chosen
closely resemble that of those used in previous studies.
Three of the indicators chosen are financial ratios dealing with profitability and asset
management, two of the six financial indicators take into consideration the turnover of
organisations, and the remaining indicator incorporates the share price. This is
thought to provide a balanced view of the financial performance at each organisation.
The next chapter’s aim tries to introduce the association between quality and financial
performance.
It is noted that unlike TQM, financial performance is well understood (although the
use of historical values e.g. on balance sheet needs some explanation). This is why
there is such a difference between the TQM and the financial performance sections.

Page 77
Chapter Five: Quality and Financial Performance
5.1. Introduction
The previous chapters introduced and defined the concepts of TQM and financial
performance. This chapter approaches TQM by analysing any associations between
quality and profitability, productivity, market share, and price performance. These
factors are examined because each may affect financial performance and each may be
affected by quality initiatives. References are made throughout the chapter to current
and previous international studies performed.
The Malcolm Baldrige National Quality Award is placing more emphasis on financial
performance than before (Chapter 3.3.10 and Appendix E). Specifically, the award
that recognises corporate quality achievements now further emphasises financial data
in setting priorities for performance improvement, and also relies more on financial
results in identifying quality practices. Considering this, the association between
quality and financial performance is examined, and findings on links between quality
and financial performance discussed.
5.2. Quality, Profitability, Market Share, and Competitiveness
Buzzell and Gale (1987) maintain that there are two basic ways to try do better than a
competitor. The first one is to achieve superior perceived quality by developing a set
of product specifications and service standards that more closely meet customer needs
than competitors. The second way is to achieve superior conformance by being more
effective than the competitors in conforming to the appropriate product specifications
and service standards. These ways of improving are not mutually exclusive, so
competitors should try to compete against each other on both perceived quality and
conformance quality.

Page 78
Superior relative quality is linked to higher relative process, market-share gain, lower
relative costs, and higher profitability, as shown in Figure 10 (Buzzell and Gale, 1987,
p.81). Total quality is considered essential to ensure competitiveness in global
markets and is important to market leaders i.e. organisations with greater market share
(Deming, 1982, p.1; Ross, 1994, p.1; Buzzell and Gale, 1987, p.81; Feigenbaum,
1983, p.824; Porter and Tanner, 1996, p.1). Buzzell and Gale (1987, p.81) maintain
that market leaders not only command higher processes, but also maintain their
leadership position by offering products and services that are superior relative to those
offered by competitors. Gaining more market share implies volume growth, rising
capacity utilisation, and ultimately, capacity expansion allowing the introduction of
new equipment that embodies the latest cost-saving technology. In this way, quality
affects many areas of an organisation. The implementation of quality has an
exponential effect on financial performance because as time goes on, more functions
in a business are positively affected by it (Buzzel, 1987, p.81).
Figure 10: Winning with Superior Perceived Quality
The association between quality, profitability, and market share has been studied in
depth by the Strategic Planning Institute (Cambridge, Massachusetts), by the
formulation of an extensive database started in 1972. The Profit Impact of Market
Strategy (PIMS) database relates business strategies to performance by studying past
experiences (Buzzell and Gale, 1987, p.1). The conclusion, based on performance

Page 79
data of about 3000 strategic business units is (Buzzell and Gale, 1987, p.103; Ross,
1994, p.9):
“One factor above all others – quality – drives market share. And when
superior quality and large markets share are both present, profitability is
virtually guaranteed. There is no doubt that relative perceived quality and
profitability are strongly related. Whether the profit measure is return on sales
or return on investment, businesses with a superior product/service offering
clearly outperform those with inferior quality”.
The PIMS database demonstrates that relative market share and relative quality exert
a strong positive influence on a business’s profitability (Buzzell and Gale, 1987,
p.73). According to Buzzell and Gale (1987, p.108), organisations that have both
larger share and better quality than their leading competitors earn return on
investments (ROIs) that are dramatically higher than those of businesses with small
share and inferior quality, as demonstrated in Figure 11.
From the above discussion it can be understood how quality improves market share
and how market share plays a part in improving financial performance. The positive
link with quality should provide an added incentive to implement TQM. PIMS shows
that the relative perceived quality of an organisation and its product/service affects its
market share. TQM is one initiative that can be implemented to provide that superior
relative perceived quality. TQM is a continuous system that monitors and tracks
customer’s needs as a prerequisite. It can alter systems or its product/service to those
needs making sure that the organisation has the superior quality edge in the
marketplace.

Page 80
Figure 11: Both Quality and Market Share Drive Profitability
5.2.1. Service Quality and Financial Performance
Many aspects of IT organisations can be classified in the service industry (section
3.2). Considering this, the aspect of how service quality may affect financial
performance is discussed.
Berry et al (1989, p. 6) believe that the quality of service provided by an organisation
directly affects its bottom line, the effect is positive if the service is good and negative
if service is poor, but the association between quality and financial performance is
inescapable. He believes that quality service can help cut costs and boost revenues
through relationship broadening, productivity enhancement, and error reduction, all
characteristics of TQM.
Financial institutions have three ways to increase market share: attracting new
customers, doing more business with existing customers, and reducing customer loss
(Berry et al, 1989, p. 9). Berry et al (1989, p.9) believe that a reputation in quality
service promotes an institution’s effectiveness in all three areas. With the
implementation of TQM (its main focus being customer satisfaction), it helps the

Page 81
three factors to increase an organisation’s effectiveness. When service quality is
increased using proper implementation of TQM, customer satisfaction should also
increase. This in turn improves brand loyalty and formation of true customers,
increasing profitability.
5.2.2. Customer Retention and Profitability
Ross (1994, p.216) states that a measure for customer satisfaction and profitability is
hard to calculate. This may be due, in part, to the difficulty of measuring satisfaction
and relating it to profit. An easier, yet theoretically similar, method would be to
analyse customer retention and profitability. It is assumed that a retained customer is
ultimately satisfied. Ross believes that one way to put a value on customer retention is
to assign or estimate a “lifetime retention value”, the additional sales that would result
if the customer were retained. Taco Bell (food franchise in the US), automobile
dealers, and MBNA America (credit card organisation) all found that the value of
customer retention is worth striving towards (Ross, 1994, p.216). The system for
improving customer retention and profit is illustrated in Figure 12. The motivation is
employee satisfaction and the system components are (Ross, 1994, pp.216-217):
• internal service quality to establish and reinforce an organisational quality
culture;
• employee retention for good human resource management;
• external service quality delivered through the organisation’s quality
infrastructure; and
• customer satisfaction to reduce customer defections.
These components link to the principles of TQM implying that if implemented
correctly, customer defection is less likely to occur. This indicates an association
between customer retention and profit, and hence TQM and profit (Ross, 1994,
p.217).

Page 82
Figure 12: Profitability and Customer Retention (Source: Ross, 1994)
5.3. Quality and Productivity
The association between quality, market share, and profitability was discussed earlier
showing that higher quality might lead to both increased profits and greater market
share. This section examines the association between quality and productivity. This is
because an organisation's financial performance is associated to its quality and
productivity improvement approaches (Lee, 2001).
Improvement of productivity (output-per-man-hour) means increasing the ratio of the
output of goods and services produced divided by the input used to produce them
(Ross, 1994, p.309). This implies that increasing output, reducing the input, or both,
can increase productivity. Figure 13 shows some techniques for improving the
productivity ratio. Five major ways to improve productivity are as follows (Ross,
1994, pp.310-312):
• Cost Reduction – traditional and most widely used method. This forced cutting
of expenses leads to more inefficient processes just to save some money and is
not the recommended route.

Page 83
• Managing Growth – this is a more positive approach and termed cost
avoidance. An investment is made for growth, but the investment must return
more than the cost, in so, increasing the productivity ratio.
• Working Smarter – this means more output from the same input. This can be
obtained by reducing manufacturing cost through product design, improving
processes, or getting more production from the same level of raw materials by
increasing inventory turnover.
• Paring Down – similar to cost reduction, except that as sales or production is
off, input should be reduced by a proportionately larger amount, thus
increasing the ratio. This could imply getting rid of the no longer productive,
the obsolescent, and the obsolete.
• Working Effectively – this is the best method and believes more is attainable
for less. This is the TQM approach by creating a quality culture, involving
employees, improved communications, employee training etc.
A misconception exists that if time and money is devoted to quality, attention is
removed from productivity and hence reduces output. While this may be the case in
the short term for some, it generally is not true over a longer period of time (Ross,
1994, p.300; Buzzell and Gale, 1987, p.7; Deming, 1982, p.1).
Deming (1982, pp.1-2), who based it on the reduced productivity that is caused by
quality defects, rework and scrap, made the argument for a positive relationship. He
concluded: “improvement of quality transfers waste of man-hours and of machine-
time into the manufacture of good products and better service”. Feigenbaum (1977,
p.21) maintains that a certain “hidden” plant exists to re-work and repair defects and
returns, and if quality were improved, this hidden plant would be available for
increased productivity. When the broader picture is considered it can be shown that
increasing quality also increases productivity, and the two are mutually reinforcing
(Harrington, 1991, p.26; Ross, 1994, p.300, Buzzell and Gale, 1987, p.6). TQM is
then associated with cost reduction, greater efficiency, better use of resources, and
organisational restructuring i.e. increasing productivity (Feigenbaum, 1983, p.824).
With this positive link between quality and productivity and hence market share and

Page 84
profitability, productivity can also improve with the implementation of TQM, and
hence affect financial performance.
Figure 13: Productivity Wheel
Harrington (1991) and Buzzell and Gale (1987) believe that organisations pursuing
quality as a competitive strategy have found that improved quality, increased
productivity, reduced costs, and enhanced customer satisfaction go hand in hand. This
was confirmed by a study by McAdam and McKeown (1999). They found that
although TQM businesses said that it had been worthwhile implementing TQM, no
businesses specified the effects of TQM on bottom line performance results or, more
importantly, the actual positive impact on customer satisfaction. In spite of increased
customer satisfaction, experienced by 55% of the survey, it appears that many of these

Page 85
businesses are chasing after internal benefits rather than focusing on customers
(McAdam, 1999, pp.229-242). They found that the main reason and benefit for
implementing TQM was tending towards internal matters such as reducing costs and
increasing productivity, 73% and 55% of businesses respectively. Although this may
be incorrect, in the sense of implementing TQM for improved customer satisfaction, it
does highlight that TQM does affect certain internal benefits (reducing costs and
increased productivity).
5.4. Quality and Stock Price Performance
A study by the United States Commerce Department’s National Institute of Standards
and Technology (NIST) was done on whether TQM affects investment performance
in Malcolm Baldrige winners and applicants. NIST invested a hypothetical $1000 in
each of the five publicly traded whole organisation winners of the Baldrige Award
and the parent organisations of seven subsidiaries. The progress of the investment was
tracked from the first business day in April, the year they won the award, or the date
they went public- till 3 October 1994. Adjustments were made for stock splits and/or
dividends. Another hypothetical $1000 was invested in the Standard & Poor’s (S&P)
500 at the same time. Overall, the Baldrige portfolio achieved a 92% return on
investment (ROI) compared with a 33% ROI for the S&P 500 (NIST, 1995).
In addition, NIST invested a hypothetical $1000 in the publicly quoted Baldrige
applicants during 1990 through to 1993. The applicants outperformed the S&P 500
portfolio by a ratio of 4.5 to 1. These studies add to the empirical evidence that TQM
can lead to superior financial performance (Porter and Tanner, 1996, p.253). Baldrige
Award winners provide examples that investment in quality programmes may result
in cost savings, market share improvement, and impressive improvements in
manufacturing and service performance (NIST, 1995). Robinson (Iversen, 2002, p.6)
states "once you're using advanced management techniques, including things like Six
Sigma, ISO, and Malcolm Baldrige, you start to gain efficiencies that your
competitors do not have". Those efficiencies may pay off in improved profitability
and other benefits that the stock market rewards. This study highlights the importance
of share price movement by incorporating it as one of the six financial indicators.

Page 86
5.5. Research Findings
Agus (2000) performed a study on Malaysian organisations that empirically
investigates the simultaneous linkages between TQM, customer satisfaction, and
financial performance relative to competitors. The paper offers empirical evidence of
the contributing attribute of TQM practices on customer satisfaction and, ultimately,
financial performance in comparison with competitors. The results suggest that the
implementations of TQM may lead to the enhancement of customer satisfaction and
ultimately improve the financial performance of manufacturing organisations in
Malaysia.
Eriksson (2003) in Sweden and Singhal and Hendricks (1997, 1999, 2001) in United
States performed two different, yet similar in method, studies to determine the impact
of TQM on financial performance. Both examine quality award winners and compare
them to a competitor of similar size, scope, and industry not implementing TQM
(matched control groups). Results examine a five-year implementation period and a
five-year post implementation period. The results of both studies show significant
associations - during the implementation period the award recipients did not
necessarily perform better than their competitors, but during the post implementation
period award winners significantly outperformed organisations in the various control
groups. Eriksson (2003) found that the award recipients show a significantly higher
return on assets than their competitors and the branch indices during the post
implementation period of TQM. Also, the indicators, change in sales, change in
number of employees and return on sales, show that the award recipients
outperformed the branch indices during the post implementation period (Eriksson,
2003, pp.36-51). Singhal and Hendricks (2001) quantified gains by stating,
“depending on the control group used, the mean out performance ranges from 38% to
46%”. Moreover, these organisations had a 48 percent higher growth rate in operating
income and 37 percent higher growth in sales. They also outperformed their control
counterparts in operating margins and growth in assets. The studies show that
effective implementation of TQM principles and philosophies lead to significant
wealth creation. This theory guides towards one of the objectives of this research (to
establish if there is any direct link between TQM and financial performance).

Page 87
5.6. Conclusion
Various authors indicate that the rewards of higher quality are positive, substantial,
and pervasive. Findings indicate that attaining quality superiority produces the
following organisational benefits:
• Stronger Customer Loyalty – quality creates true customers, customers who
will use the organisation again and praise it to others (Zeithaml, 1990, p. 9;
Berry et al, 1989, pp. 6 - 9).
• Market Share Improvements – key to an organisation’s growth and
profitability (Buzzell and Gale, 1987, p.103).
• Higher Stock Prices – Robinson (Iversen, 2002) developed the Q100 - an
index of organisations selected for their leading quality management methods.
Since the inception of the index in September 1998 through the end of 2001,
Q100 organisations returned 26.97%, compared to 17.59% for the Standard &
Poor's 500 stock index during the same period.
• Higher Prices – superior perceived quality implies an organisation can charge
a higher price for the superior quality and let the premium fall right to the
bottom line or better customer value can be offered by charging same price as
competitors but for superior product/service offering (Buzzell and Gale, 1987,
p.105).
• Increased Efficiencies and Greater Productivity – quality costs money to
implement (technology, training, research, systems) but with increased quality
comes increased revenues due to increased sales volume and higher premium
prices. Service errors are also decreased saving money. This creates a balance
that in the long term increases an organisation’s efficiency and productivity
(Zeithaml, 1990, p. 11, Ross, 1994, p.300, Buzzell and Gale, 1987, p.6).
• Lower Cost Quality – superior conformance quality means lower cost of
quality than that of competitors, and thereby a lower overall cost (Buzzell and
Gale, 1987, p.107).
The positive link between market share, profitability, productivity, stock price
performance and the implementation of TQM was discussed above. Quality is a
winning business strategy (Berry et al, 1989, p. 4; Porter and Tanner, 1996, p.268).

Page 88
Organisations that adopt sound TQM principles deliver better performance for their
stakeholders. Customers, employees, shareholders and society at large benefit.
Furthermore, these organisations may have a better understanding of the major factors
that impact on their performance.
The PIMS database reveals that high relative market share combined with high
relative quality exerts a strong positive influence on the profitability of a business,
affecting its financial performance. The PIMS database not only establishes the
association between market share and profitability, but market share and quality.
Views on the negative impact of implementing quality practices also exist. Some
reasons behind this can be found in Appendix O. In summary, negative publicity
about TQM has caused organisations to question the association between TQM and
financial performance. This is mainly due to unrealistic expectations, quick-fix
mentality, and competition from other tools. TQM is a long-term challenge that, if
implemented correctly, may improve financial performance as discussed in this
chapter.
Kathleen (1995, p.18) believes that TQM is a comprehensive and integrated way of
managing any organisation to meet the needs of the customer consistently. Customer
satisfaction and organisation profitability are linked together. If customers are not
satisfied, they are lost, this having an adverse effect on profit. Quality cannot be seen
as separate from overall performance or the bottom line. It should be woven
throughout an organisation's business practices.
This evidence indicates a positive association between TQM and financial
performance. Eriksson (2003), Singhal and Hendricks (1997, 1999, 2001), and Agus
(2000) managed to find a significant association between the implementation of TQM
and improved financial performance using similar financial indicators. This is the
association that is attempted to be established in this research.

Page 89
It was shown that TQM may be defined by the level of implementation in each of its
eight principles (Chapter Three). These are:
1. top management involvement;
2. information systems;
3. strategic quality planning;
4. human resource development;
5. management of quality;
6. customer focus and satisfaction;
7. management structure and teams; and
8. cost of quality.
It was further shown that the financial performance of organisations may be measured
by using six financial indicators (Chapter Four). These are:
1. percentage change in sales;
2. percentage change in return on sales;
3. total asset turnover;
4. return on assets (ROA);
5. return on equity (ROE); and
6. percentage change in share price.
It was also shown how quality may have an effect on financial performance of
organisations by affecting factors such as market share, productivity, customer
loyalty, and share price movement (Chapter Five). These are not attempted to be
measured directly (except for changes in share price) as these should follow quality
implementation and hence improve financial performance, which is measured using
the six financial indicators.
This research attempts to establish if there is any association between TQM and the
financial performance of organisations, as previous studies’ findings have shown.
Theses findings lead to the formation of the null hypothesis - there is no association
between the number of TQM principles implemented (level of implementation of
eight principles) and financial performance of organisations (measured by the six
financial indicators). This research focuses on selected listed organisations on the
Information Technology sector of the JSE.

Page 90
PART THREE: THE RESEARCH PROCESS Chapter Six: Research Methodology
6.1. Introduction
This chapter outlines the boundaries of the research as well as giving a comprehensive
account of the research methodology used. The chapter includes a description of the
statistical methods used at various stages in the study.
Chapters two and three provide a detailed description of TQM. The task is to use this
information to determine how much of it has been implemented in the selected
organisations.
This chapter concludes with methods used to calculate the TQM and financial
performance scores. Questionnaires and interviews have been used to collect data, the
analysis of which is described in chapters seven, eight, and nine.
6.2. Research Question
The overall objective of this research is to evaluate the association between TQM and
financial performance in selected IT sector businesses listed on the JSE.
This report provides results for the objectives and a hypothesis. The following
objectives are set out for the study:
1. to determine the extent of TQM principles application in the organisations;
2. to examine financial performance of the organisations;
3. to establish if there is any direct link between TQM and financial performance
in each organisation; and
4. to discuss evolution of TQM in the IT industry.
The first research objective about TQM application is answered by analysing the
TQM questionnaire results. Financial performance (the second study objective) is

Page 91
tested by calculating and assessing the six financial indicators. The third research
objective, an association between TQM and financial performance, is established by
comparing TQM scores against the financial performance scores using multiple linear
regression. Evidence for discussing the evolution of TQM (fourth objective) is
obtained from interviews with the organisations’ representatives and a literature
survey.
The null hypothesis from objective three is formed:
There is no association between the level of TQM implementation and financial
performance of organisations of the information technology sector listed on the JSE.
The reason for this inclusion is the different method of testing and handling of
objectives and the hypothesis. Objectives provide a qualitative description of the
results whereas a hypothesis is used where the data is tested by statistics.
6.3. Research Design
Malhotra (1999, p.83) defines a research design as a framework or blueprint for
conducting the research project. It details the procedures necessary for obtaining the
information needed to structure or solve the research problem. Research designs may
be broadly classified as exploratory, descriptive, or causal in nature (Malhotra, 1999,
p.83). Exploratory research is the initial step in the overall research design framework
that provides insights and understanding of TQM and its possibilities in terms of
affecting financial performance. This information is obtained from an in-depth
literature survey and leads to tentative findings. It is then followed by descriptive
research, which concerns this study. A clear statement of the problem, testing a
specific hypothesis and examining specific relationships marks conclusive descriptive
research (information is clearly defined and the research process is formal and
structured). It has its major objective as the description of something – usually market
characteristics or functions (Malhotra, 1993, p.95). Because the descriptive research is
also used to identify the factors that influence financial performance and put together
the indicators to use for each organisation, the association between the TQM results
and financial indicator results are analysed.

Page 92
Causal research is not used because it involves a relatively controlled environment
and uses experimentation as the main method of research with the objective of
obtaining evidence regarding cause-and-effect relationships (Malhotra, 1993, p.102).
To provide the most accurate results for objective four (contemporary view of TQM),
a case study approach is taken. A case study is an empirical inquiry that investigates a
contemporary phenomenon within its real-life context; when the boundaries between
phenomenon and context are not clearly evident; and in which multiple sources of
evidence are used (Yin, 1984, p.23). Yin states that the case study is able to add two
sources of evidence – direct observation and systematic interviewing, and allows an
investigation to retain the holistic and meaningful characteristics of real-life events
such as managerial processes like TQM (Yin, 1984, p.14). These facts are reflected in
this study where TQM is examined (a contemporary event), interviews held with the
IT organisations investigated and the relevant behaviours are not able to be
manipulated.
A multiple cross-sectional case design is implemented where multiple samples are
taken from a single organisation.
6.4. Sampling Design Process
It is not possible to investigate all organisations or every employee in the relevant
sector. A sample of the target population is taken. Leedy (1985, p.144) said “the
results of a survey are no trustworthier than the quality of the population or the
representatives of the sample”. He states that population parameter and sampling
procedures are of paramount importance and become critical factors in the success of
the study.
The major stages involved in a statistical sampling study can be seen in Figure 14.
The planning stage, data collection instruments, and procedures are discussed in this
chapter while chapters seven through to nine cover data analysis and conclusions.
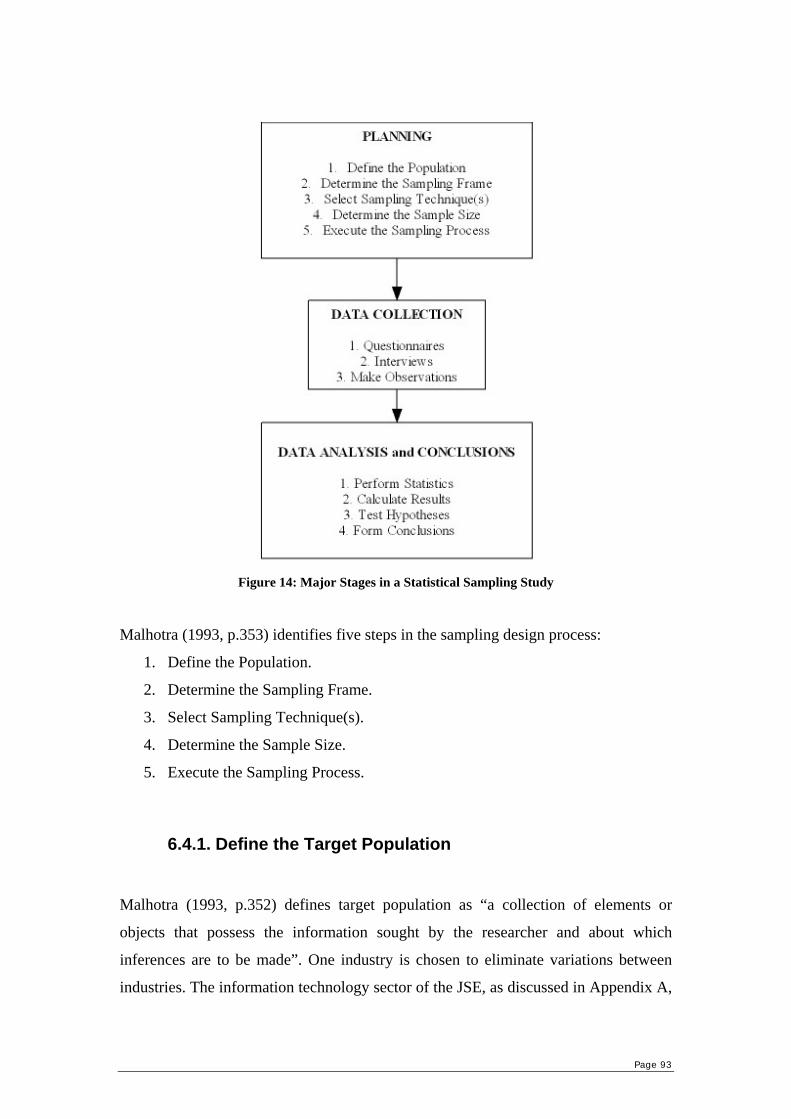
Page 93
Figure 14: Major Stages in a Statistical Sampling Study
Malhotra (1993, p.353) identifies five steps in the sampling design process:
1. Define the Population.
2. Determine the Sampling Frame.
3. Select Sampling Technique(s).
4. Determine the Sample Size.
5. Execute the Sampling Process.
6.4.1. Define the Target Population
Malhotra (1993, p.352) defines target population as “a collection of elements or
objects that possess the information sought by the researcher and about which
inferences are to be made”. One industry is chosen to eliminate variations between
industries. The information technology sector of the JSE, as discussed in Appendix A,

Page 94
is chosen for this study and judgements and results are limited to this sector. It may be
defined in terms of its:
• elements – representatives and respondents;
• sampling units – IT organisations taking part in the survey;
• extent – Gauteng Province (head office or branch); and
• time – August to November 2005.
A TQM culture that creates an organisational infrastructure consistent with
continuous quality improvement needs to be instilled into the personalities of all
employees. It is for this reason that the survey is not limited to management, but non-
managerial personnel are solicited for their involvement, too.
The research is, however, limited to the head office or branches in Gauteng. This is
due to time and cost constraints because the researcher only has access to locations
within the immediate area. The organisations were approached and data collected
within four months of the year 2005. Interviews were held and questionnaires handed
out in August and September. In October and November organisations were
repeatedly contacted by phone and e-mail until sufficient data from each organisation
was collected.
6.4.2. Determining the Sample Frame
Malhotra (1993, p.353) defines the sampling frame as a representation of the elements
of the target population that consist of a list or set of directions for identifying the
target population. The frame is important in statistical studies because it helps to
define the population (Lapin, 1982, p.9). There are six main reasons and
considerations why a sample must be taken (Lapin, 1982, pp.72-74): economy,
timeliness, the large size of the population, inaccessibility of some of the population,
destructiveness of the observation, and accuracy.
There were 24 listed organisations in the IT sector at the time during the research
process. Certain criteria were set to allow their inclusion in the study. These criteria
were that they are:

Page 95
1. listed on the JSE in the Information technology sector;
2. listed for a minimum of six years i.e. the audited financial records to be
available since the year 2000;
3. located in Gauteng to allows access for interviews and site visits;
4. having a number of employees exceeding 50 in the Gauteng branch so that
there would be more of an incentive to implement TQM initiatives; and
5. allowing permission for site visits and an interview to study the
management philosophy first hand and examine exactly methods of quality
principles application.
Out of 17 possible organisations in the IT sector, within the boundaries (points 1-4
above), 10 respondents met all the criteria set (including point 5 above) and were
investigated. This response rate indicates that approximately 60% of all the possible
approachable organisations and 40% of all organisations in the IT sector turned out to
be subjects of the study.
Due to the highly heterogeneous set of companies investigated (differing in IT
services and employee numbers), a frame size cannot be adequately established,
therefore, a sample frame is difficult to determine. The maximum number of IT
organisations that fit the boundaries (points 1-4 above) stated were attempted to be
contacted. The combination of sampling methods (convenience method for
organisations and probability method for individual respondents) provides the sample
for this research.
6.4.3. Select a Sampling Technique
A sampling technique involves decisions of a broader nature (Malhotra, 1999, p.331).
Sampling used is traditional sampling without replacement. This implies that an
organisation or any employee approached cannot be included in the sample more than
once.
With regards to the sampling technique, probability or nonprobability sampling has to
be decided upon next. Malhotra (1993, p.368) states that the choice between

Page 96
nonprobability and probability samples should be based on considerations such as the
nature of the research, degree of error tolerance, relative magnitude of non-sampling
versus sampling errors, variability in the population, as well as statistical and
operational considerations. Nonprobability sampling relies on the personal judgement
of the researcher rather than chance to select sample elements. In probability
sampling, sampling units are selected by chance i.e. chosen through some random
process. This is also the most accurate form of sampling and this permits the
researcher to make inferences or projections about the target population from which
the sample was drawn (Malhotra, 1993, pp.357-358).
The potential organisations had certain criteria attached (10 organisations remained)
and one representative was interviewed from each organisation. This is an example of
convenience sampling, which is a type of nonprobability sampling technique.
Malhotra (1993, p.358) defines convenience sampling as a technique that attempts to
obtain a sample of convenient elements. The selection of sampling units is left
primarily to the interviewer. Convenience sampling is the least expensive and least
time consuming of all sampling techniques. The sampling units are accessible, easy to
measure, and cooperative.
Malhotra (1993, p.358) goes on to describe the limitations of convenience sampling.
The main one being that there are many potential sources of selection bias. To
eliminate the problem in this research, the researcher did not choose any random
representative, but rather opted for the best-qualified representative from each
organisation. With regard to the respondents, the representative was asked to
distribute the questionnaires randomly between four divisions to eleven respondents.
In this way the researcher played no part in their selection. This implies probability
sampling. Due to these steps it is felt that the study’s validity is not compromised by
the researcher, however, the representatives may have compromised the validity.
6.4.4. Determine the Sample Size
Malhotra (1993, p.354) defines sample size as the number of elements or units to be
included in the study. It is important to choose the survey sample that best reflects the

Page 97
overall population of the organisation. In general, for more important decisions, more
information is necessary and the information should be obtained more precisely. This
requires larger samples, but as the sample size increases, each unit of information is
obtained at a greater cost (Malhotra, 1993, p. 354). Working within these constraints,
a considerable fraction of the population is obtained - 40 percent of the organisations
listed in the IT sector on the JSE. This exceeded sample sizes used in the past studies
on TQM researched – 24% for Agus (2000) and 20% for Singhal and Hendricks
(2001).
To initiate contact, an interview was held with an organisation representative. The
researcher attempted to interview the highest-ranking manager dealing with quality
aspects or, if there were no relevant managerial structures in place, a manager who
had the greatest knowledge of quality practices within the organisation. Discussion
included the management philosophy of the organisation as well as general South
African trends in the field, with special attention made to the organisations’ quality
principles either already in place or outlined for the future. No attempt was made to
interview or discuss any quality principles with any personnel other than the
representative. Reasons included better management accessibility to the researcher,
and the possibility to positively influence others to take part in the survey. Time and
financial constraints also limited interviews to only one representative per
organisation.
Sets of questionnaires were left with the representative to be handed out to other
employees. The representatives were asked to distribute a minimum of 12
questionnaires (including one for the representative) throughout the organisation
between a minimum of four divisions, e.g. marketing, human resources, quality,
finance, IT, etc. The representatives were asked to exclude certain divisions of an
auxiliary character such as cleaning services, reception, etc. Then completed
questionnaires were collected internally and given back to the researcher. The
representatives were told that a minimum of 10 questionnaires were required. The
number of questionnaires collected can be seen in Table 3. Out of a required 100, 96
questionnaires were completed indicating an 80% response rate and a 96% return on
the required amount. Being short of a 100% was mainly due to the lack of
participation of Company J as only the representative completed a questionnaire. The

Page 98
high response rate may have been attributed to the favourable ratio between the real (a
large number of employees) and potential respondents (twelve) and a favourable
attitude of the organisations towards the research (one of the stated boundaries of the
study).
There is space on the questionnaire where the respondent was asked to complete their
position and department in the organisation. This is only used to check if different
employees in different departments were being asked to participate. No conclusions
are drawn from this.
Table 3: Breakdown of Completed Questionnaires by Company
Company Questionnaires A 6 B 12 C 12 D 12 E 12 F 9 G 10 H 11 I 11 J 1
Total: 96
6.4.5. Execute the Sampling Process
Once it is made clear the exact specification of the sampling process with respect to
the population, sampling frame, sampling unit, sampling technique, and sample size,
the sampling process can be executed. Procedures that needed to be in place for
unexpected results included:
• organisation inaccessible – approach next organisation in list until maximum
number of organisations out of a possible 24 participate;
• representative inaccessible – investigate next possible representative until a
suitable replacement is found;
• sample of organisations from IT organisations not forming a sufficient sample
-approach other sectors closest to IT sector, e.g. engineering (but with some

Page 99
consequences in results and validity). This did not have to be reverted to in
this study; and
• not enough questionnaires were returned from the organisation – organisations
were given 12 questionnaires when only 10 were required. If five or less were
not returned the organisation could make no significant impact on the findings.
The results would be documented, but no conclusion could be drawn from that
particular data.
Non-response errors arise when some of the potential respondents included in the
study do not respond (Malhotra, 1993, p.369). Methods to attempt reducing the
number of non-respondents included:
• prior notification given in the form of arranging a meeting time after
discussing the study upfront on the phone;
• respondents motivated and given incentives in the form of obtaining the
results to the study. This could aid the organisation in determining what
principles were implemented and which were lacking, how the organisation’s
practices compared to other IT organisations as well as learning future trends
in quality management philosophies. Further motivation to respond was
enhanced by the promise of confidentiality;
• clear, precise questionnaire design and administration; and
• follow-ups after the initial contact either via e-mail or phone.
6.4.6. Conclusion
The sampling design process places the research in context imposing boundaries for
the study, these are summarised as:
• The Industry - the information technology sector of the JSE.
• The Organisations – ten organisations meet the requirements set. To meet the
anonymity nature of this research, they are labelled organisations A to J.
• The Respondents – survey is not limited to management as questionnaires
were left with representatives to be handed out to other employees and

Page 100
completed at their own time. Contact was attempted with the highest-ranking
manager dealing with quality issues of the organisation.
6.5. Data Collection
Once the type of research design has been determined, initiated, and the information
to be obtained specified, measurement and scaling techniques need to be decided on.
This critical part of any research process must be as precise as possible to increase the
accuracy and validity of the results (Malhotra, 1994, pp.275-277). The purpose of this
section describes how the data required is collected i.e. takes the defined TQM
information, formulates questions and obtains answers to be analysed.
Structured data collection is performed in this survey. Formal questionnaires are
prepared and the questions are asked in a pre-arranged order. An attached formal
letter given to the respondents outlines the purpose of the questionnaire. All
paperwork used in the approaching of the organisations can be seen in Appendix P.
Interviews were also held before the questionnaires were handed out, but questions
were not strictly pre-structured that is, information about organisations’ TQM was
gathered from different angles in an open dialogue to adjust to the various styles of
the organisations’ representatives. The information obtained from this is qualitative in
nature. The overall aim was to:
• obtain a background of the organisation and any past and future developments
with regards to management style;
• obtain a background of the way quality is understood within the organisation;
• obtain an understanding of developments in SA and any past and future trends
the organisation feels worth mentioning with regards to different quality
management philosophies;
• obtain information on any type of quality management system the organisation
is looking into or has in place; and
• experience any quality principles in place.

Page 101
6.5.1. Survey Instrument – Questionnaire
The questionnaire is based on the guidelines used to evaluate applicants for the
Malcolm Baldrige National Quality Award (MBNQA) in the year 1996. Each
principle is then examined using an in-depth literature review to provide further
understanding resulting in some exclusion (business performance) and inclusions
(cost of quality, management structure and teams). In addition to this, much attention
is given to the type and structure of questions used previously in the case studies of
Ross (1994) to evaluate organisations. The format and content of the questionnaire is
therefore developed from the MBNQA principles, each principle’s understanding
(through a literature review), and certain case study questions used in Ross (1994).
The questionnaire can be found in Appendix Q.
The six factors (principles) of the MBNQA discussed in chapter three are used as the
different sections in the questionnaire. The weightings of each section are largely
obtained from analysing the weightings of the MBNQA between the years 1989 and
2006. The reason for analysing so many years is due to yearly weightings’ changing.
More weighting is being put onto business and operational results as the award
progresses each year. This covers areas not investigated in this research such as
product and service outcomes, financial and market results, and social responsibility
results i.e. more external influences of the organisation (e.g. in 1994, 18% of the total
mark reflected operational results whereas in 2005, it was 45%). This trend follows
the evolution of management theory due to the result of changes in the environment
(Smit, p. 57, 1999). This includes social development, sustainability, corporate
governance, and environmental concern issues in South Africa. These are not
measured or focused on with regards to TQM, as it is in the MBNQA; hence the final
weightings are based on appropriate measures of TQM. For an example of MBNQA
weightings, refer to Appendix E.
The final weightings used are in Table 4. The cumulative mark from each section
forms a total of 100 for each organisation. Obtaining top weightings of 20%
highlights the importance of top management and customer focus and satisfaction.

Page 102
This is followed by the need for human resource development and management of
process quality.
Table 4: Section Weightings
Section Description Weighting A Top Management Involvement 20 B Information Systems 10 C Strategic Quality Planning 10 D Human Resource Development 15 E Management of Process Quality 15 F Customer Focus and Satisfaction 20 G Management Structure and Teams 7.5 H Cost of Quality 2.5
Total: 100
Sections G and H are not covered as separate entities in the Malcolm Baldrige criteria,
but are included as separate sections, in this research, after analysing the evaluation
techniques used by Ross (1994). The TQM process needs an appropriate
organisational infrastructure, therefore it is analysed for each organisation. The cost of
quality is an indication of how much is spent on non-conformance. It can be used as a
benchmark for progress. It provides basic understanding of why implementing TQM
may prove profitable. Since sections G and H are not included in the Malcolm
Baldrige award, they constitute only 10% together from the overall TQM score.
Questions under each section link to a single principle of TQM. All the sections can
then be analysed in turn to provide an overall score for TQM at different
organisations.
The questionnaires were given to a representative of the organisation and then
distributed by them to other managerial and non-managerial personnel as discussed in
section 6.4.4.

Page 103
6.5.1.1. Measurement Techniques
Malhotra (1993, p.277) and Leedy (1985, p.173) define measurement as a means of
assigning numbers or other symbols to characteristics of objects according to certain
pre-specified rules. Measurement of data is expressed by means of various scales. The
questionnaires measure employees’ perceptions, attitudes, or preferences about the
principles of TQM. The principles then describe TQM as a whole for each
organisation. Each principle and its associative questions are assigned weightings and
values. These values then indicate the level of TQM implementation at each
organisation.
The two different types of measuring techniques utilised in this research are:
1. dichotomous questions – requiring a simple “Yes”, “No”, or “Don’t Know”
response (Malhotra, 1993, p.328); and
2. five-point Likert-type itemised scales – requiring the respondents to indicate
their opinions on a rating scale.
There are four primary scales of measurement - nominal, ordinal, interval, and ratio
(Malhotra, 1993, p.277; Leedy, 1985, p.173). The type of scaling technique employed
in the study is a Likert itemised rating non-comparative interval scale. This uses a
method whereby numbers are used to rank objects such that numerically equal
distances on the scale represent equal distances in the characteristics being measured
(Malhotra, 1993, p. 280).
6.5.1.2. Dichotomous Questions
A dichotomous question has only two response alternatives supplemented by a neutral
alternative. The neutral option is given because different knowledge about quality
practices, or no involvement in any quality practices leading to uncertainty about what
the questions might be referring to, was expected.

Page 104
6.5.1.3. Itemised Rating Scales
This is the type of non-comparative scaling technique used to construct various rating
scales. The respondents are provided with a scale that has a number or brief
description associated with each category (Malhotra, 1999, p.270). This includes an
agreement scale, percentages, and timing in the questionnaire. The most widely used
type of scale is Likert. Respondents indicate their degree of agreement or
disagreement with each of a series of statements about the stimulus object. A five-
point scale is used; strongly disagree to strongly agree. To conduct the analysis on all
multi-item scales, each statement is assigned a numerical score, ranging from -2
(strongly disagree) to +2 (strongly agree). The six major concepts involved when
constructing itemised rating scales and their decisions are:
1. the number of scale categories to use – five;
2. balanced versus unbalanced scale – balanced (objective data);
3. odd or even number of categories – odd;
4. forced versus unforced choice – unforced;
5. the nature and degree of the verbal description – Verbal and numerical scales
used (numerical include percentages and time horizons); and
6. the physical form of the scale – horizontal boxes.
Respondents readily understand how to use the scale, making it suitable to be
completed independently (Malhotra, 1999, p.272).
6.5.2. Pilot Study
A pilot study was performed to refine the techniques used to approach the selected
organisations and test the questionnaire. The pilot study participants were from
NetStar, which is part of the umbrella group, Altech, listed in the Electronic and
Electrical Equipment sub sector of the General Industrials sector on the JSE. They
deal with the research and development of vehicle tracking devices. NetStar was
chosen because, although not located in the Information technology sector, it is in a
similar field dealing with the development of new technology, marketing the
technology to the customer, and providing customer service.

Page 105
The preliminary questionnaires were handed out to the CEO, management, and sub-
management (15 in total). Once completed, they were discussed with the CEO of
NetStar who is knowledgeable in TQM. Attention was paid to determining its best
layout, question content, wording, sequence, appropriate length, and the importance
of certain TQM principles. Once questionnaires were corrected, the post-correction
questionnaire was dispensed again, this time only to the CEO, one manager, and one
non-managerial employee resulting in no further corrections. They also felt that the
final altered questionnaire was effective in procuring the required information.
The time it took various respondents to fill in the questionnaire was between 10 and
15 minutes and both management and normal employees understood all the questions.
This confirmed that it was not necessary to form two separate questionnaires, as was
designed in planning.
Respondents of the pilot questionnaire suggested that TQM should also include the
characteristics of potential employees. Character and personality tests should be done
at the interview to determine if the personality of the candidate fits the quality culture
in the organisation. No job seekers should be hired if strong quality values are not
evident. This aids the overall quality movement process as employees already have
the correct mindset or personality traits, and an understanding of some TQM
principles. This makes the continuous transformation towards quality easier. As a
result, a question was included in the questionnaire (human resource development and
management section in Appendix Q).
The general method of approaching organisations was also discussed - how to
establish point of entry and how to conduct the interview respecting their
confidentiality at the same time.

Page 106
6.6. Questionnaire Evaluation
The questionnaire implored the use of itemised scaling questions. A multi-item scale
should be evaluated for accuracy and applicability. This involves the assessment of
the reliability and validity of the scale (Malhotra, 1999, p.280).
6.6.1. Reliability
A multi-item scale such as the one used for certain questions in the questionnaire
needs to be evaluated for reliability. Reliability refers to the extent to which a scale
produces consistent results, if measurements are made repeatedly (Malhotra, 1999,
p.281). Determining the proportion of systematic variation in a scale assesses
reliability. This is done by determining the association between scores obtained from
different administrations of the scale. If the association is high, the scale yields
consistent results and is therefore reliable (Malhotra, 1999, p.282). Statistical
approach used for assessing reliability is the coefficient alpha, or Cronbach’s alpha. It
represents an estimate of internal consistency of items in a scale (StatsDirect, 2005).
Malhotra (1999, p.282) explains Cronbach’s alpha as the average of all possible split-
half coefficients resulting from different ways of splitting the scale items. This
coefficient varies from 0 to 1, and a value of 0.6 or less generically indicates
unsatisfactory internal consistency reliability (Malhotra, 1999, p.282).
6.6.2. Validity
The validity of a measuring instrument may be defined as (Malhotra, 1993, p.309):
“The extent to which differences in observed scores reflect true differences
among objects on the characteristics being measured, rather than systematic or
random errors.”

Page 107
Garson (2005) indicates that a study is valid if its measures actually measure what
they claim to, and if there are no logical errors in drawing conclusions from the data.
He states that there are a great many labels for different types of validity, but they
relate to threats and biases that would undermine the meaningfulness of research. To
increase the confidence of the questionnaire and hence provide stronger conclusions
from the study, the questionnaire is assessed as a measuring instrument by its content,
criterion, and construct validity.
In addition to these, the issues of internal and external validity warrant thought. When
conducting an experiment, the researcher must draw conclusions about the effects of
independent variables on the study group (internal validity) and make valid
generalisations to a larger population of interest (external validity).
6.6.2.1. Content Validity
This is a subjective evaluation of how well the content represents the measurement
task at hand i.e. how well it directly measures TQM. The questionnaire must stand by
itself as an adequate measure of TQM (Nunnally, 1978, p.91; Malhotra, 1993, p.309).
Content validity results from careful and systematic building of the questionnaire. To
ensure that, a few steps are undertaken:
• The sections, structure, and section weightings are derived directly from the
internationally used Malcolm Baldrige National Quality Award.
• Actual questions and question structure are derived from case studies used to
evaluate each principle of TQM from Ross (1994).
• Each section has a heading indicating to the respondents the topic of the
questions to follow.
• Questions are formed in sections; each question and section is formed through
an in-depth literature survey.
Content validity is improved on the above issues.

Page 108
6.6.2.2. Criterion Validity
Criterion validity reflects whether the measurement performs as expected to other
variables selected as meaningful criteria. Variables may include demographic and
psychographic characteristics, attitudinal and behavioural measures, or scores
obtained from other scales (Malhotra, 1993, p.309). Because of the exploratory nature
of this research (see section 6.3) and hence the lack of data available on quality
practices in the IT industry in South Africa, the criterion validity of the questionnaire
cannot be determined.
6.6.2.3. Construct Validity
Construct validity addresses the question of what construct or characteristic the scale
is, in fact, measuring. Construct validity is the most sophisticated and difficult type of
validity to establish (Malhotra, 1993, pp.309-310). It deals with how the scale
correlates positively or negatively with other external constructs. Due to budget and
time constraints and lack of external comparisons and tests, construct validity of the
questionnaire cannot be established.
6.6.2.4. Internal and External Validity
Garson (2005) explains that internal validity addresses the "true" causes of the
outcomes that are observed in the study. It has to do with defending against sources of
bias that would affect the resultant process being studied by introducing covert
variables i.e. whether the observed effects on the organisations’ financial performance
could have been caused by variables other than TQM.
Garson (2005) describes external validity as having to deal with possible bias in the
process of generalising conclusions from a sample to a population, to other subject
populations, and/or to other settings i.e. beyond the investigated organisations into the
entire IT sector and conclusion drawn about TQM. Threats to external validity arise

Page 109
when the conditions of the research do not realistically take into account the
interactions of other relevant variables in the real world (Malhotra, 1993, p.225).
Control of extraneous variables is a necessary condition for establishing internal and
external validity. Extraneous variables are discussed, and any steps to combat them
stated, in Appendix R. In summary, most extraneous variables become a problem
when the study is either longitudinal (testing affects, mortality, instrumentation), the
passage of time during the study provides external factors that may influence results
(maturation, history, instrumentation), or there exists any bias with the respondents
(maturation, selection bias). This research was cross-sectional in nature, research on
the organisations took four months to complete, organisations had to be willing to
take part, and management were asked to distribute the questionnaires internally
within the organisation as an apparent directive from higher authority. These factors
improve upon and/or eliminate these extraneous variables.
6.7. Statistical Analysis
Leedy (1985, p.147) maintains that unless the sampling is carefully planned and
statistically tested, distortion is likely to be present in the conclusions from the data.
Statistical analysis that follows the sampling technique and collection of data to
validate the information and make inferences about the IT industry are discussed in
this section. The survey by means of questionnaires is quantitative in nature.
Qualitative data can be obtained from the descriptive analysis of the results and from
interviews.
Lapin (1982, p.2) describes statistics as a body of methods and theory that are applied
to numerical evidence when making decisions in the face of uncertainty. Statistics are
used in two respects:
1. on the questionnaire data to determine the validity of each question with
respect to TQM i.e. the association between the questions and TQM; and
2. on the overall TQM and financial indicator results.

Page 110
6.7.1. Statistics Used
6.7.1.1. Association of Variables
The type of data involved yields the type of statistical tests to be used. For the
dichotomous questions, univariate statistical techniques are used. These are
appropriate when there is a single measurement of each element in the sample, or
when there are several measurements of each element, but each variable is analysed in
isolation (Malhotra, 1999, p.434). Nonmetric data are obtained from the
questionnaires in the form of “Yes”, “No”, or “Don’t Know” answers. There are also
two or more independent samples involved. All this information leads to the use of
chi-square testing.
The chi-square statistic is used to test the statistical significance of the observed
association in a cross-tabulation. It assists in determining whether a systematic
association exists between variables (Malhotra, 1999, p.465). Chi-square is used on
each section in the questionnaire. This involves only the dichotomous questions in
each section and not the itemised questions.
Malhotra (1999) states that whenever inferences are drawn about a population, there
is a risk that an incorrect conclusion may be reached. The probability of the sample
results leading to the rejection of the null hypothesis when it is in fact true is called
the level of significance (Malhotra, 1999, p.456). The level of significance is set at
0.05 (5%).
6.7.1.2. Multiple Linear Regression
The general purpose of multiple regression is to learn more about the relationship
between several independent or predictor variables and a dependent or criterion
variable (StatSoft, 2003). In this study, multiple regression is used to check the link
between any financial indicator and the level of TQM implemented. Even though the
sample size is adequate, the researcher is aware that a total of ten observations (ten
organisations) are not enough to find a potentially significant association between

Page 111
TQM and financial performance, but it is attempted nevertheless. Regression is
performed subject to assumptions (Nau, 2006):
1. linearity of the relationship between dependent and independent variables;
2. independence of the errors (no serial correlation);
3. homoscedasticity (constant variance) of the errors versus time and versus the
predictions (or versus any independent variable); and
4. normality of the error distribution.
Nau (2006) describes that if any of these assumptions are violated (i.e., if there is
nonlinearity, serial correlation, heteroscedasticity, and/or non-normality), then the
forecasts, confidence intervals, and economic insights yielded by a regression model
may be (at best) inefficient or (at worst) seriously biased or misleading.
6.7.2. Statistical Package
The statistical calculations used in the analysis of data are computed in StatsDirect
(StatsDirect, 2005), Microsoft Excel, and GraphPad InStat (GraphPad, 2005).
6.8. Method of Analysis – Total Quality Management
This section discusses the manner in which the final results are obtained for the TQM
scores. The questionnaire is designed in the way that would closely follow the eight
principles of TQM. Questions are formulated for each principle and placed under their
respective headings (see chapters three and six). The analyses of the two different
types of questions (dichotomous and multi-scale) are handled differently.
For the dichotomous questions, each question for each organisation is counted for
each individual section. These tables of answers can be seen in Appendix S. Once the
results are tabulated, chi-square statistical analysis is used to test results (see chapters
six and seven above). With the significant results, only the positives are counted i.e.
only the ‘Yes’ answers. This is because:
• only interested in definite answers;

Page 112
• only interested in positive answers; and
• there is no negative marking.
In this way, the TQM score reflects the answers that increase the score for the
organisation.
There are two exceptions to this:
1. Section A – Question 1 – question is asked to test awareness of quality. ‘No’
implies that the respondent is aware that they do not have ISO certification,
thus a ‘Yes’ or ‘No’ increases the TQM score.
2. Section F – Question 5.3 – question reveals if respondents know about internal
and external customers. The ‘No’ is the positive answer as it indicates they do
have customers.
For the itemised scale questions, each answer to each question is assigned a number
i.e. 2, 1, 0, -1, or –2, depending if there is a positive or negative answer towards TQM
in the organisation. Cronbach’s alpha is the statistical approach used to assess and
confirm reliability of the answers.
The final result for each organisation’s section is then obtained using the number of
questions in the section and the number of questionnaires for the organisation. This
result is then used with the sections’ weighting to obtain a final section score. The
different section scores are then added to obtain a total TQM score for each
organisation. How the section weightings are derived at is discussed in section 6.5.
6.9. Method of Analysis – Financial Performance
Financial performance is measured using six financial indicators – percentage change
in sales, percentage change in return on sales, return on assets, return on equity, total
asset turnover, and percentage change in share price. This section follows the way of
obtaining the results for these indicators.
The financial statements from each organisation for the period of six years (2000 to
2005, inclusive) are obtained and subjected to financial analysis. Different weighting

Page 113
is decided upon for each year as shown in Table 5. The latest year (year of study) is
given the highest weighting of 50%. There are a few reasons to opt for this weighting,
which include:
• the highest weighting is given to the year of study i.e. when the cross sectional
study was done to provide the most accurate results. There was no indication
given by organisations when any TQM principles started being implemented.
The further back in time the organisation is studied, the less certain it is that
the current management philosophies are in place; and
• the lowest weighting is given to the last two years (2001 and 2002). This is
because the IT industry suffered a big correction on the stock market after the
“dot-com bubble” burst in March 20, 2000 (Wikipedia:Dot-Com, 2006). The
years following the 2000 correction are given the lowest weighting. A good
organisation might have only had bad financial indicators because of the
overall sector’s performance. This implies that the financial results might have
not best depicted the situation of the organisation at that time.
Table 5: Year Weightings
Year Weighting
2005 50 2004 25 2003 12.5 2002 6.25 2001 6.25
Total: 100
Some figures need to be excluded from the calculations of the indicators. These, if
included, may skew results that are not indicative of the operations. These include:
• restructuring of organisations often involves restructuring its asset
composition, e.g. selling off subsidiary organisations. This would indicate a
drop in its total asset base. When the change in assets lowers by over R1bn in
the balance sheet, values in that year are excluded; and
• percentage change increase from a value close to zero produces large
percentage increases, e.g. from 0.02 to 0.2 indicates an increase of 900%. This
distorts results even though the change in value is less significant. These
values are excluded.

Page 114
6.9.1. Financial Ratios
Organisations use financial ratios to assess their overall performance. Some of these
financial ratios appear in the annual reports of the organisation. Because the
organisations determine these ratios, there may not be a set standard procedure to
calculate them i.e. different organisations may calculate ratios differently. Different
organisations also list different financial ratios because different methodologies and
figures may be used. Consequently, the ratios provided by the organisations are not
used in the study. Calculations are performed on the original financial statements
(income statement and balance sheet) so that the method may remain the same for
each organisation and there is less chance of manipulation of the data. The balance
sheets and income statements from each annual report for the organisations are not
included to keep the anonymity of these organisations. Certain calculated figures
obtained from the annual reports can be found in Appendix T.
6.9.2. Share Price
The share prices used to calculate the percentage change year on year are obtained
from a 30-day moving average (average value of a security's price over the last 30
days (Investopedia, 2006)) for the month of September in each year. This month
corresponds to the time when questionnaires were being completed in 2005.
When calculating the percentage change in share price, certain anomalies that may
skew results are eliminated. These are:
• percentage share price increases from around zero result in large percentage
gains even though minimal in monetary terms, e.g. 1c to 10c implies a 900%
gain. These increases are excluded; and
• data on share prices that prior to name changes of organisations were not
obtainable, therefore, only recent data is used.
Using the method of analysis for both TQM and financial performance, results may be
obtained. The data collection, questionnaire evaluation, statistical analysis, and
method of analysis results are discussed in the next chapter.
Page 115
PART FOUR: ANALYSIS OF RESEARCH FINDINGS Chapter Seven: Results
7.1. Introduction
The findings of the empirical survey undertaken are presented in this chapter. TQM
scores are discussed first, then the financial performance results, concluding with
results linking the two.
Statistical results are discussed in the relevant sections. These are presented to build a
case for testing objectives and the hypothesis.
7.2. Total Quality Management Scores
7.2.1. Cronbach’s Alpha
Cronbach’s alpha is used to ascertain the questionnaires’ internal reliability. It is
necessary to group questions to provide a sufficient sample size. Cronbach’s alpha is
used on each principle of TQM in the questionnaire when there are more than one
multi-item questions. Sections with less than five scale questions are grouped together
to form sections with at least five questions. Internal consistency reliability is then
computed for each grouping or section. This reveals reliable questions in all cases. As
an example, sections B, D, E, and G have two or less multi-item questions and need to
be combined together with a section that contains more than two multi-item questions
to minimise systematic variation in the scales. The result of section A (three
questions) with sections B, D, and G provide a reliability of 0.61, which is just above
the required 0.60. Section C contains seven multi-item questions with a reliability of
0.76 and doesn’t need to be grouped with any other section. Sections F and G are
combined to provide a scale reliability of 0.60.
The overall scale reliability of the entire questionnaire is 0.84. There is also no
significant indication for the need to eliminate any question from the questionnaire to
increase the reliability of the data. The results of all Cronbach’s alpha statistical tests

Page 116
can be seen in Appendix U. It is concluded that multi-item questions are reliable for
further use in calculating the overall TQM principles of each organisation.
7.2.2. Chi-Square Statistic
The chi-square statistic is used to test the statistical significance of the observed
association between questionnaire parts. The results for the chi-square test for
independence indicate that the null hypothesis of no association could be rejected
indicating that the association is statistically significant for each section except
section C (strategic quality planning) where there are only two dichotomous questions
and hence the sample size is too small to verify the association. The overall result for
all the questions and sections indicate a statistically significant association between
the variables i.e. the questions are dependent on each other and hence dependent on
TQM (Appendix V shows the chi-square results). This verifies that the questions
formulated are able to measure TQM in a correct way.
7.2.3. Treatment of Missing Responses
Missing responses represent values of a variable that are unknown due to the fact that
the respondent’s answers are not properly recorded. Treatment of missing responses
poses problems, particularly if the proportion of missing responses is more than ten
percent (Malhotra, 1999, p.428). The following options are used for the treatment of
missing responses:
• Removing the question – only two questions had to be removed. The first,
Question 1 in Section E, because it is unanswered by fifty percent of the
respondents. It is obvious that people do not know how often quality is
measured to gauge the overall direction of quality within the organisation. The
question made no space for “Don’t Know” possibility forcing a clear answer
on the respondent. The second, Question 4.2 in Section D, due to that fact that
over 50% of the respondents answered it even though the answer to Question
4 was ‘No’ therefore they were not supposed to continue to Question 4.2. The

Page 117
purpose of the question is to test training with regards to quality and not just
any training the respondent undertook.
• Substitute a neutral value when question is left unanswered – this would imply
putting in a “Don’t Know” or “Neither Agree or Disagree” (depending on the
type of question and answer required – dichotomous implies “Don’t Know”
and itemised scale implies “Neither Agree of Disagree”) when questions are
left blank. Of 96 questionnaires, 28 questions were left blank, excluding the
above point (removing the question). In each questionnaire, different questions
were left unanswered, if any, therefore one question never constituted ten
percent.
7.2.4. Total Quality Management Scores
The final TQM results can be seen in Table 6 and Table 7, the latter displaying the
TQM scores in descending order for ease of readability.
Table 6: Final TQM Scores Displayed By Section
Section Company A B C D E F G H Total Score
A 2.92 3.89 1.00 5.36 7.77 14.09 1.72 0.00 36.75 B 15.90 5.41 6.05 7.50 11.04 13.11 4.26 0.83 64.10 C 6.53 1.88 3.58 7.14 8.47 11.59 2.34 0.13 41.66 D 3.96 4.31 0.63 5.54 6.59 10.15 1.87 0.38 33.42 E 14.59 5.27 4.96 7.50 8.96 12.20 2.70 0.96 57.14 F 5.74 2.60 2.73 7.62 6.30 8.79 2.03 0.00 35.79 G 4.58 2.01 2.79 8.21 3.61 10.00 1.72 0.13 33.05 H 7.31 4.63 3.56 6.43 3.89 13.03 1.41 1.44 41.69 I 16.52 3.71 5.59 9.16 10.07 12.07 5.11 0.41 62.64 J 5.83 8.34 7.00 4.29 7.50 20.00 5.63 0.00 58.59
Table 7: Final TQM Scores Displayed In Descending Order
Score Company 64.10 B 62.64 I 58.59 J 57.14 E 41.69 H 41.66 C 36.75 A 35.79 F 33.42 D 33.05 G

Page 118
Organisations B and I are the only organisations achieving scores above 60 – 64.10
and 62.64 respectively – indicating that they have the highest number of TQM
practices in place. Organisations J and E are in the upper 50s, just coming short of the
60s level. On the other side of the scale, the remaining organisations A, D, F, and G
are in the 30s bracket faring relatively poorly in quality practices applied (Company J
only provides one questionnaire and hence may give a skewed result).
Each individual TQM principle is also examined, the analysis of which is in chapter
eight. The TQM principles, as defined in this study, are implemented when the score
for that section is more than half of the weighting (e.g. if the weighting of the
section/principle is 20, an organisation with a result of 10 or more is considered to
have that principle in place). Table 8 shows the results using this rule.
Table 8: Implementation of TQM Principles
Section/Principle Organisations
Top Management Involvement 3 Information Systems 3
Strategic Quality Planning 3 Human Resource Development 5
Management of Quality 6 Customer Focus and Satisfaction 9
Management Structure and Teams 3 Cost of Quality 1
7.3. Financial Performance Scores
This section displays the results obtained from the financial statement analysis. The
financial scores are described under the headings they pertain to – sales, ratios, and
share price.
The final financial performance results are displayed in Table 9. The data source for
the calculations can be seen in Appendix T. Negative values on a financial ratio, once
calculated, are zeroed e.g. Company G obtained negative values for ROA and ROE so
a zero is indicated on the table.

Page 119
Table 9: Financial Performance Indicators and Scores
Company
Percentage Change in
Sales
Percentage Change in Return on
Sales Return on
Assets Total Asset Turnover
Return on Equity
Percentage Change in
Share PriceA 40.18 27.81 0.18 0.93 0.24 99.86B 29.95 17.72 0.06 2.52 0.16 147.86C 27.29 16.09 0.09 1.33 0.14 18.16D 7.63 -3.22 0.15 0.92 0.18 50.85E 7.39 7.93 0.06 1.88 0.16 26.20F 16.20 -4.46 0.02 1.49 0.00 47.63G 16.56 21.90 0.00 1.91 0.00 44.94H -21.37 -10.04 0.00 1.05 0.00 0.00I -1.78 18.01 0.09 1.30 0.18 50.00J 11.81 0.00 0.00 1.79 0.00 4.36
7.3.1. Financial Ratios
7.3.1.1. Sales Ratios
A graphical representation of the two sales columns from Table 9 can be seen in
Figure 15. Examining the turnover that each organisation produces reveals
organisations A, B, C, and G with relatively good percentage increases, and
organisation H as the only organisation obtaining an overall negative increase in sales
and return on sales, year on year since 2000. With respect to return on sales alone,
organisations D, F, and H produce an overall negative result.

Page 120
Sales Results
-30.00
-20.00
-10.00
0.00
10.00
20.00
30.00
40.00
50.00
A B C D E F G H I J
Company
Perc
enta
ge C
hang
e
Sales Return on Sales
Figure 15: Percentage Change in Sales Results
7.3.1.2. Asset Management Ratios
Examination of the total asset turnover financial ratio column reveals positive values
throughout. Figure 16 shows this. Organisations B, E, and G produce the most amount
of income for every Rand of assets.

Page 121
Total Asset Turnover
0.00
0.50
1.00
1.50
2.00
2.50
3.00
A B C D E F G H I J
Company
Tota
l Ass
et T
urno
ver
Figure 16: Total Asset Turnover Results
7.3.1.3. Profitability Ratios
A graphical representation of the returns financial ratios indicators can be seen in
Figure 17. Return on assets (ROA) indicates that the overall management efficiency
of the organisation is best in A and D participants. These organisations generate the
most value from its total asset base.
Return on Equity (ROE) figures are generally better and have a tighter range (14% to
25%) than the ROA figures. The figures indicate that organisation A is managed most
effectively in the interest of shareholders. A value of 24% implies that it generates 24
cents in profit for every Rand in equity.
Organisations G, H, and J obtain negative values for ROE and ROA (refer to Figure
17).

Page 122
Returns Results
0.00
5.00
10.00
15.00
20.00
25.00
30.00
A B C D E F G H I J
Company
Ret
urn
(Per
cent
age)
ROA ROE
Figure 17: Return on Assets and Return on Equity Results
7.3.2. Share Price
Figure 18 shows the graphical representation of the share price percentage change.
Organisations A and B show the highest gains in share price.
Share Price Percentage Change
0.00
20.00
40.00
60.00
80.00
100.00
120.00
140.00
160.00
A B C D E F G H I J
Company
Shar
e Pr
ice
Incr
ease
(Per
cent
age)
Figure 18: Percentage Change in Share Price

Page 123
7.4. Multiple Linear Regression
Multiple regression is used to interpret the data from the TQM scores and find which,
if any, financial indicators are associated with TQM. Tests associated with multiple
regression are R-squared (R2), F significance, regression coefficients, and P values.
Significance of the Test – R-Squared and F Significance
Before analysing and interpreting the independent variables, the overall significance
of the test used must be examined to determine whether the model for obtaining those
results is significant. The R-square value is an indicator of how well the model fits the
data (e.g., an R-square close to 1.0 indicates that the test accounted for almost all of
the variability with the variables specified in the model; values of .60 or better are
considered acceptable) i.e. the R-squared of the regression is the fraction of the
variation in the dependent variable that is accounted for, or predicted by, the
independent variables (StatSoft, 2003; Malhotra, 1999, p.643; Princeton Services,
2005). The value of 0.73 obtained here (as seen in Table 10) implies that 73% of the
data are accounted for with the variables specified (financial indicators) explaining
thus the TQM results accurately.
The output of multiple regression also indicates if the model allows predicting TQM
implementation at a rate better than chance. This is denoted by the significance level
of the overall F of the model. If the significance is .05 (or less), then the model is
considered significant. In other words, there is only a 5 in a 100 chance (or less) that
there is no association between TQM and financial results (Abrams, 2005). The F
significance can be seen in Table 10 under analysis of variance (ANOVA). It shows a
value more than 0.05 implying no statistical significance.
Determining Significant Variables – P-Values
Standard multiple regression tests the significance of each independent variable on the
dependant variable. The significance levels given for each independent variable
indicate whether that particular independent variable is a significant predictor of the
dependent variable, over and above the other independent variables (Abrams, 2005).

Page 124
Table 10: Summary Output of Multiple Linear Regression (TQM and Financial Indicators)
Regression Statistics Multiple R 0.854661361 R Square 0.730446042 Adjusted R Square 0.191338125 Standard Error 11.36669914 Observations 10 ANOVA
df SS MS F Significance FRegression 6 1050.346062 175.0576769 1.354916185 0.43329179Residual 3 387.6055483 129.2018494 Total 9 1437.95161
Coefficients Standard Error t Stat P-value Intercept 44.58735073 40.68614172 1.09588545 0.353222355 Sales 0.080003241 0.57157472 0.139969873 0.897552764 Return on Sales (ROS) -0.257417957 0.517570036 -0.497358693 0.653103722 ROA -424.7962675 468.3289091 -0.907046862 0.431249996 Total Asset Turnover -0.470581656 26.97127541 -0.017447512 0.987175111 ROE 296.4786387 230.8619976 1.284224523 0.289254119 Share Price 0.001690674 0.150084111 0.011264845 0.991719387
The P value indicates the significance level of each independent variable. A P value
of 5% (.05) or less is the generally accepted point at which an independent variable is
significant and implies there is only a 5% chance that results obtained would come up
in a random distribution. Assuming the model is specified correctly and significant, it
can therefore be said with a 95% probability of being correct that the variable is
having some effect (Princeton Services, 2005; Abrams, 2005). Results from multiple
regression with P-values can be seen in Table 10. The overall equation is:
iceShareROETurnoverTotalAssetROAsturnOnSaleSalesTQM
Pr002.048.29647.080.424Re26.008.058.44
++−−−+=
The multiple regression highlights the most influenced financial indicator by TQM
using the t-Stat values. ROE has the highest t-Stat value so it is first tested against the
TQM scores (Table 11) and secondly against each principle of TQM (Appendix W) to
determine if any one TQM principle is significantly associated with ROE. The
equation for ROE and TQM principles, derived from Table 11 is:
ityCostofQualStructureManagementtisfactionCustomerSayocesQualitsourceHuman
nningQualityPlanSystemsInformatioentTopManagemROE
83.65946.7321.19Pr31.61Re82.226
32.676.511.11183.2014
−−−−−
−−+=

Page 125
Table 11: Summary Output of Multiple Linear Regression (ROE & TQM Principles)
Regression Statistics Multiple R 0.95667718 R Square 0.915231226 Adjusted R Square 0.237081037 Standard Error 132.644056 Observations 10 ANOVA
df SS MS F Significance FRegression 8 189963.6544 23745.4568 1.349599603 0.585594245Residual 1 17594.4456 17594.4456 Total 9 207558.1
Coefficients Standard Error t Stat P-value Intercept 2014.831809 6301.608743 0.319732927 0.802991225 Top Management 111.1039351 262.5636183 0.423150534 0.745159138 Information Systems -51.76237253 314.114328 -0.16478832 0.896026913 Quality Planning -6.321254396 63.07702323 -0.10021485 0.936413545 Human Resource -226.8169669 695.6006658 -0.326073533 0.799335814 Process Quality -61.30966137 248.7244712 -0.246496298 0.846142782 Customer Satisfaction -19.20917181 44.19626319 -0.434633393 0.738984722 Management Structure -73.45797136 106.6642382 -0.688684161 0.616060345 Cost of Quality -659.8246451 816.4626708 -0.808150414 0.56729528
The R-Square value of the multiple regression in each case indicates that most of the
data are accounted for with the variables specified in each case. However, neither the
multiple regression between TQM and financial indicators nor the regression between
ROE and TQM principles are significant. Considering this, there can be no statistical
significant variables. This may be attributed to the lack of observations.
7.5. Interview Results
Interview questions were not strictly pre-structured. Information was gathered from
different angles in an open dialogue from representatives about their views of quality
management in general and in their organisations. The information obtained from this
is qualitative in nature and is discussed. Considering this, the information is not
evaluated for reliability or validity. A summary of the data can be seen in Table 12.

Page 126
Company A
Company A has a quality assurance department which has been implemented for over
five years but it is not making an impact on the organisation because only one
individual is involved, with lack of communication to top management. Nevertheless,
they are trying to implement some of the principles of TQM, especially in the
development side of the business where quality is directed at the customer.
Company B
Quality is important at Company B. They have an organisation-wide quality assurance
department incorporating the different divisions with close ties to top management.
They are ISO9000:2000 certified and continually improving on that, currently seeking
new quality management entities to improve quality and increase their customer base.
They are implementing quality systems such as: control sheets and quality control at
every step of the products life cycle; feedback systems between employees, the
quality department, and top management; cross-functional training so every employee
is aware of their job description and the importance of quality; and high levels of top
management involvement.
Company B feels that cost of quality is hard to measure in the IT industry but that
percentage targets work better, e.g. reworks must be less that 5%.
Company C
Company C is customer oriented because it has continuous interaction between the
developer and the customer to provide for the unique needs of each customer. They
also have teams dedicated to clients meeting their needs. They have an organisation-
wide quality assurance department so that quality, as stated by the customer
requirements, is met at every stage of the product. Other client satisfaction initiatives
include user acceptance tests from a client’s point of view; and employee incentives
for meeting customer demands.
The development and manufacturing arena uses a global accredited best practice,
CMMI, to provide stringent quality practices to compete internationally. The other
departments are however not accredited.

Page 127
Company D
Company D have had a quality assurance department since 1985 aimed at customer
training. This department is however not organisation-wide and tends not to include
other departments or other employees in quality management initiatives. The
principles of TQM are not being applied to the organisation and human resource
development and management with quality, needs to be improved. There is no quality
training, quality circles, or employee incentives, rewards, or involvement.
Company E
Company E is ISO9000:2000 certified and follows its eight quality management
principles. It has effective departmental links and communication between all
divisions, suppliers, and customers. They regard their core competence as flexibility
and service towards the customer. They have five divisions dealing with different
groups of customers – education, corporate, export, retail, and dealer – to meet the
requirements of each. This allows the organisation to focus on separate markets to
provide the highest level of customer satisfaction at each level. Other positive quality
management issues are:
• on-site technician for clients/customers;
• service training, team building, and skills development;
• customer surveys;
• quality culture with top management involved;
• targets and goals based on customer requirements;
• continuous improvement on information systems; and
• international benchmarking.
Company E agrees with organisation B that a cost of quality is hard to measure in the
industry and uses target figures such as minimum percentage reworks. Another
problem with quality is that people with too much self-interest don’t fit in the quality
culture of the organisation and it takes time to find the type of people that do fit.
Company F
Company F has recently examined various quality management initiatives and is
currently forming a quality assurance department, its main aim being the
implementation of CMMI for their products. The need for a quality best practice is

Page 128
evident as reworks are as high as 40% and need to be brought down to improve
customer relationships and increase their customer base. They also feel quality brings
inherent and indirect benefits.
Company G Company G claimed that a quality best practice is important and they are looking to
implement an organisation-wide best practice but are facing organisation structure
problems, close to being fixed. There is currently a lack of communication between
the groups and levels in organisation G. It was also indicated that there are external
influences that need to be taken care of to remain competitive in the South African
industry such as BEE and corporate governance that detract attention away from
quality.
Company H
Company H has developed their own manuals and procedures dealing with quality
management. They have opted not to use an international best practice due to the
nature of their product. Because of this, there is a lack of a quality culture because the
quality is aimed at the product and not the organisation.
Company I
Company I has the highest number of quality management initiatives in place aimed
at providing a TQM culture throughout the organisation. They are implementing ITIL,
Six Sigma, South African Excellence Model (SAEM), Investors in People (IiP),
ISO9000:2000, and most recently looking into CMMI and COBIT. They have an
organisation-wide quality assurance department aimed at a quality culture throughout
all levels of the organisation, its customers, and its suppliers. The representative
indicated that potential customers are educated on these best practices to show how
stringent their practices are, the customer then understands them, and joins
organisation I increasing organisation I’s customer base. Company I indicates that
being able to manage projects unique to customer requirements is the next aim in the
IT industry. An overall quality management initiative needs to be imposed on each
project to provide the best quality for each customer’s requirements.

Page 129
Company J
Company J also implements quality management best practices such as ITIL to
provide an overall organisation-wide quality culture and deems COBIT as the most
important in the IT industry. They agree with organisation I that the IT industry is
becoming more project based with unique requirements for each client. Considering
this, COBIT can provide overall IT governance that takes into account different
projects.
Summary
The interview provided more insight into quality at each of the investigated
organisations. From the interviews, it became clear of underlying concepts facing the
IT industry and quality management in particular. The uses of more specialised
quality management entities were highlighted. The main reason given is the need to
manage unique projects for different clients and requiring a quality framework for
each project.
The idea of cost of quality is also found not to be practiced in the IT industry due to
the complexity of its calculation relating to IT issues but performance targets are
rather set.
Certain external factors that are affecting quality management, its implementation and
effectiveness are also discovered. Table 12 provides a summary of the information
gathered from the interviews.
Table 12: Information Gathered from Interviews
CHARACTERISTIC COMPANY A B C D E F G H I J Quality Department X X X X X X Organisation-Wide Quality Department X X X X ISO9000:2000 Certified X X X CMMI Accredited X X X Developed own Quality Management Procedures X Analyses ITIL, COBIT to Further Quality X X Need Quality Management for IT Projects X X X Cost of Quality vs. Performance Targets (PT) PT PT PT
Page 130
7.6. Extreme Company Analysis
To examine any link between TQM and financial performance, the comparisons
between two extremes – organisations with the minor and major TQM
implementation respectively - are discussed to check if there are any noticeable links.
Each organisation is not discussed in terms of its results, for a brief overview of the
organisations one after the other, see Appendix X.
7.6.1. Company B vs. Company G
Company B is the top performer in terms of its quality score. It obtained 64.10, 1.46
points above the second place competitor. Apart from CoQ, it excels in the
implementation of all TQM principles and, most importantly, it is one of only three
organisations implementing sound top management involvement. Company B also
excels in the financial performance indicators. It is in the top five for all the financial
elements coming first for percentage increase in share price and total asset turnover.
Company G is the lowest performing organisation obtaining a score of only 33.05 on
the quality scale. This is, apparently, because the organisation had to undergo
restructuring of the business due to the number of acquisitions. Because the
organisation grew too quickly, a quality management initiative was put on hold.
Company G did well in the sales indicators and total asset turnover financial ratio.
Negative results are obtained in ROE and ROA showing poor return for the various
investments made (assets and shareholder’s equity) and indicate some poor
management.
The fact that Company G attains the lowest TQM score is not wholly reflected in the
financial results. The percentage change in sales figures for Company G indicate an
increase of almost 22% year on year, the second highest result overall. Company B is
not too far behind at 18% (Figure 19). The reverse occurs for percentage change in
sales where organisation B outperforms organisation G. With respect to the total asset
turnover financial ratio, organisation B is marginally better than organisation G being

Page 131
the second highest overall (Figure 20). The largest variance is in the two return
financial ratios – ROA and ROE. Figure 21 shows this difference clearly. Regarding
percentage change in share price, organisation G obtains average results (45%)
whereas organisation B obtains the highest percentage increase at 148%. These results
show that a high involvement in TQM may result in improved financial performance.
Company B vs. Company G - Sales
0.00
5.00
10.00
15.00
20.00
25.00
30.00
35.00
B G
Company
Fina
ncia
l Ind
icat
or R
esul
t (Pe
rcen
tage
)
Sales
Return on Sales
Figure 19: Company B vs. Company G, With Respect To Sales Results
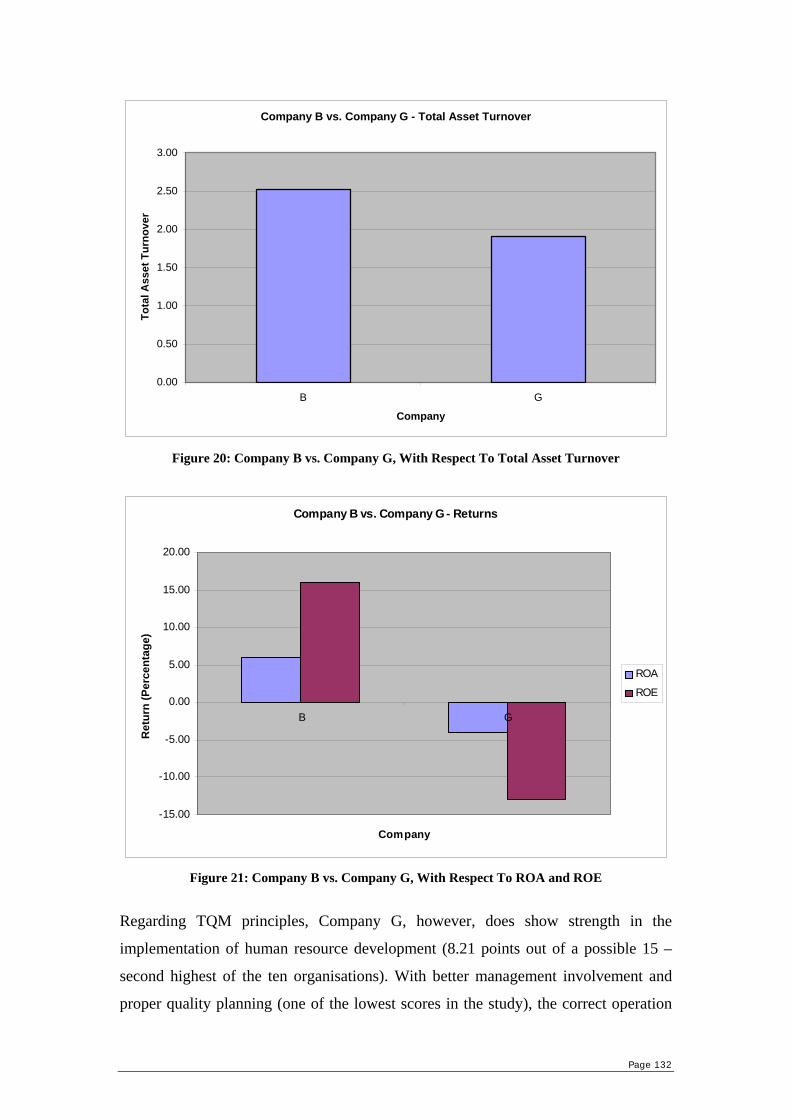
Page 132
Company B vs. Company G - Total Asset Turnover
0.00
0.50
1.00
1.50
2.00
2.50
3.00
B G
Company
Tota
l Ass
et T
urno
ver
Figure 20: Company B vs. Company G, With Respect To Total Asset Turnover
Company B vs. Company G - Returns
-15.00
-10.00
-5.00
0.00
5.00
10.00
15.00
20.00
B G
Company
Ret
urn
(Per
cent
age)
ROA
ROE
Figure 21: Company B vs. Company G, With Respect To ROA and ROE
Regarding TQM principles, Company G, however, does show strength in the
implementation of human resource development (8.21 points out of a possible 15 –
second highest of the ten organisations). With better management involvement and
proper quality planning (one of the lowest scores in the study), the correct operation
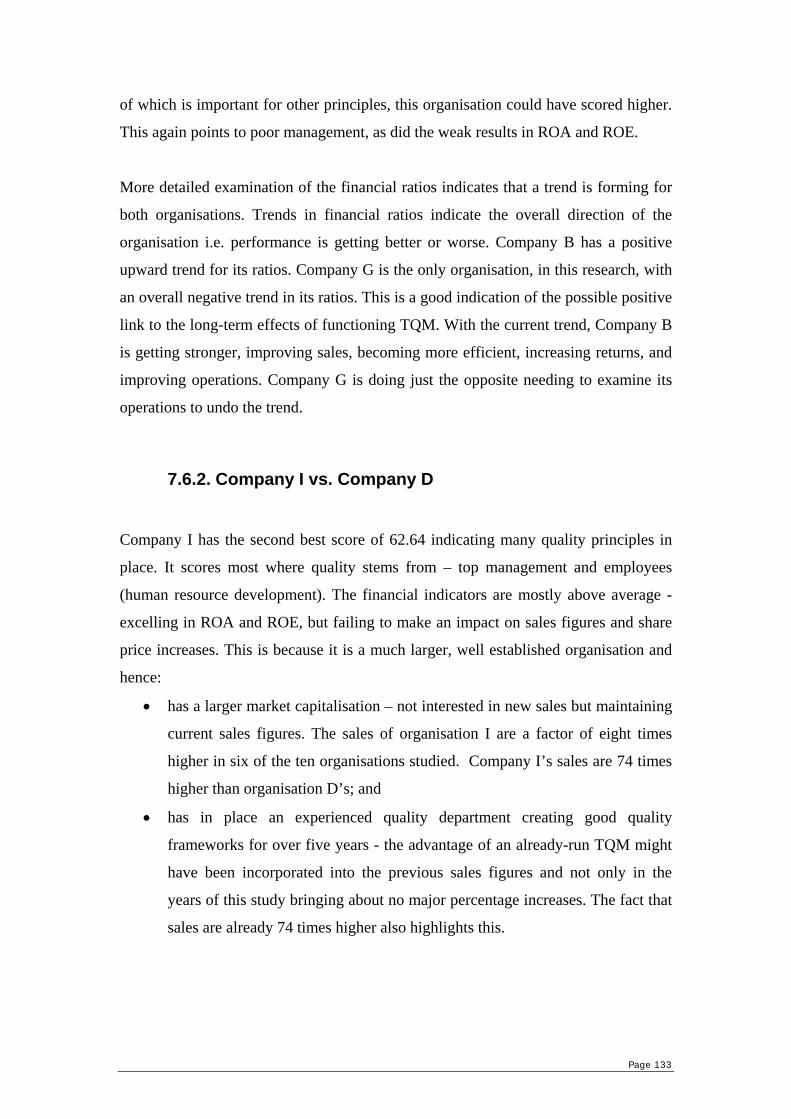
Page 133
of which is important for other principles, this organisation could have scored higher.
This again points to poor management, as did the weak results in ROA and ROE.
More detailed examination of the financial ratios indicates that a trend is forming for
both organisations. Trends in financial ratios indicate the overall direction of the
organisation i.e. performance is getting better or worse. Company B has a positive
upward trend for its ratios. Company G is the only organisation, in this research, with
an overall negative trend in its ratios. This is a good indication of the possible positive
link to the long-term effects of functioning TQM. With the current trend, Company B
is getting stronger, improving sales, becoming more efficient, increasing returns, and
improving operations. Company G is doing just the opposite needing to examine its
operations to undo the trend.
7.6.2. Company I vs. Company D
Company I has the second best score of 62.64 indicating many quality principles in
place. It scores most where quality stems from – top management and employees
(human resource development). The financial indicators are mostly above average -
excelling in ROA and ROE, but failing to make an impact on sales figures and share
price increases. This is because it is a much larger, well established organisation and
hence:
• has a larger market capitalisation – not interested in new sales but maintaining
current sales figures. The sales of organisation I are a factor of eight times
higher in six of the ten organisations studied. Company I’s sales are 74 times
higher than organisation D’s; and
• has in place an experienced quality department creating good quality
frameworks for over five years - the advantage of an already-run TQM might
have been incorporated into the previous sales figures and not only in the
years of this study bringing about no major percentage increases. The fact that
sales are already 74 times higher also highlights this.

Page 134
Company I vs. Company D - Returns
0.00
2.00
4.00
6.00
8.00
10.00
12.00
14.00
16.00
18.00
20.00
I D
Company
Ret
urn
(Per
cent
age)
ROA
ROE
Figure 22: Company I vs. Company D, With Respect To ROA and ROE
Company I vs. Company D - Sales
-6.00
-4.00
-2.00
0.00
2.00
4.00
6.00
8.00
10.00
12.00
14.00
16.00
I D
Company
Fina
ncia
l Ind
icat
or R
esul
t (Pe
rcen
tage
)
Sales
Return on Sales
Figure 23: Company I vs. Company D, With Respect To Sales Results
Company D scores the second lowest score of 33.42. It is the lowest performer in
quality planning and the second lowest in human resource development and
involvement of top management. These facts may point towards a non-healthy work

Page 135
environment with no consideration to quality, as there is neither drive from
management nor a drive for quality planning. Nevertheless, Company D performs
well for percentage increase in sales but obtains a negative return on sales figure. It
further performs well with regards to both the return financial indicators - ROA and
ROE.
Overall, results are better for Company I indicating stability and an improving trend in
its financial ratios. Company I’s return financial ratios are slightly below those of
Company D (Figure 22). The sales indicators are mixed as Company D excels in
percentage change in sales, but obtains negative percentage gains with respect to
percentage change in return on sales (Figure 23). Percentage change in share price
results are similar even though share price of Company I is already twice as high as
Company D’s and hence a greater percentage movement up is harder to obtain.
Considering this and the fact that Company I is much bigger with a 74 times greater
turnover, Company I outclasses Company D. This case, as the previous ones, points
out that a higher involvement in TQM and other quality management entities may
result in improved financial performance.

Page 136
Chapter Eight: Discussion
8.1. Summary of the Research
This research uses questionnaires and interviews to analyse TQM at selected
organisations and determine any current trends with regards to quality management in
the IT sector. TQM is defined by an in-depth literature survey that focuses on original
theorists’ works, modern TQM literature, past and current quality entities, and past
research. Eight core principles are identified and used to depict TQM. Questions are
formulated on each principle in the questionnaires, which are then used to determine
the level of implementation of TQM at the various IT organisations. The anonymity
of responders and their results are guaranteed.
The questionnaire structure, principles, and their weightings are based on the criteria
set by the Malcolm Baldrige Award. The questions are formulated on the strength of
the literature survey along with the case studies used by Ross (1994) to evaluate TQM
at organisations. Cronbach’s alpha and chi-square statistical tests are used to validate
the questionnaire.
Out of 17 possible organisations in the IT sector that could have been approached
(within the boundaries as described in chapter six), 10 positive respondents are
investigated indicating a response rate of 59%. That amounts to 42% of all 24
organisations in the IT sector. A better response would have provided more
observations influencing the final results by maybe providing a more significant
conclusion.
8.2. Total Quality Management
TQM has revolutionised the way many organisations are operating as it has become
integrated into mainstream management practices (Flynn, 2005, p.4). Its hallmark is a
commitment to exceed customer expectations on an ongoing basis by continuously
improving the organisation’s products and services and the processes that make and
support them. A core concept of TQM is viewing the organisation as a system tied

Page 137
together by processes that cross conventional functional boundaries. Every traditional
department should be involved in the organisation’s TQM efforts to obtain the full
benefits of this powerful management technology (Stoner, 1994, p.1).
TQM should not be appreciated only as a set of tools, methods, and practices but
rather, more importantly, containing a set of generic "profound and valuable
knowledge" (borrowing Deming's term) which can be tailored in a flexible manner to
suit organisational specific needs, including quality and innovation. Parajogo and
Sohal (2004) found that the success derived from TQM essentially came from the
strategic adaptation of the use of its principles rather than by simply adopting its tools
and techniques.
8.3. Objective One
The first objective of the study is to determine the extent of application of TQM
principles in the organisations approached. The principles of TQM incorporate certain
necessary elements that may form part of other managerial techniques. Considering
this, even if TQM for itself is not being implemented at a given organisation, a result
above zero is easily obtainable. With this in mind, only an organisation with a score
above 50 in this study could be said to be implementing TQM. The results obtained
from the TQM scores reveal varying levels of TQM implementation, ranging from a
top score of 64.10 down to 33.05 out of a maximum of 100 and a minimum of 0. The
differences in scores were expected because no two organisations could be
implementing the same number of principles at the same level per se. The
management philosophy in place is unique for each organisation. This is due to
different top management, the managers they employ, the practices they set up, the
organisation’s philosophy they build - all leading to different quality cultures.
Considering the cut-off point of 50 in calculated scores, only four organisations (B, I,
J, E) can be believed to understand the importance of TQM by incorporating it in their
management style (Table 7). Company B has a full organisation-wide quality
management framework incorporating quality control with feedback systems for
employees in place, quality circles, cross-functional training, quality control sheets at

Page 138
every step of the products development, and top management involvement with
quality strategic planning and quality issues, meeting once a month. Company I
implements many various quality management systems such as ISO, ITIL, CMMI,
and a variation of TQM not surprisingly placing it among the top organisations.
Company J also implements numerous quality management entities mainly focused
on the theory of ITIL and COBIT. Company E initiated their quality initiative with
ISO9001, obtained the certification, and has built onto that. They now perform
international benchmarking; continuous improvement on their information systems;
setting targets and goals based on customers’ needs and expectations (including
customer surveys); training/ team building/ skills development; and are managing to
develop a quality culture that is consistently pursued by top management.
Four of the ten organisations (A, D, F, G) obtain results in the 30s, which shows less
of an interest in TQM and any other quality management initiatives. Company A has
had a quality department for the last five years, but it only consists of one individual
who does not interact regularly with top management. Company F is the most
promising of the four indicating their new involvement in a quality management
entity to obtain international recognition – CMMI, and being in the process of
forming a quality department. Company D does have a quality assurance department,
but serving purely the customer without getting involved with top management or
other employees of the organisation – a classic example of misunderstanding TQM.
Company G omits TQM blaming the lack of sufficient resources that had to be
concentrated on the organisation’s rapid expansion involving formation of multiple
separate business divisions. They do, however, consider quality initiatives important
in the local and global market.
The remaining two organisations (H and C) attain nearly identical TQM scores –
41.69 and 41.66 respectively. Where Company C falls short is the lack of an
organisation-wide quality entity. Company C focuses on implementing quality
management only in certain departments, e.g. the software factory (this division needs
execution of the global best practices because the organisation retails internationally
and needs global accreditation). The organisation does have a quality assurance
department dealing in issues across all divisions, but does not apply any specific
quality management entities. Company H on the other hand has developed its own in-

Page 139
house quality management standards that are not internationally recognised and shows
no interest in obtaining any. A wiser approach might be to incorporate internationally
known standards to improve turnover by securing deals (H is obtaining negative
results in the two sales indicators).
From the results it is clear that organisations are aware of quality as an issue in the
South African and global markets. Awareness alone, though, is not sufficient. To the
organisations’ credit, they have moved towards quality management finding
themselves at various stages of its implementation. Organisations ought to understand
that quality is a continuous process and just because an organisation is, e.g. ISO9000,
certified, it can still improve operations by adapting other quality management entities
such as TQM. ISO is the most common underlying quality entity. This acknowledges
Porter and Tanner’s (1996, p.6) statement that ISO is one of the most widely used
quality frameworks and a useful first step. He also goes on to state that it is not a fully
comprehensive business excellence framework (as TQM) and further progress should
be planned.
It would be worthwhile to put the study’s findings side by side with others regarding
the IT industry not only in South Africa but internationally as well. Comparisons
could not be made, however, considering that other research regarding TQM and the
IT sector could not be found.
Each principle is now discussed one at a time. The descriptive analysis of the data
looks at the reasons why so many/few organisations managed to implement a
particular principle of TQM. Table 8 shows the results of how many principles are
being applied by the investigated organisations.
8.3.1. Attitude and Involvement of Top Management
Leadership and support from top management are found to be the most critical
factors. It comes as no surprise for it is known that top management chooses sub-
managers and both need to lead by example, create a quality culture, and prepare
strategic plans (Yusof, 2000; Powell, 1995; Ahire, 1996). In the light of the findings,
Page 140
the lack of management commitment is the main weakness found in the investigation.
Only three organisations – B, E, and I – are driven by top management with respect to
quality. It is certainly no accident that their overall TQM scores correspond with this
approach.
Some of the problems identified when visiting the sites and holding interviews may
include:
• lack of total commitment to quality by management;
• insufficient time, money, and trained personnel devoted to TQM;
• not enough belief in TQM as an overall management philosophy –
organisations feel that they must do it just because others do;
• lack of a clear understanding of TQM by top management;
• lack of belief in employees – changing the way processes are done may be a
big change for some employees and management is not patient enough in
trying to modify their habits; and
• lack of regular supervision by top management of already set up quality
divisions or quality task forces.
8.3.2. Information Systems and Information Technology
Information is the critical enabler of TQM (Ross, 1994, p.61). Information systems
can track and improve the quality processes, e.g. by making information available
real-time to employees and aiding the transformation of an organisation.
Organisations in the IT sector should excel in this division because of the availability
of the infrastructure, access to reduced prices, and engaging employees knowledge in
information systems design and implementation. The businesses approached,
however, generally fail to improve this opportunity considering that only three
organisations were found implementing sound information systems.
The interviews’ findings point at the main problem - the lack of a complete
understanding of benchmarking. The problem lies with two reasons:
1. Once an organisation achieves a relatively high stature in terms of their field,
they fail to benchmark internationally because they feel they are one of the

Page 141
benchmarks in South Africa (SA). Several problems rest with this. Firstly,
there are not many South African listed IT organisations competing in exactly
the same field. Because of this, listed organisations tend to be the benchmark
in SA and the drive to become better, fades. Secondly, without looking
internationally, no new ideas can be brought into South African organisations
to aid any particular process.
2. Organisations fail to look in other sectors to benchmark a single activity or
process, e.g. distribution. From the interviews, it seems that organisations in
South Africa do not realise that they can improve certain processes or
activities by examining other sectors that specialise in those processes, e.g.
marketing division of IT organisation can examine sectors where marketing is
constantly used.
8.3.3. Strategic Quality Planning
Strategic planning is needed to plan the long-term implementation of TQM. Quality
needs to be integrated into the organisations’ visions, goals, policies, and all
processes. Only in this way, employees can see the change and take part to create a
new quality culture and make TQM more effective.
Only three organisations researched have quality planning in place. Respondents from
various levels of the organisation (managerial and non-managerial) completed the
questionnaires. Allowing for this, not everybody involved has to be aware of possible
quality strategies in place because the organisation may be failing to promote them or
may not be initiating them yet. Top managements are responsible for quality planning
and thus the lack of their involvement unsurprisingly may result in deficient planning.
Of the three organisations with extensive management involvement, two have sound
quality planning.
8.3.4. Human Resource Development and Management
It has been researched that one of the best ways to achieve organisational success is
by educating, involving, and empowering employees at all levels. TQM emphasises

Page 142
self-control, autonomy, and creativity among employees and calls for greater active
cooperation rather than just compliance. This creates unique inclusive TQM culture.
Five of the ten organisations indicate an implementation of this principle generating a
positive sign considering that human resource development is a crucial part in the
overall TQM process (Ross, 1994, p. 119, Porter and Tanner, 1996, p.5). It is
necessary to mention here that there also are some external factors, e.g. BEE, that
stress the importance and necessity of employee development. One of the BEE aims is
the development of previously disadvantaged employees by training and educating
them. It is possible that some organisations earn higher scores for human resource
development due to BEE and not because of a TQM initiative.
8.3.5. Management of Process Quality
Management of quality deals with the execution and maintaining of quality processes
that have been planned. This entails management of process quality for work units
and suppliers, systematic quality improvement, and quality assessment (see chapter
three).
A good number of organisations are implementing the management of quality (six of
the possible ten). This is a good sign yet highlights the problem of the lack of strategic
quality planning. How can quality be implemented and managed if it is not correctly
planned? This is a problem area for the organisations investigated. It seems as if
organisations are too eager in trying to start a quality initiative, but fail to plan for it.
With a possibility of the quality initiative not developing smoothly in the future,
organisations would have no plan or strategies to continue the initiative. This stems
from the problem of lack of involvement and commitment from top management.
Quality divisions, if not set up already, need to be developed and regular meetings
should be held with top management. If the theory of TQM or any quality
management philosophy is unclear to top management, time and effort should be
spared to research TQM.

Page 143
8.3.6. Customer Focus and Satisfaction
This research points to the fact that the customer should be the centre of attention. It is
because of them that organisations exist and a TQM initiative is sought after. TQM
might streamline processes and cut costs, but should be taken as a sub-factor and not a
main factor for initiating implementation of TQM. The main aim of TQM is customer
focus and satisfaction to improve business results. The idea of the customer in TQM
goes beyond the traditional external customer and includes internal ones, that is,
employees dealing with inputs and outputs of internal processes (see chapter three).
It is seen that all the organisations researched except one, take into consideration the
customer and customer satisfaction. This is the key to long-term business success and
growth – it is positive to see that the organisations recognise this. In interviews held,
this topic is widely acknowledged, too. Organisations know that they exist to serve a
certain type of customer and focus on providing the best for that customer. Many of
the organisations have sound customer focus practices in place with after-sale service
considerations. Organisations put forward a great deal of correct steps that improve
customer satisfaction - conduct surveys on the product/service offered, offer training
for clients, provide solid warranties and guarantees as well as methods that counter
any problems in place. The information obtained from customers by the organisations
is then used to better the service or product offered by the organisation.
8.3.7. Management Structure and Teams
A certain management structure is required to facilitate the TQM development.
Employees should be assigned responsibilities and tasks so that they feel a sense of
attachment to their work and the organisation. Included in this is the use of quality
councils and quality teams. The aim is to make quality the responsibility of everyone
and not just a few managers involved in the head quality department (see chapter
three).
Three organisations that were investigated have a management structure with quality
teams in place that facilitate the TQM process. This once again shows the lack of

Page 144
involvement of average employees in the TQM process. A quality department may
exist, but fails to incorporate ideas and decisions from employees. This possibility
would create/maintain a quality culture that everyone helps develop. This point stems
from the lack of human resource development and management and not acquiring the
organisations’ goals, visions, and missions aligned with the employees’.
8.3.8. Cost of Quality
TQM costs to implement because it takes time; processes need to be restructured; and
employees made aware, educated, and trained. These costs are offset by the four costs
of non-conformance or the cost of quality (CoQ) – prevention, appraisal, internal
failure, and external failure costs. The theory is that in the long-term, TQM introduces
savings that overshadow the costs and so should be a worthwhile investment.
This topic of CoQ in the IT sector was argued in the interviews and it is found that it
is almost non-existent. The reasons may include that:
• the IT sector deals with projects, goals, and targets unique to the customer that
take different times to develop, implement, monitor, and service.
Consequently, the organisations cannot measure a CoQ accurately.;
• many organisations find that most of their income comes from maintaining the
systems developed. Systems can and indeed are set up on client’s premises. In
the extreme cases some organisations hire, employ and pay workers to work at
the client’s site full time. This long-term partnership has both costs and
income associated with it that are, apparently, hard to measure in terms of
quality.;
• to provide customer satisfaction and secure deals, organisations offer free
maintenance for a year, warranty on parts including delivery for a year, etc.
They maintain that no CoQ can be calculated on this as customers’ premises
vary in distance and hence projects take different times to complete. Costs are
unique to different projects, different customers, different branches, etc.; and
• upgrades are offered at a discounted rate to existing clients for the retention of
the client. The loss in profit on upgrades is not in essence a cost of quality

Page 145
because it retains the client. Maintenance and warranties on the upgraded parts
are also dealt with differently and cannot be measured with respect to CoQ.
Instead of measuring the CoQ, the organisations look at overall costs incurred with
respect to returns, maintenance, repairs, etc., and try to minimise them by setting
goals. Since they cannot obtain actual CoQ figures, they set goals pertaining to cutting
costs, e.g. to reduce returns due to bad installation by 20% by the year X, or cut down
implementation time by 10% by the year X.
8.3.9. Conclusion
Overall, only four organisations (B, E, I, and J) are implementing TQM as such. Even
if management did not indicate that TQM is their organisation management
philosophy, they implement enough TQM principles to achieve a score above 50. A
great deal of these principles are present, in various “disguises”, in different quality
management practices such as ISO (eight quality management principles), CMMI
(derived from TQM ideas), ITIL (derived from principles of TQM), COBIT (four
domains of quality), and TQM, which the organisations put into practice (see chapter
three). These organisations also feel that the quality initiative is important to business
and will continuously maintain its developments.
The most three implemented principles of TQM in order are – customer focus and
satisfaction, management of process quality, and human resource development and
management. The highlighting point is the positive results in customer focus and
human resource development because they involve the two critical areas of an
organisation – internal and external customers.
Regarding measuring a CoQ, the goals set by organisations are a more positive
approach than not measuring anything at all, as it can still be quantifiable and
improvement can be monitored. It can therefore be considered acceptable.
The principles and questionnaires are formulated mostly on international sources. It
can be argued that it may not apply to South Africa. Sila (2005) studied the influence

Page 146
of contextual variables on TQM practices and TQM organisational performance
relationships. The country of origin is included as one of the contextual variables and
the results show that the implementation of the TQM practices are similar across
subgroups of organisations. In addition, the effects of TQM on four performance
measures, as well as the associations among these measures, are generally similar
across subgroup organisations. Thus the country of origin in implementing TQM does
not affect performance relationships. This information, combined with the empirical
evidence provided by international studies that TQM provides benefits (Iversen, 2002;
Agus, 2000; Eriksson, 2003; Hendricks and Singhal, 2001), can educate managers in
South Africa by providing another possibility to increase competitiveness. The fact
that only four of the ten organisations are implementing TQM indicates the possibility
of further development in the IT industry.
8.4. Objective Two
The second objective in the study aims at examining the financial performance of the
organisations. Two financial indicators relate to the turnover of the organisation –
percentage change in sales and percentage change in return on sales. The latter makes
use of operating income as opposed to net income, which is a better measure of
performance since it is not greatly affected by accounting methods, tax strategies, or
financial structure. Organisations A and G obtain an over 20% overall increase year
on year for change in return on sales whilst organisations D, F, and H obtain negative
returns.
Organisations F, G, and H are also the lowest performing for both return on assets
(ROA) and return on equity (ROE) - two of the financial ratios used. Organisations A
and D perform well in both ROE and ROA while organisations B, C, and I perform
well in ROA alone. Total asset turnover is the other financial ratio used -
organisations A, D, and H fail to make an impression while organisations B, E, G, and
J excel.
Percentage change in share price is the last financial indicator used. Share prices of
organisations range from 1c to R10 and provide vast differences in the results. Certain

Page 147
price increases have to be excluded. This is because percentage increases from a low
value such as 1c result in high price increases (see chapter six). Organisations A and
B show the highest gains in share price over the five-year period.
As expected, the financial indicators chosen and calculated show that each
organisation has varying financial results. Some organisations obtain negative results
for certain financial indicators while others excel. The main aim of the objective,
nevertheless, is to provide information for fulfilling objective three of the study.
8.5. Objective Three
The third, main, objective set out for this study is to establish if there is any
association between TQM and financial performance within the investigated
organisations. To determine the possibility of an association, the comparisons
between two extremes – organisations with the minor and major TQM
implementation respectively - were discussed in chapter seven and any noticeable
results, highlighted.
A descriptive analysis of the data sways towards the fact that the organisations with
higher TQM scores prove better in the financial area, too. The four organisations
implementing TQM principles do not perform poorly in any of the financial
indicators, but they do not obtain the highest values either. Some organisations that
obtain poorer TQM scores reveal unstable financial indicators (performing well in one
respect, but poorly in another). All the poor financial indicators results come from
organisations implementing only a few or none of the principles of TQM.
Nevertheless, they still manage some good results in the financial indicators. The
limited scope of the study does not find any significance in either its observations or
analyses.
Further examination of the four extreme cases reveals odd results. The two lowest
performing organisations, with respect to TQM scores, differ in results in ROE and
ROA – organisation G (the lowest performer) obtaining negative figures, organisation
D (the second lowest performer) good figures. There is no constant pattern in the

Page 148
association, which subscribes to the overall analytic result of multiple linear
regression and only indirectly hints at advantages of TQM execution. McAdam and
McKeown (1999) studied small businesses in Northern Ireland and did not manage to
quantify the effects of TQM on bottom line performance either, but managed to show
that the organisations benefited by an improvement in processes, people, and supplier
and customer relationships overall.
In addition to the extreme cases analyses, multiple linear regression is used to
highlight any statistically significant link between TQM and financial performance.
Based on the statistical examination in which each financial indicator and the TQM
result are involved, the null hypothesis of no association between TQM and financial
performance cannot be rejected. The regression results can be seen in Table 10. The R
square value of 73% implied that the range of TQM scores accounts for the various
financial results. The p values for both the overall regression and the individual
variables (financial indicators) are, however, above 0.05 meaning no statistical
significance and, consequently, any possibility to confirm a positive link between
TQM and financial performance cannot be drawn.
These results go against the writings in the surveyed literature and the findings of past
research. These research discussions have been considered throughout the study, and
only a brief summary is given here:
• Robinson (Iversen, 2002) developed an index of American organisations
selected for their leading quality management methods and managed to show
that the overall return on the index was 10% greater than the Standard &
Poor's 500 (S&P 500) stock index during the same period.
• Agus (2000) performed a study on Malaysian organisations that empirically
investigated the linkages between TQM and financial performance relative to
competitors. The paper was successful in providing evidence of the
contributing factors of TQM on financial performance.
• Eriksson (2003) performed a similar study in Sweden where quality award
winners were examined in comparison to a competitor of similar size not
implementing TQM. It found that over the long-term (post implementation of
TQM) the award recipients outperformed the non-TQM organisations in

Page 149
financial performance. Another interesting point was that the indicators used
to measure financial performance were similar to the ones used in this research
- percentage change in sales, return on assets, return on sales, percentage
change in total assets, percentage change in number of employees
• NIST (National Institute of Standards and Technology) examined the
organisations that won the Malcolm Baldrige Award and their associated share
prices. It was found that the Baldrige portfolio achieved 60% better than the
S&P 500. In addition, it made another portfolio of Malcolm Baldrige
applicants (not winners) and the applicants outperformed the S&P 500
portfolio by a ratio of 4.5 to 1.
• Hendricks and Singhal (2001) performed a similar study to Eriksson (2003) of
winners of quality awards in the USA over a ten-year period. They also used
similar financial indicators – percentage change in: growth in assets, growth in
sales, share price, operating income. They too found conclusive proof that
TQM has a positive effect on financial performance showing that award
winners outperformed control groups 38% to 46%.
These studies add to the mounting empirical evidence that TQM can lead to superior
growth in sales and earnings, higher profits, higher ROA, and other positive financial
results. Results of this study are different. This might be caused by too few
organisations being investigated (ten) due to the constraints of the study outlined in
chapter one, such as time and the method used. It would be desirable to have larger
samples to increase the number of observations for statistical analysis. The research
performed by other researchers around the world dealt with many organisations over a
longer time frame resulting in statistically significant conclusions.
Another factor that can result in not being able to disprove the hypothesis is the lack
of segmentation of the organisations. Of the ten organisations, some are well-
established large organisations with widespread interests, whereas the others are
substantially smaller, dealing with more of a niche segment in the IT industry. Some
of those larger organisations have already initiated a quality movement within their
organisations many years ago. As a result, their consequent improvement in the
financial figures has already been in place long before the years that are considered

Page 150
for analysis in this study. In addition, these organisations with a larger market
capitalisation cannot have the greatest percentage increases in the financial indicators
because these increases occurred before the years of this study, and are now just
maintaining an average growth (e.g. the sales of organisation I were a factor of eight
times higher in six of the ten organisations studied).
Other reasons for the lack of obtaining a statistically significant association could be
due to the:
• method of analysis (TQM) – this could include selecting different weightings
between the principles, the inclusion or exclusion of some other principles, or
focusing on different areas in each TQM principle. Based on the literature
survey done, the most accurate options are thought to have been used,
however, after investigating the companies, certain principles could have been
excluded (cost of quality) and others included (quality in project management)
to possibly provide a better perspective of quality in IT organisations;
• method of analysis (financial performance) – this could take in placing
different weightings to the yearly financial figures, assessing different
financial performance indicators. Once again, it is thought that the most
accurate options have been chosen, still, with base values being different
between companies, a more standardised method may be preferred;
• lack of validity – the questionnaire is based on the guidelines for evaluation of
applicants for the Malcolm Baldrige National Quality Award and questions
used previously in the case studies of Ross (1994) to evaluate organisations.
The questionnaire has, though, been created for the purpose of the study and
never previously independently validated. Care is taken to enhance validity
(Section 6.6.2 on Validity) and reliability (Section 6.6.1 on Reliability).
Nonetheless, criterion and construct validity cannot be measured.
• lack of reliability - the lack of the number of overall rating scale questions
resulted in groupings of questions in the questionnaire for Cronbach’s alpha
testing. These groupings are across different TQM principles. If no groupings
exist, this may have indicated non-reliable questions.
• The statistical technique used assumed an infinite population. However, that is
not true as 40% of the population was sampled. More sophisticated techniques
Page 151
like hypergeometric analysis may show that some factors are, in fact,
significant. Such techniques are beyond the scope of this study.
8.6. Objective Four
The fourth objective, discussing the evolution of TQM as a management philosophy,
is dealt with by the case study section of the research. It examines the subject to
determine if there are any adaptations to the core viewpoint or expansion of parallel
philosophies. Special attention is given to the IT industry that may have a different
approach to certain quality issues.
Henderson and McAdam (2004) explain that it is inevitable that internal and external
forces will change the current TQM philosophy. They state that it will come from
both within the TQM movement as well as externally. Internally, it is likely to include
large-scale shifts compared with the present format, which will include redefinition of
terminology, especially concerning the use of the word "quality." They believe
external influences on change will include environmental issues and socially
responsible business practices. The increasing awareness of the need for socially
responsible business practices is partially reflected in TQM standards, which are
associated with commitment to improvement and employee involvement. The
challenge for the TQM of the future is to evolve to be at the forefront of
environmental management issues, and be pro-active in setting responsible standards,
and ensuring its practices make them achievable.
When some organisations were approached, they denied the use of TQM, but
endorsed different quality management philosophies indicating that they are a more
modern approach towards quality. The literature survey has proven that new quality
management initiatives such as CMMI, Six Sigma, and ITIL have their roots in TQM
and endorse similar principles but on a different level. Considering this, the views of
certain organisations are considered inaccurate.
There are various internal and external factors that may influence and shape quality
management philosophies.

Page 152
8.6.1. Internal Influences
This section discusses the findings found from interviews pertaining to changes in
TQM as a management philosophy, with special attention paid to internal pressures.
Management of the more developed organisations (C, F, I, and J) feel there is a shift
away from TQM in certain respects to other newer quality management entities. This
could imply either additions to the classic TQM philosophy or a more concentrated
quality management framework for individual projects and processes.
Newer entities, supposedly addressing modern needs, which came up in the
interviews can be incorporated with TQM. Some models and how they link with
TQM are summarised here:
• SAEM - diagnostic self-assessment tool – based on Malcolm Baldrige Model
and hence TQM.
• IiP – expands on the human resource development and management principle
of TQM.
• Six Sigma – deals with continual quality improvement using numerical means
(identifying defects). Originated from statistical quality control developed by
the pioneers of TQM.
Organisation-wide entities such as TQM can continue to provide overall management
best practices. Other entities may be incorporated into the management of the
business and increase an organisation’s number of entities to compete in a global
market. Company I is the most distinct in this respect using SAEM criteria on its
processes and making use of six sigma and IiP (Investors in People). The Malcolm
Baldrige and other awards still exist and only the criteria required to win the award
adapt to modern pressures. The same ideology applies to TQM. It can still provide a
competitive advantage to any organisation that undertakes it, it just needs to
continually adapt.
Another move away, indicated in the interviews, from TQM, internally, is the
development of advanced quality management entities for individual processes,

Page 153
measurement systems, and improvement methodologies. This can include the
planning, implementation, and monitoring of projects for clients. Some of the quality
management entities are discussed in chapter three and a full list can be found in
Appendix G. The three entities that came up when investigating the organisations are:
• CMMI for control and structure in software (and system) development;
• ITIL for operational and tactical management of service delivery; and
• COBIT as an overall IT governance framework.
It can be understood why this evolution towards more quality management for
projects is starting to take place. IT organisations, such as Organisations I and J,
undertake IT projects involving months of work and then even years of further
monitoring and maintenance (see chapter three – management of process quality).
Each client and their project are unique and certain new quality frameworks, for
instance ITIL and CMMI, concentrate on the project and provide a checklist. This
helps manage the projects making sure that proper attention is given to each aspect of
quality throughout the project. It proposes a methodology for projects that is always
the same even though the projects differ. This new trend of handling projects can be
more specific to the IT industry because unique projects are commonly found in this
field. The only principle of TQM that can deal with projects is customer focus and
satisfaction and this is not good enough to manage projects or IT service delivery for
customers. This is not a reason to disregard TQM, but to rather use it, for the
synergistic effect, as the structure for the combination with a new quality management
entity that specialises in, and incorporates, a methodology for projects. Jung and
Wang (2006) found that TQM alone may have a positive affect on project
management.
It can also be understood why there is a need to adopt new best practices to
standardise IT processes. New frameworks need to bring consistency and efficiency to
the various aspects of IT such as application development, help desk, network
operations, security, and service delivery and support. Dubie (2006) explains that
ITIL addresses service delivery and support, COBIT covers the broadest spectrum of
IT governance, CMMI shows how IT shops rate in terms of maturity compared with
best-known processes, and ISO demands intense processes that are focused on quality

Page 154
and compliance. Organisations need to adopt more than one best-practice framework -
or at least parts of many - if they want a complete, effective set of management
process guidelines.
IT functions are being asked to add value to the business in a stable, agile and cost
effective manner. Many IT functions are turning to industry best practices for
guidance on how to improve quality of service while reducing costs, instead of
inventing practices and processes themselves (Fry, 2005).
At the moment, ITIL is the international best practice approach, providing
comprehensive guidance on how to manage the delivery and support of IT services
(Melliar, 2004). Research predicts that there will be widespread adoption of ITIL best
practices by internal IT departments (see chapter three) and it is suggested that ITIL
will be adopted and used across the world as the standard for best practice in the
provision of IT service delivery (Fry, 2005).
In the study, only two of the ten organisations show interest in ITIL – a negative sign
for quality management in South Africa if they are to compete with international
organisations implementing the most modern quality management practices.
8.6.2. External Influences
Alvin Toffler, an American writer and futurist, is known for discussing the digital
revolution and corporate evolution (Wikipedia:Alvin Toffler, 2006). Toffler
emphasises that change has become part of life and at an ever-increasing rate.
Management theory is no exception to this and has evolved through the years. This
evolution comes as a result of changes in the environment (Smit, 1999, p.57). TQM is
developed to be a complete organisational management tool making sure to
incorporate all elements of an organisation. TQM looks at continuous improvement
and never being satisfied with quality i.e. focusing to improve internal processes. This
is still necessary and certain elements of TQM are still relevant, if not almost all of
them. The difference lies in the fact that both the organisation and the classic TQM

Page 155
model should take into account external factors, too. These external factors can be
economical, political, social, or environmental.
South Africa has been undergoing organisation restructuring in many areas. Over the
last decade, corporate sustainability has steadily broadened from an initial focus on
philanthropy and environmental management towards including health, safety, labour,
community and broader socio-economic issues (KPMG, 2004). Corporate governance
and the pressure of complying with empowerment and transformation codes are
firmly entrenched as the new business necessity (Candy, June 2005). Corporate
governance acknowledges that there is a move away from the single bottom line (that
is, profit for shareholders) to a triple bottom line, which embraces the economic,
environmental and social aspects of an organisation’s activities. TQM needs to adapt
to take into consideration external influences such as the corporate governance and
ethics, sustainability issues, and black economic empowerment (BEE) criteria, all of
which are necessary for long-term continuance and prosperity in South Africa. It is for
this reason that TQM needs to combine with other management issues to remain a
holistic approach. When discussing corporate governance in the interviews, the
organisations had more of a classic view regarding TQM and external influences -
that they are not intertwining. Both are acknowledged as important, just not seen as
symbiotic. The major objectives of an organisation are now not only creating
shareholder’s wealth by improving profits, ensuring adequate liquidity, and improving
growth, but serving society by enriching the lives of employees (TQM incorporates
some of this), serving the various communities, and conserving the environment for
future generations.
This is evident in the companies analysed. Focus is being deterred by trying to
improve BEE and corporate governance so that future projects are secured. With
current positive economic conditions place (low interest rates spurring improved GDP
growth encouraging development in cyclical sectors such as IT and a relatively stable
exchange rate), it is not as necessary to concentrate on redefining IT organisations
with regard to their management processes. Initiatives such as BEE, corporate
governance, and proudly SA are evident in many of the companies studied. These
external influences are required to get try projects in lucrative markets such as
government spending and NEPAD (Appendix A). Management themselves indicate

Page 156
focus is being diverted from a TQM framework to these initiatives (companies G, H,
I). This is in no way incorrect, external influences need to be managed for future
sustainability. These external influences are currently evolving management theory.
The central focus of TQM was, is, and still will be customer satisfaction. The new
developments, however, need to be incorporated into the TQM philosophy.
Henderson and McAdam (2004) declare that there is no shortage of views on the
present state and usage of TQM tools and philosophy, and how they impact on
organisations. The fact that so many take the time and effort to contribute to the
debate about how to define TQM, how to use it, adopt it, adapt it, promote it, and
develop it is a tribute to its recognition as an important factor in ensuring that an
organisation maintains its focus on customers' needs and expectation, and how to
maintain the consistency of that focus. They believe TQM continues to play a central
role in future organisational development. The changes to TQM will build on the
existing academic and organisational reputation of TQM to meet the demands of
external organisational change.
Questions concerning external influences that were raised in the interviews did not
meet with any noteworthy answers. Representatives agreed that these pressing issues
are important in the long-term prosperity of the organisation and have to be
incorporated into management. Of all the external factors discussed, BEE and
corporate governance were mostly stressed. Organisations should take a closer look at
the TQM philosophy in general, how it is to be used in their environment, and how it
can use TQM ideas to forge new management theories. Changing dynamics of the
marketplace require that old mind-sets of the organisation-wide TQM approach shift
directions to include external influences.
8.6.3. Overall Model
The quality revolution started in Japan in 1946 with Deming and spread to the United
States in the 1980s. The TQM movement peaked between 1992 and 1996. Gibson and
Tesone (2001) reveal that although the TQM trend has declined since then, it is still
alive. The philosophy of continuous quality improvement now might carry a different

Page 157
name in organisations, but with the same underlying principles. Flynn (2005)
acknowledges this by stating that TQM has become integrated into good, mainstream
management practice because it contains valuable core ideas. Furthermore, it is
doubtful that any organisation will be able to ignore the necessity of improving
customer service and the quality of goods and services.
In the same way that the Malcolm Baldrige Award undergoes annual revision of core
values and concepts, scoring guidelines, and weightings, TQM should continually
adapt to external and internal influences to reflect current thinking. Mehra et al (2001)
tried identifying the future role of TQM in businesses facing global markets. They
found that organisations need to take a closer look at the TQM philosophy in general
and, specifically, how it is to be used in their environment. Furthermore, businesses
should undertake a challenge to design operations using seamless boundaries in
internal processes and external transactions. Their research found that instantaneous
response to changing market dynamics would be the single most important challenge
of the future. It requires a new definition of quality and TQM alike. The same as
every business, even South African organisations, being a part of the international
market place, should heed the advice to improve their competitive edge. Parajogo and
Sohal (2004) presented a case study of an organisation that has been successfully
maintaining its competitive advantage and growth. Based on the analysis of the
research findings they suggest that organisations need to keep vigilant in observing
the changes occurring in the business environment adjusting their strategy
accordingly, and that it is highly important to redefine and broaden the application of
the principles of TQM understanding the need to tailor them appropriately. These two
findings concur with the result of this study. TQM needs to incorporate specific South
African external influences and adapt, in general, to include internal influences such
as project handling.
To make the adaptation easier and more effective, TQM can link with other known
best practices to cover aspects that face local and global organisations and form a new
integrated management system. CMMI can be used to guide process improvement
across a project and provide the latest best practices for product and service
development and maintenance. The origins of CMMI lie with TQM, so the core
characteristics are the same, but rather applied in a more modular fashion for easier

Page 158
implementation over projects. ITIL, on the other hand, contains comprehensive,
publicly accessible specialist documentation on the planning, provision, and support
of IT services and also covers the environmental facilities needed to support IT. The
combinations of various entities are able to cover the processes and operations
(external and internal influences) within an organisation remaining a holistic approach
for continuous quality. Figure 24 shows how an overall management system
incorporating the needed entities can be formulated. Stoller (2005) states that
organisations need to turn to other frameworks to fill the gaps that other entities
cannot fill.
Dubie (2006) studied various organisations and analysed the implementation of
various IT best practices. It was found that organisations suggest that in many cases,
ITIL, COBIT, and CMMI should be adopted together depending what they wanted
out of the various entities. Advice, in the form of three steps, is given on how
managers should approach process adoption: start with a framework such as COBIT
or ITIL; move on to a standard that can be certified, such as the many ISO guidelines;
then perform ongoing improvements that can be measured by, for example, CMMI or
Six Sigma. This is similar to the view found in this research through Organisations I
and J when discussing the need to combine the mentioned philosophies. In Figure 24,
TQM formulates the core with necessary principles and deals with aspects such as the
"soft" dimensions of leadership and human resource management; CMMI is an off-
shoot of TQM dealing with projects, products, processes, and increasing maturation
levels of the other best standards; COBIT brings in check points and security points;
external factors such as BEE and corporate governance, are taken into consideration;
and underlying all are necessary best practices to improve any one process or
principle in TQM. ITIL would run the day-to-day operations of IT whilst Six Sigma is
an ideal discipline and set of skills to implement COBIT and ITIL (Fry, 2005). It is
thought that this is a commanding combination since many of the current best
practices are derived from the principles of TQM and similar ideologies underline
their structure. In any case, an array of frameworks, tailored to the particular needs of
the organisation is the best approach. South African organisations’ awareness of these
various best practices is minimal. Managers should realise the potential of structuring
and improving processes within an organisation to compete with international
organisations.

Page 159
Figure 24: Integrated Management System with All Entities

Page 160
Chapter Nine: Conclusion and Directions for Future Research
9.1. Conclusion
Quality management is a complex topic. Regular evaluation studies carried out among
concerned parties at performing levels provide a valuable method to help us
understand how employees feel about and understand quality and how it can be
improved. By the questionnaires’ analysis it has been illustrated that the studied
organisations benefit from varying, and insufficient, for that matter, levels of TQM
implementation. Only four of the ten organisations prove to be applying at least some
of the eight core principles of TQM. This differs from the standards set at the
international level by leading enterprises. The main problem areas such as improper
quality planning and insufficient quality managerial structures seem to stem from the
lack of commitment and involvement of top management. If quality management is to
be taken forward, successfully, with all organisations and their employees being asked
to make an active contribution to future organisational development, then the
satisfaction, attitudes, and concerns of personnel expressed in the questionnaires,
should be acknowledged and the relevant executives put the theory into practice. It
would appear that the potential benefits of proper quality management are not clear to
decision-making bodies. Although unpopular, the only answer to the predicament
would seem to be the only appropriate measure of the relevant Board of Directors,
themselves educated in quality issues, to improve the shape of the organisation.
Based on international findings, a positive link between TQM and financial
performance was expected. A descriptive analysis of the data does indicate that the
organisations with higher TQM scores prove better in the financial area, too. On
contrast, the financial results of the organisations, not putting quality principles in to
practice are not as stable. Statistical testing does not provide any further evidence for
an association between TQM and financial performance.
While TQM principles are found, to a large extent, insufficient in occurrence, certain
organisations scored relatively highly in dealing with internal influences (process
management), external influences (corporate governance and economic

Page 161
empowerment), and quality issues through different means. Alternative, modern,
more processed based quality management philosophies (namely ITIL, COBIT, and
CMMI) are in place, although even higher levels would be desirable – only five
organisations seek other quality entities. The supervisory structures should only be
commended for that. It suggests that they are well informed on the quality issues that
are under scrutiny in the modern-day business environment trying to extrapolate them
into the South African environment. The emerging new philosophies and their good
rapport with the business management put even the usability of TQM in isolation into
question. It has been a further proof that although the traditional ideology behind
TQM remains in place, it needs to adjust to the contemporary corporate world.
9.2. Implications of the Study
This work remains the only cross-sectional study considering issues surrounding
problems with TQM implementation in the IT industry in South Africa.
Smit suggests that today’s business environment is more turbulent than ever. South
African organisations are particularly hard pressed because of South Africa’s
relatively recent entry into the global economy. The organisations now have to
compete in a borderless world against established competitors such as the United
States of America and Singapore (Smit, 1999, p.139). There might be different views
on how to improve the business’ competitiveness (e.g., through better salaries,
productivity, skills development, cooperation with unions, etc.), but elaboration on
that is out of the scope of this study. TQM, though, while certainly not a universal
remedy, is one management philosophy that is capable of aiding South African
organisations. The performance of TQM is more mature in international organisations
as it has become integrated into mainstream management practice (Gibson and
Tesone 2001; Flynn, 2005). More and more organisations can focus on quality
management entities to increase competitiveness by implementing internationally
accepted best practices. This may also improve expansion opportunities both locally
and globally.

Page 162
Unlike purely mass product-oriented industrial fields (e.g., car industry) where the
necessity for standard TQM is unquestionable, the service-oriented specifics of the IT
industry have put the usability of TQM in isolation into question. The lack of TQM in
the IT sector found in this research highlights this.
It is true that the study does not find any definite positive association between quality
and financial performance, but the results are nonetheless indicative of the overall
appeal of the correct quality management of any variety. Learning from the findings
of this study and mistakes of the organisations’ initial executions, and better
reciprocal understanding of all contributors involved should ensure that quality and,
ultimately, customer satisfaction, could improve considerably over time.
9.3. Further Research
Every research has limitations and it is important to recognise these explicitly. It
would be desirable to have larger samples to increase the number of observations for
statistical analysis and to increase the general, overall results. In the same thought,
these findings should be validated by using other samples. However, one of the
consequences of a cross-sectional research design is the lack of information over time
and examining exactly when any TQM principles started to take shape at selected
organisations. This research also places reliance upon a single respondent in each
organisation. In future research, it may be advantageous to use multiple respondents
in each organisation to improve respondent reliability. Future researchers can also
examine the methodology used in this study (questionnaires and interviews) and may
opt for other strategies. Other studies make the use of quality award winners
(Hendricks and Singhal, 2001; Eriksson, 2003) compared to a competitor of similar
size not implementing TQM.
The validity and reliability of the TQM questionnaires are high, but still subject to
improvement. Further empirical research may be conducted on redefining the TQM
elements by a more refined method. This could include selecting different weightings
between the principles, the inclusion or exclusion of some other principles, or
focusing on different areas in each TQM principle. More questionnaires per

Page 163
organisation may also provide a better representation of TQM principles at the
organisations. The financial success is measured on six chosen indicators. These may
be refined and others may be included, more aimed at TQM such as percentage
change in number of employees. Also, different emphasis may be placed on the
weightings of each year’s financial figures.
Future research work may incorporate other selected quality management entities
being implemented in South Africa and how they affect financial performance on a
broader spectrum. More focus may also be given to local trends and external
influences and determine the affects on management and the bottom line. Evolution of
TQM and other quality management frameworks can also be examined in other
industries to compare the findings to, e.g. project management, and provide even
more concrete information for the management of South Africa.
Both ongoing monitoring and intermittent evaluations of TQM are needed and could
form the foundations for further research. Systemic incorporation of other quality
management entities, extra focus on local trends, and exploration of other industrial
fields, can assist in giving details about the South African position.

Page 164
References
Agus, A. and Krishnan, S. K. and Kadir, S. L. S. A. The structural impact of total
quality management on financial performance relative to competitors through
customer satisfaction: A study of Malaysian manufacturing organisations, Total
Quality Management Journal, Abingdon, July 2000, Volume 11, Issues 4-6, pp.
S808-S820
Ahire, S. L. and Golhar, D. Y. and Waller, M. A. Development and validation of
TQM implementation constructs, Decision Sciences Journal, 1996, Volume 27, pp.
23-56
Alexander, M. Black Economic Empowerment, South Africa Info RePorter and
Tanner, South Africa Business Guidebook 2002-2003, Towards a Ten Year Review,
http://www.southafrica.info/doing_business/trends/empowerment/bee.htm, 2003
Anderson, B. Down but not out, Moneyweb Holdings Limited,
http://www.moneyweb.co.za/shares/ict_sector/383958.htm, 2 September 2004
Balachandran, S. Customer-Driven Services Management, Second Edition, Response
Books, Thousand Oaks, California, 2004
Bankseta, Investors In People,
http://www.bankseta.org.za/investors_in_people/default.asp, 2005
Berry, L. L. and Bennett, D. R. and Brown, C. W. Service Quality, A profit strategy
for Financial Institutions, Richard D Irwin Inc, Homewood, Illinois, 1989
Bicheno, J. 34 for Quality, A guide to 8 Gurus, 7 Tools, 7 Wastes, 12 Techniques,
Picsie Books, Buckingham, 1991
Brealey, R. A. and Myers, S. C. Principles of Corporate Finance, Fourth Edition,
McGraw-Hill Inc, New York, 1991

Page 165
Buzzell, R. D. and Gale, B. T. The PIMS* Principles, Linking Strategy to
Performance, *Profit Impact of Market Strategy, The Free Press, New York, 1987
Camp, R. C. Benchmarking, The search for industry best practices that lead to
superior performance, ASQC Quality Press, Milwaukee, Wisconsin, 1989
Candy, G. E-Government on the Way, Moneyweb Holdings Limited,
http://www.moneyweb.co.za/shares/ict_sector/420154.htm, 1 March 2005
Candy, G. Awarding Good Governance, Moneyweb Holdings Limited,
http://www.moneyweb.co.za/specials/corp_gov/454163.htm, 23 June 2005
Carnegie Mellon, What is CMMI?, Carnegie Mellon University,
http://www.sei.cmu.edu/cmmi/general/general.html, July 2005
Carnegie Mellon, Capability Maturity Model (CMM) and CMM Integration (CMMI),
Carnegie Mellon University,
http://www.cs.hmc.edu/courses/2005/spring/cs121/slides/cmm.pdf, 2005
Coetzee, H. Interview Held – Pinnacle Group Financial Manager, Pinnacle Limited,
(011) 265 3216, [email protected], 6 October 2005
Cortada, J. W. TQM for information systems management: quality practices for
continuous improvement. McGraw-Hill, New York, 2005
Costa, M. M. and Lorente, A. R. M. ISO 9000 as a tool for TQM: A Spanish Case
Study, The Quality Management Journal, Milwaukee, 2004, Volume 11, Issue 4,
pp.20-31
Crosby, P. B. Quality is Free: the art of making quality certain, New York: New
American Library, 1979
Crosby, P. B. Quality Without Tears, The Art of Hassle-Free Management, McGraw
Hill, New York, 1984

Page 166
Definition:Financial Performance, Dictionary – Financial Performance,
Dictionary.com, http://dictionary.reference.com/browse/financial%20performance,
Accessed 16 June 2006
Dekker, C. King Report on Corporate Governance 2002 – What it means to you,
Cliffe Dekker, http://www.cliffedekker.co.za/literature/corpgov/, Accessed 13 March
2006
Deming, W. E. Quality, Productivity and Competitive Position, Massachusetts
Institute of Technology, Centre for Advanced Engineering Study, Cambridge,
Massachusetts, 1982
Dictionary, Share Price – What’s the definition, Investor Dictionary.com,
http://www.investordictionary.com/definition/share+price.aspx, Accessed 20
February 2006
Drummond, H. The Quality Movement, What Total Quality Management is Really All
About, Nichols Publishing, London, 1992
Dubie, D. ITIL Best Practices gain growing interest: survey, Network World,
Framingham, November 2004, Volume. 21, Issue 46, p.19
Dubie, D. Better management through best practices, Network World, Framingham,
January 2006, Volume 23, Issue 2, p. 28
Dye, R. W. The world of work in 2010, CMA Management, Hamilton, December
2001/January 2002, Volume 75, Issue 9, pp. 38-42
Easton, G.S. and Jarrell, S.L. The effects of total quality management on corporate
performance: an empirical investigation, Journal of Business, Volume 71, No 2, 1998
pp. 253-307.

Page 167
Elmuti, D. and AlDiab, T. F. Improving Quality and Organisational effectiveness go
hand in hand through Deming’s Management System, Gibson D. Lewis Centre for
Business and Economic Development, http://coba.shsu.edu/jbs/vol12/no1/12-1-6.htm,
Journal of Business Strategies, Spring 1995, Volume 12, Number 1, pp. 86-98
Emerick, N. South Africa’s leap from information dirt road to super highway, The
Free Market Foundation of Southern Africa,
http://www.freemarketfoundation.com/ShowArticle.asp?ArticleType=Issue&ArticleI
d=1815, 7 September 2004
Eriksson, H. and Hansson, J. The impact of TQM on financial performance,
Measuring Business Excellence Journal, Bradford, 2003, Volume 7, Issue 1, pp.36-51
FED. About the FED, Federal Reserve Bank of San Francisco,
http://www.frbsf.org/publications/federalreserve/monetary/affect.html, 2005
Feigenbaum, A. V. Total Quality Control, Third Edition, McGraw Hill, New York,
1983
Feigenbaum, A. V. Quality and Productivity, Quality Progress, 1977
Feinberg, P. Corporate Financial Management and Decision Making, 2nd Edition,
Peter Feinberg Business Planning cc, Johannesburg, 2005
Firer, C. and Ross, S. A. and Westerfield, R. W. and Jordan, B. D. Fundamentals of
Corporate Finance, 3rd South African Edition, McGraw Hill, London, 2004
Flynn, B. B. Introduction, The Total Quality Management Journal, Milwaukee, 2005,
Volume 12, Issue 2, p. 4
Fry, M. TQM, ISO, COBIT, ITIL: Putting the Frameworks Together to Improve
Business. IT Business Edge, http://www.itbusinessedge.com/item/?ci=2623, February
2005

Page 168
Fry, M. The hidden pitfalls of ITIL, Network Times – IT Magazine for IT decision
makers, Paradigma Publishing,
http://networktimes.co.za/article.asp?pklArticleId=3619&pklIssueId=537&pklCatego
ryId=295, August 2005
Gardner, B. R. ISO 9000 and TQM: Is it OK to Choose?, Community Quality Journal,
September/October Edition,
http://deming.eng.clemson.edu/pub/tqmbbs/iso9000/isovstqm.txt, Accessed 12
December 2005
Garson, G. D. PA765 – Multivariate Analysis in Public Administration, Professor of
Public Administration, College of Humanities and Social Sciences,
http://www2.chass.ncsu.edu/garson/pa765/index.htm, Accessed 25 May 2005
Gibson, J. W. and Tesone, D. V. Management fads: Emergence, evolution, and
implications for managers, The Academy of Management Executive, Briarcliff Manor,
November 2001, Volume 15, Issue 4, pp. 122-134
Goodspeed, I. The Equity Market, South African Institute of Financial Markets
(SAIFM), Johannesburg, Registered Persons Exam Module, January 2004
GraphPad. GraphPad Software, http://www.graphpad.com/instat/instat.htm, 2005
Gruska, G. F. W.E. Deming in the new millennium, Total Quality Management,
Abingdon, July 2000, Volume 11, Issues 4-6, pp. S779-S788
Harrington, H. J. Business Process Improvement, The breakthrough strategy for total
quality, productivity, and competitiveness, American Society for Quality Control,
McGraw Hill, New York, 1991
Henderson, J. and McAdam, R. Will we recognize the TQM of the future? Factors
which will reshape the body of knowledge, Measuring Business Excellence, Bradford,
2004, Volume 8, Issue 4, pp. 76-80

Page 169
I-Net. Rand Stable despite choppy market waters. Business Report,
http://www.busrep.co.za/index.php?fSectionId=564&fArticleId=3036867, December
15 2005
Investopedia, Moving Average – MA, Investopedia Inc. 2000,
http://www.answers.com/moving+average&r=67, Accessed 20 February 2006
ISO, International Organisation for Standardisation, ISO 9000 in brief,
http://www.iso.org/iso/en/iso9000-14000/understand/inbrief.html, Accessed 14 June
2006
ITIL, Achieving IT Service Leadership, itil.org,
http://www.itil.org/itil_e/index_e.html, 2005
Iversen, W. Bottom-Line Quality, Quality, Troy, August 2002, Volume 41, Issue 8,
p.6
Jarrar, Y. F. and Zairi, M. Best practice transfer for future competitiveness: A study of
best practices, Total Quality Management, Abingdon, July 2000, Volume 11, Issue 4-
6, pp. S734-S781
Jacob, S. The IT best practices revolution, Network World, Aug/Sep 2005, Volume
79, Issue 5, pp.46-47
Jeffries, D. R. and Evans, B. and Reynolds, P. Training for Total Quality
Management, Practical Trainer Series, Kogan Page, London, 1992
Juhl, H. J. and Kristensen, K. and Kanji, G. K. and Batley, T. W. Quality
Management: A comparison of cultural differences, Total Quality Management,
Abingdon, January 2000, Volume 11, Issue 1, pp. 57-66
Jung, J. Y. and Wang, Y. J. Relationship between total quality management (TQM)
and continuous improvement of international project management (CIIPM),

Page 170
Technovation, Science Direct, Volume 26, Issues 5-6, May-June 2006, pp. 716-722
Juran, J. M. Made in USA-A Quality Resurgence, Journal for Quality and
Participation, March 1991, pp.6-8
Juran, J. M. Juran on Quality by Design, The New Steps for Planning Quality into
Goods and Services, The Free Press, New York, 1992
Kaplan, I. Telephone Conversation about IT Sector, Kaplan Equity Analysts,
http://www.kaplanequity.com/, 7 October 2005
Kanji, G. K. and Wallace, W. Business excellence through customer satisfaction,
Total Quality Management, Abingdon, Volume 11, Issue 7, pp. S979 – S999,
September 2000
Kathleen, C. Baldrige beefs up on finance, CFO, Boston, March 1995, Volume 11,
Issue 3, p.18
KPMG. 2004 KPMG Survey on Integrated Sustainability Reporting in South Africa –
A Ten Year Review, KPMG, http://www.waynevisser.com/cc_in_sa_short.htm,
December 2004
Kruger, W. Interview Held – Mustek Credit Manager, Mustek Limited, (011) 237
1000, [email protected], 6 October 2005
Lapin, L. L. Statistics for Modern Business Decisions, Third Edition, Harcourt Brace
Jovanovich Inc, New York,1982
Lawler III, E. E. and Mohrman, S. A. and Ledford Jr, G. E. Employee Involvement
and Total Quality Management, Practices and Results in Fortune 1000 Companies,
Jossey-Bass Publishers, San Francisco, 1992

Page 171
Lawler II, E. E. and Mohrman, S. A. and Ledford Jr, G. E. Do employee involvement
and TQM programs work?, The Journal for Quality and Participation, Cincinnati,
Jan/Feb 1996, Volume 19, Issue 1, pp.6-111
Lee, C. C. and Lee, T. S. and Chang, C. Quality/productivity practices and
organisation performance in China, The International Journal of Quality and
Reliability Management, Bradford, Volume 18, Issue 6/7, pp. 604-625, 2001
Leedy, P. D. Practical Research, Planning and Design, Third Edition, Macmillan,
New York, 1980
Lemak, D. J. and Reed, R. Commitment to total quality management: is there a
relationship with firm performance, Journal of Quality Management, 1997, Vol. 2 No.
1, pp. 67-86
Linde, K. V. and Horney, N. and Koonce, R. Seven ways to make your training
department one of the best, Training and Development, Alexandria, August 1997,
Volume 51, Issue 8, pp.20-26
Malhotra, N. K. Marketing Research, An Applied Orientation, Prentice-Hall
International Editions Inc, New Jersey, 1993
Malhotra, N. K. Marketing Research, An Applied Orientation, Third Edition,
Prentice-Hall Inc, New Jersey, 1999
McAdam, R. and McKeown, M. Life after ISO9000: An analysis of the impact of
ISO9000 and total quality management on small businesses in Northern Ireland, Total
Quality Management, Abingdon, March 1999, Volume 10, Issue 2, pp.229-242
McConnell and Brue, Economic Growth and Instability, Chapter 8,
http://www.wits.ac.za/sebs/downloads/2005/econ109.macro.mcconnell_ch8.ppt, 2005
Page 172
McLeod, D. BEE’s Ups and Downs, Top Empowerment Companies 2005, Financial
Mail, http://free.financialmail.co.za/projects05/topempowerment/stories/lbee.htm, 4
March 2005
Mehra, S. and Hoffman, J. M. and Sirias, D. TQM as a management strategy for the
next millennia, International Journal of Operations and Production Management,
Bradford, 2001, Volume 21, Issue 5/6, pp. 855-877
Melliar, F. IT Service Management Best Practice, Frameworks, Standards, and
Models, Thought Leadership Piece, http://www.foster-
melliar.co.za/whitepapers/Thought%20Leadership%201.pdf, 2004
Monteiro, A. SA Lapping up PCs and Notebooks, Moneyweb Holdings Limited,
http://www.moneyweb.co.za/shares/ict_sector/464072.htm, 21 July 2005
Nau, R. F. Testing the assumptions of linear regression, Associate Professor, Ph.D.
University of California, Berkeley, http://www.duke.edu/~rnau/testing.htm, Accessed
20 April 2006
NIST. Quality Management Proves to be a Sound Investment, National Institute of
Standards and Technology, http://www.nist.gov/public_affairs/releases/n95-05.htm, 3
February 1995
Nthite, C. Interest Rates to Inch Up?, Moneyweb Holdings Limited,
http://www.moneyweb.co.za/economy/economic_trends/488706.htm, 19 September
2005
Nunnally, J. C. Psychometric Theory, Second Edition, McGraw Hill, New York, 1978
Obert, T. An Exploratory Study of the Link Between Strategic Types and Quality
Management, http://coba.shsu.edu/jbs/vol13/no1/13-1-5.htm, 1996
OGC, ITIL: IT Service Management, Office of Government Commerce (OGC),
http://www.itil.co.uk/, 2005

Page 173
Ozeki, K. and Asaka, T. Handbook of Quality Tools, The Japanese Approach,
Productivity Press, Cambridge, Massachusetts, 1990
Parajogo, D. I. and Sohal, A. S. Transitioning from total quality management to total
innovative management: An Australian case, The International Journal of Quality &
Reliability Management, Bradford, 2004, Volume 21, Issue 8, pg. 861
Parzinger, M. J. and Nath, R. A study of the relationships between total quality
management implementation factors and software quality, Total Quality Management,
Abingdon, May 2000, Volume 11, Issue 3, pp.353-372
Porter and Tanner, L. and Tanner, S. Assessing Business Excellence, Oxford, 1996
Powell, T. C. Total quality management as competitive advantage: a review and
empirical study, Strategic Management Journal, 1995, Volume 16, pp. 15-37.
Praxiom, ISO 9000 – An Introduction, Praxiom Research Group Limited,
http://praxiom.com/iso-intro.htm, August 25 2005
ProudlySA. What is…Proudly South African, http://www.proudlysa.co.za, 2005
Przasnyski, Z. H. and Tai, L. S. Stock Market reaction to Malcolm Baldrige Quality
Award announcements: Does quality pay?, Total Quality Management, Abingdon,
May 1999, Volume 10, Issue 3, pp.391-401
Pyzdek, T. Why Six Sigma is not TQM,
http://www.pyzdek.com/six_sigma_vs_tqm.htm, February 2001
Ray, C. The seven Cs of effective supplier evaluation, Purchasing and Supply
Management, Easton-on-the-Hill, April 1995, pp.44-45

Page 174
Reh, F. J. About – Management – Benchmarking. About Inc. New York Times
Company, http://management.about.com/cs/benchmarking/a/Benchmarking.htm,
Accessed 23 July 2005
Reimann, C. W. Winning Strategies for Quality Improvement, Business America,
March 25, 1991, pp. 8-11
Ross, S. A. and Westerfield, R. W. and Jordan, B. D. Fundamentals of Corporate
Finance, Third Edition, Richard D Irwin Inc, Chicago, 1995.
Ross, J. E. Total Quality Management, Text, Cases and Readings, Second Edition, St
Lucie Press, Florida, 1994
Roubini, N. Gross Domestic Product,
http://pages.stern.nyu.edu/~nroubini/bci/GDP.html, 2004
SABS, South African Bureau of Standards, Electro-technical/Service
http://www.sabs.co.za/index.aspx, Accessed 14 June 2006
SAEF, About SAEF, South African Excellence Foundation,
http://www.saef.co.za/asp/about/#saem, 2005
SARB, South African Reserve Bank – Interest Rates, http://www.reservebank.co.za/,
Accessed 14 April 2006
Seria, N. Economists expect no change in Interest Rates, Business Report,
http://www.busrep.co.za/index.php?fArticleId=3026571&fSectionId=606&fSetId=66
2, December 8 2005
Sila, I. The Influence of Contextual Variables on TQM Practices and TQM-
Organizational Performance Relationships, The Business Review, Cambridge,
Hollywood, Summer 2005, Volume 4, Issue 1, pp. 204-210

Page 175
Singhal, V. R. and Hendricks, K. B. The Long-Run Stock Price Performance of Firms
with Effective TQM Programs, Management Science, Volume 47, No 3, March 2001
pp.359-368
Singhal, V. R. and Hendricks, K. B. Does Implementing an Effective TQM Program
Actually Improve Operating Performance? Empirical Evidence from Firms That Have
Won Quality Awards, Management Science, Volume 43, No 9, September 1997 pp.
1258-1274
Singhal, V. R. and Hendricks, K. B. Don’t count TQM out, Quality Progress,
Milwaukee, April 1999, Volume 32, Issue 4, pp.35-43
Singhal, V. R. and Hendricks, K. B. Firm characteristics, total quality management,
and financial performance, Journal of Operations Management, 2001, Volume 19, pp.
269-285
Smit, P. J. and Cronje, G. D. J. Management Principles, A contemporary Edition for
Africa, 2nd Edition, Juta & Co Ltd, Kenwyn, 1999
Stat-A-Matrix, Six Sigma/TQM, SAM Stat-A-Matrix Frequently Asked Questions,
http://www2.statamatrix.com/sub1_six.cfm?n2=faq, Accessed 12 December 2005
StatsDirect, Statistical Software, http://www.statsdirect.com/, StatsDirect Ltd., 2005
StatsSA. Latest Key Indicators - GDP, Statistics South Africa
http://www.statssa.gov.za/keyindicators/keyindicators.asp, Accessed 20 March 2006
StatSoft, Multiple Regression, StatSoft Inc. http://www.statsoft.com/textbook/stmulreg.html, 2003
Stoller J. The IT Best Practices Revolution, CMA Management,
http://www.managementmag.com/index.cfm/ci_id/2364/la_id/1.htm, Accessed March
2006

Page 176
Stoner, J. A. F. and Werner, F. M. Managing Finance for Quality, Bottom-Line
Results from Top-Level Commitment, ASQC Quality Press, Milwaukee, Wisconsin,
1994
Stones, L. ICT Set for Growth – Mustek, Business Day, JSE SENS,
http://jsefin.hosted.inet.co.za/news/story/1939801, 5 September 2005
Sullivan, B. Subject: Stocks – Cyclical, The Investment – FAQ, http://invest-
faq.com/articles/stock-cyclicals.html, 1995
Tredway, G. BEE Deals in IT, Moneyweb Holdings Limited,
http://www.moneyweb.co.za/shares/ict_sector/378252.htm, 3 December 2003
Who Owns Whom, Mustek, Who Owns Whom Pty (Ltd),
http://www.africanstatistics.co.za/organisationprofile/870.html, 2003
Wiener, E. Umbrella keeps Sanlam dry, Moneyweb Holdings Limited,
http://www.moneyweb.co.za/shares/financial_services/379949.htm, 4 March 2004
Wikipedia:Alvin Toffler, Alvin Toffler, Wikipedia – the free encyclopaedia,
http://en.wikipedia.org/wiki/Alvin_Toffler, Accessed 22 February 2006
Wikipedia:COBIT, COBIT, Wikipedia – the free encyclopaedia,
http://en.wikipedia.org/wiki/COBIT, Accessed 4 May 2006
Wikipedia:Dot-Com, Dot-Com, Wikipedia – the free encyclopaedia,
http://en.wikipedia.org/wiki/Dot-com, Accessed 20 February 2006
Wikipedia:Inflation, Inflation, Wikipedia – the free encyclopaedia,
http://en.wikipedia.org/wiki/Inflation, Accessed 20 March 2006
Wikipedia:NEPAD, NEPAD E-School Program, Wikipedia – the free encyclopaedia
http://en.wikipedia.org/wiki/NEPAD_e-school_programme, Accessed 13 March 2006

Page 177
Wikipedia:Six Sigma, Six Sigma, Wikipedia – the free encyclopaedia,
http://en.wikipedia.org/wiki/Six_Sigma, Accessed 12 December 2005
Wikipedia:South Africa, Economy of South Africa, Wikipedia – the free
encyclopaedia, http://en.wikipedia.org/wiki/Economy_of_South_Africa, Accessed 14
April 2006
Yin, R. K. Case Study Research – Design and Methods, Sage Publications Ltd,
Beverley Hills, 1984
Yusof, S. M. and Aspinwall, E. M. Critical success factors in small and medium
enterprises: Survey Results, Total Quality Management, Abingdon, July 2000,
Volume 11, Issue 4-6, pp. S448-S463
Zeithaml, V. A. and Parasuraman, A. and Berry, L. L. Delivering Service Quality,
Balancing Customer Perceptions and Expectations, The Free Press, New York, 1990
Page 178
Appendix A: The Economy and Industry
The current economic environment in South Africa may be an important factor to
consider in the study bearing in mind that economical conditions may affect growth
and financial conditions of businesses. The study focuses on the year in which the
work is done – 2005/2006.
The appendix first provides an economic analysis. It then describes why the
information technology (IT) sector is chosen. Political and legal influences on IT
organisations are discussed subsequently.
1.1. Economic Analysis
1.1.1. Interest Rates, Gross Domestic Profit (GDP), and Inflation
Changes in real interest rates affect the public's demand for goods and services mainly
by altering borrowing costs, the availability of bank loans, the wealth of households,
and foreign exchange rates (FED, 2005). A decrease in real interest rates lowers the
cost of borrowing that leads businesses to increase investment spending. Low interest
rates fuel the economy, are the driving force behind the country’s improved GDP
growth, and improve sentiment. South Africa is currently enjoying the lowest interest
rate – 10.50% - in the last 24 years (Seria, 2005). This is spurring growth in South
Africa as can be seen by the overall increase in the JSE, approximately 40% in 2005.
An increase in interest rates may dampen the current growth of certain sectors in the
country (Roubini, 2004).
Roubini (2004) believes that the GDP represents a broad measure of economic
activity and signals the direction of overall aggregate economic activity. At present,
real GDP values in SA indicate a growth of approximately 4.4% year on year
(StatsSA, 2006). GDP is also pro-cyclical i.e. as GDP increases cyclical stocks
increase and IT organisations are cyclical in nature (Goodspeed, 2004, p.19). Sullivan
(1995) defines cyclical stocks as the stocks of those organisations whose earnings are
Page 179
strongly tied to the business cycle (alternating rises and declines in the level of
economic activity, which can extend over several years). This means that the prices of
the stocks move up sharply when the economy turns up, move down sharply when the
economy turns down. Durables such as cars, fridges, and computers are cyclical in
nature because their purchases can be delayed. Since September 1999, South Africa’s
economy has been in an upward phase (McConnell and Blue, 2005), an encouraging
environment for the IT sector.
Inflation is the rise in the general level of prices (Wikipedia:Inflation, 2006). Since
September 2003 the inflation rate has remained consistently within the target range of
3% to 6% average per annum, currently (April 2006) at 4.5% (SARB, 2006).
Inflation, GDP, and interest rates are linked together. An analysis of the economy of
South Africa (Wikipedia:South Africa, 2006) revealed that success in keeping
inflation at bay gave the government room to drastically bring down interest rates.
During 2003 alone interest rates were cut by 550 basis points, while between 2002
and 2006 interest rates were cut by a total 650 basis points. The cut in interest rates
saw consumer spending rise, the construction sector boom and the sale of new
vehicles reach record levels. This in turn generated much needed GDP growth. IT
sector can be affected by future GDP figures, interest rates, and inflation. Future GDP
figures can alter (Roubini, 2004):
• Interest Rates: Unexpectedly high quarterly GDP growth is perceived to be
potentially inflationary if the economy is close to full capacity and would
cause interest rates to rise.
• Stock Prices: Ambiguous. On one side, higher than expected growth leads to
higher profits, this benefits IT. On the other, it may increase expected inflation
and lead to higher interest rates adversely affecting IT organisations.
• Exchange Rates: Larger than expected GDP growth tends to appreciate the
exchange rate following expected hikes in interest rates.
To illustrate the current growth rate with respect to IT, Monteiro (21 July 2005)
discovered that South Africans (organisations and individuals) are buying more
computers and laptops (notebooks), in line with international trends. International

Page 180
research house Gartner says that worldwide computer shipments increased by 14,8%,
or 48,9m units in the three months to June 2005 when compared with the same period
in 2004, exceeding projections by two percentage points. Computer and notebook
retailers say increases in South Africa over the same period outstrip the global
average (Monteiro, 21 July 2005). The IT industry can currently take advantage of
this positive state of affairs.
1.1.2. Exchange Rate
Anderson (2004) found that hardware components are sourced internationally (mainly
in the East) in Dollar terms and sold locally in Rand. Exchange rate decisions are
crucial to IT organisations dealing in hardware. As the Rand weakens, buying power
internationally decreases because purchasing hardware internationally becomes more
expensive. This is followed by increases in the prices of hardware in SA reducing the
organisations’ profit margin.
Hedging instruments are used by some organisations in the IT industry to control
exchange rate exposure (Kruger, 2005). The Rand is relatively stable at the moment
indicating good underlying economical fundamentals having been put in place by the
relevant government authorities (I-Net, 2005).
1.1.3. US Economy
Kruger (2005) stated and Coetzee (2005) confirmed that the US economy affects the
South African economy and industries. When the Federal Reserve increases interest
rates the US stock markets are affected and, as a result, the JSE as well. This is
especially true of the NASDAQ stock exchange (USA) and IT sector (JSE). A crash
in the NASDAQ could lead to a crash in the local IT sector (Kruger, 2005; Coetzee,
2005).

Page 181
1.2. Industry Selection
A specific sector (industry) is chosen to eliminate as many external and environmental
factors as possible. Complications can be added by uncontrollable environmental
factors such as general economic conditions, technology, public policies and laws,
political environment, competition, and social and cultural changes. Owing to that, the
study opts for organisations that operate in the same economic, technical, political and
legal environment. The organisations in the same sector and industry are influenced
relatively in the same way to external forces and this limits the amount of varying
variables between organisations. If the economy stimulates growth in a certain sector,
most organisations in that sector benefit in the same way. These organisations also
have similar aims and procedures with regards to operations and TQM and can hence
be compared on a more equal level.
An ideal sector selected is the one that:
1. is not overly complex in terms of structure (functional vs. divisional), e.g. Spar
vs. Altech;
2. contains a sufficient number of organisations to have an adequate sample size,
e.g. Telecommunication Services (three organisations listed) vs. Banks
(twelve organisations listed);
3. carries the researcher’s interest, e.g. Health (not interested) vs. Engineering
(interested);
4. is fully understood by the researcher – this is an important element in
understanding and formulating the background of the problem (Malhotra,
1999, p.42).
5. deals with products and processes fully understood by the researcher, e.g.
Chemicals (no knowledge of chemicals) vs. Software and Computer Services
(extensive knowledge of both);
6. promises sufficient accessibility in terms of the location, e.g. Resources (all
across South Africa) vs. Information Technology (businesses located mostly in
Johannesburg);
7. is influenced more by internal economic conditions as opposed to
external/foreign economic conditions, e.g. Resources or Retail (influenced by

Page 182
currency fluctuations) vs. Information Technology or General Industrials
(more sensitive to internal economic fluctuations); and
8. consists of organisations dealing directly with customers as opposed to the one
where it is not required (the first group may be, presumably, more interested in
TQM incorporation), e.g. Resources (business interaction) vs. Cyclical
Services (dependant on customer interaction).
The information technology sector is the industry of choice. It suits all the above
points. Information technology can be further sub-divided into “Information
Technology Hardware” and “Software and Computer Services”. Both of these sub-
sectors are included making a total of 24 organisations that can be investigated.
1.3. Industry Analysis
This section considers what is happening in and what external factors could influence
the IT industry. These factors are discussed because they could shift the results of the
TQM results. The main occurrences in SA that impact organisations and are touched
on in detail are black economic empowerment, corporate governance, NEPAD, and
new legislation.
Other factors not touched on in detail that could have a positive influence on the IT
market include: a boom in both Internet and e-commerce applications, increased
demand from the home-user market as computer literacy increases, strong economic
outlook, the easing of supply and demand issues, the convergence of computers and
mobile technology, demand for home entertainment systems, the continued
proliferation of cheap PCs, and entry level criteria keep increasing, thus driving the
replacement market demand i.e. replacing technology infrastructure in businesses
(Who Owns Whom, 2003; Stones, 2005).

Page 183
1.3.1. Government Influences
1.3.1.1. Black Economic Empowerment (BEE)
Alexander (2003) describes black economic empowerment as a government strategy
to redress the imbalances in South African society created by apartheid, and an
integral part of South Africa's transformation process, encouraging the redistribution
of wealth and opportunities to previously disadvantaged communities and individuals,
including blacks, women and people with disabilities. The empowerment process has
been identified as crucial to the future viability of the country's economy (Alexander,
2003). A black empowered organisation is one that is at least 25.1% owned by black
persons and where there is substantial management control. Ownership refers to
economic interests, while management refers to executive directors. This is whether
black enterprise has control or not (Alexander, 2003).
Increasingly, foreign and local organisations are seeking BEE partners to establish
working relationships or joint ventures, thereby securing state approval for
government contracts. A BEE partner may add extra points in a tender (Alexander,
2003). Because of this McLeod (2005) believes there have been dramatic changes in
SA's information and communications technology (ICT) sector in the past year.
Organisations in the sector concluded some of the more notable BEE transactions of
2005 (McLeod, 2005). As an example, Mustek made the biggest of the IT BEE
announcements of 2003 selling a 25% share in itself to Safika Holdings for an
estimated R224m. As part of the arrangement, Safika’s CEO, Vuli Cuba, became a
deputy chairman of Mustek (Tredway, 2003). Since then Mustek has continued the
BEE initiative strongly especially in terms of training (skills development) blue-collar
workforce and promoting advancement in the workplace. Management feels that this
is much more of a sustainable approach then just bringing in black holding
organisations as this does nothing for the average black worker (Kruger, 2005). Since
the initial move in 2003, Mustek is now SA’s third top empowered IT organisation,
according to McLeod (2005), this is impressive, considering that it did not make the
top 20 in 2004. The BEE drives undertaken by Mustek helps secure business deals
with other private organisations and the government (Kruger, 2005).

Page 184
1.3.1.2. King Report on Corporate Governance
Dekker (2006) describes that the King Report (King I and King II) represents a code
of corporate practices and conduct aimed at promoting the highest standards of
corporate governance in South Africa. The newly revised King II acknowledges that
there is a move away from the single bottom line (that is, profit for shareholders) to a
triple bottom line, which embraces the economic, environmental and social aspects of
an organisation’s activities. The report discusses: directors and their responsibilities;
risk management; internal audits; integrated sustainability reporting; accounting and
auditing principles; and compliance and enforcement issues. Information in all these
is reported in the annual statements of listed organisations (Dekker, 2006).
Economically, the King II report sets new minimum standards that should be adhered
to. To keep up with leaders in the industry, organisations must commit to following
the report as the new way of a running a business. The financial impact of such is that
it does cost money to implement these new procedures and hence decrease profits, but
since it has become a new standard, all organisations should be implementing the new
procedures (Wiener, 2004). Organisations should take the report seriously because
those that fall behind and do not implement the code correctly may suffer the loss of
new contracts with other organisations, hence losing profits and endangering the
existence of the organisation in the long run.
By realising that transparency ultimately is the correct way to go, organisations may
prosper as less bad publicity is received and its customer base may increase. By
having both good corporate governance and ethics in place, the retention of current
customers and an increase in new customers is ensured.
1.3.1.3. Government and Information Technology
According to a new report by research house BMI-TechKnowledge (or BMI-T),
government is increasing the amount of money it spends on IT, primarily to improve
and initiate e-government projects. This increased spending will focus on a number of
projects to implement technology to simplify government processes. These include

Page 185
initiatives such as the development of an integrated justice system, which will
streamline the justice process, reduce backlogs of cases and improve safety for all
citizens. IT will be used to improve processes, to drive down costs, reduce errors and
save time and effort (Candy, March 2005).
BMI-T expects government IT spending to increase to R6,5-bn by 2007/2008, from
R4,8-bn during the 2003/2004 period. And, the big winners in this increased spending
will most probably be BEE organisations, in partnership with some of the larger, more
established IT organisations. Government is starting to recognise the local IT
organisations that may be used in the projects (Candy, March 2005).
1.3.1.4. Legislation
A recent legislative change has seen the removal of the restriction on Voice-Over-IP
transmission (Emerick, 2004). Stones (2005) believes that this should increase the
take-up of PCs. Internet service providers can now carry voice calls over their data
networks, letting people make international phone calls via PCs. The removal of the
Voice-Over-IP restriction means all manner of technical cost-savings. The cost of
international calls is expected to drop considerably, as organisations lease bandwidth
from their network suppliers rather than pay for call time. In fact, telephone
organisations are becoming more like network service organisations using computers
to communicate as opposed to the telephone infrastructure (Stones, 2005).
1.3.2. Proudly South Africa
The Proudly South African initiative is a campaign to promote South African
organisations, products and services that are helping to create jobs and economic
growth in the country. The organisation states that organisations who meet the
standards set by Proudly South African can use the logo to identify themselves, their
products and services. Supported by organised labour, organised business,
government and community organisations, Proudly South African is thought highly of
(ProudlySA, 2005).

Page 186
Stones (2005) states that organisations are required to show their support for locally
produced goods and to buy from empowered suppliers. There is belief that there
would be more demand for IT organisations being Proudly South African (Stones,
September 2005).
1.3.3. New Partnership for Africa’s Development (NEPAD)
New Partnership for Africa's Development is an economic development programme
of the African Union. NEPAD has embarked upon an "e-schools" programme to
equip 600,000 primary and secondary schools in Africa with IT equipment and
internet access within 10 years (Wikipedia:NEPAD, 2006). Kaplan (2005) and
Coetzee (2005) hope that instead of using international organisations like DELL and
HP improving their name and expertise, governments and private organisations might
use African organisations such as Mustek and Pinnacle increasing their growth. In
addition, employment of the locals from each relevant country will promote growth,
education, and wealth.

Page 187
Appendix B: Forms of Business Organisations
Four different legal forms of business organisation are most widely used – sole
proprietorship, partnership, close corporation, and organisation. Goodspeed (2004)
states that generally sole traders and partnerships constitute the majority of the
businesses in the private sector of an economy, however, limited organisations
account for the largest part of economic activity. Limited organisations differ from
sole traders and partnerships in that ownership and management of the business are
separated. Ownership is in the hands of shareholders that have the right to appoint the
board of directors. Directors select the managers of the organisation to run the
business in the best interests of the shareholders. The goal of the managers is to
increase shareholders’ wealth i.e. increase the current value per share of the existing
shares (Firer et al, 2004, p.10). The directors have to report to shareholders at least
annually on the performance of the managers. Two important types of limited
organisations are (Goodspeed, 2004, p.5):
• Private limited organisations – the shares of private limited organisations
cannot be sold on the stock exchange without the approval of other
shareholders and without first offering them to existing shareholders.
• Public limited organisations – the shares of public limited organisations are
listed (quoted) on and sold to the general public via stock exchanges.
The latter are the type of organisations that are investigated in this research. These
organisations are more prone to implement TQM to gain a competitive advantage and
increase market share in both the domestic and international markets. Any reference
to organisations, businesses, etc. in this study implies that they are public limited
organisations.

Page 188
Appendix C: Theories of Total Quality Management
This appendix examines the origins of TQM discussing the theories developed and
put forward by the founders of the quality movement - W. Edwards Deming, Joseph
M. Juran, Armand V. Feigenbaum, and Philip Crosby.
1.1. W. Edwards Deming
Deming is one of the early pioneers of the quality movement having been credited
with popularising quality control in Japan in the early 1950s. He is best known for
developing a system of statistical quality control, although his contribution goes
substantially beyond those techniques. Statistical quality control (SQC) is a branch of
TQM based on statistical methods.
Deming (1982) identifies two types of variations within organisations known as
“common causes” and “special causes”. While common causes are inherent in the
process special causes are not, and these special causes need to be identified. He
views statistics as a management tool and relies on statistical process control (SPC) as
a means of managing variations in a process (Ross, 1994, p.4; Bicheno, 1991, p.5).
Deming’s (1982, p.16) well-known “14-point” plan outlines the responsibilities of
management. He believes that management must lead quality and stresses that no
point can be executed without the management’s force. The fourteen points apply to
all organisations, from small to large, and from service to manufacturing. They are
summarised as follows (Deming, 1982, pp.16-49):
1. Create consistent message about quality, throughout the organisation for
improvement of product and service.
2. Adopt the new philosophy of quality that requires a commitment to improve
quality continuously and customer expectations increase.
3. Switch from defect detection (mass inspection) to defect prevention. Rather
inspect the process than the end product.

Page 189
4. End the practice of choosing suppliers based solely on price, move towards
quality of product, reliability of delivery, and willingness to cooperate and
improve.
5. Constantly and forever improve the system of production and service. Identify
problems, minimise variations and work continuously to improve the system.
The system is not confined to products and their direct processes, but to all
supporting services and activities.
6. Adopt modern methods of training on the job. Let employees understand the
concept of variation, statistical process control, improvement, and the total
approach to quality.
7. Institute modern methods of supervision. Change the focus from quantity to
quality. This implies a change from chasing to coaching and support.
8. Drive out fear. Management must create the environment that removes all
possibility that improvement in quality will somehow penalise operators,
through more work, loss of jobs, financial loss, or whatever.
9. Break down barriers between staff areas. This implies the removal of any
organisational barrier that prevents quality improvement. This means
improved visibility between sections and easier communications.
10. Eliminate numerical goals for the work force. Stop requesting improved
productivity and unrealistic targets without providing methods to achieve it
and don’t have silly slogans that mean nothing.
11. Eliminate work standards and numerical quotas. This is in regards to natural
variation in processes. It implies no standard can be exact so employees
should not be penalised or rewarded for quotas beyond their control.
12. Remove barriers that hinder the hourly worker and focus more on pride of
workmanship. These barriers might include unrealistic quotas and time
pressure, short-term requirements for profit rather than quality, lack of
investment in the right machines or tools, individual investment schemes
based on output rather than group based schemes based on quality and
improvement, and lack of management or consistency.
13. Institute a vigorous programme of education and training. Education must be
widely based and continuing.

Page 190
14. Create a structure in top management that will push every day on the above 13
points. This point stresses the continual nature of quality management and its
long-term philosophy.
Deming developed what is known as the Deming chain reaction; as quality improves,
costs will decrease and productivity will increase, resulting in more jobs, greater
market share, and long-term survival. Improvement of the processes increases
uniformity of output of the product, reduces rework and mistakes, reduced waste of
manpower, machine-time, and materials and thus increases output with less effort.
Other benefits of improved quality are lower costs, better competitive position, and
happier people on the job (Deming, 1982, p.1).
Deming’s argument is that competitiveness depends upon customer satisfaction. He
believes customer satisfaction is created through meeting customer expectations, and
continuous improvement of products or services. Quality is a fundamental customer
requirement. It is determined not by forcing employees to work harder but by the
system. The system is defined as inputs, and the manner in which these are processed.
1.2. Joseph M. Juran
Like Deming, Dr. Joseph Juran is given credit for developing Japanese quality in the
1950s. Perhaps the best-known Juran concepts are his definitions of quality, the
concepts of “breakthrough”, “internal customer”, and the “quality trilogy”. Juran, like
Deming, also introduced statistical quality control (SQC) in Japan after World War II.
As SQC caught on and became more popular, Japanese organisations incorporated it
into a wider range of activities and developed it further. They created systems in
which exclusive responsibility for quality was taken away from management and staff
and replaced with organisation-wide, comprehensive TQM programmes in which
every employee had a role (Ozeki, 1990, p.3).
Juran concentrates more on product satisfaction and hence customer satisfaction, and
product dissatisfaction and hence customer dissatisfaction. He defines a product as the
output of any process. Customer satisfaction is a result achieved when product

Page 191
features respond to customer needs and product deficiencies are in all cases sources of
customer dissatisfaction (Juran, 1992, p.7). Product satisfaction has its origin in
product features and is why clients purchase the product. Product dissatisfaction has
its origin in non-conformances and is why customers complain. He further states that
a customer is anyone who is impacted by the product or process and differentiates
between internal and external customers. Therefore, products can be for internal or
external customers (Juran, 1992, p.8). He defines each as:
• External Customers – these are impacted by the product but are not members
of the organisation that produces the product. External customers include
clients who buy the product, government regulatory bodies, and the public.
• Internal Customers – they are impacted by the product, and are also members
of the organisation that produces the product.
There are now two dimensions of quality, an external one concerned with matching
customer requirements, and an internal one concerned with building the product or
service correctly. Quality begins with a close understanding of who the users will be
and how and where the product will be used. Without this customer orientation, good
quality, he believes, is not possible.
The Juran trilogy are three processes used for the managing of quality. It uses the
theory of the three managerial processes for financial management - financial
planning, financial control, and financial improvement. Now the names change to
(Juran, 1992, pp.14-15):
• Quality Planning – the activity of developing the products and processes
required to meet customers’ needs. It involves a series of universal steps
(Juran, 1992, pp.27-274):
o Establish Quality Goals
o Identify the Customers
o Determine Customer Needs
o Develop Product Features
o Develop Process Features
o Develop Process Controls

Page 192
• Quality Control – this consists of evaluating actual quality performance,
comparing actual performance to quality goals and acting on the difference,
i.e. the execution of plans.
• Quality Improvement – this process is the means of raising quality
performance to unprecedented levels (“breakthrough”). It involves
organisation infrastructure for quality, identifying specific needs for
improvement, and providing the resources, motivation, and training for quality
teams.
Juran (1992) believes good quality management requires the quality actions to be
planned out, improved, and controlled. The process, consequently, can be seen as
achieving control at one level of quality performance, then planning to be better and
eventually achieving “breakthrough” to an improved level, and then once again
controlling at the new level. It is a continuous process.
Juran (1992, p.40) emphasises that quality is not just a concern of production or even
of total quality within an organisation, but extends further into the linkage between
organisations, and includes all service organisation and operations. He terms this “Big
Q” to realise the bigger effect of quality within organisations.
1.3. Armand V. Feigenbaum
Armand Feigenbaum, an American engineer, was the originator of “Total Quality
Control”, now often referred to simply as total quality. In the 1950s, he defined
quality as (Feigenbaum, 1991, p.6):
“Total quality control is an effective system for integrating the quality
development, quality maintenance, and quality improvement efforts to the various
groups in an organisation so as to enable production and service at the most
economical levels which allow full customer satisfaction”
Feigenbaum (1991) concentrates more on managerial and technical leadership to
bring about total control. He does have similar views as Juran with regards to

Page 193
customer satisfaction (Feigenbaum, 1991, pp.7-9). He believes that the production
cycle starts and ends with the customer, but in between many people and functions
must play a role; in fact everyone has a role and the responsibility must be shared.
Feigenbaum sees the quality professionals playing a central role and coordinating the
entire process.
Feigenbaum (1991, p.11) referred to the “industrial cycle” which is the ongoing
sequence of activities necessary to bring products from concept to market. Included in
this cycle are marketing, design, purchasing, manufacturing engineering,
manufacturing supervision and shop operations (production), inspection, shipping,
and installation and service. As one moves through the cycle, there are requirements
to be met at each stage, and these different requirements must be defined and
communicated. This is where the quality professionals have a prime role. The total
cost of quality (or non quality) accumulates through all these stages, and a total view
of quality being managed through all the stages will lead to a lower overall cost.
Although Feigenbaum (1991) stresses the importance of top management in relation
to quality, he does understand that effective human relations are basic to quality
control. Total quality control provides the fundamental basis of positive quality
motivation for all organisation employees and representatives, from top management
through assembly workers, office personnel, dealers, and service people. A major
feature of this activity is its positive effect in building up employee responsibility for,
and interest in, product quality. In the final analysis of a product, it is a pair of human
hands that performs the important operations affecting product quality. It is of utmost
importance to successful quality-control work that these hands be guided in a skilled,
conscientious, and quality-minded fashion (Feigenbaum, 1991, p.6).
Feigenbaum (1991, p.78) believes in a more linked organisational structure. The
systems approach to quality begins with the basic principle of total quality control that
customer satisfaction cannot be achieved by concentrating upon any one area of the
organisation alone. Its achievement depends, instead, both upon how well and how
thoroughly these quality actions in the several areas of the business work individually
and upon how well and how thoroughly they work together. He goes on to state that a
modern total quality system must be structured and maintained so that all key

Page 194
activities-quality equipment, work force, information flow, standards, controls, and
similar major activities-must be established not only for their own effectiveness but
for their interrelated impact on total quality effectiveness (Feigenbaum, 1991, pp.81-
82). Feigenbaum identifies statistical and engineering methods for the modern total
quality system.
For the achievement of total quality systems, the major field of systems engineering
and systems management has been adapted and applied to the particular needs of
modern quality control. It is now a centre point of effective quality engineering.
Quality management directed the development and on-going leadership of a strong,
integrated-rather that fragmented-quality system which operates with economy,
efficiency, and enthusiastic support throughout the entire organisation and plant wide
organisation (Feigenbaum, 1991, p.84). This is Feigenbaum’s approach to a modern
total quality control system. He lists various techniques in his book Total Quality
Control (1991) for the employees of an organisation to implement their individual
responsibilities towards quality improvement.
In conclusion, Feigenbaum’s (1991, pp.106-107) views on recognising an effective
system quality system can be identified by twelve fundamental areas:
1. It controls quality on an integrated, organisation-wide basis that begins with
the marketing conception and ends with customer satisfaction.
2. It provides for primary quality decision-making ties with upper management.
3. It fosters a sufficient budgetary base and technical competence to permit
preventive effort rather than corrective effort.
4. It establishes quality control as a set of disciplines to be applied throughout the
business.
5. It builds in quality control’s coupling with customers on a positive feed
forward basis providing a great deal of data about customer-use requirements
before production.
6. It clearly structures and reports quality costs.
7. It makes quality motivation a continuous process.
8. It structures a unique technological contribution to the business through
quality and reliability engineering work.

Page 195
9. It provides for continuously measuring and monitoring actual customer quality
satisfaction.
10. It provides good product service rapidly and economically.
11. It integrates product-safety and product-liability-control considerations with
all aspects of the quality programme.
12. It adds a major, organisation wide work scope to the quality function. This
makes quality control the technical and managerial extension of the general
management of the organisation into the quality field.
1.4. Philip Crosby
The ideas of Philip B. Crosby are contained in his books Quality is Free (1979) and
Quality without Tears (1984). Crosby (1984) believes quality must be made clear
throughout the organisation and management play a key role in introducing quality.
Quality must be integrated into the culture of the organisation (Crosby, 1984, p.10). A
quality policy must be presented and followed and understood and communicated
within the organisation. This is critical in an organisation and is no good just
introducing tools to monitor quality.
In Crosby’s mind there exist four absolutes of quality management.
The First Absolute – The Definition of Quality is Conformance to Requirements
The first absolute is implemented to improve quality and eliminate hassle at the same
time. Crosby (1984, p.59) considers that quality improvement is built on getting
everyone to do it right the first time (DIRFT). DIRFT is getting requirements clearly
understood and then not putting things in people’s way. Management has three basic
tasks to perform for this:
• establish the requirements that employees are to meet;
• supply the wherewithal that the employees need to meet those
requirements; and
• spend all its time encouraging and helping the employees to meet those
requirements.

Page 196
When it is clear that management policy is DIRFT, then all employees will be DIRFT
and will take requirements as seriously as the management does. Crosby (1984, p. 64)
strongly believes that quality has to be defined as conformance to requirements, not as
goodness. Crosby (1984, pp.6-7) states:
“An organisation can be vaccinated against non-conformance. It can be
provided with antibodies that will prevent hassle…antibodies must be built
into a management style that operates the organisation. The knowledge that
they exist has to extend throughout the organisation. This extension serves to
help those who make decisions (and every employee makes decisions) to keep
from causing problems of quality.”
All non-conformances are caused. Anything that is caused can be prevented. The
organisation that wishes to avoid internal hassle, eliminate non-conformance, save
itself a bundle of money, and keep its customers happy must be “vaccinated”. To
prepare the vaccine, certain key ingredients need to be combined. To administer it
continually, the corporate body requires a strategy that requires three distinct
management actions (Crosby, 1984, p.7):
• Determination – Management realises that their action is the only tool that will
change the profile of the organisation.
• Education – Process of helping employees have a common language of
quality.
• Implementation – Guiding the flow of improvement, this process never
becomes complete.
The Second Absolute – The System of Quality is Prevention
The most visible of the expenses of conventional quality practice lies in the area of
appraisal (Crosby, 1984, p.66). Appraisal is inspection or testing of the product. The
problem with it is that it is always done after the fact i.e. after the error has occurred.
Crosby (1984, pp.66-73) believes the system for quality is prevention, not appraisal.

Page 197
Processes must be analysed and fixed so that the errors in the production process are
not transpired onto the product/service.
Crosby (1984) maintains that the secret of prevention is to look at the process and
identify opportunities for error. These can be controlled. Each product or service
contains many components, each of which has to be dealt with to eliminate the cause
of the problems (Crosby, 1984, p.68). Quality systems and processes must be built
into the different activities so that errors occur less and less till at an absolute
minimum.
Crosby (1984) believes it is management’s responsibility to set up parameters guiding
the plans to prevent errors and aligning quality throughout the organisation.
The Third Absolute – The Performance Standard is Zero Defects
Setting requirements is a process that is readily understood, but the need for meeting
those requirements each and every time not so (Crosby, 1984, p.74).
Crosby (1984, pp.74-84) believes that every action of every step in manufacturing of
a product/service has to be done properly as planned to make everything come out
right that is, the job must be done right the first time.
Mistakes are caused by either lack of knowledge or lack of attention (Crosby, 1984,
p.83). Both can be mended leading to a state of zero defects, which should be the
management performance standard. The concept of zero defects is not impossible if
processes are examined and corrected individually and not as a whole.
The Fourth Absolute – The Measurement of Quality Is the Price of Non-
Conformance
Quality is never looked at in financial terms the way everything else is; it is always
thought of in some relative fashion, as in degree of goodness (Crosby, 1984, p.85).
Quality needs to be measured against cost and the cost of quality can be divided into
two areas:

Page 198
1. The price of non-conformance – expenses involved in doing something wrong,
e.g. corrections and warranty cover.
2. The price of conformance – what is necessary to spend to make things come
out right, e.g. prevention efforts and quality education.
These prices can then be used to monitor the progress of the organisation if improving
or as a basis for finding out where the most lucrative corrective-action opportunities
reside (Crosby, 1984, p.86).
Crosby (1984, p.99) believes there is one path to quality as he states:
“That is the road we have to lay out – the path of our journey. It is made up of
fourteen things that we have to do something about in a certain order. Then we lie
out the same fourteen blocks again and keep building. The blocks get more
familiar and comfortable as we repeat, but they provide the foundation forever.”
His fourteen steps for quality improvement are as follows (Ross, 1994, pp.6-7):
1. Management commitment – communicate need for quality to entire
organisation.
2. Quality improvement team – for a team to oversee improvements.
3. Quality measurement – establish measurements appropriate to every activity.
4. Cost of quality – estimate costs of quality to identify areas for improvement.
5. Quality awareness – raise quality awareness among employees.
6. Corrective action – take corrective action as a result of steps 3 and 4.
7. Zero defect planning – for a committee to plan a programme appropriate to the
organisation and its culture.
8. Supervisor training and employee education – all levels must be trained in
how to implement their part of the quality improvement programme.
9. Zero defect day – schedule a day to signal to employees the organisation’s
new standard.
10. Goal setting – individuals must establish improvement goals.
11. Error-cause removal – employees should be encouraged to inform
management of any problems.

Page 199
12. Recognition – give public, non-financial appreciation to those who meet their
quality goals or perform outstandingly.
13. Quality councils – composed of quality professionals, councils should meet
often to share experiences, problems, and ideas.
14. Do it over again – continuous quality improvement.

Page 200
Appendix D: Managing Quality in Service Organisations
As with manufactured products, the key to quality in service delivery is customer
satisfaction. In service delivery, customer satisfaction means fulfilling expectations
which, according to Drummond (1992, p.99-108), denotes:
• Identifying important determinants of quality – many variables affect
perceptions of service quality; the best thing to do is to find out what matters,
and concentrate upon providing it.
• Managing customer expectations – if expectations are too high, the customer
will always be disappointed, so management must learn to undersell rather
than to oversell; this way expectation is managed.
• Managing impressions of product quality and service quality – service
delivery is like a “theatrical performance” and that staff must act the part.
Customers form conclusions on impressions of the organisation based on the
impressions of the staff and must be managed not to shock or disappoint
consumers, e.g. pension plans are best presented by older employees as
opposed to the young, since dealing with people closer to retirement.
• Customer education – education can be used to create interest and is a subtle
and relatively inexpensive means of drawing attention to services.
• Developing reliable support systems – technology should be designed to
facilitate quality service.
• Soliciting feedback – the absence of complaints does not necessarily imply
satisfaction as customers can vow never to return, so the organisation must
take the initiative and solicit feedback.
• Concentrating on time - time is a powerful weapon, management must
concentrate not only on doing things right, but doings things quickly.
Customers appreciate this and return.
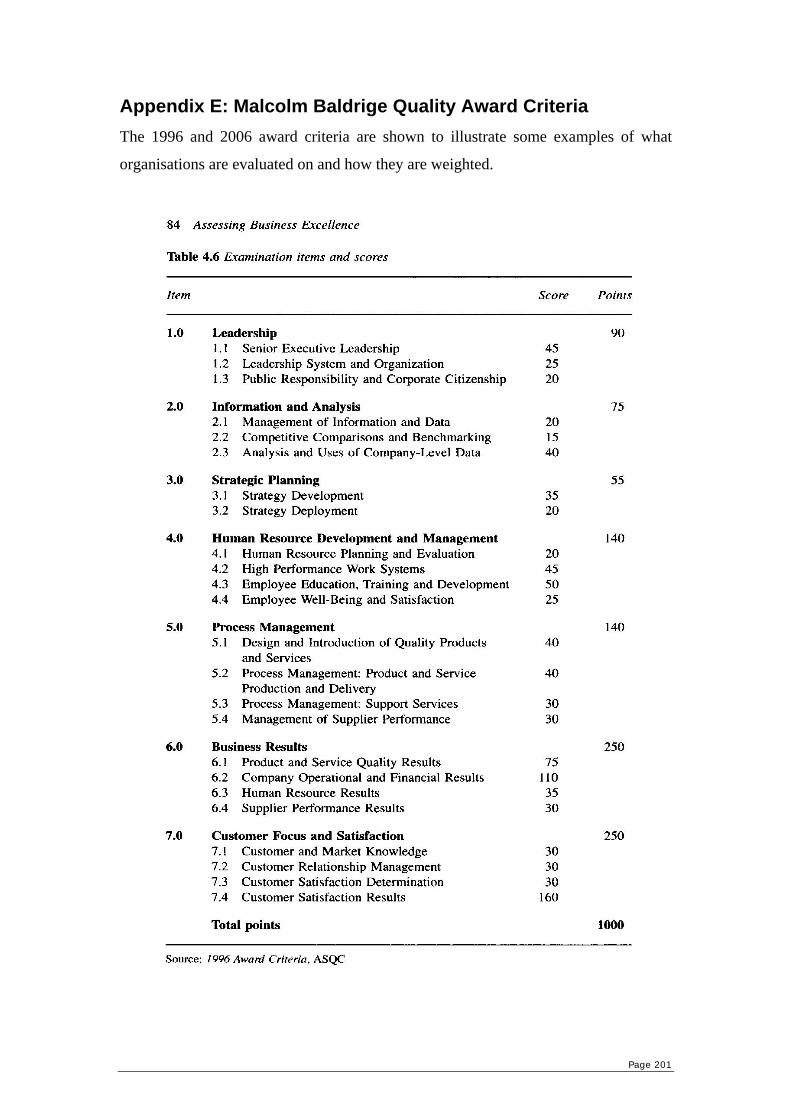
Page 201
Appendix E: Malcolm Baldrige Quality Award Criteria The 1996 and 2006 award criteria are shown to illustrate some examples of what
organisations are evaluated on and how they are weighted.

Page 202

Page 203
Appendix F: Investors in People (IiP)
Over the past 12 years independent research in the UK has consistently shown that the
Investors in People standard provides real business benefits to organisations of all
sizes and across all sectors. The practical benefits of working towards and achieving
the standard include (Bankseta, 2005):
• Improved earnings, productivity and profitability - Skilled and motivated
people work harder and better, improving productivity.
• Customer satisfaction - IiP is central to helping employees become customer-
focused thus enabling the organisation to effectively meet customer needs.
• Improved motivation - Through greater involvement, personal development
and recognition of achievement, motivation is improved. This leads to higher
morale, improved retention rates, reduced absenteeism, readier acceptance of
change and identification with the organisation beyond the confines of the job.
• Reduced costs and wastage - Skilled and motivated people constantly examine
their work to contribute towards reducing costs and wastage.
• Enhanced quality - Investing in people significantly improves the results of
quality programmes. Investors in People add considerable value to The
Excellence Model, ISO 9000, TQM and other quality management initiatives.
• Competitive advantage through improved performance - IiP organisations
develop a competitive edge.
• Public recognition - IiP status brings public recognition for real achievements
measured against a rigorous national standard. Being an IiP helps to attract the
best quality job applicants. It may also provide a reason for customers to
choose specific goods and services.

Page 204
Appendix G: Various IT Quality Entities This appendix highlights various IT quality management entities. These were adapted
from a provider of IT service management training and mentoring (Melliar, 2004). It
shows key aspects of each entity summarising what the entity is, its objective, and the
potential outcome of each.
Category Entity What is it? Objective Outcome Foundation ITIL Best practice guidance Assists IT organisations Provides an organisation Processes for the Support and on how to plan and setup with a solid foundation Delivery of IT Services. policies and from which to manage processes to manage the IT Services. end-to-end delivery and support of IT services. Improvement Six Sigma A statistical process To streamline processes Potential reduction in Methodology improvement by making them more the number of defects methodology focussing efficient and effective. within process driven on quality from a Assists in the activities. Best applied customer/user identification of defects to processes that are viewpoint. in processes and assists already defined and in solving the various being managed. problems. Also assists in the creation of process to eliminate the amount of re-work required following implementation. Measurement CMMI A Capability Maturity The objectives are Provides a sound System Model for IT twofold. The first is to process maturity model organisations that enable IT organisations that IT organisations can provide IT services. to assess their use to measure and Based on the Software capabilities regarding improve the IT services development CMM (Now the delivery and support supplied to CMMI). of IT Services using a customers/users. five level process maturity scale. Secondly it provides IT organisations with directions on what processes require improvement to enhance the organisations IT service capability. Quality BS15000 The first formal IT To externally certify IT Organisations become Initiative Service Management organisations as formally BS15000 standard. A set of BS15000 compliant, certified, assists with ISO minimum requirements providing organisations accreditation and proves against which an with proof that they are commitment to IT organisations IT Service practicing best practice Service Management Management processes IT Service Management. Quality. can be assessed. Aligned to ITIL.

Page 205
Governance COBIT An audit focussed set of IT Governance Checklist. Provides an organisation guidelines for IT Focus mainly on what with a sound IT audit processes, practices and should be in place within tool from which to controls. a well managed IT identify what processes organisation. should be in place within an IT organisation. Quality EFQM EFQM provides a good Provides organisations A high maturity level Initiative model for those wishing with a structured model gained within Europe is European to achieve business and detailed assessments seen as a distinct Foundation excellence in a programme geared towards climbing a business advantage and a for Quality of continual 5 scale organisation commendable Management improvement. Consists maturity model. achievement. US of 9 high level criteria 9 high level criteria equivalent is the Malcolm with a further 32 subcriteria. includes: Baldrige Quality Award Mainly used 1. Leadership which in the US is a much within Europe as a total 2. People sought after award and a quality model with some 3. Policy and strategy high maturity level gained organisations aiming for the 4. Partnerships and gives the organisation European Quality Award. resources distinct advantages in the 5. Processes market. 6. People results 7. Customer results 8. Society results 9. Key performance results. Quality ISO9000 A set of high level customer Aims to ensure that an ISO certification is a Initiative orientated, auditable organisation defines and globally recognised standards for Quality documents its processes achievement and Management Systems. and they are practiced in some instances a Internationally recognised the monitored, measured and prerequisite for doing standard intends to ensure an improved. Applies to all business. organisation’s processes are areas within an controlled, repeatable and organisation. documented. Organisations are audited by external parties with a view to being ISO certified. Quality Malcolm A US quality initiative/award Provides a set of “best in Winners of the Malcolm Initiative Baldrige where organisations that class” criteria for Baldrige Award have not apply are judged to be organisations to achieve. only seen an increase in outstanding in seven areas: This criteria has been business but have also seen leadership, strategic planning, developed over numerous internal benefits. These customer and market focus, years and is widely benefits have been realised information and analysis, recognised as one of the through the identification of human resource focus, most cost effective and strengths and weaknesses process management, and comprehensive Quality from which to improve and business results. Effectively performance assessments an organisation working the equivalent of the EFQM in the US. collectively to achieve a for the US. common goal.

Page 206
Appendix H: Characteristics of Excellent Top Management
Reimann summarises the characteristics of excellent leadership as (1991, pp. 8-11):
• Visible, committed, and knowledgeable – they promote the emphasis on
quality and know the details and how well the organisation is doing. Personal
involvement in education, training, and recognition. Accessible to and routine
contact with employees, customers, and suppliers.
• A missionary zeal – active in promotion of quality outside the organisation.
• Aggressive targets – Going beyond incremental improvements and looking at
possibility of making large gains, getting the whole work force thinking about
different processes – not just improving processes.
• Strong drivers – Cycle time, zero defects, six sigma or other targets to drive
improvements. Clearly defined customer satisfaction and quality
improvement objectives.
• Communication of values – effecting cultural change related to quality.
Written policy, mission, guidelines and other documented statements of
quality values, or other bases for clear and consistent communications.
• Organisation – flat structures that allow more authority at lower levels.
Empowering employees. Manager as coaches rather than bosses. Cross-
functional management processes and focus on internal as well as external
customers. Interdepartmental improvement teams.
• Customer contact – CEO and other senior managers are accessible to
customers.

Page 207
Appendix I: Managers As Enablers
Whereas traditional management emphasises control and imposition in setting
standards, in a quality culture the role of managers will be to provide the forum for
employees to address priorities and work upon improvements.
Drummond (1992, p.137) states that quality is a product of the system. Instead of
focusing upon ostensible outcomes, managers will need to concentrate upon the
processes whereby results are achieved. A major part of a manger’s role in a quality
culture will be to work in a ‘hands on’ fashion with employees, continuously
identifying new directions and the means of accomplishing change (Drummond,
1992, p.137). Cortada (1995) believes that the role of managers has changed because
they have found it more effective to get things done by delegating increasing amounts
of authority to well-informed employees. Their role shifted from telling employees
what to do to facilitating employees’ getting things done. That shift called for
managers to train employees, to provide tools with which they could get work done,
and to foster the use of teams to approach problems and processes. Managers can now
have larger spans of control while improving the overall speed and quality of the
processes within an organisation (Cortada, 1995, p.4). Management will stimulate
ideas and shape the processes. Participation in a quality culture requires a more
sophisticated model, whereby organisations abandon the traditional demarcation
between managers and the managed and instead recognise that all employees will
need to assume some managerial responsibility.

Page 208
Appendix J: Supplier Evaluation
The key elements to evaluate suppliers are (Ray, 1995, pp.44-45):
• Competency of the supplier to undertake the tasks required by the buying
organisation - This must include technical skill of staff at all levels within the
organisation, operative, supervisory and managerial. Competency is also
focused upon the human resources of the supplier and will include such factors
as motivation, reward, training and development of all grades of staff.
Evidence of this competency begins with a review of staff CVs, qualifications,
past experience and attainments. It also includes details of investments in
training on the part of the individual and the organisation.
• Capacity of the supplier to meet total needs - This element if the supplier has
the physical, intellectual and financial resources to deliver the items or
services required. One of the benefits of collaborative partnerships with
suppliers is that they feel confident to decline work that they are unable to
deliver, without being afraid of the buyer moving the whole contract to an
alternative source.
• Commitment of the supplier to the customer, in terms of quality, cost driving
and service, most particular, total quality, given that the other elements
mentioned all stem from the achievement of and total commitment to quality.
This commitment has to be enshrined in the organisation's psyche.
• Control systems - It is vital that the prospective supplier has appropriate and
effective control and information systems in place. These include all the
obvious resource control systems, inventory, costs, budgets, people and
information.
• Cash resources and financial stability - The time and energy that needs to be
devoted to the selection of an effective supplier means that it is vital that the
supplier selected is financially sound and is able to continue in business into
the foreseeable future, this can be seen by past business and records and
current financial statements.
• Cost - The concept of total cost of acquisition is well established. In the past
many buyers were seduced by low prices but subsequently ended paying a

Page 209
higher cost in terms of quality failures, disputes, and increased management
input.
• Consistency - A sample of a product or service is sometimes used to compare
supplies and cannot be used without caution. It is vital that the prospective
supplier is able to demonstrate that they can deliver at least consistently and,
one hopes, improve levels of quality and service. Too often the 'sample' is
produced with great care and attention to detail; once the order has been
placed, subsequent output may not always be of the same standard.

Page 210
Appendix K: Employee Involvement
Employee involvement can be created in many ways (Lawler III, 1992, pp. 11-37;
Ross, 1994, pp.120-126; Balachandran, 2004, pp. 178-193):
• Redistributing Power – moving power downward in organisations often
requires special activities and structural changes. This could include quality
circles, participation groups, and quality committees. The general idea of this
is to add decision making ability to all employees i.e. make their suggestions
and ideas heard (more participative management).
• Training and Development - increases the skill level. This increases
communication among departments and workers tend to have a view of the
organisation as a whole. Problem solving ability should be taught to aid in
increasing the TQM development process. Without the right skills, it is
impossible for individuals to participate in the business and influence its
direction.
• Selection – choosing from a group of potential employees. Examines more
than just ability, this could include personality tests and an overall assessment,
this could be regarding not just the specified role and what it takes but whether
the employee fits the organisation and its beliefs.
• Performance Appraisals - serve as a diagnostic tool for development of the
individual, team, and organisation – can be used to determine reward levels,
aid career development, improve communications, and facilitate
understanding of job duties.
• Compensation Systems – as opposed to being based on individual
performance that creates competitive atmosphere, TQM compensation rewards
team strategies and quality management within that team. This increases
involvement, commitment, and communication within the business.
• Rewarding Performance – basing rewards on organisational performance is
one way to ensure that employees are involved in and care about the
performance of the organisation. It also helps ensure that they share in gains
that result from any performance improvement. All behaviour is goal directed
and goals are determined by the availability of rewards or punishments.

Page 211
• Sharing Information – sharing of information about the business. Without
business information, it is difficult for individuals to understand how the
business is doing and to make meaningful contributions to the general
directions of the business.

Page 212
Appendix L: Employee Education
Certain criteria need to be taught to employees (Crosby, 1984, pp.156-171):
• Operating management people must understand how the cost of quality is put
together and how it applies to their area.
• Individuals involved in review and planning must understand the concepts of
corrective action and problem analysis.
• Members of quality improvement teams who determine recognition needs for
quality should have a special course on recognition to make certain that they
put things in proper perspective.
• A system of communication should be designed, set-up and taught to make
communication easy within an organisation.
• Supplier quality management workshops need to be conducted for all
personnel who are going to be involved in relationships with suppliers.
• Emphasis on procedural and product qualification to help people recognise
that it is important to take procedures seriously as they are developed.
• The organisation policies should be taught and made visible to create that
quality atmosphere.
• Representatives of the advertising agency and advertising function to
understand the policies of the organisation and portray them correctly to
possible customers.
• CEO needs personal awareness to understand the particular role assigned to
the job. This means executive education.
• Senior executives need to go to executive education and to workshops on their
specific functions to understand quality in each function, not just their own.
• Managers need more working-level information about the process than the
senior executives, so they need to attend the management education.

Page 213
Appendix M: Just In Time (JIT)
Drummond (1992) explains that JIT production reverses conventional approaches to
manufacturing:
• First sell it, and then make it – nothing is produced until a customer is
identified. This eliminated the need for warehousing and other costs associated
with inventory holding.
• Production is planned backwards instead of forwards – staff responsible for
the final operation receive the production plan first, determine their needs and
pass the plan backwards.
• ‘Pull’ instead of ‘push’ systems of production – designed to eliminate stock
and facilitate flexibility.
The main problem of JIT, according to Drummond (1992) and Ross (1994), is that
stockless production leaves organisations extremely vulnerable to supply failures and
the effects of industrial action.

Page 214
Appendix N: Factors Affecting Share Price Performance
Shareholders own the organisation through the purchase of shares in the organisation
(Goodspeed, 2004, p.5). A share is one of a number of equal portions of the capital of
an organisation. The liability of shareholders for the debts of the organisation is
limited to their investment in the organisation i.e. if the organisation is wound up the
maximum shareholders can lose is the amount paid for the shares (Goodspeed, 2004,
p.5).
According to Firer et al (2004), the cash payoff to owners of common stocks comes in
two forms:
1. Capital gains (losses) - arise through changes in the price of an organisation’s
shares.
2. Dividends – a portion of the organisation’s profits.
Some corresponding factors of each are examined:
1. Factors such as operating income, capital structure, profitability ratios, etc.
2. Dividend policy.
1.1. Capital Structure
Capital structure refers to the specific mixture of long-term debt and equity the
organisation uses to finance its operations. The mixture chosen affects both the risk
and value of the organisation (Firer et al, 2004, p.5). All organisations must, at
varying times, obtain capital. To do so, an organisation must either borrow the money
(debt financing); sell a portion of the organisation (equity financing), or both. How an
organisation raises capital depends a great deal on the size of the organisation, its life
cycle stage and its growth prospects (Firer et al, 2004, p.494). Capital structure
decisions can have important implications for the value of the organisation (Firer et al,
2004, p.523). According to Firer et al (2004) and Brealey and Myers (1991) capital
structure affects an organisation’s cost of capital. Cost of capital is the discount rate
appropriate for the organisation’s overall cash flows (required return for the

Page 215
organisation). When cost of capital is minimised, the value of the organisation is
maximised. This is because values and discount rates move in the opposite direction.
Thus, capital structure affects the organisation’s value.
1.1.1. Illusion of Wealth
Financial leverage refers to the extent to which an organisation relies on debt. The
more debt financing an organisation uses in its capital structure, the more financial
leverage it employs (Firer et al, 2004, p.525). Firer et al (1994) and Brealey and
Myers (1991) believe as financial leverage increases, sensitivity of earnings per share
(EPS) increases. This would imply that by increasing the debt when profits are good
increases EPS. This creates an illusion of wealth because the value of the organisation
increases just because more debt is taken on.
According to Firer et al (2004), the more the organisation borrows, the more it is
worth. This is because interest paid on debt is tax deductible. As a result, the
organisation is able to reduce its tax burden because the interest that it pays reduces
its taxable income. This is known as the tax shield. The gain in value of the
organisation is just equal to the present value of the interest tax shield (Firer et al,
2004, p.547).
Firer et al (2004) state that the problem lies with the fact that interest must be paid on
debt. The cost of capital declines because of this (interest payments increase as debt
increases). Interest must be paid on the debt regardless of an organisation’s profit. As
debt rise, so too does the probability that the organisation will be unable to pay its
bondholders what was promised. The organisation’s value is then reduced by the
present value of the potential future insolvency costs. These costs grow as the
organisation borrows more and more, and eventually overwhelm the tax advantage of
debt financing (Firer et al, 2004, p.547). It is assumed that the organisations listed in
the IT sector of the JSE are aware of this and using good financial leverage principles.
When analysing the organisations year to year, it should be checked that the
organisations are not in essence “buying earnings” by increasing its debt structure

Page 216
giving the illusion that EPS is increasing whereby creating a factor in driving the
share price upwards.
1.1.2. Dividend Policy
Brealey and Myers (1991) maintain that the dividend policy looks at the time pattern
of dividend payout i.e. should the organisation pay out money to its shareholders, or
should the organisation keep that money and invest it for its shareholders.
An argument for the fact that dividend policy is irrelevant exists from some authors
because the individual investor is able to make homemade dividends if the policy is
altered to one not agreeable by the investor. Homemade dividends imply that
dissatisfied shareholders can alter the organisation’s dividend policy to suit
themselves by reinvesting dividends or selling shares of stock (Firer et al, 2004,
p.564). This means that, in theory, dividend policy is irrelevant. However, Brealey
and Myers (1991) point out that this does not account for the real-world factors such
as taxes and flotation costs. Investors in South Africa are not taxed on dividend
income that they receive. They are, however, subject to capital gains tax on the
difference between the selling and buying prices of shares (Firer et al, 2004, p.565).
Firer et al (2004) assert that another factor to consider is secondary tax on
organisations (STC); this is a tax payable by an organisation proportional to the size
of the dividend it declares. STC is greater than capital gains, therefore present value
of tax is lower if dividend payments are kept within the organisation and used to
increase the value of the organisation for share growth. With the dividend not being
paid out, the organisation can re-invest, be it in Treasury Bills or positive net present
value (NPV) projects. With this, the capital gains of the return will be higher in the
future.
Ross, Westerfield, and Jordan (1995) emphasise that this tax disadvantage of
dividends does not necessarily lead to a policy of paying no dividends. All other
things the same, when personal tax rates are higher than corporate tax rates; an
organisation will have an incentive to reduce dividend payouts. However, if personal

Page 217
tax rates are lower than corporate tax rates, an organisation will have an incentive to
pay out any excess cash in dividends (Ross, Westerfield, Jordan, 1995, p. 512). The
excess cash invested will result in a different future cash flow depending if it is
invested on a personal or corporate level.
Firer et al (2004) describe situations where certain real world factors favour a high
payout. These would be the desire for current income and uncertainty resolutions
(Firer et al, 2004, p.569). Desire for current income holds for investors that need the
money more at present, e.g. retirees. A high dividend policy also benefits shareholders
because it resolves uncertainty because future cash flows are less certain than present
ones. These factors suggest that the organisation paying the larger dividend will
almost always sell at a higher price (Ross, Westerfield, Jordan, 1995, p. 514).
There are positive factors for both options of dividend payout. Even though it seems
that dividend policy is irrelevant, this does not imply that it is not important. The
assets of the organisation are not affected by the dividend policy yet the share price
alters due to two important concepts. These are information content of dividends and
the clientele effect.
Information Effect
The information effect is the market’s reaction to a change in organisation dividend
payout (Firer et al, 2004, p.570; Brealey and Myers, 1991, pp.375-376). Dividend
changes convey information about the organisation to the market. It is found with
some consistency that share price rises when the current dividend is unexpectedly
increased, and they generally fall when the dividend is unexpectedly decreased.
Organisations only cut dividends with great reluctance. Thus, a dividend cut is often a
signal that the organisation is in trouble (Firer et al, 2004, pp.569-570).
Clientele Effect
Ross, Westerfield, Jordan (1995) and Firer et al (2004) define the clientele effect as an
argument that shares attract particularly different groups of investors depending on
the dividend policy. When an organisation chooses a particular dividend policy, the
only effect is to attract a particular clientele. Recognising that some groups such as
private investors require low payout whilst others like pension plans require a high

Page 218
payout, organisations may alter the dividend policy depending on the needs of the
stockholders. This just leads to a simple supply and demand argument. This implies
that if the different dividend policies are in equilibrium i.e. 50% of groups require
high payout and 50% of organisations offer a high payout, dividend policy makes no
change to the share price performance. If not in equilibrium, the organisations with a
dividend policy in demand will increase in value until equilibrium is met (Firer et al,
2004, p.571). This sharply reduces the impact of any individual organisation’s
dividend policy on its market share (Ross, Westerfield, Jordan, 1995, p. 531).
Reality
Firer et al (2004) believe that in practice, many organisations appear to follow a
compromise dividend policy. Such a policy is based on five main goals; these are in
order of importance (Firer et al, 2004, p.575):
1. Avoid cutting back on positive NPV projects to pay a dividend.
2. Avoid dividend cuts.
3. Avoid the need to sell equity.
4. Maintain a target capital structure.
5. Maintain a target dividend payout ratio.
This means that most organisations offer a residual dividend approach; this is a policy
under which an organisation pays dividends only after meeting its investment needs
while maintaining a desired debt/equity ratio (capital structure). A residual dividend
policy, either a fixed fraction of that quarter’s earnings or a fixed fraction of yearly
earnings, adds stability to a dividend policy.
This study ignores dividend policy. It is noted that if the dividend market is not in
equilibrium, the dividend policy might affect share price performance. It is assumed
that organisations are practicing the residual dividend approach, hence considering all
the above factors. Over the long-term, the values of the organisations are not affected
greatly by dividend policies and are ignored. This study is also cross-sectional and not
longitudinal. This implies that the study does not examine the current supply and
demand for different dividend policies. It assumes each organisation’s policy as
given.

Page 219
1.2. Mergers and Acquisitions
Mergers and acquisitions deal with some sort of redistribution or concentration of
control. Mergers imply two organisations combining whereas acquisitions imply an
individual or organisation gaining control of the management and assets of another
organisation (Firer et al, 2004, p.759). This new synergy affects the financial situation
of all parties concerned because it costs money to do, total assets change, and turnover
changes. This can be seen in the annual financial statements. Mergers and acquisitions
hope in some way to increase value of some of the parties involved. This increase
could be due to (Firer et al, 2004, pp.775-779):
• Synergy - combined organisation has value that is greater than the sum of the
values of the separate organisations.
• Revenue enhancement - combined organisation may generate greater
revenues from marketing gains, strategic benefits, and increase in market
power.
• Cost reductions - combined organisation may operate more efficiently due to
economies of scale (average cost per unit of producing goods and services
decreases).
• Lower taxes – Combined organisation will have a lower tax bill.
Firer et al (2004) accept that an acquisition can also create the appearance of growth
in earnings per share (EPS). This is a purely financial side effect and might not make
economic sense. This may fool investors into thinking that the organisation is doing
better than it really is, just as it can increase debt to create the illusion of wealth.
Mergers and acquisitions are ignored in this study. Mergers usually imply a new
organisation is formed and this would be noticeable in the analysis of the
organisations (Firer et al, 2004, p.759). Acquisitions do affect the financial situation
of organisations, but it is assumed that over the long-term, the cost incurred is
received back, if not increased, and management styles reflect the acquirers’. This
study does not analyse each organisation in detail with respect to income and where it
comes from and expenditure and what it is spent on.

Page 220
Appendix O: Cost of Total Quality Management Zeithaml (1990, p. 8) and Buzzell and Gale (1987, p.7) also examine the negative
view of implementing TQM. Investments to improve quality may not come back as
profit gains. Indeed, a lot of money is wasted in organisations every year in the name
of quality improvement. They source this money wastage from adding costly service
features that are unimportant to customers and spending training money unwisely.
TQM is a vast and complicated subject and must be approached slowly and
systematically until each level of the organisation is affected. An organisation must be
analysed to determine exactly how to implement TQM, as the approach towards TQM
implementation differs between organisations (Obert, 1996, p. 1). If implemented
effectively, though, there is a definite positive relationship between quality and
profitability (Zeithaml, 1990, p. 9; Berry et al, 1989, p. 4; Buzzell and Gale, 1987,
p.7). The database from the Profit Impact of Market Strategy (PIMS) programme
shows this association.
Singhal and Hendricks (1999) developed the root cause why TQM has come under
increasing criticism from many business gurus for delivering lacklustre economic
returns. Unrealistic expectations, quick-fix mentality, and competition from other
tools are some reasons organisations have soured on TQM. Some organisations may
have adopted TQM with inflated expectations of what it could deliver. TQM was
expected to have the answers. When TQM did not deliver the hoped-for-results, it was
deemed a failure. Furthermore, contrary to the TQM philosophy, many organisations
adopted TQM seeking instant and swift gratification. Often TQM efforts were
measured against short-term financial performance. When short-term improvements
did not materialise, many organisations became disillusioned. Proponents of TQM are
unhappy with its skewering in the business press. Some have stated that, while hard to
establish, the link between quality and financial performance is strong. However, this
has not been enough to counter the criticisms. The reality is that the negative publicity
about TQM has caused organisations to question the relationship between TQM and
financial performance. TQM is not a quick fix for all corporate problems and
corporations' disillusionment with the theory is the result of managers who had
unreasonable expectations. TQM is difficult to implement, as it requires major
organisational changes that need time and commitment (Singhal, 1999, pp. 35-43).

Page 221
Appendix P: Materials Used When Approaching Organisations Representative Letter: Dear Respondent RE: TOTAL QUALITY MANAGEMENT SURVEY You have received the enclosed questionnaires as part of a survey investigating the implementation of Total Quality Management (TQM) at various organisations in the Information Technology sector. My name is Jaro Vomacka and I am doing my Masters in Industrial Engineering at the University of Witwatersrand. I am researching at what different levels organisations in the IT sector are at relative to TQM. One of my main tasks of my research is to provide management with relevant, accurate, reliable, valid and current information with regards to TQM in South Africa. At the completion of the research project, each business that participated will be given a copy of my research findings. These findings can then be used as a benchmark to analyse where the organisation stands with respect to TQM and highlight which areas need improving or where opportunities may exist for advancing the organisation. I have chosen to approach this organisation because it is one of many in the required sector, located in Gauteng, it is a sector of interest and one I have knowledge of being an Electrical and Information Engineer. South Africa is now subject to international business competition and TQM is becoming more accepted as a powerful solution to the reaction of increasing domestic and global competition and the pervasive need to integrate the several organisational functions for improvement of total output of an organisation. Poor quality in the average organisations costs about 20 percent of revenues, most of which can be avoided by adopting good quality practices. TQM re-engineers the departments for better efficiency targeted for the goal of customer satisfaction. TQM can shorten cycle time, improve quality, increase productivity and reduce costs. All these factors point to increased customer satisfaction, increased customer base, increased profit in the long-term, and an improvement in financial performance. The results of this research can aid you in determining what principles are being implemented and what are lacking in your organisation. I would be very grateful if you and your staff could assist in my research by taking time to complete the questionnaires and provide me with an insight into quality assurance within your organisation. The answers will be treated confidentially, and will be used for research purposes only. The names of any employees will not appear anywhere on the questionnaire. The questionnaire will take you about ten minutes to complete. I would appreciate if you would distribute the questionnaires in the manner agreed i.e. minimum of three people in each of four different departments (minimum of 12 people). Should you have any problems with the questionnaires or the process, please do not hesitate to contact me on 082 0804034 or 011 6806134. Please could you keep all completed questionnaires at your office, and I will make arrangements to collect them. Your cooperation and assistance are very much appreciated. Kind Regards, Mr. J. Vomacka

Page 222
Respondent Letter: Dear Respondent RE: TOTAL QUALITY MANAGEMENT SURVEY You have received this questionnaire as part of a survey investigating the implementation of Total Quality Management at various organisations in the Information Technology sector. South Africa is now subject to international business competition and TQM is becoming more accepted as a powerful solution to the reaction of increasing domestic and global competition and the pervasive need to integrate the several organisational functions for improvement of total output of an organisation. Poor quality in the average organisations costs about 20 percent of revenues, most of which can be avoided by adopting good quality practice. The goal of TQM is customer satisfaction and TQM re-engineers the departments for better efficiency targeted for customers. TQM can shorten cycle time, improve quality, increase productivity and reduce costs. All these factors point to increased customer satisfaction, increased profit in the long-term, increased customer base and this leads to an increase in financial performance. I would be very grateful if you could assist in my research for my Masters Degree in Industrial Engineering at the University of the Witwatersrand (WITS) by taking time to complete the questionnaire and provide me with an insight into quality assurance within your organisation. Your cooperation and assistance are very much appreciated. As you work through the questionnaire, you will find some questions which ask about yourself whilst others about the organisation and your opinions. For these opinion questions, there are no right or wrong answers. What is important is to know just what you think and the questions are answered to the best of your ability - as honestly and fully as you can. The answers you give will be treated confidentially, and will be used for research purposes only. Your name will not appear anywhere on the questionnaire. The questionnaire will take you about ten minutes to complete. If you have any questions about completing the questionnaire, please contact your head of department. The completed questionnaire should reach the quality manager/HR manager/marketing manager (person managing quality) in the envelope provided by 30 September 2005. Thank you for taking this research seriously and assisting my results making them more meaningful. Thank you again for your assistance, Kind Regards Mr. J. Vomacka

Page 223
Appendix Q: Questionnaire HOW TO COMPLETE THE QUESTIONNAIRE
Questions will be asked in either one or two ways - either a direct answer is required or a scale exists where an opinionated answer is required (rating). Please mark only one box by placing a cross in it.
The direct answers require a YES, NO, or DON'T KNOW Y N D To rate a scale item, please cross the level of agreement for the statement. You may now begin. 1. Department (e.g. Accounting, Marketing, IT, Research and Development etc.) 2. Position in organisation (e.g. sales manager, personal assistant, network administrator etc.) A. Attitude and Involvement of Top Management 1. Is your organisation ISO9000 Series Certified (ISO9001;ISO9004 etc.)? Y N D (I) If YES, since when?__________________________________ 2. (I) Does your organisation have a formal written quality policy? Y N D (ii) If YES, has the organisation improved on that in any way? Y N D AND, does this policy contain: (iii) a brief statement of corporate intent to quality Y N D (iv)
the minimum actions to be taken by organisation divisions with respect to quality Y N D
(v) specific goals (measurements) to be attained regarding quality Y N D 3. Is the concept of quality made visible by management? Y N D 4. Does management drive the quality? Y N D 5. Is there a quality culture in your organisation? (Attitudes, beliefs, visions etc. about quality) Y N D 6.
There are reporting mechanisms for feedback to top management within the organisation.
Agree Disagree Strongly Agree
Neither Agree nor Disagree
Strongly Disagree
7.
Personal Leadership improvement plans are developed based on feedback mechanisms.
Agree Disagree Strongly Agree
Neither Agree nor Disagree
Strongly Disagree
8.
Senior executives are personally involved in the ongoing communication of quality values oriented at the customer/market.
Agree Disagree Strongly Agree
Neither Agree nor Disagree
Strongly Disagree

Page 224
B. Information Systems and Information Technology 1.
Is the organisation involved in any process, product or organisation benchmarks? Y N D
2.
Is the “Best-In-Class” organisation known, studied and followed? (The organisation leading your sector) Y N D
3.
Are there any actions to try close the gap between you and your superior organisation? Y N D
4. Do you rate your suppliers in terms of quality? Y N D If YES, do you continuously measure them and make adjustments? Y N D 5.
Competitive quality data are used to create strategies for market, product, technical, environmental, and resource developments.
Agree Disagree Strongly Agree
Neither Agree nor Disagree
Strongly Disagree
C. Strategic Quality Planning 1. Are there any quality surveys within the organisation in place? Y N D 2. Do you know the mission of the organisation? Y N D (I) If YES, is it quality oriented Y N D 3. In setting goals, YOUR department sets some quality goals. Agree Disagree Strongly Agree
Neither Agree nor Disagree
Strongly Disagree
4.
Human resource development requirements are considered during the planning process.
Agree Disagree Strongly Agree
Neither Agree nor Disagree
Strongly Disagree
5.
An integrated strategic quality planning process exists, which incorporates a wide variety of internal and external information sources, including customer, competitive, environmental, supplier, co-worker, and society data.
Agree Disagree Strongly Agree
Neither Agree nor Disagree
Strongly Disagree
6.
Productivity improvement is considered when developing operational performance improvement plans.
Agree Disagree Strongly Agree
Neither Agree nor Disagree
Strongly Disagree
7.
Specific short-term and longer-term quality and performance goals, including an action plan goal to achieve substantial improvement in key indicators, have been set.
Agree Disagree Strongly Agree
Neither Agree nor Disagree
Strongly Disagree
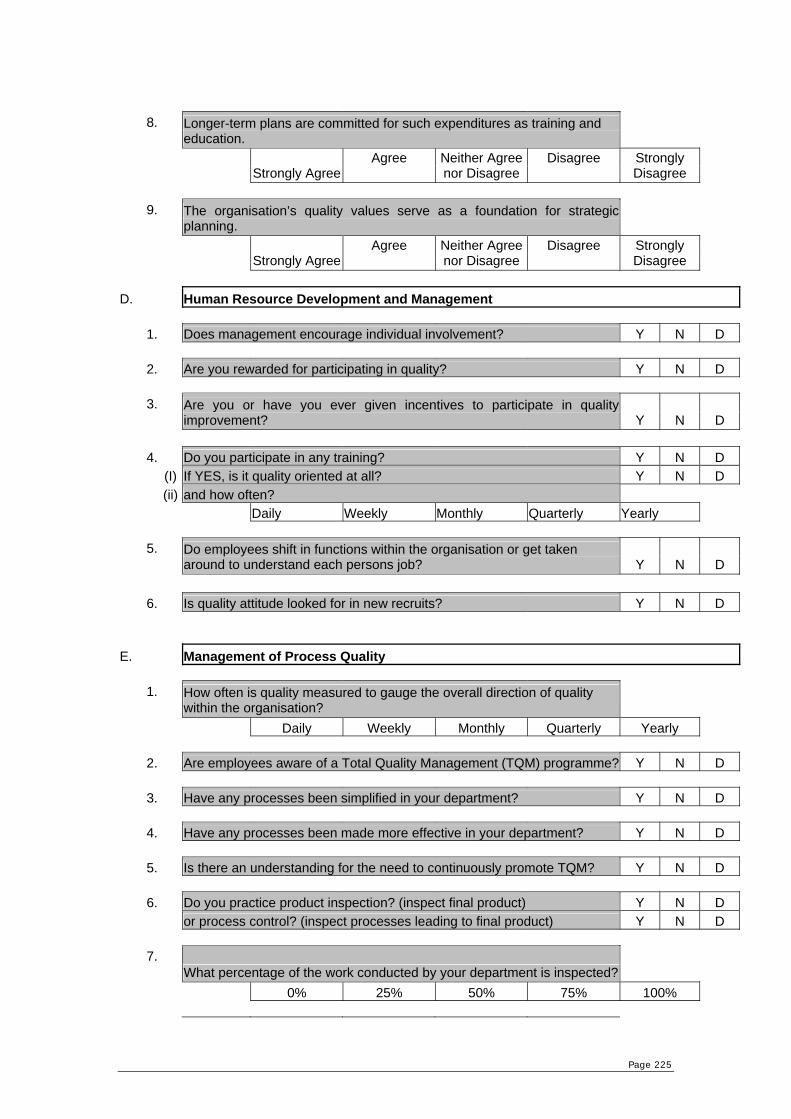
Page 225
8.
Longer-term plans are committed for such expenditures as training and education.
Agree Disagree Strongly Agree
Neither Agree nor Disagree
Strongly Disagree
9.
The organisation’s quality values serve as a foundation for strategic planning.
Agree Disagree Strongly Agree
Neither Agree nor Disagree
Strongly Disagree
D. Human Resource Development and Management 1. Does management encourage individual involvement? Y N D 2. Are you rewarded for participating in quality? Y N D 3.
Are you or have you ever given incentives to participate in quality improvement? Y N D
4. Do you participate in any training? Y N D (I) If YES, is it quality oriented at all? Y N D (ii) and how often? Daily Weekly Monthly Quarterly Yearly 5.
Do employees shift in functions within the organisation or get taken around to understand each persons job? Y N D
6. Is quality attitude looked for in new recruits? Y N D E. Management of Process Quality 1.
How often is quality measured to gauge the overall direction of quality within the organisation?
Daily Weekly Monthly Quarterly Yearly 2. Are employees aware of a Total Quality Management (TQM) programme? Y N D 3. Have any processes been simplified in your department? Y N D 4. Have any processes been made more effective in your department? Y N D 5. Is there an understanding for the need to continuously promote TQM? Y N D 6. Do you practice product inspection? (inspect final product) Y N D or process control? (inspect processes leading to final product) Y N D 7. What percentage of the work conducted by your department is inspected? 0% 25% 50% 75% 100%

Page 226
8.
Can the organisation pinpoint any problems immediately e.g. vendor problem, lack of expertise, poor preventive maintenance, old machines etc.? Y N D
9.
Customer input is reviewed to determine how quality, cycle time, and overall performance can be improved.
Agree Disagree Strongly Agree
Neither Agree nor Disagree
Strongly Disagree
F. Customer Focus and Satisfaction 1.
When deciding what constitutes a quality product/service, customer requirements are researched and must be known.
Agree Disagree Strongly Agree
Neither Agree nor Disagree
Strongly Disagree
2. Does the organisation record all customer complaints? Y N D 3.
Does the organisation process customer complaints to try prevent those problems from occurring again? Y N D
4.
My superiors/quality council regularly tell me what the key quality requirements of my customers are.
Agree Disagree Strongly Agree
Neither Agree nor Disagree
Strongly Disagree
5. I consider the following people to be MY customers: (I) other departments within my organisation; or Y N D (ii) the customers of the organisation; or Y N D (iii) I don't have any. Y N D 6.
Customer feedback is a key to understanding customer requirements - this includes surveys, complaints, gains and losses of customers, third-party telephone surveys.
Agree Disagree Strongly Agree
Neither Agree nor Disagree
Strongly Disagree
7. (I) Are warranties and commitments to customers made and adhered to? Y N D (ii)
Are warranties and commitments to customers compared to those made by key competitors? Y N D
8.
Commitments extend beyond direct customers to the consumer. Methods include warranties and a toll-free number.
Agree Disagree Strongly Agree
Neither Agree nor Disagree
Strongly Disagree
G. Management Structure and Teams 1.
Does a quality council/steering committee exist or any cross-functional quality improvement teams? Y N D

Page 227
2.
How often does YOUR superior/manager participate in quality team meetings in your department?
0% 25% 50% 75% 100% 3. Are you a member of some form of Quality Improvement Team? Y N D 4.
If YES, does your team have the authority to implement solutions to identified problems? Y N D
5. Do you know who your suppliers are, internally and externally? Y N D 6. Can a process that you know of be simplified? Y N D (I) If YES, have you told anyone of this? Y N D (ii) Has it been done? Y N D H. Cost of Quality 1. Does your organisation calculate a cost of quality in monetary terms? Y N D If YES, Continue, If NO, You Are Done, Thank You 2.
Which of the following elements are included in your organisations calculation of the cost of quality?
(I)
prevention costs - incurred in preventing defects from occurring, such as quality audits, preventative maintenance, design reviews etc. Y N D
(ii)
appraisal costs - used to determine conformance to requirements or specification. Y N D
(iii)
failure costs - cost incurred as a result of things not conforming to requirements the first time. Y N D
3. Is there a target or cost of quality reducing goal? Y N D
THANK YOU VERY MUCH FOR COMPLETING THIS QUESTIONNAIRE. PLEASE REMEMBER TO PLACE IT IN THE ENVELOPE AND TO HAND IT IN TO THE DESIGNATED MANAGER

Page 228
Appendix R: Extraneous Variables
The need to control extraneous variables has been made clear in chapter six. Some
extraneous variables are (Malhotra, 1993, pp.225-228):
• History – refers to specific events that are external to the research and occur at
the same time. In attempt to minimise this, the entire study was completed in
four months (two months of interviews and two months of questionnaire
collection). To the knowledge of the author, no major activities that could
affect the study occurred.
• Maturation – is similar to history except that it refers to changes in the
respondents themselves caused by the passage of time. In research involving
people, maturation takes place as people become older, more experienced,
tired, bored, or uninterested. To combat this, the length of the questionnaire
was kept to the minimum possible, management themselves were asked to
push the issue internally within the organisation as an apparent directive from
higher authority, and a covering letter was given to each respondent indicating
the importance of quality within the workplace for a business.
• Testing Effects – these are the effects on the study by taking a measure on the
dependant variable before and after the presentation of the treatment. This
research is cross sectional (see section six) and so this variable does not exist.
• Instrumentation – refers to changes in the measuring instruments, in the
observers, or in the scores themselves. The questionnaire was never altered
throughout the study and the study did not make use of any observers, so there
was no variation in the responses obtained.
• Statistical Regression – occurs when obtained results with extreme scores
move closer to the average score during the course of the research. Once
again, this was not a longitudinal study (see section six) and does not make
use of different scenarios. The results are obtained once and not manipulated
to form any type of average.
• Selection Bias – refers to improper assignment of respondents to TQM
conditions. To minimise this, the representative most qualified with regards to
quality was interviewed (convenience sampling). Management was also asked

Page 229
to distribute the questionnaires to employees in different departments within
the organisation as discussed in section three (random sampling).
• Mortality – refers to the loss of respondents while the research is in progress.
This happens for many reasons, such as respondents refusing to continue in
the research. To combat this, meetings were held with the organisations to
discuss the importance and implications of the study. This made them
understand it is for their benefit, too. Furthermore, respondents were only
asked 15 minutes of their time and because of the cross-sectional nature of the
study, once the questionnaire was completed, they could not in essence
abandon the research.

Page 230
Appendix S: TQM Section Results For the dichotomous questions, each organisation and question was counted
separately for each individual section. This appendix presents the tables of answers.
Dichotomous Question Results
Section
Company A B C D E F G H Total ScoreA 1.67 3.33 1.17 5.36 6.94 11.21 1.88 0.00 31.56B 13.19 4.72 2.17 7.50 8.75 8.94 3.83 0.83 49.93C 5.00 1.67 1.50 7.14 6.94 8.48 2.50 0.13 33.36D 3.33 4.17 0.50 5.54 5.69 8.03 2.34 0.38 29.98E 12.92 4.58 2.33 7.50 7.50 9.55 2.66 0.96 48.00F 4.44 2.41 1.67 7.62 5.93 7.88 2.60 0.00 32.55G 4.72 2.08 1.75 8.21 3.47 9.24 2.03 0.13 31.63H 6.11 4.07 0.67 6.43 3.89 10.10 1.77 1.44 34.48I 13.79 3.33 2.64 9.16 8.33 8.93 5.11 0.41 51.70J 3.33 6.67 3.00 4.29 6.67 12.73 5.63 0.00 42.32
Section A: Company Response Q1 Q2.1 Q2.2 Q2.3 Q2.4 Q2.5 Q3 Q4 Q5 Section A
20.00 Yes 0 0 0 0 0 0 4 0 0 1.67 A Don't Know 4 3 0 0 0 0 0 0 2 No 2 3 0 0 0 0 2 6 4 Yes 9 12 10 6 10 12 12 12 12 13.19 B Don't Know 3 0 2 6 2 0 0 0 0 No 0 0 0 0 0 0 0 0 0 Yes 1 4 1 3 2 2 7 7 7 5.00 C Don't Know 9 6 2 1 2 2 3 2 4 No 2 2 1 0 0 0 2 3 1 Yes 1 0 0 0 0 0 2 7 5 3.33 D Don't Know 2 3 0 0 0 0 3 0 0 No 9 9 0 0 0 0 7 5 7 Yes 12 12 9 11 10 10 11 9 9 12.92 E Don't Know 0 0 3 1 1 1 0 0 1 No 0 0 0 0 1 1 1 3 2 Yes 0 0 0 0 0 0 6 6 3 4.44 F Don't Know 0 0 0 0 0 0 0 0 0 No 9 9 0 0 0 0 3 3 6 Yes 2 3 2 1 0 0 5 5 10 4.72 G Don't Know 4 6 0 0 1 1 0 0 0 No 6 3 1 2 2 2 7 7 2 Yes 0 2 0 0 2 2 9 4 9 6.11 H Don't Know 4 0 2 2 0 0 0 3 0 No 5 7 0 0 0 0 0 2 0 Yes 10 11 11 11 10 10 10 9 9 13.79

Page 231
I Don't Know 1 0 0 0 0 0 0 1 0 No 0 0 0 0 1 1 1 1 2 Yes 0 0 0 0 0 0 0 0 1 3.33 J Don't Know 0 0 0 0 0 0 0 0 0 No 1 1 0 0 0 0 1 1 0
Section B: Company Response Q1 Q2 Q3 Q4.1 Q4.2 Section B
10 Yes 2 0 0 5 5 3.33 A Don't Know 2 4 4 1 0 No 2 2 2 0 0 Yes 8 5 5 8 8 4.72 B Don't Know 4 5 2 4 0 No 0 2 5 0 0 Yes 5 1 2 3 1 1.67 C Don't Know 7 11 10 6 1 No 0 0 0 3 1 Yes 10 2 7 6 5 4.17 D Don't Know 2 2 3 4 1 No 0 8 2 2 0 Yes 9 3 5 8 8 4.58 E Don't Know 2 4 3 4 0 No 1 5 4 0 0 Yes 7 3 3 0 0 2.41 F Don't Know 0 0 2 2 0 No 2 6 4 7 0 Yes 0 3 2 8 2 2.08 G Don't Know 7 2 7 2 3 No 5 7 3 2 3 Yes 2 0 4 9 7 4.07 H Don't Know 3 5 3 0 2 No 4 4 2 0 0 Yes 6 3 2 7 4 3.33 I Don't Know 3 5 8 3 3 No 2 3 1 1 0 Yes 1 1 1 1 0 6.67 J Don't Know 0 0 0 0 0 No 0 0 0 0 1
Section C: Company Response Q1 Q2.1 Q2.2 Section C
10 Yes 2 5 0 1.17 A Don't Know 1 0 0 No 3 1 5 Yes 10 8 8 2.17 B Don't Know 2 4 0 No 0 0 0 Yes 2 8 8 1.50 C Don't Know 6 1 0

Page 232
No 4 3 0 Yes 1 4 1 0.50 D Don't Know 1 0 3 No 10 8 0 Yes 10 9 9 2.33 E Don't Know 1 1 0 No 1 2 0 Yes 2 9 4 1.67 F Don't Know 0 0 0 No 7 0 5 Yes 3 10 8 1.75 G Don't Know 2 0 0 No 7 2 2 Yes 2 4 0 0.67 H Don't Know 0 3 0 No 7 2 4 Yes 8 11 10 2.64 I Don't Know 0 0 0 No 3 0 1 Yes 1 1 1 3.00 J Don't Know 0 0 0 No 0 0 0
Section D: Company Response Q1 Q2 Q3 Q4 Q4.1 Q5 Q6 Section D
15.00 Yes 6 0 0 3 2 4 0 5.36 A Don't Know 0 0 0 0 0 0 6 No 0 6 6 3 1 2 0 Yes 9 2 2 7 7 5 10 7.50 B Don't Know 0 3 0 0 0 0 2 No 3 7 10 5 0 7 0 Yes 11 5 6 6 3 4 5 7.14 C Don't Know 1 4 1 0 1 2 7 No 0 3 5 6 2 6 0 Yes 3 4 3 7 5 3 6 5.54 D Don't Know 1 0 0 0 2 0 2 No 8 8 9 5 0 9 4 Yes 8 2 6 10 7 2 7 7.50 E Don't Know 1 1 0 1 0 1 3 No 3 9 6 1 3 9 2 Yes 7 6 4 5 1 3 6 7.62 F Don't Know 0 0 0 0 0 0 0 No 2 3 5 4 4 6 3 Yes 9 5 3 12 4 4 9 8.21 G Don't Know 0 2 2 0 2 2 0 No 3 5 7 0 6 6 3 Yes 7 0 2 6 4 2 6 6.43 H Don't Know 0 2 0 0 0 3 3 No 2 7 7 3 2 4 0

Page 233
Yes 11 2 5 11 10 0 8 9.16 I Don't Know 0 1 0 0 0 2 3 No 0 8 6 0 1 9 0 Yes 1 0 0 1 0 0 0 4.29 J Don't Know 0 0 0 0 0 0 1 No 0 1 1 0 1 1 0
Section E: Company Response Q2 Q3 Q4 Q5 Q6 Q6.1 Q8 Section E
15.00 Yes 0 3 5 0 6 6 5 6.94 A Don't Know 1 0 1 3 0 0 1 No 5 3 0 3 0 0 0 Yes 8 9 7 6 12 12 9 8.75 B Don't Know 4 2 4 4 0 0 0 No 0 1 1 2 0 0 3 Yes 1 8 9 7 11 8 6 6.94 C Don't Know 6 2 3 4 1 3 4 No 5 2 0 1 0 1 2 Yes 0 7 12 2 10 3 7 5.69 D Don't Know 2 0 0 4 0 8 2 No 10 5 0 6 2 1 3 Yes 4 8 10 9 8 9 6 7.50 E Don't Know 4 2 1 1 3 3 5 No 4 2 1 2 1 0 1 Yes 3 3 4 5 6 4 7 5.93 F Don't Know 0 0 0 0 0 3 2 No 6 6 5 4 3 2 0 Yes 0 3 2 4 8 5 3 3.47 G Don't Know 2 0 2 2 2 2 6 No 10 9 8 6 2 5 3 Yes 0 0 7 2 0 3 9 3.89 H Don't Know 2 2 2 2 0 0 0 No 7 7 0 5 9 6 0 Yes 4 10 10 11 4 10 6 8.33 I Don't Know 4 0 0 0 5 0 3 No 3 1 1 0 2 1 2 Yes 0 1 1 0 0 1 1 6.67 J Don't Know 0 0 0 0 0 0 0 No 1 0 0 1 1 0 0
Section F: Company Response Q2 Q3 Q5.1 Q5.2 Q5.3 Q7.1 Q7.2 Section F
20.00 Yes 6 6 4 6 0 6 5 15.71 A Don't Know 0 0 2 0 2 0 0 No 0 0 0 0 4 0 1 Yes 10 12 5 7 5 12 12 15.00 B Don't Know 2 0 3 2 6 0 0 No 0 0 4 3 1 0 0 Yes 8 10 8 12 0 10 3 12.14

Page 234
C Don't Know 3 2 2 0 7 2 9 No 1 0 2 0 5 0 0 Yes 11 9 8 12 1 6 6 12.62 D Don't Know 0 0 0 0 10 4 4 No 1 3 4 0 1 2 2 Yes 10 11 8 10 0 9 7 13.10 E Don't Know 0 0 2 2 4 3 3 No 2 1 2 0 8 0 2 Yes 6 5 9 9 1 4 1 11.11 F Don't Know 3 2 0 0 3 3 6 No 0 2 0 0 5 2 2 Yes 7 8 12 12 0 11 5 13.10 G Don't Know 2 4 0 0 6 0 4 No 3 0 0 0 6 1 3 Yes 7 9 7 9 0 7 5 13.97 H Don't Know 0 0 0 0 3 2 2 No 2 0 2 0 6 0 2 Yes 11 11 11 10 1 8 2 14.03 I Don't Know 0 0 0 1 9 3 4 No 0 0 0 0 1 0 5 Yes 1 1 1 1 0 1 1 17.14 J Don't Know 0 0 0 0 0 0 0 No 0 0 0 0 1 0 0
Section G: Company Response Q1 Q3 Q4 Q5 Q6 Q6.1 Q6.2 Section G
7.50 Yes 1 1 1 4 4 1 0 1.88 A Don't Know 4 0 0 2 2 2 2 No 1 5 0 0 0 3 4 Yes 9 8 8 7 7 5 5 3.83 B Don't Know 2 0 0 2 2 4 5 No 1 4 0 3 3 3 2 Yes 4 3 2 3 8 8 4 2.50 C Don't Know 5 0 1 3 2 4 5 No 3 9 0 6 2 0 3 Yes 1 4 2 11 5 5 2 2.34 D Don't Know 0 0 1 0 3 7 7 No 11 8 1 1 4 0 3 Yes 5 4 3 7 7 5 3 2.66 E Don't Know 4 2 0 2 2 6 7 No 3 6 1 3 3 1 2 Yes 4 6 4 7 2 2 0 2.60 F Don't Know 1 3 0 0 3 6 6 No 4 0 2 2 4 1 3 Yes 0 0 0 10 8 8 0 2.03 G Don't Know 5 0 0 0 0 4 5 No 7 12 0 2 4 0 7 Yes 2 0 0 4 5 4 2 1.77 H Don't Know 3 0 0 0 0 5 5

Page 235
No 4 9 0 5 4 0 2 Yes 10 7 7 11 10 8 7 5.11 I Don't Know 0 0 0 0 0 0 0 No 1 4 0 0 1 3 4 Yes 0 1 1 1 1 1 1 5.63 J Don't Know 0 0 0 0 0 0 0 No 1 0 0 0 0 0 0
Section H: Company Response Q1 Q2.1 Q2.2 Q2.3 Q3 Section H
2.50 Yes 0 0 0 0 0 0.00 A Don't Know 6 0 0 0 0 No 0 0 0 0 0 Yes 6 5 4 3 2 0.83 B Don't Know 4 1 2 2 2 No 2 0 0 1 2 Yes 1 1 1 0 0 0.13 C Don't Know 10 0 0 0 1 No 1 0 0 1 0 Yes 3 2 3 1 0 0.38 D Don't Know 1 0 0 1 2 No 8 1 0 1 1 Yes 6 4 5 4 4 0.96 E Don't Know 5 1 0 0 0 No 1 1 1 2 2 Yes 0 0 0 0 0 0.00 F Don't Know 2 0 0 0 0 No 7 0 0 0 0 Yes 1 0 1 1 0 0.13 G Don't Know 9 1 0 0 1 No 2 0 0 0 0 Yes 6 6 4 6 4 1.44 H Don't Know 3 0 0 0 0 No 0 0 2 0 2 Yes 2 2 2 2 1 0.41 I Don't Know 6 0 0 0 1 No 3 0 0 0 0 Yes 0 0 0 0 0 0.00 J Don't Know 0 0 0 0 0 No 1 0 0 0 0

Page 236
Itemised Question Results: Sections
A B C E F G A 1.25 0.56 -0.17 0.83 2.88 -0.16 B 2.71 0.69 3.88 2.29 4.17 0.43 C 1.53 0.21 2.08 1.53 3.11 -0.16 D 0.63 0.14 0.13 0.90 2.12 -0.47 E 1.67 0.69 2.63 1.46 2.65 0.04 F 1.30 0.19 1.06 0.37 0.91 -0.57 G -0.14 -0.07 1.04 0.14 0.76 -0.31 H 1.20 0.56 2.89 0.00 2.93 -0.36 I 2.73 0.38 2.95 1.74 3.14 0.00 J 2.50 1.67 4.00 0.83 7.27 0.00
Com
pany
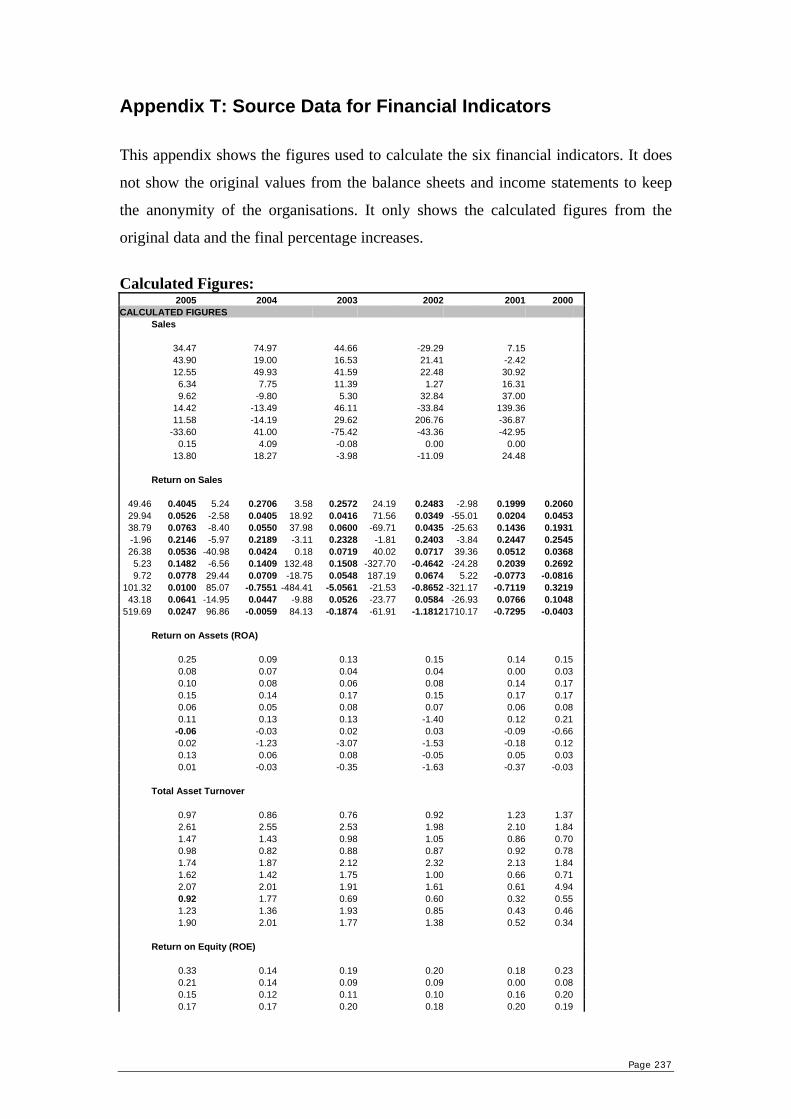
Page 237
Appendix T: Source Data for Financial Indicators This appendix shows the figures used to calculate the six financial indicators. It does
not show the original values from the balance sheets and income statements to keep
the anonymity of the organisations. It only shows the calculated figures from the
original data and the final percentage increases.
Calculated Figures: 2005 2004 2003 2002 2001 2000 CALCULATED FIGURES Sales 34.47 74.97 44.66 -29.29 7.15 43.90 19.00 16.53 21.41 -2.42 12.55 49.93 41.59 22.48 30.92 6.34 7.75 11.39 1.27 16.31 9.62 -9.80 5.30 32.84 37.00 14.42 -13.49 46.11 -33.84 139.36 11.58 -14.19 29.62 206.76 -36.87 -33.60 41.00 -75.42 -43.36 -42.95 0.15 4.09 -0.08 0.00 0.00 13.80 18.27 -3.98 -11.09 24.48 Return on Sales
49.46 0.4045 5.24 0.2706 3.58 0.2572 24.19 0.2483 -2.98 0.1999 0.2060 29.94 0.0526 -2.58 0.0405 18.92 0.0416 71.56 0.0349 -55.01 0.0204 0.0453 38.79 0.0763 -8.40 0.0550 37.98 0.0600 -69.71 0.0435 -25.63 0.1436 0.1931 -1.96 0.2146 -5.97 0.2189 -3.11 0.2328 -1.81 0.2403 -3.84 0.2447 0.2545 26.38 0.0536 -40.98 0.0424 0.18 0.0719 40.02 0.0717 39.36 0.0512 0.0368 5.23 0.1482 -6.56 0.1409 132.48 0.1508 -327.70 -0.4642 -24.28 0.2039 0.2692 9.72 0.0778 29.44 0.0709 -18.75 0.0548 187.19 0.0674 5.22 -0.0773 -0.0816
101.32 0.0100 85.07 -0.7551 -484.41 -5.0561 -21.53 -0.8652 -321.17 -0.7119 0.3219 43.18 0.0641 -14.95 0.0447 -9.88 0.0526 -23.77 0.0584 -26.93 0.0766 0.1048
519.69 0.0247 96.86 -0.0059 84.13 -0.1874 -61.91 -1.18121710.17 -0.7295 -0.0403 Return on Assets (ROA) 0.25 0.09 0.13 0.15 0.14 0.15 0.08 0.07 0.04 0.04 0.00 0.03 0.10 0.08 0.06 0.08 0.14 0.17 0.15 0.14 0.17 0.15 0.17 0.17 0.06 0.05 0.08 0.07 0.06 0.08 0.11 0.13 0.13 -1.40 0.12 0.21 -0.06 -0.03 0.02 0.03 -0.09 -0.66 0.02 -1.23 -3.07 -1.53 -0.18 0.12 0.13 0.06 0.08 -0.05 0.05 0.03 0.01 -0.03 -0.35 -1.63 -0.37 -0.03 Total Asset Turnover 0.97 0.86 0.76 0.92 1.23 1.37 2.61 2.55 2.53 1.98 2.10 1.84 1.47 1.43 0.98 1.05 0.86 0.70 0.98 0.82 0.88 0.87 0.92 0.78 1.74 1.87 2.12 2.32 2.13 1.84 1.62 1.42 1.75 1.00 0.66 0.71 2.07 2.01 1.91 1.61 0.61 4.94 0.92 1.77 0.69 0.60 0.32 0.55 1.23 1.36 1.93 0.85 0.43 0.46 1.90 2.01 1.77 1.38 0.52 0.34 Return on Equity (ROE) 0.33 0.14 0.19 0.20 0.18 0.23 0.21 0.14 0.09 0.09 0.00 0.08 0.15 0.12 0.11 0.10 0.16 0.20 0.17 0.17 0.20 0.18 0.20 0.19

Page 238
0.19 0.16 0.25 0.24 0.17 0.23 0.22 0.20 0.23 -5.08 0.19 0.84 -0.22 -0.08 0.05 0.09 -0.24 3.69 0.18 -16.53 -4.30 -1.87 -0.21 0.19 0.25 0.12 0.19 -0.08 0.10 0.06 0.06 -0.13 -1.35 -4.04 -0.53 -0.04 Share Price 200.00% -42.86% 133.33% -25.00% -72.41% 234.15% 64.00% 78.57% 133.33% -53.85% 11.11% 50.00% 35.48% -27.06% -42.18% 99.34% -7.93% 18.84% 21.05% -8.06% 16.63% 19.60% 65.24% 65.35% 11.89% 61.11% 9.09% 200.00% -95.20% -68.02% 60.61% 54.73% 13.24% 10.25% -21.46% 966.67% 0.00% 200.00% -85.71% -73.08% 68.84% 0.00% 0.00% 0.00% 0.00% 16.26% 17.52% 13.36% -71.50% -85.58%
Final Percentage Change Figures:
2005 2004 2003 2002 2001 FINAL FINAL PERCENTAGE CHANGE FIGURES Percentage Change in Sales
17.24 18.74 5.58 -1.83 0.45 40.18 A 40.18 21.95 4.75 2.07 1.34 -0.15 29.95 B 29.95 6.27 12.48 5.20 1.41 1.93 27.29 C 27.29 3.17 1.94 1.42 0.08 1.02 7.63 D 7.63 4.81 -2.45 0.66 2.05 2.31 7.39 E 7.39 7.21 -3.37 5.76 -2.11 8.71 16.20 F 16.20 5.79 -3.55 3.70 12.92 -2.30 16.56 G 16.56
-16.80 10.25 -9.43 -2.71 -2.68 -21.37 H -21.37 0.08 1.02 -0.01 0.00 0.00 1.09 I 1.09 6.90 4.57 -0.50 -0.69 1.53 11.81 J 11.81
Percentage Change in Return on Sales
24.73 1.31 0.45 1.51 -0.19 27.81 A 27.81 14.97 -0.65 2.37 4.47 -3.44 17.72 B 17.72 19.40 -2.10 4.75 -4.36 -1.60 16.09 C 16.09 -0.98 -1.49 -0.39 -0.11 -0.24 -3.22 D -3.22 13.19 -10.25 0.02 2.50 2.46 7.93 E 7.93 2.62 -1.64 16.56 -20.48 -1.52 -4.46 F -4.46 4.86 7.36 -2.34 11.70 0.33 21.90 G 21.90
50.66 21.27 -60.55 -1.35 -20.07 -10.04 H -10.04 21.59 -3.74 -1.23 -1.49 -1.68 13.45 I 13.45
259.84 24.22 10.52 -3.87 106.89 397.59 J 0.00 Percentage Change in Return on Assets
0.12 0.02 0.02 0.01 0.01 0.18 A 18.00 0.04 0.02 0.01 0.00 0.00 0.06 B 6.00 0.05 0.02 0.01 0.01 0.01 0.09 C 9.00 0.08 0.03 0.02 0.01 0.01 0.15 D 15.00 0.03 0.01 0.01 0.00 0.00 0.06 E 6.00 0.05 0.03 0.02 -0.09 0.01 0.02 F 2.00
-0.03 -0.01 0.00 0.00 -0.01 -0.04 G 0.00 0.01 -0.31 -0.38 -0.10 -0.01 -0.79 H 0.00 0.06 0.01 0.01 0.00 0.00 0.09 I 9.00 0.01 -0.01 -0.04 -0.10 -0.02 -0.17 J 0.00
Percentage Change in Total Asset Turnover
0.48 0.21 0.10 0.06 0.08 0.93 A 0.93 1.31 0.64 0.32 0.12 0.13 2.52 B 2.52 0.73 0.36 0.12 0.07 0.05 1.33 C 1.33 0.49 0.20 0.11 0.05 0.06 0.92 D 0.92 0.87 0.47 0.27 0.15 0.13 1.88 E 1.88 0.81 0.35 0.22 0.06 0.04 1.49 F 1.49 1.03 0.50 0.24 0.10 0.04 1.91 G 1.91 0.46 0.44 0.09 0.04 0.02 1.05 H 1.05 0.62 0.34 0.24 0.05 0.03 1.28 I 1.28

Page 239
0.95 0.50 0.22 0.09 0.03 1.79 J 1.79 Percentage Change in Return on Equity
0.16 0.03 0.02 0.01 0.01 0.24 A 24.00 0.11 0.03 0.01 0.01 0.00 0.16 B 16.00 0.08 0.03 0.01 0.01 0.01 0.14 C 14.00 0.09 0.04 0.03 0.01 0.01 0.18 D 18.00 0.09 0.04 0.03 0.02 0.01 0.19 E 19.00 0.11 0.05 0.03 -0.32 0.01 -0.12 F 0.00
-0.11 -0.02 0.01 0.01 -0.01 -0.13 G 0.00 0.09 -4.13 -0.54 -0.12 -0.01 -4.71 H 0.00 0.12 0.03 0.02 -0.01 0.01 0.18 I 18.00 0.03 -0.03 -0.17 -0.25 -0.03 -0.46 J 0.00
Percentage Change in Share Price
100.00 -10.71 16.67 -1.56 -4.53 99.86 A 99.86 117.07 16.00 9.82 8.33 -3.37 147.86 B 147.86
5.56 12.50 4.44 -1.69 -2.64 18.16 C 18.16 49.67 -1.98 2.36 1.32 -0.50 50.85 D 50.85 8.31 4.90 8.15 4.08 0.74 26.20 E 26.20
30.56 2.27 25.00 -5.95 -4.25 47.63 F 47.63 30.31 13.68 1.65 0.64 -1.34 44.94 G 44.94
483.33 0.00 25.00 -5.36 -4.57 498.41 H 0.00 34.42 0.00 0.00 0.00 0.00 34.42 I 34.42 8.13 4.38 1.67 -4.47 -5.35 4.36 J 4.36

Page 240
Appendix U: Cronbach’s Alpha Statistical Results This appendix shows the results of all Cronbach’s alpha statistical tests performed on
the multi-item questions.
ALL SECTIONS Scale reliability alpha = 0.837024 (95% lower confidence limit = 0.794756) Variable dropped Alpha Change Section A Q6 0.831632 -0.00539 Q7 0.826695 -0.01033 Q8 0.826803 -0.01022 Section B Q5 0.826477 -0.01055 Section C Q3 0.823532 -0.01349 Q4 0.835515 -0.00151 Q5 0.823777 -0.01325 Q6 0.818468 -0.01856 Q7 0.821467 -0.01556 Q8 0.847946 0.010922 Q9 0.815921 -0.0211 Section D Q4.2 0.846484 0.009459 Section E Q7 0.845267 0.008243 Q9 0.824317 -0.01271 Section F Q1 0.831364 -0.00566 Q4 0.824106 -0.01292 Q6 0.834135 -0.00289 Q8 0.829565 -0.00746 Section G Q2 0.821309 -0.01572 Section A Scale reliability alpha = 0.575784 (95% lower confidence limit = 0.435789) Variable dropped Alpha Change Q6 0.417291 -0.15849 Q7 0.396456 -0.17933 Q8 0.589193 0.013409 Sections A and B

Page 241
Scale reliability alpha = 0.595229 (95% lower confidence limit = 0.472084) Variable dropped Alpha Change Q6 0.485661 -0.10957 Q7 0.481293 -0.11394 Q8 0.543237 -0.05199 Q5 0.575784 -0.01945 Sections A and E Scale reliability alpha = 0.539922 (95% lower confidence limit = 0.406016) Variable dropped Alpha Change Q6 0.453496 -0.08643 Q7 0.392129 -0.14779 Q8 0.443485 -0.09644 Q7 0.568511 0.028588 Q9 0.556277 0.016355 Sections A, B, and D Scale reliability alpha = 0.522833 (95% lower confidence limit = 0.383952) Variable dropped Alpha Change Q6 0.45605 -0.06678 Q7 0.388978 -0.13385 Q8 0.431638 -0.09119 Q5 0.453155 -0.06968 Q4.2 0.595229 0.072397 Sections D and E Scale reliability alpha = 0.182232 (95% lower confidence limit = 0) Variable dropped Alpha Change Q4.2 0.061541 -0.12069 Q7 -0.03362 -0.21585 Q9 0.278469 0.096237 Sections B, D, and G Scale reliability alpha = 0.376533 (95% lower confidence limit = 0.170782) Variable dropped Alpha Change Q5 0.196991 -0.17954 Q4.2 0.422296 0.045763 Q2 0.239917 -0.13662 Sections B, D, E, and G

Page 242
Scale reliability alpha = 0.482747 (95% lower confidence limit = 0.332199) Variable dropped Alpha Change Q5 0.383403 -0.09934 Q4.2 0.482854 0.000107 Q2 0.327852 -0.15489 Q7 0.486602 0.003855 Q9 0.43846 -0.04429 Sections A, B, D, and G Scale reliability alpha = 0.61241 (95% lower confidence limit = 0.502708) Variable dropped Alpha Change Q6 0.564594 -0.04782 Q7 0.506926 -0.10548 Q8 0.570803 -0.04161 Q5 0.564413 -0.048 Q4.2 0.658701 0.046291 Q2 0.522833 -0.08958 Section C Scale reliability alpha = 0.756113 (95% lower confidence limit = 0.6884) Variable dropped Alpha Change Q3 0.741634 -0.01448 Q4 0.749256 -0.00686 Q5 0.734594 -0.02152 Q6 0.703287 -0.05283 Q7 0.677738 -0.07838 Q8 0.787358 0.031245 Q9 0.67122 -0.08489 Section E Scale reliability alpha = 0.061541 (95% lower confidence limit = 0) Variable dropped Alpha Change Q7 * * * Q9 * * * Section F Scale reliability alpha = 0.53891 (95% lower confidence limit = 0.39863) Variable dropped Alpha Change Q1 0.395772 -0.14314 Q4 0.511918 -0.02699 Q6 0.497514 -0.0414
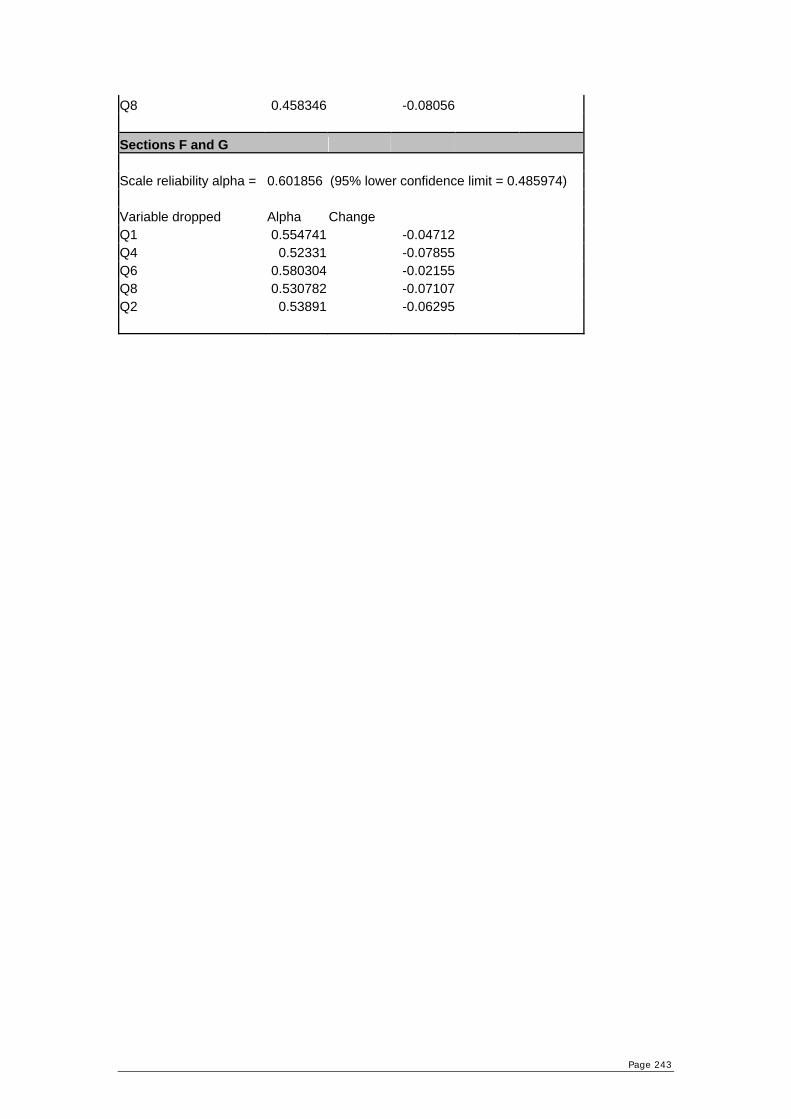
Page 243
Q8 0.458346 -0.08056 Sections F and G Scale reliability alpha = 0.601856 (95% lower confidence limit = 0.485974) Variable dropped Alpha Change Q1 0.554741 -0.04712 Q4 0.52331 -0.07855 Q6 0.580304 -0.02155 Q8 0.530782 -0.07107 Q2 0.53891 -0.06295

Page 244
Appendix V: Chi-Square Statistical Results
This appendix shows the chi-square results for the dichotomous questions in the
various sections of the questionnaire. The P value in chi-square answers this question:
If there is really no association between the variable that defines the rows and the
variable that defines the columns, then what is the chance that random sampling
would result in a chi-square value as large (or larger) as obtained in the experiment. A
P value lower than 0.001 indicates statistical significance and dependence on each
other.
Chi-squared Test for Independence - All Sections Chi-square: 1052.6 Degrees of Freedom: 94 Table size: 48 rows, 3 columns. The P value is < 0.0001. The row and column variables are significantly associated.
Section Question Row Total Percent
2.1 1 96 2.42% 2.2 2 44 1.11% 2.3 3 44 1.11% 2.4 4 44 1.11% 2.5 5 44 1.11%
3 6 96 2.42% 4 7 96 2.42%
A
5 8 96 2.42% 1 9 96 2.42% 2 10 96 2.42% 3 11 96 2.42%
4.1 12 96 2.42% B
4.2 13 55 1.39% 1 14 96 2.42% C
2.1 15 69 1.74% 1 16 96 2.42% 2 17 96 2.42% 3 18 96 2.42% 4 19 96 2.42%
4.1 20 68 1.72% 5 21 96 2.42%
D
6 22 96 2.42% 2 23 96 2.42% E 3 24 96 2.42%

Page 245
4 25 96 2.42% 5 26 96 2.42% 6 27 96 2.42%
6.1 28 96 2.42% 8 29 96 2.42% 2 30 96 2.42% 3 31 96 2.42%
5.1 32 96 2.42% 5.2 33 96 2.42% 5.3 34 96 2.42% 7.1 35 96 2.42%
F
7.2 36 96 2.42% 1 37 96 2.42% 3 38 96 2.42% 4 39 34 0.86% 5 40 96 2.42% 6 41 96 2.42%
6.1 42 96 2.42%
G
6.2 43 96 2.42% 1 44 96 2.42%
2.1 45 26 0.66% 2.2 46 26 0.66% 2.3 47 26 0.66%
H
3 48 26 0.66% Total 3962 100.00% Section A Contingency table analysis Observed 44 18 34 96 Observed 33 9 2 44 Observed 32 10 2 44 Observed 34 6 4 44 Observed 36 4 4 44 Observed 66 6 24 96 Observed 59 6 31 96 Observed 65 7 24 96 Total 369 66 125 560 TOTAL number of cells = 24
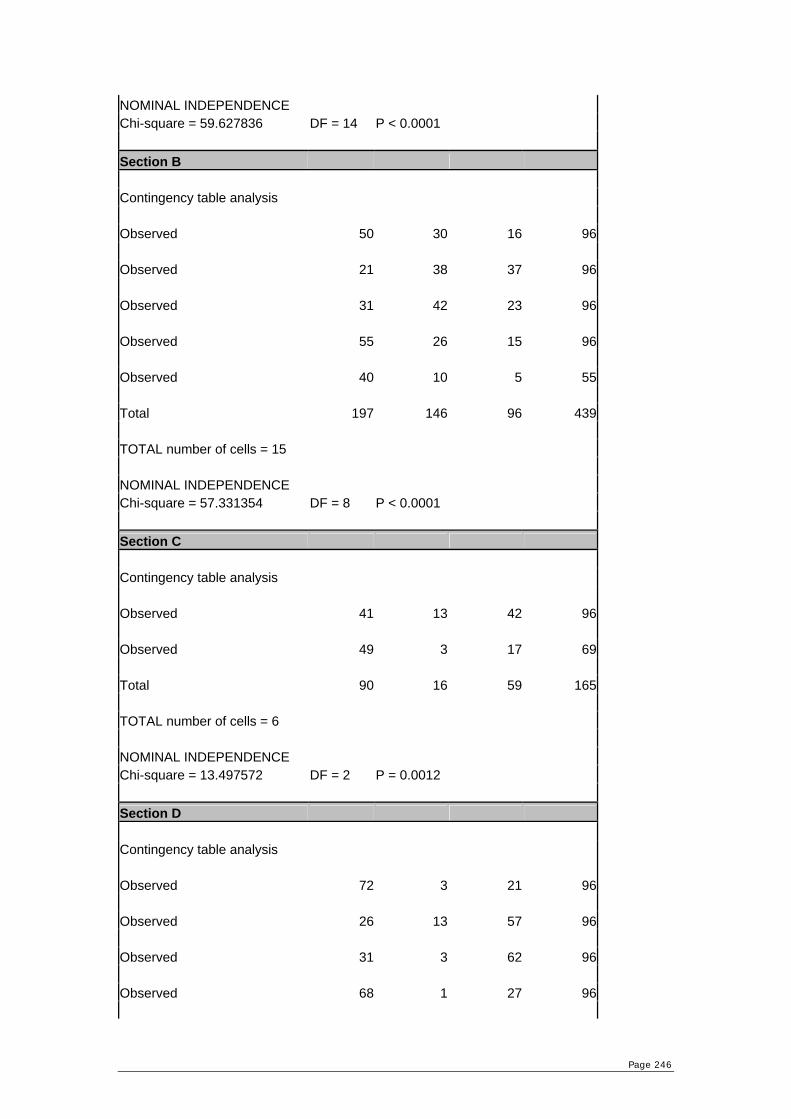
Page 246
NOMINAL INDEPENDENCE Chi-square = 59.627836 DF = 14 P < 0.0001 Section B Contingency table analysis Observed 50 30 16 96 Observed 21 38 37 96 Observed 31 42 23 96 Observed 55 26 15 96 Observed 40 10 5 55 Total 197 146 96 439 TOTAL number of cells = 15 NOMINAL INDEPENDENCE Chi-square = 57.331354 DF = 8 P < 0.0001 Section C Contingency table analysis Observed 41 13 42 96 Observed 49 3 17 69 Total 90 16 59 165 TOTAL number of cells = 6 NOMINAL INDEPENDENCE Chi-square = 13.497572 DF = 2 P = 0.0012 Section D Contingency table analysis Observed 72 3 21 96 Observed 26 13 57 96 Observed 31 3 62 96 Observed 68 1 27 96

Page 247
Observed 43 5 20 68 Observed 27 10 59 96 Observed 57 27 12 96 Total 324 62 258 644 TOTAL number of cells = 21 NOMINAL INDEPENDENCE Chi-square = 167.019283 DF = 12 P < 0.0001 Section E Contingency table analysis Observed 20 25 51 96 Observed 52 8 36 96 Observed 67 13 16 96 Observed 46 20 30 96 Observed 65 11 20 96 Observed 61 19 16 96 Observed 59 23 14 96 Total 370 119 183 672 TOTAL number of cells = 21 NOMINAL INDEPENDENCE Chi-square = 87.215175 DF = 12 P < 0.0001 Section F Contingency table analysis Observed 77 10 9 96 Observed 82 8 6 96 Observed 73 9 14 96 Observed 88 5 3 96 Observed 38 50 8 96

Page 248
Observed 74 17 5 96 Observed 47 32 17 96 Total 479 131 62 672 TOTAL number of cells = 21 NOMINAL INDEPENDENCE Chi-square = 134.571087 DF = 12 P < 0.0001 Section G Contingency table analysis Observed 36 24 36 96 Observed 34 5 57 96 Observed 28 2 4 34 Observed 65 9 22 96 Observed 57 14 25 96 Observed 47 38 11 96 Observed 24 42 30 96 Total 291 134 185 610 TOTAL number of cells = 21 NOMINAL INDEPENDENCE Chi-square = 140.996079 DF = 12 P < 0.0001 Section H Contingency table analysis Observed 25 46 25 96 Observed 20 4 2 26 Observed 20 3 3 26 Observed 17 4 5 26 Observed 11 8 7 26

Page 249
Total 93 65 42 200 TOTAL number of cells = 15 NOMINAL INDEPENDENCE Chi-square = 41.266207 DF = 8 P < 0.0001

Page 250
Appendix W: Simple Linear Regression The simple linear regression in this appendix tries to ascertain if there is any link
between ROE and any TQM principle. ROE is used because TQM had the largest
impact on this financial indicator. The equation for ROE and each TQM principle is:
))(Pr()( tIndependenincipleTQMbaDependentROE +=
ROE and Top Management Involvement
Regression Statistics Multiple R 0.119871803 R Square 0.014369249 Adjusted R Square -0.108834595 Standard Error 159.9123377 Observations 10 ANOVA
df SS MS F Significance FRegression 1 2982.454056 2982.454056 0.116629877 0.741515955Residual 8 204575.6459 25571.95574 Total 9 207558.1
Coefficients Standard Error t Stat P-value Intercept -72.67244494 99.77197489 -0.728385351 0.487148502 X Variable 1 3.502299899 10.25530126 0.341511167 0.741515955 ROE and Information Systems
Regression Statistics Multiple R 0.133064659 R Square 0.017706203 Adjusted R Square -0.105080521 Standard Error 159.6414083 Observations 10 ANOVA
df SS MS F Significance FRegression 1 3675.065928 3675.065928 0.144202913 0.71402044Residual 8 203883.0341 25485.37926 Total 9 207558.1
Coefficients Standard Error t Stat P-value Intercept 1.04059167 127.2113011 0.008180025 0.993673664 X Variable 1 -10.54763578 27.77589796 -0.379740586 0.71402044

Page 251
ROE and Strategic Quality Planning
Regression Statistics Multiple R 0.017304199 R Square 0.000299435 Adjusted R Square -0.124663135 Standard Error 161.0496623 Observations 10 ANOVA
df SS MS F Significance FRegression 1 62.15022364 62.15022364 0.0023962 0.962158397Residual 8 207495.9498 25936.99372 Total 9 207558.1
Coefficients Standard Error t Stat P-value Intercept -38.57864384 109.070759 -0.353702901 0.732702038 X Variable 1 -1.246321703 25.46059967 -0.048950996 0.962158397 ROE and Human Resource Development
Regression Statistics Multiple R 0.153884944 R Square 0.023680576 Adjusted R Square -0.098359352 Standard Error 159.1551934 Observations 10 ANOVA
df SS MS F Significance FRegression 1 4915.095338 4915.095338 0.194039576 0.671235497Residual 8 202643.0047 25330.37558 Total 9 207558.1
Coefficients Standard Error t Stat P-value Intercept -152.8217089 253.6737039 -0.602434176 0.563566972 X Variable 1 15.93043038 36.16449046 0.440499235 0.671235497

Page 252
ROE and Management of Process Quality
Regression Statistics Multiple R 0.564158731 R Square 0.318275073 Adjusted R Square 0.233059458 Standard Error 132.9932002 Observations 10 ANOVA
df SS MS F Significance FRegression 1 66060.5695 66060.5695 3.734938371 0.089361523Residual 8 141497.5305 17687.19131 Total 9 207558.1
Coefficients Standard Error t Stat P-value Intercept -306.1090897 142.342163 -2.150515934 0.063724048 X Variable 1 35.41476419 18.32494308 1.932598864 0.089361523 ROE and Customer Focus and Satisfaction
Regression Statistics Multiple R 0.127008972 R Square 0.016131279 Adjusted R Square -0.106852311 Standard Error 159.7693347 Observations 10 ANOVA
df SS MS F Significance FRegression 1 3348.177607 3348.177607 0.131166109 0.72660645Residual 8 204209.9224 25526.2403 Total 9 207558.1
Coefficients Standard Error t Stat P-value Intercept 34.65406181 221.0925993 0.156740035 0.879333146 X Variable 1 -6.235156469 17.21616988 -0.362168619 0.72660645

Page 253
ROE and Management Structure and Teams
Regression Statistics Multiple R 0.284055308 R Square 0.080687418 Adjusted R Square -0.034226654 Standard Error 154.4388118 Observations 10 ANOVA
df SS MS F Significance FRegression 1 16747.32722 16747.32722 0.702154369 0.426385218Residual 8 190810.7728 23851.3466 Total 9 207558.1
Coefficients Standard Error t Stat P-value Intercept -123.8944415 107.8698204 -1.148555185 0.283920195 X Variable 1 27.99633227 33.41064331 0.837946519 0.426385218 ROE and Cost of Quality
Regression Statistics Multiple R 0.661779346 R Square 0.437951903 Adjusted R Square 0.367695891 Standard Error 120.7567985 Observations 10 ANOVA
df SS MS F Significance FRegression 1 90900.4649 90900.4649 6.233657305 0.037130794Residual 8 116657.6351 14582.20439 Total 9 207558.1
Coefficients Standard Error t Stat P-value Intercept 43.72773088 51.70309063 0.845746944 0.422267706 X Variable 1 -203.3358198 81.44087469 -2.496729322 0.037130794
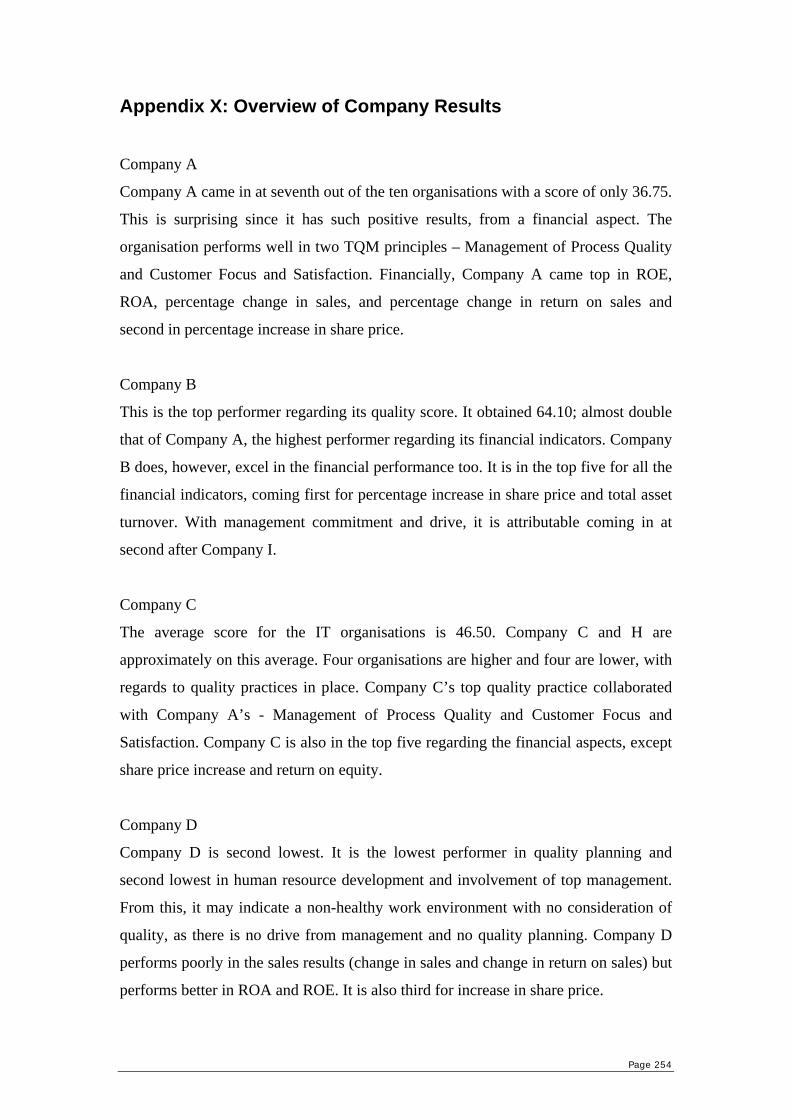
Page 254
Appendix X: Overview of Company Results
Company A
Company A came in at seventh out of the ten organisations with a score of only 36.75.
This is surprising since it has such positive results, from a financial aspect. The
organisation performs well in two TQM principles – Management of Process Quality
and Customer Focus and Satisfaction. Financially, Company A came top in ROE,
ROA, percentage change in sales, and percentage change in return on sales and
second in percentage increase in share price.
Company B
This is the top performer regarding its quality score. It obtained 64.10; almost double
that of Company A, the highest performer regarding its financial indicators. Company
B does, however, excel in the financial performance too. It is in the top five for all the
financial indicators, coming first for percentage increase in share price and total asset
turnover. With management commitment and drive, it is attributable coming in at
second after Company I.
Company C
The average score for the IT organisations is 46.50. Company C and H are
approximately on this average. Four organisations are higher and four are lower, with
regards to quality practices in place. Company C’s top quality practice collaborated
with Company A’s - Management of Process Quality and Customer Focus and
Satisfaction. Company C is also in the top five regarding the financial aspects, except
share price increase and return on equity.
Company D
Company D is second lowest. It is the lowest performer in quality planning and
second lowest in human resource development and involvement of top management.
From this, it may indicate a non-healthy work environment with no consideration of
quality, as there is no drive from management and no quality planning. Company D
performs poorly in the sales results (change in sales and change in return on sales) but
performs better in ROA and ROE. It is also third for increase in share price.

Page 255
Company E
If Company J’s results are ignored due to the lack of participation, Company E is third
highest, with its TQM results, with a score of 57.14. Company E shows above average
results in involvement of top management, information systems, and management of
quality. Financially, it scores highly in ROE and total asset turnover. The financial
results are not low in any other particular financial indicators but fail to excel in
others.
Company F
Company F obtains third lowest with a score of 35.79. The lowest four organisations
have similar results ranging between 33 and 37. Company F has the worst result for
customer focus and satisfaction and shows a definite lack of commitment from
management. Company F has, overall, lower results than most except in total asset
turnover and percentage share in sales. It does, however, obtain negative results for
percentage change in return on sales and ROE.
Company G
This is the lowest performing organisation obtaining a score of 33.05. This is not
reflected in the financial indicators, as some results seem average. It came second for
percentage change in return on sales and total asset turnover, however, obtained
negative results for ROA and ROE.
Company H
Company H is the second organisation with the average TQM score. The reason for
this is the poor result for management of quality, management structure and teams,
and involvement and drive of management, in quality aspects. Financially,
organisation H is the lowest, obtaining negative results in all financial indicators
except share price and total asset turnover where it is below average.
Company I
Company I has the second highest score indicating better quality principles in place. It
scores most where quality should be from – top management and employees (human
Page 256
resource development). The financial indicators are mostly above average excelling in
ROA and ROE but failing to make an impact on sales and share price increases.
Company J
Company J only managed to obtain one respondent. It performs well with a score of
58.59 in TQM. Financially it obtained negative and positive results.