Embed Size (px)
Citation preview

The Atlanta Regional CommissionThe Atlanta Regional CommissionTransportation ModelTransportation Model
Presentation Made to the 2004 TMIPPresentation Made to the 2004 TMIPNCDOT Modeling Peer ReviewNCDOT Modeling Peer Review

ARC Transportation Planning
• Departmental Organization
– Long Range Planning
– Short Range Planning
– Modeling, Analysis & Data
– Air Quality

What is the Atlanta Region?
HALL
FULTON
COBB
CARROLL
BARTOW
COWETA
HENRY
GWINNETT
CHEROKEE
WALTON
DEKALB
NEWTON
PAULDING
FORSYTH
FAYETTE
DOUGLAS
SPALDING
BARROW
CLAYTON
ROCKDALE
FLOYD
CHATTOOGA
GORDONPICKENS
DAWSON
LUMPKIN
WHITE HABERSHA
BANK
JACKSON
MOR
JASPER
PUT
BUTTS
MONROE
LAMARPIKEMERIWETHER
TROUP
HEARD
UPSON
HARALSON
POLK
WALKERMURRAY
GILMER
FANNINUNION
N
5 0 5 10 15 Miles
EXISTING AND PROPOSED PLANNING AND NON-ATTAINMENT BOUNDARIES FOR THE ATLANTA REGION
Existing 10-County ARC Planning Area
Existing 13-County Non-Attainment Area
19 Counties containing a portionof 2000 Atlanta Urbanized Area
Proposed 20-CountyNon-Attainment Area
• 10-county ARC planningarea
• 19 counties containing aportion of 2000 Atlanta UAB(ARC will likely expand to 18counties)
• 13 counties classified asSerious ozonenonattainment area by 1990CAAA (reclassification toSevere effective January2004)
• 20 counties proposed for 8-hour nonattainment area

2.02.7
3.74.2
5.1
6.0
1.21.8
2.53.0
3.64.2
0.0
1.0
2.0
3.0
4.0
5.0
6.0
7.0
1980 1990 2000 2010 2020 2030
Population Employment
MIL
LIO
NS
Number One Challenge - Growth
(13 County Non-attainment Area)

ARC Travel Demand Modeling Team
Guy Rousseau, Program ManagerModeling Applications & Models Development
Claudette Dillard, Principal PlannerHighway Network Coding, Surveys & Studies
Curt Davis, Principal PlannerHighway Network Coding, Database Implementation
Laura Chen, Senior PlannerHighway Network Coding, GIS-T & Census / SE Data
Kandace Lewis, Senior PlannerHighway Network Coding, Performance Measures
Jean Hee Park, Senior PlannerTransit Network Coding, Development of Regional Impact (DRI)
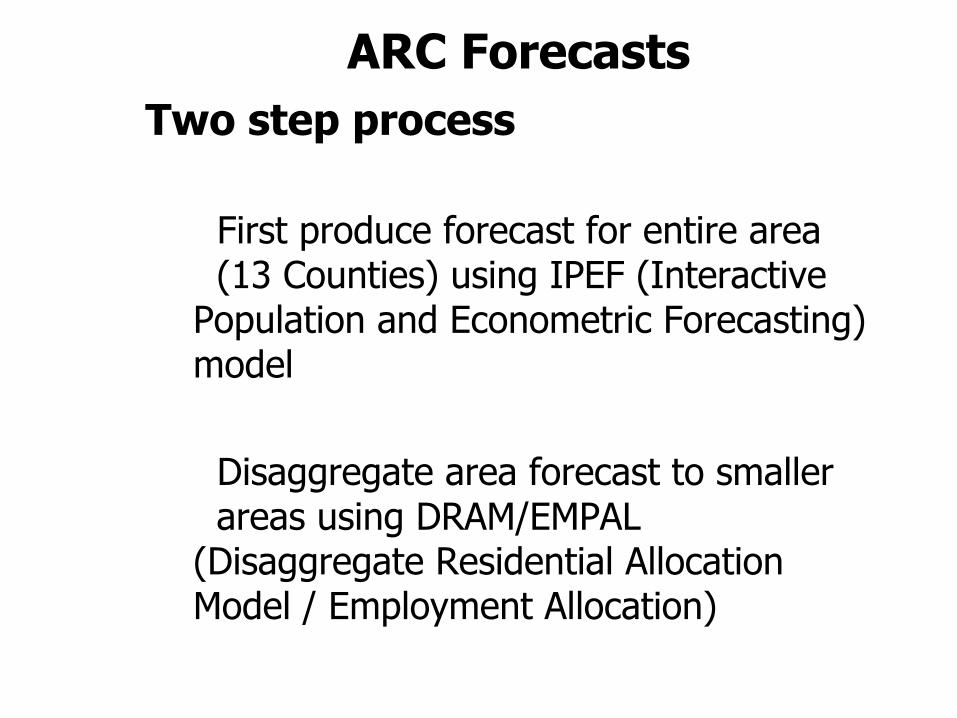
Two step process
• First produce forecast for entire area (13 Counties) using IPEF (InteractivePopulation and Econometric Forecasting)model
• Disaggregate area forecast to smaller areas using DRAM/EMPAL(Disaggregate Residential AllocationModel / Employment Allocation)
ARC Forecasts

Surveys and Studies•2000-1 Household Travel Survey (SMARTRAQ):
2-day survey, 8000 households surveyed, or about 1/200 household•2001 Transit On-Board Survey•1999 Establishment Survey•2000 Hartsfield Jackson International Airport Survey•2000-2001 Speed Studies & Travel Time StudiesTraffic Modeling Platform/Environment•Converted Model Stream from TRANPLAN to TP+Socio-Economic (SE) Data•Updated Using Census 2000 Datasets (CTPP)•Updated Base Year 2000 Colleges & Universities Enrollment•589 Census Tracts (from DRAM/EMPAL) SE Data
disaggregated into 1683 internal TAZ

ARC Highway Networks & Related TAZ structure
• Expanded Zonal Structure from 948 internal TAZto 1683, maintained External Stations to 57zones, for a grand total of 1740 TAZ, comparedto 1005 previously
• QA/QC 2000 Base Year Highway Network usingGIS-T techniques and Aerial Photography
• Revisited Centroid Connectors to accommodatenew internal TAZ geometric reconfiguration
• Expanded facility type definitions• Refined Facility Types Definitions using ARC
CMS Strategic Arterial System Definitions• Updated Free-Flow Speeds and Capacities
Look-Up Tables, based upon 2000-2001 traveltimes and speed studies
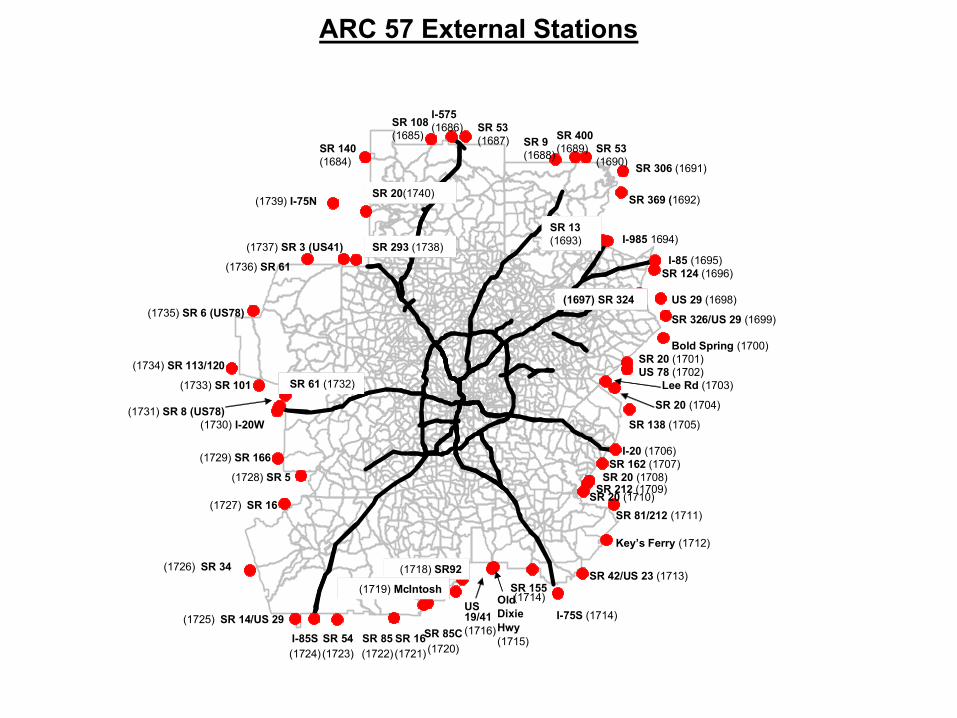
ARC 57 External Stations
SR 140(1684)
SR 108(1685)
I-575 (1686) SR 53
(1687) SR 9 (1688)
SR 400 (1689) SR 53
(1690) SR 306 (1691)
SR 369 (1692)
SR 13 (1693) I-985 1694)
I-85 (1695)SR 124 (1696)
(1697) SR 324 US 29 (1698)
SR 326/US 29 (1699)
Bold Spring (1700)SR 20 (1701)US 78 (1702)
Lee Rd (1703)
SR 20 (1704)
SR 138 (1705)
I-20 (1706)SR 162 (1707)
SR 20 (1708)SR 212 (1709)
SR 20 (1710)
SR 81/212 (1711)
Key’s Ferry (1712)
SR 42/US 23 (1713)
I-75S (1714)
SR 155(1714)Old
Dixie Hwy (1715)
US 19/41(1716)
(1718) SR92
(1719) McIntosh
SR 85C(1720)
SR 16(1721)
SR 85(1722)
SR 54(1723)
I-85S(1724)
(1725) SR 14/US 29
(1726) SR 34
(1727) SR 16
(1728) SR 5
(1729) SR 166
(1730) I-20W(1731) SR 8 (US78)
SR 61 (1732)(1733) SR 101
(1734) SR 113/120
(1735) SR 6 (US78)
(1736) SR 61
(1737) SR 3 (US41) SR 293 (1738)
(1739) I-75NSR 20(1740)

ARC Facility Types0 Centroid Connectors1 Interstate / Freeway2 Parkway3 HOV Buffer Separated4 HOV Barrier Separated5 High Speed Ramp / CD Road6 Medium Speed Ramp7 Low Speed Ramp8 Loop Ramp9 Off Ramp w/ Intersection10 On Ramp w/ Intersection11 Expressway12 Principal Arterial - Class I13 Principal Arterial - Class II14 Minor Arterial - Class I15 Minor Arterial - Class II16 HOV - Arterial (all classes)17 Major Collector18 Minor Collector / Other Local19 Planned Ramps w/ Intersections20 Planned Directional Ramps50 Transit Only Link: Neighborhood Local51 Transit Only Link: Local Roads and Collectors52 Transit Only Link: Park-n-ride lot connector53 Transit Only Link: Transfer links between rail and bus54 Associated with BRT Routes (Future year coding)
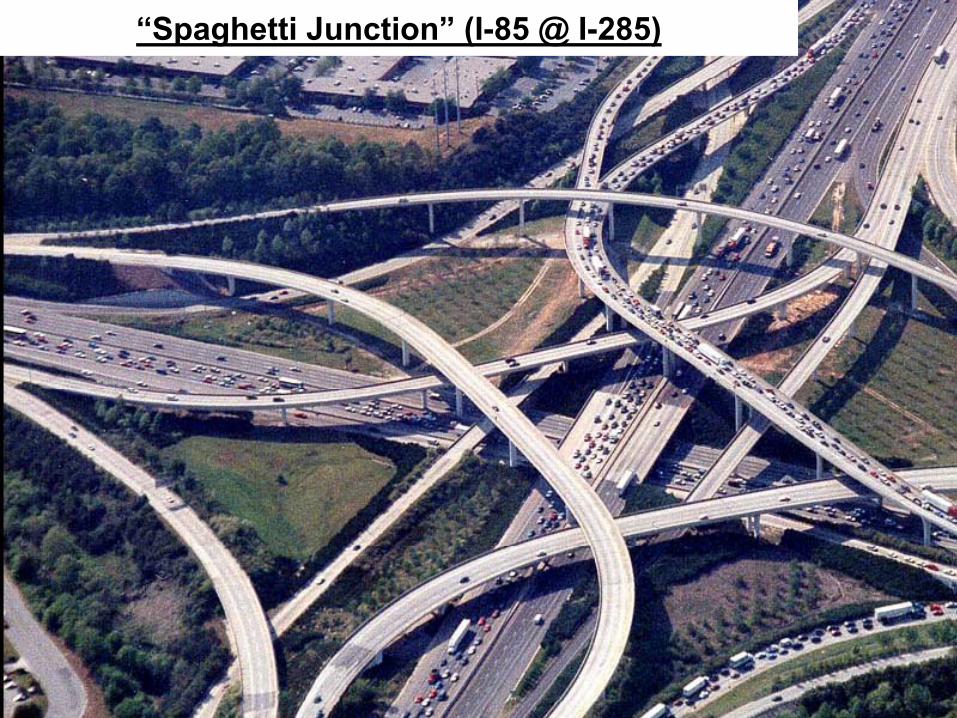
“Spaghetti Junction” (I-85 @ I-285)
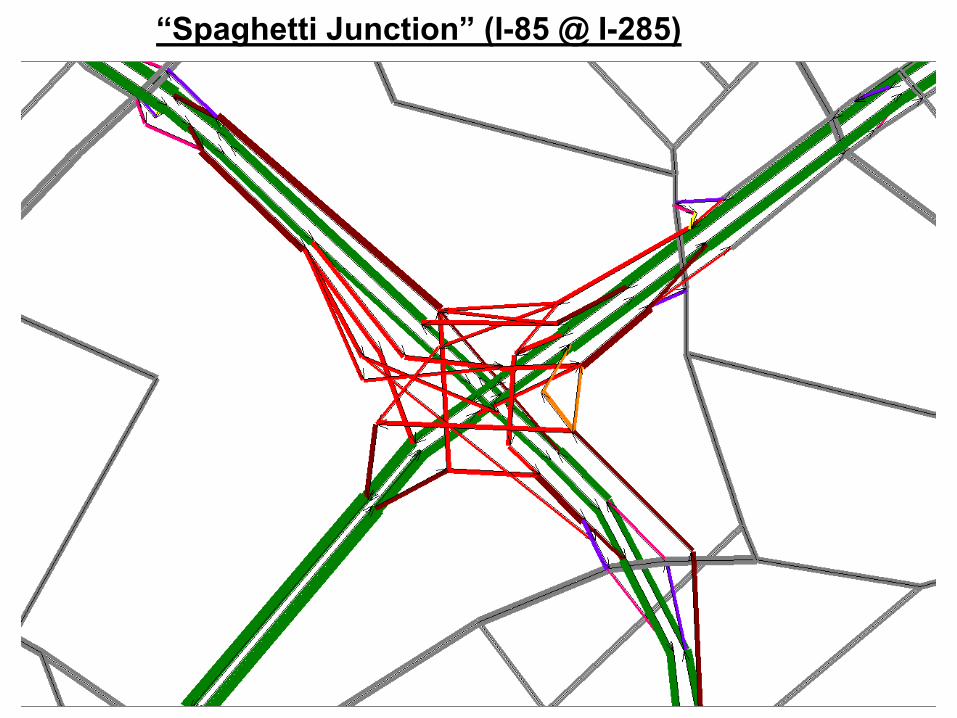
“Spaghetti Junction” (I-85 @ I-285)
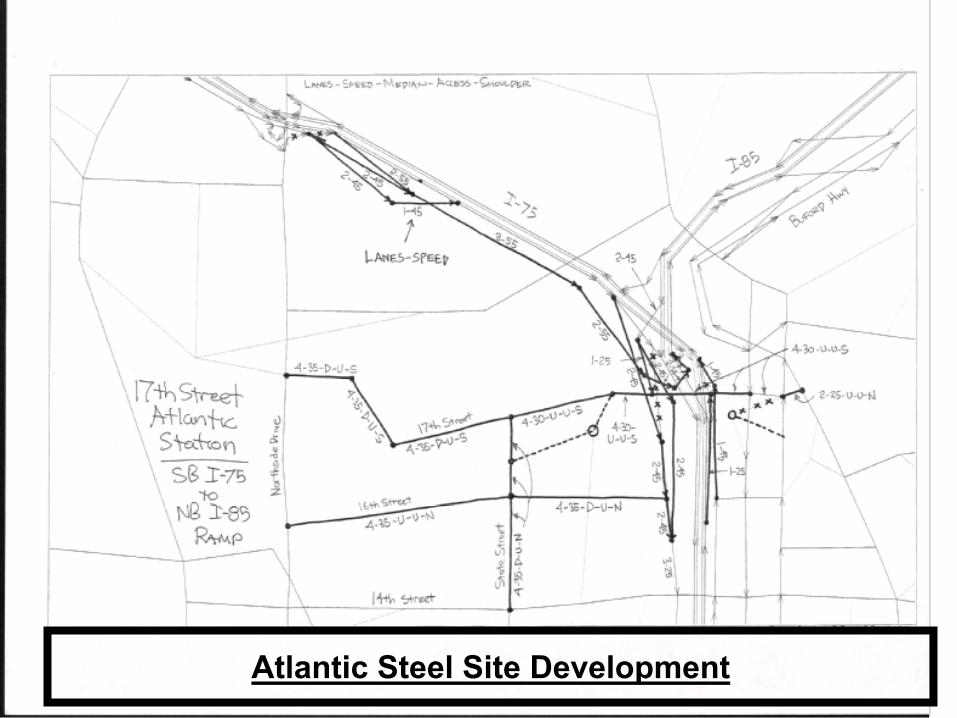
Atlantic Steel Site Development
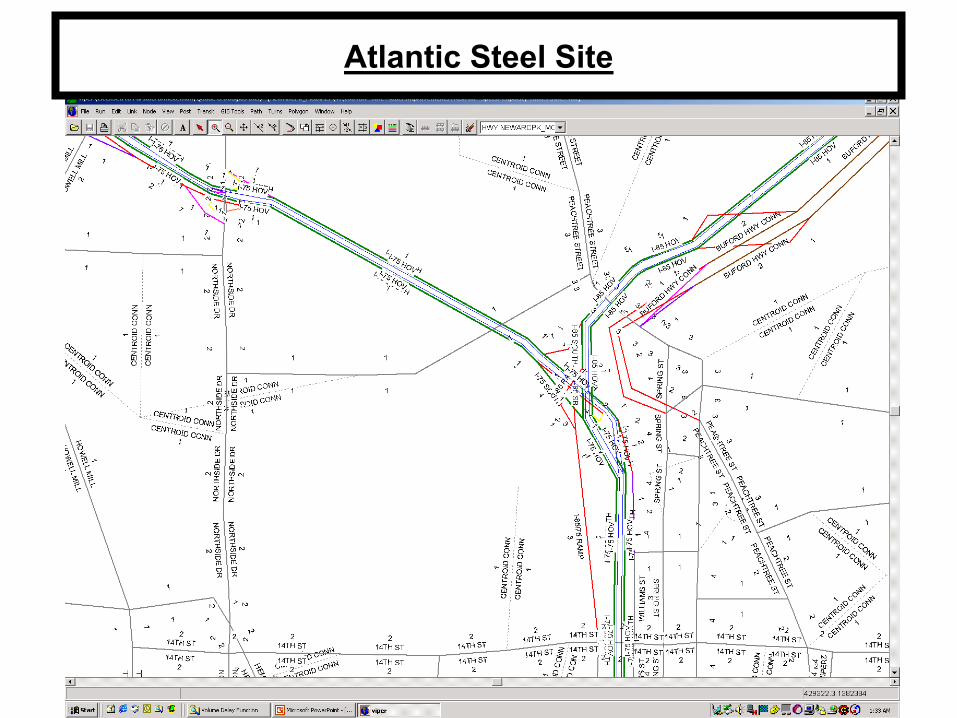
Atlantic Steel Site

Northside Drive @ I-75
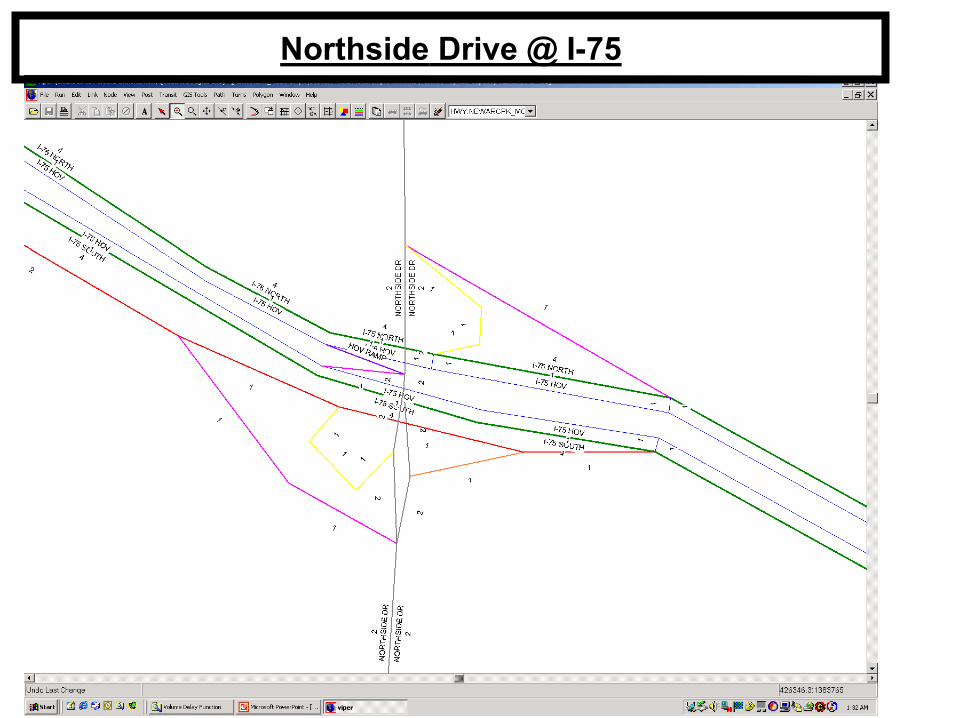
Northside Drive @ I-75
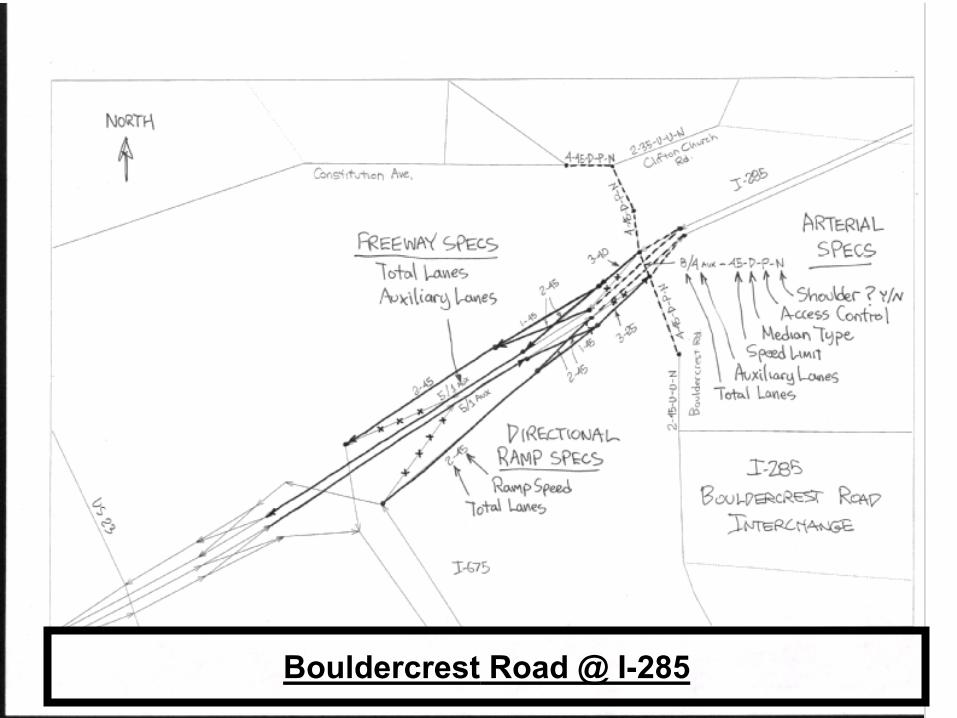
Bouldercrest Road @ I-285
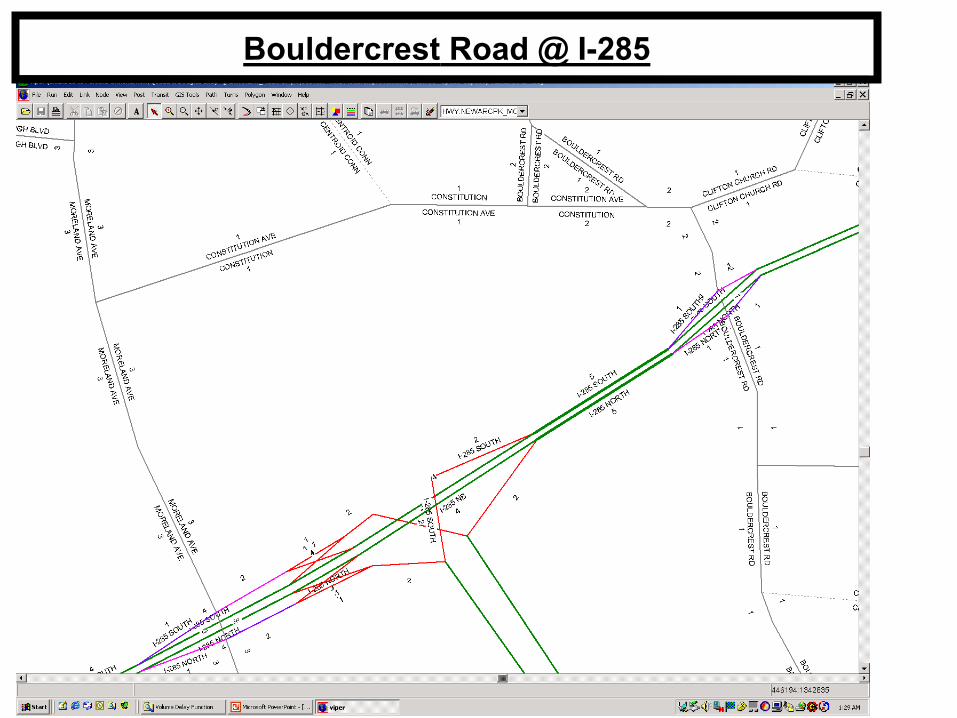
Bouldercrest Road @ I-285
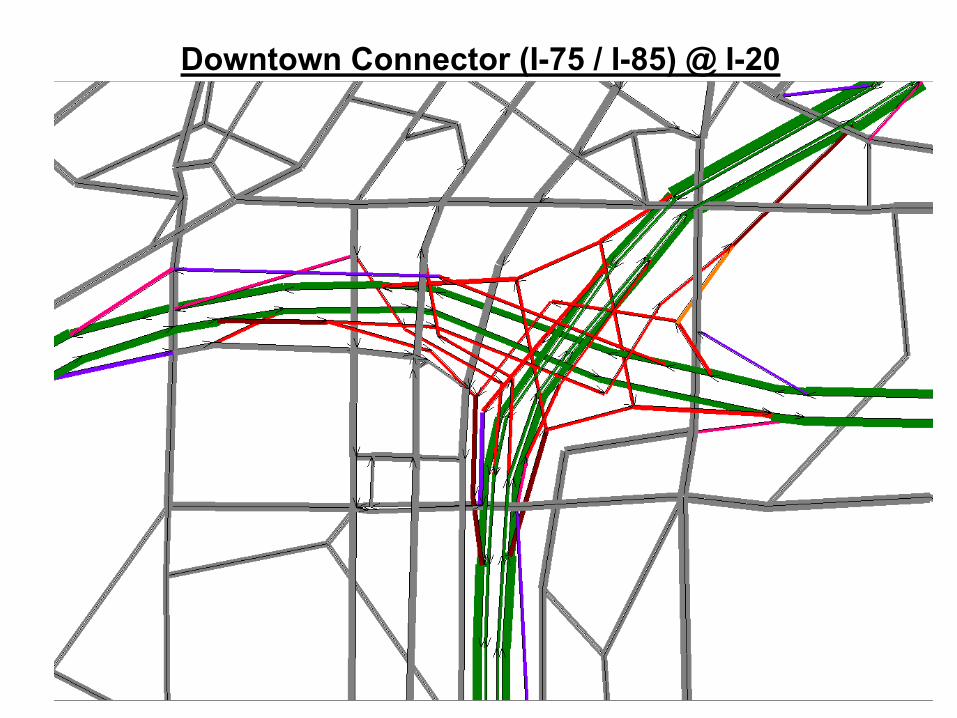
Downtown Connector (I-75 / I-85) @ I-20
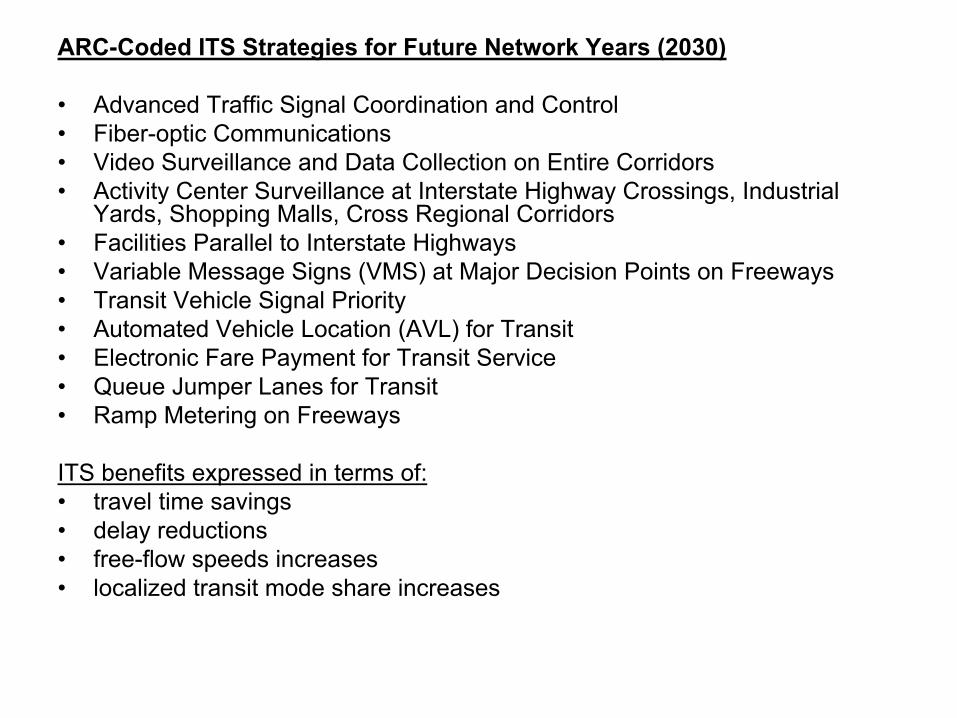
ARC-Coded ITS Strategies for Future Network Years (2030)
• Advanced Traffic Signal Coordination and Control• Fiber-optic Communications• Video Surveillance and Data Collection on Entire Corridors• Activity Center Surveillance at Interstate Highway Crossings, Industrial
Yards, Shopping Malls, Cross Regional Corridors• Facilities Parallel to Interstate Highways• Variable Message Signs (VMS) at Major Decision Points on Freeways• Transit Vehicle Signal Priority• Automated Vehicle Location (AVL) for Transit• Electronic Fare Payment for Transit Service• Queue Jumper Lanes for Transit• Ramp Metering on Freeways
ITS benefits expressed in terms of:• travel time savings• delay reductions• free-flow speeds increases• localized transit mode share increases
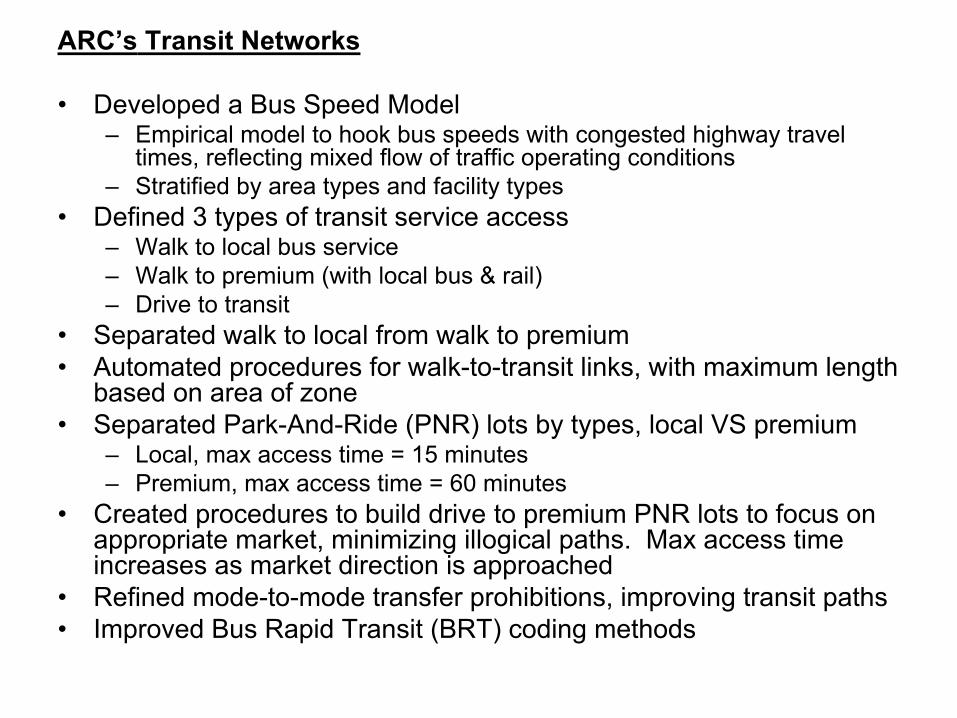
ARC’s Transit Networks
• Developed a Bus Speed Model– Empirical model to hook bus speeds with congested highway travel
times, reflecting mixed flow of traffic operating conditions– Stratified by area types and facility types
• Defined 3 types of transit service access– Walk to local bus service– Walk to premium (with local bus & rail)– Drive to transit
• Separated walk to local from walk to premium• Automated procedures for walk-to-transit links, with maximum length
based on area of zone• Separated Park-And-Ride (PNR) lots by types, local VS premium
– Local, max access time = 15 minutes– Premium, max access time = 60 minutes
• Created procedures to build drive to premium PNR lots to focus onappropriate market, minimizing illogical paths. Max access timeincreases as market direction is approached
• Refined mode-to-mode transfer prohibitions, improving transit paths• Improved Bus Rapid Transit (BRT) coding methods
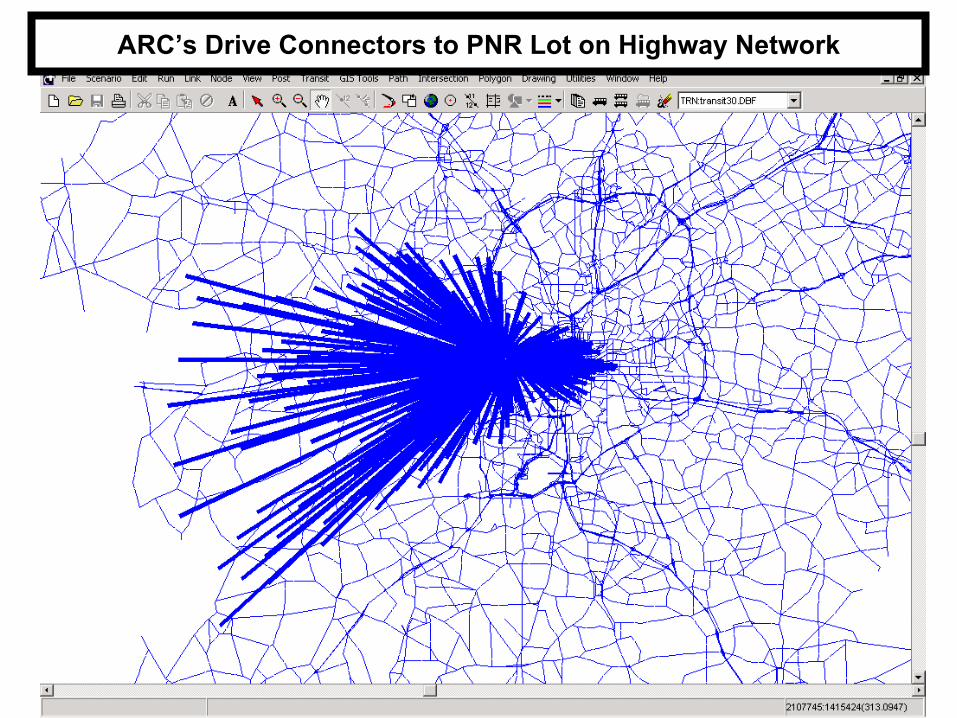
ARC’s Drive Connectors to PNR Lot on Highway Network
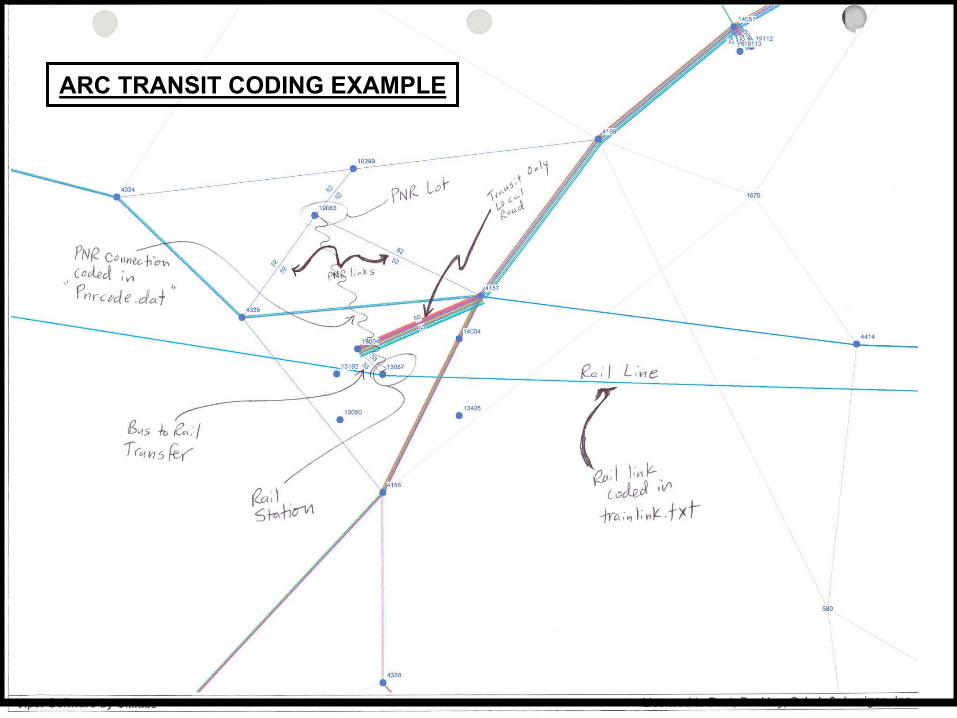
ARC TRANSIT CODING EXAMPLE

ARC’s Trip Generation• Production Model: Set of Logit Models stratified by trip
purposes and person types– 6 Trip Purposes
• HBW Home-Based Work• HBShop Home-Based Shop• HBO Home-Based Other• HBU Home-Based University (age of traveler: 19+)• HBSchool Home-Based Grade School (age of traveler: under 19)• NHB Non-Home Based
– 3 Person Types• Adult worker (age 16+ with full or part time job)• Non-Working Adult• Child (age 15 or younger)
– 5 Socio-Economic Independent Variables, by household• Household size (1,2,3,4+)• Household income ($0-$20K, 20-50, 50-100, $100K+)• Workers per Household (0,1,2,3+)• Children per Household (0,1,2,3+)• Autos per Household (0,1,2,3+)

ARC’s Trip Generation – Production Model– Estimates probabilities of a person making:
• 0 trip, I trip, 2 trips, 3 trips, 4+ trips– Converts to trip rates/person by person type– Estimates non-motorized trips, including consideration of
household access by income for transit and highway time– Based on 2000-2001 household travel survey
ARC’s Trip Generation – Attraction Model– Cross classification for HBW, HBShop, HBO, NHB
Regression for HBSchool, HBU– Stratified by 4 trip purposes, all 4 are a 2-way cross-class matrix
of trip rates per employee, or person, or household.– Trip rates for each of the 4 purposes, one for each type of
demographic data: types of households, persons andemployment (8 types, construction, manufacturing, retail, TCU,wholesale, FIRE, service, government), and one for each of the7 area types (based on density, CBD, Urb Com, Urb Res,Suburb Com, Suburb Res, Exurb, Rural)
– Based on 1999 Establishment Survey

ARC’s Trip Distribution• Use separate gravity model for each of the
6 trip purposes• Separate friction factors for each of the 6
trip purposes by the 4 income groups• Composite time (highway and transit time)
used as impedance variable• HBW uses AM peak period skims• All other trip purposes use free-flow skims
with separate topographic penalties added,those are area biases, such as theChattahoochee River

0.0%
1.0%
2.0%
3.0%
4.0%
5.0%
6.0%
7.0%
8.0%
9.0%
0 5 10 15 20 25 30 35 40 45 50 55 60 65 70 75 80 85 90 95 100
Travel Time (in minutes)
Perc
ent o
f Tri
ps
O-D Average Trip Length = 23.79 Min. Intrazonal Trips = 3,449
GM Average Trip Length = 23.60 Min. Intrazonal Trips = 2,684
ARC’s Trip Length Frequency Distribution (TLFD)HBW Income Group 1 Trips (O-D vs. GM)Using AM Peak Period Composite Time
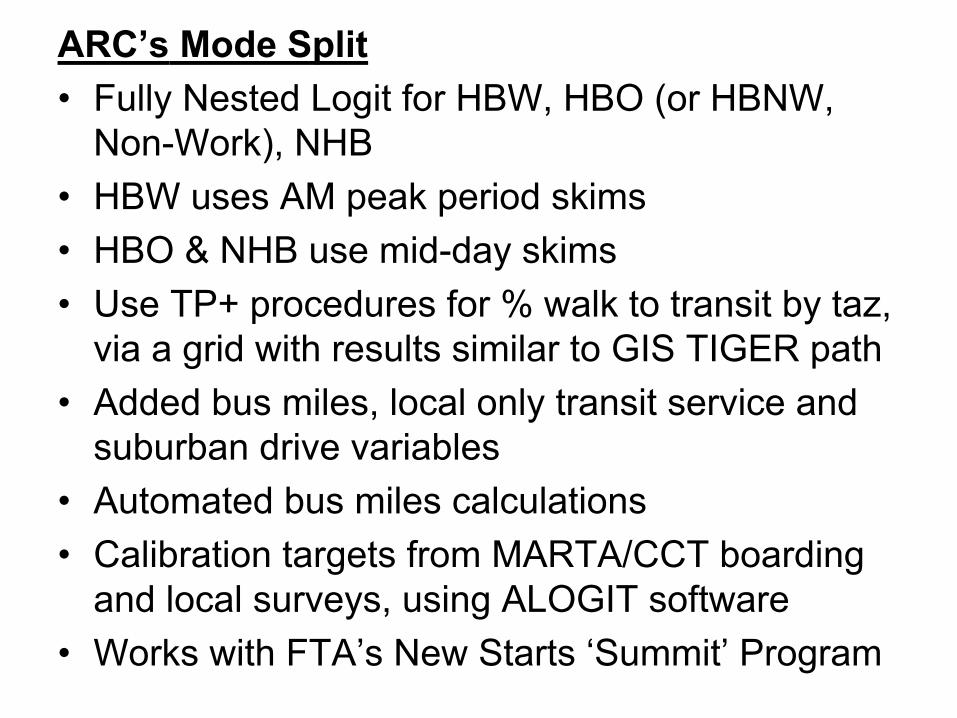
ARC’s Mode Split• Fully Nested Logit for HBW, HBO (or HBNW,
Non-Work), NHB• HBW uses AM peak period skims• HBO & NHB use mid-day skims• Use TP+ procedures for % walk to transit by taz,
via a grid with results similar to GIS TIGER path• Added bus miles, local only transit service and
suburban drive variables• Automated bus miles calculations• Calibration targets from MARTA/CCT boarding
and local surveys, using ALOGIT software• Works with FTA’s New Starts ‘Summit’ Program
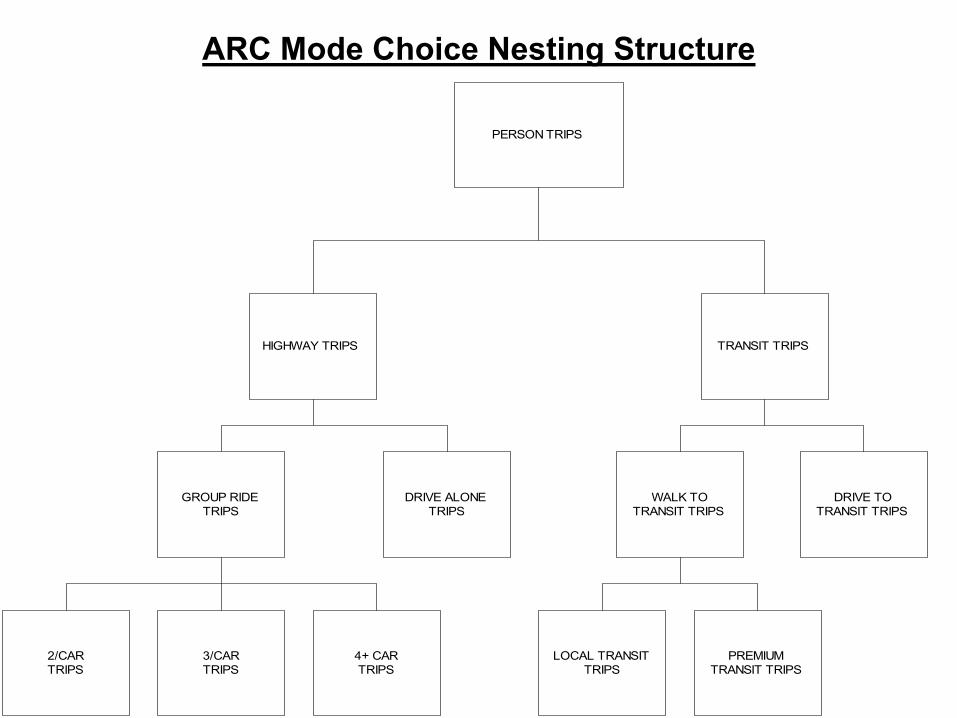
ARC Mode Choice Nesting Structure
PERSON TRIPS
HIGHWAY TRIPS TRANSIT TRIPS
GROUP RIDETRIPS
DRIVE ALONETRIPS
WALK TOTRANSIT TRIPS
DRIVE TOTRANSIT TRIPS
LOCAL TRANSITTRIPS
PREMIUMTRANSIT TRIPS
2/CARTRIPS
3/CARTRIPS
4+ CARTRIPS
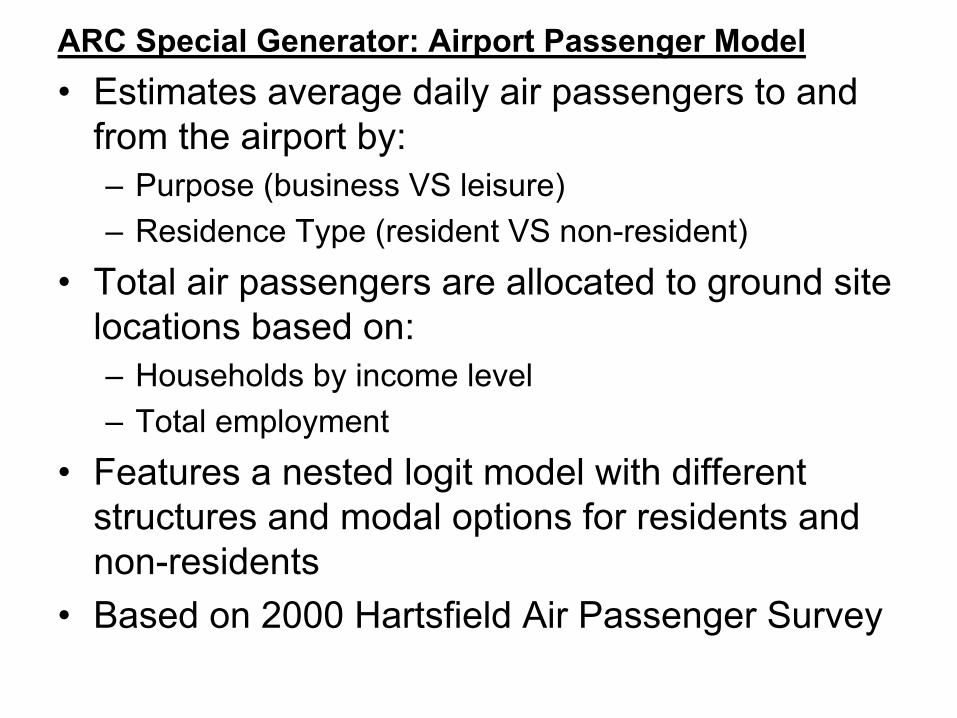
ARC Special Generator: Airport Passenger Model• Estimates average daily air passengers to and
from the airport by:– Purpose (business VS leisure)– Residence Type (resident VS non-resident)
• Total air passengers are allocated to ground sitelocations based on:– Households by income level– Total employment
• Features a nested logit model with differentstructures and modal options for residents andnon-residents
• Based on 2000 Hartsfield Air Passenger Survey
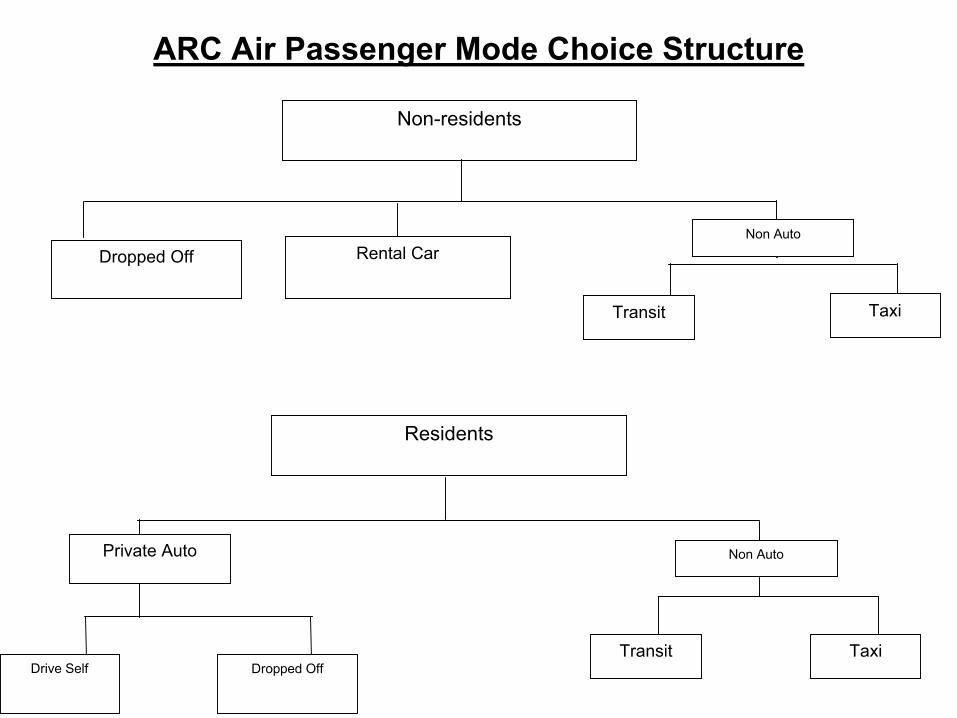
ARC Air Passenger Mode Choice Structure
Non-residents
Dropped Off Rental CarNon Auto
Transit Taxi
Non Auto
Transit Taxi
Residents
Drive Self Dropped Off
Private Auto
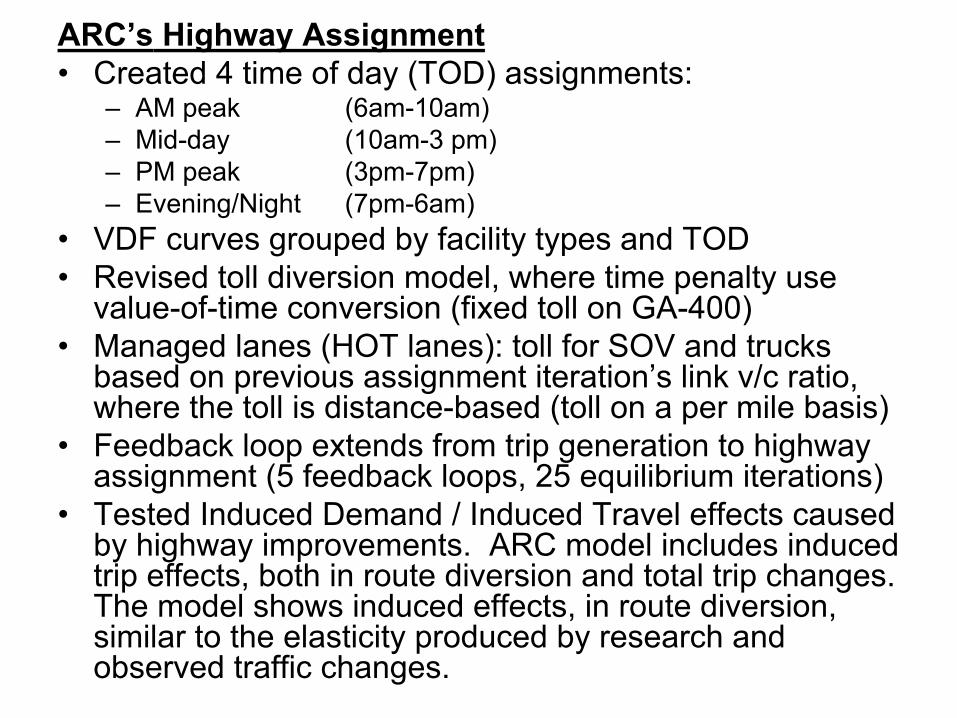
ARC’s Highway Assignment• Created 4 time of day (TOD) assignments:
– AM peak (6am-10am)– Mid-day (10am-3 pm)– PM peak (3pm-7pm)– Evening/Night (7pm-6am)
• VDF curves grouped by facility types and TOD• Revised toll diversion model, where time penalty use
value-of-time conversion (fixed toll on GA-400)• Managed lanes (HOT lanes): toll for SOV and trucks
based on previous assignment iteration’s link v/c ratio,where the toll is distance-based (toll on a per mile basis)
• Feedback loop extends from trip generation to highwayassignment (5 feedback loops, 25 equilibrium iterations)
• Tested Induced Demand / Induced Travel effects causedby highway improvements. ARC model includes inducedtrip effects, both in route diversion and total trip changes.The model shows induced effects, in route diversion,similar to the elasticity produced by research andobserved traffic changes.
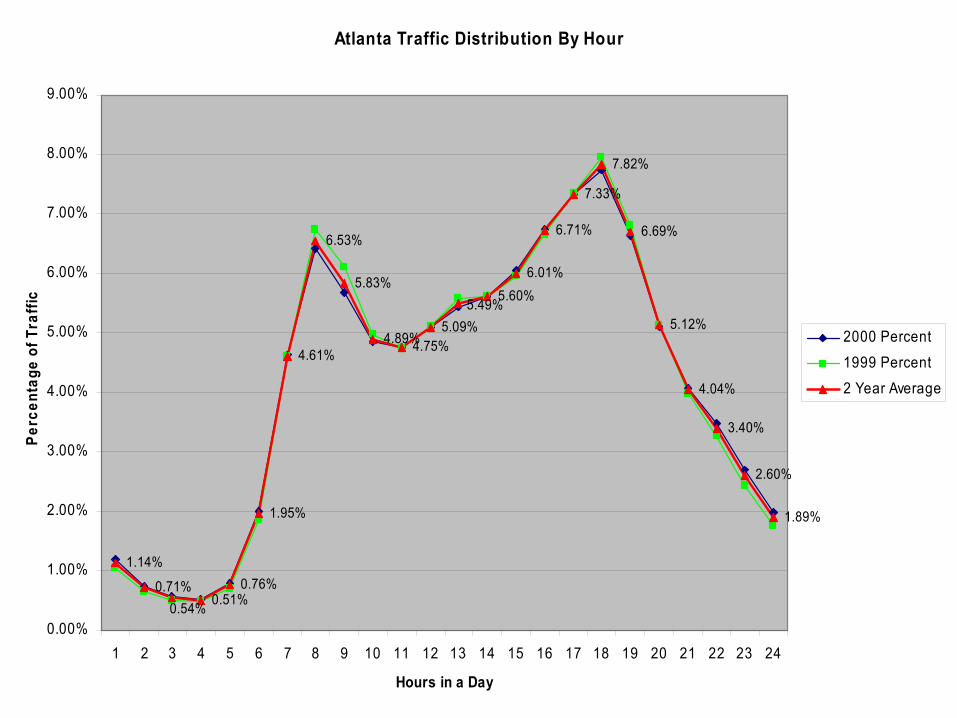
Atlanta Traffic Distribution By Hour
1.14%
0.71%0.51%
0.76%
1.95%
4.61%
6.53%
5.83%
4.89%4.75%5.09%
5.60%6.01%
6.71%
7.33%
7.82%
6.69%
5.12%
4.04%
3.40%
2.60%
1.89%
5.49%
0.54%0.00%
1.00%
2.00%
3.00%
4.00%
5.00%
6.00%
7.00%
8.00%
9.00%
1 2 3 4 5 6 7 8 9 10 11 12 13 14 15 16 17 18 19 20 21 22 23 24
Hours in a Day
Perc
enta
ge o
f Tra
ffic
2000 Percent
1999 Percent
2 Year Average

AM Period Volume-Delay Functions
0.00
0.20
0.40
0.60
0.80
1.00
1.20
0.00
0.10
0.20
0.30
0.40
0.50
0.60
0.70
0.80
0.90
1.00
1.10
1.20
1.30
1.40
1.50
1.60
1.70
1.80
1.90
2.00
V/C Ratio
Perc
ent o
f Fre
eflo
w S
peed
Freew ay / Expressw ay / Principal Arterial Minor Arterial Collector / Local

Midday Period Volume-Delay Functions
0.00
0.20
0.40
0.60
0.80
1.00
1.20
0.00
0.10
0.20
0.30
0.40
0.50
0.60
0.70
0.80
0.90
1.00
1.10
1.20
1.30
1.40
1.50
1.60
1.70
1.80
1.90
2.00
V/C Ratio
Perc
ent o
f Fre
eflo
w S
peed
Freew ay / Expressw ay / Principal Arterial Minor Arterial Collector / Local

PM Period Volume-Delay Functions
0.00
0.20
0.40
0.60
0.80
1.00
1.20
0.00
0.20
0.40
0.60
0.80
1.00
1.20
1.40
1.60
1.80
2.00
V/C Ratio
Perc
ent o
f Fre
eflo
w S
peed
Freew ay / Expressw ay / Principal Arterial Minor Arterial Collector / Local
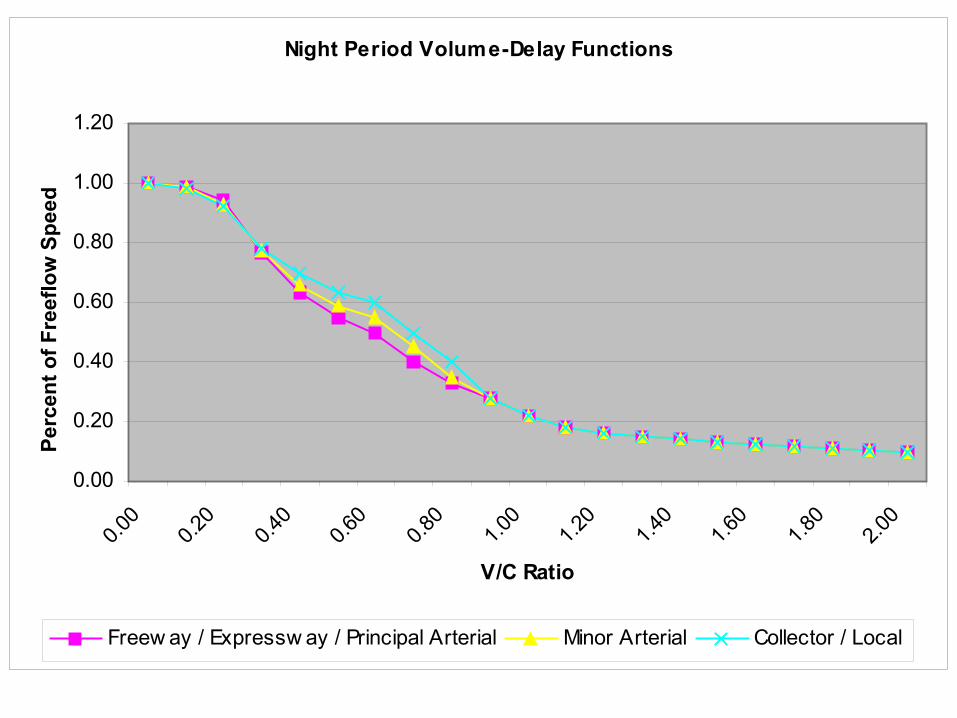
Night Period Volume-Delay Functions
0.00
0.20
0.40
0.60
0.80
1.00
1.20
0.00
0.20
0.40
0.60
0.80
1.00
1.20
1.40
1.60
1.80
2.00
V/C Ratio
Perc
ent o
f Fre
eflo
w S
peed
Freew ay / Expressw ay / Principal Arterial Minor Arterial Collector / Local

Atlanta 2000 Travel Demand Model Scatter Plot
R2 = 0.9184
0
2 0000
4 0000
6 0000
8 0000
10 0000
12 0000
14 0000
16 0000
0 20000 400 00 60000 800 00 10 0000 120000 140 000 160000
Count
Mod
eled
Vol
ume
Count -vs- Volume X=Y -10000 10000 Linear (Count -vs- Volume)
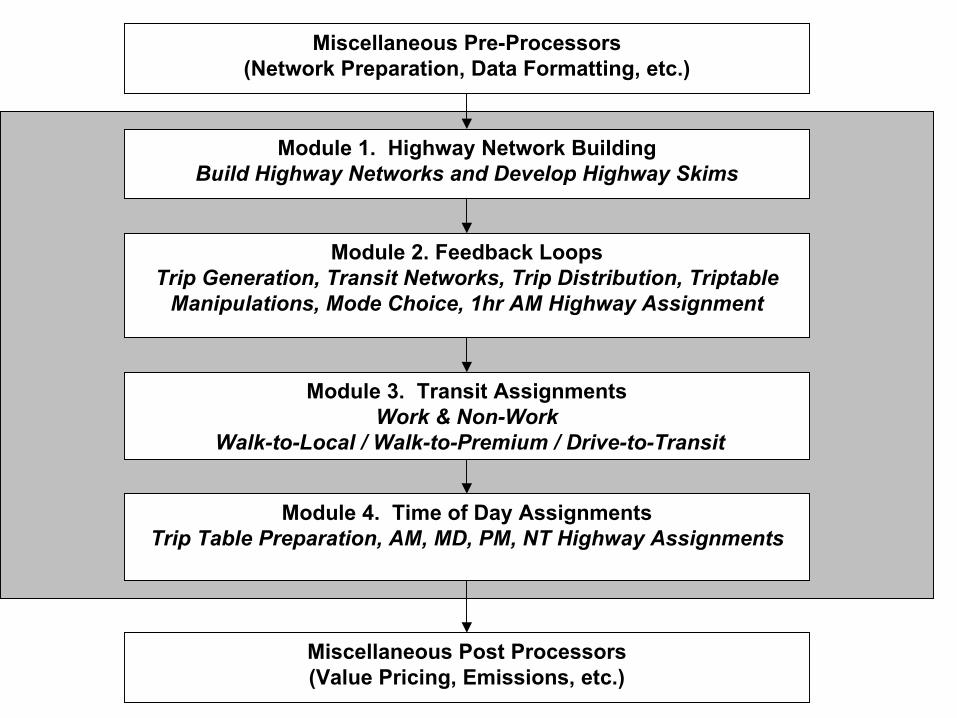
Module 1. Highway Network BuildingBuild Highway Networks and Develop Highway Skims
Module 2. Feedback LoopsTrip Generation, Transit Networks, Trip Distribution, Triptable
Manipulations, Mode Choice, 1hr AM Highway Assignment
Module 3. Transit AssignmentsWork & Non-Work
Walk-to-Local / Walk-to-Premium / Drive-to-Transit
Module 4. Time of Day AssignmentsTrip Table Preparation, AM, MD, PM, NT Highway Assignments
Miscellaneous Post Processors(Value Pricing, Emissions, etc.)
Miscellaneous Pre-Processors(Network Preparation, Data Formatting, etc.)
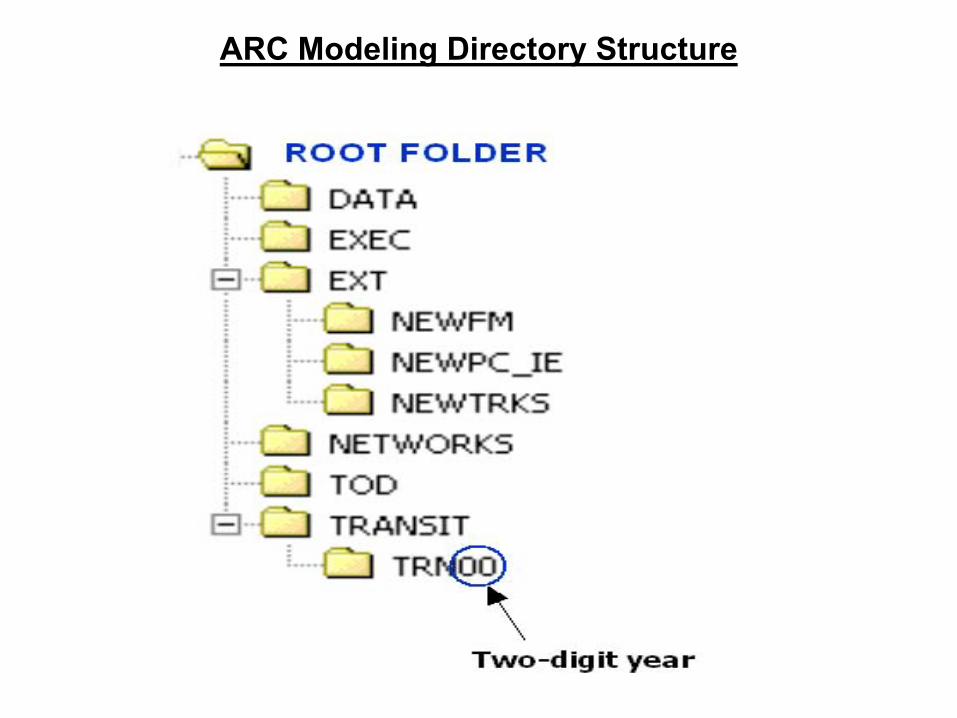
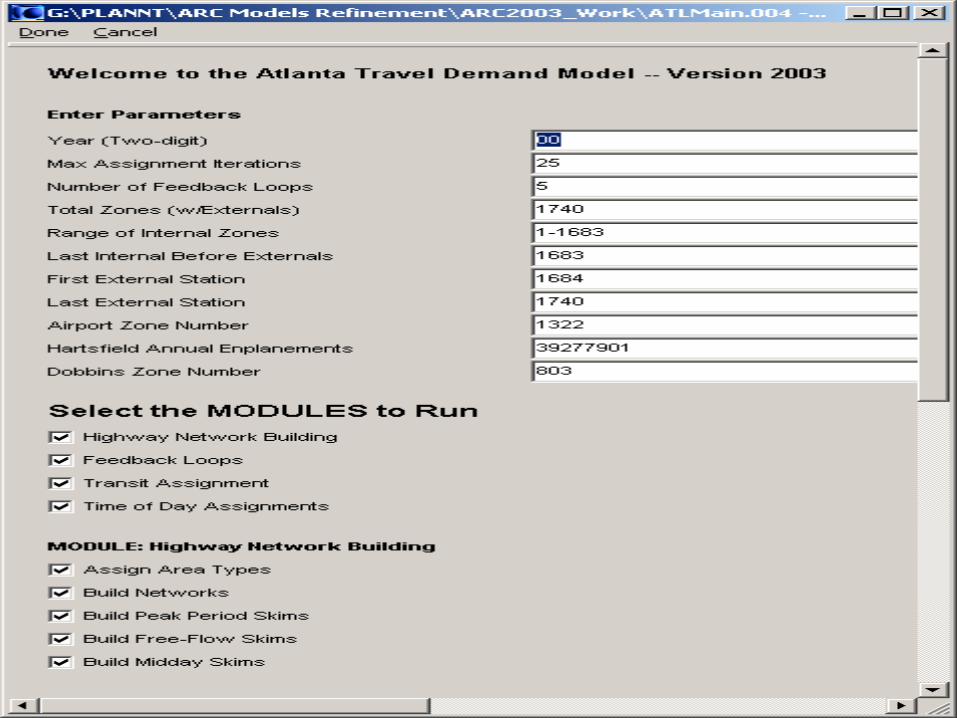
ARC Modeling Directory Structure


ARC 2000 Base Year & 2030 Model Results
POPULATION 3,630,560 5,869,086HOUSEHOLDS 1,356,058 2.323.443
EMPLOYMENT 2,067,000 3,310,428
HOME-BASED WORKWalk to Local Transit Trips 41,727 81,018Walk to Premium Transit Trips 88,009 156,553Drive to Transit Trips 33,039 58,105
Low Occupancy (SOV) Vehicle Trips 2,101,702 3,326,176Low Occupancy (SOV) Person Trips 2,101,702 3,326,176High Occupancy (HOV) Vehicle Trips 100,773 161,864High Occupancy (HOV) Person Trips 265,608 425,497
Total HBW Transit 162,775 295,676Total HBW Vehicles 2,202,475 3,488,040Total HBW Persons 2,530,085 4,047,349
Percent HBW Mode Split 6.4% 7.3%
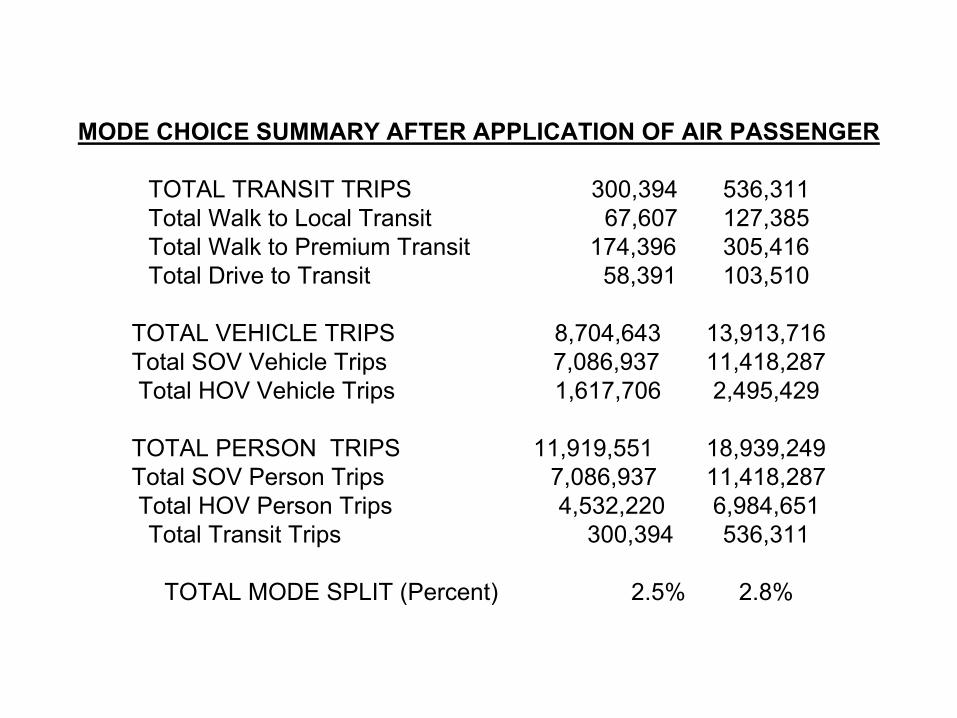
MODE CHOICE SUMMARY AFTER APPLICATION OF AIR PASSENGER
TOTAL TRANSIT TRIPS 300,394 536,311Total Walk to Local Transit 67,607 127,385Total Walk to Premium Transit 174,396 305,416Total Drive to Transit 58,391 103,510
TOTAL VEHICLE TRIPS 8,704,643 13,913,716Total SOV Vehicle Trips 7,086,937 11,418,287Total HOV Vehicle Trips 1,617,706 2,495,429
TOTAL PERSON TRIPS 11,919,551 18,939,249Total SOV Person Trips 7,086,937 11,418,287Total HOV Person Trips 4,532,220 6,984,651Total Transit Trips 300,394 536,311
TOTAL MODE SPLIT (Percent) 2.5% 2.8%

EXTERNAL-EXTERNAL VEHICLE TRIPS
Passenger Cars 46,347 82,116Trucks 15,482 25,538
TOTAL E-E TRIPS 61,829 107,654
PERSON TRIP TABLE BY PURPOSE
Home-Based Work 2,530,080 4,047,349Home-Based Other 5,597,463 8,701,930Non Home-Based 3,689,765 5,960,941
TOTAL PERSON TRIPS 11,817,308 18,710,220
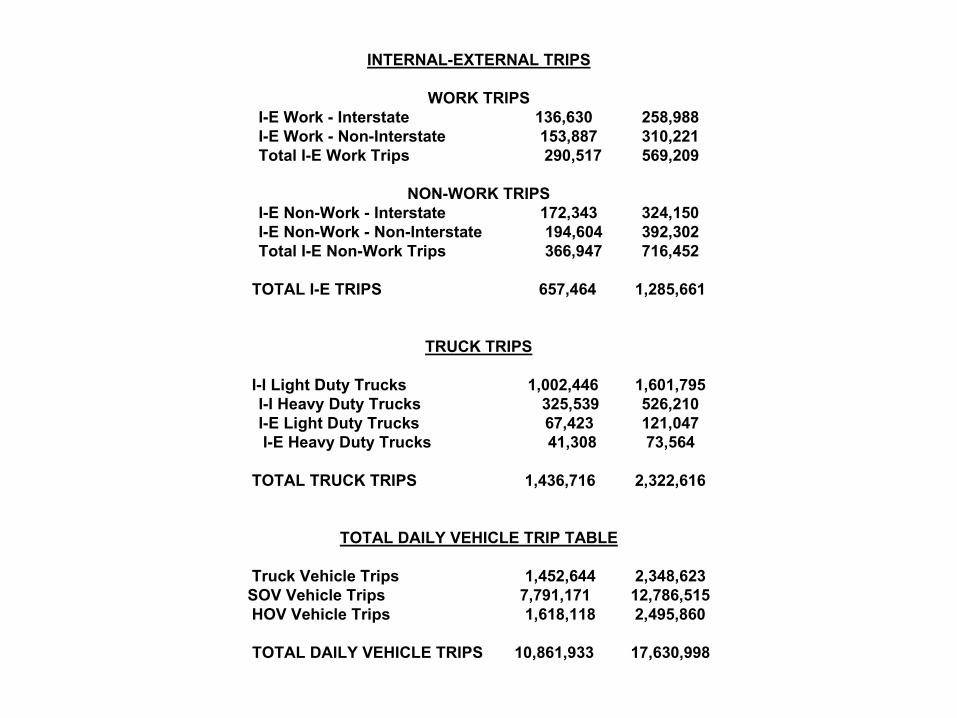
INTERNAL-EXTERNAL TRIPS
WORK TRIPSI-E Work - Interstate 136,630 258,988I-E Work - Non-Interstate 153,887 310,221Total I-E Work Trips 290,517 569,209
NON-WORK TRIPSI-E Non-Work - Interstate 172,343 324,150I-E Non-Work - Non-Interstate 194,604 392,302Total I-E Non-Work Trips 366,947 716,452
TOTAL I-E TRIPS 657,464 1,285,661
TRUCK TRIPS
I-I Light Duty Trucks 1,002,446 1,601,795I-I Heavy Duty Trucks 325,539 526,210I-E Light Duty Trucks 67,423 121,047I-E Heavy Duty Trucks 41,308 73,564
TOTAL TRUCK TRIPS 1,436,716 2,322,616
TOTAL DAILY VEHICLE TRIP TABLE
Truck Vehicle Trips 1,452,644 2,348,623SOV Vehicle Trips 7,791,171 12,786,515HOV Vehicle Trips 1,618,118 2,495,860
TOTAL DAILY VEHICLE TRIPS 10,861,933 17,630,998
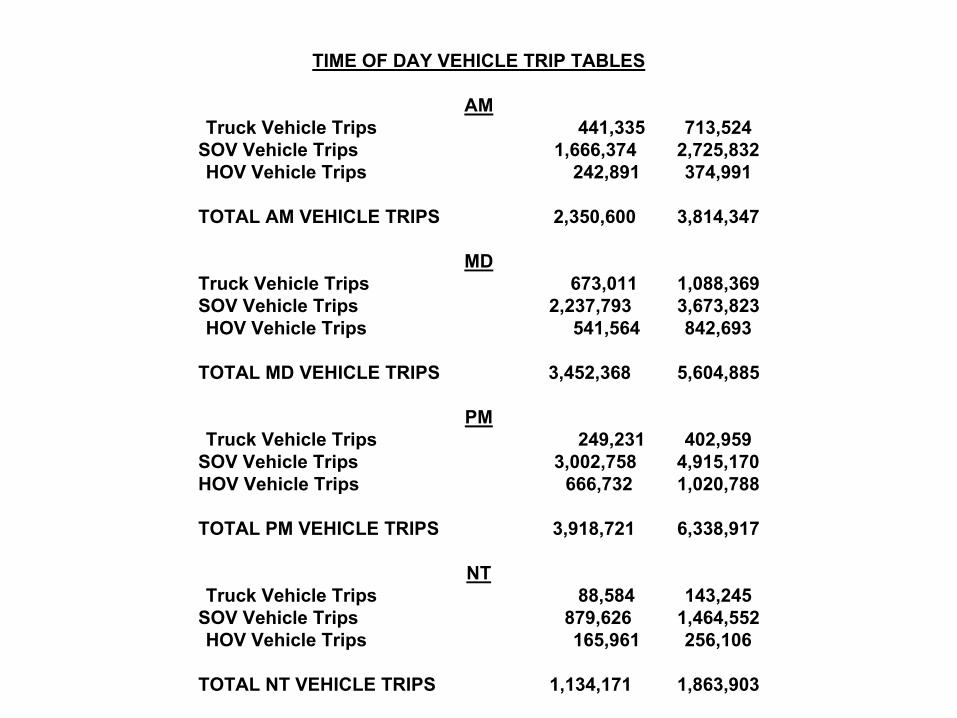
TIME OF DAY VEHICLE TRIP TABLES
AMTruck Vehicle Trips 441,335 713,524
SOV Vehicle Trips 1,666,374 2,725,832HOV Vehicle Trips 242,891 374,991
TOTAL AM VEHICLE TRIPS 2,350,600 3,814,347
MDTruck Vehicle Trips 673,011 1,088,369SOV Vehicle Trips 2,237,793 3,673,823HOV Vehicle Trips 541,564 842,693
TOTAL MD VEHICLE TRIPS 3,452,368 5,604,885
PMTruck Vehicle Trips 249,231 402,959
SOV Vehicle Trips 3,002,758 4,915,170HOV Vehicle Trips 666,732 1,020,788
TOTAL PM VEHICLE TRIPS 3,918,721 6,338,917
NTTruck Vehicle Trips 88,584 143,245
SOV Vehicle Trips 879,626 1,464,552HOV Vehicle Trips 165,961 256,106
TOTAL NT VEHICLE TRIPS 1,134,171 1,863,903

VEHICLE MILES TRAVELED
AM VMT 29,231,507 46,269,810MD VMT 34,755,605 56,293,733PM VMT 40,286,588 64,089,408NT VMT 13,398,933 21,578,644
TOTAL DAILY VMT 117,672,632 188,231,596
44% of VMT on freeway39% of VMT on arterial
17% of VMT on local/collector
While freeways have more VMT than arterials in 2000, they have only 60% of the hourly capacity of the arterials.
However per-lane freeway capacity is 4 to 5 times as great as arterials.
VEHICLE HOURS TRAVELED
AM VHT 834,692 1,360,637MD VHT 1,011,084 1,682,856PM VHT 1,196,474 1,964,960NT VHT 375,714 599,284
TOTAL DAILY VHT 3,417,963 5,607,736
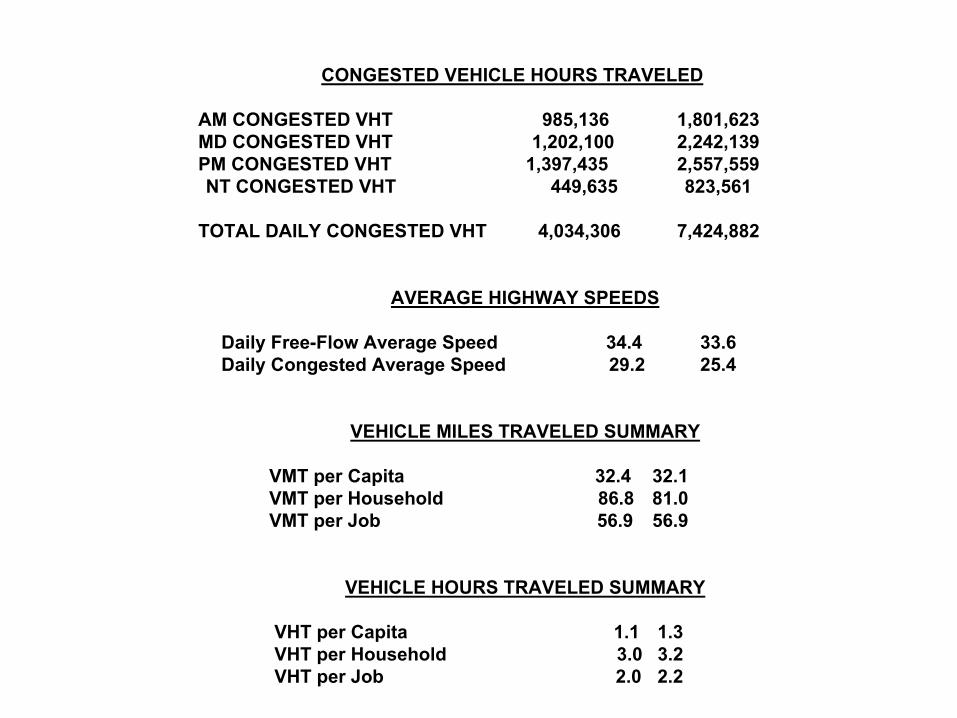
CONGESTED VEHICLE HOURS TRAVELED
AM CONGESTED VHT 985,136 1,801,623MD CONGESTED VHT 1,202,100 2,242,139PM CONGESTED VHT 1,397,435 2,557,559NT CONGESTED VHT 449,635 823,561
TOTAL DAILY CONGESTED VHT 4,034,306 7,424,882
AVERAGE HIGHWAY SPEEDS
Daily Free-Flow Average Speed 34.4 33.6Daily Congested Average Speed 29.2 25.4
VEHICLE MILES TRAVELED SUMMARY
VMT per Capita 32.4 32.1VMT per Household 86.8 81.0VMT per Job 56.9 56.9
VEHICLE HOURS TRAVELED SUMMARY
VHT per Capita 1.1 1.3VHT per Household 3.0 3.2VHT per Job 2.0 2.2

A Few Recommended PerformanceMeasures for 2030 Plan Analysis
Source: Tim Lomax, TTI, Texas A&M University
“It’s more than just Volume/Capacity Ratios”
• Individual Delay per Person• Individual Travel Time per Person (“Planning Time”)• Individual Cost Per Person• Congestion Index from Texas Transportation Institute• Total Travel Time• Total Delay Hours• Total Cost of Travel & Delay

ARC utilizes a traditional link-basedprocedure to estimate mobile sourceemissions.
•Satisfies federal transportation conformityregulations that direct regional emissions analysesTransportation Conformity Rule - Section 93.122(b)
•Consistent with methodology used to developemissions inventories needed to establish MVEB aspart of the SIP
Mobile Source Emissions Modeling
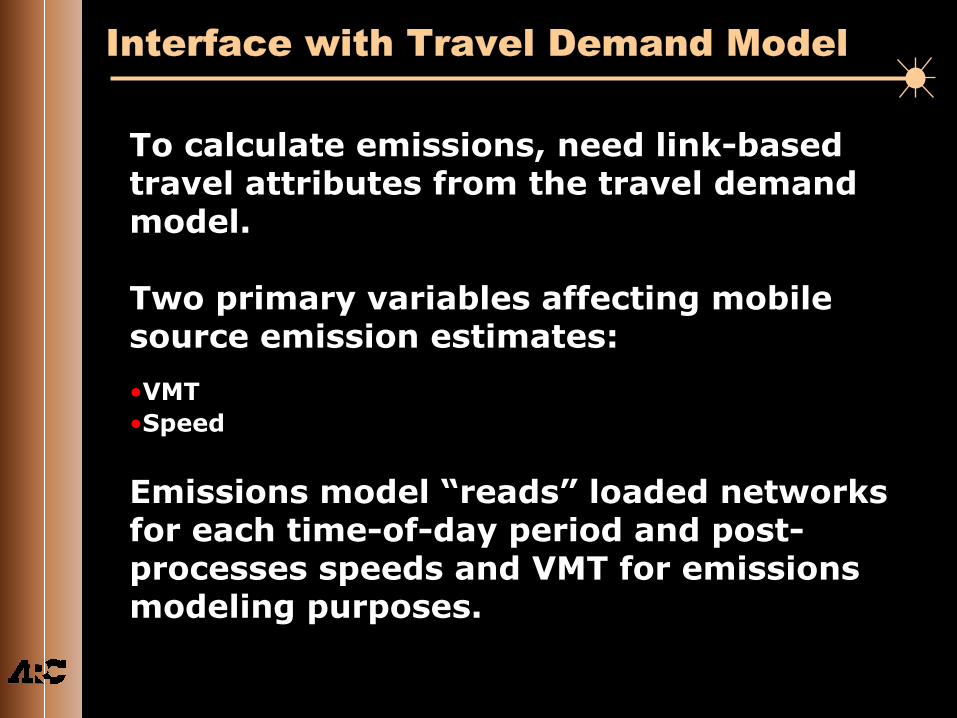
Interface with Travel Demand Model
To calculate emissions, need link-basedtravel attributes from the travel demandmodel.
Two primary variables affecting mobilesource emission estimates:
•VMT•Speed
Emissions model “reads” loaded networksfor each time-of-day period and post-processes speeds and VMT for emissionsmodeling purposes.

TP+ Procedure

Post-Processing VMT – HPMS Adjustment
EPA guidance requires HPMS basedforecasts of VMT for emission analyses.
•Average daily, summer-adjusted HPMS VMT estimatesfor year 2000 compared to average daily travel modelVMT for same year, at functional class level
HPMS Adj. Factori=2000 HPMS VMTi/2000 Model VMTi
i = HPMS functional class
•Adjustment factors applied at link level using HPMSfunctional class code
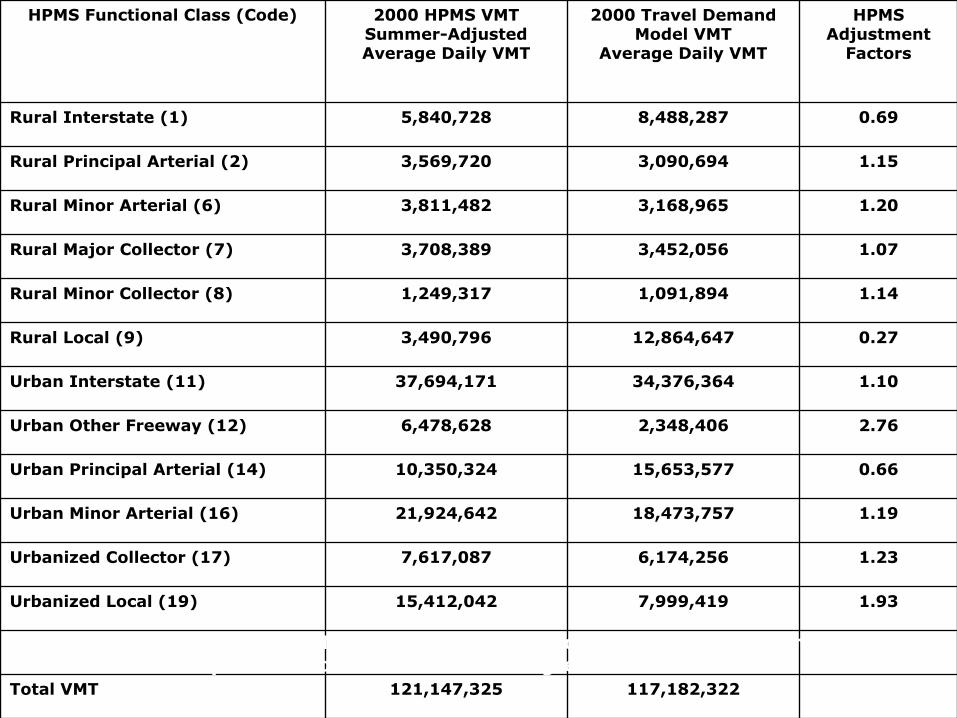
HPMS Adjustment Factors
117,182,322121,147,325Total VMT
1.937,999,41915,412,042Urbanized Local (19)
1.236,174,2567,617,087Urbanized Collector (17)
1.1918,473,75721,924,642Urban Minor Arterial (16)
0.6615,653,57710,350,324Urban Principal Arterial (14)
2.762,348,4066,478,628Urban Other Freeway (12)
1.1034,376,36437,694,171Urban Interstate (11)
0.2712,864,6473,490,796Rural Local (9)
1.141,091,8941,249,317Rural Minor Collector (8)
1.073,452,0563,708,389Rural Major Collector (7)
1.203,168,9653,811,482Rural Minor Arterial (6)
1.153,090,6943,569,720Rural Principal Arterial (2)
0.698,488,2875,840,728Rural Interstate (1)
HPMSAdjustment
Factors
2000 Travel DemandModel VMT
Average Daily VMT
2000 HPMS VMTSummer-AdjustedAverage Daily VMT
HPMS Functional Class (Code)
Latest available HPMS adjustment factors calculated for emissionsinventory needed for Severe Rate of Progress SIP
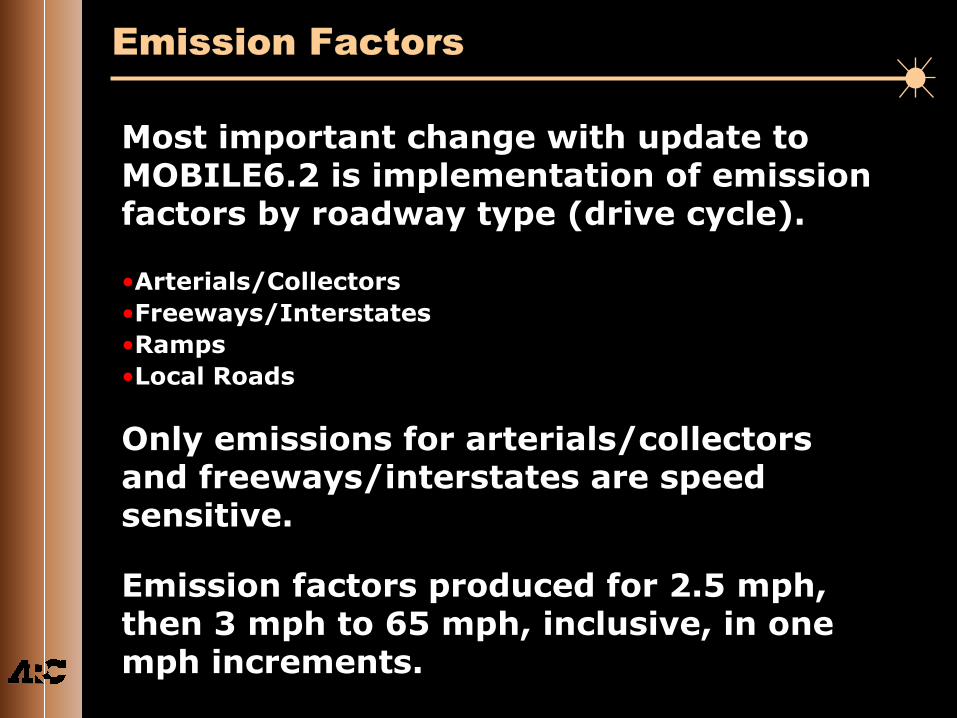
Most important change with update toMOBILE6.2 is implementation of emissionfactors by roadway type (drive cycle).
•Arterials/Collectors•Freeways/Interstates•Ramps•Local Roads
Only emissions for arterials/collectorsand freeways/interstates are speedsensitive.
Emission factors produced for 2.5 mph,then 3 mph to 65 mph, inclusive, in onemph increments.
Emission Factors

Loaded Networks for Each Time Period•Final assigned VMT and VHT from a capacity-restrained assignment procedure
TP+ Emissions Model•Post-process link congested flow speed•Post-process link VMT•Calculate link emissions•Summarize link-level emissions over entire network forfour time periods
Emissions Modeling Process Summary
HPMS Adjustment Factors
Emission Factors
HPMS “Equivalencies”

Multi-Year Program - Activity/Tour-Based ModelCompleted Proposed Anticipated2001/2002 2003 2004 2005 2006
1 General Approach to Activity/Tour-Based Models * * * *
2 Detailed Model Specifications * * * *3 Data Development:
QC and Estimation Files * * * *4 Initial Estimation - Tour-based Models
a Population Synthesizer * * * *b Household Activity Models * * * *c Tour Details Models * * * *
5 Model Applications Development & Testing
a Population Synthesizer * * * *b Household Activity Models * * * *c Tour Details Models * * * *
6 Calibration / Validationa Population Synthesizer * * * *b Household Activity Models * * * *c Tour Details Models * * * *d Highway / Transit Assignment * * * *
7 Model Application Optimization / Reporting * * * *
8 Documentation & Training * * * *9 Work Plan to Complete TB with
Conversion Strategy * * * *10 Integration /Cross-Validation with Trip-
Base Models * * * *
Next Steps…
• Conversion to Cube’s Application Manager,Scenario Manager / Flowchart Approach
• Refine EJ Performance Measures• Refine Evening / Night TOD Model• Summarize Model Output by Activity
Centers & Town Centers (LCI sites)• Review the Externals Model
Next Steps (Continued)
• Refine Transit Coding / Modeling &Commuter Rail with “Externals” Input
• Continue Tour-Based & Activity-BasedModel Development
• Refine Sketch Modeling Methods• Perform Commercial Vehicle / Truck
Survey and Use Transearch Reebie Data• Freight Model Development

Guy RousseauGuy RousseauModeling ManagerModeling Manager
Atlanta Regional CommissionAtlanta Regional Commission40 Courtland St, NE40 Courtland St, NEAtlanta, GA 30303Atlanta, GA 30303
[email protected]@atlantaregional.com
www.atlantaregional.comwww.atlantaregional.com