Embed Size (px)
Citation preview
The Autoxidation of Biodiesel and its
Effects on Engine Lubricants
Thomas Iain James Dugmore
A thesis submitted for the
degree of Doctor of Philosophy
The University of York
Department of Chemistry
September 2011

iii
Abstract
To investigate the impact of biodiesel on automotive engines during usage, the
chemistry of two significant biodiesel components, methyl linoleate and oleate were
examined. Both were oxidised in bench top reactors at temperatures between 100 – 170 oC
to represent the different conditions across the engine. Products were identified and
quantified by GC-FID and GC-MS to determine the main degradation mechanisms.
Methyl oleate and linoleate were also oxidised with squalane in the reactors to
simulate the effects of fuel dilution in the engine lubricant. At lower temperatures methyl
linoleate was shown to enhance the rate of squalane oxidation, but as the temperature
increased, the pro-oxidant character decreased to become inhibiting by 170 oC, with the
temperature at which this crossover occurred measured at 158 5 oC – methyl oleate had
no effect however.
This temperature dependent behaviour is attributed to the weak C-H bond of the
doubly allylic system (the only feature not common to both molecules) and the subsequent
reversibility of O2 addition to the methyl linoleate radical formed via hydrogen abstraction.
Studies of a similar molecule, 1,4-pentadiene, revealed ceiling temperatures for this
specific reaction as 173 6 oC which was in good agreement with the experimental value.
The effects of lubricant additives (two antioxidants and a detergent) on the
degradation of squalane-methyl linoleate mixtures was also examined. It was shown that at
all temperatures the antioxidant could delay the onset of the reactions, but have no effect
on them once they started. Similarly, methyl linoleate could reduce the effectiveness of the
antioxidants at all measured temperatures showing that the reversible addition of O2 to
allylic radicals was not relevant for these reactions. Two possible mechanisms for this
behaviour are discussed along with potential methods for testing them in future
experiments. No noticeable effects were observed for the detergent.

iv
Table of Contents
v
Table of Contents
The Autoxidation of Biodiesel and its Effects on Engine Lubricants
Abstract……………………………………………………………………………………iii
Table of Contents………………………………………………………………………….v
List of Figures and Tables………………………………………………………………..ix
Acknowledgments……………………………………………………………………….xix
Author’s Declaration………………………………………………………..…………xxi
Chapter 1
1. Introduction………………………………………………………………………1
1.1 History of Fuels and Crude Oil……………………………………………….1
1.2 Biodiesel Manufacture and Properties………………………………………..5
1.3 Increasing Usage of Biodiesel………………………………………………...9
1.4 Lubrication………………………………………………………………..…11
1.5 Oxygen Radicals and Autoxidation…………………………………………13
1.5.1 Chemistry of oxygen radicals……………………………………...13
1.5.2 Combustion of VOCS and Light Fuels…………………………….19
1.5.3 Heavier Hydrocarbons and Lubricants………………………….…21
1.5.4 Lipids and Biodiesel……………………………………………….24
1.6 Effect of Biodiesel on automotive engines………………………………….26
1.6.1 Combustion Chamber……………………………………………...27
1.6.2 Piston Assembly…………………………………………………...27
1.6.3 Sump……………………………………………………………….28
1.6.4 Legislative Demands and Restrictions…………………………….29
1.6.5 Emissions…………………………………………………………..30
1.7 Project Aims…………………………………………………………………31
The Autoxidation of Biodiesel and its Effects on Engine Lubricants
vi
1.8 References…………………………………………………………………...32
Chapter 2
2. Experimental……………………………………………………………………43
2.1 Materials…………………………………………………………………….43
2.2 Oxidation Reactions…………………………………………………………44
2.2.1 Static Oxidation……………………………………………………44
2.2.2 Flow Oxidation…………………………………………………….47
2.3 Viscosity Measurements…………………………………………………….47
2.4 Chemical Analysis…………………………………………………………..48
2.4.1 Gas Chromatography………………………………………………48
2.4.2 Mass Spectrometry…………………………………………………50
2.5 References…………………………………………………………………...50
Chapter 3
3. The Liquid Phase Autoxidation of Methyl Linoleate and Oleate at Elevated
Temperatures……………………………………………………………………51
3.1 Introduction………………………………………………………………….51
3.2 Results……………………………………………………………………….53
3.2.1 Gas Chromatography………………………………………………53
3.2.2 Mass Spectrometry…………………………………………………55
3.3.3 Methyl Linoleate Decay……………………………………………58
3.2.4 Autoxidation Product Formation and Decay………………………62
3.3 Discussion…………………………………………………………………...76
3.3.1 Mechanisms of Autoxidation……………………………………...76
3.3.2 Formation and Decay of Products…………………………………83
3.3.3 Dominant Degradation Mechanisms………………….…………...88
3.4 Summary……………………………………………………….……………99
3.5 References……………………………………...………………………….100
Table of Contents
vii
Chapter 4
4. The Effect of Methyl Linoleate and Oleate on Squalane Oxidation…….….105
4.1 Introduction………………………………………………………………...105
4.2 Results……………………………………………………………………...107
4.2.1 Rate of Squalane Decay…………………………………………..107
4.2.2 Effect of Methyl Linoleate on Rate of Decay of Squalane……….112
4.2.3 Effect of Methyl Oleate on Rate of Decay of Squalane………..…124
4.2.4 Effect of Methyl Linoleate and Oleate on Kinematic Viscosity of
Oxidising Squalane……………………………………………….131
4.3 Discussion………………………………………………………………….135
4.3.1 Pro-oxidancy of Methyl Linoleate in Squalane at Low
Temperatures……………………………………………………...142
4.3.2 Anti-oxidancy of Methyl Linoleate in Squalane at Elevated
Temperatures……………………………………………………...146
4.3.3 Relevance to Behaviour of Methyl Linoleate in Engines………...151
4.4 Summary…………………………………………………………………...153
4.5 References………………………………………………………………….153
Chapter 5
5. The Effect of Additives on Methyl Linoleate and Squalane………………...159
5.1 Introduction………………………………………………………………...159
5.1.1 Phenolic Antioxidant Mechanism………………………………...160
5.1.2 Aminic Antioxidant Mechanism………………………………….161
5.2 Results……………………………………………………………………...164
5.2.1 The Effect of Additives on Squalane..……………………………164
5.2.1.1 Phenolic Antioxidants…………………………………….164
5.2.1.2 Aminic Antioxidants……………………………………...167
5.2.1.3 Detergent………………………………………………….169
5.2.2 The Effect of Additives on Squalane with Methyl Linoleate…….170
5.3 Discussion…………………………………………………………………...176
5.3.1 Antioxidant Effect on Autoxidation………………………………176
5.3.2 Antioxidant Effect on Induction Period…………………………..178
5.3.3 Relevance to Behaviour in Engines………………………………185
5.3.4 Detergent………….………………………………………………186
The Autoxidation of Biodiesel and its Effects on Engine Lubricants
viii
5.4 Summary…………………………………………………………………...187
5.5 References………………………………………………………………….188
Chapter 6
6. Conclusions and Future Work..….………….….………………….……..…..191
6.1 Overview of Results ………….…………………………………………….191
6.2 Future Work on Autoxidation………………………………………………192
6.3 Future Work on Chemically Modelling Biodiesel………………………….193
6.4 Future Work on Antioxidants……………………………………………….194
Appendix: Mass Spectrometry Data…………………………………………………..195
List of Abbreviations…………………………………………....……………………....201
List of References……………………………………………………………………….203

List of Figures and Tables
ix
List of Figures and Tables
List of Figures
Chapter 1
Figure 1.1 – The generic structure of lipids – R = alkyl chain…………………………...5
Figure 1.2 – The molecular orbital diagram of O2………………………………………13
Figure 1.3 – A peroxide and carbonyl compound, typical common examples of oxygen
forming two bonds in stable compounds………………..…………………13
Figure 1.4 – Peroxyl, alkoxyl, hydroxyl and hydroperoxyl radicals respectively, where
R H..……………………………………………………………………...15
Figure 1.5 – The radical propagation cycle generated by reactions 1.3 and 1.4………...16
Figure 1.6 – The interaction of the radical propagation cycle with alkoxyl radicals……17
Figure 1.7 – The overall summarised radical cycle……………………………….…….18
Figure 1.8 – The hydrogen abstraction of methane by oxygen as the opening stage of
combustion………………………………………………………………...19
Figure 1.9 – The cleaving of a C-C bond via an alkoxy radical………………………...20
Figure 1.10 – From left to right, the n-butyl, i-butyl and t-butyl radicals………………..23
Figure 1.11 – The combination of two alkyl radicals to terminate a radical reaction……24
Figure 1.12 – A vinyl and allylic C-H bond, respectively………………………………..25
Figure 1.13 – The abstraction of an allylic hydrogen atom and subsequent resonance
stabilisation mechanism…………………………………………………...25
Figure 1.14 – The abstraction of a doubly allylic hydrogen atom and subsequent
resonance stabilisation structures………………………………………….25
Figure 1.15 – Schematic diagram of the four phases of the four stroke diesel engine…...25
Chapter 2
Figure 2.1 – From top to bottom, the chemical structures of methyl oleate, methyl
linoleate and squalane……………………………………………………...43
The Autoxidation of Biodiesel and its Effects on Engine Lubricants
x
Figure 2.2 – The chemical structure of octadecyl 3-(3,5 di-tertbutyl, 4-hydroxy phenyl)
propanoate (Irganox L107)………………………………………………...44
Figure 2.3 – The generic chemical structures of the aminic antioxidant (OS146100) and
sodium sulphonate detergent (OS102880)……………………………...…44
Figure 2.4 – External and internal views of the small and large reactors…………...…..45
Figure 2.5 – Example of a pressure trace with the Induction Time and Reaction Time
marked………………………………………………….…………….……46
Figure 2.6 – A schematic diagram of the viscometer tubes used……………………….48
Figure 2.7 – The calibration plot for the response factor according to effective carbon
number of the GC…………………………….……………………………49
Chapter 3
Figure 3.1 – The saturate, monounsaturated and doubly unsaturated C-H bonds and their
respective B.D.Es…………………………………………………………52
Figure 3.2 – The GC spectra of the oxidation products of methyl linoleate at 170 oC
before and including methyl linoleate elution……………………..………54
Figure 3.3 – The GC spectra of the oxidation products of methyl linoleate at 170 oC after
methyl linoleate elution……………………………………………………54
Figure 3.4 – The close up of peaks 19-28 for clarity……………………………………55
Figure 3.5 – The GC spectra of the oxidation products of methyl oleate at 170 oC. Peaks
1 – 15 have been intensified 6-fold for clarity…………………………….55
Figure 3.6 – The fragmentation of an epoxide to give the m/z = 185 fragment in EI-
MS……………………………………………………………………….…56
Figure 3.7 – The change in concentration of ML over time at 170 oC with a 0.08 dm3
min-1 flow of oxygen……………………………………………………...58
Figure 3.8 – The logarithmic decay of ML over time at 170 oC with a 0.08 dm
3 min
-1
flow of oxygen………………………………………………………….….59
Figure 3.9 – The logarithmic decay of ML over time between 100 – 170 oC with a
0.08 dm3 min
-1 flow of oxygen…………………………………………….59
Figure 3.10 – The kML values for methyl linoleate oxidation reaction versus
temperature………………………………………………………………...61
Figure 3.11 – Arrhenius plot for methyl linoleate autoxidation between 100 – 170 oC….61
List of Figures and Tables
xi
Figure 3.12 – The cleavage of the 8-9 C-C bond to give methyl octanoate and 2,4
decadienal………………………………………………………………….62
Figure 3.13 – From left to right, the chemical structures of methyl octanoate, 2,4
decadienal (Z,Z) and 2,4 decadienal (E,Z)………………………………...62
Figure 3.14 – From top to bottom, the formation and decay of methyl octanoate, 2,4
decadienal (Z,Z) and 2,4 decadienal (E,Z) over time ………………….….63
Figure 3.15 – The cleavage of the 13-14 C-C bond to give methyl octanoate and 2,4
decadienal………………………………………………………………….64
Figure 3.16 – The chemical structures of pentane and 13-oxo methyl tridec-9,11-
dienoate…………………………………………………………………….64
Figure 3.17 – From top to bottom, the formation and decay of pentane and 13-oxo methyl
tridec-9,11-enoate over time………………….……………………………65
Figure 3.18 – Left to right, top to bottom, the chemical structures of hexanal, 2-octenal,
9-oxo methyl nonanoate and 10-oxo methyl dec-8-enoate…….…….….…66
Figure 3.19 – From top to bottom, the formation and decay of hexanal, 2-heptenal, 9-oxo
methyl nonanoate and 10-oxo methyl dec-8-enoate over time.……………67
Figure 3.20 – Left to right, top to bottom, the chemical structures of methyl heptanoate,
2-octenal, 8-oxo methyl octanoate and 8-hydroxy methyl octanoate……..68
Figure 3.21 – Left to right, top to bottom, the chemical structures of 10-oxo methyl
decanoate, methyl nonandioic acid, 11-oxo methyl undec-9-enoate and 12-
oxo methyl dodec-9-enoate………………………………………………..68
Figure 3.22 – The formation and decay of methyl heptanoate over time………………...69
Figure 3.23 – The formation and decay of 2-octenal over time………………………….70
Figure 3.24 – From top to bottom, the formation and decay of 8-oxo methyl octanoate and
8-hydroxy methyl octanoate over time.e formation and decay of 8-oxo
methyl octanoate over time………………………………………………...71
Figure 3.25 – From top to bottom, the formation and decay of 11-oxo methyl undec-8-
enoate and 12-oxo methyl dodec-9-enoate over time.……………………..72
Figure 3.26 – From top to bottom, the formation and decay of methyl trans-9-epoxy
octadec-12-enoate, methyl trans-12-epoxy octadec-9-enoate, methyl cis-9-
epoxy octadec-12-enoate and methyl cis-12-epoxy octadec-9-enoate over
time over time.…..........................................................................................74
Figure 3.27 – The formation and decay of the first methyl linoleate alcohol (exact
positional isomer unknown) over time…………………………………….75
The Autoxidation of Biodiesel and its Effects on Engine Lubricants
xii
Figure 3.28 – From top to bottom, the formation and decay of methyl 9-oxo octadec-
10,12-dienoate and methyl 13-oxo octadec-9,11-dienoateover time ..…...76
Figure 3.29 – The resonance stabilisation of a doubly allylic radical……………………77
Figure 3.30 – The three main alkoxyl radical isomers of methyl linoeate autoxidation…78
Figure 3.31 – The positional isomers of the alkoxyl radicals of methyl linoleate after
singly allylic hydrogen abstraction………………………………………...80
Figure 3.32 – The theoretical cleaving of the 12-13 C-C bond via reactions 3.6 and 3.7 to
give hexanal and methyl dodec-9,11-dienoate…………………………….83
Figure 3.33 – The theoretical cleaving of the 12-13 C-C bond via reaction 3.10 to give
hexanal and 12-oxo methyl dodec-9-enoate……………………………….84
Figure 3.34 – The cleaving of the 11-12 C-C bond to give 1-heptene and 11-oxo methyl
undec-9-enoate (top) and the 10-11 C-C bond to give methyl dec-9-enoate
and 2-ocetenal (bottom) from structure B…………………………………85
Figure 3.35 – The theoretical rearrangement of the terminal alkene radicals to form 2-
heptenal and 10-oxo methyl dec-8-enoate………………...……………….86
Figure 3.36 – The theoretical cleaving of the 9-10 C-C bond via reaction 3.10 to give non-
3-enal and 9-oxo methyl nonanoate………………………………………..86
Figure 3.37 – The formation of ketones via reaction 3.6…………………………………87
Figure 3.38 – The theoretical allylic and tertiary C-H bond of the methyl linoleate
dehydrodimer; positional isomer arbitrarily assigned……………………..88
Figure 3.39 – The total concentrations of products formed by C-H and C=C bond addition
at all temperatures………………………………………………………….89
Figure 3.40 – The ratio of products formed by C-H bond scission to C=C bond addition at
all temperatures…………………………………………………………….90
Figure 3.41 – The maximum ratio of hydroperoxide to epoxide products versus
temperature………………………………………………………………...90
Figure 3.42 – The alkoxyl radical structures from which the observed products were
formed……………………………………………………………………..93
Figure 3.43 – The total concentrations on scission products formed via the different
alkoxyl radicals at 170 oC………………………………………………....94
Figure 3.44 – The total concentrations on scission products formed via the different
alkoxyl radicals at 150 oC…………………………………………..……..94
Figure 3.45 – The total concentrations on scission products formed via the different
alkoxyl radicals at 130 oC………………………………………………….95
List of Figures and Tables
xiii
Figure 3.46 – The total concentrations on scission products formed via the different
alkoxyl radicals at 100 oC……………………………………………….....95
Figure 3.47 – The percentage of each alkoxyl radical structure in the overall concentration
at 170 oC. ……………………………………………………………….....96
Figure 3.48 – The percentage of each alkoxyl radical structure in the overall concentration
at 150 oC. ……………………………………………………………….....97
Figure 3.49 – The percentage of each alkoxyl radical structure in the overall concentration
at 130 oC. ……………………………………………………………….....97
Figure 3.50 – The percentage of each alkoxyl radical structure in the overall concentration
at 100 oC. ……………………………………………………………….....98
Chapter 4
Figure 4.1 – The decay of squalane over time at 170 oC with a 0.08 dm
3 min
-1 flow of
oxygen.……………………………………………………………..……108
Figure 4.2 – The logarithmic decay of squalane over time at 170 oC with a 0.08 dm
3
min-1
flow of oxygen……………………………………………………..109
Figure 4.3 – The logarithmic decay of squalane over time between 100 – 170 oC with a
0.08 dm3 min
-1 flow of oxygen………………………………………….110
Figure 4.4 – The ksqualane for squalane oxidation reaction versus temperature………..111
Figure 4.5 – Arrhenius plot for squalane autoxidation……………………………….112
Figure 4.6 – The decay of squalane with varying amounts of methyl linoleate at 100 oC
with a 0.08 dm3 min
-1 flow of oxygen…………………………………..113
Figure 4.7 – The dependence of the rate of decay of squalane on methyl linoleate at
100 oC……………………………………………………………………..114
Figure 4.8 – The decay of squalane with varying amounts of methyl linoleate at 130 oC
with a 0.08 dm3 min
-1 flow of oxygen……………………………………..115
Figure 4.9 – The rate of decay of squalane with methyl linoleate at 130 oC………..…115
Figure 4.10 – The decay of squalane with varying amounts of methyl linoleate at 150 oC
with a 0.08 dm3 min
-1 flow of oxygen…………………………………....116
Figure 4.11 – The rate of decay of squalane with methyl linoleate at 150 oC…………..116
Figure 4.12 – The decay of squalane with varying amounts of methyl linoleate at 170 oC
with a 0.08 dm3 min
-1 flow of oxygen……………………………………117
Figure 4.13 – The rate of decay of squalane with methyl linoleate at 170 oC…………..117
The Autoxidation of Biodiesel and its Effects on Engine Lubricants
xiv
Figure 4.14 – The rate of decay of squalane with methyl linoleate at concentrations of
0 – 10% at 100 – 170 oC…………………………………………………118
Figure 4.15 – Methyl linoleate concentration versus time at 150 oC with 8%ML in
squalane…………………………………………………………………..119
Figure 4.16 – The decay of methyl linoleate in squalane at 100 oC………………….…119
Figure 4.17 – The decay of methyl linoleate in squalane at 130 oC…………………….120
Figure 4.18 – The decay of methyl linoleate in squalane at 150 oC…………………….120
Figure 4.19 – The decay of methyl linoleate in squalane at 170 oC…………………….121
Figure 4.20 – The rate of decay of methyl linoleate in squalane at 100 oC……………..121
Figure 4.21 – The rate of decay of methyl linoleate in squalane at 130 oC……………..122
Figure 4.22 – The rate of decay of methyl linoleate in squalane at 150 oC……………..123
Figure 4.23 – The rate of decay of methyl linoleate in squalane at 170 oC……………..123
Figure 4.24 – The rate of kML increase for methyl linoleate versus temperature………124
Figure 4.25 – The decay of squalane with varying amounts of methyl oleate at 170 oC with
a 0.08 dm3 min
-1 flow of oxygen…………………………………………125
Figure 4.26 – The rate of decay of squalane with methyl oleate at 170 oC……………..125
Figure 4.27 – The decay of squalane with varying amounts of methyl oleate at 150 oC with
a 0.08 dm3 min
-1 flow of oxygen…………………………………………126
Figure 4.28 – The rate of decay of squalane with methyl oleate at 150 oC……………..127
Figure 4.30 – The rate of decay of squalane with methyl oleate at 130 oC……………..128
Figure 4.31 – The decay of methyl oleate in squalane at 170 oC……………………….129
Figure 4.32 – The decay of methyl oleate in squalane at 150 oC……………………….129
Figure 4.33 – The decay of methyl oleate in squalane at 130 oC……………………….130
Figure 4.34 – The rate of decay of methyl oleate in squalane at 170 oC………….…….130
Figure 4.35 – The rate of decay of methyl oleate in squalane at 150 oC………………..131
Figure 4.36 – The rate of decay of methyl oleate in squalane at 130 oC………………..131
Figure 4.37 – The change in KV40 of squalane over time at 170 oC with a 0.08 dm
3 min
-1
flow of oxygen……………………………………………………………133
Figure 4.38 – The change in KV40 of squalane over time at 150 oC with a 0.08 dm
3 min
-1
flow of oxygen……………………………………………………………133
Figure 4.39 – The change in KV40 of squalane over time at 130 oC with a 0.08 dm
3 min
-1
flow of oxygen……………………………………………………………134
Figure 4.40 – The change in KV40 of squalane/methyl linoleate mixtures at 130 –
170 oC…………………………………………………………………….134
List of Figures and Tables
xv
Figure 4.41 – The change in KV40 of squalane/methyl oleate mixtures at 130 –
170 oC……………………………………………………….……………135
Figure 4.41 – The relative change of squalane decay with added methyl linoleate…….136
Figure 4.42 – The logarithmic relative change of squalane decay with added methyl
linoleate…………………………………………………………………...137
Figure 4.43 – The relative change of squalane decay with added methyl oleate…….….137
Figure 4.44 – The logarithmic relative change of squalane decay with added methyl
oleate……………………………………………………………………...138
Figure 4.45 – The relative change in KV40 of squalane/methyl linoleate mixtures……139
Figure 4.46 – The logarithmic relative change in KV40 of squalane/methyl linoleate
mixtures…………………………………………………………………..139
Figure 4.47 – The relative change in KV40 of squalane/methyl oleate mixtures………140
Figure 4.48 – The logarithmic relative change in KV40 of squalane/methyl oleate
mixtures…………………………………………………………………..140
Figure 4.49 – Temperature dependence of the rate of squalane decay to added methyl
linoleate/oleate……………………………………………………………141
Figure 4.50 – The rate of change in KV40 of squalane per % methyl linoleate/oleate added
versus temperature………………………………………………………..142
Figure 4.51 – The autoxidation cycle of squalane………………………………………143
Figure 4.52 – The autoxidation cycle of methyl linoleate………………………………143
Figure 4.53 – The resonance stabilisation of a doubly allylic system…………………..144
Figure 4.54 – The radical interaction between methyl linoleate and squalane………….145
Chapter 5
Figure 5.1 – The chemical structure of ascorbic acid (Vitamin C)…………………….159
Figure 5.2 – Bond dissociation energies (kJ mol-1
) of the O-H bond in 3 phenolic
species………………………………………………………….………...160
Figure 5.3 – An aminic antioxidant stabilised by t-butyl groups on the para positions of
the aromatic ring………………………………………………………….162
Figure 5.4 – The resonance stabilisation if the nitroxyl radical………………..…...….163
Figure 5.5 – The Denisov cycle……………………….....…………………………….164
Figure 5.6 – The structure of Irganox L107……………………………..…………….165
Figure 5.7 – The pressure traces of squalane by itself and with 0.3% Irganox L107 at
170 oC under 1 bar of oxygen…………………………………………....165

The Autoxidation of Biodiesel and its Effects on Engine Lubricants
xvi
Figure 5.8 – The induction time of squalane with varying amounts of Irganox L107 at
170 oC…………………………………………………………………….166
Figure 5.9 – The induction time of squalane with varying amounts of Irganox L107 at
130 oC…………………………………………………………………….167
Figure 5.10 – The generic chemical structure of aminic antioxidant OS146100……….167
Figure 5.11 – The induction time of squalane with varying amounts of aminic antioxidant
OS146100 at 170 oC………………………………………………..…….168
Figure 5.12 – The induction time of squalane with varying amounts of aminic antioxidant
OS146100 at 130 oC………….…………………………………………..168
Figure 5.13 – The generic chemical structure for detergent OS102880……….………..169
Figure 5.14 – The induction time of squalane with varying amounts of detergent
OS102880 at 170 oC………..……………………….……………………169
Figure 5.15 – The induction time of squalane with varying amounts of detergent
OS102880 at 130 oC…….…….…………….……………………………170
Figure 5.16 – The induction time of squalane with varying amounts of phenolic
antioxidant and methyl linoleate at 170 oC…………..…………………..172
Figure 5.17 – The induction time of squalane with varying amounts of phenolic
antioxidant and methyl linoleate at 130 oC…………………..…………..172
Figure 5.18 – The induction time of squalane with varying amounts of aminic antioxidant
and methyl linoleate and 170 oC………………………………………….173
Figure 5.19 – The induction time of squalane with varying amounts of aminic antioxidant
and methyl linoleate at 130 oC…………….……………………………..173
Figure 5.20 – The induction time of squalane with varying amounts of detergent and
methyl linoleate at 170 oC……………………..…………………………174
Figure 5.21 – The induction time of squalane with varying amounts of detergent and
methyl linoleate at 130 oC………………………………………….……174
Figure 5.22 – The concentrations of the starting materials of squalane with 2% methyl
linoleate and 0.25% Irganox L107 over time at 170 oC………..………..175
Figure 5.23 – The concentrations of the starting materials of squalane with 10% methyl
linoleate and 0.25% Irganox L107 over time at 130 oC…………..……..176
Figure 5.24 – The ksqualane values both with and without antioxidants at 170 oC………178
Figure 5.25 – The ksqualane values both with and without antioxidants at 130 oC………178
Figure 5.26 – The induction time of squalane with varying amounts of methyl linoleate
and phenolic antioxidant at 170 oC………………………………………179
List of Figures and Tables
xvii
Figure 5.27 – The induction time of squalane with varying amounts of methyl linoleate
and phenolic antioxidant at 130 oC………………………………………180
Figure 5.28 – The induction time of squalane with varying amounts of methyl linoleate
and aminic antioxidant at 170 oC………………..……………………….180
Figure 5.29 – The induction time of squalane with varying amounts of methyl linoleate
and aminic antioxidant at 130 oC………………..……………………….181
Figure 5.30 – The ‘donation’ of a hydrogen atom to ML peroxy radicals to inhibit the
propagation cycle…….…………….……………….……………………182
Figure 5.31 – Arrhenius plots for squalane and methyl linoleate……………………….194
List of Tables
Table 2.1 – Reactor Properties………………………………………………………....45
Table 3.1 – The proposed reaction pathways for the epoxides and fragmentation
products from the different methyl linoleate alkoxyl radicals………..........81
Table 3.2 – The % selectivity of each of the alkoxyl radical structures at each
temperature………………………………………………………………...98
Table 4.1 – The pseudo-first order rate of decay of squalane oxidation between
100 – 170 oC under a 0.08dm
3 min
-1 flow of oxygen………..…………...110
Table 4.2 – The change in ksqualane relative to standard ksqualane0 at various
temperatures………………………………………………………………136
Table 4.3 – The ceiling temperature for oxygen addition to ML radicals at different
partial pressures of oxygen………………………….……………………152
Table 5.1 – The exact amounts of methyl linoleate and phenolic antioxidant in the
squalane, ML and phenolic AO mixtures…….……………………..……171
Table 5.2 – The exact amounts of methyl linoleate and aminic antioxidant in the
squalane, ML and Aminic AO mixtures………………………………….171
Table 5.3 – The exact amounts of methyl linoleate and detergent in the squalane, ML
and detergent mixtures……………………………………………………171
Table A.1 – The GC EI-MS data for methyl linoleate oxidation at 170 oC, including
NIST library matches and subsequent product identification…………..195
Table A.2 – The GC FI-MS data for methyl linoleate oxidation at 170 oC and subsequent
product identification………………………………...………………….197
The Autoxidation of Biodiesel and its Effects on Engine Lubricants
xviii
Table A.3 – The GC EI-MS data for methyl oleate oxidation at 170 oC including NIST
library matches and subsequent product identification…………...……...198
Table A.4 – The GC CI-MS data for methyl oleate oxidation at 170 oC and subsequent
product identification…………………………………………….…….…200

Acknowledgements
xix
Acknowledgements
Firstly, thanks must go to Dr Moray Stark for accepting me onto the project and
supervising me throughout for the last three years, not to mention proof reading the entire
thesis! Also to Dr Craig Jones and Dr Jola Adamczewka at Lubrizol for funding the project
as well as for providing biodiesel and additive samples. Thanks also to Dr Duncan
Macquarrie for being my IPM and giving much needed feedback throughout the project.
Without you, this project would never even have got started in the first place!
Big thanks to Dr Alfahad Alfadhl for helping me find my feet in those first few
weeks, showing me around the lab, how to use equipment and generally helping me get
started as well as for his work on additives in lubricants that significantly helped me with
my work. Similarly, thanks to Dr Julian Wilkinson for his previous work on lubricant
oxidation and to Alexandra Neal, George Parker and Rob Jamieson for their preliminary
work on methyl oleate and methyl linoleate which provided an excellent platform for me to
get started on. Thanks especially to my fellow group members Peter Hurst, Bernadeta
Pochopien and Gareth Moody for help with equipment, contributing ideas and results,
pooling intellect together and general support. You’ve been great company guys and best
of luck with your own theses!
On a similar note, thanks to everyone I’ve been involved with in the Green
Chemistry Centre, whether through work, office banter or socialising on nights out you’ve
all helped in one way or another, if nothing else simply by helping make these last three
years hugely enjoyable. There are way too many of you to mention here and I’d be sure to
forget someone, so I will simply say thank you to you all and the best of luck wherever you
end up!
Thanks to Dr Trevor Dransfield and Ben Glennie in the Mass Spectrometry
department, but special thanks Dr Karl Heaton for his help, feedback and patience as we
were setting up a method for GPC-MS. Likewise thanks must go to glassblowers Brian
Smith and Abigail Storey and to Chris Mortimer, Wayne Robinson and Jon Hamstead in
mechanical workshops for making and repairing our equipment.
Last and definitely by no means least, big, big thanks to my parents and the rest of
my family and close friends for all their support in one way or another over the years.

The Autoxidation of Biodiesel and its Effects on Engine Lubricants
xx

Author’s Declaration
xxi
Author’s Declaration
I confirm that the material presented within this thesis is my own work and
previously unpresented or unpublished to my knowledge with the exception of the
following:
Autoxidation of methyl oleate experiment and GC trace in figure 3.5 carried out by
George Parker. Subsequent EI- and CI- MS interpretation carried out by George Parker,
Alexandra Neal and Dr Moray Stark.
Denisov cycle in figure 5.5 taken from Mechanism of Regeneration of Hindered
Nitroxyl and Aromatic Amines, Polymer Degradation and Stability, by T.E. Denisov,
1989.

The Autoxidation of Biodiesel and its Effects on Engine Lubricants
xxii
Chapter 1 Introduction
1
Chapter 1. Introduction
1.1 History of Fuels, Crude Oil and Renewables
During the 18th
and 19th
century, advances in agriculture, mining, manufacture and
transport led to a major overhaul in the technology and subsequently culture of the world
in what is now known as the Industrial Revolution. As a result, in certain areas, traditional
manual labour could no longer produce goods quickly or carry out operations powerful
enough to supply the increased demand. Many tasks became mechanised and this process
brought with it a new challenge; supplying the machines with sufficient power to keep
them running.
The use of fast-flowing rivers to turn water wheels and thus drive machines was one
of the first major automated processes, particularly in the textile industry, but this limited
industry to places where such rivers could be found. Thomas Savery, then later Thomas
Newcomen had used the idea of using a steam driven piston to draw water from a well and
drain mines – a jet of steam would be injected into the cylinder to raise the pressure and
drive the piston up, then a jet of cold water would cool the cylinder, reducing pressure and
pulling the piston back. This design was inefficient, the alternating heating and cooling of
the cylinder meant that a lot of energy was lost, resulting in large amounts of fuel usage –
however, the idea of using an increase in pressure to drive a piston would ultimately prove
to be a significant one for the development of transport.
James Watt’s steam engine was the breakthrough model, using a separate cylinder to
condense the steam (Spear 2008), followed by several other modifications resulting in a
model that used 75% less fuel than Newcomen’s engine. Furthermore, in contrast to the
water wheels, where the machines had to be taken to the water source, this development
meant that an efficient machine now existed that could have its fuel transported to it and
hence operate anywhere. The next breakthrough for the transport industry came via
William Murdoch, an employee of Watt’s and his business partner Matthew Boulton
(though it was Watt who patented it). The breakthrough was to attach a beam to the end of
the piston which connected via a crank to a cogwheel, which in turn was attached to and
rotated around a larger cogwheel meaning the piston could now be used to provide
rotational as well as linear motion. This apparatus became known as the ‘sun and planet’
gear due the nature of the smaller cogwheel orbiting the main wheel. Being able to finally
The Autoxidation of Biodiesel and its Effects on Engine Lubricants
2
turn wheels, this system became the engine for the steam train – the first form of transport
driven by fuel, rather than natural forces such as the wind or horsepower.
Due to the abundance and cheap cost of coal, the steam engine would go on to be the
main form of power in industry for the next century, whilst the steam train became a
popular form of transport, particularly in Britain to export the products it was mass
producing as the industrial revolution thrived and in the U.S.A. to aid transport across such
large areas during colonisation. (Dickinson 2011, Hills 1993)
The next major advance for the transport industry would be the development of the
internal combustion engine. This differed from the steam engine in that the fuel was not
used to heat water (or any other medium) to power the machine, but rather the combustion
of the fuel itself to form carbon dioxide and water vapour provided the increase in pressure
necessary to drive the pistons. The earliest internal combustion engines can be traced back
to China, Mongolia and Arabic states in the 13th
Century, (Gruntman 2004). Similarly, in
16th
Century Europe, Da Vinci described a compression-less engine and though this was
little more than a toy at the time, it gained fame when Huygens used a model of it working
on gunpowder to drive the water pumps at the Versaille palace gardens. The problem with
these models was the fuels were all solids and thus the engines had to be stopped after each
cycle to be reloaded. In the early 19th
century, de Rivaz developed an internal combustion
engine that could use hydrogen as a continual fuel supply solving the problem.
Unfortunately this design never took off as hydrogen was hard and expensive to obtain in
those days, especially in comparison to coal.
Nevertheless the prospect of producing a faster, more powerful engine than the steam
engine was still a promising one and the 19th
century saw a newfound interest in the
internal combustion engine, especially with the advent of the oil industry. Many different
designs were proposed or built with varying degrees of success – it is hard to say who
made the breakthrough as many inventors failed to patent their designs, or were beaten to it
by their rivals, but it is currently accepted that Nikolaus Otto was the first to build and sell
the engine (Heywood 1988) – the Otto Cycle Engine (U.S Patent 388,372). Gottlieb
Daimler took the design a step further towards what is known today as the gasoline engine
and in 1886, Karl Benz received the first patent (DRP No. 37435) for a gasoline-fueled car.
The usage of petroleum from crude oil as a source of fuel enabled the internal combustion
engine to surpass the steam engine in terms of power output, but could not overtake it in
production in areas where coal was more abundant than oil and would require increased
costs to import.
Chapter 1 Introduction
3
In the late 1890’s Rudolf Diesel adapted the Otto Cycle Engine in a different manner
– by mixing the fuel droplets with the air inside the combustion chamber, rather than
drawing it in pre-mixed – to enable it to run on vegetable, rather than mineral oils. The first
model was run using peanut oil and Diesel envisaged a large market for the engine as
various different plant oils could be produced in all parts of the world (Bryant 1976).
Diesel’s engine would make him a millionaire and be used throughout industry,
particularly where heavy duty, ‘dirty’ work was required, though due to cheap costs, the
fuel that was eventually to be used would be the heavier hydrocarbon fraction from
petroleum distillation, as opposed to the vegetable oils Diesel originally intended.
As the oil industry’s efficiency increased and the costs decreased, both Daimler and
Diesel’s engines became the first choice for the transport industry in road (primarily
Daimler’s engine) and rail (primarily Diesel’s, though this was later partially phased out
due to electrification of the railway lines) rendering Watt’s steam engine obsolete by the
end of the 20th
century. The burning of fuels for power was, for a long time unregulated as
it was believed the atmosphere into which the resulting gases were emitted, was essentially
a large, stable, unreactive sink.
In the late 1950’s due to the emissions from other industries mainly into the water
and land, environmental legislation was introduced. Research from these showed that the
atmosphere itself was also a delicate ecosystem, spawning atmospheric chemistry as a new
field of research, itself divided into atmospheric regions such as the tropo- and stratosphere
and chemistry type such as aerosol and photochemistry (Cadle 1972, Levy II 1972, Nicolet
1972). A particular concern was the absorption of IR-radiation by carbon dioxide and the
resulting warming effect it has and will continue to have on the climate of our planet
(Johnson 1970, Woodwell 1979, Cox 2000, Wayne 2000) and the subsequent disruption of
the ecosystem (Manabe 1975 & 1993, Sarmiento 1998 (Air/ocean system) Attiwill 1970,
Cao 1998 (plant and soil carbon sinks)). As a result the Intergovernmental Panel of
Climate Change (IPCC) was set up with legislation being gradually introduced to limit
CO2 emissions; most notably the Kyoto Protocol which calls for an average 5.2% reduction
in emissions in all areas with respect to 1990 levels during the 2008 – 2012 period.
Consequently, EU directives, such as Euro 5 (EC Regulation No. 715/2007) and Euro 6
(EC Regulation No. 595/2009) have set targets on reducing these emissions; the use of
biofuels to replace traditional mineral oils is one method thought to have the potential for
achieving this. The stated EU directive is that biofuels, including biogas, bioethanol and
biodiesel must make up 10% of the fuel share for transport, replacing petrol and diesel
The Autoxidation of Biodiesel and its Effects on Engine Lubricants
4
consumption by 2020 (EC Regulation No. 28/2009). Currently, at the time of writing, the
European Standard is for diesel fuel to consist of 7% biodiesel (EN590).
Despite environmental concerns demand for crude oil was increasing due to the
expansion of the transport industry and other sectors (particularly the chemical synthesis
industries) relying on production of crude oil. However new reserves were slow to appear
and the rate of replenishment of existing ones was almost negligible compared to their
consumption rates (Boult 2003). Demand, coupled with political instability in some oil
producing regions, caused the cost of extraction and sale price on the market to begin
rising and continued to rise erratically even up until recently. The cost of crude oil rose
from $33 per barrel in 2004, to $72 per barrel in 2006, reaching a peak of $147 per barrel
by July 2008 and currently averaging $110 per barrel as of April 2011(U.S Department of
Energy).
Due to a combination of all these factors, it became clear that crude oil reserves
could not continue to sustain the transport industry and unfortunately, the same was true of
coal. As such the new challenge for the transport industry has, once again, come down to
the choice of fuel. Electrification of the automotive (as with the locomotive) industry has
been considered, though this still requires a fuel source elsewhere, as has the use of solar
powered cars. The two most popular choices so far have been the return to some of the
original ideas for the internal combustion engine – hydrogen (de Rivaz) and vegetable oils
(Diesel). Whilst hydrogen is now more easily obtained than in de Rivaz’s days, obtaining it
on a scale necessary to sustain the transport industry is still problematic, as is the issue of
storing it and delivering it to the combustion chamber using the current automobile
designs. As Diesel’s engine was designed to run on vegetable oils originally, the idea of
returning to these oils or modifying them to Biodiesel is currently seen as one of the most
feasible methods for replacing diesel from crude oil and hence reducing CO2 emissions
(Hill, J. 2006, Dermibas 2007); the original, non-binding target set for the UK to achieve
Kyoto targets was that biofuels should make up 5.75% of fuel usage by 2010 (Department
for Transport 2005) – however a legally binding legislation to achieve EU legislation
based on the level of success of this target has not been finalised at the current time of
writing. Whilst it is true that biofuels release carbon dioxide on combustion, the crop used
is planted and harvested each year so, to an extent, the emissions will be absorbed by the
following year’s crop rather than persist in the atmosphere (Dvorák 2001).
However, both legislative and consumer demands have both changed considerably
since Diesel’s day and it is impossible to meet these by simply switching back to vegetable
Chapter 1 Introduction
5
oils. Over the remainder of this chapter, the properties of vegetable oils and their biodiesel
derivatives will be discussed as well as the problems associated with their usage. The
remaining chapters will be spent trying to identify the causes for some of these problems
with the aim that solutions can be found to reduce, or even remove them.
1.2 Biodiesel Manufacture and Properties
Rudolf Diesel’s version of the internal combustion engine using peanut oil was
designed with the goal of utilising other vegetable oils as a readily available, renewable
fuel source. The exact nature of vegetable oils and lipids differ according to the organism
they are produced by, but they all follow the same basic structure of up to 3 long chain
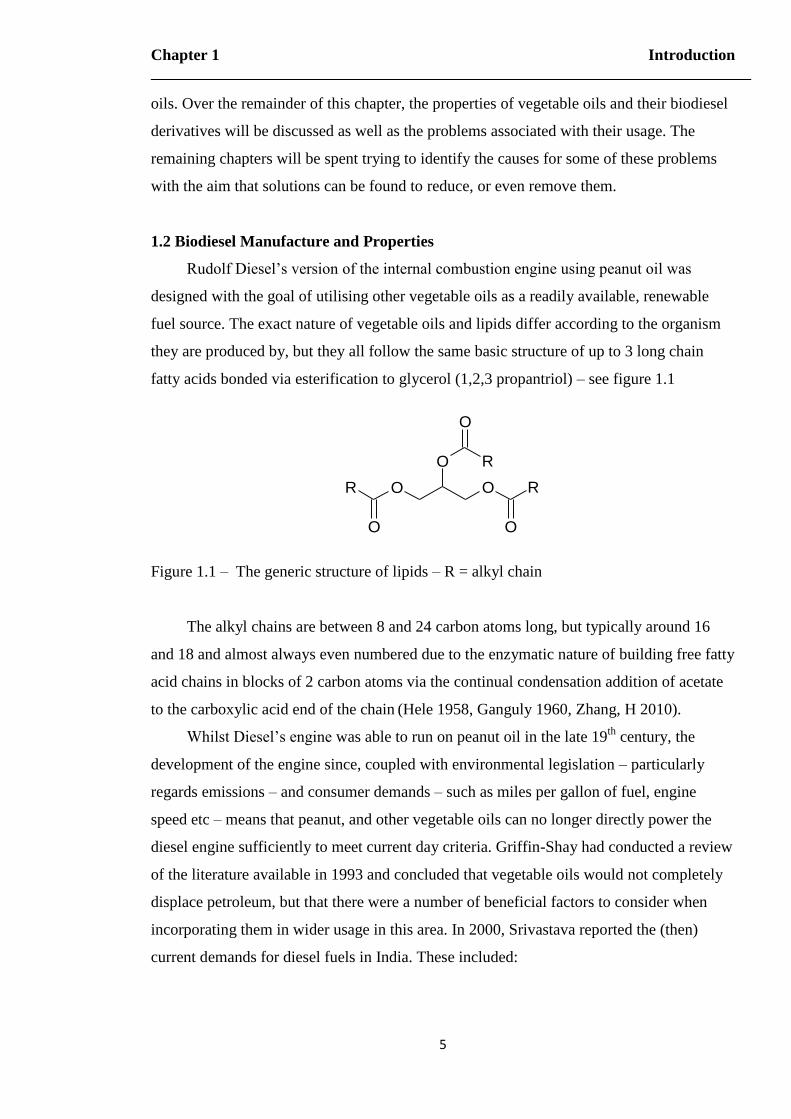
fatty acids bonded via esterification to glycerol (1,2,3 propantriol) – see figure 1.1
Figure 1.1 – The generic structure of lipids – R = alkyl chain
The alkyl chains are between 8 and 24 carbon atoms long, but typically around 16
and 18 and almost always even numbered due to the enzymatic nature of building free fatty
acid chains in blocks of 2 carbon atoms via the continual condensation addition of acetate
to the carboxylic acid end of the chain (Hele 1958, Ganguly 1960, Zhang, H 2010).
Whilst Diesel’s engine was able to run on peanut oil in the late 19th
century, the
development of the engine since, coupled with environmental legislation – particularly
regards emissions – and consumer demands – such as miles per gallon of fuel, engine
speed etc – means that peanut, and other vegetable oils can no longer directly power the
diesel engine sufficiently to meet current day criteria. Griffin-Shay had conducted a review
of the literature available in 1993 and concluded that vegetable oils would not completely
displace petroleum, but that there were a number of beneficial factors to consider when
incorporating them in wider usage in this area. In 2000, Srivastava reported the (then)
current demands for diesel fuels in India. These included:
O
O
O
O
R R
O
O
R
The Autoxidation of Biodiesel and its Effects on Engine Lubricants
6
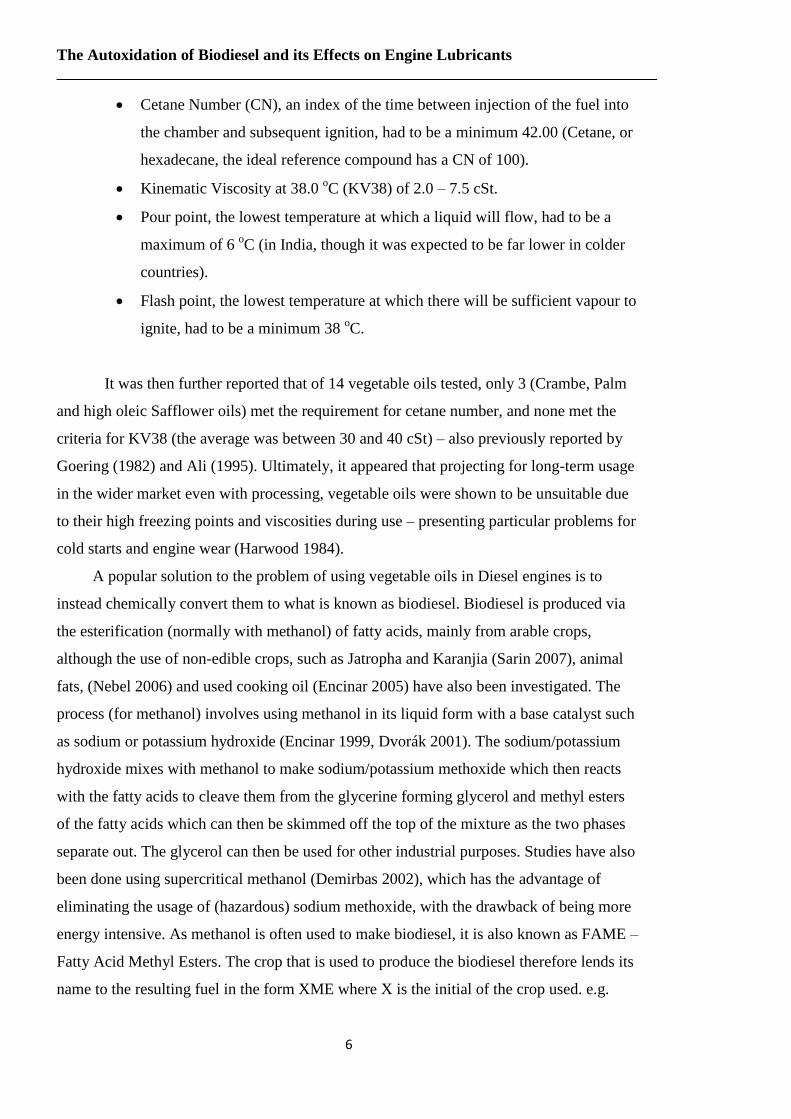
Cetane Number (CN), an index of the time between injection of the fuel into
the chamber and subsequent ignition, had to be a minimum 42.00 (Cetane, or
hexadecane, the ideal reference compound has a CN of 100).
Kinematic Viscosity at 38.0 oC (KV38) of 2.0 – 7.5 cSt.
Pour point, the lowest temperature at which a liquid will flow, had to be a
maximum of 6 oC (in India, though it was expected to be far lower in colder
countries).
Flash point, the lowest temperature at which there will be sufficient vapour to
ignite, had to be a minimum 38 oC.
It was then further reported that of 14 vegetable oils tested, only 3 (Crambe, Palm
and high oleic Safflower oils) met the requirement for cetane number, and none met the
criteria for KV38 (the average was between 30 and 40 cSt) – also previously reported by
Goering (1982) and Ali (1995). Ultimately, it appeared that projecting for long-term usage
in the wider market even with processing, vegetable oils were shown to be unsuitable due
to their high freezing points and viscosities during use – presenting particular problems for
cold starts and engine wear (Harwood 1984).
A popular solution to the problem of using vegetable oils in Diesel engines is to
instead chemically convert them to what is known as biodiesel. Biodiesel is produced via
the esterification (normally with methanol) of fatty acids, mainly from arable crops,
although the use of non-edible crops, such as Jatropha and Karanjia (Sarin 2007), animal
fats, (Nebel 2006) and used cooking oil (Encinar 2005) have also been investigated. The
process (for methanol) involves using methanol in its liquid form with a base catalyst such
as sodium or potassium hydroxide (Encinar 1999, Dvorák 2001). The sodium/potassium
hydroxide mixes with methanol to make sodium/potassium methoxide which then reacts
with the fatty acids to cleave them from the glycerine forming glycerol and methyl esters
of the fatty acids which can then be skimmed off the top of the mixture as the two phases
separate out. The glycerol can then be used for other industrial purposes. Studies have also
been done using supercritical methanol (Demirbas 2002), which has the advantage of
eliminating the usage of (hazardous) sodium methoxide, with the drawback of being more
energy intensive. As methanol is often used to make biodiesel, it is also known as FAME –
Fatty Acid Methyl Esters. The crop that is used to produce the biodiesel therefore lends its
name to the resulting fuel in the form XME where X is the initial of the crop used. e.g.
Chapter 1 Introduction
7
RME = Rapeseed Methyl Ester, SME = Soybean Methyl Ester, PME = Palm Methyl Ester
etc. As well as lowering the fuel’s viscosity and freezing points (Ma 1999) to levels more
comparative with mineral diesel, transesterification with methanol also has the added
advantage over vegetable oil of being miscible with mineral diesel and hence able to form
fuel blends for use in engines (Agarwal 2001).
The usage of other alcohols for transesterification has also been investigated. Du
Plessis (1985) compared the stability of methyl and ethyl esters of sunflower oil during
storage but found that ethyl esters were less stable at all storage temperatures, leading to
increased acidity and viscosity of the fuel over a 3-month period. Knothe (1998)
investigated the effect of both the alkyl chain and the alcohol moiety of the ester on the
cetane number of the fuel and discovered that whilst a longer chain would increase the
cetane of the fuel, branching subsequently decreased it (the highly branched isomer of
hexadecane, 2,2,4,4,6,8,8 heptamethyl nonane has a CN of only 15) – leading to problems
when using alcohols with more than four carbons for esterification. In addition, as
previously noted an increase in carbon number increases the viscosity, creating further
problems. Interestingly as well, separate studies by Knothe (1997, 2003, summarised 2005)
showed that when the alkyl chain of the ester was unsaturated, the increase in chain length
of the alcohol moiety had the potential to decrease the CN.
Similarly, it has been considered not employing any esterification techniques and
simply using the free fatty acids (FFA) for biodiesel. However since many studies using
FAME with relatively high levels (<20%) of FFA have shown increased problems in
acidity, corrosion and overall damage to the fuel injectors and engine (Ghadge 2005,
Tiwari 2007, Berchmans 2008, Ranz 2010) it has been concluded that FFA could not meet
the current criteria necessary for fuel. Ultimately, due to optimum properties, methyl esters
have been generally accepted as the industrial standard for biodiesel.
The choice of which crops to use for biodiesel is still the subject of much debate.
Concerning physical properties only, the factors affecting cetane number would suggest
that plants favouring the production of longer, saturated chains would be the most suitable,
at least during the running of the engine, as the temperatures of combustion would easily
overcome the subsequent increase in viscosity; Krisnangkura (2006) provided an empirical
method of predicting the temperature dependence of the viscosity of a biodiesel based
upon knowing the FAME content. Palm Oil (PME), with a high content of palmitate and
stearate, saturated 16 and 18 carbon compounds respectively (Graboski 1998, Ma 1999,

The Autoxidation of Biodiesel and its Effects on Engine Lubricants
8
Srivastava 2000, Yuan 2005, Yizhe 2008, Balat 2010), has therefore become a popular
choice for biodiesel production.
Outside of normal engine operations, however, the low viscosity, and hence high
pour point can cause serious problems for engines running in colder conditions as noted
previously. Increasing the amount of unsaturation in the alkyl chain can help lower the
viscosity, freezing and pour points at the expense of also lowering the cetane number.
Combinations of saturated and unsaturated methyl esters can therefore help balance these
properties and crops such as Rapeseed (RME) and Soybean (SME) that produce both
palmitate and stearate as well as oleate and linoleate (Ma 1999, Srivastava 2000, Yuan
2005, Yizhe 2008, Balat 2010) (the singly and doubly unsaturated analogues of stearate
respectively) have therefore also become popular choices as crops for biodiesel. In addition
to their abundance and cheap production the three have now become the leading biodiesel
crops in Europe and North America (Bockey 2002) – the three often being used in blends
to create commercially available biodiesel.
Another area of concern has been raised on the issue of growing crops for fuel in
place of food, particularly in the light of food supplies in 3rd
world countries (Srinisavan
2009). It is unfortunate therefore, that the three aforementioned crops are also highly
valued in the food industry (Hill, K. 2000, Thoenes 2006). In addition to ethical concern,
there is also economical concern that as demand for rapeseed etc increases as a new market
opens up for it that prices for these crops will also increase, which is undesirable from the
point of view of both the food and fuel markets. Whilst arable crops show good potential
for use of biodiesel, they clearly cannot supply the market by themselves.
One solution has been to take the used oil, rather than then virgin material, and put
it through the same transesterification processes to produce Used Cooking Oil (UCO)
biodiesel (Zhang, Y. 2003). As well as not immediately competing with the food market,
due to being used in the fuel industry after usage, UCO biodiesel has another immediate
advantage over virgin oil in that it is cheaper due to coming from a waste stream as
opposed to a raw material and as such reduces water pollution the need for landfill.
During usage UCO biodiesel has shown very similar physical (pour and flash point)
and combustion (CN) properties to virgin oil biodiesel – though the feedstock oil was still
a significant determinant in the used oil’s properties (Lapuerta 2008). The higher oxygen
content of UCO from autoxidation (see section 1.5) during usage led to a reduction in
particulate emissions however those that were emitted were smaller in diameter (Lapuerta
2008) which could be a potential barrier depending on how legislation on particulate
Chapter 1 Introduction
9
matter emissions proceed and may require the need for refinement. At present though
FAME from UCO sources complies with current legislation and is a very viable option for
fuel that does not compete with food crop production (Enweremadu 2009).
Another proposed option is to use plants that are inedible to humans, yet are also
triglyceride, or fatty acid producing. One that has become of considerable interest in Asia
is the plant Jatropha (Sarin 2007, Zhang F.L. 2008, Jain 2010). The specific species,
Jatropha curcas (common name: Ratanjyot), has been identified as a potential biodiesel
crop due to its high oil content of between 30-40% (Sarin 2007) and the fact that FAME
material produced from it has a desirable cetane number of 51 (Jain 2010) and testing has
shown it to have other comparable properties to diesel (Chauan 2006). It is also of interest,
not just because it is inedible, but because it can grow in drier, arid conditions that would
not be suitable for growing arable crops, hence would not impede upon land used for
growing food and as such provides the potential for not only generating fuel, but
recapturing wasteland and boosting the economy of local communities that may farm it.
Other crops have since been investigated for their potential to achieve similar results, the
next most significant being Pongamia pinnata (Karanjia), but Jain also identified Kusum,
Neem and Mahua as plants to be considered.
In the food vs. fuel debate, these inedible crops, amongst others became the next
wave of biodiesels and are sometimes referred to as second generation biodiesels, whilst
their predecessors (from rapeseed, soybean etc) are first generation (Naik 2010). But whilst
their source material may be different, the biodiesel produced is still a mixture of FAME –
Jatropha also contains mainly palmitic, stearic, oleic and linoleic acids – and as such, they
can be grouped together when their chemistry is being analysed. 2nd
generation biofuels
can also differ in production methods, whilst still using the same source materials. There
are other areas currently being investigated of producing diesel from other bio-materials
such as algae, lignin and cellulose (3rd
and 4th
generation etc) which at present look like
they may depart from the traditional FAME biodiesels. At present, however, FAME is still
the predominant form of biodiesel and as such, this chapter and all subsequent ones will
(unless otherwise stated) consider biodiesel as FAME mixtures.
1.3 Increasing Usage of Biodiesel
Biodiesel has been in existence in its FAME format since the mid-1930’s (Pousa
2007), but never took off as a popular fuel, mainly due to petrol and mineral diesel being
considerably cheaper and much more readily available. Instead, vegetable oils and
The Autoxidation of Biodiesel and its Effects on Engine Lubricants
10
biodiesels were typically confined to use in times of fuel shortage and other emergency
situations (Pousa 2000, Sharma 2009). Usage of biodiesel was otherwise mainly confined
to rural, agricultural areas where waste crops could be quickly converted to biodiesel on
site to power farming machinery providing an easy fuel source and avoiding the need to
import.
Avoiding the need to import was another major factor in biofuel development –
crude oil may have been historically preferred due to its high abundance and low cost of
production, but there was still the issue of transport. Britain, the U.S.A., Russia and
particularly the Middle East all had their own oil reserves to drill, each with their own
differing compositions. For instance, one region’s oil reserves could be high in aromatics
and low in saturates, whilst another may be the reverse (Aske 2001). This meant that
Europe, Asia and North America all had plenty of oil to hand and to trade with other to
complement each other’s strengths and weaknesses. South America’s oil reserves were
considerably smaller however, meaning importation was necessary – a fact not helped by
the fact that the southernmost countries were not amongst the commonly used trade routes,
driving the prices up further. Exploiting the region’s own natural resources was a much
more viable alternative and hence Latin American countries developed an interest in
biofuels much earlier than most of the developed world. Brazil’s abundance of sugar cane,
for instance, made for an easy source of sugars to cheaply ferment to make ethanol. As a
result, Brazil’s fuel economy is now made up largely of bioethanol which is also one of its
major exports – as of 2005 Brazil’s production of bioethanol equalled half of the global
production (Smeets 2008).
Diesel was still a necessary fuel for heavier machinery though and so, although
taking a back seat to bioethanol, research into biodiesel was still a popular area. Globally,
interest in biodiesel was revived during the petroleum crisis of the 1970’s (Pousa 2000,
Radich 2004), triggered by political unrest in Arabian oil producing states, particularly the
Iranian Revolution (Campbell 1998) and therefore raising the awareness of the developed
world’s dependence on cheap petroleum. The Gulf War of 1990-1991 saw another surge in
oil prices again sparking interest in renewable fuels which this time around has persisted
this far partially due to the noted trend of oil price spikes triggering recession and
excessive inflation (Barsky 2004), but also due to increasing interest in environmental
issues and climate change during the 2000’s as a result of the culmination of research into
global warming, sustainability and energy demands leading to stricter legislation on such
matters (EU Paper COM (2006) 105).

Chapter 1 Introduction
11
The 1990’s also saw the beginning of commercial production of biodiesel in the
U.S.A. with areas such as Europe and India swiftly following (Srivastava 2000) and has
been a rapidly expanding market – in the U.S.A. alone production went from 500,000
gallons per annum in 1999 to 6.7 million gallons p.a. in 2000 (Radich 2004) and 114
million gallons p.a. in 2003, with European production at 450 million gallons p.a. in 2003
(Haas 2006). However with arable crops being the most readily available feedstock, they
have also become the primary choice for biodiesel production which has led to conflict
with food usage due to concern over food prices and third world poverty in what is known
as the ‘Food vs. Fuel’ debate (Srinisavan 2009). Whilst the usage of non-food crops (such
as Jatropha), UCO biodiesel or 2nd
, 3rd
and above generation biodiesel are all being
researched, arable crops such as palm, rape and soybean currently make up the bulk of
biodiesel feedstocks (Szulczyk 2010), with the food vs. fuel debate currently unresolved at
the time of writing.
1.4 Lubrication
Both the steam engine and the internal combustion engine went through several
modifications before arriving at the finished models that would become familiar to the
world during the industrial revolution. The main aims throughout the developments were
to arrive at a design that would make efficient use of the fuel it was using. Watt may have
had made the breakthrough that avoided the inefficient alternating of heating and cooling
the cylinder, but there was still another major source of heat and energy loss. A tight seal
between the piston and cylinder wall was required to prevent escape of the steam as this
would prevent the build up and decline of pressure required to drive the piston. This tight
fit came with the trade-off of friction between the two surfaces preventing the piston
moving as quickly and as smoothly as it would have done otherwise. This required more
fuel to drive the piston to overcome the friction and hence resulted in a loss of efficiency.
More seriously, the friction between the surfaces also wore them down over time, reducing
the tight fit between the walls and allowing steam to escape, once more reducing the
efficiency of the engine, but also over time rendering the machinery incapable of carrying
out its function properly. Replacing the machinery was undesirable as it was expensive and
therefore another challenge was to preserve the working lifetime of the engine for as long
as possible.
The same problems arose where the rod met the wheel and on the bearings for the
wheels – in fact all areas where moving parts came into contact with either their supports
The Autoxidation of Biodiesel and its Effects on Engine Lubricants
12
or each other were, and still are, subject to wear. The solution, fortunately, was therefore
universal for all areas and came in the form of lubrication – employing a liquid or grease, a
lubricant, between the two surfaces to prevent friction to both allowing two surfaces to
slide freely across each other and to prevent wear between them. There is no universal
lubricant as different purposes require different properties from their lubricant. Indeed, if
there were only a handful of lubricants to choose from, then the most readily available one
would generally be the one selected, regardless of the disadvantages which initially, before
the advent of crude oil, this was generally the method of selection and early (pre-19th
Century) lubricants ranged from goose fat to natural graphite (Lansdown 2004).
However, as the complexity of machinery has evolved, so too has the specificity of
the lubricant required and the solution for lubrication of engines came in the same form as
the fuel – crude oil. During the fractional distillation process where petrol and diesel are
separated out, the unvaporised oil is then put through a second process – vacuum
distillation. Through this various types of oils are separated out for different purposes, such
as medical, cosmetic and mechanical lubrication (Stachiowak 2005).
The reasons for the necessity of different types of lubricant vary, even amongst the
same class, or purpose of lubricant. In mechanical lubrication for instance, a machine
designed to operate in cold conditions will need a lubricant that will not freeze at the
required operating temperatures. Similarly, machines operating at high temperatures need
lubricants which will not evaporate, become too thin, or potentially ignite in the presence
of other fuels or sparks. Another factor affecting the lubricant selection can include the
type of surface being lubricated. If a surface is chemically active, the lubricant itself must
be inert so as not to react with the surface and degrade or destroy it. In fact, the same is
true of the lubricant itself – it should ideally be inert and protected in order to prevent its
own degradation and contamination. In some situations, the best solution can be to avoid
lubrication altogether if it difficult or expensive to administer and its usage can lead to
build up of unwanted products.
Automotive engines often experience these problems. Administering the lubricant
to the desired areas requires additional pipework and pumps to transport the lubricant
around the engine where it subjected to both degradation via oxidation and contamination
from the fuel which can lead to unwanted products. Due to the harsh nature of the engine
however, avoiding the use of lubricant altogether would damage the engine even further
and hence is not a viable option. In order to minimise this problem it is necessary to
understand the nature of the fuel contamination as well as the oxidative degradation
Chapter 1 Introduction
13
mechanisms of the lubricant, also the fuel and more generally the behaviour of the species
responsible for oxidation in the first place.
1.5 Oxygen Radicals and Autoxidation
1.5.1 Chemistry of oxygen radicals
Oxygen is rare amongst the elements in the periodic table in that in its common
elemental form, O2, even though it possesses an even number of electrons, rather than fully
pairing up, two electrons are left unpaired in the antibonding orbitals (Mulliken 1932).
This means the molecule is naturally paramagnetic as opposed to diamagnetic and has led
to debates in the scientific community about whether the bonding structure of dioxygen
should be properly represented as a double bond (O=O) or as a diradical
(∙O-O∙) (Kearns
1971) – though at present it is conventionally represented as O=O. The molecular orbital
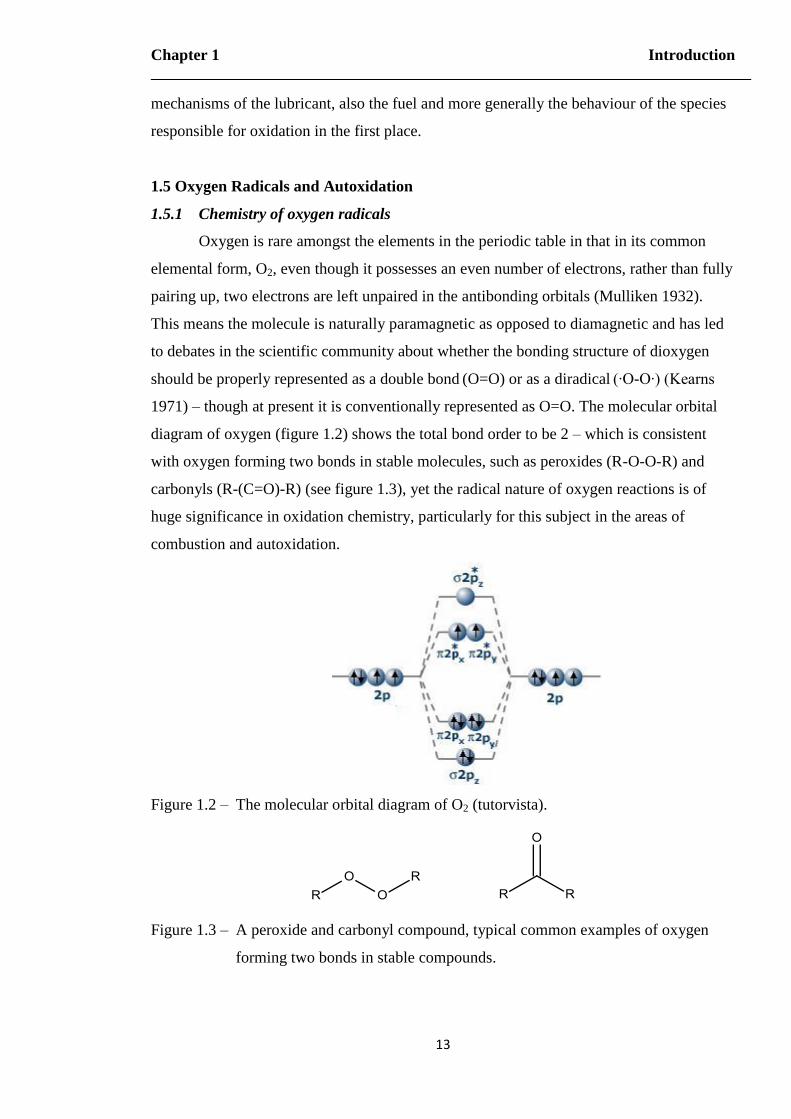
diagram of oxygen (figure 1.2) shows the total bond order to be 2 – which is consistent
with oxygen forming two bonds in stable molecules, such as peroxides (R-O-O-R) and
carbonyls (R-(C=O)-R) (see figure 1.3), yet the radical nature of oxygen reactions is of
huge significance in oxidation chemistry, particularly for this subject in the areas of
combustion and autoxidation.
Figure 1.2 – The molecular orbital diagram of O2 (tutorvista).
Figure 1.3 – A peroxide and carbonyl compound, typical common examples of oxygen
forming two bonds in stable compounds.
The Autoxidation of Biodiesel and its Effects on Engine Lubricants
14
Radical reactions due to their nature generate other radicals which typically go on
to partake in further radical reactions, triggering a chain reaction. Radicals reactions are
therefore rarely single processes but instead a collection generally known as radical chain
reactions or radical cycles with the individual reactions falling into three main categories:
initiation reactions, (chain) propagation reactions and termination reactions.
Initiation reactions are those that set the cycle in motion by creating one or more
unstable, reactive radical species. In controlled radical reactions, such as syntheses, this
usually occurs via the homolytic cleaving of a bond to generate two radical species as
opposed to the more common heterolytic cleaving which generates two oppositely charged
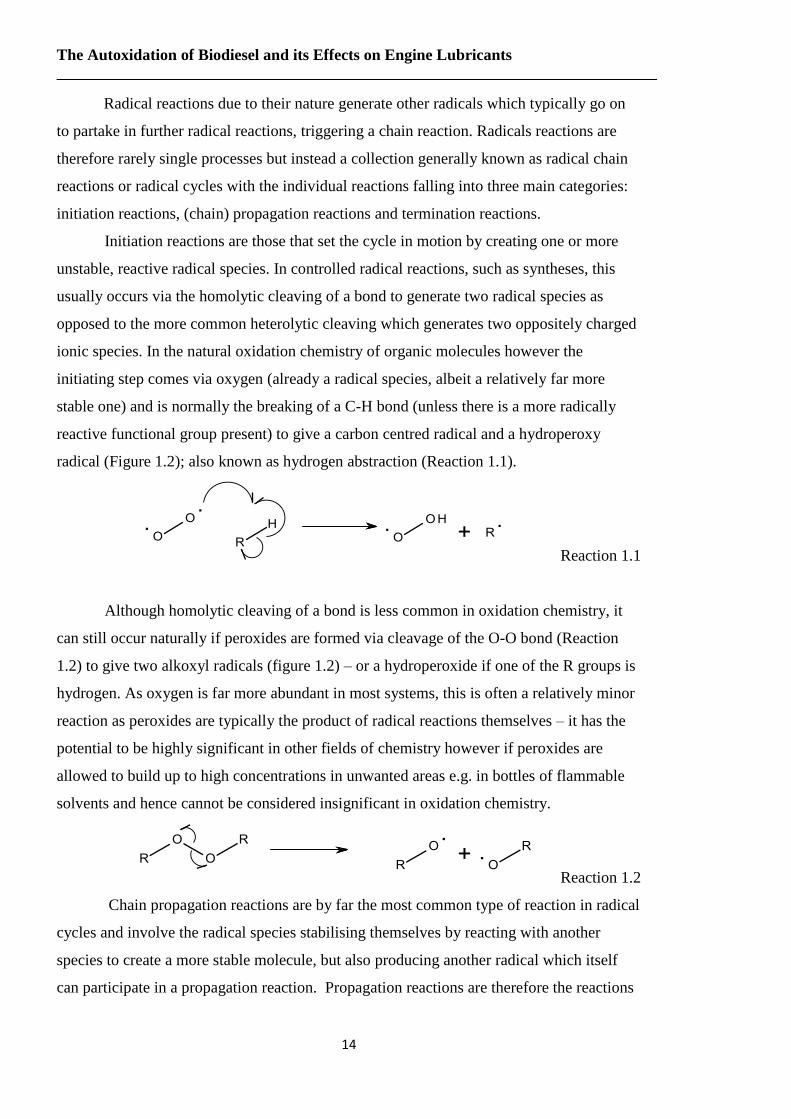
ionic species. In the natural oxidation chemistry of organic molecules however the
initiating step comes via oxygen (already a radical species, albeit a relatively far more
stable one) and is normally the breaking of a C-H bond (unless there is a more radically
reactive functional group present) to give a carbon centred radical and a hydroperoxy
radical (Figure 1.2); also known as hydrogen abstraction (Reaction 1.1).
Reaction 1.1
Although homolytic cleaving of a bond is less common in oxidation chemistry, it
can still occur naturally if peroxides are formed via cleavage of the O-O bond (Reaction
1.2) to give two alkoxyl radicals (figure 1.2) – or a hydroperoxide if one of the R groups is
hydrogen. As oxygen is far more abundant in most systems, this is often a relatively minor
reaction as peroxides are typically the product of radical reactions themselves – it has the
potential to be highly significant in other fields of chemistry however if peroxides are
allowed to build up to high concentrations in unwanted areas e.g. in bottles of flammable
solvents and hence cannot be considered insignificant in oxidation chemistry.
Reaction 1.2
Chain propagation reactions are by far the most common type of reaction in radical
cycles and involve the radical species stabilising themselves by reacting with another
species to create a more stable molecule, but also producing another radical which itself
can participate in a propagation reaction. Propagation reactions are therefore the reactions
Chapter 1 Introduction
15
that enable the radical cycle to continue by continually providing new species of radicals to
react, hence why they are sometimes known as ‘chain’ propagation reactions. In oxidation
chemistry, the species that typically participate the propagation cycle are the oxygen based
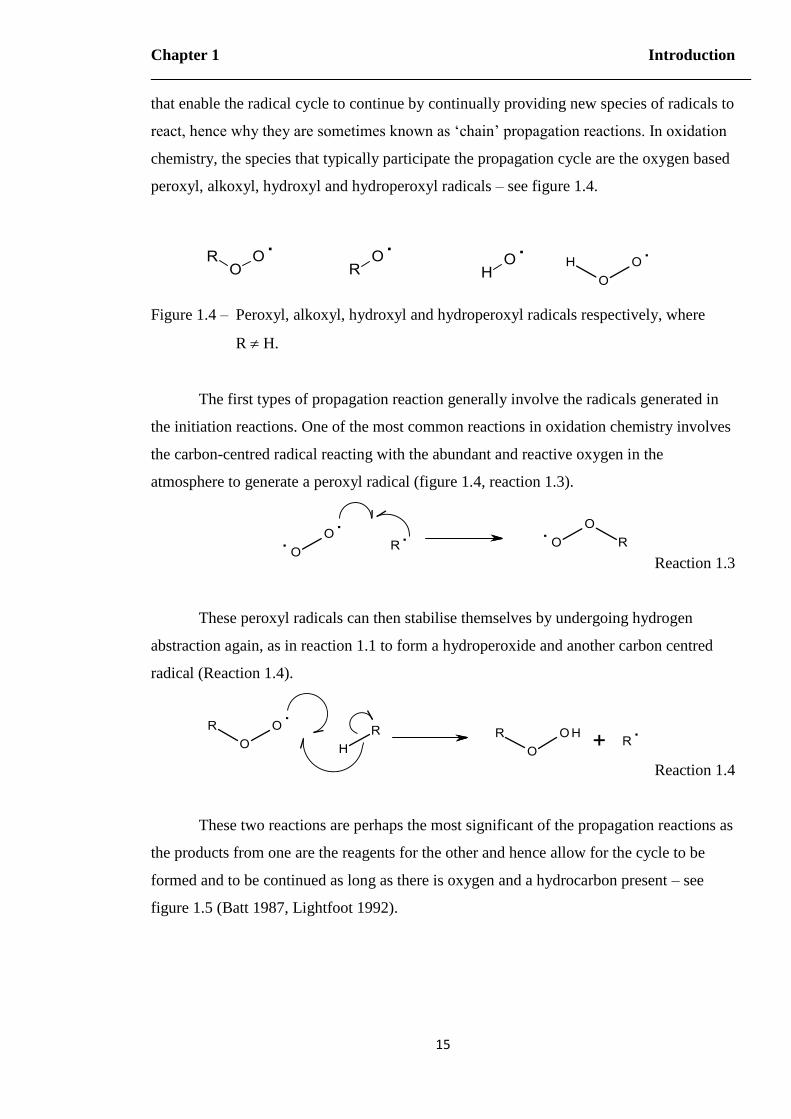
peroxyl, alkoxyl, hydroxyl and hydroperoxyl radicals – see figure 1.4.
Figure 1.4 – Peroxyl, alkoxyl, hydroxyl and hydroperoxyl radicals respectively, where
R H.
The first types of propagation reaction generally involve the radicals generated in
the initiation reactions. One of the most common reactions in oxidation chemistry involves
the carbon-centred radical reacting with the abundant and reactive oxygen in the
atmosphere to generate a peroxyl radical (figure 1.4, reaction 1.3).
Reaction 1.3
These peroxyl radicals can then stabilise themselves by undergoing hydrogen
abstraction again, as in reaction 1.1 to form a hydroperoxide and another carbon centred
radical (Reaction 1.4).
Reaction 1.4
These two reactions are perhaps the most significant of the propagation reactions as
the products from one are the reagents for the other and hence allow for the cycle to be
formed and to be continued as long as there is oxygen and a hydrocarbon present – see
figure 1.5 (Batt 1987, Lightfoot 1992).
The Autoxidation of Biodiesel and its Effects on Engine Lubricants
16
1.3
1.4
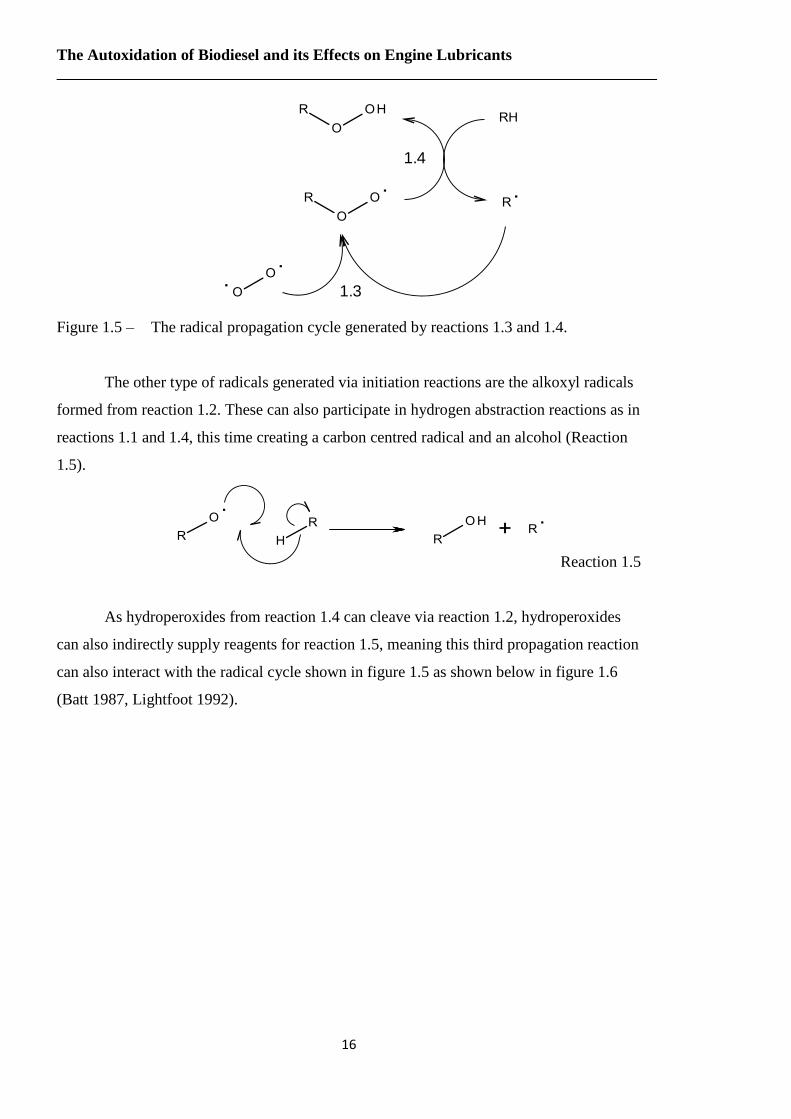
Figure 1.5 – The radical propagation cycle generated by reactions 1.3 and 1.4.
The other type of radicals generated via initiation reactions are the alkoxyl radicals
formed from reaction 1.2. These can also participate in hydrogen abstraction reactions as in
reactions 1.1 and 1.4, this time creating a carbon centred radical and an alcohol (Reaction
1.5).
Reaction 1.5
As hydroperoxides from reaction 1.4 can cleave via reaction 1.2, hydroperoxides
can also indirectly supply reagents for reaction 1.5, meaning this third propagation reaction
can also interact with the radical cycle shown in figure 1.5 as shown below in figure 1.6
(Batt 1987, Lightfoot 1992).
Chapter 1 Introduction
17
1.3
1.4
1.2
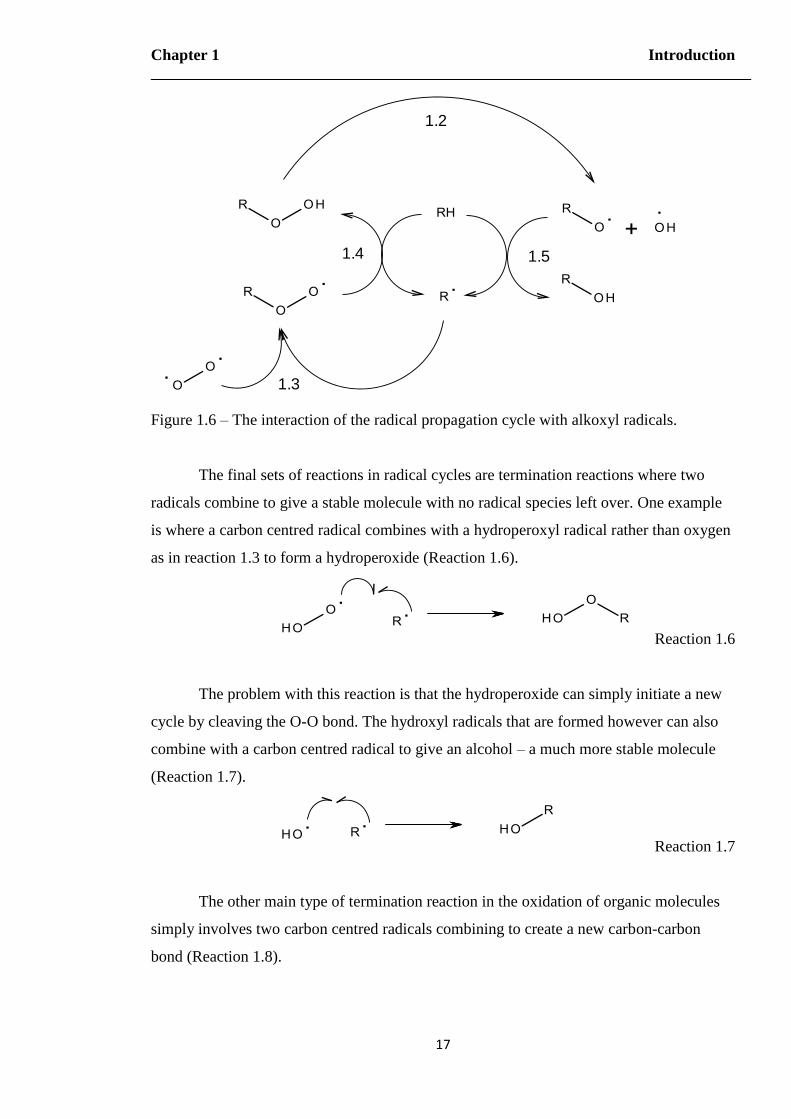
1.5
Figure 1.6 – The interaction of the radical propagation cycle with alkoxyl radicals.
The final sets of reactions in radical cycles are termination reactions where two
radicals combine to give a stable molecule with no radical species left over. One example
is where a carbon centred radical combines with a hydroperoxyl radical rather than oxygen
as in reaction 1.3 to form a hydroperoxide (Reaction 1.6).
Reaction 1.6
The problem with this reaction is that the hydroperoxide can simply initiate a new
cycle by cleaving the O-O bond. The hydroxyl radicals that are formed however can also
combine with a carbon centred radical to give an alcohol – a much more stable molecule
(Reaction 1.7).
Reaction 1.7
The other main type of termination reaction in the oxidation of organic molecules
simply involves two carbon centred radicals combining to create a new carbon-carbon
bond (Reaction 1.8).
The Autoxidation of Biodiesel and its Effects on Engine Lubricants
18
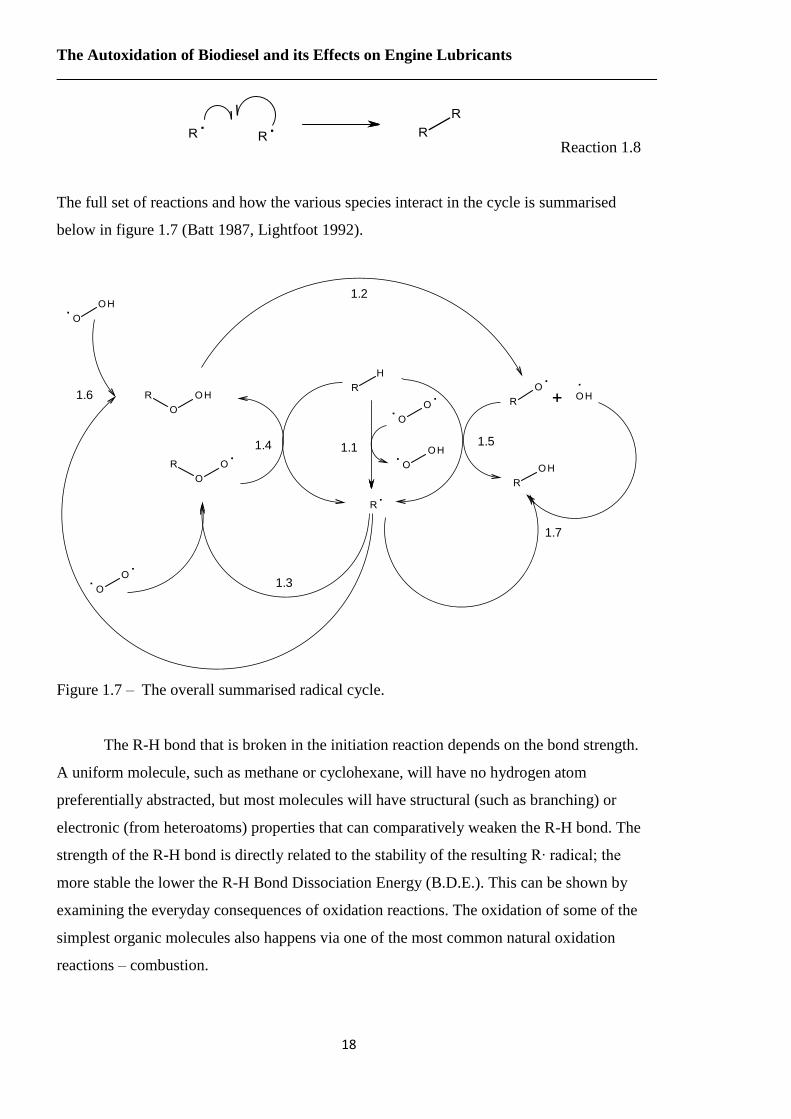
Reaction 1.8
The full set of reactions and how the various species interact in the cycle is summarised
below in figure 1.7 (Batt 1987, Lightfoot 1992).
1.1
1.3
1.4
1.2
1.5
1.7
1.6
Figure 1.7 – The overall summarised radical cycle.
The R-H bond that is broken in the initiation reaction depends on the bond strength.
A uniform molecule, such as methane or cyclohexane, will have no hydrogen atom
preferentially abstracted, but most molecules will have structural (such as branching) or
electronic (from heteroatoms) properties that can comparatively weaken the R-H bond. The
strength of the R-H bond is directly related to the stability of the resulting R∙ radical; the
more stable the lower the R-H Bond Dissociation Energy (B.D.E.). This can be shown by
examining the everyday consequences of oxidation reactions. The oxidation of some of the
simplest organic molecules also happens via one of the most common natural oxidation
reactions – combustion.

Chapter 1 Introduction
19
1.5.2 Combustion of VOCs and light-fuels.
The chemical definition of combustion is given in the Oxford English Dictionary as
‘the development of light and heat from the chemical combination of a substance with
oxygen’. The substance in question can be a variety of materials, both inorganic and
organic, as oxygen, being a powerful oxidising agent, will react with most materials.
Lighting, fireworks and even some lasers are built around knowing the emission spectra of
various metals upon reaction with oxygen, for example, yet for the purpose of fuel it is the
emission of energy in the form of heat that is of importance and this is almost always
obtained – certainly in the internal combustion engine – from organic materials. As the
backbone for all organic materials is carbon, it naturally follows that the complete
combination of any organic compound will yield carbon dioxide – leading to emissions
problems as outlined at the beginning of this chapter. If there are no other heteroatoms
present in the molecule, the other product of the reaction will come from the combination
of hydrogen with oxygen to form water vapour. Complete combustion of hydrocarbon
fuels is therefore given by the overall reaction in Equation 1.1:
OHm
nCOOm
nHC mn 22224
Equation 1.1
In reality, the process of combustion is a combination of the sub-reactions in the
previous section. Cool-flame studies on 2-methyl pentane by Affleck back in 1967
identified several intermediates during the process suggested a multi-step process for
combustion as a whole (Lignola 1987), beginning with initiation via reaction 1.1. Using the
simplest organic molecule, methane, as an example, this initial step can be shown in figure
1.8.
1.1
Figure 1.8 – The hydrogen abstraction of methane by oxygen as the opening stage of
combustion.
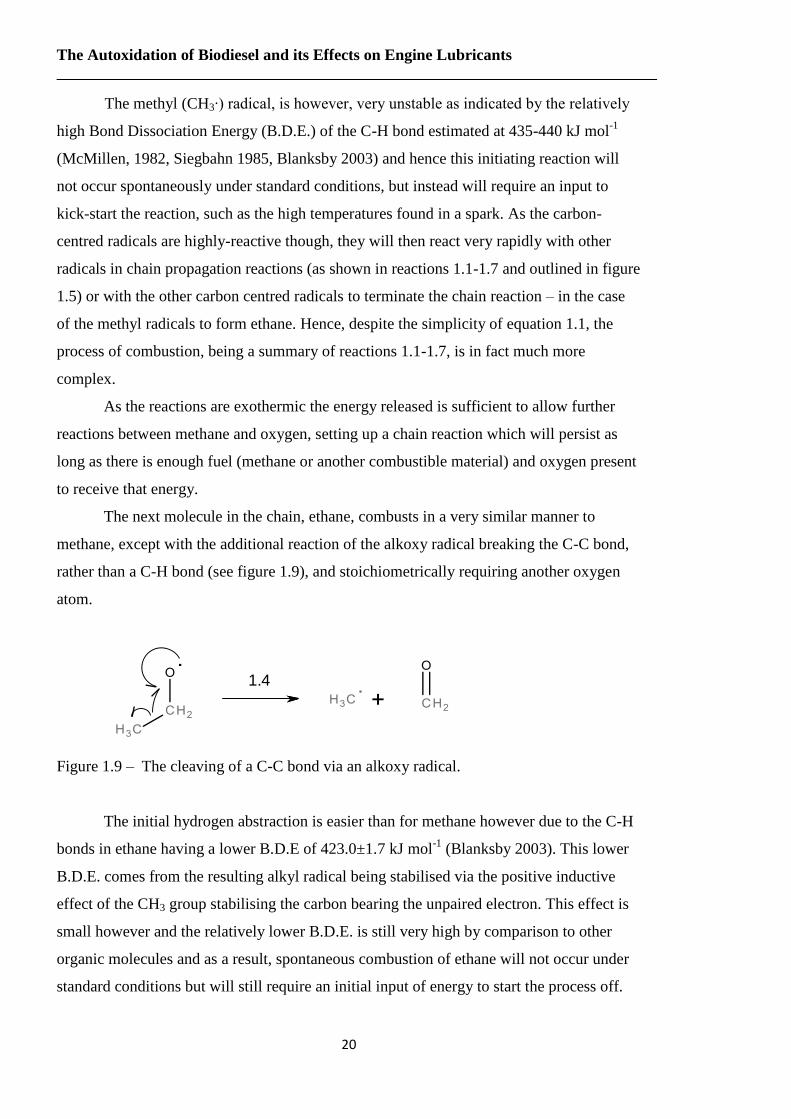
The Autoxidation of Biodiesel and its Effects on Engine Lubricants
20
The methyl (CH3∙) radical, is however, very unstable as indicated by the relatively
high Bond Dissociation Energy (B.D.E.) of the C-H bond estimated at 435-440 kJ mol-1
(McMillen, 1982, Siegbahn 1985, Blanksby 2003) and hence this initiating reaction will
not occur spontaneously under standard conditions, but instead will require an input to
kick-start the reaction, such as the high temperatures found in a spark. As the carbon-
centred radicals are highly-reactive though, they will then react very rapidly with other
radicals in chain propagation reactions (as shown in reactions 1.1-1.7 and outlined in figure
1.5) or with the other carbon centred radicals to terminate the chain reaction – in the case
of the methyl radicals to form ethane. Hence, despite the simplicity of equation 1.1, the
process of combustion, being a summary of reactions 1.1-1.7, is in fact much more
complex.
As the reactions are exothermic the energy released is sufficient to allow further
reactions between methane and oxygen, setting up a chain reaction which will persist as
long as there is enough fuel (methane or another combustible material) and oxygen present
to receive that energy.
The next molecule in the chain, ethane, combusts in a very similar manner to
methane, except with the additional reaction of the alkoxy radical breaking the C-C bond,
rather than a C-H bond (see figure 1.9), and stoichiometrically requiring another oxygen
atom.
1.4
Figure 1.9 – The cleaving of a C-C bond via an alkoxy radical.
The initial hydrogen abstraction is easier than for methane however due to the C-H
bonds in ethane having a lower B.D.E of 423.0±1.7 kJ mol-1
(Blanksby 2003). This lower
B.D.E. comes from the resulting alkyl radical being stabilised via the positive inductive
effect of the CH3 group stabilising the carbon bearing the unpaired electron. This effect is
small however and the relatively lower B.D.E. is still very high by comparison to other
organic molecules and as a result, spontaneous combustion of ethane will not occur under
standard conditions but will still require an initial input of energy to start the process off.
Chapter 1 Introduction
21
As the carbon chain gets progressively longer, the inductive effect gets
progressively more significant in stabilising the alkyl radical with the result that the initial
energy required to start the oxidation (combustion) process gets gradually smaller.
However, as the carbon chain increases in length, it gets heavier and hence its boiling point
decreases; meaning it is less likely to enter the vapour phase to mix with oxygen. In
addition more oxygen molecules are required to consume the entire molecule. The net
result being for straight chain, saturated hydrocarbons the initial oxidation step becomes
easier as the chain length increases, but this comes at the expense of combustibility.
Ultimately, there comes a point where the hydrocarbon in question becomes too heavy to
enter the gas phase easily at which point it can no longer be considered a viable option as a
fuel.
1.5.3 Heavier Hydrocarbons and Lubricants
Obviously combustibility in many cases is not a desirable property; neither is the
ability to react spontaneously with oxygen or the atmosphere in general. In fact, a wide
range of materials are selected for their physical properties and complete chemical
inertness is a valued property – lubricants are a typical example of these. Virtually all
machinery utilizing moving parts – from engines to computer hard disks (Hsu 2004,
Stachiowak 2005) – that come into contact with each other employ a lubricant of some
description in order to maintain smooth working order by reducing friction between the
surfaces and hence subsequent wear. Saturated hydrocarbons are therefore good candidates
as they typically have no functionality and are only known for their ability to react with
oxygen. As stated in the previous section, in light, volatile hydrocarbons, this property
manifests itself in the form of combustion – a process that requires an initial energy input
to get started. Heavier hydrocarbons are therefore not subject to this problem at room
temperature. However as the fuel combusts energy is released to drive the motor; no
process is completely energy efficient and the wasted energy from combustion is released
as heat, meaning the temperature inside the engine is vastly increased and can achieve an
average of over 250 oC inside the combustion chamber on the cylinder walls (Hayes 1993).
The areas where the lubricant is required to operate generally do not reach such high
temperatures, but the lubricant can still be expected to operate at temperatures ranging
from -10 oC (depending on local temperature) upon start-up to 180
oC (Moritani 2003,
Taylor 2004) during full operation. Straight chain alkanes cannot meet this criteria –
alkanes that are liquid at room temperature and at -10 oC will boil by 180
oC (Owczarek
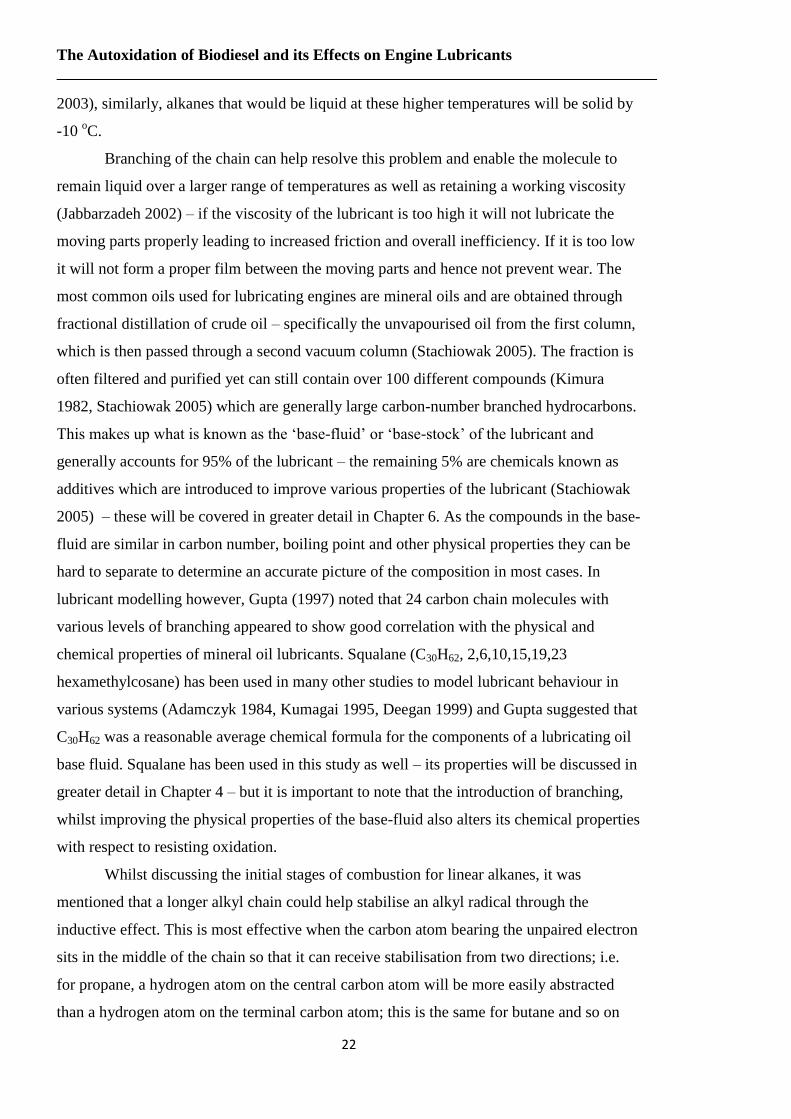
The Autoxidation of Biodiesel and its Effects on Engine Lubricants
22
2003), similarly, alkanes that would be liquid at these higher temperatures will be solid by
-10 oC.
Branching of the chain can help resolve this problem and enable the molecule to
remain liquid over a larger range of temperatures as well as retaining a working viscosity
(Jabbarzadeh 2002) – if the viscosity of the lubricant is too high it will not lubricate the
moving parts properly leading to increased friction and overall inefficiency. If it is too low
it will not form a proper film between the moving parts and hence not prevent wear. The
most common oils used for lubricating engines are mineral oils and are obtained through
fractional distillation of crude oil – specifically the unvapourised oil from the first column,
which is then passed through a second vacuum column (Stachiowak 2005). The fraction is
often filtered and purified yet can still contain over 100 different compounds (Kimura
1982, Stachiowak 2005) which are generally large carbon-number branched hydrocarbons.
This makes up what is known as the ‘base-fluid’ or ‘base-stock’ of the lubricant and
generally accounts for 95% of the lubricant – the remaining 5% are chemicals known as
additives which are introduced to improve various properties of the lubricant (Stachiowak
2005) – these will be covered in greater detail in Chapter 6. As the compounds in the base-
fluid are similar in carbon number, boiling point and other physical properties they can be
hard to separate to determine an accurate picture of the composition in most cases. In
lubricant modelling however, Gupta (1997) noted that 24 carbon chain molecules with
various levels of branching appeared to show good correlation with the physical and
chemical properties of mineral oil lubricants. Squalane (C30H62, 2,6,10,15,19,23
hexamethylcosane) has been used in many other studies to model lubricant behaviour in
various systems (Adamczyk 1984, Kumagai 1995, Deegan 1999) and Gupta suggested that
C30H62 was a reasonable average chemical formula for the components of a lubricating oil
base fluid. Squalane has been used in this study as well – its properties will be discussed in
greater detail in Chapter 4 – but it is important to note that the introduction of branching,
whilst improving the physical properties of the base-fluid also alters its chemical properties
with respect to resisting oxidation.
Whilst discussing the initial stages of combustion for linear alkanes, it was
mentioned that a longer alkyl chain could help stabilise an alkyl radical through the
inductive effect. This is most effective when the carbon atom bearing the unpaired electron
sits in the middle of the chain so that it can receive stabilisation from two directions; i.e.
for propane, a hydrogen atom on the central carbon atom will be more easily abstracted
than a hydrogen atom on the terminal carbon atom; this is the same for butane and so on
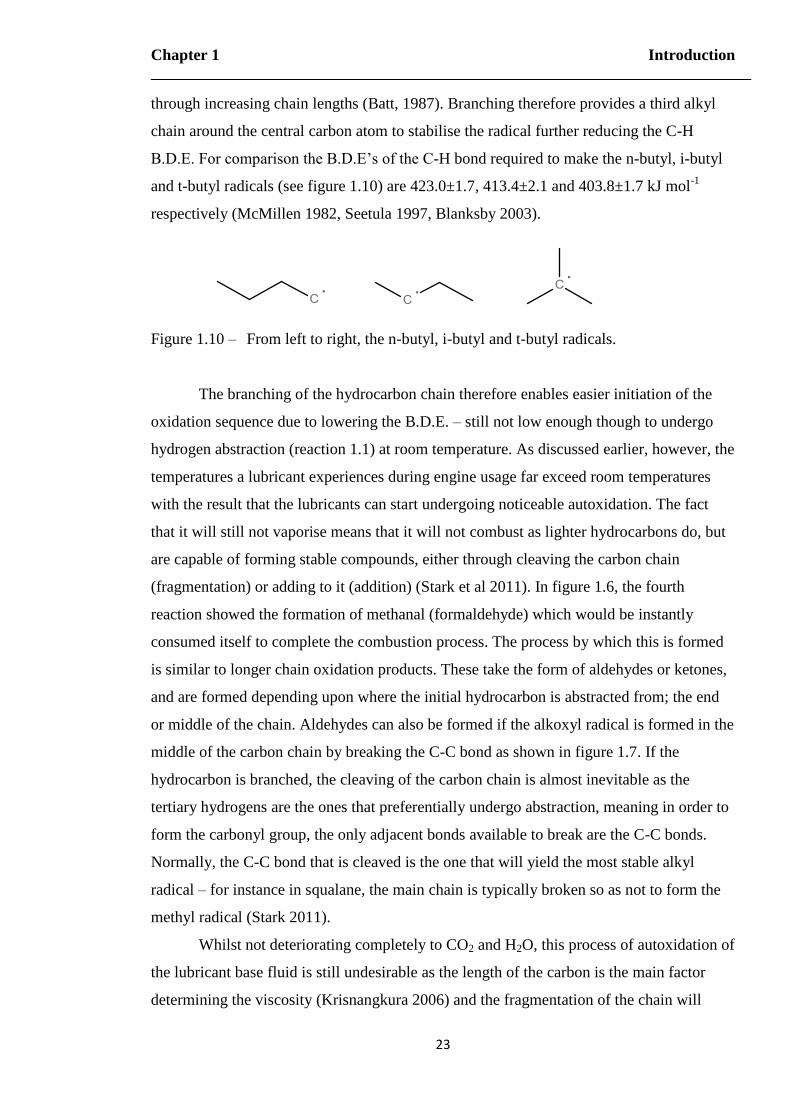
Chapter 1 Introduction
23
through increasing chain lengths (Batt, 1987). Branching therefore provides a third alkyl
chain around the central carbon atom to stabilise the radical further reducing the C-H
B.D.E. For comparison the B.D.E’s of the C-H bond required to make the n-butyl, i-butyl
and t-butyl radicals (see figure 1.10) are 423.0±1.7, 413.4±2.1 and 403.8±1.7 kJ mol-1
respectively (McMillen 1982, Seetula 1997, Blanksby 2003).
Figure 1.10 – From left to right, the n-butyl, i-butyl and t-butyl radicals.
The branching of the hydrocarbon chain therefore enables easier initiation of the
oxidation sequence due to lowering the B.D.E. – still not low enough though to undergo
hydrogen abstraction (reaction 1.1) at room temperature. As discussed earlier, however, the
temperatures a lubricant experiences during engine usage far exceed room temperatures
with the result that the lubricants can start undergoing noticeable autoxidation. The fact
that it will still not vaporise means that it will not combust as lighter hydrocarbons do, but
are capable of forming stable compounds, either through cleaving the carbon chain
(fragmentation) or adding to it (addition) (Stark et al 2011). In figure 1.6, the fourth
reaction showed the formation of methanal (formaldehyde) which would be instantly
consumed itself to complete the combustion process. The process by which this is formed
is similar to longer chain oxidation products. These take the form of aldehydes or ketones,
and are formed depending upon where the initial hydrocarbon is abstracted from; the end
or middle of the chain. Aldehydes can also be formed if the alkoxyl radical is formed in the
middle of the carbon chain by breaking the C-C bond as shown in figure 1.7. If the
hydrocarbon is branched, the cleaving of the carbon chain is almost inevitable as the
tertiary hydrogens are the ones that preferentially undergo abstraction, meaning in order to
form the carbonyl group, the only adjacent bonds available to break are the C-C bonds.
Normally, the C-C bond that is cleaved is the one that will yield the most stable alkyl
radical – for instance in squalane, the main chain is typically broken so as not to form the
methyl radical (Stark 2011).
Whilst not deteriorating completely to CO2 and H2O, this process of autoxidation of
the lubricant base fluid is still undesirable as the length of the carbon is the main factor
determining the viscosity (Krisnangkura 2006) and the fragmentation of the chain will
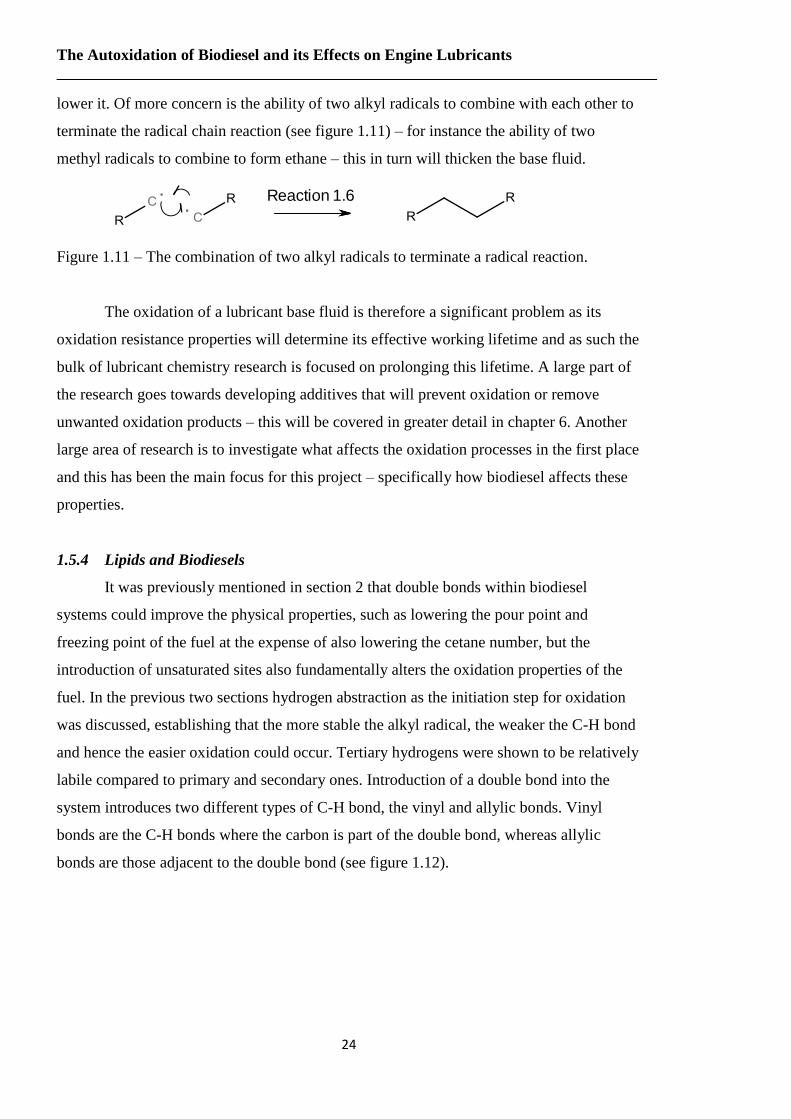
The Autoxidation of Biodiesel and its Effects on Engine Lubricants
24
lower it. Of more concern is the ability of two alkyl radicals to combine with each other to
terminate the radical chain reaction (see figure 1.11) – for instance the ability of two
methyl radicals to combine to form ethane – this in turn will thicken the base fluid.
Reaction 1.6
Figure 1.11 – The combination of two alkyl radicals to terminate a radical reaction.
The oxidation of a lubricant base fluid is therefore a significant problem as its
oxidation resistance properties will determine its effective working lifetime and as such the
bulk of lubricant chemistry research is focused on prolonging this lifetime. A large part of
the research goes towards developing additives that will prevent oxidation or remove
unwanted oxidation products – this will be covered in greater detail in chapter 6. Another
large area of research is to investigate what affects the oxidation processes in the first place
and this has been the main focus for this project – specifically how biodiesel affects these
properties.
1.5.4 Lipids and Biodiesels
It was previously mentioned in section 2 that double bonds within biodiesel
systems could improve the physical properties, such as lowering the pour point and
freezing point of the fuel at the expense of also lowering the cetane number, but the
introduction of unsaturated sites also fundamentally alters the oxidation properties of the
fuel. In the previous two sections hydrogen abstraction as the initiation step for oxidation
was discussed, establishing that the more stable the alkyl radical, the weaker the C-H bond
and hence the easier oxidation could occur. Tertiary hydrogens were shown to be relatively
labile compared to primary and secondary ones. Introduction of a double bond into the
system introduces two different types of C-H bond, the vinyl and allylic bonds. Vinyl
bonds are the C-H bonds where the carbon is part of the double bond, whereas allylic
bonds are those adjacent to the double bond (see figure 1.12).
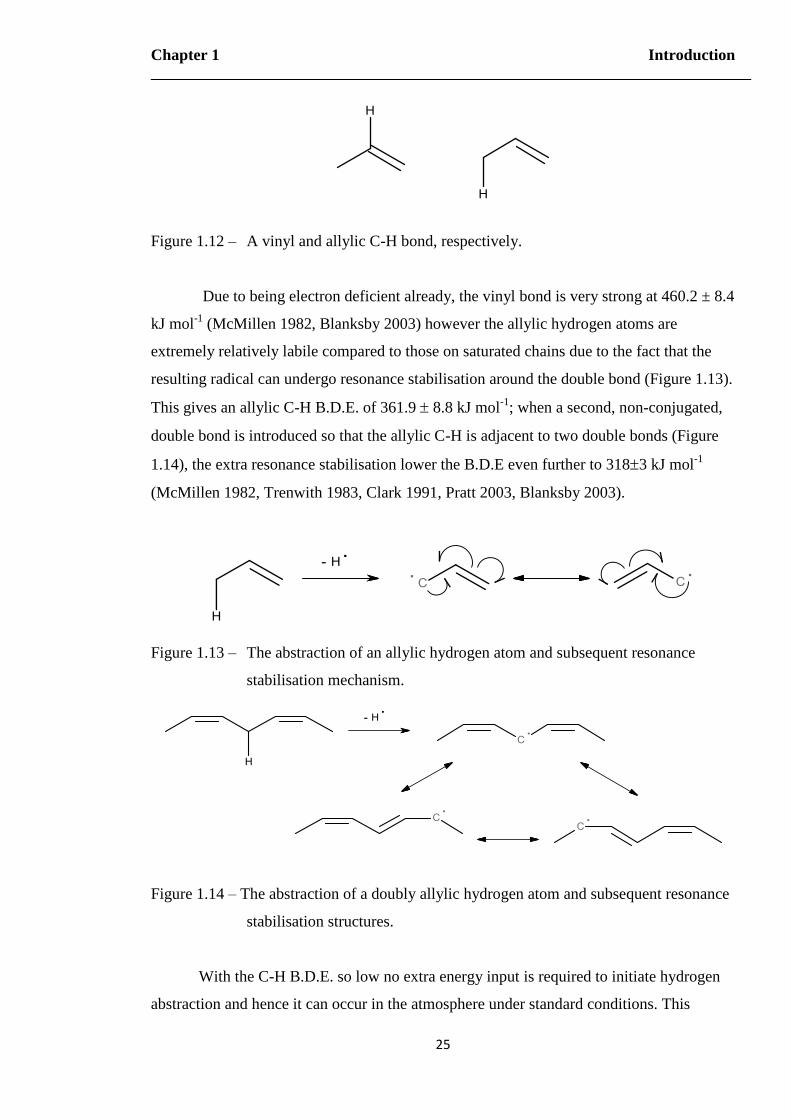
Chapter 1 Introduction
25
Figure 1.12 – A vinyl and allylic C-H bond, respectively.
Due to being electron deficient already, the vinyl bond is very strong at 460.2 ± 8.4
kJ mol-1
(McMillen 1982, Blanksby 2003) however the allylic hydrogen atoms are
extremely relatively labile compared to those on saturated chains due to the fact that the
resulting radical can undergo resonance stabilisation around the double bond (Figure 1.13).
This gives an allylic C-H B.D.E. of 361.9 8.8 kJ mol-1
; when a second, non-conjugated,
double bond is introduced so that the allylic C-H is adjacent to two double bonds (Figure
1.14), the extra resonance stabilisation lower the B.D.E even further to 3183 kJ mol-1
(McMillen 1982, Trenwith 1983, Clark 1991, Pratt 2003, Blanksby 2003).
-
Figure 1.13 – The abstraction of an allylic hydrogen atom and subsequent resonance
stabilisation mechanism.
-
Figure 1.14 – The abstraction of a doubly allylic hydrogen atom and subsequent resonance
stabilisation structures.
With the C-H B.D.E. so low no extra energy input is required to initiate hydrogen
abstraction and hence it can occur in the atmosphere under standard conditions. This
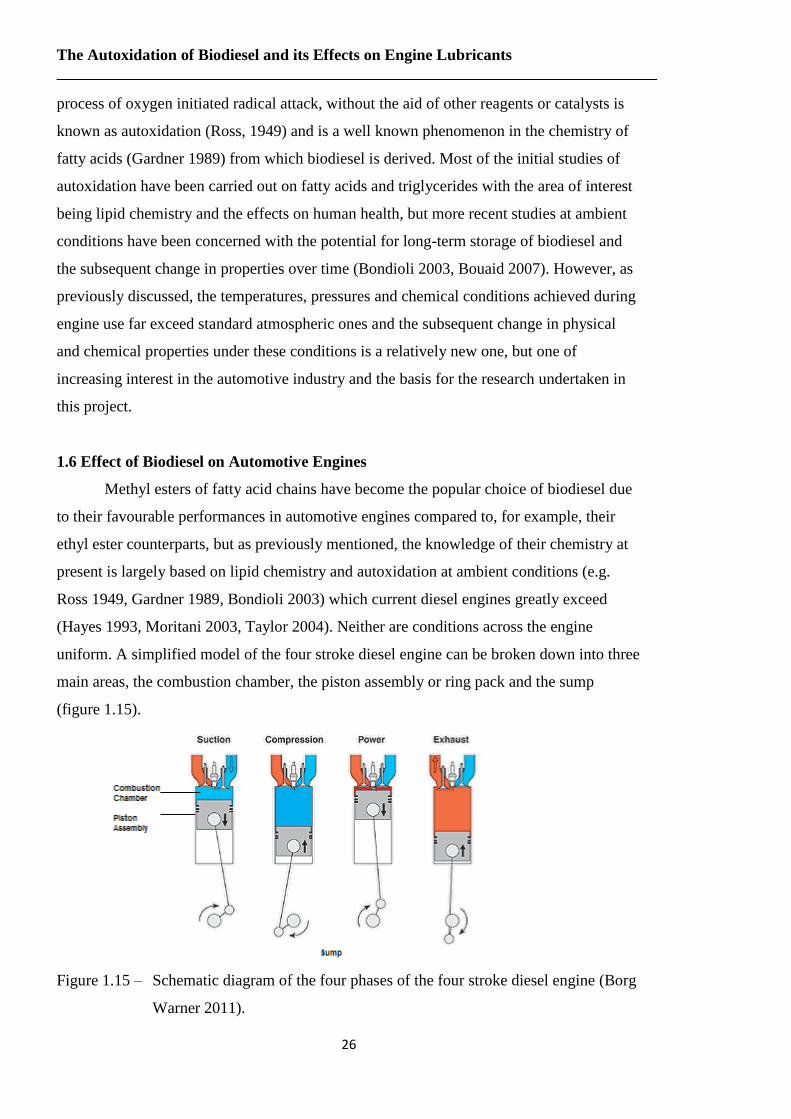
The Autoxidation of Biodiesel and its Effects on Engine Lubricants
26
process of oxygen initiated radical attack, without the aid of other reagents or catalysts is
known as autoxidation (Ross, 1949) and is a well known phenomenon in the chemistry of
fatty acids (Gardner 1989) from which biodiesel is derived. Most of the initial studies of
autoxidation have been carried out on fatty acids and triglycerides with the area of interest
being lipid chemistry and the effects on human health, but more recent studies at ambient
conditions have been concerned with the potential for long-term storage of biodiesel and
the subsequent change in properties over time (Bondioli 2003, Bouaid 2007). However, as
previously discussed, the temperatures, pressures and chemical conditions achieved during
engine use far exceed standard atmospheric ones and the subsequent change in physical
and chemical properties under these conditions is a relatively new one, but one of
increasing interest in the automotive industry and the basis for the research undertaken in
this project.
1.6 Effect of Biodiesel on Automotive Engines
Methyl esters of fatty acid chains have become the popular choice of biodiesel due
to their favourable performances in automotive engines compared to, for example, their
ethyl ester counterparts, but as previously mentioned, the knowledge of their chemistry at
present is largely based on lipid chemistry and autoxidation at ambient conditions (e.g.
Ross 1949, Gardner 1989, Bondioli 2003) which current diesel engines greatly exceed
(Hayes 1993, Moritani 2003, Taylor 2004). Neither are conditions across the engine
uniform. A simplified model of the four stroke diesel engine can be broken down into three
main areas, the combustion chamber, the piston assembly or ring pack and the sump
(figure 1.15).
Figure 1.15 – Schematic diagram of the four phases of the four stroke diesel engine (Borg
Warner 2011).
Chapter 1 Introduction
27
As its name implies, there are four main stages to the engine cycle. Firstly, the air is
drawn in as the intake valve opens and the piston is drawn down (intake). Secondly, the
valve closes so the fuel air mixture is compressed as the piston pushes back up through the
cylinder (compression). Thirdly, the fuel/air mixture ignites under the extreme heat and
pressure it is subjected to under the compression stage, the resulting pressure increase from
gas production driving the piston back down the cylinder (power). Finally, the exhaust
valve opens allowing the reagent gases to leave the chamber, the drop in pressure helping
to draw the piston back up the cylinder (exhaust) (Ferguson 1986).
1.6.1 Combustion Chamber
From a chemistry perspective, the reason the engine can be simplified into three
areas is that these are the areas the main different types of chemistry occur in. In the
combustion chamber, the main chemistry that occurs is the combustion of hydrocarbons
according to the general Equation 1.1 (section 1.5.2). This is a simplified equation for the
combination of reactions that occur during the combustion a saturated hydrocarbon and
hence the real chemistry becomes more complex due to the presence of other atmospheric
molecules – most notably NOx causing unwanted side reactions (Bowman 1975, Lazaroiu
2007); FAME also adds the extra complication of double bonds and oxygen into the fuel
molecule. Whilst clean combustion is the main and intended chemistry in the combustion
chamber, it is the side reactions that are of significance to the performance of the engine.
Although they are very minor – the combustion process is very efficient both with mineral
and biodiesel (Tormos 2010) the unwanted chemical products tend to manifest in the form
of thick, soot-like particles (Hiroyasu 1976) that can clog up the fuel injectors.
1.6.2 Piston Assembly
The issue of the unburned fuel is then of importance as it migrates down the wall of
the cylinder past the piston assembly. This area is lubricated to ensure smooth operation of
the piston, due to the fact that friction in this area is the main contributor to overall
mechanical power loss (Wakuri 1992, Priest 1999, Tan 2010). Due to the continuous
reciprocal motion of the piston, the lubricant is exposed to heavy wearing from the friction
surfaces as well as contamination from exhaust gases and other combustion products – any
unburnt fuel that migrates down the wall is also subject to these conditions – which, when
combined with the heat generated through friction contributes significantly to the
degradation of the lubricant (Gamble 2003). Investigating the nature of lubricant
The Autoxidation of Biodiesel and its Effects on Engine Lubricants
28
degradation has proved problematic due to the fact that the temperatures and pressures the
piston rings (which form the seal between the piston and cylinder wall) vary as the piston
itself moves up and down the cylinder, meaning the lubricant itself is subjected to a wide
range of conditions (Hamrock 1994, Tan 2010). The resulting products here are
carbonaceous deposits on the piston rings (Kim 1998) which then increase the amount of
friction between the piston and the cylinder walls reducing the efficiency of the piston, and
hence the engine over time. Whilst the chemistry behind these deposits is unclear, the use
of both vegetable oil and biodiesel has been seen to increase their formation (Shahid 2008),
which poses a significant problem as the piston assembly is currently considered in the
studies mentioned to be one of the major areas of lubricant degradation.
1.6.3 Sump
The final area of chemistry occurs in the sump underneath the piston. This is where
lubricant and unburned fuel accumulate as they migrate down the cylinder walls. Being
further away from the combustion chamber and moving parts it is also the lowest
temperature part of the engine. The sump is also the reservoir from which accumulated oil
is pumped out to re-lubricate the piston assembly and other moving parts of the engine.
Any chemical changes that occur to the lubricant here, whether from addition of other
chemicals (a process known as fuel dilution), or reactions of the existing ones, and the
change in physical properties that result will therefore fundamentally affect the
performance of the entire engine – there is still some debate about whether the gums and
sediments found in the combustion chamber and piston assembly are really formed there,
or whether they are transported and deposited there from the sump. Bush (1991) compared
oil samples from the top ring zone and the sump against fresh oil and noted that the piston
assembly oil showed greater levels of degradation compared to the sump, but that the sump
also showed degradation characteristics such as a reduction in concentration of the base
fluid. From this, it was proposed that the sump and the piston assembly should be
considered as two separate reaction areas. The main unwanted products seen in the sump
are sludge-like materials that can gum up the lubricant and make it less efficient. The use
of biodiesel in some engines has seen an increase in the formation of these sludges,
especially with the use of unsaturated ones. A study on palm oil (Sapaun 1996), which is
composed mainly of saturated or singly unsaturated fatty acid chains (Sumathi 2008),
revealed on short term test to show very comparable levels of combustion chamber wear,
carbon deposits and lubricant oil contamination compared to mineral diesel. By
Chapter 1 Introduction
29
comparison, studies on soybean and tallow biodiesel containing larger amounts of
unsaturated material (Ali 1995) showed both to increase the carbon residue by up to 10
times the amount left by a standard No.2 Diesel fuel; although this was reduced to
comparable levels by blending the fuels in ratios as high as 60:40 Diesel:FAME levels.
In addition, due the introduction of diesel particulate filters (DPFs – detailed in the
next section) and post-injection cycles to burn off excess soot has seen increased levels of
fuel migrating down the walls of the cylinder to end up in the lubricant sump (Rakopoulos
2006). As biodiesel is less volatile than mineral diesel (Goodrum 2002, Reboucas 2001) it
has a greater tendency to accumulate in the sump leading to high levels (typically around 5
– 10% higher than mineral diesel; Thornton 2009) of fuel dilution of the lubricant which is
subsequently pumped throughout the engine (Rakopoulos 2006). In addition to reduced
volatility, vegetable oil derived methyl ester biodiesel is more prone to oxidation than
mineral diesel hence as it accumulates it is believed that it continues to oxidise to form
sludges and varnishes which, when pumped through the engine can cause the increased
ring-sticking noted by Labeckas (2006). As a result of this, increased oxidation and
viscosity of the engine lubricant were also observed in this study, though at this stage there
is no clear consensus amongst the literature as to whether biodiesel is causing increased
oxidation of the lubricant, or simply contaminating it with its own breakdown products.
1.6.4 Legislative Demands and Restrictions
The engines that biodiesel seems to exacerbate sludge formation most prominently
are the ones that utilise a technique known as Direct Injection (DI). Legislative demands
are one of the reasons why a straight switch back to vegetable oils is not possible due to the
call for reduction of emissions of various exhaust products, but the one crucial to direct
injection engines is the legislation relating to Particulate Matter (PM) emissions.
Particulate Matter is the name given to any solid particle product such as soot, ash or sand
which when airborne can coat buildings, help form smog and, when inhaled, cause
respiratory problems (El-Fadel 2000). It is therefore of interest to keep their emission into
the atmosphere as low as possible – this is currently achieved in engines by having a filter,
known as a Diesel Particulate Filter (DPF) in the exhaust which will trap any particulate
emissions as they pass through. In order to prevent the filter being clogged up, DI engine
inject an excess of fuel through the engine to burn the particulate aggregate off the filter –
as a result excess fuel leads to excess unburned fuel which ends up in the sump leading to
greater fuel dilution of the lubricant (Rakopoulos 2006). As PM emissions are required to
The Autoxidation of Biodiesel and its Effects on Engine Lubricants
30
be as low as possible, DPFs and the DI engines that necessitate them are becoming more
commonplace – in Europe, the Euro 5 and Euro 6 legislation, particularly EC Regulation
No. 595/2009 has called for them to be a mandatory feature of diesel engines.
As a result this has impeded the progress of biodiesel into the market as DI engines
are unable to cope with the large amounts of fuel dilution as a result. Current European
legislation states that biodiesel can form a maximum of 7% of the fuel blend in a diesel
engine; the blend being known as B07 for common, commercial distribution. If the blend is
any higher than 7%, then it must be labelled as such (i.e. a blend of 10% biodiesel would
be B10, 25% B25 etc) at the pump so that people who still choose to buy it do so at their
own discretion. The upper limit is currently set at 7% as when deposits and sludge start to
form in the engine it reduces its efficiency meaning more fuel is consumed per unit
distance and hence emissions increase, including CO2 which is counter-productive to using
biodiesel as a means of CO2 reduction. From the consumer perspective the reduction in
efficiency is also undesirable as it also reduces the lifetime of the engine making it less
value for money. A product that is less appealing is therefore also unattractive for engine
manufacturers.
1.6.5 Emissions
Biodiesel still shows great promise for supplying the automotive industry because
despite these issues, biodiesel still provides a large potential for carbon emission
reductions as theoretically, all the carbon that is released as CO2 will be taken up the
following year in the next crop; assuming 100% crop yield. The full life-cycle assessment
must also take into account carbon emissions from the farm processes – tractors, ploughs,
etc and so biodiesel is not completely carbon-neutral, but can still reduce CO2 emissions by
3.2kg compared to mineral diesel for every 1kg of fuel. Also as FAME contains no
sulphur, biodiesel combustion emits no SO2 (Körbitz 1999). and can also provide a 39%
reduction in particulate matter (PM), 50% soot reduction and 20% CO as well as
reductions in hydrocarbon and polyaromatic emissions; the latter two being strongly
influenced by the biodiesel source material (Lapuerta 2008, Xue 2011). Due to the higher
oxygen content of FAME, biodiesel has been noted to increase NOx emissions which is
less desirable, however Lapuerta noted that the injection process was slightly advanced
with biodiesel and several studies (Walker 1994, Marshall 1995, Graboski 1998) proposed
that to delay the injection process could reduce NOx emissions at the expense of increasing
PM and soot; though these levels would still be lower than for mineral diesel. Leung
Chapter 1 Introduction
31
(2006) proposed that other injection parameters could be changed to reduce NOx levels
without the tradeoff of increasing PM and soot emissions and whilst at the time of writing
there is no finalised or patented method, there does appear to be good scope to combat NOx
increases, thus eliminating the only negative emissions characteristic of biodiesel when
compared to mineral diesel.
1.7 Project Aims
Whilst biodiesel shows significant promise as a potential renewable automotive
fuel, it can still never be fully integrated as a stand-alone fuel as long as some of the
associated problems remain unresolved and must continue to be used in conjunction with
mineral diesel. In particular, with respect to being used independently of mineral diesel, the
problem of increased engine fouling must be overcome.
In order to combat the formation of deposits and sludges, the chemical mechanisms
behind their formation need to be understood and hence this forms the base upon which
this project shall be focused. Whilst there has been significant work in the automotive
industry in researching the practical problems associated with biodiesel usage, much of the
work in understanding the chemical mechanisms of the breakdown of fatty acid methyl
esters has been the study of biodiesels in their commercial form as a mixture of several
different FAME compounds. Others have been generic studies of how biodiesel behaves or
how they are related to the general autoxidation mechanisms, especially with respect to
fatty acid and lipid autoxidation at room temperature, as previously discussed in sections
1.2 – 1.4. This project aims to further this understanding by breaking down biodiesel into
its individual FAME components so as to analyse their chemistry individually. They will
be broken down into two categories: mono-unsaturated and poly-unsaturated which are
represented by methyl oleate and methyl linoleate respectively. As the poly-unsaturated
FAME are so far understood to be the most chemically important, methyl linoleate will be
the main focus for this project. However, it was reported that (at the time of writing) it was
unknown whether these engine problems were caused by biodiesel actively altering the
chemistry of the other components of the engine lubricant, or simply causing adverse
effects by contaminating either them directly or via their breakdown products. As a result,
it was concluded that to determine this, it was necessary to investigate the chemistry both
of biodiesel and of biodiesel/lubricant systems.
By using the knowledge gained through this study, it will then be applied to seeing
how these mechanisms impacts on other engine components; crucially the lubricant base

The Autoxidation of Biodiesel and its Effects on Engine Lubricants
32
fluid, but also general antioxidants employed to inhibit oxidative degradation in mineral
diesel/lubricant systems.
1.8 References
Adamczyk, A.A. Kach, R.A. A Combustion Bomb Study of Fuel-Oil Solubility and HC
Emissions From Oil Layers, Twentieth Symposium (International) on
Combustion/The Combustion Institute, 1984, 37-43.
Affleck, W.S. Fish, A. Two-stage Ignition under Engine Conditions Parallels that at Low
Pressures, Eleventh Symposium (International) on Combustion/The Combustion
Institute, 1967, 1003-1013.
Agarwal, A.K. Das, L.M. Biodiesel Development and Characterization for Use as a Fuel in
Compression Ignition Engines. J. of Eng. For Gas Turbines and Power, 2001, 123,
440-447.
Alexiadas, A. Global Warming and Human Activity: A Model for Studying the Potential
Instability of the Carbon Dioxide/Temperature Feedback Mechanism, Ecological
Modelling, 2007, 203(3-4), 243-256.
Ali, Y. Hanna, M.A. Cuppett, S.L. Fuel Properties of Tallow and Soybean Oil Esters. J.
Am. Oil Chem. Soc. 1995, 72(12), 1557-1564.
Aske, N. Kallevik, H. Sjöblom, J. Determination of Saturate, Aromatic, Resin and
Asphaltenic (SARA) Components in Crude Oils by Means of Infrared and Near-
Infrared Spectroscopy, Energy and Fuels, 2001, 15, 1304-1312.
Attiwill, P.M. Atmospheric Carbon Dioxide and the Biosphere, Environmental Pollution,
1971, (1), 249-261.
Balat, M. Balat, H. Progress in Biodiesel Processing, Applied Energy, 2010, 87(6), 1815-
1835.
Barsky, R. Kilian, L. Oil and the Macroeconomy since the 1970’s, National Bureau of
Economic Research, Working Paper 10855, October 2004.
Batt L, Reactions of Alkoxy and Alkyl Peroxy Radicals, International Reviews in Physical
Chemistry, 1987, 6(1), 53-90.
Benson, S.W. Combustion, A Chemical and Kinetic View, Twenty-First Symposium
(International) on Combustion/The Combustion Institute, 1986, 703-711.
Berchmans, H.J. Hirata, S. Biodiesel Production from Crude Jatropha Curcas L. Seed Oil
with a High Content of Free Fatty Acids, Bioresource Technology, 2008, 99(6),
1716-1721.
Chapter 1 Introduction
33
Blanksby, S.J. Ellison, G.B. Bond Dissociation Energies of Organic Molecules, Acc.
Chem. Res. 2003, 36, 255-263.
Bockey, D. Situation and Development Potential for the Production of Biodiesel – An
International Report, 2002.
Bondioli, P. Gasparoli, A. Della Bella, L. Tagliabue, S. Toso, G. Biodiesel Stability under
Comercial Storage Conditions over One Year, Eur. J. Lipid Sci. Technol. 2003, 105,
735-741.
Borg-Warner Turbo and Emission Systems - http://www.3k-
warner.de/products/turbochargerPrinciples.aspx - accessed 12/08/11
Bouaid, A. Martinez, M. Aracil, J. Long Storage Stability of Biodiesel from Vegetable and
Used Frying Oils, Fuel, 2007, 86, 2596-2602.
Boult, P.J. Fisher, Q.J. Clinch, S.R. Lovibond, J R. Cockshell, C.C. Geomechanical,
microstructural, and petrophysical evolution in experimentally reactivated
cataclasites: Discussion, AAPG Bulletin. 2003, 87, 1681-1683.
Bowman, C.T. Kinetics of Pollutant Formation and Destruction in Combustion, Prog.
Energy Combust. Sci. 1975, 1, 33-45.
Bush, G.P. Fox, M.F. Picken, D.J. Butcher, L.F. Composition of Lubricating Oil in the
Upper Ring Zone of an Internal Combustion Engine, Tribology International, 1991,
24(4), 231-233.
Bryant, L. The Development of the Diesel Engine, Technology and Culture, 1976, 17(3),
432-446.
Cadle, R.D. Formation and Chemical Reactions of Atmospheric Particles, Journal of
Colloid and Interface Science, 1972, 39(1), 25-31.
Campbell, C.J. The End of Cheap Oil, Scientific American, March 1998.
Cao, M. Woodward, F. I. Dynamic Responses of Terrestrial Ecosystem Carbon Cycling to
Global Climate Change, Nature, 1998, 393, 249-252.
Carlton, A.C. James Watt (1736 – 1819), Journal of the Franklin Institute, 1953, 256(4),
375-376.
Chauhan, R.D. Sharma, M.P. Saini, R.P. Singal, S.K. Biodiesel from Jatropha as Transport
Fuel – A Case Study of UP State, India, Journal of Scientific and Industrial
Research, 2006, 66(5), 394-398.
Cox, P.M, Betts, R.A. Jones, C.D. Spall, S.A. Totterdell, I.J. Acceleration of Global
Warming due to Carbon-Cycle Feedbacks in a Coupled Climate Model, Nature,2000,
408, 184-187.
The Autoxidation of Biodiesel and its Effects on Engine Lubricants
34
Clark, K.B. Culshaw, P.N. Griller, D. Lossing, F.P. Martinho Simões, J.A. Walton, J.C.
Studies of the Formation and Stability of Pentadienyl and 3-Substituted Pentadienyl
Radicals, J. Org. Chem. 1991, 56, 5535-5539.
Deegan, R.D. Leheny, R.L. Menon, N. Nagel, S.R. Dynamic Shear Modulus of Tricresyl
Phosphate and Squalane, J. Phys. Chem. B, 1999, 103, 4066-4070.
Demirbas, A. Biodiesel from Vegetable Oils via Transesterification in Supercritical
Methanol, Energy Conversion and Management, 2002, 43, 2349-2356.
Dermibas, A. The Importance of Biodiesel as Transportation Fuel, Energy Policy, 2007,
35, 4661-4670.
Dickinson, H.W. A Short History of the Steam Engine, Cambridge University Press, 1939
(Online 2010).
Du Plessis, L.M. De Villiers, J.B.M. Van Der Walt, W.H. Stability Studies on Methyl and
Ethyl Fatty Acid Esters of Sunflowerseed Oil, J. Am. Oil Chem. Soc. 1985, 62(4),
748-752.
Dvorák, A. Skopal, F. Komers, K. Transesterification of Rapeseed Oil in a Feedback
Reactor, Eur. J. Lipid Sci. Technol. 2001, 103, 742-745.
EN590:2004. Automotive Fuels. Diesel. Requirements and Test Methods. 27/08/2004.
ISBN: 058044119 9
European Commission Paper COM(2006) 105 – A European Strategy for Sustainable,
Competitive and Secure Energy, 8/3/2006.
European Commission Regulation No. 715/2007 – Euro 5
European Commission Regulation No. 28/2009
European Commission Regulation No. 595/2009 – Euro 6
El-Fadel, M. Massoud, M. Particulate Matter in Urban Areas: Health-based Economic
Assessment, Science of the Total Environment, 2000, 257(2-3), 133-146.
Encinar, J.M. González, J.F. Sabio, E. Ramiro, M.J. Preparation and Properties of
Biodiesel from Cynara cardunculus L. Oil, Ind. Eng. Chem. Res. 1999, 38, 2927-
2931
Encinar, J.M. González, J.F.Rodríguez-Reinares. Biodiesel from Used Frying Oil.
Variables Affecting the Yields and Characteristics of the Biodiesel, Ind. Eng. Chem.
Res. 2005, 44, 5491-5499.
Enweremadu, C.C. Mbarawa, M.M. Technical Aspects of Production and Analysis of
Biodiesel from Used Cooking Oil – A Review, Renewable and Sustainable Energy
Reviews, 2009, 13(9), 2205-2224.
Chapter 1 Introduction
35
Ferguson, C.R. Internal Combustion Engines, John Wiley, New York, 1986.
Florides, G.A. Christodoulides, P. Global Warming and Carbon Dioxide Through
Sciences, Environment International, 2009, 35, 390-401.
Gamble, R.J. Priest, M. Taylor, C.M. Detailed Analysis of Oil Transport in the Piston
Assembly of a Gasoline Engine, Tribology Letters, 2003, 14(2), 147-156.
Ganguly, J. Studies on the Mechanism of Fatty Acid Synthesis: VII. Biosynthesis of Fatty
Acids from Malonyl CoA, Biochim. Biophys. Acta, 1960, 40, 110-118.
Gardner, H.W. Oxygen Radical Chemistry of Polyunsaturated Fatty Acids, Free Radical
Biology & Medicine, 1989, 7, 65-86.
German Patent (DRP) No. 37435 – Karl Benz, gasoline fuelled car
Ghadge, S.V. Raheman, H. Biodiesel Production from Mahua (Madhuca Indica) Oil
having Free Fatty Acids, Biomass and Bioenergy, 2005, 28(6), 601-605.
Goering, C.E. Schwab, A.W. Dangherty, M.J. Pryde, E.H. Heakin, A.J. Fuel Properties of
Eleven Vegetable Oils. ASAE 1982, 25(6), 1472-1477.
Goodrum, J.W. Volatility and Boiling Points of Biodiesel from Vegetable Oils and Tallow,
Biomass and Bioenergy, 2002, 22, 205–211.
Graboski, M.S. McCormick, R.L. Combustion of Fat and Vegetable Oil Derived Fuels in
Diesel Engines, Prog. Energy Combust. Sci. 1998, 24, 125-164.
Griffin Shay, E. Diesel Fuel from Vegetable Oils: Status and Oppurtunities, Biomass and
Bioenergy, 1993, 4(4), 247-242.
Gruntman, M. Blazing the Trail: The Early History of Spacecraft and Rocketry, American
Institute of Aeronautics and Astronautics, 2004.
Gupta, S.A. Cochran, H.D. Cummings, P.T. Shear Behaviour of Squalane and Tetracosane
under Extreme Confinement. I. Model, Simulation Method and Interfacial Slip. J.
Chem. Phys, 1997, 107(23), 10316-10326.
Haas, M.J. McAloon, A.J. Yee, W.C. Foglia, T.A. A Process Model to Estimate Biodiesel
Production Costs, Bioresource Technology, 2006, 97(4), 671-678.
Hamrock, B.J. Fundamentals of Fluid Film Lubrication, 1994, McGraw-Hill Publishing.
Harwood, H.J. Oleochemicals as a Fuel: Mechanical and Economic Feasability, J. Am. Oil
Chem. Soc., 1984, 61(2), 315-324.
Hayes, T.K. White, R.A. Peters, J.E. Combustion Chamber Temperature and Instantaneous
Local Heat Flux Measurements in a Spark Ignition Engine, SAE Technical Paper
930217, 1993.
Hele, P. Biosynthesis of Fatty Acids, Brit. Med. Bull. 1958, 14(3), 201-206
The Autoxidation of Biodiesel and its Effects on Engine Lubricants
36
Heywood, J.B. – Internal Combustion Engine Fundamentals, International Edition,
McGraw-Hill Book Company, 1988.
Hill, J. Nelson, E. Tilman, D. Polasky, S. Tiffany, D. Environmental, Economic and
Energetic Costs and Benefits of Biodiesel and Ethanol Biofuels, PNAS, 2006,
103(30), 11206-11210.
Hill, K. Fats and Oils as Oleochemical Raw Materials, Pure Appl. Chem. 2000, 72(7),
1255-1264.
Hills, R.L. Power from Steam: A History of the Stationary Steam Engine, Cambridge
University Press, 1993.
Hiroyasu, H. Kadota, T. Models for Combustion and Formation of Nitric Oxide and Soot
in Direct Injection Diesel Engines, Soc. Automotive Eng. Paper No. 760129, 1976.
Hsu, S.M. Nano-lubrication: Concept and Design, Tribology International, 2004, 37(7),
537-545.
Jabbarzadeh, A. Atkinson, J.D. Tanner, R.I. The effect of Branching on Slip and
Rheological Properties of Lubricants in Molecular Dynamics Simulation of Couette
Shear Flow, Tribology International, 2002, 35(1), 35-46.
Jain, S. Sharma, M.P. Prospects of Biodiesel from Jatropha in India: A Review, Renewable
and Sustainable Energy Reviews, 2010, 14, 763-771.
Johnson, F.S. The Balance of Atmospheric Oxygen and Carbon Dioxide, Biological
Conservation, 1970, 2(2), 83-89.
Jones, E. Combustion of Methane, Nature, 1956, 178, 1112.
Kearns, D.R. Physical and Chemical Properties of Singlet Molecular Oxygen, Chemical
Reviews, 1971, 71(4), 395-427.
Kim, J.S. Min, B.S. Lee, D.S. Oh, D.Y. Choi, J.K. Characteristics of Carbon Deposit
Formation in Piston Top Ring Groove of Gasoline and Diesel Engine, 1998 SAE
International Congress & Exposition; Detroit, MI, USA, 1998, 147-154.
Kimura, Y. Okabe, H. An Introduction to Tribology, Youkandou Press, 1982, 69-82
Knothe, G. Bagby, M.O. Ryan, T.W. Soc. Automotive Eng. Technical Paper No. 971681
1997.
Knothe, G. Bagby, M.O. Ryan, T.W. III. Precombustion of Fatty Acid and Esters of
Biodiesel. A Possibile Explanation for Differing Cetane Numbers. J.Am. Oil Chem.
Soc. 1998, 75(8), 1007-1013.
Knothe, G. Dependence of Biodiesel Fuel Properties on the Structure of Fatty Acid Alkyl
Esters, Fuel Processing Technology, 2005, 86, 1059-1070.
Chapter 1 Introduction
37
Körbitz, W. Biodiesel Production in Europe and North America, an Encouraging Prospect,
Renewable Energy, 1999, 16, 1078-1083.
Krisnangkura, K. Yimsuwan, T. Pairintra, R. An Empircal Approach in Predicting
Biodiesel Viscosity at Various Temperatures, Fuel, 2006, 85, 107-113.
Kumagi, A. Takahashi, S. Viscosity and Density of Liquid Mixtures of n-Alkanes with
Squalane, International Journal of Thermophysics, 1995, 16(3), 773-779.
Kyoto Protocol, http://kyotoprotocol.com.
Labeckas, G. Slavinskas, S. Performance of direct-injection off-road diesel engine on
rapeseed oil, Renewable Energy, 2006, 31, 849-863.
Lansdown, A.R. Lubrication and Lubricant Selection, A Practical Guide, 3rd
Edition,
Tribology in Practice Series, Professional Engineering Publishing, 2004.
Lapuerta, M. Rodríguez-Fernández, J. Agudelo, J.R. Diesel Particulate Emissions from
Used Cooking Oil Biodiesel, Bioresource Technology, 2008, 99, 731-740.
Lapuerta, M. Armos, A. Rodríguez-Fernández, J. Effect of Biodiesel Fuels on Diesel
Engine Emissions, Progress in Energy and Combustion Science, 2008, 34(2), 198-
223.
Lazaroiu, G. Modeling and Simulation Combustion and Generation of NOx, Fuel
Processing Technology, 2007, 88, 771-777.
Leung, D.Y.C. Luo, Y. Chan, T.L. Optimization of Exhaust Emissions of a Diesel Engine
Fuelled with Biodiesel, Energy & Fuels, 2006, 20(3), 1015-1023.
Levy II, H. Photochemistry of the Lower Troposphere, Planetary and Space Science, 1972,
20, 919-935.
Lightfoot, P.D. Cox, R.A. Crowley, J.N. Destriau, M.Hayman, G.D. Jenkin, M.E.
Moortgat, G.K. Zabel, F. Organic Peroxy Radicals: Kinetics, Spectroscopy and
Tropospheric Chemistry, Atmospheric Environment, 1992, 26A(10), 1805-961.
Lignola, P.G. Reverchon, E. Cool Flames, Prog. Energy Combust. Sci. 1987, 13, 75-96.
Ma, F. Hanna, M.A. Biodiesel Production: A Review, Bioresource Technology, 1999, 70,
1-15.
Manabe, S. Wetherald, R.T. The Effects of Doubling CO2 Concentration on the Climate of
a General Circulation Model, J. of the Atmos. Sci. 1975, 32(1), 3-15.
Manabe, S. Stouffer, R.J. Century-scale Effects of Increased Atmospheric CO2 on the
Ocean-atmosphere System, Nature, 1993, 364, 215-218.

The Autoxidation of Biodiesel and its Effects on Engine Lubricants
38
Mantashyan, A.A. Khachatryan, L.A. Niazyan, O.M. Arsentyev, S.D. On the Reactions of
Peroxy Radicals in the Slow Combustion of Methane and Ethylene, Combustion and
Flame, 1981, 43, 221-227.
Marshall, W. Schumacher, L.G. Howell, S. Engine Exhaust Emissions: Evaluation of a
Cummins L10E when Fuelled with a Biodiesel Blend. SAE paper 952363, 1995.
McMillen, D.F. Golden, D.M. Hydrocarbon Bond Dissociation Energies, Ann. Rev. Phys.
Chem, 1982, 33, 493-532.
Monyem, A. Canakci, M. Van Gerpen, J.H. Investigation of Biodiesel Thermal Stability
Under Simulated In-Use Conditions, Applied Engineering in Agriculture, 2000,
16(4), 373-378.
Moritani, H. Nozawa, Y. Oil Degradation in Second-Land Region of Gasoline Engine
Pistons, R&D Rev. Toyota CRDL, 2003, 38, 36-43.
Mulliken, R.S. The Interpretation of Band Spectra Part III. Electron Quantum Numbers
and States of Molecules and Their Atoms, Rev. Mod. Phys. 1932, 4(1), 1-86.
Naik, S.N. Goud, V.V. Rout, P.K. Dalai, A.K. Production of First and Second Generation
Biofuels: A Comprehensive Review, Renewable and Sustainable Energy Reviews,
2010, 14(2), 578-597.
Nebel, B.A. Mittelbach, M. Biodiesel from Extracted Fat out of Meat and Bone Meal, Eur.
J. Lipid Sc. Technol. 2006, 108, 398-403.
Nicolet, M. Aeronomic Chemistry of the Stratosphere, Planetary and Space Science, 1972,
20, 1671-1702.
Nitschke, W.R. Wilson, C.M. Rudolph Diesel, Pioneer of the Age of Power, The
University of Oklahoma Press, Norman, OK 1965.
Owczarek, I. Blazej, K. Recommended Critical Temperatures. Part I. Aliphatic
Hydrocarbons. J. Phys. Chem. Ref. Data 2003, 32(4), 1411-1428.
Oxford English Dictionary, Oxford University Press, 1996.
Pousa, G.P.A.G. Santos, A.L.F. Suarez, P.A.Z. History and Policy of Biodiesel in Brazil,
Energy Policy, 2007, 35(11), 5393-5398.
Pratt, D.A. Mills, J.H. Porter, N.A. Theoretical Calculations of Carbon-Oxygen Bond
Dissociation Enthalpies of Peroxyl Radicals Formed in the Autoxidation of Lipids, J.
Am. Chem. Soc. 2003, 124, 5801-5810.
Priest, M. Dowson, D. Taylor, C.M. Predictive Wear Modelling of Lubricated Piston Rings
in a Diesel Engine, Wear, 1999, 231, 89-101.
Chapter 1 Introduction
39
Radich, A. Biodiesel Performance, Costs and Use, Energy Information Administration,
2004.
Rakopoulos, C.D. Antonopoulos, K.A. Rakopoulos, D.C. Hountalas, D.T. Giakoumis, E.G.
Comparative Performance and Emissions Study of a Direct-injection Diesel Engine
Using Blends of Diesel fuel with Vegetable Oils or Bio-diesels of Various Origins,
Energy Conversion and Management, 2006, 47, 3272-2387.
Ranz, A. Maier, E. Lankwayr, E. Determination of Fatty Acid Derivatives in Fuel and
Diesel Oil, Fuel, 2010, 89(8), 2133-2139.
Ross, J.R. Gebhart, A.I. Gerecht, J.F. The Autoxidation of Methyl Oleate. J. Am. Chem.
Soc. 1949, 71, 282-286.
Ryan, T. W. III. Dodge, L.G., Callahan, T.J. The Effects of Vegetable Oil Properties on
Injection and Combustion in Two Different Diesel Engines, J.Am.Oil Chem.Soc,
1984, 61, 1610–1619.
Sapaun, S.M. Masjuki, H.H. Azlan, A. The Use of Palm Oil as Diesel Fuel Substitute. J.
Power Energy A. 1996, 210, 47–53.
Sarin, R. Sharma, M. Sinharay, S. Malhorta, R.K. Jatropha – Palm Biodiesel Blends: An
Optimum Mix for Asia. Fuel, 2007, 86, 1365-1371.
Sarmiento, J.L. Hughes, T.M.C. Stouffer, R.J. Manabe, S. Simulated Response of the
Ocean Carbon Cycle to Anthropogenic Climate Warning, Nature¸1998, 393, 245-
249.
Seetula J.A. Slagle I.R. Kinetics and thermochemistry of the R+ HBr H+ Br (R= n-
C3H7, iso-C3H7 , n-C4H9 , iso-C4H9 , sec-C4H9 or tert-C4H9) equilibrium, J. Chem.
Soc. Faraday Trans. 1997, 93, 1709-1719.
Shahid, E.M. Jamal, Y. A Review of Biodiesel as a Vehicular Fuel, Renewable and
Sustainable Energy Review, 2008, 12(9), 2484-2494.
Sharma, Y.C. Singh, B. Development of Biodiesel: Current Scenario, Renewable and
Sustainable Energy Reviews, 2009, 13(6-7), 1646-1651.
Siegbahn, P.E.M. Multireference CCI Calculations on the Bond Dissociation Energies of
Methane, Chemical Physics Letters, 1985, 119(6), 515-522.
Smeets, E. Junginger, M. Faaij, A. Walter, A. Dolzan, P. Turkenburg, W. The
Sustainability of Brazilian Ethanol—An Assessment of the Possibilities of Certified
Production, Biomass and Bioenergy, 2008, 32(8), 781-813.
The Autoxidation of Biodiesel and its Effects on Engine Lubricants
40
Spear, B. James Watt: The Steam Engine and Commercialization of Patents, World Patent
Information, 2008, 30, 53-58.
Srinisavan, S. The Food v Fuel Debate: A Nuanced View of Incentive Structures,
Renewable Energy, 2009, 34(4), 950-954.
Srivastava, A. Prasad, R. Triglycerides-based Diesel Fuels, Renewable and Sustainable
Energy Reviews, 2000, 4, 111-133.
Stachowiak, G.W. Batchelor, A.W. Lubricants and their Composition, Engineering
Tribology, 2005, Ch. 3, 51-101.
Stark, M.S. Wilkinson, J.J. Lindsay Smith, J.R. Alfadhl, A. Pochopien, B.A. Autoxidation
of Branched Alkanes in the Liquid Phase, Ind, Eng. Chem. Res. 2011, 50, 817-823
Sumathi, S. Chai, S.P. Mohamed, A.R. Utilization of Palm Oil as a Source of Renewable
Energy in Malaysia, Renewable and Sustainable Energy Reviews, 2008, 12, 2404–
2421.
Szulcyk, K.R. McCarl, B.A. Market Penetration of Biodiesel, Renewable and Sustainable
Energy Reviews, 2010, 14(8), 2426-2433.
Tan, Y.C. Ripin, Z.M. Frictional Behaviour of Piston Rings of Small Utility Two-Stroke
Engine Under Secondary Motion of Piston, Tribology International, 2010, 44, 592-
602.
Taylor, R.I. Evans, P.G. In-situ Piston Measurements, Proc. Instn. Mech. Engrs. 2004,
218(J: J. Engineering Tribology), 185-200.
Thoenes, P. Biofuels and Commodities Market – Palm Oil Focus, FAO, Commodities and
Trades Division.
Thornton, M.J. Alleman, T.L. Luecke, J. McCormick, R.L. Impacts of Biodiesel Fuel
Blends, Oil Dilution on Light-Duty Diesel Engine Operation, National Renewable
Energy Laboratory, Conference Paper NREL/CP-549-44833, August 2009.
Tiwari, A.K. Kumar, A. Raheman, H. Biodiesel Production from Jatropha Oil (Jatropha
Curcas) with High Free Fatty Acids: An Optimised Process, Bioresource
Technology, 2007, 31(8), 569-575.
Tormos, B. Novella, R. García, A. Gargar, K. Comprehensive Study of Biodiesel Fuel for
HSDI Engines in Convencional and Low Temperature Combustion Conditions,
Renweable Energy, 2010, 35, 368-378.
Trenwith, A.B. Dissociation of 3-methyl-1,4-pentadiene and the Resonance Energy of the
Pentadienyl Radical J. Chem. Soc. Faraday Trans. 1, Physical Chemistry in
Condensed Phases, 1982, 78(10), 3131-3136.
Chapter 1 Introduction
41
Tutorvista.com http://www.tutorvista.com/content/chemistry/chemistry-iv/atomic-
structure/oxygen-molecule.php Accessed 04/08/2011
U.S Department of Energy report 2011 http://tonto.eia.doe.gov/oog/info/twip/twip.asp
27/04/2011
U.S. Patent 388,372, 08/1888 – Nikolaus Otto, Otto Cycle Engine.
Wakuri, Y. Hamatake, T. Soejima, M. Kitahara, T. Piston Ring Friction in Internal
Combustion Engines, Tribology International, 1992, 25(5), 299-308.
Walker, K. Biodiesel from Rapeseed, J. R. Agric. Soc. Engl. 1994, 155, 43–47.
Wayne, R.P. Chemistry of Atmospheres, 3rd
Edition, Oxford University Press, 2000, 50-
60.
Woodwell, G.M, MacDonald, G.J. Revelle, R, Kelling, C.D. The Carbon Dioxide Problem:
Implications for Policy in the Management of Energy and Other Resources, Report to
the Council on Environmental Quality, 1979, Reprinted 2008.
Yizhe, L. Guirong, B. Hua, W. Determination of 11 fatty acids and fatty acid methyl esters
in biodiesel using ultra performance liquid chromatography, Chinese Journal of
Chromatography, 2008, 26(4), 494-498.
Xue, J. Grift, T.E. Hansen, A.C. Effect of Biodiesel on Engine Performances and
Emissions, Renewable and Sustainable Energy Reviews, 2011, 15(2), 1098-1116.
Yuan, W. Hansen, A.C. Zhang, Q. Vapour Pressure and Normal Boiling Point Predictions
for Pure Methyl Esters and Biodiesel Fuels, Fuel, 2005, 84, 943-950.
Zhang, F.L. Niu, B. Wang, Y.C. Chen, F. Wang, S.H. Xu, Y. Jiang, L.D. Gao, S. Wu, J.
Tang, L. Jia, Y.J. A Novel Betain Aldehyde dehydrogenase gene from Jatropha
Curcas, encoding an enzyme implicated in adaptation to environmental stress, Plant
Science, 2008, 174, 510-518.
Zhang, H. Machutta, C.A. Tonge, P.J. Fatty Acid Biosynthesis and Oxidation,
Comprehensive Natural Products II, 2010, 8.07, 231-275.
Zhang, Y. Dubé, M.A. McLean, D.D. Kates, M. Biodiesel Production from Waste Cooking
Oil: 1. Process Design and Technological Assessment, Bioresource Technology,
2003, 89(1), 1-16.

The Autoxidation of Biodiesel and its Effects on Engine Lubricants
42
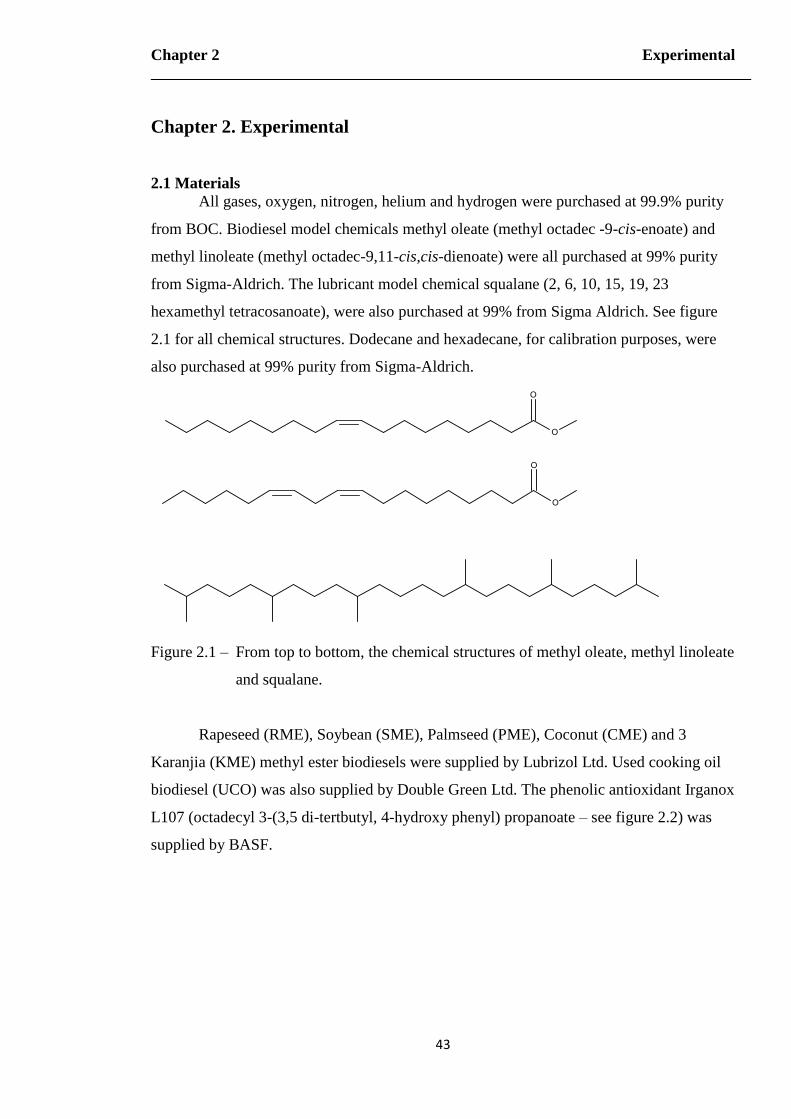
Chapter 2 Experimental
43
Chapter 2. Experimental
2.1 Materials
All gases, oxygen, nitrogen, helium and hydrogen were purchased at 99.9% purity
from BOC. Biodiesel model chemicals methyl oleate (methyl octadec -9-cis-enoate) and
methyl linoleate (methyl octadec-9,11-cis,cis-dienoate) were all purchased at 99% purity
from Sigma-Aldrich. The lubricant model chemical squalane (2, 6, 10, 15, 19, 23
hexamethyl tetracosanoate), were also purchased at 99% from Sigma Aldrich. See figure
2.1 for all chemical structures. Dodecane and hexadecane, for calibration purposes, were
also purchased at 99% purity from Sigma-Aldrich.
Figure 2.1 – From top to bottom, the chemical structures of methyl oleate, methyl linoleate
and squalane.
Rapeseed (RME), Soybean (SME), Palmseed (PME), Coconut (CME) and 3
Karanjia (KME) methyl ester biodiesels were supplied by Lubrizol Ltd. Used cooking oil
biodiesel (UCO) was also supplied by Double Green Ltd. The phenolic antioxidant Irganox
L107 (octadecyl 3-(3,5 di-tertbutyl, 4-hydroxy phenyl) propanoate – see figure 2.2) was
supplied by BASF.
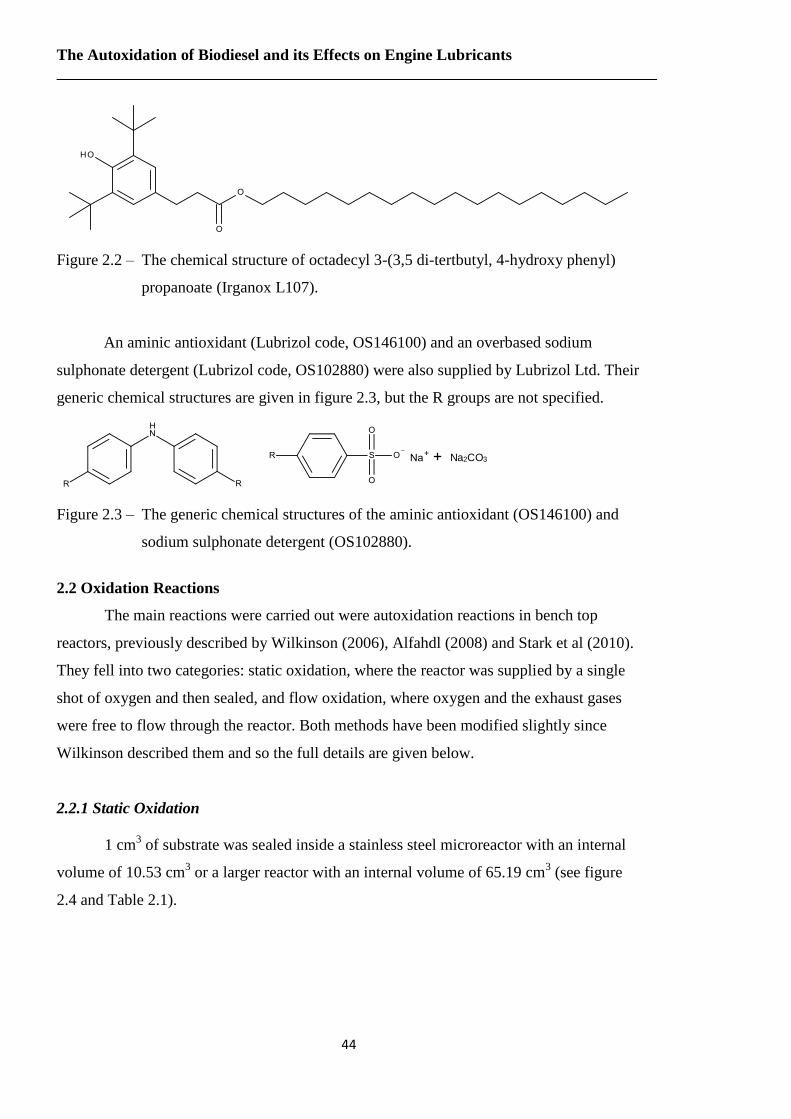
The Autoxidation of Biodiesel and its Effects on Engine Lubricants
44
Figure 2.2 – The chemical structure of octadecyl 3-(3,5 di-tertbutyl, 4-hydroxy phenyl)
propanoate (Irganox L107).
An aminic antioxidant (Lubrizol code, OS146100) and an overbased sodium
sulphonate detergent (Lubrizol code, OS102880) were also supplied by Lubrizol Ltd. Their
generic chemical structures are given in figure 2.3, but the R groups are not specified.
Na2CO3
Figure 2.3 – The generic chemical structures of the aminic antioxidant (OS146100) and
sodium sulphonate detergent (OS102880).
2.2 Oxidation Reactions
The main reactions were carried out were autoxidation reactions in bench top
reactors, previously described by Wilkinson (2006), Alfahdl (2008) and Stark et al (2010).
They fell into two categories: static oxidation, where the reactor was supplied by a single
shot of oxygen and then sealed, and flow oxidation, where oxygen and the exhaust gases
were free to flow through the reactor. Both methods have been modified slightly since
Wilkinson described them and so the full details are given below.
2.2.1 Static Oxidation
1 cm3 of substrate was sealed inside a stainless steel microreactor with an internal
volume of 10.53 cm3 or a larger reactor with an internal volume of 65.19 cm
3 (see figure
2.4 and Table 2.1).
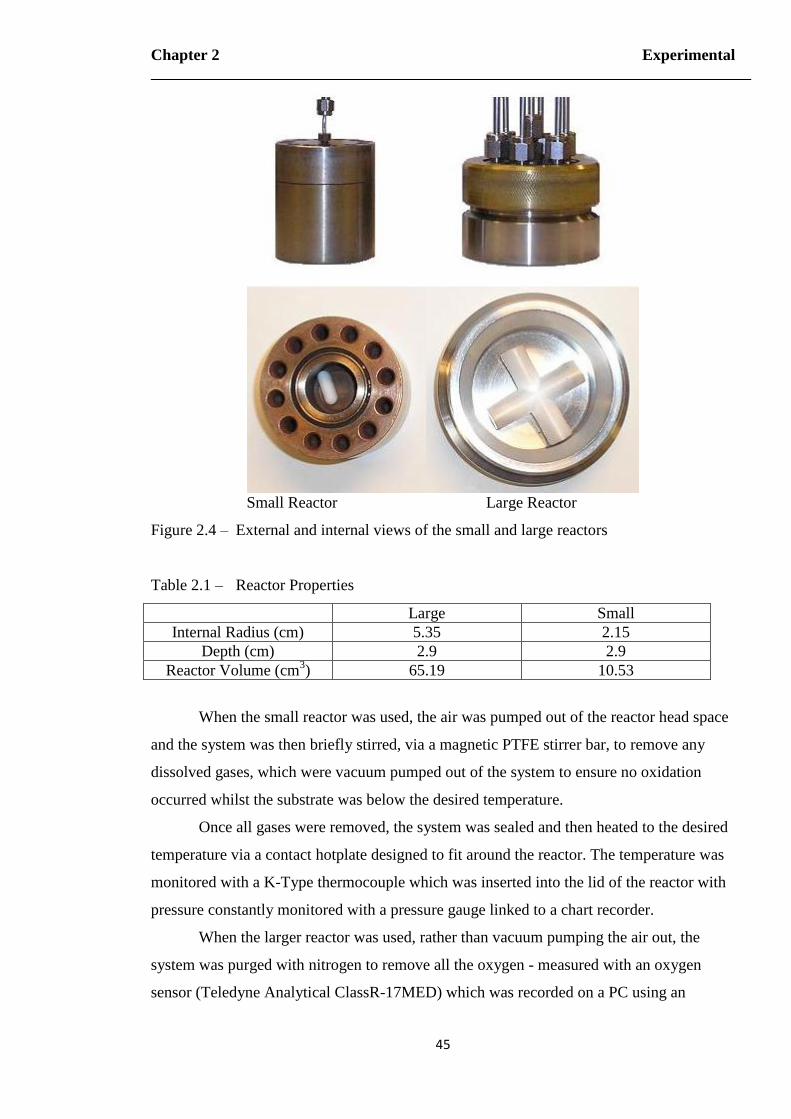
Chapter 2 Experimental
45
Small Reactor Large Reactor
Figure 2.4 – External and internal views of the small and large reactors
Table 2.1 – Reactor Properties
Large Small
Internal Radius (cm) 5.35 2.15
Depth (cm) 2.9 2.9
Reactor Volume (cm3) 65.19 10.53
When the small reactor was used, the air was pumped out of the reactor head space
and the system was then briefly stirred, via a magnetic PTFE stirrer bar, to remove any
dissolved gases, which were vacuum pumped out of the system to ensure no oxidation
occurred whilst the substrate was below the desired temperature.
Once all gases were removed, the system was sealed and then heated to the desired
temperature via a contact hotplate designed to fit around the reactor. The temperature was
monitored with a K-Type thermocouple which was inserted into the lid of the reactor with
pressure constantly monitored with a pressure gauge linked to a chart recorder.
When the larger reactor was used, rather than vacuum pumping the air out, the
system was purged with nitrogen to remove all the oxygen - measured with an oxygen
sensor (Teledyne Analytical ClassR-17MED) which was recorded on a PC using an
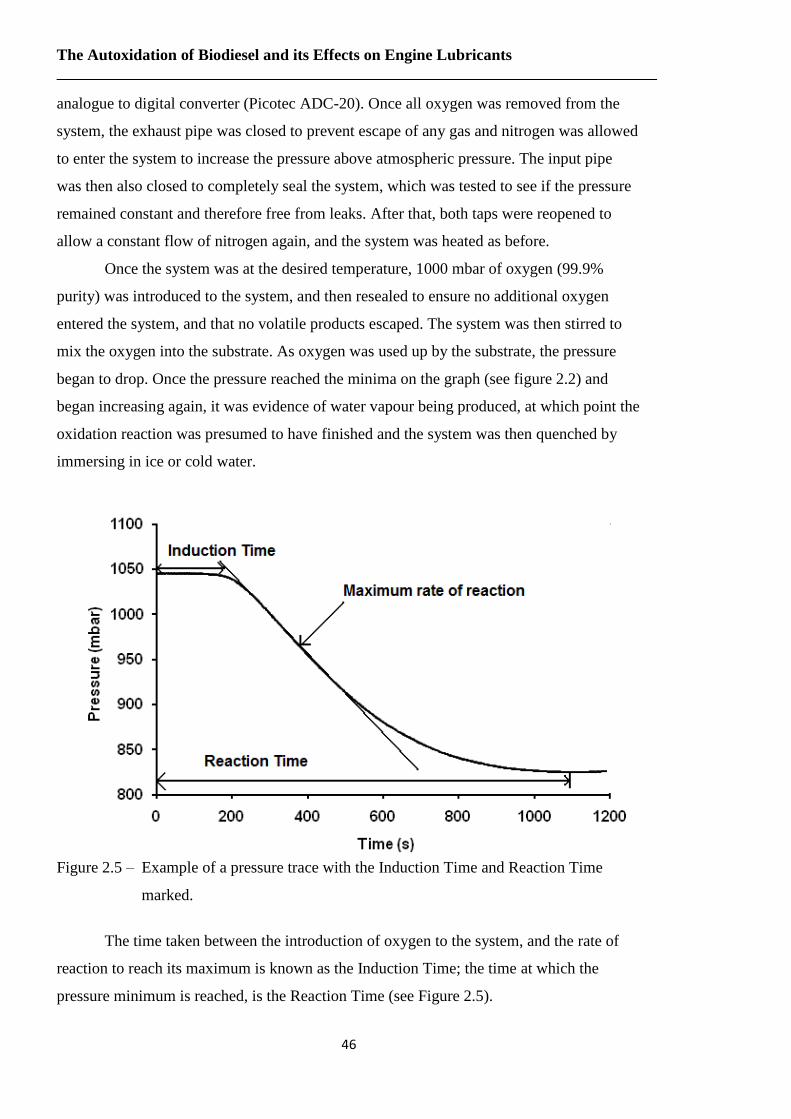
The Autoxidation of Biodiesel and its Effects on Engine Lubricants
46
analogue to digital converter (Picotec ADC-20). Once all oxygen was removed from the
system, the exhaust pipe was closed to prevent escape of any gas and nitrogen was allowed
to enter the system to increase the pressure above atmospheric pressure. The input pipe
was then also closed to completely seal the system, which was tested to see if the pressure
remained constant and therefore free from leaks. After that, both taps were reopened to
allow a constant flow of nitrogen again, and the system was heated as before.
Once the system was at the desired temperature, 1000 mbar of oxygen (99.9%
purity) was introduced to the system, and then resealed to ensure no additional oxygen
entered the system, and that no volatile products escaped. The system was then stirred to
mix the oxygen into the substrate. As oxygen was used up by the substrate, the pressure
began to drop. Once the pressure reached the minima on the graph (see figure 2.2) and
began increasing again, it was evidence of water vapour being produced, at which point the
oxidation reaction was presumed to have finished and the system was then quenched by
immersing in ice or cold water.
Figure 2.5 – Example of a pressure trace with the Induction Time and Reaction Time
marked.
The time taken between the introduction of oxygen to the system, and the rate of
reaction to reach its maximum is known as the Induction Time; the time at which the
pressure minimum is reached, is the Reaction Time (see Figure 2.5).
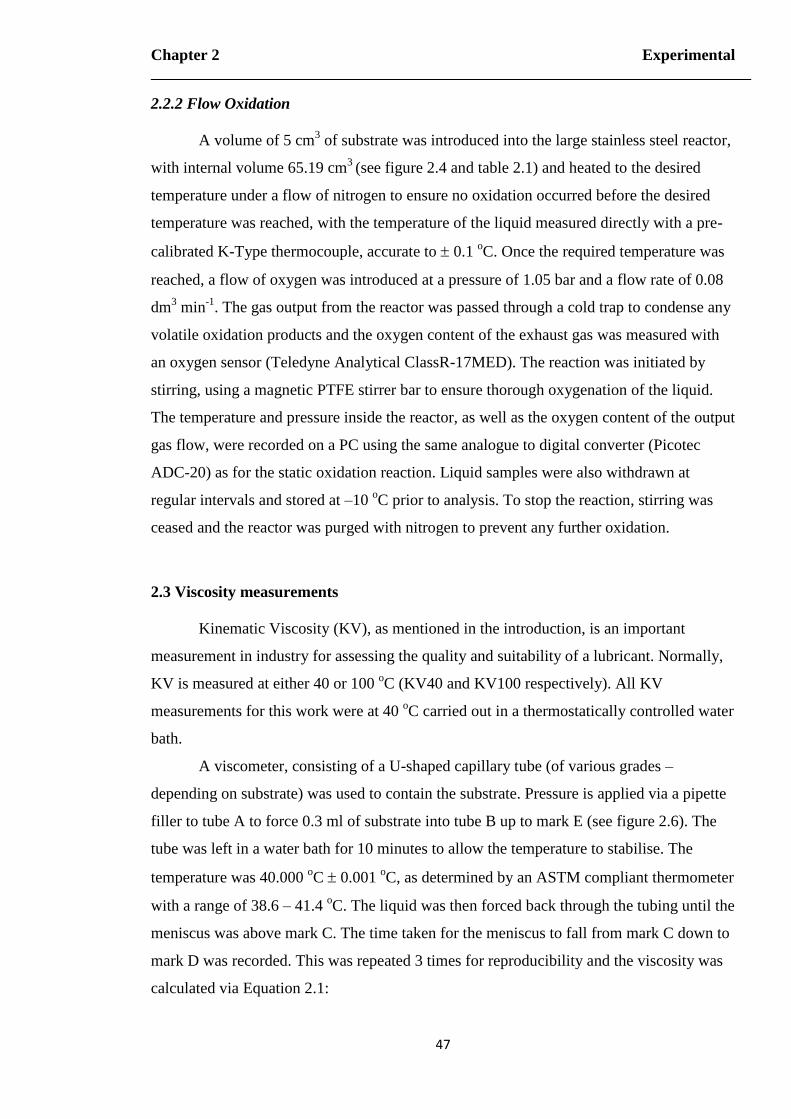
Chapter 2 Experimental
47
2.2.2 Flow Oxidation
A volume of 5 cm3 of substrate was introduced into the large stainless steel reactor,
with internal volume 65.19 cm3
(see figure 2.4 and table 2.1) and heated to the desired
temperature under a flow of nitrogen to ensure no oxidation occurred before the desired
temperature was reached, with the temperature of the liquid measured directly with a pre-
calibrated K-Type thermocouple, accurate to 0.1 oC. Once the required temperature was
reached, a flow of oxygen was introduced at a pressure of 1.05 bar and a flow rate of 0.08
dm3 min
-1. The gas output from the reactor was passed through a cold trap to condense any
volatile oxidation products and the oxygen content of the exhaust gas was measured with
an oxygen sensor (Teledyne Analytical ClassR-17MED). The reaction was initiated by
stirring, using a magnetic PTFE stirrer bar to ensure thorough oxygenation of the liquid.
The temperature and pressure inside the reactor, as well as the oxygen content of the output
gas flow, were recorded on a PC using the same analogue to digital converter (Picotec
ADC-20) as for the static oxidation reaction. Liquid samples were also withdrawn at
regular intervals and stored at –10 oC prior to analysis. To stop the reaction, stirring was
ceased and the reactor was purged with nitrogen to prevent any further oxidation.
2.3 Viscosity measurements
Kinematic Viscosity (KV), as mentioned in the introduction, is an important
measurement in industry for assessing the quality and suitability of a lubricant. Normally,
KV is measured at either 40 or 100 oC (KV40 and KV100 respectively). All KV
measurements for this work were at 40 oC carried out in a thermostatically controlled water
bath.
A viscometer, consisting of a U-shaped capillary tube (of various grades –
depending on substrate) was used to contain the substrate. Pressure is applied via a pipette
filler to tube A to force 0.3 ml of substrate into tube B up to mark E (see figure 2.6). The
tube was left in a water bath for 10 minutes to allow the temperature to stabilise. The
temperature was 40.000 oC 0.001
oC, as determined by an ASTM compliant thermometer
with a range of 38.6 – 41.4 oC. The liquid was then forced back through the tubing until the
meniscus was above mark C. The time taken for the meniscus to fall from mark C down to
mark D was recorded. This was repeated 3 times for reproducibility and the viscosity was
calculated via Equation 2.1:
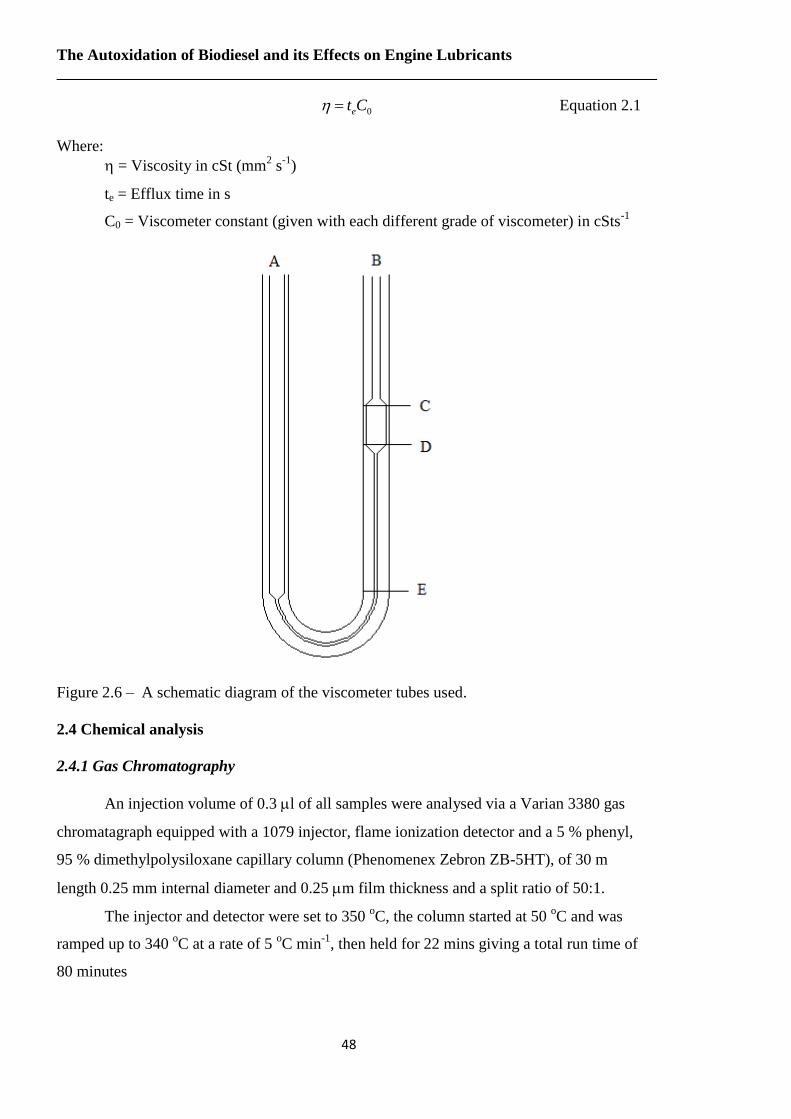
The Autoxidation of Biodiesel and its Effects on Engine Lubricants
48
0Cte Equation 2.1
Where:
= Viscosity in cSt (mm2 s
-1)
te = Efflux time in s
C0 = Viscometer constant (given with each different grade of viscometer) in cSts-1
Figure 2.6 – A schematic diagram of the viscometer tubes used.
2.4 Chemical analysis
2.4.1 Gas Chromatography
An injection volume of 0.3 l of all samples were analysed via a Varian 3380 gas
chromatagraph equipped with a 1079 injector, flame ionization detector and a 5 % phenyl,
95 % dimethylpolysiloxane capillary column (Phenomenex Zebron ZB-5HT), of 30 m
length 0.25 mm internal diameter and 0.25 m film thickness and a split ratio of 50:1.
The injector and detector were set to 350 oC, the column started at 50
oC and was
ramped up to 340 oC at a rate of 5
oC min
-1, then held for 22 mins giving a total run time of
80 minutes
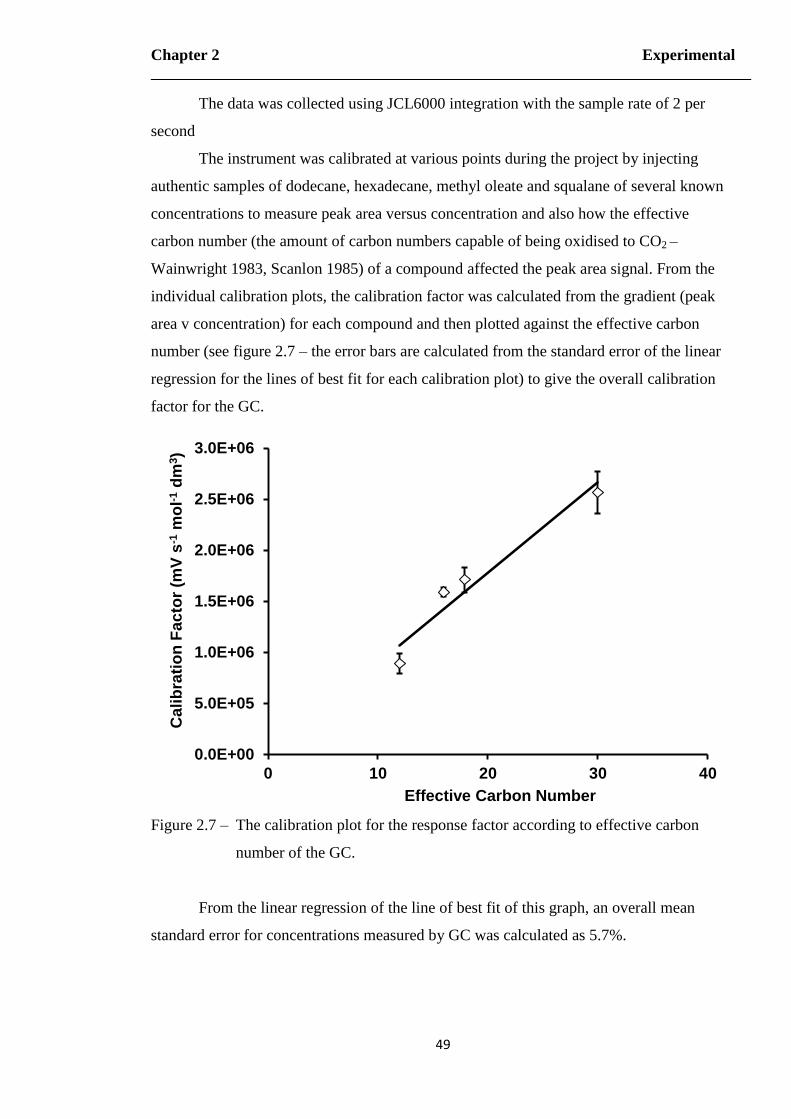
Chapter 2 Experimental
49
The data was collected using JCL6000 integration with the sample rate of 2 per
second
The instrument was calibrated at various points during the project by injecting
authentic samples of dodecane, hexadecane, methyl oleate and squalane of several known
concentrations to measure peak area versus concentration and also how the effective
carbon number (the amount of carbon numbers capable of being oxidised to CO2 –
Wainwright 1983, Scanlon 1985) of a compound affected the peak area signal. From the
individual calibration plots, the calibration factor was calculated from the gradient (peak
area v concentration) for each compound and then plotted against the effective carbon
number (see figure 2.7 – the error bars are calculated from the standard error of the linear
regression for the lines of best fit for each calibration plot) to give the overall calibration
factor for the GC.
Figure 2.7 – The calibration plot for the response factor according to effective carbon
number of the GC.
From the linear regression of the line of best fit of this graph, an overall mean
standard error for concentrations measured by GC was calculated as 5.7%.
0.0E+00
5.0E+05
1.0E+06
1.5E+06
2.0E+06
2.5E+06
3.0E+06
0 10 20 30 40
Cali
bra
tio
n F
ac
tor
(mV
s-1
mo
l-1 d
m3)
Effective Carbon Number
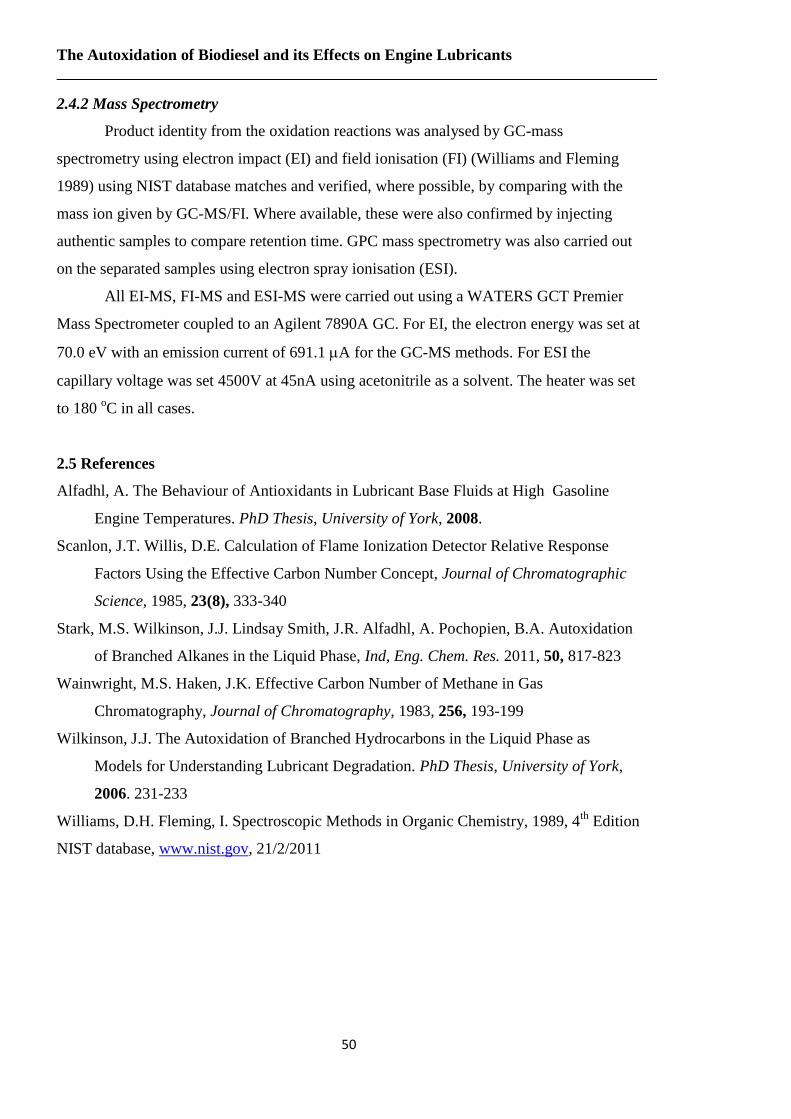
The Autoxidation of Biodiesel and its Effects on Engine Lubricants
50
2.4.2 Mass Spectrometry
Product identity from the oxidation reactions was analysed by GC-mass
spectrometry using electron impact (EI) and field ionisation (FI) (Williams and Fleming
1989) using NIST database matches and verified, where possible, by comparing with the
mass ion given by GC-MS/FI. Where available, these were also confirmed by injecting
authentic samples to compare retention time. GPC mass spectrometry was also carried out
on the separated samples using electron spray ionisation (ESI).
All EI-MS, FI-MS and ESI-MS were carried out using a WATERS GCT Premier
Mass Spectrometer coupled to an Agilent 7890A GC. For EI, the electron energy was set at
70.0 eV with an emission current of 691.1 A for the GC-MS methods. For ESI the
capillary voltage was set 4500V at 45nA using acetonitrile as a solvent. The heater was set
to 180 oC in all cases.
2.5 References
Alfadhl, A. The Behaviour of Antioxidants in Lubricant Base Fluids at High Gasoline
Engine Temperatures. PhD Thesis, University of York, 2008.
Scanlon, J.T. Willis, D.E. Calculation of Flame Ionization Detector Relative Response
Factors Using the Effective Carbon Number Concept, Journal of Chromatographic
Science, 1985, 23(8), 333-340
Stark, M.S. Wilkinson, J.J. Lindsay Smith, J.R. Alfadhl, A. Pochopien, B.A. Autoxidation
of Branched Alkanes in the Liquid Phase, Ind, Eng. Chem. Res. 2011, 50, 817-823
Wainwright, M.S. Haken, J.K. Effective Carbon Number of Methane in Gas
Chromatography, Journal of Chromatography, 1983, 256, 193-199
Wilkinson, J.J. The Autoxidation of Branched Hydrocarbons in the Liquid Phase as
Models for Understanding Lubricant Degradation. PhD Thesis, University of York,
2006. 231-233
Williams, D.H. Fleming, I. Spectroscopic Methods in Organic Chemistry, 1989, 4th
Edition
NIST database, www.nist.gov, 21/2/2011

Chapter 3 Autoxidation of Methyl Linoleate and Oleate
51
Chapter 3. The Liquid Phase Autoxidation of Methyl Linoleate and
Methyl Oleate at Elevated Temperatures
3.1 Introduction
In the Introduction chapter environmental and political factors driving forward the
production of biodiesel were investigated, as well as the chemical, mechanical and
economic factors inhibiting them; the latter being heavily influenced by the first two. Also
investigated was the evolution of biodiesels from traditional vegetable oils to the fatty acid
methyl esters (FAME) currently used for biodiesel as well as the factors that drove this
development.
The main reason was that vegetable oils themselves have been shown to have
relatively poor fuel properties due to relatively high freezing points and high viscosities
(Goering 1982) , hence must be chemically altered to make them suitable for use in engines
designed for conventional diesel. Transesterification with methanol to produce FAME
mixtures was shown to produce a sufficient improvement in properties necessary for
automotive use with regards to freezing points, combustion, viscosity and oxidative
stability (Knothe 2008, Zhang 1988, Du Plessis 1985). The problem with this method is
that whilst these methyl esters displayed better oxidative stability and physical properties
compared to their equivalent monoesters and triglycerides respectively, the fatty acid
chains that contribute to these esters can still have multiple highly reactive unsaturated
carbon-carbon double bonds (Dermibas 2009). By comparison, the traditional mineral oils
used in engines are generally saturated hydrocarbons and aromatics (Gómez-Carracedo
2003), with little to no additional functionality and are typically unreactive towards
chemical breakdown, except during the high temperature of combustion, which is what has
made them effective fuels.
These unsaturated sites in FAME biodiesel typically have singly or doubly allylic
C-H bonds which are weaker (369.0 8.8 and 318 3 kJ mol-1
respectively) than saturated
sites (424 4.2 kJ mol-1
Golden 1969, McMillen 1982, Trenwith 1982, Clark 1991, Pratt
2003, Blanksby 2003 – see figure 3.1) and are hence capable of reacting rapidly with
oxygen-centred radicals in a process known as autoxidation (Ross 1949) to form oxidation
products such as ketones and epoxides (Hamberg 1973), especially at the harsh
temperatures found in combustion engines via the radical cycle summarised below and
explained in greater detail in the introduction (Lightfoot 1992).
The Autoxidation of Biodiesel and its Effects on Engine Lubricants
52
RH + O2 R + HO2 Reaction 3.1
RO2H RO + OH Reaction 3.2
R + O2 RO2 Reaction 3.3
RO2 + RH RO2H + R Reaction 3.4
RO + RH ROH + R Reaction 3.5
424.0 4.2 369.0 8.8 318 3
Figure 3.1 – The saturate, monounsaturated and doubly unsaturated C-H bonds and their
respective B.D.Es.
This subsequent increase in use of biodiesel has resulted in noted detrimental
problems with regards to the engine performance. Listed amongst the problems caused by
this included (but was not limited) to ring sticking (Kim 1998, Labeckas 2006, Shahid
2008), injector fouling (Hiroyasu 1976, Tormos 2010) and degradation of the lubricant
(Bush 1991, Sapaun 1996, Gamble 2003), which in turn resulted in reduced efficiency and
therefore increased costs and emissions.
In this Chapter, the chemistry of biodiesel oxidation will be considered. To achieve
this, two different monoesters, methyl oleate (methyl cis-octadec-9-enoate) and methyl
linoleate (methyl cis-cis-octadec-9,12-dienoate) were used to represent the chemical
degradation of polyunsaturated biodiesels, in particular, identifying the products of
oxidation and the rate at which they are formed at temperatures ranging from 100 oC to 170
oC, representative of various temperatures found in different areas of a diesel engine from
the sump (lowest) to the piston ring assembly and piston assembly (highest) (Taylor 2004,
Moritani 2004). Methyl linoleate was chosen as a biodiesel analogue due to the fact that
Chapter 3 Autoxidation of Methyl Linoleate and Oleate
53
linoleic acid is a commonly occurring fatty acid in many crops used for biodiesel (Ma
1999, Srivastava 2000, Yuan 2005, Balat 2010). Consequently after transesterification, the
corresponding methyl ester, methyl linoleate, is a significant component of biodiesel
(Monyem 2000), especially in rapeseed and soybean methyl ester biodiesel blends (Yizhe
2008). Also, as polyunsaturated compounds are more reactive than monounsaturated and
saturated ones (Bors 1987, Monyem 2000), the hypothesis that methyl linoleate is one of
the primary chemicals responsible for the enhanced formation of engine deposits and
accelerated rate of lubricant oxidation will be further investigated in Chapter 4.
Meanwhile, methyl oleate has been a molecule of interest for a long time as a
model to try and mimic fatty acid and lipid chemistry. Ross investigated the autoxidation
of it in 1949 at 35 oC and identified the migration of the double bond by noting the
formation of hydroperoxides only at the 8, 9, 10 and 11 positions on the chain which,
combined with Farmer’s (1943) previous work on double bond migration led to Frankel
(1984 and 1985) identifying this process to be the main cause of fat and lipid degradation
which, at present, is widely accepted. These models, coupled with both the previous
knowledge and current research of methyl oleate chemistry can therefore lend themselves
to the study of methyl linoleate and biodiesel autoxidation. Methyl oleate is of course also
worthy of study in its own right in this field as it is also a common biodiesel component
(Monyem 2000, Srivastava 2000, Yuan 2005, Yizhe 2008) and hence can contribute to this
study by helping understand the role of singly unsaturated FAME components in biodiesel
degradation and fuel dilution.
3.2 Results
3.2.1 Gas Chromatography
Figures 3.1 and 3.2 show the GC traces for methyl linoleate oxidised in the static
oxidation reaction method at 170 oC. Figure 3.2 shows the peaks that eluted up to and
including methyl linoleate, whereas figure 3.3 shows those that eluted after and including
methyl linoleate. The reason for this is that the peaks that eluted before methyl linoleate
were spread out over a 30 minute period. Those that eluted afterwards however were
mainly in a 4 minute window from 33.5 to 37.5 minutes (shown in figure 3.4 for clarity)
(with the exception of the minor peak at around 61 minutes) hence the chromatogram are
being presented separately for clarity. Figure 3.5 shows the GC trace for methyl oleate
under the same conditions.
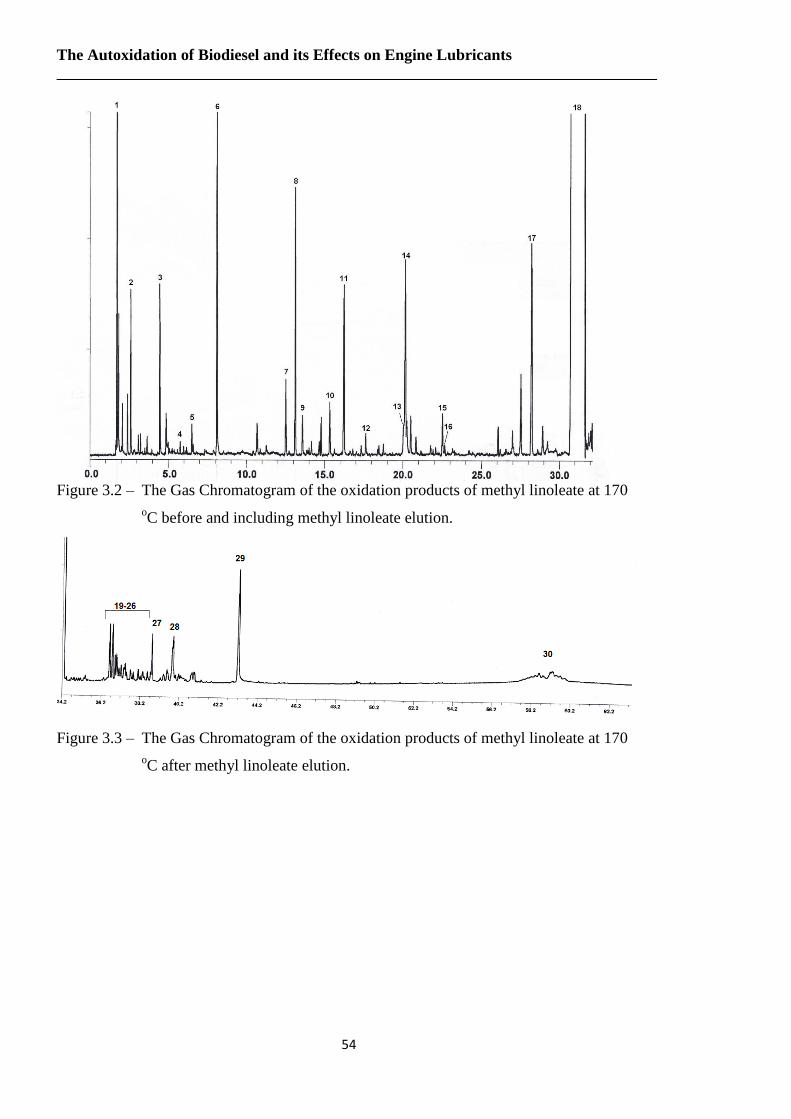
The Autoxidation of Biodiesel and its Effects on Engine Lubricants
54
Figure 3.2 – The Gas Chromatogram of the oxidation products of methyl linoleate at 170
oC before and including methyl linoleate elution.
Figure 3.3 – The Gas Chromatogram of the oxidation products of methyl linoleate at 170
oC after methyl linoleate elution.
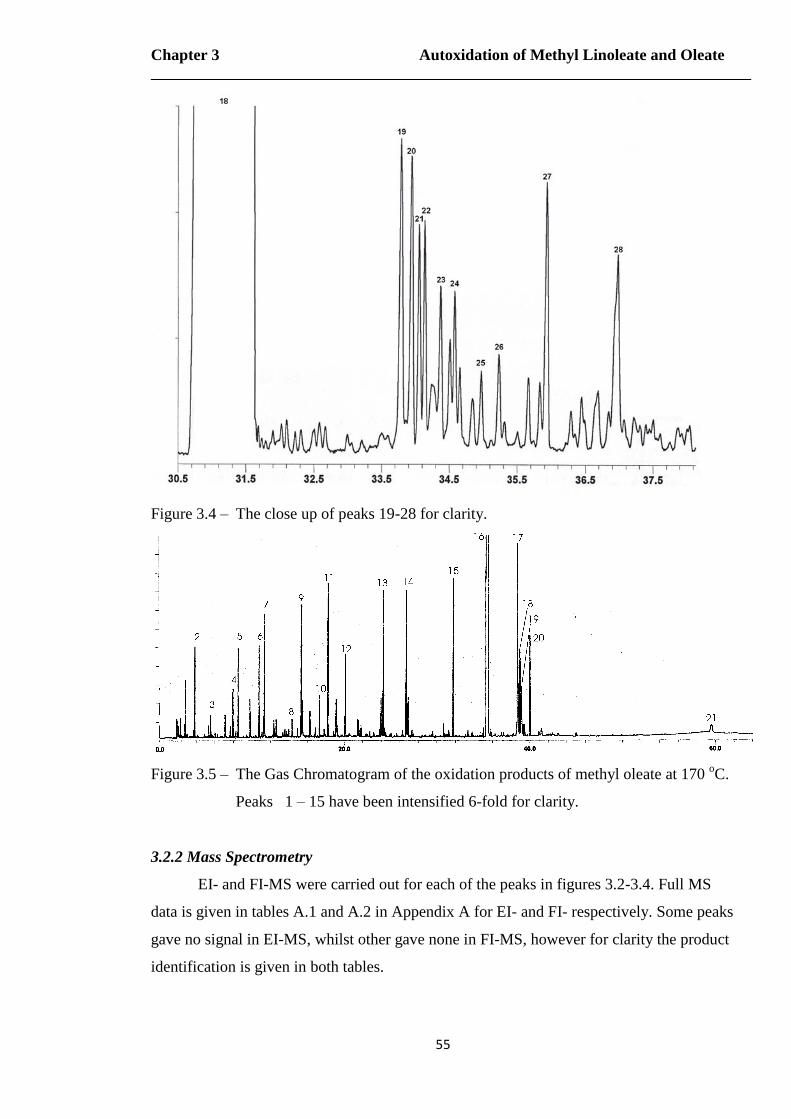
Chapter 3 Autoxidation of Methyl Linoleate and Oleate
55
Figure 3.4 – The close up of peaks 19-28 for clarity.
Figure 3.5 – The Gas Chromatogram of the oxidation products of methyl oleate at 170 oC.
Peaks 1 – 15 have been intensified 6-fold for clarity.
3.2.2 Mass Spectrometry
EI- and FI-MS were carried out for each of the peaks in figures 3.2-3.4. Full MS
data is given in tables A.1 and A.2 in Appendix A for EI- and FI- respectively. Some peaks
gave no signal in EI-MS, whilst other gave none in FI-MS, however for clarity the product
identification is given in both tables.
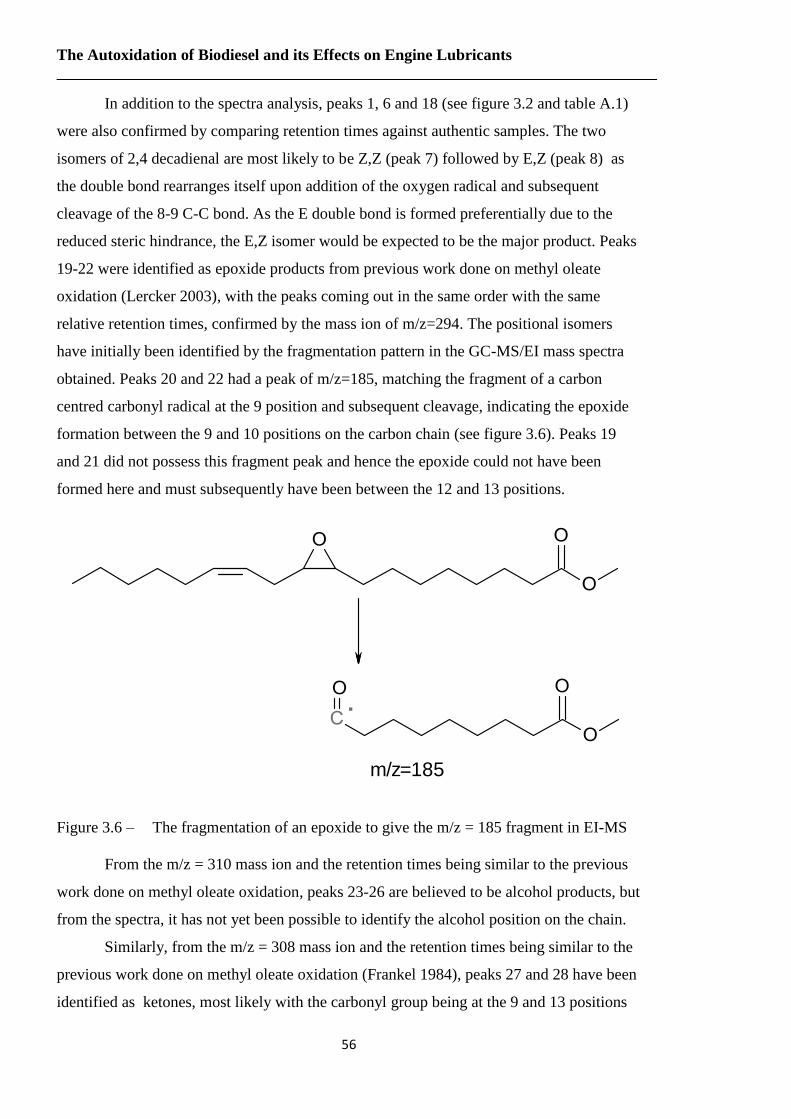
The Autoxidation of Biodiesel and its Effects on Engine Lubricants
56
In addition to the spectra analysis, peaks 1, 6 and 18 (see figure 3.2 and table A.1)
were also confirmed by comparing retention times against authentic samples. The two
isomers of 2,4 decadienal are most likely to be Z,Z (peak 7) followed by E,Z (peak 8) as
the double bond rearranges itself upon addition of the oxygen radical and subsequent
cleavage of the 8-9 C-C bond. As the E double bond is formed preferentially due to the
reduced steric hindrance, the E,Z isomer would be expected to be the major product. Peaks
19-22 were identified as epoxide products from previous work done on methyl oleate
oxidation (Lercker 2003), with the peaks coming out in the same order with the same
relative retention times, confirmed by the mass ion of m/z=294. The positional isomers
have initially been identified by the fragmentation pattern in the GC-MS/EI mass spectra
obtained. Peaks 20 and 22 had a peak of m/z=185, matching the fragment of a carbon
centred carbonyl radical at the 9 position and subsequent cleavage, indicating the epoxide
formation between the 9 and 10 positions on the carbon chain (see figure 3.6). Peaks 19
and 21 did not possess this fragment peak and hence the epoxide could not have been
formed here and must subsequently have been between the 12 and 13 positions.
Figure 3.6 – The fragmentation of an epoxide to give the m/z = 185 fragment in EI-MS
From the m/z = 310 mass ion and the retention times being similar to the previous
work done on methyl oleate oxidation, peaks 23-26 are believed to be alcohol products, but
from the spectra, it has not yet been possible to identify the alcohol position on the chain.
Similarly, from the m/z = 308 mass ion and the retention times being similar to the
previous work done on methyl oleate oxidation (Frankel 1984), peaks 27 and 28 have been
identified as ketones, most likely with the carbonyl group being at the 9 and 13 positions
m/z=185
Chapter 3 Autoxidation of Methyl Linoleate and Oleate
57
(respectively), as they are the most stable (see Discussion section). As with identifying the
positional isomers on the epoxides, peak 27 possessed the m/z = 185 ion, with a relative
intensity of 11%, indicating it is most likely at the 9- position. If it was at the 13- position,
there would be a significant fragment at m/z = 237. Whilst this fragment was observed, it
was very minor at only 1% relative intensity grouped with a more prominent peak at m/z =
235 (4% relative intensity) suggesting the m/z = 237 is merely an isotope peak. Peak 28
did possess the m/z = 237 peak with a relative intensity of 66% (compared to peak 27 at
only 5%), suggesting that it could correspond to having the carbonyl group at the 13-
position, especially with the m/z = 308 mass ion. However, whilst this peak showed up
with a relative intensity of 27% in the EI-MS, an FI-MS for this peak was not obtained in
the spectra, so it is unable to be confirmed whether or not this is definitely the mass ion.
Peak 29 was not observed in either EI- or FI-MS from this sample, but showed up
on all GC traces and is therefore suspected to be an impurity (due to the matching retention
time, most likely squalane from other experiments) or a ghost peak from the GC.
Finally, from the mass ion of m/z = 586, peak 30 has been assigned as the
dehydrodimer. The FI-MS spectra did not detect this peak, but an automated mass ion
calculation was performed on this cluster of peak giving a probable mass ion of m/z = 586.
An accurate mass analysis was also performed on this peak which was given as m/z =
586.496 ± 1 which exactly matches a molecular formula of C38H66O4, which in turn
corresponds to two methyl linoleate molecules each minus a hydrogen atom. This product
would be expected to be formed from termination reactions of methyl linoleate radicals to
form a new C-C bond with the two missing hydrogen atoms coming from hydrogen
abstraction. As with the alcohols, from the spectra, the exact position of the C-C bridge
between the two molecules is unknown. The peak itself appears as a double cluster with
near identical MS profiles, suggesting the presence of several different dimer isomers.
As with methyl linoleate, the mass spectra for the GC-MS analysis of methyl oleate
autoxidation products (from figure 3.5) are presented in Tables A.3 and A.4 in Appendix
A. The fragmentation products are mainly aldehydes and their corresponding alkanes, as
described with methyl linoleate previously. Similarly, the addition products are the
epoxides as well as alcohol and ketone products, as well as the dehydrodimer.
In addition to mass spectra, peaks 2,6,7 and 16 were verified by comparing the
retention time with pure samples. The epoxides were also verified from Lercker’s (2003)
work on methyl oleate oxidation. The remaining addition products, alcohols, ketones and

The Autoxidation of Biodiesel and its Effects on Engine Lubricants
58
the dimer were verified from Frankel’s (1984) work on methyl oleate hydroperoxides,
although the exact structure of the dimer isomer (or more likely isomers) could not be
exactly determined.
3.2.3 Methyl Linoleate Decay
Following the identification of the autoxidation products of methyl linoleate it was
then necessary to determine which were the dominant ones, but also which would react
further and decay over time and which ones would be persistent. To determine this, the
flow oxidation reactions were then carried out on methyl linoleate to measure the change in
concentration of ML and its products over time. Figure 3.7 shows the change in
concentration of ML over time, within the ±5.7% error associated with the GC at 170 oC as
an example.
Figure 3.7 – The change in concentration of ML over time at 170 oC with a 0.08 dm
3 min
-1
flow of oxygen.
Taking the natural logarithms of the concentration of squalane over time in this
oxidation reaction yielded a straight-line plot indicating that the autoxidation of methyl
linoleate is approximately first order with respect to ML – see figure 3.8. The decay of ML
was also found to yield straight-line graphs at 100, 130 and 150 oC, the other 3
temperatures used in this study – see figure 3.9.
0
0.5
1
1.5
2
2.5
3
3.5
4
0 10 20 30 40 50 60 70
[ML
]x1
0-3
(m
ol d
m-3
)
Time (min) 170oC
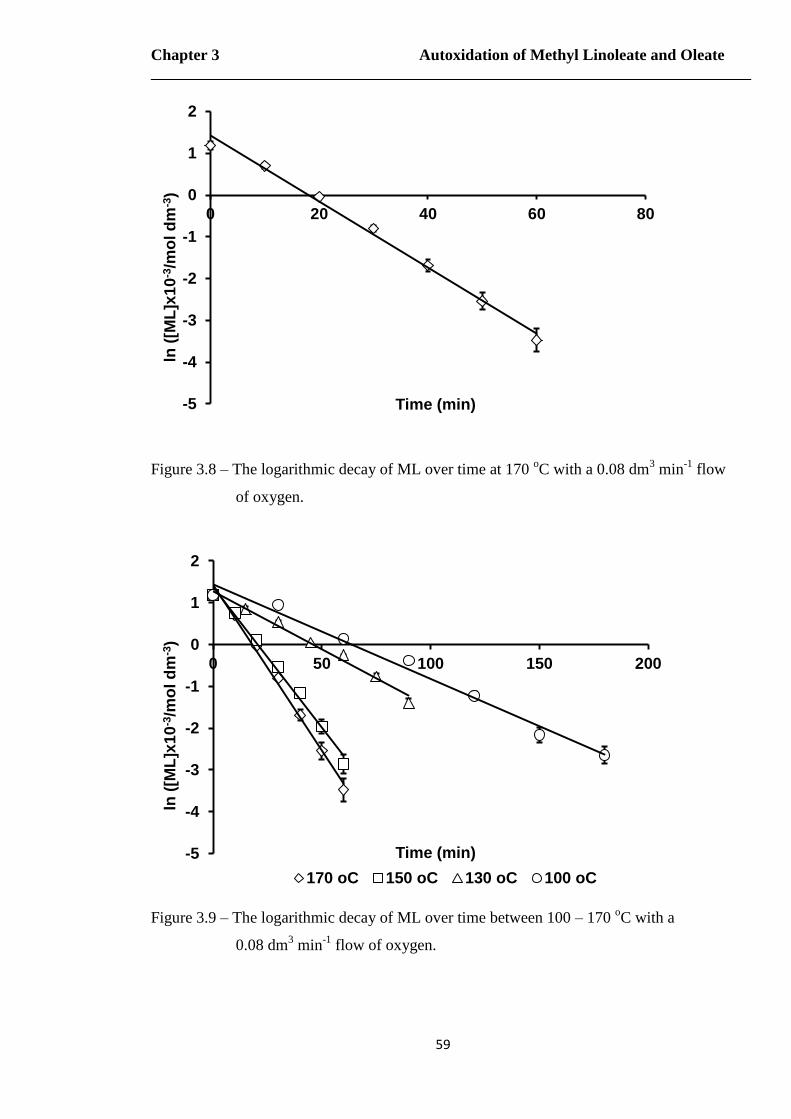
Chapter 3 Autoxidation of Methyl Linoleate and Oleate
59
Figure 3.8 – The logarithmic decay of ML over time at 170 oC with a 0.08 dm
3 min
-1 flow
of oxygen.
Figure 3.9 – The logarithmic decay of ML over time between 100 – 170 oC with a
0.08 dm3 min
-1 flow of oxygen.
-5
-4
-3
-2
-1
0
1
2
0 20 40 60 80
ln (
[ML
]x1
0-3
/mo
l d
m-3
)
Time (min)
-5
-4
-3
-2
-1
0
1
2
0 50 100 150 200
ln (
[ML
]x1
0-3
/mo
l d
m-3
)
Time (min)
170 oC 150 oC 130 oC 100 oC

The Autoxidation of Biodiesel and its Effects on Engine Lubricants
60
As the reaction is approximately psuedo first-order with respect to methyl linoleate
the autoxidation of methyl linoleate can be represented by Equation 3.1, with the observed
rate constant derived from the gradient of the line of best fit being given as kML.
[ ]
[ ] Equation 3.1
From the kML values calculated, an Arrhenius plot was carried out to calculate an
apparrent activation energy for methyl linoleate autoxidation. Figure 3.10 shows the kML
values calculated at the different temperatures, whilst figure 3.11 shows the Arrhenius plot
for the activation energy calculation. However, whilst the data points in figure 3.9 all
correlate well with first-order decay, the data points in figure 3.11 do not neatly fit a
straight line as would be expected for an Arrhenius diagram plotted in this way with only 1
point sitting on the line of best fit despite the fact that the errors associated with the kML
values are obtained from the linear regression of the best-fit lines of the logarithmic decay
graphs and represent the calculated standard error – ca. a 65% chance the true value lies
within the quoted error limits. This plot would give an apparent activation energy for the
autoxidation methyl linoleate of 26.6 ±7.2 kJ mol-1
, instead however there is indication that
there are perhaps Arrhenius plots for two different reactions on the graph – one between
100 – 130 oC and the other from 150 – 170
oC with apparent activation energies of 8.6 and
12.50 kJ mol-1
respectively (no errors shown as each calculation is made from only two
data points).
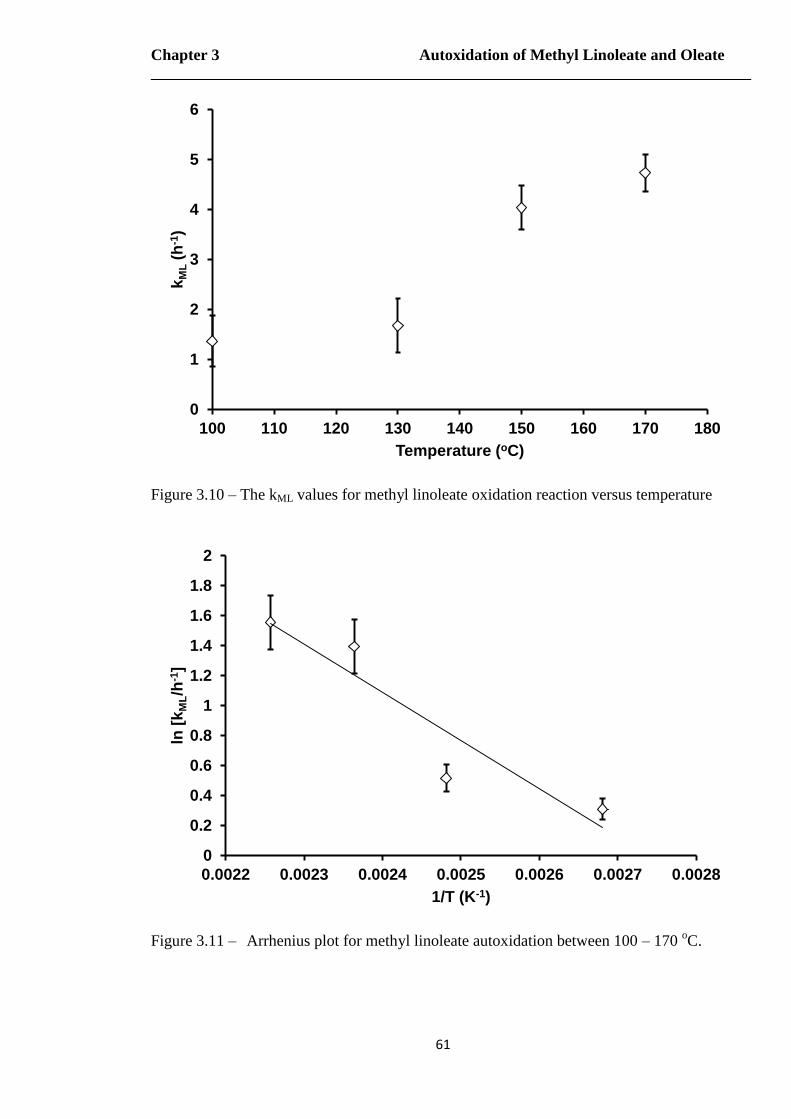
Chapter 3 Autoxidation of Methyl Linoleate and Oleate
61
Figure 3.10 – The kML values for methyl linoleate oxidation reaction versus temperature
Figure 3.11 – Arrhenius plot for methyl linoleate autoxidation between 100 – 170 oC.
0
1
2
3
4
5
6
100 110 120 130 140 150 160 170 180
kM
L (
h-1
)
Temperature (oC)
0
0.2
0.4
0.6
0.8
1
1.2
1.4
1.6
1.8
2
0.0022 0.0023 0.0024 0.0025 0.0026 0.0027 0.0028
ln [
kM
L/h
-1]
1/T (K-1)
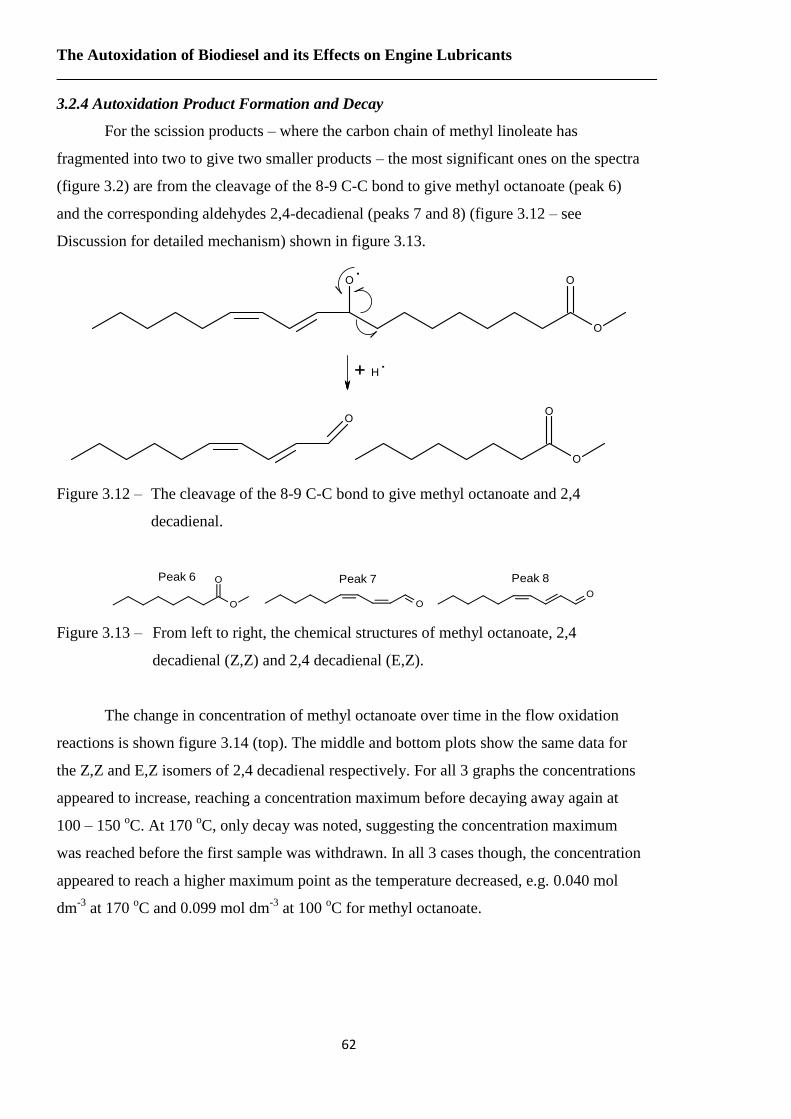
The Autoxidation of Biodiesel and its Effects on Engine Lubricants
62
3.2.4 Autoxidation Product Formation and Decay
For the scission products – where the carbon chain of methyl linoleate has
fragmented into two to give two smaller products – the most significant ones on the spectra
(figure 3.2) are from the cleavage of the 8-9 C-C bond to give methyl octanoate (peak 6)
and the corresponding aldehydes 2,4-decadienal (peaks 7 and 8) (figure 3.12 – see
Discussion for detailed mechanism) shown in figure 3.13.
Figure 3.12 – The cleavage of the 8-9 C-C bond to give methyl octanoate and 2,4
decadienal.
Peak 6 Peak 8Peak 7
Figure 3.13 – From left to right, the chemical structures of methyl octanoate, 2,4
decadienal (Z,Z) and 2,4 decadienal (E,Z).
The change in concentration of methyl octanoate over time in the flow oxidation
reactions is shown figure 3.14 (top). The middle and bottom plots show the same data for
the Z,Z and E,Z isomers of 2,4 decadienal respectively. For all 3 graphs the concentrations
appeared to increase, reaching a concentration maximum before decaying away again at
100 – 150 oC. At 170
oC, only decay was noted, suggesting the concentration maximum
was reached before the first sample was withdrawn. In all 3 cases though, the concentration
appeared to reach a higher maximum point as the temperature decreased, e.g. 0.040 mol
dm-3
at 170 oC and 0.099 mol dm
-3 at 100
oC for methyl octanoate.

Chapter 3 Autoxidation of Methyl Linoleate and Oleate
63
Figure 3.14 – From top to bottom, the formation and decay of methyl octanoate, 2,4
decadienal (Z,Z) and 2,4 decadienal (E,Z) over time.
The next two major peaks were 1 and 17 which were identified as pentane and the
corresponding aldehyde 13-oxo methyl tridec-9,11-dienoate from cleavage of the 13-14
C-C bond – see figures 3.15 and 3.16.
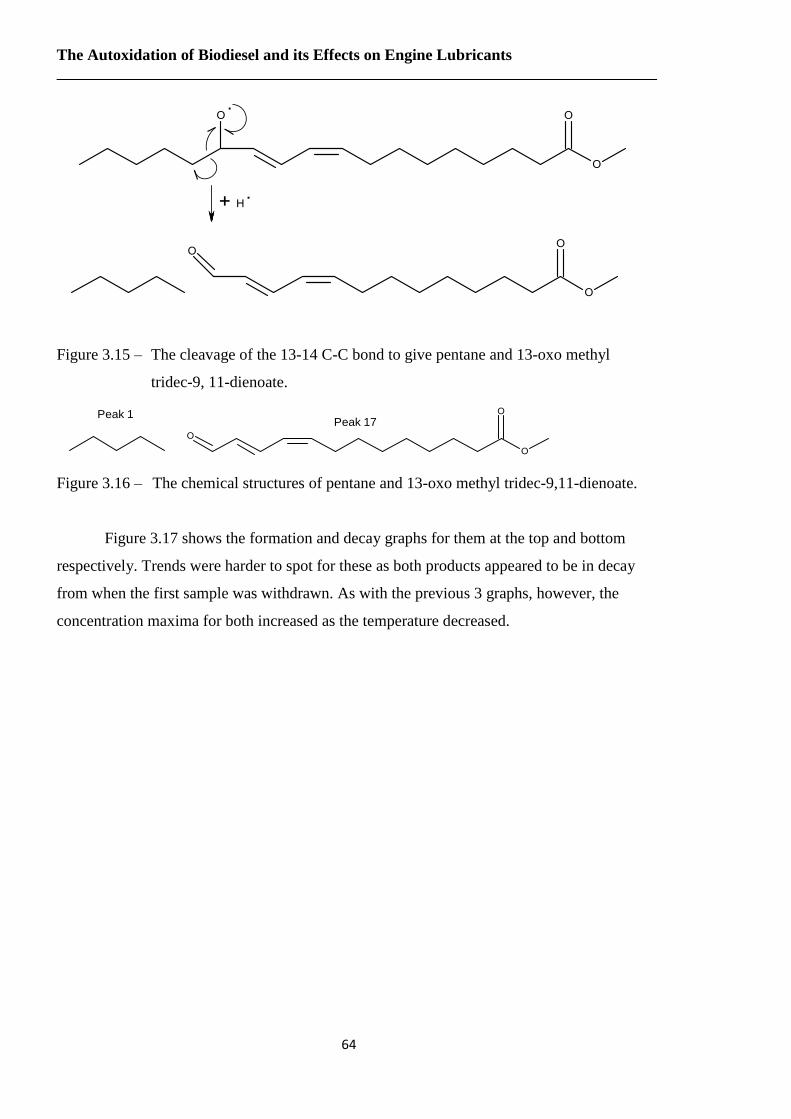
The Autoxidation of Biodiesel and its Effects on Engine Lubricants
64
Figure 3.15 – The cleavage of the 13-14 C-C bond to give pentane and 13-oxo methyl
tridec-9, 11-dienoate.
Peak 1Peak 17
Figure 3.16 – The chemical structures of pentane and 13-oxo methyl tridec-9,11-dienoate.
Figure 3.17 shows the formation and decay graphs for them at the top and bottom
respectively. Trends were harder to spot for these as both products appeared to be in decay
from when the first sample was withdrawn. As with the previous 3 graphs, however, the
concentration maxima for both increased as the temperature decreased.
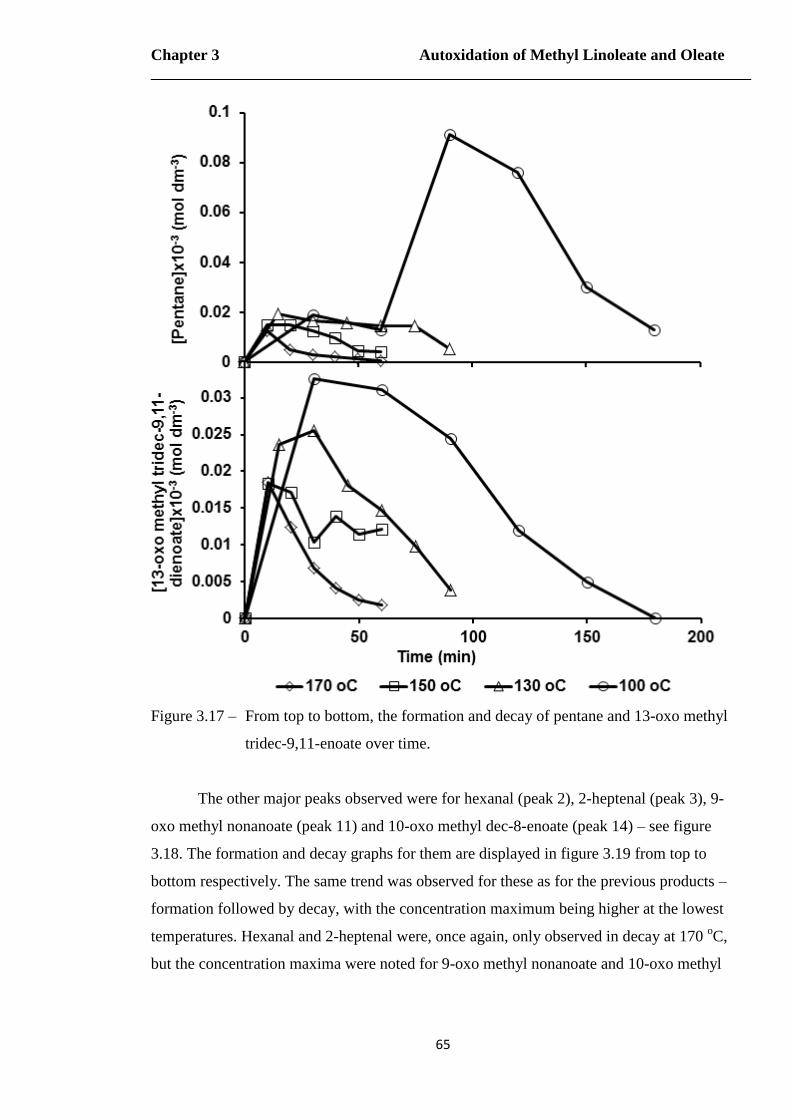
Chapter 3 Autoxidation of Methyl Linoleate and Oleate
65
Figure 3.17 – From top to bottom, the formation and decay of pentane and 13-oxo methyl
tridec-9,11-enoate over time.
The other major peaks observed were for hexanal (peak 2), 2-heptenal (peak 3), 9-
oxo methyl nonanoate (peak 11) and 10-oxo methyl dec-8-enoate (peak 14) – see figure
3.18. The formation and decay graphs for them are displayed in figure 3.19 from top to
bottom respectively. The same trend was observed for these as for the previous products –
formation followed by decay, with the concentration maximum being higher at the lowest
temperatures. Hexanal and 2-heptenal were, once again, only observed in decay at 170 oC,
but the concentration maxima were noted for 9-oxo methyl nonanoate and 10-oxo methyl
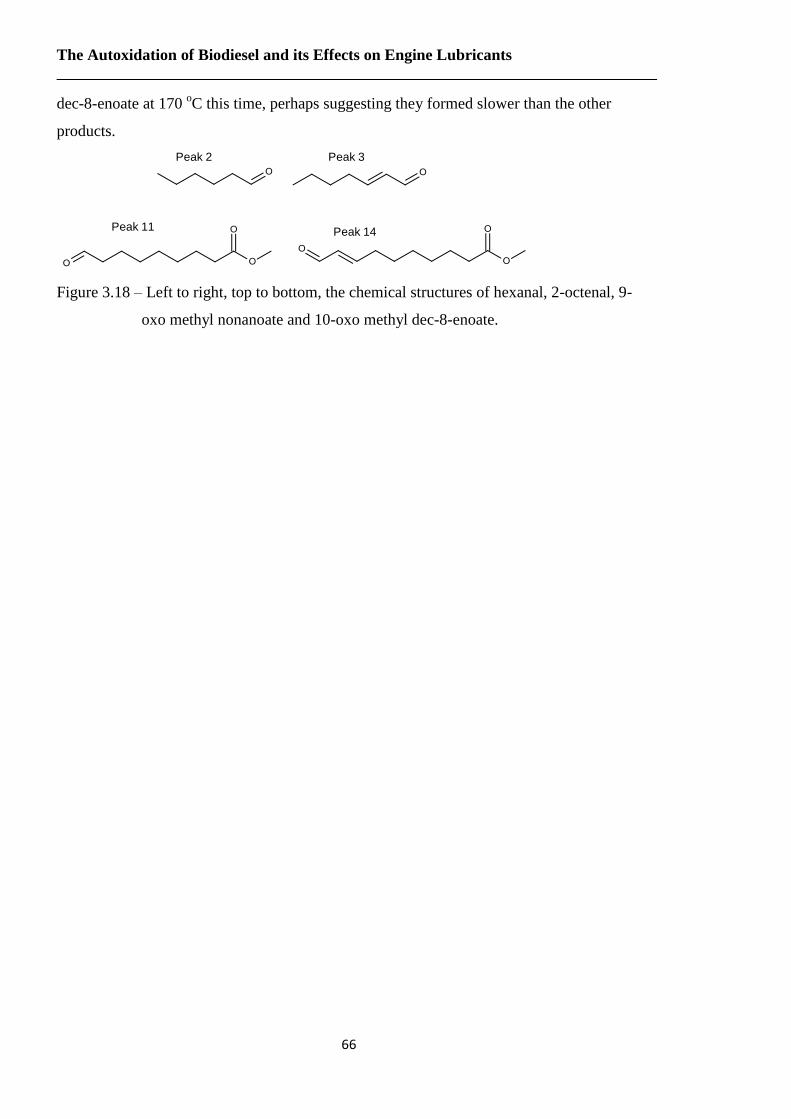
The Autoxidation of Biodiesel and its Effects on Engine Lubricants
66
dec-8-enoate at 170 oC this time, perhaps suggesting they formed slower than the other
products.
Peak 2 Peak 3
Peak 11 Peak 14
Figure 3.18 – Left to right, top to bottom, the chemical structures of hexanal, 2-octenal, 9-
oxo methyl nonanoate and 10-oxo methyl dec-8-enoate.

Chapter 3 Autoxidation of Methyl Linoleate and Oleate
67
Figure 3.19 – From top to bottom, the formation and decay of hexanal, 2-heptenal, 9-oxo
methyl nonanoate and 10-oxo methyl dec-8-enoate over time.

The Autoxidation of Biodiesel and its Effects on Engine Lubricants
68
After the major fragmentation products, the minor peaks that were detected and that
gave signal in either EI- of FI-MS (or both) were methyl heptanoate (peak 4), 2-octenal
(peak 5), 8-oxo methyl octanoate (peak 9), 8-hydroxy methyl octanoate (peak 10) (all
shown in figure 3.20), 10-oxo methyl decanoate, (peak 12) methyl nonandioic acid (peak
13), 11-oxo methyl undec-9-enoate (peak 15) and 12-oxo methyl dodec-9-enoate (peak 16)
(figure 3.21).
Peak 4 Peak 5
Peak 9Peak 10
Figure 3.20 – Left to right, top to bottom, the chemical structures of methyl heptanoate, 2-
octenal, 8-oxo methyl octanoate and 8-hydroxy methyl octanoate.
Peak 12 Peak 13
Peak 15 Peak 16
Figure 3.21 – Left to right, top to bottom, the chemical structures of 10-oxo methyl
decanoate, methyl nonandioic acid, 11-oxo methyl undec-9-enoate and 12-
oxo methyl dodec-9-enoate.
Because these were minor products, patterns could be harder to determine due to
the associated error of the GC sometimes taking the peak area below the limit of detection
– with peaks sometimes barely distinguishable above the noise of the baseline. Figure 3.22,
for example, shows the formation and decay of methyl heptanoate over time. At 130 oC, no
peak areas were detected above the noise until 60 minutes into the reaction. At 100 oC, the
variation due to GC error took the peaks below the limit of detection midway through the
reaction. Even when a peak was detected in each sample at 150 oC, the concentration
seemed to shoot up mid-way through – the only temperature where any notable trend was
noted was 170 oC which showed methyl heptanoate in decay over time.
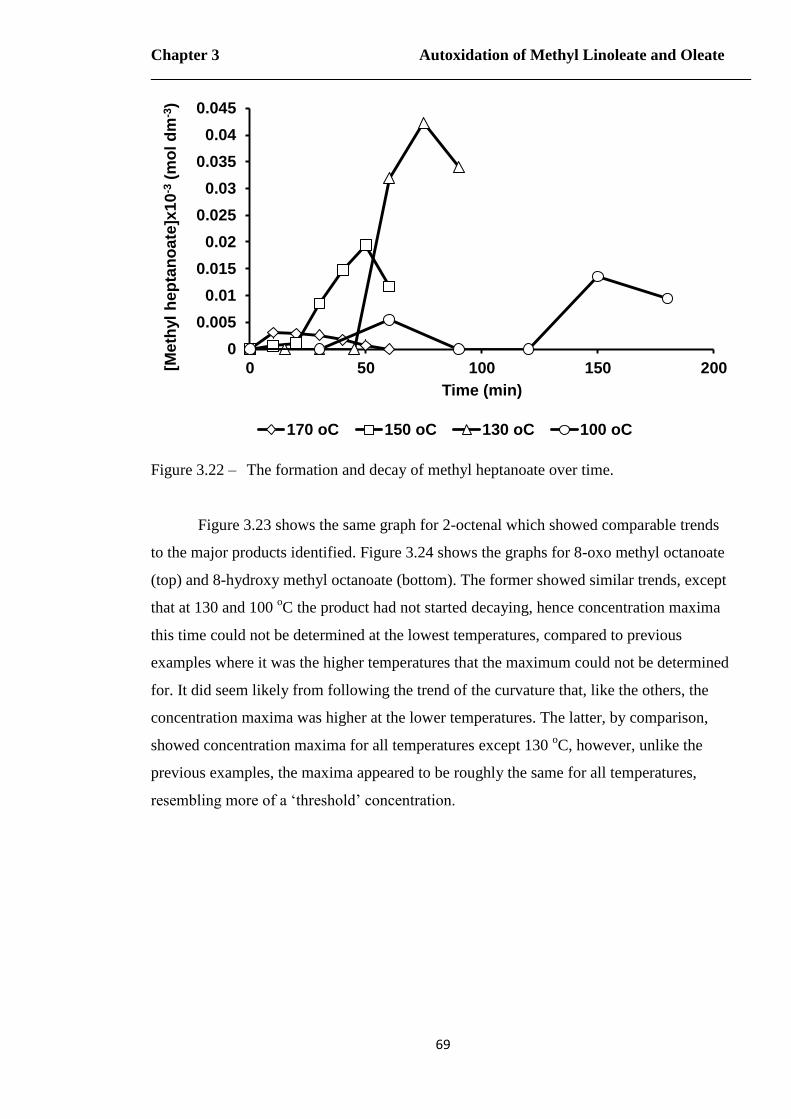
Chapter 3 Autoxidation of Methyl Linoleate and Oleate
69
Figure 3.22 – The formation and decay of methyl heptanoate over time.
Figure 3.23 shows the same graph for 2-octenal which showed comparable trends
to the major products identified. Figure 3.24 shows the graphs for 8-oxo methyl octanoate
(top) and 8-hydroxy methyl octanoate (bottom). The former showed similar trends, except
that at 130 and 100 oC the product had not started decaying, hence concentration maxima
this time could not be determined at the lowest temperatures, compared to previous
examples where it was the higher temperatures that the maximum could not be determined
for. It did seem likely from following the trend of the curvature that, like the others, the
concentration maxima was higher at the lower temperatures. The latter, by comparison,
showed concentration maxima for all temperatures except 130 oC, however, unlike the
previous examples, the maxima appeared to be roughly the same for all temperatures,
resembling more of a ‘threshold’ concentration.
0
0.005
0.01
0.015
0.02
0.025
0.03
0.035
0.04
0.045
0 50 100 150 200[Me
thyl
hep
tan
oa
te]x
10
-3 (
mo
l d
m-3
)
Time (min)
170 oC 150 oC 130 oC 100 oC

The Autoxidation of Biodiesel and its Effects on Engine Lubricants
70
Figure 3.23 – The formation and decay of 2-octenal over time.
0
0.005
0.01
0.015
0.02
0.025
0 50 100 150 200
[2-O
cte
na
l]x1
0-3
(m
ol d
m-3
)
Time (min) 170 oC 150 oC 130 oC 100 oC
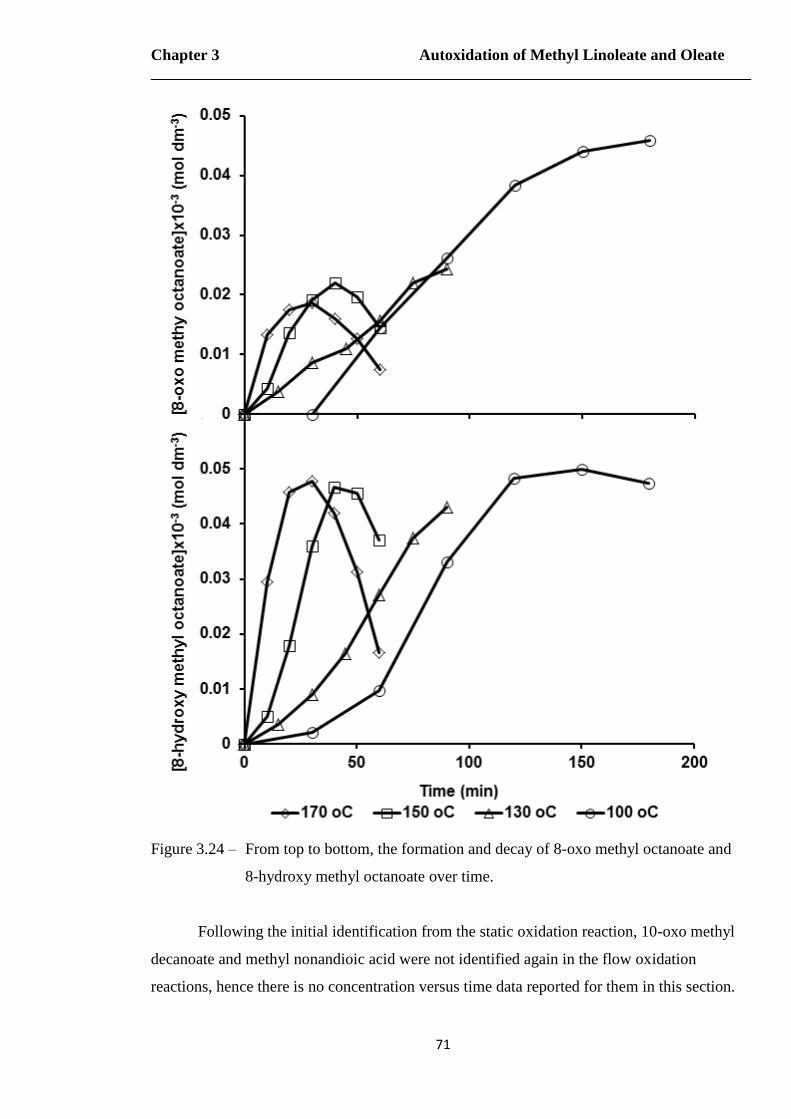
Chapter 3 Autoxidation of Methyl Linoleate and Oleate
71
Figure 3.24 – From top to bottom, the formation and decay of 8-oxo methyl octanoate and
8-hydroxy methyl octanoate over time.
Following the initial identification from the static oxidation reaction, 10-oxo methyl
decanoate and methyl nonandioic acid were not identified again in the flow oxidation
reactions, hence there is no concentration versus time data reported for them in this section.
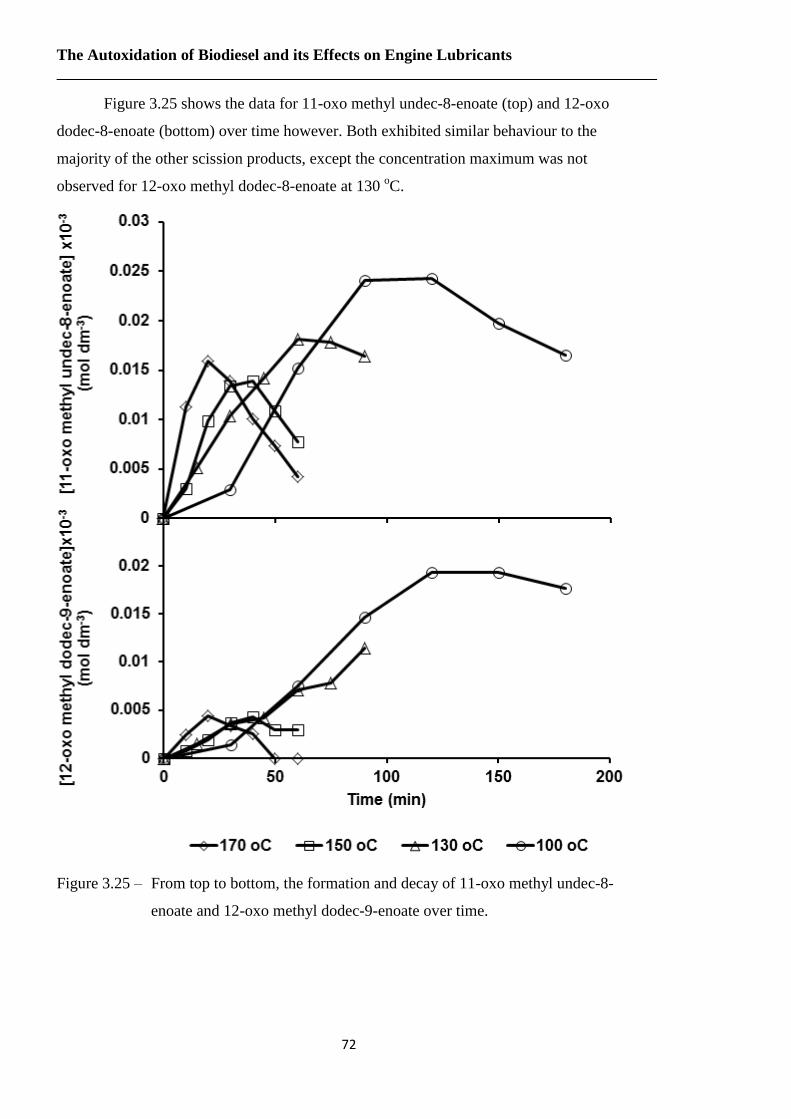
The Autoxidation of Biodiesel and its Effects on Engine Lubricants
72
Figure 3.25 shows the data for 11-oxo methyl undec-8-enoate (top) and 12-oxo
dodec-8-enoate (bottom) over time however. Both exhibited similar behaviour to the
majority of the other scission products, except the concentration maximum was not
observed for 12-oxo methyl dodec-8-enoate at 130 oC.
Figure 3.25 – From top to bottom, the formation and decay of 11-oxo methyl undec-8-
enoate and 12-oxo methyl dodec-9-enoate over time.
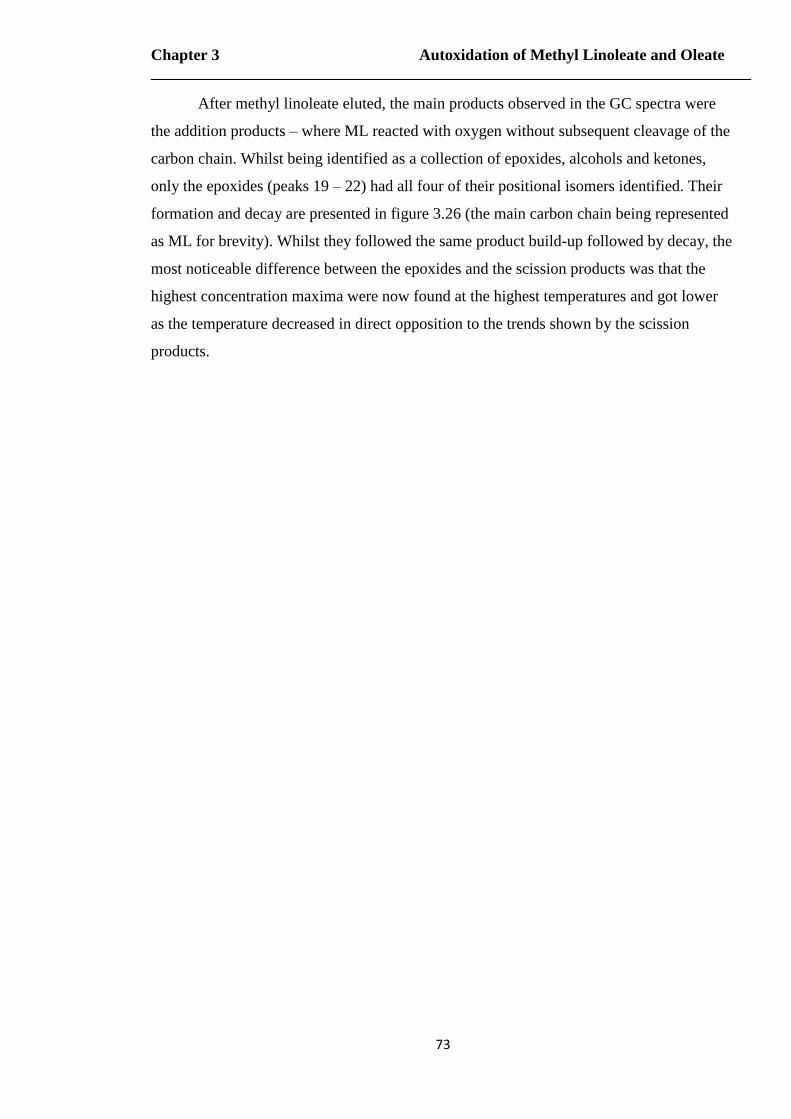
Chapter 3 Autoxidation of Methyl Linoleate and Oleate
73
After methyl linoleate eluted, the main products observed in the GC spectra were
the addition products – where ML reacted with oxygen without subsequent cleavage of the
carbon chain. Whilst being identified as a collection of epoxides, alcohols and ketones,
only the epoxides (peaks 19 – 22) had all four of their positional isomers identified. Their
formation and decay are presented in figure 3.26 (the main carbon chain being represented
as ML for brevity). Whilst they followed the same product build-up followed by decay, the
most noticeable difference between the epoxides and the scission products was that the
highest concentration maxima were now found at the highest temperatures and got lower
as the temperature decreased in direct opposition to the trends shown by the scission
products.
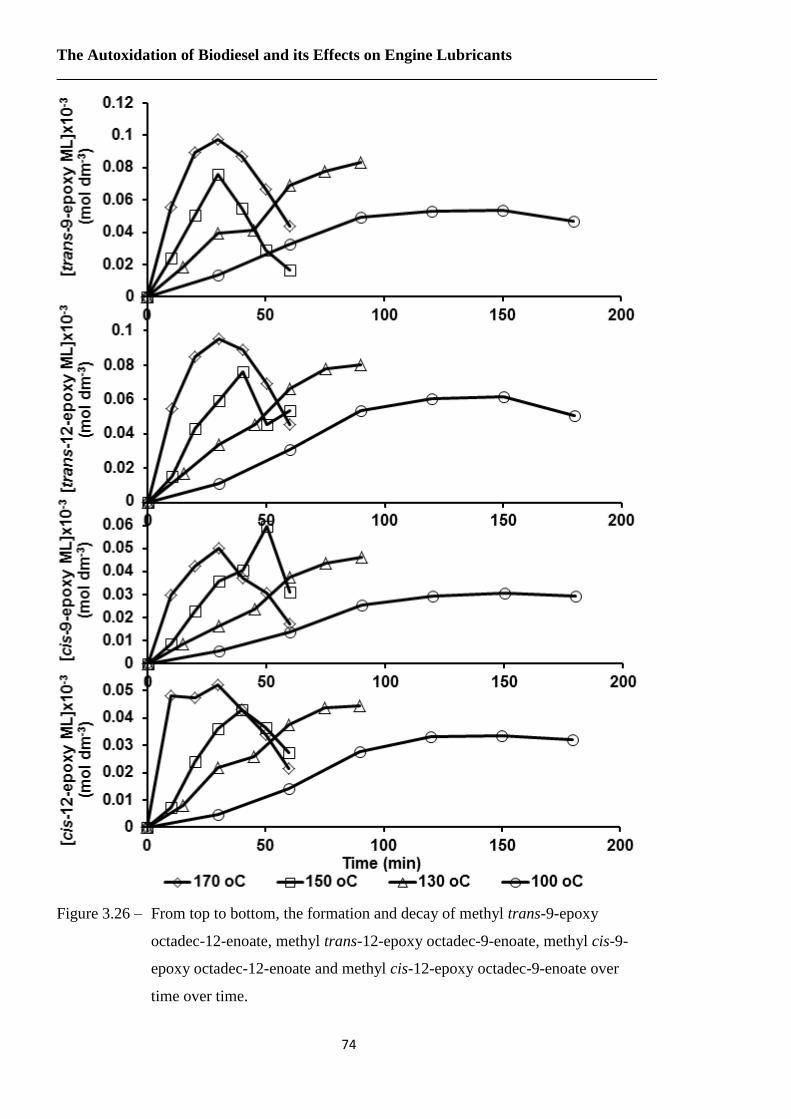
The Autoxidation of Biodiesel and its Effects on Engine Lubricants
74
Figure 3.26 – From top to bottom, the formation and decay of methyl trans-9-epoxy
octadec-12-enoate, methyl trans-12-epoxy octadec-9-enoate, methyl cis-9-
epoxy octadec-12-enoate and methyl cis-12-epoxy octadec-9-enoate over
time over time.
Chapter 3 Autoxidation of Methyl Linoleate and Oleate
75
Of the 4 peaks identified as alcohols from the static oxidation reaction, only the
first one was consistently identifiable by its retention time in the flow oxidation reactions;
after this several other peaks (possibly minor ketones) started appearing overlapping the
remaining 3 alcohol peaks leading to increasingly poor resolution to obtain concentrations
and in some cases making identifying the original peak nearly impossible. For this reason
only one graph for the methyl linoleate alcohols is shown in figure 3.27. Concentration
maxima were only obtained at 130 and 150 oC (though the one for 150
oC appears to be
anomalously high), at 100 and 170 oC only decay of the alcohol was noted, though as with
the scission products it did appear the higher concentrations were found as the temperature
decreased.
Figure 3.27 – The formation and decay of the first methyl linoleate alcohol (exact
positional isomer unknown) over time.
The graphs for the two ketones are shown in figure 3.28 (methyl 9-oxo octadec-
10,12-dieanote, top and methyl 13-oxo octadec-9,11-dienoate, bottom). The 9-oxo isomer
shows the rise and fall in concentration with the highest maxima being shown at lowest
temperatures, though the graph patterns for 100 and 130 oC are very similar, as are those
for 150 and 170 oC. Due to some anomalously high values for the 11-oxo isomer
noticeable trends are very hard to identify however. Finally, in the flow oxidation reactions
0
0.005
0.01
0.015
0.02
0.025
0 50 100 150 200
[ML
OH
]x1
0-3
(m
ol d
m-3
)
Time (min)
170oC 150oC 130oC 100oC
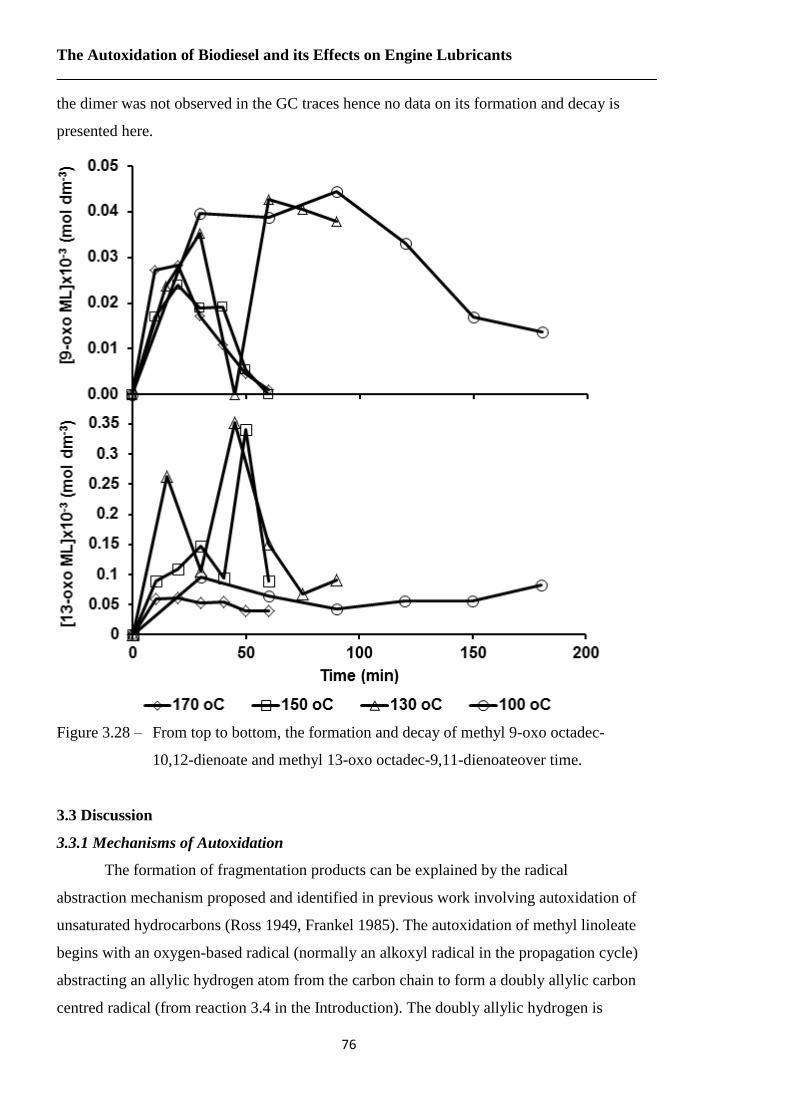
The Autoxidation of Biodiesel and its Effects on Engine Lubricants
76
the dimer was not observed in the GC traces hence no data on its formation and decay is
presented here.
Figure 3.28 – From top to bottom, the formation and decay of methyl 9-oxo octadec-
10,12-dienoate and methyl 13-oxo octadec-9,11-dienoateover time.
3.3 Discussion
3.3.1 Mechanisms of Autoxidation
The formation of fragmentation products can be explained by the radical
abstraction mechanism proposed and identified in previous work involving autoxidation of
unsaturated hydrocarbons (Ross 1949, Frankel 1985). The autoxidation of methyl linoleate
begins with an oxygen-based radical (normally an alkoxyl radical in the propagation cycle)
abstracting an allylic hydrogen atom from the carbon chain to form a doubly allylic carbon
centred radical (from reaction 3.4 in the Introduction). The doubly allylic hydrogen is
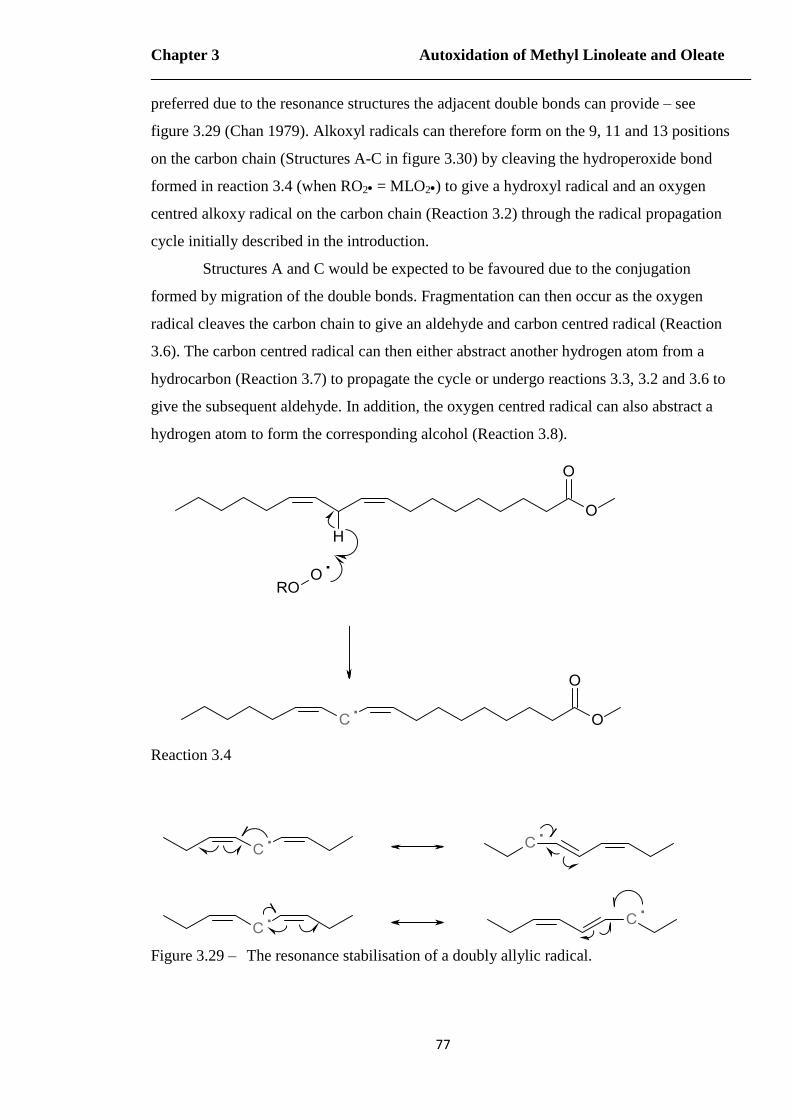
Chapter 3 Autoxidation of Methyl Linoleate and Oleate
77
preferred due to the resonance structures the adjacent double bonds can provide – see
figure 3.29 (Chan 1979). Alkoxyl radicals can therefore form on the 9, 11 and 13 positions
on the carbon chain (Structures A-C in figure 3.30) by cleaving the hydroperoxide bond
formed in reaction 3.4 (when RO2 = MLO2) to give a hydroxyl radical and an oxygen
centred alkoxy radical on the carbon chain (Reaction 3.2) through the radical propagation
cycle initially described in the introduction.
Structures A and C would be expected to be favoured due to the conjugation
formed by migration of the double bonds. Fragmentation can then occur as the oxygen
radical cleaves the carbon chain to give an aldehyde and carbon centred radical (Reaction
3.6). The carbon centred radical can then either abstract another hydrogen atom from a
hydrocarbon (Reaction 3.7) to propagate the cycle or undergo reactions 3.3, 3.2 and 3.6 to
give the subsequent aldehyde. In addition, the oxygen centred radical can also abstract a
hydrogen atom to form the corresponding alcohol (Reaction 3.8).
Reaction 3.4
Figure 3.29 – The resonance stabilisation of a doubly allylic radical.
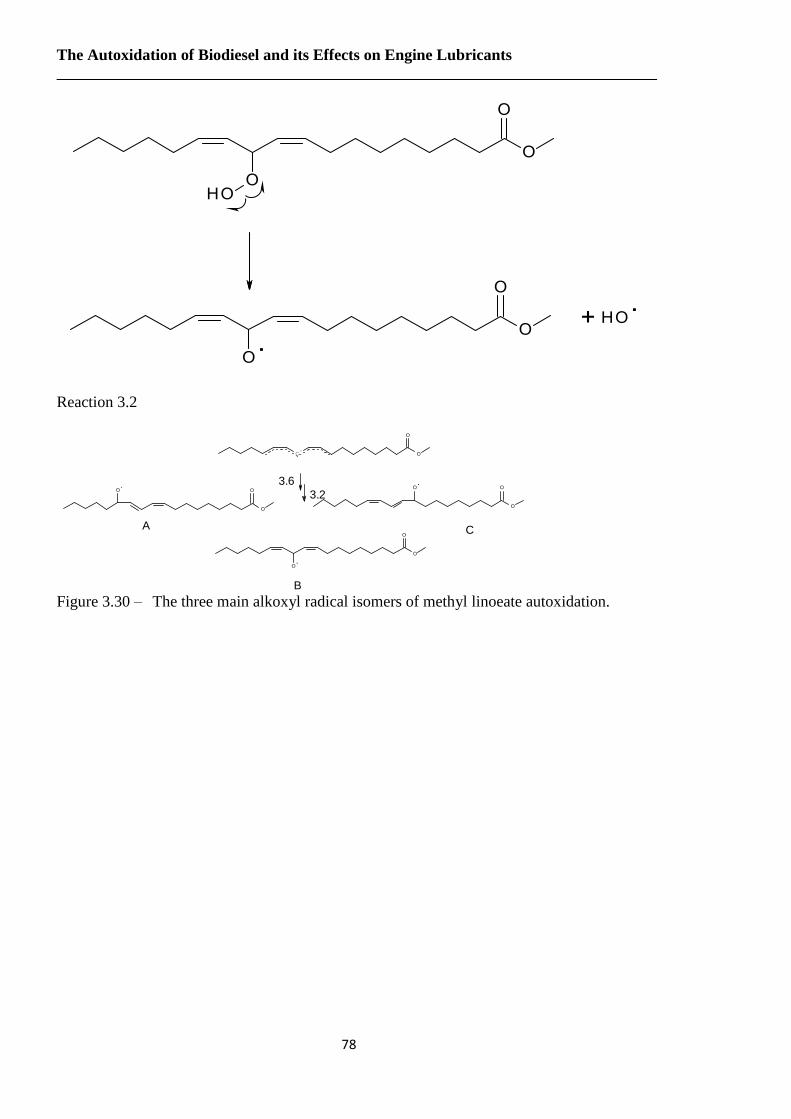
The Autoxidation of Biodiesel and its Effects on Engine Lubricants
78
Reaction 3.2
3.6
3.2
A
B
C
Figure 3.30 – The three main alkoxyl radical isomers of methyl linoeate autoxidation.
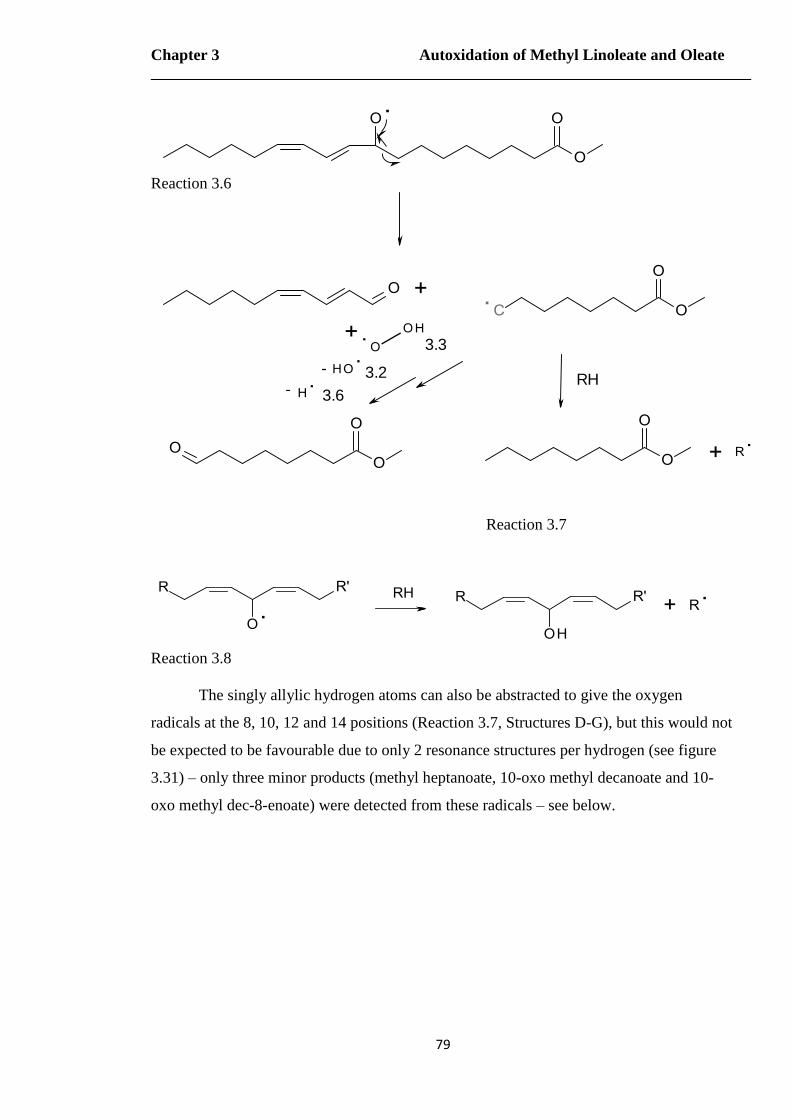
Chapter 3 Autoxidation of Methyl Linoleate and Oleate
79
Reaction 3.6
3.3
- 3.2- 3.6
RH
Reaction 3.7
Reaction 3.8
The singly allylic hydrogen atoms can also be abstracted to give the oxygen
radicals at the 8, 10, 12 and 14 positions (Reaction 3.7, Structures D-G), but this would not
be expected to be favourable due to only 2 resonance structures per hydrogen (see figure
3.31) – only three minor products (methyl heptanoate, 10-oxo methyl decanoate and 10-
oxo methyl dec-8-enoate) were detected from these radicals – see below.
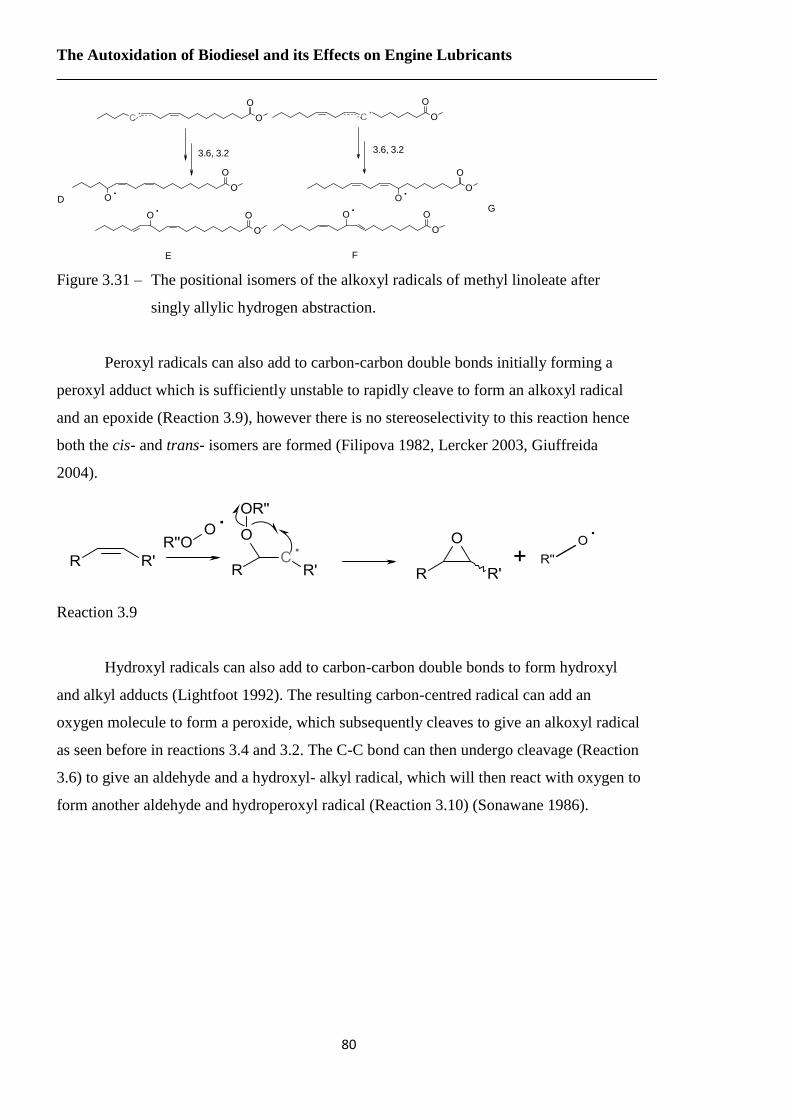
The Autoxidation of Biodiesel and its Effects on Engine Lubricants
80
3.6, 3.2 3.6, 3.2
D
E F
G
Figure 3.31 – The positional isomers of the alkoxyl radicals of methyl linoleate after
singly allylic hydrogen abstraction.
Peroxyl radicals can also add to carbon-carbon double bonds initially forming a
peroxyl adduct which is sufficiently unstable to rapidly cleave to form an alkoxyl radical
and an epoxide (Reaction 3.9), however there is no stereoselectivity to this reaction hence
both the cis- and trans- isomers are formed (Filipova 1982, Lercker 2003, Giuffreida
2004).
Reaction 3.9
Hydroxyl radicals can also add to carbon-carbon double bonds to form hydroxyl
and alkyl adducts (Lightfoot 1992). The resulting carbon-centred radical can add an
oxygen molecule to form a peroxide, which subsequently cleaves to give an alkoxyl radical
as seen before in reactions 3.4 and 3.2. The C-C bond can then undergo cleavage (Reaction
3.6) to give an aldehyde and a hydroxyl- alkyl radical, which will then react with oxygen to
form another aldehyde and hydroperoxyl radical (Reaction 3.10) (Sonawane 1986).
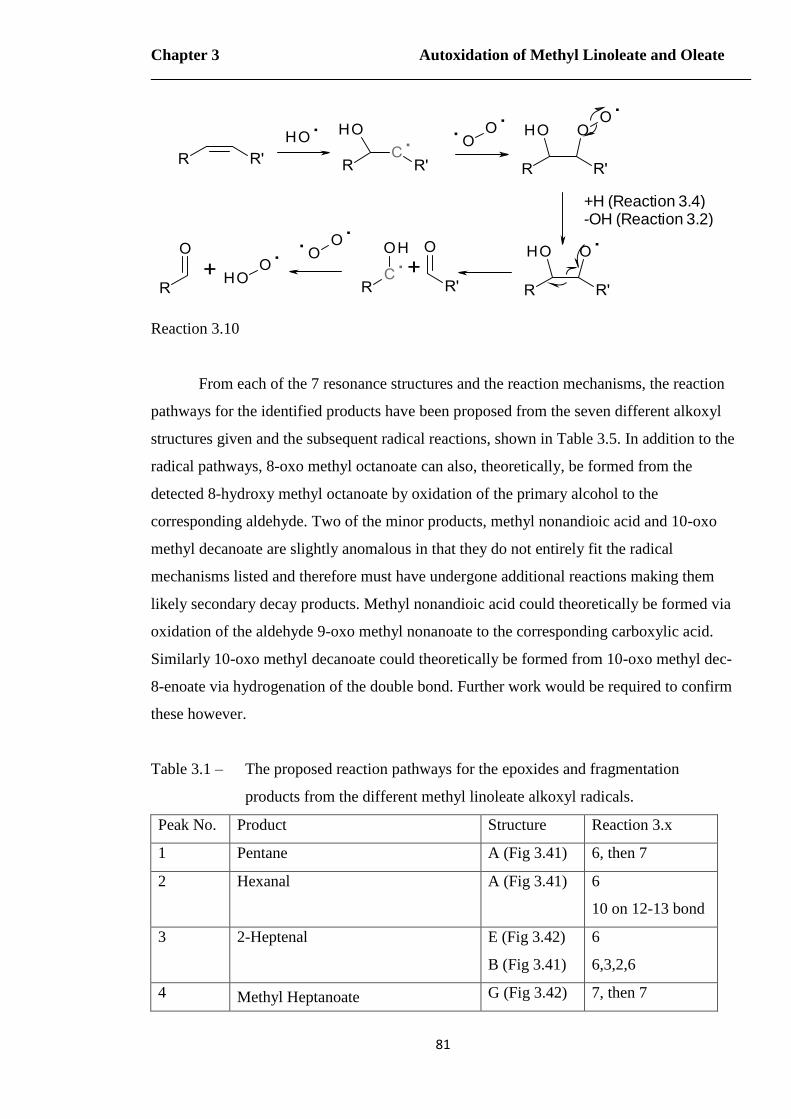
Chapter 3 Autoxidation of Methyl Linoleate and Oleate
81
+H (Reaction 3.4)-OH (Reaction 3.2)
Reaction 3.10
From each of the 7 resonance structures and the reaction mechanisms, the reaction
pathways for the identified products have been proposed from the seven different alkoxyl
structures given and the subsequent radical reactions, shown in Table 3.5. In addition to the
radical pathways, 8-oxo methyl octanoate can also, theoretically, be formed from the
detected 8-hydroxy methyl octanoate by oxidation of the primary alcohol to the
corresponding aldehyde. Two of the minor products, methyl nonandioic acid and 10-oxo
methyl decanoate are slightly anomalous in that they do not entirely fit the radical
mechanisms listed and therefore must have undergone additional reactions making them
likely secondary decay products. Methyl nonandioic acid could theoretically be formed via
oxidation of the aldehyde 9-oxo methyl nonanoate to the corresponding carboxylic acid.
Similarly 10-oxo methyl decanoate could theoretically be formed from 10-oxo methyl dec-
8-enoate via hydrogenation of the double bond. Further work would be required to confirm
these however.
Table 3.1 – The proposed reaction pathways for the epoxides and fragmentation
products from the different methyl linoleate alkoxyl radicals.
Peak No. Product Structure Reaction 3.x
1 Pentane A (Fig 3.41) 6, then 7
2 Hexanal A (Fig 3.41) 6
10 on 12-13 bond
3 2-Heptenal E (Fig 3.42)
B (Fig 3.41)
6
6,3,2,6
4 Methyl Heptanoate G (Fig 3.42) 7, then 7
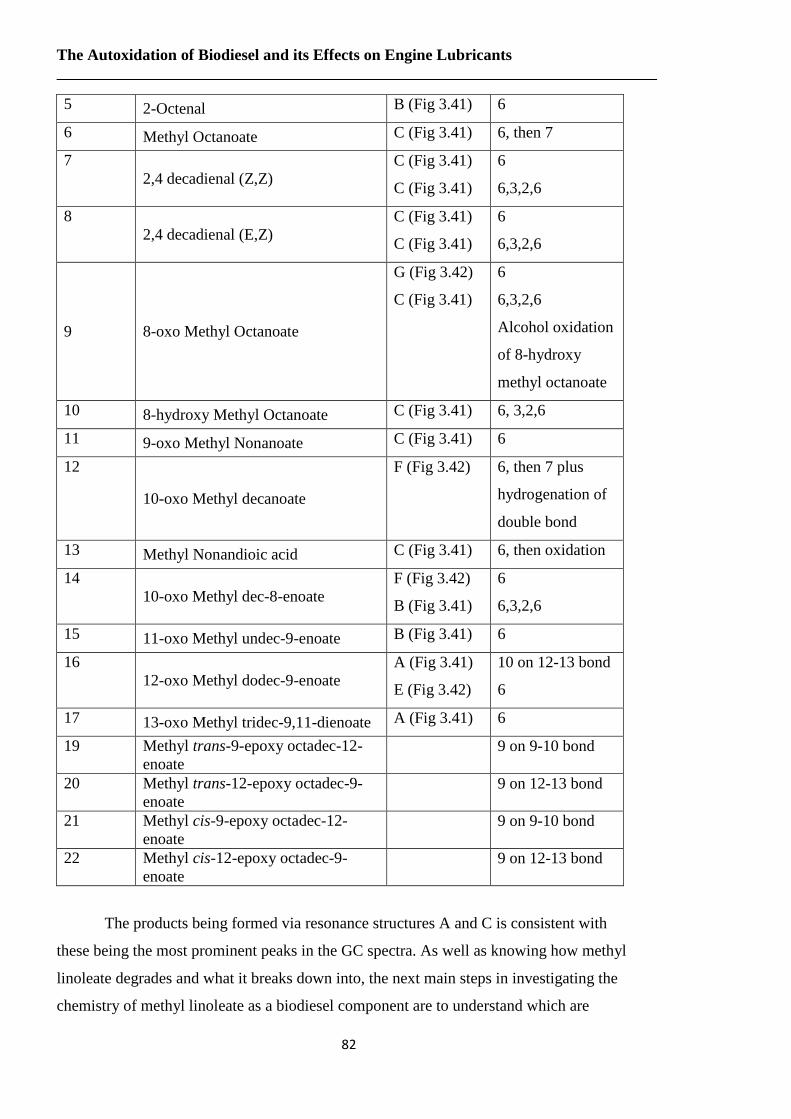
The Autoxidation of Biodiesel and its Effects on Engine Lubricants
82
5 2-Octenal B (Fig 3.41) 6
6 Methyl Octanoate C (Fig 3.41) 6, then 7
7
2,4 decadienal (Z,Z)
C (Fig 3.41)
C (Fig 3.41)
6
6,3,2,6
8
2,4 decadienal (E,Z)
C (Fig 3.41)
C (Fig 3.41)
6
6,3,2,6
9 8-oxo Methyl Octanoate
G (Fig 3.42)
C (Fig 3.41)
6
6,3,2,6
Alcohol oxidation
of 8-hydroxy
methyl octanoate
10 8-hydroxy Methyl Octanoate C (Fig 3.41) 6, 3,2,6
11 9-oxo Methyl Nonanoate C (Fig 3.41) 6
12
10-oxo Methyl decanoate
F (Fig 3.42) 6, then 7 plus
hydrogenation of
double bond
13 Methyl Nonandioic acid C (Fig 3.41) 6, then oxidation
14
10-oxo Methyl dec-8-enoate
F (Fig 3.42)
B (Fig 3.41)
6
6,3,2,6
15 11-oxo Methyl undec-9-enoate B (Fig 3.41) 6
16
12-oxo Methyl dodec-9-enoate
A (Fig 3.41)
E (Fig 3.42)
10 on 12-13 bond
6
17 13-oxo Methyl tridec-9,11-dienoate A (Fig 3.41) 6
19 Methyl trans-9-epoxy octadec-12-
enoate
9 on 9-10 bond
20 Methyl trans-12-epoxy octadec-9-
enoate
9 on 12-13 bond
21 Methyl cis-9-epoxy octadec-12-
enoate
9 on 9-10 bond
22 Methyl cis-12-epoxy octadec-9-
enoate
9 on 12-13 bond
The products being formed via resonance structures A and C is consistent with
these being the most prominent peaks in the GC spectra. As well as knowing how methyl
linoleate degrades and what it breaks down into, the next main steps in investigating the
chemistry of methyl linoleate as a biodiesel component are to understand which are
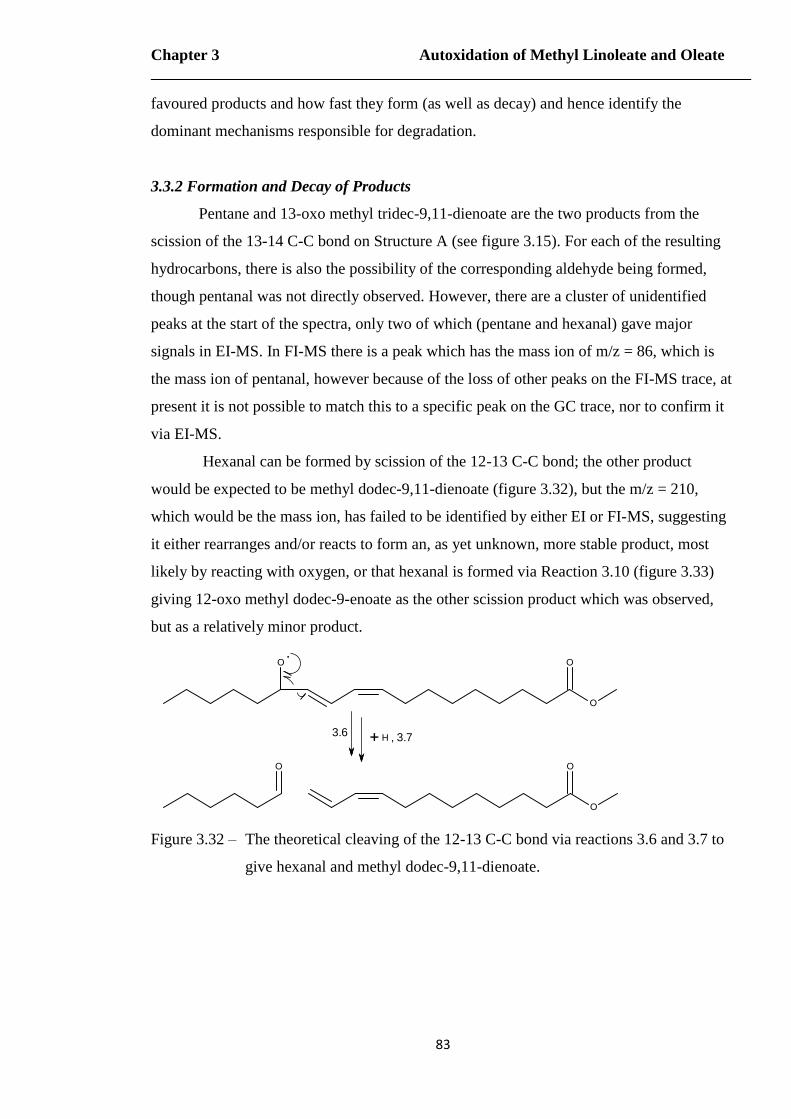
Chapter 3 Autoxidation of Methyl Linoleate and Oleate
83
favoured products and how fast they form (as well as decay) and hence identify the
dominant mechanisms responsible for degradation.
3.3.2 Formation and Decay of Products
Pentane and 13-oxo methyl tridec-9,11-dienoate are the two products from the
scission of the 13-14 C-C bond on Structure A (see figure 3.15). For each of the resulting
hydrocarbons, there is also the possibility of the corresponding aldehyde being formed,
though pentanal was not directly observed. However, there are a cluster of unidentified
peaks at the start of the spectra, only two of which (pentane and hexanal) gave major
signals in EI-MS. In FI-MS there is a peak which has the mass ion of m/z = 86, which is
the mass ion of pentanal, however because of the loss of other peaks on the FI-MS trace, at
present it is not possible to match this to a specific peak on the GC trace, nor to confirm it
via EI-MS.
Hexanal can be formed by scission of the 12-13 C-C bond; the other product
would be expected to be methyl dodec-9,11-dienoate (figure 3.32), but the m/z = 210,
which would be the mass ion, has failed to be identified by either EI or FI-MS, suggesting
it either rearranges and/or reacts to form an, as yet unknown, more stable product, most
likely by reacting with oxygen, or that hexanal is formed via Reaction 3.10 (figure 3.33)
giving 12-oxo methyl dodec-9-enoate as the other scission product which was observed,
but as a relatively minor product.
3.6 , 3.7
Figure 3.32 – The theoretical cleaving of the 12-13 C-C bond via reactions 3.6 and 3.7 to
give hexanal and methyl dodec-9,11-dienoate.
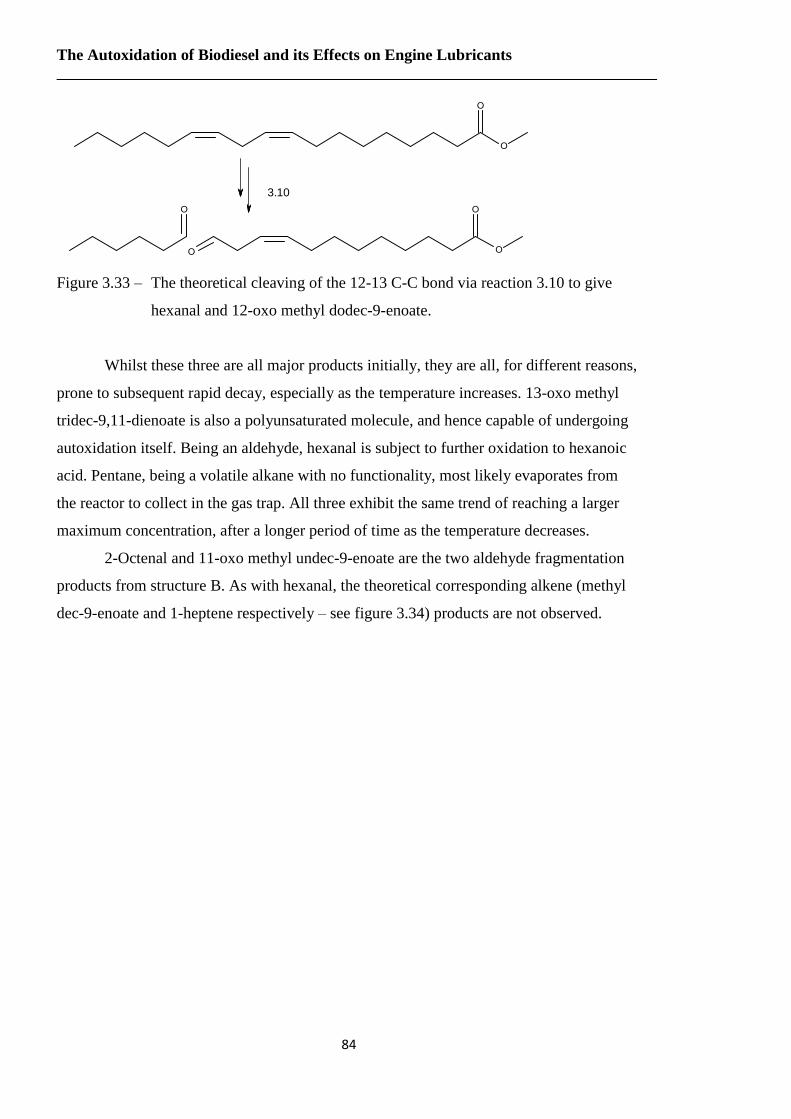
The Autoxidation of Biodiesel and its Effects on Engine Lubricants
84
3.10
Figure 3.33 – The theoretical cleaving of the 12-13 C-C bond via reaction 3.10 to give
hexanal and 12-oxo methyl dodec-9-enoate.
Whilst these three are all major products initially, they are all, for different reasons,
prone to subsequent rapid decay, especially as the temperature increases. 13-oxo methyl
tridec-9,11-dienoate is also a polyunsaturated molecule, and hence capable of undergoing
autoxidation itself. Being an aldehyde, hexanal is subject to further oxidation to hexanoic
acid. Pentane, being a volatile alkane with no functionality, most likely evaporates from
the reactor to collect in the gas trap. All three exhibit the same trend of reaching a larger
maximum concentration, after a longer period of time as the temperature decreases.
2-Octenal and 11-oxo methyl undec-9-enoate are the two aldehyde fragmentation
products from structure B. As with hexanal, the theoretical corresponding alkene (methyl
dec-9-enoate and 1-heptene respectively – see figure 3.34) products are not observed.
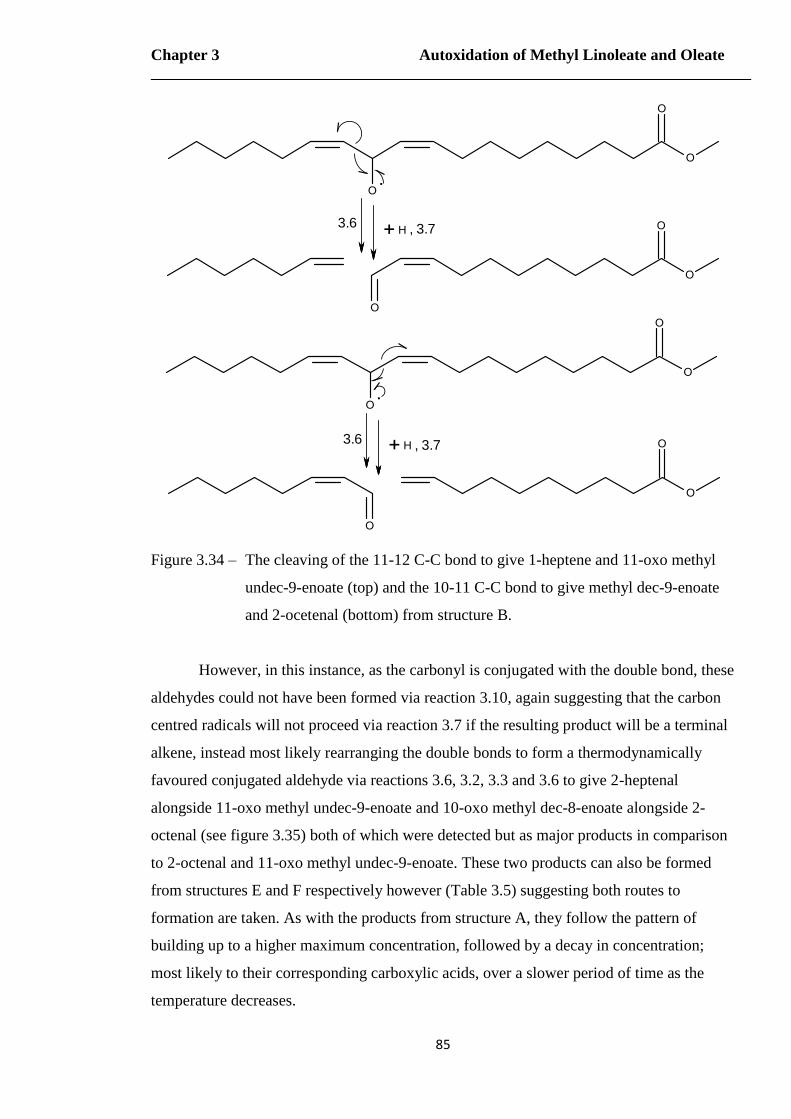
Chapter 3 Autoxidation of Methyl Linoleate and Oleate
85
3.6
3.6
, 3.7
, 3.7
Figure 3.34 – The cleaving of the 11-12 C-C bond to give 1-heptene and 11-oxo methyl
undec-9-enoate (top) and the 10-11 C-C bond to give methyl dec-9-enoate
and 2-ocetenal (bottom) from structure B.
However, in this instance, as the carbonyl is conjugated with the double bond, these
aldehydes could not have been formed via reaction 3.10, again suggesting that the carbon
centred radicals will not proceed via reaction 3.7 if the resulting product will be a terminal
alkene, instead most likely rearranging the double bonds to form a thermodynamically
favoured conjugated aldehyde via reactions 3.6, 3.2, 3.3 and 3.6 to give 2-heptenal
alongside 11-oxo methyl undec-9-enoate and 10-oxo methyl dec-8-enoate alongside 2-
octenal (see figure 3.35) both of which were detected but as major products in comparison
to 2-octenal and 11-oxo methyl undec-9-enoate. These two products can also be formed
from structures E and F respectively however (Table 3.5) suggesting both routes to
formation are taken. As with the products from structure A, they follow the pattern of
building up to a higher maximum concentration, followed by a decay in concentration;
most likely to their corresponding carboxylic acids, over a slower period of time as the
temperature decreases.
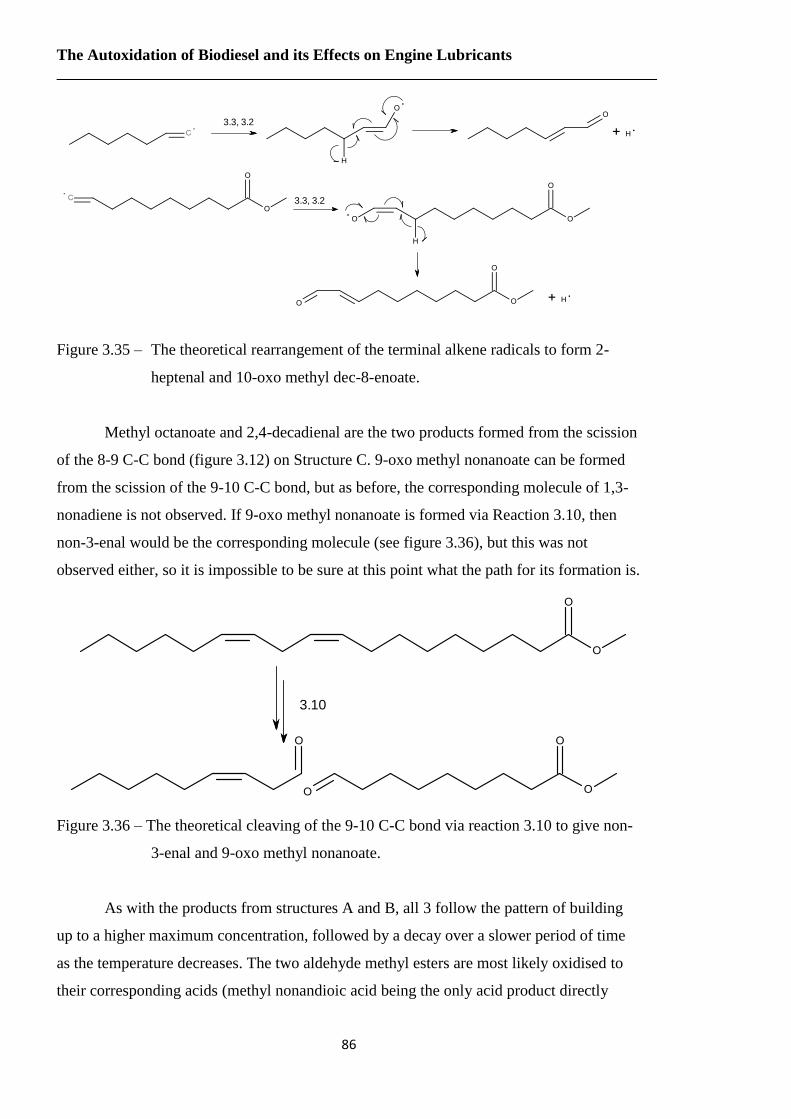
The Autoxidation of Biodiesel and its Effects on Engine Lubricants
86
3.3, 3.2
3.3, 3.2
Figure 3.35 – The theoretical rearrangement of the terminal alkene radicals to form 2-
heptenal and 10-oxo methyl dec-8-enoate.
Methyl octanoate and 2,4-decadienal are the two products formed from the scission
of the 8-9 C-C bond (figure 3.12) on Structure C. 9-oxo methyl nonanoate can be formed
from the scission of the 9-10 C-C bond, but as before, the corresponding molecule of 1,3-
nonadiene is not observed. If 9-oxo methyl nonanoate is formed via Reaction 3.10, then
non-3-enal would be the corresponding molecule (see figure 3.36), but this was not
observed either, so it is impossible to be sure at this point what the path for its formation is.
3.10
Figure 3.36 – The theoretical cleaving of the 9-10 C-C bond via reaction 3.10 to give non-
3-enal and 9-oxo methyl nonanoate.
As with the products from structures A and B, all 3 follow the pattern of building
up to a higher maximum concentration, followed by a decay over a slower period of time
as the temperature decreases. The two aldehyde methyl esters are most likely oxidised to
their corresponding acids (methyl nonandioic acid being the only acid product directly
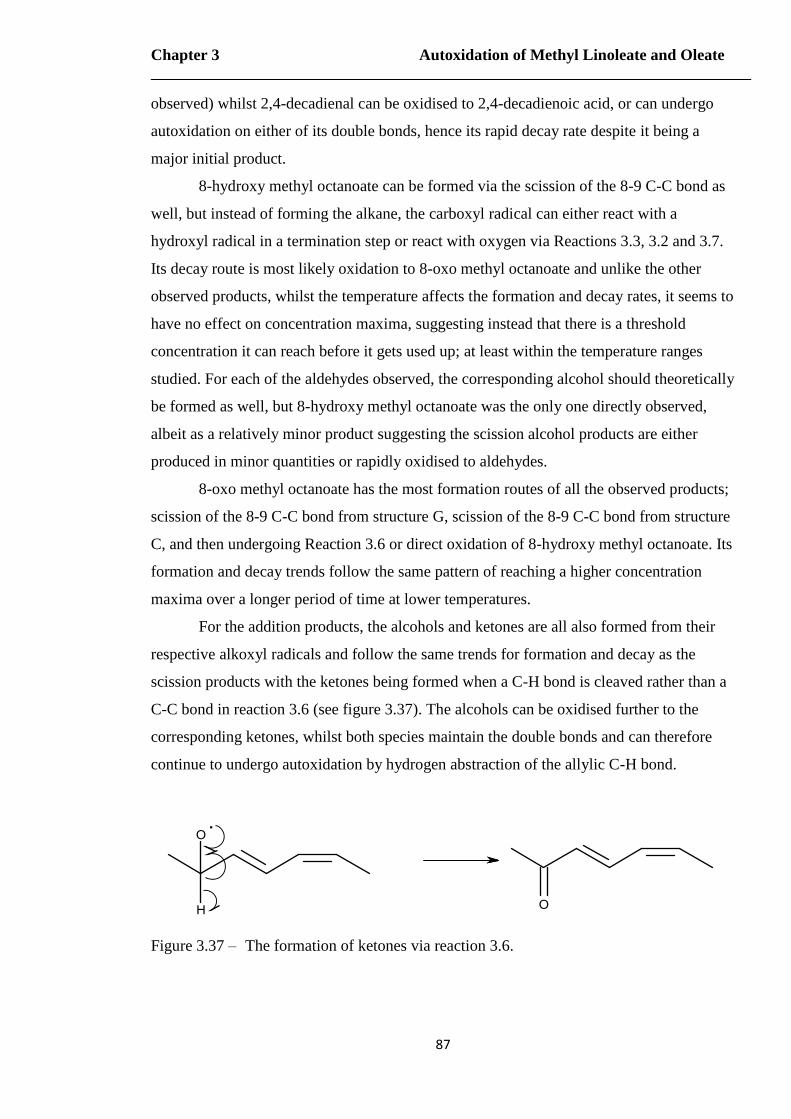
Chapter 3 Autoxidation of Methyl Linoleate and Oleate
87
observed) whilst 2,4-decadienal can be oxidised to 2,4-decadienoic acid, or can undergo
autoxidation on either of its double bonds, hence its rapid decay rate despite it being a
major initial product.
8-hydroxy methyl octanoate can be formed via the scission of the 8-9 C-C bond as
well, but instead of forming the alkane, the carboxyl radical can either react with a
hydroxyl radical in a termination step or react with oxygen via Reactions 3.3, 3.2 and 3.7.
Its decay route is most likely oxidation to 8-oxo methyl octanoate and unlike the other
observed products, whilst the temperature affects the formation and decay rates, it seems to
have no effect on concentration maxima, suggesting instead that there is a threshold
concentration it can reach before it gets used up; at least within the temperature ranges
studied. For each of the aldehydes observed, the corresponding alcohol should theoretically
be formed as well, but 8-hydroxy methyl octanoate was the only one directly observed,
albeit as a relatively minor product suggesting the scission alcohol products are either
produced in minor quantities or rapidly oxidised to aldehydes.
8-oxo methyl octanoate has the most formation routes of all the observed products;
scission of the 8-9 C-C bond from structure G, scission of the 8-9 C-C bond from structure
C, and then undergoing Reaction 3.6 or direct oxidation of 8-hydroxy methyl octanoate. Its
formation and decay trends follow the same pattern of reaching a higher concentration
maxima over a longer period of time at lower temperatures.
For the addition products, the alcohols and ketones are all also formed from their
respective alkoxyl radicals and follow the same trends for formation and decay as the
scission products with the ketones being formed when a C-H bond is cleaved rather than a
C-C bond in reaction 3.6 (see figure 3.37). The alcohols can be oxidised further to the
corresponding ketones, whilst both species maintain the double bonds and can therefore
continue to undergo autoxidation by hydrogen abstraction of the allylic C-H bond.
Figure 3.37 – The formation of ketones via reaction 3.6.

The Autoxidation of Biodiesel and its Effects on Engine Lubricants
88
The dehydrodimer, unlike the other species, is not derived from an alkoxyl radical,
but is instead formed via a termination reaction between two ML radicals. Nevertheless,
the first step to their formation is still hydrogen abstraction. As the dimer was undetected
in the flow oxidation reactions, it is impossible to examine its formation or decay patterns,
though it does suggest it is short-lived which would be expected as the species would
theoretically now possess a C-H bond that is not only allylic but tertiary as well (see figure
3.38).
Figure 3.38 – The theoretical allylic and tertiary C-H bond of the methyl linoleate
dehydrodimer; positional isomer arbitrarily assigned.
The epoxides are all formed via Reaction 3.10 over the double bonds. As there is
no control over the stereochemistry of the epoxides, each double bond will form two
isomers, cis- and trans-. Whilst formation and decay still happens more slowly at lower
temperatures, the key difference between the epoxides and the scission products, alcohols
and ketones is that the concentration maxima is higher at higher temperatures.
3.3.3 Dominant Mechanisms of Degradation
Whilst there are a variety of different products from methyl linoleate (and methyl
oleate) degradation, they all come from just two main pathways. The scission products,
alcohols and ketones are all formed by the initial reaction of hydrogen abstraction from an
allylic, or doubly allylic C-H bond, whereas epoxides are formed over the C=C bonds. At
all temperatures the epoxides were noted to be the major products, yet products from the
hydroperoxide route were more numerous hence at first glance it is not straightforward to
identify the dominant autoxidation mechanisms. Figure 3.39 shows the combined
concentrations of all products formed by both epoxidation (C=C reaction) and
hydroperoxide (C-H scission) at all temperatures. This reflects the trends seen in the graphs
for the individual products; product build up followed by decay, with the hydroperoxide
products increasing in maximum concentration with temperature, whilst the epoxides
decrease in concentration as the temperature rises.
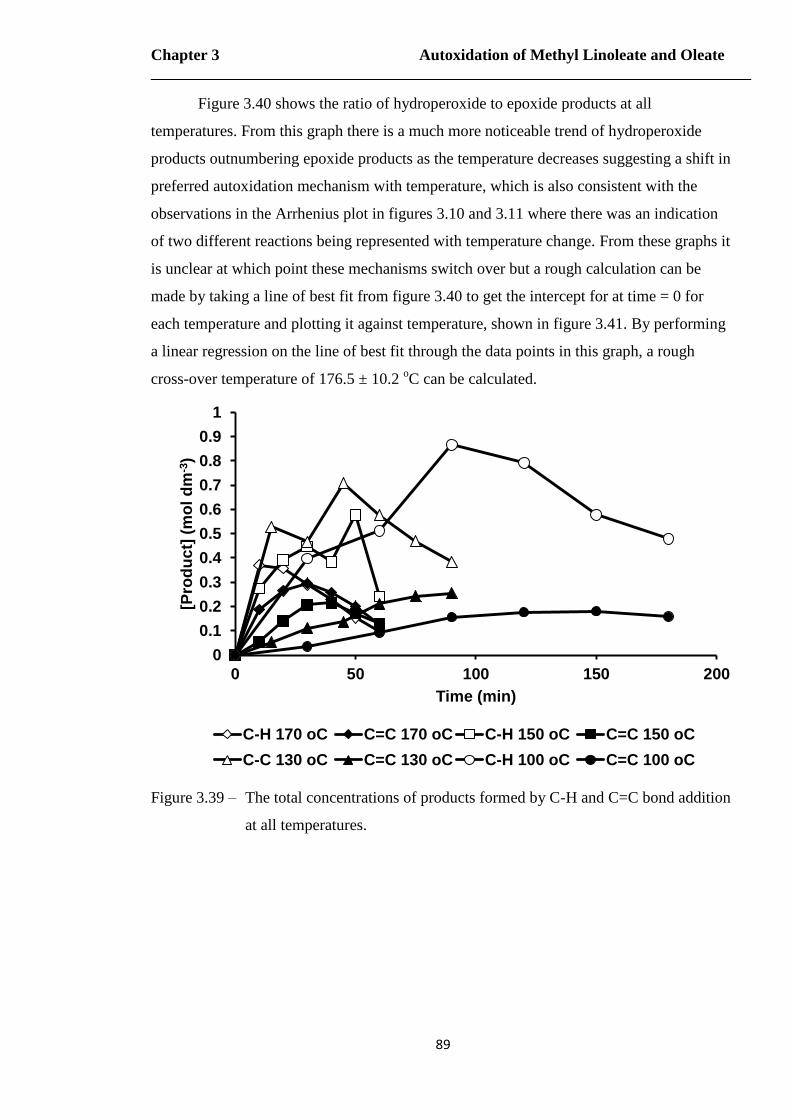
Chapter 3 Autoxidation of Methyl Linoleate and Oleate
89
Figure 3.40 shows the ratio of hydroperoxide to epoxide products at all
temperatures. From this graph there is a much more noticeable trend of hydroperoxide
products outnumbering epoxide products as the temperature decreases suggesting a shift in
preferred autoxidation mechanism with temperature, which is also consistent with the
observations in the Arrhenius plot in figures 3.10 and 3.11 where there was an indication
of two different reactions being represented with temperature change. From these graphs it
is unclear at which point these mechanisms switch over but a rough calculation can be
made by taking a line of best fit from figure 3.40 to get the intercept for at time = 0 for
each temperature and plotting it against temperature, shown in figure 3.41. By performing
a linear regression on the line of best fit through the data points in this graph, a rough
cross-over temperature of 176.5 ± 10.2 oC can be calculated.
Figure 3.39 – The total concentrations of products formed by C-H and C=C bond addition
at all temperatures.
0
0.1
0.2
0.3
0.4
0.5
0.6
0.7
0.8
0.9
1
0 50 100 150 200
[Pro
du
ct]
(m
ol
dm
-3)
Time (min)
C-H 170 oC C=C 170 oC C-H 150 oC C=C 150 oC
C-C 130 oC C=C 130 oC C-H 100 oC C=C 100 oC
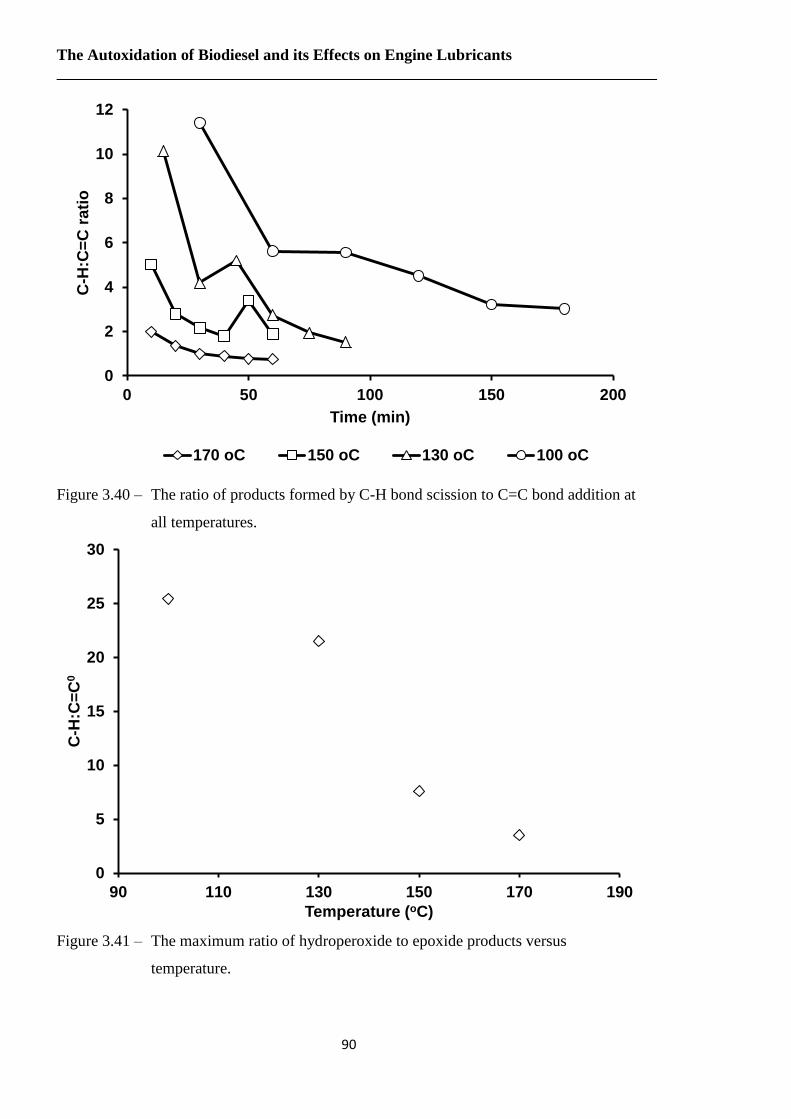
The Autoxidation of Biodiesel and its Effects on Engine Lubricants
90
Figure 3.40 – The ratio of products formed by C-H bond scission to C=C bond addition at
all temperatures.
Figure 3.41 – The maximum ratio of hydroperoxide to epoxide products versus
temperature.
0
2
4
6
8
10
12
0 50 100 150 200
C-H
:C=
C r
ati
o
Time (min)
170 oC 150 oC 130 oC 100 oC
0
5
10
15
20
25
30
90 110 130 150 170 190
C-H
:C=
C0
Temperature (oC)
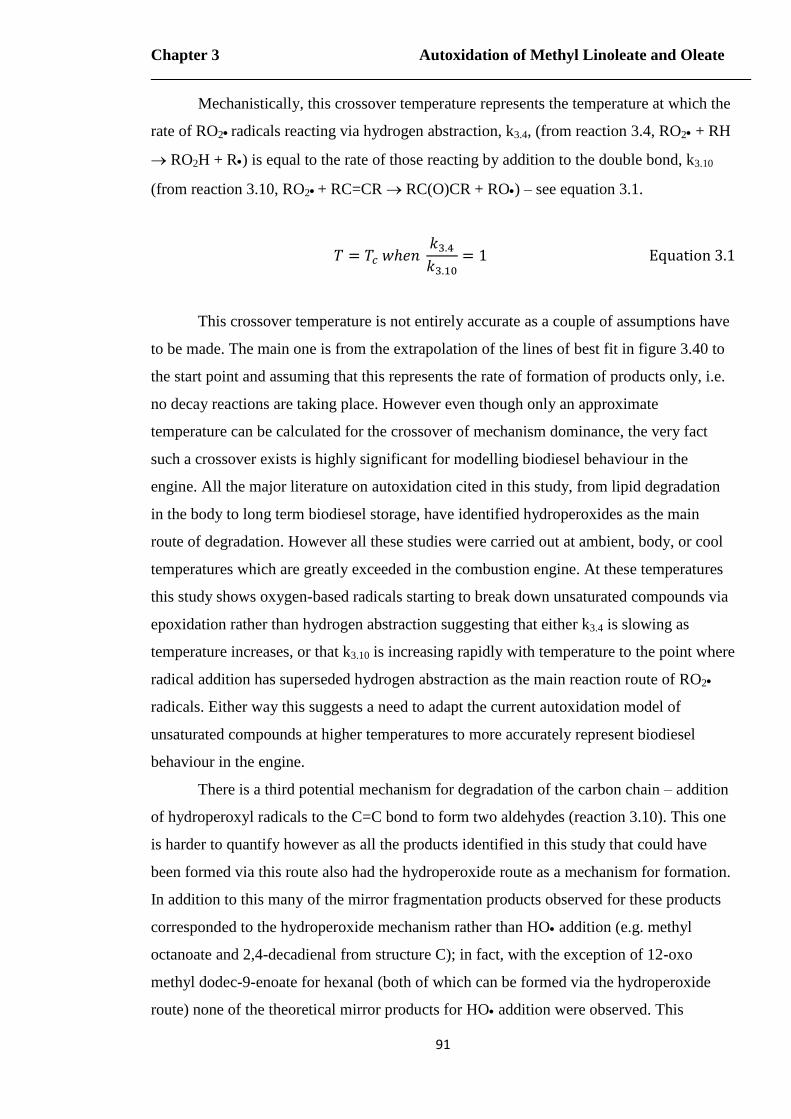
Chapter 3 Autoxidation of Methyl Linoleate and Oleate
91
Mechanistically, this crossover temperature represents the temperature at which the
rate of RO2 radicals reacting via hydrogen abstraction, k3.4, (from reaction 3.4, RO2 + RH
RO2H + R) is equal to the rate of those reacting by addition to the double bond, k3.10
(from reaction 3.10, RO2 + RC=CR RC(O)CR + RO) – see equation 3.1.
This crossover temperature is not entirely accurate as a couple of assumptions have
to be made. The main one is from the extrapolation of the lines of best fit in figure 3.40 to
the start point and assuming that this represents the rate of formation of products only, i.e.
no decay reactions are taking place. However even though only an approximate
temperature can be calculated for the crossover of mechanism dominance, the very fact
such a crossover exists is highly significant for modelling biodiesel behaviour in the
engine. All the major literature on autoxidation cited in this study, from lipid degradation
in the body to long term biodiesel storage, have identified hydroperoxides as the main
route of degradation. However all these studies were carried out at ambient, body, or cool
temperatures which are greatly exceeded in the combustion engine. At these temperatures
this study shows oxygen-based radicals starting to break down unsaturated compounds via
epoxidation rather than hydrogen abstraction suggesting that either k3.4 is slowing as
temperature increases, or that k3.10 is increasing rapidly with temperature to the point where
radical addition has superseded hydrogen abstraction as the main reaction route of RO2
radicals. Either way this suggests a need to adapt the current autoxidation model of
unsaturated compounds at higher temperatures to more accurately represent biodiesel
behaviour in the engine.
There is a third potential mechanism for degradation of the carbon chain – addition
of hydroperoxyl radicals to the C=C bond to form two aldehydes (reaction 3.10). This one
is harder to quantify however as all the products identified in this study that could have
been formed via this route also had the hydroperoxide route as a mechanism for formation.
In addition to this many of the mirror fragmentation products observed for these products
corresponded to the hydroperoxide mechanism rather than HO addition (e.g. methyl
octanoate and 2,4-decadienal from structure C); in fact, with the exception of 12-oxo
methyl dodec-9-enoate for hexanal (both of which can be formed via the hydroperoxide
route) none of the theoretical mirror products for HO addition were observed. This
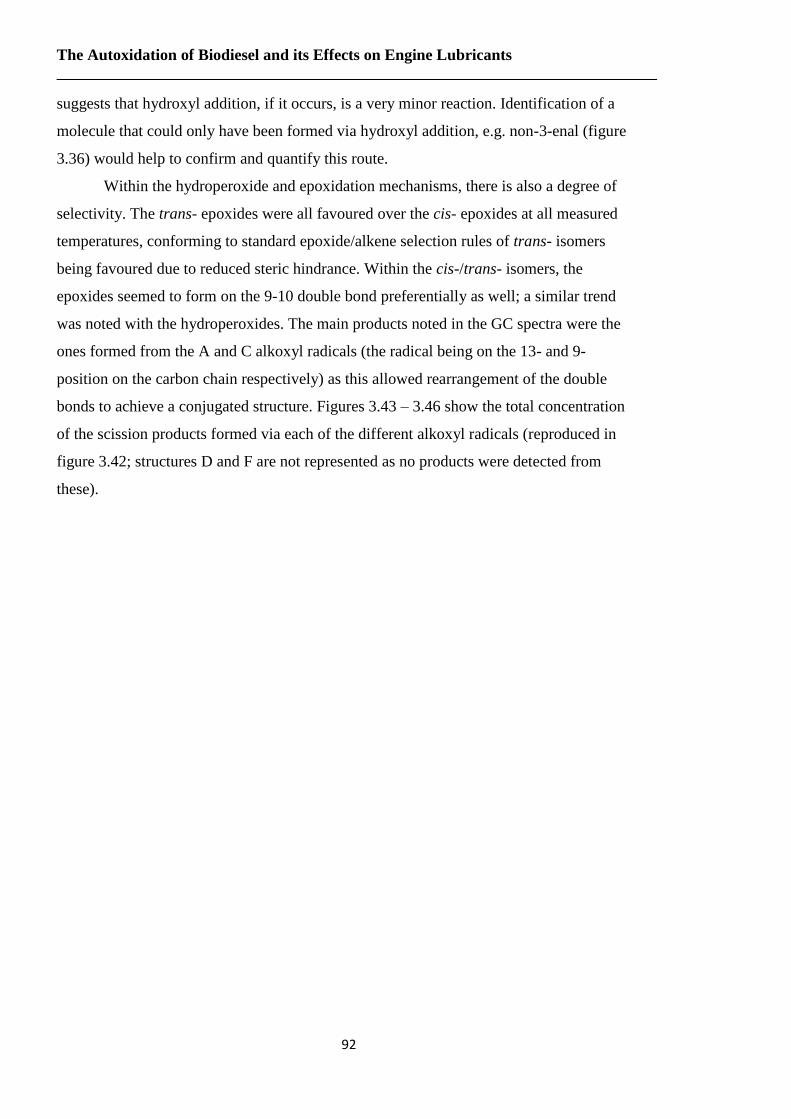
The Autoxidation of Biodiesel and its Effects on Engine Lubricants
92
suggests that hydroxyl addition, if it occurs, is a very minor reaction. Identification of a
molecule that could only have been formed via hydroxyl addition, e.g. non-3-enal (figure
3.36) would help to confirm and quantify this route.
Within the hydroperoxide and epoxidation mechanisms, there is also a degree of
selectivity. The trans- epoxides were all favoured over the cis- epoxides at all measured
temperatures, conforming to standard epoxide/alkene selection rules of trans- isomers
being favoured due to reduced steric hindrance. Within the cis-/trans- isomers, the
epoxides seemed to form on the 9-10 double bond preferentially as well; a similar trend
was noted with the hydroperoxides. The main products noted in the GC spectra were the
ones formed from the A and C alkoxyl radicals (the radical being on the 13- and 9-
position on the carbon chain respectively) as this allowed rearrangement of the double
bonds to achieve a conjugated structure. Figures 3.43 – 3.46 show the total concentration
of the scission products formed via each of the different alkoxyl radicals (reproduced in
figure 3.42; structures D and F are not represented as no products were detected from
these).
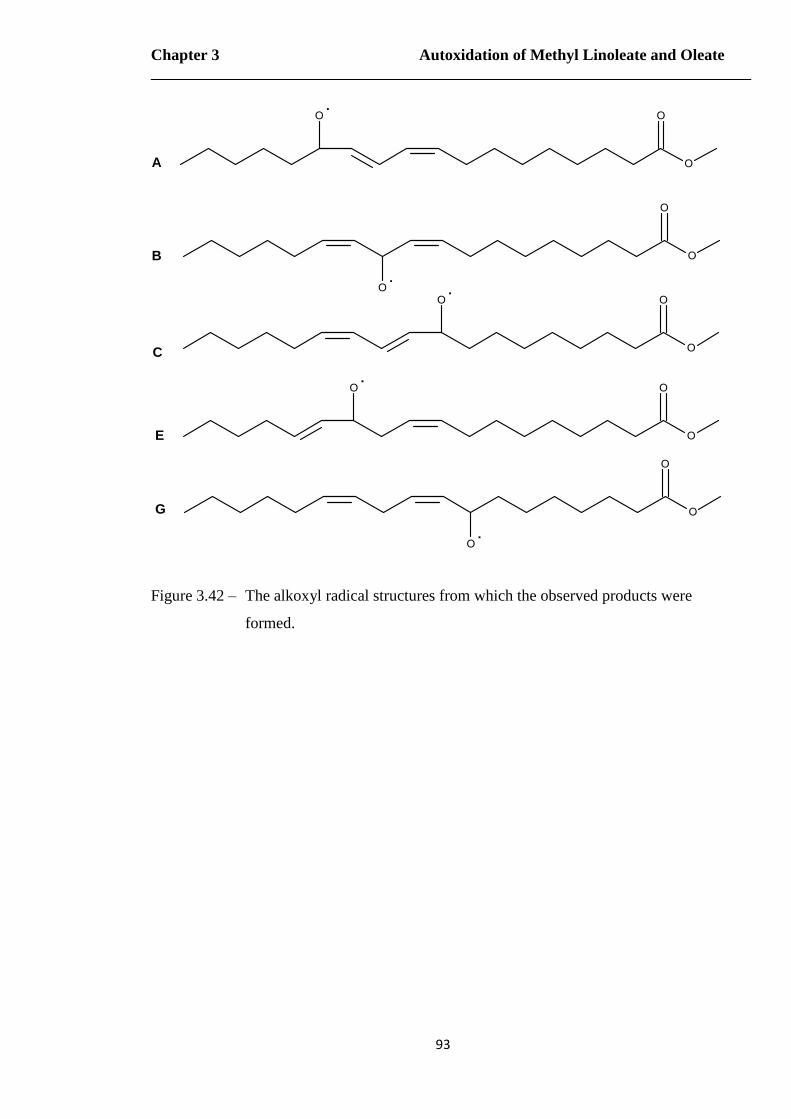
Chapter 3 Autoxidation of Methyl Linoleate and Oleate
93
A
B
C
E
G
Figure 3.42 – The alkoxyl radical structures from which the observed products were
formed.
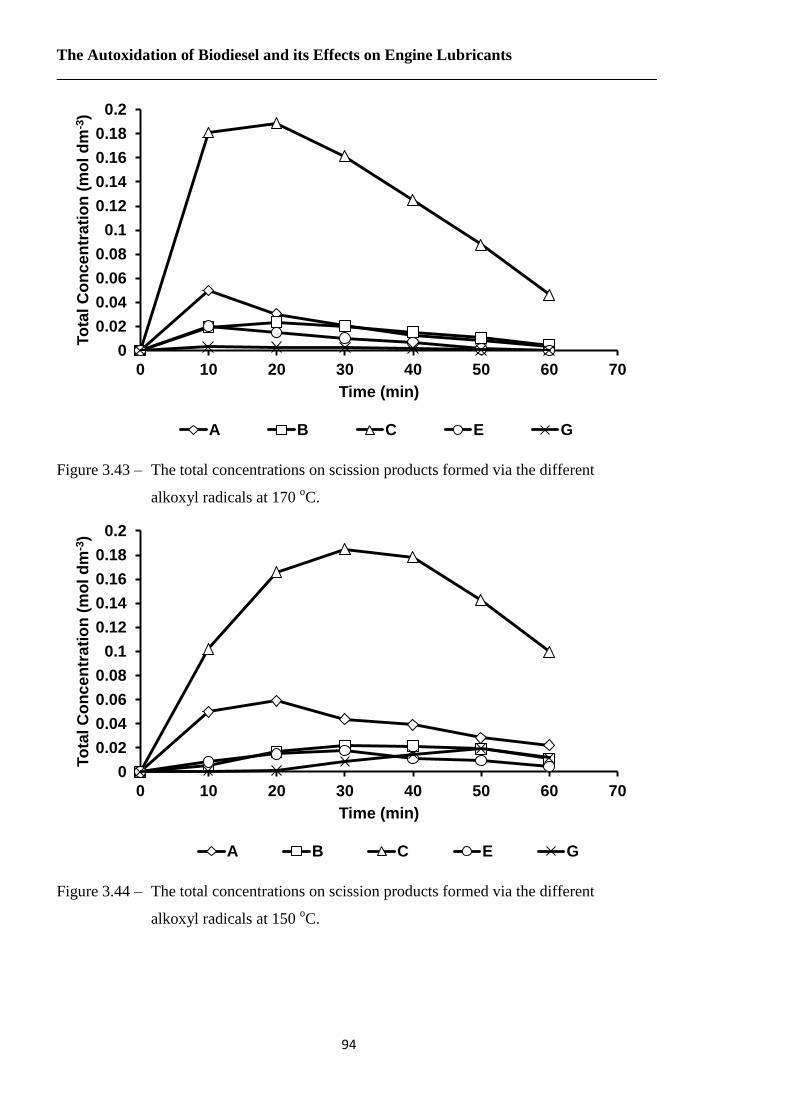
The Autoxidation of Biodiesel and its Effects on Engine Lubricants
94
Figure 3.43 – The total concentrations on scission products formed via the different
alkoxyl radicals at 170 oC.
Figure 3.44 – The total concentrations on scission products formed via the different
alkoxyl radicals at 150 oC.
0
0.02
0.04
0.06
0.08
0.1
0.12
0.14
0.16
0.18
0.2
0 10 20 30 40 50 60 70
To
tal C
on
ce
ntr
ati
on
(m
ol
dm
-3)
Time (min)
A B C E G
0
0.02
0.04
0.06
0.08
0.1
0.12
0.14
0.16
0.18
0.2
0 10 20 30 40 50 60 70
To
tal C
on
ce
ntr
ati
on
(m
ol
dm
-3)
Time (min)
A B C E G
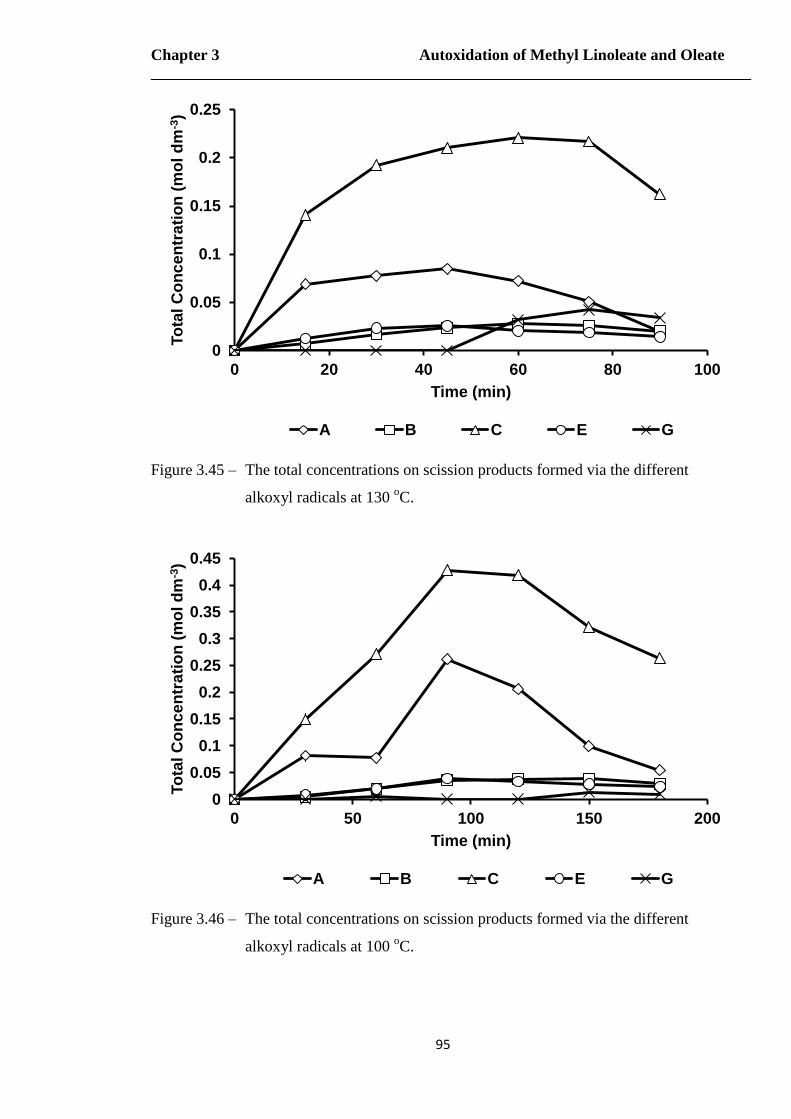
Chapter 3 Autoxidation of Methyl Linoleate and Oleate
95
Figure 3.45 – The total concentrations on scission products formed via the different
alkoxyl radicals at 130 oC.
Figure 3.46 – The total concentrations on scission products formed via the different
alkoxyl radicals at 100 oC.
0
0.05
0.1
0.15
0.2
0.25
0 20 40 60 80 100
To
tal C
on
ce
ntr
ati
on
(m
ol
dm
-3)
Time (min)
A B C E G
0
0.05
0.1
0.15
0.2
0.25
0.3
0.35
0.4
0.45
0 50 100 150 200
To
tal C
on
ce
ntr
ati
on
(m
ol
dm
-3)
Time (min)
A B C E G
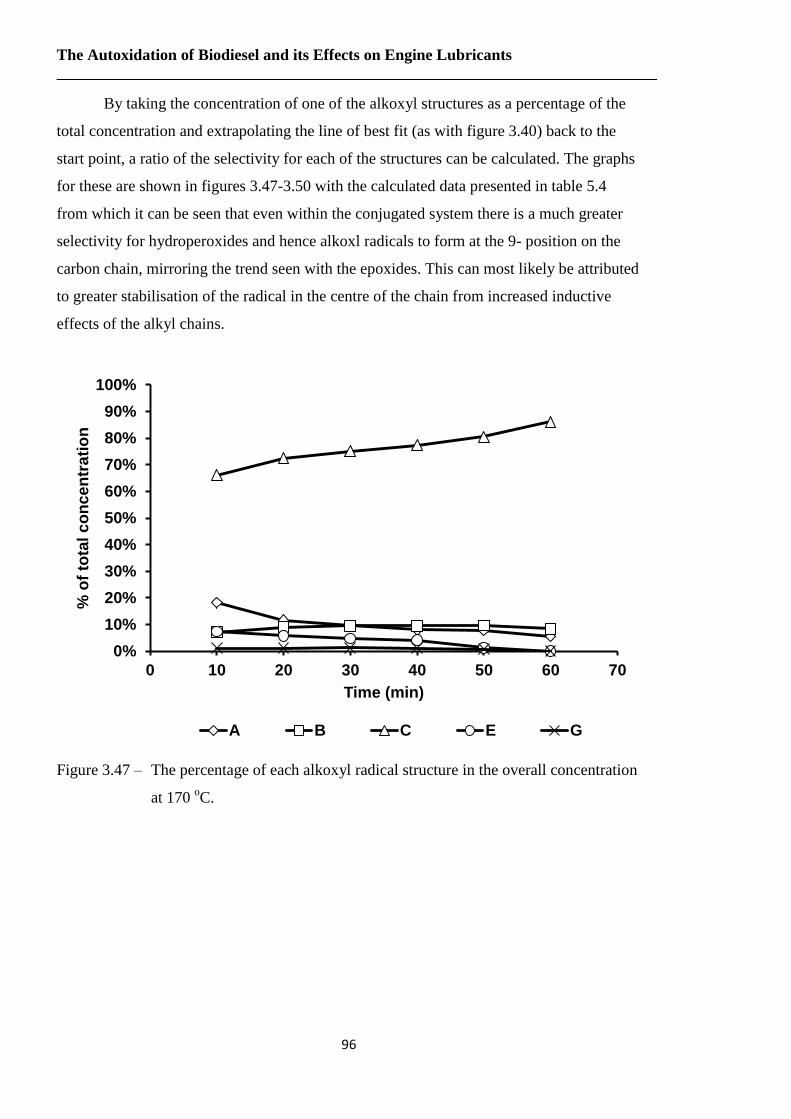
The Autoxidation of Biodiesel and its Effects on Engine Lubricants
96
By taking the concentration of one of the alkoxyl structures as a percentage of the
total concentration and extrapolating the line of best fit (as with figure 3.40) back to the
start point, a ratio of the selectivity for each of the structures can be calculated. The graphs
for these are shown in figures 3.47-3.50 with the calculated data presented in table 5.4
from which it can be seen that even within the conjugated system there is a much greater
selectivity for hydroperoxides and hence alkoxl radicals to form at the 9- position on the
carbon chain, mirroring the trend seen with the epoxides. This can most likely be attributed
to greater stabilisation of the radical in the centre of the chain from increased inductive
effects of the alkyl chains.
Figure 3.47 – The percentage of each alkoxyl radical structure in the overall concentration
at 170 oC.
0%
10%
20%
30%
40%
50%
60%
70%
80%
90%
100%
0 10 20 30 40 50 60 70
% o
f to
tal
co
nce
ntr
ati
on
Time (min)
A B C E G
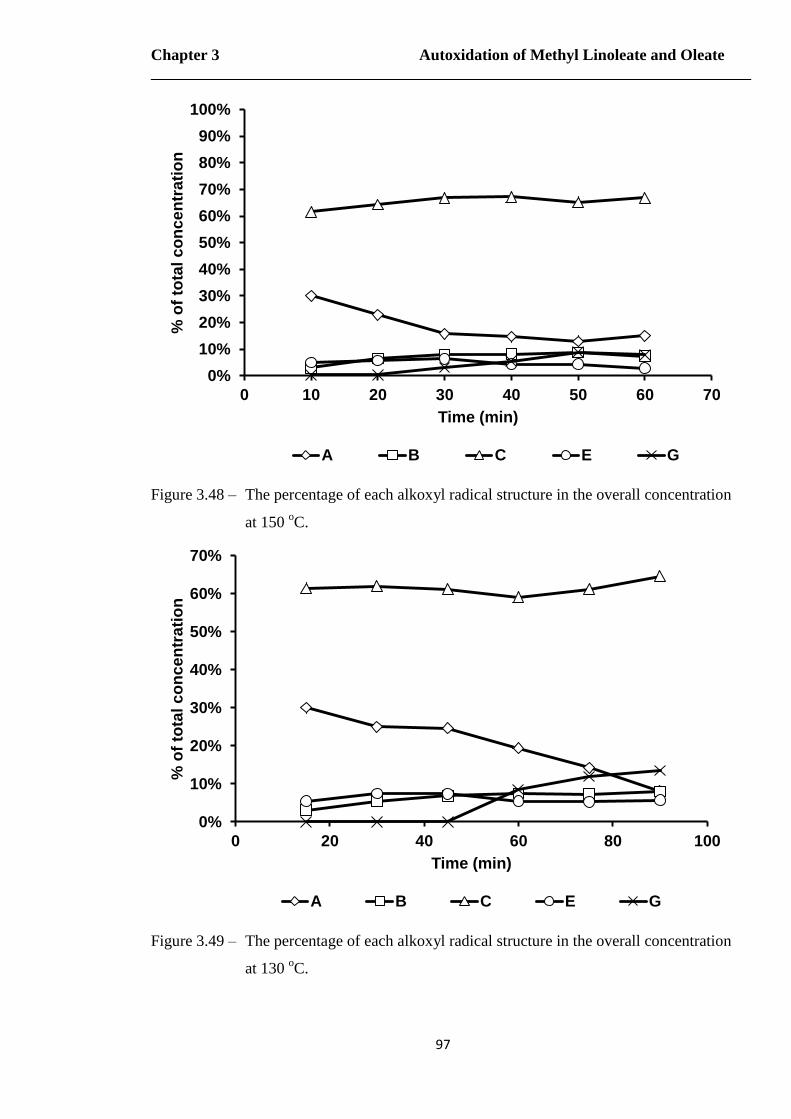
Chapter 3 Autoxidation of Methyl Linoleate and Oleate
97
Figure 3.48 – The percentage of each alkoxyl radical structure in the overall concentration
at 150 oC.
Figure 3.49 – The percentage of each alkoxyl radical structure in the overall concentration
at 130 oC.
0%
10%
20%
30%
40%
50%
60%
70%
80%
90%
100%
0 10 20 30 40 50 60 70
% o
f to
tal
co
nce
ntr
ati
on
Time (min)
A B C E G
0%
10%
20%
30%
40%
50%
60%
70%
0 20 40 60 80 100
% o
f to
tal
co
nce
ntr
ati
on
Time (min)
A B C E G
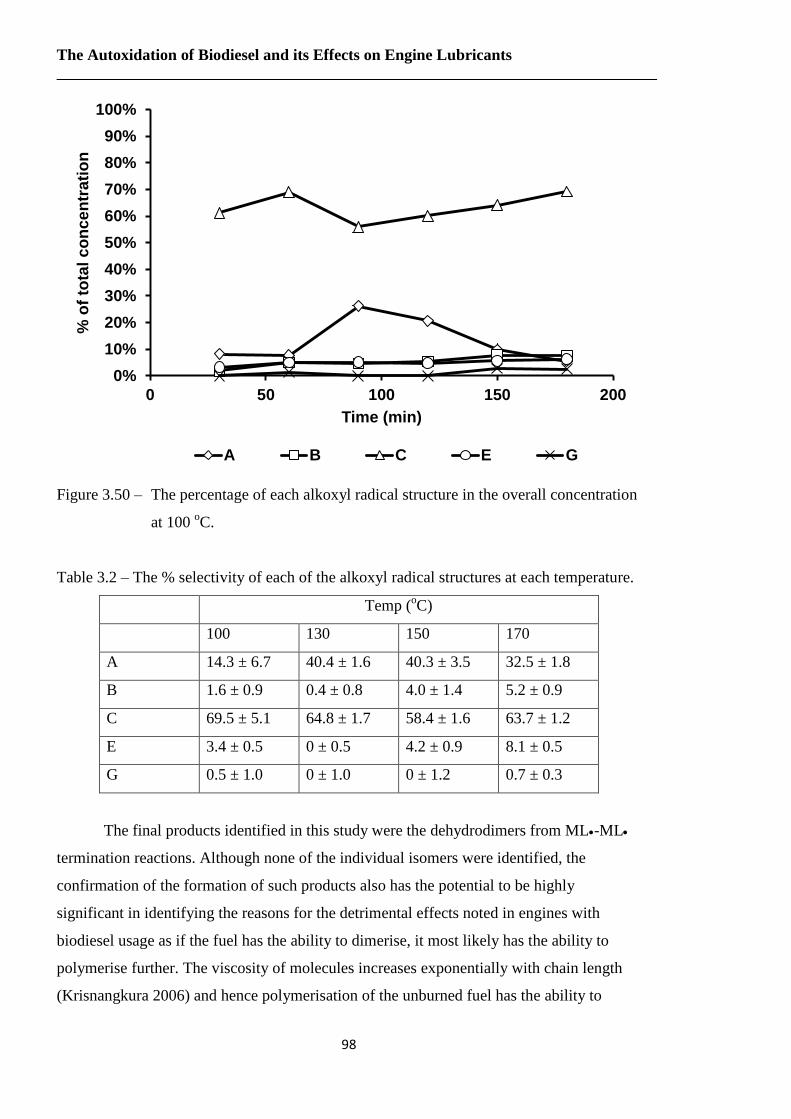
The Autoxidation of Biodiesel and its Effects on Engine Lubricants
98
Figure 3.50 – The percentage of each alkoxyl radical structure in the overall concentration
at 100 oC.
Table 3.2 – The % selectivity of each of the alkoxyl radical structures at each temperature.
Temp (oC)
100 130 150 170
A 14.3 ± 6.7 40.4 ± 1.6 40.3 ± 3.5 32.5 ± 1.8
B 1.6 ± 0.9 0.4 ± 0.8 4.0 ± 1.4 5.2 ± 0.9
C 69.5 ± 5.1 64.8 ± 1.7 58.4 ± 1.6 63.7 ± 1.2
E 3.4 ± 0.5 0 ± 0.5 4.2 ± 0.9 8.1 ± 0.5
G 0.5 ± 1.0 0 ± 1.0 0 ± 1.2 0.7 ± 0.3
The final products identified in this study were the dehydrodimers from ML-ML
termination reactions. Although none of the individual isomers were identified, the
confirmation of the formation of such products also has the potential to be highly
significant in identifying the reasons for the detrimental effects noted in engines with
biodiesel usage as if the fuel has the ability to dimerise, it most likely has the ability to
polymerise further. The viscosity of molecules increases exponentially with chain length
(Krisnangkura 2006) and hence polymerisation of the unburned fuel has the ability to
0%
10%
20%
30%
40%
50%
60%
70%
80%
90%
100%
0 50 100 150 200
% o
f to
tal
co
nce
ntr
ati
on
Time (min)
A B C E G
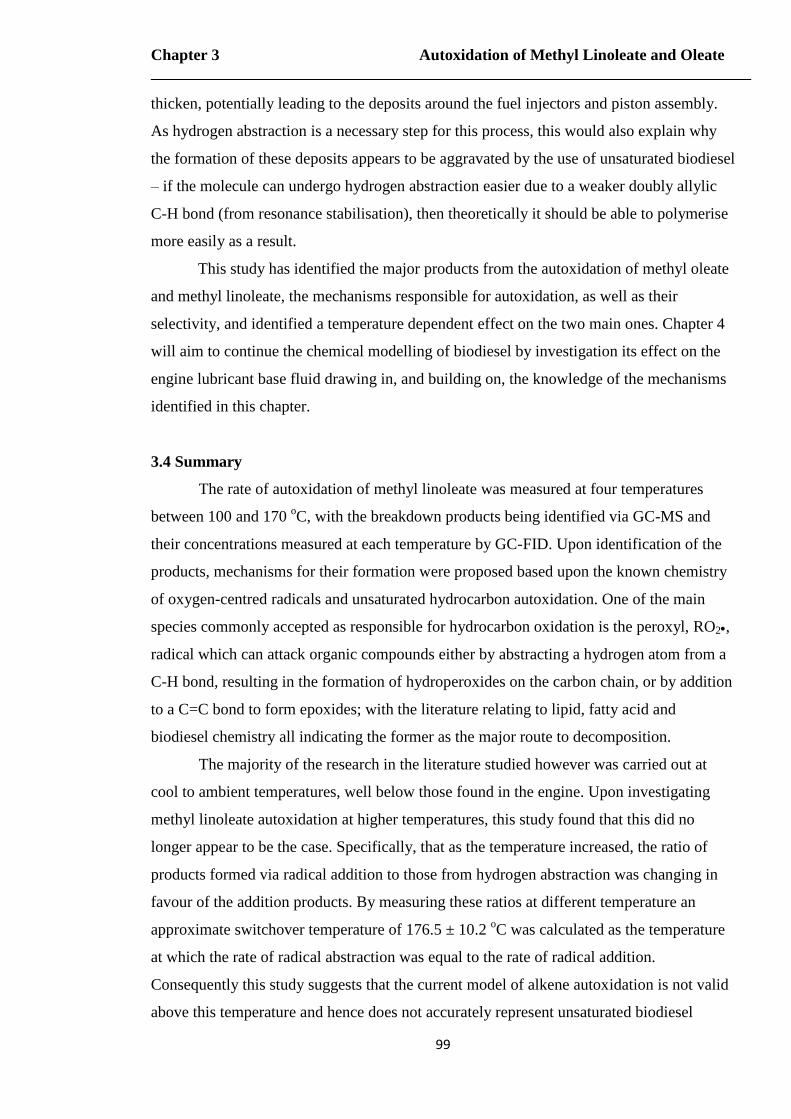
Chapter 3 Autoxidation of Methyl Linoleate and Oleate
99
thicken, potentially leading to the deposits around the fuel injectors and piston assembly.
As hydrogen abstraction is a necessary step for this process, this would also explain why
the formation of these deposits appears to be aggravated by the use of unsaturated biodiesel
– if the molecule can undergo hydrogen abstraction easier due to a weaker doubly allylic
C-H bond (from resonance stabilisation), then theoretically it should be able to polymerise
more easily as a result.
This study has identified the major products from the autoxidation of methyl oleate
and methyl linoleate, the mechanisms responsible for autoxidation, as well as their
selectivity, and identified a temperature dependent effect on the two main ones. Chapter 4
will aim to continue the chemical modelling of biodiesel by investigation its effect on the
engine lubricant base fluid drawing in, and building on, the knowledge of the mechanisms
identified in this chapter.
3.4 Summary
The rate of autoxidation of methyl linoleate was measured at four temperatures
between 100 and 170 oC, with the breakdown products being identified via GC-MS and
their concentrations measured at each temperature by GC-FID. Upon identification of the
products, mechanisms for their formation were proposed based upon the known chemistry
of oxygen-centred radicals and unsaturated hydrocarbon autoxidation. One of the main
species commonly accepted as responsible for hydrocarbon oxidation is the peroxyl, RO2,
radical which can attack organic compounds either by abstracting a hydrogen atom from a
C-H bond, resulting in the formation of hydroperoxides on the carbon chain, or by addition
to a C=C bond to form epoxides; with the literature relating to lipid, fatty acid and
biodiesel chemistry all indicating the former as the major route to decomposition.
The majority of the research in the literature studied however was carried out at
cool to ambient temperatures, well below those found in the engine. Upon investigating
methyl linoleate autoxidation at higher temperatures, this study found that this did no
longer appear to be the case. Specifically, that as the temperature increased, the ratio of
products formed via radical addition to those from hydrogen abstraction was changing in
favour of the addition products. By measuring these ratios at different temperature an
approximate switchover temperature of 176.5 ± 10.2 oC was calculated as the temperature
at which the rate of radical abstraction was equal to the rate of radical addition.
Consequently this study suggests that the current model of alkene autoxidation is not valid
above this temperature and hence does not accurately represent unsaturated biodiesel
The Autoxidation of Biodiesel and its Effects on Engine Lubricants
100
behaviour in the engine and that the model needs to be altered to take into account radical
addition as the new dominant degradation mechanism.
The next main finding in this study was identifying the dehydrodimer of methyl
linoleate indicating the ability of the fuel to dimerise and therefore, most likely, polymerise
further. The polymerisation of the fuel can likely help to account for the increased deposits
found in engines fuelled with biodiesel, especially when these fuels contain multiple
double bonds as these can undergo the necessary hydrogen abstraction step easier due to
the weakened doubly allylic C-H bond.
The other noted observations in this work came from the selectivity of these
mechanisms. The radical addition mechanism to form epoxides conformed to the standard
epoxide selection rules of trans-epoxides being favoured over cis-epoxides due the
reduction of steric hindrance. Both radical abstraction and radical addition seemed to
favour attacking the reactive sites nearest the centre of the carbon chain, most likely due to
the increased inductive stabilisation of the resulting radical coming from both sides of the
carbon chain. Finally, upon fragmentation of the carbon chain it was noted that whilst C-C
bond scission from autoxidation yields an aldehyde one side and an alkyl chain on the
other, this did not happen if the resulting hydrocarbon product would be a terminal alkene.
In these cases, the double bonds were believed to rearrange and react further with oxygen-
based radicals to form a more thermodynamically favoured aldehyde product conjugated
with the double bond.
3.5 References
Balat, M. Balat, H. Progress in Biodiesel Processing, Applied Energy, 2010, 87(6), 1815-
1835.
Blanksby, S.J. Ellison, G.B. Bond Dissociation Energies of Organic Molecules, Acc.
Chem. Res. 2003, 36, 255-263.
Bors, W. Erben-Russ, M. Saran, M. Fatty acid peroxyl radicals: Their generation and
reactivities, Bioelectrochemistry and Bioenergenetics, 1987, 18, 37-49.
Boult, P.J. Fisher, Q.J. Clinch, S.R. Lovibond, J R. Cockshell, C.C. Geomechanical,
microstructural, and petrophysical evolution in experimentally reactivated
cataclasites: Discussion, AAPG Bulletin. 2003, 87, 1681-1683.
Bush, G.P. Fox, M.F. Picken, D.J. Butcher, L.F. Composition of Lubricating Oil in the
Upper Ring Zone of an Internal Combustion Engine, Tribology International, 1991,
24(4), 231-233.
Chapter 3 Autoxidation of Methyl Linoleate and Oleate
101
Clark, K.B. Culshaw, P.N. Griller, D. Lossing, F.P. Martinho Simões, J.A. Walton, J.C.
Studies of the Formation and Stability of Pentadienyl and 3-Substituted Pentadienyl
Radicals, J. Org. Chem. 1991, 56, 5535-5539.
Chan, H.W.S. Levett, G. Matthew, J.A. The Mechanism of the Rearrangement of Linoleate
Hydroperoxides. Chemistry and Physics of Lipids, 1979, 24, 245-256.
Demirbas, A. Progress and recent trends in biodiesel fuels. Energy Conversion and
Management, 2009, 50, 14-34.
Department for Transport – Towards a UK Strategy for Biofuels – Public Consultation
2005, 2-4, www.dft.gov.uk/consultations/archive/2004/tuksb/, Archived 02/09/2009,
27/4/2011
Du Plessis, L.M. De Villiers, K.B.M. Van Der Walt, W.H. Stability studies on methyl and
ethyl fatty acid esters of sunflowerseed oil, JAOCS. 1985, 62(4), 748-752.
Dvorák, R. Frantisek, F. Komers, K. Transesterification of rapeseed oil in a feedback
reactor, Eur. J. Lipid Sci. Technol, 2001, 103, 742–745.
Filipova, T.V. Blyumberg, E.A. Mechanism of the Epoxidation of Alkenes by Molecular
Oxygen, Russian Chemical Reviews, 1982, 51(6), 582-591.
Farmer, E.H. Koch, H.P. Sutton, D.A. The Course of Autoxidation Reactions in
Polyisoprenes and Allied Compounds. Part VII. Rearrangement of Double Bonds
during Autoxidation, J. Chem. Soc. 1943, 541-547.
Frankel, E.N. Garwood, R.F. Khambay, B.P.S. Moss, G.P. Weedon, B.C.L.
Stereochemistry of Olefin and Fatty Acid Oxidation. Part 3. The Allylic
Hydroperoxides from the Autoxidation of Methyl Oleate, J. Chem. Soc. Perkin
Transactions 1, 1984, 2233-2240.
Frankel, E.N. Chemistry of Free Radical and Singlet Oxidation of Lipids. Prog. Lipid Res.
1985, 23, 197-221.
Gamble, R.J. Priest, M. Taylor, C.M. Detailed Analysis of Oil Transport in the Piston
Assembly of a Gasoline Engine, Tribology Letters, 2003, 14(2), 147-156.
Giuffrida, F. Destaillats, F. Robert, F. Skibsted, L.H. Dionisi, F. Formation and Hydrolysis
of Triacylglycerol and Sterol Epoxides: Role of Unsaturated Triacylglycerol Peroxyl
Radicals, Free Radical Biology & Medicine. 2004, 37(1), 104-114.
Goering, C.E. Schwab, A.W. Dangherty, M.J. Pryde, E.H. Heakin, A.J. Fuel Properties of
Eleven Vegetable Oils, ASAE 1982, 25(6), 1472-1477.
Golden, D.M. Benson, S.W. Chem.Rev 1969, 69,125.

The Autoxidation of Biodiesel and its Effects on Engine Lubricants
102
Gómez-Carracedo, M.P. Andrade, J.M. Calviño M., Fernández, E. Prada, D. Muniategui,
S. Multivariate prediction of eight kerosene properties employing vapour-phase mid-
infrared spectrometry, Fuel, 2003, 82, 1211-1218.
Hamberg, M. Gotthammer, B. A New Reaction of Unsaturated Fatty Acid
Hydroperoxides: Formation of 1 1-Hydroxy-12,13-epoxy-9-octadecenoic Acid from
13-Hydroperoxy-9,11 -octadecadienoic Acid, Lipids, 1973, 8(12), 737-744.
Hiroyasu, H. Kadota, T. Models for Combustion and Formation of Nitric Oxide and Soot
in Direct Injection Diesel Engines, Soc. Automotive Eng. Paper No. 760129, 1976.
Hirsch, R.L. Bezdek, R. Wendling, R. Peaking of World Oil Production: Impacts,
Mitigation and Risk Management, 2005, 11-20, www.netl.doe.gov
Kim, J.S. Min, B.S. Lee, D.S. Oh, D.Y. Choi, J.K. Characteristics of Carbon Deposit
Formation in Piston Top Ring Groove of Gasoline and Diesel Engine, 1998 SAE
International Congress & Exposition; Detroit, MI, USA, 1998, 147-154.
Korchek, S. Chenier, J.H.B. Howard, J.A. Ingold, K.U. Absolute rate constants for
hydrocarbon autoxidation. XXI. Activation energies for propagation and the
correlation of propogation rate constant with carbon–hydrogen bond strengths, Can.
J. Chem, 1972, 50, 2285–2297.
Knothe, G. “Designer” Biodiesels: Optimizing Fatty Acid Ester Composition to Improve
Fuel Properties, Energy and Fuels, 2008, 22, 1358-1364.
Krisnangkura, K. Yimsuwan, T. Pairintra, R. An Empircal Approach in Predicting
Biodiesel Viscosity at Various Temperatures, Fuel, 2006, 85, 107-113.
Labeckas, G. Slavinskas, S. Performance of direct-injection off-road diesel engine on
rapeseed oil, Renewable Energy, 2006, 31, 849-863.
Lercker, G. Rodriguez-Estrada, T.M. Bonoli M., Analysis of the oxidation products of cis-
and trans-octadecenoate methyl esters by capillary gas chromatography–ion-trap
mass spectrometry I. Epoxide and dimeric compounds, Journal of Chromatography,
2003, 985, 333-342.
Lightfoot, P.D. Cox, R.A. Crowley, J.N. Destriau, M.Hayman, G.D. Jenkin, M.E.
Moortgat, G.K. Zabel, F. Organic Peroxy Radicals: Kinetics, Spectroscopy and
Tropospheric Chemistry, Atmospheric Environment, 1992, 26A(10), 1805-961.
Ma, F. Hanna, M.A. Biodiesel Production: A Review, Bioresource Technology, 1999, 70,
1-15.
McMillen, D.F. Golden, D.M. Hydrocarbon Bond Dissociation Energies, Ann. Rev. Phys.
Chem, 1982, 33, 493-532.
Chapter 3 Autoxidation of Methyl Linoleate and Oleate
103
Monyem, A. Canakci, M. Van Gerpen, J.H. Investigation of Biodiesel Thermal Stability
Under Simulated In-Use Conditions, Applied Engineering in Agriculture, 2000,
16(4), 373-378.
Moritani, H. Nozawa, Y. Oil Degradation in Second-Land Region of Gasoline Engine
Pistons. R&D Review of Toyota CRDL, 2004, 38(3), 36-43.
Pratt, D.A. Mills, J.H. Porter, N.A. Theoretical Calculations of Carbon-Oxygen Bond
Dissociation Enthalpies of Peroxyl Radicals Formed in the Autoxidation of Lipids, J.
Am. Chem. Soc. 2003, 125, 5801-5810.
Rakopoulos, C.D. Antonopoulos, K.A. Rakopoulos, D.C. Hountalas, D.T. Giakoumis,
E.G. Comparative performance and emissions study of a direct injection Diesel
engine using blends of Diesel fuel with vegetable oils or bio-diesels of various
origins, Energy Conversion and Management, 2006, 47, 3272-3287.
Ross, J.R. Gebhart, A.I. Gerecht, J.F. The Autoxidation of Methyl Oleate, J. Am. Chem.
Soc. 1949, 71, 282-286.
Sapaun, S.M. Masjuki, H.H. Azlan, A. The Use of Palm Oil as Diesel Fuel Substitute. J.
Power Energy A. 1996, 210, 47–53.
Shahid, E.M. Jamal, Y. A Review of Biodiesel as a Vehicular Fuel, Renewable and
Sustainable Energy Review, 2008, 12(9), 2484-2494.
Sonawane, H.R. Nanjundiah, B.S. Kelkar, R.G. Light-Mediated Transformations of
Olefins into Alcohols: Reactions of Hydroxyl Radicals With Cycloalkenes,
Tetrahedron, 1986, 42(24), 6673-6682
Srivastava, A. Prasad, R. Triglycerides-based Diesel Fuels, Renew. Sustain. Energy Rev.
2000, 4, 111-133
Taylor, R.I. Evans, P.G. In-situ Piston Measurements, Proc. Instn. Mech. Engrs. 2004,
218(J: J. Engineering Tribology), 185-200.
Tormos, B. Novella, R. García, A. Gargar, K. Comprehensive Study of Biodiesel Fuel for
HSDI Engines in Convencional and Low Temperature Combustion Conditions,
Renweable Energy, 2010, 35, 368-378.
Trenwith, A.B. Dissociation of 3-methyl-1,4-pentadiene and the Resonance Energy of the
Pentadienyl Radical J. Chem. Soc. Faraday Trans. 1, Physical Chemistry in
Condensed Phases, 1982, 78(10), 3131-3136.
U.S Department of Energy report 2011 http://tonto.eia.doe.gov/oog/info/twip/twip.asp
27/04/2011
The Autoxidation of Biodiesel and its Effects on Engine Lubricants
104
Yizhe, L. Guirong, B. Hua, W. Determination of 11 fatty acids and fatty acid methyl esters
in biodiesel using ultra performance liquid chromatography, Chinese Journal of
Chromatography, 2008, 26(4), 494-498.
Yuan, W. Hansen, A.C. Zhang, Q. Vapour Pressure and Normal Boiling Point Predictions
for Pure Methyl Esters and Biodiesel Fuels, Fuel, 2005, 84, 943-950.
Zhang, Q. Feldman, M. Peterson, C.L. Diesel engine durability when fuelled with methyl
ester of winter rapeseed oil. ASAE Paper No. 88: 1562. 1988
Chapter 4 Effect of Methyl Linoleate and Oleate on Squalane Oxidation
105
Chapter 4. The Effect of Methyl Linoleate and Oleate on Squalane
Oxidation
4.1 Introduction
The effect of biodiesel on engine lubricants has been studied since their planned
entry into the market in the 1980’s. Early tests on sunflower and cottonseed oils (Engler
1983) indicated that even when they were put through purification processes such as
degumming and dewaxing, the resultant degree of fouling of the lubricating oil through
fuel dilution (as described in Introduction) as a result of their usage over a 40 hour test run
rendered them useful only on a short-term basis.
A study by Ryan et al (1984) however, showed that this lubricant contamination
issue only seemed to be significant in engines utilising direct-injection (where a dosage of
fuel is pumped into the combustion chamber) methods – for indirect injection engines
(where the fuel is ‘drawn’ into the chamber via the pressure gradient caused by the piston
movement), test run results with refined vegetable oils were largely comparable to those
with mineral diesel. It was noted, however that these tests were run only over a matter of
days; far below the average working time of an engine and that greater differences may be
observed on longer-term trials. It was also noted that injector coking and lubricant oil
contamination in direct-injection engines was aggravated by the use of unsaturated
vegetable oils and therefore such fuels would have to be modified in order to allow for
sufficient working of the engine. From this, it was proposed that two sets of fuel
specification were necessary – one for direct- and one for indirect- injection engines; a
proposal that has since been rendered obsolete by the European particulate emission
legislation (EC Regulation No. 595/2009) which will require the mandatory introduction of
direct-injection engines in order to facilitate the use of Diesel Particulate Filters (DPFs).
DPFs are devices fitted to the exhaust system of an engine to reduce Particulate Matter
(PM) emissions – of particular concern due to their impacts on the environment and human
health (Kittelson 1998) – by trapping them via filtration, usually with the aid of catalytic
adsorbants, only allowing exhaust gas molecules to pass through and be released to the
atmosphere (van Setten 2001, Yang 2008). They are being introduced as a necessary
measure to reduce engine PM emissions but must be cleaned to prevent excess soot
clogging the filter. This is where DI engines are utilised, as the excess fuel that is injected
The Autoxidation of Biodiesel and its Effects on Engine Lubricants
106
can be used to burn off residual soot gathered on the filter (Conrad 2006). The problem
with utilising this method is that this excess fuel can end up in the sump, contributing to
fuel dilution. Unfortunately, at present, there is no other more efficient way of reducing
PM emissions or cleaning the DPF reported.
Whilst the physical properties of vegetable oils were improved upon
transesterification to produce Fatty Acid Methyl Esters, FAME, the levels of unsaturation
within the fatty acid chains were still shown to prove problematic with regards to lubricant
contamination and oxidation compared to saturated FAME and mineral diesel (Sapaun
1996, Sumathi 2008), again, these effects appeared to be more problematic in DI engines
(Radu 2009). Monyem (2000) took biodiesel from soya (Soybean Methyl Ester – SME),
currently the most common form of biodiesel in the USA (Van Wechel 2002) – and
consisting of over 50% doubly unsaturated FAME (see Chapter 1, Section 3) – and
investigated its properties under simulated engine conditions. Among the findings was a
large increase in kinematic viscosity of the fuel and the lubricant over time when using
neat biodiesel compared to diesel and blends of the two. Viscosity of the lubrication
systems is crucial to the smooth running of the engine; too low and the oil film will
become too thin to provide sufficient protection between the colliding surfaces to
overcome friction and prevent excessive wear and temperature increase, too high and the
moving parts cannot slide along as effectively, reducing the efficiency of the engine, hence
requiring more fuel and increasing carbon dioxide emissions per mile/km. Any
contamination of the lubricant by the fuel must therefore have minimal effect on the
viscosity, yet biodiesel’s lubrication properties have been reported as worse compared to
mineral diesel (Hu 2005, Dermibas 2009). Masjuki (1996) noted that adverse wear
conditions could be prevented only if levels of biodiesel in the lubricant were kept below
5%; Fazal (2011) attributed these findings to higher corrosion properties of oxidised
biodiesel.
Agarwal (2007) documented the use of biodiesel in engines, including the effect on
engine lubricant through FTIR studies, tribology and viscosity measurements. FTIR results
showed increased amounts of oxidised base fluid in biodiesel fuelled engines,
corresponding with increased viscosity after use and hence it was suggested that this could
be due to biodiesel increasing the rate of base oil oxidation once they were mixed.
With all the work done on the effects of biodiesel on engine lubricants, it is quite
surprising, particularly given the research on the chemistry of fats, lipids and subsequently
FAME, that very little work has been done on the chemistry of how biodiesel and
Chapter 4 Effect of Methyl Linoleate and Oleate on Squalane Oxidation
107
lubricants physically and, crucially, chemically interact with one another. The aim of this
section is to present the work done for this project using methyl linoleate and methyl oleate
(as biodiesel analogues) on squalane (a lubricant base fluid analogue) and to draw in
knowledge of the methyl linoleate and methyl oleate chemistry (Chapter 3) to try and
identify (among others) the causes of viscosity increase, sediment formation and piston
deposits. Methyl linoleate is the main focus of the research as the doubly unsaturated
system is the suspected cause of reactivity.
4.2 Results
4.2.1 Rate of Squalane Decay
In the previous chapter methyl oleate and linoleate were used to chemically model
biodiesel behaviour. In order to model the effect on engine lubricants, it was necessary to
find a chemical model for the lubricant base fluid. Squalane was used to achieve this as it
is readily available and has properties such as chain length, degree of branching and
viscosity comparable to engine lubricants (Kaiser 1981) – it has been used in several other
studies on engine lubricants (Adamczyk 1984, Gupta 1997, Jabbarzadeh 2002, Stark 2011
– see chapter 1, section 4) – but crucially for this work, it elutes as a single peak in GC
work, meaning its rate of decay is easily monitored. Figure 4.1 shows, for example, the
decrease in the concentration of squalane (within the ±5.7% error margin of the GC for
squalane) over time reacting with a flow of 1 bar of oxygen at 170 oC.
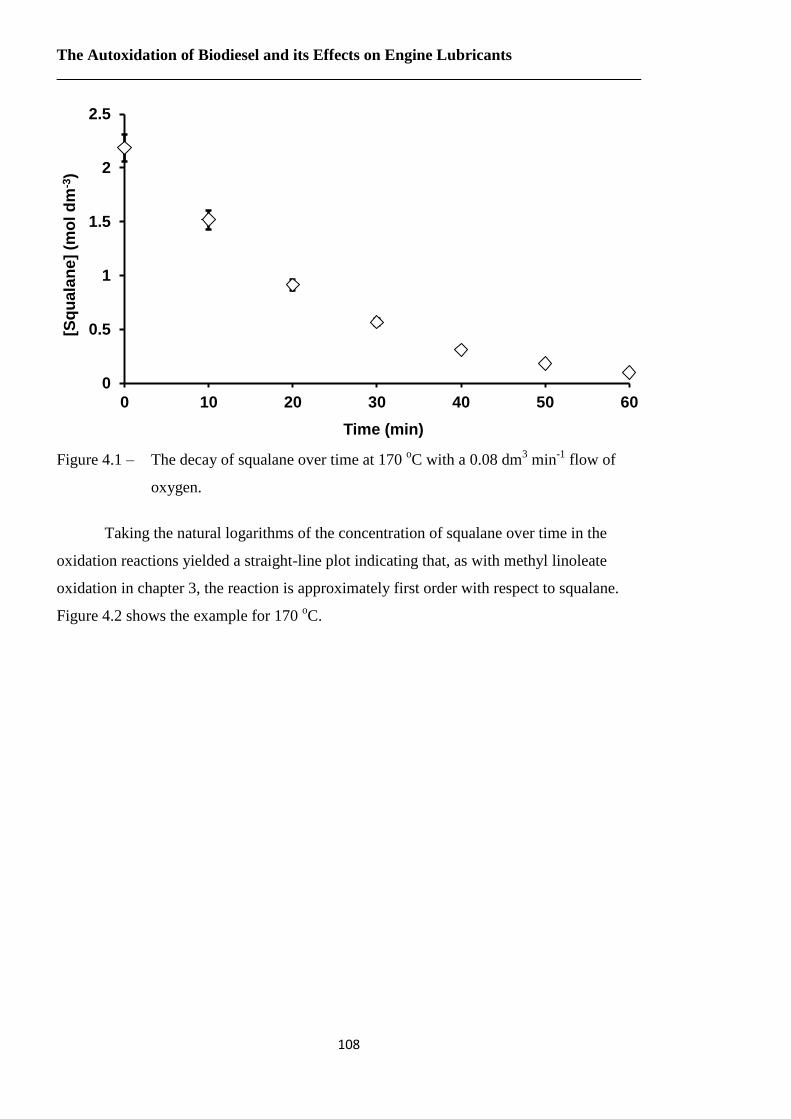
The Autoxidation of Biodiesel and its Effects on Engine Lubricants
108
Figure 4.1 – The decay of squalane over time at 170
oC with a 0.08 dm
3 min
-1 flow of
oxygen.
Taking the natural logarithms of the concentration of squalane over time in the
oxidation reactions yielded a straight-line plot indicating that, as with methyl linoleate
oxidation in chapter 3, the reaction is approximately first order with respect to squalane.
Figure 4.2 shows the example for 170 oC.
0
0.5
1
1.5
2
2.5
0 10 20 30 40 50 60
[Sq
uala
ne]
(mo
l d
m-3
)
Time (min)
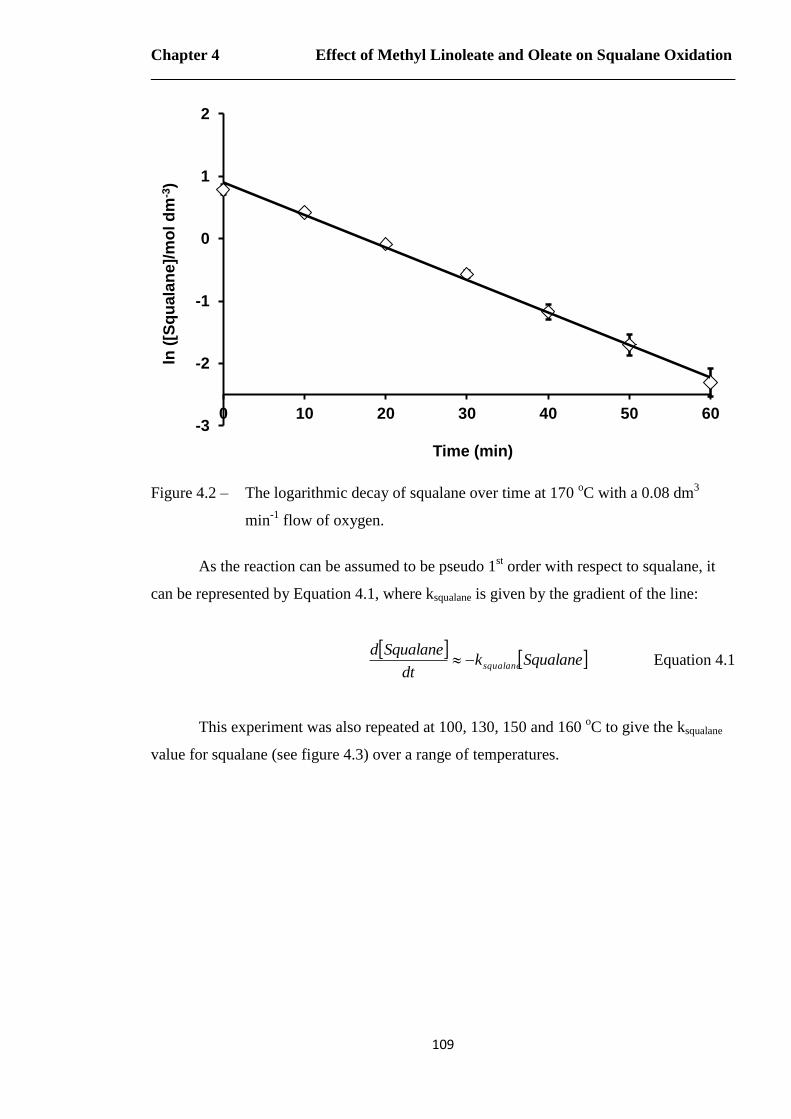
Chapter 4 Effect of Methyl Linoleate and Oleate on Squalane Oxidation
109
Figure 4.2 – The logarithmic decay of squalane over time at 170 oC with a 0.08 dm
3
min-1
flow of oxygen.
As the reaction can be assumed to be pseudo 1st order with respect to squalane, it
can be represented by Equation 4.1, where ksqualane is given by the gradient of the line:
Squalanek
dt
Squalanedsqualane Equation 4.1
This experiment was also repeated at 100, 130, 150 and 160 oC to give the ksqualane
value for squalane (see figure 4.3) over a range of temperatures.
-3
-2
-1
0
1
2
0 10 20 30 40 50 60
ln (
[Sq
uala
ne]/
mo
l d
m-3
)
Time (min)
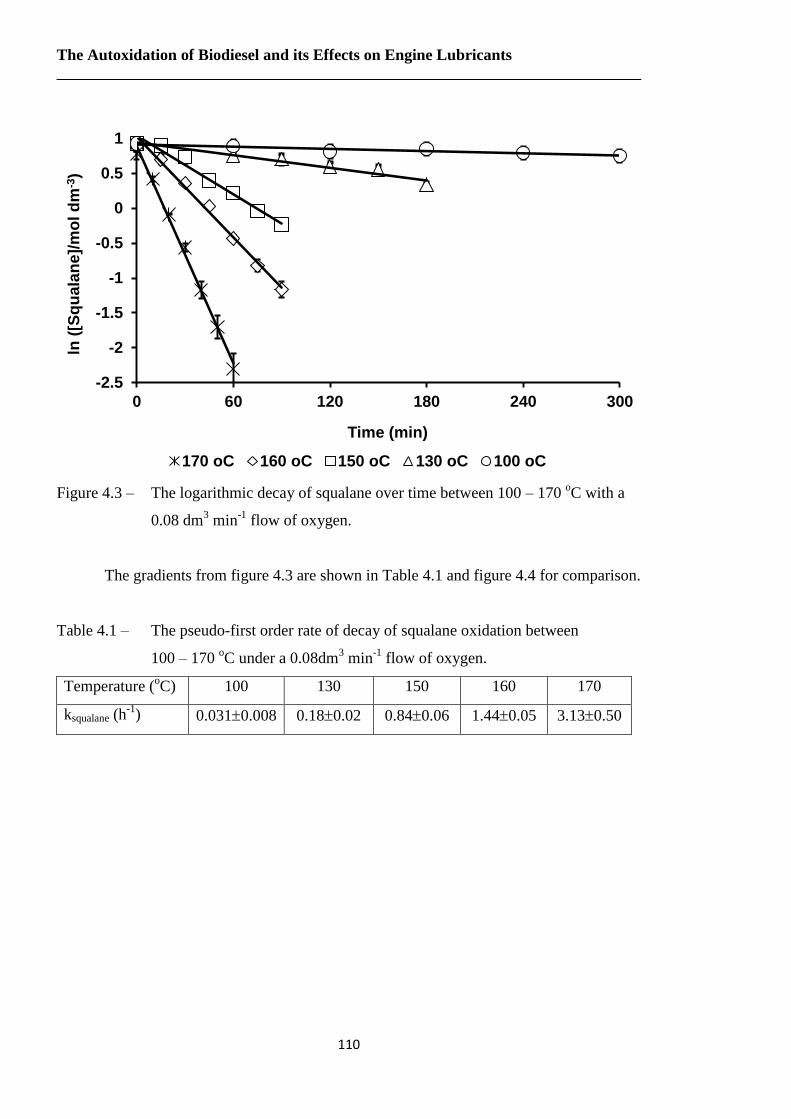
The Autoxidation of Biodiesel and its Effects on Engine Lubricants
110
Figure 4.3 – The logarithmic decay of squalane over time between 100 – 170 oC with a
0.08 dm3 min
-1 flow of oxygen.
The gradients from figure 4.3 are shown in Table 4.1 and figure 4.4 for comparison.
Table 4.1 – The pseudo-first order rate of decay of squalane oxidation between
100 – 170 oC under a 0.08dm
3 min
-1 flow of oxygen.
Temperature (oC) 100 130 150 160 170
ksqualane (h-1
) 0.0310.008 0.180.02 0.840.06 1.440.05 3.130.50
-2.5
-2
-1.5
-1
-0.5
0
0.5
1
0 60 120 180 240 300
ln (
[Sq
uala
ne]/
mo
l d
m-3
)
Time (min)
170 oC 160 oC 150 oC 130 oC 100 oC
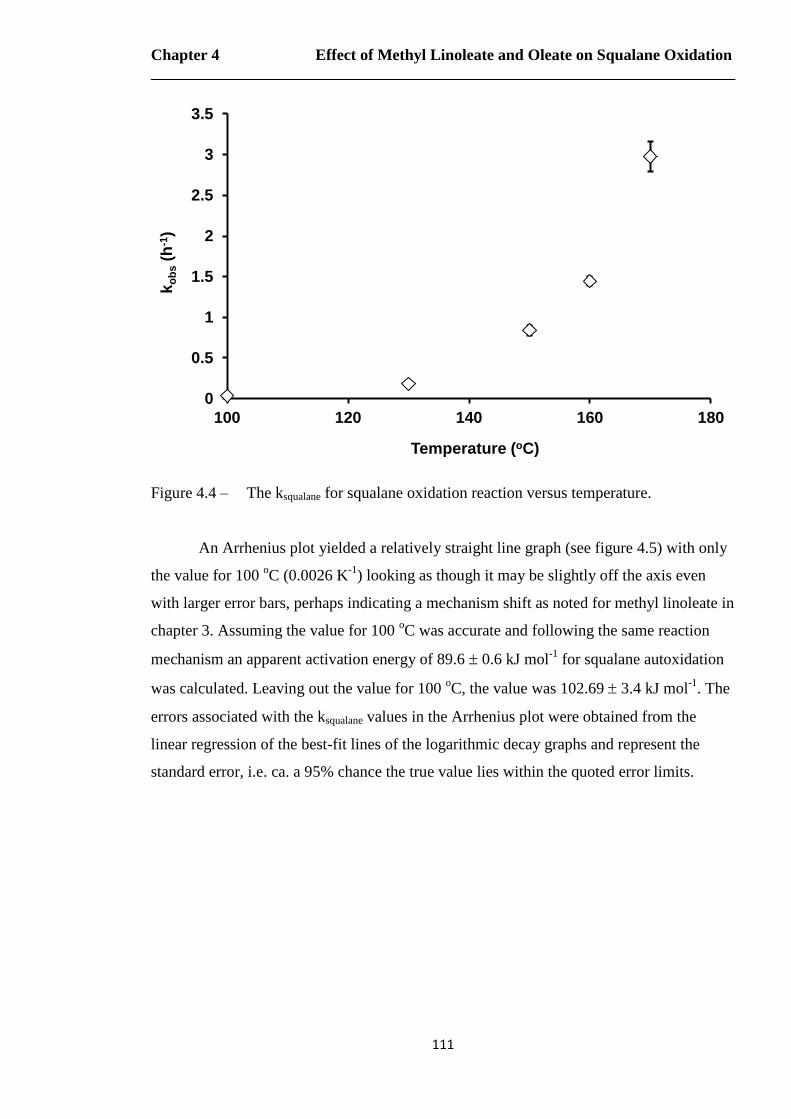
Chapter 4 Effect of Methyl Linoleate and Oleate on Squalane Oxidation
111
Figure 4.4 – The ksqualane for squalane oxidation reaction versus temperature.
An Arrhenius plot yielded a relatively straight line graph (see figure 4.5) with only
the value for 100 oC (0.0026 K
-1) looking as though it may be slightly off the axis even
with larger error bars, perhaps indicating a mechanism shift as noted for methyl linoleate in
chapter 3. Assuming the value for 100 oC was accurate and following the same reaction
mechanism an apparent activation energy of 89.6 0.6 kJ mol-1
for squalane autoxidation
was calculated. Leaving out the value for 100 oC, the value was 102.69 3.4 kJ mol
-1. The
errors associated with the ksqualane values in the Arrhenius plot were obtained from the
linear regression of the best-fit lines of the logarithmic decay graphs and represent the
standard error, i.e. ca. a 95% chance the true value lies within the quoted error limits.
0
0.5
1
1.5
2
2.5
3
3.5
100 120 140 160 180
ko
bs (
h-1
)
Temperature (oC)
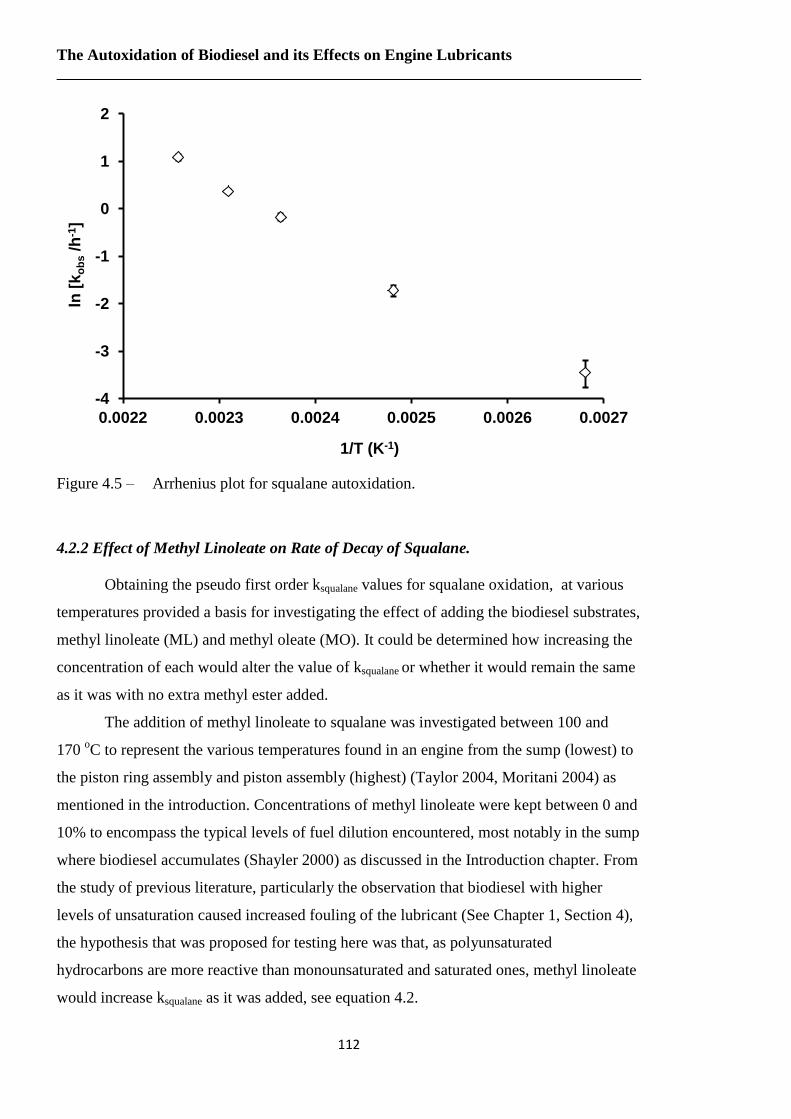
The Autoxidation of Biodiesel and its Effects on Engine Lubricants
112
Figure 4.5 – Arrhenius plot for squalane autoxidation.
4.2.2 Effect of Methyl Linoleate on Rate of Decay of Squalane.
Obtaining the pseudo first order ksqualane values for squalane oxidation, at various
temperatures provided a basis for investigating the effect of adding the biodiesel substrates,
methyl linoleate (ML) and methyl oleate (MO). It could be determined how increasing the
concentration of each would alter the value of ksqualane or whether it would remain the same
as it was with no extra methyl ester added.
The addition of methyl linoleate to squalane was investigated between 100 and
170 oC to represent the various temperatures found in an engine from the sump (lowest) to
the piston ring assembly and piston assembly (highest) (Taylor 2004, Moritani 2004) as
mentioned in the introduction. Concentrations of methyl linoleate were kept between 0 and
10% to encompass the typical levels of fuel dilution encountered, most notably in the sump
where biodiesel accumulates (Shayler 2000) as discussed in the Introduction chapter. From
the study of previous literature, particularly the observation that biodiesel with higher
levels of unsaturation caused increased fouling of the lubricant (See Chapter 1, Section 4),
the hypothesis that was proposed for testing here was that, as polyunsaturated
hydrocarbons are more reactive than monounsaturated and saturated ones, methyl linoleate
would increase ksqualane as it was added, see equation 4.2.
-4
-3
-2
-1
0
1
2
0.0022 0.0023 0.0024 0.0025 0.0026 0.0027
ln [
ko
bs /h
-1]
1/T (K-1)

Chapter 4 Effect of Methyl Linoleate and Oleate on Squalane Oxidation
113
Equation 4.2
Where x = the % of substrate added
Figure 4.6 shows the decay of squalane with different amounts of methyl linoleate
at 100 oC in logarithmic form. The line of best fit was taken for each of these data series
with the gradient giving the value of ksqualanex, plotted in figure 4.7 with the error bars again
representing the standard error from the linear regression of the trendline.
Figure 4.6 – The decay of squalane with varying amounts of methyl linoleate at 100
oC
with a 0.08 dm3 min
-1 flow of oxygen.
0
0.2
0.4
0.6
0.8
1
1.2
0 1 2 3 4 5 6
ln (
[Sq
uala
ne]/
mo
l d
m-3
)
Time (hours)
0%ML 5%ML 10%ML
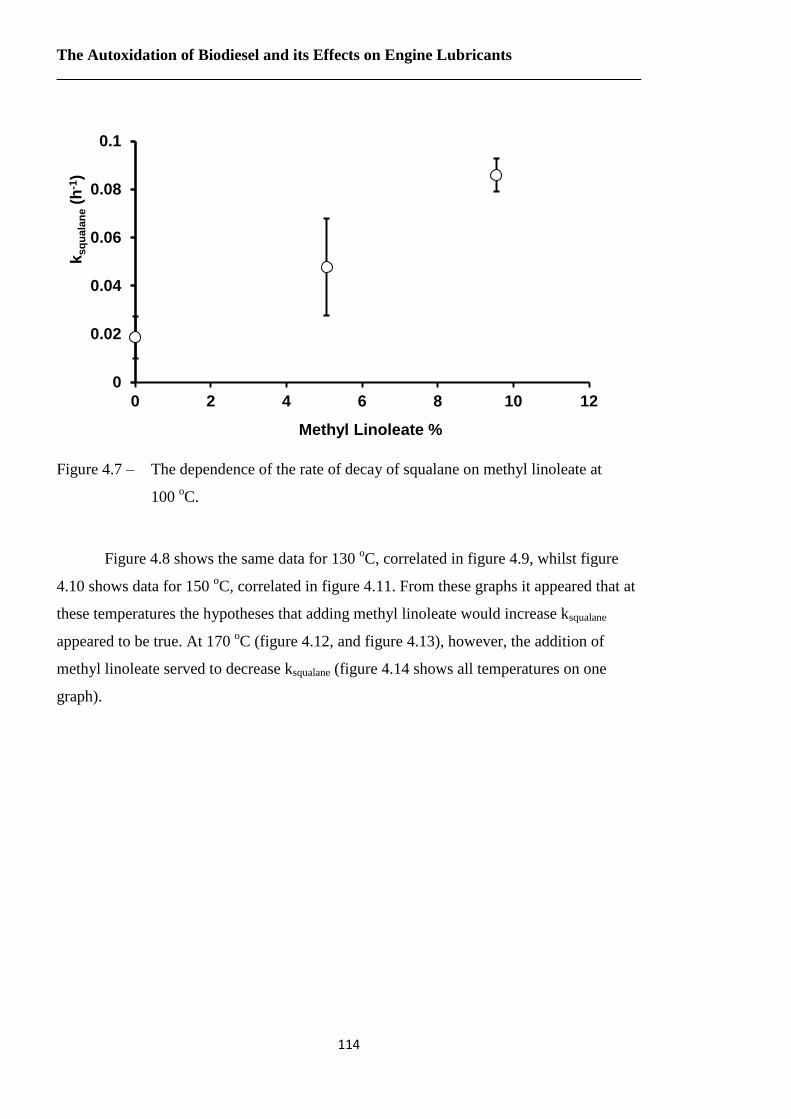
The Autoxidation of Biodiesel and its Effects on Engine Lubricants
114
Figure 4.7 – The dependence of the rate of decay of squalane on methyl linoleate at
100 oC.
Figure 4.8 shows the same data for 130 oC, correlated in figure 4.9, whilst figure
4.10 shows data for 150 oC, correlated in figure 4.11. From these graphs it appeared that at
these temperatures the hypotheses that adding methyl linoleate would increase ksqualane
appeared to be true. At 170 oC (figure 4.12, and figure 4.13), however, the addition of
methyl linoleate served to decrease ksqualane (figure 4.14 shows all temperatures on one
graph).
0
0.02
0.04
0.06
0.08
0.1
0 2 4 6 8 10 12
ksq
ua
lan
e (
h-1
)
Methyl Linoleate %
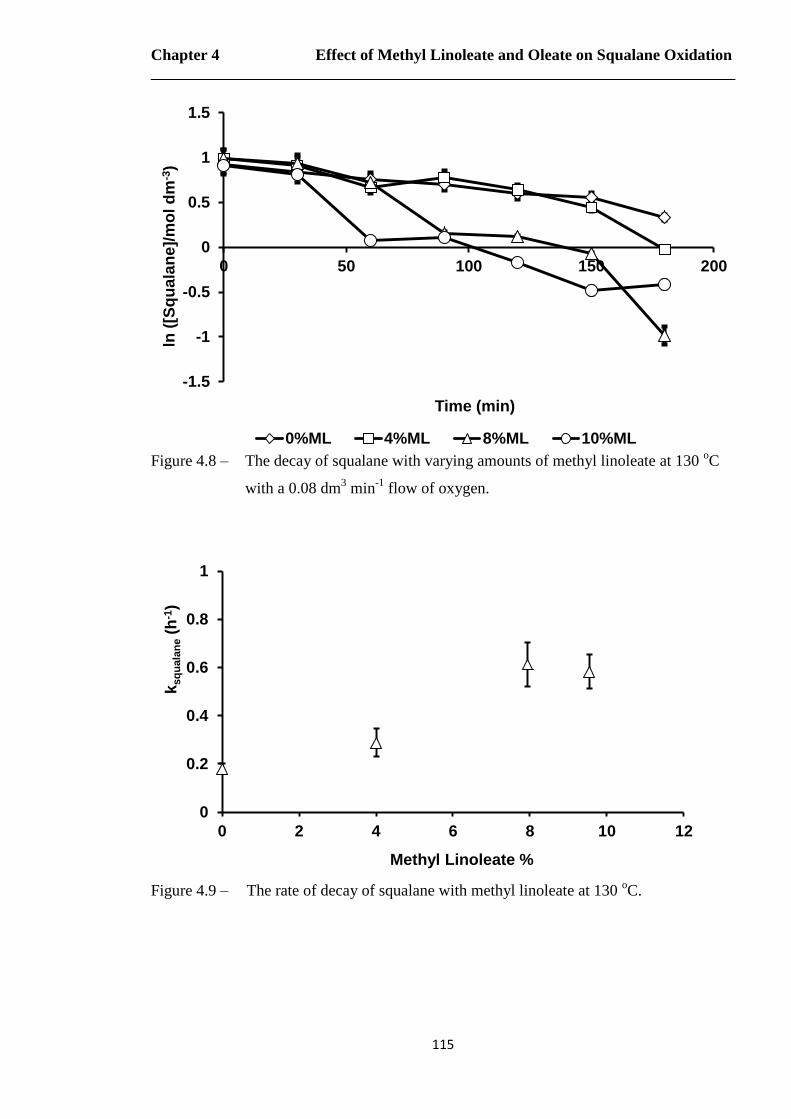
Chapter 4 Effect of Methyl Linoleate and Oleate on Squalane Oxidation
115
Figure 4.8 – The decay of squalane with varying amounts of methyl linoleate at 130
oC
with a 0.08 dm3 min
-1 flow of oxygen.
Figure 4.9 – The rate of decay of squalane with methyl linoleate at 130
oC.
-1.5
-1
-0.5
0
0.5
1
1.5
0 50 100 150 200
ln (
[Sq
uala
ne]/
mo
l d
m-3
)
Time (min)
0%ML 4%ML 8%ML 10%ML
0
0.2
0.4
0.6
0.8
1
0 2 4 6 8 10 12
ksq
ua
lan
e (
h-1
)
Methyl Linoleate %
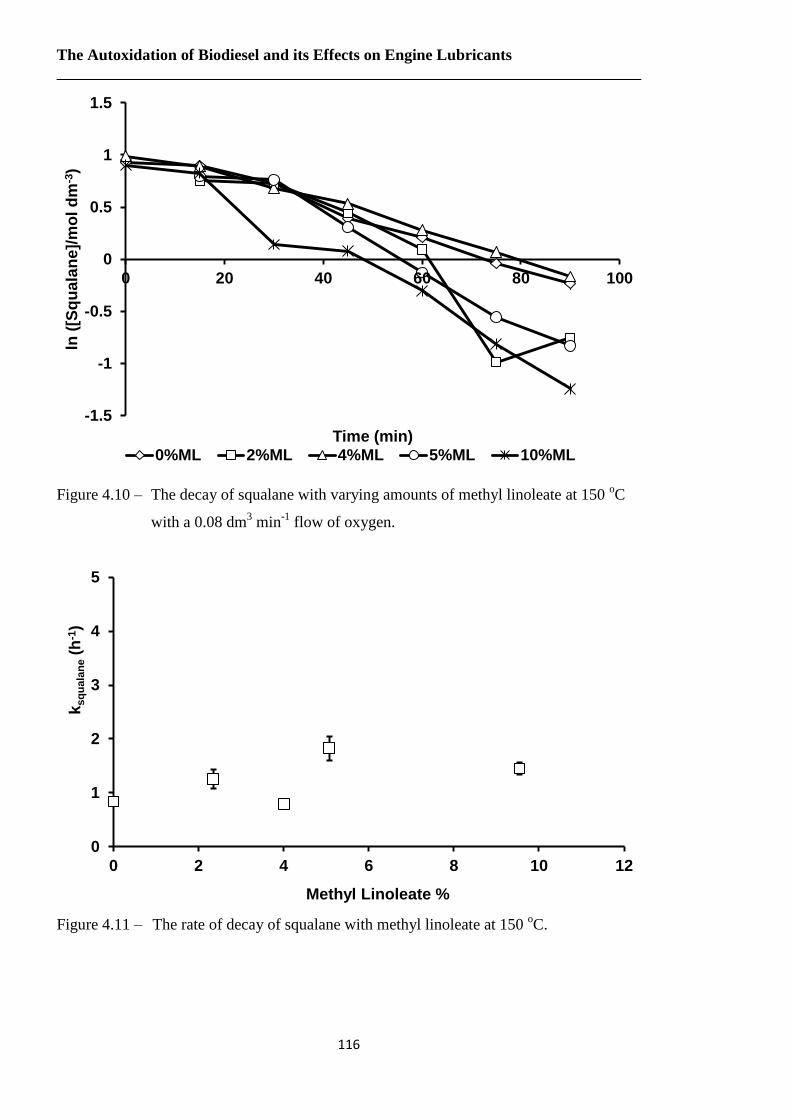
The Autoxidation of Biodiesel and its Effects on Engine Lubricants
116
Figure 4.10 – The decay of squalane with varying amounts of methyl linoleate at 150 oC
with a 0.08 dm3 min
-1 flow of oxygen.
Figure 4.11 – The rate of decay of squalane with methyl linoleate at 150
oC.
-1.5
-1
-0.5
0
0.5
1
1.5
0 20 40 60 80 100
ln (
[Sq
uala
ne]/
mo
l d
m-3
)
Time (min) 0%ML 2%ML 4%ML 5%ML 10%ML
0
1
2
3
4
5
0 2 4 6 8 10 12
ksq
ua
lan
e (
h-1
)
Methyl Linoleate %

Chapter 4 Effect of Methyl Linoleate and Oleate on Squalane Oxidation
117
Figure 4.12 – The decay of squalane with varying amounts of methyl linoleate at 170
oC
with a 0.08 dm3 min
-1 flow of oxygen.
Figure 4.13 – The rate of decay of squalane with methyl linoleate at 170 oC
-2.5
-2
-1.5
-1
-0.5
0
0.5
1
1.5
0 10 20 30 40 50 60 70
ln (
[Sq
uala
ne]/
mo
l d
m-3
)
Time (min) 0%ML 0%ML #2 2%ML 4%ML5%ML 5%ML #2 8%ML
0
1
2
3
4
0 2 4 6 8 10 12
ksq
ua
lan
e (
h-1
)
Methyl Linoleate %

The Autoxidation of Biodiesel and its Effects on Engine Lubricants
118
Figure 4.14 – The rate of decay of squalane with methyl linoleate at concentrations of
0 – 10% at 100 – 170 oC.
The change in rate of methyl linoleate decay (kML) was also looked at.
Unfortunately, this was not as straightforward to analyse as a minor peak started to appear
on the GC spectra at the same retention time as methyl linoleate roughly mid-way through
the reaction, causing a slight apparent increase in peak area (see Figure 4.15). As there was
no other peak in the initial decay spectra of either methyl linoleate or squalane
corresponding to this retention time, it was assumed this was a secondary decay product
produced from the breakdown of one of the (undetermined) initial decay products.
Therefore the observed rate constants were calculated with a greater level of uncertainty
due to having fewer data points available. Figure 4.16, 4.17, 4.18 and 4.19 present the
decay data for methyl linoleate in squalane at 100, 130, 150 and 170 oC respectively.
0
1
2
3
4
5
0 2 4 6 8 10 12
ksq
ua
lan
e (
h-1
)
Methyl Linoleate %
170oC 150oC 130oC 100oC
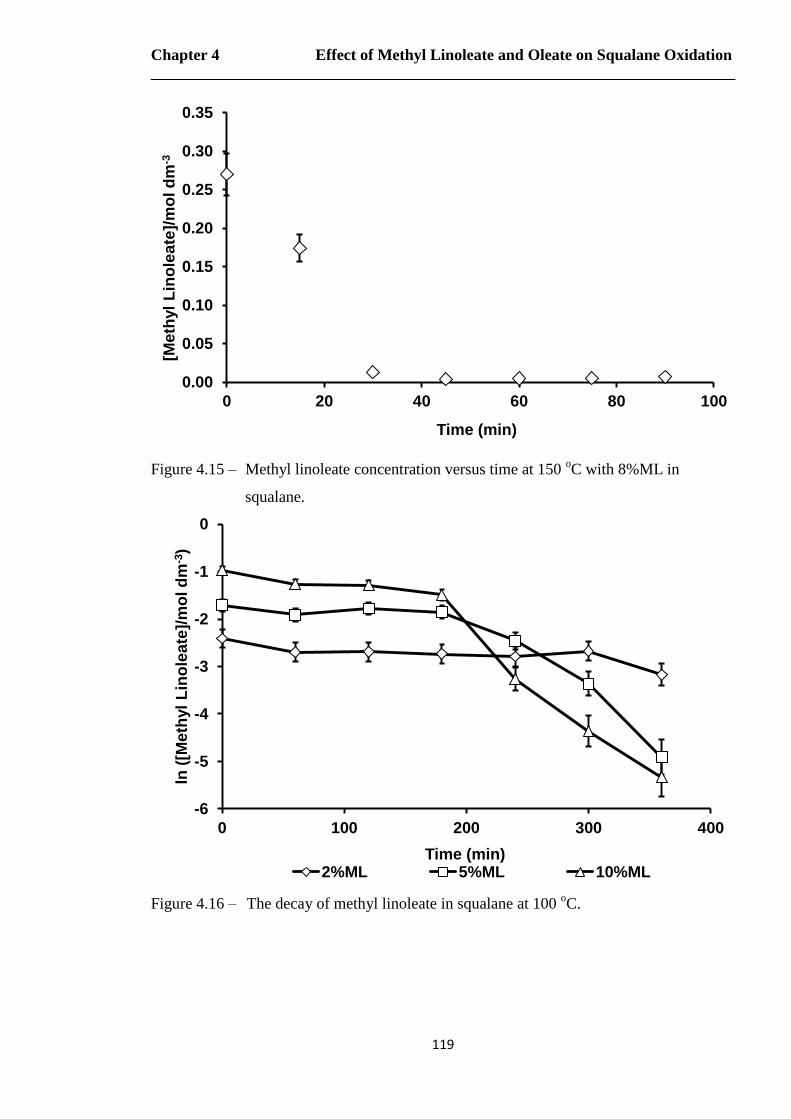
Chapter 4 Effect of Methyl Linoleate and Oleate on Squalane Oxidation
119
Figure 4.15 – Methyl linoleate concentration versus time at 150 oC with 8%ML in
squalane.
Figure 4.16 – The decay of methyl linoleate in squalane at 100 oC.
0.00
0.05
0.10
0.15
0.20
0.25
0.30
0.35
0 20 40 60 80 100
[Me
thyl
Lin
ole
ate
]/m
ol d
m-3
Time (min)
-6
-5
-4
-3
-2
-1
0
0 100 200 300 400
ln (
[Me
thyl
Lin
ole
ate
]/m
ol d
m-3
)
Time (min) 2%ML 5%ML 10%ML

The Autoxidation of Biodiesel and its Effects on Engine Lubricants
120
Figure 4.17 – The decay of methyl linoleate in squalane at 130 oC.
Figure 4.18 – The decay of methyl linoleate in squalane at 150 oC.
-7
-6
-5
-4
-3
-2
-1
0
0 20 40 60 80 100 120 140
ln (
[Me
thyl
Lin
ole
ate
]/m
ol d
m-3
)
Time (min)
4%ML 8%ML 10%ML
-7
-6
-5
-4
-3
-2
-1
0
0 20 40 60 80 100
ln (
[Me
thyl
Lin
ole
ate
]/m
ol d
m-3
)
Time (min)
2%ML 4%ML 5%ML 8%ML 10%ML
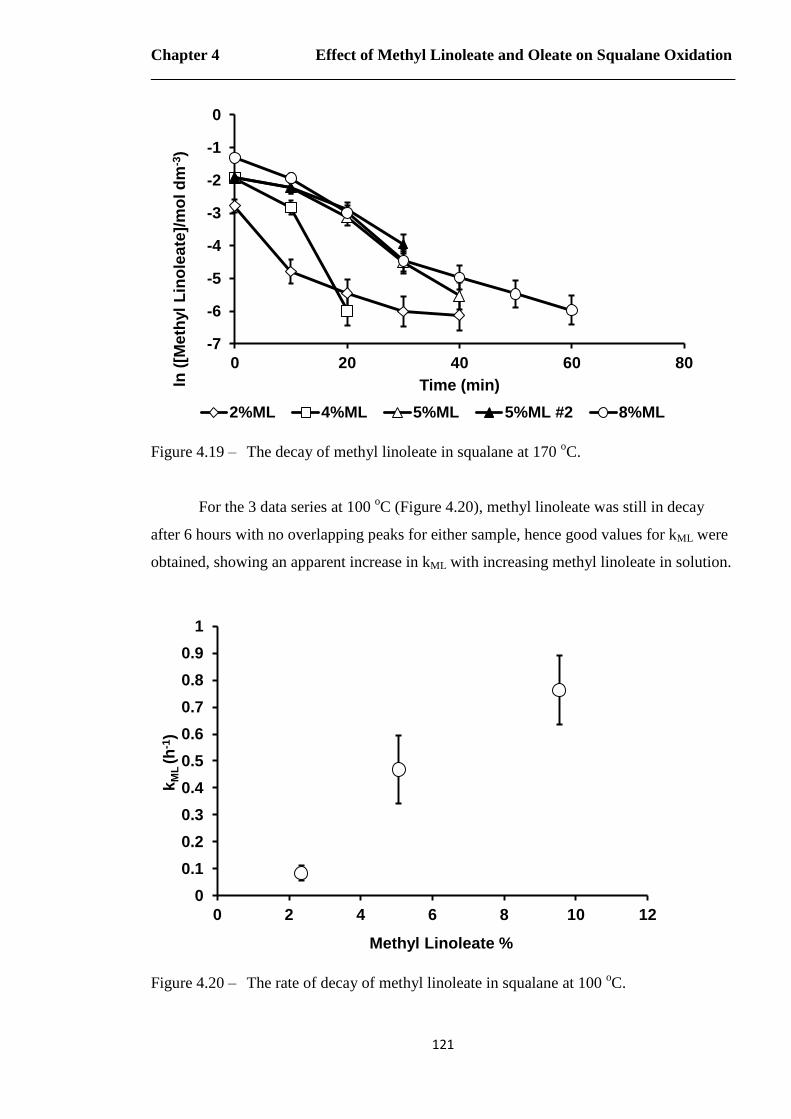
Chapter 4 Effect of Methyl Linoleate and Oleate on Squalane Oxidation
121
Figure 4.19 – The decay of methyl linoleate in squalane at 170 oC.
For the 3 data series at 100 oC (Figure 4.20), methyl linoleate was still in decay
after 6 hours with no overlapping peaks for either sample, hence good values for kML were
obtained, showing an apparent increase in kML with increasing methyl linoleate in solution.
Figure 4.20 – The rate of decay of methyl linoleate in squalane at 100 oC.
-7
-6
-5
-4
-3
-2
-1
0
0 20 40 60 80
ln (
[Me
thyl
Lin
ole
ate
]/m
ol d
m-3
)
Time (min)
2%ML 4%ML 5%ML 5%ML #2 8%ML
0
0.1
0.2
0.3
0.4
0.5
0.6
0.7
0.8
0.9
1
0 2 4 6 8 10 12
kM
L (h
-1)
Methyl Linoleate %
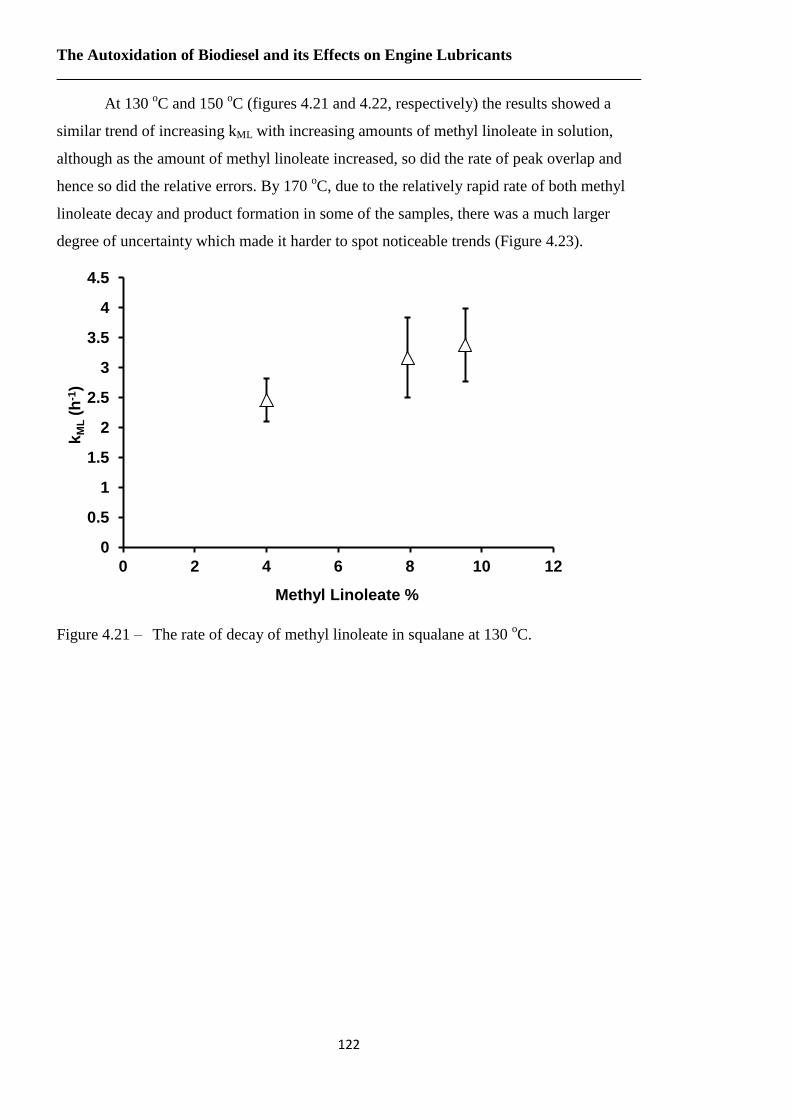
The Autoxidation of Biodiesel and its Effects on Engine Lubricants
122
At 130 oC and 150
oC (figures 4.21 and 4.22, respectively) the results showed a
similar trend of increasing kML with increasing amounts of methyl linoleate in solution,
although as the amount of methyl linoleate increased, so did the rate of peak overlap and
hence so did the relative errors. By 170 oC, due to the relatively rapid rate of both methyl
linoleate decay and product formation in some of the samples, there was a much larger
degree of uncertainty which made it harder to spot noticeable trends (Figure 4.23).
Figure 4.21 – The rate of decay of methyl linoleate in squalane at 130 oC.
0
0.5
1
1.5
2
2.5
3
3.5
4
4.5
0 2 4 6 8 10 12
kM
L (
h-1
)
Methyl Linoleate %
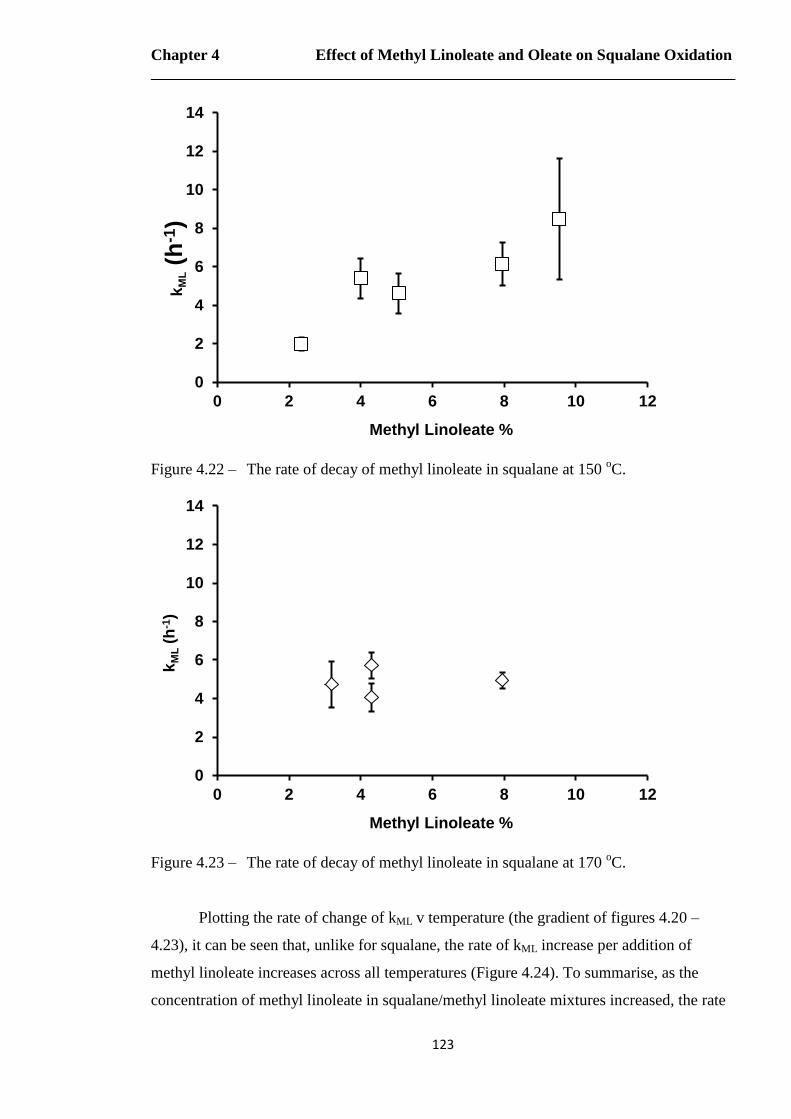
Chapter 4 Effect of Methyl Linoleate and Oleate on Squalane Oxidation
123
Figure 4.22 – The rate of decay of methyl linoleate in squalane at 150 oC.
Figure 4.23 – The rate of decay of methyl linoleate in squalane at 170 oC.
Plotting the rate of change of kML v temperature (the gradient of figures 4.20 –
4.23), it can be seen that, unlike for squalane, the rate of kML increase per addition of
methyl linoleate increases across all temperatures (Figure 4.24). To summarise, as the
concentration of methyl linoleate in squalane/methyl linoleate mixtures increased, the rate
0
2
4
6
8
10
12
14
0 2 4 6 8 10 12
kM
L (
h-1
)
Methyl Linoleate %
0
2
4
6
8
10
12
14
0 2 4 6 8 10 12
kM
L (
h-1
)
Methyl Linoleate %
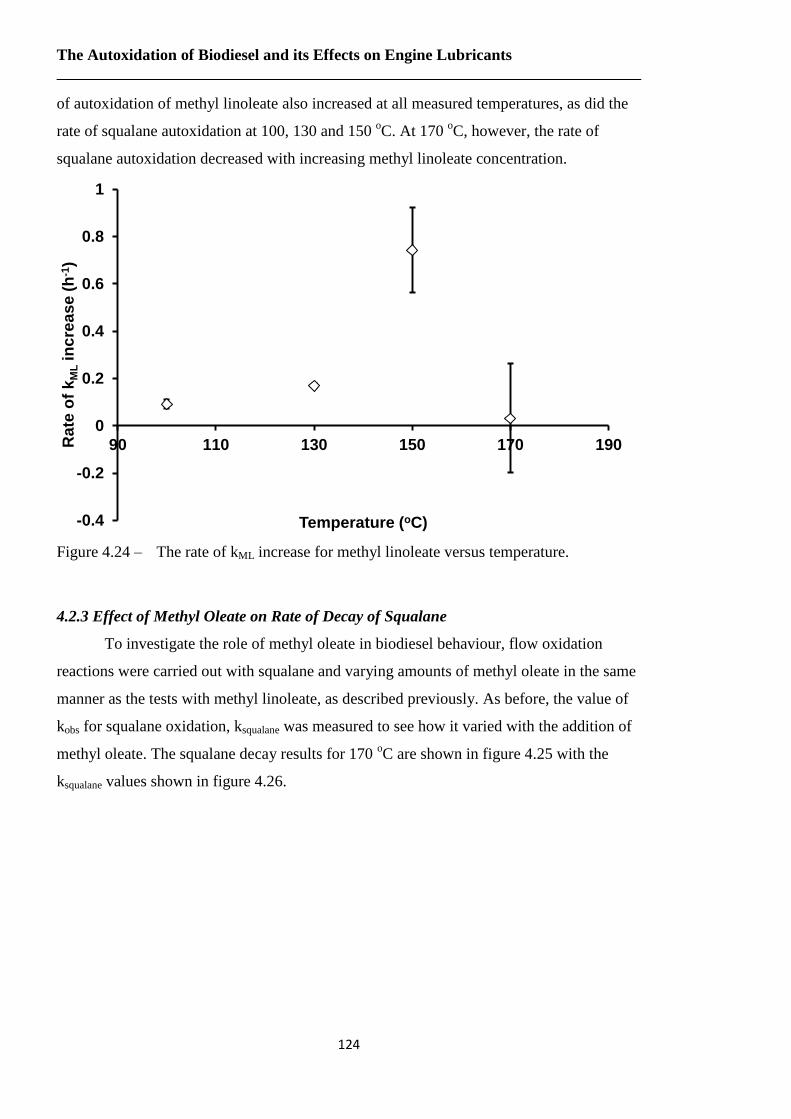
The Autoxidation of Biodiesel and its Effects on Engine Lubricants
124
of autoxidation of methyl linoleate also increased at all measured temperatures, as did the
rate of squalane autoxidation at 100, 130 and 150 oC. At 170
oC, however, the rate of
squalane autoxidation decreased with increasing methyl linoleate concentration.
Figure 4.24 – The rate of kML increase for methyl linoleate versus temperature.
4.2.3 Effect of Methyl Oleate on Rate of Decay of Squalane
To investigate the role of methyl oleate in biodiesel behaviour, flow oxidation
reactions were carried out with squalane and varying amounts of methyl oleate in the same
manner as the tests with methyl linoleate, as described previously. As before, the value of
kobs for squalane oxidation, ksqualane was measured to see how it varied with the addition of
methyl oleate. The squalane decay results for 170 oC are shown in figure 4.25 with the
ksqualane values shown in figure 4.26.
-0.4
-0.2
0
0.2
0.4
0.6
0.8
1
90 110 130 150 170 190Rate
of
kM
L in
cre
as
e (
h-1
)
Temperature (oC)
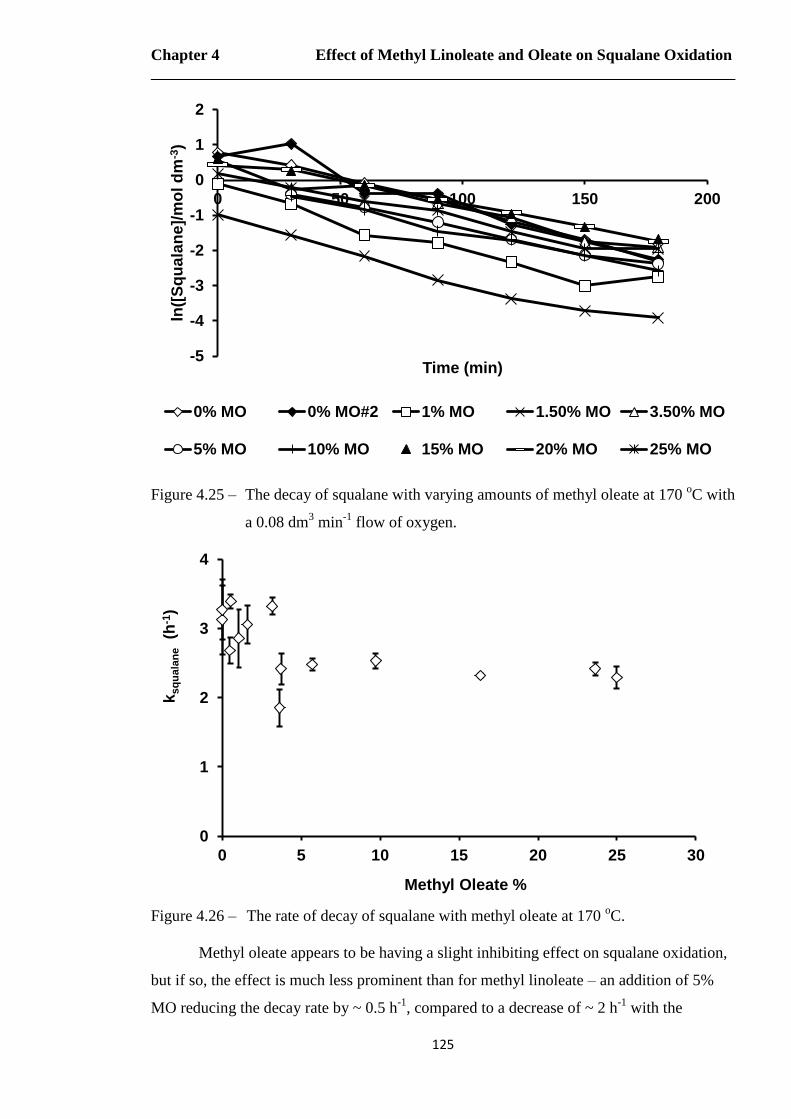
Chapter 4 Effect of Methyl Linoleate and Oleate on Squalane Oxidation
125
Figure 4.25 – The decay of squalane with varying amounts of methyl oleate at 170 oC with
a 0.08 dm3 min
-1 flow of oxygen.
Figure 4.26 – The rate of decay of squalane with methyl oleate at 170
oC.
Methyl oleate appears to be having a slight inhibiting effect on squalane oxidation,
but if so, the effect is much less prominent than for methyl linoleate – an addition of 5%
MO reducing the decay rate by ~ 0.5 h-1
, compared to a decrease of ~ 2 h-1
with the
-5
-4
-3
-2
-1
0
1
2
0 50 100 150 200
ln([
Sq
uala
ne]/
mo
l d
m-3
)
Time (min)
0% MO 0% MO#2 1% MO 1.50% MO 3.50% MO
5% MO 10% MO 15% MO 20% MO 25% MO
0
1
2
3
4
0 5 10 15 20 25 30
ksq
ua
lan
e (h
-1)
Methyl Oleate %
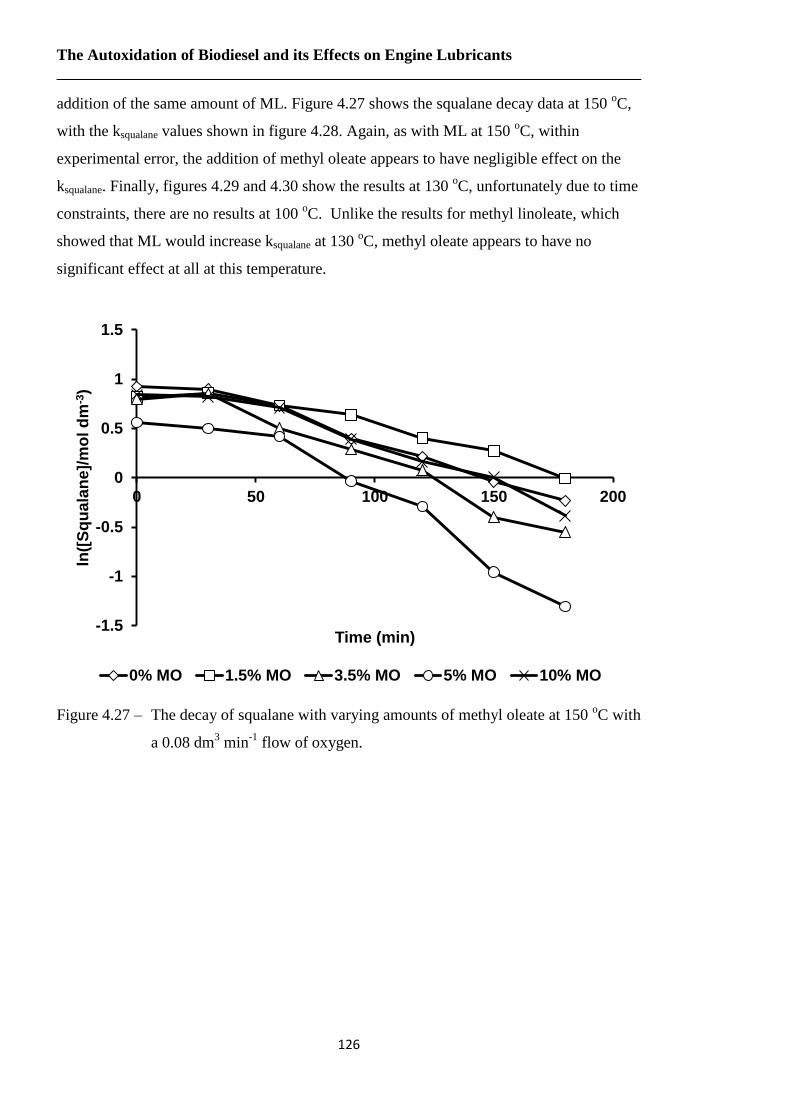
The Autoxidation of Biodiesel and its Effects on Engine Lubricants
126
addition of the same amount of ML. Figure 4.27 shows the squalane decay data at 150 oC,
with the ksqualane values shown in figure 4.28. Again, as with ML at 150 oC, within
experimental error, the addition of methyl oleate appears to have negligible effect on the
ksqualane. Finally, figures 4.29 and 4.30 show the results at 130 oC, unfortunately due to time
constraints, there are no results at 100 oC. Unlike the results for methyl linoleate, which
showed that ML would increase ksqualane at 130 oC, methyl oleate appears to have no
significant effect at all at this temperature.
Figure 4.27 – The decay of squalane with varying amounts of methyl oleate at 150 oC with
a 0.08 dm3 min
-1 flow of oxygen.
-1.5
-1
-0.5
0
0.5
1
1.5
0 50 100 150 200
ln([
Sq
uala
ne]/
mo
l d
m-3
)
Time (min)
0% MO 1.5% MO 3.5% MO 5% MO 10% MO
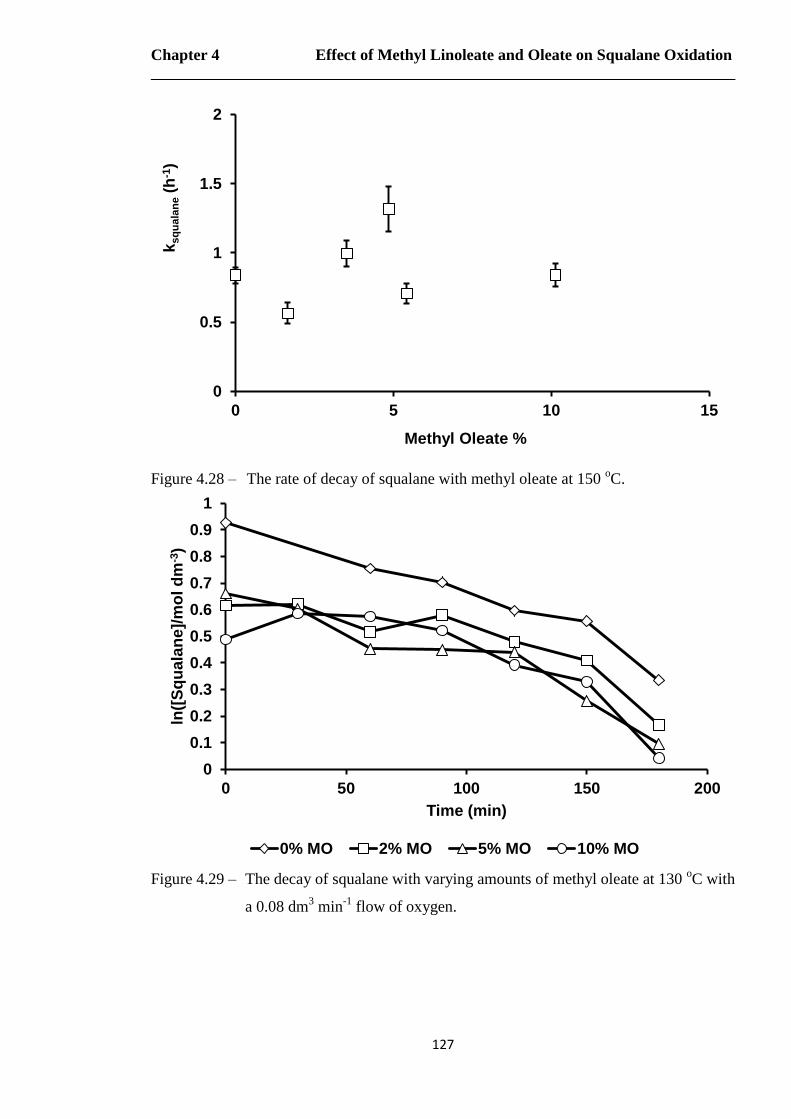
Chapter 4 Effect of Methyl Linoleate and Oleate on Squalane Oxidation
127
Figure 4.28 – The rate of decay of squalane with methyl oleate at 150 oC.
Figure 4.29 – The decay of squalane with varying amounts of methyl oleate at 130
oC with
a 0.08 dm3 min
-1 flow of oxygen.
0
0.5
1
1.5
2
0 5 10 15
ksq
ua
lan
e (
h-1
)
Methyl Oleate %
0
0.1
0.2
0.3
0.4
0.5
0.6
0.7
0.8
0.9
1
0 50 100 150 200
ln([
Sq
uala
ne]/
mo
l d
m-3
)
Time (min)
0% MO 2% MO 5% MO 10% MO

The Autoxidation of Biodiesel and its Effects on Engine Lubricants
128
Figure 4.30 – The rate of decay of squalane with methyl oleate at 130 oC.
As with methyl linoleate, the change in rate of decay of methyl oleate, kMO was also
investigated. Unfortunately, the interference on the GC spectra from one of the breakdown
products was still present (at 170 and 150 oC) and hence again, the rate constants were
calculated from fewer data points and therefore with less certainty. The decay data is
presented in figures 4.31 – 4.33 with the kMO values shown in figures 4.34 – 4.36 where it
can be seen that again, as with methyl linoleate, kMO seemed to increase as more methyl
oleate was added to the mixture, albeit far more slowly.
0
0.05
0.1
0.15
0.2
0.25
0 2 4 6 8 10
Sq
uala
ne D
ec
ay R
ate
/ h
-1
Methyl Oleate %

Chapter 4 Effect of Methyl Linoleate and Oleate on Squalane Oxidation
129
Figure 4.31 – The decay of methyl oleate in squalane at 170 oC.
Figure 4.32 – The decay of methyl oleate in squalane at 150 oC.
-16
-14
-12
-10
-8
-6
-4
-2
0
0 10 20 30 40 50 60
ln([
MO
]/m
ol
dm
-3)
Time (min)
0.5% MO 1.5% MO 3.5% MO 10% MO
15% MO 20% MO 25% MO
-16
-14
-12
-10
-8
-6
-4
-2
0
0 20 40 60 80 100
ln([
MO
]/m
ol
dm
-3)
Time (min)
1.5 MO% 3.5% MO 5% MO 5% MO#2 10% MO

The Autoxidation of Biodiesel and its Effects on Engine Lubricants
130
Figure 4.33 – The decay of methyl oleate in squalane at 130 oC.
Figure 4.34 – The rate of decay of methyl oleate in squalane at 170 oC.
-7
-6
-5
-4
-3
-2
-1
0
0 50 100 150 200
ln (
[MO
]/m
ol
dm
-3)
Time (min)
2% MO 5% MO 10% MO
0
2
4
6
8
10
12
0 5 10 15 20 25 30
kM
O (h
-1)
Methyl Oleate %
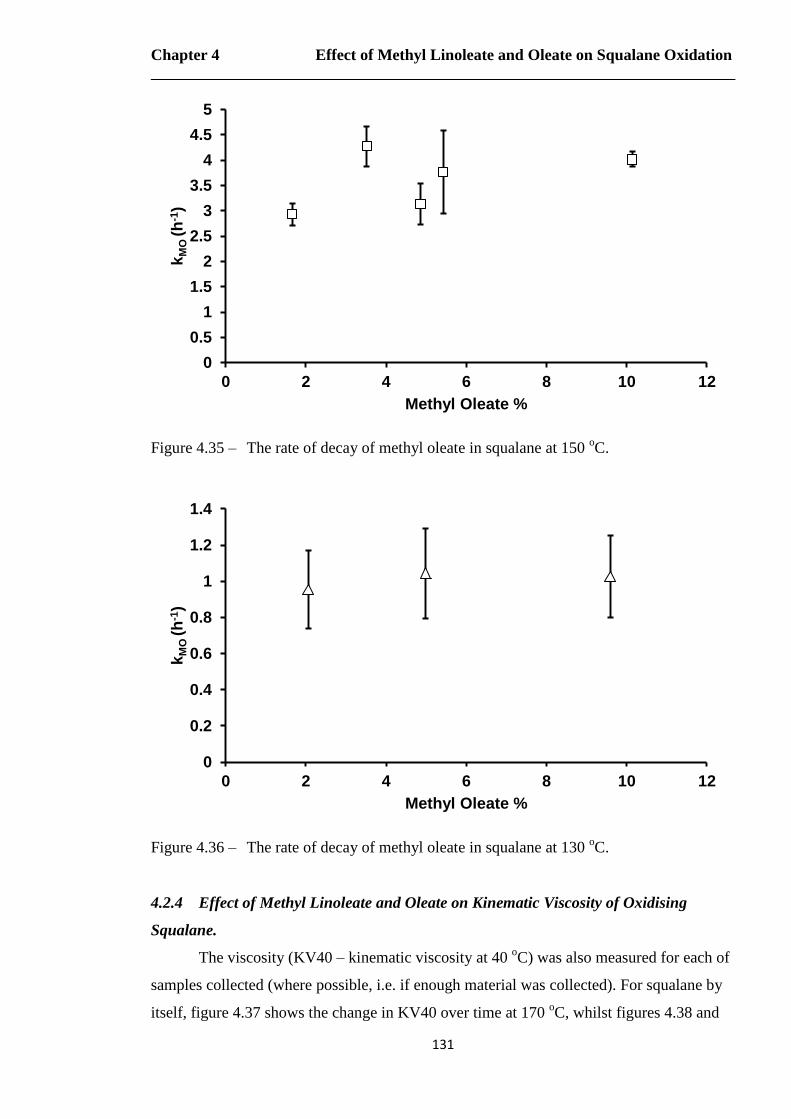
Chapter 4 Effect of Methyl Linoleate and Oleate on Squalane Oxidation
131
Figure 4.35 – The rate of decay of methyl oleate in squalane at 150 oC.
Figure 4.36 – The rate of decay of methyl oleate in squalane at 130 oC.
4.2.4 Effect of Methyl Linoleate and Oleate on Kinematic Viscosity of Oxidising
Squalane.
The viscosity (KV40 – kinematic viscosity at 40 oC) was also measured for each of
samples collected (where possible, i.e. if enough material was collected). For squalane by
itself, figure 4.37 shows the change in KV40 over time at 170 oC, whilst figures 4.38 and
0
0.5
1
1.5
2
2.5
3
3.5
4
4.5
5
0 2 4 6 8 10 12
kM
O (h
-1)
Methyl Oleate %
0
0.2
0.4
0.6
0.8
1
1.2
1.4
0 2 4 6 8 10 12
kM
O (h
-1)
Methyl Oleate %

The Autoxidation of Biodiesel and its Effects on Engine Lubricants
132
4.39 show the same data for 150 oC and 130
oC respectively. The exponential-like curve is
typical of those obtained for these reactions reported here, although if the reaction is
coming to a close, the curve can start to flatten out leading to a more sigmoid pattern as
shown by squalane at 150 oC (figure 4.38). Part of the reason for this is that the KV40 of
the liquid throughout the reaction is also affected by a mixture of dilution from lighter
compounds (such as scission products) and thickening from heavier compounds (oxidation
products, polymers). This makes getting sufficient data points to get a gradient to measure
a rate of change in KV40 for comparison quite problematic. In addition as biodiesel
components are less viscous than lubricants (squalane was measured to have KV40 of
19.14 cSt, compared to methyl linoleate at just 3.34 cSt), upon their addition to squalane
the overall initial KV40 of the liquid decreases. For these reasons to provide a basis for
comparison at a single temperature for all mixtures, the overall change in KV40, i.e.
KV40final – KV40initial of the mixtures was measured and to compare between temperatures,
the change in KV40 was used after 1 hour as this was the longest time that all experiments
ran. At 100 oC, the change in KV40 after an hour was too negligible to be measured
accurately within the confines of the equipment available and as a result these data are not
shown.
The trends observed for KV40 upon the addition of methyl linoleate showed good
correlation with those for ksqualane – the addition of methyl linoleate enhanced KV40
increase at 130 and – to a lesser degree – at 150 oC, but inhibited it at 170
oC (see figure
4.40).
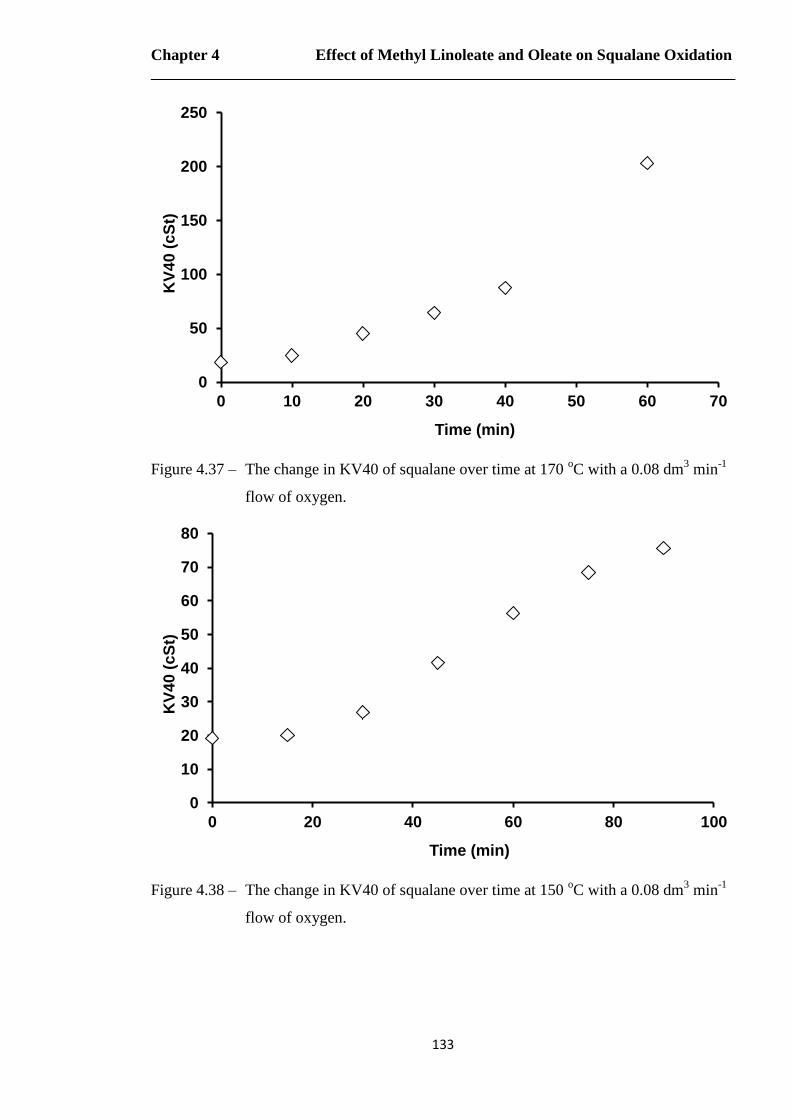
Chapter 4 Effect of Methyl Linoleate and Oleate on Squalane Oxidation
133
Figure 4.37 – The change in KV40 of squalane over time at 170 oC with a 0.08 dm
3 min
-1
flow of oxygen.
Figure 4.38 – The change in KV40 of squalane over time at 150 oC with a 0.08 dm
3 min
-1
flow of oxygen.
0
50
100
150
200
250
0 10 20 30 40 50 60 70
KV
40
(cS
t)
Time (min)
0
10
20
30
40
50
60
70
80
0 20 40 60 80 100
KV
40
(cS
t)
Time (min)
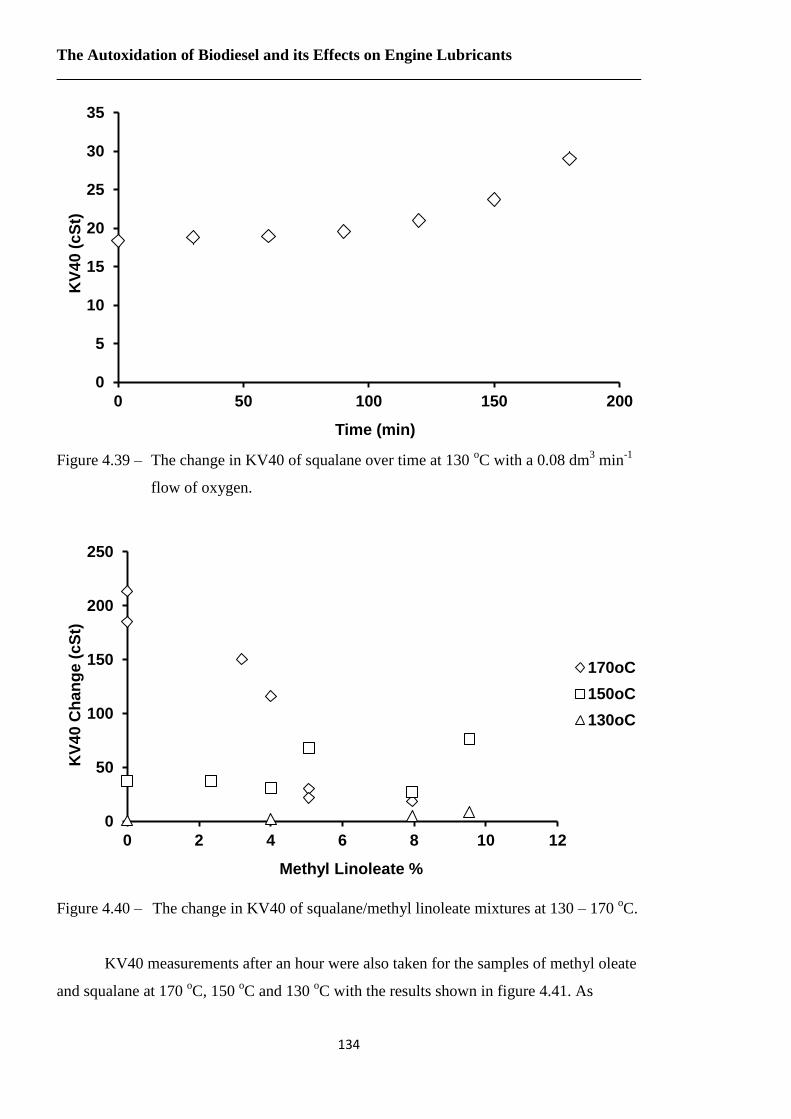
The Autoxidation of Biodiesel and its Effects on Engine Lubricants
134
Figure 4.39 – The change in KV40 of squalane over time at 130
oC with a 0.08 dm
3 min
-1
flow of oxygen.
Figure 4.40 – The change in KV40 of squalane/methyl linoleate mixtures at 130 – 170 oC.
KV40 measurements after an hour were also taken for the samples of methyl oleate
and squalane at 170 oC, 150
oC and 130
oC with the results shown in figure 4.41. As
0
5
10
15
20
25
30
35
0 50 100 150 200
KV
40
(cS
t)
Time (min)
0
50
100
150
200
250
0 2 4 6 8 10 12
KV
40
Ch
an
ge
(cS
t)
Methyl Linoleate %
170oC
150oC
130oC
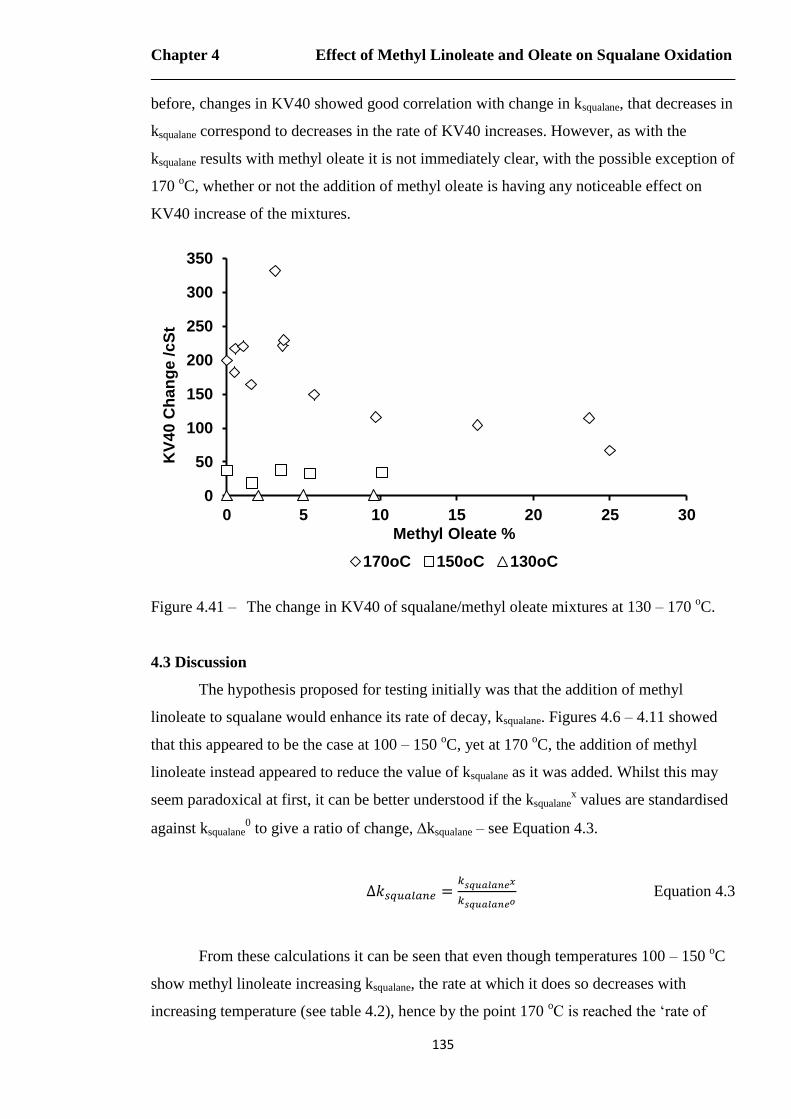
Chapter 4 Effect of Methyl Linoleate and Oleate on Squalane Oxidation
135
before, changes in KV40 showed good correlation with change in ksqualane, that decreases in
ksqualane correspond to decreases in the rate of KV40 increases. However, as with the
ksqualane results with methyl oleate it is not immediately clear, with the possible exception of
170 oC, whether or not the addition of methyl oleate is having any noticeable effect on
KV40 increase of the mixtures.
Figure 4.41 – The change in KV40 of squalane/methyl oleate mixtures at 130 – 170 oC.
4.3 Discussion
The hypothesis proposed for testing initially was that the addition of methyl
linoleate to squalane would enhance its rate of decay, ksqualane. Figures 4.6 – 4.11 showed
that this appeared to be the case at 100 – 150 oC, yet at 170
oC, the addition of methyl
linoleate instead appeared to reduce the value of ksqualane as it was added. Whilst this may
seem paradoxical at first, it can be better understood if the ksqualanex values are standardised
against ksqualane0 to give a ratio of change, ksqualane – see Equation 4.3.
Equation 4.3
From these calculations it can be seen that even though temperatures 100 – 150 oC
show methyl linoleate increasing ksqualane, the rate at which it does so decreases with
increasing temperature (see table 4.2), hence by the point 170 oC is reached the ‘rate of
0
50
100
150
200
250
300
350
0 5 10 15 20 25 30
KV
40
Ch
an
ge
/c
St
Methyl Oleate %
170oC 150oC 130oC
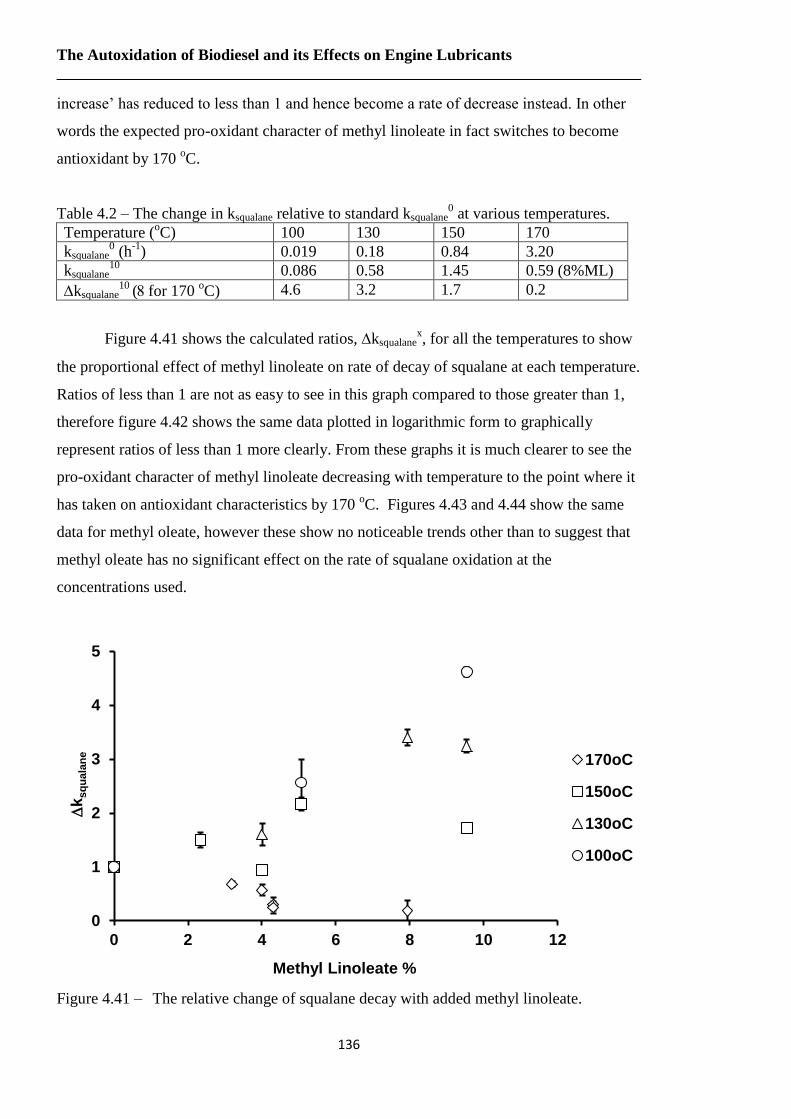
The Autoxidation of Biodiesel and its Effects on Engine Lubricants
136
increase’ has reduced to less than 1 and hence become a rate of decrease instead. In other
words the expected pro-oxidant character of methyl linoleate in fact switches to become
antioxidant by 170 oC.
Table 4.2 – The change in ksqualane relative to standard ksqualane0 at various temperatures.
Temperature (oC) 100 130 150 170
ksqualane0 (h
-1) 0.019 0.18 0.84 3.20
ksqualane10
0.086 0.58 1.45 0.59 (8%ML)
ksqualane10
( for 170
oC) 4.6 3.2 1.7 0.2
Figure 4.41 shows the calculated ratios, ksqualanex, for all the temperatures to show
the proportional effect of methyl linoleate on rate of decay of squalane at each temperature.
Ratios of less than 1 are not as easy to see in this graph compared to those greater than 1,
therefore figure 4.42 shows the same data plotted in logarithmic form to graphically
represent ratios of less than 1 more clearly. From these graphs it is much clearer to see the
pro-oxidant character of methyl linoleate decreasing with temperature to the point where it
has taken on antioxidant characteristics by 170 oC. Figures 4.43 and 4.44 show the same
data for methyl oleate, however these show no noticeable trends other than to suggest that
methyl oleate has no significant effect on the rate of squalane oxidation at the
concentrations used.
Figure 4.41 – The relative change of squalane decay with added methyl linoleate.
0
1
2
3
4
5
0 2 4 6 8 10 12
k
sq
ua
lan
e
Methyl Linoleate %
170oC
150oC
130oC
100oC
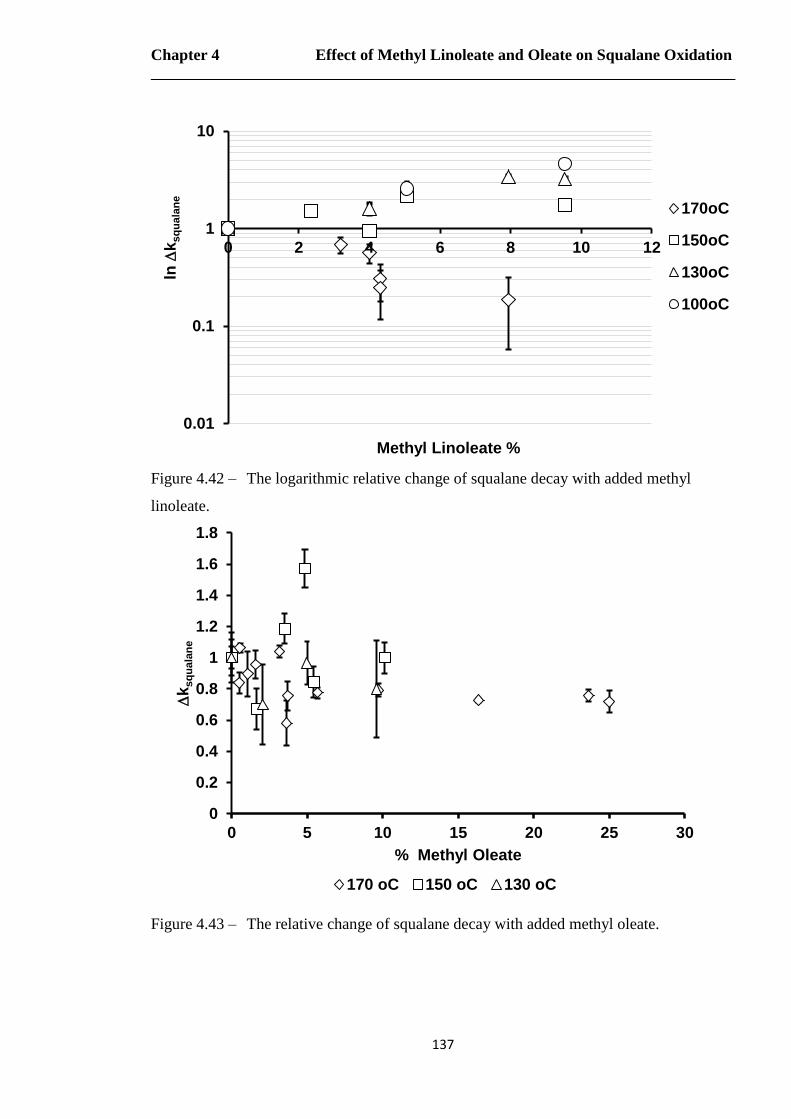
Chapter 4 Effect of Methyl Linoleate and Oleate on Squalane Oxidation
137
Figure 4.42 – The logarithmic relative change of squalane decay with added methyl
linoleate.
Figure 4.43 – The relative change of squalane decay with added methyl oleate.
0.01
0.1
1
10
0 2 4 6 8 10 12
ln
ksq
ua
lan
e
Methyl Linoleate %
170oC
150oC
130oC
100oC
0
0.2
0.4
0.6
0.8
1
1.2
1.4
1.6
1.8
0 5 10 15 20 25 30
k
sq
ua
lan
e
% Methyl Oleate
170 oC 150 oC 130 oC
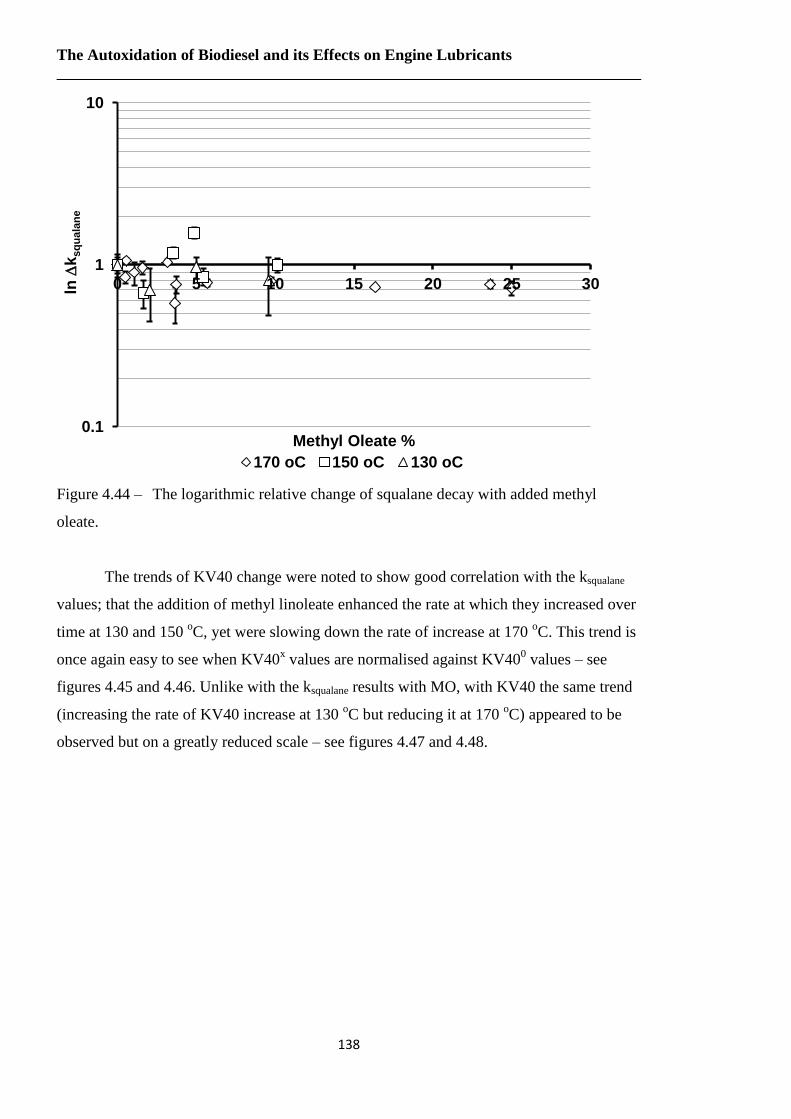
The Autoxidation of Biodiesel and its Effects on Engine Lubricants
138
Figure 4.44 – The logarithmic relative change of squalane decay with added methyl
oleate.
The trends of KV40 change were noted to show good correlation with the ksqualane
values; that the addition of methyl linoleate enhanced the rate at which they increased over
time at 130 and 150 oC, yet were slowing down the rate of increase at 170
oC. This trend is
once again easy to see when KV40x values are normalised against KV40
0 values – see
figures 4.45 and 4.46. Unlike with the ksqualane results with MO, with KV40 the same trend
(increasing the rate of KV40 increase at 130 oC but reducing it at 170
oC) appeared to be
observed but on a greatly reduced scale – see figures 4.47 and 4.48.
0.1
1
10
0 5 10 15 20 25 30ln
ksq
ua
lan
e
Methyl Oleate %
170 oC 150 oC 130 oC
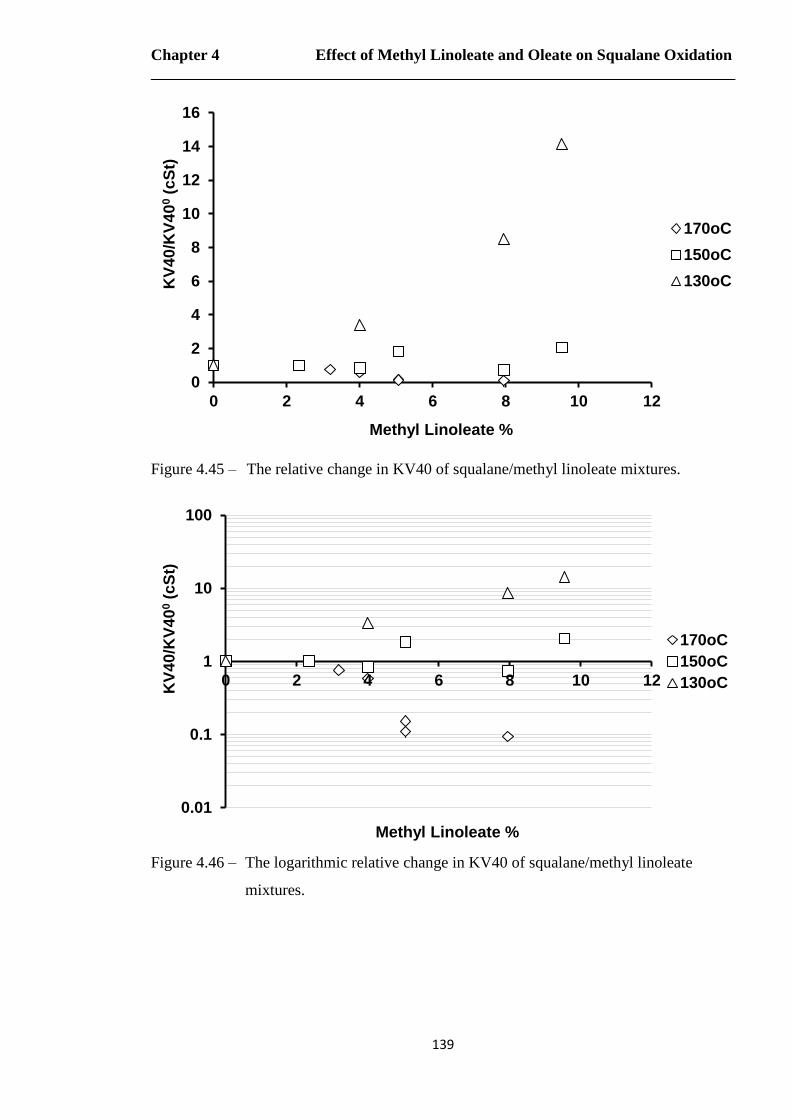
Chapter 4 Effect of Methyl Linoleate and Oleate on Squalane Oxidation
139
Figure 4.45 – The relative change in KV40 of squalane/methyl linoleate mixtures.
Figure 4.46 – The logarithmic relative change in KV40 of squalane/methyl linoleate
mixtures.
0
2
4
6
8
10
12
14
16
0 2 4 6 8 10 12
KV
40
/KV
40
0 (
cS
t)
Methyl Linoleate %
170oC
150oC
130oC
0.01
0.1
1
10
100
0 2 4 6 8 10 12
KV
40
/KV
40
0 (
cS
t)
Methyl Linoleate %
170oC
150oC
130oC
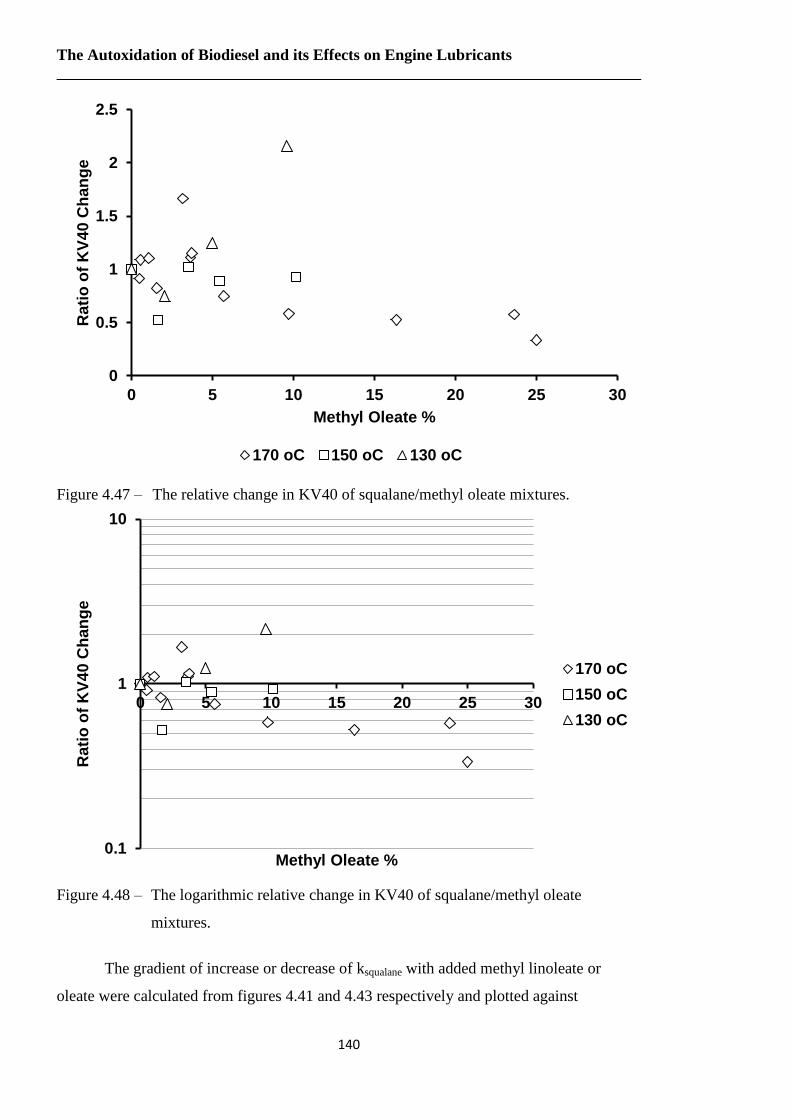
The Autoxidation of Biodiesel and its Effects on Engine Lubricants
140
Figure 4.47 – The relative change in KV40 of squalane/methyl oleate mixtures.
Figure 4.48 – The logarithmic relative change in KV40 of squalane/methyl oleate
mixtures.
The gradient of increase or decrease of ksqualane with added methyl linoleate or
oleate were calculated from figures 4.41 and 4.43 respectively and plotted against
0
0.5
1
1.5
2
2.5
0 5 10 15 20 25 30
Rati
o o
f K
V4
0 C
han
ge
Methyl Oleate %
170 oC 150 oC 130 oC
0.1
1
10
0 5 10 15 20 25 30
Rati
o o
f K
V4
0 C
han
ge
Methyl Oleate %
170 oC
150 oC
130 oC
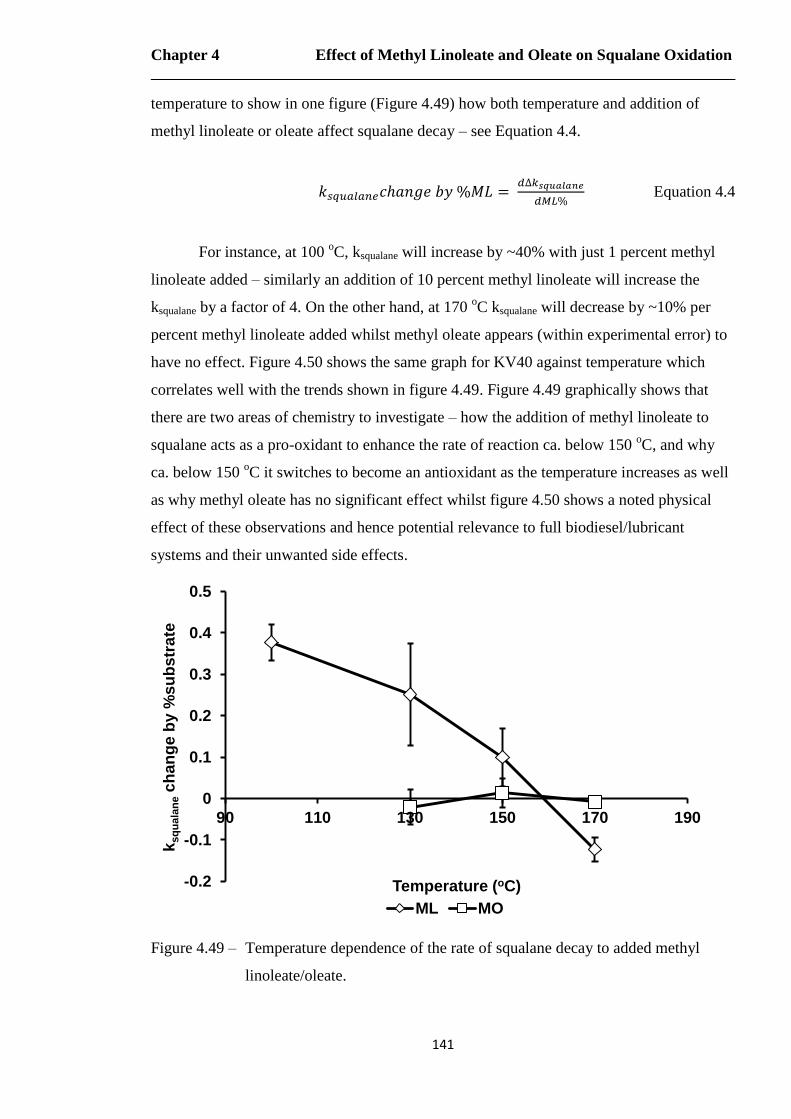
Chapter 4 Effect of Methyl Linoleate and Oleate on Squalane Oxidation
141
temperature to show in one figure (Figure 4.49) how both temperature and addition of
methyl linoleate or oleate affect squalane decay – see Equation 4.4.
Equation 4.4
For instance, at 100 oC, ksqualane will increase by ~40% with just 1 percent methyl
linoleate added – similarly an addition of 10 percent methyl linoleate will increase the
ksqualane by a factor of 4. On the other hand, at 170 oC ksqualane will decrease by ~10% per
percent methyl linoleate added whilst methyl oleate appears (within experimental error) to
have no effect. Figure 4.50 shows the same graph for KV40 against temperature which
correlates well with the trends shown in figure 4.49. Figure 4.49 graphically shows that
there are two areas of chemistry to investigate – how the addition of methyl linoleate to
squalane acts as a pro-oxidant to enhance the rate of reaction ca. below 150 oC, and why
ca. below 150 oC it switches to become an antioxidant as the temperature increases as well
as why methyl oleate has no significant effect whilst figure 4.50 shows a noted physical
effect of these observations and hence potential relevance to full biodiesel/lubricant
systems and their unwanted side effects.
Figure 4.49 – Temperature dependence of the rate of squalane decay to added methyl
linoleate/oleate.
-0.2
-0.1
0
0.1
0.2
0.3
0.4
0.5
90 110 130 150 170 190
ksq
ua
lan
e c
han
ge
by %
su
bstr
ate
Temperature (oC)
ML MO
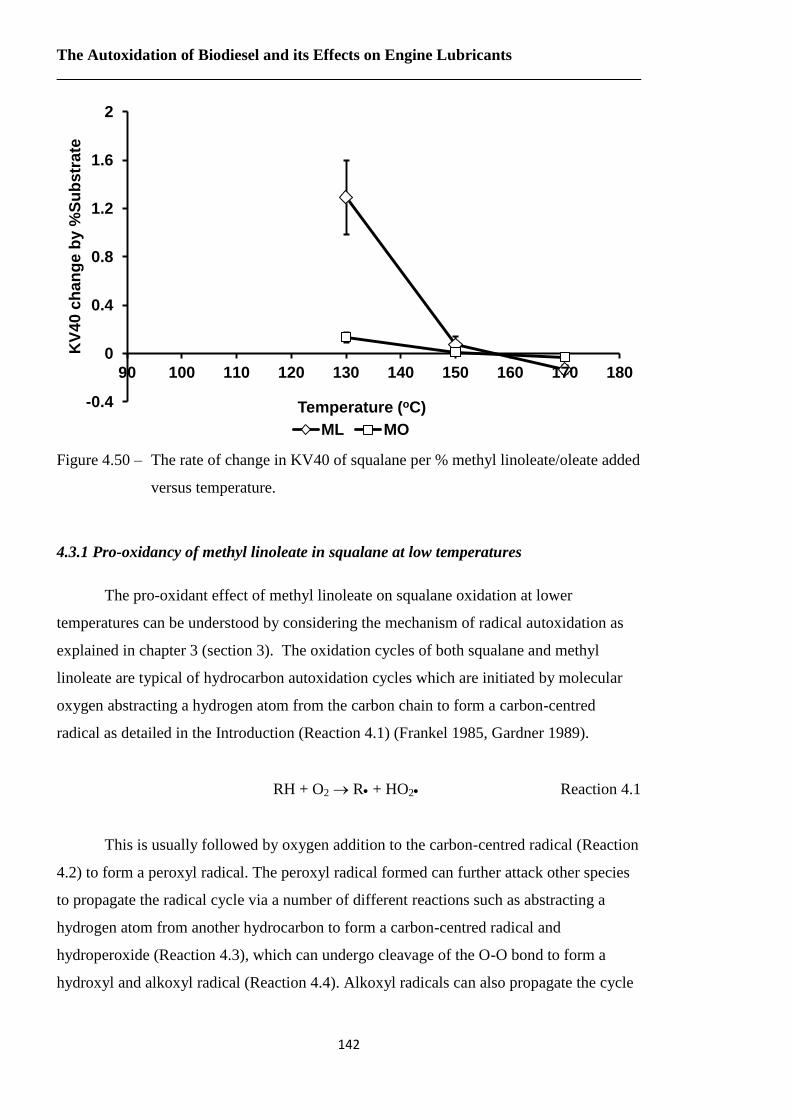
The Autoxidation of Biodiesel and its Effects on Engine Lubricants
142
Figure 4.50 – The rate of change in KV40 of squalane per % methyl linoleate/oleate added
versus temperature.
4.3.1 Pro-oxidancy of methyl linoleate in squalane at low temperatures
The pro-oxidant effect of methyl linoleate on squalane oxidation at lower
temperatures can be understood by considering the mechanism of radical autoxidation as
explained in chapter 3 (section 3). The oxidation cycles of both squalane and methyl
linoleate are typical of hydrocarbon autoxidation cycles which are initiated by molecular
oxygen abstracting a hydrogen atom from the carbon chain to form a carbon-centred
radical as detailed in the Introduction (Reaction 4.1) (Frankel 1985, Gardner 1989).
RH + O2 R + HO2 Reaction 4.1
This is usually followed by oxygen addition to the carbon-centred radical (Reaction
4.2) to form a peroxyl radical. The peroxyl radical formed can further attack other species
to propagate the radical cycle via a number of different reactions such as abstracting a
hydrogen atom from another hydrocarbon to form a carbon-centred radical and
hydroperoxide (Reaction 4.3), which can undergo cleavage of the O-O bond to form a
hydroxyl and alkoxyl radical (Reaction 4.4). Alkoxyl radicals can also propagate the cycle
-0.4
0
0.4
0.8
1.2
1.6
2
90 100 110 120 130 140 150 160 170 180
KV
40
ch
an
ge
by %
Su
bstr
ate
Temperature (oC)
ML MO

Chapter 4 Effect of Methyl Linoleate and Oleate on Squalane Oxidation
143
by hydrogen atom abstraction to form an alcohol and carbon-centred radical (Reaction
4.5).
R + O2 RO2 Reaction 4.2
RO2 + RH RO2H + R Reaction 4.3
RO2H RO + OH Reaction 4.4
RO + RH ROH + R Reaction 4.5
This chain reaction cycle is summarised for squalane in Figure 4.51 and for methyl
linoleate in figure 4.52.
Figure 4.51 – The autoxidation cycle of squalane.
Figure 4.52 – The autoxidation cycle of methyl linoleate.
C
OO
OO
O
OH
O OH
OHO ++
4.2
4.3
4.4+
C
R R
OOH
R
OO
H
R
OO
R
O
R
OH
R
O
OH
ORH
++
+
4.2
4.3
4.4
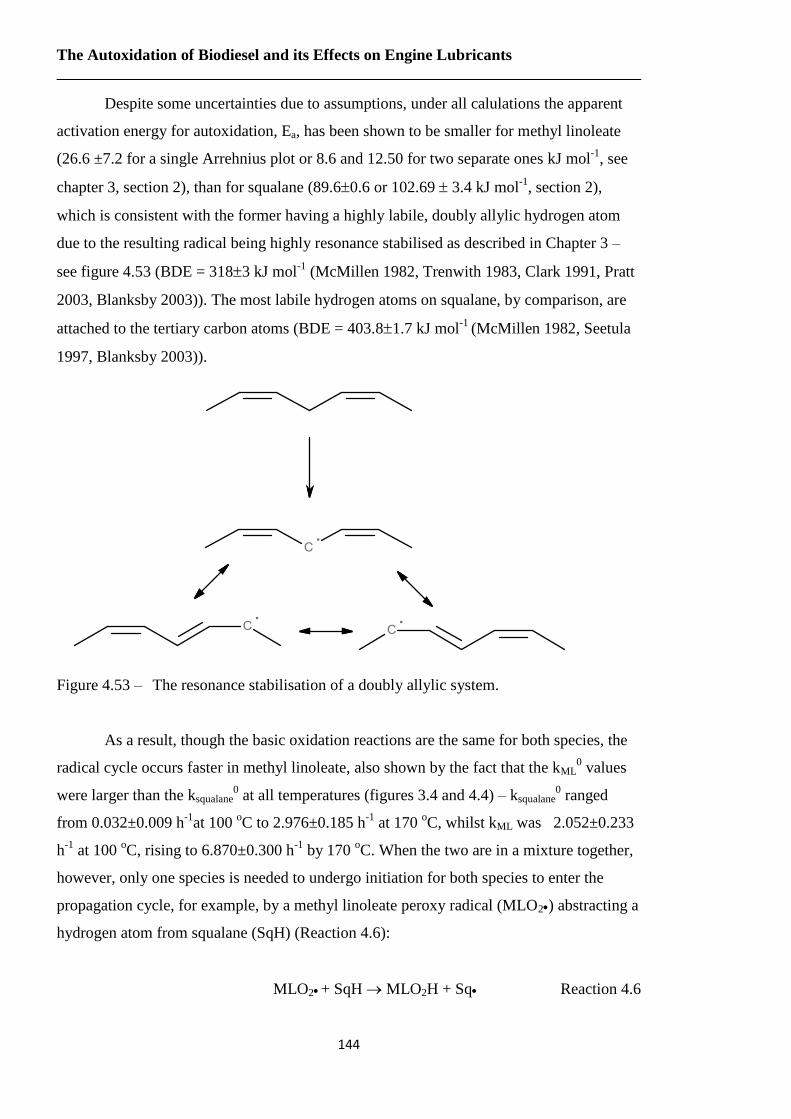
The Autoxidation of Biodiesel and its Effects on Engine Lubricants
144
Despite some uncertainties due to assumptions, under all calulations the apparent
activation energy for autoxidation, Ea, has been shown to be smaller for methyl linoleate
(26.6 ±7.2 for a single Arrehnius plot or 8.6 and 12.50 for two separate ones kJ mol-1
, see
chapter 3, section 2), than for squalane (89.60.6 or 102.69 3.4 kJ mol-1
, section 2),
which is consistent with the former having a highly labile, doubly allylic hydrogen atom
due to the resulting radical being highly resonance stabilised as described in Chapter 3 –
see figure 4.53 (BDE = 3183 kJ mol-1
(McMillen 1982, Trenwith 1983, Clark 1991, Pratt
2003, Blanksby 2003)). The most labile hydrogen atoms on squalane, by comparison, are
attached to the tertiary carbon atoms (BDE = 403.81.7 kJ mol-1
(McMillen 1982, Seetula
1997, Blanksby 2003)).
Figure 4.53 – The resonance stabilisation of a doubly allylic system.
As a result, though the basic oxidation reactions are the same for both species, the
radical cycle occurs faster in methyl linoleate, also shown by the fact that the kML0 values
were larger than the ksqualane0 at all temperatures (figures 3.4 and 4.4) – ksqualane
0 ranged
from 0.032±0.009 h-1
at 100 oC to 2.976±0.185 h
-1 at 170
oC, whilst kML was 2.052±0.233
h-1
at 100 oC, rising to 6.870±0.300 h
-1 by 170
oC. When the two are in a mixture together,
however, only one species is needed to undergo initiation for both species to enter the
propagation cycle, for example, by a methyl linoleate peroxy radical (MLO2) abstracting a
hydrogen atom from squalane (SqH) (Reaction 4.6):
MLO2 + SqH MLO2H + Sq Reaction 4.6
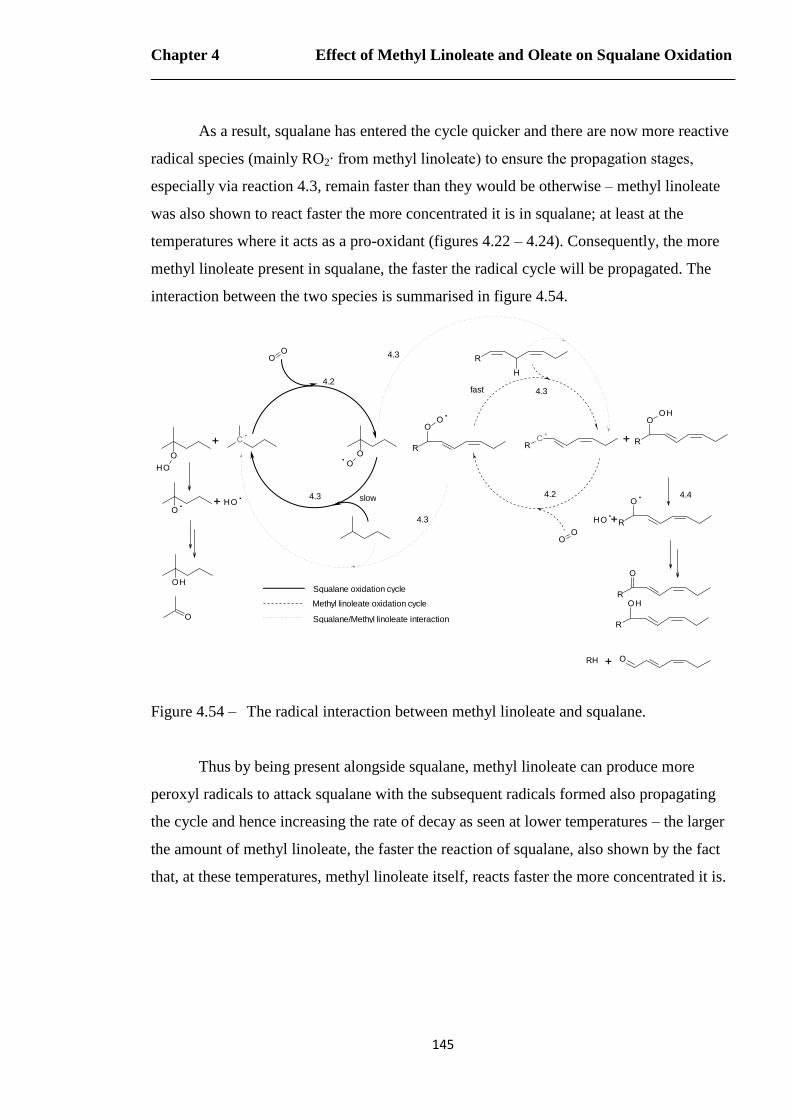
Chapter 4 Effect of Methyl Linoleate and Oleate on Squalane Oxidation
145
As a result, squalane has entered the cycle quicker and there are now more reactive
radical species (mainly RO2∙ from methyl linoleate) to ensure the propagation stages,
especially via reaction 4.3, remain faster than they would be otherwise – methyl linoleate
was also shown to react faster the more concentrated it is in squalane; at least at the
temperatures where it acts as a pro-oxidant (figures 4.22 – 4.24). Consequently, the more
methyl linoleate present in squalane, the faster the radical cycle will be propagated. The
interaction between the two species is summarised in figure 4.54.
4.4
4.2
4.3 4.2
4.3
4.3
4.3fast
slow
Squalane oxidation cycle
Methyl linoleate oxidation cycle
Squalane/Methyl linoleate interaction
Figure 4.54 – The radical interaction between methyl linoleate and squalane.
Thus by being present alongside squalane, methyl linoleate can produce more
peroxyl radicals to attack squalane with the subsequent radicals formed also propagating
the cycle and hence increasing the rate of decay as seen at lower temperatures – the larger
the amount of methyl linoleate, the faster the reaction of squalane, also shown by the fact
that, at these temperatures, methyl linoleate itself, reacts faster the more concentrated it is.
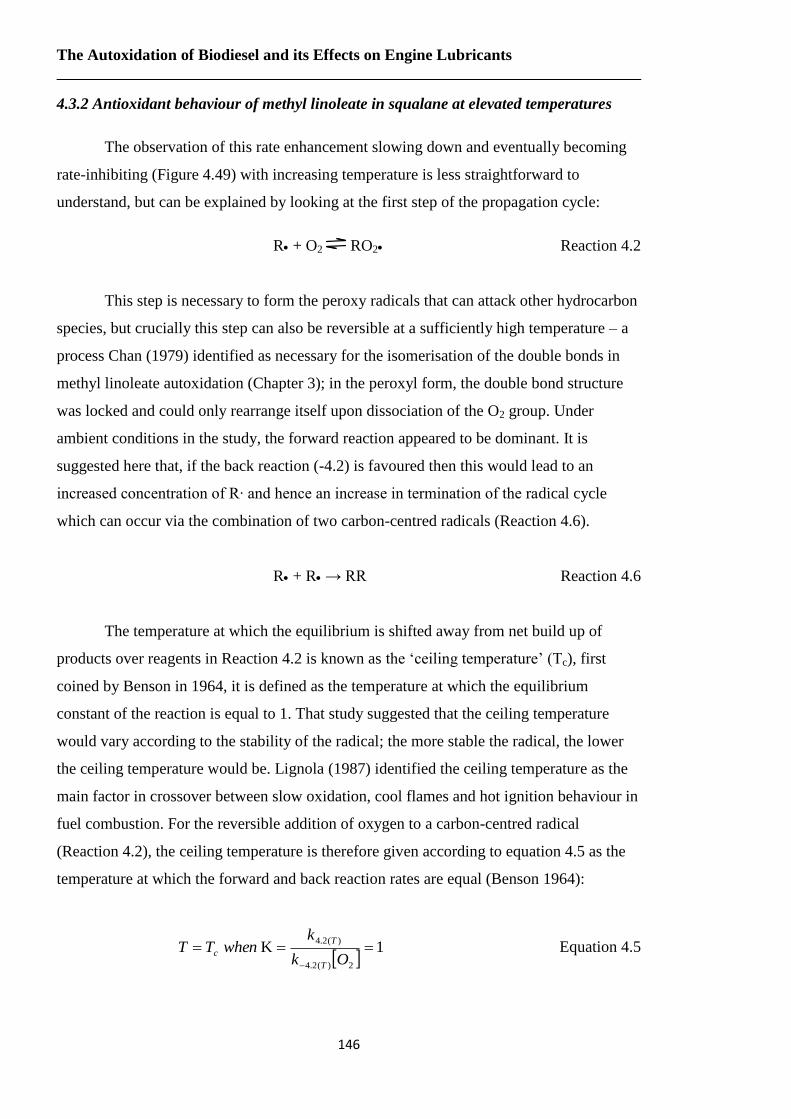
The Autoxidation of Biodiesel and its Effects on Engine Lubricants
146
4.3.2 Antioxidant behaviour of methyl linoleate in squalane at elevated temperatures
The observation of this rate enhancement slowing down and eventually becoming
rate-inhibiting (Figure 4.49) with increasing temperature is less straightforward to
understand, but can be explained by looking at the first step of the propagation cycle:
R + O2 RO2 Reaction 4.2
This step is necessary to form the peroxy radicals that can attack other hydrocarbon
species, but crucially this step can also be reversible at a sufficiently high temperature – a
process Chan (1979) identified as necessary for the isomerisation of the double bonds in
methyl linoleate autoxidation (Chapter 3); in the peroxyl form, the double bond structure
was locked and could only rearrange itself upon dissociation of the O2 group. Under
ambient conditions in the study, the forward reaction appeared to be dominant. It is
suggested here that, if the back reaction (-4.2) is favoured then this would lead to an
increased concentration of R∙ and hence an increase in termination of the radical cycle
which can occur via the combination of two carbon-centred radicals (Reaction 4.6).
R + R → RR Reaction 4.6
The temperature at which the equilibrium is shifted away from net build up of
products over reagents in Reaction 4.2 is known as the ‘ceiling temperature’ (Tc), first
coined by Benson in 1964, it is defined as the temperature at which the equilibrium
constant of the reaction is equal to 1. That study suggested that the ceiling temperature
would vary according to the stability of the radical; the more stable the radical, the lower
the ceiling temperature would be. Lignola (1987) identified the ceiling temperature as the
main factor in crossover between slow oxidation, cool flames and hot ignition behaviour in
fuel combustion. For the reversible addition of oxygen to a carbon-centred radical
(Reaction 4.2), the ceiling temperature is therefore given according to equation 4.5 as the
temperature at which the forward and back reaction rates are equal (Benson 1964):
1K
2)(2.4
)(2.4
Ok
kwhenTT
T
T
c Equation 4.5
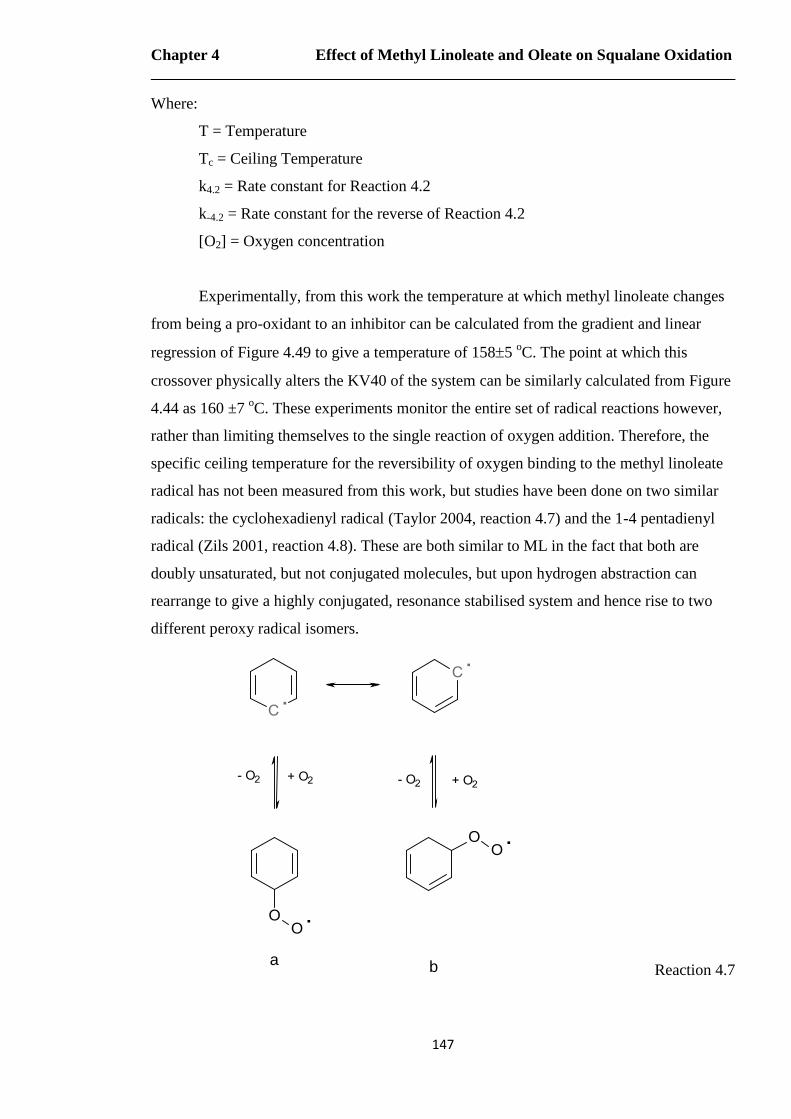
Chapter 4 Effect of Methyl Linoleate and Oleate on Squalane Oxidation
147
Where:
T = Temperature
Tc = Ceiling Temperature
k4.2 = Rate constant for Reaction 4.2
k-4.2 = Rate constant for the reverse of Reaction 4.2
[O2] = Oxygen concentration
Experimentally, from this work the temperature at which methyl linoleate changes
from being a pro-oxidant to an inhibitor can be calculated from the gradient and linear
regression of Figure 4.49 to give a temperature of 1585 oC. The point at which this
crossover physically alters the KV40 of the system can be similarly calculated from Figure
4.44 as 160 ±7 oC. These experiments monitor the entire set of radical reactions however,
rather than limiting themselves to the single reaction of oxygen addition. Therefore, the
specific ceiling temperature for the reversibility of oxygen binding to the methyl linoleate
radical has not been measured from this work, but studies have been done on two similar
radicals: the cyclohexadienyl radical (Taylor 2004, reaction 4.7) and the 1-4 pentadienyl
radical (Zils 2001, reaction 4.8). These are both similar to ML in the fact that both are
doubly unsaturated, but not conjugated molecules, but upon hydrogen abstraction can
rearrange to give a highly conjugated, resonance stabilised system and hence rise to two
different peroxy radical isomers.
a b Reaction 4.7
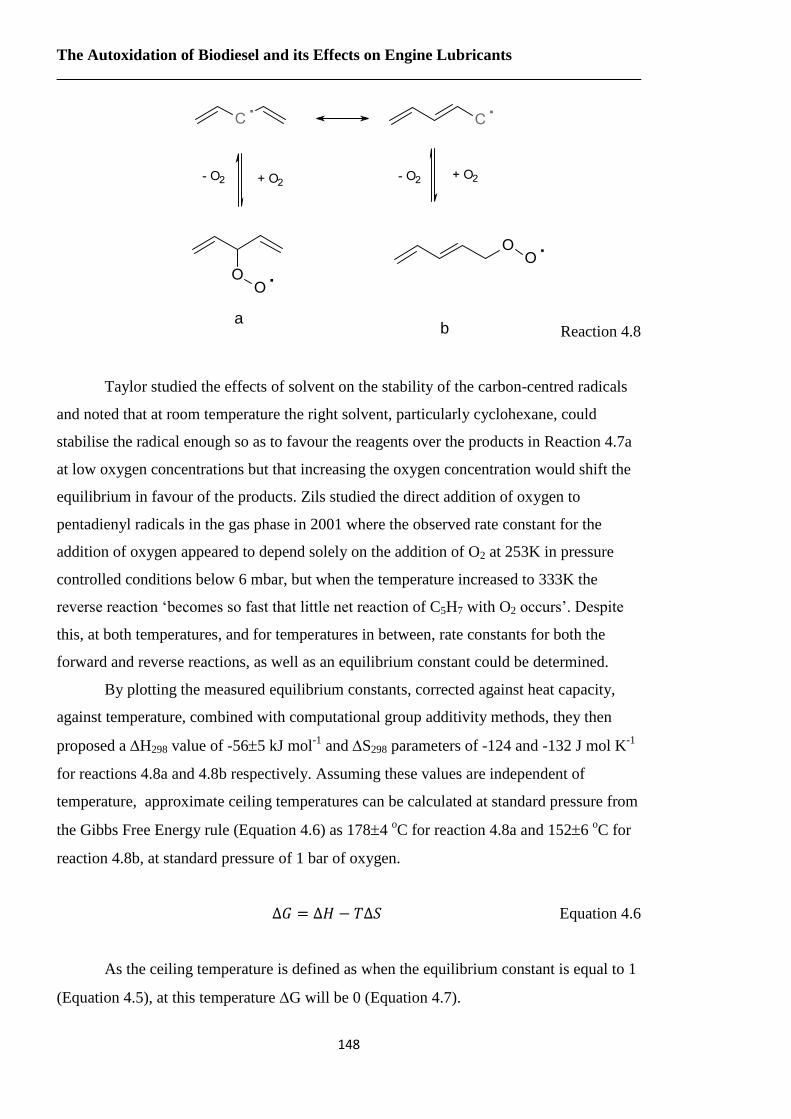
The Autoxidation of Biodiesel and its Effects on Engine Lubricants
148
ab Reaction 4.8
Taylor studied the effects of solvent on the stability of the carbon-centred radicals
and noted that at room temperature the right solvent, particularly cyclohexane, could
stabilise the radical enough so as to favour the reagents over the products in Reaction 4.7a
at low oxygen concentrations but that increasing the oxygen concentration would shift the
equilibrium in favour of the products. Zils studied the direct addition of oxygen to
pentadienyl radicals in the gas phase in 2001 where the observed rate constant for the
addition of oxygen appeared to depend solely on the addition of O2 at 253K in pressure
controlled conditions below 6 mbar, but when the temperature increased to 333K the
reverse reaction ‘becomes so fast that little net reaction of C5H7 with O2 occurs’. Despite
this, at both temperatures, and for temperatures in between, rate constants for both the
forward and reverse reactions, as well as an equilibrium constant could be determined.
By plotting the measured equilibrium constants, corrected against heat capacity,
against temperature, combined with computational group additivity methods, they then
proposed a H298 value of -565 kJ mol-1
and S298 parameters of -124 and -132 J mol K-1
for reactions 4.8a and 4.8b respectively. Assuming these values are independent of
temperature, approximate ceiling temperatures can be calculated at standard pressure from
the Gibbs Free Energy rule (Equation 4.6) as 1784 oC for reaction 4.8a and 1526
oC for
reaction 4.8b, at standard pressure of 1 bar of oxygen.
Equation 4.6
As the ceiling temperature is defined as when the equilibrium constant is equal to 1
(Equation 4.5), at this temperature G will be 0 (Equation 4.7).
Chapter 4 Effect of Methyl Linoleate and Oleate on Squalane Oxidation
149
Equation 4.7
If G = 0 then Equation 4.6 can be rearranged to give:
Equation 4.8
However, in this work the oxygen concentration in the liquid mixture will be
noticeably lower than in the reactor headspace, according to Henry’s Law – for a typical
branched hydrocarbon under standard pressure of oxygen, the mole fraction of oxygen in
the liquid is 23.6 kPa at 100 oC, dropping to 22.0 kPa at 170
oC and 101.325 kPa partial
pressure of oxygen (Batino 1983). To calculate the effect pressure will have on the ceiling
temperature it is necessary to define K as the ratio of the forward and reverse rate
constants, the forward being dependent on oxygen content from Equation 4.5. Combining
Equations 4.6 and 4.7 gives:
Equation 4.9
Substituting Equation 4.5 in:
( [ ]
) Equation 4.10
Dividing both sides by -RT:
(
[ ]
) Equation 4.11
At standard pressure [O2] = 1bar, hence [O2]. Hence from Gibb’s free energy law
and taking exponentials from both sides:
R
S
RT
H
eeOk
kc
22.4
2.4 Equation 4.12
The Autoxidation of Biodiesel and its Effects on Engine Lubricants
150
From equation 4.8, at T = Tc,
[ ] Equation 4.13
Substituting 4.13 into 4.12:
R
S
RT
H
eeOk
Okc
22.4
22.4 Equation 4.14
Taking natural logs of both sides and cancelling gives:
R
S
RT
H
O
O
c
2
2ln Equation 4.15
Rearranging gives:
2
2lnO
ORS
HTc
Equation 4.16
Using the previous values for H and S and using the calculated value (from
Batino’s work on Henry’s Law constants for O2 dissolved in branched hydrocarbons) of
22.38 kPa for [O2] gives ceiling temperatures at these pressures of:
Tc 4.8a = 173 6 oC
Tc 4.8b = 146 7 oC
This is in good agreement with the crossover temperature 158 5 oC measured
experimentally in this work, especially as ML oxidation will occur through a mixture of
both reactions as shown in Chapter 3. It would appear though, that reaction 4.8b is
favoured due to the formation of the conjugated structure – the dominant peaks in the GC
traces were the ones with this structure, though the fragments that would be formed via

Chapter 4 Effect of Methyl Linoleate and Oleate on Squalane Oxidation
151
reaction 4.8a were also detected confirming that oxygen will add to ML radicals via both
reaction pathways.
With regard to the chemistry of the squalane/methyl linoleate system, the
temperature at which the net production of R radicals are favoured over the production of
RO2 radicals is the point at which the chemistry of the system changes and the
reversibility leads to build-up of R radicals which then have more chance of combining
with each other to terminate the cycle rather than propagate it, especially as the percentage
of methyl linoleate, and hence R radicals in the mixture increases.
As the doubly allylic system is the only functional group not present to both methyl
oleate and methyl linoleate, this would suggest that methyl oleate should either have a
much reduced effect on squalane oxidation, or no effect at all, with the latter being
indicated by the results obtained in this chapter. If there were to a similar (reduced) effect,
then the derived equation for ceiling temperature it is possible to calculate a theoretical Tc
if H and S
values exist for the addition of oxygen to the alkyl chain radical. Ruiz
(1981) studied this for allyl (C3H5) radicals and estimated H to be -71.9 kJ mol-1
at 300K
and Sto be -110.4 J K
-1 mol
-1 at 348 Kwhich, using equation 4.15, would give a ceiling
temperature of 370 oC.
4.3.3 Relevance to behaviour of methyl linoleate in engines
The mechanistic switching between pro-oxidant and antioxidant behaviour of
methyl linoleate on squalane becomes of considerable interest when the typical engine
temperatures are considered. The lowest temperatures that a lubricant experiences are
typically in the sump, which is also where the highest amount of fuel dilution occurs as
unburned fuel migrates down the cylinder walls (Rakopoulos 2006). Vehicles using post-
injection of fuel to burn off soot as it accumulates on the DPFs (see Introduction) are
especially prone to this effect. Due to legislation on particulate matter reductions (EC
Regulation Nos. 715/2007 and 595/2009), these systems will become commonplace over
the next few years as there is (as yet) no other reported technology capable of reducing
particulate matter to the levels required by legislation.
With mineral diesel, this was not so much of a problem as during the engine run, a
portion of the unburned fuel would evaporate out as the temperature rose. As biodiesel
components are typically larger and less volatile (Goodrum 2002, Owczarek 2003 & 2004,
Yuan 2005), biodiesel has a greater tendency to accumulate; a typical fuel containing a
The Autoxidation of Biodiesel and its Effects on Engine Lubricants
152
blend of 10% biodiesel to mineral diesel (B10) can end up becoming 50% biodiesel (B50)
in the sump (Jones 2008) as the mineral diesel evaporates off. In terms of fuel dilution, this
can correspond to a B10 fuel being diluted down roughly by a factor of 10 in the sump at
100 oC (Shayler 2000), i.e. if the lubricant consists of 1% biodiesel, after the mineral diesel
fraction of the fuel evaporates off the biodiesel fraction can concentrate to 5% in the
lubricant – quite significant as at 100 oC a 5% addition of methyl linoleate has the ability to
double the rate of base fluid autoxidation (figure 4.44). Partial pressure of oxygen would
have to be taken into account to determine at what point the ceiling temperature would
actually occur in the sump, however, as the headspace above would contain a large amount
of nitrogen from the atmosphere, as well as any exhaust gases from the combustion
chamber. Using Equation 4.10, the ceiling temperatures have been calculated for a range of
oxygen partial pressures below.
Table 4.3 – The ceiling temperature for oxygen addition to ML radicals at different
partial pressures of oxygen.
Tc
(oC
)
Partial pressure of oxygen (bar)
1 0.1 0.01 0.001
Reaction 4.8a 178.5 170.2 162.3 154.5
Reaction 4.8b 151.1 143.8 136.8 130.0
By contrast, the highest temperatures achieved in the engine are typically in the
combustion chamber where the fuel is injected. As the first lubricated area the fuel will
encounter is with the piston in the cylinder, the antioxidant effect of methyl linoleate at
higher temperatures in the chamber is of relatively little importance as far as the lubricant
chemistry is concerned. What is perhaps more significant, however, is the unsaturated
fuel’s ability to form polymeric compounds (Chapter 3) via radical termination reactions at
higher temperatures due to the build up of R radicals. As the fuel is nearly in its neat form
in the combustion chamber, upon oxidation the carbon centred radicals would be in
relatively high concentration, further promoting the dimerisation reactions and potentially
leading to the piston deposits noted on biodiesel usage.
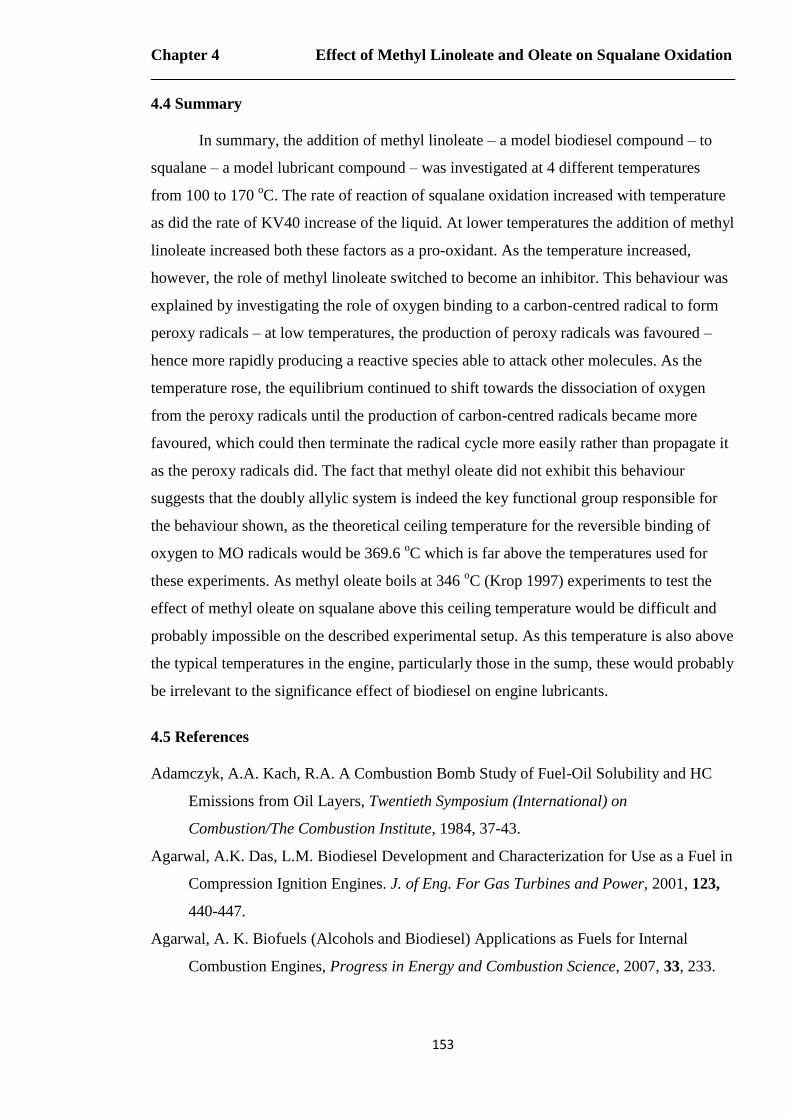
Chapter 4 Effect of Methyl Linoleate and Oleate on Squalane Oxidation
153
4.4 Summary
In summary, the addition of methyl linoleate – a model biodiesel compound – to
squalane – a model lubricant compound – was investigated at 4 different temperatures
from 100 to 170 oC. The rate of reaction of squalane oxidation increased with temperature
as did the rate of KV40 increase of the liquid. At lower temperatures the addition of methyl
linoleate increased both these factors as a pro-oxidant. As the temperature increased,
however, the role of methyl linoleate switched to become an inhibitor. This behaviour was
explained by investigating the role of oxygen binding to a carbon-centred radical to form
peroxy radicals – at low temperatures, the production of peroxy radicals was favoured –
hence more rapidly producing a reactive species able to attack other molecules. As the
temperature rose, the equilibrium continued to shift towards the dissociation of oxygen
from the peroxy radicals until the production of carbon-centred radicals became more
favoured, which could then terminate the radical cycle more easily rather than propagate it
as the peroxy radicals did. The fact that methyl oleate did not exhibit this behaviour
suggests that the doubly allylic system is indeed the key functional group responsible for
the behaviour shown, as the theoretical ceiling temperature for the reversible binding of
oxygen to MO radicals would be 369.6 oC which is far above the temperatures used for
these experiments. As methyl oleate boils at 346 oC (Krop 1997) experiments to test the
effect of methyl oleate on squalane above this ceiling temperature would be difficult and
probably impossible on the described experimental setup. As this temperature is also above
the typical temperatures in the engine, particularly those in the sump, these would probably
be irrelevant to the significance effect of biodiesel on engine lubricants.
4.5 References
Adamczyk, A.A. Kach, R.A. A Combustion Bomb Study of Fuel-Oil Solubility and HC
Emissions from Oil Layers, Twentieth Symposium (International) on
Combustion/The Combustion Institute, 1984, 37-43.
Agarwal, A.K. Das, L.M. Biodiesel Development and Characterization for Use as a Fuel in
Compression Ignition Engines. J. of Eng. For Gas Turbines and Power, 2001, 123,
440-447.
Agarwal, A. K. Biofuels (Alcohols and Biodiesel) Applications as Fuels for Internal
Combustion Engines, Progress in Energy and Combustion Science, 2007, 33, 233.
The Autoxidation of Biodiesel and its Effects on Engine Lubricants
154
Batino, R. Rettich, T.R. Tominaga, T. The Solubility of Oxygen and Ozone in Liquids, J.
Phys. Chem. Ref. Data, 1983, 12(2), 163-178.
Benson, S.W. Effect of Resonance and Structure on the Thermochemistry of Organic
Peroxy Radicals and the Kinetics of Combustion Reaction, J. Am. Chem. Soc 1964,
87(5), 972-980.
The British Petroleum Company - Industrial Lubrication. 1966. Published East Grinstead,
The British Petroleum Company.
Blanksby, S.J. Ellison, G.B. Bond Dissociation Energies of Organic Molecules, Acc.
Chem. Res. 2003, 36, 255-263.
Conrad, B.R. Evaluation of Diesel Particulate Filter Systems at Stobie Mine, Diesel
Emission Evaluation Program, INCO, 2006, 28-29
Chan, H.W.S. Levett, G. Matthew, J.A. The Mechanism of the Rearrangement of Linoleate
Hydroperoxides. Chemistry and Physics of Lipids, 1979, 24, 245-256.
Clark, K.B. Culshaw, P.N. Griller, D. Lossing, F.P. Martinho Simões, J.A. Walton, J.C.
Studies of the Formation and Stability of Pentadienyl and 3-Substituted Pentadienyl
Radicals, J. Org. Chem. 1991, 56, 5535-5539.
Dermibas, A. Progress and Recent Trends in Biodiesel Fuels, Energy Conversion and
Management, 2009, 50, 14-34.
Engler, C. R. J. Johnson, L.A. Effects of Processing and Chemical Characteristics of Plant
Oils on Performance of an Indirect-Injection Diesel Engine, J. Am. Oil Chem. Soc.,
1983, 60, 1592–1596.
Fazal, M.A. Haseeb, A.S.M.A. Masjuki, H.H. Biodiesel Feasibility Study: An Evaluation
of Material Compatibility; Performance; Emission and Engine Durability, Renewable
and Sustainability Energy Reviews, 2011, 15(2), 1314-1324.
Frankel, E.N. Chemistry of Free Radical and Singlet Oxidation of Lipids. Prog. Lipid Res.
1985, 23,197-221.
Gardner, H.W. Oxygen Radical Chemistry of Polyunsaturated Fatty Acids, Free Radical
Biology & Medicine, 1989, 7, 65-86
Golden, D.M. Benson, S.W. Chem.Rev 1969, 69,125.
Goodrum, J.W. Volatility and Boiling Points of Biodiesel from Vegetable Oils and Tallow,
Biomass and Bioenergy, 2002, 22, 205–211.
Gupta, S.A. Cochran, H.D. Cummings, P.T. Shear Behaviour of Squalane and Tetracosane
under Extreme Confinement. I. Model, Simulation Method and Interfacial Slip, J.
Chem. Phys, 1997, 107(23), 10316-10326.
Chapter 4 Effect of Methyl Linoleate and Oleate on Squalane Oxidation
155
Gupta, S.A. Cochran, H.D. Cummings, P.T. Shear Behaviour of Squalane and Tetracosane
under Extreme Confinement. II. Confined Film Structure, J. Chem. Phys, 1997,
107(23), 10327-10334.
Gupta, S.A. Cochran, H.D. Cummings, P.T. Shear Behaviour of Squalane and Tetracosane
under Extreme Confinement. III. Effect of Confinement on Viscosity, J. Chem. Phys,
1997, 107(23), 10334-10343.
Hu, J. Du, Z. Li, C. Min, E. Study on the Lubrication Properties of Biodiesel as Fuel
Lubricity Enhancers, Fuel, 2005, 84, 1601-1606.
Jabbarzadeh, A. Atkinson, J.D. Tanner, R.I. The effect of Branching on Slip and
Rheological Properties of Lubricants in Molecular Dynamics Simulation of Couette
Shear Flow, Tribology International, 2002, 35(1), 35-46.
Jones, C. Interactions Between Biofuels and Lubricants and Effects on Engine Oil
Durability, 2008 SAE Biofuels: Specifications and Performance Symposium, Paris,
France. July 2008.
Kaiser, E.W. Admczyk, A.A. Lavoie, G.A. The Effect of Oil Layers on the Hydrocarbon
Emissions Generated During Closed Vessel Combustion, Eighteenth Symposium
(Inetnational) on Combustion/The Combustion Institute, 1981, 1881-1890.
Kittelson, D.B. Engines and Nanoparticles: A Review, J. Aerosol Sci. 1998, 29(5/6), 575-
588
Krop, H.B. v. Velzen, M.J.M. Parsons, J.R. Govers, H.R.J. Determination of
Environmentally Relevant Physical-Chemical Properties of Some Fatty Acid Esters,
JAOCS, 1997, 74(3), 309-315
Lightfoot, P.D. Cox, R.A. Crowley, M. Destriau, M. Hayman, G.D. Jenkin, M.E.
Moortgat, G.K. Zabel, F. Organic Peroxy Radicals: Kinetics, Spectroscopy and
Tropospheric Chemistry, Atmospheric Environment, 1992, 26(10), 1805–1961.
Lignola, P.G. Reverchon, E. Cool Flames, Prog. Energy Combust. Sci. 1987, 13, 75-96.
Ma, F. Hanna, M.A. Biodiesel Production: A Review, Bioresource Technology, 1999, 70,
1-15.
Masjuki, H.H. Maleque, M.A. The Effect of Palm Oil Diesel Fuel Contaminated Lubricant
on Sliding Wear of Cast Irons against Mild Steel, Wear, 1996, 198, 293-299.
McMillen, D.F. Golden, D.M. Hydrocarbon Bond Dissociation Energies, Ann. Rev. Phys.
Chem, 1982, 33, 493-532.

The Autoxidation of Biodiesel and its Effects on Engine Lubricants
156
Monyem, A. Canakci, M. Van Gerpen, J.H. Investigation of Biodiesel Thermal Stability
Under Simulated In-Use Conditions, Am. Soc. of Agricultural Eng, 2000, 16(4), 373-
378.
Moritani, H. Nozawa, Y. Oil Degradation in Second-Land Region of Gasoline Engine
Pistons. R&D Review of Toyota CRDL, 2004, 38(3), 36-43.
Owczarek, I. Blazej, K. Recommended Critical Temperatures. Part I. Aliphatic
Hydrocarbons. J. Phys. Chem. Ref. Data 2003, 32(4), 1411-1428.
Owczarek, I. Blazej, K. Recommended Critical Temperatures. Part II. Aromatic and Cyclic
Hydrocarbons. J. Phys. Chem. Ref. Data 2004, 33(2), 541-547.
Pratt, D.A. Mills, J.H. Porter, N.A. Theoretical Calculations of Carbon-Oxygen Bond
Dissociation Enthalpies of Peroxyl Radicals Formed in the Autoxidation of Lipids, J.
Am. Chem. Soc. 2003, 124, 5801-5810.
Radu, R. Petru, C. Edward, R. Gheroghe, M. Fueling an D.I. Agricultural Diesel Engine
with Waste-Oil Biodiesel: Effects Over Injection, Combustion and Engine
Characteristics, Energy Conversion and Management, 2009, 50, 2158-2166.
Rakopoulos, C.D. Antonopoulos, K.A. Rakopoulos, D.C. Hountalas, D.T. Giakoumis, E.G.
Comparative Performance and Emissions Study of a Direct-injection Diesel Engine
Using Blends of Diesel fuel with Vegetable Oils or Bio-diesels of Various Origins,
Energy Conversion and Management, 2006, 47, 3272-2387.
Ruiz, R.P. Bayes, K.D. Macpherson, M.T. Pilling, M.J. Direct Observation of the
Equilibrium between Allyl Radicals, O2, and Allylperoxy Radicals, J. Phys. Chem.
1981, 85, 1622-1624.
Ryan, T. W. III. Dodge, L.G., Callahan, T.J. The Effects of Vegetable Oil Properties on
Injection and Combustion in Two Different Diesel Engines, J.Am.Oil.Chem.Soc,
1984, 61, 1610–1619.
Sapaun, S.M. Masjuki, H.H. Azlan, A. The Use of Palm Oil as Diesel Fuel Substitute. J.
Power Energy A. 1996, 210, 47–53.
Seetula J.A. Slagle I.R. Kinetics and thermochemistry of the R+ HBr H+ Br (R= n-
C3H7, iso-C3H7 , n-C4H9 , iso-C4H9 , sec-C4H9 or tert-C4H9) equilibrium, J. Chem.
Soc. Faraday Trans. 1997, 93, 1709-1719.
Shayler, P.J. Winborn, L.D. Hill, N.J. Eade, D. Fuel Transport to the Crankcase, Oil
Dilution and HC Return with Breather Flow During the Cold Operation of a SI
Engine, SAE 2000 World Congress, 2000, Paper No. 2000-01-1235.

Chapter 4 Effect of Methyl Linoleate and Oleate on Squalane Oxidation
157
Stark, M.S. Wilkinson, J.J. Lindsay Smith, J.R. Alfadhl, A. Pochopien, B.A. Autoxidation
of Branched Alkanes in the Liquid Phase, Ind, Eng. Chem. Res. 2011, 50, 817-823
Sumathi, S. Chai, S.P. Mohamed, A.R. Utilization of Palm Oil as a Source of Renewable
Energy in Malaysia, Renewable and Sustainable Energy Reviews, 2008, 12, 2404–
2421.
Taylor, J.W. Ehlker, G. Carstensen, H.H. Ruslen, L. Field, R.W. Green, W.H. Direct
Measurement of the Fast, Reversible Addition of Oxygen to Cyclohexadienyl
Radicals in Nonpolar Solvents, J. Phys. Chem. A. 2004, 108, 7193-7203.
Taylor, R.I. Evans, P.G. In-situ Piston Measurements, Proc. Instn. Mech. Engrs. 2004,
218(J: J. Engineering Tribology), 185-200.
Trenwith, A.B. Dissociation of 3-methyl-1,4-pentadiene and the Resonance Energy of the
Pentadienyl Radical J. Chem. Soc. Faraday Trans. 1, Physical Chemistry in
Condensed Phases, 1982, 78(10), 3131-3136.
Van Setten, B.A.A.L. Makkee, M. Moulijn, J.A. Science and Technology of Catalytic
Diesel Particulate Filters, Catalysis Reviews, 2001, 43(4), 489-564.
Van Wechel, T. Gustafson, G.R. Leistritz, F.L. Economic Feasibility of Biodiesel
Production in North Dakota, Agribusiness and Applied Economics Report 2002, 505.
Yang, J. Stewart, M. Maupin, G. Herling, D. Zelenyuk, A. Single Wall Diesel Particulate
Filter (DPF) Filtration Efficiency Studies Using Laboratory Generated Particles,
Chemical Engineering Science, 2008, 64(8), 1625-1634.
Yuan, W. Hansen, A.C. Zhang, Q. Vapor Pressure and Normal Boiling Point Predictions
for Pure Methyl Esters and Biodiesel Fuels. Fuel, 2005, 84, 943-950.
Zils, R. Inomata, S. Imamura, T. Miyoshi, A. Washida, N. Determination of the
Equilibrium Constant and Thermodynamic Parameters for the Reaction of
Pentadienyl Radicals with O2, J. Phys. Chem. A. 2003, 105, 1277-1282.

The Autoxidation of Biodiesel and its Effects on Engine Lubricants
158

Chapter 5 Effect of Additives on Methyl Linoleate and Squalane
159
Chapter 5. The Effect of Additives on Methyl Linoleate and Squalane
5.1 Introduction
As with many products, neither lubricants nor fuels are supplied as single
chemicals, or even sole combinations of their major components. They are instead treated,
generally at less than 5% composition, with chemicals known as additives which serve to
enhance the product in various ways by altering in a positive manner various properties
such as hardness, elasticity or (crucially for lubricant chemistry) viscosity and resistance to
degradation, to keep the product suitable for the task, either whilst in storage, or to increase
the working lifetime and/or performance of the product during this period.
Perhaps the most important group of additives in the fuel and lubricant industry are
the antioxidants – chemicals added to prevent oxidation of the product (Mahoney 1969).
Antioxidants are not confined to lubricant chemistry but are found in a vast range of
systems, both biological and non-biological. As molecular oxygen is both a powerful
oxidising agent and present at 21% of the atmosphere, it is inevitable that any system
exposed to air will be vulnerable to oxidation. In fuel and lubricant systems, oxidation can
lead to detrimental products and processes such as polymerisation, previously outlined in
greater detail in chapters 1, 3 and 4. In biological systems oxidation can lead to cell and
DNA damage (Hochstein 1988, Hu 1995, Gedik 2002) and hence many plants produce
antioxidant chemicals to protect themselves; ascorbic acid (Vitamin C – figure 5.1) is an
example of a natural antioxidant (Cort 1982, Yen 2002).
Figure 5.1 – The chemical structure of ascorbic acid (Vitamin C).
Whilst nature already provides a large range of antioxidants to work with, as these
compounds are produced in plants and animals evolved to survive at ambient temperatures,
they are not necessarily as well suited to the elevated temperatures and other harsh
conditions found inside the engine. Fortunately, as the mechanisms of these compounds
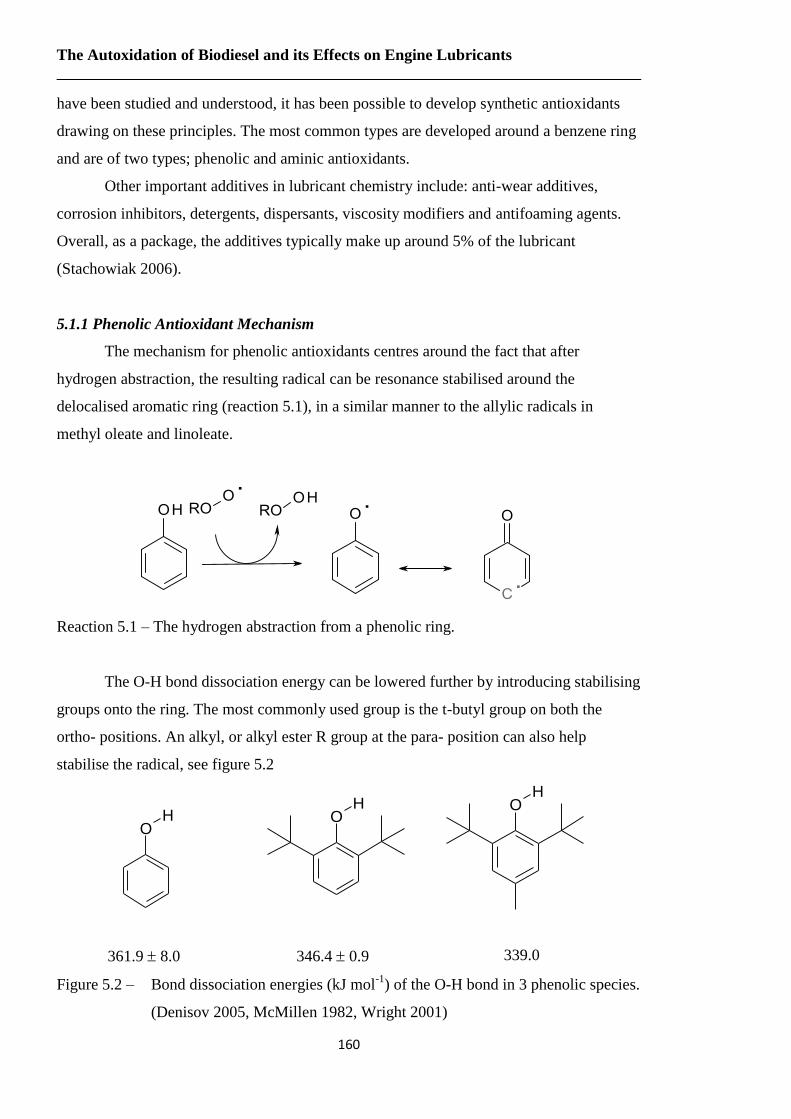
The Autoxidation of Biodiesel and its Effects on Engine Lubricants
160
have been studied and understood, it has been possible to develop synthetic antioxidants
drawing on these principles. The most common types are developed around a benzene ring
and are of two types; phenolic and aminic antioxidants.
Other important additives in lubricant chemistry include: anti-wear additives,
corrosion inhibitors, detergents, dispersants, viscosity modifiers and antifoaming agents.
Overall, as a package, the additives typically make up around 5% of the lubricant
(Stachowiak 2006).
5.1.1 Phenolic Antioxidant Mechanism
The mechanism for phenolic antioxidants centres around the fact that after
hydrogen abstraction, the resulting radical can be resonance stabilised around the
delocalised aromatic ring (reaction 5.1), in a similar manner to the allylic radicals in
methyl oleate and linoleate.
Reaction 5.1 – The hydrogen abstraction from a phenolic ring.
The O-H bond dissociation energy can be lowered further by introducing stabilising
groups onto the ring. The most commonly used group is the t-butyl group on both the
ortho- positions. An alkyl, or alkyl ester R group at the para- position can also help
stabilise the radical, see figure 5.2
361.9 8.0 346.4 0.9 339.0
Figure 5.2 – Bond dissociation energies (kJ mol-1
) of the O-H bond in 3 phenolic species.
(Denisov 2005, McMillen 1982, Wright 2001)
OH
OH
OH

Chapter 5 Effect of Additives on Methyl Linoleate and Squalane
161
In addition to lowering the bond dissociation energy of the O-H bond, the R group
can also change the antioxidant properties in other ways. Firstly, a long alkyl chain can
increase the boiling point of the molecule – a point frequently utilized in lubricant
chemistry to ensure the antioxidant does not evaporate out of the base fluid during the
harsh temperatures experienced in engines. However, an alkyl chain attached to the
aromatic ring can, if sufficiently stable as a radical, become a leaving group when
substituted by peroxy radicals. This is achieved when peroxy radicals add to the phenoxyl
radical formed in a reaction (usually at the para- position) to form a peroxide. The peroxide
bond then generally cleaves to give two alkoxyl radicals; the phenolic alkoxyl one then
loses the alkyl chain to form a stable quinone molecule, reaction 5.2 (Mahoney 1975).
Reaction 5.2 – The formation of 1, 4- Benzoquinone from a phenolic antioxidant
intermediate.
The overall aim of the synthesis of these antioxidants is that they will produce more
stable radicals and hence be targeted preferentially by peroxy radicals as opposed to the
fuel/lubricant molecules they are meant to be protecting. In terms of efficiency, in
reactions 5.1 and 5.2, two peroxy radicals are consumed, however one carbon centred
radical is produced, which will be susceptible to reaction with oxygen to generate a peroxy
radical meaning in practice, the net consumption of peroxy radicals is only one. This
overall count of radicals consumed is termed the stoichiometric number and is commonly
used to evaluate the efficiency of an antioxidant.
5.1.2 Aminic Antioxidant Mechanism
As with phenolic antioxidants, aminic antioxidants work through stabilisation of
the radical intermediate through an aromatic ring. Unlike phenolic antioxidants though, the
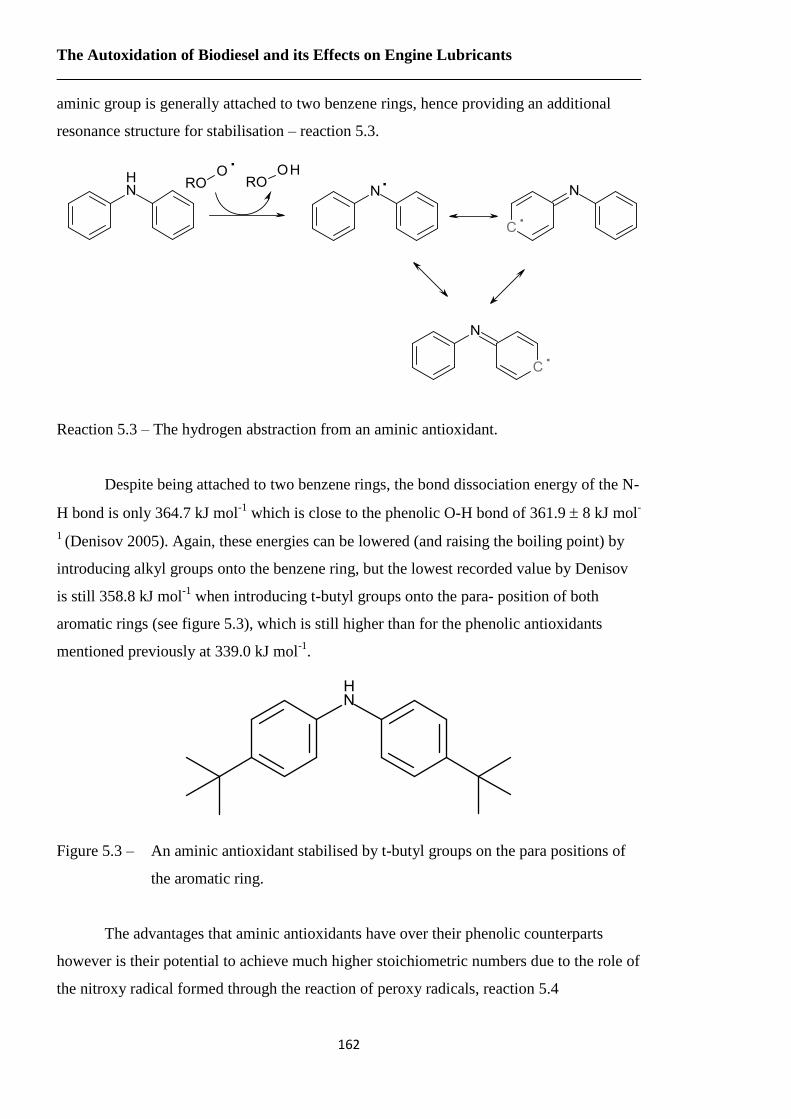
The Autoxidation of Biodiesel and its Effects on Engine Lubricants
162
aminic group is generally attached to two benzene rings, hence providing an additional
resonance structure for stabilisation – reaction 5.3.
Reaction 5.3 – The hydrogen abstraction from an aminic antioxidant.
Despite being attached to two benzene rings, the bond dissociation energy of the N-
H bond is only 364.7 kJ mol-1
which is close to the phenolic O-H bond of 361.9 8 kJ mol-
1 (Denisov 2005). Again, these energies can be lowered (and raising the boiling point) by
introducing alkyl groups onto the benzene ring, but the lowest recorded value by Denisov
is still 358.8 kJ mol-1
when introducing t-butyl groups onto the para- position of both
aromatic rings (see figure 5.3), which is still higher than for the phenolic antioxidants
mentioned previously at 339.0 kJ mol-1
.
Figure 5.3 – An aminic antioxidant stabilised by t-butyl groups on the para positions of
the aromatic ring.
The advantages that aminic antioxidants have over their phenolic counterparts
however is their potential to achieve much higher stoichiometric numbers due to the role of
the nitroxy radical formed through the reaction of peroxy radicals, reaction 5.4
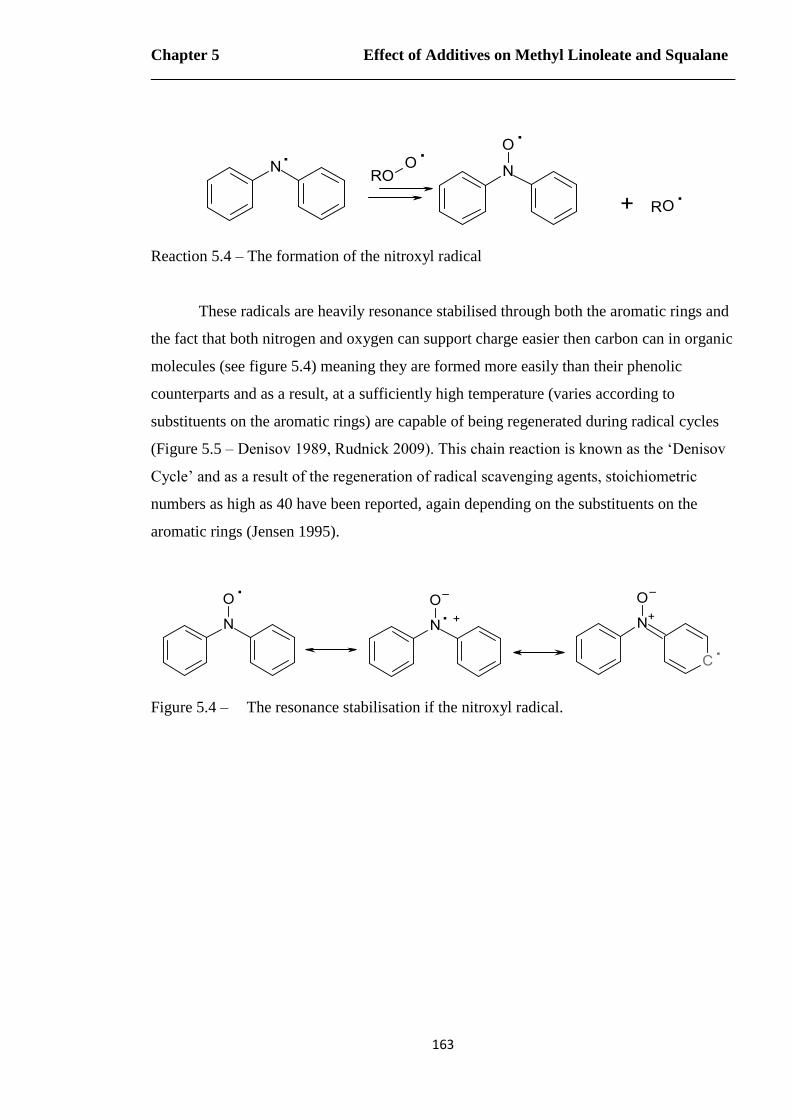
Chapter 5 Effect of Additives on Methyl Linoleate and Squalane
163
Reaction 5.4 – The formation of the nitroxyl radical
These radicals are heavily resonance stabilised through both the aromatic rings and
the fact that both nitrogen and oxygen can support charge easier then carbon can in organic
molecules (see figure 5.4) meaning they are formed more easily than their phenolic
counterparts and as a result, at a sufficiently high temperature (varies according to
substituents on the aromatic rings) are capable of being regenerated during radical cycles
(Figure 5.5 – Denisov 1989, Rudnick 2009). This chain reaction is known as the ‘Denisov
Cycle’ and as a result of the regeneration of radical scavenging agents, stoichiometric
numbers as high as 40 have been reported, again depending on the substituents on the
aromatic rings (Jensen 1995).
Figure 5.4 – The resonance stabilisation if the nitroxyl radical.
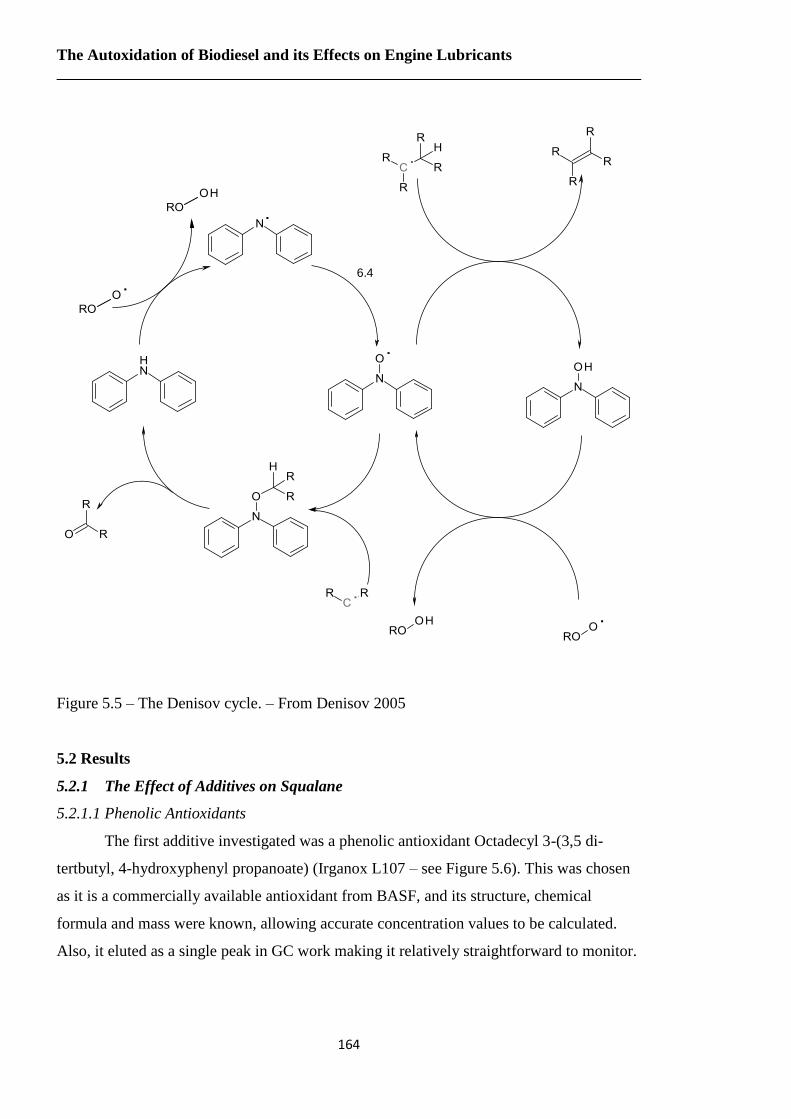
The Autoxidation of Biodiesel and its Effects on Engine Lubricants
164
6.4
Figure 5.5 – The Denisov cycle. – From Denisov 2005
5.2 Results
5.2.1 The Effect of Additives on Squalane
5.2.1.1 Phenolic Antioxidants
The first additive investigated was a phenolic antioxidant Octadecyl 3-(3,5 di-
tertbutyl, 4-hydroxyphenyl propanoate) (Irganox L107 – see Figure 5.6). This was chosen
as it is a commercially available antioxidant from BASF, and its structure, chemical
formula and mass were known, allowing accurate concentration values to be calculated.
Also, it eluted as a single peak in GC work making it relatively straightforward to monitor.
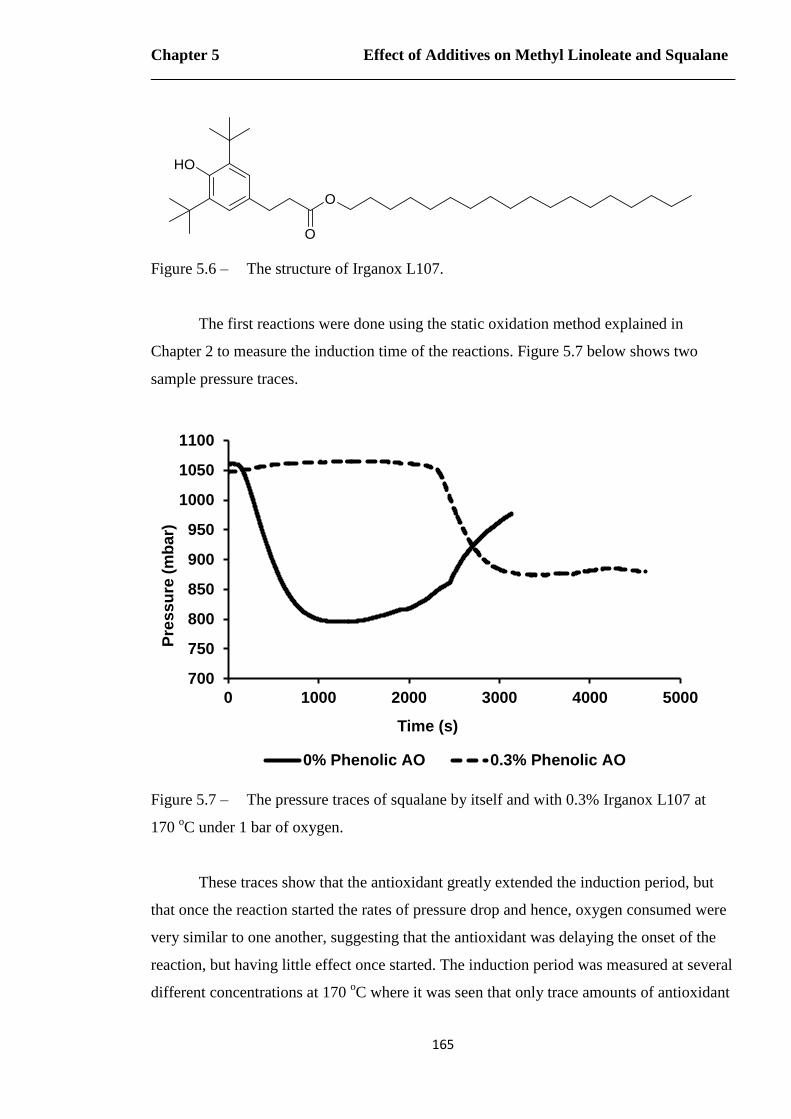
Chapter 5 Effect of Additives on Methyl Linoleate and Squalane
165
Figure 5.6 – The structure of Irganox L107.
The first reactions were done using the static oxidation method explained in
Chapter 2 to measure the induction time of the reactions. Figure 5.7 below shows two
sample pressure traces.
Figure 5.7 – The pressure traces of squalane by itself and with 0.3% Irganox L107 at
170 oC under 1 bar of oxygen.
These traces show that the antioxidant greatly extended the induction period, but
that once the reaction started the rates of pressure drop and hence, oxygen consumed were
very similar to one another, suggesting that the antioxidant was delaying the onset of the
reaction, but having little effect once started. The induction period was measured at several
different concentrations at 170 oC where it was seen that only trace amounts of antioxidant
700
750
800
850
900
950
1000
1050
1100
0 1000 2000 3000 4000 5000
Pre
ss
ure
(m
bar)
Time (s)
0% Phenolic AO 0.3% Phenolic AO
OH
O
O
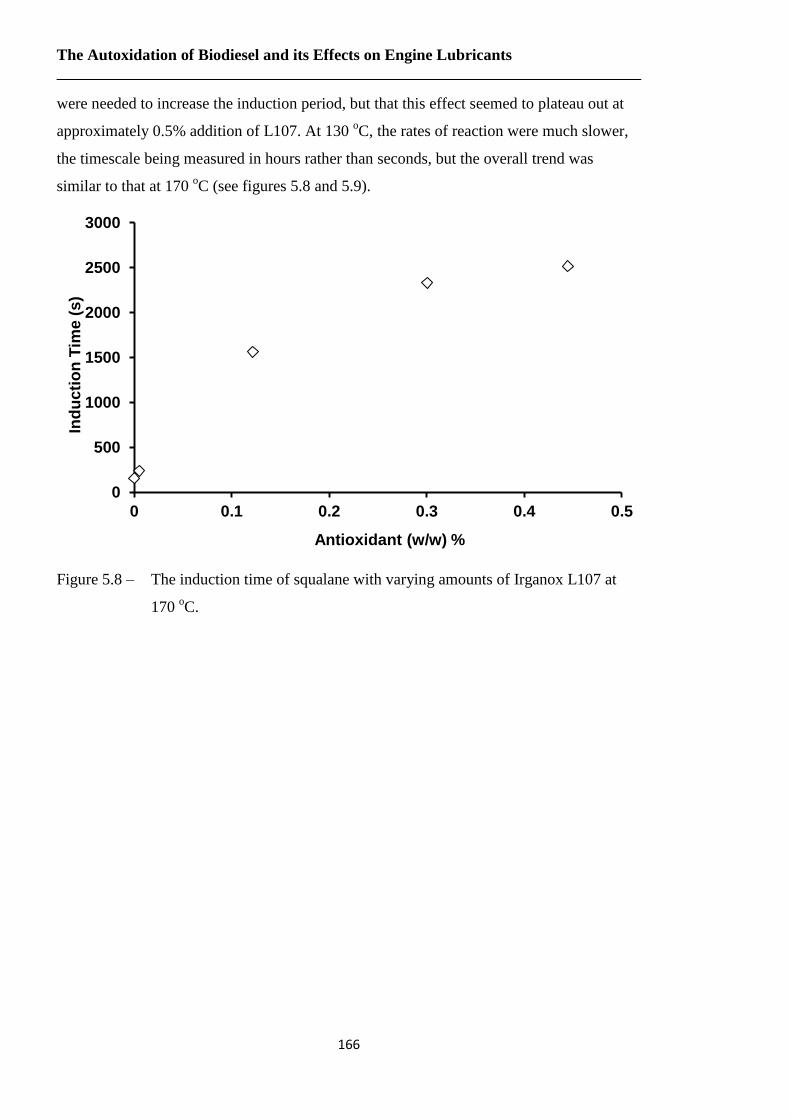
The Autoxidation of Biodiesel and its Effects on Engine Lubricants
166
were needed to increase the induction period, but that this effect seemed to plateau out at
approximately 0.5% addition of L107. At 130 oC, the rates of reaction were much slower,
the timescale being measured in hours rather than seconds, but the overall trend was
similar to that at 170 oC (see figures 5.8 and 5.9).
Figure 5.8 – The induction time of squalane with varying amounts of Irganox L107 at
170 oC.
0
500
1000
1500
2000
2500
3000
0 0.1 0.2 0.3 0.4 0.5
Ind
uc
tio
n T
ime
(s)
Antioxidant (w/w) %
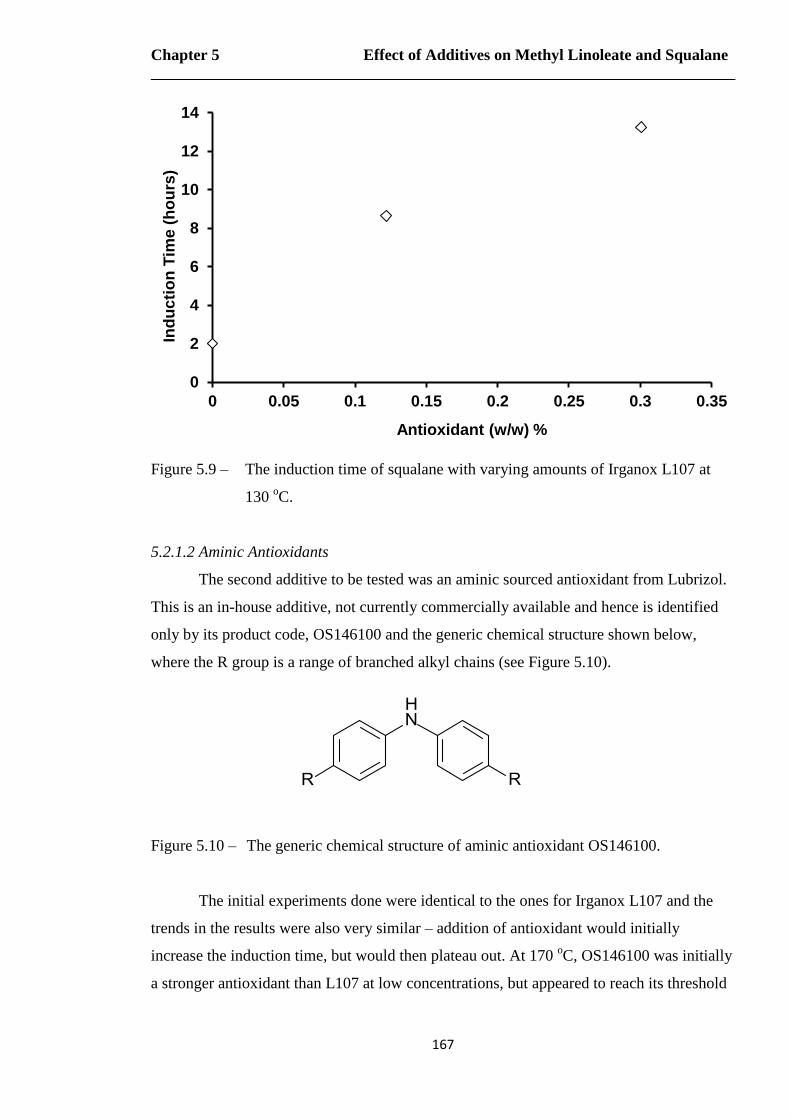
Chapter 5 Effect of Additives on Methyl Linoleate and Squalane
167
Figure 5.9 – The induction time of squalane with varying amounts of Irganox L107 at
130 oC.
5.2.1.2 Aminic Antioxidants
The second additive to be tested was an aminic sourced antioxidant from Lubrizol.
This is an in-house additive, not currently commercially available and hence is identified
only by its product code, OS146100 and the generic chemical structure shown below,
where the R group is a range of branched alkyl chains (see Figure 5.10).
Figure 5.10 – The generic chemical structure of aminic antioxidant OS146100.
The initial experiments done were identical to the ones for Irganox L107 and the
trends in the results were also very similar – addition of antioxidant would initially
increase the induction time, but would then plateau out. At 170 oC, OS146100 was initially
a stronger antioxidant than L107 at low concentrations, but appeared to reach its threshold
0
2
4
6
8
10
12
14
0 0.05 0.1 0.15 0.2 0.25 0.3 0.35
Ind
uc
tio
n T
ime
(h
ou
rs)
Antioxidant (w/w) %

The Autoxidation of Biodiesel and its Effects on Engine Lubricants
168
at a lower concentration (see Figure 5.11), whilst at 130 oC, OS146100 was a stronger
antioxidant at all measured concentrations (see Figure 5.12).
Figure 5.11 – The induction time of squalane with varying amounts of aminic antioxidant
OS146100 at 170 oC.
Figure 5.12 – The induction time of squalane with varying amounts of aminic antioxidant
OS146100 at 130 oC.
0
500
1000
1500
2000
2500
0 0.2 0.4 0.6 0.8 1
Ind
uc
tio
n T
ime
(s)
Antioxidant (w/w) %
0
5
10
15
20
25
30
35
40
45
0 0.1 0.2 0.3 0.4 0.5
Ind
uc
tio
n T
ime
(h
ou
rs)
% Antioxidant (w/w)

Chapter 5 Effect of Additives on Methyl Linoleate and Squalane
169
5.2.1.3 Detergent
The final additive to be investigated was another Lubrizol in-house additive; an
overbased sodium sulphonate detergent with the generic chemical structure
RC6H4SO3Na/Na2CO3 (see figure 5.13) is available, with the R group being unknown and
identified by its product code OS102880.
Figure 5.13 – The generic chemical structure for detergent OS102880.
Initially static oxidation runs were carried out to see if the detergent mechanism
was comparable, or could be measured in the same way antioxidants. However this did not
appear to be the case; at both 170 and 130 oC, the addition of OS102880 initially served to
reduce the induction period, in one case at 170 oC eliminating it altogether, although at
higher concentrations the induction period then started to decrease – see figures 5.14 and
5.15.
Figure 5.14 – The induction time of squalane with varying amounts of detergent
OS102880 at 170 oC.
0
20
40
60
80
100
120
140
160
180
0 0.1 0.2 0.3 0.4
Ind
uc
tio
n T
ime
(s)
% Detergent (w/w)
R S
O
O
O Na+
Na2CO
3+
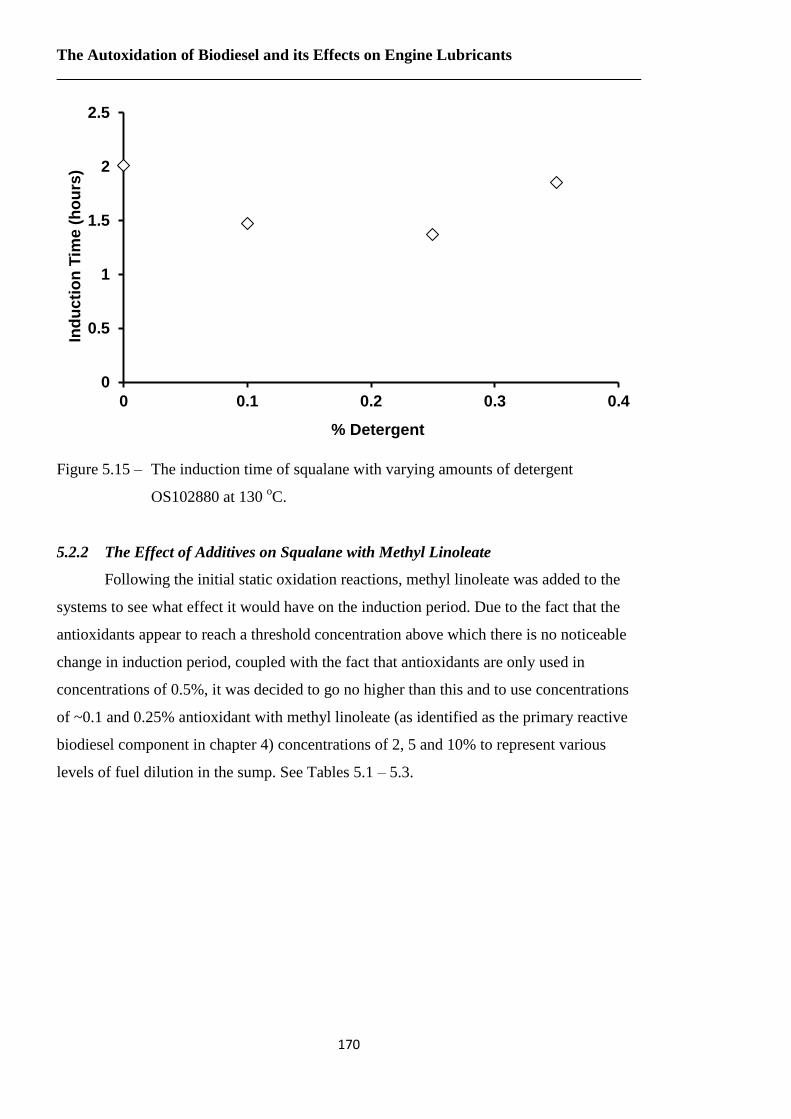
The Autoxidation of Biodiesel and its Effects on Engine Lubricants
170
Figure 5.15 – The induction time of squalane with varying amounts of detergent
OS102880 at 130 oC.
5.2.2 The Effect of Additives on Squalane with Methyl Linoleate
Following the initial static oxidation reactions, methyl linoleate was added to the
systems to see what effect it would have on the induction period. Due to the fact that the
antioxidants appear to reach a threshold concentration above which there is no noticeable
change in induction period, coupled with the fact that antioxidants are only used in
concentrations of 0.5%, it was decided to go no higher than this and to use concentrations
of ~0.1 and 0.25% antioxidant with methyl linoleate (as identified as the primary reactive
biodiesel component in chapter 4) concentrations of 2, 5 and 10% to represent various
levels of fuel dilution in the sump. See Tables 5.1 – 5.3.
0
0.5
1
1.5
2
2.5
0 0.1 0.2 0.3 0.4
Ind
uc
tio
n T
ime
(h
ou
rs)
% Detergent
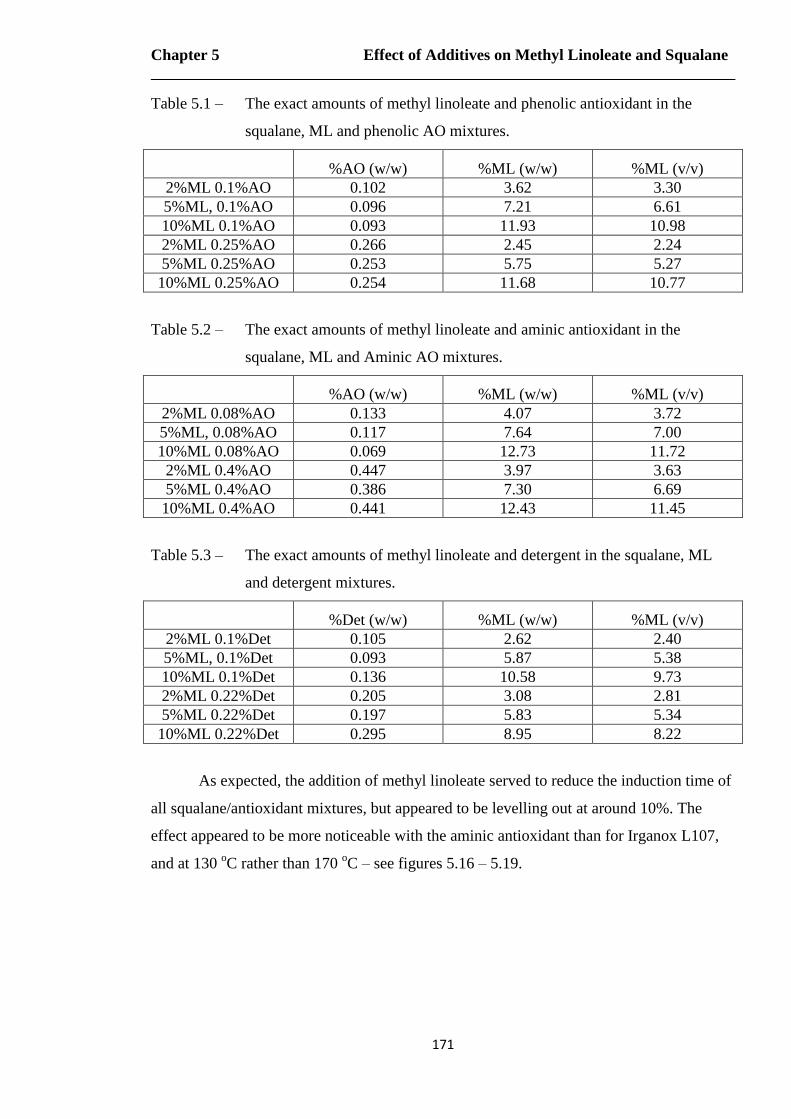
Chapter 5 Effect of Additives on Methyl Linoleate and Squalane
171
Table 5.1 – The exact amounts of methyl linoleate and phenolic antioxidant in the
squalane, ML and phenolic AO mixtures.
%AO (w/w) %ML (w/w) %ML (v/v)
2%ML 0.1%AO 0.102 3.62 3.30
5%ML, 0.1%AO 0.096 7.21 6.61
10%ML 0.1%AO 0.093 11.93 10.98
2%ML 0.25%AO 0.266 2.45 2.24
5%ML 0.25%AO 0.253 5.75 5.27
10%ML 0.25%AO 0.254 11.68 10.77
Table 5.2 – The exact amounts of methyl linoleate and aminic antioxidant in the
squalane, ML and Aminic AO mixtures.
%AO (w/w) %ML (w/w) %ML (v/v)
2%ML 0.08%AO 0.133 4.07 3.72
5%ML, 0.08%AO 0.117 7.64 7.00
10%ML 0.08%AO 0.069 12.73 11.72
2%ML 0.4%AO 0.447 3.97 3.63
5%ML 0.4%AO 0.386 7.30 6.69
10%ML 0.4%AO 0.441 12.43 11.45
Table 5.3 – The exact amounts of methyl linoleate and detergent in the squalane, ML
and detergent mixtures.
%Det (w/w) %ML (w/w) %ML (v/v)
2%ML 0.1%Det 0.105 2.62 2.40
5%ML, 0.1%Det 0.093 5.87 5.38
10%ML 0.1%Det 0.136 10.58 9.73
2%ML 0.22%Det 0.205 3.08 2.81
5%ML 0.22%Det 0.197 5.83 5.34
10%ML 0.22%Det 0.295 8.95 8.22
As expected, the addition of methyl linoleate served to reduce the induction time of
all squalane/antioxidant mixtures, but appeared to be levelling out at around 10%. The
effect appeared to be more noticeable with the aminic antioxidant than for Irganox L107,
and at 130 oC rather than 170
oC – see figures 5.16 – 5.19.

The Autoxidation of Biodiesel and its Effects on Engine Lubricants
172
Figure 5.16 – The induction time of squalane with varying amounts of phenolic
antioxidant and methyl linoleate at 170 oC.
Figure 5.17 – The induction time of squalane with varying amounts of phenolic
antioxidant and methyl linoleate at 130 oC.
0
500
1000
1500
2000
2500
0 2 4 6 8 10 12
Ind
uc
tio
n T
ime
(s)
Methyl Linoleate %
0% Phenolic AO 0.1% Phenolic AO 0.25% Phenolic AO
0
2
4
6
8
10
12
14
0 2 4 6 8 10 12
Ind
uc
tio
n T
ime
(h
ou
rs)
Methyl Linoleate %
0% Phenolic AO 0.1% Phenolic AO 0.25% Phenolic AO
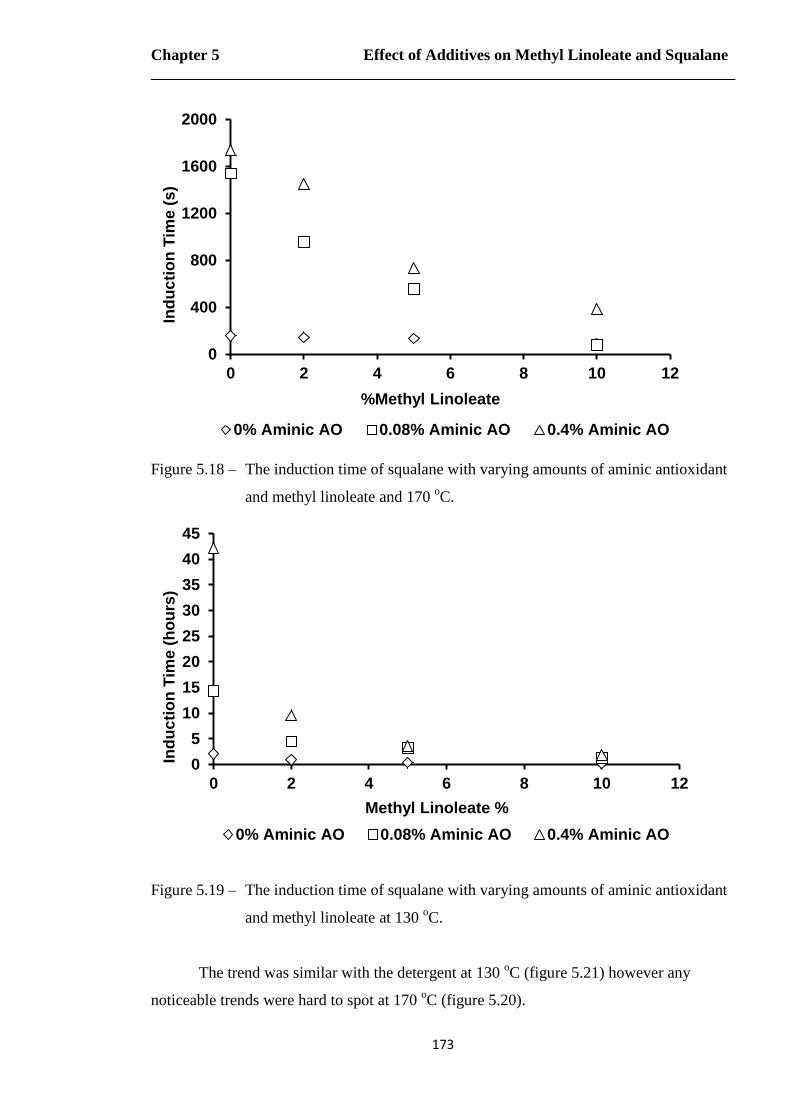
Chapter 5 Effect of Additives on Methyl Linoleate and Squalane
173
Figure 5.18 – The induction time of squalane with varying amounts of aminic antioxidant
and methyl linoleate and 170 oC.
Figure 5.19 – The induction time of squalane with varying amounts of aminic antioxidant
and methyl linoleate at 130 oC.
The trend was similar with the detergent at 130 oC (figure 5.21) however any
noticeable trends were hard to spot at 170 oC (figure 5.20).
0
400
800
1200
1600
2000
0 2 4 6 8 10 12
Ind
uc
tio
n T
ime
(s)
%Methyl Linoleate
0% Aminic AO 0.08% Aminic AO 0.4% Aminic AO
0
5
10
15
20
25
30
35
40
45
0 2 4 6 8 10 12
Ind
uc
tio
n T
ime
(h
ou
rs)
Methyl Linoleate %
0% Aminic AO 0.08% Aminic AO 0.4% Aminic AO
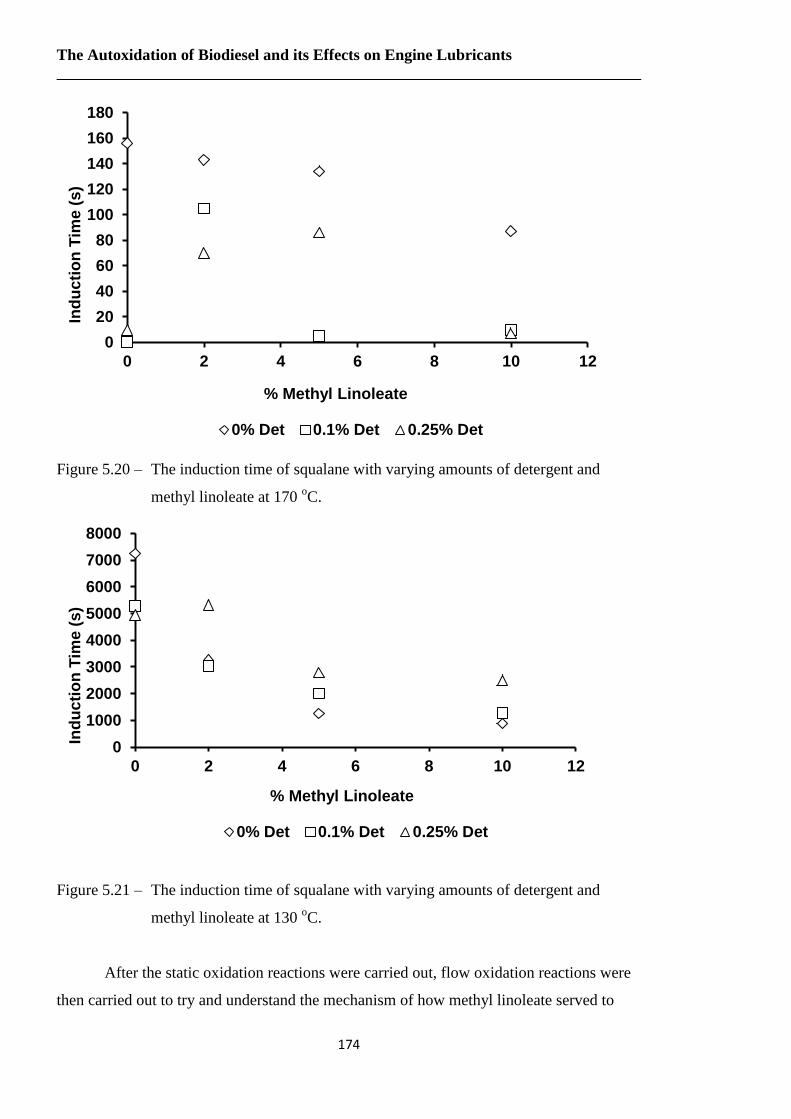
The Autoxidation of Biodiesel and its Effects on Engine Lubricants
174
Figure 5.20 – The induction time of squalane with varying amounts of detergent and
methyl linoleate at 170 oC.
Figure 5.21 – The induction time of squalane with varying amounts of detergent and
methyl linoleate at 130 oC.
After the static oxidation reactions were carried out, flow oxidation reactions were
then carried out to try and understand the mechanism of how methyl linoleate served to
0
20
40
60
80
100
120
140
160
180
0 2 4 6 8 10 12
Ind
uc
tio
n T
ime
(s)
% Methyl Linoleate
0% Det 0.1% Det 0.25% Det
0
1000
2000
3000
4000
5000
6000
7000
8000
0 2 4 6 8 10 12
Ind
uc
tio
n T
ime
(s)
% Methyl Linoleate
0% Det 0.1% Det 0.25% Det
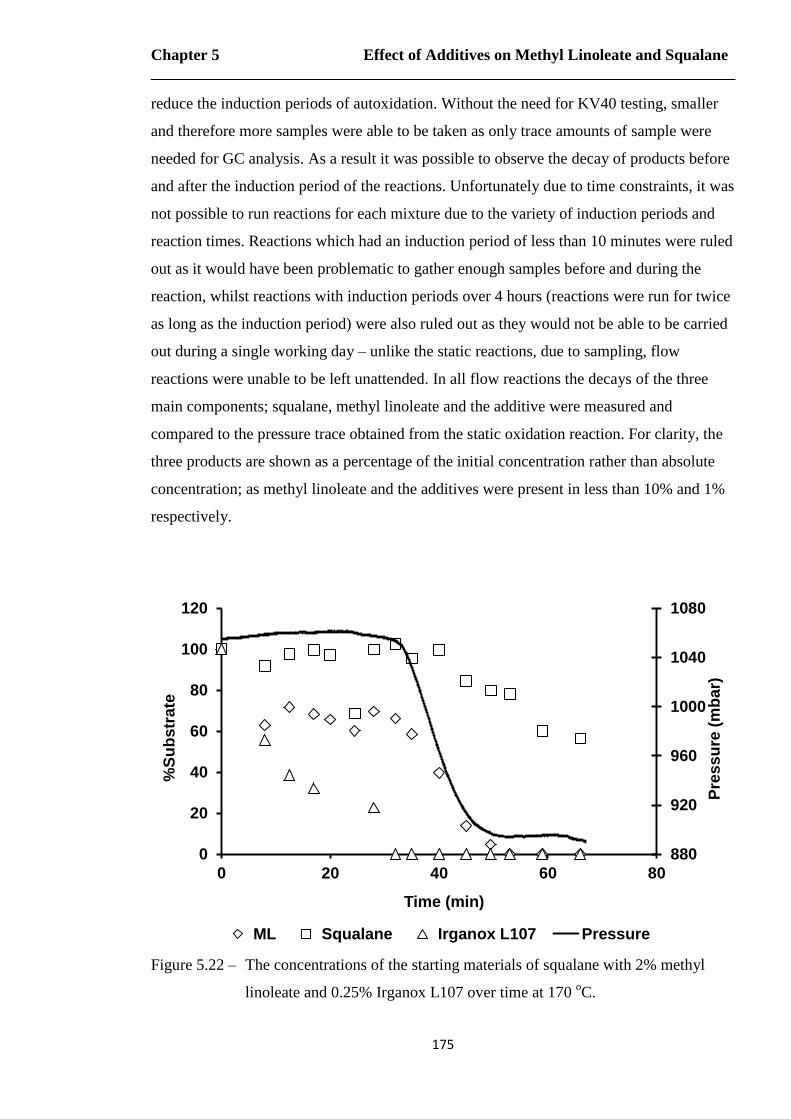
Chapter 5 Effect of Additives on Methyl Linoleate and Squalane
175
reduce the induction periods of autoxidation. Without the need for KV40 testing, smaller
and therefore more samples were able to be taken as only trace amounts of sample were
needed for GC analysis. As a result it was possible to observe the decay of products before
and after the induction period of the reactions. Unfortunately due to time constraints, it was
not possible to run reactions for each mixture due to the variety of induction periods and
reaction times. Reactions which had an induction period of less than 10 minutes were ruled
out as it would have been problematic to gather enough samples before and during the
reaction, whilst reactions with induction periods over 4 hours (reactions were run for twice
as long as the induction period) were also ruled out as they would not be able to be carried
out during a single working day – unlike the static reactions, due to sampling, flow
reactions were unable to be left unattended. In all flow reactions the decays of the three
main components; squalane, methyl linoleate and the additive were measured and
compared to the pressure trace obtained from the static oxidation reaction. For clarity, the
three products are shown as a percentage of the initial concentration rather than absolute
concentration; as methyl linoleate and the additives were present in less than 10% and 1%
respectively.
Figure 5.22 – The concentrations of the starting materials of squalane with 2% methyl
linoleate and 0.25% Irganox L107 over time at 170 oC.
880
920
960
1000
1040
1080
0
20
40
60
80
100
120
0 20 40 60 80
Pre
ss
ure
(m
bar)
%S
ub
str
ate
Time (min)
ML Squalane Irganox L107 Pressure
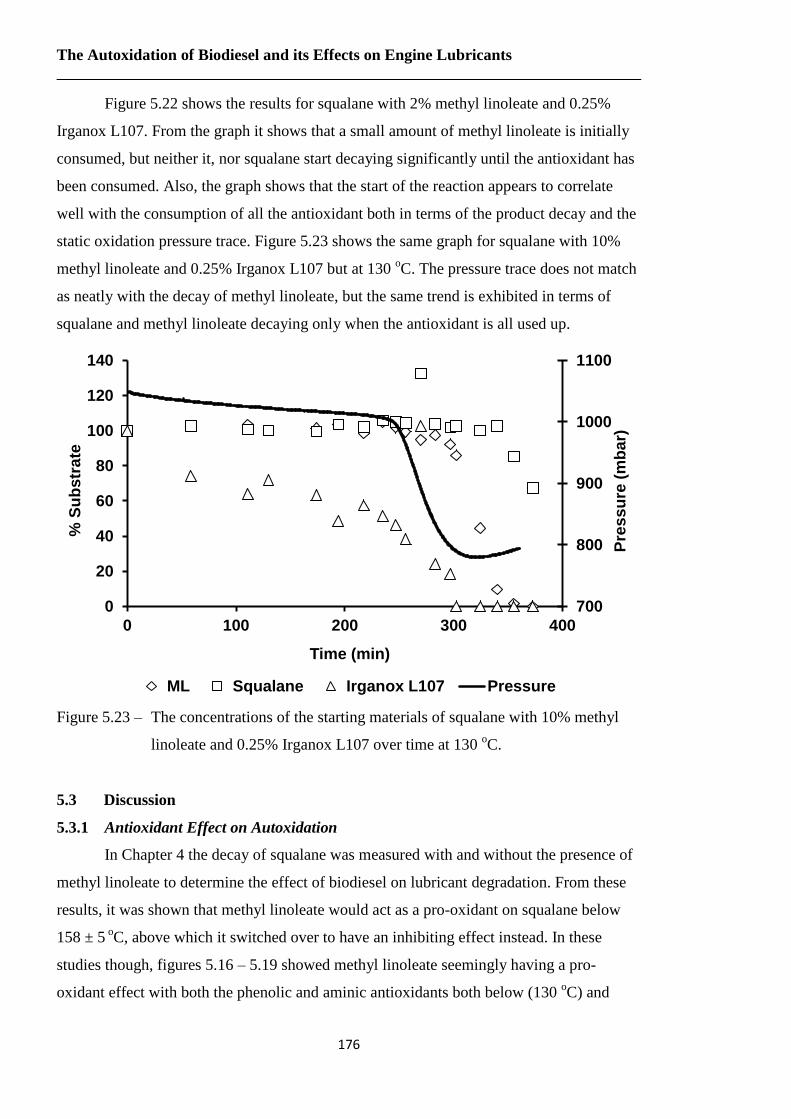
The Autoxidation of Biodiesel and its Effects on Engine Lubricants
176
Figure 5.22 shows the results for squalane with 2% methyl linoleate and 0.25%
Irganox L107. From the graph it shows that a small amount of methyl linoleate is initially
consumed, but neither it, nor squalane start decaying significantly until the antioxidant has
been consumed. Also, the graph shows that the start of the reaction appears to correlate
well with the consumption of all the antioxidant both in terms of the product decay and the
static oxidation pressure trace. Figure 5.23 shows the same graph for squalane with 10%
methyl linoleate and 0.25% Irganox L107 but at 130 oC. The pressure trace does not match
as neatly with the decay of methyl linoleate, but the same trend is exhibited in terms of
squalane and methyl linoleate decaying only when the antioxidant is all used up.
Figure 5.23 – The concentrations of the starting materials of squalane with 10% methyl
linoleate and 0.25% Irganox L107 over time at 130 oC.
5.3 Discussion
5.3.1 Antioxidant Effect on Autoxidation
In Chapter 4 the decay of squalane was measured with and without the presence of
methyl linoleate to determine the effect of biodiesel on lubricant degradation. From these
results, it was shown that methyl linoleate would act as a pro-oxidant on squalane below
158 ± 5 oC, above which it switched over to have an inhibiting effect instead. In these
studies though, figures 5.16 – 5.19 showed methyl linoleate seemingly having a pro-
oxidant effect with both the phenolic and aminic antioxidants both below (130 oC) and
700
800
900
1000
1100
0
20
40
60
80
100
120
140
0 100 200 300 400P
res
su
re (
mb
ar)
% S
ub
str
ate
Time (min)
ML Squalane Irganox L107 Pressure
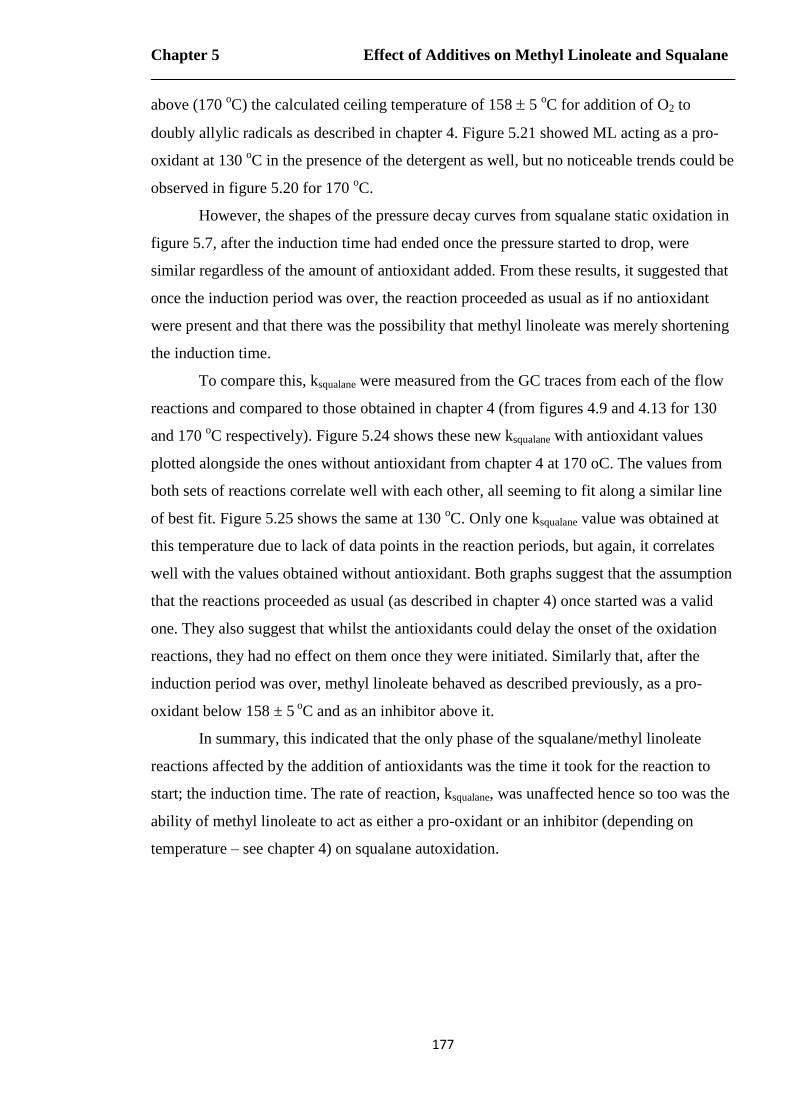
Chapter 5 Effect of Additives on Methyl Linoleate and Squalane
177
above (170 oC) the calculated ceiling temperature of 158 5
oC for addition of O2 to
doubly allylic radicals as described in chapter 4. Figure 5.21 showed ML acting as a pro-
oxidant at 130 oC in the presence of the detergent as well, but no noticeable trends could be
observed in figure 5.20 for 170 oC.
However, the shapes of the pressure decay curves from squalane static oxidation in
figure 5.7, after the induction time had ended once the pressure started to drop, were
similar regardless of the amount of antioxidant added. From these results, it suggested that
once the induction period was over, the reaction proceeded as usual as if no antioxidant
were present and that there was the possibility that methyl linoleate was merely shortening
the induction time.
To compare this, ksqualane were measured from the GC traces from each of the flow
reactions and compared to those obtained in chapter 4 (from figures 4.9 and 4.13 for 130
and 170 oC respectively). Figure 5.24 shows these new ksqualane with antioxidant values
plotted alongside the ones without antioxidant from chapter 4 at 170 oC. The values from
both sets of reactions correlate well with each other, all seeming to fit along a similar line
of best fit. Figure 5.25 shows the same at 130 oC. Only one ksqualane value was obtained at
this temperature due to lack of data points in the reaction periods, but again, it correlates
well with the values obtained without antioxidant. Both graphs suggest that the assumption
that the reactions proceeded as usual (as described in chapter 4) once started was a valid
one. They also suggest that whilst the antioxidants could delay the onset of the oxidation
reactions, they had no effect on them once they were initiated. Similarly that, after the
induction period was over, methyl linoleate behaved as described previously, as a pro-
oxidant below 158 ± 5 oC and as an inhibitor above it.
In summary, this indicated that the only phase of the squalane/methyl linoleate
reactions affected by the addition of antioxidants was the time it took for the reaction to
start; the induction time. The rate of reaction, ksqualane, was unaffected hence so too was the
ability of methyl linoleate to act as either a pro-oxidant or an inhibitor (depending on
temperature – see chapter 4) on squalane autoxidation.
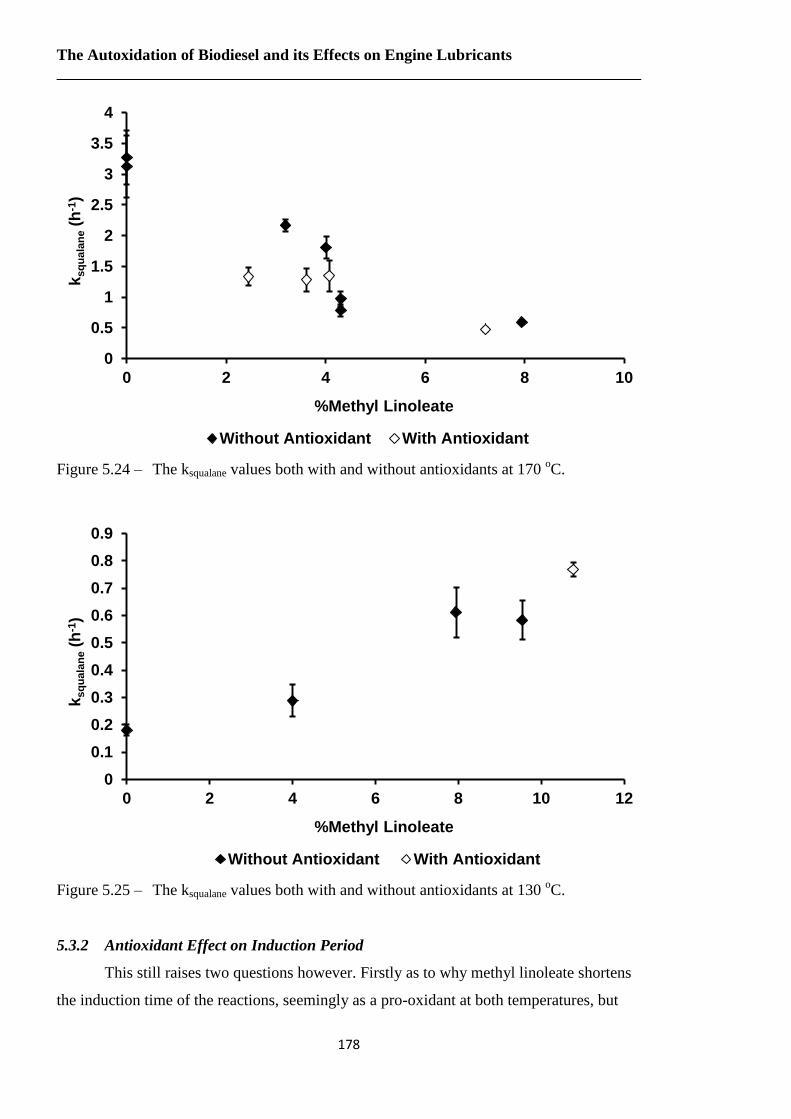
The Autoxidation of Biodiesel and its Effects on Engine Lubricants
178
Figure 5.24 – The ksqualane values both with and without antioxidants at 170 oC.
Figure 5.25 – The ksqualane values both with and without antioxidants at 130 oC.
5.3.2 Antioxidant Effect on Induction Period
This still raises two questions however. Firstly as to why methyl linoleate shortens
the induction time of the reactions, seemingly as a pro-oxidant at both temperatures, but
0
0.5
1
1.5
2
2.5
3
3.5
4
0 2 4 6 8 10
ksq
ua
lan
e (
h-1
)
%Methyl Linoleate
Without Antioxidant With Antioxidant
0
0.1
0.2
0.3
0.4
0.5
0.6
0.7
0.8
0.9
0 2 4 6 8 10 12
ksq
ua
lan
e (
h-1
)
%Methyl Linoleate
Without Antioxidant With Antioxidant
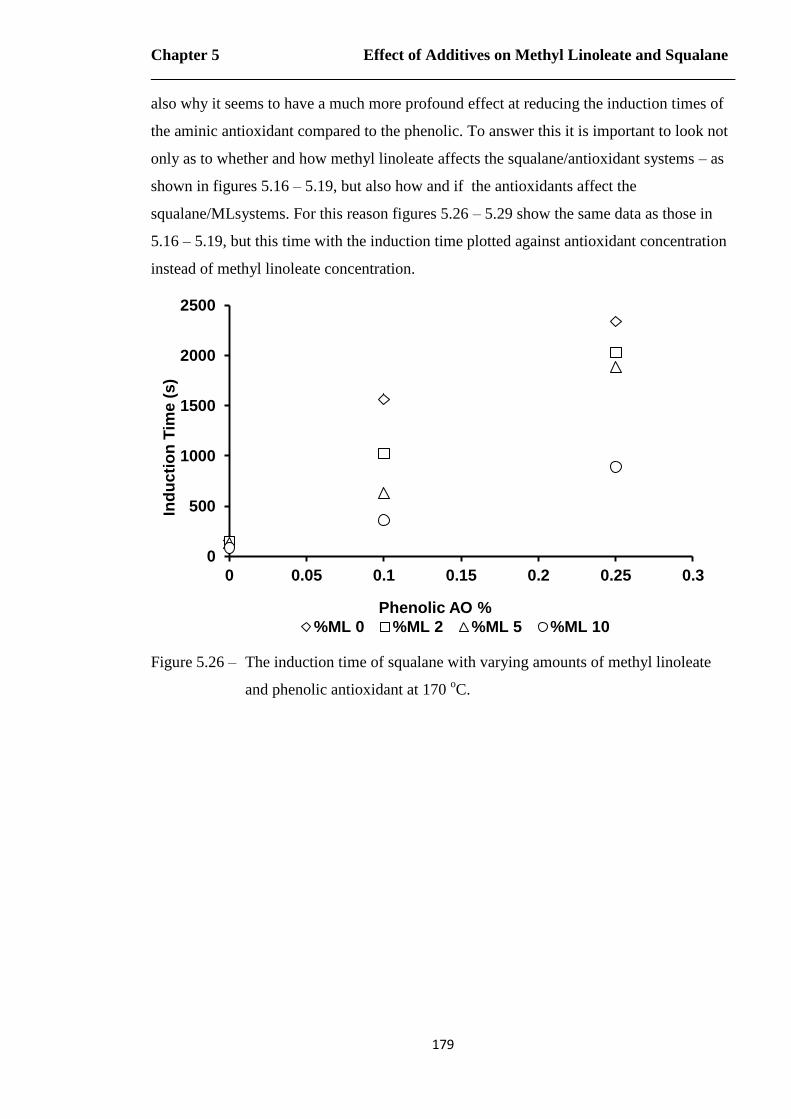
Chapter 5 Effect of Additives on Methyl Linoleate and Squalane
179
also why it seems to have a much more profound effect at reducing the induction times of
the aminic antioxidant compared to the phenolic. To answer this it is important to look not
only as to whether and how methyl linoleate affects the squalane/antioxidant systems – as
shown in figures 5.16 – 5.19, but also how and if the antioxidants affect the
squalane/MLsystems. For this reason figures 5.26 – 5.29 show the same data as those in
5.16 – 5.19, but this time with the induction time plotted against antioxidant concentration
instead of methyl linoleate concentration.
Figure 5.26 – The induction time of squalane with varying amounts of methyl linoleate
and phenolic antioxidant at 170 oC.
0
500
1000
1500
2000
2500
0 0.05 0.1 0.15 0.2 0.25 0.3
Ind
uc
tio
n T
ime
(s)
Phenolic AO %
%ML 0 %ML 2 %ML 5 %ML 10
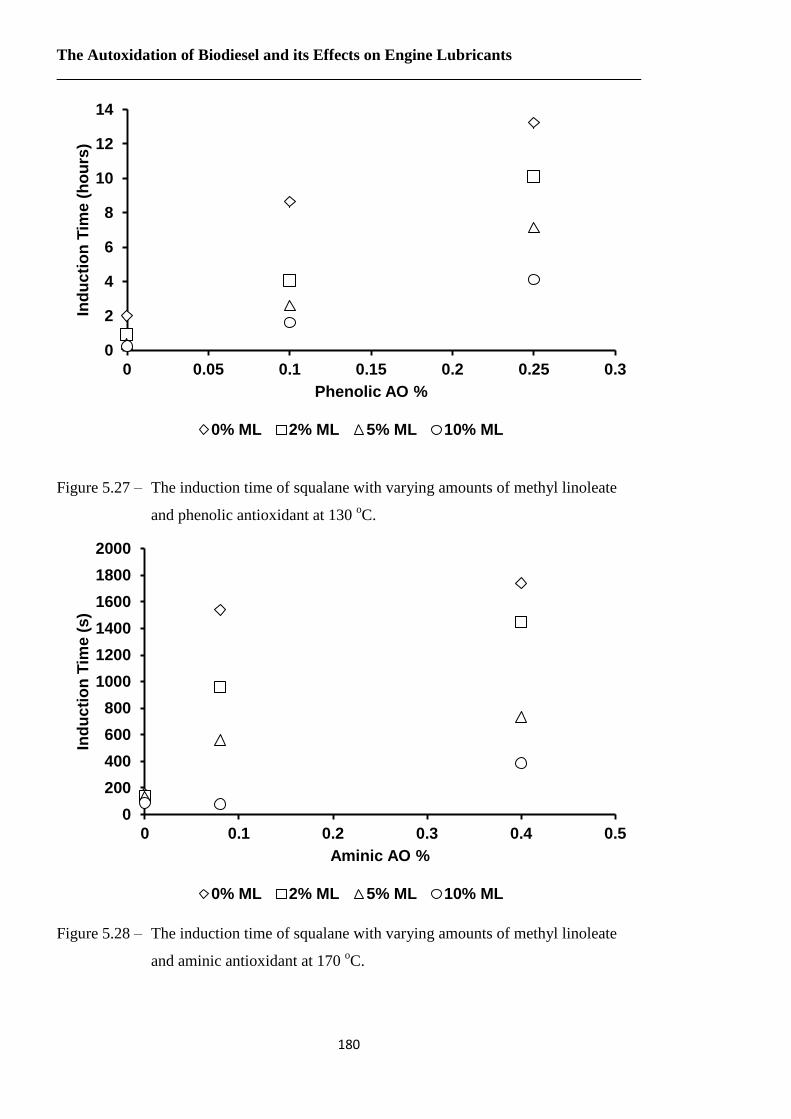
The Autoxidation of Biodiesel and its Effects on Engine Lubricants
180
Figure 5.27 – The induction time of squalane with varying amounts of methyl linoleate
and phenolic antioxidant at 130 oC.
Figure 5.28 – The induction time of squalane with varying amounts of methyl linoleate
and aminic antioxidant at 170 oC.
0
2
4
6
8
10
12
14
0 0.05 0.1 0.15 0.2 0.25 0.3
Ind
uc
tio
n T
ime
(h
ou
rs)
Phenolic AO %
0% ML 2% ML 5% ML 10% ML
0
200
400
600
800
1000
1200
1400
1600
1800
2000
0 0.1 0.2 0.3 0.4 0.5
Ind
uc
tio
n T
ime
(s)
Aminic AO %
0% ML 2% ML 5% ML 10% ML
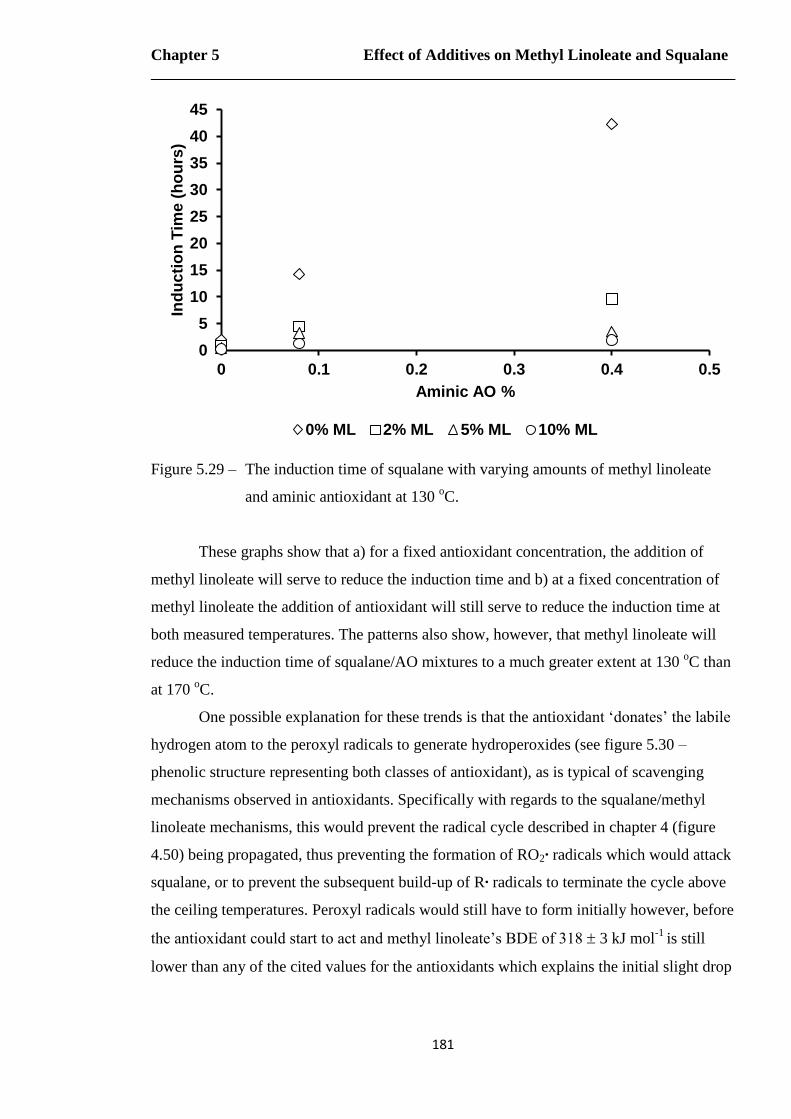
Chapter 5 Effect of Additives on Methyl Linoleate and Squalane
181
Figure 5.29 – The induction time of squalane with varying amounts of methyl linoleate
and aminic antioxidant at 130 oC.
These graphs show that a) for a fixed antioxidant concentration, the addition of
methyl linoleate will serve to reduce the induction time and b) at a fixed concentration of
methyl linoleate the addition of antioxidant will still serve to reduce the induction time at
both measured temperatures. The patterns also show, however, that methyl linoleate will
reduce the induction time of squalane/AO mixtures to a much greater extent at 130 oC than
at 170 oC.
One possible explanation for these trends is that the antioxidant ‘donates’ the labile
hydrogen atom to the peroxyl radicals to generate hydroperoxides (see figure 5.30 –
phenolic structure representing both classes of antioxidant), as is typical of scavenging
mechanisms observed in antioxidants. Specifically with regards to the squalane/methyl
linoleate mechanisms, this would prevent the radical cycle described in chapter 4 (figure
4.50) being propagated, thus preventing the formation of RO2∙ radicals which would attack
squalane, or to prevent the subsequent build-up of R∙ radicals to terminate the cycle above
the ceiling temperatures. Peroxyl radicals would still have to form initially however, before
the antioxidant could start to act and methyl linoleate’s BDE of 318 3 kJ mol-1
is still
lower than any of the cited values for the antioxidants which explains the initial slight drop
0
5
10
15
20
25
30
35
40
45
0 0.1 0.2 0.3 0.4 0.5
Ind
uc
tio
n T
ime
(h
ou
rs)
Aminic AO %
0% ML 2% ML 5% ML 10% ML
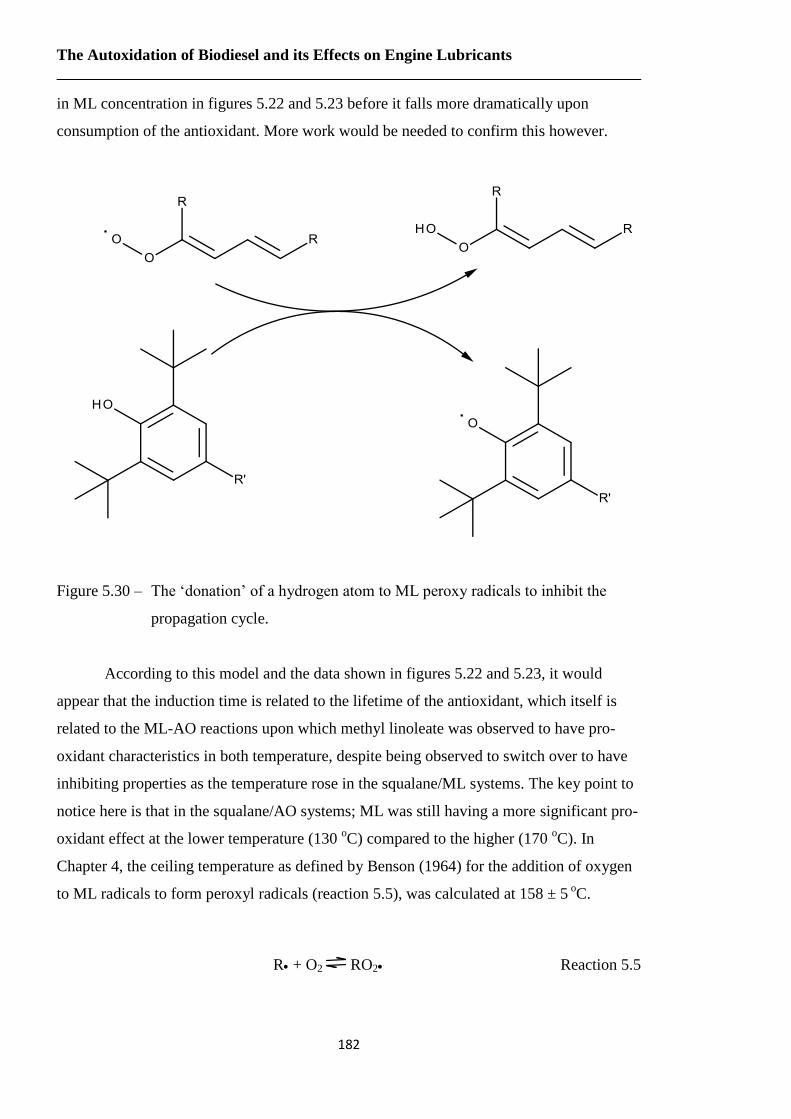
The Autoxidation of Biodiesel and its Effects on Engine Lubricants
182
in ML concentration in figures 5.22 and 5.23 before it falls more dramatically upon
consumption of the antioxidant. More work would be needed to confirm this however.
Figure 5.30 – The ‘donation’ of a hydrogen atom to ML peroxy radicals to inhibit the
propagation cycle.
According to this model and the data shown in figures 5.22 and 5.23, it would
appear that the induction time is related to the lifetime of the antioxidant, which itself is
related to the ML-AO reactions upon which methyl linoleate was observed to have pro-
oxidant characteristics in both temperature, despite being observed to switch over to have
inhibiting properties as the temperature rose in the squalane/ML systems. The key point to
notice here is that in the squalane/AO systems; ML was still having a more significant pro-
oxidant effect at the lower temperature (130 oC) compared to the higher (170
oC). In
Chapter 4, the ceiling temperature as defined by Benson (1964) for the addition of oxygen
to ML radicals to form peroxyl radicals (reaction 5.5), was calculated at 158 ± 5 oC.
R + O2 RO2 Reaction 5.5
Chapter 5 Effect of Additives on Methyl Linoleate and Squalane
183
Below this temperature, in this case at 130 oC, the equilibrium will be to the right
and hence favour a build-up of peroxyl radicals, which will be subsequently scavenged by
the antioxidant, hence accelerating its rate of decay as observed. Above this temperature
the equilibrium shifts to the left away from the build-up of peroxyl radicals however,
crucially, not completely elimating the forward reaction that produces them and therefore,
whilst at a comparatively lower concentration, peroxyl radicals will still be formed above
the ceiling temperature – as shown in Chapter 3 where the breakdown products formed via
peroxyl radicals were seen at all temperatures – and therefore will still be scavenged by the
antioxidant and hence reducing the induction period of the overall reaction. The ceiling
temperature for the reaction between ML (or another doubly allylic species) will still be the
same, but for the case of the induction period, the main mechanism responsible is slightly
different. In this case, any hypothetical switchover in behaviour – e.g. ML starting to
increase the induction period – would occur at the temperature where the reverse reaction
would become so fast as to either essentially eliminate the production of peroxyl radicals
or to make them dissociate faster than antioxidants could scavenge them. This switchover
mechanism could theoretically be investigated, by determining the temperature at which
this occurred with various different antioxidants. If the former mechanism (elimination of
the production of peroxyl radicals), the temperature should be consistent whichever
antioxidant was used, if the latter, it should vary according to the AO’s speed and
efficiency at scavenging peroxyl radicals. In practice, this would be very difficult to
achieve (probably impossible on the described experimental setup) due to the extremely
high speeds that induction periods would be likely to occur at; another problem would
occur if that theoretical temperature occurred higher than ML’s boiling point of 346 oC (at
1atm – Krop 1997), although a different doubly allylic species could be substituted for this
purpose. From this work, it would initially suggest that the latter is the case as ML had a
more noticeable effect on the aminic antioxidant compared to the phenolic, perhaps due to
some interference with the Denisov cycle (Figure 5.5) preventing regeneration of the
nitroxyl radical and hence reducing the overall longevity of the antioxidant. Again, this
would require further work to confirm/disprove.
A second possible explanation is that the rate of squalane autoxidation, described in
chapter 4, is dependent on the propagation reaction of oxygen addition to the doubly allylic
radicals (reaction 5.5) which is reversible above the ceiling temperature, whereas the
induction period is dependent upon the initiation reaction of methyl linoleate oxidation,
The Autoxidation of Biodiesel and its Effects on Engine Lubricants
184
whereby hydrogen is abstracted to give doubly allylic and hydroperoxyl radicals (reaction
5.6).
R + O2 → R + HO2 Reaction 5.6
As described already, due to bond strengths, this is much faster than the initiation
rate for squalane, but critically no studies (as of yet) have reported this reaction as being
reversible meaning it would get faster as temperature increased and hence reduce the
induction period at all measured temperatures. The fact that the proportional effect is lower
at 170 oC than at 130
oC can also be explained via this mechanism by considering the bond
strengths. As the two ML + O2 reactions (from chapter 3) occur more readily than squalane
+ O2 due to the difference in bond strengths, it naturally follows that the activation energy
for the these two are lower and hence the rate constants faster which seems to be the case
considering the observed rate constants for overall autoxidation where all larger for kML
(both reactions) than ksqualane at all measured temperatures (as shown in chapters 3 and 4
respectively). As the temperature increases the gap between the kML and ksqualane values
should decrease, again as shown in the observed rate constants for both reactions (see
figure 5.31), meaning that the proportional effect of linoleate would also decrease as
observed.
In summary, as the temperature increases, the difference between the kML and
ksqualane values decrease, hence so too does the proportional effect of methyl linoleate
reducing the induction time of squalane/methyl linoleate/antioxidant systems.

Chapter 5 Effect of Additives on Methyl Linoleate and Squalane
185
Figure 5.31 – Arrhenius plots for squalane and both methyl linoleate autoxidation
reactions.
5.3.3 Relevance to Behaviour in Engines
As before, these results have potential significance when the temperatures in
engines are considered. Antioxidants are employed to increase the overall longevity of the
engine lubricant and hence any reduction in their effectiveness will impact on the overall
efficiency of the engine. In Chapter 4, it was shown that the lubricant base fluid was most
susceptible to enhanced degradation rates from doubly unsaturated biodiesel components at
lower (100 – 130 oC) temperatures, typical of those found in the sump. It is therefore
important that antioxidants can function effectively at these temperatures in order to
protect the engine efficiently. The results from this chapter show that, unfortunately,
methyl linoleate can both reduce the lifetime of the antioxidant and still go on to attack the
lubricant base fluid upon consumption of the antioxidant at these temperatures.
Furthermore, as with the ceiling temperature effect shown in Chapter 4, its relative
effectiveness at this increases as temperature decreases, meaning that the area in which the
lubricant and fuel come into contact the most (in the sump) is the area where the
antioxidant is required to work more efficiently, yet is also the area where its performance
is most likely to be hindered.
-5
-4
-3
-2
-1
0
1
2
0.0022 0.0023 0.0024 0.0025 0.0026 0.0027 0.0028
ln k
ob
s/[
h-1
]
1/T K-1
Squalane ML
The Autoxidation of Biodiesel and its Effects on Engine Lubricants
186
More positively, however, both phenolic and aminic antioxidants were shown to
delay the onset of autoxidation reactions at very low (<1%) concentrations, even if that
delay could be shortened by methyl linoleate. It was also shown that the aminic AO was
more effective than the phenolic, indicating the possibility of developing antioxidants that
could have greater efficiency at increasing these induction periods; though these combined
results still suggest that doubly unsaturated compounds in the fuel should ideally be kept at
low concentrations.
Of further interest here would be investigating the effect of the phenolic and aminic
antioxidants together in solution as previous work on the two has shown the ability of
phenolic antioxidants to help regenerate aminic antioxidants in a process known as
synergism, described by Bishov for phenolic antioxidants in food chemistry (1975 and
1977) and reported for synthetic antioxidants (aminic and phenolic) by Denisov (2005) and
Alfadhl (2008). It would therefore be beneficial to see whether these could prolong
induction periods further, or, more crucially, whether methyl linoleate would have the
ability to inhibit synergistic effects significantly.
5.3.4 Detergent
Trends with the detergent were much harder to determine however, mainly due to
error margins. The errors associated with the static oxidation come from two sources,
experimental error from variability in the method itself (though figure 6.10 does show
good reproducibility where the antioxidant concentrations are similar) and human error in
reading the induction time off the pressure trace. Unfortunately, the exact error margin of
both is unknown, but by examining the two closest cases of OS146100 in squalane where
concentrations of 0.80% and 0.81% w/w had induction times of 1932 and 1912 seconds
respectively, and from them assuming a rough estimate of 10s for the error, it can be seen
that on the timescales of less than 100s (as is the case for the detergent below 170 oC) the
experimental setup is not precise enough to obtain accurate results within a good error
margin. All the other experiments had timescales over 100s where the approximate error is
therefore less than 10% of the value obtained.
As the trends shown with detergent and squalane in the absence of methyl linoleate
in figures 5.14 and 5.15 are very different to those shown with antioxidants, it also
suggests that any effect detergent has on biodiesel/lubricant system are sufficiently

Chapter 5 Effect of Additives on Methyl Linoleate and Squalane
187
different mechanistically as to perhaps require a different method to the ones described
here in any case.
5.4 Summary
Following on from the work on methyl linoleate and squalane in Chapter 4, the effects
of 3 different additives were tested on these mixtures; a phenolic antioxidant (Irganox
L107), an aminic antioxidant (OS146100) and an overbased sodium sulphonate detergent
(OS102880). The antioxidants both appeared to delay the onset of the main squalane/ML
reactions but then did not affect them once depleted. The most likely cause was attributed
to the antioxidants converting the reactive peroxyl radicals into hydroperoxides. The
detergents did not show as many noticeable trends due to the reactions being too fast to
measure within the error margins on the current equipment setup, but did suggest that the
radical scavenging model did not apply to these compounds.
Overall, these results would require more work in order to properly support the
models proposed. The antioxidants could perhaps be tested for the breakdown products or
the presence methyl linoleate hydroperoxides, though the former would require a very
sensitive GC technique due to the trace concentrations in which antioxidants are used –
perhaps a column with a lower affinity for aromatics. Also of interest would be to test the
two models proposed for the effect of linoleate switching between pro-oxidant and
inhibitor in squalane with increasing temperature, whilst reducing the induction period at
all temperatures in antioxidant reactions. One potential study could be to measure
equilibrium constants of the initiation reaction of methyl linoleate + O2, specifically to see
if any degree of reversibility can be detected as the second model requires the reaction to
be irreversible. Another (though more expensive) test for the first model could be to
isotopically label the labile hydrogen on the antioxidants with deuterium and look for
deuteriated ML hydroperoxides via GC-MS to see if the antioxidant is indeed donating the
hydrogen atom to the peroxyl radicals and hence preventing the propagation cycle.
The detergent work would most likely have to be carried out at lower temperatures –
though this would raise questions about how valid any models would be at higher
temperatures; particularly at those higher than the ceiling temperatures of any of the
reagents. Alternatively a different experimental setup would be required – perhaps one
with a greater degree of automation – that would be more sensitive to the short reaction
times at high temperatures.

The Autoxidation of Biodiesel and its Effects on Engine Lubricants
188
5.5 References
Alfadhl, A. The Behaviour of Antioxidants in Lubricant Base Fluids at High Gasoline
Engine Temperatures. PhD Thesis, University of York, 2008.
Benson, S.W. Effect of Resonance and Structure on the Thermochemistry of Organic
Peroxy Radicals and the Kinetics of Combustion Reaction, J. Am. Chem. Soc 1964,
87(5), 972-980.
Bishov, S.J. Henick, A.S. Antioxidant Effect of Protein Hydrolyzates in Freeze-Dried
Model Systems; Synergistic Action with a Series of Phenolic Antioxidants, Journal
of Food Science, 1975, 40(2), 345-348
Bishov, S.J. Masuoka, Y. Kapsalis, J.G. Antioxidant Effect of Spices, Herbs and Protein
Hydrolyzates in Freeze-Dried Model Systems: Synergistic Action with Synthetic
Phenolic Antioxidants, Journal of Food Processing and Preservation, 1977, 1(2),
153-166
The British Petroleum Company - Industrial Lubrication. 1966. Published East Grinstead,
The British Petroleum Company.
Cort, W.M. Antioxidant Properties of Ascorbic Acid in Foods, Advances in Chemistry,
1982, 200(22), 533-550.
Denisov, E.T. Mechanism of Regeneration of Hindered Nitroxyl and Aromatic Amines,
Polymer Degradation and Stability, 1989, 25, 209-215.
Denisov, E.T. Afanas’ev, I.B. Oxidation and Antioxidants in Organic Chemistry and
Biology, CRC Press 2005, ISBN 0-8247-5356-9.
Gedik, C.M. Boyle, S.P. Wood, S.G. Vaughan, S.J. Collins, A.R. Oxidative Stress in
Humans: Validation of Biomarkers of DNA Damage, Carcinogenesis, 2002, 23(9),
1441-1446.
Hochstein, P. Atallah, A.S. The Nature of Oxidants and Antioxidant Systems in the
Inhibition of Mutation and Cancer, Mutation Research, 1988, 202, 363-375.
Hu, J.J. Dubin, N. Kurland, D. Ma, B. Roush, G. The Effects of Hydrogen Peroxide on
DNA Repair Activities, Mutation Research, 1995, 336, 193-201.
Jensen, R.K. Korcek, S. Zinbo, M. Gerlock, J.L. Regeneration of Amine in Catalytic
Inhibition of Oxidation, J. Org. Chem. 1995, 60, 5396-5400.
Krop, H.B. v. Velzen, M.J.M. Parsons, J.R. Govers, H.R.J. Determination of
Environmentally Relevant Physical-Chemical Properties of Some Fatty Acid Esters,
JAOCS, 1997, 74(3), 309-315
Mahoney, L.R.Antioxidants, Angew. Chem. Int. Ed. 1969, 8(8), 547-555.

Chapter 5 Effect of Additives on Methyl Linoleate and Squalane
189
Mahoney, L.R. DaRooge, M.A. The Kinetic Behavior and Thermochemical Properties of
Phenoxy Radicals. J. Am. Chem. Soc. 1975, 97(16), 4722-4731.
McMillen, D.F. Golden, D.M. Hydrocarbon Bond Dissociation Energies, Ann. Rev. Phys.
Chem, 1982, 33, 493-532.
Rudnick, L.R. Lubricant Additives, Chemistry and Applications, 2nd
Ed. CRC Press 2009,
ISBN 1-4200-5964-9.
Stachokiak, G.W. Batchelor, A.W. Engineering Tribology, Chapter 3, Lubricants and their
Composition, 2006.
Wright, J.S. Johnson, E.R. DiLabio, G.A. Predicting the Activity of Phenolic Antioxidants:
Theoretical Method, Analysis of Substituent Effects, and Application to Major
Families of Antioxidants, J. Am. Chem. Soc, 2001, 123, 1173-1183.
Yen, G. Duh, P. Tsai, H. Antioxidant and Pro-oxidant Properties of Ascorbic Acid and
Gallic Acid, Food Chemistry, 2002, 79, 307-313.

The Autoxidation of Biodiesel and its Effects on Engine Lubricants
190

Conclusions and Future Work
191
6. Conclusions and Future Work
6.1 Overview of Results
Prior to this study, it was known that increasing the length of the alkyl chain of
FAME biodiesel would increase the cetane number (CN) as well as the pour point and
kinematic viscosity, whilst introducing unsaturated sites onto the chain would reduce all
three. However, it also appeared that biodiesel with higher levels of unsaturation
exacerbated detrimental effects of the engine over time, such as injector clogging, piston
ring sticking and sludge and soot formation. The general consensus was that there was a
tradeoff – unsaturates would bring viscosities and freezing/pour points into specification at
the expense of enhancing engine degradation. Consequently in the UK biodiesel is
currently only allowed to be blended with mineral diesel in levels up to 7% - any higher
and the fuel must be labelled as such.
From this work, however it appears that only polyunsaturated compounds enhance
the rate of lubricant degradation or have chemical influence on other engine components.
In the model systems at least, with methyl oleate (the monounsaturated analogue) present
squalane (the lubricant analogue) behaved exactly the same as it did with none present.
Only methyl linoleate (the polyunsaturated analogue) had any effect on oxidation rates;
below 158 5 oC methyl linoleate acted as a pro-oxidant, switching to an inhibitor above
this temperature. This was attributed to the reversible binding of oxygen radicals to the
doubly allylic radical formed by hydrogen abstraction in chapter 4. In chapter 3, whilst
examining the autoxidation of methyl linoleate by itself, it was noted that the
decomposition of methyl linoleate by formation of hydroperoxides after hydrogen
abstraction – currently the accepted main mechanism of autoxidation – became less
significant as the temperature increased with epoxidation, formed instead by addition of
peroxyl radicals to double bonds, started to become the dominant mechanism. A rough
cross-over temperature of 176.5 ± 10.2 oC was calculated which, despite some
assumptions, correlates relatively well with the ceiling temperature of 158 5 oC
calculated in chapter 4 indicating that there is perhaps some connection between the
reversibility of oxygen binding to allylic radicals to form peroxyl radicals and the main
mechanisms (hydrogen abstraction or addition to double bonds) by which peroxyl radicals
attack species.

The Autoxidation of Biodiesel and its Effects on Engine Lubricants
192
In chapter 5 antioxidants were also added to the methyl linoleate and squalane
mixtures from which it was shown that antioxidants could delay the induction period of
reactions whilst methyl linoleate could accelerate them. Interestingly the latter point
appeared true at all temperatures; there was no crossover to methyl linoleate becoming an
inhibitor as there had been with squalane. More detailed analysis revealed however, that
when the antioxidant was consumed the reactions between squalane and methyl linoleate
proceeded the same as if no antioxidant were present. From this it was deduced that
antioxidants could only prevent the onset of a reaction, not alter the rate of it once started.
Two possible mechanisms were suggested as to why methyl linoleate served to
accelerate the onset of a reaction at all temperatures contrary to what was observed with
squalane. The first was that methyl linoleate radicals, both in allylic and peroxyl form,
were scavenged by the antioxidant. As the concentration of methyl linoleate increased,
more radicals were produced hence the antioxidant was consumed faster. The second was
that the crossover temperature was based around radical propagation reactions, crucially
the reversible binding of oxygen to doubly allylic radicals whilst the induction period is
based on radical initiation reactions, mainly hydrogen abstraction by molecular oxygen
which is irreversible and hence faster at all temperatures.
6.2 Future Work on Autoxidation
As the temperature calculated in chapter 3 is based on some large assumptions due
to availability of data, one useful future study would be to gather further data by carrying
out flow reactions of methyl linoleate but taking samples earlier to try and obtain rate
constants for both the hydrogen abstraction via peroxyl radicals and addition of peroxyl
radicals to double bonds. This work would also hopefully identify a formation and decay
trend for the dehydrodimer which would help clarify some of the trends seen in chapter 4 –
if the hydroperoxide route is less favoured above the ceiling temperature, yet hydrogen
abstraction is still occurring then dimeric compounds should be being formed as well as
epoxides. If dimeric compounds are short lived, then polymerisation would be expected
which would explain why, even though ML is inhibiting squalane degradation, KV40
continues to increase. Other methods such as GPC may have to be investigated if these
compounds cannot be detected via GC.
It would also be highly beneficial to continue with the study of methyl oleate to the
same level; as well as cataloguing the products measuring the rates of their formation and
calculating the selectivity of radical attack sites in the same way as was done for methyl
Conclusions and Future Work
193
linoleate. This completed study would be of benefit both industrially and academically; the
former by examining how similar monounsaturated compounds behaved compared to
polyunsaturated ones in storage and combustion. If methyl oleate also has the same
crossover between degradation mechanisms (peroxyl radical hydrogen abstraction v
addition) then the temperature at which this did or did not occur would help to tell whether
the similarity between two crossover temperatures observed with methyl linoleate
(158 5 oC for reversible addition of oxygen to doubly allylic radicals and 176.5 ± 10.2
oC
for the hydrogen abstraction/addition degradation mechanism) indicates a connection
between the mechanisms or is purely coincidental. Either way would help to further the
knowledge of autoxidation mechanisms of not only biodiesel, but unsaturated molecules in
general.
6.3 Future Work on Chemically Modelling Biodiesel
Monounsaturated compounds appeared to behave the same as saturated ones
assuming the current model, that saturated FAME compounds are chemically inert with
respect to their fuel properties, is correct. Another beneficial future study therefore would
be to study the effect of saturated FAME compounds such as methyl palmitate or methyl
stearate (16 and 18 carbon chain respectively) to test whether, like methyl oleate, they
would have no effect on squalane oxidation rates. The study of these compounds would
also be highly relevant to the effect of biodiesel on lubricants as they are also very
common biodiesel components and studies of these would not only mean all three different
FAME classes had been covered, but also all of the four major biodiesel compounds –
methyl stearate, palmitate, oleate and linoleate.
Another piece of potential future work could be to investigate the role of FAME
with 3 or 4 double bonds such as methyl linolenate (18 carbons, 3 double bonds) or methyl
arachidonate (20 carbons, 4 double bonds) on squalane oxidation. As they are
polyunsaturated, the basic chemistry principles of doubly allylic systems should be the
same as for methyl linoleate, although with more double bonds to act on, the molecule as a
whole may be more reactive. For instance, methyl arachidonate may cause squalane to
degrade much faster than methyl linoleate (due to producing peroxyl radicals faster) whilst
having a much greater inhibiting effect above it. As they are still based around doubly
allylic chemistry, however, the ceiling temperature should be the same as for doubly allylic
systems. A study of this nature may not be of as great an interest as far as relevance to
The Autoxidation of Biodiesel and its Effects on Engine Lubricants
194
engines goes, depending on the outcome of the results (linolenate and arachidonate are
much rarer than oleate and linoleate as FFA), but it would certainly test the validity of
using methyl linoleate to represent all polyunsaturated compounds as well as the theory
that polyunsaturated compounds all behave the same as diunsaturated ones as is the
currently accepted model.
6.4 Future Work on Antioxidants
As the development of more powerful and efficient antioxidants is a continually
ongoing process, this area possibly has the most potentially interesting future work for
industry; most notably as to why the aminic antioxidant had a far greater potential to
extend the induction period of methyl oleate/squalane autoxidation compared to the
phenolic, yet was more dramatically effected by increasing methyl linoleate concentration.
This could be tested by using different antioxidants (both phenolic and aminic) with
different, known substituents. Of particular interest would be which substituents increased
the induction periods and which also increased the lifetime of the antioxidant.
Such a study would also help to determine which (if either) of the two mechanisms
for methyl linoleate reducing the induction proposed in Chapter 5 are most likely to be
correct (in addition to those mentioned in the Discussion) – if it is due to the scavenging
ability of the antioxidants, then the induction time should depend heavily on the efficiency
of the antioxidant.
Overall as this field impacts on biodiesel behaviour in engines as well as being
dependant on the mechanisms of oxidation, further work in this area potentially has a lot
more to offer both industrially and academically.

Appendix A: Mass Spectrometry Data
195
Appendix A: Mass Spectrometry Data
Table A.1 – The GC EI-MS data for methyl linoleate oxidation at 170 oC, including NIST
library matches and subsequent product identification.
Peak no. Product Identification
EI Mass Spectra NIST Library Spectra
1 Pentane 39(17), 41(60), 43(100),
57(20), 72(12)
39(13), 41(50),43(100), 57(21),
72(17)
2 hexanal 39(29), 41(92), 43(71), 43(68), 44(100), 56(88), 57(64),100(2)
39(21), 41(71), 43(75), 44(100), 56(83), 57(38), 100(2)
3 2-heptenal (cis and trans) 41(100), 55(88), 70(48) 83(100 ), 97(12), 112(4) 41(100), 55(83), 70(33), 83(54),
97(4), 112(8)
4 Methyl Heptanoate
43(35), 55(21), 74(100), 87(40), 101(14.5),
113(16)
43(50), 55(15), 74(100), 87(25),
101(13), 113(10), 144(2)
5 2-Octenal 51(17), 55(86), 57(61), 69(100), 70(48), 83(97), 97(9), 126(2)
29(74), 39(42) ,41(99), 55(85), 70(71), 83(62), 126(10)
6 Methyl Octanoate
39(13), 41(41), 43(54), 55(41), 57(38), 59(31), 69(17), 74(100), 87(44), 101(19), 115(23),
127(33), 158(2)
39(10), 41(31), 43(46), 55(17), 57(17), 59(13), 69(6), 74(100),
87(38), 101(6), 115(6), 127(8),
158(2)
7 2,4 decadienal (Z,Z) 41(30), 55(19), 67(35), 81(100), 95(17), 123(7),
152(7), 325(1), 341(4), 429(1)
41(19), 55(11), 67(13), 81(100),
95(9), 123(4), 152(9)
8 2,4 decadienal (E,Z) 41(30), 55(17), 67(22), 81(100), 95(15), 109(4), 123(4), 152(9)
41(19), 55(11), 67(13), 81(100), 95(9), 123(4), 152(9)
9 8-oxo Methyl -octanoate 41(44), 55(52), 74(100), 87(94), 97(44), 112(7)
129(46), 141(33), 154(1)
41(67), 55(48), 74(100), 87(94),
97(44), 112(7), 129(63),
141(33), 154(2), 172(1)
10 8-hydroxy Methyl Octanoate
31(4), 41(48), 43(28), 55(61), 74(100), 87(54),
96(30), 124(13), 144(11)
31(19), 41(33), 43(50), 55(50),
74(100), 87(46), 96(11), 124(11), 144(13), 174(1)
11 9-oxo Methyl Nonanoate 32(2), 41(54), 55(81), 59(41), 69(37), 74(100),
87(96), 98(17), 111(61), 143(48), 155(33)
32(4), 41(43), 55(59), 59(28),
69(28), 74(100), 87(61), 98(9), 111(35), 143(30), 155(17),
171(2), 185(1)
12 10-oxo Methyl decanoate 41(39), 55(76), 74(100), 87(72), 97(35), 108(7),
125(52), 157(26), 169(15)
41(39), 55(54), 74(100), 87(70),
97(31), 125(65), 157(63),
169(50), 200(2)
13 Methyl Nonandioic acid 41(39), 43(31), 55(85), 60(15), 74(100), 83(48),
97(22), 98(19), 111(35), 124(33), 152(81), 171(30)
41(30), 43(35), 55(43), 60(13),
74(100), 83(30), 97(13), 98(19), 111(30), 124(15), 152(91),
171(26)
14 10-oxo Methyl dec-8-enoate 41(81), 55(100), 59(56), 69(83), 74(76), 83(61),
98(54), 110(), 121(24), 138(57), 148(7), 166(11)
41(100), 55(69), 69(48), 74(44),
83(30), 98(22), 110(7), 121(4),
138(13), 166(4), 198(2)
15 11-oxo Methyl undec-9-enoate 41(67), 55(100), 74(59), 83(72), 98(59), 109(20),
135(19), 152(17), 162(6), 181(7)
41(100), 55(69), 74(37), 83(28),
98(24), 109(7), 135(4), 152(4),
181(4)
16 12-oxo Methyl dodec-9-enoate 41(59), 55(100), 67(48), 74(87), 87(59), 95(31),
98(24), 109(15), 151(65), 166(11), 195(6)
41(85), 55(100), 67(37), 74(65),
95(22), 98(61), 109(15), 151(4), 166(6), 195(6), 226(4)
17 13-oxo Methyl tridec-9,11-dienoate 41(42), 55(38), 59(19), 67(40), 74(13), 81(100), 95(38), 109(19), 121(9), 135(6), 149(6), 160(2),
178(9), 188(6), 194(2), 206(11), 220(6), 238(4)
41(70), 55(85), 67(95), 74(24), 81(100), 95(69), 109(33),
121(20), 135(17), 149(11),
152(20), 178(17), 194(6), 206(1), 210(9), 220(2)
18 Methyl Linoleate 41(32), 55(45), 67(95), 74(14). 81(100), 95(64), 109(32), 123(19), 135(15), 150(18), 164(16),
178(12), 220(8), 263(29), 294(60)
41(46), 55(65), 67(100), 81(96), 95(72), 109(38), 123(20),
135(15), 150(16), 165(10),
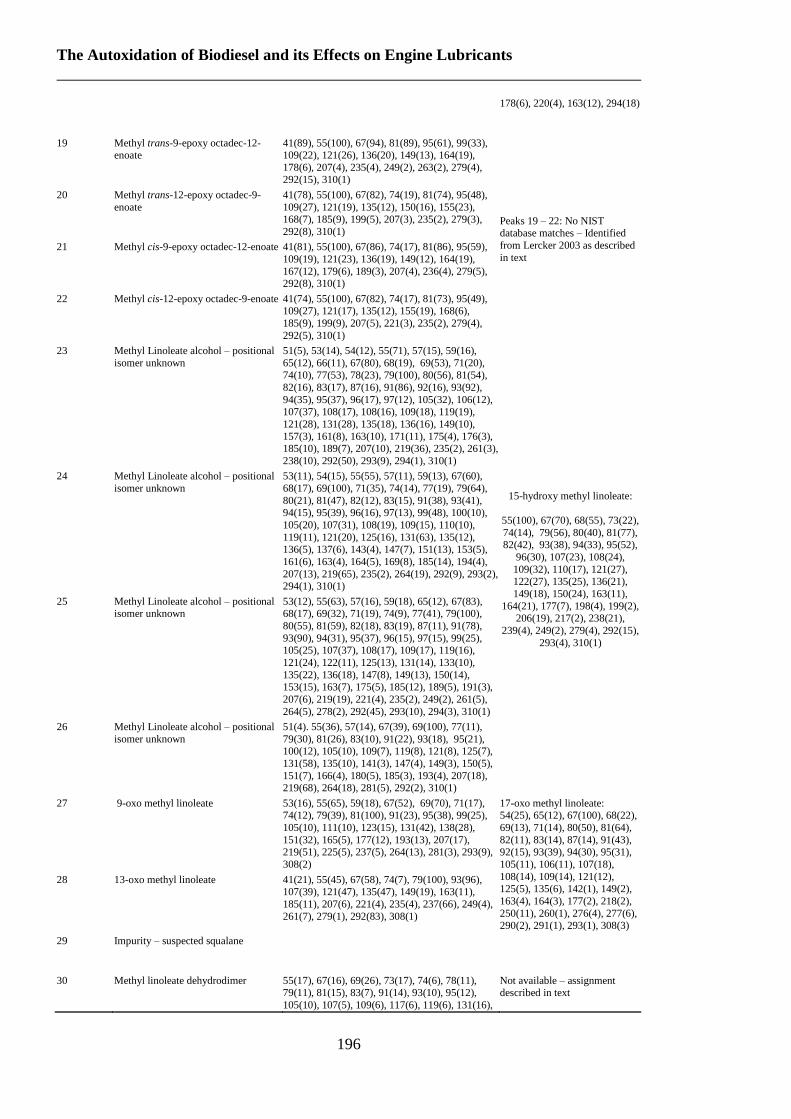
The Autoxidation of Biodiesel and its Effects on Engine Lubricants
196
178(6), 220(4), 163(12), 294(18)
19 Methyl trans-9-epoxy octadec-12-enoate
41(89), 55(100), 67(94), 81(89), 95(61), 99(33), 109(22), 121(26), 136(20), 149(13), 164(19),
178(6), 207(4), 235(4), 249(2), 263(2), 279(4), 292(15), 310(1)
Peaks 19 – 22: No NIST database matches – Identified
from Lercker 2003 as described
in text
20 Methyl trans-12-epoxy octadec-9-
enoate
41(78), 55(100), 67(82), 74(19), 81(74), 95(48),
109(27), 121(19), 135(12), 150(16), 155(23), 168(7), 185(9), 199(5), 207(3), 235(2), 279(3),
292(8), 310(1)
21 Methyl cis-9-epoxy octadec-12-enoate 41(81), 55(100), 67(86), 74(17), 81(86), 95(59),
109(19), 121(23), 136(19), 149(12), 164(19),
167(12), 179(6), 189(3), 207(4), 236(4), 279(5), 292(8), 310(1)
22 Methyl cis-12-epoxy octadec-9-enoate 41(74), 55(100), 67(82), 74(17), 81(73), 95(49), 109(27), 121(17), 135(12), 155(19), 168(6),
185(9), 199(9), 207(5), 221(3), 235(2), 279(4),
292(5), 310(1)
23 Methyl Linoleate alcohol – positional
isomer unknown
51(5), 53(14), 54(12), 55(71), 57(15), 59(16),
65(12), 66(11), 67(80), 68(19), 69(53), 71(20),
74(10), 77(53), 78(23), 79(100), 80(56), 81(54),
82(16), 83(17), 87(16), 91(86), 92(16), 93(92),
94(35), 95(37), 96(17), 97(12), 105(32), 106(12), 107(37), 108(17), 108(16), 109(18), 119(19),
121(28), 131(28), 135(18), 136(16), 149(10),
157(3), 161(8), 163(10), 171(11), 175(4), 176(3), 185(10), 189(7), 207(10), 219(36), 235(2), 261(3),
238(10), 292(50), 293(9), 294(1), 310(1)
15-hydroxy methyl linoleate:
55(100), 67(70), 68(55), 73(22),
74(14), 79(56), 80(40), 81(77), 82(42), 93(38), 94(33), 95(52),
96(30), 107(23), 108(24),
109(32), 110(17), 121(27), 122(27), 135(25), 136(21),
149(18), 150(24), 163(11),
164(21), 177(7), 198(4), 199(2), 206(19), 217(2), 238(21),
239(4), 249(2), 279(4), 292(15),
293(4), 310(1)
24 Methyl Linoleate alcohol – positional
isomer unknown
53(11), 54(15), 55(55), 57(11), 59(13), 67(60),
68(17), 69(100), 71(35), 74(14), 77(19), 79(64),
80(21), 81(47), 82(12), 83(15), 91(38), 93(41), 94(15), 95(39), 96(16), 97(13), 99(48), 100(10),
105(20), 107(31), 108(19), 109(15), 110(10),
119(11), 121(20), 125(16), 131(63), 135(12), 136(5), 137(6), 143(4), 147(7), 151(13), 153(5),
161(6), 163(4), 164(5), 169(8), 185(14), 194(4),
207(13), 219(65), 235(2), 264(19), 292(9), 293(2), 294(1), 310(1)
25 Methyl Linoleate alcohol – positional isomer unknown
53(12), 55(63), 57(16), 59(18), 65(12), 67(83), 68(17), 69(32), 71(19), 74(9), 77(41), 79(100),
80(55), 81(59), 82(18), 83(19), 87(11), 91(78),
93(90), 94(31), 95(37), 96(15), 97(15), 99(25), 105(25), 107(37), 108(17), 109(17), 119(16),
121(24), 122(11), 125(13), 131(14), 133(10),
135(22), 136(18), 147(8), 149(13), 150(14), 153(15), 163(7), 175(5), 185(12), 189(5), 191(3),
207(6), 219(19), 221(4), 235(2), 249(2), 261(5),
264(5), 278(2), 292(45), 293(10), 294(3), 310(1)
26 Methyl Linoleate alcohol – positional
isomer unknown
51(4). 55(36), 57(14), 67(39), 69(100), 77(11),
79(30), 81(26), 83(10), 91(22), 93(18), 95(21), 100(12), 105(10), 109(7), 119(8), 121(8), 125(7),
131(58), 135(10), 141(3), 147(4), 149(3), 150(5),
151(7), 166(4), 180(5), 185(3), 193(4), 207(18), 219(68), 264(18), 281(5), 292(2), 310(1)
27 9-oxo methyl linoleate 53(16), 55(65), 59(18), 67(52), 69(70), 71(17), 74(12), 79(39), 81(100), 91(23), 95(38), 99(25),
105(10), 111(10), 123(15), 131(42), 138(28),
151(32), 165(5), 177(12), 193(13), 207(17), 219(51), 225(5), 237(5), 264(13), 281(3), 293(9),
308(2)
17-oxo methyl linoleate: 54(25), 65(12), 67(100), 68(22),
69(13), 71(14), 80(50), 81(64),
82(11), 83(14), 87(14), 91(43), 92(15), 93(39), 94(30), 95(31),
105(11), 106(11), 107(18),
108(14), 109(14), 121(12), 125(5), 135(6), 142(1), 149(2),
163(4), 164(3), 177(2), 218(2),
250(11), 260(1), 276(4), 277(6), 290(2), 291(1), 293(1), 308(3)
28 13-oxo methyl linoleate 41(21), 55(45), 67(58), 74(7), 79(100), 93(96), 107(39), 121(47), 135(47), 149(19), 163(11),
185(11), 207(6), 221(4), 235(4), 237(66), 249(4),
261(7), 279(1), 292(83), 308(1)
29 Impurity – suspected squalane
30 Methyl linoleate dehydrodimer 55(17), 67(16), 69(26), 73(17), 74(6), 78(11), 79(11), 81(15), 83(7), 91(14), 93(10), 95(12),
105(10), 107(5), 109(6), 117(6), 119(6), 131(16),
Not available – assignment described in text
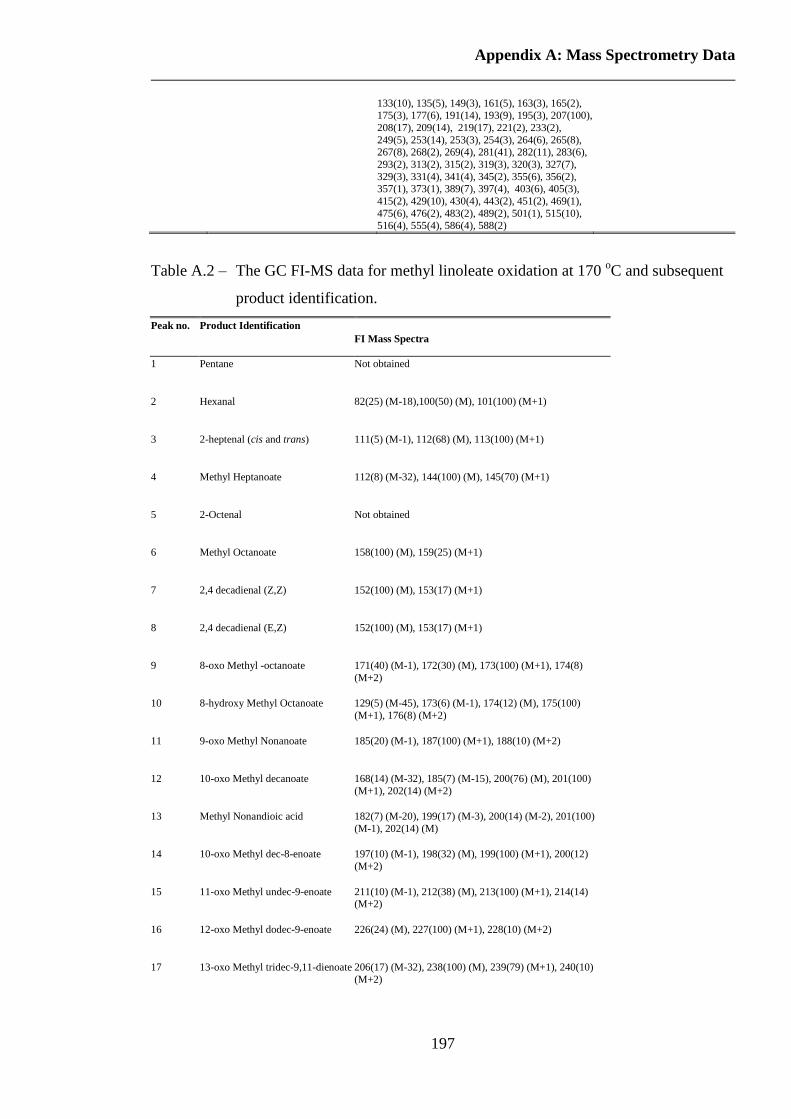
Appendix A: Mass Spectrometry Data
197
133(10), 135(5), 149(3), 161(5), 163(3), 165(2), 175(3), 177(6), 191(14), 193(9), 195(3), 207(100),
208(17), 209(14), 219(17), 221(2), 233(2),
249(5), 253(14), 253(3), 254(3), 264(6), 265(8), 267(8), 268(2), 269(4), 281(41), 282(11), 283(6),
293(2), 313(2), 315(2), 319(3), 320(3), 327(7),
329(3), 331(4), 341(4), 345(2), 355(6), 356(2), 357(1), 373(1), 389(7), 397(4), 403(6), 405(3),
415(2), 429(10), 430(4), 443(2), 451(2), 469(1),
475(6), 476(2), 483(2), 489(2), 501(1), 515(10), 516(4), 555(4), 586(4), 588(2)
Table A.2 – The GC FI-MS data for methyl linoleate oxidation at 170 oC and subsequent
product identification.
Peak no. Product Identification
FI Mass Spectra
1 Pentane Not obtained
2 Hexanal 82(25) (M-18),100(50) (M), 101(100) (M+1)
3 2-heptenal (cis and trans) 111(5) (M-1), 112(68) (M), 113(100) (M+1)
4 Methyl Heptanoate 112(8) (M-32), 144(100) (M), 145(70) (M+1)
5 2-Octenal Not obtained
6 Methyl Octanoate 158(100) (M), 159(25) (M+1)
7 2,4 decadienal (Z,Z) 152(100) (M), 153(17) (M+1)
8 2,4 decadienal (E,Z) 152(100) (M), 153(17) (M+1)
9 8-oxo Methyl -octanoate 171(40) (M-1), 172(30) (M), 173(100) (M+1), 174(8)
(M+2)
10 8-hydroxy Methyl Octanoate 129(5) (M-45), 173(6) (M-1), 174(12) (M), 175(100)
(M+1), 176(8) (M+2)
11 9-oxo Methyl Nonanoate 185(20) (M-1), 187(100) (M+1), 188(10) (M+2)
12 10-oxo Methyl decanoate 168(14) (M-32), 185(7) (M-15), 200(76) (M), 201(100)
(M+1), 202(14) (M+2)
13 Methyl Nonandioic acid 182(7) (M-20), 199(17) (M-3), 200(14) (M-2), 201(100)
(M-1), 202(14) (M)
14 10-oxo Methyl dec-8-enoate 197(10) (M-1), 198(32) (M), 199(100) (M+1), 200(12)
(M+2)
15 11-oxo Methyl undec-9-enoate 211(10) (M-1), 212(38) (M), 213(100) (M+1), 214(14) (M+2)
16 12-oxo Methyl dodec-9-enoate 226(24) (M), 227(100) (M+1), 228(10) (M+2)
17 13-oxo Methyl tridec-9,11-dienoate 206(17) (M-32), 238(100) (M), 239(79) (M+1), 240(10)
(M+2)
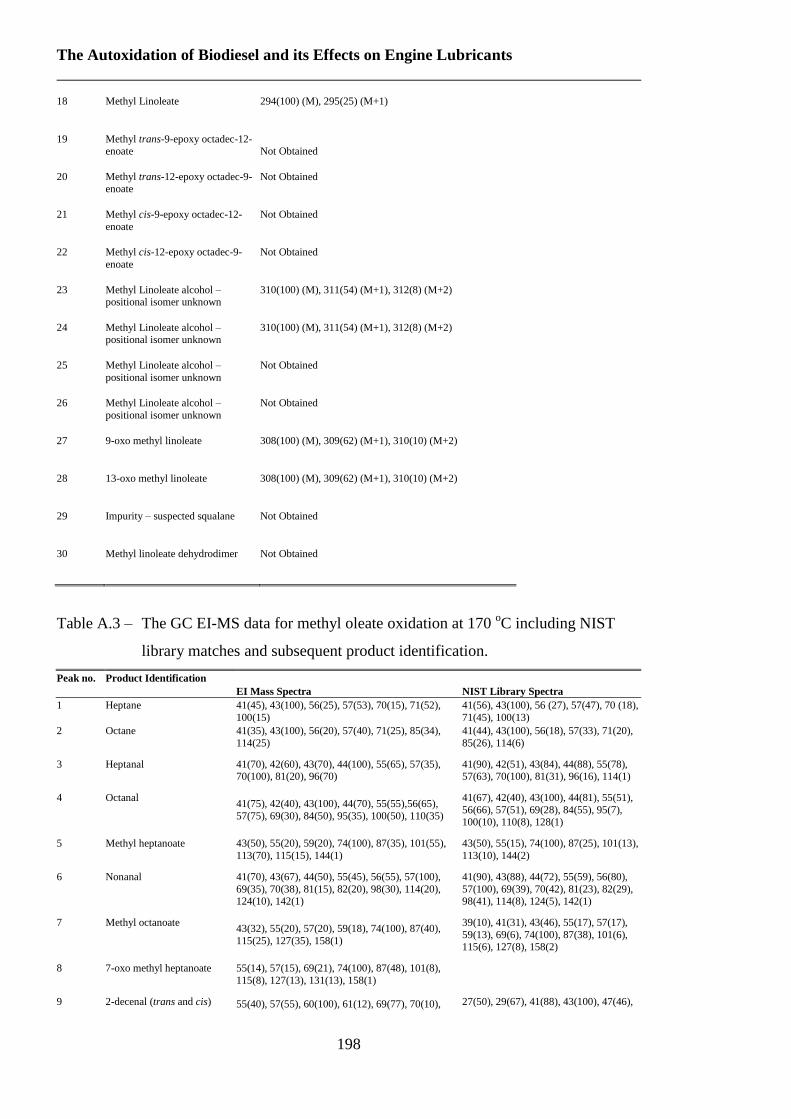
The Autoxidation of Biodiesel and its Effects on Engine Lubricants
198
18 Methyl Linoleate 294(100) (M), 295(25) (M+1)
19 Methyl trans-9-epoxy octadec-12-enoate
Not Obtained
20 Methyl trans-12-epoxy octadec-9-enoate
Not Obtained
21 Methyl cis-9-epoxy octadec-12-
enoate
Not Obtained
22 Methyl cis-12-epoxy octadec-9-
enoate
Not Obtained
23 Methyl Linoleate alcohol – positional isomer unknown
310(100) (M), 311(54) (M+1), 312(8) (M+2)
24 Methyl Linoleate alcohol – positional isomer unknown
310(100) (M), 311(54) (M+1), 312(8) (M+2)
25 Methyl Linoleate alcohol –
positional isomer unknown
Not Obtained
26 Methyl Linoleate alcohol –
positional isomer unknown
Not Obtained
27 9-oxo methyl linoleate 308(100) (M), 309(62) (M+1), 310(10) (M+2)
28 13-oxo methyl linoleate 308(100) (M), 309(62) (M+1), 310(10) (M+2)
29 Impurity – suspected squalane Not Obtained
30 Methyl linoleate dehydrodimer Not Obtained
Table A.3 – The GC EI-MS data for methyl oleate oxidation at 170 oC including NIST
library matches and subsequent product identification.
Peak no. Product Identification
EI Mass Spectra NIST Library Spectra
1 Heptane 41(45), 43(100), 56(25), 57(53), 70(15), 71(52),
100(15)
41(56), 43(100), 56 (27), 57(47), 70 (18),
71(45), 100(13)
2 Octane 41(35), 43(100), 56(20), 57(40), 71(25), 85(34),
114(25)
41(44), 43(100), 56(18), 57(33), 71(20),
85(26), 114(6)
3 Heptanal 41(70), 42(60), 43(70), 44(100), 55(65), 57(35), 70(100), 81(20), 96(70)
41(90), 42(51), 43(84), 44(88), 55(78), 57(63), 70(100), 81(31), 96(16), 114(1)
4 Octanal 41(75), 42(40), 43(100), 44(70), 55(55),56(65),
57(75), 69(30), 84(50), 95(35), 100(50), 110(35)
41(67), 42(40), 43(100), 44(81), 55(51),
56(66), 57(51), 69(28), 84(55), 95(7), 100(10), 110(8), 128(1)
5 Methyl heptanoate 43(50), 55(20), 59(20), 74(100), 87(35), 101(55),
113(70), 115(15), 144(1)
43(50), 55(15), 74(100), 87(25), 101(13),
113(10), 144(2)
6 Nonanal 41(70), 43(67), 44(50), 55(45), 56(55), 57(100),
69(35), 70(38), 81(15), 82(20), 98(30), 114(20), 124(10), 142(1)
41(90), 43(88), 44(72), 55(59), 56(80),
57(100), 69(39), 70(42), 81(23), 82(29), 98(41), 114(8), 124(5), 142(1)
7 Methyl octanoate 43(32), 55(20), 57(20), 59(18), 74(100), 87(40),
115(25), 127(35), 158(1)
39(10), 41(31), 43(46), 55(17), 57(17),
59(13), 69(6), 74(100), 87(38), 101(6), 115(6), 127(8), 158(2)
8 7-oxo methyl heptanoate 55(14), 57(15), 69(21), 74(100), 87(48), 101(8),
115(8), 127(13), 131(13), 158(1)
9 2-decenal (trans and cis) 55(40), 57(55), 60(100), 61(12), 69(77), 70(10), 27(50), 29(67), 41(88), 43(100), 47(46),

Appendix A: Mass Spectrometry Data
199
73(95), 83(7), 87(15), 91(9), 98(11), 119(10),
121(1),
55(70), 70(70), 83(51), 98(22), 110(15),
121(5), 136(1), 154(1)
10 8-oxo methyl octanoate 55(25), 59(14), 67(11), 69(100), 74(54), 87(51), 91(13), 95(18), 97(28), 100(12), 101(13), 112(2),
119(14), 129(19), 131(63), 141(12),
41(67), 55(48), 74(100), 87(94), 97(44), 112(7), 129(63), 141(33), 154(2), 172(1)
11 2-undecenal (trans and cis) 55(44), 57(23), 69(100), 70(43), 81(12), 83(29),
97(12), 111(4), 119(11), 121(6), 131(50), 135(1), 150(2)
27(39), 29(72), 39(31), 41(94), 43(82),
55(80), 57(89), 70(100), 83(57), 97(18), 111(12), 121(10), 135(2), 150(3), 168(1)
12 9-oxo methyl nonanoate 53(7), 55(55), 57(14), 59(26), 67(22), 69(100),
74(86), 81(10), 83(37), 87(60), 98(9), 100(13),
111(40), 115(13), 119(11), 131(70), 143(28), 155(17),
32(4), 41(43), 55(59), 59(28), 69(28),
74(100), 87(61), 98(9), 111(35), 143(30),
155(17), 171(2), 185(1)
13 10-oxo methyl dec-8-enoate
(trans and cis)
55(45), 59(29), 67(20), 69(100), 74(40),79(17),
83(22), 87(13), 91(11), 94(14), 95(12), 97(14), 98(24), 110(9), 119(13), 121(10), 131(61), 138(27),
166(2),
41(100), 55(69), 69(48), 74(44), 83(30),
98(22), 110(7), 121(4), 138(13), 166(4), 198(2)
14 11-oxo methyl undec-9-
enoate (trans and cis)
55(37), 59(13), 67(17), 69(100), 74(21), 81(13),
83(18), 87(14), 98(21), 109(4), 119(10), 131(57),
135(5), 152(3), 181(1)
41(100), 55(69), 74(37), 83(28), 98(24),
109(7), 135(4), 152(4), 181(4)
15 Methyl sterate (impurity) 55(23), 57(14), 69(29), 74(100), 87(70), 97(4),
101(7), 111(2), 115(2), 129(8), 131(18), 143(19),
157(1), 171(5), 185(6), 199(5), 207(2), 213(3), 219(23), 227(17), 241(2), 264(6),
43(34), 55(3), 69(17), 74(100), 87(74),
97(9), 111(4), 129(9), 143(24), 157(4),
171(2), 184(5), 199(10), 213(4), 227(1), 241(3), 255(11), 267(6), 298(14)
16 Methyl oleate 55(100), 59(14), 69(75), 74(59), 83(55), 87(38),
97(29), 98(30), 109(16), 111(15), 123(13), 131(28),
137(10), 141(6), 152(7), 166(5), 180(10), 193(1), 207(5), 194(33), 219(33), 222(16), 235(3), 246(2),
264(28), 265(17), 296(2)
29(9), 41(46), 55(100), 59 (21), 69(66),
74(54), 83(52), 87(42), 97(51), 111(24),
123(16), 137(10), 152(9), 166(7), 180(13), 193(2), 207(2), 222(16), 235(3),
246(2), 264(29), 278(1), 296(6)
17 trans-methyl oleate epoxide 53(6), 54(15), 55(87), 56(21), 57(22), 59(17), 67(64), 68(28), 69(78), 70(16), 71(11), 74(89),
75(3), 79(13), 81(44), 82(25), 83(41), 87(44),
93(11), 94(18), 95(39), 96(19), 97(32), 98(4), 101(7), 109(41), 110(6), 111(7), 121(14), 125(8),
127(18), 136(8), 139(25), 153(14), 155(100),
156(7), 167(9), 171(15), 181(2), 187(2), 199(10), 219(2), 245(2), 263(2), 294(3)312(1)
27(13), 28(13), 29(29), 39(12), 41(72),
42(23), 43(70), 54(16), 55(100), 56(33), 57(58), 59(24), 67(42), 68(31), 69(74),
70(25), 71(35), 74(93), 75(11), 81(33), 82(27), 83(48), 84(18), 85(18), 87(52),
94(20), 95(33), 96(29), 97(44), 98(14),
109(24), 110(13), 111(13), 124(11),
125(13), 127(18), 138(10), 139(17),
153(13), 155(81), 156(12), 171(15),
199(12), 214(1), 263(1), 281(2), 294(2), 312(1)
Stereochemistry undefined. Assigned from Lercker as described in text
18 cis-methyl oleate epoxide 53(7), 54(14), 55(96), 56(26), 57(25), 59(17),
67(57), 68(27), 69(80), 70(17), 71(17), 74(94),
75(4), 79(12), 81(41), 82(23), 83(43), 85(10), 87(44), 93(10), 94(18), 95(38), 96(20), 97(35),
101(7), 107(6), 109(41), 110(5), 111(9), 121(14),
125(10), 127(18), 137(8), 139(26), 141(7), 149(3), 153(17), 155(100), 156(8), 157(3), 171(17), 181(2),
185(6), 187(2), 199(10), 219(4), 245(1), 263(1),
294(2), 312(1)
19 Hydroxymethyl oleates 54(19), 55(68), 57(41), 59(15), 67(100), 68(26), 69(45), 71(11), 74(14), 79(43), 80(22), 81(89),
82(32), 83(28), 87(29), 91(10), 93(25), 94(17),
95(69), 96(30), 97(17), 98(13), 101(10), 107(17), 109(30), 110(16), 111(15), 115(5), 121(30),
123(10), 125(14), 131(16), 135(26), 136(6), 137(7),
138(5), 139(16), 149(10), 150(10), 151(6), 155(12), 163(8), 164(7), 167(30), 169(10), 178(5), 181(29),
182(4), 185(4), 195(3), 199(9), 200(3), 207(3),
209(3), 213(7), 214(2), 219(17), 220(5), 221(2),
223(2), 245(3), 262(5), 263(5), 264(5), 294(20),
295(3), 312(1)
12-hydroxy methyl oleate:
29(14), 41(32), 43(32), 54(15), 55(99), 67(24), 68(21), 69(44), 74(53), 81(25),
82(39), 83(31), 84(60), 87(33), 94(10),
95(18), 96(52), 97(42), 98(57), 109(10), 110(16), 111(17), 115(10), 119(10),
123(20), 124(46), 125(18), 137(18),
148(24), 166(100), 167(14), 180(2), 195(5), 198(35), 199(6), 221(1), 227(2),
245(1), 263(3), 269(1), 294(5), 295(2),
312(1)
20 Ketomethyl oleates 53(17), 55(100), 57(36), 59(21), 67(54), 68(17),
69(58), 70(18), 71(16), 74(9), 79(20), 81(40),
82(14), 83(30), 84(17), 85(13), 91(10), 93(21), 94(19), 95(52), 97(64), 98(13), 99(4), 107(17),
108(17), 109(48), 110(34), 111(19), 119(14),
123(14), 125(14), 131(10), 133(26), 134(5), 135(8), 137(74), 138(14), 139(10), 141(9), 151(59),
152(35), 153(95), 154(13), 165(10), 166(11),
12-oxo methyl oleate:
55(25), 57(2), 59(8), 67(9), 68(4), 69(6), 74(6), 81(8), 83(4), 85(38), 95(8),
113(100), 114(8), 123(2), 139(2), 147(2),
150(5), 165(3), 166(2), 167(2), 193(2), 222(3), 279(7), 310(3)
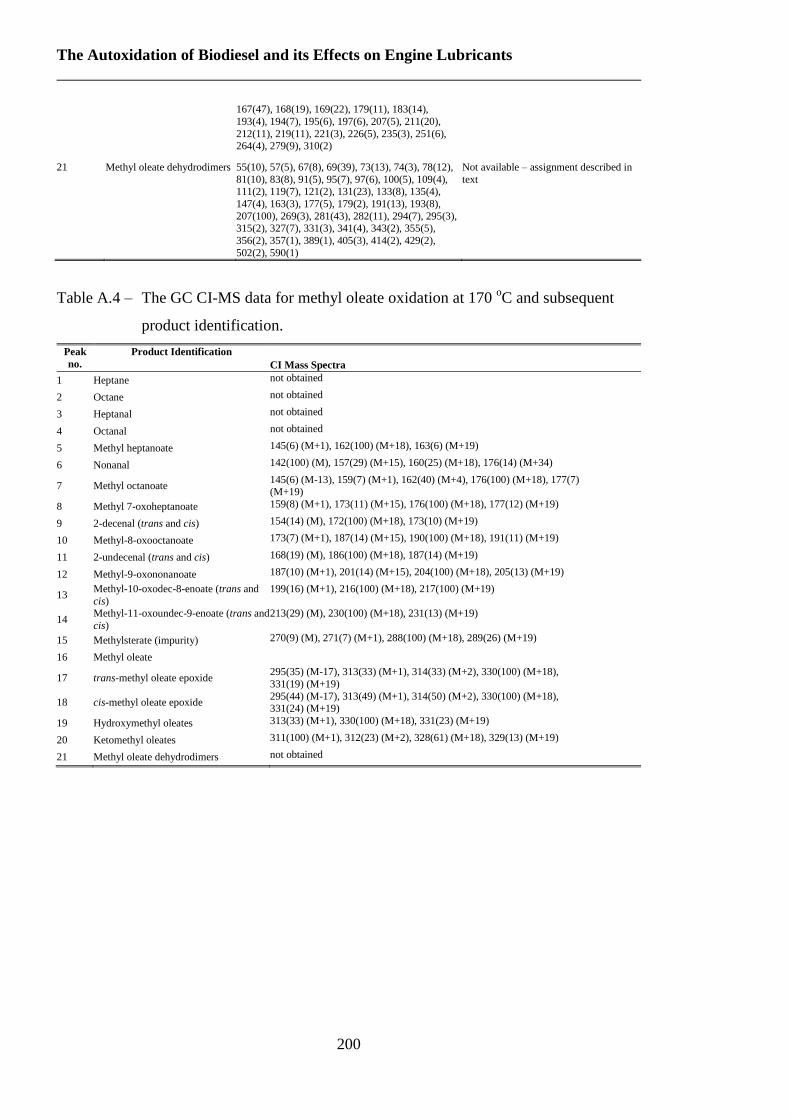
The Autoxidation of Biodiesel and its Effects on Engine Lubricants
200
167(47), 168(19), 169(22), 179(11), 183(14),
193(4), 194(7), 195(6), 197(6), 207(5), 211(20),
212(11), 219(11), 221(3), 226(5), 235(3), 251(6), 264(4), 279(9), 310(2)
21 Methyl oleate dehydrodimers 55(10), 57(5), 67(8), 69(39), 73(13), 74(3), 78(12),
81(10), 83(8), 91(5), 95(7), 97(6), 100(5), 109(4), 111(2), 119(7), 121(2), 131(23), 133(8), 135(4),
147(4), 163(3), 177(5), 179(2), 191(13), 193(8),
207(100), 269(3), 281(43), 282(11), 294(7), 295(3), 315(2), 327(7), 331(3), 341(4), 343(2), 355(5),
356(2), 357(1), 389(1), 405(3), 414(2), 429(2),
502(2), 590(1)
Not available – assignment described in
text
Table A.4 – The GC CI-MS data for methyl oleate oxidation at 170 oC and subsequent
product identification.
Peak
no.
Product Identification
CI Mass Spectra
1 Heptane not obtained
2 Octane not obtained
3 Heptanal not obtained
4 Octanal not not obtained
5 Methyl heptanoate 145(6) (M+1), 162(100) (M+18), 163(6) (M+19)
6 Nonanal 142(100) (M), 157(29) (M+15), 160(25) (M+18), 176(14) (M+34)
7 Methyl octanoate 145(6) (M-13), 159(7) (M+1), 162(40) (M+4), 176(100) (M+18), 177(7) (M+19)
8 Methyl 7-oxoheptanoate 159(8) (M+1), 173(11) (M+15), 176(100) (M+18), 177(12) (M+19)
9 2-decenal (trans and cis) 154(14) (M), 172(100) (M+18), 173(10) (M+19)
10 Methyl-8-oxooctanoate 173(7) (M+1), 187(14) (M+15), 190(100) (M+18), 191(11) (M+19)
11 2-undecenal (trans and cis) 168(19) (M), 186(100) (M+18), 187(14) (M+19)
12 Methyl-9-oxononanoate 187(10) (M+1), 201(14) (M+15), 204(100) (M+18), 205(13) (M+19)
13 Methyl-10-oxodec-8-enoate (trans and
cis)
199(16) (M+1), 216(100) (M+18), 217(100) (M+19)
14 Methyl-11-oxoundec-9-enoate (trans and
cis)
213(29) (M), 230(100) (M+18), 231(13) (M+19)
15 Methylsterate (impurity) 270(9) (M), 271(7) (M+1), 288(100) (M+18), 289(26) (M+19)
16 Methyl oleate
17 trans-methyl oleate epoxide 295(35) (M-17), 313(33) (M+1), 314(33) (M+2), 330(100) (M+18),
331(19) (M+19)
18 cis-methyl oleate epoxide 295(44) (M-17), 313(49) (M+1), 314(50) (M+2), 330(100) (M+18), 331(24) (M+19)
19 Hydroxymethyl oleates 313(33) (M+1), 330(100) (M+18), 331(23) (M+19)
20 Ketomethyl oleates 311(100) (M+1), 312(23) (M+2), 328(61) (M+18), 329(13) (M+19)
21 Methyl oleate dehydrodimers not obtained
List of Abbreviations
201
List of Abbreviations.
AO Antioxidant
B.D.E. Bond Dissociation Energy
BXX Diesel blend consisting of XX% biodiesel
CN Cetane Number
Det Detergent
DI Direct Injection
DPF Diesel Particulate Filter
EC European Commission
EI Electron Impact
ESI Electron Spray Ionisation
EU European Union
FAME Fatty Acid Methyl Ester
FFA Free Fatty Acid
FI Field Ionisation
FID Flame Ionisation Detector
HPLC High Performance Liquid Chromatography
Irganox L107 Octadecyl 3-(3,5 di-tertbutyl, 4-hydroxyphenyl propanoate)
GC Gas Chromatography
IPCC International Panel for Climate Change
KVx Kinematic Viscosity at x oC
ML Methyl Linoleate (Methyl cis-cis-octadec-9,11-dienoate)
MO Methyl Oleate (Methyl cis-octadec-9-enoate)
MS Mass Spectrometry
p.a. Per Annum
PM Particulate Matter
The Autoxidation of Biodiesel and its Effects on Engine Lubricants
202
PME Palm Methyl Ester
RME Rapeseed Methyl Ester
SME Soybean Methyl Ester
UCO Used Cooking Oil
VOCs Volatile Organic Compounds
References
203
List of References
Adamczyk, A.A. Kach, R.A. A Combustion Bomb Study of Fuel-Oil Solubility and HC
Emissions From Oil Layers, Twentieth Symposium (International) on
Combustion/The Combustion Institute, 1984, 37-43.
Affleck, W.S. Fish, A. Two-stage Ignition under Engine Conditions Parallels that at Low
Pressures, Eleventh Symposium (International) on Combustion/The Combustion
Institute, 1967, 1003-1013.
Agarwal, A.K. Das, L.M. Biodiesel Development and Characterization for Use as a Fuel in
Compression Ignition Engines. J. of Eng. For Gas Turbines and Power, 2001, 123,
440-447.
Agarwal, A. K. Biofuels (Alcohols and Biodiesel) Applications as Fuels for Internal
Combustion Engines, Progress in Energy and Combustion Science, 2007, 33, 233.
Alfadhl, A. The Behaviour of Antioxidants in Lubricant Base Fluids at High Gasoline
Engine Temperatures. PhD Thesis, University of York, 2008.
Alexiadas, A. Global Warming and Human Activity: A Model for Studying the Potential
Instability of the Carbon Dioxide/Temperature Feedback Mechanism, Ecological
Modelling, 2007, 203(3-4), 243-256.
Ali, Y. Hanna, M.A. Cuppett, S.L. Fuel Properties of Tallow and Soybean Oil Esters. J.
Am. Oil Chem. Soc. 1995, 72(12), 1557-1564.
Aske, N. Kallevik, H. Sjöblom, J. Determination of Saturate, Aromatic, Resin and
Asphaltenic (SARA) Components in Crude Oils by Means of Infrared and Near-
Infrared Spectroscopy, Energy and Fuels, 2001, 15, 1304-1312.
Attiwill, P.M. Atmospheric Carbon Dioxide and the Biosphere, Environmental Pollution,
1971, (1), 249-261.
Balat, M. Balat, H. Progress in Biodiesel Processing, Applied Energy, 2010, 87(6), 1815-
1835.
Barsky, R. Kilian, L. Oil and the Macroeconomy since the 1970’s, National Bureau of
Economic Research, Working Paper 10855, October 2004.
Batino, R. Rettich, T.R. Tominaga, T. The Solubility of Oxygen and Ozone in Liquids, J.
Phys. Chem. Ref. Data, 1983, 12(2), 163-178.
Batt L, Reactions of Alkoxy and Alkyl Peroxy Radicals, International Reviews in Physical
Chemistry, 1987, 6(1), 53-90.

The Autoxidation of Biodiesel and its Effects on Engine Lubricants
204
Benson, S.W. Combustion, A Chemical and Kinetic View, Twenty-First Symposium
(International) on Combustion/The Combustion Institute, 1986, 703-711.
Berchmans, H.J. Hirata, S. Biodiesel Production from Crude Jatropha Curcas L. Seed Oil
with a High Content of Free Fatty Acids, Bioresource Technology, 2008, 99(6),
1716-1721.
Bishov, S.J. Henick, A.S. Antioxidant Effect of Protein Hydrolyzates in Freeze-Dried
Model Systems; Synergistic Action with a Series of Phenolic Antioxidants, Journal
of Food Science, 1975, 40(2), 345-348
Bishov, S.J. Masuoka, Y. Kapsalis, J.G. Antioxidant Effect of Spices, Herbs and Protein
Hydrolyzates in Freeze-Dried Model Systems: Synergistic Action with Synthetic
Phenolic Antioxidants, Journal of Food Processing and Preservation, 1977, 1(2),
153-166
Blanksby, S.J. Ellison, G.B. Bond Dissociation Energies of Organic Molecules, Acc.
Chem. Res. 2003, 36, 255-263.
Bockey, D. Situation and Development Potential for the Production of Biodiesel – An
International Report, 2002.
Bondioli, P. Gasparoli, A. Della Bella, L. Tagliabue, S. Toso, G. Biodiesel Stability under
Comercial Storage Conditions over One Year, Eur. J. Lipid Sci. Technol. 2003, 105,
735-741.
Borg-Warner Turbo and Emission Systems - http://www.3k-
warner.de/products/turbochargerPrinciples.aspx - accessed 12/08/11
Bors, W. Erben-Russ, M. Saran, M. Fatty acid peroxyl radicals: Their generation and
reactivities, Bioelectrochemistry and Bioenergenetics, 1987, 18, 37-49.
Bouaid, A. Martinez, M. Aracil, J. Long Storage Stability of Biodiesel from Vegetable and
Used Frying Oils, Fuel, 2007, 86, 2596-2602.
Boult, P.J. Fisher, Q.J. Clinch, S.R. Lovibond, J R. Cockshell, C.C. Geomechanical,
microstructural, and petrophysical evolution in experimentally reactivated
cataclasites: Discussion, AAPG Bulletin. 2003, 87, 1681-1683.
Bowman, C.T. Kinetics of Pollutant Formation and Destruction in Combustion, Prog.
Energy Combust. Sci. 1975, 1, 33-45.
The British Petroleum Company - Industrial Lubrication. 1966. Published East Grinstead,
The British Petroleum Company.
References
205
Bush, G.P. Fox, M.F. Picken, D.J. Butcher, L.F. Composition of Lubricating Oil in the
Upper Ring Zone of an Internal Combustion Engine, Tribology International, 1991,
24(4), 231-233.
Bryant, L. The Development of the Diesel Engine, Technology and Culture, 1976, 17(3),
432-446.
Cadle, R.D. Formation and Chemical Reactions of Atmospheric Particles, Journal of
Colloid and Interface Science, 1972, 39(1), 25-31.
Campbell, C.J. The End of Cheap Oil, Scientific American, March 1998.
Cao, M. Woodward, F. I. Dynamic Responses of Terrestrial Ecosystem Carbon Cycling to
Global Climate Change, Nature, 1998, 393, 249-252.
Carlton, A.C. James Watt (1736 – 1819), Journal of the Franklin Institute, 1953, 256(4),
375-376.
Chan, H.W.S. Levett, G. Matthew, J.A. The Mechanism of the Rearrangement of Linoleate
Hydroperoxides. Chemistry and Physics of Lipids, 1979, 24, 245-256.
Chauhan, R.D. Sharma, M.P. Saini, R.P. Singal, S.K. Biodiesel from Jatropha as Transport
Fuel – A Case Study of UP State, India, Journal of Scientific and Industrial
Research, 2006, 66(5), 394-398.
Conrad, B.R. Evaluation of Diesel Particulate Filter Systems at Stobie Mine, Diesel
Emission Evaluation Program, INCO, 2006, 28-29
Cort, W.M. Antioxidant Properties of Ascorbic Acid in Foods, Advances in Chemistry,
1982, 200(22), 533-550.
Cox, P.M, Betts, R.A. Jones, C.D. Spall, S.A. Totterdell, I.J. Acceleration of Global
Warming due to Carbon-Cycle Feedbacks in a Coupled Climate Model, Nature,2000,
408, 184-187.
Clark, K.B. Culshaw, P.N. Griller, D. Lossing, F.P. Martinho Simões, J.A. Walton, J.C.
Studies of the Formation and Stability of Pentadienyl and 3-Substituted Pentadienyl
Radicals, J. Org. Chem. 1991, 56, 5535-5539.
Deegan, R.D. Leheny, R.L. Menon, N. Nagel, S.R. Dynamic Shear Modulus of Tricresyl
Phosphate and Squalane, J. Phys. Chem. B, 1999, 103, 4066-4070.
Demirbas, A. Biodiesel from Vegetable Oils via Transesterification in Supercritical
Methanol, Energy Conversion and Management, 2002, 43, 2349-2356.
Dermibas, A. The Importance of Biodiesel as Transportation Fuel, Energy Policy, 2007,
35, 4661-4670.
The Autoxidation of Biodiesel and its Effects on Engine Lubricants
206
Demirbas, A. Progress and recent trends in biodiesel fuels. Energy Conversion and
Management, 2009, 50, 14-34.
Denisov, E.T. Mechanism of Regeneration of Hindered Nitroxyl and Aromatic Amines,
Polymer Degradation and Stability, 1989, 25, 209-215.
Denisov, E.T. Afanas’ev, I.B. Oxidation and Antioxidants in Organic Chemistry and
Biology, CRC Press 2005, ISBN 0-8247-5356-9.
Department for Transport – Towards a UK Strategy for Biofuels – Public Consultation
2005, 2-4, www.dft.gov.uk/consultations/archive/2004/tuksb/, Archived 02/09/2009,
27/4/2011
Dickinson, H.W. A Short History of the Steam Engine, Cambridge University Press, 1939
(Online 2010).
Du Plessis, L.M. De Villiers, J.B.M. Van Der Walt, W.H. Stability Studies on Methyl and
Ethyl Fatty Acid Esters of Sunflowerseed Oil, J. Am. Oil Chem. Soc. 1985, 62(4),
748-752.
Dvorák, A. Skopal, F. Komers, K. Transesterification of Rapeseed Oil in a Feedback
Reactor, Eur. J. Lipid Sci. Technol. 2001, 103, 742-745.
European Commission Paper COM(2006) 105 – A European Strategy for Sustainable,
Competitive and Secure Energy, 8/3/2006.
European Commission Regulation No. 715/2007 – Euro 5
European Commission Regulation No. 28/2009
European Commission Regulation No. 595/2009 – Euro 6
El-Fadel, M. Massoud, M. Particulate Matter in Urban Areas: Health-based Economic
Assessment, Science of the Total Environment, 2000, 257(2-3), 133-146.
Encinar, J.M. González, J.F. Sabio, E. Ramiro, M.J. Preparation and Properties of
Biodiesel from Cynara cardunculus L. Oil, Ind. Eng. Chem. Res. 1999, 38, 2927-
2931
Encinar, J.M. González, J.F.Rodríguez-Reinares. Biodiesel from Used Frying Oil.
Variables Affecting the Yields and Characteristics of the Biodiesel, Ind. Eng. Chem.
Res. 2005, 44, 5491-5499.
Engler, C. R. J. Johnson, L.A. Effects of Processing and Chemical Characteristics of Plant
Oils on Performance of an Indirect-Injection Diesel Engine, J. Am. Oil Chem. Soc.,
1983, 60, 1592–1596.
References
207
Enweremadu, C.C. Mbarawa, M.M. Technical Aspects of Production and Analysis of
Biodiesel from Used Cooking Oil – A Review, Renewable and Sustainable Energy
Reviews, 2009, 13(9), 2205-2224.
Farmer, E.H. Koch, H.P. Sutton, D.A. The Course of Autoxidation Reactions in
Polyisoprenes and Allied Compounds. Part VII. Rearrangement of Double Bonds
during Autoxidation, J. Chem. Soc. 1943, 541-547.
Fazal, M.A. Haseeb, A.S.M.A. Masjuki, H.H. Biodiesel Feasibility Study: An Evaluation
of Material Compatibility; Performance; Emission and Engine Durability, Renewable
and Sustainability Energy Reviews, 2011, 15(2), 1314-1324.
Ferguson, C.R. Internal Combustion Engines, John Wiley, New York, 1986.
Florides, G.A. Christodoulides, P. Global Warming and Carbon Dioxide Through
Sciences, Environment International, 2009, 35, 390-401.
Filipova, T.V. Blyumberg, E.A. Mechanism of the Epoxidation of Alkenes by Molecular
Oxygen, Russian Chemical Reviews, 1982, 51(6), 582-591.
Frankel, E.N. Garwood, R.F. Khambay, B.P.S. Moss, G.P. Weedon, B.C.L.
Stereochemistry of Olefin and Fatty Acid Oxidation. Part 3. The Allylic
Hydroperoxides from the Autoxidation of Methyl Oleate, J. Chem. Soc. Perkin
Transactions 1, 1984, 2233-2240.
Frankel, E.N. Chemistry of Free Radical and Singlet Oxidation of Lipids. Prog. Lipid Res.
1985, 23, 197-221.
Gamble, R.J. Priest, M. Taylor, C.M. Detailed Analysis of Oil Transport in the Piston
Assembly of a Gasoline Engine, Tribology Letters, 2003, 14(2), 147-156.
Ganguly, J. Studies on the Mechanism of Fatty Acid Synthesis: VII. Biosynthesis of Fatty
Acids from Malonyl CoA, Biochim. Biophys. Acta, 1960, 40, 110-118.
Gardner, H.W. Oxygen Radical Chemistry of Polyunsaturated Fatty Acids, Free Radical
Biology & Medicine, 1989, 7, 65-86.
Gedik, C.M. Boyle, S.P. Wood, S.G. Vaughan, S.J. Collins, A.R. Oxidative Stress in
Humans: Validation of Biomarkers of DNA Damage, Carcinogenesis, 2002, 23(9),
1441-1446.
German Patent (DRP) No. 37435 – Karl Benz, gasoline fuelled car
Giuffrida, F. Destaillats, F. Robert, F. Skibsted, L.H. Dionisi, F. Formation and Hydrolysis
of Triacylglycerol and Sterol Epoxides: Role of Unsaturated Triacylglycerol Peroxyl
Radicals, Free Radical Biology & Medicine. 2004, 37(1), 104-114.
The Autoxidation of Biodiesel and its Effects on Engine Lubricants
208
Ghadge, S.V. Raheman, H. Biodiesel Production from Mahua (Madhuca Indica) Oil
having Free Fatty Acids, Biomass and Bioenergy, 2005, 28(6), 601-605.
Goering, C.E. Schwab, A.W. Dangherty, M.J. Pryde, E.H. Heakin, A.J. Fuel Properties of
Eleven Vegetable Oils. ASAE 1982, 25(6), 1472-1477.
Golden, D.M. Benson, S.W. Chem.Rev 1969, 69,125.
Gómez-Carracedo, M.P. Andrade, J.M. Calviño M., Fernández, E. Prada, D. Muniategui,
S. Multivariate prediction of eight kerosene properties employing vapour-phase mid-
infrared spectrometry, Fuel, 2003, 82, 1211-1218.
Goodrum, J.W. Volatility and Boiling Points of Biodiesel from Vegetable Oils and Tallow,
Biomass and Bioenergy, 2002, 22, 205–211.
Graboski, M.S. McCormick, R.L. Combustion of Fat and Vegetable Oil Derived Fuels in
Diesel Engines, Prog. Energy Combust. Sci. 1998, 24, 125-164.
Griffin Shay, E. Diesel Fuel from Vegetable Oils: Status and Oppurtunities, Biomass and
Bioenergy, 1993, 4(4), 247-242.
Gruntman, M. Blazing the Trail: The Early History of Spacecraft and Rocketry, American
Institute of Aeronautics and Astronautics, 2004.
Gupta, S.A. Cochran, H.D. Cummings, P.T. Shear Behaviour of Squalane and Tetracosane
under Extreme Confinement. I. Model, Simulation Method and Interfacial Slip. J.
Chem. Phys, 1997, 107(23), 10316-10326.
Gupta, S.A. Cochran, H.D. Cummings, P.T. Shear Behaviour of Squalane and Tetracosane
under Extreme Confinement. II. Confined Film Structure, J. Chem. Phys, 1997,
107(23), 10327-10334.
Gupta, S.A. Cochran, H.D. Cummings, P.T. Shear Behaviour of Squalane and Tetracosane
under Extreme Confinement. III. Effect of Confinement on Viscosity, J. Chem. Phys,
1997, 107(23), 10334-10343.
Haas, M.J. McAloon, A.J. Yee, W.C. Foglia, T.A. A Process Model to Estimate Biodiesel
Production Costs, Bioresource Technology, 2006, 97(4), 671-678.
Hamberg, M. Gotthammer, B. A New Reaction of Unsaturated Fatty Acid
Hydroperoxides: Formation of 1 1-Hydroxy-12,13-epoxy-9-octadecenoic Acid from
13-Hydroperoxy-9,11 -octadecadienoic Acid, Lipids, 1973, 8(12), 737-744.
Hamrock, B.J. Fundamentals of Fluid Film Lubrication, 1994, McGraw-Hill Publishing.
Harwood, H.J. Oleochemicals as a Fuel: Mechanical and Economic Feasability, J. Am. Oil
Chem. Soc., 1984, 61(2), 315-324.
References
209
Hayes, T.K. White, R.A. Peters, J.E. Combustion Chamber Temperature and Instantaneous
Local Heat Flux Measurements in a Spark Ignition Engine, SAE Technical Paper
930217, 1993.
Hele, P. Biosynthesis of Fatty Acids, Brit. Med. Bull. 1958, 14(3), 201-206
Heywood, J.B. – Internal Combustion Engine Fundamentals, International Edition,
McGraw-Hill Book Company, 1988.
Hill, J. Nelson, E. Tilman, D. Polasky, S. Tiffany, D. Environmental, Economic and
Energetic Costs and Benefits of Biodiesel and Ethanol Biofuels, PNAS, 2006,
103(30), 11206-11210.
Hill, K. Fats and Oils as Oleochemical Raw Materials, Pure Appl. Chem. 2000, 72(7),
1255-1264.
Hills, R.L. Power from Steam: A History of the Stationary Steam Engine, Cambridge
University Press, 1993.
Hiroyasu, H. Kadota, T. Models for Combustion and Formation of Nitric Oxide and Soot
in Direct Injection Diesel Engines, Soc. Automotive Eng. Paper No. 760129, 1976.
Hirsch, R.L. Bezdek, R. Wendling, R. Peaking of World Oil Production: Impacts,
Mitigation and Risk Management, 2005, 11-20, www.netl.doe.gov
Hochstein, P. Atallah, A.S. The Nature of Oxidants and Antioxidant Systems in the
Inhibition of Mutation and Cancer, Mutation Research, 1988, 202, 363-375.
Hsu, S.M. Nano-lubrication: Concept and Design, Tribology International, 2004, 37(7),
537-545.
Hu, J. Du, Z. Li, C. Min, E. Study on the Lubrication Properties of Biodiesel as Fuel
Lubricity Enhancers, Fuel, 2005, 84, 1601-1606.
Hu, J.J. Dubin, N. Kurland, D. Ma, B. Roush, G. The Effects of Hydrogen Peroxide on
DNA Repair Activities, Mutation Research, 1995, 336, 193-201.
Jabbarzadeh, A. Atkinson, J.D. Tanner, R.I. The effect of Branching on Slip and
Rheological Properties of Lubricants in Molecular Dynamics Simulation of Couette
Shear Flow, Tribology International, 2002, 35(1), 35-46.
Jain, S. Sharma, M.P. Prospects of Biodiesel from Jatropha in India: A Review, Renewable
and Sustainable Energy Reviews, 2010, 14, 763-771.
Jensen, R.K. Korcek, S. Zinbo, M. Gerlock, J.L. Regeneration of Amine in Catalytic
Inhibition of Oxidation, J. Org. Chem. 1995, 60, 5396-5400.
Johnson, F.S. The Balance of Atmospheric Oxygen and Carbon Dioxide, Biological
Conservation, 1970, 2(2), 83-89.
The Autoxidation of Biodiesel and its Effects on Engine Lubricants
210
Jones, C. Interactions Between Biofuels and Lubricants and Effects on Engine Oil
Durability, 2008 SAE Biofuels: Specifications and Performance Symposium, Paris,
France. July 2008.
Jones, E. Combustion of Methane, Nature, 1956, 178, 1112.
Kaiser, E.W. Admczyk, A.A. Lavoie, G.A. The Effect of Oil Layers on the Hydrocarbon
Emissions Generated During Closed Vessel Combustion, Eighteenth Symposium
(Inetnational) on Combustion/The Combustion Institute, 1981, 1881-1890.
Kearns, D.R. Physical and Chemical Properties of Singlet Molecular Oxygen, Chemical
Reviews, 1971, 71(4), 395-427.
Kim, J.S. Min, B.S. Lee, D.S. Oh, D.Y. Choi, J.K. Characteristics of Carbon Deposit
Formation in Piston Top Ring Groove of Gasoline and Diesel Engine, 1998 SAE
International Congress & Exposition; Detroit, MI, USA, 1998, 147-154.
Kimura, Y. Okabe, H. An Introduction to Tribology, Youkandou Press, 1982, 69-82
Kittelson, D.B. Engines and Nanoparticles: A Review, J. Aerosol Sci. 1998, 29(5/6), 575-
588
Knothe, G. Bagby, M.O. Ryan, T.W. Soc. Automotive Eng. Technical Paper No. 971681
1997.
Knothe, G. Bagby, M.O. Ryan, T.W. III. Precombustion of Fatty Acid and Esters of
Biodiesel. A Possibile Explanation for Differing Cetane Numbers. J.Am. Oil Chem.
Soc. 1998, 75(8), 1007-1013.
Knothe, G. Dependence of Biodiesel Fuel Properties on the Structure of Fatty Acid Alkyl
Esters, Fuel Processing Technology, 2005, 86, 1059-1070.
Körbitz, W. Biodiesel Production in Europe and North America, an Encouraging Prospect,
Renewable Energy, 1999, 16, 1078-1083.
Korchek, S. Chenier, J.H.B. Howard, J.A. Ingold, K.U. Absolute rate constants for
hydrocarbon autoxidation. XXI. Activation energies for propagation and the
correlation of propogation rate constant with carbon–hydrogen bond strengths, Can.
J. Chem, 1972, 50, 2285–2297.
Krisnangkura, K. Yimsuwan, T. Pairintra, R. An Empircal Approach in Predicting
Biodiesel Viscosity at Various Temperatures, Fuel, 2006, 85, 107-113.
Krop, H.B. v. Velzen, M.J.M. Parsons, J.R. Govers, H.R.J. Determination of
Environmentally Relevant Physical-Chemical Properties of Some Fatty Acid Esters,
JAOCS, 1997, 74(3), 309-315
References
211
Kumagi, A. Takahashi, S. Viscosity and Density of Liquid Mixtures of n-Alkanes with
Squalane, International Journal of Thermophysics, 1995, 16(3), 773-779.
Kyoto Protocol, http://kyotoprotocol.com.
Labeckas, G. Slavinskas, S. Performance of direct-injection off-road diesel engine on
rapeseed oil, Renewable Energy, 2006, 31, 849-863.
Lansdown, A.R. Lubrication and Lubricant Selection, A Practical Guide, 3rd
Edition,
Tribology in Practice Series, Professional Engineering Publishing, 2004.
Lapuerta, M. Rodríguez-Fernández, J. Agudelo, J.R. Diesel Particulate Emissions from
Used Cooking Oil Biodiesel, Bioresource Technology, 2008, 99, 731-740.
Lapuerta, M. Armos, A. Rodríguez-Fernández, J. Effect of Biodiesel Fuels on Diesel
Engine Emissions, Progress in Energy and Combustion Science, 2008, 34(2), 198-
223.
Lazaroiu, G. Modeling and Simulation Combustion and Generation of NOx, Fuel
Processing Technology, 2007, 88, 771-777.
Lercker, G. Rodriguez-Estrada, T.M. Bonoli M., Analysis of the oxidation products of cis-
and trans-octadecenoate methyl esters by capillary gas chromatography–ion-trap
mass spectrometry I. Epoxide and dimeric compounds, Journal of Chromatography,
2003, 985, 333-342.
Leung, D.Y.C. Luo, Y. Chan, T.L. Optimization of Exhaust Emissions of a Diesel Engine
Fuelled with Biodiesel, Energy & Fuels, 2006, 20(3), 1015-1023.
Levy II, H. Photochemistry of the Lower Troposphere, Planetary and Space Science, 1972,
20, 919-935.
Lightfoot, P.D. Cox, R.A. Crowley, J.N. Destriau, M.Hayman, G.D. Jenkin, M.E.
Moortgat, G.K. Zabel, F. Organic Peroxy Radicals: Kinetics, Spectroscopy and
Tropospheric Chemistry, Atmospheric Environment, 1992, 26A(10), 1805-961.
Lignola, P.G. Reverchon, E. Cool Flames, Prog. Energy Combust. Sci. 1987, 13, 75-96.
Ma, F. Hanna, M.A. Biodiesel Production: A Review, Bioresource Technology, 1999, 70,
1-15.
Mahoney, L.R.Antioxidants, Angew. Chem. Int. Ed. 1969, 8(8), 547-555.
Mahoney, L.R. DaRooge, M.A. The Kinetic Behavior and Thermochemical Properties of
Phenoxy Radicals. J. Am. Chem. Soc. 1975, 97(16), 4722-4731.
Manabe, S. Wetherald, R.T. The Effects of Doubling CO2 Concentration on the Climate of
a General Circulation Model, J. of the Atmos. Sci. 1975, 32(1), 3-15.
The Autoxidation of Biodiesel and its Effects on Engine Lubricants
212
Manabe, S. Stouffer, R.J. Century-scale Effects of Increased Atmospheric CO2 on the
Ocean-atmosphere System, Nature, 1993, 364, 215-218.
Mantashyan, A.A. Khachatryan, L.A. Niazyan, O.M. Arsentyev, S.D. On the Reactions of
Peroxy Radicals in the Slow Combustion of Methane and Ethylene, Combustion and
Flame, 1981, 43, 221-227.
Marshall, W. Schumacher, L.G. Howell, S. Engine Exhaust Emissions: Evaluation of a
Cummins L10E when Fuelled with a Biodiesel Blend. SAE paper 952363, 1995.
Masjuki, H.H. Maleque, M.A. The Effect of Palm Oil Diesel Fuel Contaminated Lubricant
on Sliding Wear of Cast Irons against Mild Steel, Wear, 1996, 198, 293-299.
McMillen, D.F. Golden, D.M. Hydrocarbon Bond Dissociation Energies, Ann. Rev. Phys.
Chem, 1982, 33, 493-532.
Monyem, A. Canakci, M. Van Gerpen, J.H. Investigation of Biodiesel Thermal Stability
Under Simulated In-Use Conditions, Applied Engineering in Agriculture, 2000,
16(4), 373-378.
Moritani, H. Nozawa, Y. Oil Degradation in Second-Land Region of Gasoline Engine
Pistons, R&D Rev. Toyota CRDL, 2003, 38, 36-43.
Mulliken, R.S. The Interpretation of Band Spectra Part III. Electron Quantum Numbers
and States of Molecules and Their Atoms, Rev. Mod. Phys. 1932, 4(1), 1-86.
Naik, S.N. Goud, V.V. Rout, P.K. Dalai, A.K. Production of First and Second Generation
Biofuels: A Comprehensive Review, Renewable and Sustainable Energy Reviews,
2010, 14(2), 578-597.
Nebel, B.A. Mittelbach, M. Biodiesel from Extracted Fat out of Meat and Bone Meal, Eur.
J. Lipid Sc. Technol. 2006, 108, 398-403.
Nicolet, M. Aeronomic Chemistry of the Stratosphere, Planetary and Space Science, 1972,
20, 1671-1702.
NIST database, www.nist.gov, 21/2/2011
Nitschke, W.R. Wilson, C.M. Rudolph Diesel, Pioneer of the Age of Power, The
University of Oklahoma Press, Norman, OK 1965.
Owczarek, I. Blazej, K. Recommended Critical Temperatures. Part I. Aliphatic
Hydrocarbons. J. Phys. Chem. Ref. Data 2003, 32(4), 1411-1428.
Owczarek, I. Blazej, K. Recommended Critical Temperatures. Part II. Aromatic and Cyclic
Hydrocarbons. J. Phys. Chem. Ref. Data 2004, 33(2), 541-547.
Oxford English Dictionary, Oxford University Press, 1996.
References
213
Pousa, G.P.A.G. Santos, A.L.F. Suarez, P.A.Z. History and Policy of Biodiesel in Brazil,
Energy Policy, 2007, 35(11), 5393-5398.
Pratt, D.A. Mills, J.H. Porter, N.A. Theoretical Calculations of Carbon-Oxygen Bond
Dissociation Enthalpies of Peroxyl Radicals Formed in the Autoxidation of Lipids, J.
Am. Chem. Soc. 2003, 124, 5801-5810.
Priest, M. Dowson, D. Taylor, C.M. Predictive Wear Modelling of Lubricated Piston Rings
in a Diesel Engine, Wear, 1999, 231, 89-101.
Radich, A. Biodiesel Performance, Costs and Use, Energy Information Administration,
2004.
Radu, R. Petru, C. Edward, R. Gheroghe, M. Fueling an D.I. Agricultural Diesel Engine
with Waste-Oil Biodiesel: Effects Over Injection, Combustion and Engine
Characteristics, Energy Conversion and Management, 2009, 50, 2158-2166.
Rakopoulos, C.D. Antonopoulos, K.A. Rakopoulos, D.C. Hountalas, D.T. Giakoumis, E.G.
Comparative Performance and Emissions Study of a Direct-injection Diesel Engine
Using Blends of Diesel fuel with Vegetable Oils or Bio-diesels of Various Origins,
Energy Conversion and Management, 2006, 47, 3272-2387.
Ranz, A. Maier, E. Lankwayr, E. Determination of Fatty Acid Derivatives in Fuel and
Diesel Oil, Fuel, 2010, 89(8), 2133-2139.
Ross, J.R. Gebhart, A.I. Gerecht, J.F. The Autoxidation of Methyl Oleate. J. Am. Chem.
Soc. 1949, 71, 282-286.
Rudnick, L.R. Lubricant Additives, Chemistry and Applications, 2nd
Ed. CRC Press 2009,
ISBN 1-4200-5964-9.
Ruiz, R.P. Bayes, K.D. Macpherson, M.T. Pilling, M.J. Direct Observation of the
Equilibrium between Allyl Radicals, O2, and Allylperoxy Radicals, J. Phys. Chem.
1981, 85, 1622-1624.
Ryan, T. W. III. Dodge, L.G., Callahan, T.J. The Effects of Vegetable Oil Properties on
Injection and Combustion in Two Different Diesel Engines, J.Am.Oil Chem.Soc,
1984, 61, 1610–1619.
Sapaun, S.M. Masjuki, H.H. Azlan, A. The Use of Palm Oil as Diesel Fuel Substitute. J.
Power Energy A. 1996, 210, 47–53.
Sarin, R. Sharma, M. Sinharay, S. Malhorta, R.K. Jatropha – Palm Biodiesel Blends: An
Optimum Mix for Asia. Fuel, 2007, 86, 1365-1371.
The Autoxidation of Biodiesel and its Effects on Engine Lubricants
214
Sarmiento, J.L. Hughes, T.M.C. Stouffer, R.J. Manabe, S. Simulated Response of the
Ocean Carbon Cycle to Anthropogenic Climate Warning, Nature¸1998, 393, 245-
249.
Scanlon, J.T. Willis, D.E. Calculation of Flame Ionization Detector Relative Response
Factors Using the Effective Carbon Number Concept, Journal of Chromatographic
Science, 1985, 23(8), 333-340.
Seetula J.A. Slagle I.R. Kinetics and thermochemistry of the R+ HBr H+ Br (R= n-
C3H7, iso-C3H7 , n-C4H9 , iso-C4H9 , sec-C4H9 or tert-C4H9) equilibrium, J. Chem.
Soc. Faraday Trans. 1997, 93, 1709-1719.
Shahid, E.M. Jamal, Y. A Review of Biodiesel as a Vehicular Fuel, Renewable and
Sustainable Energy Review, 2008, 12(9), 2484-2494.
Sharma, Y.C. Singh, B. Development of Biodiesel: Current Scenario, Renewable and
Sustainable Energy Reviews, 2009, 13(6-7), 1646-1651.
Shayler, P.J. Winborn, L.D. Hill, N.J. Eade, D. Fuel Transport to the Crankcase, Oil
Dilution and HC Return with Breather Flow During the Cold Operation of a SI
Engine, SAE 2000 World Congress, 2000, Paper No. 2000-01-1235.
Siegbahn, P.E.M. Multireference CCI Calculations on the Bond Dissociation Energies of
Methane, Chemical Physics Letters, 1985, 119(6), 515-522.
Smeets, E. Junginger, M. Faaij, A. Walter, A. Dolzan, P. Turkenburg, W. The
Sustainability of Brazilian Ethanol—An Assessment of the Possibilities of Certified
Production, Biomass and Bioenergy, 2008, 32(8), 781-813.
Sonawane, H.R. Nanjundiah, B.S. Kelkar, R.G. Light-Mediated Transformations of
Olefins into Alcohols: Reactions of Hydroxyl Radicals With Cycloalkenes,
Tetrahedron, 1986, 42(24), 6673-6682
Spear, B. James Watt: The Steam Engine and Commercialization of Patents, World Patent
Information, 2008, 30, 53-58.
Srinisavan, S. The Food v Fuel Debate: A Nuanced View of Incentive Structures,
Renewable Energy, 2009, 34(4), 950-954.
Srivastava, A. Prasad, R. Triglycerides-based Diesel Fuels, Renewable and Sustainable
Energy Reviews, 2000, 4, 111-133.
Stachowiak, G.W. Batchelor, A.W. Lubricants and their Composition, Engineering
Tribology, 2005, Ch. 3, 51-101.

References
215
Stark, M.S. Wilkinson, J.J. Lindsay Smith, J.R. Alfadhl, A. Pochopien, B.A. Autoxidation
of Branched Alkanes in the Liquid Phase, Ind, Eng. Chem. Res. 2011, 50, 817-823
Sumathi, S. Chai, S.P. Mohamed, A.R. Utilization of Palm Oil as a Source of Renewable
Energy in Malaysia, Renewable and Sustainable Energy Reviews, 2008, 12, 2404–
2421.
Szulcyk, K.R. McCarl, B.A. Market Penetration of Biodiesel, Renewable and Sustainable
Energy Reviews, 2010, 14(8), 2426-2433.
Tan, Y.C. Ripin, Z.M. Frictional Behaviour of Piston Rings of Small Utility Two-Stroke
Engine Under Secondary Motion of Piston, Tribology International, 2010, 44, 592-
602.
Taylor, J.W. Ehlker, G. Carstensen, H.H. Ruslen, L. Field, R.W. Green, W.H. Direct
Measurement of the Fast, Reversible Addition of Oxygen to Cyclohexadienyl
Radicals in Nonpolar Solvents, J. Phys. Chem. A. 2004, 108, 7193-7203.
Taylor, R.I. Evans, P.G. In-situ Piston Measurements, Proc. Instn. Mech. Engrs. 2004,
218(J: J. Engineering Tribology), 185-200.
Thoenes, P. Biofuels and Commodities Market – Palm Oil Focus, FAO, Commodities and
Trades Division.
Thornton, M.J. Alleman, T.L. Luecke, J. McCormick, R.L. Impacts of Biodiesel Fuel
Blends, Oil Dilution on Light-Duty Diesel Engine Operation, National Renewable
Energy Laboratory, Conference Paper NREL/CP-549-44833, August 2009.
Tiwari, A.K. Kumar, A. Raheman, H. Biodiesel Production from Jatropha Oil (Jatropha
Curcas) with High Free Fatty Acids: An Optimised Process, Bioresource
Technology, 2007, 31(8), 569-575.
Tormos, B. Novella, R. García, A. Gargar, K. Comprehensive Study of Biodiesel Fuel for
HSDI Engines in Convencional and Low Temperature Combustion Conditions,
Renweable Energy, 2010, 35, 368-378.
Trenwith, A.B. Dissociation of 3-methyl-1,4-pentadiene and the Resonance Energy of the
Pentadienyl Radical J. Chem. Soc. Faraday Trans. 1, Physical Chemistry in
Condensed Phases, 1982, 78(10), 3131-3136.
Tutorvista.com http://www.tutorvista.com/content/chemistry/chemistry-iv/atomic-
structure/oxygen-molecule.php Accessed 04/08/2011
U.S Department of Energy report 2011 http://tonto.eia.doe.gov/oog/info/twip/twip.asp
27/04/2011
U.S. Patent 388,372, 08/1888 – Nikolaus Otto, Otto Cycle Engine.
The Autoxidation of Biodiesel and its Effects on Engine Lubricants
216
Van Setten, B.A.A.L. Makkee, M. Moulijn, J.A. Science and Technology of Catalytic
Diesel Particulate Filters, Catalysis Reviews, 2001, 43(4), 489-564.
Van Wechel, T. Gustafson, G.R. Leistritz, F.L. Economic Feasibility of Biodiesel
Production in North Dakota, Agribusiness and Applied Economics Report 2002, 505.
Wainwright, M.S. Haken, J.K. Effective Carbon Number of Methane in Gas
Chromatography, Journal of Chromatography, 1983, 256, 193-199.
Wakuri, Y. Hamatake, T. Soejima, M. Kitahara, T. Piston Ring Friction in Internal
Combustion Engines, Tribology International, 1992, 25(5), 299-308.
Walker, K. Biodiesel from Rapeseed, J. R. Agric. Soc. Engl. 1994, 155, 43–47.
Wayne, R.P. Chemistry of Atmospheres, 3rd
Edition, Oxford University Press, 2000, 50-
60.
Wilkinson, J.J. The Autoxidation of Branched Hydrocarbons in the Liquid Phase as
Models for Understanding Lubricant Degradation. PhD Thesis, University of York,
2006. 231-233
Williams, D.H. Fleming, I. Spectroscopic Methods in Organic Chemistry, 1989, 4th
Edition
Woodwell, G.M, MacDonald, G.J. Revelle, R, Kelling, C.D. The Carbon Dioxide Problem:
Implications for Policy in the Management of Energy and Other Resources, Report to
the Council on Environmental Quality, 1979, Reprinted 2008.
Wright, J.S. Johnson, E.R. DiLabio, G.A. Predicting the Activity of Phenolic Antioxidants:
Theoretical Method, Analysis of Substituent Effects, and Application to Major
Families of Antioxidants, J. Am. Chem. Soc, 2001, 123, 1173-1183.
Yizhe, L. Guirong, B. Hua, W. Determination of 11 fatty acids and fatty acid methyl esters
in biodiesel using ultra performance liquid chromatography, Chinese Journal of
Chromatography, 2008, 26(4), 494-498.
Xue, J. Grift, T.E. Hansen, A.C. Effect of Biodiesel on Engine Performances and
Emissions, Renewable and Sustainable Energy Reviews, 2011, 15(2), 1098-1116.
Yang, J. Stewart, M. Maupin, G. Herling, D. Zelenyuk, A. Single Wall Diesel Particulate
Filter (DPF) Filtration Efficiency Studies Using Laboratory Generated Particles,
Chemical Engineering Science, 2008, 64(8), 1625-1634.
Yen, G. Duh, P. Tsai, H. Antioxidant and Pro-oxidant Properties of Ascorbic Acid and
Gallic Acid, Food Chemistry, 2002, 79, 307-313.
Yuan, W. Hansen, A.C. Zhang, Q. Vapour Pressure and Normal Boiling Point Predictions
for Pure Methyl Esters and Biodiesel Fuels, Fuel, 2005, 84, 943-950.
References
217
Zhang, F.L. Niu, B. Wang, Y.C. Chen, F. Wang, S.H. Xu, Y. Jiang, L.D. Gao, S. Wu, J.
Tang, L. Jia, Y.J. A Novel Betain Aldehyde dehydrogenase gene from Jatropha
Curcas, encoding an enzyme implicated in adaptation to environmental stress, Plant
Science, 2008, 174, 510-518.
Zhang, H. Machutta, C.A. Tonge, P.J. Fatty Acid Biosynthesis and Oxidation,
Comprehensive Natural Products II, 2010, 8.07, 231-275.
Zhang, Y. Dubé, M.A. McLean, D.D. Kates, M. Biodiesel Production from Waste Cooking
Oil: 1. Process Design and Technological Assessment, Bioresource Technology,
2003, 89(1), 1-16.
Zils, R. Inomata, S. Imamura, T. Miyoshi, A. Washida, N. Determination of the
Equilibrium Constant and Thermodynamic Parameters for the Reaction of
Pentadienyl Radicals with O2, J. Phys. Chem. A. 2003, 105, 1277-1282.

![EXPERIMENTAL INVESTIGATION REVIEW OF BIODIESEL USAGE … · tion, properties, and usage of biodiesel fuels in a Diesel engine [18-24]. In general, biodiesel is a sustainable, nontoxic,](https://img.pdfslide.net/doc/110x75/6057cdd9c828af729f46c0dd/experimental-investigation-review-of-biodiesel-usage-tion-properties-and-usage.jpg)