Embed Size (px)
Citation preview
- 0 -
The Baby Bonus in Singapore: A Brief Empirical Study
Cheng Xun CHUA Mathematical Methods in the Social Sciences
Northwestern University Advisor: Associate Professor Matthias Doepke
2009

- 1 -
Acknowledgements
This piece of work would not have been possible without the advice, encouragement
and insight of my thesis advisor, Professor Matthias Doepke of the Economics Department.
Professor Doepke has been a constant source of inspiration and perspective throughout the
thesis-writing process, and I have benefited greatly from having worked with him.
My sincere gratitude goes out to Tim Lin, our intelligent, tireless and dedicated
teaching assistant who has been a great help with the data manipulation and econometric
analysis for this thesis.
Special thanks to Sarah Muir our MMSS program assistant, who has never been too
busy to chat or help me out whenever I needed something these past 3 years.
Thanks are due too to all the professors of the MMSS program: Professors Clark
Robinson, Eric Schulz, Bill Rogerson, Bård Harstad, Robert Porter, Elie Tamer, Aviv Nevo,
Jamie Druckman and Joe Ferrie. Their teachings and guidance have made this piece of work
possible.
Heartfelt thanks go out as well to all the friends I’ve made in the last 3 years both
within the MMSS program and outside of it that have made the program and my
Northwestern experience such an enjoyable and unforgettable one.
Last but not least, thank you to my family and friends back home in Singapore. Their
constant support, care and encouragement have made me the person I am today, and I will
always be indebted to them for that.
- 2 -
Abstract
Many developed countries face the challenge of rapidly decreasing fertility rates.
Various approaches have been taken to try to reverse this trend, with limited success in most
scenarios. This is a situation that Singapore faces as well. The Singapore government, known
for its pragmatic approach and micro-management of every aspect of Singaporean society,
has been attempting for the last 20 years to arrest the steep decline in fertility rates that the
nation-state has experienced. The latest, most comprehensive and most significant policy to
this end is the Baby Bonus Scheme, first implemented in 2001, then further enhanced and
expanded in 2004 and 2008.
This paper argues that this latest initiative by the Singaporean government is unlikely
to have significant impact on fertility rates in Singapore, and estimates via quantitative
analysis that the Baby Bonus Scheme generally has a slightly positive but statistically
insignificant impact on the fertility rates of the nation-state.
- 3 -
Contents Page
I. Acknowledgements 1
II. Abstract 2
III. Contents 3
IV. Introduction 4
V. Singapore Demographic Trends and Patterns 6
VI. History of Singapore’s Population Policies 10
VII. Literature Review 17
VIII. Theoretical Argument and Hypothesis 24
IX. Framework of Empirical Study and Data 29
X. Findings 34
XI. Conclusions, Caveats and Suggestions for Further Study 41
XII. References 44
- 4 -
Introduction
The Singapore government is known for its pragmatism and paternalism. An overt
democracy that has been over-whelmingly dominated by a single political party since the
nation’s founding, Singapore’s system of government has been described as a benevolent
dictatorship. The leadership of the country has a penchant for utilizing a carrot-and-stick
approach to shaping the social behavior of its citizens, not least in the area of fertility
decisions and population control.
The government’s population policies have been categorized into three main phases
(Wong & Yeoh, 2003): the anti-natalist phase (1966-1982); the “eugenics” period (1983-
1987); and the pro-natalist phase (1987-current). While the policies of each phase warrant
further study, this paper will focus mainly on attempting to evaluate the effectiveness of the
Children Development Co-Savings or “Baby Bonus” Scheme, implemented as part of the
pro-natalist drive and designed to lighten the financial burden of raising children in
Singapore. This initiative was first implemented in April 2001, enhanced in August 2004 and
again in August 2008 (www.babybonus.gov.sg, 2008).
The Baby Bonus Scheme is a two-tiered scheme, comprising of a direct cash gift
from the government and a co-saving arrangement in which the government matches dollar
for dollar the amount parents put into a Child Development Account (CDA), subject to a
maximum amount. The birth order covered under the scheme and the maximum value of
each component varied with each new rendition of the scheme. Refer to Table 1 for details.

- 5 -
Table 1: Total Benefits per Child (S$) under Baby Bonus Scheme, by Birth Order*
Birth Order Cash Gift from Government
Maximum Matching Govt. Contribution to CDA Total
Second $3,000 $6,000 Up to $9,000Third $6,000 $12,000 Up to $18,000First $3,000 - Up to $3,000
Second $3,000 $6,000 Up to $9,000Third & Fourth $6,000 $12,000 Up to $18,000First & Second $4,000 $6,000 Up to $10,000Third & Fourth $6,000 $12,000 Up to $18,000
Fifth and Beyond - $18,000 Up to $18,000
Apr '01 SchemeAug '04 Scheme
Aug '08 Scheme
* More details on the 2001 and 2004 iterations of the scheme can be found in Tables 3-5
It can be observed that having a second or third child brought parents significant
monetary rewards from 2001 onwards, while having a first or fourth child only did so from
2004 onwards, and a fifth child only from August 2008. This provides an opportunity to
study the impact of the Baby Bonus Scheme on children of different birth orders.
While several key studies have been done to better understand the Singaporean
population policies and to study the effectiveness of pro-natalist policies in Singapore on
boosting total fertility rates (TFR) (Drakakis-Smith et al, 1993; Teo & Yeoh, 1999; Graham
et al, 2002; Wong & Yeoh, 2003; Park, 2005 etc), I intend to contribute to the body of
knowledge already available by focusing on the impact of the Baby Bonus Scheme on total
fertility rates, as well as fertility rates for the first through fourth birth order, as opposed to
just on the aggregate. This allows for a more pointed assessment of the scheme’s
effectiveness for each birth order. I will also focus exclusively on the Baby Bonus Scheme.
(Park for example only focuses on Qualified Child Tax Relief (QCR) as a proxy for
government efforts to influence population trends.) I will also include in my regression
several variables that have not been included in previous studies, thus hopefully providing a
more well-specified and accurate model. I will in addition manipulate the combination of
variables I use in my regressions to attempt to shed new insight on the issue.
- 6 -
The paper proceeds as follows: As background for my study, in the first part of my
paper I will describe the demographic trends and patterns observed in Singapore since its
independence in 1965, and provide an analysis of the population policies that the Singapore
government has enacted through the years. In the next part I will conduct a literature review
of some of the research that has been done in this area previously. The third part of my paper
will state my hypothesis on the effectiveness of the Baby Bonus Scheme, together with
theoretical justifications for my stance and the relevance of the variables I incorporate. The
last segment will be a quantitative study attempting to estimate the direction and significance
of the Baby Bonus Scheme.
Singapore Demographic Trends and Patterns
Singapore’s population and total fertility rate has changed drastically since the post
Second World War baby boom. When Singapore was first founded by Sir Stanford Raffles in
1819 it was reported that the island had a total population of only 150 people. Since then, as
Singapore grew to become an important trading hub and a major colony in the east for the
British, immigration from China, India, Southeast Asia and the Middle East grew rapidly,
contributing to Singapore’s population increase. After Singapore emerged from the Second
World War it experienced a sustained post-war baby boom period that continued till the mid-
1960s. The TFR hit over 6 children per woman in the late 1950s. Over-crowding of the little
island of Singapore became a big concern, and for the first time, in 1966, the government got
involved in programs and policies to influence population trends.
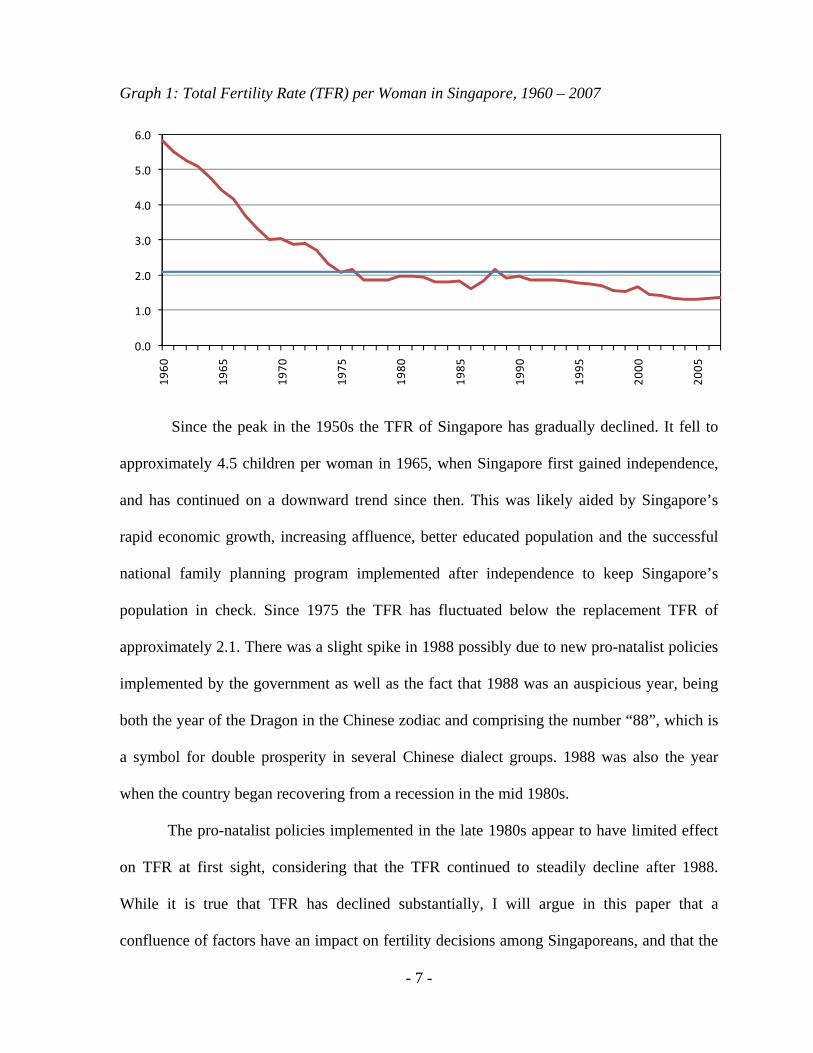
Refer to Graph 1 below for an overview of the trends in total fertility rates in
Singapore from 1960 to 2007.
- 7 -
Graph 1: Total Fertility Rate (TFR) per Woman in Singapore, 1960 – 2007
0.0
1.0
2.0
3.0
4.0
5.0
6.0
1960
1965
1970
1975
1980
1985
1990
1995
2000
2005
Since the peak in the 1950s the TFR of Singapore has gradually declined. It fell to
approximately 4.5 children per woman in 1965, when Singapore first gained independence,
and has continued on a downward trend since then. This was likely aided by Singapore’s
rapid economic growth, increasing affluence, better educated population and the successful
national family planning program implemented after independence to keep Singapore’s
population in check. Since 1975 the TFR has fluctuated below the replacement TFR of
approximately 2.1. There was a slight spike in 1988 possibly due to new pro-natalist policies
implemented by the government as well as the fact that 1988 was an auspicious year, being
both the year of the Dragon in the Chinese zodiac and comprising the number “88”, which is
a symbol for double prosperity in several Chinese dialect groups. 1988 was also the year
when the country began recovering from a recession in the mid 1980s.
The pro-natalist policies implemented in the late 1980s appear to have limited effect
on TFR at first sight, considering that the TFR continued to steadily decline after 1988.
While it is true that TFR has declined substantially, I will argue in this paper that a
confluence of factors have an impact on fertility decisions among Singaporeans, and that the
- 8 -
fact that TFR continues to decline does not necessarily imply that the pro-natalist policies of
the government are ineffective. As of 2008, Singapore had a population of 4.6 million people
and a TFR of about 1.3 children born/woman, making it according to United Nations and
CIA estimates a country with one of the lowest total fertility rates worldwide.
The population of Singapore is a multi-ethnic one, with about 77% of the population
Chinese, 14% Malay, and 8% Indian (South Asian), with the last 1% being of other
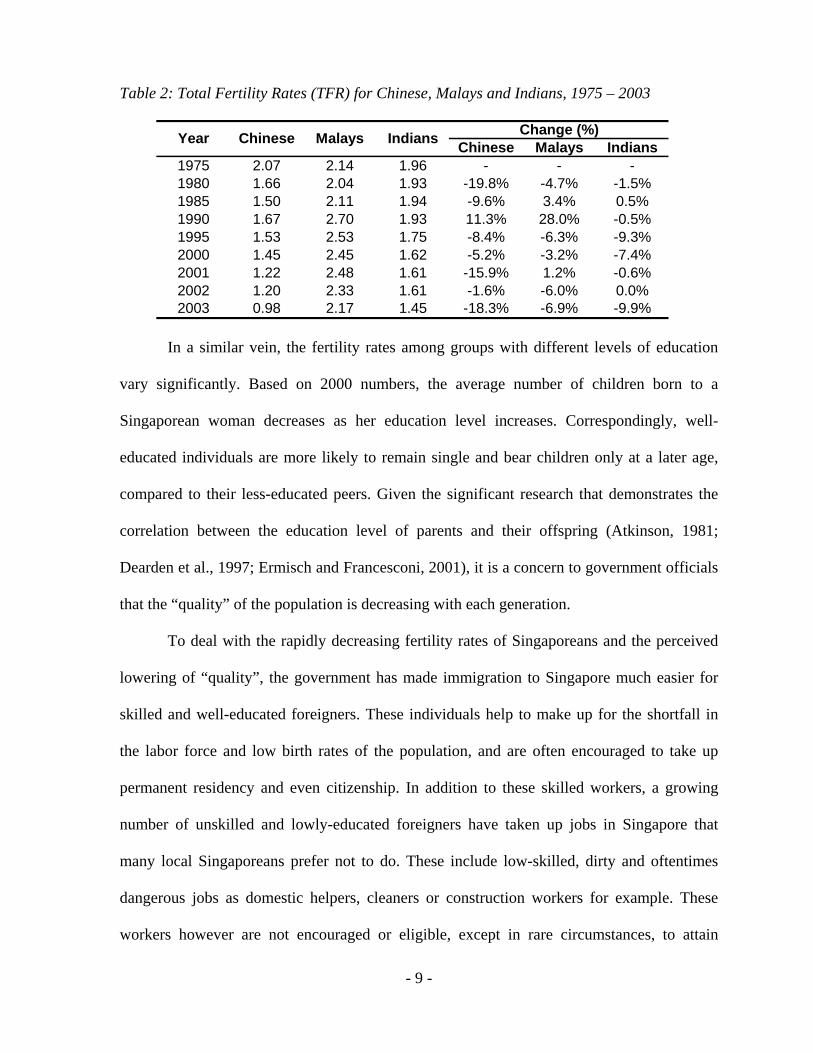
ethnicities. It is worth noting that these 3 major ethnic groups have different fertility rates and
socioeconomic conditions. Based on statistics, the Chinese have the highest median income,
followed by that of the Indians and then the Malays. The Malays however have the highest
fertility rates, followed by the Indians and then the Chinese. As of 2003, the fertility rate
among the Chinese, Malays and Indians is 0.98, 2.17 and 1.45 respectively. This situation has
created some complexity for the government in their population planning. The Chinese, the
majority of the population, have the highest income and yet have the lowest fertility rates.
This means, ceteris paribus, that the Chinese will be more difficult to motivate via monetary
incentives, since Chinese families tend to be more affluent, and the extra funding from the
government may not have much impact on their fertility decisions. The converse is true for
the Malays in the population. They are more likely to be motivated by monetary incentives
from the government, being the least affluent of the major ethnic groups, but with an already
relatively higher fertility rate the Malays too are unlikely to be very motivated to have even
more children. There is also the consideration of the long-term impact of encouraging the
least affluent ethnic group to have more offspring. Refer to Table 2 for more details
regarding the total fertility rates for the three main races of Singapore: the Chinese, the
Malays and the Indians.
- 9 -
Table 2: Total Fertility Rates (TFR) for Chinese, Malays and Indians, 1975 – 2003
Chinese Malays Indians1975 2.07 2.14 1.96 - - -1980 1.66 2.04 1.93 -19.8% -4.7% -1.5%1985 1.50 2.11 1.94 -9.6% 3.4% 0.5%1990 1.67 2.70 1.93 11.3% 28.0% -0.5%1995 1.53 2.53 1.75 -8.4% -6.3% -9.3%2000 1.45 2.45 1.62 -5.2% -3.2% -7.4%2001 1.22 2.48 1.61 -15.9% 1.2% -0.6%2002 1.20 2.33 1.61 -1.6% -6.0% 0.0%2003 0.98 2.17 1.45 -18.3% -6.9% -9.9%
Year Chinese Malays Indians Change (%)
In a similar vein, the fertility rates among groups with different levels of education
vary significantly. Based on 2000 numbers, the average number of children born to a
Singaporean woman decreases as her education level increases. Correspondingly, well-
educated individuals are more likely to remain single and bear children only at a later age,
compared to their less-educated peers. Given the significant research that demonstrates the
correlation between the education level of parents and their offspring (Atkinson, 1981;
Dearden et al., 1997; Ermisch and Francesconi, 2001), it is a concern to government officials
that the “quality” of the population is decreasing with each generation.
To deal with the rapidly decreasing fertility rates of Singaporeans and the perceived
lowering of “quality”, the government has made immigration to Singapore much easier for
skilled and well-educated foreigners. These individuals help to make up for the shortfall in
the labor force and low birth rates of the population, and are often encouraged to take up
permanent residency and even citizenship. In addition to these skilled workers, a growing
number of unskilled and lowly-educated foreigners have taken up jobs in Singapore that
many local Singaporeans prefer not to do. These include low-skilled, dirty and oftentimes
dangerous jobs as domestic helpers, cleaners or construction workers for example. These
workers however are not encouraged or eligible, except in rare circumstances, to attain
- 10 -
citizenship or permanent residence in Singapore. The influx of these skilled and unskilled
foreigners has changed the composition of the population. Whereas in 1980 over 94% of the
population were residents, this number dropped in 1990 to about 90%, and then to about 81%
in 2000, holding steady at that rate as of 2006. While the openness to foreigners has helped
alleviate the problem of a shrinking labor force, this policy has created some social issues
and unhappiness among local Singaporeans who accuse the government of taking care of the
interests of foreigners ahead of those of Singaporeans. For these reasons, the government still
finds it imperative to focus on increasing the fertility rate of the population.
History of Singapore’s Population Policies
The Singapore government has a history of implementing policies to influence and
shape social behavior, not least in the area of population policies. While organizations and
initiatives that try to influence population trends have existed since the end of the Second
World War, the government refused to play an active role in influencing fertility decisions
until January 1966 when the Singapore Family Planning and Population Board was
established.
Anti-Natalist Period (1966 – 1982)
As noted, the government initially got involved in order to control the size of the
population, which exploded due to a sustained post-war baby boom that Singapore
experienced. This was a different problem from that which Singapore currently faces. As a
relatively backward country with a poorly educated population, high infant mortality rates
and little or no education on or access to family planning resources, it is no surprise that
fertility rates were relatively high at that point.
- 11 -
The government took several drastic and controversial steps to control the population
boom. As mentioned, the government established the Singapore Family Planning and
Population Board (SFPPB) to promote the benefits of family planning and the use of
contraceptives. This was a first for the conservative Singaporean society, but the initiative
was widely supported. Against significant opposition, the Abortion Act came into force in
1970, legalizing induced abortions for the first time. This was done in part to help control the
rate of population expansion, but also to put an end to illegal and dangerous “back alley”
abortions that were going on. The government legalized voluntary sterilization the same year
that the Abortion Act came into force. This was supplanted by an even more liberal new
Voluntary Sterilization Act that was implemented in 1974, allowing almost anyone who
wanted to be sterilized to undergo the medical procedure. This too was done in the hope that,
in conjunction with the promotion of family planning and the use of contraceptives, the
population would begin to stabilize.
Throughout the 1970s, the government took further steps to attempt to reduce the
fertility rates and rapid population growth. In 1972 the government announced several policy
changes relating to income taxes, education, maternity leave and public housing that were
meant to encourage Singaporeans via incentives and disincentives to have only 1 or 2
children. Incentives include priority in primary (elementary) school registration for the first
and second child, as well as subsidized delivery charges for first and second births. Some of
the disincentives include higher charges for delivering the third and subsequent children of
couples, and the reduction in maternity leave benefits for the third child and beyond. These
measures were refined and intensified throughout the decade. The aim of these various
policies of the 1970s is perhaps best summed up by the advertising campaigns initiated by
the SFPPB: Stop at two (children).
- 12 -
While it is debatable whether the anti-natalist policies of the government from after
the Second World War till the 1970s were effective, the population growth did slow down
drastically. The total number of births each year decreased almost yearly from 1965 till 1977,
and the total fertility rate fell from a peak of over 6 in the mid 1950s to 3.0 in 1970 and 1.89
in 1977, below the replacement rate of around 2.1. Some of the other causes proposed for this
drop in fertility include the increase in the proportion of women in the workforce and the
corresponding later marrying and child-bearing age of Singaporean women, the higher
education level of the population, as well as the higher standard of living and the
corresponding increase in economic and opportunity cost of raising a child. Whatever the
reasons were, the population explosion was tamed, the TFR decreased significantly, and a
new problem of a very different nature emerged: the risk of a dwindling population,
especially among the better educated segments of the population.
Eugenics Period (1983 – 1986)
The government first expressed their concern about the lowering TFR among well-
educated women in 1983, when then Prime Minister Lee Kuan Yew observed the lopsided
pattern of procreation among Singaporeans, with well-educated women bearing much fewer
children compared to their less-educated peers. He cited research that showed the importance
of nature and genetics in determining the intelligence of an individual, and voiced his worry
that the “quality” of the Singaporean population would be adversely affected by these trends.
The 1980s thus ushered in a period of new population policies that aimed at increasing the
fertility rates of Singaporeans, particularly those of well-educated women.
Some of the policies introduced during the mid 1980s include the establishment of the
Social Development Unit (SDU), tasked by the government to match-make college graduates
to each other. More controversially, the government introduced several overtly eugenic
- 13 -
measures, including the provision of cash incentives to less-educated individuals to undergo
sterilization, and reduced subsidies for delivery charges of children of less-educated parents.
Because the Chinese were generally better educated and the Malays the least educated,
many deemed these policies as racial discrimination, aimed at preventing the proportion of
Chinese in the population from dwindling, relative to the Indians and Malays in particular.
This was a highly unpopular move among Singaporeans, and possibly contributed to the
significant reduction in votes garnered by the ruling party in the 1984 general elections.
These policies were also deemed a failure by the government, since they did little to increase
the fertility rates of the well-educated, likely due to the limited impact monetary incentives
have on these more affluent, well-educated segments of the population. The government
recognized the unpopularity of these measures, and took steps to firstly reduce emphasis on
some of these eugenic policies and secondly, transition into a period of pro-natalist policies
aimed at increasing the fertility rates of the entire population, regardless of education level.
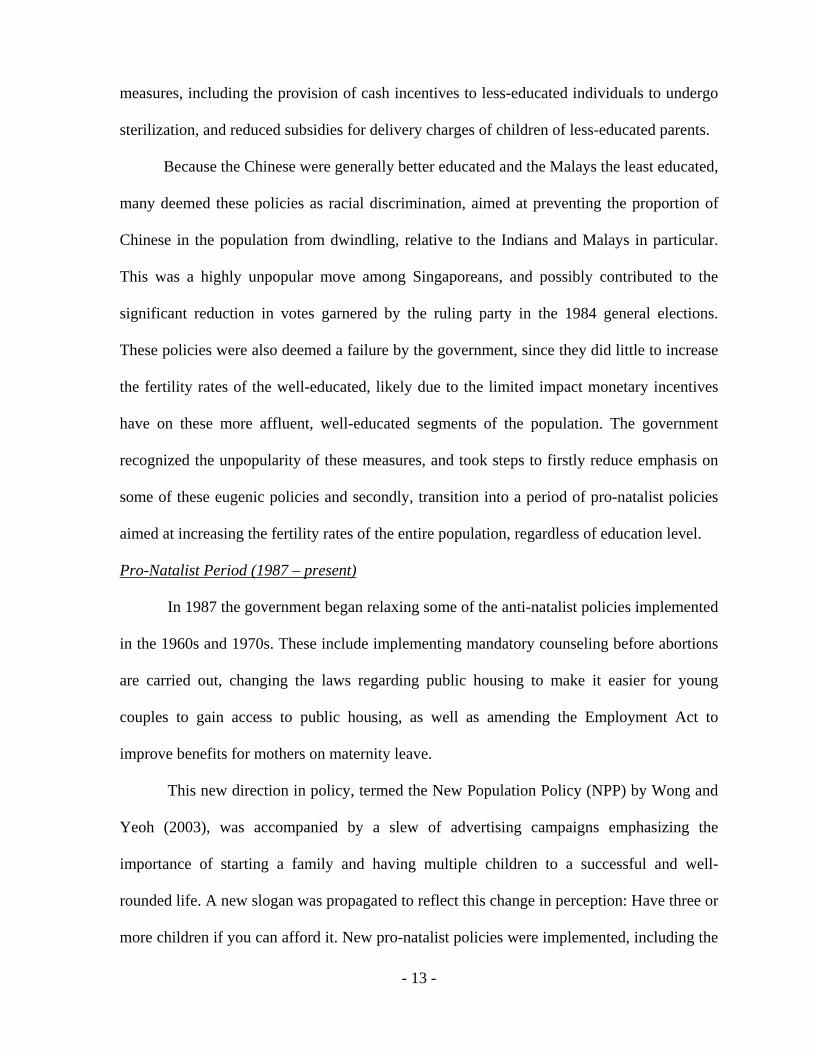
Pro-Natalist Period (1987 – present)
In 1987 the government began relaxing some of the anti-natalist policies implemented
in the 1960s and 1970s. These include implementing mandatory counseling before abortions
are carried out, changing the laws regarding public housing to make it easier for young
couples to gain access to public housing, as well as amending the Employment Act to
improve benefits for mothers on maternity leave.
This new direction in policy, termed the New Population Policy (NPP) by Wong and
Yeoh (2003), was accompanied by a slew of advertising campaigns emphasizing the
importance of starting a family and having multiple children to a successful and well-
rounded life. A new slogan was propagated to reflect this change in perception: Have three or
more children if you can afford it. New pro-natalist policies were implemented, including the
- 14 -
focus of this paper: the Baby Bonus Scheme that was implemented in 2001. Other pro-
natalist policies implemented in the early 2000s include extra paid maternity leave, reduced
cost of public housing for large families, subsidized infant care facilities, and funds that
provided subsidies and monetary incentives for working mothers. This last policy in
particular reflected the constant struggle the government faced with wanting to encourage
both higher fertility rates and a larger proportion of women joining the work force.
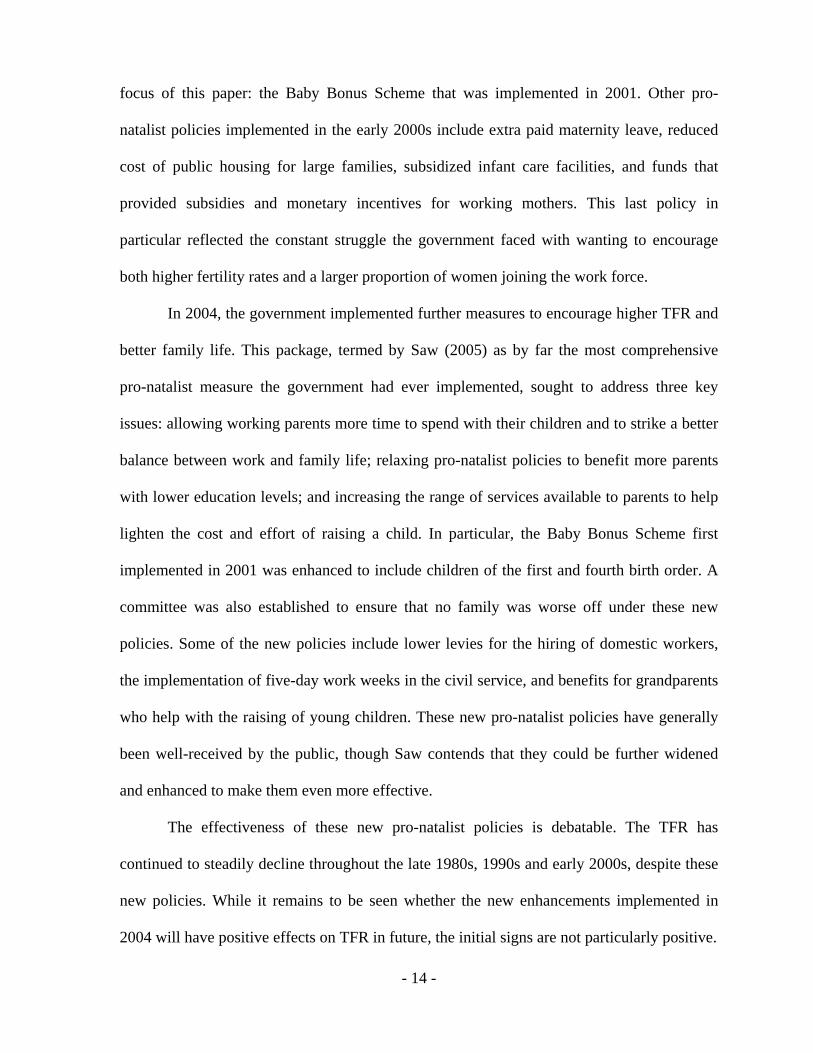
In 2004, the government implemented further measures to encourage higher TFR and
better family life. This package, termed by Saw (2005) as by far the most comprehensive
pro-natalist measure the government had ever implemented, sought to address three key
issues: allowing working parents more time to spend with their children and to strike a better
balance between work and family life; relaxing pro-natalist policies to benefit more parents
with lower education levels; and increasing the range of services available to parents to help
lighten the cost and effort of raising a child. In particular, the Baby Bonus Scheme first
implemented in 2001 was enhanced to include children of the first and fourth birth order. A
committee was also established to ensure that no family was worse off under these new
policies. Some of the new policies include lower levies for the hiring of domestic workers,
the implementation of five-day work weeks in the civil service, and benefits for grandparents
who help with the raising of young children. These new pro-natalist policies have generally
been well-received by the public, though Saw contends that they could be further widened
and enhanced to make them even more effective.
The effectiveness of these new pro-natalist policies is debatable. The TFR has
continued to steadily decline throughout the late 1980s, 1990s and early 2000s, despite these
new policies. While it remains to be seen whether the new enhancements implemented in
2004 will have positive effects on TFR in future, the initial signs are not particularly positive.
- 15 -
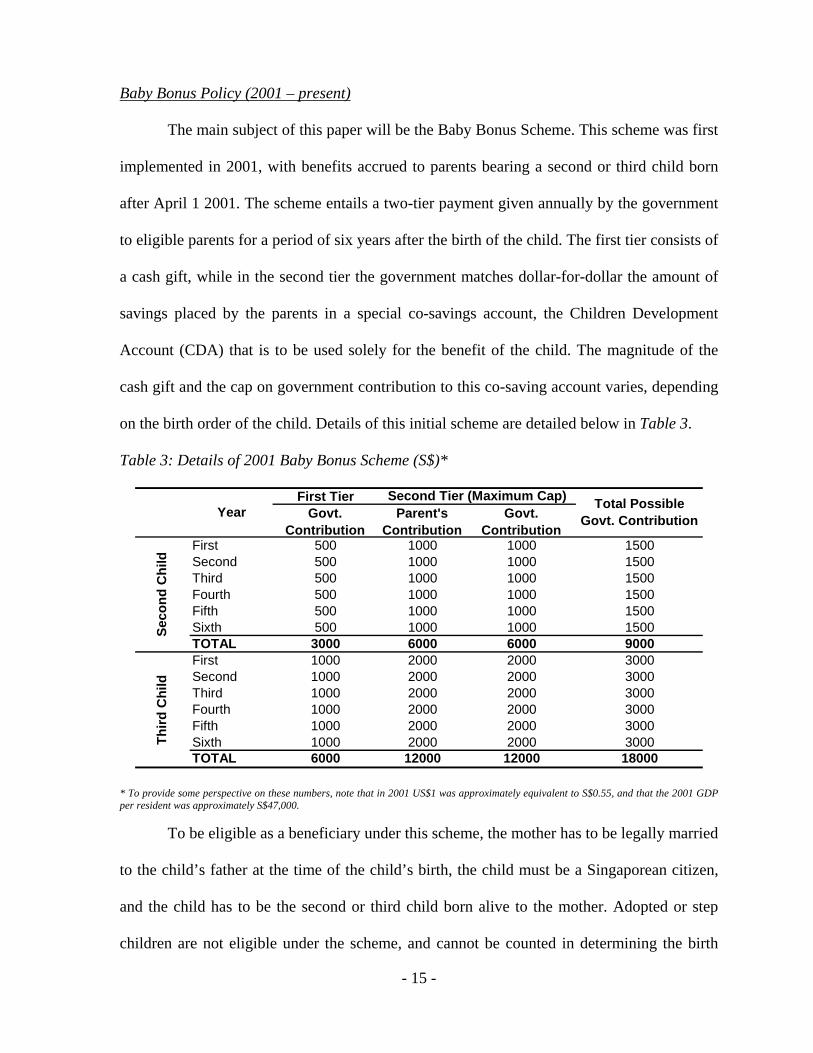
Baby Bonus Policy (2001 – present)
The main subject of this paper will be the Baby Bonus Scheme. This scheme was first
implemented in 2001, with benefits accrued to parents bearing a second or third child born
after April 1 2001. The scheme entails a two-tier payment given annually by the government
to eligible parents for a period of six years after the birth of the child. The first tier consists of
a cash gift, while in the second tier the government matches dollar-for-dollar the amount of
savings placed by the parents in a special co-savings account, the Children Development
Account (CDA) that is to be used solely for the benefit of the child. The magnitude of the
cash gift and the cap on government contribution to this co-saving account varies, depending
on the birth order of the child. Details of this initial scheme are detailed below in Table 3.
Table 3: Details of 2001 Baby Bonus Scheme (S$)*
First TierGovt.
ContributionParent's
ContributionGovt.
ContributionFirst 500 1000 1000 1500Second 500 1000 1000 1500Third 500 1000 1000 1500Fourth 500 1000 1000 1500Fifth 500 1000 1000 1500Sixth 500 1000 1000 1500TOTAL 3000 6000 6000 9000First 1000 2000 2000 3000Second 1000 2000 2000 3000Third 1000 2000 2000 3000Fourth 1000 2000 2000 3000Fifth 1000 2000 2000 3000Sixth 1000 2000 2000 3000TOTAL 6000 12000 12000 18000
YearSecond Tier (Maximum Cap) Total Possible
Govt. Contribution
Seco
nd C
hild
Third
Chi
ld
* To provide some perspective on these numbers, note that in 2001 US$1 was approximately equivalent to S$0.55, and that the 2001 GDP per resident was approximately S$47,000.
To be eligible as a beneficiary under this scheme, the mother has to be legally married
to the child’s father at the time of the child’s birth, the child must be a Singaporean citizen,
and the child has to be the second or third child born alive to the mother. Adopted or step
children are not eligible under the scheme, and cannot be counted in determining the birth
- 16 -
order of a child. Multiple births at the same time are considered separate births in the
determination of birth order.
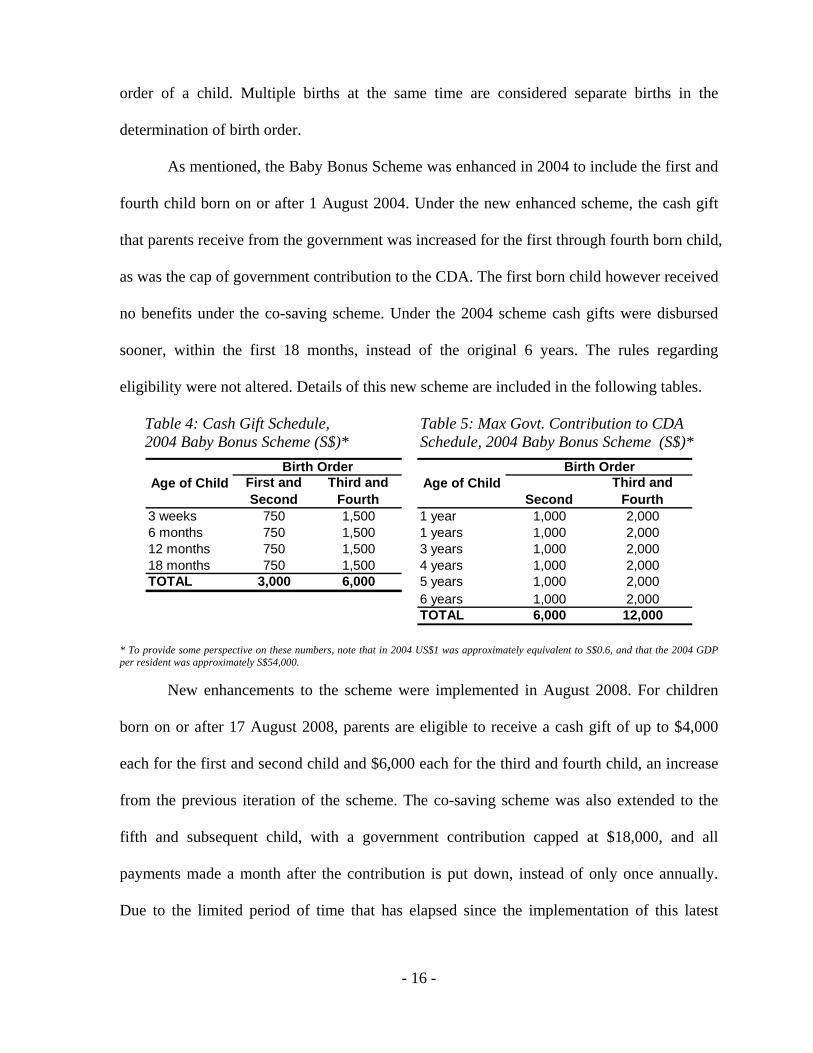
As mentioned, the Baby Bonus Scheme was enhanced in 2004 to include the first and
fourth child born on or after 1 August 2004. Under the new enhanced scheme, the cash gift
that parents receive from the government was increased for the first through fourth born child,
as was the cap of government contribution to the CDA. The first born child however received
no benefits under the co-saving scheme. Under the 2004 scheme cash gifts were disbursed
sooner, within the first 18 months, instead of the original 6 years. The rules regarding
eligibility were not altered. Details of this new scheme are included in the following tables.
Table 4: Cash Gift Schedule, 2004 Baby Bonus Scheme (S$)*
Table 5: Max Govt. Contribution to CDA Schedule, 2004 Baby Bonus Scheme (S$)*
First and Second
Third and Fourth Second
Third and Fourth
3 weeks 750 1,500 1 year 1,000 2,0006 months 750 1,500 1 years 1,000 2,00012 months 750 1,500 3 years 1,000 2,00018 months 750 1,500 4 years 1,000 2,000TOTAL 3,000 6,000 5 years 1,000 2,000
6 years 1,000 2,000TOTAL 6,000 12,000
Birth OrderAge of Child Age of Child
Birth Order
* To provide some perspective on these numbers, note that in 2004 US$1 was approximately equivalent to S$0.6, and that the 2004 GDP per resident was approximately S$54,000. New enhancements to the scheme were implemented in August 2008. For children
born on or after 17 August 2008, parents are eligible to receive a cash gift of up to $4,000
each for the first and second child and $6,000 each for the third and fourth child, an increase
from the previous iteration of the scheme. The co-saving scheme was also extended to the
fifth and subsequent child, with a government contribution capped at $18,000, and all
payments made a month after the contribution is put down, instead of only once annually.
Due to the limited period of time that has elapsed since the implementation of this latest
- 17 -
alteration to the scheme, the scope of this paper will not cover the effects of the third iteration
of the scheme.
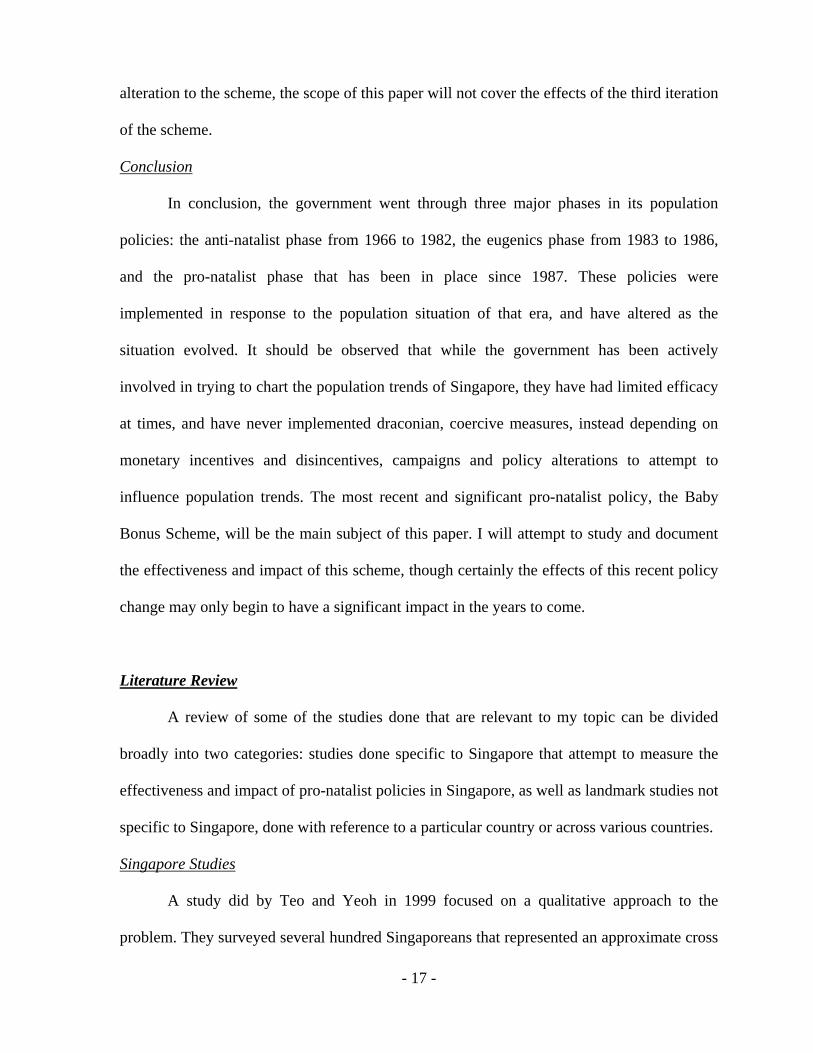
Conclusion
In conclusion, the government went through three major phases in its population
policies: the anti-natalist phase from 1966 to 1982, the eugenics phase from 1983 to 1986,
and the pro-natalist phase that has been in place since 1987. These policies were
implemented in response to the population situation of that era, and have altered as the
situation evolved. It should be observed that while the government has been actively
involved in trying to chart the population trends of Singapore, they have had limited efficacy
at times, and have never implemented draconian, coercive measures, instead depending on
monetary incentives and disincentives, campaigns and policy alterations to attempt to
influence population trends. The most recent and significant pro-natalist policy, the Baby
Bonus Scheme, will be the main subject of this paper. I will attempt to study and document
the effectiveness and impact of this scheme, though certainly the effects of this recent policy
change may only begin to have a significant impact in the years to come.
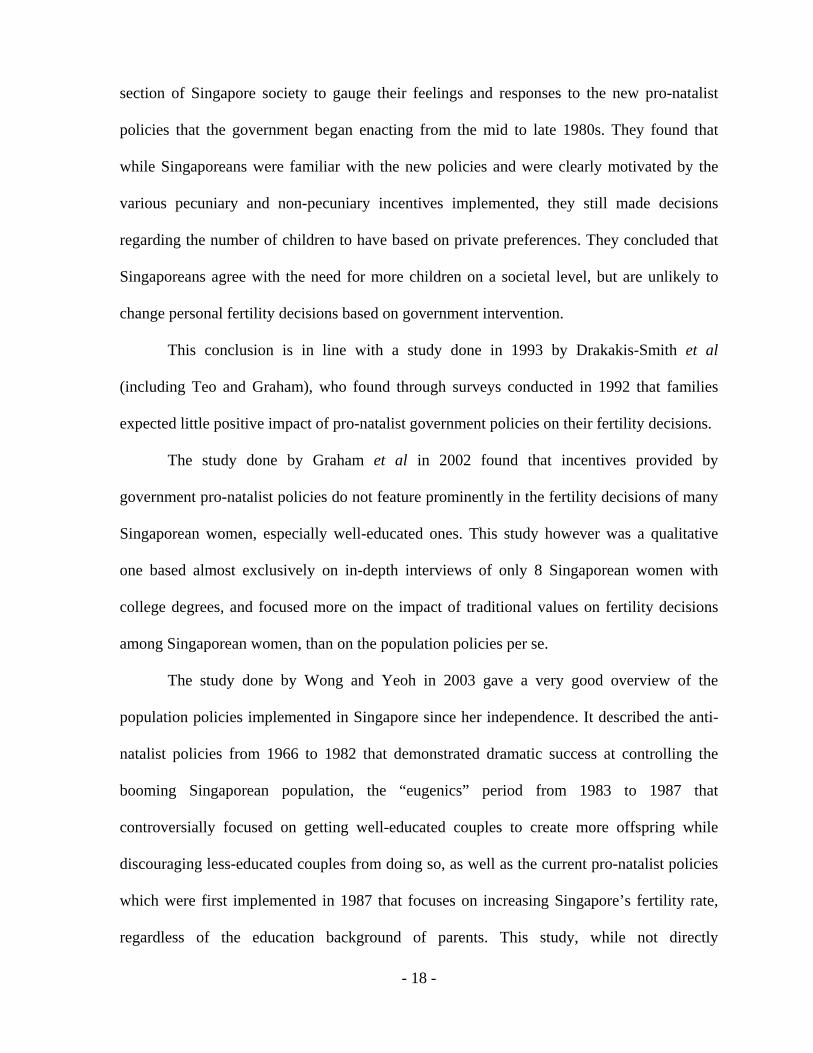
Literature Review
A review of some of the studies done that are relevant to my topic can be divided
broadly into two categories: studies done specific to Singapore that attempt to measure the
effectiveness and impact of pro-natalist policies in Singapore, as well as landmark studies not
specific to Singapore, done with reference to a particular country or across various countries.
Singapore Studies
A study did by Teo and Yeoh in 1999 focused on a qualitative approach to the
problem. They surveyed several hundred Singaporeans that represented an approximate cross
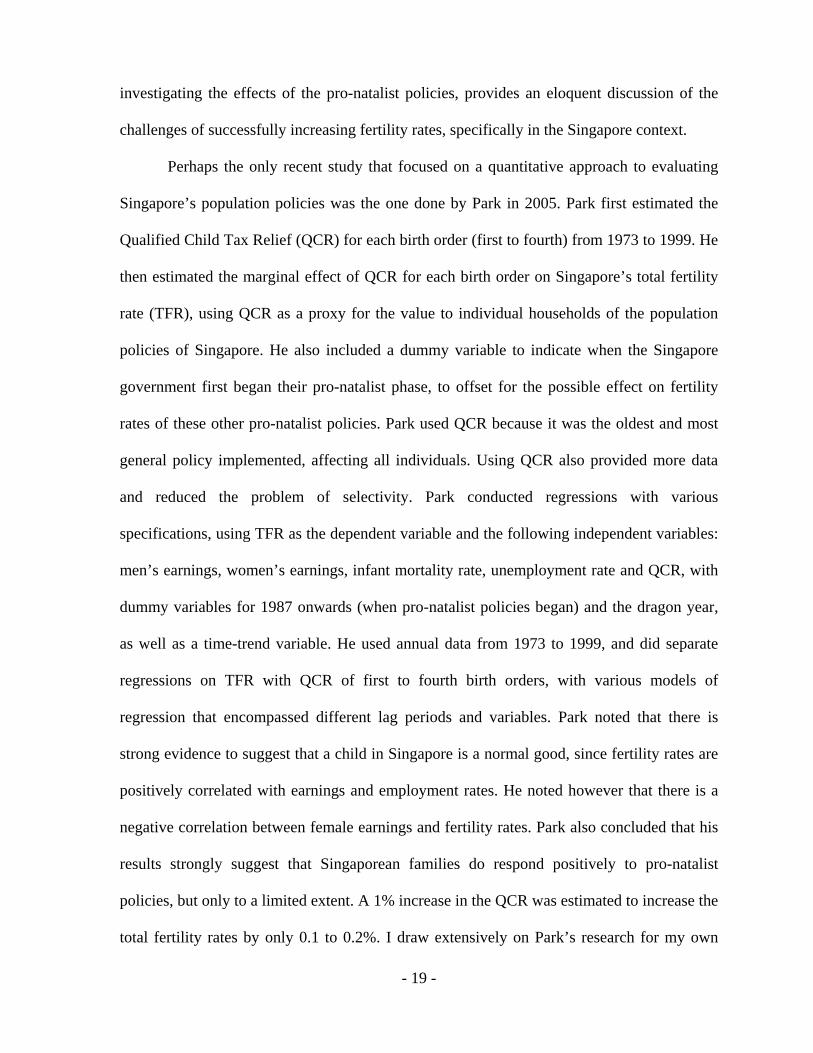
- 18 -
section of Singapore society to gauge their feelings and responses to the new pro-natalist
policies that the government began enacting from the mid to late 1980s. They found that
while Singaporeans were familiar with the new policies and were clearly motivated by the
various pecuniary and non-pecuniary incentives implemented, they still made decisions
regarding the number of children to have based on private preferences. They concluded that
Singaporeans agree with the need for more children on a societal level, but are unlikely to
change personal fertility decisions based on government intervention.
This conclusion is in line with a study done in 1993 by Drakakis-Smith et al
(including Teo and Graham), who found through surveys conducted in 1992 that families
expected little positive impact of pro-natalist government policies on their fertility decisions.
The study done by Graham et al in 2002 found that incentives provided by
government pro-natalist policies do not feature prominently in the fertility decisions of many
Singaporean women, especially well-educated ones. This study however was a qualitative
one based almost exclusively on in-depth interviews of only 8 Singaporean women with
college degrees, and focused more on the impact of traditional values on fertility decisions
among Singaporean women, than on the population policies per se.
The study done by Wong and Yeoh in 2003 gave a very good overview of the
population policies implemented in Singapore since her independence. It described the anti-
natalist policies from 1966 to 1982 that demonstrated dramatic success at controlling the
booming Singaporean population, the “eugenics” period from 1983 to 1987 that
controversially focused on getting well-educated couples to create more offspring while
discouraging less-educated couples from doing so, as well as the current pro-natalist policies
which were first implemented in 1987 that focuses on increasing Singapore’s fertility rate,
regardless of the education background of parents. This study, while not directly
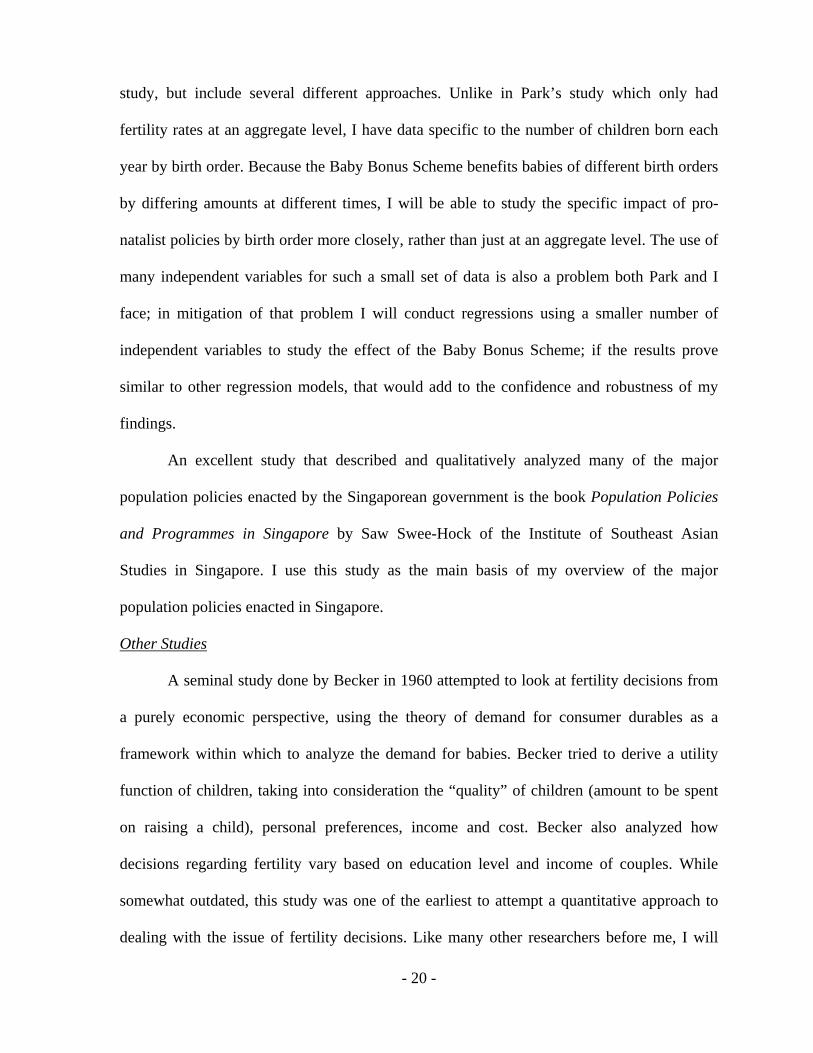
- 19 -
investigating the effects of the pro-natalist policies, provides an eloquent discussion of the
challenges of successfully increasing fertility rates, specifically in the Singapore context.
Perhaps the only recent study that focused on a quantitative approach to evaluating
Singapore’s population policies was the one done by Park in 2005. Park first estimated the
Qualified Child Tax Relief (QCR) for each birth order (first to fourth) from 1973 to 1999. He
then estimated the marginal effect of QCR for each birth order on Singapore’s total fertility
rate (TFR), using QCR as a proxy for the value to individual households of the population
policies of Singapore. He also included a dummy variable to indicate when the Singapore
government first began their pro-natalist phase, to offset for the possible effect on fertility
rates of these other pro-natalist policies. Park used QCR because it was the oldest and most
general policy implemented, affecting all individuals. Using QCR also provided more data
and reduced the problem of selectivity. Park conducted regressions with various
specifications, using TFR as the dependent variable and the following independent variables:
men’s earnings, women’s earnings, infant mortality rate, unemployment rate and QCR, with
dummy variables for 1987 onwards (when pro-natalist policies began) and the dragon year,
as well as a time-trend variable. He used annual data from 1973 to 1999, and did separate
regressions on TFR with QCR of first to fourth birth orders, with various models of
regression that encompassed different lag periods and variables. Park noted that there is
strong evidence to suggest that a child in Singapore is a normal good, since fertility rates are
positively correlated with earnings and employment rates. He noted however that there is a
negative correlation between female earnings and fertility rates. Park also concluded that his
results strongly suggest that Singaporean families do respond positively to pro-natalist
policies, but only to a limited extent. A 1% increase in the QCR was estimated to increase the
total fertility rates by only 0.1 to 0.2%. I draw extensively on Park’s research for my own
- 20 -
study, but include several different approaches. Unlike in Park’s study which only had
fertility rates at an aggregate level, I have data specific to the number of children born each
year by birth order. Because the Baby Bonus Scheme benefits babies of different birth orders
by differing amounts at different times, I will be able to study the specific impact of pro-
natalist policies by birth order more closely, rather than just at an aggregate level. The use of
many independent variables for such a small set of data is also a problem both Park and I
face; in mitigation of that problem I will conduct regressions using a smaller number of
independent variables to study the effect of the Baby Bonus Scheme; if the results prove
similar to other regression models, that would add to the confidence and robustness of my
findings.
An excellent study that described and qualitatively analyzed many of the major
population policies enacted by the Singaporean government is the book Population Policies
and Programmes in Singapore by Saw Swee-Hock of the Institute of Southeast Asian
Studies in Singapore. I use this study as the main basis of my overview of the major
population policies enacted in Singapore.
Other Studies
A seminal study done by Becker in 1960 attempted to look at fertility decisions from
a purely economic perspective, using the theory of demand for consumer durables as a
framework within which to analyze the demand for babies. Becker tried to derive a utility
function of children, taking into consideration the “quality” of children (amount to be spent
on raising a child), personal preferences, income and cost. Becker also analyzed how
decisions regarding fertility vary based on education level and income of couples. While
somewhat outdated, this study was one of the earliest to attempt a quantitative approach to
dealing with the issue of fertility decisions. Like many other researchers before me, I will
- 21 -
draw significantly from Becker’s economic analysis of fertility to provide the basis of my
theoretical argument and hypothesis regarding the efficacy of the Baby Bonus Scheme.
A study done by Paul Demeny in 1986 provided an overview of why there is a
perceived need among governments to enact population policies, what some of the methods
that have been used are, and whether these methods have been effective. Demeny did
significant research into papers written on the topic, and found that the consensus that is
appearing, regardless of country, is that many pro-natalist policies have no or negligible
impacts on fertility rates.
Buttner and Lutz in 1990 studied the effects on former East Germany’s fertility rates
of the liberalization of abortion in 1972 and expansion of maternity leave period and benefits
in 1976. They examined the effect on fertility rates of different birth orders, using data from
1964 to 1987. They found that while there is limited effect of these policies on first births,
births of higher birth orders are significantly affected. The study of impact on different birth
orders is one that I will also adopt in my study.
One of the leading researchers of fertility and pro-natalist policies, Leslie Whittington,
conducted a study in 1990 that estimated the effect of personal exemption granted to
taxpayers on the general fertility rate of the United States. They used annual data from 1913
to 1984 and controlled for male income, unemployment rate, infant mortality rate, the
proportion of immigrants among women of child-bearing age, average female wage and
education, availability of contraceptive pills, time trend, and the period of World War II.
Whittington conducted regressions with various models, assuming different lag structures
and slightly different sets of independent variables. Under all specifications, they found that
personal exemption has a statistically significant positive effect on the US fertility rate.
- 22 -
The Whittington model has served as the basis for many studies in this field,
including Park’s study discussed previously. Other studies that have incorporated this model
include Georgellis and Wall (1992) and Gohmann and Ohsfeldt (1994). Both studies found
that the marginal effect of the personal exemption decreases as the exemption amount
increases. This suggests that using pecuniary incentives to increase the fertility rates to
replacement levels may prove to be extremely costly. Zhang et al. (1994) and Huang (2002)
also used this model in their studies on Canada and Taiwan respectively.
Whittington also conducted another study in 1992 examining the relationship between
the dependent exemption feature in the US federal income tax (a subsidy for dependents) and
the fertility behavior of married couples in America, between 1979 and 1983. While there are
reasons to believe that there were inaccuracies in the study (including the very short time
frame studied and the fact that subsidies for dependents do not directly imply a pro-natalist
shift in attitude), this study, using a quantitative approach, concluded that these tax
exemptions have a positive and significant impact on the likelihood of having a birth during
the period of study.
A study done by Gauthier and Hatzius in 1997 took a quantitative approach when
assessing the effectiveness of policies on fertility rates. They rightly pointed out that many
studies done so far have been either based on public opinion surveys, qualitative analysis
based on a descriptive-intuitive approach, or qualitative approaches, based either on
aggregate or individual data. Gauthier and Hatzius decided to conduct a wide ranging panel
data econometric analysis across countries. They had as their dependent variable the TFR of
countries, and the following independent variables: male wages, female wages,
unemployment rate, and the variables of interest: cash benefits for bearing children and
maternity benefits (based on amount of maternity leave federally mandated and amount
- 23 -
mothers get paid while on leave). The study found that the amount of maternity benefits has
insignificant effects on TFR, while that of cash benefits have positive and significant effects
on fertility.
A paper by Cohen, Dehejia and Romanov (2007) studied empirically whether
government child subsidies affected fertility rates in Israel. They found that financial
incentives have a significant positive effect on fertility, but with greater positive effect
focused on lower income families, as expected. They concluded that fertility decisions
respond to financial incentives, and therefore child subsidy policies like the Baby Bonus
Scheme can have a significant positive influence on fertility rates. A point of interest about
this study is that the researchers had access to comprehensive, non-public individual level
panel data, allowing for a much closer examination of the effects on individual fertility
decisions of financial incentives. While access to such data is not possible for my study, this
study provides some insight into how best to approach the modeling of a regression analysis.
A study by Preston and Hartnett (2008) investigated the major social and
demographic forces that influence American fertility levels, with the aim of predicting
changes in fertility levels in the coming decades. While this paper is not directly relevant to a
study of the impact of financial incentives on fertility decisions, the paper discusses some of
the independent variables which impact fertility rates that could be included in my analysis:
female wages, more widespread use of contraception, education levels and female labor force
participation. This paper concluded that the change in female wages and labor force
participation are among the greatest reasons for the changes in fertility rates in developed
countries. This view is echoed by a paper by Sacerdote and Feyrer (2008), which concluded
that the status of females in developed countries has a large impact on fertility rates. While
data on female wages and education levels are unavailable in my study, I will include female
- 24 -
labor participation rate and GDP per capita as independent variables in my study to attempt
to incorporate the impact of the changing role of women in Singaporean society.
A study done by Bachi in 1990 comprehensively detailed the reasons for decreasing
fertility rates in developed countries. Bachi stated that aside from decreasing infant mortality,
the major factors that cause a fall in fertility rates in developed countries are the decline in
marital fertility and the destabilization of the institution of marriage. Reasons for the
decreasing marital fertility include the rising monetary cost of raising a child due to higher
standards in quality of life and education expected, the detrimental effect that child bearing
and raising has on the careers of working women, the modern day emphasis on the pursuit of
personal fulfillment and the simultaneous weakening of the influence of traditional values on
fertility, as well as the reduced need to rely on children as economic insurance for parents in
their old age. This analysis will come in useful when I attempt to interpret and evaluate the
results of my empirical study.
Worth noting as well are studies that span across more than one country: Winegarden
and Bracy (1995) used data from 17 OECD countries and Gauthier and Hatzius (1997) that
was reviewed earlier used data from 22 industrialized nations. While I considered conducting
a study spanning Singapore as well as other countries, I found data collection from other
countries difficult. In addition, Singapore is a fairly unique nation-state and comparisons with
other countries are unlikely to yield significant insight.
Theoretical Argument and Hypothesis
Becker’s 1960 research paper will be the basis of my theoretical argument of children
as an economic good, as it is for many other papers in this field. As Becker expounded,
children can be perceived as durable, normal consumer goods, and parents the consumers of
- 25 -
these normal goods. While it is arguable that children may turn out to be production goods if
the cost to parents of raising a child is less than the material returns to be gained when the
child matures, Becker argued that children typically grow up to be free agents that do not
necessarily contribute significantly in terms of monetary returns to parents in their later years.
Becker also demonstrated that the cost of raising a child has increased significantly with time,
and greatly outstrips the material returns to parents later, especially after taking into
consideration the time value of money. It is worth noting though that in the Confucian culture
that dominates Singapore, it is the social norm for children to take care of their parents in
their old age. It is thus more possible that children in a Singaporean context turn out to be a
production good. To simplify my analysis I shall however assume that children can be
primarily compared to durable consumer goods.
For this economic analysis to carry weight, it has to be assumed that parents have
significant if not total control over whether they want to have a child or not. With greater use
of contraceptive methods and the decreasing taboo associated with abortions, this assumption
appears to be a fair one. That said there are couples who want to have children but face
significant difficulties doing so. We shall assume such couples to be the minority.
Parents are generally speaking only concerned with the number of children who
survive, not the number of children who are born to them. As infant mortality rates fall,
parents have greater certainty regarding whether their child will survive; ceteris paribus, this
would mean a lower fertility rate. Whereas in the past parents may have more babies to guard
against the possibility of children not surviving infanthood, parents have to worry less about
infant mortality now.
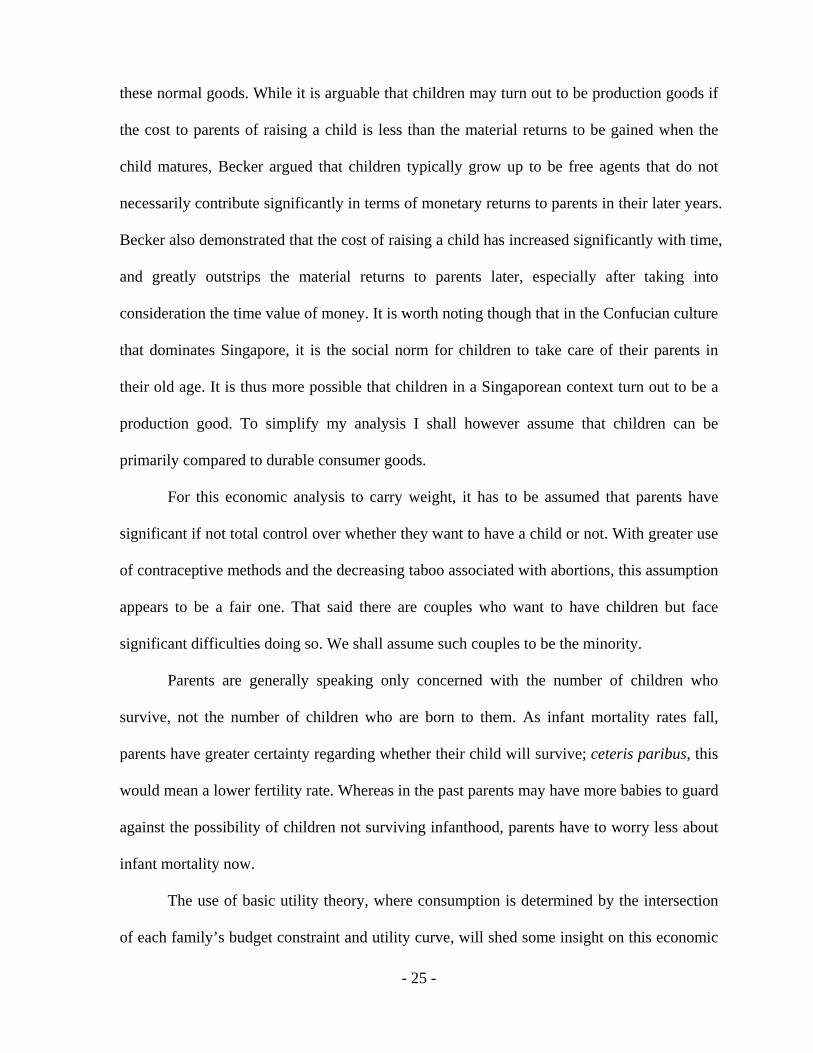
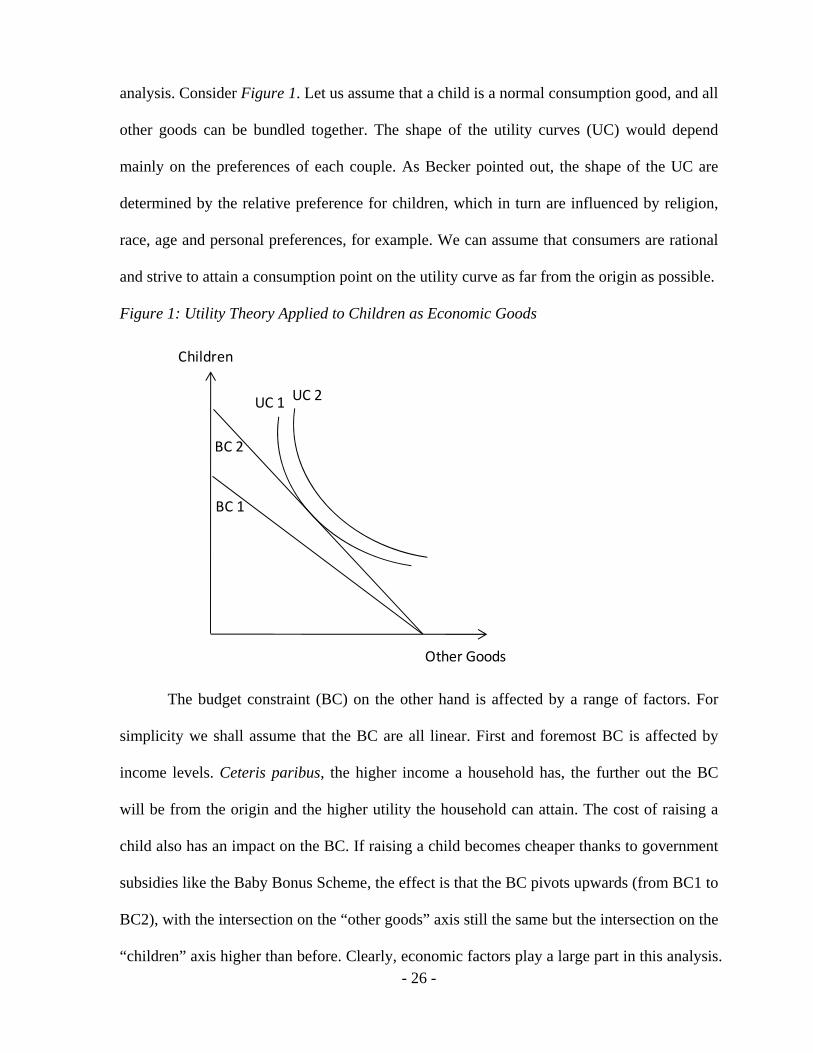
The use of basic utility theory, where consumption is determined by the intersection
of each family’s budget constraint and utility curve, will shed some insight on this economic
- 26 -
analysis. Consider Figure 1. Let us assume that a child is a normal consumption good, and all
other goods can be bundled together. The shape of the utility curves (UC) would depend
mainly on the preferences of each couple. As Becker pointed out, the shape of the UC are
determined by the relative preference for children, which in turn are influenced by religion,
race, age and personal preferences, for example. We can assume that consumers are rational
and strive to attain a consumption point on the utility curve as far from the origin as possible.
Figure 1: Utility Theory Applied to Children as Economic Goods
Children
Other Goods
UC 1 UC 2
BC 1
BC 2
The budget constraint (BC) on the other hand is affected by a range of factors. For
simplicity we shall assume that the BC are all linear. First and foremost BC is affected by
income levels. Ceteris paribus, the higher income a household has, the further out the BC
will be from the origin and the higher utility the household can attain. The cost of raising a
child also has an impact on the BC. If raising a child becomes cheaper thanks to government
subsidies like the Baby Bonus Scheme, the effect is that the BC pivots upwards (from BC1 to
BC2), with the intersection on the “other goods” axis still the same but the intersection on the
“children” axis higher than before. Clearly, economic factors play a large part in this analysis.

- 27 -
As described in the literature review, several papers focus on the impact of the
changing status and role of women on fertility rates. The main argument in those studies is
that as the status of women in society increases and women become more economically
independent, hold better paying jobs and have higher labor force participation rates, the
opportunity cost of having a child increases, since that would imply a loss of greater amounts
of potential income that could have been earned by the woman for the household, if she did
not have to go through pregnancy or raise the child. This implies that over time as more
women join the labor force and earn higher wages, the cost of raising a child increases.
Ceteris paribus, this would cause BC to pivot downwards (from BC2 to BC1), with the
intersection on the “other goods” axis still the same but the intersection on the “children”
axis lower than before.
The number of children, if any, that a couple decides to raise depends on the point of
intersection between the budget constraint and the utility curve of the couple. The shape and
form of the BC and UC clearly varies from couple to couple; as mentioned, the economic
situation of a household affects the BC, and the UC of a couple varies based on personal
preferences. Some couples may enjoy having a larger family, raising a child or view having
children as contributing to their utility; others may view child raising as a nuisance and an
investment whose payoff does not cover the costs.
It is difficult to capture and reflect the shifts in preferences of a single couple over
time, but at an aggregate level it is fair to assume that these stay fairly constant. My study
will focus instead on capturing changes in the budget constraints of couples in Singapore
across time at an aggregate level. Refer to segment titled “Framework and Approach” for
more details on the approach and specifics of my quantitative analysis.
- 28 -
As discussed, what a program like the Baby Bonus Scheme does is to decrease the
cost associated with raising a child. I hypothesize however that the scheme will have limited
effect on fertility decisions. The magnitude of the subsidies entitled to parents under the
scheme, while generous, counts for only a very small portion of the costs of raising a child.
According to 2001 estimates by the U.S. Department of Agriculture, the cost of raising a
child to age 18 in America (assuming he leaves the household at 18 as an independent, self-
sufficient adult) ranges from US$118,000 – 250,000. The maximum benefit that a parent can
get under the 2004 Baby Bonus Scheme is S$18,000 or approximately US$11,000.
An overview of past studies seems to support my position. The majority of the studies
already done suggest that for developed countries, little or no impact on fertility decisions
can be made with monetary incentives. This is due in large part to the high opportunity cost
of raising children, especially for many of the well-educated working women who place
more value on their careers than less-educated women of developing countries. Many studies
conclude that the monetary cost of raising a child is significant in a developed society with
high living standards, and while financial incentives like the Baby Bonus scheme does allow
parents to reap significant monetary benefits, the monetary value attached to the scheme is
not nearly enough to compensate parents for the cost of raising a child. It has also been noted
in various studies that the marginal return of each dollar spent by governments on trying to
increase fertility rates decreases as more dollars are spent; this implies that it gets
exponentially more difficult to encourage parents to have more children.
In addition, multiple factors other than monetary considerations can have an impact
on fertility decisions. While my study will attempt to control for some of these factors, many,
especially non-tangible factors such as culture and perception that affect the utility functions
of households, will inevitably not be captured in the analysis. There is also the issue of a
- 29 -
possible significant time lag before the full effectiveness of the policy is revealed in changes
in fertility rates of the population.
For these reasons I hypothesize that the Baby Bonus Scheme will have little if any
impact on fertility rates. That said several mitigating factors exist. While there are no official
estimates of what it costs to raise a child in Singapore, the absolute cost should be
significantly lower than that estimated by USDA for American families. It should also be
restated that in Singaporean culture children are expected to support their parents in their old
age; this implies that the future “cash inflow” of raising a child may be significant, and a
better comparison to the magnitude of monetary rewards under the scheme would be the net
present cost of raising a child. In addition, the scheme should help change the minds of some
couples at the margin who are indifferent about whether to have a child or not. Ceteris
paribus, any additional cash benefit will provide the push for these households to have
additional children. The absolute magnitude of cash benefits to parents under the Baby Bonus
Scheme (up to S$18,000) is also significant, when compared to GDP per capita (S$54,000 in
2004), especially for lower income families. The support that has been expressed for the
scheme by the general population also seems to bode well for its success.
Framework of Empirical Study and Data
I base a great deal of my framework and approach on the theoretical argument laid
out above that was modified from Becker’s 1960 study, as well as on the 2005 study by Park,
who in turn was greatly influenced by Whittington’s 1990 study. I emulated Park’s approach
of dealing with the benefits accrued to each birth order separately, and included some of the
independent variables he utilized as part of his study. As noted however, because I have data
for annual births by birth order that Park did not have or utilize, I will conduct a quantitative
- 30 -
analysis studying the specific impact of the Baby Bonus Scheme on fertility rates for each
birth order (first through fourth), as well as at an aggregate level.
I will follow Park’s method of estimating the impact on fertility rates per dollar of
financial incentive that the Singapore government gives out as part of the Baby Bonus
Scheme. In addition to that, to provide a more comprehensive assessment of the effects, I will
also conduct regressions that utilize dummy variables, instead of variables indicating
monetary value, to indicate when the scheme benefits babies of a particular birth order.
The dependent variable for my regressions will be the logarithm of total fertility rates
(TFR), both at an aggregate level as well as for each birth order. This I found by dividing the
live births per year, both at an aggregate level as well as for each birth order, by the number
of women in the population of child bearing age (15 – 44 years old is a commonly used norm
that I will adopt), then multiplying that number by 29 (the number of years between 15 to 44).
I then find the logarithm of these values. The dependent variables for logarithm of aggregate
level TFR and for first, second, third and fourth born fertility rates are variables log(Births),
log(Child1), log(Child2), log(Child3) and log(Child4) respectively.
As the discussion in the previous section based on Becker’s model demonstrates,
wages and the broader economic climate are likely to have an impact on fertility decisions of
households, specifically on the budget constraint of households. My proxies to reflect
changes in wages and the economic climate of Singapore will be GDP per capita at 2000
prices and unemployment rates. My independent variable to represent the former will be
variable log(GDP), found by taking the logarithm of GDP at 2000 prices per resident
population. Annual unemployment rate will be incorporated in the study as variable Unemp.
Using the model in the previous section, I also noted that infant mortality rates have
an impact on the number of live births expected as well. While infant mortality rates were
- 31 -
fairly low to begin with in 1980 where my study starts (about 1 in every 100), rates have
fallen drastically since then, to about 1 in every 500 in 2007. It can be argued then that the
fall in fertility rates could be somewhat attributed to the decreasing infant mortality rates. I
therefore include this data in my study under variable Mort.
As mentioned in the literature review, many papers on this topic have noted that a
major cause of changing fertility rates is the changing status of women in developed nations.
Singapore is no exception. This is a factor that Becker’s model did not take into
consideration. While it would have been ideal to include data on female wages across the
period of study in my empirical analysis, this data is unavailable. While not a perfect
indicator of the changing status of women in society and their increasing economic
independence, female labor force participation rate is data that I have access to that could
serve as a substitute statistic. I therefore include it in my analysis, as variable Fpart.
As Park noted in his study, the year of the Dragon in the Chinese zodiac is
traditionally an auspicious year that tends to cause an increase in the number of births,
especially among the Chinese majority; I have therefore included the dummy variable
Dragon to signal when these years occur. In addition, Saw notes that the year of the Tiger in
the Chinese zodiac is traditionally an inauspicious year that tends to cause a decrease in the
number of births among the Chinese; I therefore also included the dummy variable Tiger to
signal when these years occur.
Consider now the crucial variables of interest, those that relate to the Baby Bonus
Scheme. As mentioned, I will conduct regressions based both on dummy variables as well as
variables that indicate the monetary value accrued to parents under the scheme. The dummy
variable indicating when the Baby Bonus Scheme is in effect is variable BB, and dummy

- 32 -
variables that indicate when the scheme benefits parents of children of the first, second, third
and fourth birth orders are variables CB1, CB2, CB3 and CB4 respectively.
Consider now the variables that relate to the monetary values associated with the
Baby Bonus Scheme. The total possible amount that can be received by households from the
government changes as the Baby Bonus Scheme enters each new iteration. For convenience I
will use as my statistic the total possible amount that can be received by households under
the scheme: the sum of the cash gift and the maximum possible matching government
contribution to the CDA. Refer to Table 1 on page 5 for additional details. The variables that
will indicate the monetary values accruable to parents of children of the first, second, third
and fourth birth orders are variables Cash1, Cash2, Cash3 and Cash4 respectively. To
determine annually at the aggregate level the amount parents stand to receive under the
scheme, I will use the average value of financial incentives to be gained for parents of
children from the first to fourth birth orders. This variable CashBB will be used as a proxy
for the amount parents stand to gain under the Baby Bonus Scheme, and regressed against the
dependent variable log(Births).
It is arguable that aside from the variables already mentioned, other pro-natalist
policies implemented by the government during this period could possibly have an impact on
fertility decisions. There has been some debate about whether these other pro-natalist policies
have a significant impact on fertility rates. If they do, then factoring these policies into the
model would be essential but difficult. To mitigate for this scenario, I include a dummy
variable ProNat to indicate the period when pro-natalist policies were enforced (1987 to
present). This is the simplest and most logical method to account for these other policies.
While not an ideal means to accurately reflect the magnitude and efficacy of the other pro-
natalist policies that have been implemented, Park adopted the same methods in his study,
- 33 -
and Saw (2005) noted that the Baby Bonus Scheme is generally acknowledged to be the most
general, comprehensive and significant pro-natalist policy enacted by the government. Using
the variable ProNat as a proxy should be adequate.
The specifications for my analysis will also incorporate a time variable (variable Time)
and lags to take into account the fact that there is a delay between the implementation of a
scheme and the birth of babies in response to that change. The variables that I will induce a
one year lag on are log(GDP), Unemp, ProNat and the relevant Baby Bonus variable. Refer
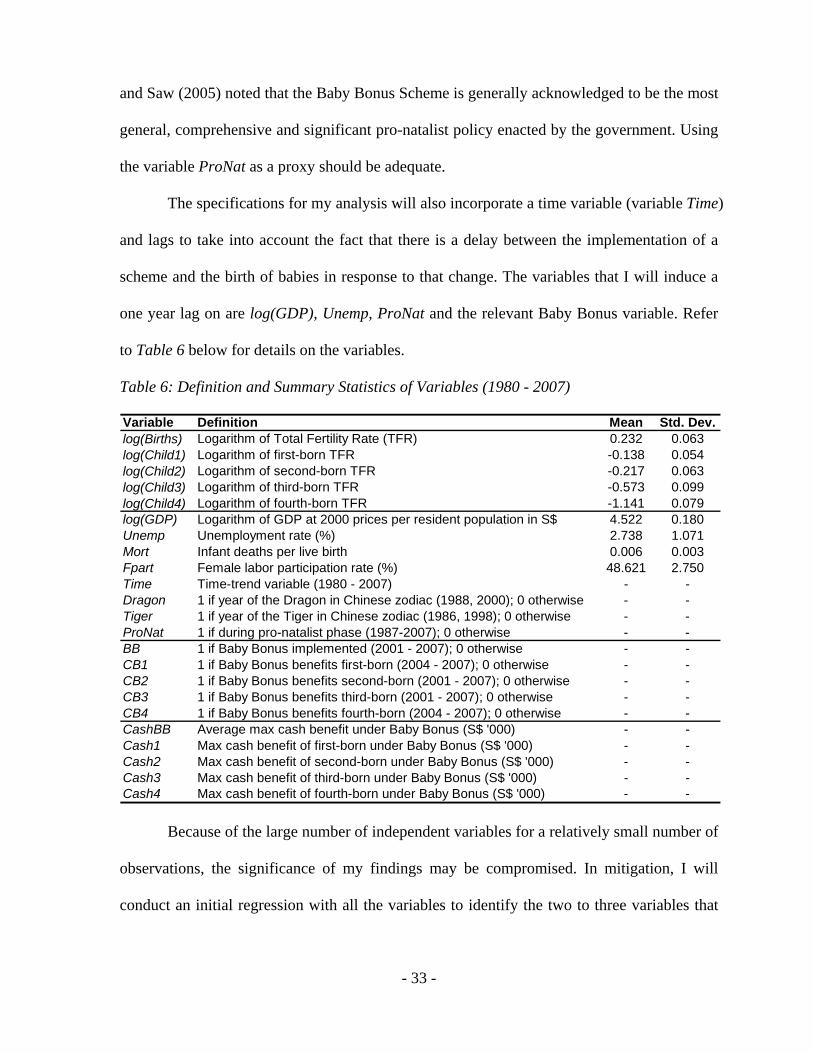
to Table 6 below for details on the variables.
Table 6: Definition and Summary Statistics of Variables (1980 - 2007)
Variable Definition Mean Std. Dev.log(Births) Logarithm of Total Fertility Rate (TFR) 0.232 0.063log(Child1) Logarithm of first-born TFR -0.138 0.054log(Child2) Logarithm of second-born TFR -0.217 0.063log(Child3) Logarithm of third-born TFR -0.573 0.099log(Child4) Logarithm of fourth-born TFR -1.141 0.079log(GDP) Logarithm of GDP at 2000 prices per resident population in S$ 4.522 0.180Unemp Unemployment rate (%) 2.738 1.071Mort Infant deaths per live birth 0.006 0.003Fpart Female labor participation rate (%) 48.621 2.750Time Time-trend variable (1980 - 2007) - -Dragon 1 if year of the Dragon in Chinese zodiac (1988, 2000); 0 otherwise - -Tiger 1 if year of the Tiger in Chinese zodiac (1986, 1998); 0 otherwise - -ProNat 1 if during pro-natalist phase (1987-2007); 0 otherwise - -BB 1 if Baby Bonus implemented (2001 - 2007); 0 otherwise - -CB1 1 if Baby Bonus benefits first-born (2004 - 2007); 0 otherwise - -CB2 1 if Baby Bonus benefits second-born (2001 - 2007); 0 otherwise - -CB3 1 if Baby Bonus benefits third-born (2001 - 2007); 0 otherwise - -CB4 1 if Baby Bonus benefits fourth-born (2004 - 2007); 0 otherwise - -CashBB Average max cash benefit under Baby Bonus (S$ '000) - -Cash1 Max cash benefit of first-born under Baby Bonus (S$ '000) - -Cash2 Max cash benefit of second-born under Baby Bonus (S$ '000) - -Cash3 Max cash benefit of third-born under Baby Bonus (S$ '000) - -Cash4 Max cash benefit of fourth-born under Baby Bonus (S$ '000) - -
Because of the large number of independent variables for a relatively small number of
observations, the significance of my findings may be compromised. In mitigation, I will
conduct an initial regression with all the variables to identify the two to three variables that
- 34 -
have the smallest significance, then conduct all regressions again, this time without these
independent variables with low statistical significance.
Data for my study comes mainly from the database of the Singapore Bureau of
Statistics. I worked with annual observations from 1980 to 2007, providing a total of 28
observations. A larger number of data points would have been preferred, but I was limited by
a lack of data for some of my variables.
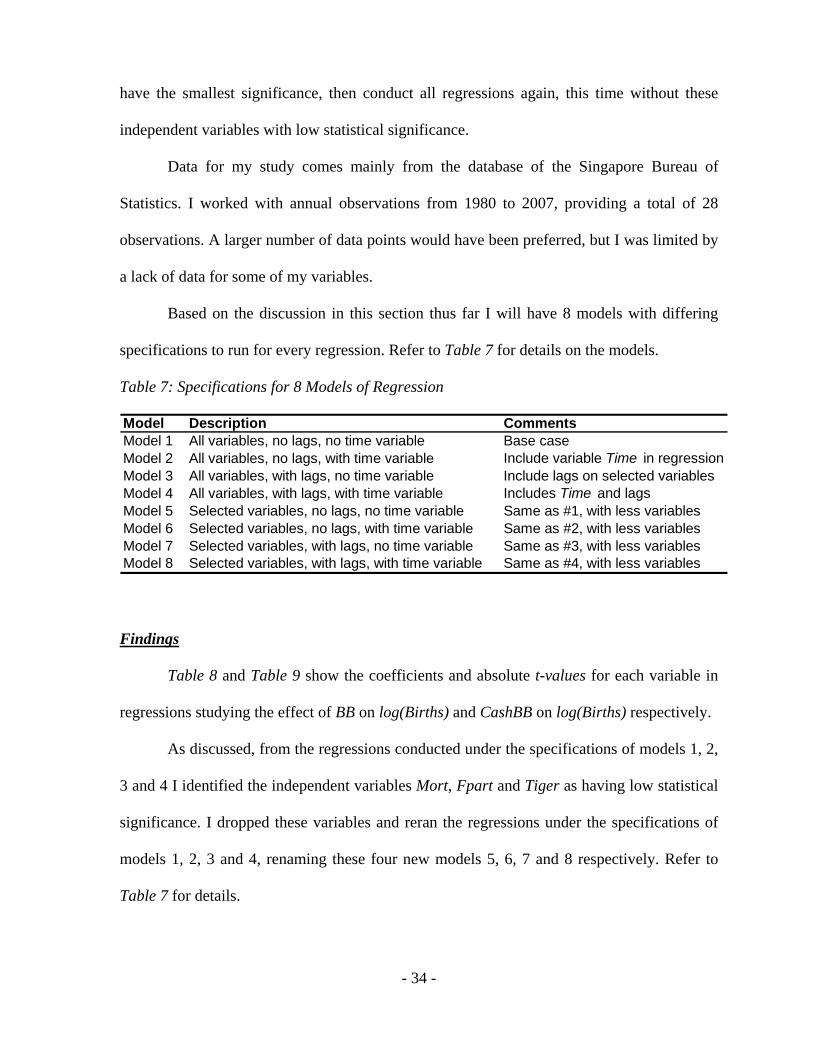
Based on the discussion in this section thus far I will have 8 models with differing
specifications to run for every regression. Refer to Table 7 for details on the models.
Table 7: Specifications for 8 Models of Regression
Model Description CommentsModel 1 All variables, no lags, no time variable Base caseModel 2 All variables, no lags, with time variable Include variable Time in regressionModel 3 All variables, with lags, no time variable Include lags on selected variablesModel 4 All variables, with lags, with time variable Includes Time and lagsModel 5 Selected variables, no lags, no time variable Same as #1, with less variablesModel 6 Selected variables, no lags, with time variable Same as #2, with less variablesModel 7 Selected variables, with lags, no time variable Same as #3, with less variablesModel 8 Selected variables, with lags, with time variable Same as #4, with less variables
Findings
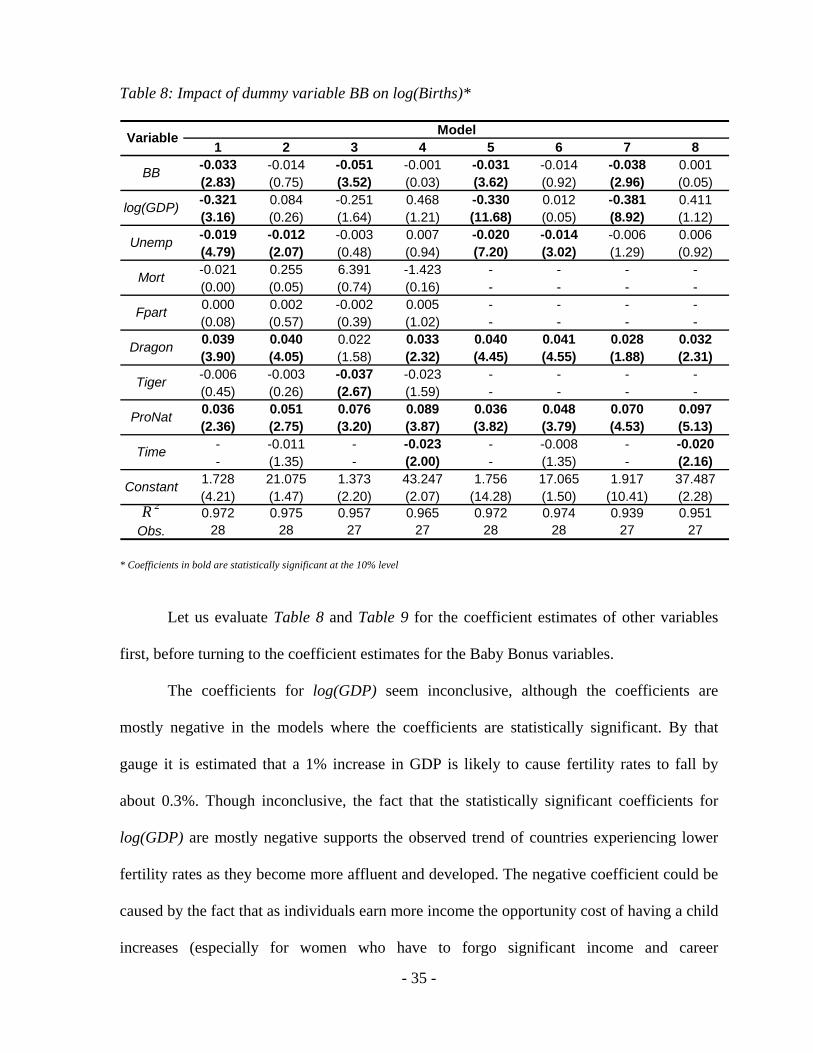
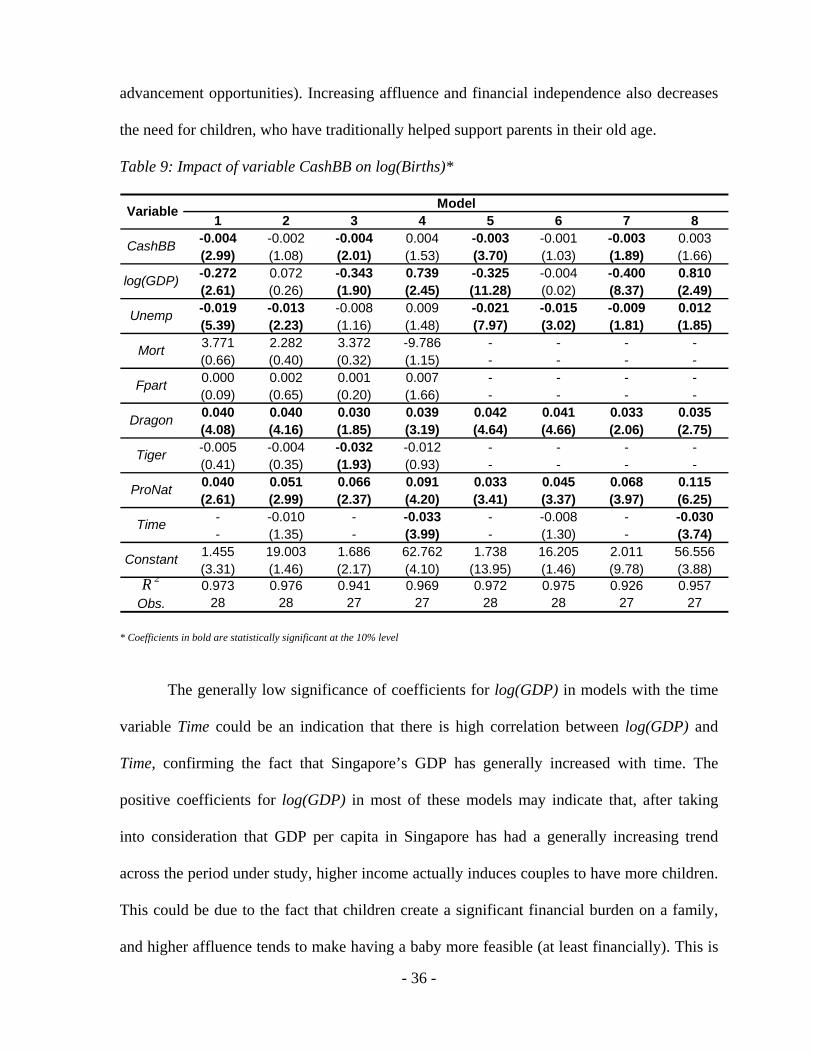
Table 8 and Table 9 show the coefficients and absolute t-values for each variable in
regressions studying the effect of BB on log(Births) and CashBB on log(Births) respectively.
As discussed, from the regressions conducted under the specifications of models 1, 2,
3 and 4 I identified the independent variables Mort, Fpart and Tiger as having low statistical
significance. I dropped these variables and reran the regressions under the specifications of
models 1, 2, 3 and 4, renaming these four new models 5, 6, 7 and 8 respectively. Refer to
Table 7 for details.
- 35 -
Table 8: Impact of dummy variable BB on log(Births)*
1 2 3 4 5 6 7 8-0.033 -0.014 -0.051 -0.001 -0.031 -0.014 -0.038 0.001(2.83) (0.75) (3.52) (0.03) (3.62) (0.92) (2.96) (0.05)-0.321 0.084 -0.251 0.468 -0.330 0.012 -0.381 0.411(3.16) (0.26) (1.64) (1.21) (11.68) (0.05) (8.92) (1.12)-0.019 -0.012 -0.003 0.007 -0.020 -0.014 -0.006 0.006(4.79) (2.07) (0.48) (0.94) (7.20) (3.02) (1.29) (0.92)-0.021 0.255 6.391 -1.423 - - - -(0.00) (0.05) (0.74) (0.16) - - - -0.000 0.002 -0.002 0.005 - - - -(0.08) (0.57) (0.39) (1.02) - - - -0.039 0.040 0.022 0.033 0.040 0.041 0.028 0.032(3.90) (4.05) (1.58) (2.32) (4.45) (4.55) (1.88) (2.31)-0.006 -0.003 -0.037 -0.023 - - - -(0.45) (0.26) (2.67) (1.59) - - - -0.036 0.051 0.076 0.089 0.036 0.048 0.070 0.097(2.36) (2.75) (3.20) (3.87) (3.82) (3.79) (4.53) (5.13)
- -0.011 - -0.023 - -0.008 - -0.020- (1.35) - (2.00) - (1.35) - (2.16)
1.728 21.075 1.373 43.247 1.756 17.065 1.917 37.487(4.21) (1.47) (2.20) (2.07) (14.28) (1.50) (10.41) (2.28)
R 2 0.972 0.975 0.957 0.965 0.972 0.974 0.939 0.951Obs. 28 28 27 27 28 28 27 27
Variable Model
BB
log(GDP)
Unemp
Mort
Fpart
Dragon
Tiger
ProNat
Time
Constant
* Coefficients in bold are statistically significant at the 10% level
Let us evaluate Table 8 and Table 9 for the coefficient estimates of other variables
first, before turning to the coefficient estimates for the Baby Bonus variables.
The coefficients for log(GDP) seem inconclusive, although the coefficients are
mostly negative in the models where the coefficients are statistically significant. By that
gauge it is estimated that a 1% increase in GDP is likely to cause fertility rates to fall by
about 0.3%. Though inconclusive, the fact that the statistically significant coefficients for
log(GDP) are mostly negative supports the observed trend of countries experiencing lower
fertility rates as they become more affluent and developed. The negative coefficient could be
caused by the fact that as individuals earn more income the opportunity cost of having a child
increases (especially for women who have to forgo significant income and career
- 36 -
advancement opportunities). Increasing affluence and financial independence also decreases
the need for children, who have traditionally helped support parents in their old age.
Table 9: Impact of variable CashBB on log(Births)*
1 2 3 4 5 6 7 8-0.004 -0.002 -0.004 0.004 -0.003 -0.001 -0.003 0.003(2.99) (1.08) (2.01) (1.53) (3.70) (1.03) (1.89) (1.66)-0.272 0.072 -0.343 0.739 -0.325 -0.004 -0.400 0.810(2.61) (0.26) (1.90) (2.45) (11.28) (0.02) (8.37) (2.49)-0.019 -0.013 -0.008 0.009 -0.021 -0.015 -0.009 0.012(5.39) (2.23) (1.16) (1.48) (7.97) (3.02) (1.81) (1.85)3.771 2.282 3.372 -9.786 - - - -(0.66) (0.40) (0.32) (1.15) - - - -0.000 0.002 0.001 0.007 - - - -(0.09) (0.65) (0.20) (1.66) - - - -0.040 0.040 0.030 0.039 0.042 0.041 0.033 0.035(4.08) (4.16) (1.85) (3.19) (4.64) (4.66) (2.06) (2.75)-0.005 -0.004 -0.032 -0.012 - - - -(0.41) (0.35) (1.93) (0.93) - - - -0.040 0.051 0.066 0.091 0.033 0.045 0.068 0.115(2.61) (2.99) (2.37) (4.20) (3.41) (3.37) (3.97) (6.25)
- -0.010 - -0.033 - -0.008 - -0.030- (1.35) - (3.99) - (1.30) - (3.74)
1.455 19.003 1.686 62.762 1.738 16.205 2.011 56.556(3.31) (1.46) (2.17) (4.10) (13.95) (1.46) (9.78) (3.88)
R 2 0.973 0.976 0.941 0.969 0.972 0.975 0.926 0.957Obs. 28 28 27 27 28 28 27 27
Fpart
Dragon
Tiger
ProNat
Time
Constant
Variable Model
CashBB
log(GDP)
Unemp
Mort
* Coefficients in bold are statistically significant at the 10% level
The generally low significance of coefficients for log(GDP) in models with the time
variable Time could be an indication that there is high correlation between log(GDP) and
Time, confirming the fact that Singapore’s GDP has generally increased with time. The
positive coefficients for log(GDP) in most of these models may indicate that, after taking
into consideration that GDP per capita in Singapore has had a generally increasing trend
across the period under study, higher income actually induces couples to have more children.
This could be due to the fact that children create a significant financial burden on a family,
and higher affluence tends to make having a baby more feasible (at least financially). This is
- 37 -
in line with the prediction made by the utility model in an earlier section that children are
normal goods (greater consumption of good as income increases). In labor economic theory,
this is a scenario where an increase in income leads to an income effect that outweighs the
substitution effect.
Turning to the coefficient on Unemp, we find that most coefficient estimates are
negative, and that this is true for almost all estimates that are statistically significant. The
coefficients estimate that a 1 percentage point increase in unemployment rate causes fertility
rates to fall by about 1-2%. This provides evidence that as unemployment rates increase the
fertility rates decline. Since variable Unemp gives an indication not only of the employment
situation in Singapore but also of the broader economic landscape and sentiment, these
results suggest that during economic downturns parents tend to have less children. This is
logical, since raising children when economic conditions are bad is more difficult, all things
being equal. As mentioned, the high statistical significance of the economic variables –
log(GDP) and Unemp – strongly suggest that Singapore’s fertility rate is closely tied to
Singapore’s economic conditions.
The coefficient estimates for Mort are all statistically insignificant and have varying
directions and magnitudes. This suggests that infant mortality may not be a significant factor
influencing Singapore fertility rates during the period of study. As discussed, this is not
surprising given that Singapore's infant mortality rate has been fairly low throughout the
period of study, and has generally displayed a steadily decreasing trend. The impact on
fertility rates caused by changing infant mortality rates would likely have been much more
significant if infant mortality rates were higher.
The coefficient estimates for Fpart are all statistically insignificant and have varying
directions, though all with relatively small magnitudes. This suggests that female labor
- 38 -
participation rates may not be a significant factor influencing Singapore fertility rates during
the period of study. This strikes me as surprising, given the emphasis that has been placed on
the impact the changing role of women in society has on fertility rates. As mentioned, this
may be due to the fact that female labor participation rate is not a good indicator of this
changing role of women. While there was a time in the past when the increase in female
labor participation signaled the changing role of women in society, it is my hypothesis that
female labor participation rates have now steadied; a more accurate proxy for the
continuously changing role of women in Singapore society today could be female wages. As
mentioned however, this data was not available to me.
The coefficient estimates for Dragon are all positive, and almost all of them are
statistically significant. It estimates that fertility rates would have been about 3-4% lower had
it not been the Dragon year. This seems to clearly suggest that Singaporean families do try to
have more babies during the year of the Dragon in the Chinese zodiac, as predicted.
Conversely, the coefficient estimates for Tiger are all negative, albeit hardly ever statistically
significant. This shows that there is limited evidence to support the prediction that
Singaporean families try to avoid having babies during the “inauspicious” year of the Tiger
in the Chinese zodiac.
The coefficient estimates for variable ProNat are all positive and all statistically
significant. This is strong evidence to suggest that aside from the Baby Bonus Scheme, the
other pro-natalist policies enacted by the government have been somewhat successful. While
these pro-natalist policies may not have been able to raise the fertility rates to above
replacement levels, this indicates that it is highly likely that without these policies fertility
rates would have been even lower. This result however raises the question of whether the
Baby Bonus Scheme truly is the most important and effective policy implemented by the
- 39 -
government, or whether other pro-natalist policies have a larger effect on fertility rates than
the Baby Bonus Scheme does.
The time trend coefficient is, unsurprisingly, estimated to be negative in all models,
though it is not always statistically significant. It suggests that fertility rates would have
dropped yearly by about 1-3%, ceteris paribus. It is worth noting as well that the models
seem to fit the data very well, with high R2 values ranging from 0.93 to 0.98.
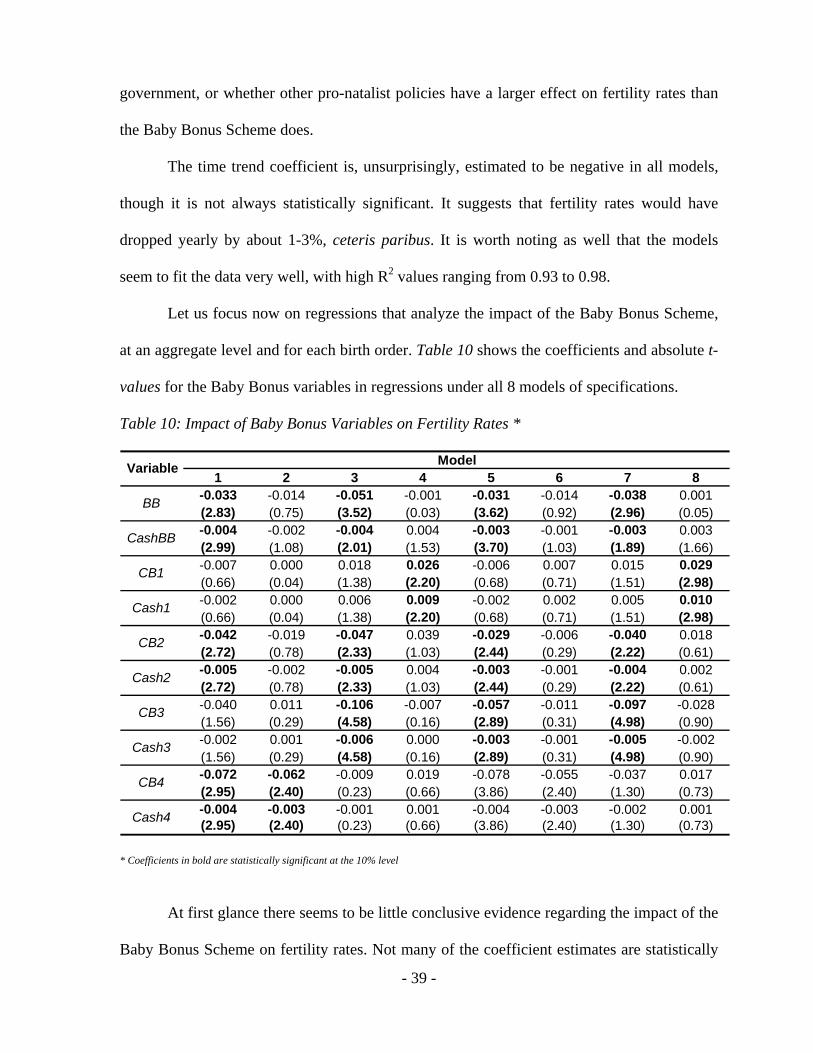
Let us focus now on regressions that analyze the impact of the Baby Bonus Scheme,
at an aggregate level and for each birth order. Table 10 shows the coefficients and absolute t-
values for the Baby Bonus variables in regressions under all 8 models of specifications.
Table 10: Impact of Baby Bonus Variables on Fertility Rates *
1 2 3 4 5 6 7 8-0.033 -0.014 -0.051 -0.001 -0.031 -0.014 -0.038 0.001(2.83) (0.75) (3.52) (0.03) (3.62) (0.92) (2.96) (0.05)-0.004 -0.002 -0.004 0.004 -0.003 -0.001 -0.003 0.003(2.99) (1.08) (2.01) (1.53) (3.70) (1.03) (1.89) (1.66)-0.007 0.000 0.018 0.026 -0.006 0.007 0.015 0.029(0.66) (0.04) (1.38) (2.20) (0.68) (0.71) (1.51) (2.98)-0.002 0.000 0.006 0.009 -0.002 0.002 0.005 0.010(0.66) (0.04) (1.38) (2.20) (0.68) (0.71) (1.51) (2.98)-0.042 -0.019 -0.047 0.039 -0.029 -0.006 -0.040 0.018(2.72) (0.78) (2.33) (1.03) (2.44) (0.29) (2.22) (0.61)-0.005 -0.002 -0.005 0.004 -0.003 -0.001 -0.004 0.002(2.72) (0.78) (2.33) (1.03) (2.44) (0.29) (2.22) (0.61)-0.040 0.011 -0.106 -0.007 -0.057 -0.011 -0.097 -0.028(1.56) (0.29) (4.58) (0.16) (2.89) (0.31) (4.98) (0.90)-0.002 0.001 -0.006 0.000 -0.003 -0.001 -0.005 -0.002(1.56) (0.29) (4.58) (0.16) (2.89) (0.31) (4.98) (0.90)-0.072 -0.062 -0.009 0.019 -0.078 -0.055 -0.037 0.017(2.95) (2.40) (0.23) (0.66) (3.86) (2.40) (1.30) (0.73)-0.004 -0.003 -0.001 0.001 -0.004 -0.003 -0.002 0.001(2.95) (2.40) (0.23) (0.66) (3.86) (2.40) (1.30) (0.73)
CB2
Cash2
CB3
Cash3
CB4
Cash4
Variable Model
BB
CashBB
CB1
Cash1
* Coefficients in bold are statistically significant at the 10% level
At first glance there seems to be little conclusive evidence regarding the impact of the
Baby Bonus Scheme on fertility rates. Not many of the coefficient estimates are statistically
- 40 -
significant, and surprisingly among those that are almost all of them return a negative
estimate for the coefficient, suggesting that the implementation of the Baby Bonus Scheme
has caused a decrease in fertility rates among Singaporeans at an aggregate level as well as
for each birth order, except perhaps for the first-born. It is also worth noting that the models
that incorporate the time variable Time (models 2, 4, 6 and 8) tend to return statistically
insignificant coefficient estimates. This leads me to conclude that the Baby Bonus Scheme
has limited impact on fertility rates at the aggregate level as well as for each birth order, once
we take into account the downward trend of fertility rates over time.
Going more in-depth into each coefficient, we find that the variables representing the
impact of the scheme at an aggregate level, BB and CashBB, tend to return negative values.
They estimate that at an aggregate level, the implementation of the Baby Bonus Scheme
causes fertility rates to fall by 3 – 5%, and that each S$1,000 increase in financial incentive
given out under the scheme causes fertility rates to fall by 0.3 – 0.4%.
The coefficient estimates for the other variables, representing impact of the scheme
for each birth order, return mainly negative values, except for those related to the first birth
order. This is in contrast to the findings of Buttner and Lutz in 1990, where they concluded
that the impact of financial incentives is positive for all birth orders other than the first. One
way to explain this is that parents who have had their first child already are more likely to
have decided independent of government influence whether they intend to raise additional
children or not, since they have more complete information on the costs and benefits of
raising children. They are thus less likely to have their decision affected by the incentives
offered by the scheme. Households without any children however are more likely to be
enticed into having children by the presence of any additional incentives, and thus are
arguably more susceptible to having their fertility decisions affected by the scheme.
- 41 -
It is worth noting that the coefficient estimates for variables relating to the second and
third birth orders are more likely to be statistically significant, perhaps owing to the fact that
the scheme has impacted having a second and third child for a longer time (since 2001) than
it has for having a first and fourth child (since 2004), and there clearly is a lag between the
time a policy is implemented and when families actually make fertility decisions based on
these new policies, possibly for more than the 1 year that I allowed for in my regressions.
While the results of my empirical study appear inconclusive, it is worth noting that
models 4 and 8 are likely to be the most accurately specified models, since they include both
the time variable Time and lags on certain variables in their specifications. Focusing on the
results of the regressions ran under models 4 and 8, it appears that the coefficient estimates
under those specifications tend to be positive, albeit statistically insignificant. This is a good
indicator that pro-natalist policies like the Baby Bonus Scheme generally have a positive but
small and statistically insignificant impact on fertility rates. An analysis of the trends in total
fertility rates in Singapore across time (refer to Graph 1 in earlier section) suggests that a
decrease in fertility rates persisted after the implementation of pro-natalist policies in 1987,
but at a significantly slower rate than before. This seems to imply that without pro-natalist
policies like the Baby Bonus Scheme, Singapore’s fertility rate would likely have fallen to an
even lower level than they currently are at. The conclusion that pro-natalist policies in a
developed country like Singapore has positive but limited impact on fertility rates is also in
line with the conclusion reached by a majority of papers done in this field.
Conclusions, Caveats and Suggestions for Further Study
It appears from the results of my study that there is some evidence that the Baby
Bonus Scheme has a slightly positive but statistically insignificant impact on fertility rates,
- 42 -
although it is also arguable that the results reflect an ambiguous direction of impact of the
scheme on fertility rates. It is at least likely to be true that without the Baby Bonus Scheme
and other pro-natalist policies the fertility rates would have been even lower than they
currently are. The results however are by no means conclusive.
There are several possible reasons for inaccuracies in my study, and areas for further
investigation. Firstly, not all children born in Singapore allow their parents to be eligible for
benefits under the Baby Bonus Scheme, and some children born to Singapore citizens outside
of the country may be eligible for benefits. This would introduce discrepancies into the
analysis. I would also be more confident with my results if I had more observations to work
with (only 28 observations from 1980 to 2007 due to lack of data for earlier years).
From a more technical perspective, further studies may attempt to take into
consideration possible correlation between independent variables (between log(GDP),
Unemp, and Fpart for example), and the inclusion of interactive terms for additional insight
and accuracy. Studies using panel data, with specific information on households and their
income level, education level, fertility decisions etc are also likely to yield more accurate
results, though such data may be difficult to gather on a large scale.
I would be more confident with my results if I could get data on female wages across
the period of study, instead of just the female labor participation rates. As discussed female
wages would act as a better proxy for the changing role of women in society, and the
estimate of the coefficients on that variable would be a more accurate indicator of the impact
of that change on fertility rates. It would also have been ideal if I could get data estimating
the cost of raising a child in Singapore, and how that has changed with time.
Worth noting as well is the fact that there are a multitude of other pro-natalist policies
that the Singapore government has implemented since the pro-natalist phase began in 1987.
- 43 -
As discussed, while the Baby Bonus Scheme has been widely accepted as the most
significant and effective pro-natalist policy that the Singapore government has implemented,
it is very possible that some of the other policies implemented could together have a much
more significant impact on fertility rates than the Baby Bonus Scheme alone. This seems to
be suggested by the positive and statistically significant coefficient estimates for variable
ProNat that were found in my empirical study. More research into the effects of these other
pro-natalist policies would have been ideal.
In conclusion, there appears to be some reason to believe that the Baby Bonus
Scheme is yielding results in Singapore, though the results are generally small and not
conclusive. Further studies have to be done to better understand the effects of pro-natalist
policies in Singapore and in other countries. The dwindling fertility rates seen in developed
countries like Singapore should certainly be a cause for concern among policy makers. This
trend, ironically a result of the success and affluence of a country, has to be stopped or
reversed for these countries to continue thriving and maintaining the high standards of living
that they have achieved thus far. Fertility decisions are however fundamentally a function of
the mindset of the population towards having offspring; changing that mindset, illustrated in
a utility model as an alteration of the shape and form of the indifference curve, may require
more than just monetary incentives.
44
References
Atkinson, A.B, “On Intergenerational Income Mobility,” Journal of Post Keynesian
Economics, 3 (1981), pp. 194 – 218.
Bachi, Roberto, “Low Fertility in Industrial Countries: Causes, Consequences, Policies,”
Annals of the New York Academy of Sciences, Vol. 610 (1990), pp. 83 – 96.
Becker, Gary S., "An Economic Analysis of Fertility," Demographic and Economic Change
in Developed Countries (1960), pp. 209 – 231.
Buttner, T., and W. Lutz, “Estimating Fertility Responses to Policy Measures in the German
Democratic Republic,” Population and Development Review, 16:3 (1990), pp. 539–555.
Cohen, Alma, Rajeev Dehejia, and Dmitri Romanov, “Do Financial Incentives Affect
Fertility?” National Bureau of Economic Research (12/2007), working paper 13700.
Dearden, L., S. Machin, and H. Reed, “Intergenerational Mobility in Britain,” Economic
Journal, 107 (1997), pp. 47 – 66.
Demeny, Paul, "Pronatalist Policies in Low-Fertility Countries: Patterns, Performance, and
Prospects," Population and Development Review 12 (1986), pp. 335 – 358.
Drakakis-Smith, David, Elspeth Graham, Peggy Teo, and Ooi Giok Ling, "Singapore:
Reversing the Demographic Transition to Meet Labor Needs," Scottish Geographical
Journal 109:3 (1993), pp. 152 – 163.
Ermisch, John, and Marco Francesconi, “Family Matters: Impacts of Family Background on
Educational Attainments,” Economica 68 (2001), pp. 137 – 156.
Gauthier, Anne Helene, and Jan Hatzius, "Family Benefits and Fertility: An Econometric
Analysis," Population Studies 51:3 (1997), pp. 295 – 306.
45
Georgellis, Y., and H.J. Wall, “The Fertility Effect of Dependent Tax Exemptions: Estimates
for the United States,” Applied Economics, 24:10 (1992), pp. 1139–1145.
Gohmann, S.F., and R.L. Ohsfeldt, “The Dependent Tax Exemption, Abortion Availability,
and US Fertility Rates,” Population Research and Policy Review, 13:4 (1994), pp. 367–
381.
Graham, Elspeth, Peggy Teo, Brenda S. A. Yeoh, and Susan Levy, "Reproducing the Asian
Family Across the Generations: ‘Tradition’, Gender and Expectations in Singapore,"
Asia-Pacific Population Journal 17:2 (2002), pp. 61 – 86.
Huang, J.-T, “Personal Tax Exemption: The Effect on Fertility in Taiwan,” The Developing
Economies, 40:1 (2002), pp. 32–48.
Park, Cheolsung, "How Effective are Pronatalist Benefits? A Literature Survey and a Study
on Singapore's Qualified Child Relief," The Singapore Economic Review 50:1, pp. 9 – 23.
Preston, Samuel H., and Caroline Hartnett, “The Future of American Fertility,” National
Bureau of Economic Research (11/2008), working paper 14498.
Sacerdote, Bruce, and James Feyrer, “Will the Stork Return to Europe and Japan?
Understanding Fertility within Developed Nations,” National Bureau of Economic
Research (6/2008), working paper 14114.
Saw, Swee-Hock, “Population Policies and Programmes in Singapore,” Institute of Southeast
Asian Studies (2005), ISBN 981-230-318-9.
Teo, Peggy, and Brenda S. A. Yeoh, "Interweaving the Public and the Private: Women's
Responses to Population Policy Shifts in Singapore," International Journal of Population
Geography 5:2 (1999), pp. 79 – 96.
46
Whittington, Leslie A., J. Alm, and H.E. Peters, “Fertility and the Personal Exemption:
Implicit Pronatalist Policy in the United States,” American Economic Review, 80:3
(1990), pp. 545–556.
Whittington, Leslie A., "Taxes and the Family: The Impact of the Tax Exemption for
Dependents on Marital Fertility," Demography 29:2 (1992), pp. 215 – 226.
Winegarden,C.R. and P.M. Bracy, “Demographic Consequences of Maternal-Leave
Programs in Industrial Countries: Evidence from Fixed-Effects Models,” Southern
Economic Journal, 61:4 (1995), pp. 1020–1035.
Wong, Theresa, and Brenda S. A. Yeoh, "Fertility and the Family: An Overview of Pro-
Natalist Population Policies in Singapore," Asian MetaCentre Research Paper Series
Number 12 (2003).
Zhang, J., J. Quan, and P.V. Meerbergen, “The Effect of Tax-Transfer Policies on Fertility in
Canada, 1921–88,” Journal of Human Resources, 29:1 (1994), pp. 181–201.