Embed Size (px)
Citation preview
1
This draft: December 31, 2010
The banking bailout of the subprime crisis: big commitments and small effects?
by
Michele Fratianni* and Francesco Marchionne**
Abstract
This paper examines government policies aimed at rescuing banks from the effects of the financial crisis of 2008-2009. Governments responded to the crisis by guaranteeing bank assets and liabilities and by injecting fresh capital into troubled institutions. We employ event study methodology to estimate the benefits of government interventions on banks. Announcements directed at the banking system as a whole were associated with positive cumulative abnormal returns whereas announcements directed at specific banks with negative ones. The effects of foreign general announcements spilled over across different areas and were perceived by home-country banks as subsidies boosting the competitive advantage of foreign banks. Specific announcements produced effects that were consistent with other banks being crowded out for government resources. Multiple specific announcements exacerbated the extent of banks’ moral hazard. Results were sensitive to the information environment. Findings are consistent with the hypothesis that individual institutions were reluctant to seek public assistance. JEL Classification: G01, G21, N20 Keywords: announcement, bank, event study, financial crisis, rescue plan. * Corresponding author, Indiana University, Kelley School of Business, Bloomington, Indiana (USA), Università Politecnica delle Marche and MoFiR, Ancona (Italy), email: [email protected]. ** Università Politecnica delle Marche and MoFiR, Ancona (Italy), email: [email protected].
2
INTRODUCTION
The financial earthquake of the subprime crisis, starting in 2007 and further developing in the
subsequent two years, generated a tsunami of public interventions into banking systems. In this paper,
we examine government policies aimed at rescuing banks from the effects of this crisis. To delimit
the scope of the analysis, we concentrate on the fiscal side of interventions and ignore, by design, the
monetary policy reaction to the crisis (in essence, we ignore inflation as a possible exit strategy).
The subprime crisis fits many of the characteristics of the credit-boom-and-bust-cycle
hypothesis, discussed, among others, by Mitchell (1913), Fisher (1933), Minsky (1977) and
Kindleberger (1978); for a review, see Fratianni (2008). Other characteristics, instead, are unique to
this crisis, such as the transfer of assets from the balance sheets of banks to the markets, the creation
of complex and opaque assets, the failure of ratings agencies to properly assess the risk of such
assets, and the application of fair value accounting. The “originate-to-distribute” bank model lowered
the incentive of the originator to screen debtors whose loans were to be placed off balance sheet.
While reputational considerations would suggest that the originator might not want to compromise its
standards, the fact that regulators and accounting standards required little disclosure about
unconsolidated off-balance sheet entities made these entities opaque to investors and lowered the cost
of reputational loss to the sponsoring institution. To complicate matters, the ratings agencies were not
up to the task of properly evaluating the new complex products (Calomiris 2007). In fact, there is
evidence that credit standards deteriorated in the United States during the 2001-2007 credit boom,
especially in the subprime mortgage market (Demyanyk and van Hembert 2009; Dell’Ariccia et al.
2008). Another problem with the “originate-to-distribute” model stems from the contingency that the
off-balance sheet entities could be reabsorbed by the sponsoring institution to either cover large
trading losses or prevent a downgrade of the sponsored institution’s credit risk (IMF 2008a, Box 2.6).
At that point, there would be a reversal of the intended benefits of the “originate-to-distribute” model:
3
risk would return home and regulatory capital would rise. The investor, having finally gained
transparency in the transaction, would judge correctly that the sponsoring bank was overleveraged
and would demand a higher return on capital; this, in turn, would translate into a spot drop of the
share price of the consolidated bank.
Governments have intervened massively and repeatedly to support banks during the crisis. We
examine the effectiveness of these interventions by measuring the markets’ reaction to intervention
announcements. To do so, we create an original dataset of public interventions that distinguishes
announcements directed at the banking system as a whole (general announcements) from those
directed at specific banks (specific announcements). With this dataset, we apply event-study
methodology to estimate the value of government interventions to support banks and their
shareholders. The maintained hypothesis is that the announcement of a rescue plan is credible if it
affects rates of return of the targeted banks. We test for these effects by computing cumulative
abnormal returns (CAR) of the participating banks around a window that includes announcement
dates. We perform four separate tests on our sample of large banks. One test estimates, with panel
data, the overall impact on banks’ equity value of the two types of government rescue
announcements; a second estimates cross-area spillover effects of general announcements; a third
estimates cross-bank spillover effects of specific announcements using US banks; and a fourth
considers the impact of multiple specific announcements.
Our findings show that general and specific announcements are priced by the markets as CAR
over the selected window periods. General announcements tend to be associated with positive CAR
and specific announcements with negative ones. Foreign general announcements exert cross-area
spillovers, but are perceived by home-country banks as boosting the competitive advantage of foreign
banks. Specific announcements exert spillovers on other banks. Our results are also sensitive to the
information environment. Specific announcements tend to exert a positive impact on rates of return
4
before the crisis erupts, when announcements are few and markets have relative confidence in the
“normal” information flow. The opposite takes place when the crisis explodes, announcements are
the order of the day and markets mistrust the information flow. These results appear consistent with
the observed reluctance of individual institutions to seek public assistance. Bank size is priced
positively by the markets, but there is no clear evidence of too-big-to-fail policy. Specific
announcements exacerbate moral hazard of subsided banks and make the banking system more
fragile to negative shocks and less sensitive to further injections of public funds.
The paper is organized as follows. Section 2 describes the market reaction to the crisis and
shows that Lehman Brothers’ failure was a critical event. Section 3 reviews event-study methodology
with a focus on the event-parameter application within a regression framework. Section 4 describes
our testable models. Section 5 reviews the long list of government announcements to rescue banks
and discusses our dataset. We show that governments have employed a mixture of capital injections
and bank asset and debt guarantees, and that opaque but politically attractive guarantees have been
dominant. Section 6 employs event-study methodology to estimate the impact of government
interventions on banks and their shareholders. Conclusions are drawn in the last section.
1. MARKETS’ REACTION TO LIQUIDITY RUSH AND RISK REPRIC ING
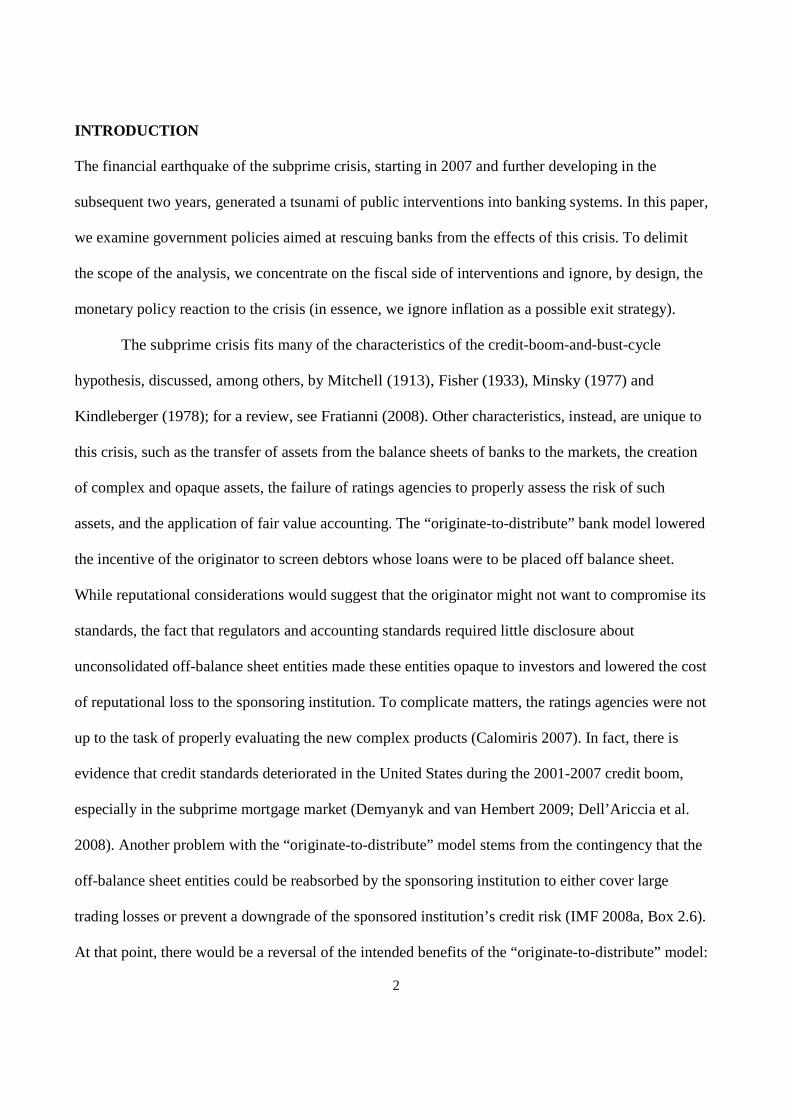
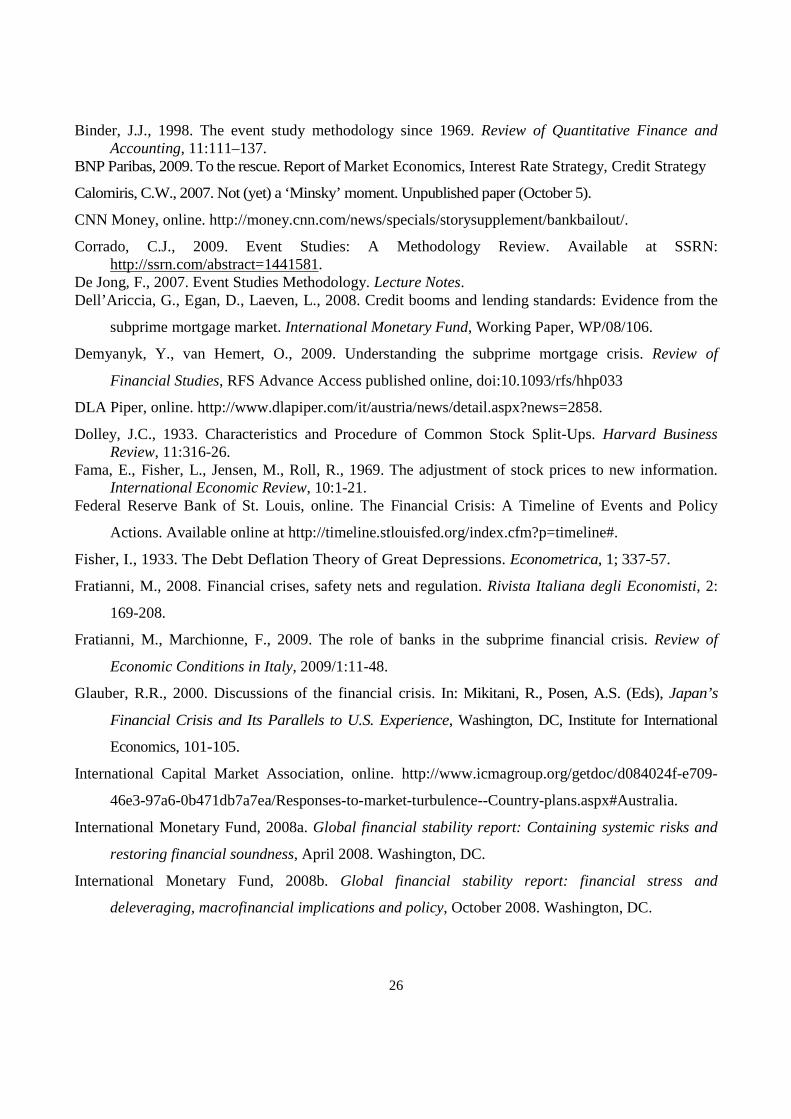
The first effect of the crisis on the market was a rush for liquidity due to risk repricing of assets. The
liquidity crisis exploded in the interbank market in August of 2007. Figure 1 plots TED spreads –the
difference between the three-month LIBOR and the three-month Treasury bill– during the entire
subprime crisis for three areas of the world: the United States, Europe and the Pacific region. Under
5
ordinary times, this spread is contained within 20 to 30 basis points.1 From September 15 (the day
when Lehman declared bankruptcy) to October 14, 2008, the US TED spread averaged over 300 basis
points; on October 10, 2008, the Friday that ended a historic week of panic selling in the equity
markets, it reached an all-time peak of 464 basis points. A similar story holds for the TED-equivalent
spreads of the large European countries and Hong Kong. Japan, on the other hand, stands out as a
country of moderate risk. On March 9, 2009, the bottom of stock market value, the TED spread had
regained the pre-crisis level in the United States, United Kingdom and Hong Kong, but not in Europe
where the risk remained high for additional three months.
[Insert Figure 1 here]
The markets were gripped by fears of credit and liquidity risks, two risks distinguishable in
theory, but not in practice (IMF 2008b, pp. 78-81). The massive injections of monetary base by central
banks were ineffective in containing the spreads in the interbank market because market participants
were worried about large credit risks and adverse selection, and could not separate liquidity from credit
risk concerns. Spreads relative to yields on government bonds shot up across all maturities (IMF
2008b, pp. 172-3).2 The switch in the public’s degree of risk aversion was justified by the mounting
difficulty of gathering reliable information on opaque clients in times of distress. Confronted with
more uncertainty in assessing the true credit status of relatively opaque borrowers, creditors had no
better method than applying higher interest rates to entire classes of borrowers. The fog shrouding
banks’ balance sheets and the financial markets was reinforced by opaque accounting practices
(Fratianni and Marchionne 2009).3
1 At the peak of the Mexican crisis of 1994-95 and the South-East Asian financial crisis of 1997, the TED spread rose to approximately 60 basis points. In the Gulf War and the crisis of Long Term Capital Management, it peaked at approximately 120 basis points. 2 See Mishkin (1991) for historical evidence from the 19th and 20th century US panics. 3 To illustrate, according to reported accounting data, the US banking system did not appear severely undercapitalized: at the end of 2008, the ratio of Tier 1 or core capital to risk-weighted assets was 17.4 percent for small banks, 12.3 percent for intermediate banks, and 9.4 percent for large banks. These ratios are way above the benchmark of 4 percent. Yet, it was
6
The shrinking of balance sheets and the re-pricing of risk across a variety of assets triggered a
process of deleveraging, as predicted by the credit-boom-and-bust hypothesis. From the second half of
2007 through September 2008, deleveraging of global banks was met with $430 billion of fresh capital
(IMF 2008b, p. 22). Then, with recapitalization becoming increasingly difficult, deleverage was
achieved by selling assets in illiquid markets. Thus, without significant profits to retire debt or fresh
capital to finance it, the deleveraging process necessarily implied distress sales and falling asset values
(Adrian and Shin 2008, Figure 2.5). Fair value accounting aggravated the problem through its pro-
cyclical bias. Lower accounting asset prices impacted negatively on regulatory capital and may have
pushed bankers to engage in liquidation sales that further depressed asset prices.
Stock market data show the extent of the financial maelstrom. We collect equity prices for a
sample of banks from three areas of the world: the United States, Western Europe, and the Pacific
region. The actual list, shown in the Table A1 of the Appendix, includes 45 US banks, 51 banks from
15 different Western European countries, and 26 banks from three different Pacific region countries;
more on our data below.4 The listed banks tend to be large and thus capable of engaging in complex
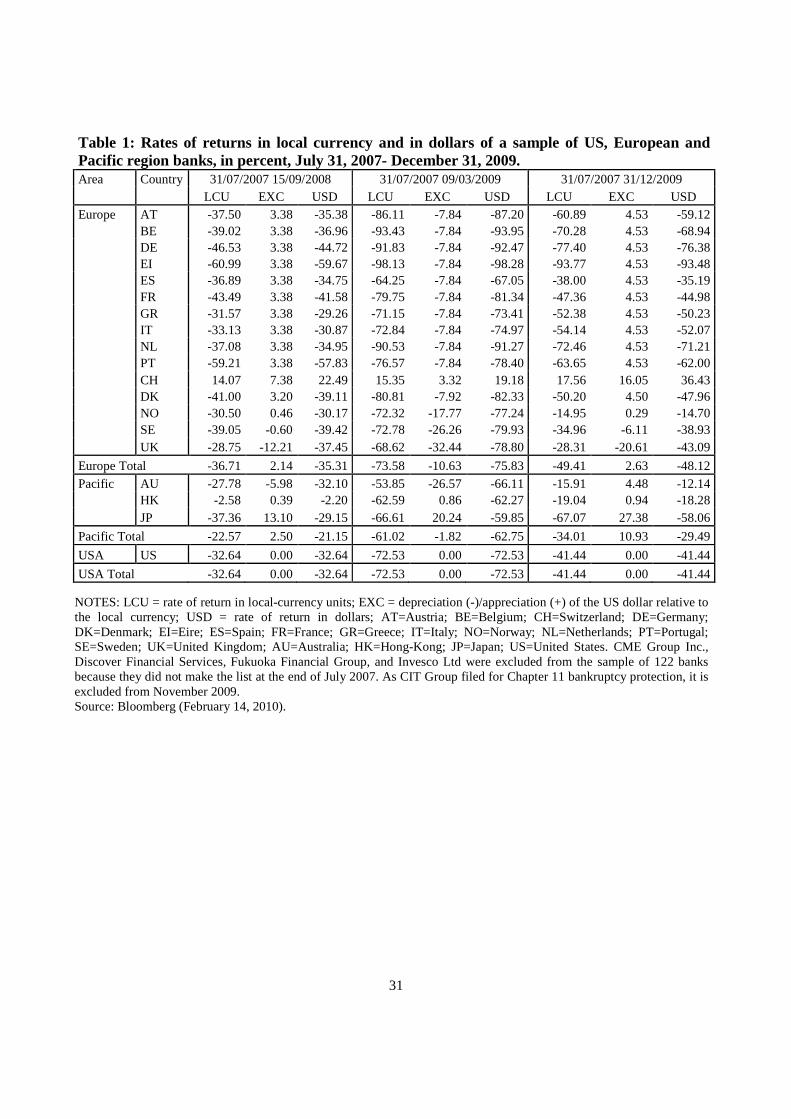
structured finance. Table 1 provides average rates of return, both in local currency and in US dollars, at
the country level for three periods: the first phase of the crisis from the starting pre-crisis date of July
31, 2007 to September 15, 2008, an expanded phase of the crisis from the same starting date to March
9, 2009, and the complete sample period from the same starting date to our last observation of
December 31, 2009. September 15, 2008 is a significant date because it is the day when Lehman
Brothers filed for Chapter 11 bankruptcy protection, an event widely believed to be a watershed in the
crisis; March 9, 2009 was selected because is the date when the market finally bottomed out.
widely acknowledged that banks were severely undercapitalized. Undercapitalization has been the biggest stumbling block to the resolution of the financial crisis. 4 Only the largest listed banks are included. For Ireland, Norway, and Switzerland, we have one bank each.
7
[Insert Table 1, here]
Over the extended period from July 31, 2007 to March 9, 2009, the crisis destroyed $3.34
trillion of market values in our bank sample. European banks were hit the hardest with a 79.94
percent decline, the Pacific banks were hit the mildest with a 52.13 percent decline, and US banks
fared in the middle with a 76.42 percent decline. The decline, furthermore, was at least twice as large
after September 15, 2009 than in the first phase of the crisis. Table 1 shows rates of return both in
local currency and in US dollar. Dollar returns are the sum of local-currency returns, the rate of dollar
depreciation (or appreciation if negative) and the interaction between these two terms. The US dollar
depreciated relative to most currencies in the pre-Lehman period, appreciated in the first part of the
post-Lehman period and then depreciated again after May of 2009. Consider bank stocks in the euro
area. In the pre-Lehman period, rates of return averaged -37 percent, over a range spanning from -32
percent for Greece to -61 percent for Ireland. Banks from France, Germany, Ireland, and Portugal
fared worse than banks from Greece, Italy, Spain, and Netherlands. From July 31, 2007 to March 9,
2009, the euro-area average rate of return was an astounding -74 percent, ranging from -64 percent
for Spain to -98 percent for Ireland. Austrian, Belgian, Dutch, German and Irish banks did much
worse than French and Southern European banks. For most countries, but not for the United
Kingdom, Norway, Sweden, and Australia, the differences between local-currency returns and US
dollar returns were of a small order of magnitude.
At first, governments reacted to the crisis with disjointed and ad-hoc interventions, which were
accompanied by sharp declines in equity prices. For example, the US government supported some
institutions (Bear Stearns being acquired by JPMorgan Chase), but not others (Lehman Brothers). The
failure of Lehman on September 15, 2008 was a watershed and prompted policymakers in the next two
months to implement programs addressing systemic problems, such as the $700 billion Troubled Asset
Relief Program (TARP) in the United States and the £500 billion banking recapitalization program in
8
the United Kingdom. The initial objective of purchasing sub-standard illiquid assets ran into
difficulties because, without a market, governments were likely to either overvalue “toxic” assets, thus
penalizing taxpayers, or undervaluing them, thus penalizing potential sellers. Governments then
adjusted their policy by either recapitalizing financially distressed banks (e.g., in the United States) or
nationalizing them (e.g., in the United Kingdom). In December 2008 and January 2009, governments
tried to douse the fire of the crisis by targeting specific large banks (e.g., Commerzbank and
Citigroup); they were unsuccessful. In February and March 2009, additional general measures were
taken, this time with a focus on relieving banks of bad assets. At the same time, many indebted US
banks began repaying the US government, while in Europe the number of banks that had signaled their
intention for government assistance declined (e.g., Intesa Sanpaolo and Unicredit in Italy).
2. METHODOLOGY
The rescue of several large financial institutions in the United States and in Europe was sparked by the
migration of liquidity risk from banks to other financial institutions and followed the rapidly expanding
role of government as a market maker of last resort to support not only big banking, but also big
finance. We employ event-study methodology to estimate markets’ reaction to the announcements of
government interventions.
Event-study methodology goes back to the 1930s (Dolley 1933), but became ubiquitous in
capital markets research after important contributions by Ball and Brown (1968) and Fama et al.
(1969).5 The spreading popularity of this technique, however, was accompanied by modifications of
the original setup that implied violations of the underlying statistical assumptions (MacKinlay 1997).
Corrections and practical adjustments to these practices surfaced in the second half of 1970s; for a
5 Kothari and Warner (2006) report that, over the period 1974-2000, five top finance journals published 565 articles using event-study methodology.
9
review, see Serra (2002) and Corrado (2009). There is now agreement that the general setup of this
methodology consists of three stages: the identification of an event of interest and its timing; the
specification of a valuation model; and an analysis and computation of CAR (cumulative abnormal
returns) around the event date (De Jong 2007, p. 2). The procedure can be implemented in two
alternative ways (Binder 1998). The first is a two-step approach, in which a valuation model is first
estimated over a control (pre-event) estimation period and then CAR is computed as cumulative
residuals of the valuation model over a short event window; for an example, see O’Hara and Shaw
(1990). The second is an event-parameter approach, in which the valuation model is estimated over the
combined estimation and event periods, and includes dummy variables defined (to be equal to one)
over a relevant event window; for an example, see Meulbroek (1992).
The two approaches are unbiased and equivalent under the assumption of serially independent
and normally distributed returns and non-overlapping event windows (Corrado 2009). Conversely,
problems arise in the presence of overlapping windows, multiple events, aggregation of abnormal
returns across firms, cross-sectional dependence, serial correlation, event-induced volatility and event-
induced returns (De Jong 2007). A number of these statistical problems can be overcome with the
event-parameter regression framework (Binder 1998). In our case, general announcements are clearly
overlapping because they influence all banks in a country; furthermore, if different countries were to
coordinate their policies overlapping would be exacerbated. Also, public interventions become
multiple events when the same bank receives subsidies repeatedly during the crisis. In the presence of
overlapping multiple events, Binder (1998) suggests the use of event-parameter methodology because
it simplifies the estimation and is more flexible in hypothesis testing. This methodology provides also a
natural solution to aggregation problems across banks. Other considerations as well support the choice
of the event-parameter framework: with relatively frequent events, as it is true in our case, information
on multiple events is lost or distorted by the two-step approach because the estimation window is either
10
too short or affected by previous announcements. The event-parameter methodology is relatively more
efficient because abnormal returns are estimated in one step.6
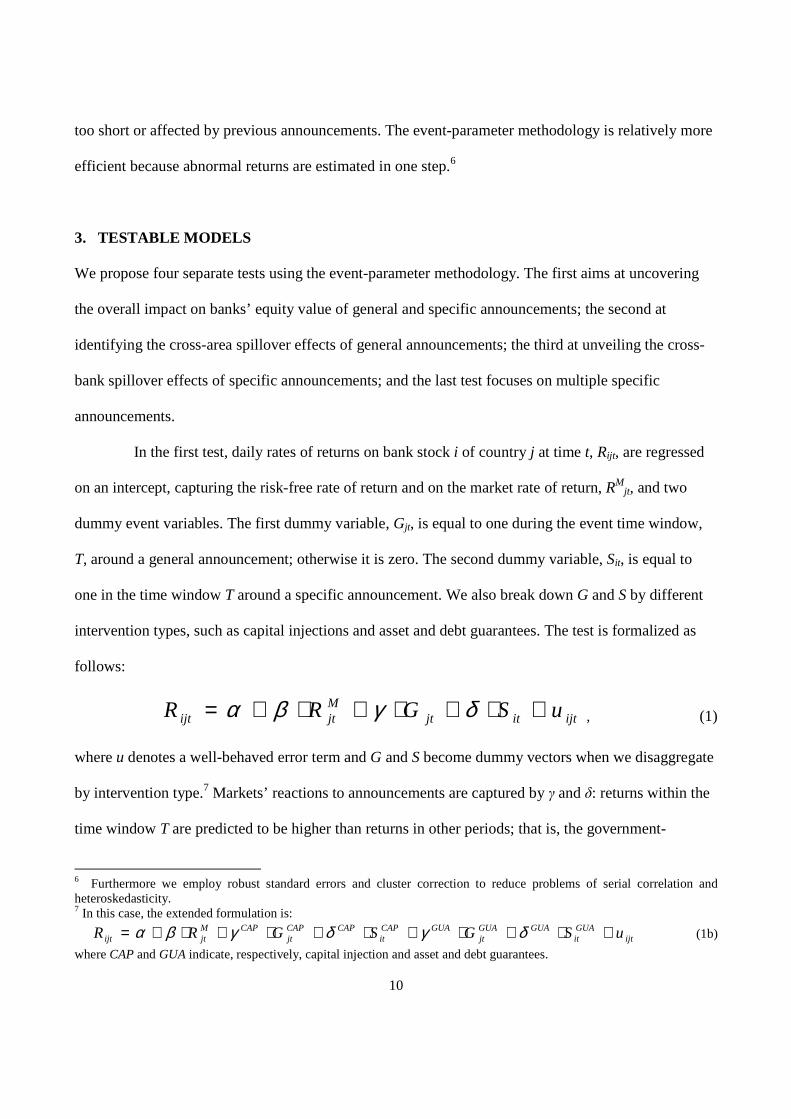
3. TESTABLE MODELS
We propose four separate tests using the event-parameter methodology. The first aims at uncovering
the overall impact on banks’ equity value of general and specific announcements; the second at
identifying the cross-area spillover effects of general announcements; the third at unveiling the cross-
bank spillover effects of specific announcements; and the last test focuses on multiple specific
announcements.
In the first test, daily rates of returns on bank stock i of country j at time t, Rijt, are regressed
on an intercept, capturing the risk-free rate of return and on the market rate of return, RMjt, and two
dummy event variables. The first dummy variable, Gjt, is equal to one during the event time window,
T, around a general announcement; otherwise it is zero. The second dummy variable, Sit, is equal to
one in the time window T around a specific announcement. We also break down G and S by different
intervention types, such as capital injections and asset and debt guarantees. The test is formalized as
follows:
ijtitjtMjtijt uSGRR +⋅+⋅+⋅+= δγβα , (1)
where u denotes a well-behaved error term and G and S become dummy vectors when we disaggregate
by intervention type.7 Markets’ reactions to announcements are captured by γ and δ: returns within the
time window T are predicted to be higher than returns in other periods; that is, the government-
6 Furthermore we employ robust standard errors and cluster correction to reduce problems of serial correlation and heteroskedasticity. 7 In this case, the extended formulation is:
ijtGUAit
GUAGUAjt
GUACAPit
CAPCAPjt
CAPMjtijt uSGSGRR +⋅+⋅+⋅+⋅+⋅+= δγδγβα (1b)
where CAP and GUA indicate, respectively, capital injection and asset and debt guarantees.
11
intervention event generates CAR. Since the error of the regression must be zero on average, the null
hypothesis is that CAR, within T, must also be zero. A rejection of the null hypothesis corroborates the
presence of abnormal returns. In (1), CAR is the sum of the estimates of parameters γ and δ
multiplied by T (Meulbroek 1992).
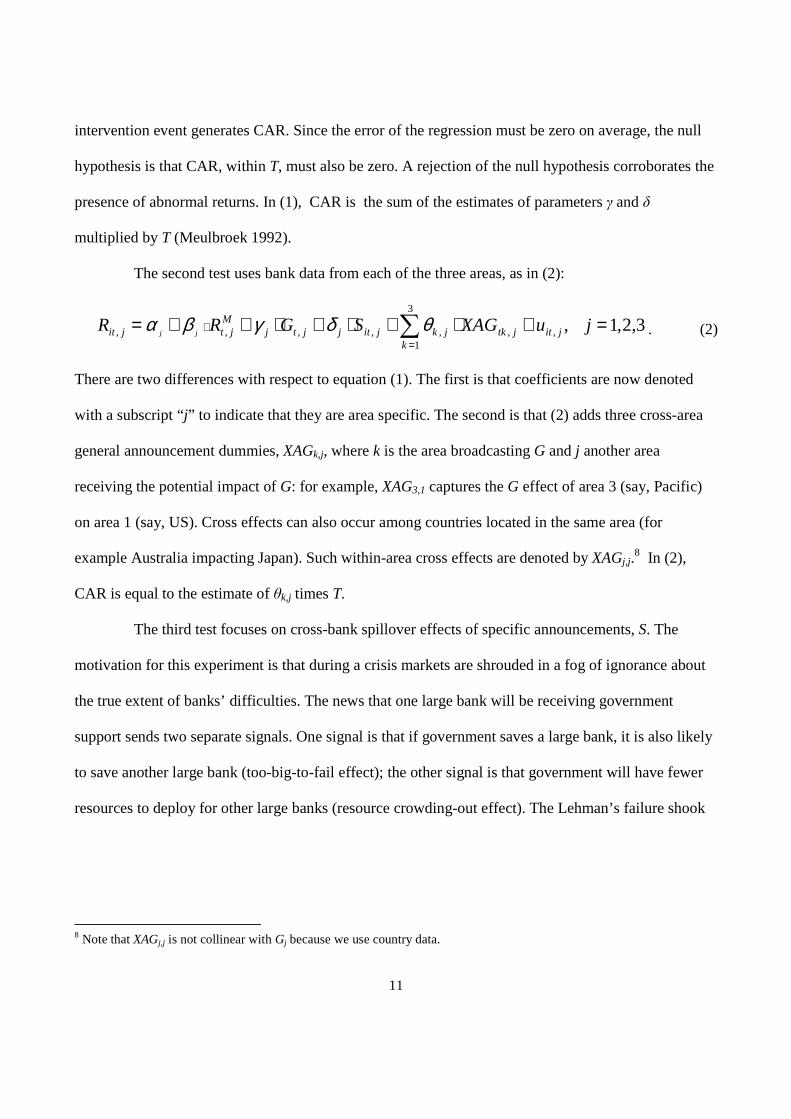
The second test uses bank data from each of the three areas, as in (2):
3,2,1,,
3
1,,,,,, =+⋅+⋅+⋅++= ∑
=
⋅ juXAGSGRR jitk
jtkjkjitjjtjM
jtjit jjθδγβα . (2)
There are two differences with respect to equation (1). The first is that coefficients are now denoted
with a subscript “j” to indicate that they are area specific. The second is that (2) adds three cross-area
general announcement dummies, XAGk,j, where k is the area broadcasting G and j another area
receiving the potential impact of G: for example, XAG3,1 captures the G effect of area 3 (say, Pacific)
on area 1 (say, US). Cross effects can also occur among countries located in the same area (for
example Australia impacting Japan). Such within-area cross effects are denoted by XAGj,j.8 In (2),
CAR is equal to the estimate of θk,j times T.
The third test focuses on cross-bank spillover effects of specific announcements, S. The
motivation for this experiment is that during a crisis markets are shrouded in a fog of ignorance about
the true extent of banks’ difficulties. The news that one large bank will be receiving government
support sends two separate signals. One signal is that if government saves a large bank, it is also likely
to save another large bank (too-big-to-fail effect); the other signal is that government will have fewer
resources to deploy for other large banks (resource crowding-out effect). The Lehman’s failure shook
8 Note that XAGj,j is not collinear with Gj because we use country data.
12
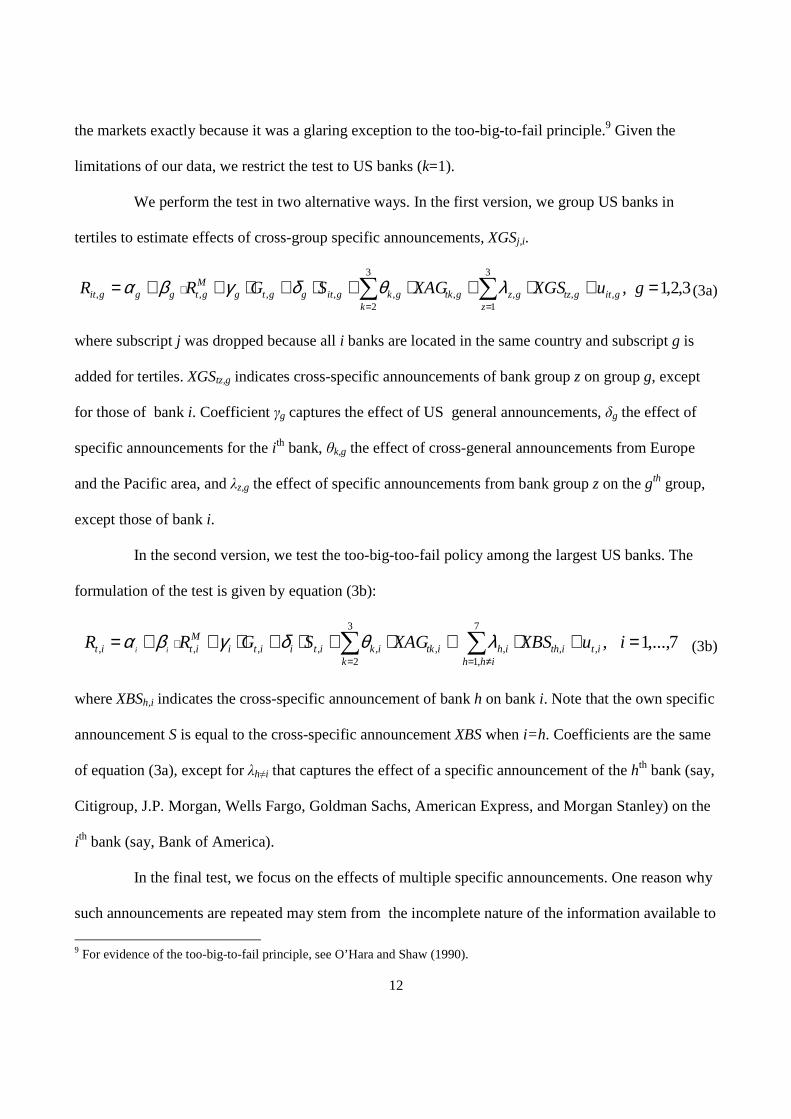
the markets exactly because it was a glaring exception to the too-big-to-fail principle.9 Given the
limitations of our data, we restrict the test to US banks (k=1).
We perform the test in two alternative ways. In the first version, we group US banks in
tertiles to estimate effects of cross-group specific announcements, XGSj,i.
3,2,1,,
3
1,,
3
2,,,,,, =+⋅+⋅+⋅+⋅++= ∑∑
==
⋅ guXGSXAGSGRR gitz
gtzgzk
gtkgkgitggtgMgtgggit λθδγβα (3a)
where subscript j was dropped because all i banks are located in the same country and subscript g is
added for tertiles. XGStz,g indicates cross-specific announcements of bank group z on group g, except
for those of bank i. Coefficient γg captures the effect of US general announcements, δg the effect of
specific announcements for the i th bank, θk,g the effect of cross-general announcements from Europe
and the Pacific area, and λz,g the effect of specific announcements from bank group z on the gth group,
except those of bank i.
In the second version, we test the too-big-too-fail policy among the largest US banks. The
formulation of the test is given by equation (3b):
7,...,1,,
7
,1,,
3
2,,,,,, =+⋅+⋅+⋅+⋅++= ∑∑
≠==
⋅ iuXBSXAGSGRR itihh
ithihk
itkikitiitiMitit ii
λθδγβα (3b)
where XBSh,i indicates the cross-specific announcement of bank h on bank i. Note that the own specific
announcement S is equal to the cross-specific announcement XBS when i=h . Coefficients are the same
of equation (3a), except for λh≠i that captures the effect of a specific announcement of the hth bank (say,
Citigroup, J.P. Morgan, Wells Fargo, Goldman Sachs, American Express, and Morgan Stanley) on the
ith bank (say, Bank of America).
In the final test, we focus on the effects of multiple specific announcements. One reason why
such announcements are repeated may stem from the incomplete nature of the information available to
9 For evidence of the too-big-to-fail principle, see O’Hara and Shaw (1990).
13
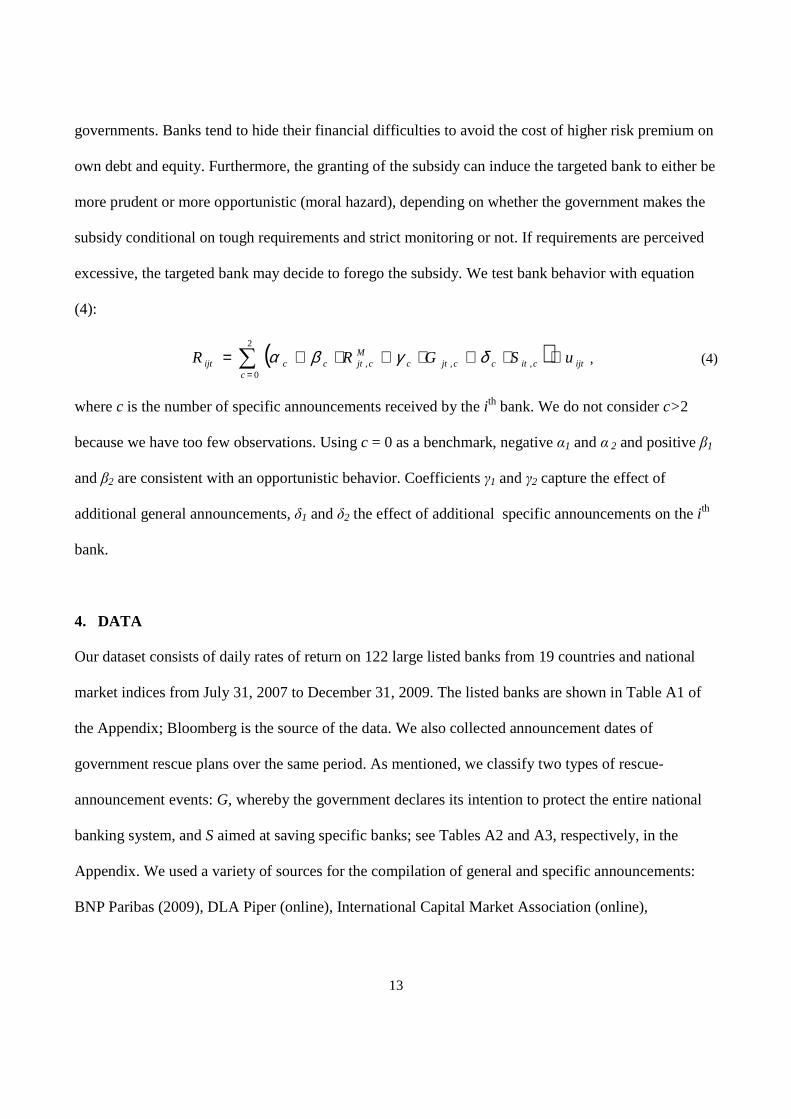
governments. Banks tend to hide their financial difficulties to avoid the cost of higher risk premium on
own debt and equity. Furthermore, the granting of the subsidy can induce the targeted bank to either be
more prudent or more opportunistic (moral hazard), depending on whether the government makes the
subsidy conditional on tough requirements and strict monitoring or not. If requirements are perceived
excessive, the targeted bank may decide to forego the subsidy. We test bank behavior with equation
(4):
( ) ijtc
citccjtcM
cjtccijt uSGRR +⋅+⋅+⋅+= ∑=
2
0,,, δγβα , (4)
where c is the number of specific announcements received by the ith bank. We do not consider c>2
because we have too few observations. Using c = 0 as a benchmark, negative α1 and α 2 and positive β1
and β2 are consistent with an opportunistic behavior. Coefficients γ1 and γ2 capture the effect of
additional general announcements, δ1 and δ2 the effect of additional specific announcements on the i th
bank.
4. DATA
Our dataset consists of daily rates of return on 122 large listed banks from 19 countries and national
market indices from July 31, 2007 to December 31, 2009. The listed banks are shown in Table A1 of
the Appendix; Bloomberg is the source of the data. We also collected announcement dates of
government rescue plans over the same period. As mentioned, we classify two types of rescue-
announcement events: G, whereby the government declares its intention to protect the entire national
banking system, and S aimed at saving specific banks; see Tables A2 and A3, respectively, in the
Appendix. We used a variety of sources for the compilation of general and specific announcements:
BNP Paribas (2009), DLA Piper (online), International Capital Market Association (online),
14
Mediobanca (2009), Panetta et al. (2009), and websites of CNN Money and national Ministries of
Finance or Treasuries.
For the 19 countries represented in our sample, there are 51 general announcements over 33
different dates, of which 30 are capital injections and 21 are asset and debt guarantees (Appendix,
Table A2). There are 139 specific announcements over 88 different dates, of which 103 as capital
injections and 36 as asset and debt guarantees (Appendix, Table A3). Specific announcements affect
53 of the 122 banks and two thirds of the countries in our sample.10 Pacific-area banks are the least
affected by announcements. Finally, 33 banks in our sample have been the target of multiple
announcements.
From the date of Lehman’s failure to the end of 2009, governments have committed $8.6
trillion of funds in general rescue packages, of which 37.6 percent as capital injections and 63.4
percent as asset and debt guarantees; see Appendix, Table A2. The rescue plans of the United States,
United Kingdom, Germany and Ireland were larger than those of Italy, Denmark, Greece, and
Portugal. Clearly, differences in the committed amounts cannot be explained only by differences in
national sizes of financial markets.
Commitments to specific interventions, over the same period, amount to $2.4 trillion, of which
39.9 percent as capital injections and 60.1 percent as asset and debt guarantees (Appendix, Table A3).
The ranking of subsidy-receiving banks changes according to the type of intervention. Considering all
subsidies, the Royal Bank of Scotland and Lloyds TBS top the list, respectively with $529 and $408
billion, followed by Citigroup and Hypo Real Estate with $330 billion each, Dexia with $228 billion
and Bank of America with $144 billion.
10 These countries are Austria, Belgium, France, Greece, Germany, Ireland, Italy, Luxembourg, Netherlands, Portugal, Sweden, the United Kingdom, and the United States.
15
In sum, governments have used a mix of general and specific interventions, reflecting the
opaqueness of information after Lehman’s failure. Asset and debt guaranties are politically attractive
because governments do not have to argue the case with legislators. They also entail smaller current
costs than the expected present-value contingent cost, suggesting that governments are prone to gamble
for a possible resurrection of the banking system. This strategy was a defining characteristic of both
the US Savings and Loans crisis of the Eighties and the long Japanese crisis of the Nineties, which was
responsible for transforming “a relatively small cost into a staggeringly large one” (Glauber 2000, p.
102).
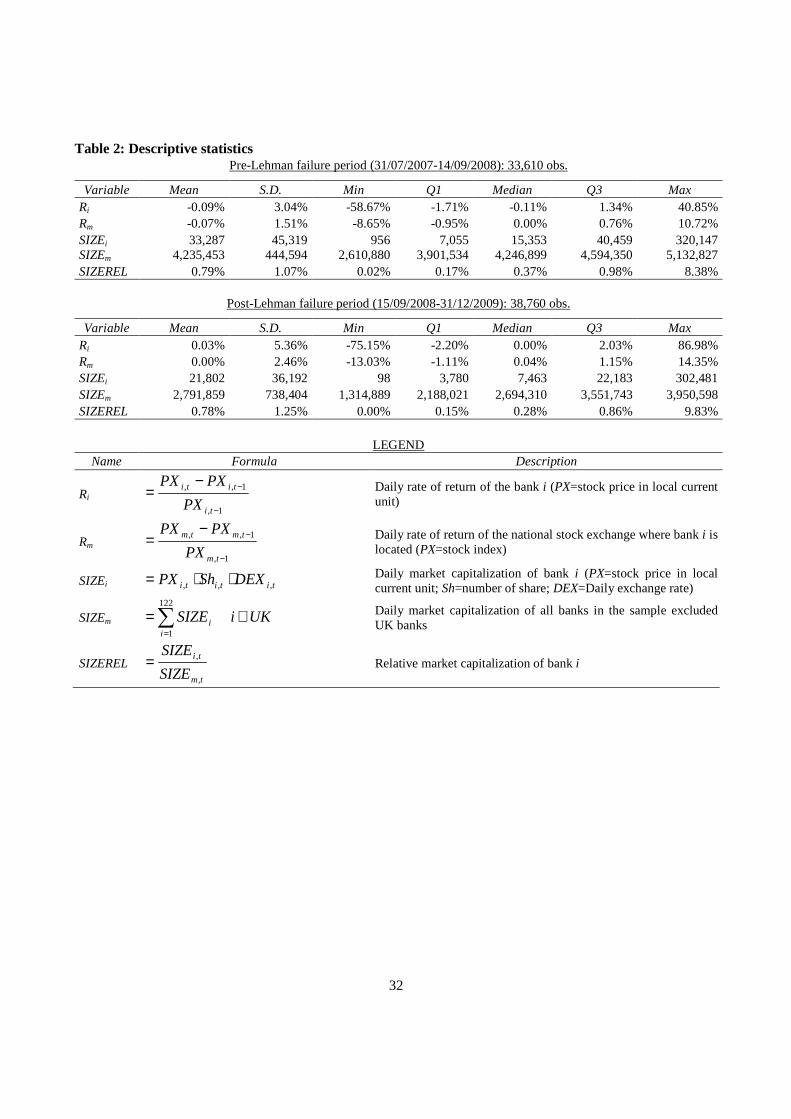
Table 2 reports some descriptive statistics for the pre-Lehman and post-Lehman failure periods;
for brevity, we shall refer to these two periods as PRE and POST, respectively. Bank returns Ri tend to
be procyclical in both periods. The variability of Ri (measured by its standard deviation) is higher than
the variability of market returns, Rm, and rises from PRE to POST. Both individual (SIZEi) and overall
(SIZEm) market capitalizations of banks decrease around 35 percent from PRE to POST, implying no
material change in relative bank size (SIZEREL). The within serial variability of SIZEi falls from 45 to
36 between the two periods, whereas the overall variability of SIZEo rises from 444 to 738, implying
an increase in the between cross-sectional variability. The main message is that the financial crisis
enlarged size differences among banks.
[Insert Table 2, here]
5. FINDINGS
The hypothesis underlying our analysis is that the announcement of a rescue plan is credible if it raises
the survivability and rates of return of participating banks. Therefore, we can test the effects of rescue
plans by computing CAR of participating banks around an announcement-date window. Estimates of
alpha, the risk free rate, and beta, the market risk parameter, from the capital asset price model are
estimated on daily returns for the PRE and POST periods. A general announcement is more complex
16
than a specific announcement because it requires longer time for the market to process it; in addition, it
is easier for the markets to obtain relevant information about general than specific announcements. For
this reason, we apply different windows to the two types of announcements: a seven-day window for
general announcements centered on the announcement date and spanning three working days before
and after the announcement, and a five-day window for specific announcements centered on the
announcement date and spanning two working days before and after the announcement. We exclude
UK banks from the estimation because UK capital injections were in fact nationalizations that tend to
be unfavorable to private shareholders and can distort market reactions.11 Consequently, the number of
banks in our sample is reduced to 116.
5.1 Overall impact of general and specific announcements on banks’ rates of return
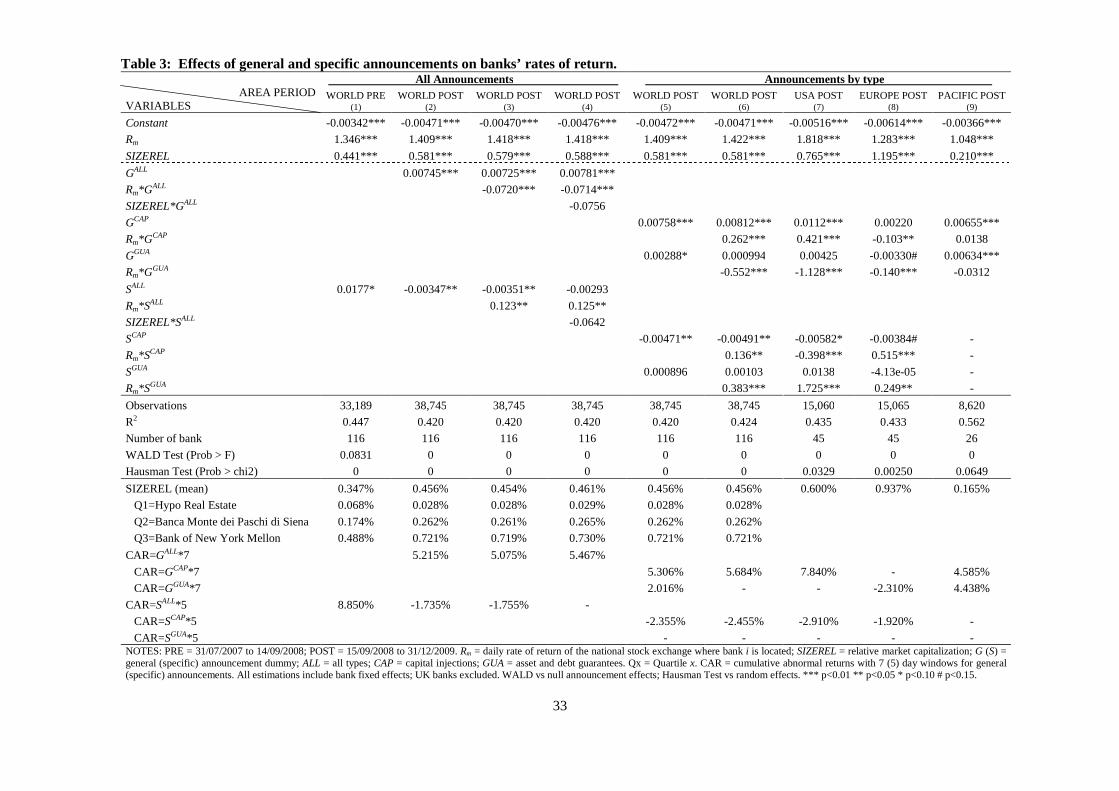
The first test estimates the overall impact of 49 general and 133 specific announcements on banks’
returns using the entire panel of 116 banks.12 Results for the two periods are shown in Table 3: PRE
has 33,189 observations and POST 38,745, of which 15,060 from the United States, 15,065 from
Europe, and 8,620 from the Pacific area. We test equation (1) first by aggregating all announcements
(ALL) and then using the two individual categories of capital injections (CAP) and asset and debt
guarantees (GUA); see equation (1b). We recall that a general announcement G has a seven-day
window and a specific announcement S a five-day window. We experimented with different window
lengths: results tend to weaken as the window is enlarged, in particular for S. Obviously, the bulk of
11 For example, partial nationalization reduces the volume of traded shares that, in turn, affects stock price. Conversely, public ownership provides an explicit safety net. 12 We drop announcements from the United Kingdom (two general announcements and six specific announcements).
17
the announcements occurs in POST. The panel is estimated with bank fixed effects, a specification that
is not rejected by the Hausman (1978) test.13
In addition to the variables indicated on the right-hand side of equation (1), we have added
relative bank size measured as the US dollar capitalization value of bank i relative to capitalization of
all banks (SIZEREL). This variable turns out to have positive and statistically significant effects in all
the regressions. On average, 0.35 percentage points of returns depend on SIZEREL in PRE and over
0.45 in POST. Relevant differences emerge among banks. Take Hypo Real Estate, Banca Monte dei
Paschi di Siena, and Bank of New York Mellon, respectively the first quartile, median, and third
quartile in the distribution of market-value capitalization in PRE. SIZEREL impact on returns of Hypo
Real Estate is nine times lower than on returns of Banca Monte dei Paschi and 25 times lower than on
returns of Bank of New York Mellon.
The first key finding of Table 3 is that all announcements have a statistically significant and
economically relevant impact on banks’ rates of return.14 The PRE period has no general
announcements G and relatively few specific announcements S, which produce a CAR of 8.8
percentage points. In the POST period, G-induced CAR are almost 5 percentage points higher than
normal returns while S-induced CAR are 1.7 percentage points lower than normal returns. The
opposite signs of the G and S coefficients reflect differences in the way markets evaluate the two types
of announcements. A general announcement is taken as a signal that government wants to protect the
13 The Hausman (1978) specification test uses the statistic )()()( 1
REFEREFEREFE VarNH ββββββ −−′−= − to
compare fixed effects with random effects, where N = number of observations, FEβ and REβ are respectively the vector of coefficients in the fixed and random effect model, and Var(.) indicates the variance-covariance operator; H has a chi-squared distribution. In Table 3, except for the last column, the null hypothesis that the estimated coefficients from the fixed effect model is not systematically different from the coefficients of the random effect model is rejected at the significance level of 5%. In this case, that is under the alternative hypothesis, the random-effect model is inconsistent, where the fixed-effect model is. In the last column, observations decrease and the null hypothesis is rejected at the significance level of 10%. 14 WALD tests of null announcement effects are rejected in all specifications at 5 percent level, except for first period (column 1) rejected at 10 percent level.
18
banking systems. The banking industry, as a whole, receives support and shareholders gain
“abnormally” high rates of return over the announcement window. A specific announcement, instead,
generates a more problematic signal. During “normal” times, when markets face stable information
flows and are able to price banks’ future net cash flows with relative efficiency, S is evaluated as a
boost to shareholders’ return. On the other hand, in the fog of a financial crisis, when markets are
extremely uncertain about the quality of the assets, a specific announcement is taken as a revelation of
partially unknown troubles. S-induced CAR, therefore, may turn out to be negative. On this point, it is
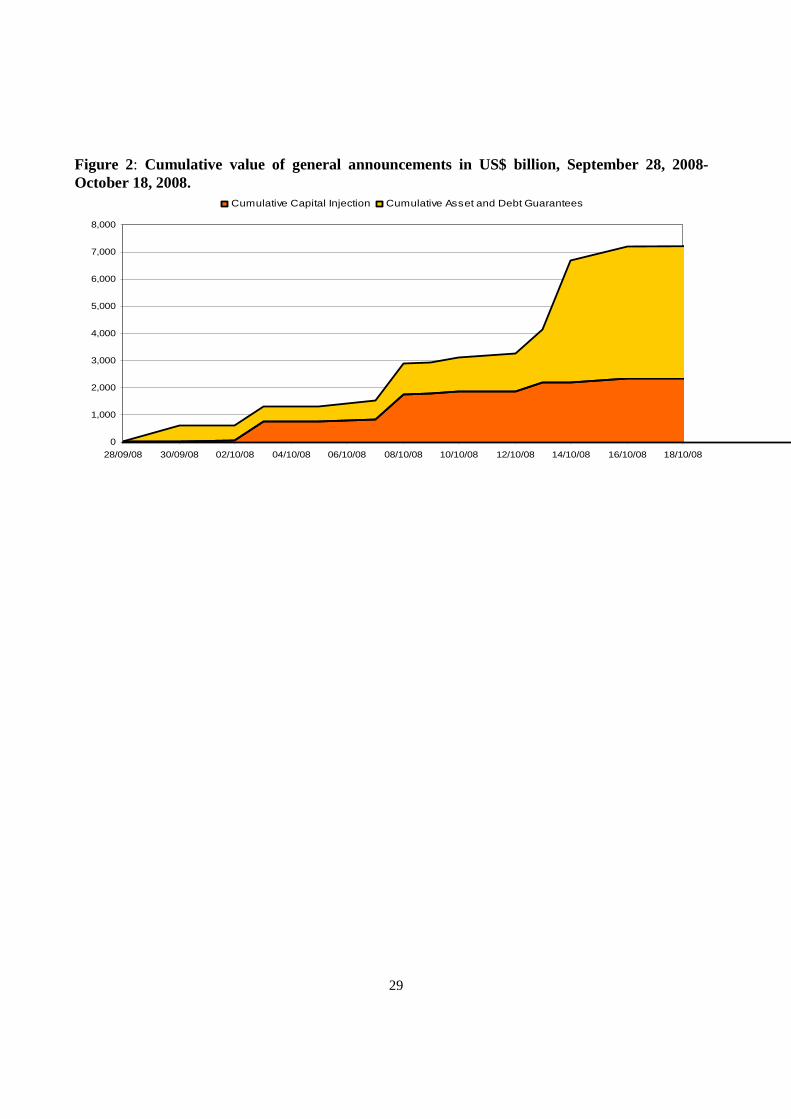
worth recalling that particularly hectic activities took place in the first half of October 2008, when
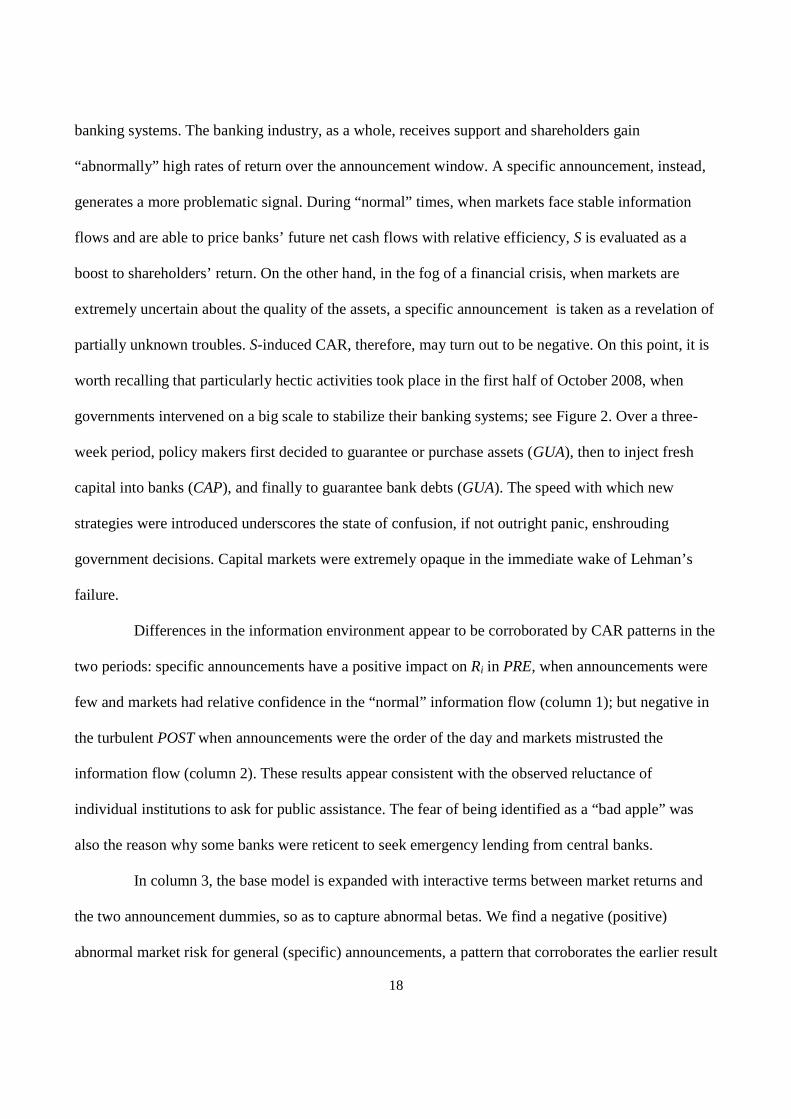
governments intervened on a big scale to stabilize their banking systems; see Figure 2. Over a three-
week period, policy makers first decided to guarantee or purchase assets (GUA), then to inject fresh
capital into banks (CAP), and finally to guarantee bank debts (GUA). The speed with which new
strategies were introduced underscores the state of confusion, if not outright panic, enshrouding
government decisions. Capital markets were extremely opaque in the immediate wake of Lehman’s
failure.
Differences in the information environment appear to be corroborated by CAR patterns in the
two periods: specific announcements have a positive impact on Ri in PRE, when announcements were
few and markets had relative confidence in the “normal” information flow (column 1); but negative in
the turbulent POST when announcements were the order of the day and markets mistrusted the
information flow (column 2). These results appear consistent with the observed reluctance of
individual institutions to ask for public assistance. The fear of being identified as a “bad apple” was
also the reason why some banks were reticent to seek emergency lending from central banks.
In column 3, the base model is expanded with interactive terms between market returns and
the two announcement dummies, so as to capture abnormal betas. We find a negative (positive)
abnormal market risk for general (specific) announcements, a pattern that corroborates the earlier result
19
that general announcements provide a safety net to banking system whereas specific announcements
appear to identify “bad apple” banks. We also check, in column 4, for potential too-big-too-fail effect
by adding interactive terms between SIZEREL and announcement dummies; we find no evidence of
that.
The second key finding of Table 3 is that markets have had difficulties in sorting out the
relative efficacy of different types of announcements. Column 5 reports the estimate of the base model
and columns 6 through 9 the estimates of the expanded model. Both GCAP and GGUA exert a positive
impact on Ri. On the other hand, the negative impact of S on Ri is driven wholly by SCAP. Area
regressions confirm this pattern. In column 6, abnormal betas are estimated by intervention types:
general announcements of asset and debt guarantees lower beta, whereas general announcements of
capital injections and the two types of specific announcements raise beta. Columns 7 through 9
underscore differences of abnormal market risk in the three areas. In particular, the US market stands
out as somewhat different with respect to other areas.
[Insert Table 3 and Figure 2, here]
A point of interest is to check the stability of the coefficient estimates over the most turbulent
part of the crisis. To this end, we run rolling regressions of the base model recursively, starting with an
initial estimation window spanning from July 31, 2007 to July 31, 2008 and then expanding it
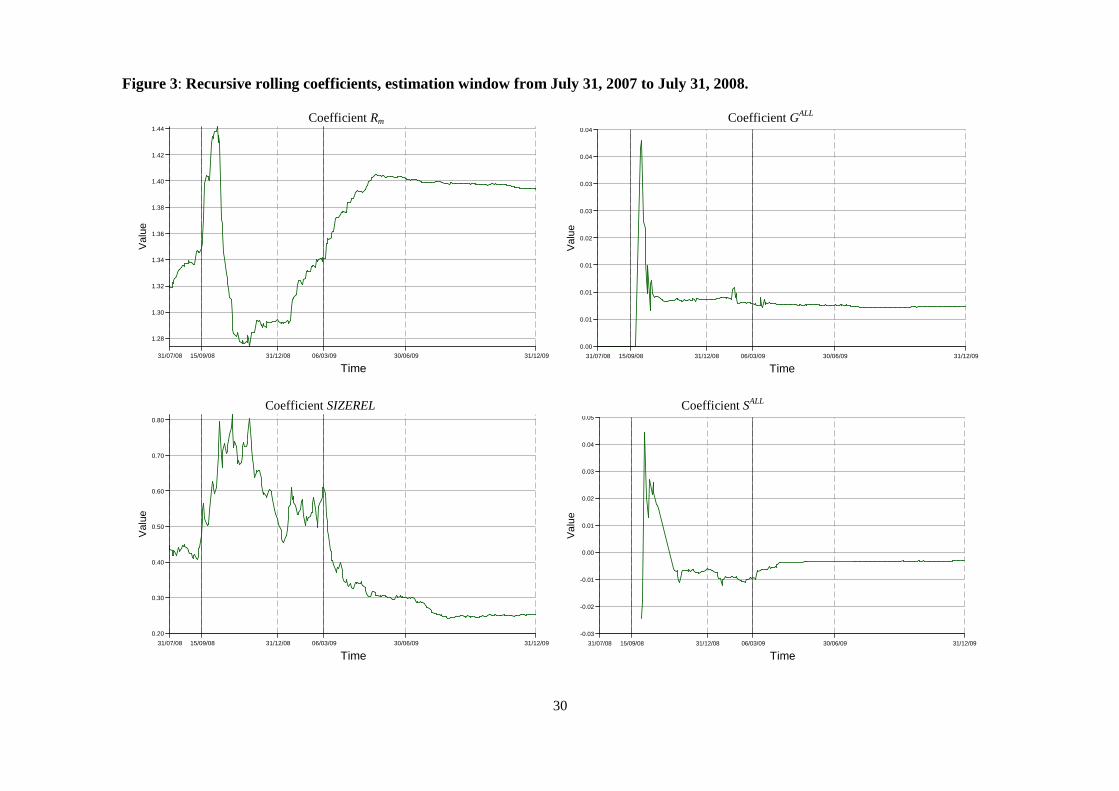
progressively until the end of 2009. Figure 3 plots the rolling estimates of Rm, SIZEREL, GALL and SALL.
The impact of market risk rises sharply immediately after Lehman’s failure, then declines rapidly in
the latter part of 2008, and finally rises steadily until June 2009. As to relative bank size, its effect on
bank returns doubles after Lehman’s failure and stays high until the bottom of the markets, after which
it falls to around one half of its pre-Lehman value. These patterns confirm that Lehman’s failure was a
watershed in the crisis and that ensuing turbulence lasted approximately six months. Both general and
specific announcements had positive effects on bank returns soon after Lehman’s demise, but as time
20
progresses the effect of specific announcements switches in sign while the effect of general
announcements remains positive.
[Insert Figure 3, here]
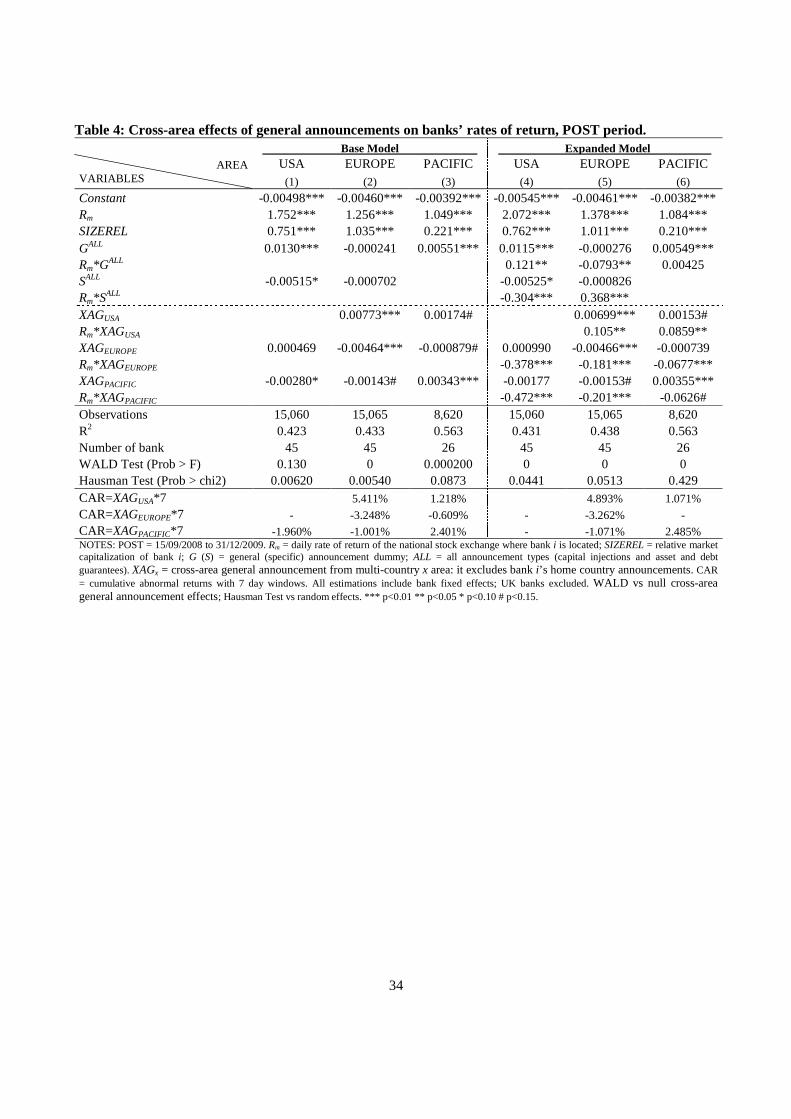
5.2 Cross-area spillover effects of general announcements
Table 4 presents results of possible cross-area general announcement effects; cf. equation (2). A bank
in a given country may respond not only to its country’s G and its own S, but also to G affecting other
banks abroad. To explore this issue, our 116 banks were divided into the three geographical areas of
Europe, the Pacific, and the United States.15 In the base model (left panel), four of the eight cross-area
spillovers are statistically significant at least at the 10 percent level.16 Two different patterns emerge:
the cross effect of the Pacific area on the United States is negative, but the cross effect of one Pacific
country on another Pacific country is positive; the cross effect of the United States on Europe is
positive, but the cross effect of one European country on another European country is negative. A
positive cross effect is what one would expect in an interconnected world. On the other hand, a
negative cross effect is consistent with a view that foreign rescue plans give a competitive advantage to
foreign banks. It is also worth noting that the impact of the own G in the United States is at least twice
as large as that in Europe and the Pacific area, reflecting the more aggressive and extensive nature of
US intervention plans.
The results of the expanded model (right panel), in addition to confirming the results of the
base model, show that the own G either reduces or leaves unchanged market risk in Europe and the
Pacific area, but raises it in the United States. This indicates that bank interconnectedness runs from
Western Europe and the Pacific area to the United States, but not vice versa. The noted US
15 We cannot determine cross-country spillovers because of the collinearity of many general announcements across countries. 16 Note that some other coefficients are only marginally insignificant.
21
distinctiveness may well reflect US financial leadership in the world, including the special role of the
US dollar in the international monetary system.
[Insert Table 4, here]
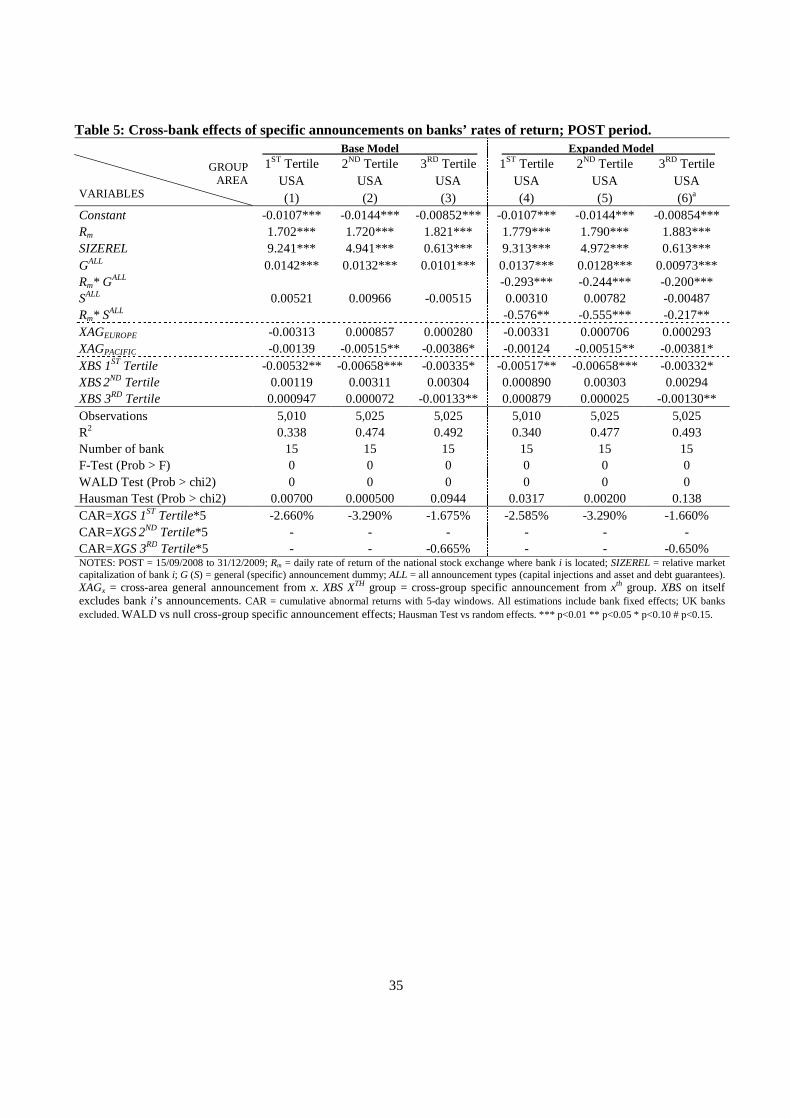
5.3 Cross-bank spillover effects of specific announcements
Next, we test the cross-bank spillover effects induced by specific announcements. Given the
limitations of our data and the particular role of the US financial market, we restrict the test to the 45
US banks in our sample, which are divided in tertiles based on their PRE market capitalization. Also,
the data do not permit the use of interactive terms for cross-area and cross-group spillovers. Table 5
shows the estimates of equation (3a). Cross-group effects are negative, suggesting a resource
crowding-out phenomenon and the absence of a too-big-to-fail policy: when the government saves a
bank, the market fears that the government will curtail subsidies to other banks.
[Insert Table 5 here]
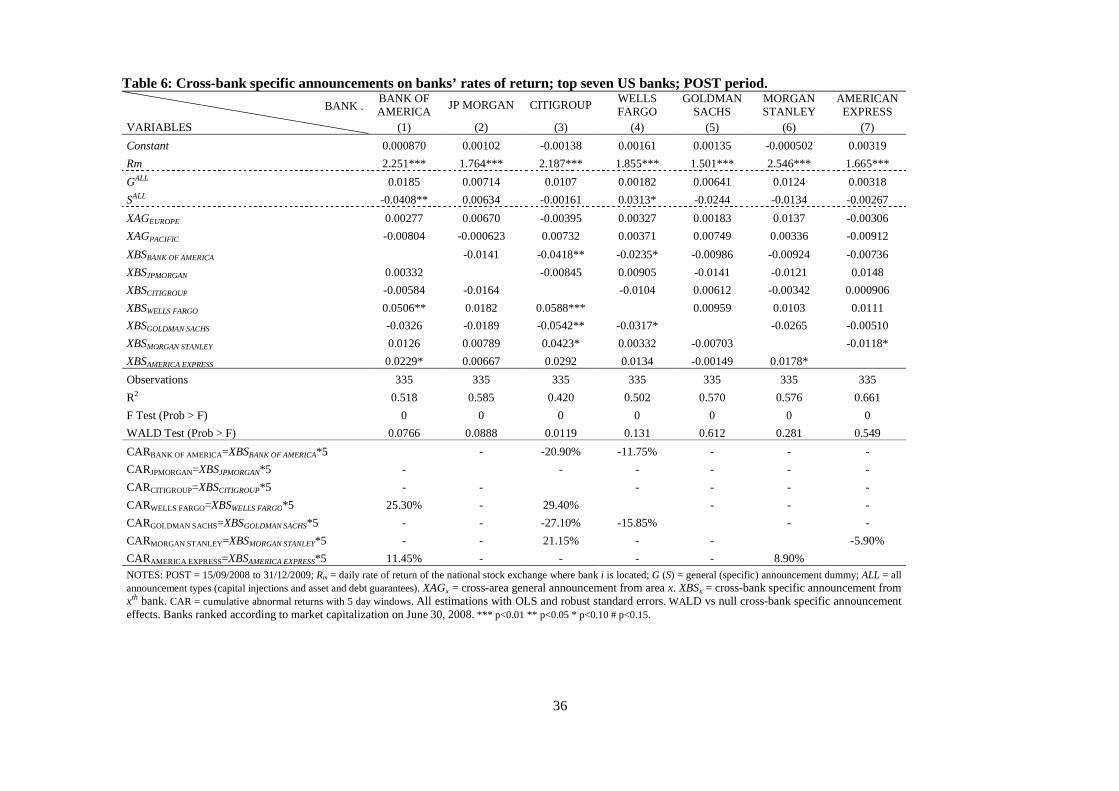
We probe further into the too-big-to-fail issue by focusing on the largest banks; see Table 6. We select
the top seven US banks by market capitalization as of June 30, 2008: Bank of America, JPMorgan,
Citigroup, Wells Fargo, Goldman Sachs, Morgan Stanley and American Express, which account for
more than 60 percent of US bank market capitalization, 100 percent of asset and debt guarantees, and
90 percent of capital injections.17 The estimation is performed with OLS and robust standard errors.
SIZEREL is no longer necessary without the cross-sectional dimension and it is eliminated.
Recall that while a specific announcement may signal unexpected financial difficulties of the
targeted institution and inter-bank competition for subsidies, it may also signal the intention of
government to save another bank at least as big as the one it just saved. The pattern of cross-bank
17 Bank of America and JP Morgan, had market capitalization of $147 and $140 billion, respectively; Citigroup and Wells Fargo were approximately two-thirds of their size, Goldman Sachs half of their size, and Morgan Stanley and American Express less than one third of their size. This ranking holds for different dates of market valuations ad is consistent with a ranking based on employment.
22
spillovers suggests both resource crowding-out and too-big-to-fail effects are present. The inference
about the former emerges from negative and statistically significant coefficients in the upper triangle of
the XBS matrix of Table 6: Bank of America’s announcements penalize the smaller Citigroup and
Wells Fargo; similarly, Morgan Stanley’s announcements penalize the smaller American Express.
Consistent with this pattern is the boost that American Express and Wells Fargo’s announcements give
to larger Bank of America, Citigroup, and Morgan Stanley, and Morgan Stanley’s announcements give
to larger Citigroup. However, there are also deviations to this pattern, such as the negative cross-effect
of Goldman Sachs‘s announcements on larger Citigroup and Wells Fargo. In sum, our findings are
consistent with a mix of resource crowding-out and too-big-to-fail policy, albeit limited to the largest
US banks. We leave open the possibility that too-big-to-fail policy may operate not only on size, but
also on the degree of the targeted bank’s interconnectedness with other financial institutions.
[Insert Table 6, here]
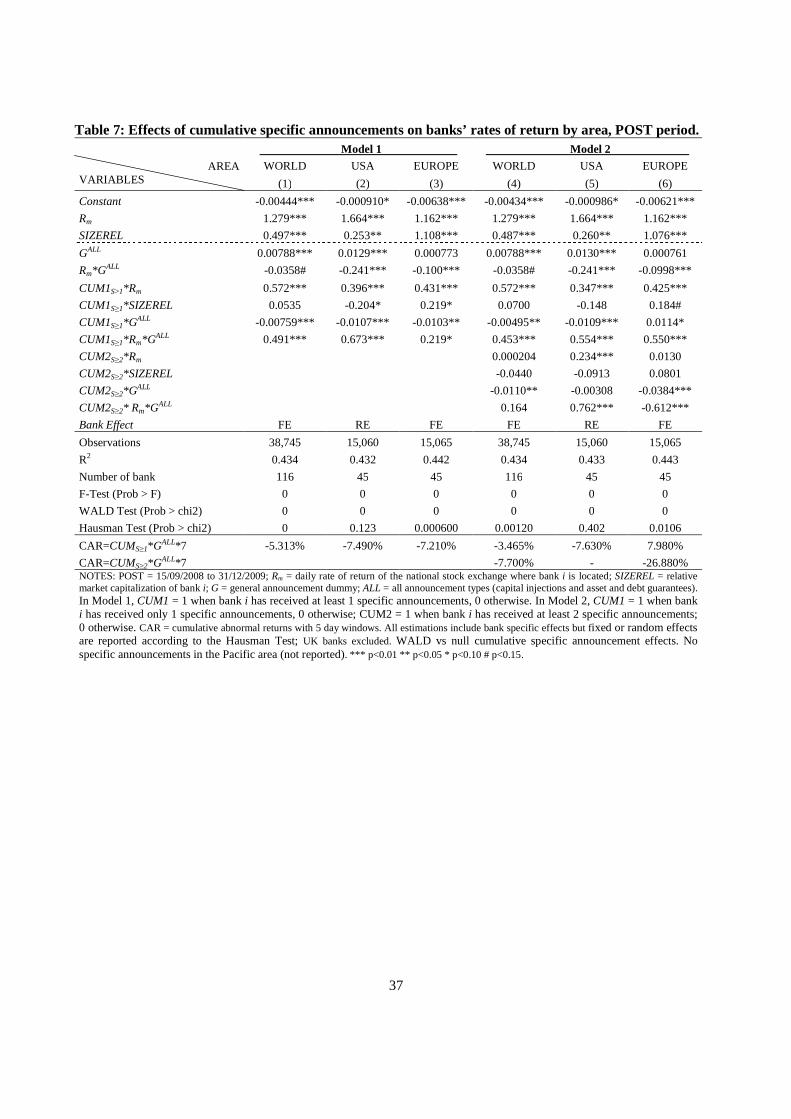
5.4 Multiple specific announcements
Our last test relates to impact on bank returns of multiple specific announcements (CUM). Table 7
reports the estimation of equation (4) after eliminating the dummy S because it is already included in
CUM. We report on the selection of bank fixed vs. random effect models using the Hausman test.
There are two sections in the table: one on the left relates to banks with at least one single specific
announcement (CUM1 dummy variable) and the other on the right relates to banks with multiple
specific announcements broken down by number of interventions (CUM1 and CUM2 dummy
variables).18 Concerning the former, three important findings emerge. The first is that beta rises when a
bank receives a subsidy, suggesting a higher degree of moral hazard or a more fragile banking system.
The second is that the benefit of a general announcement declines for banks targeted by a specific
18 CUM1 is equal to one 1 when bank i receives only one specific announcement and zero otherwise, whereas CUM2 is equal to one when bank i receives at least two specific announcements and zero otherwise.
23
announcement, whose CAR falls by 7.5 percentage points in the United States and 7.2 points in
Europe. Furthermore, the interaction of G with CUM1 fails to reduce market risk of targeted banks.
The third is that bank size becomes more important for multi-intervention banks in smaller European
markets than in the larger US market. This could be interpreted as markets anticipating different
reactions by authorities to bank size: too-big-to-fail policy may be more relevant for small than large
countries because banks from small countries need to be larger in relation to domestic market size than
banks from big countries to compete in global markets. The right panel of Table 7 extends the model
to distinguish between the effects of single-S (CUM1) and multi-S banks (CUM2). The key finding
here is that US multi-S banks face a higher market risk, whereas their European counterparts are
penalized by negative G-induced CAR.19 On the other hand, abnormal betas increase with the number
of public interventions in the United Staates, but not in Europe.
In sum, the findings of Table 7 suggest that the soft budget constraint implied by government
subsidies reduces the efficacy of repeated rescue announcements and induces a more opportunistic
behavior in targeted banks. Differences between areas affect marginally this result. The diminishing
benefits from government interventions have the policy implication that subsidies are only an urgent
and temporary crisis measures and should be quickly replaced by structural reforms.
[Insert Table 7, here]
6. CONCLUSIONS
The great financial crisis of 2007-2009 had its roots in a credit boom that manifested itself in an
extremely indebted US economy. Subprime defaults spread the fire in a financial system that had
become fragile as a result of several factors unique to this crisis. Banks’ undercapitalization explains
the persistence of the crisis and why governments have injected vast sums of public funds into banks.
19 CAR value is -27 percentage points; see column 6 of Table 7.
24
Our paper focuses on the specific question of whether general and specific rescue
announcements were priced by the markets as cumulative abnormal returns over selected event
windows. General announcements tend to be associated with positive abnormal returns (and lower
market risk) and specific announcements with negative abnormal returns (and higher market risk);
foreign general announcements exert cross-area spillovers, but are perceived by the home-country
banks as subsidies boosting the competitive advantage of foreign banks; specific announcements exert
a resource crowding-out effect on other banks; and multiple specific announcements increase the
degree of moral hazard of subsidized banks. Our results are also sensitive to the information
environment. Specific announcements tend to exert a positive impact on rates of return in the pre-
Lehman failure period, when announcements were few and markets trusted the “normal” information
flow. The opposite occurred in the turbulent phase of the crisis when announcements were frequent
and markets mistrusted the information flow. These results appear consistent with the observed
reluctance of individual institutions to request public assistance. The fear of being identified as a “bad
apple” was also the reason why some banks were reticent to apply at central banks for emergency
lending.
Three other generalizations emerge from our evidence. The first is that market reaction to
rescue announcements is not uniform across areas. In particular, capital injections in the United States,
the country where the crisis originated and the world’s financial leader, exert effects on bank returns
that are different from those in other countries. The second is that markets appear to have valued
timely and big actions without much regard to refinements as to the type of actions undertaken. The
different long-run consequences of different types of interventions were ignored. As it is true in a war,
participants in a financial crisis want to survive: planning horizons are shortened and considerations
that are taken seriously under normal circumstances are instead relegated in the background. This
pattern is consistent with the lessons from the last Nordic and Japanese banking crises: timely and big
25
public interventions solved successfully the crisis in Sweden, whereas untimely and small government
measures led to the lost Japanese decade. It is also consistent with the diminishing benefits from
government interventions that reinforce markets’ perceptions that subsidies are urgent and temporary
anti-crisis measures and should be quickly replaced by structural reforms. The third is that, given that
different announcements produce similar effects, governments might have had incentives to gamble for
opaque and “low-cost” guarantees of bank assets and debts rather than undertake more transparent and
costly alternatives.
Government rescue plans are likely to lead to a consolidation of the banking system. This, in
turn, raises the probability of invoking the too-big-to-fail policy. We find that bank size matters even if
there is not a clear evidence for the too-big-to-fail policy. In one test dealing with cross-bank spillovers
using the largest US banks, our findings are consistent with a mix of resource crowding-out and too-
big-to-fail policy. Clues about the latter also emerge from multiple-event regressions by area. The
resolution of this issue remains unsettled in part because the too-big-to-fail policy may operate not
only on size, but also on the degree of the targeted bank’s interconnectedness with other financial
institutions.
Acknowledgements
We thank Matteo Cassiani for providing us with bank data and Angelo Baglioni and Luca Papi for
comments and suggestions on an earlier version of the paper.
References
Adrian, T., Shin, H.S., 2008. Liquidity and leverage. Federal Reserve Bank of New York available online
at http://www.newyorkfed.org/research/staff_reports/sr328.html.
Ball, R., Brown, P., 1968. An Empirical Evaluation of Accounting Income Numbers. Journal of Accounting Research, 6(2):159-78.
26
Binder, J.J., 1998. The event study methodology since 1969. Review of Quantitative Finance and Accounting, 11:111–137.
BNP Paribas, 2009. To the rescue. Report of Market Economics, Interest Rate Strategy, Credit Strategy
Calomiris, C.W., 2007. Not (yet) a ‘Minsky’ moment. Unpublished paper (October 5).
CNN Money, online. http://money.cnn.com/news/specials/storysupplement/bankbailout/.
Corrado, C.J., 2009. Event Studies: A Methodology Review. Available at SSRN: http://ssrn.com/abstract=1441581.
De Jong, F., 2007. Event Studies Methodology. Lecture Notes. Dell’Ariccia, G., Egan, D., Laeven, L., 2008. Credit booms and lending standards: Evidence from the
subprime mortgage market. International Monetary Fund, Working Paper, WP/08/106.
Demyanyk, Y., van Hemert, O., 2009. Understanding the subprime mortgage crisis. Review of
Financial Studies, RFS Advance Access published online, doi:10.1093/rfs/hhp033
DLA Piper, online. http://www.dlapiper.com/it/austria/news/detail.aspx?news=2858.
Dolley, J.C., 1933. Characteristics and Procedure of Common Stock Split-Ups. Harvard Business Review, 11:316-26.
Fama, E., Fisher, L., Jensen, M., Roll, R., 1969. The adjustment of stock prices to new information. International Economic Review, 10:1-21.
Federal Reserve Bank of St. Louis, online. The Financial Crisis: A Timeline of Events and Policy
Actions. Available online at http://timeline.stlouisfed.org/index.cfm?p=timeline#.
Fisher, I., 1933. The Debt Deflation Theory of Great Depressions. Econometrica, 1; 337-57.
Fratianni, M., 2008. Financial crises, safety nets and regulation. Rivista Italiana degli Economisti, 2:
169-208.
Fratianni, M., Marchionne, F., 2009. The role of banks in the subprime financial crisis. Review of
Economic Conditions in Italy, 2009/1:11-48.
Glauber, R.R., 2000. Discussions of the financial crisis. In: Mikitani, R., Posen, A.S. (Eds), Japan’s
Financial Crisis and Its Parallels to U.S. Experience, Washington, DC, Institute for International
Economics, 101-105.
International Capital Market Association, online. http://www.icmagroup.org/getdoc/d084024f-e709-
46e3-97a6-0b471db7a7ea/Responses-to-market-turbulence--Country-plans.aspx#Australia.
International Monetary Fund, 2008a. Global financial stability report: Containing systemic risks and
restoring financial soundness, April 2008. Washington, DC.
International Monetary Fund, 2008b. Global financial stability report: financial stress and
deleveraging, macrofinancial implications and policy, October 2008. Washington, DC.
27
Kothari, S.P., Warner, J.B., 2006. Econometrics of Event Studies. In: Eckbo. B.E. (Ed.), Handbook of Corporate Finance: Empirical Corporate Finance, Volume A (Handbooks in Finance Series, Elsevier/North-Holland), Ch. 1.
Kindleberger, C.P., 1978 [2000]. Manias, Panics, and Crashes: A History of Financial Crises. 4th
edition, New York: Wiley.
Kothari, S.P., Warner, J.B., 1997. Measuring long-horizon security price performance. Journal of Financial Economics, 43:301-339.
MacKinlay, A.C., 1997. Event Studies in Economics and Finance. Journal of Economic Literature, 35(1):13-39.
Mediobanca, 2009. Sintesi dei principali piani di stabilizzazione finanziaria in Europe e negli Stati Uniti, Aggiornamento al 5 giugno 2009. Ricerche e Studi.
Meulbroek, L.K., 1992. An Empirical Analysis of Illegal Insider Trading. Journal of Finance
47(5):1661-1699.
Minsky, H., 1977. A Theory of Systemic Fragility. In: E. J. Altman and A. W. Sametz (eds). Financial
Crises: Institutions and Markets in a Fragile Environment. New York. Wiley, 138-52.
Mitchell, W.C., 1913. Business Cycles. New York: Burt Franklin.
O'Hara, M., Shaw, W., 1990. Deposit Insurance and Wealth Effects: The Value of Being "Too Big to
Fail”. Journal of Finance, 45(5):1587-1600.
Panetta, F., Faeh, T., Grande, G., Ho, C., King, M., Levy, A., Signoretti, F.M., Taboga, M., Zaghini,
A., 2009. An assessment of financial sector rescue programmes. BIS Paper, 48;
http://www.bis.org/.
Serra, A.P., 2002. Event Study Tests: A Brief Survey. FEP Working Paper n.117.
28
Figure 1: TED spread and TED-equivalent spreads, various countries. Period 1 Period 2 Period 3
0
50
100
150
200
250
300
350
400
450
500
TE
D (
basi
s po
int)
31/07/07 31/12/07 30/06/08 15/09/08 31/12/08 09/03/09 30/06/09 31/12/09
US TED UK TED
Period 1 Period 2 Period 3
0
50
100
150
200
250
300
350
400
450
500
TE
D (
basi
s po
int)
31/07/07 31/12/07 30/06/08 15/09/08 31/12/08 09/03/09 30/06/09 31/12/09
DE TED FR TED IT TED
Period 1 Period 2 Period 3
0
50
100
150
200
250
300
350
400
450
500
TE
D (
basi
s po
int)
31/07/07 31/12/07 30/06/08 15/09/08 31/12/08 09/03/09 30/06/09 31/12/09
HK TED JP TED
NOTES: TED spread is the difference between the three-month dollar LIBOR and the three-month T-bill interest rate (US); TED-equivalent spreads are those of the United Kingdom (UK), Honk-Kong (HK), Japan (JP), Germany (DE), France (FR) and Italy (IT). Source: Bloomberg (February 14, 2010).
29
Figure 2: Cumulative value of general announcements in US$ billion, September 28, 2008- October 18, 2008.
0
1,000
2,000
3,000
4,000
5,000
6,000
7,000
8,000
28/09/08 30/09/08 02/10/08 04/10/08 06/10/08 08/10/08 10/10/08 12/10/08 14/10/08 16/10/08 18/10/08
Cumulative Capital Injection Cumulative Asset and Debt Guarantees
30
Figure 3: Recursive rolling coefficients, estimation window from July 31, 2007 to July 31, 2008. Coefficient Rm Coefficient GALL
1.28
1.30
1.32
1.34
1.36
1.38
1.40
1.42
1.44
Val
ue
31/07/08 15/09/08 31/12/08 06/03/09 30/06/09 31/12/09
Time
0.00
0.01
0.01
0.01
0.02
0.03
0.03
0.04
0.04
Val
ue
31/07/08 15/09/08 31/12/08 06/03/09 30/06/09 31/12/09
Time Coefficient SIZEREL Coefficient SALL
0.20
0.30
0.40
0.50
0.60
0.70
0.80
Val
ue
31/07/08 15/09/08 31/12/08 06/03/09 30/06/09 31/12/09
Time
-0.03
-0.02
-0.01
0.00
0.01
0.02
0.03
0.04
0.05
Val
ue
31/07/08 15/09/08 31/12/08 06/03/09 30/06/09 31/12/09
Time
31
Table 1: Rates of returns in local currency and in dollars of a sample of US, European and Pacific region banks, in percent, July 31, 2007- December 31, 2009. Area Country 31/07/2007 15/09/2008 31/07/2007 09/03/2009 31/07/2007 31/12/2009 LCU EXC USD LCU EXC USD LCU EXC USD Europe AT -37.50 3.38 -35.38 -86.11 -7.84 -87.20 -60.89 4.53 -59.12 BE -39.02 3.38 -36.96 -93.43 -7.84 -93.95 -70.28 4.53 -68.94 DE -46.53 3.38 -44.72 -91.83 -7.84 -92.47 -77.40 4.53 -76.38 EI -60.99 3.38 -59.67 -98.13 -7.84 -98.28 -93.77 4.53 -93.48 ES -36.89 3.38 -34.75 -64.25 -7.84 -67.05 -38.00 4.53 -35.19 FR -43.49 3.38 -41.58 -79.75 -7.84 -81.34 -47.36 4.53 -44.98 GR -31.57 3.38 -29.26 -71.15 -7.84 -73.41 -52.38 4.53 -50.23 IT -33.13 3.38 -30.87 -72.84 -7.84 -74.97 -54.14 4.53 -52.07 NL -37.08 3.38 -34.95 -90.53 -7.84 -91.27 -72.46 4.53 -71.21 PT -59.21 3.38 -57.83 -76.57 -7.84 -78.40 -63.65 4.53 -62.00 CH 14.07 7.38 22.49 15.35 3.32 19.18 17.56 16.05 36.43 DK -41.00 3.20 -39.11 -80.81 -7.92 -82.33 -50.20 4.50 -47.96 NO -30.50 0.46 -30.17 -72.32 -17.77 -77.24 -14.95 0.29 -14.70 SE -39.05 -0.60 -39.42 -72.78 -26.26 -79.93 -34.96 -6.11 -38.93 UK -28.75 -12.21 -37.45 -68.62 -32.44 -78.80 -28.31 -20.61 -43.09
Europe Total -36.71 2.14 -35.31 -73.58 -10.63 -75.83 -49.41 2.63 -48.12 Pacific AU -27.78 -5.98 -32.10 -53.85 -26.57 -66.11 -15.91 4.48 -12.14 HK -2.58 0.39 -2.20 -62.59 0.86 -62.27 -19.04 0.94 -18.28 JP -37.36 13.10 -29.15 -66.61 20.24 -59.85 -67.07 27.38 -58.06
Pacific Total -22.57 2.50 -21.15 -61.02 -1.82 -62.75 -34.01 10.93 -29.49
USA US -32.64 0.00 -32.64 -72.53 0.00 -72.53 -41.44 0.00 -41.44
USA Total -32.64 0.00 -32.64 -72.53 0.00 -72.53 -41.44 0.00 -41.44 NOTES: LCU = rate of return in local-currency units; EXC = depreciation (-)/appreciation (+) of the US dollar relative to the local currency; USD = rate of return in dollars; AT=Austria; BE=Belgium; CH=Switzerland; DE=Germany; DK=Denmark; EI=Eire; ES=Spain; FR=France; GR=Greece; IT=Italy; NO=Norway; NL=Netherlands; PT=Portugal; SE=Sweden; UK=United Kingdom; AU=Australia; HK=Hong-Kong; JP=Japan; US=United States. CME Group Inc., Discover Financial Services, Fukuoka Financial Group, and Invesco Ltd were excluded from the sample of 122 banks because they did not make the list at the end of July 2007. As CIT Group filed for Chapter 11 bankruptcy protection, it is excluded from November 2009. Source: Bloomberg (February 14, 2010).
32
Table 2: Descriptive statistics Pre-Lehman failure period (31/07/2007-14/09/2008): 33,610 obs.
Variable Mean S.D. Min Q1 Median Q3 Max Ri -0.09% 3.04% -58.67% -1.71% -0.11% 1.34% 40.85% Rm -0.07% 1.51% -8.65% -0.95% 0.00% 0.76% 10.72% SIZEi 33,287 45,319 956 7,055 15,353 40,459 320,147 SIZEm 4,235,453 444,594 2,610,880 3,901,534 4,246,899 4,594,350 5,132,827 SIZEREL 0.79% 1.07% 0.02% 0.17% 0.37% 0.98% 8.38%
Post-Lehman failure period (15/09/2008-31/12/2009): 38,760 obs.
Variable Mean S.D. Min Q1 Median Q3 Max Ri 0.03% 5.36% -75.15% -2.20% 0.00% 2.03% 86.98% Rm 0.00% 2.46% -13.03% -1.11% 0.04% 1.15% 14.35% SIZEi 21,802 36,192 98 3,780 7,463 22,183 302,481 SIZEm 2,791,859 738,404 1,314,889 2,188,021 2,694,310 3,551,743 3,950,598 SIZEREL 0.78% 1.25% 0.00% 0.15% 0.28% 0.86% 9.83%
LEGEND Name Formula Description
Ri 1,
1,,
−
−−=
ti
titi
PX
PXPX Daily rate of return of the bank i (PX=stock price in local current
unit)
Rm 1,
1,,
−
−−=
tm
tmtm
PX
PXPX Daily rate of return of the national stock exchange where bank i is
located (PX=stock index)
SIZEi tititi DEXShPX ,,, ⋅⋅= Daily market capitalization of bank i (PX=stock price in local current unit; Sh=number of share; DEX=Daily exchange rate)
SIZEm ∑=
=122
1iiSIZE UKi ∉ Daily market capitalization of all banks in the sample excluded
UK banks
SIZEREL tm
ti
SIZE
SIZE
,
,= Relative market capitalization of bank i
33
Table 3: Effects of general and specific announcements on banks’ rates of return. . All Announcements . . Announcements by type .
AREA PERIOD VARIABLES
WORLD PRE WORLD POST WORLD POST WORLD POST WORLD POST WORLD POST USA POST EUROPE POST PACIFIC POST (1) (2) (3) (4) (5) (6) (7) (8) (9)
Constant -0.00342*** -0.00471*** -0.00470*** -0.00476*** -0.00472*** -0.00471*** -0.00516*** -0.00614*** -0.00366***
Rm 1.346*** 1.409*** 1.418*** 1.418*** 1.409*** 1.422*** 1.818*** 1.283*** 1.048***
SIZEREL 0.441*** 0.581*** 0.579*** 0.588*** 0.581*** 0.581*** 0.765*** 1.195*** 0.210***
GALL 0.00745*** 0.00725*** 0.00781***
Rm*GALL -0.0720*** -0.0714***
SIZEREL*GALL -0.0756
GCAP 0.00758*** 0.00812*** 0.0112*** 0.00220 0.00655***
Rm*GCAP 0.262*** 0.421*** -0.103** 0.0138
GGUA 0.00288* 0.000994 0.00425 -0.00330# 0.00634***
Rm*GGUA -0.552*** -1.128*** -0.140*** -0.0312
SALL 0.0177* -0.00347** -0.00351** -0.00293
Rm*SALL 0.123** 0.125**
SIZEREL*SALL -0.0642
SCAP -0.00471** -0.00491** -0.00582* -0.00384# -
Rm*SCAP 0.136** -0.398*** 0.515*** -
SGUA 0.000896 0.00103 0.0138 -4.13e-05 -
Rm*SGUA 0.383*** 1.725*** 0.249** -
Observations 33,189 38,745 38,745 38,745 38,745 38,745 15,060 15,065 8,620
R2 0.447 0.420 0.420 0.420 0.420 0.424 0.435 0.433 0.562
Number of bank 116 116 116 116 116 116 45 45 26
WALD Test (Prob > F) 0.0831 0 0 0 0 0 0 0 0
Hausman Test (Prob > chi2) 0 0 0 0 0 0 0.0329 0.00250 0.0649
SIZEREL (mean) 0.347% 0.456% 0.454% 0.461% 0.456% 0.456% 0.600% 0.937% 0.165%
Q1=Hypo Real Estate 0.068% 0.028% 0.028% 0.029% 0.028% 0.028%
Q2=Banca Monte dei Paschi di Siena 0.174% 0.262% 0.261% 0.265% 0.262% 0.262%
Q3=Bank of New York Mellon 0.488% 0.721% 0.719% 0.730% 0.721% 0.721%
CAR=GALL*7 5.215% 5.075% 5.467%
CAR=GCAP*7 5.306% 5.684% 7.840% - 4.585%
CAR=GGUA*7 2.016% - - -2.310% 4.438%
CAR=SALL*5 8.850% -1.735% -1.755% -
CAR=SCAP*5 -2.355% -2.455% -2.910% -1.920% -
CAR=SGUA*5 - - - - - NOTES: PRE = 31/07/2007 to 14/09/2008; POST = 15/09/2008 to 31/12/2009. Rm = daily rate of return of the national stock exchange where bank i is located; SIZEREL = relative market capitalization; G (S) = general (specific) announcement dummy; ALL = all types; CAP = capital injections; GUA = asset and debt guarantees. Qx = Quartile x. CAR = cumulative abnormal returns with 7 (5) day windows for general (specific) announcements. All estimations include bank fixed effects; UK banks excluded. WALD vs null announcement effects; Hausman Test vs random effects. *** p<0.01 ** p<0.05 * p<0.10 # p<0.15.
34
Table 4: Cross-area effects of general announcements on banks’ rates of return, POST period. . Base Model . . Expanded Model .
AREA VARIABLES
USA EUROPE PACIFIC USA EUROPE PACIFIC (1) (2) (3) (4) (5) (6)
Constant -0.00498*** -0.00460*** -0.00392*** -0.00545*** -0.00461*** -0.00382*** Rm 1.752*** 1.256*** 1.049*** 2.072*** 1.378*** 1.084*** SIZEREL 0.751*** 1.035*** 0.221*** 0.762*** 1.011*** 0.210*** GALL 0.0130*** -0.000241 0.00551*** 0.0115*** -0.000276 0.00549*** Rm*GALL 0.121** -0.0793** 0.00425 SALL -0.00515* -0.000702 -0.00525* -0.000826 Rm*SALL -0.304*** 0.368*** XAGUSA 0.00773*** 0.00174# 0.00699*** 0.00153# Rm*XAGUSA 0.105** 0.0859** XAGEUROPE 0.000469 -0.00464*** -0.000879# 0.000990 -0.00466*** -0.000739 Rm*XAGEUROPE -0.378*** -0.181*** -0.0677*** XAGPACIFIC -0.00280* -0.00143# 0.00343*** -0.00177 -0.00153# 0.00355*** Rm*XAGPACIFIC -0.472*** -0.201*** -0.0626# Observations 15,060 15,065 8,620 15,060 15,065 8,620 R2 0.423 0.433 0.563 0.431 0.438 0.563 Number of bank 45 45 26 45 45 26 WALD Test (Prob > F) 0.130 0 0.000200 0 0 0 Hausman Test (Prob > chi2) 0.00620 0.00540 0.0873 0.0441 0.0513 0.429 CAR=XAGUSA*7 5.411% 1.218% 4.893% 1.071% CAR=XAGEUROPE*7 - -3.248% -0.609% - -3.262% - CAR=XAGPACIFIC*7 -1.960% -1.001% 2.401% - -1.071% 2.485% NOTES: POST = 15/09/2008 to 31/12/2009. Rm = daily rate of return of the national stock exchange where bank i is located; SIZEREL = relative market capitalization of bank i; G (S) = general (specific) announcement dummy; ALL = all announcement types (capital injections and asset and debt guarantees). XAGx = cross-area general announcement from multi-country x area: it excludes bank i’s home country announcements. CAR = cumulative abnormal returns with 7 day windows. All estimations include bank fixed effects; UK banks excluded. WALD vs null cross-area general announcement effects; Hausman Test vs random effects. *** p<0.01 ** p<0.05 * p<0.10 # p<0.15.
35
Table 5: Cross-bank effects of specific announcements on banks’ rates of return; POST period. . Base Model . . Expanded Model .
GROUP AREA
VARIABLES
1ST Tertile 2ND Tertile 3RD Tertile 1ST Tertile 2ND Tertile 3RD Tertile USA USA USA USA USA USA (1) (2) (3) (4) (5) (6)a
Constant -0.0107*** -0.0144*** -0.00852*** -0.0107*** -0.0144*** -0.00854*** Rm 1.702*** 1.720*** 1.821*** 1.779*** 1.790*** 1.883*** SIZEREL 9.241*** 4.941*** 0.613*** 9.313*** 4.972*** 0.613*** GALL 0.0142*** 0.0132*** 0.0101*** 0.0137*** 0.0128*** 0.00973*** Rm* GALL -0.293*** -0.244*** -0.200*** SALL 0.00521 0.00966 -0.00515 0.00310 0.00782 -0.00487 Rm* SALL -0.576** -0.555*** -0.217** XAGEUROPE -0.00313 0.000857 0.000280 -0.00331 0.000706 0.000293 XAGPACIFIC -0.00139 -0.00515** -0.00386* -0.00124 -0.00515** -0.00381* XBS 1ST Tertile -0.00532** -0.00658*** -0.00335* -0.00517** -0.00658*** -0.00332* XBS 2
ND Tertile 0.00119 0.00311 0.00304 0.000890 0.00303 0.00294 XBS 3RD Tertile 0.000947 0.000072 -0.00133** 0.000879 0.000025 -0.00130** Observations 5,010 5,025 5,025 5,010 5,025 5,025 R2 0.338 0.474 0.492 0.340 0.477 0.493 Number of bank 15 15 15 15 15 15 F-Test (Prob > F) 0 0 0 0 0 0 WALD Test (Prob > chi2) 0 0 0 0 0 0 Hausman Test (Prob > chi2) 0.00700 0.000500 0.0944 0.0317 0.00200 0.138 CAR=XGS 1ST Tertile*5 -2.660% -3.290% -1.675% -2.585% -3.290% -1.660% CAR=XGS 2
ND Tertile*5 - - - - - - CAR=XGS 3RD Tertile*5 - - -0.665% - - -0.650% NOTES: POST = 15/09/2008 to 31/12/2009; Rm = daily rate of return of the national stock exchange where bank i is located; SIZEREL = relative market capitalization of bank i; G (S) = general (specific) announcement dummy; ALL = all announcement types (capital injections and asset and debt guarantees). XAGx = cross-area general announcement from x. XBS XTH group = cross-group specific announcement from xth group. XBS on itself excludes bank i’s announcements. CAR = cumulative abnormal returns with 5-day windows. All estimations include bank fixed effects; UK banks excluded. WALD vs null cross-group specific announcement effects; Hausman Test vs random effects. *** p<0.01 ** p<0.05 * p<0.10 # p<0.15.
36
Table 6: Cross-bank specific announcements on banks’ rates of return; top seven US banks; POST period.
BANK .
VARIABLES
BANK OF AMERICA
JP MORGAN CITIGROUP WELLS FARGO
GOLDMAN SACHS
MORGAN STANLEY
AMERICAN EXPRESS
(1) (2) (3) (4) (5) (6) (7)
Constant 0.000870 0.00102 -0.00138 0.00161 0.00135 -0.000502 0.00319
Rm 2.251*** 1.764*** 2.187*** 1.855*** 1.501*** 2.546*** 1.665***
GALL 0.0185 0.00714 0.0107 0.00182 0.00641 0.0124 0.00318
SALL -0.0408** 0.00634 -0.00161 0.0313* -0.0244 -0.0134 -0.00267
XAGEUROPE 0.00277 0.00670 -0.00395 0.00327 0.00183 0.0137 -0.00306
XAGPACIFIC -0.00804 -0.000623 0.00732 0.00371 0.00749 0.00336 -0.00912
XBSBANK OF AMERICA -0.0141 -0.0418** -0.0235* -0.00986 -0.00924 -0.00736
XBSJPMORGAN 0.00332 -0.00845 0.00905 -0.0141 -0.0121 0.0148
XBSCITIGROUP -0.00584 -0.0164 -0.0104 0.00612 -0.00342 0.000906
XBSWELLS FARGO 0.0506** 0.0182 0.0588*** 0.00959 0.0103 0.0111
XBSGOLDMAN SACHS -0.0326 -0.0189 -0.0542** -0.0317* -0.0265 -0.00510
XBSMORGAN STANLEY 0.0126 0.00789 0.0423* 0.00332 -0.00703 -0.0118*
XBSAMERICA EXPRESS 0.0229* 0.00667 0.0292 0.0134 -0.00149 0.0178*
Observations 335 335 335 335 335 335 335
R2 0.518 0.585 0.420 0.502 0.570 0.576 0.661
F Test (Prob > F) 0 0 0 0 0 0 0
WALD Test (Prob > F) 0.0766 0.0888 0.0119 0.131 0.612 0.281 0.549
CARBANK OF AMERICA=XBSBANK OF AMERICA*5 - -20.90% -11.75% - - -
CARJPMORGAN=XBSJPMORGAN*5 - - - - - -
CARCITIGROUP=XBSCITIGROUP*5 - - - - - -
CARWELLS FARGO=XBSWELLS FARGO*5 25.30% - 29.40% - - -
CARGOLDMAN SACHS=XBSGOLDMAN SACHS*5 - - -27.10% -15.85% - -
CARMORGAN STANLEY=XBSMORGAN STANLEY*5 - - 21.15% - - -5.90%
CARAMERICA EXPRESS=XBSAMERICA EXPRESS*5 11.45% - - - - 8.90% NOTES: POST = 15/09/2008 to 31/12/2009; Rm = daily rate of return of the national stock exchange where bank i is located; G (S) = general (specific) announcement dummy; ALL = all announcement types (capital injections and asset and debt guarantees). XAGx = cross-area general announcement from area x. XBSx = cross-bank specific announcement from xth bank. CAR = cumulative abnormal returns with 5 day windows. All estimations with OLS and robust standard errors. WALD vs null cross-bank specific announcement effects. Banks ranked according to market capitalization on June 30, 2008. *** p<0.01 ** p<0.05 * p<0.10 # p<0.15.
37
Table 7: Effects of cumulative specific announcements on banks’ rates of return by area, POST period. . Model 1 . . Model 2 .
AREA VARIABLES
WORLD USA EUROPE WORLD USA EUROPE
(1) (2) (3) (4) (5) (6)
Constant -0.00444*** -0.000910* -0.00638*** -0.00434*** -0.000986* -0.00621***
Rm 1.279*** 1.664*** 1.162*** 1.279*** 1.664*** 1.162***
SIZEREL 0.497*** 0.253** 1.108*** 0.487*** 0.260** 1.076***
GALL 0.00788*** 0.0129*** 0.000773 0.00788*** 0.0130*** 0.000761
Rm*GALL -0.0358# -0.241*** -0.100*** -0.0358# -0.241*** -0.0998***
CUM1S≥1*Rm 0.572*** 0.396*** 0.431*** 0.572*** 0.347*** 0.425***
CUM1S≥1*SIZEREL 0.0535 -0.204* 0.219* 0.0700 -0.148 0.184#
CUM1S≥1*GALL -0.00759*** -0.0107*** -0.0103** -0.00495** -0.0109*** 0.0114*
CUM1S≥1*Rm*GALL 0.491*** 0.673*** 0.219* 0.453*** 0.554*** 0.550***
CUM2S≥2*Rm 0.000204 0.234*** 0.0130
CUM2S≥2*SIZEREL -0.0440 -0.0913 0.0801
CUM2S≥2*GALL -0.0110** -0.00308 -0.0384***
CUM2S≥2* Rm*GALL 0.164 0.762*** -0.612***
Bank Effect FE RE FE FE RE FE
Observations 38,745 15,060 15,065 38,745 15,060 15,065
R2 0.434 0.432 0.442 0.434 0.433 0.443
Number of bank 116 45 45 116 45 45
F-Test (Prob > F) 0 0 0 0 0 0
WALD Test (Prob > chi2) 0 0 0 0 0 0
Hausman Test (Prob > chi2) 0 0.123 0.000600 0.00120 0.402 0.0106
CAR=CUMS≥1*GALL*7 -5.313% -7.490% -7.210% -3.465% -7.630% 7.980%
CAR=CUMS≥2*GALL*7 -7.700% - -26.880% NOTES: POST = 15/09/2008 to 31/12/2009; Rm = daily rate of return of the national stock exchange where bank i is located; SIZEREL = relative market capitalization of bank i; G = general announcement dummy; ALL = all announcement types (capital injections and asset and debt guarantees). In Model 1, CUM1 = 1 when bank i has received at least 1 specific announcements, 0 otherwise. In Model 2, CUM1 = 1 when bank i has received only 1 specific announcements, 0 otherwise; CUM2 = 1 when bank i has received at least 2 specific announcements; 0 otherwise. CAR = cumulative abnormal returns with 5 day windows. All estimations include bank specific effects but fixed or random effects are reported according to the Hausman Test; UK banks excluded. WALD vs null cumulative specific announcement effects. No specific announcements in the Pacific area (not reported). *** p<0.01 ** p<0.05 * p<0.10 # p<0.15.

38
Appendix
Table A1: List of banks included in market capitalization Area Country Bank Nr. Bank Name
Europe
AT 2 ERSTE GROUP BANK AG, RAIFFEISEN INTL BANK HOLDING BE 2 DEXIA SA, KBC GROEP NV CH 1 VALIANT HOLDING AG-REG DE 3 COMMERZBANK AG, DEUTSCHE POSTBANK AG, HYPO REAL ESTATE HOLDING DK 3 DANSKE BANK A/S, JYSKE BANK-REG, SYDBANK A/S
ES 6 BANCO BILBAO VIZCAYA ARGENTA, BANCO DE VALENCIA SA, BANCO POPULAR ESPANOL, BANCO SANTANDER SA, BANKINTER SA
FR 4 BNP PARIBAS, CREDIT AGRICOLE SA, NATIXIS, SOCIETE GENERALE
GR 5 ALPHA BANK A.E., BANK OF GREECE, EFG EUROBANK ERGASIAS, NATIONAL BANK OF GREECE, PIRAEUS BANK S.A.
IE 1 ALLIED IRISH BANKS PLC
IT 8 BANCA CARIGE SPA, BANCA MONTE DEI PASCHI SIENA, BANCA POPOLARE DI MILANO, BANCO POPOLARE SCARL, INTESA SANPAOLO, PICCOLO CREDITO VALTELLINESE, UBI BANCA SCPA, UNICREDIT SPA
NL 2 ING GROEP, SNS REAAL
NO 1 DNB NOR ASA PT 3 BANCO BPI SA, BANCO COMERCIAL PORTUGUES, BANCO ESPIRITO SANTO
SE 4 NORDEA BANK AB, SKANDINAVISKA ENSKILDA, SVENSKA HANDELSBANKEN SHS, SWEDBANK AB
UK 6 BANK OF IRELAND, BARCLAYS PLC, HSBC HOLDINGS PLC, LLOYDS BANKING GROUP PLC, ROYAL BANK OF SCOTLAND, STANDARD CHARTERED PLC
Pacific
AU 6 AUST AND NZ BANKING GROUP, BANK OF QUEENSLAND LTD, BENDIGO AND ADELAIDE BANK, COMMONWEALTH BANK OF AUSTRALIA, NATI ONAL AUSTRALIA BANK LTD, WESTPAC BANKING CORP
HK 8 BANK OF CHINA LTD, BANK OF COMMUNICATIONS CO, BANK OF EAST ASIA, BOC HONG KONG HOLDINGS LTD, CHINA CONSTRUCTION BANK, HANG SENG BANK LTD, HSBC HOLDINGS PLC, IND & COMM BANK OF CHINA
JP 12
BANK OF YOKOHAMA LTD, CHIBA BANK LTD, CHUO MITSUI TRUST HOLDINGS, FUKUOKA FINANCIAL GROUP INC., MITSUBISHI UFJ FINANCIAL GROUP, MIZUHO FINANCIAL GROUP INC, MIZUHO TRUST & BANKING CO, RESONA HOLDINGS INC, SHINSEI BANK LTD, SHIZUOKA BANK LTD, SUMITOMO MITSUI FINANCIAL GROUP, SUMITOMO TRUST & BANKING CO
USA US 45
AMERICAN CAPITAL LTD, AMERICAN EXPRESS CO, AMERIPRISE FINANCIAL INC, BANK OF AMERICA CORP, BANK OF NEW YORK MELLON CORP, BB&T CORP, CAPITAL ONE FINANCIAL CORP, CIT GROUP INC, CITIGROUP INC, CMA GROUP INC, COMERICA INC, DISCOVERY FINANCIAL SERVICES, E*TRADE FINANCIAL CORP, FEDERATED INVESTORS INC, FIFTH THIRD BANCORP, FIRST HORIZON NATIONAL CORP, FRANKLIN RESOURCES INC, GOLDMAN SACHS GROUP INC, HUDSON CITY BANCORP INC, HUNTINGTON BANCSHARES INC, INTERCONTINENTALEXCHANGE INC, INVESCO LTD, JANUS CAPITAL GROUP INC, JPMORGAN CHASE & CO, KEYCORP, LEGG MASON INC, LEUCADIA NATIONAL CORP, M & T BANK CORP, MARSHALL & ILSLEY CORP, MOODY'S CORP, MORGAN STANLEY, NASDAQ OMX GROUP, NORTHERN TRUST CORP, NYSE EURONEXT, PEOPLE'S UNITED FINANCIAL, PNC FINANCIAL SERVICES GROUP, REGIONS FINANCIAL CORP, SCHWAB (CHARLES) CORP, SLM CORP, STATE STREET CORP, SUNTRUST BANKS INC, T ROWE PRICE GROUP INC, US BANCORP, WELLS FARGO & CO, ZIONS BANCORPORATION
NOTES: AT=Austria; BE=Belgium; CH=Switzerland; DE=Germany; DK=Denmark; EI=Eire; ES=Spain; FR=France; GR=Greece; IT=Italy; NO=Norway; NL=Netherlands; PT=Portugal; SE=Sweden; UK=United Kingdom; AU=Australia; HK=Hong-Kong; JP=Japan; US=United States.
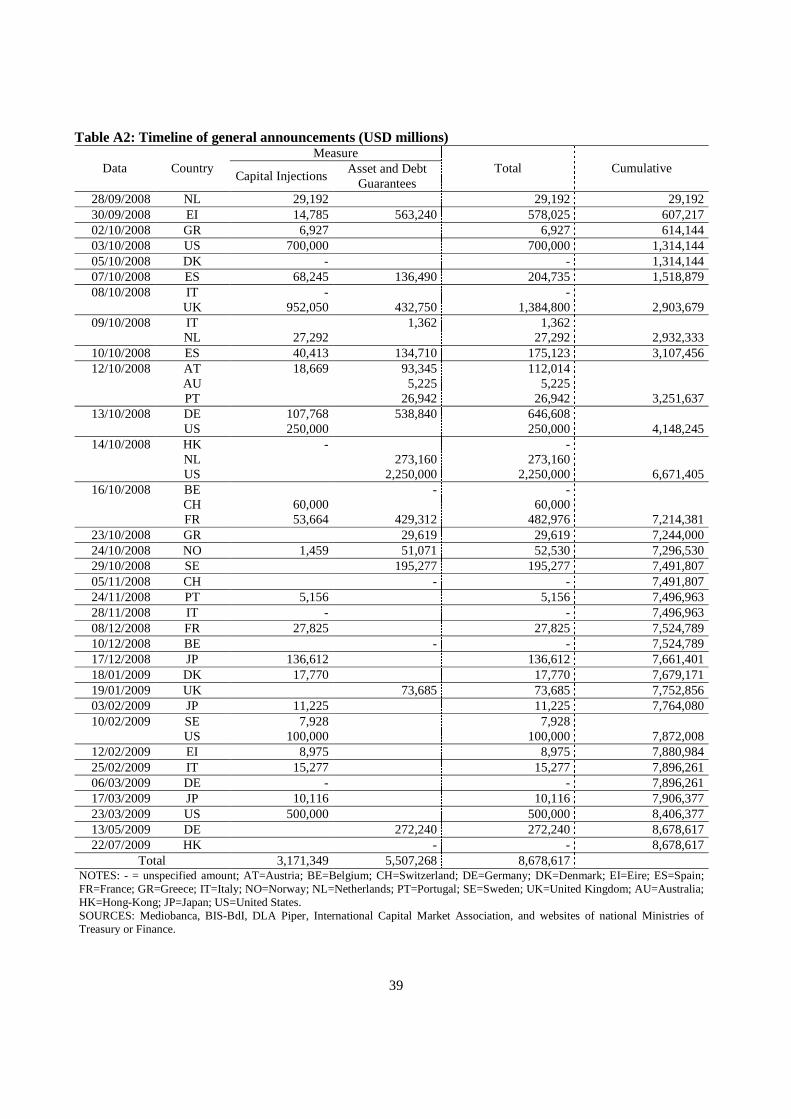
39
Table A2: Timeline of general announcements (USD millions)
Data Country Measure
Total Cumulative Capital Injections
Asset and Debt Guarantees
28/09/2008 NL 29,192 29,192 29,192 30/09/2008 EI 14,785 563,240 578,025 607,217 02/10/2008 GR 6,927 6,927 614,144 03/10/2008 US 700,000 700,000 1,314,144 05/10/2008 DK - - 1,314,144 07/10/2008 ES 68,245 136,490 204,735 1,518,879 08/10/2008 IT - -
UK 952,050 432,750 1,384,800 2,903,679 09/10/2008 IT 1,362 1,362
NL 27,292 27,292 2,932,333 10/10/2008 ES 40,413 134,710 175,123 3,107,456 12/10/2008 AT 18,669 93,345 112,014
AU 5,225 5,225 PT 26,942 26,942 3,251,637
13/10/2008 DE 107,768 538,840 646,608 US 250,000 250,000 4,148,245
14/10/2008 HK - - NL 273,160 273,160 US 2,250,000 2,250,000 6,671,405
16/10/2008 BE - - CH 60,000 60,000 FR 53,664 429,312 482,976 7,214,381
23/10/2008 GR 29,619 29,619 7,244,000 24/10/2008 NO 1,459 51,071 52,530 7,296,530 29/10/2008 SE 195,277 195,277 7,491,807 05/11/2008 CH - - 7,491,807 24/11/2008 PT 5,156 5,156 7,496,963 28/11/2008 IT - - 7,496,963 08/12/2008 FR 27,825 27,825 7,524,789 10/12/2008 BE - - 7,524,789 17/12/2008 JP 136,612 136,612 7,661,401 18/01/2009 DK 17,770 17,770 7,679,171 19/01/2009 UK 73,685 73,685 7,752,856 03/02/2009 JP 11,225 11,225 7,764,080 10/02/2009 SE 7,928 7,928
US 100,000 100,000 7,872,008 12/02/2009 EI 8,975 8,975 7,880,984 25/02/2009 IT 15,277 15,277 7,896,261 06/03/2009 DE - - 7,896,261 17/03/2009 JP 10,116 10,116 7,906,377 23/03/2009 US 500,000 500,000 8,406,377 13/05/2009 DE 272,240 272,240 8,678,617 22/07/2009 HK - - 8,678,617
Total 3,171,349 5,507,268 8,678,617 NOTES: - = unspecified amount; AT=Austria; BE=Belgium; CH=Switzerland; DE=Germany; DK=Denmark; EI=Eire; ES=Spain; FR=France; GR=Greece; IT=Italy; NO=Norway; NL=Netherlands; PT=Portugal; SE=Sweden; UK=United Kingdom; AU=Australia; HK=Hong-Kong; JP=Japan; US=United States. SOURCES: Mediobanca, BIS-BdI, DLA Piper, International Capital Market Association, and websites of national Ministries of Treasury or Finance.
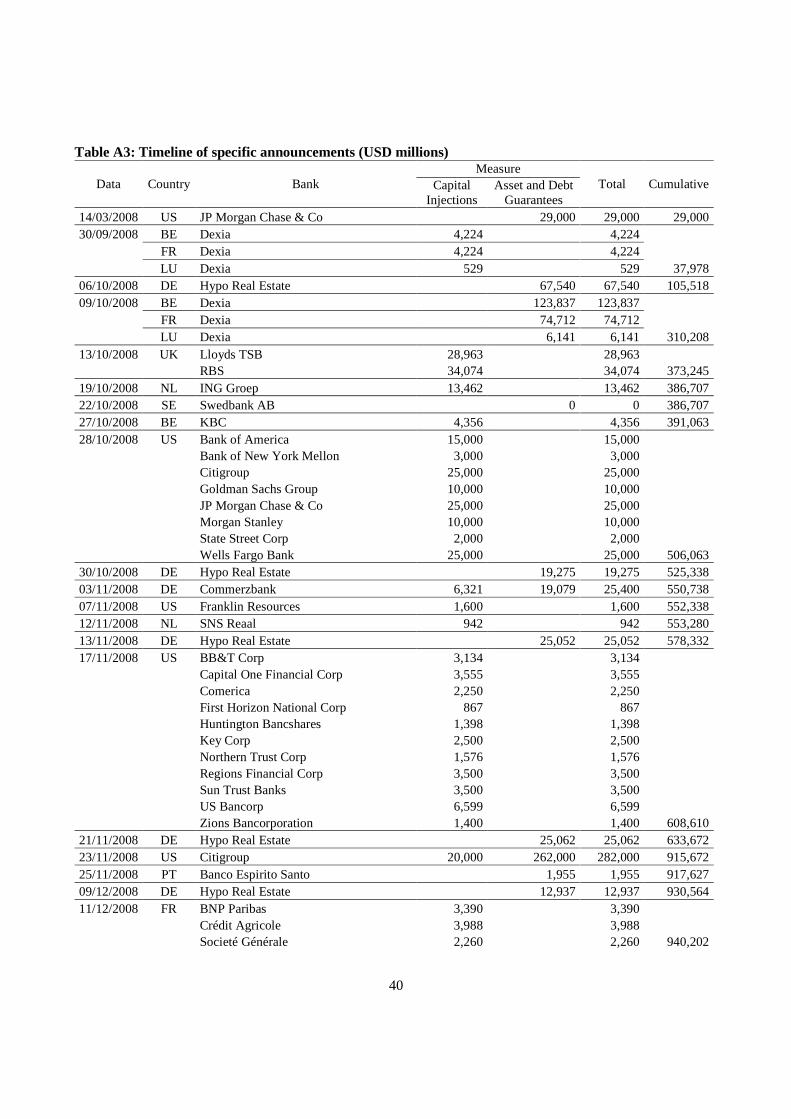
40
Table A3: Timeline of specific announcements (USD millions)
Data Country Bank Measure
Total Cumulative Capital Injections
Asset and Debt Guarantees
14/03/2008 US JP Morgan Chase & Co 29,000 29,000 29,000 30/09/2008 BE Dexia 4,224 4,224 FR Dexia 4,224 4,224 LU Dexia 529 529 37,978 06/10/2008 DE Hypo Real Estate 67,540 67,540 105,518 09/10/2008 BE Dexia 123,837 123,837 FR Dexia 74,712 74,712 LU Dexia 6,141 6,141 310,208 13/10/2008 UK Lloyds TSB 28,963 28,963 RBS 34,074 34,074 373,245 19/10/2008 NL ING Groep 13,462 13,462 386,707 22/10/2008 SE Swedbank AB 0 0 386,707 27/10/2008 BE KBC 4,356 4,356 391,063 28/10/2008 US Bank of America 15,000 15,000 Bank of New York Mellon 3,000 3,000 Citigroup 25,000 25,000 Goldman Sachs Group 10,000 10,000 JP Morgan Chase & Co 25,000 25,000 Morgan Stanley 10,000 10,000 State Street Corp 2,000 2,000 Wells Fargo Bank 25,000 25,000 506,063 30/10/2008 DE Hypo Real Estate 19,275 19,275 525,338 03/11/2008 DE Commerzbank 6,321 19,079 25,400 550,738 07/11/2008 US Franklin Resources 1,600 1,600 552,338 12/11/2008 NL SNS Reaal 942 942 553,280 13/11/2008 DE Hypo Real Estate 25,052 25,052 578,332 17/11/2008 US BB&T Corp 3,134 3,134 Capital One Financial Corp 3,555 3,555 Comerica 2,250 2,250 First Horizon National Corp 867 867 Huntington Bancshares 1,398 1,398 Key Corp 2,500 2,500 Northern Trust Corp 1,576 1,576 Regions Financial Corp 3,500 3,500 Sun Trust Banks 3,500 3,500 US Bancorp 6,599 6,599 Zions Bancorporation 1,400 1,400 608,610 21/11/2008 DE Hypo Real Estate 25,062 25,062 633,672 23/11/2008 US Citigroup 20,000 262,000 282,000 915,672 25/11/2008 PT Banco Espirito Santo 1,955 1,955 917,627 09/12/2008 DE Hypo Real Estate 12,937 12,937 930,564 11/12/2008 FR BNP Paribas 3,390 3,390 Crédit Agricole 3,988 3,988 Societé Générale 2,260 2,260 940,202
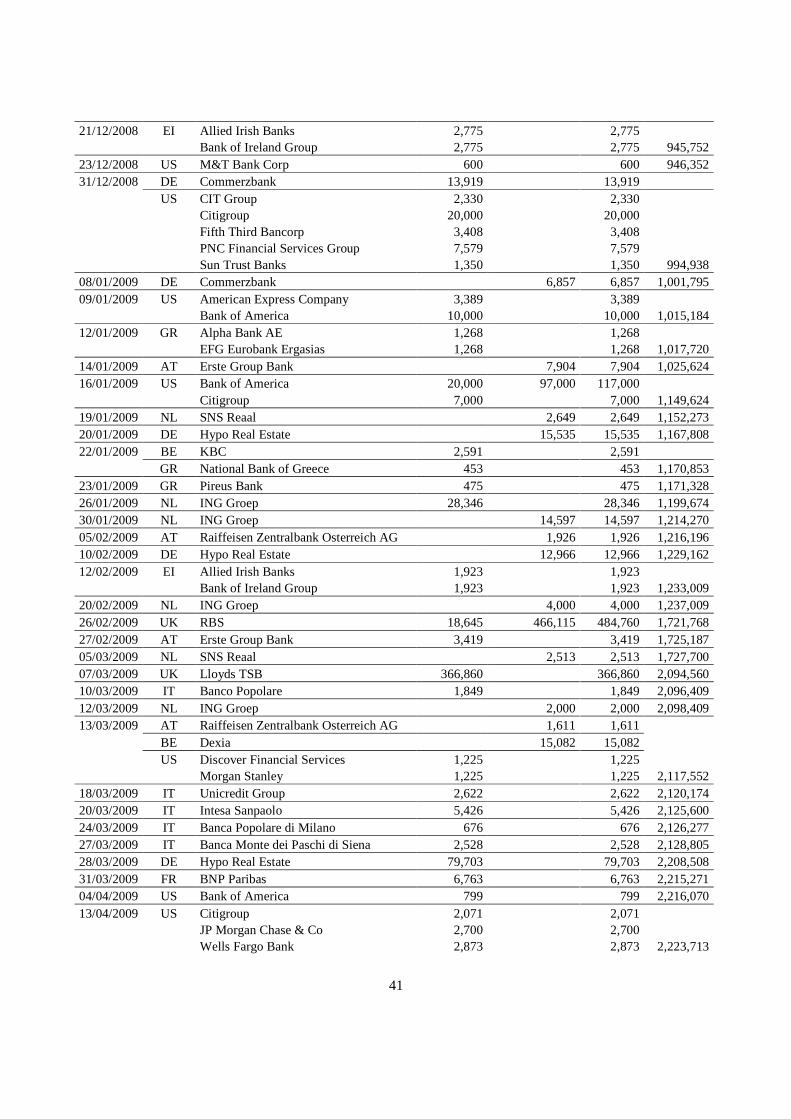
41
21/12/2008 EI Allied Irish Banks 2,775 2,775 Bank of Ireland Group 2,775 2,775 945,752 23/12/2008 US M&T Bank Corp 600 600 946,352 31/12/2008 DE Commerzbank 13,919 13,919 US CIT Group 2,330 2,330 Citigroup 20,000 20,000 Fifth Third Bancorp 3,408 3,408 PNC Financial Services Group 7,579 7,579 Sun Trust Banks 1,350 1,350 994,938 08/01/2009 DE Commerzbank 6,857 6,857 1,001,795 09/01/2009 US American Express Company 3,389 3,389 Bank of America 10,000 10,000 1,015,184 12/01/2009 GR Alpha Bank AE 1,268 1,268 EFG Eurobank Ergasias 1,268 1,268 1,017,720 14/01/2009 AT Erste Group Bank 7,904 7,904 1,025,624 16/01/2009 US Bank of America 20,000 97,000 117,000 Citigroup 7,000 7,000 1,149,624 19/01/2009 NL SNS Reaal 2,649 2,649 1,152,273 20/01/2009 DE Hypo Real Estate 15,535 15,535 1,167,808 22/01/2009 BE KBC 2,591 2,591 GR National Bank of Greece 453 453 1,170,853 23/01/2009 GR Pireus Bank 475 475 1,171,328 26/01/2009 NL ING Groep 28,346 28,346 1,199,674 30/01/2009 NL ING Groep 14,597 14,597 1,214,270 05/02/2009 AT Raiffeisen Zentralbank Osterreich AG 1,926 1,926 1,216,196 10/02/2009 DE Hypo Real Estate 12,966 12,966 1,229,162 12/02/2009 EI Allied Irish Banks 1,923 1,923 Bank of Ireland Group 1,923 1,923 1,233,009 20/02/2009 NL ING Groep 4,000 4,000 1,237,009 26/02/2009 UK RBS 18,645 466,115 484,760 1,721,768 27/02/2009 AT Erste Group Bank 3,419 3,419 1,725,187 05/03/2009 NL SNS Reaal 2,513 2,513 1,727,700 07/03/2009 UK Lloyds TSB 366,860 366,860 2,094,560 10/03/2009 IT Banco Popolare 1,849 1,849 2,096,409 12/03/2009 NL ING Groep 2,000 2,000 2,098,409 13/03/2009 AT Raiffeisen Zentralbank Osterreich AG 1,611 1,611 BE Dexia 15,082 15,082 US Discover Financial Services 1,225 1,225 Morgan Stanley 1,225 1,225 2,117,552 18/03/2009 IT Unicredit Group 2,622 2,622 2,120,174 20/03/2009 IT Intesa Sanpaolo 5,426 5,426 2,125,600 24/03/2009 IT Banca Popolare di Milano 676 676 2,126,277 27/03/2009 IT Banca Monte dei Paschi di Siena 2,528 2,528 2,128,805 28/03/2009 DE Hypo Real Estate 79,703 79,703 2,208,508 31/03/2009 FR BNP Paribas 6,763 6,763 2,215,271 04/04/2009 US Bank of America 799 799 2,216,070 13/04/2009 US Citigroup 2,071 2,071 JP Morgan Chase & Co 2,700 2,700 Wells Fargo Bank 2,873 2,873 2,223,713
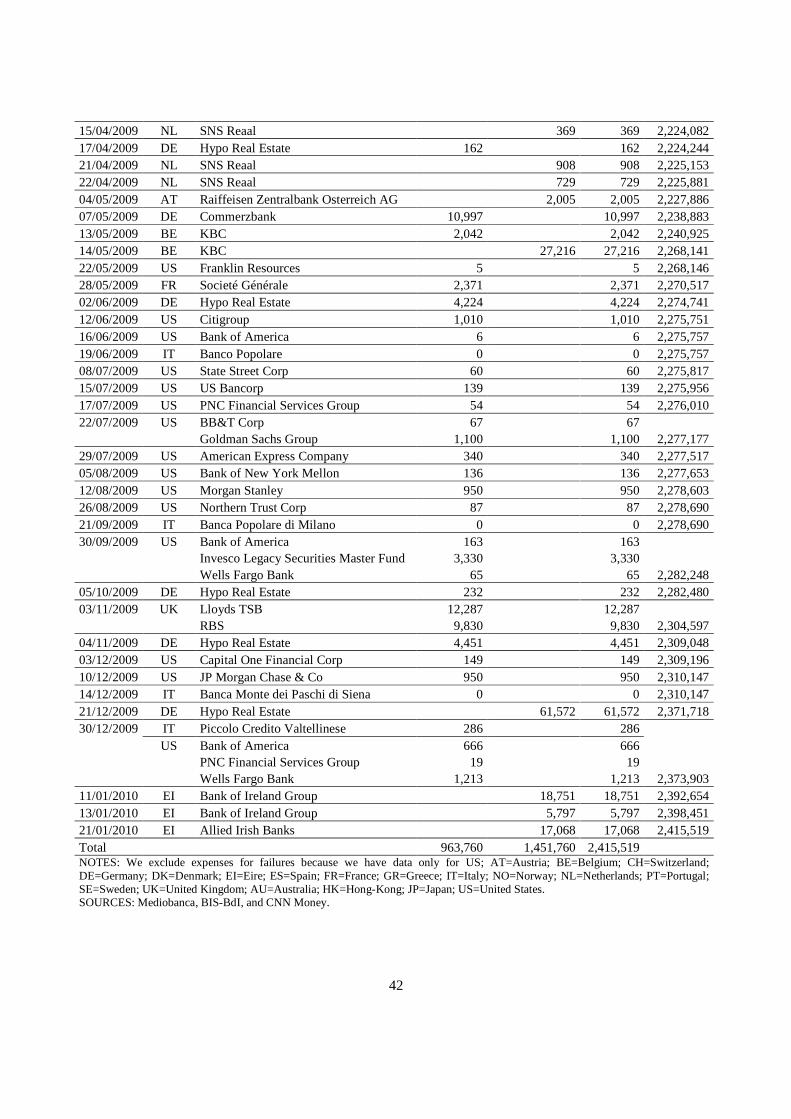
42
15/04/2009 NL SNS Reaal 369 369 2,224,082 17/04/2009 DE Hypo Real Estate 162 162 2,224,244 21/04/2009 NL SNS Reaal 908 908 2,225,153 22/04/2009 NL SNS Reaal 729 729 2,225,881 04/05/2009 AT Raiffeisen Zentralbank Osterreich AG 2,005 2,005 2,227,886 07/05/2009 DE Commerzbank 10,997 10,997 2,238,883 13/05/2009 BE KBC 2,042 2,042 2,240,925 14/05/2009 BE KBC 27,216 27,216 2,268,141 22/05/2009 US Franklin Resources 5 5 2,268,146 28/05/2009 FR Societé Générale 2,371 2,371 2,270,517 02/06/2009 DE Hypo Real Estate 4,224 4,224 2,274,741 12/06/2009 US Citigroup 1,010 1,010 2,275,751 16/06/2009 US Bank of America 6 6 2,275,757 19/06/2009 IT Banco Popolare 0 0 2,275,757 08/07/2009 US State Street Corp 60 60 2,275,817 15/07/2009 US US Bancorp 139 139 2,275,956 17/07/2009 US PNC Financial Services Group 54 54 2,276,010 22/07/2009 US BB&T Corp 67 67 Goldman Sachs Group 1,100 1,100 2,277,177 29/07/2009 US American Express Company 340 340 2,277,517 05/08/2009 US Bank of New York Mellon 136 136 2,277,653 12/08/2009 US Morgan Stanley 950 950 2,278,603 26/08/2009 US Northern Trust Corp 87 87 2,278,690 21/09/2009 IT Banca Popolare di Milano 0 0 2,278,690 30/09/2009 US Bank of America 163 163 Invesco Legacy Securities Master Fund 3,330 3,330 Wells Fargo Bank 65 65 2,282,248 05/10/2009 DE Hypo Real Estate 232 232 2,282,480 03/11/2009 UK Lloyds TSB 12,287 12,287 RBS 9,830 9,830 2,304,597 04/11/2009 DE Hypo Real Estate 4,451 4,451 2,309,048 03/12/2009 US Capital One Financial Corp 149 149 2,309,196 10/12/2009 US JP Morgan Chase & Co 950 950 2,310,147 14/12/2009 IT Banca Monte dei Paschi di Siena 0 0 2,310,147 21/12/2009 DE Hypo Real Estate 61,572 61,572 2,371,718 30/12/2009 IT Piccolo Credito Valtellinese 286 286 US Bank of America 666 666 PNC Financial Services Group 19 19 Wells Fargo Bank 1,213 1,213 2,373,903 11/01/2010 EI Bank of Ireland Group 18,751 18,751 2,392,654 13/01/2010 EI Bank of Ireland Group 5,797 5,797 2,398,451 21/01/2010 EI Allied Irish Banks 17,068 17,068 2,415,519 Total 963,760 1,451,760 2,415,519 NOTES: We exclude expenses for failures because we have data only for US; AT=Austria; BE=Belgium; CH=Switzerland; DE=Germany; DK=Denmark; EI=Eire; ES=Spain; FR=France; GR=Greece; IT=Italy; NO=Norway; NL=Netherlands; PT=Portugal; SE=Sweden; UK=United Kingdom; AU=Australia; HK=Hong-Kong; JP=Japan; US=United States. SOURCES: Mediobanca, BIS-BdI, and CNN Money.