Embed Size (px)
Citation preview
69
Chapter 3
The Basic Structure of the Human Liver fromthe Viewpoint of Vascular Architecture
Let me begin analysis of organ structure with introducing some thoughts about theliver and its microvasculature (Takahashi, 1970; Takahashi and Chiba, 1990; Takahashiet al., 1992). The liver is a voluminous organ comparable in size to the lung, with amicrostructure appearing not only quite simple but randomized in terms of orientationwith which the blood vessels are arranged. This makes us expect that we would beable to rely on stereological method in various facets of study. However, taking a stepinto asking what fundamental principle dominates this organ in its structure-functioncorrelation, one may realize the study cannot be that easy. The following is an ex-ample showing how much had to be consumed to understand what the “organ struc-ture” implies even in this simple organ.
a) The unitary structure—different concepts
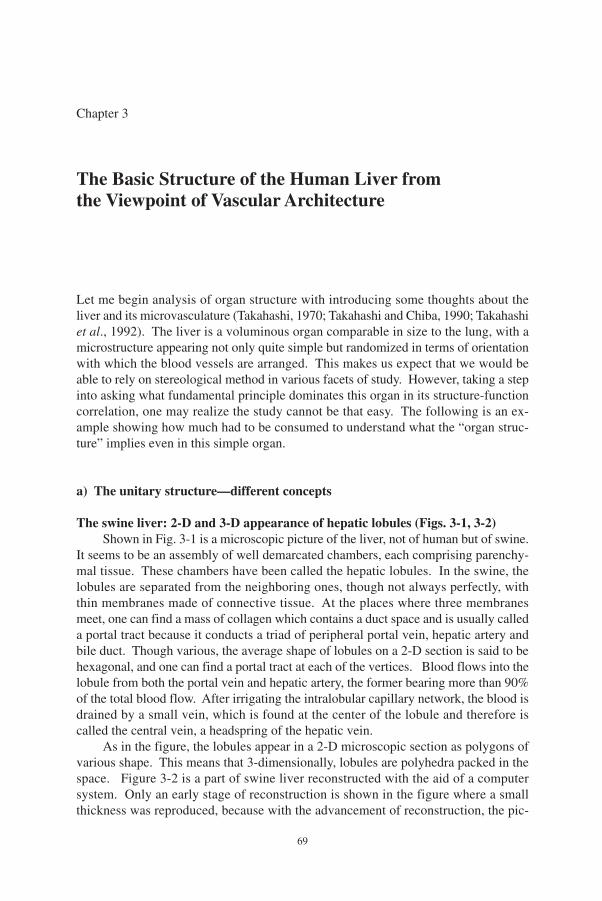
The swine liver: 2-D and 3-D appearance of hepatic lobules (Figs. 3-1, 3-2)Shown in Fig. 3-1 is a microscopic picture of the liver, not of human but of swine.
It seems to be an assembly of well demarcated chambers, each comprising parenchy-mal tissue. These chambers have been called the hepatic lobules. In the swine, thelobules are separated from the neighboring ones, though not always perfectly, withthin membranes made of connective tissue. At the places where three membranesmeet, one can find a mass of collagen which contains a duct space and is usually calleda portal tract because it conducts a triad of peripheral portal vein, hepatic artery andbile duct. Though various, the average shape of lobules on a 2-D section is said to behexagonal, and one can find a portal tract at each of the vertices. Blood flows into thelobule from both the portal vein and hepatic artery, the former bearing more than 90%of the total blood flow. After irrigating the intralobular capillary network, the blood isdrained by a small vein, which is found at the center of the lobule and therefore iscalled the central vein, a headspring of the hepatic vein.
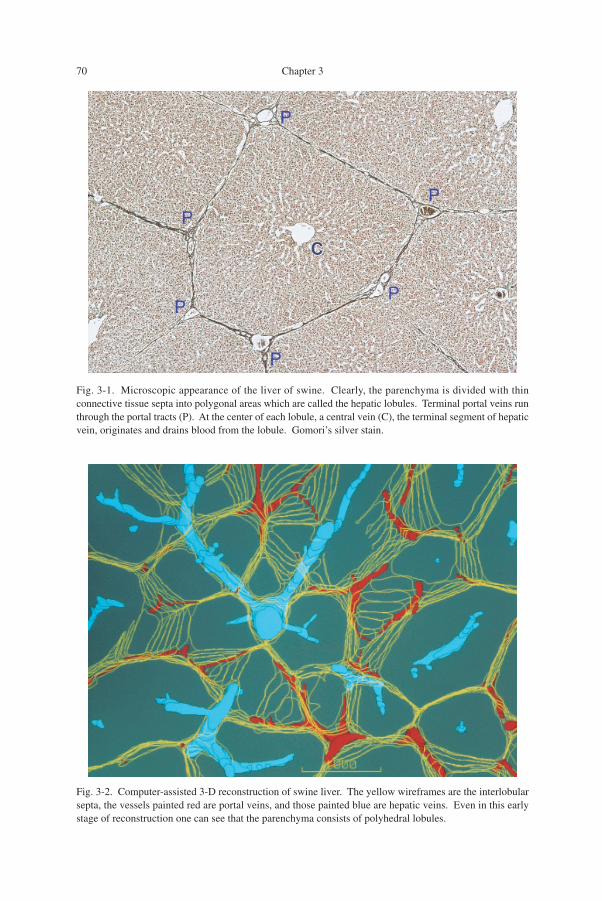
As in the figure, the lobules appear in a 2-D microscopic section as polygons ofvarious shape. This means that 3-dimensionally, lobules are polyhedra packed in thespace. Figure 3-2 is a part of swine liver reconstructed with the aid of a computersystem. Only an early stage of reconstruction is shown in the figure where a smallthickness was reproduced, because with the advancement of reconstruction, the pic-
70 Chapter 3
Fig. 3-1. Microscopic appearance of the liver of swine. Clearly, the parenchyma is divided with thinconnective tissue septa into polygonal areas which are called the hepatic lobules. Terminal portal veins runthrough the portal tracts (P). At the center of each lobule, a central vein (C), the terminal segment of hepaticvein, originates and drains blood from the lobule. Gomori’s silver stain.
Fig. 3-2. Computer-assisted 3-D reconstruction of swine liver. The yellow wireframes are the interlobularsepta, the vessels painted red are portal veins, and those painted blue are hepatic veins. Even in this earlystage of reconstruction one can see that the parenchyma consists of polyhedral lobules.
The Basic Structure of the Human Liver from the Viewpoint of Vascular Architecture 71
ture becomes growingly complicated, making it hard to keep a clear perspective of thebasic structural framework. Still, even at this stage of reconstruction where serialsectional pictures have just started to stack, it may be understood that the space ispacked with polyhedral lobules with portal veins (red) running along the interlobularmembranes and hepatic veins (blue) penerating the lobules.
Characterization of polyhedral lobules (Figs. 3-3, 3-4)The geometry of lobular polyhedra was analyzed upon serial sections of swine
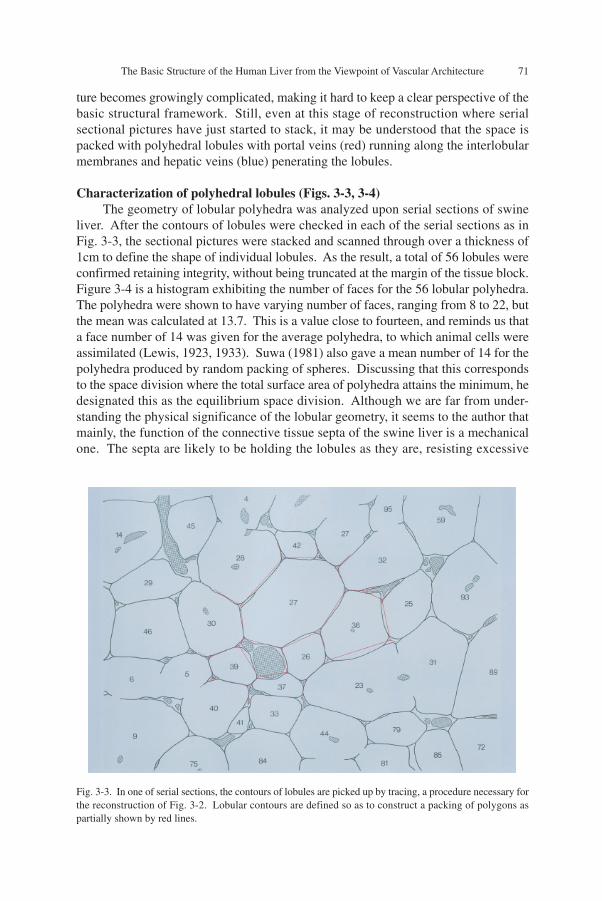
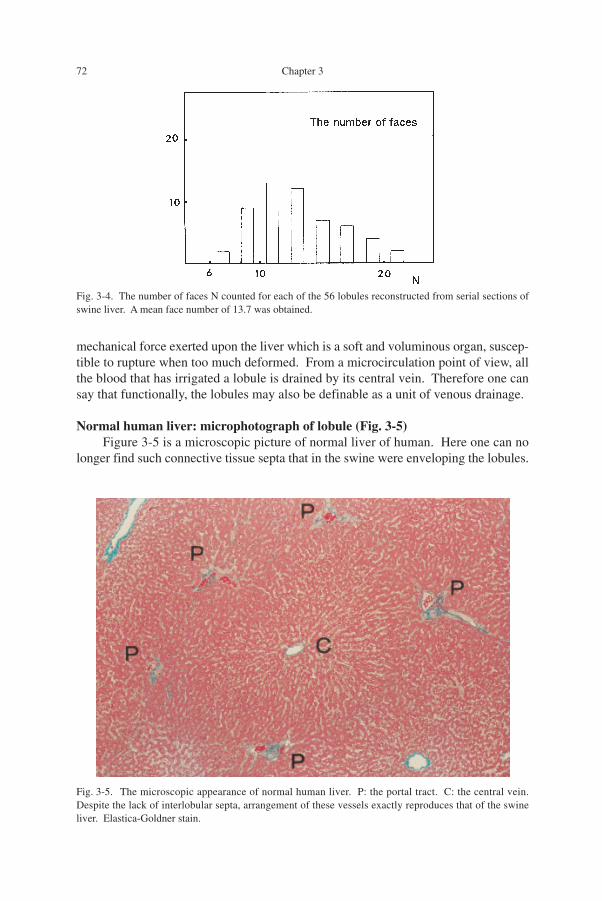
liver. After the contours of lobules were checked in each of the serial sections as inFig. 3-3, the sectional pictures were stacked and scanned through over a thickness of1cm to define the shape of individual lobules. As the result, a total of 56 lobules wereconfirmed retaining integrity, without being truncated at the margin of the tissue block.Figure 3-4 is a histogram exhibiting the number of faces for the 56 lobular polyhedra.The polyhedra were shown to have varying number of faces, ranging from 8 to 22, butthe mean was calculated at 13.7. This is a value close to fourteen, and reminds us thata face number of 14 was given for the average polyhedra, to which animal cells wereassimilated (Lewis, 1923, 1933). Suwa (1981) also gave a mean number of 14 for thepolyhedra produced by random packing of spheres. Discussing that this correspondsto the space division where the total surface area of polyhedra attains the minimum, hedesignated this as the equilibrium space division. Although we are far from under-standing the physical significance of the lobular geometry, it seems to the author thatmainly, the function of the connective tissue septa of the swine liver is a mechanicalone. The septa are likely to be holding the lobules as they are, resisting excessive
Fig. 3-3. In one of serial sections, the contours of lobules are picked up by tracing, a procedure necessary forthe reconstruction of Fig. 3-2. Lobular contours are defined so as to construct a packing of polygons aspartially shown by red lines.
72 Chapter 3
mechanical force exerted upon the liver which is a soft and voluminous organ, suscep-tible to rupture when too much deformed. From a microcirculation point of view, allthe blood that has irrigated a lobule is drained by its central vein. Therefore one cansay that functionally, the lobules may also be definable as a unit of venous drainage.
Normal human liver: microphotograph of lobule (Fig. 3-5)Figure 3-5 is a microscopic picture of normal liver of human. Here one can no
longer find such connective tissue septa that in the swine were enveloping the lobules.
Fig. 3-4. The number of faces N counted for each of the 56 lobules reconstructed from serial sections ofswine liver. A mean face number of 13.7 was obtained.
Fig. 3-5. The microscopic appearance of normal human liver. P: the portal tract. C: the central vein.Despite the lack of interlobular septa, arrangement of these vessels exactly reproduces that of the swineliver. Elastica-Goldner stain.
The Basic Structure of the Human Liver from the Viewpoint of Vascular Architecture 73
However, there is unmistakably a parenchymal area that may be definable with theportal veins (P) surrounding the area, and with a central vein (C) penetrating the area atthe center. The area seems likely to be corresponding to the lobule of the swine liverfrom which only the septa were taken away, leaving the portal tracts and central veinsat the places where they were. Also in the arrangement of lobules in the human livershown in Fig. 2-36, little difference seems to exist compared with the swine.
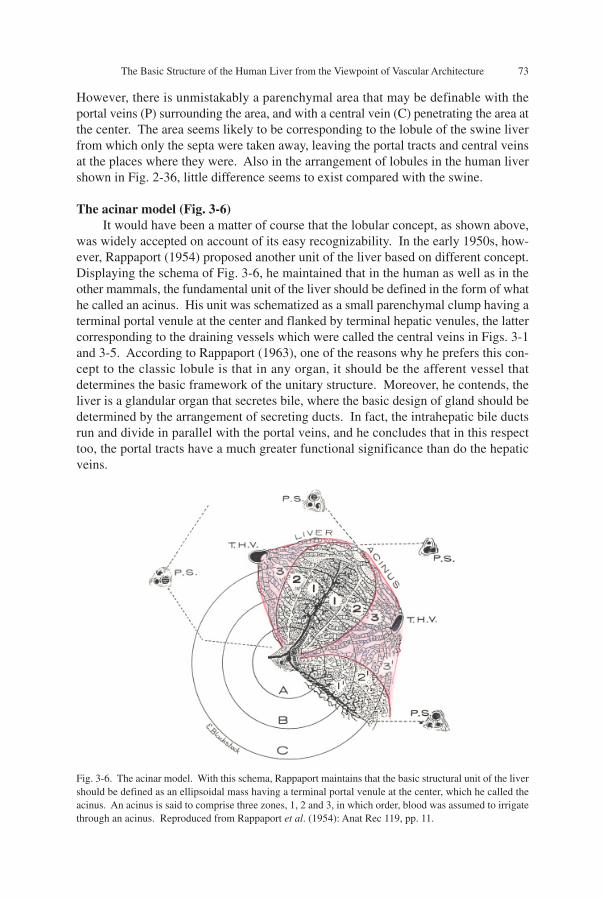
The acinar model (Fig. 3-6)It would have been a matter of course that the lobular concept, as shown above,
was widely accepted on account of its easy recognizability. In the early 1950s, how-ever, Rappaport (1954) proposed another unit of the liver based on different concept.Displaying the schema of Fig. 3-6, he maintained that in the human as well as in theother mammals, the fundamental unit of the liver should be defined in the form of whathe called an acinus. His unit was schematized as a small parenchymal clump having aterminal portal venule at the center and flanked by terminal hepatic venules, the lattercorresponding to the draining vessels which were called the central veins in Figs. 3-1and 3-5. According to Rappaport (1963), one of the reasons why he prefers this con-cept to the classic lobule is that in any organ, it should be the afferent vessel thatdetermines the basic framework of the unitary structure. Moreover, he contends, theliver is a glandular organ that secretes bile, where the basic design of gland should bedetermined by the arrangement of secreting ducts. In fact, the intrahepatic bile ductsrun and divide in parallel with the portal veins, and he concludes that in this respecttoo, the portal tracts have a much greater functional significance than do the hepaticveins.
Fig. 3-6. The acinar model. With this schema, Rappaport maintains that the basic structural unit of the livershould be defined as an ellipsoidal mass having a terminal portal venule at the center, which he called theacinus. An acinus is said to comprise three zones, 1, 2 and 3, in which order, blood was assumed to irrigatethrough an acinus. Reproduced from Rappaport et al. (1954): Anat Rec 119, pp. 11.
74 Chapter 3
However, the matter is not that simple. In the first place, one can hardly talkabout something like the superiority of the afferent vessel over the efferent one, sincemicrocirculation of an organ may not be sustainable under a malfunctioning efferentvessel, and in this respect the outlets of blood have to be considered equally indispens-able with the inlets. In the second place, the liver is indeed an excretory gland produc-ing bile. But structurally, the liver is classified into the type of netlike gland, quite aunique one. Here, bile is secreted into the bile canaliculi which form a vast networkcontinuing over the whole organ, as shown later (Figs. 3-26 and 3-27). At many places,the network is tapped with a terminal bile ductule (the canal of Hering) which leads toan interlobular duct, the peripheral branch of biliary tree. Therefore, even if severalterminal ductules came to be obstructed, bile can be drained through any of the otherexits. In these circumstances, it may be clear that in the liver where bile can be se-creted via any route of the biliary system, one cannot define a glandular lobule in sucha way as in ordinary exocrine glands like the pancreas or salivary glands.
In the third place, if the acinar concept were tenable as a functionally significantcirculatory unit of the liver, it must be able to explain the morphogenesis of variousliver changes developing under impaired circulation, because it has been defined as aunit of tissue blood flow. In the practice of diagnostic pathology, hepatocellular necro-sis due to ischemia or intoxication is often experienced. But in reality, the pattern ofliver lesions actually found in such patients is far from what one might expect byassuming the acinar concept. This issue will be revisited in Chapter 7.
b) The microvasculature of human liver and its functional significance
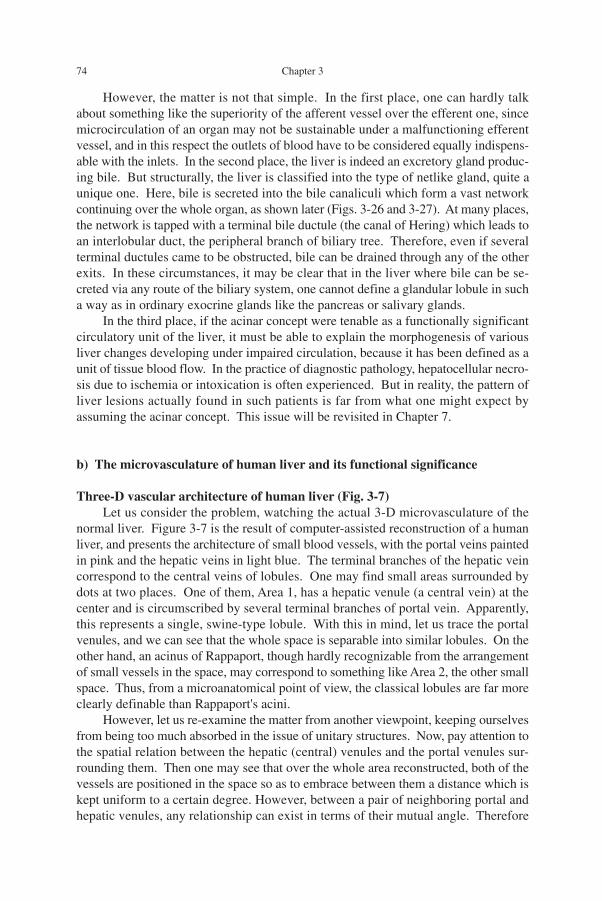
Three-D vascular architecture of human liver (Fig. 3-7)Let us consider the problem, watching the actual 3-D microvasculature of the
normal liver. Figure 3-7 is the result of computer-assisted reconstruction of a humanliver, and presents the architecture of small blood vessels, with the portal veins paintedin pink and the hepatic veins in light blue. The terminal branches of the hepatic veincorrespond to the central veins of lobules. One may find small areas surrounded bydots at two places. One of them, Area 1, has a hepatic venule (a central vein) at thecenter and is circumscribed by several terminal branches of portal vein. Apparently,this represents a single, swine-type lobule. With this in mind, let us trace the portalvenules, and we can see that the whole space is separable into similar lobules. On theother hand, an acinus of Rappaport, though hardly recognizable from the arrangementof small vessels in the space, may correspond to something like Area 2, the other smallspace. Thus, from a microanatomical point of view, the classical lobules are far moreclearly definable than Rappaport's acini.
However, let us re-examine the matter from another viewpoint, keeping ourselvesfrom being too much absorbed in the issue of unitary structures. Now, pay attention tothe spatial relation between the hepatic (central) venules and the portal venules sur-rounding them. Then one may see that over the whole area reconstructed, both of thevessels are positioned in the space so as to embrace between them a distance which iskept uniform to a certain degree. However, between a pair of neighboring portal andhepatic venules, any relationship can exist in terms of their mutual angle. Therefore
The Basic Structure of the Human Liver from the Viewpoint of Vascular Architecture 75
the portal-central-venous distance has to be defined in clearer geometric terms. Thedefinition will be introduced afterwards, and here let us only have an overview bycomparing the picture with another organ where the isodistant relationship of vascula-ture seems to be retained much less than in the liver.
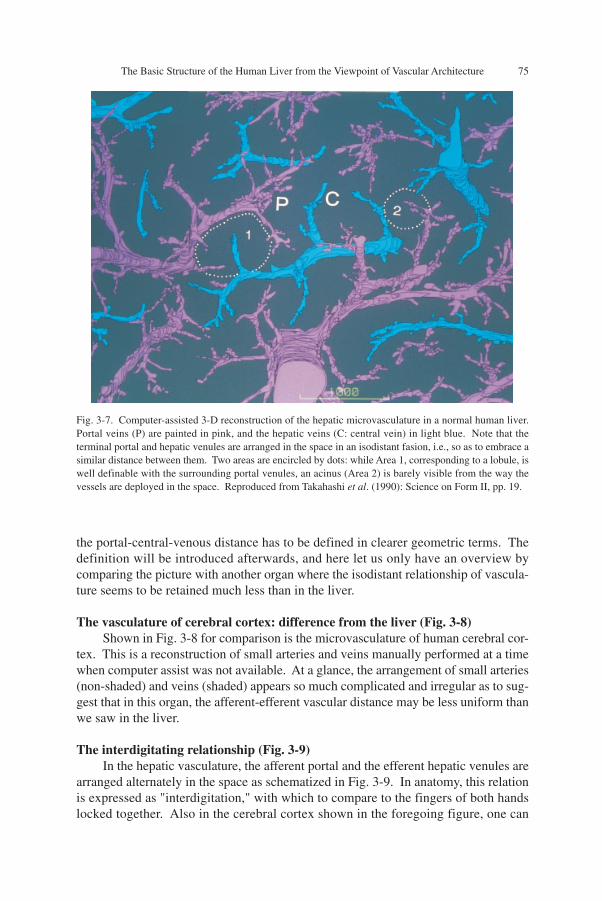
The vasculature of cerebral cortex: difference from the liver (Fig. 3-8)Shown in Fig. 3-8 for comparison is the microvasculature of human cerebral cor-
tex. This is a reconstruction of small arteries and veins manually performed at a timewhen computer assist was not available. At a glance, the arrangement of small arteries(non-shaded) and veins (shaded) appears so much complicated and irregular as to sug-gest that in this organ, the afferent-efferent vascular distance may be less uniform thanwe saw in the liver.
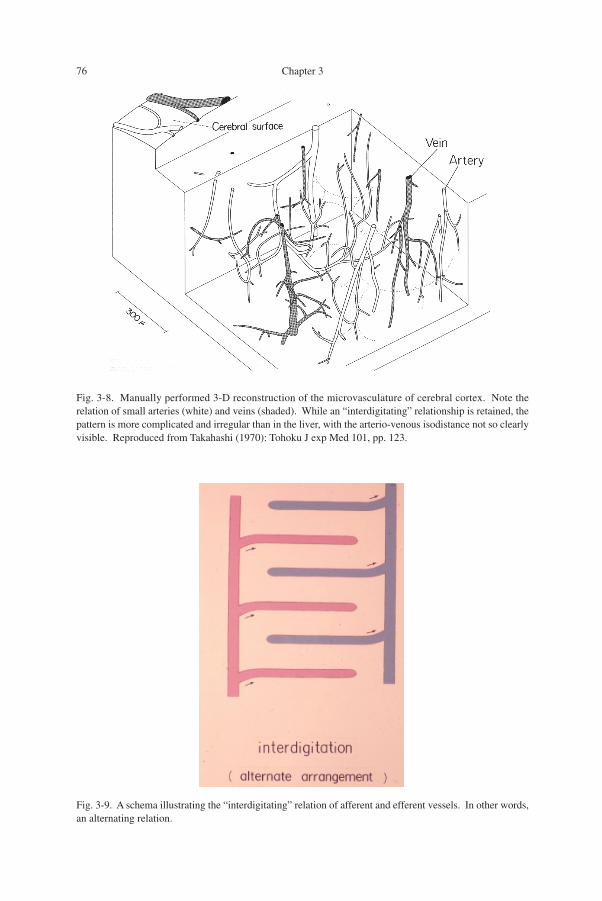
The interdigitating relationship (Fig. 3-9)In the hepatic vasculature, the afferent portal and the efferent hepatic venules are
arranged alternately in the space as schematized in Fig. 3-9. In anatomy, this relationis expressed as "interdigitation," with which to compare to the fingers of both handslocked together. Also in the cerebral cortex shown in the foregoing figure, one can
Fig. 3-7. Computer-assisted 3-D reconstruction of the hepatic microvasculature in a normal human liver.Portal veins (P) are painted in pink, and the hepatic veins (C: central vein) in light blue. Note that theterminal portal and hepatic venules are arranged in the space in an isodistant fasion, i.e., so as to embrace asimilar distance between them. Two areas are encircled by dots: while Area 1, corresponding to a lobule, iswell definable with the surrounding portal venules, an acinus (Area 2) is barely visible from the way thevessels are deployed in the space. Reproduced from Takahashi et al. (1990): Science on Form II, pp. 19.
76 Chapter 3
Fig. 3-8. Manually performed 3-D reconstruction of the microvasculature of cerebral cortex. Note therelation of small arteries (white) and veins (shaded). While an “interdigitating” relationship is retained, thepattern is more complicated and irregular than in the liver, with the arterio-venous isodistance not so clearlyvisible. Reproduced from Takahashi (1970): Tohoku J exp Med 101, pp. 123.
Fig. 3-9. A schema illustrating the “interdigitating” relation of afferent and efferent vessels. In other words,an alternating relation.
The Basic Structure of the Human Liver from the Viewpoint of Vascular Architecture 77
find, by closely watching, the interdigitating relation retained in the whole region,allowing to define circulatory "units" around small veins as roughly depicted withdotted circles along their putative borders. Thus, the difference between the liver andthe cerebral cortex is that in the former, there exists quite an isodistant interdigitatingvasculature, while in the latter the afferent-efferent vascular distance is much less uni-form. As will be shown, the liver has a vasculature that retains the highest isodistanceamong the organs. If so, what significance does the isodistant vasculature of the liverhave in the organ function? Because morphologically, it is the microvasculature thatmakes the liver a unique organ, it may be reasonable to assume that there may be someuniqueness in the hepatic circulation.
The portal vein: its uniqueness (Figs. 3-10, 3-11)With respect to circulation, the uniqueness of the liver lies, of course, in that it has
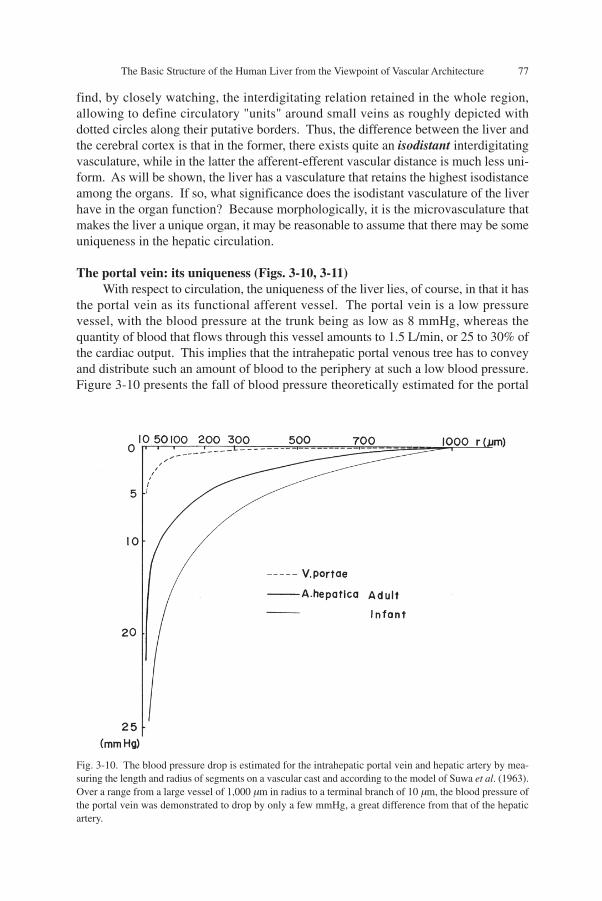
the portal vein as its functional afferent vessel. The portal vein is a low pressurevessel, with the blood pressure at the trunk being as low as 8 mmHg, whereas thequantity of blood that flows through this vessel amounts to 1.5 L/min, or 25 to 30% ofthe cardiac output. This implies that the intrahepatic portal venous tree has to conveyand distribute such an amount of blood to the periphery at such a low blood pressure.Figure 3-10 presents the fall of blood pressure theoretically estimated for the portal
Fig. 3-10. The blood pressure drop is estimated for the intrahepatic portal vein and hepatic artery by mea-suring the length and radius of segments on a vascular cast and according to the model of Suwa et al. (1963).Over a range from a large vessel of 1,000 µm in radius to a terminal branch of 10 µm, the blood pressure ofthe portal vein was demonstrated to drop by only a few mmHg, a great difference from that of the hepaticartery.
78 Chapter 3
vein and hepatic artery by quantitative treatment of methacrylate casts of these ves-sels. The study, performed according to the mathematical theorem developed by Suwaet al. (1962), demonstrates that the pressure gradient of portal blood flow is incompa-rably smaller.
Moreover, the blood flowing into the liver has to be distributed to the peripherallobules sufficiently uniformly over this large organ. This is a critical requirement to besatisfied so that the portal blood, after flowing into the liver, may make sufficientcontact with the intralobular hepatocytes. Otherwise, the liver would be unable tofunction as the central organ of metabolism. Particularly, one has to keep in mind thatthe liver plays crucial role in detoxifying noxious substances absorbed in the GI tractand carried via the portal vein. If there were unevenness in the density at which portalblood irrigates the hepatic parenchyma, allowing a part of blood to pass through theorgan without making sufficient contact with hepatocytes, the result would be a he-patic insufficiency, although various in its clinical seriousness.
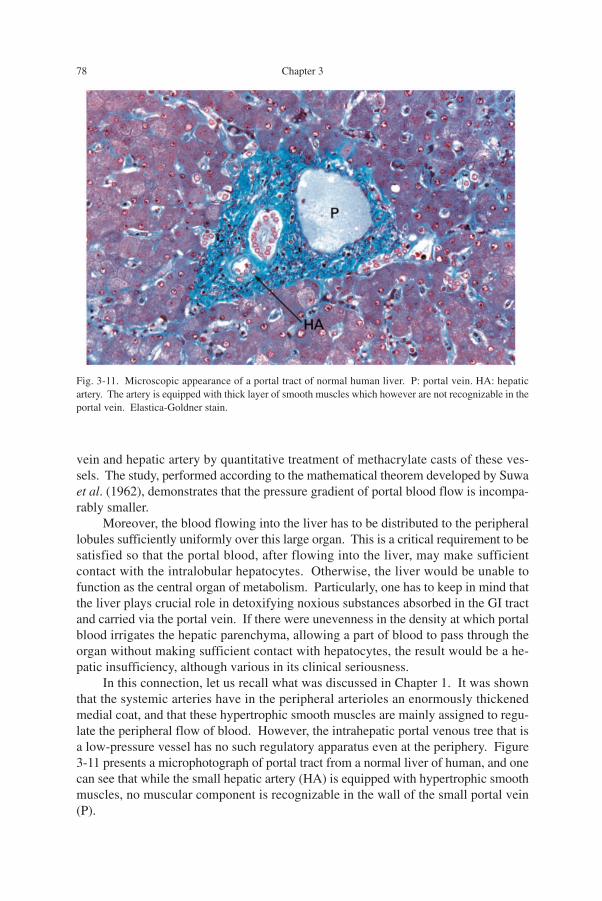
In this connection, let us recall what was discussed in Chapter 1. It was shownthat the systemic arteries have in the peripheral arterioles an enormously thickenedmedial coat, and that these hypertrophic smooth muscles are mainly assigned to regu-late the peripheral flow of blood. However, the intrahepatic portal venous tree that isa low-pressure vessel has no such regulatory apparatus even at the periphery. Figure3-11 presents a microphotograph of portal tract from a normal liver of human, and onecan see that while the small hepatic artery (HA) is equipped with hypertrophic smoothmuscles, no muscular component is recognizable in the wall of the small portal vein(P).
Fig. 3-11. Microscopic appearance of a portal tract of normal human liver. P: portal vein. HA: hepaticartery. The artery is equipped with thick layer of smooth muscles which however are not recognizable in theportal vein. Elastica-Goldner stain.

The Basic Structure of the Human Liver from the Viewpoint of Vascular Architecture 79
The significance of isodistant vasculature: two vascular models (Figs. 3-12, 3-13,3-14)The uniquely isodistant relation of the portal and hepatic venules shown above
seems to be the structure that satisfies the requirement which the liver has in achievingits circulatory and metabolic functions. In other words, one can find in the hepatic
Fig. 3-12. A schema illustrating arteries and veins entering and going out of an organ, both running inparallel. In most organs, arteries and veins run and divide toward the periphery, retaining the contiguousrelation.
Fig. 3-13. Microcirculation Model 1, with contiguous arrangement of terminal arteries (A; or afferentvessels like portal vein), red, and terminal efferent veins (V), blue. Capillary network is shown in green.Under this vasculature, the distance of capillary flow routes greatly varies, and so does the flow resistance.This inequality has to be compensated by active flow regulation on the part of vascular smooth muscleswhich are illustrated with either red spirals surrounding the terminal arteries or red rings sporadically foundaround capillaries.
80 Chapter 3
microvasculature a sort of “adequate design,” the optimum structure-function correla-tion. This will be understood by making the following ideal experiment.
Usually, an organ has a hilus where an artery enters and a vein leaves the organbut they do so closely in parallel as in Fig. 3-12. This relation is brought into theorgan, where arteries and veins run and divide, maintaining the close adjacency. Whatif, however, this contiguity should be kept down to their terminal region where theyare joined with the capillary network? Here, one will have to expect a difficulty in thetissue microcirculation, for the following reason.
Figure 3-13 is a schema of contiguous vasculature. Here we assume that thespace between the small arteries and veins (more generally, afferent and efferent ves-sels) is uniformly filled with capillary network (green). If arteries and veins are lo-cated in close adjacency like the figure, a great inequality occurs in the length of flowroutes through capillaries, and produces shortcircuited flow at the places of contiguity.Therefore, under this vasculature, blood cannot be distributed uniformly over the tis-sue, unless there is a correcting mechanism which actively regulates and redistributesblood flow. As is well known, it is the sphincter action of vascular smooth musclesthat is responsible for this regulation, i.e., the medial smooth muscles of small arteriesand arterioles, and also the smooth muscle cells sporadically found in capillaries. Theseemingly luxurious muscular coat of the arterioles as demonstrated by the elevatedD/R ratio (Fig. 1-9) must have been expressing the extremely vigorous activities ofthese vessels assigned to regulate the tissue blood flow. Only with the combined ac-tivities of these regulatory apparatuses, will the tissue blood flow be equalized over the
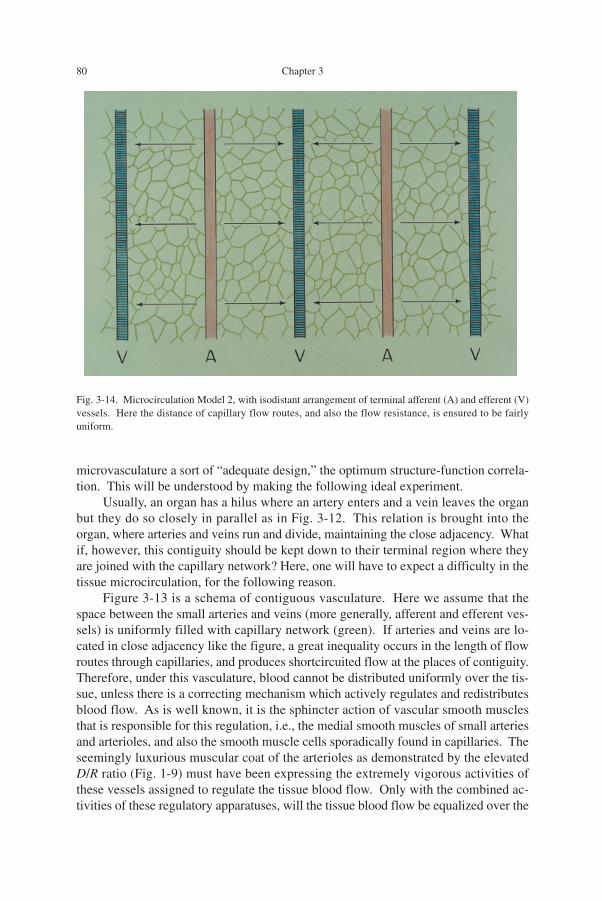
Fig. 3-14. Microcirculation Model 2, with isodistant arrangement of terminal afferent (A) and efferent (V)vessels. Here the distance of capillary flow routes, and also the flow resistance, is ensured to be fairlyuniform.
The Basic Structure of the Human Liver from the Viewpoint of Vascular Architecture 81
whole region.However, we have another extreme too, as in Fig. 3-14. Here, the terminal arter-
ies and veins (or, afferent and efferent vessels) are keeping a uniform distance. Underthis isodistant pattern, the length of capillary routes becomes uniform. It would ensurea uniform resistance to flow, and ensure a distribution of blood at a uniform density,even if the vessels are not equipped with any apparatus for regulation. Since in theliver, the peripheral portal veins are not equipped with smooth muscular coat and areconsidered to be devoid of regulatory function, it appears that this isodistant relationmay be the very structure required by this organ.
Organ difference in microvasculature: functional significance (Table 3-1) We now understand that in the organ circulation there is an aspect, in which the
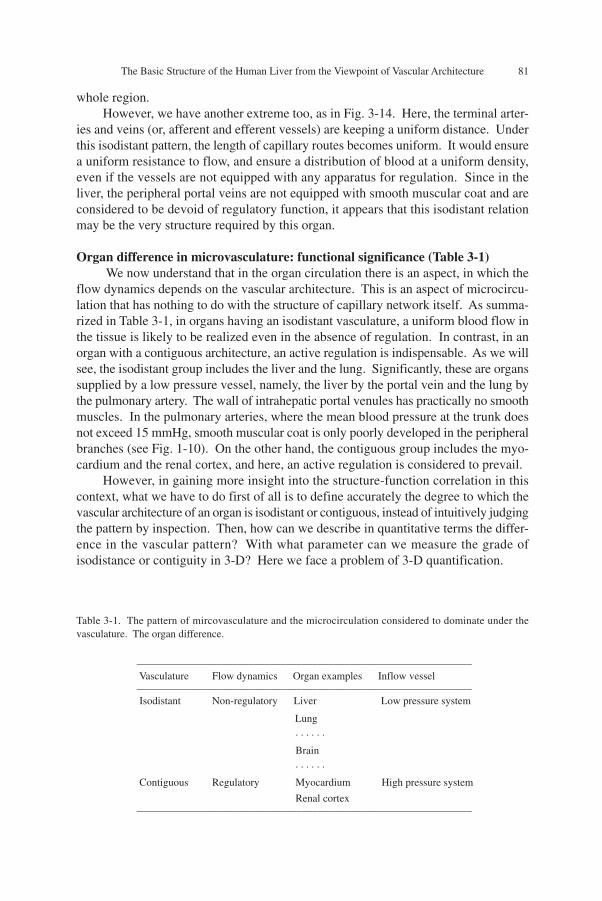
flow dynamics depends on the vascular architecture. This is an aspect of microcircu-lation that has nothing to do with the structure of capillary network itself. As summa-rized in Table 3-1, in organs having an isodistant vasculature, a uniform blood flow inthe tissue is likely to be realized even in the absence of regulation. In contrast, in anorgan with a contiguous architecture, an active regulation is indispensable. As we willsee, the isodistant group includes the liver and the lung. Significantly, these are organssupplied by a low pressure vessel, namely, the liver by the portal vein and the lung bythe pulmonary artery. The wall of intrahepatic portal venules has practically no smoothmuscles. In the pulmonary arteries, where the mean blood pressure at the trunk doesnot exceed 15 mmHg, smooth muscular coat is only poorly developed in the peripheralbranches (see Fig. 1-10). On the other hand, the contiguous group includes the myo-cardium and the renal cortex, and here, an active regulation is considered to prevail.
However, in gaining more insight into the structure-function correlation in thiscontext, what we have to do first of all is to define accurately the degree to which thevascular architecture of an organ is isodistant or contiguous, instead of intuitively judgingthe pattern by inspection. Then, how can we describe in quantitative terms the differ-ence in the vascular pattern? With what parameter can we measure the grade ofisodistance or contiguity in 3-D? Here we face a problem of 3-D quantification.
Table 3-1. The pattern of mircovasculature and the microcirculation considered to dominate under thevasculature. The organ difference.
_______________________________________________________________
Vasculature Flow dynamics Organ examples Inflow vessel_______________________________________________________________
Isodistant Non-regulatory Liver Low pressure system
Lung
· · · · · ·
Brain
· · · · · ·
Contiguous Regulatory Myocardium High pressure system
Renal cortex_______________________________________________________________
82 Chapter 3
c) Quantitative expression of vasculature pattern
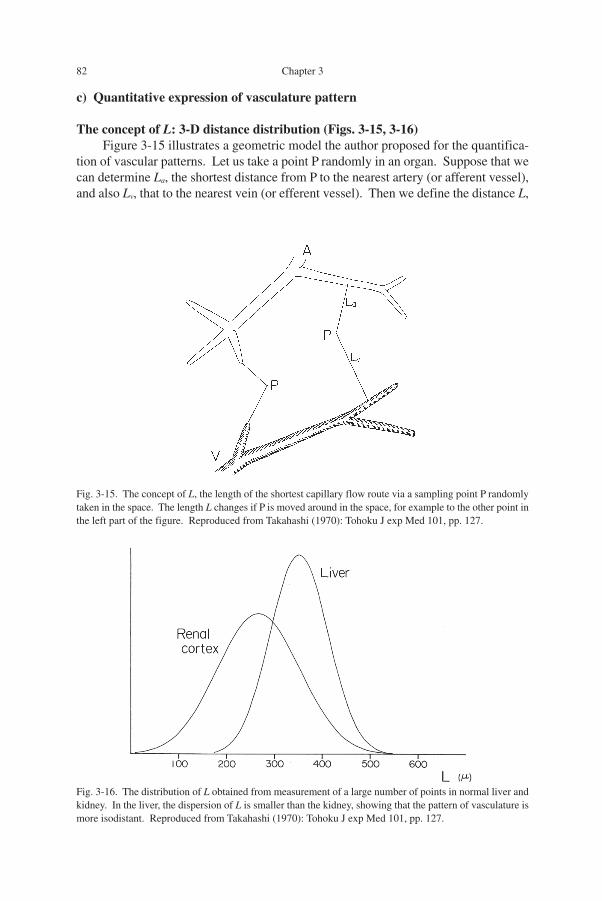
The concept of L: 3-D distance distribution (Figs. 3-15, 3-16)Figure 3-15 illustrates a geometric model the author proposed for the quantifica-
tion of vascular patterns. Let us take a point P randomly in an organ. Suppose that wecan determine La, the shortest distance from P to the nearest artery (or afferent vessel),and also Lv, that to the nearest vein (or efferent vessel). Then we define the distance L,
Fig. 3-16. The distribution of L obtained from measurement of a large number of points in normal liver andkidney. In the liver, the dispersion of L is smaller than the kidney, showing that the pattern of vasculature ismore isodistant. Reproduced from Takahashi (1970): Tohoku J exp Med 101, pp. 127.
Fig. 3-15. The concept of L, the length of the shortest capillary flow route via a sampling point P randomlytaken in the space. The length L changes if P is moved around in the space, for example to the other point inthe left part of the figure. Reproduced from Takahashi (1970): Tohoku J exp Med 101, pp. 127.
The Basic Structure of the Human Liver from the Viewpoint of Vascular Architecture 83
the sum of La and Lv, as the length of the shortest capillary route via P. This lengthchanges when the point P is moved around in the organ, for example to the left-sidedpoint in the figure. Accordingly, if we set a sufficiently large number of points ran-domly in the organ and measure L, then it will become a statistical quantity.
Consider that in an organ, the length L was measured for hundreds of points andthe dispersion of L was calculated. In Fig. 3-16, results from two organs are shown forcomparison. If the dispersion of L proved to be comparatively small as in the liver, thevasculature in the organ is likely to be more isodistant. In contrast, the larger thedispersion, the more contiguous vasculature is suggested to exist. Thus, in this con-text, what we have to obtain by morphometry is the mean and the dispersion of L.
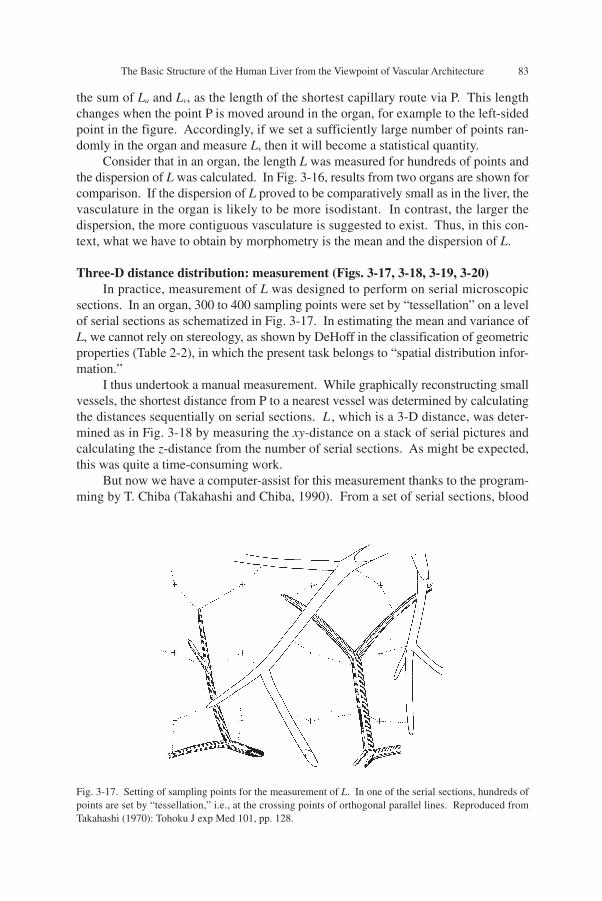
Three-D distance distribution: measurement (Figs. 3-17, 3-18, 3-19, 3-20)In practice, measurement of L was designed to perform on serial microscopic
sections. In an organ, 300 to 400 sampling points were set by “tessellation” on a levelof serial sections as schematized in Fig. 3-17. In estimating the mean and variance ofL, we cannot rely on stereology, as shown by DeHoff in the classification of geometricproperties (Table 2-2), in which the present task belongs to “spatial distribution infor-mation.”
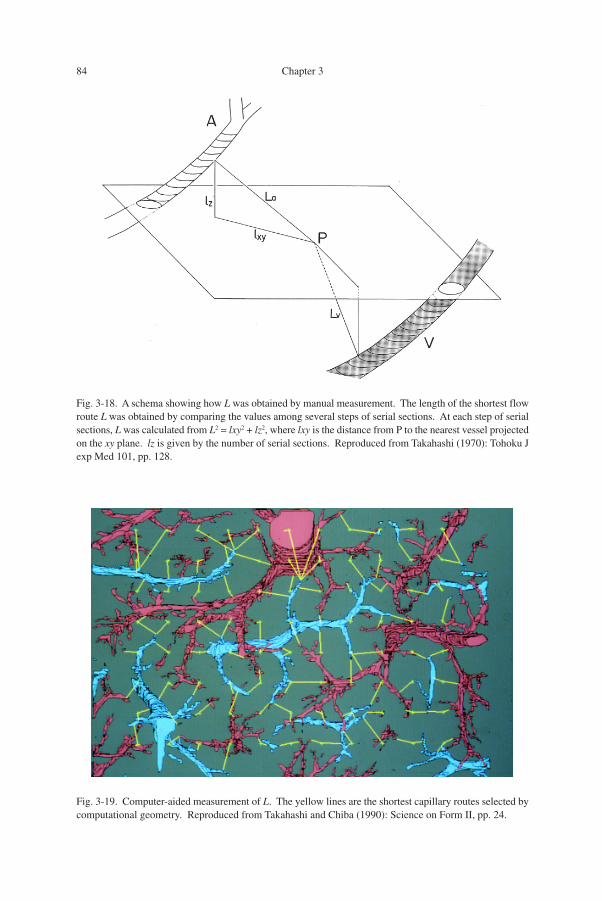
I thus undertook a manual measurement. While graphically reconstructing smallvessels, the shortest distance from P to a nearest vessel was determined by calculatingthe distances sequentially on serial sections. L , which is a 3-D distance, was deter-mined as in Fig. 3-18 by measuring the xy-distance on a stack of serial pictures andcalculating the z-distance from the number of serial sections. As might be expected,this was quite a time-consuming work.
But now we have a computer-assist for this measurement thanks to the program-ming by T. Chiba (Takahashi and Chiba, 1990). From a set of serial sections, blood
Fig. 3-17. Setting of sampling points for the measurement of L. In one of the serial sections, hundreds ofpoints are set by “tessellation,” i.e., at the crossing points of orthogonal parallel lines. Reproduced fromTakahashi (1970): Tohoku J exp Med 101, pp. 128.
84 Chapter 3
Fig. 3-18. A schema showing how L was obtained by manual measurement. The length of the shortest flowroute L was obtained by comparing the values among several steps of serial sections. At each step of serialsections, L was calculated from L2 = lxy2 + lz2, where lxy is the distance from P to the nearest vessel projectedon the xy plane. lz is given by the number of serial sections. Reproduced from Takahashi (1970): Tohoku Jexp Med 101, pp. 128.
Fig. 3-19. Computer-aided measurement of L. The yellow lines are the shortest capillary routes selected bycomputational geometry. Reproduced from Takahashi and Chiba (1990): Science on Form II, pp. 24.
The Basic Structure of the Human Liver from the Viewpoint of Vascular Architecture 85
vessels are digitized at every step, and we have a whole set of 3-D structural data in ahard disc. Figure 3-19 is an example in a normal liver (portal vein, red; hepatic vein,blue). Here one can see 88 test points, and the yellow lines are the shortest routescalculated.
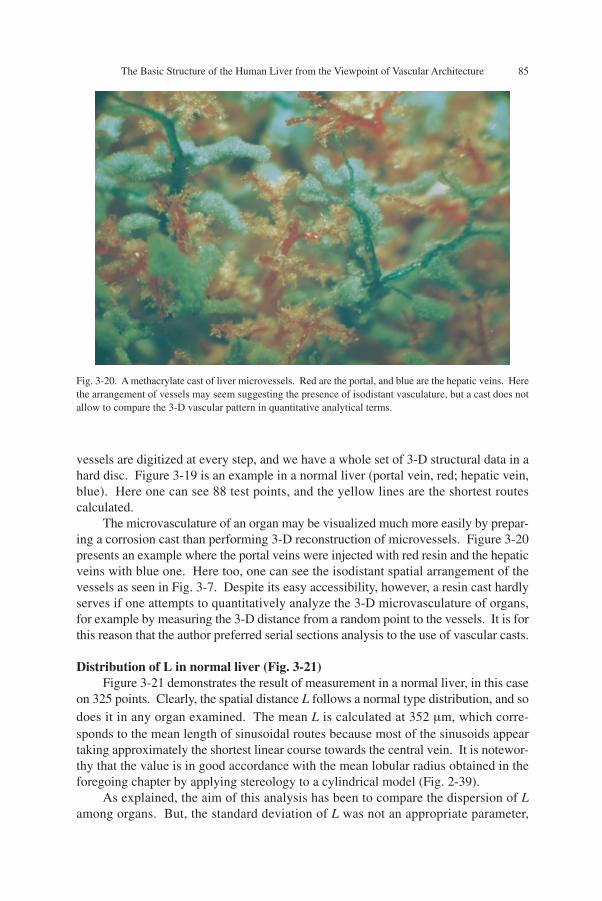
The microvasculature of an organ may be visualized much more easily by prepar-ing a corrosion cast than performing 3-D reconstruction of microvessels. Figure 3-20presents an example where the portal veins were injected with red resin and the hepaticveins with blue one. Here too, one can see the isodistant spatial arrangement of thevessels as seen in Fig. 3-7. Despite its easy accessibility, however, a resin cast hardlyserves if one attempts to quantitatively analyze the 3-D microvasculature of organs,for example by measuring the 3-D distance from a random point to the vessels. It is forthis reason that the author preferred serial sections analysis to the use of vascular casts.
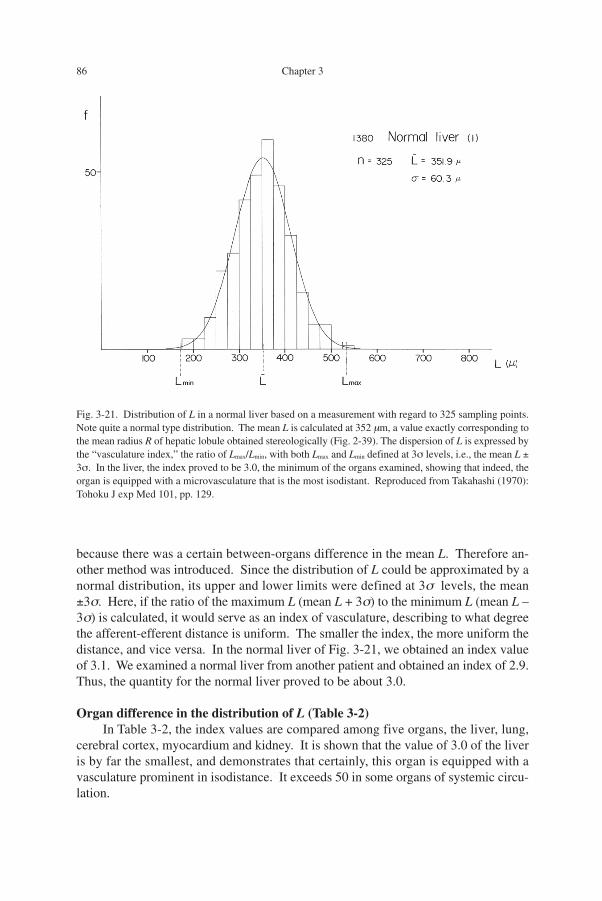
Distribution of L in normal liver (Fig. 3-21)Figure 3-21 demonstrates the result of measurement in a normal liver, in this case
on 325 points. Clearly, the spatial distance L follows a normal type distribution, and sodoes it in any organ examined. The mean L is calculated at 352 µm, which corre-sponds to the mean length of sinusoidal routes because most of the sinusoids appeartaking approximately the shortest linear course towards the central vein. It is notewor-thy that the value is in good accordance with the mean lobular radius obtained in theforegoing chapter by applying stereology to a cylindrical model (Fig. 2-39).
As explained, the aim of this analysis has been to compare the dispersion of Lamong organs. But, the standard deviation of L was not an appropriate parameter,
Fig. 3-20. A methacrylate cast of liver microvessels. Red are the portal, and blue are the hepatic veins. Herethe arrangement of vessels may seem suggesting the presence of isodistant vasculature, but a cast does notallow to compare the 3-D vascular pattern in quantitative analytical terms.
86 Chapter 3
because there was a certain between-organs difference in the mean L. Therefore an-other method was introduced. Since the distribution of L could be approximated by anormal distribution, its upper and lower limits were defined at 3σ levels, the mean±3σ. Here, if the ratio of the maximum L (mean L + 3σ) to the minimum L (mean L –3σ) is calculated, it would serve as an index of vasculature, describing to what degreethe afferent-efferent distance is uniform. The smaller the index, the more uniform thedistance, and vice versa. In the normal liver of Fig. 3-21, we obtained an index valueof 3.1. We examined a normal liver from another patient and obtained an index of 2.9.Thus, the quantity for the normal liver proved to be about 3.0.
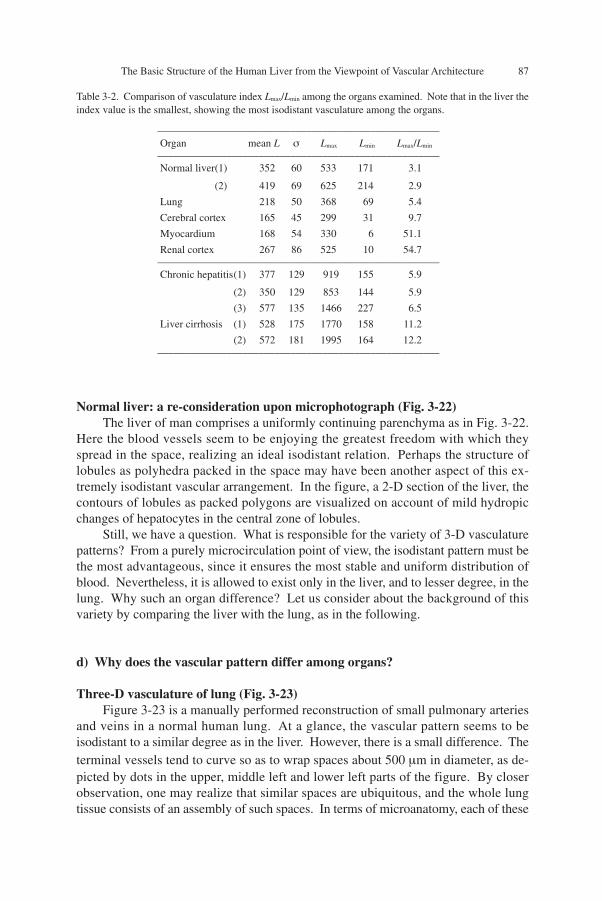
Organ difference in the distribution of L (Table 3-2)In Table 3-2, the index values are compared among five organs, the liver, lung,
cerebral cortex, myocardium and kidney. It is shown that the value of 3.0 of the liveris by far the smallest, and demonstrates that certainly, this organ is equipped with avasculature prominent in isodistance. It exceeds 50 in some organs of systemic circu-lation.
Fig. 3-21. Distribution of L in a normal liver based on a measurement with regard to 325 sampling points.Note quite a normal type distribution. The mean L is calculated at 352 µm, a value exactly corresponding tothe mean radius R of hepatic lobule obtained stereologically (Fig. 2-39). The dispersion of L is expressed bythe “vasculature index,” the ratio of Lmax/Lmin, with both Lmax and Lmin defined at 3σ levels, i.e., the mean L ±3σ. In the liver, the index proved to be 3.0, the minimum of the organs examined, showing that indeed, theorgan is equipped with a microvasculature that is the most isodistant. Reproduced from Takahashi (1970):Tohoku J exp Med 101, pp. 129.
The Basic Structure of the Human Liver from the Viewpoint of Vascular Architecture 87
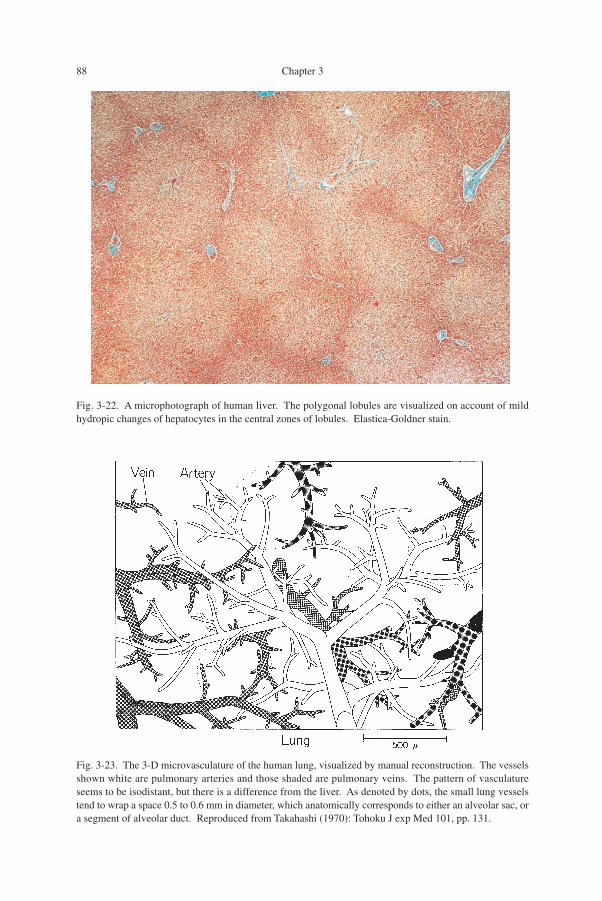
Normal liver: a re-consideration upon microphotograph (Fig. 3-22)The liver of man comprises a uniformly continuing parenchyma as in Fig. 3-22.
Here the blood vessels seem to be enjoying the greatest freedom with which theyspread in the space, realizing an ideal isodistant relation. Perhaps the structure oflobules as polyhedra packed in the space may have been another aspect of this ex-tremely isodistant vascular arrangement. In the figure, a 2-D section of the liver, thecontours of lobules as packed polygons are visualized on account of mild hydropicchanges of hepatocytes in the central zone of lobules.
Still, we have a question. What is responsible for the variety of 3-D vasculaturepatterns? From a purely microcirculation point of view, the isodistant pattern must bethe most advantageous, since it ensures the most stable and uniform distribution ofblood. Nevertheless, it is allowed to exist only in the liver, and to lesser degree, in thelung. Why such an organ difference? Let us consider about the background of thisvariety by comparing the liver with the lung, as in the following.
d) Why does the vascular pattern differ among organs?
Three-D vasculature of lung (Fig. 3-23)Figure 3-23 is a manually performed reconstruction of small pulmonary arteries
and veins in a normal human lung. At a glance, the vascular pattern seems to beisodistant to a similar degree as in the liver. However, there is a small difference. Theterminal vessels tend to curve so as to wrap spaces about 500 µm in diameter, as de-picted by dots in the upper, middle left and lower left parts of the figure. By closerobservation, one may realize that similar spaces are ubiquitous, and the whole lungtissue consists of an assembly of such spaces. In terms of microanatomy, each of these
_____________________________________________________
Organ mean L σ Lmax Lmin Lmax/Lmin_____________________________________________________
Normal liver(1) 352 60 533 171 3.1
(2) 419 69 625 214 2.9
Lung 218 50 368 69 5.4
Cerebral cortex 165 45 299 31 9.7
Myocardium 168 54 330 6 51.1
Renal cortex 267 86 525 10 54.7_____________________________________________________
Chronic hepatitis(1) 377 129 919 155 5.9
(2) 350 129 853 144 5.9
(3) 577 135 1466 227 6.5
Liver cirrhosis (1) 528 175 1770 158 11.2
(2) 572 181 1995 164 12.2_____________________________________________________
Table 3-2. Comparison of vasculature index Lmax/Lmin among the organs examined. Note that in the liver theindex value is the smallest, showing the most isodistant vasculature among the organs.
88 Chapter 3
Fig. 3-22. A microphotograph of human liver. The polygonal lobules are visualized on account of mildhydropic changes of hepatocytes in the central zones of lobules. Elastica-Goldner stain.
Fig. 3-23. The 3-D microvasculature of the human lung, visualized by manual reconstruction. The vesselsshown white are pulmonary arteries and those shaded are pulmonary veins. The pattern of vasculatureseems to be isodistant, but there is a difference from the liver. As denoted by dots, the small lung vesselstend to wrap a space 0.5 to 0.6 mm in diameter, which anatomically corresponds to either an alveolar sac, ora segment of alveolar duct. Reproduced from Takahashi (1970): Tohoku J exp Med 101, pp. 131.
The Basic Structure of the Human Liver from the Viewpoint of Vascular Architecture 89
spaces corresponds to either an alveolar sac or a segment of alveolar duct, includingthe alveoli opening there. In contrast to the liver where the afferent and efferent ves-sels penetrating the parenchyma can take any position, an alveolar sac as well as al-veolar duct of normal lung is an air space which does not allow arteries or veins toenter its interior as a naked vessel not contained in alveolar septum. While in the 3-Dpicture of Fig. 3-23 the lung vessels seem to be arranged in an isodistant fashion, inreality, it is only among the vessels enclosed within the alveolar septa that the isodistanceis realized.
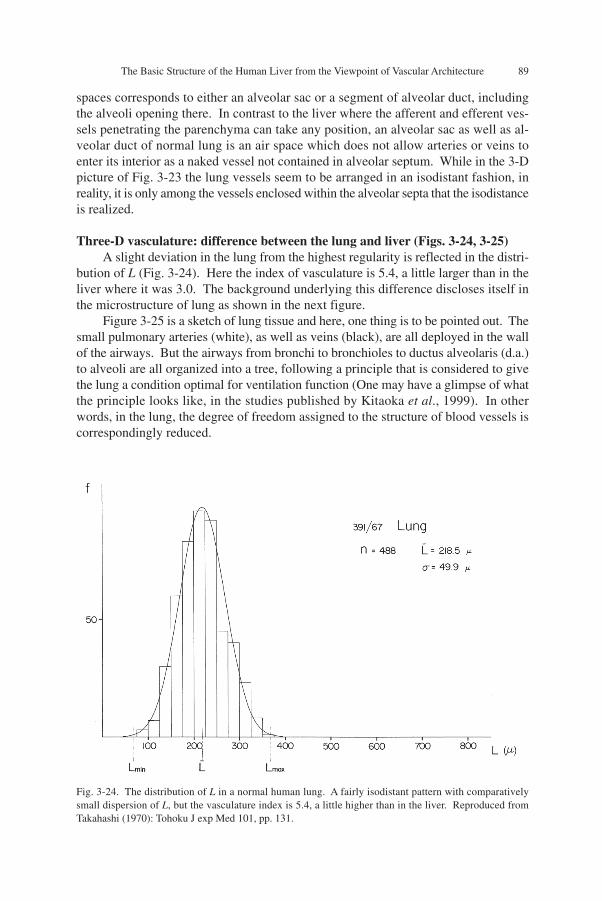
Three-D vasculature: difference between the lung and liver (Figs. 3-24, 3-25)A slight deviation in the lung from the highest regularity is reflected in the distri-
bution of L (Fig. 3-24). Here the index of vasculature is 5.4, a little larger than in theliver where it was 3.0. The background underlying this difference discloses itself inthe microstructure of lung as shown in the next figure.
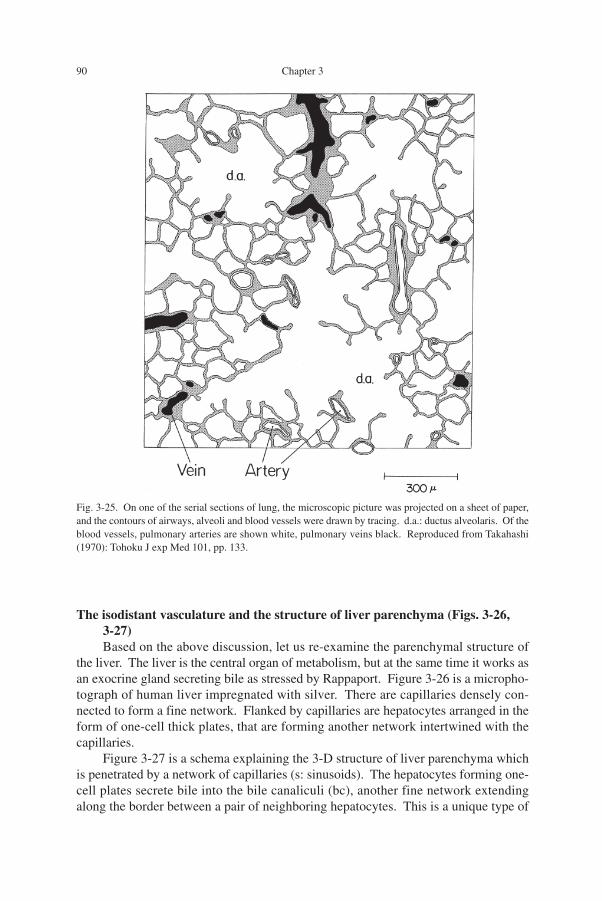
Figure 3-25 is a sketch of lung tissue and here, one thing is to be pointed out. Thesmall pulmonary arteries (white), as well as veins (black), are all deployed in the wallof the airways. But the airways from bronchi to bronchioles to ductus alveolaris (d.a.)to alveoli are all organized into a tree, following a principle that is considered to givethe lung a condition optimal for ventilation function (One may have a glimpse of whatthe principle looks like, in the studies published by Kitaoka et al., 1999). In otherwords, in the lung, the degree of freedom assigned to the structure of blood vessels iscorrespondingly reduced.
Fig. 3-24. The distribution of L in a normal human lung. A fairly isodistant pattern with comparativelysmall dispersion of L, but the vasculature index is 5.4, a little higher than in the liver. Reproduced fromTakahashi (1970): Tohoku J exp Med 101, pp. 131.
90 Chapter 3
The isodistant vasculature and the structure of liver parenchyma (Figs. 3-26,3-27)Based on the above discussion, let us re-examine the parenchymal structure of
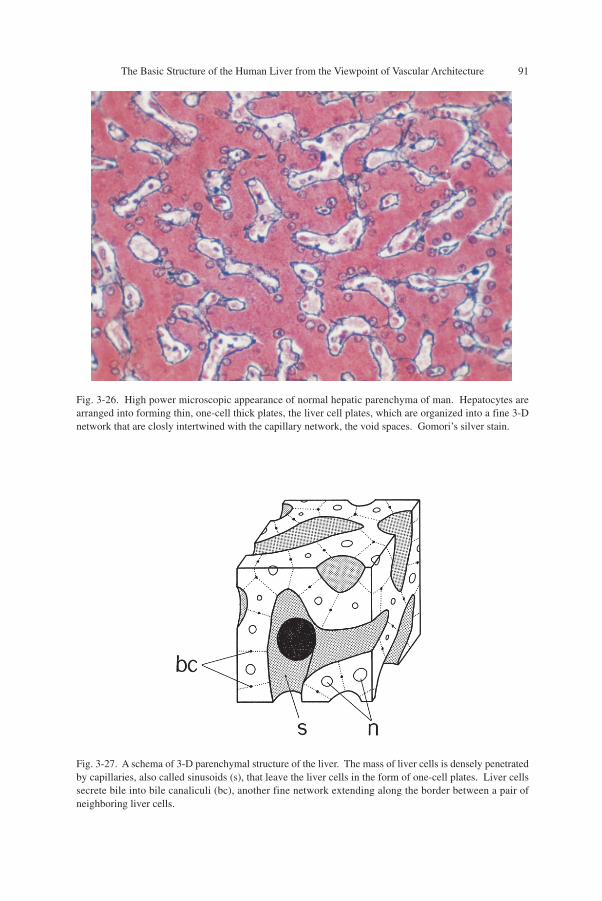
the liver. The liver is the central organ of metabolism, but at the same time it works asan exocrine gland secreting bile as stressed by Rappaport. Figure 3-26 is a micropho-tograph of human liver impregnated with silver. There are capillaries densely con-nected to form a fine network. Flanked by capillaries are hepatocytes arranged in theform of one-cell thick plates, that are forming another network intertwined with thecapillaries.
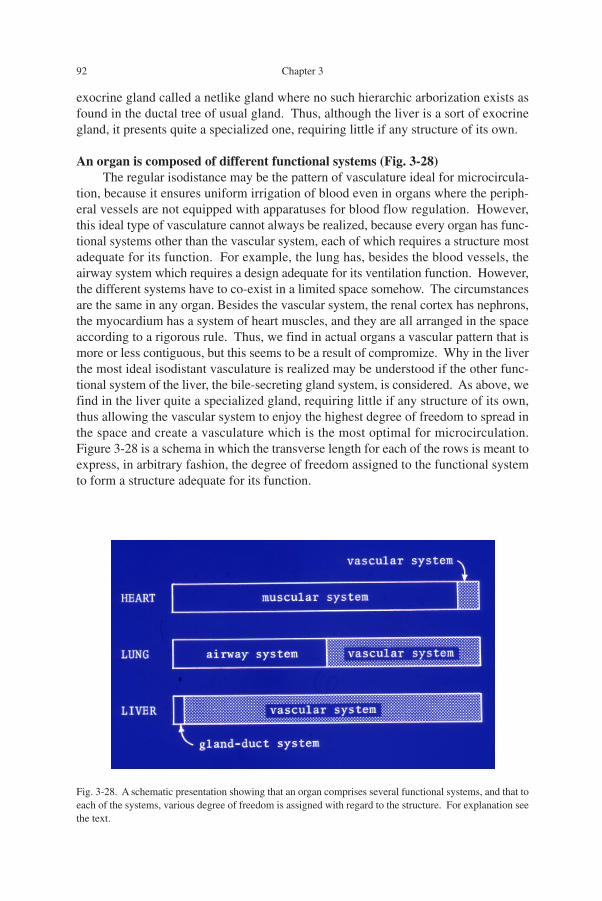
Figure 3-27 is a schema explaining the 3-D structure of liver parenchyma whichis penetrated by a network of capillaries (s: sinusoids). The hepatocytes forming one-cell plates secrete bile into the bile canaliculi (bc), another fine network extendingalong the border between a pair of neighboring hepatocytes. This is a unique type of
Fig. 3-25. On one of the serial sections of lung, the microscopic picture was projected on a sheet of paper,and the contours of airways, alveoli and blood vessels were drawn by tracing. d.a.: ductus alveolaris. Of theblood vessels, pulmonary arteries are shown white, pulmonary veins black. Reproduced from Takahashi(1970): Tohoku J exp Med 101, pp. 133.
The Basic Structure of the Human Liver from the Viewpoint of Vascular Architecture 91
Fig. 3-26. High power microscopic appearance of normal hepatic parenchyma of man. Hepatocytes arearranged into forming thin, one-cell thick plates, the liver cell plates, which are organized into a fine 3-Dnetwork that are closly intertwined with the capillary network, the void spaces. Gomori’s silver stain.
Fig. 3-27. A schema of 3-D parenchymal structure of the liver. The mass of liver cells is densely penetratedby capillaries, also called sinusoids (s), that leave the liver cells in the form of one-cell plates. Liver cellssecrete bile into bile canaliculi (bc), another fine network extending along the border between a pair ofneighboring liver cells.
92 Chapter 3
exocrine gland called a netlike gland where no such hierarchic arborization exists asfound in the ductal tree of usual gland. Thus, although the liver is a sort of exocrinegland, it presents quite a specialized one, requiring little if any structure of its own.
An organ is composed of different functional systems (Fig. 3-28)The regular isodistance may be the pattern of vasculature ideal for microcircula-
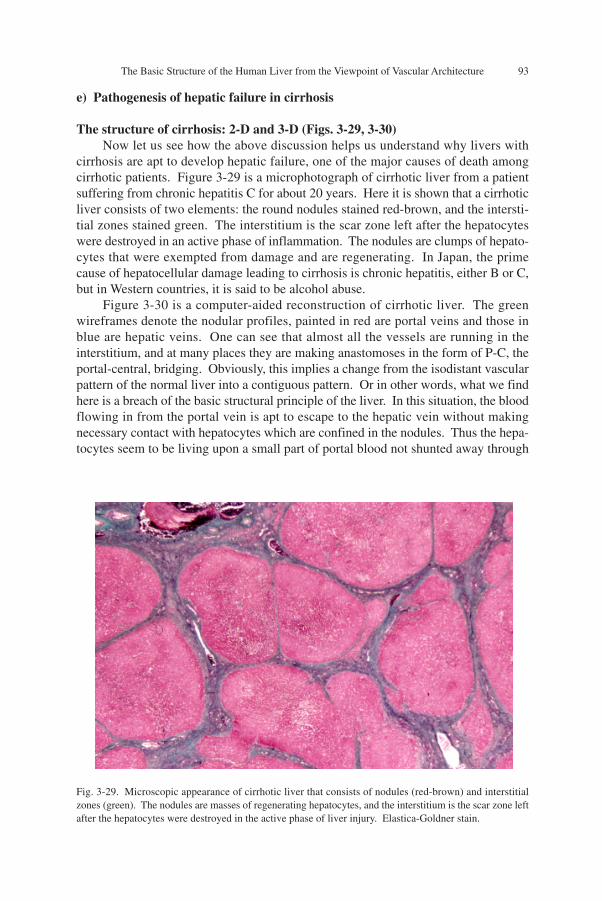
tion, because it ensures uniform irrigation of blood even in organs where the periph-eral vessels are not equipped with apparatuses for blood flow regulation. However,this ideal type of vasculature cannot always be realized, because every organ has func-tional systems other than the vascular system, each of which requires a structure mostadequate for its function. For example, the lung has, besides the blood vessels, theairway system which requires a design adequate for its ventilation function. However,the different systems have to co-exist in a limited space somehow. The circumstancesare the same in any organ. Besides the vascular system, the renal cortex has nephrons,the myocardium has a system of heart muscles, and they are all arranged in the spaceaccording to a rigorous rule. Thus, we find in actual organs a vascular pattern that ismore or less contiguous, but this seems to be a result of compromize. Why in the liverthe most ideal isodistant vasculature is realized may be understood if the other func-tional system of the liver, the bile-secreting gland system, is considered. As above, wefind in the liver quite a specialized gland, requiring little if any structure of its own,thus allowing the vascular system to enjoy the highest degree of freedom to spread inthe space and create a vasculature which is the most optimal for microcirculation.Figure 3-28 is a schema in which the transverse length for each of the rows is meant toexpress, in arbitrary fashion, the degree of freedom assigned to the functional systemto form a structure adequate for its function.
Fig. 3-28. A schematic presentation showing that an organ comprises several functional systems, and that toeach of the systems, various degree of freedom is assigned with regard to the structure. For explanation seethe text.
The Basic Structure of the Human Liver from the Viewpoint of Vascular Architecture 93
e) Pathogenesis of hepatic failure in cirrhosis
The structure of cirrhosis: 2-D and 3-D (Figs. 3-29, 3-30)Now let us see how the above discussion helps us understand why livers with
cirrhosis are apt to develop hepatic failure, one of the major causes of death amongcirrhotic patients. Figure 3-29 is a microphotograph of cirrhotic liver from a patientsuffering from chronic hepatitis C for about 20 years. Here it is shown that a cirrhoticliver consists of two elements: the round nodules stained red-brown, and the intersti-tial zones stained green. The interstitium is the scar zone left after the hepatocyteswere destroyed in an active phase of inflammation. The nodules are clumps of hepato-cytes that were exempted from damage and are regenerating. In Japan, the primecause of hepatocellular damage leading to cirrhosis is chronic hepatitis, either B or C,but in Western countries, it is said to be alcohol abuse.
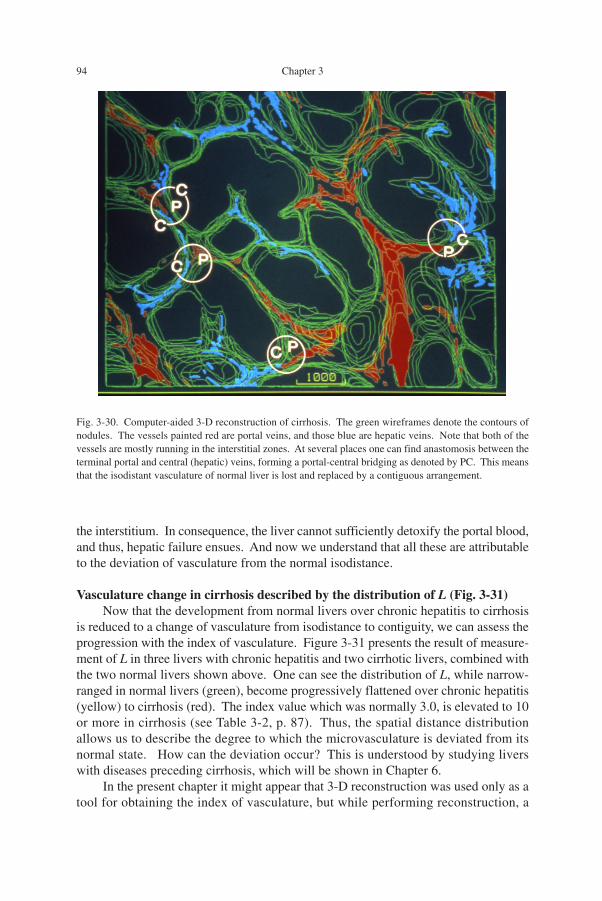
Figure 3-30 is a computer-aided reconstruction of cirrhotic liver. The greenwireframes denote the nodular profiles, painted in red are portal veins and those inblue are hepatic veins. One can see that almost all the vessels are running in theinterstitium, and at many places they are making anastomoses in the form of P-C, theportal-central, bridging. Obviously, this implies a change from the isodistant vascularpattern of the normal liver into a contiguous pattern. Or in other words, what we findhere is a breach of the basic structural principle of the liver. In this situation, the bloodflowing in from the portal vein is apt to escape to the hepatic vein without makingnecessary contact with hepatocytes which are confined in the nodules. Thus the hepa-tocytes seem to be living upon a small part of portal blood not shunted away through
Fig. 3-29. Microscopic appearance of cirrhotic liver that consists of nodules (red-brown) and interstitialzones (green). The nodules are masses of regenerating hepatocytes, and the interstitium is the scar zone leftafter the hepatocytes were destroyed in the active phase of liver injury. Elastica-Goldner stain.
94 Chapter 3
the interstitium. In consequence, the liver cannot sufficiently detoxify the portal blood,and thus, hepatic failure ensues. And now we understand that all these are attributableto the deviation of vasculature from the normal isodistance.
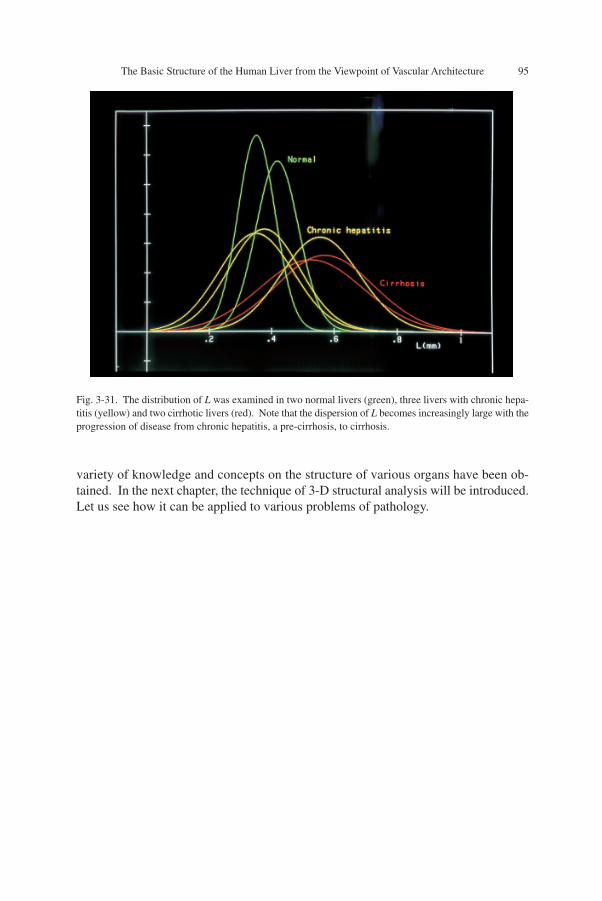
Vasculature change in cirrhosis described by the distribution of L (Fig. 3-31)Now that the development from normal livers over chronic hepatitis to cirrhosis
is reduced to a change of vasculature from isodistance to contiguity, we can assess theprogression with the index of vasculature. Figure 3-31 presents the result of measure-ment of L in three livers with chronic hepatitis and two cirrhotic livers, combined withthe two normal livers shown above. One can see the distribution of L, while narrow-ranged in normal livers (green), become progressively flattened over chronic hepatitis(yellow) to cirrhosis (red). The index value which was normally 3.0, is elevated to 10or more in cirrhosis (see Table 3-2, p. 87). Thus, the spatial distance distributionallows us to describe the degree to which the microvasculature is deviated from itsnormal state. How can the deviation occur? This is understood by studying liverswith diseases preceding cirrhosis, which will be shown in Chapter 6.
In the present chapter it might appear that 3-D reconstruction was used only as atool for obtaining the index of vasculature, but while performing reconstruction, a
Fig. 3-30. Computer-aided 3-D reconstruction of cirrhosis. The green wireframes denote the contours ofnodules. The vessels painted red are portal veins, and those blue are hepatic veins. Note that both of thevessels are mostly running in the interstitial zones. At several places one can find anastomosis between theterminal portal and central (hepatic) veins, forming a portal-central bridging as denoted by PC. This meansthat the isodistant vasculature of normal liver is lost and replaced by a contiguous arrangement.
The Basic Structure of the Human Liver from the Viewpoint of Vascular Architecture 95
Fig. 3-31. The distribution of L was examined in two normal livers (green), three livers with chronic hepa-titis (yellow) and two cirrhotic livers (red). Note that the dispersion of L becomes increasingly large with theprogression of disease from chronic hepatitis, a pre-cirrhosis, to cirrhosis.
variety of knowledge and concepts on the structure of various organs have been ob-tained. In the next chapter, the technique of 3-D structural analysis will be introduced.Let us see how it can be applied to various problems of pathology.