Embed Size (px)
Citation preview

The Basics of
Electrochemical Impedance Spectroscopy
gamry.com
CORROSION BATTERY TESTING
COATINGS PHOTOVOLTAICS
gamry.com2
Contents
What is Electrochemical Impedance Spectroscopy (EIS)? ...............................................3
Data Presentation .................................................................................................................8
Linearity of Electrochemistry Systems ........................................................................ 10
Additional Resources .................................................................................................... 17
gamry.com3
What is Electrochemical Impedance Spectroscopy (EIS)?
Simply put, EIS is a powerful tool that can simulate real-world electrochemical
behaviors using multiple parameters that can be automated, providing a system of
measurement and validation.
In this four-part series of articles, we will review the basics of EIS and how you can
apply this technique to the study and testing of batteries, fuel cells, coatings, and
corrosive reactions.
Part I – AC Circuit Theory and Representation of Complex
Impedance Values
Impedance Definition: Concept of Complex Impedance
Almost everyone knows about the concept of electrical resistance. It is the ability
of a circuit element to resist the flow of electrical current. Ohm’s law (Equation 1)
defines resistance in terms of the ratio between voltage, E, and current, I.
1 R ≡ EI
gamry.com4
While this is a well-known relationship, its use is limited to only one circuit
element - the ideal resistor. An ideal resistor has several simplifying properties:
• It follows Ohm’s Law at all current and voltage levels.
• Its resistance value is independent of frequency.
• AC current and voltage signals through a resistor are in phase with each other.
However, the real world contains circuit elements that exhibit much more
complex behavior. These elements force us to abandon the simple concept of
resistance, and in its place we use impedance, a more general circuit parameter.
Like resistance, impedance is a measure of the ability of a circuit to resist the
flow of electrical current, but unlike resistance, it is not limited by the simplifying
properties listed above.
Electrochemical impedance is usually measured by applying an AC potential to an
electrochemical cell and then measuring the current through the cell. Assume that
we apply a sinusoidal potential excitation. The response to this potential is an AC
current signal. This current signal can be analyzed as a sum of sinusoidal functions
(a Fourier series).
gamry.com5
E
t
phase-shift
I
t
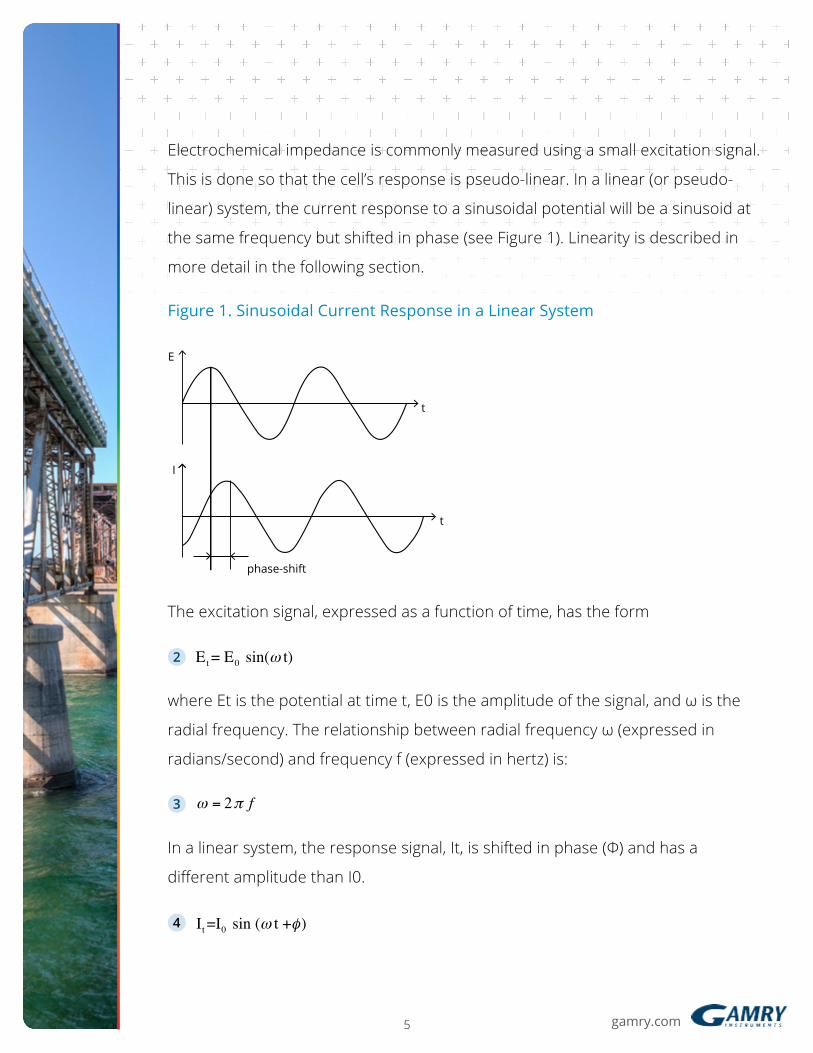
Electrochemical impedance is commonly measured using a small excitation signal.
This is done so that the cell’s response is pseudo-linear. In a linear (or pseudo-
linear) system, the current response to a sinusoidal potential will be a sinusoid at
the same frequency but shifted in phase (see Figure 1). Linearity is described in
more detail in the following section.
Figure 1. Sinusoidal Current Response in a Linear System
where Et is the potential at time t, E0 is the amplitude of the signal, and ω is the
radial frequency. The relationship between radial frequency ω (expressed in
radians/second) and frequency f (expressed in hertz) is:
In a linear system, the response signal, It, is shifted in phase (Φ) and has a
different amplitude than I0.
The excitation signal, expressed as a function of time, has the form
2
3
4
Et = E0 sin(ω t)
ω = 2π f
It =I0 sin (ω t +φ)
gamry.com6
An expression analogous to Ohm’s Law allows us to calculate the impedance of
the system as:
The impedance is therefore expressed in terms of a magnitude, Zo, and a phase
shift, Φ.
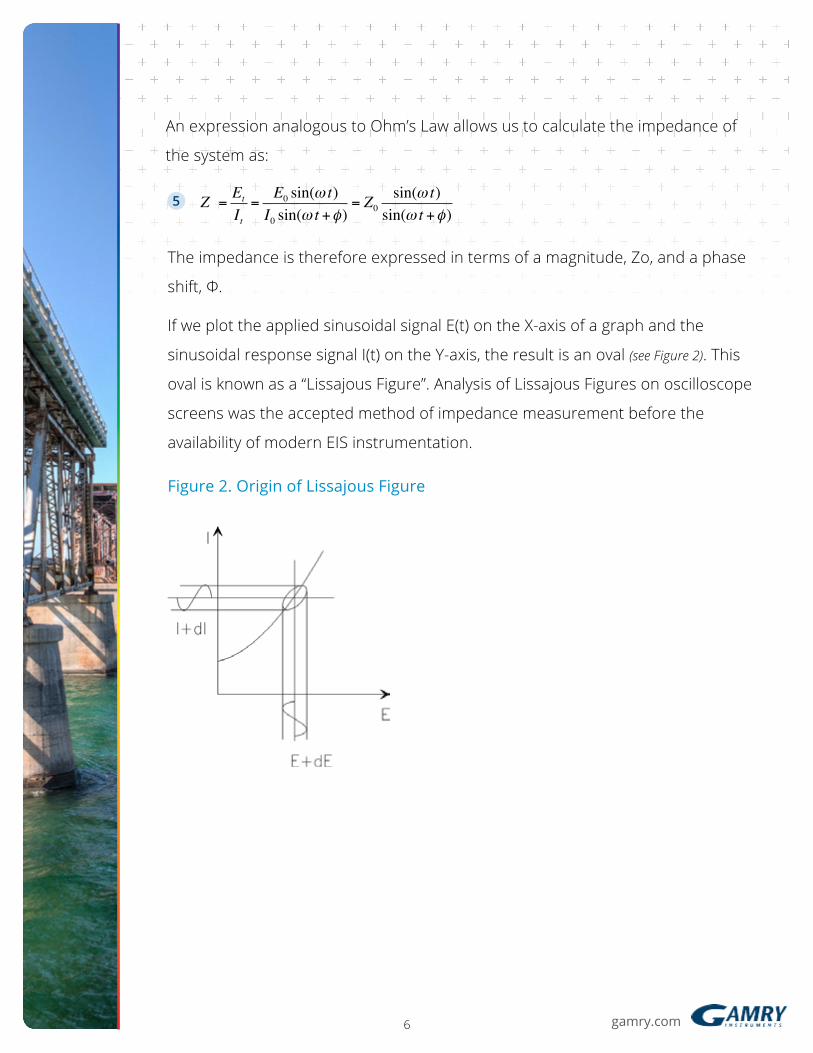
If we plot the applied sinusoidal signal E(t) on the X-axis of a graph and the
sinusoidal response signal I(t) on the Y-axis, the result is an oval (see Figure 2). This
oval is known as a “Lissajous Figure”. Analysis of Lissajous Figures on oscilloscope
screens was the accepted method of impedance measurement before the
availability of modern EIS instrumentation.
Figure 2. Origin of Lissajous Figure
5 Z =Et
It=
E0 sin(ω t)I0 sin(ω t +φ)
= Z0sin(ω t)sin(ω t +φ)
gamry.com7
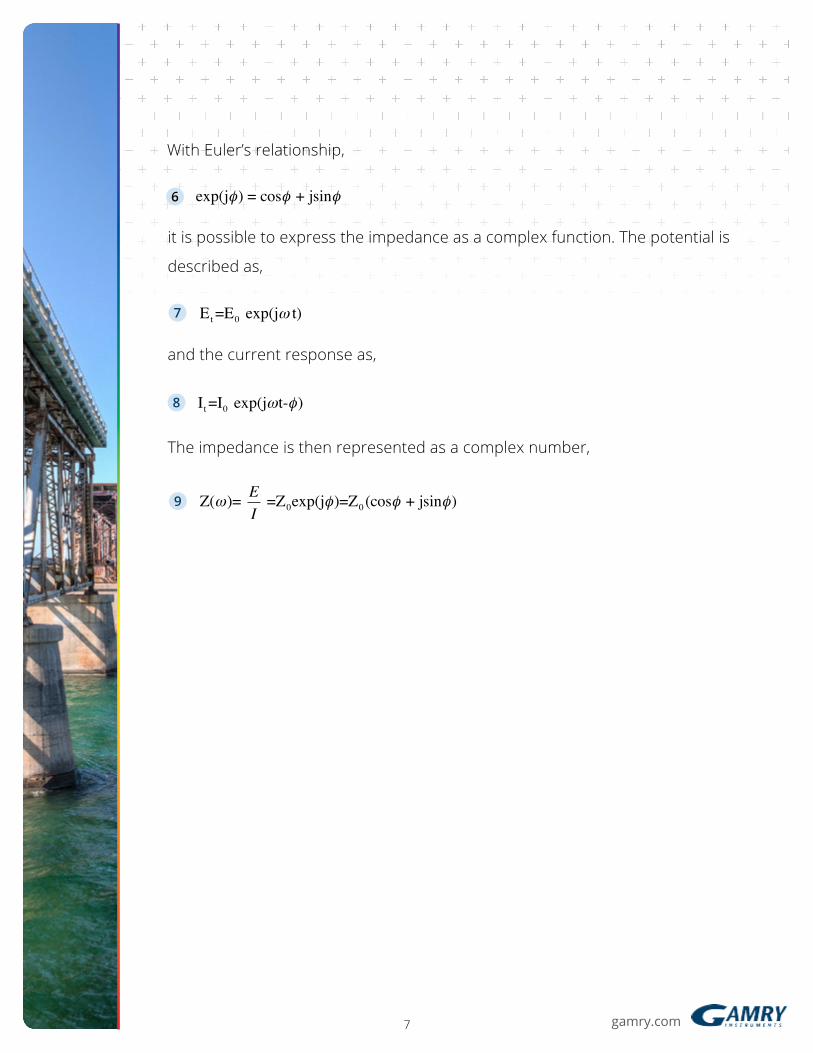
With Euler’s relationship,
6
it is possible to express the impedance as a complex function. The potential is
described as,
and the current response as,
The impedance is then represented as a complex number,
7
8
9
exp(jφ) = cosφ + jsinφ
Et =E0 exp(jω t)
It =I0 exp(jωt-φ)
Z(ω)= EI
=Z0exp(jφ)=Z0 (cosφ + jsinφ)
gamry.com8
Data Presentation
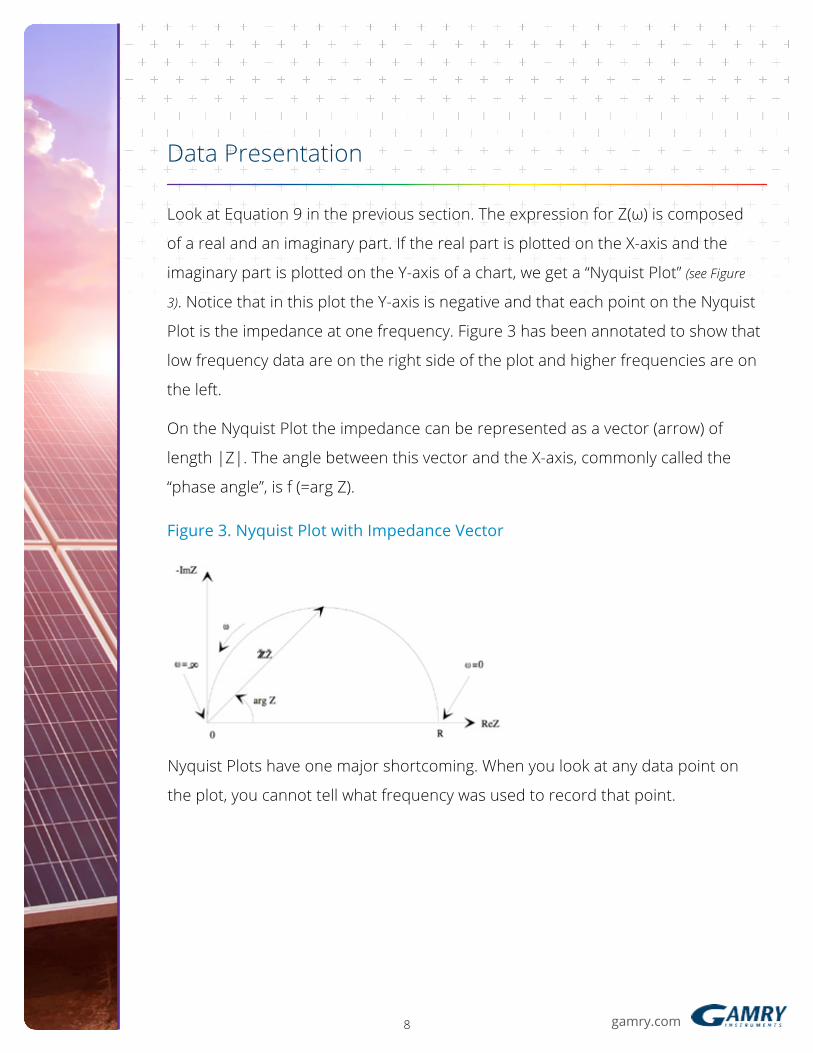
Look at Equation 9 in the previous section. The expression for Z(ω) is composed
of a real and an imaginary part. If the real part is plotted on the X-axis and the
imaginary part is plotted on the Y-axis of a chart, we get a “Nyquist Plot” (see Figure
3). Notice that in this plot the Y-axis is negative and that each point on the Nyquist
Plot is the impedance at one frequency. Figure 3 has been annotated to show that
low frequency data are on the right side of the plot and higher frequencies are on
the left.
On the Nyquist Plot the impedance can be represented as a vector (arrow) of
length |Z|. The angle between this vector and the X-axis, commonly called the
“phase angle”, is f (=arg Z).
Figure 3. Nyquist Plot with Impedance Vector
Nyquist Plots have one major shortcoming. When you look at any data point on
the plot, you cannot tell what frequency was used to record that point.
gamry.com9
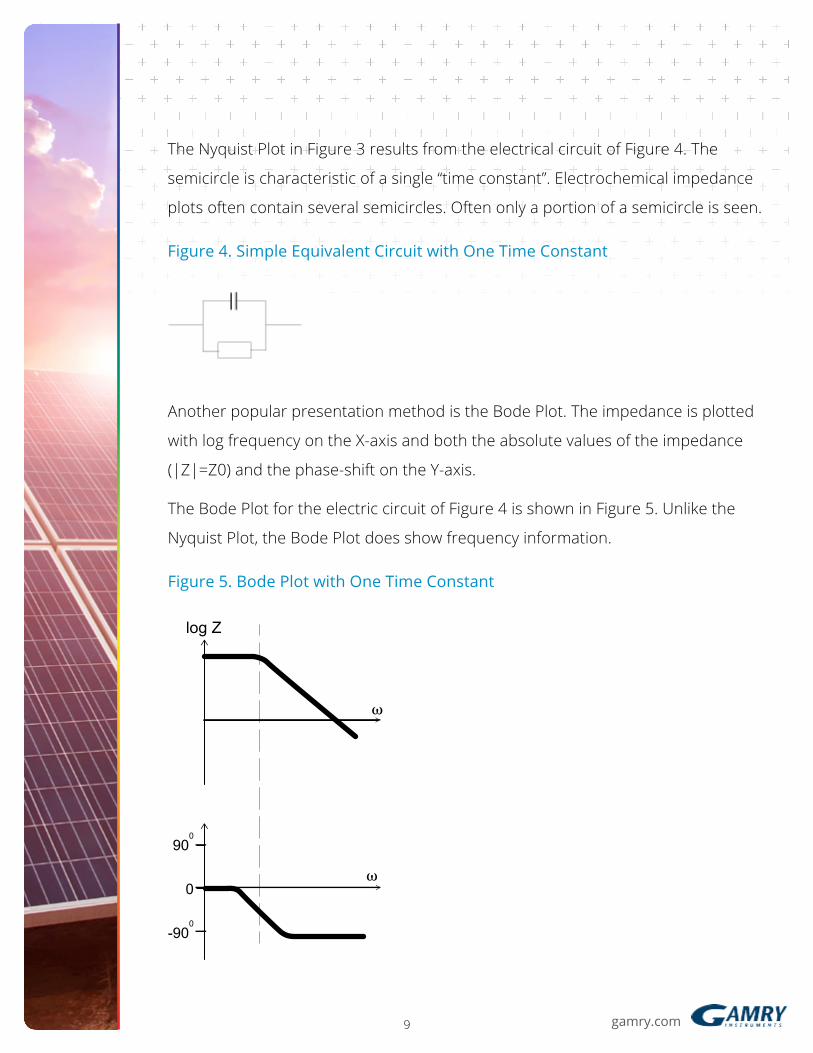
The Nyquist Plot in Figure 3 results from the electrical circuit of Figure 4. The
semicircle is characteristic of a single “time constant”. Electrochemical impedance
plots often contain several semicircles. Often only a portion of a semicircle is seen.
Figure 4. Simple Equivalent Circuit with One Time Constant
Another popular presentation method is the Bode Plot. The impedance is plotted
with log frequency on the X-axis and both the absolute values of the impedance
(|Z|=Z0) and the phase-shift on the Y-axis.
The Bode Plot for the electric circuit of Figure 4 is shown in Figure 5. Unlike the
Nyquist Plot, the Bode Plot does show frequency information.
Figure 5. Bode Plot with One Time Constant
log Z
�
�
900
0
-900
gamry.com10
Linearity of Electrochemistry Systems
Electrical circuit theory distinguishes between linear and non-linear systems
(circuits). Impedance analysis of linear circuits is much easier than analysis of non-
linear ones.
The following definition of a linear system is taken from Signals and Systems by
Oppenheim and Willsky:
A linear system ... is one that possesses the important property of superposition: If
the input consists of the weighted sum of several signals, then the output is simply
the superposition, that is, the weighted sum, of the responses of the system to
each of the signals. Mathematically, let y1(t) be the response of a continuous time
system to x1(t) ant let y2(t) be the output corresponding to the input x2(t). Then
the system is linear if:
1) The response to x1(t) + x2(t) is y1(t) + y2(t)
2) The response to ax1(t) is ay1(t) ...
For a potentiostated electrochemical cell, the input is the potential and the output
is the current. Electrochemical cells are not linear! Doubling the voltage will not
necessarily double the current.
gamry.com11
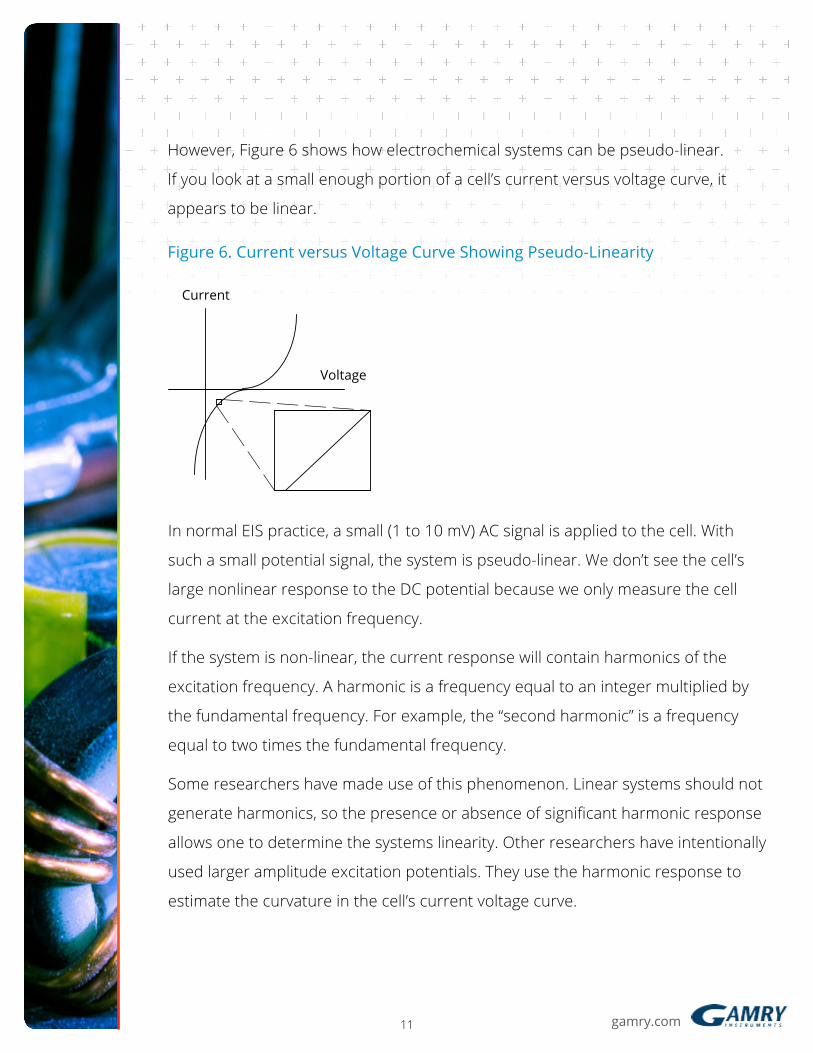
However, Figure 6 shows how electrochemical systems can be pseudo-linear.
If you look at a small enough portion of a cell’s current versus voltage curve, it
appears to be linear.
Figure 6. Current versus Voltage Curve Showing Pseudo-Linearity
In normal EIS practice, a small (1 to 10 mV) AC signal is applied to the cell. With
such a small potential signal, the system is pseudo-linear. We don’t see the cell’s
large nonlinear response to the DC potential because we only measure the cell
current at the excitation frequency.
If the system is non-linear, the current response will contain harmonics of the
excitation frequency. A harmonic is a frequency equal to an integer multiplied by
the fundamental frequency. For example, the “second harmonic” is a frequency
equal to two times the fundamental frequency.
Some researchers have made use of this phenomenon. Linear systems should not
generate harmonics, so the presence or absence of significant harmonic response
allows one to determine the systems linearity. Other researchers have intentionally
used larger amplitude excitation potentials. They use the harmonic response to
estimate the curvature in the cell’s current voltage curve.
Current
Voltage
gamry.com12
Steady State Systems
Measuring an EIS spectrum takes time (often up to many hours). The system being
measured must be at a steady state throughout the time required to measure the
EIS spectrum. A common cause of problems in EIS measurements and analysis is
drift in the system being measured.
In practice, a steady state can be difficult to achieve. The cell can change through
adsorption of solution impurities, growth of an oxide layer, build-up of reaction
products in solution, coating degradation, or temperature changes, to list just a
few factors.
Standard EIS analysis tools may give you wildly inaccurate results on a system that
is not at steady state.
Time and Frequency Domains and Transforms
Signal processing theory refers to data representation domains. The same data
can be represented in different domains. In EIS, we use two of these domains, the
time domain, and the frequency domain.
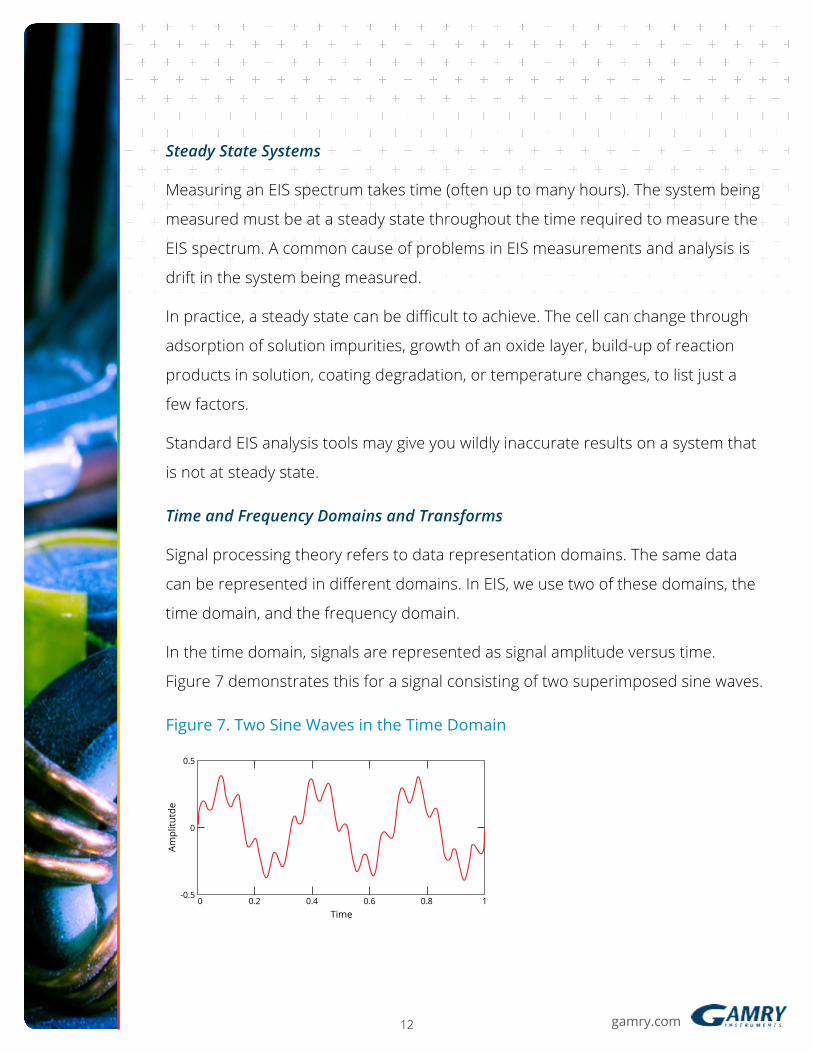
In the time domain, signals are represented as signal amplitude versus time.
Figure 7 demonstrates this for a signal consisting of two superimposed sine waves.
Figure 7. Two Sine Waves in the Time Domain
Ampl
itutd
e
Time
0.5
0
-0.50 0.2 0.4 0.6 0.8 1
gamry.com13
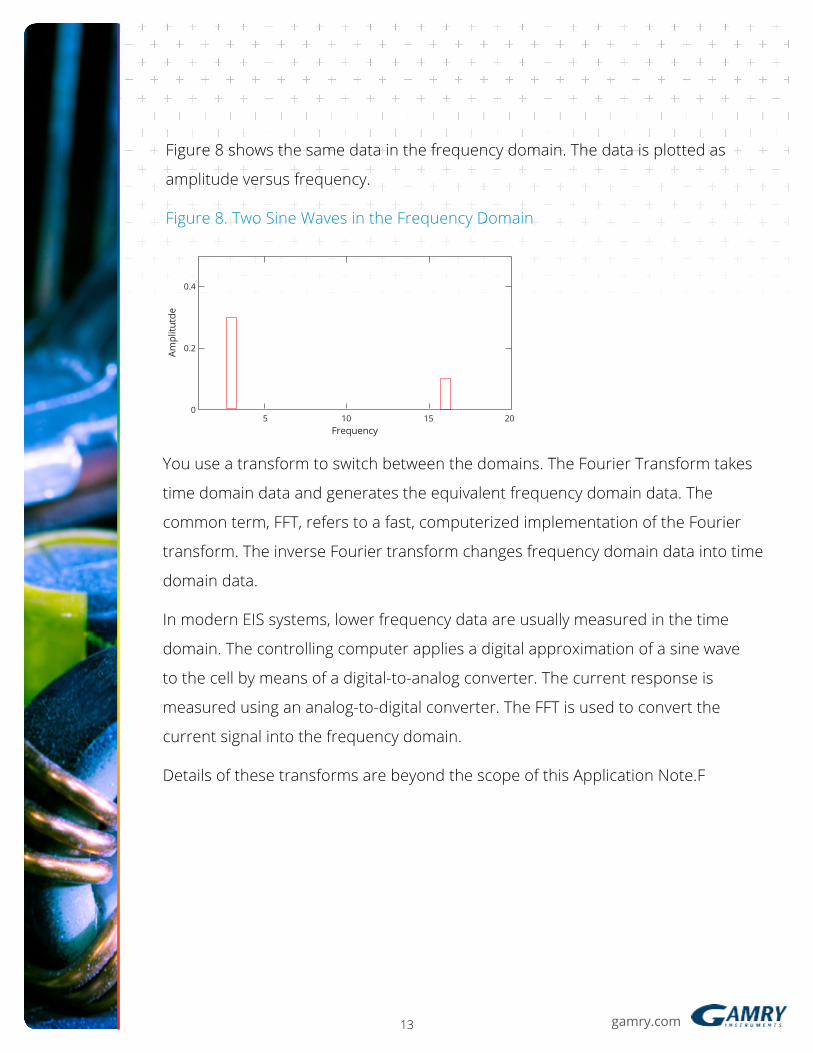
Figure 8 shows the same data in the frequency domain. The data is plotted as
amplitude versus frequency.
Figure 8. Two Sine Waves in the Frequency Domain
You use a transform to switch between the domains. The Fourier Transform takes
time domain data and generates the equivalent frequency domain data. The
common term, FFT, refers to a fast, computerized implementation of the Fourier
transform. The inverse Fourier transform changes frequency domain data into time
domain data.
In modern EIS systems, lower frequency data are usually measured in the time
domain. The controlling computer applies a digital approximation of a sine wave
to the cell by means of a digital-to-analog converter. The current response is
measured using an analog-to-digital converter. The FFT is used to convert the
current signal into the frequency domain.
Details of these transforms are beyond the scope of this Application Note.F
Ampl
itutd
e
Frequency
0.4
0.2
05 10 15 20
gamry.com14
Electrical Circuit Elements
EIS data are commonly analyzed by fitting to an equivalent electrical circuit model.
Most of the circuit elements in the model are common electrical elements such as
resistors, capacitors, and inductors. To be useful, the elements in the model should
have a basis in the physical electrochemistry of the system. As an example, most
models contain a resistor that models the cell’s solution resistance.
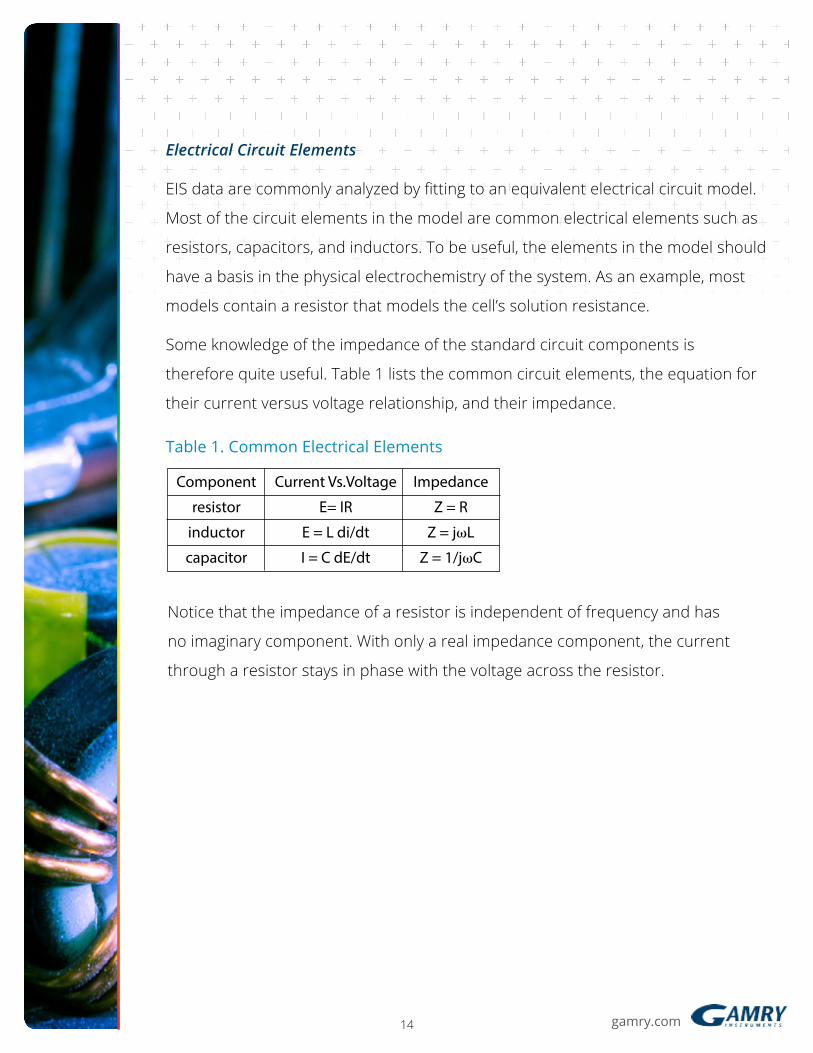
Some knowledge of the impedance of the standard circuit components is
therefore quite useful. Table 1 lists the common circuit elements, the equation for
their current versus voltage relationship, and their impedance.
Table 1. Common Electrical Elements
Notice that the impedance of a resistor is independent of frequency and has
no imaginary component. With only a real impedance component, the current
through a resistor stays in phase with the voltage across the resistor.
Component Current Vs.Voltage Impedance
resistor E= IR Z = R
inductor E = L di/dt Z = j�L
capacitor I = C dE/dt Z = 1/j�C
gamry.com15
Z1 Z2 Z3
The impedance of an inductor increases as frequency increases. Inductors have
only an imaginary impedance component. As a result, the current through an
inductor is phase-shifted -90 degrees with respect to the voltage.
The impedance versus frequency behavior of a capacitor is opposite to that of an
inductor. A capacitor’s impedance decreases as the frequency is raised. Capacitors
also have only an imaginary impedance component. The current through a
capacitor is phase shifted 90 degrees with respect to the voltage.
Serial and Parallel Combinations of Circuit Elements
Very few electrochemical cells can be modeled using a single equivalent circuit
element. Instead, EIS models usually consist of a number of elements in a network.
Both serial (Figure 9) and parallel (Figure 10) combinations of elements occur.
Fortunately, there are simple formulas that describe the impedance of circuit
elements in both parallel and series combination.
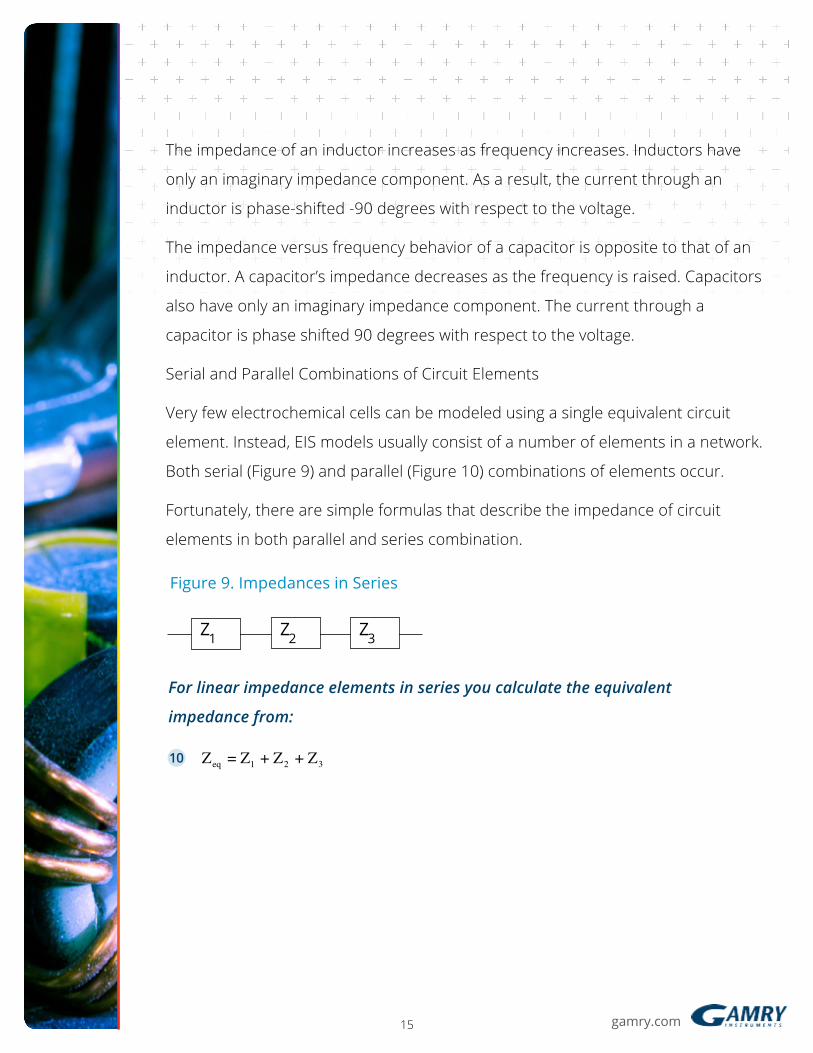
Figure 9. Impedances in Series
For linear impedance elements in series you calculate the equivalent
impedance from:
10 Zeq = Z1 + Z2 + Z3
gamry.com16
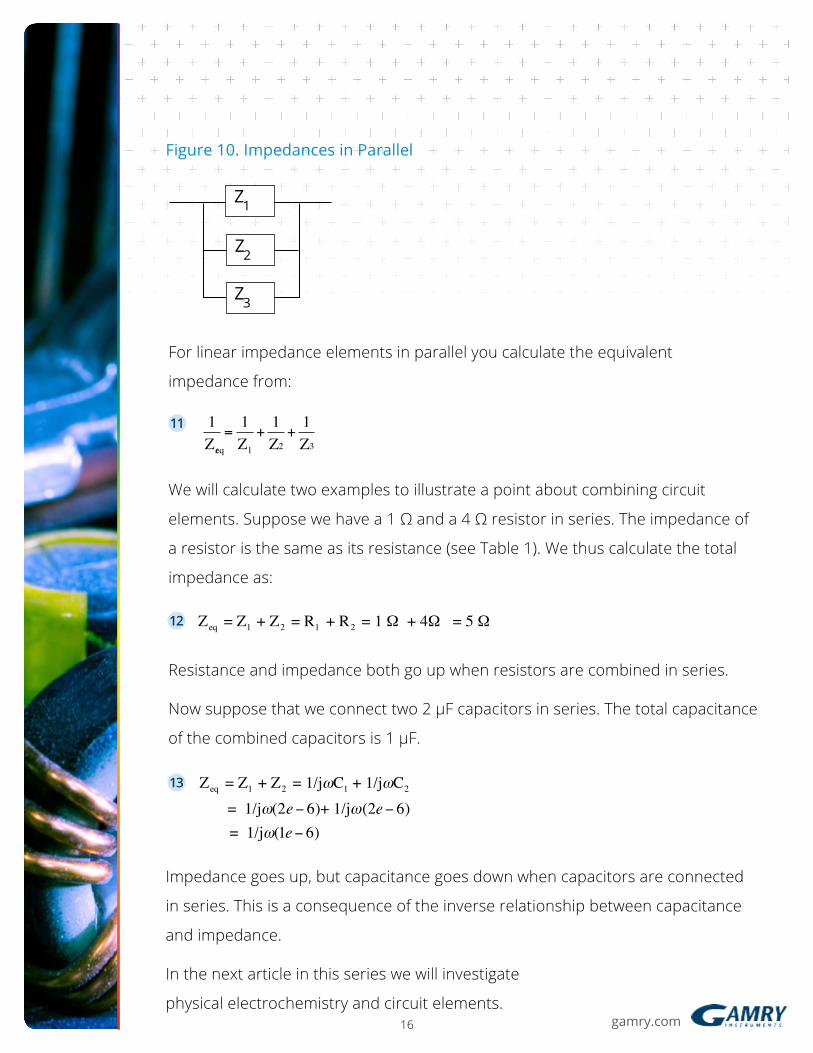
Figure 10. Impedances in Parallel
For linear impedance elements in parallel you calculate the equivalent
impedance from:
We will calculate two examples to illustrate a point about combining circuit
elements. Suppose we have a 1 Ω and a 4 Ω resistor in series. The impedance of
a resistor is the same as its resistance (see Table 1). We thus calculate the total
impedance as:
Resistance and impedance both go up when resistors are combined in series.
Now suppose that we connect two 2 μF capacitors in series. The total capacitance
of the combined capacitors is 1 μF.
Impedance goes up, but capacitance goes down when capacitors are connected
in series. This is a consequence of the inverse relationship between capacitance
and impedance.
In the next article in this series we will investigate
physical electrochemistry and circuit elements.
Z1
Z3
Z2
11
Zeq = Z1 + Z2 = R1 + R2 = 1 Ω + 4Ω = 5 Ω
1Zeqt
=1Z1+1Z2+1Z3
Zeq = Z1 + Z2 = 1/jωC1 + 1/jωC2 = 1/jω(2e− 6)+ 1/jω(2e− 6) = 1/jω(1e− 6)
12
13

gamry.com17
Additional Resources
If you need additional information, please visit our website for our online resources and support.
Technical Support A compilation of technical support information by hardware and software.
Software UpdatesLicensed users can download the latest version of the Gamry Software.
Documentation DownloadsDownload manuals for hardware and software products.
Electrochemistry Courses and TrainingInformation on short courses and electrochemistry training.
Contact Technical SupportGet support from the electrochemical experts at Gamry.
Support & Tutorial VideosFor all of our tutorial and support-related videos you can also visit Gamry Instruments YouTube
Application NotesA series of Application and Technical Notes to assist you in getting the most accurate results.
Literature DatabaseA database of articles where people have used a Gamry System in their research

gamry.com
For help from our technical staff or questions about our products, please call us at 215-682-9330.
Gamry.com