Embed Size (px)
Citation preview
The Basics of Salary Structure Design & Administration
Louisiana SHRM Annual Conference 2013
© James T Stodd, 2013 1
2
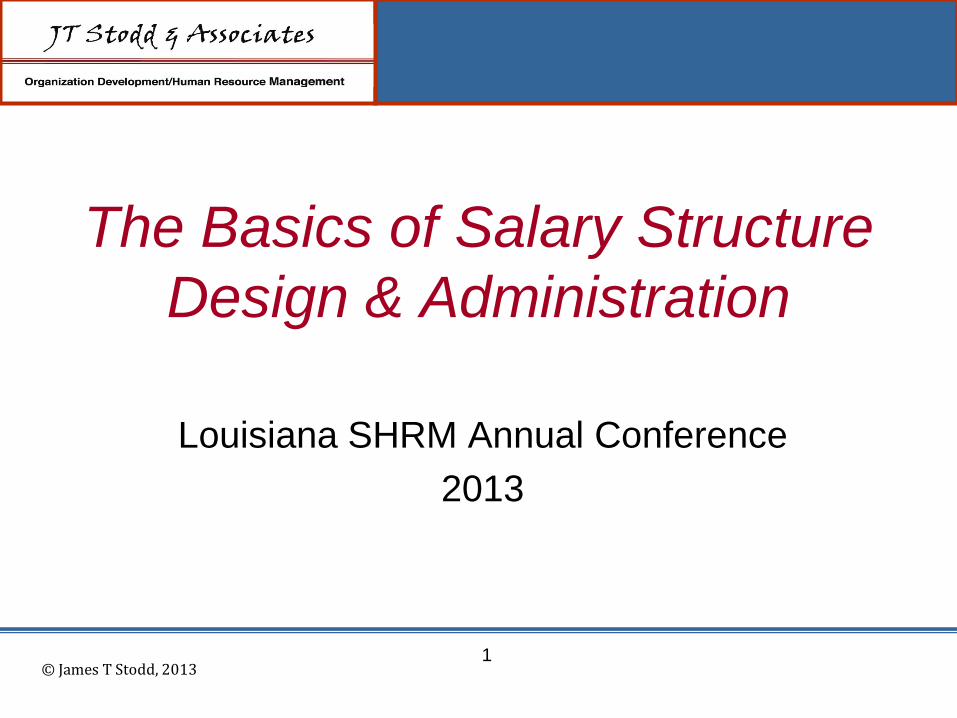
Why Use Pay/Salary Structures? M
arke
t Val
ue
$
Job Complexity & Requirements
Minimum Wage
A salary structure defines the relationship between the “internal value” placed upon jobs within
the organization relative to the “external value” found in the market place.
© James T Stodd, 2013
Establishing a
Base Pay/Salary Structure
© James T Stodd, 2013 3
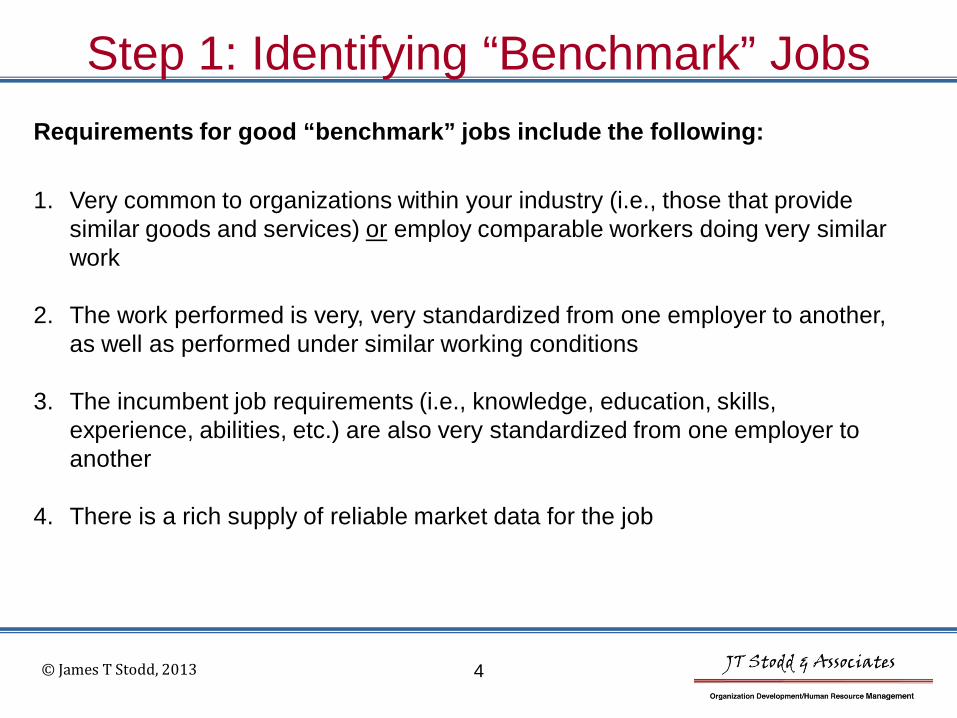
Step 1: Identifying “Benchmark” Jobs
1. Very common to organizations within your industry (i.e., those that provide
similar goods and services) or employ comparable workers doing very similar work
2. The work performed is very, very standardized from one employer to another, as well as performed under similar working conditions
3. The incumbent job requirements (i.e., knowledge, education, skills, experience, abilities, etc.) are also very standardized from one employer to another
4. There is a rich supply of reliable market data for the job
© James T Stodd, 2013 4
Requirements for good “benchmark” jobs include the following:
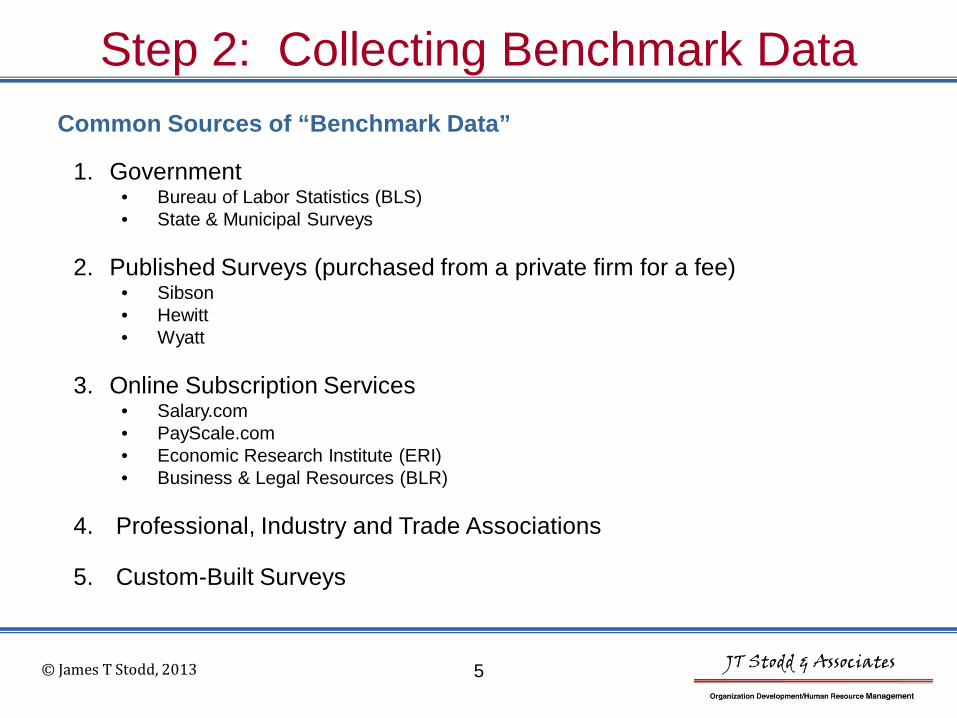
Step 2: Collecting Benchmark Data Common Sources of “Benchmark Data”
1. Government • Bureau of Labor Statistics (BLS) • State & Municipal Surveys
2. Published Surveys (purchased from a private firm for a fee)
• Sibson • Hewitt • Wyatt
3. Online Subscription Services
• Salary.com • PayScale.com • Economic Research Institute (ERI) • Business & Legal Resources (BLR)
4. Professional, Industry and Trade Associations
5. Custom-Built Surveys
© James T Stodd, 2013 5
6
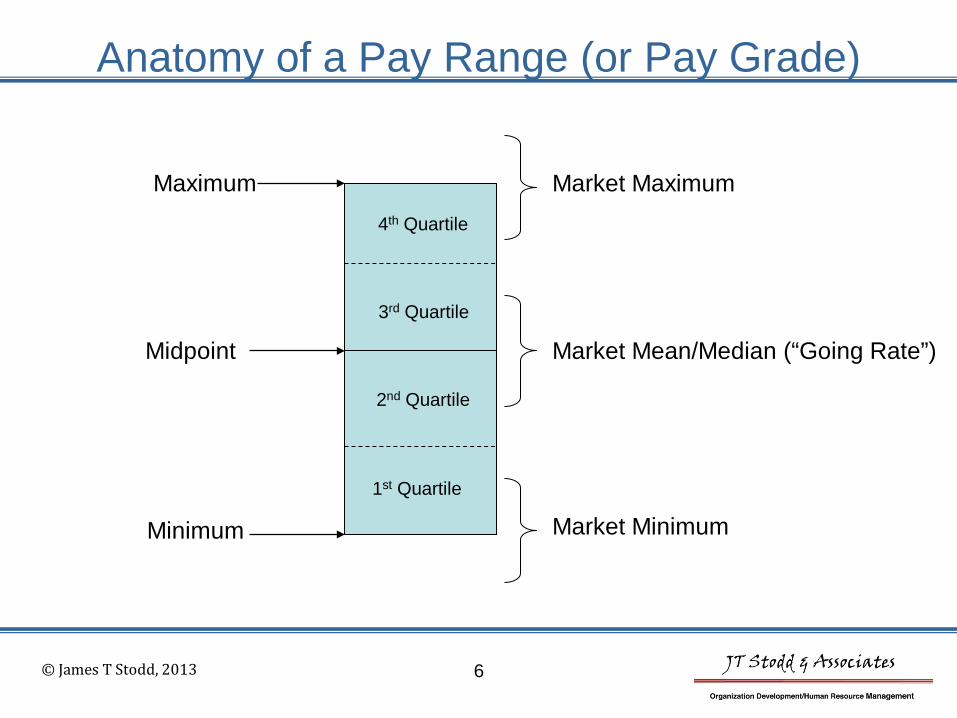
Anatomy of a Pay Range (or Pay Grade)
Minimum
Maximum
Midpoint
1st Quartile
2nd Quartile
3rd Quartile
4th Quartile
Market Minimum
Market Mean/Median (“Going Rate”)
Market Maximum
© James T Stodd, 2013
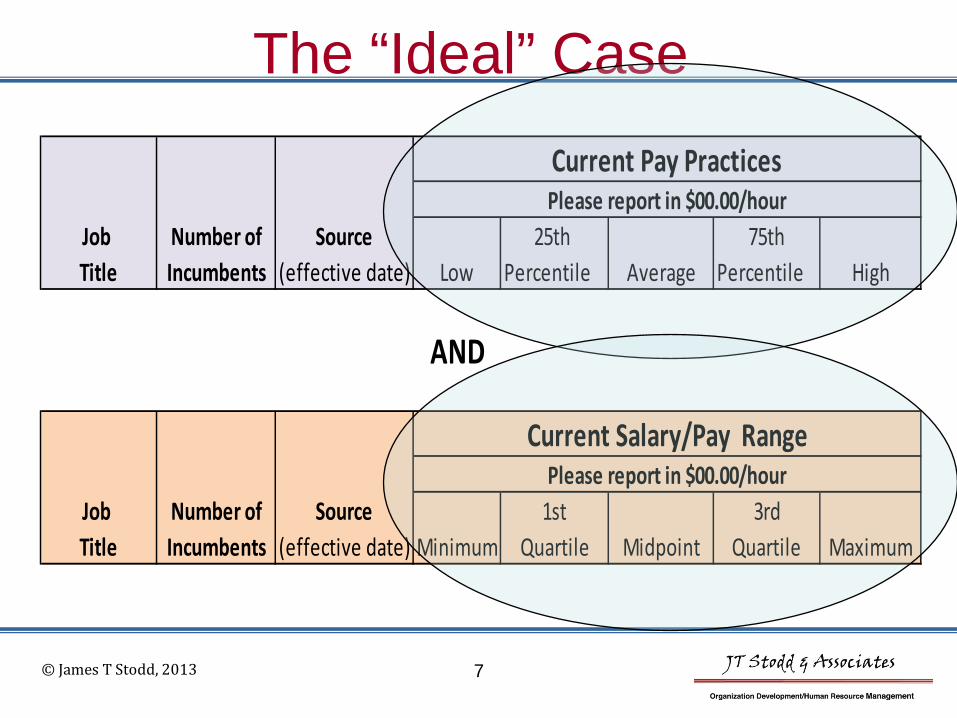
The “Ideal” Case
Job Number of Source 25th 75thTitle Incumbents (effective date) Low Percentile Average Percentile High
AND
Job Number of Source 1st 3rdTitle Incumbents (effective date) Minimum Quartile Midpoint Quartile Maximum
Current Salary/Pay RangePlease report in $00.00/hour
Please report in $00.00/hourCurrent Pay Practices
© James T Stodd, 2013 7
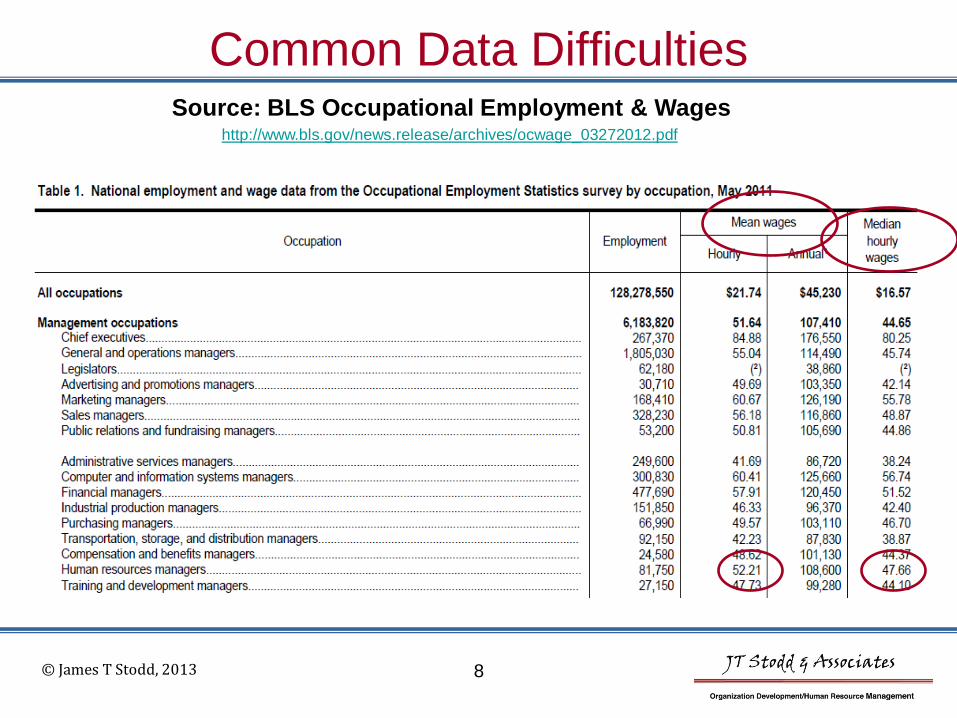
Common Data Difficulties Source: BLS Occupational Employment & Wages
http://www.bls.gov/news.release/archives/ocwage_03272012.pdf
© James T Stodd, 2013 8
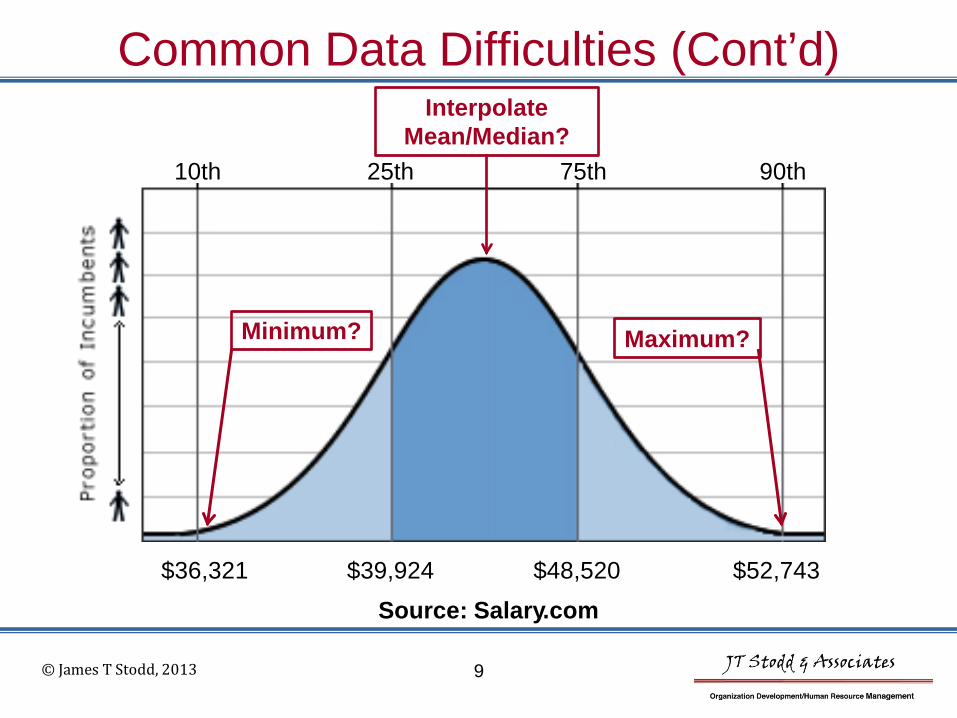
Common Data Difficulties (Cont’d)
10th 25th 75th 90th
$36,321 $39,924 $48,520 $52,743
Interpolate Mean/Median?
Minimum? Maximum?
Source: Salary.com
© James T Stodd, 2013 9
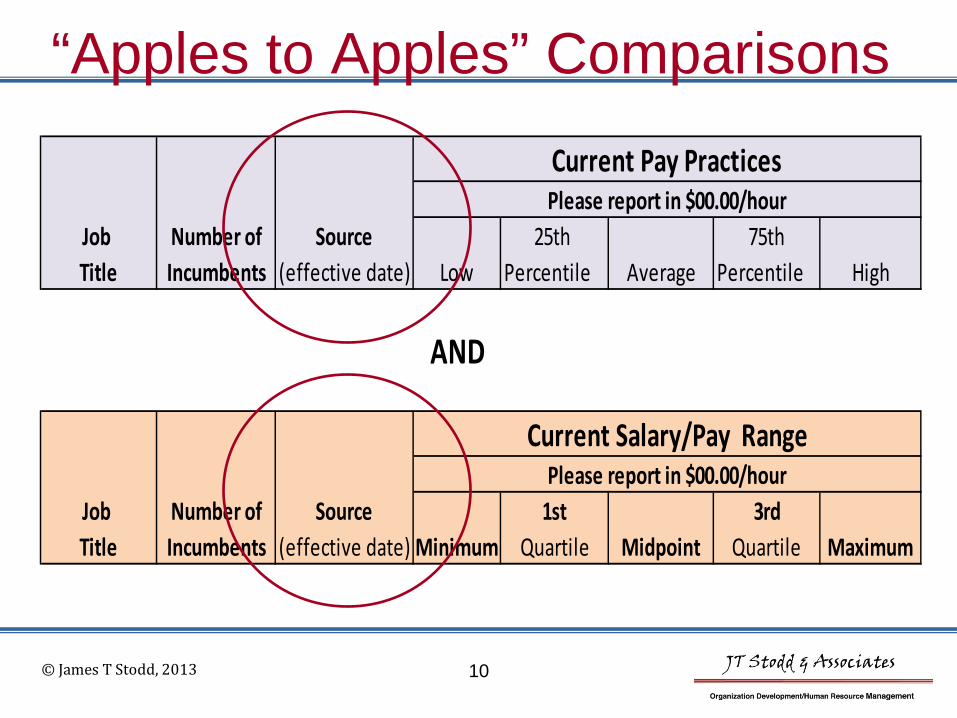
“Apples to Apples” Comparisons
Job Number of Source 25th 75thTitle Incumbents (effective date) Low Percentile Average Percentile High
AND
Job Number of Source 1st 3rdTitle Incumbents (effective date) Minimum Quartile Midpoint Quartile Maximum
Current Salary/Pay RangePlease report in $00.00/hour
Please report in $00.00/hourCurrent Pay Practices
© James T Stodd, 2013 10
Adjusting Data for Wage Inflation
Sources of information:
1. Bureau of Labor Statistics; Employment Cost Index (ECI)
2. Salary Budget & Planning Surveys (must purchase)
See Sample: http://www.culpepper.com/eBulletin/2012/SalaryBudgets0912.asp
© James T Stodd, 2013 11
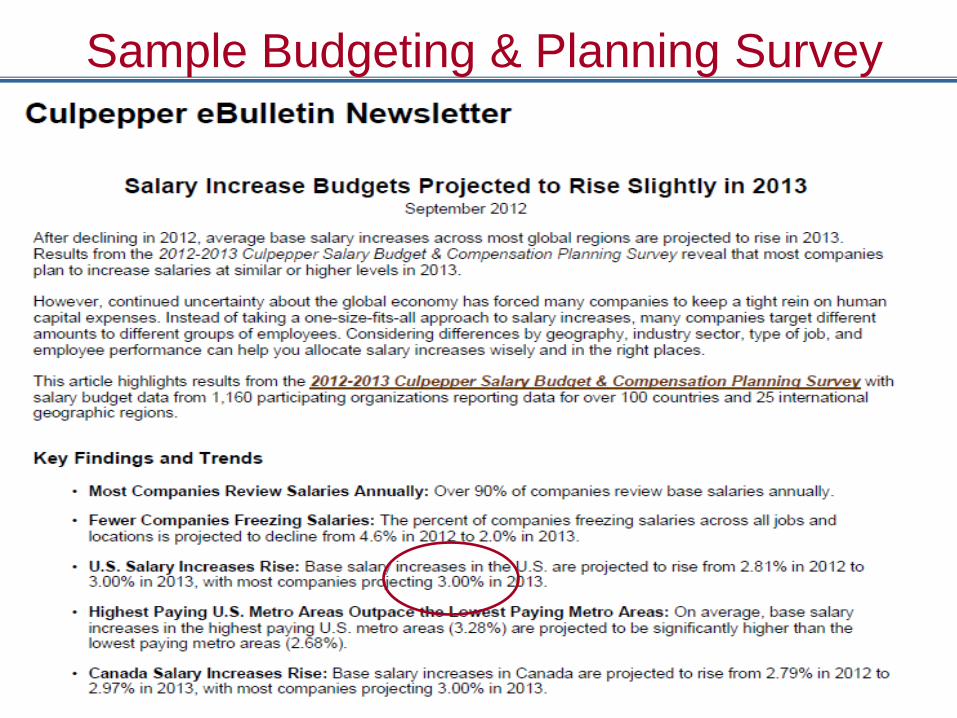
Sample Budgeting & Planning Survey
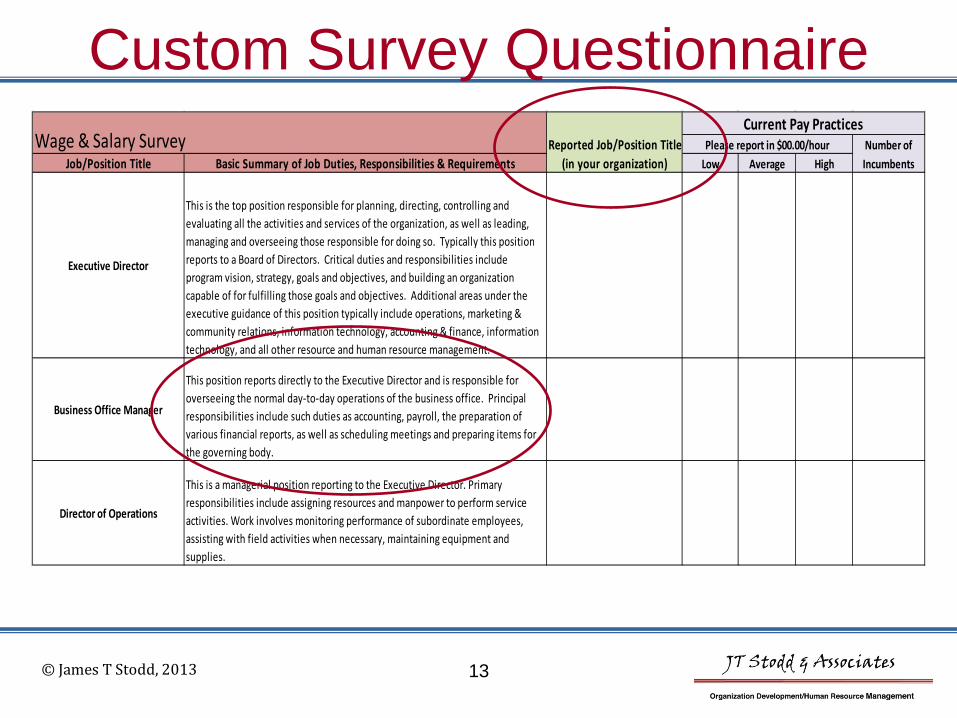
Custom Survey Questionnaire Reported Job/Position Title Number of
Job/Position Title Basic Summary of Job Duties, Responsibilities & Requirements (in your organization) Low Average High Incumbents
Executive Director
This is the top position responsible for planning, directing, controlling and evaluating all the activities and services of the organization, as well as leading, managing and overseeing those responsible for doing so. Typically this position reports to a Board of Directors. Critical duties and responsibilities include program vision, strategy, goals and objectives, and building an organization capable of for fulfilling those goals and objectives. Additional areas under the executive guidance of this position typically include operations, marketing & community relations, information technology, accounting & finance, information technology, and all other resource and human resource management.
Business Office Manager
This position reports directly to the Executive Director and is responsible for overseeing the normal day-to-day operations of the business office. Principal responsibilities include such duties as accounting, payroll, the preparation of various financial reports, as well as scheduling meetings and preparing items for the governing body.
Director of Operations
This is a managerial position reporting to the Executive Director. Primary responsibilities include assigning resources and manpower to perform service activities. Work involves monitoring performance of subordinate employees, assisting with field activities when necessary, maintaining equipment and supplies.
Current Pay PracticesPlease report in $00.00/hourWage & Salary Survey
© James T Stodd, 2013 13
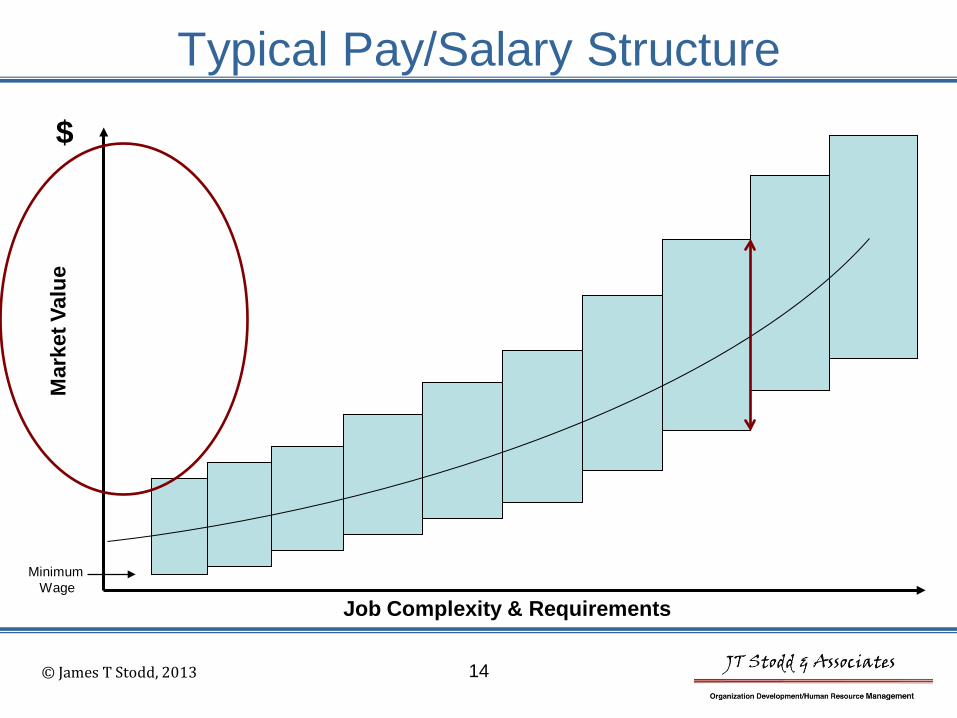
14
Typical Pay/Salary Structure M
arke
t Val
ue
$
Job Complexity & Requirements
Minimum Wage
© James T Stodd, 2013
15
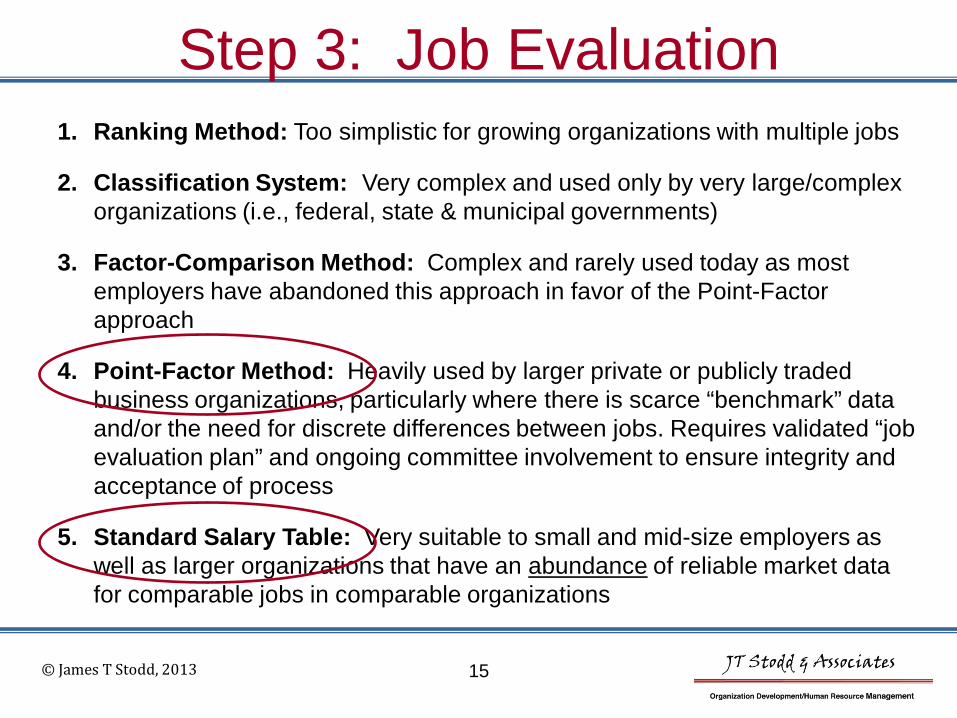
1. Ranking Method: Too simplistic for growing organizations with multiple jobs
2. Classification System: Very complex and used only by very large/complex organizations (i.e., federal, state & municipal governments)
3. Factor-Comparison Method: Complex and rarely used today as most
employers have abandoned this approach in favor of the Point-Factor approach
4. Point-Factor Method: Heavily used by larger private or publicly traded business organizations, particularly where there is scarce “benchmark” data and/or the need for discrete differences between jobs. Requires validated “job evaluation plan” and ongoing committee involvement to ensure integrity and acceptance of process
5. Standard Salary Table: Very suitable to small and mid-size employers as
well as larger organizations that have an abundance of reliable market data for comparable jobs in comparable organizations
© James T Stodd, 2013
Step 3: Job Evaluation
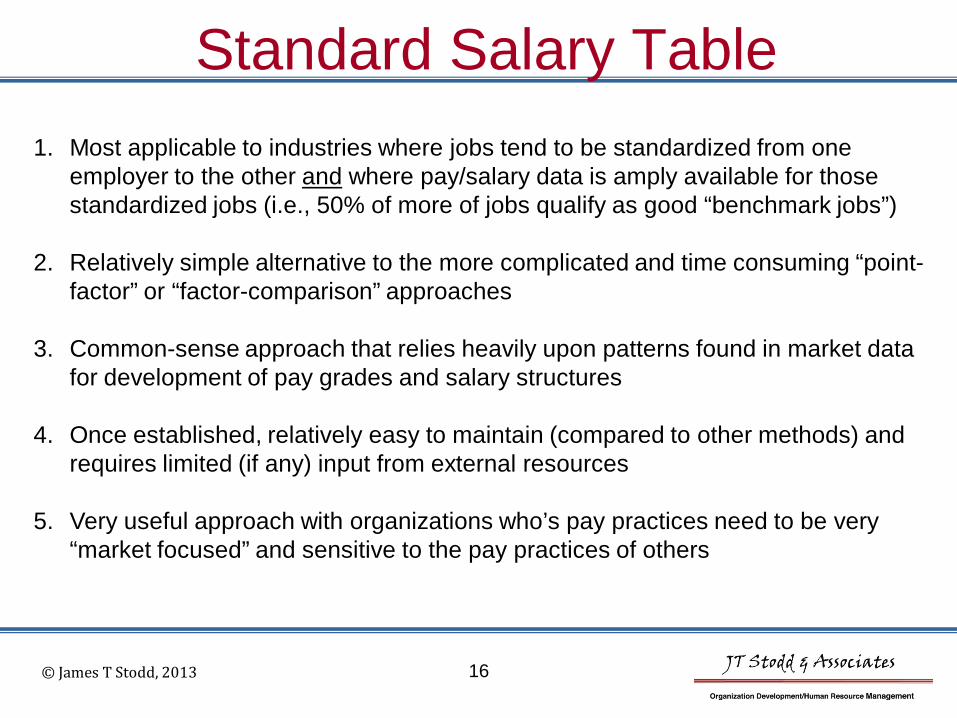
Standard Salary Table 1. Most applicable to industries where jobs tend to be standardized from one
employer to the other and where pay/salary data is amply available for those standardized jobs (i.e., 50% of more of jobs qualify as good “benchmark jobs”)
2. Relatively simple alternative to the more complicated and time consuming “point-factor” or “factor-comparison” approaches
3. Common-sense approach that relies heavily upon patterns found in market data for development of pay grades and salary structures
4. Once established, relatively easy to maintain (compared to other methods) and requires limited (if any) input from external resources
5. Very useful approach with organizations who’s pay practices need to be very “market focused” and sensitive to the pay practices of others
© James T Stodd, 2013 16
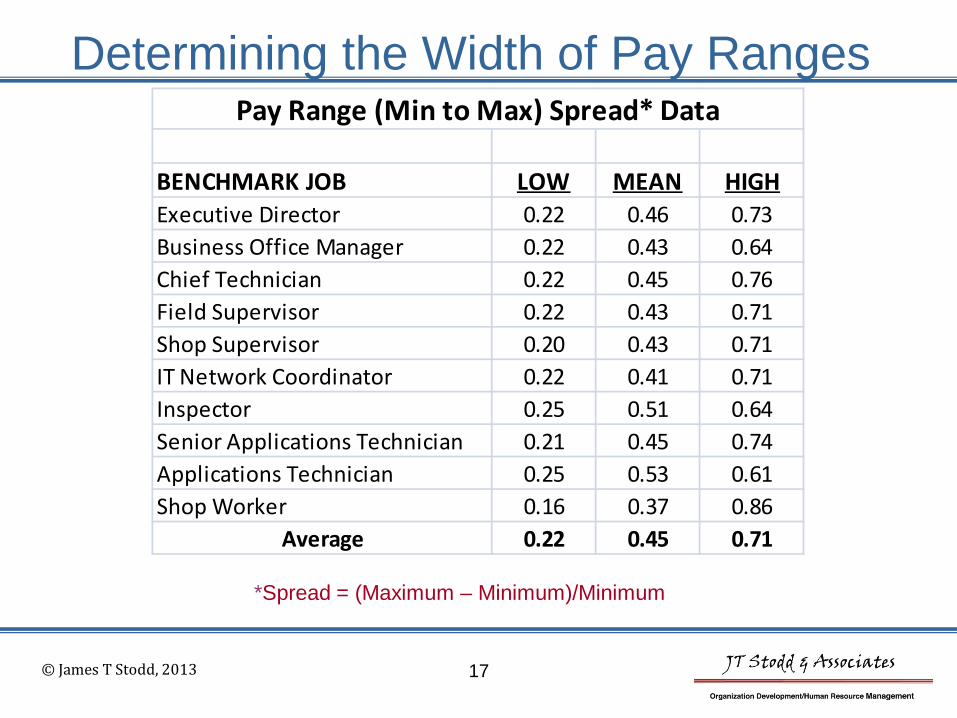
Determining the Width of Pay Ranges
17
*Spread = (Maximum – Minimum)/Minimum
BENCHMARK JOB LOW MEAN HIGHExecutive Director 0.22 0.46 0.73Business Office Manager 0.22 0.43 0.64Chief Technician 0.22 0.45 0.76Field Supervisor 0.22 0.43 0.71Shop Supervisor 0.20 0.43 0.71IT Network Coordinator 0.22 0.41 0.71Inspector 0.25 0.51 0.64Senior Applications Technician 0.21 0.45 0.74Applications Technician 0.25 0.53 0.61Shop Worker 0.16 0.37 0.86
Average 0.22 0.45 0.71
Pay Range (Min to Max) Spread* Data
© James T Stodd, 2013
Additional Notes…
1. Our first preference should be to use reported pay range data (pay range minimums and maximums), because that is what we are trying to replicate
2. As an alternative one might use “lowest paid” for minimum and “highest paid” for maximum when
a) the employer/survey has not reported an established pay range for the job, and
b) the range is not overly restricted
© James T Stodd, 2013 18
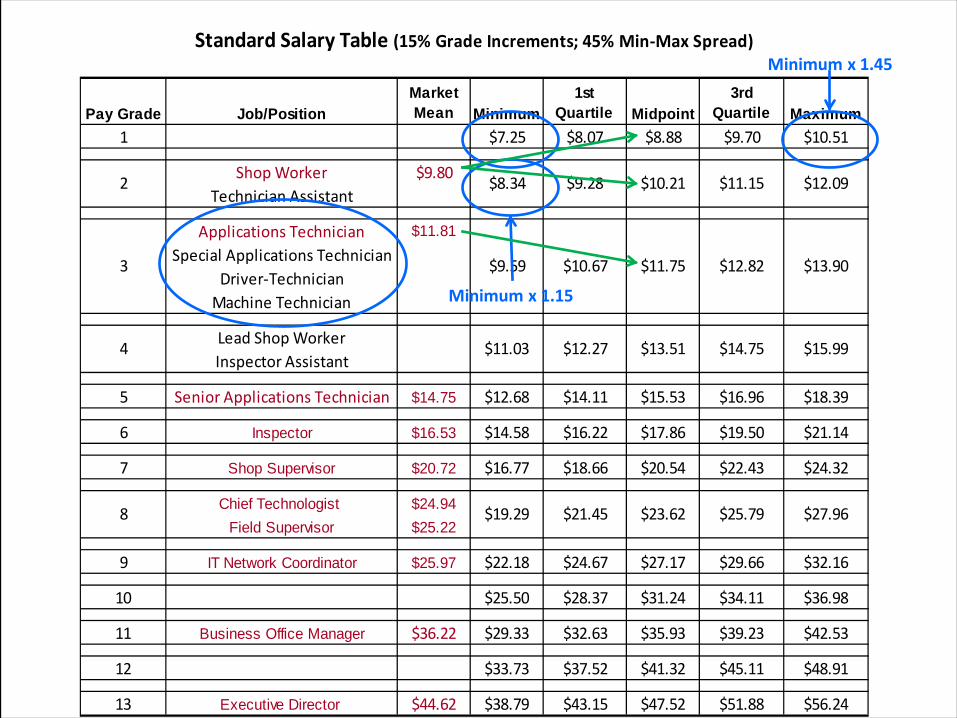
Pay Grade Job/PositionMarket Mean Minimum
1st Quartile Midpoint
3rd Quartile Maximum
1 $7.25 $8.07 $8.88 $9.70 $10.51
Shop Worker $9.80Technician Assistant
Applications Technician $11.81Special Applications Technician
Driver-TechnicianMachine Technician
Lead Shop WorkerInspector Assistant
5 Senior Applications Technician $14.75 $12.68 $14.11 $15.53 $16.96 $18.39
6 Inspector $16.53 $14.58 $16.22 $17.86 $19.50 $21.14
7 Shop Supervisor $20.72 $16.77 $18.66 $20.54 $22.43 $24.32
Chief Technologist $24.94Field Supervisor $25.22
9 IT Network Coordinator $25.97 $22.18 $24.67 $27.17 $29.66 $32.16
10 $25.50 $28.37 $31.24 $34.11 $36.98
11 Business Office Manager $36.22 $29.33 $32.63 $35.93 $39.23 $42.53
12 $33.73 $37.52 $41.32 $45.11 $48.91
13 Executive Director $44.62 $38.79 $43.15 $47.52 $51.88 $56.24
$10.67 $11.75 $12.82 $13.90
Standard Salary Table (15% Grade Increments; 45% Min-Max Spread)
$8.34 $9.28 $10.21 $11.152
3
4
8
$12.09
$11.03 $12.27 $13.51 $14.75 $15.99
$19.29 $21.45 $23.62 $25.79 $27.96
$9.59
Minimum x 1.45
Minimum x 1.15
© James T Stodd, 2013 20
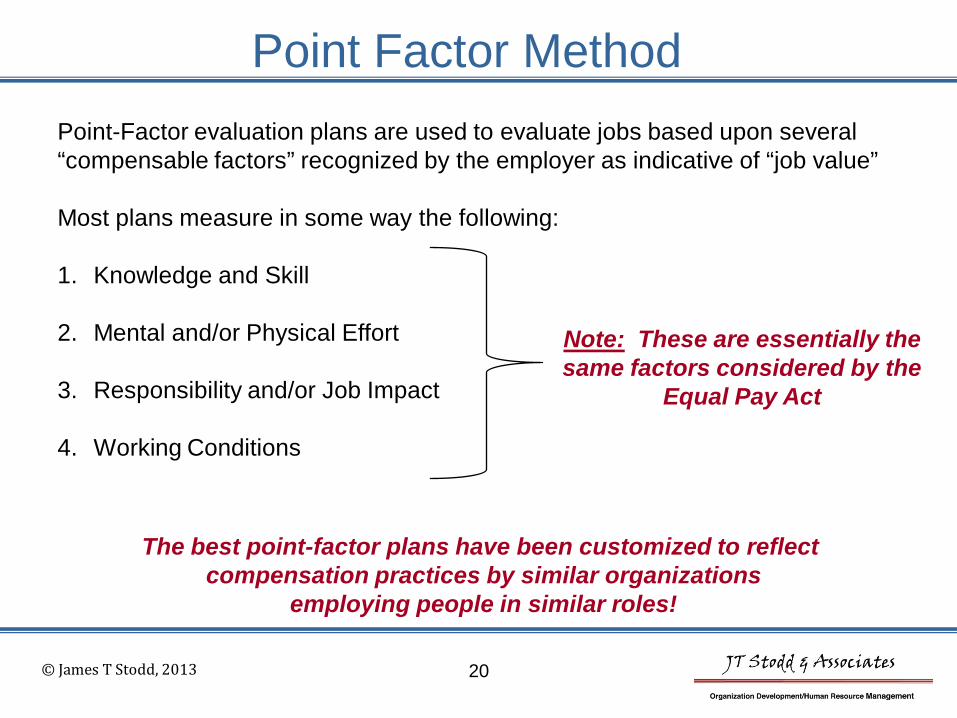
Point Factor Method Point-Factor evaluation plans are used to evaluate jobs based upon several “compensable factors” recognized by the employer as indicative of “job value” Most plans measure in some way the following: 1. Knowledge and Skill
2. Mental and/or Physical Effort
3. Responsibility and/or Job Impact
4. Working Conditions
Note: These are essentially the same factors considered by the
Equal Pay Act
The best point-factor plans have been customized to reflect compensation practices by similar organizations
employing people in similar roles!
21
Mar
ket V
alue
$
Job Evaluation Points (aka “Job Value”)
Minimum Wage
© James T Stodd, 2013
Point Factor Method
X X
X X
X
X
X
X
X
X
X
X
X
X X
X
X
X
X
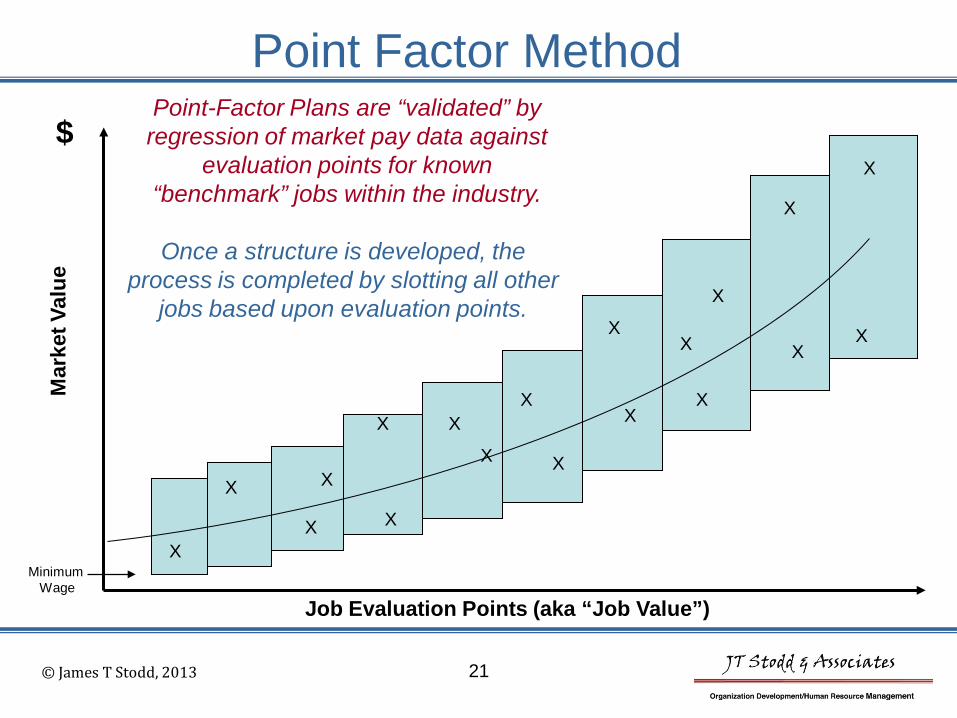
Point-Factor Plans are “validated” by regression of market pay data against
evaluation points for known “benchmark” jobs within the industry.
Once a structure is developed, the process is completed by slotting all other
jobs based upon evaluation points.
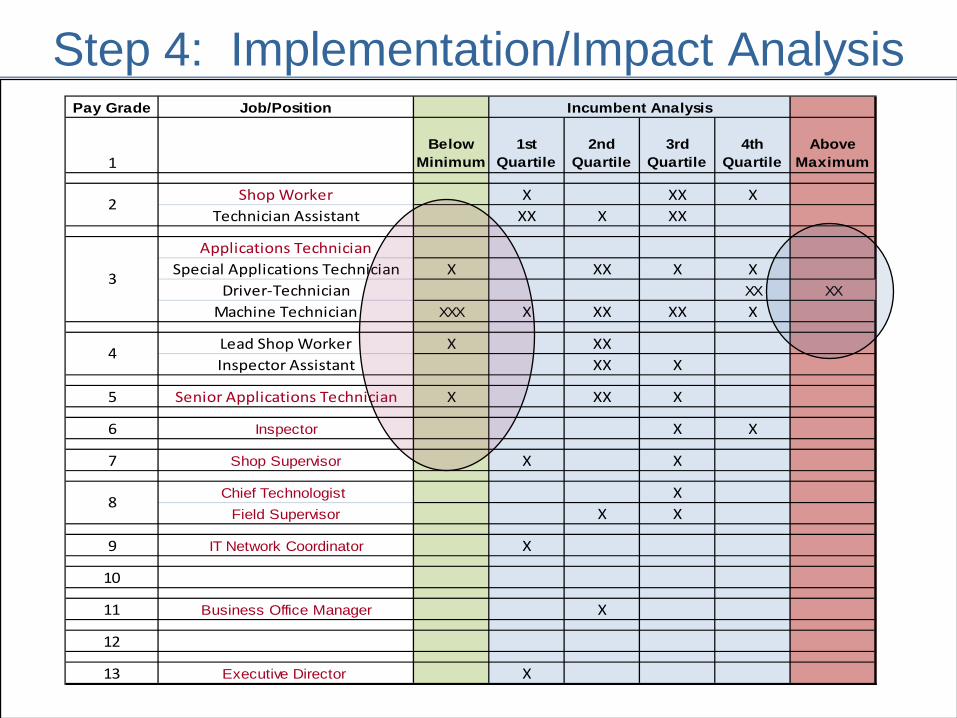
Step 4: Implementation/Impact Analysis
22
Pay Grade Job/Position
1Below
Minimum1st
Quartile2nd
Quartile3rd
Quartile4th
QuartileAbove
Maximum
Shop Worker X XX XTechnician Assistant XX X XX
Applications TechnicianSpecial Applications Technician X XX X X
Driver-Technician XX XXMachine Technician XXX X XX XX X
Lead Shop Worker X XXInspector Assistant XX X
5 Senior Applications Technician X XX X
6 Inspector X X
7 Shop Supervisor X X
Chief Technologist XField Supervisor X X
9 IT Network Coordinator X
10
11 Business Office Manager X
12
13 Executive Director X
2
3
4
8
Incumbent Analysis
23
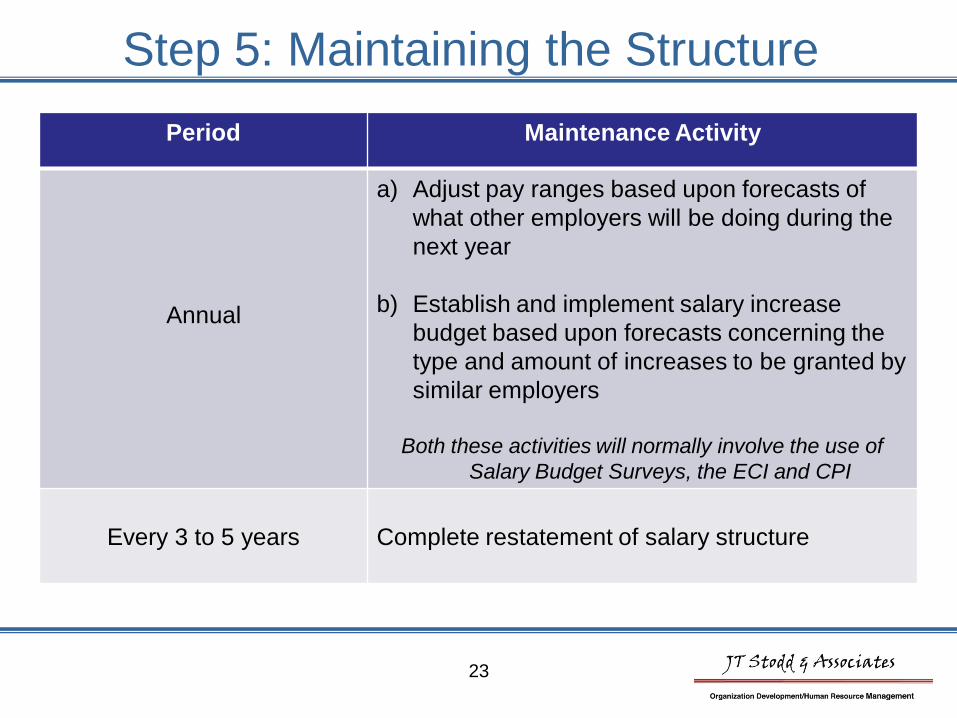
Period Maintenance Activity
Annual
a) Adjust pay ranges based upon forecasts of what other employers will be doing during the next year
b) Establish and implement salary increase budget based upon forecasts concerning the type and amount of increases to be granted by similar employers
Both these activities will normally involve the use of Salary Budget Surveys, the ECI and CPI
Every 3 to 5 years
Complete restatement of salary structure
Step 5: Maintaining the Structure
Strategic
Pay Administration
© James T Stodd, 2013 24
25
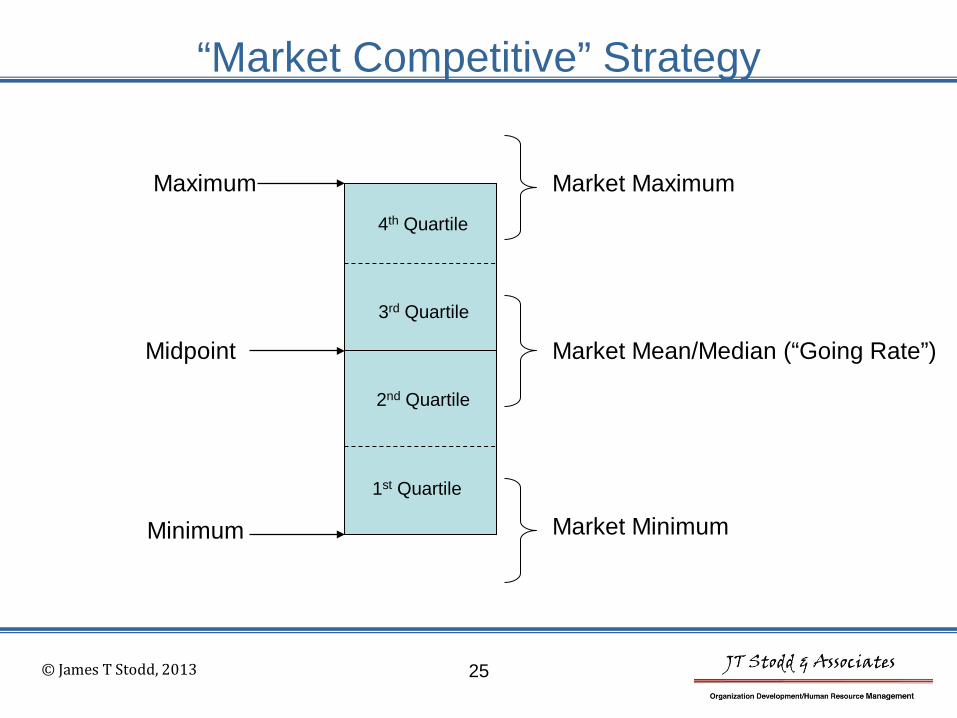
“Market Competitive” Strategy
Minimum
Maximum
Midpoint
1st Quartile
2nd Quartile
3rd Quartile
4th Quartile
Market Minimum
Market Mean/Median (“Going Rate”)
Market Maximum
© James T Stodd, 2013
26
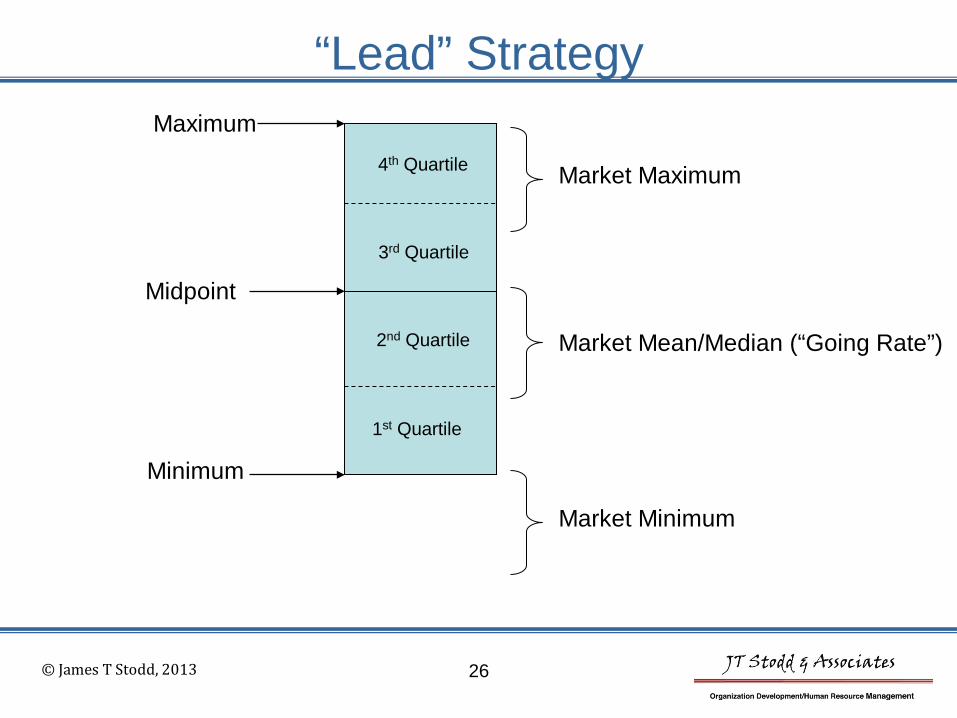
“Lead” Strategy
Minimum
Maximum
Midpoint
1st Quartile
2nd Quartile
3rd Quartile
4th Quartile
Market Minimum
Market Mean/Median (“Going Rate”)
Market Maximum
© James T Stodd, 2013
27
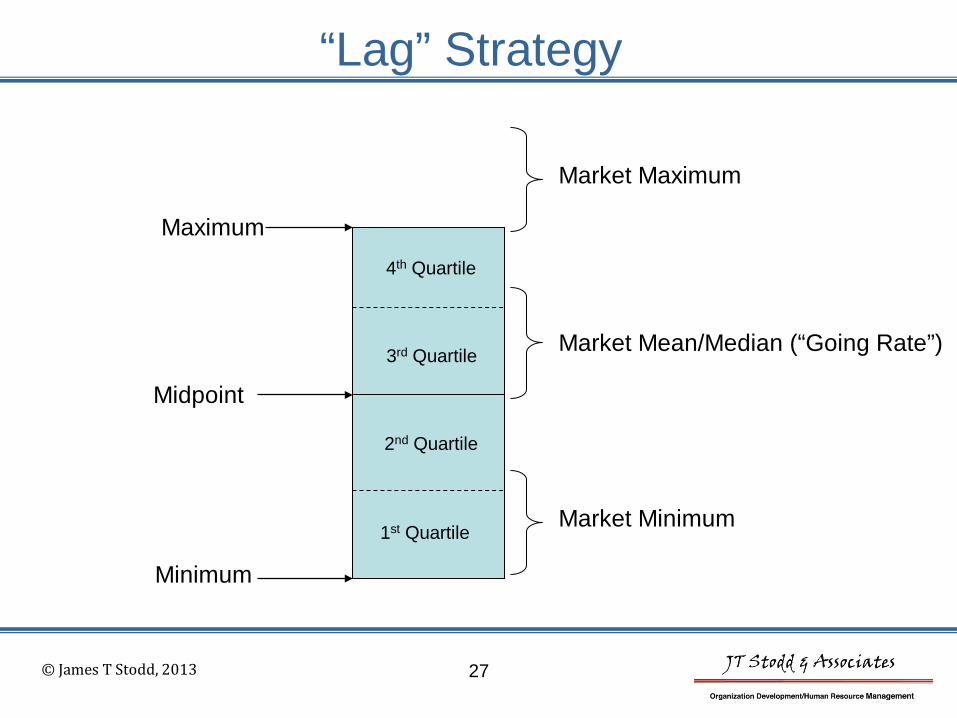
“Lag” Strategy
Minimum
Maximum
Midpoint
1st Quartile
2nd Quartile
3rd Quartile
4th Quartile
Market Minimum
Market Mean/Median (“Going Rate”)
Market Maximum
© James T Stodd, 2013
28
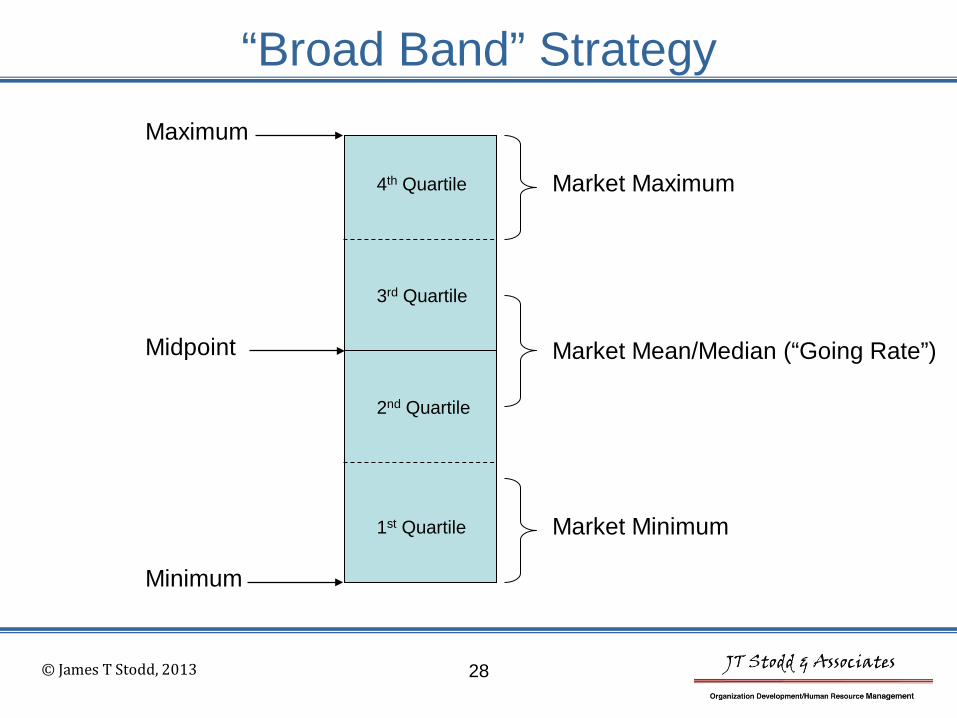
“Broad Band” Strategy
Minimum
Maximum
Midpoint
1st Quartile
2nd Quartile
3rd Quartile
4th Quartile
Market Minimum
Market Mean/Median (“Going Rate”)
Market Maximum
© James T Stodd, 2013
Questions ???
29

30
Presenter James T. Stodd, SPHR JT Stodd & Associates Office Phone: (225) 290-9866 Email: [email protected] Website: http://www.jtstodd.com
Jim offers seasoned experience as a strategic and organizational planning consultant, change agent, and executive. He has assisted numerous clients implement the organizational architecture, structure, infrastructure, and strategic plans required to achieve their visions and goals. In addition, he has assisted other organizations build strategically-focused and highly successful compensation, reward and other human resource management programs by introducing forward thinking approaches to talent management. During his career Jim has served as the Vice President of Human Resources for several prominent organizations including BroMenn Healthcare (Bloomington, IL), Our Lady of the Lake Regional Medical Center (Baton Rouge, LA), and SCAN Health Plan (Long Beach, CA). He has also been associated with several leading consulting firms including Ernst & Young LLP, Hay Management Consultants, and First Transitions. Jim currently maintains an independent consulting practice under the umbrella of JT Stodd & Associates. He has provided consulting services to a diverse mix of clients including those in the healthcare, manufacturing, technology, construction, professional services, petrochemical, finance, education and nonprofit sectors. In addition to his career as a management consultant, Jim also teaches classes in Organizational Leadership and Human Resource Management at Louisiana State University and the University of Louisiana-Lafayette. Prior to that he taught related subjects at the University of California-Irvine where he received UCI’s “2010 Distinguished Instructor” award. His educational preparation includes a B.A. in Psychology from Saint Louis University and a M.S. in Industrial/Organizational Psychology from Illinois State University. He also completed extensive post-graduate work at the Industrial Relations Center of the University of Minnesota. Jim has earned lifetime certification as a “Senior Professional in Human Resources” (SPHR) awarded by the Human Resource Certification Institute.
© James T Stodd, 2013