Embed Size (px)
Citation preview

www.elsevier.com/locate/paid
Personality and Individual Differences 43 (2007) 295–305
The Behavioural Inhibition System and BehaviouralApproach System (BIS/BAS) Scales: Measurement and
structural invariance across adults and adolescents
Andrew Cooper a,*, Rapson Gomez b, Helen Aucote b
a Department of Psychology, University of Wales, Swansea, Singleton Park, SA2 8PP, UKb School of Behavioural and Social Sciences and Humanities, University of Ballarat, Ballarat, Australia
Received 25 August 2006; received in revised form 9 November 2006; accepted 29 November 2006Available online 8 February 2007
Abstract
Confirmatory factor analytic procedures were used to examine the factor structure of Carver and White’sBIS/BAS Scales, and also its invariance across adults and adolescents. This measure, developed originallyfor adult use, has four scales: one for the Behavioural Inhibition System, and three for the BehaviouralApproach System. To accomplish the aims, 631 adults and 300 adolescents completed the measure. Thefindings provided good support for the 4-factor structure, and for between-group invariance for the mea-surement (configural and metric) and structural (factor variances and covariances) models. These resultsmean that data obtained on the BIS/BAS Scales from early adolescents are directly comparable to scoresfrom adults.� 2006 Published by Elsevier Ltd.
Keywords: Reinforcement Sensitivity Theory; BIS/BAS scales; Adults; Adolescents; Invariance; Multiple-group CFA
0191-8869/$ - see front matter � 2006 Published by Elsevier Ltd.doi:10.1016/j.paid.2006.11.023
* Corresponding author. Tel.: +44 1792 602240.E-mail address: [email protected] (A. Cooper).
296 A. Cooper et al. / Personality and Individual Differences 43 (2007) 295–305
1. Introduction
Reinforcement Sensitivity Theory (RST; Gray, 1990) has become one of the most influentialbiologically based models of personality. Two of the central constructs in RST are the Behav-ioural Approach System (BAS) and the Behavioural Inhibition System (BIS). The BAS is theo-rized to meditate sensitivity to conditioned signals of reward or non-punishment. In contrast,the BIS is theorized to mediate sensitivity to conditioned signals of punishment or frustrativenon-reward. To date, most of the work in RST has focused on adults. There is, however, someRST research on children and adolescents. One of the most popular scales used for measuringthe RST personality traits in adults is Carver and White’s (1994) Behavioral Inhibition Systemand Behavioral Approach System (BIS/BAS) Scales. Some researchers have used the BIS/BASScales with children. This study examines the applicability of the BIS/BAS Scales for adolescentsby examining its factor structure, and testing if there is measurement and structural invariance forthis measure across adults and adolescents.
The BIS/BAS Scales, developed originally for adult use, are a polytomous self report measurewith a 4-factor structure (Carver & White, 1994). There is one scale for the BIS, and three BASscales: Reward Responsiveness, Drive and Fun Seeking. Some researchers have criticised the BIS/BAS Scales having three BAS factors, on the basis that RST presumes a unidimensional BAS(Heubeck, Wilkinson, & Cologon, 1998; Leone, Perugini, Bagozzi, Pierro, & Mannetti, 2001).The three BAS scales can be combined together to provide an overall measure of the BAS.Numerous exploratory factor analytic and confirmatory factor analytic studies have providedsupport for the proposed 4-factor structure, rather than the 2-factor structure (Cogswell, Alloy,van Dulmen, & Fresco, 2006; Heubeck et al., 1998; Leone et al., 2001).
In recent years, there has been increasing interest in the relevance of RST to children and ado-lescents. This has been primarily motivated by studies that have shown that the BIS and the BASmay be relevant to a better understanding of developmental psychopathology (e.g., Gomez, 2003;Iaboni, Douglas, & Baker, 1995; O’Brien & Frick, 1996; Quay, 1988). In general, the results fromthese studies suggest that an overactive BAS and/or an underactive BIS are associated with exter-nalizing problems, while an overactive BIS is associated with internalizing problems.
Given the relevance of RST to developmental psychopathology, two recent studies have exam-ined the psychometric properties of the BIS/BAS Scales when used with children (Coplan, Wilson,Frohlick, & Zelenski, 2006; Muris, Meesters, de Kanter, & Timmerman, 2005). Using principalcomponent analysis on a slightly modified version of the BIS/BAS scales, Muris et al. (2005)found support for a 2-factor structure, with virtually all BIS items on one factor, and all BASitems on the other factor. The reliabilities of the two scales were good, with internal consistency(Cronbach’s alpha) values of 0.78 for BIS and 0.81 for BAS. Coplan et al. (2006) reported internalconsistency (Cronbach’s alpha) values of 0.66 for the BIS scale and 0.75 for the total BAS scale. Inboth studies the BIS and BAS scores correlated, as expected, with various emotion, behaviour andpersonality constructs. Overall, therefore, as with adults, the BIS/BAS scales would appear to besuitable for RST research with children. To date, however, the usefulness of this measure for earlyadolescents has yet to be established.
This study extends previous research in this area. As there is support for a 2-factor model forchildren and a 4-factor model for adults, one aim of the study was to examine the applicability ofthe 2- and 4-factor BIS/BAS scales models for adolescents. The second aim was to use a multiple

A. Cooper et al. / Personality and Individual Differences 43 (2007) 295–305 297
group CFA procedure to test if there is measurement and construct invariance for this measureacross adolescents and adults. If these can be demonstrated, it would mean that when these scalesare used with adolescents, they will function similarly to when they are used with adults.
2. Method
2.1. Participants
The study included an adult sample and an adolescent sample. The adult sample comprised 631participants (255 males and 376 females), between 21 and 40 years of age, with a mean age of26.29 years (SD = 5.62). They were recruited from the University of Ballarat, Victoria, Australia.Following permission from the University of Ballarat Human Research Ethics Committee, partic-ipants were recruited via notices placed around the University. Approximately 20% of the adultparticipants received course credit for their participation.
The adolescent sample comprised 300 participants (227 males and 73 females), between 12 and16 years, with a mean age of 13.54 years (SD = 1.22). Following permission from the Universityof Ballarat Human Research Ethics Committee and the relevant education authorities andschools, the adolescent participants were recruited from six urban and regional secondary schoolsin Victoria, as part of a larger study examining recreation habits among adolescents. The schoolsinvolved were private and government, single-sex (boys) and co-educational schools. Approxi-mately 60% of the adolescents contacted agreed to take part in the study.
2.2. Measures
The Carver and White (1994) BIS/BAS Scales are a measure comprising a BIS scale (7 items) andthree BAS scales: Reward Responsiveness (5 items), Drive (4 items) and Fun Seeking (4 items).Each item is answered using a four point Likert scale, ranging from 1 (‘strongly disagree’) to 4(‘strongly agree’). Previous research has shown the scales have satisfactory internal reliabilityand construct validity. In the current study, the adult sample had Cronbach alpha values of .77for the BIS, .89 for Reward Responsiveness, .85 for Drive and .80 for Fun Seeking. The adolescentsample had Cronbach alpha values of .68 for the BIS, .82 for Reward Responsiveness, .82 for Driveand .69 for Fun Seeking. Thus, the alpha values were acceptable across all scales for both groups.
The BIS/BAS Scales have a Flesch Reading Ease of 79, and a Flesch–Kincaid Grade Level of5.1. A score of 79 indicates a fairly easy to read document, and a Flesch–Kincaid Grade Level of5.1 indicates that a person with a grade 5 level can understand the BIS/BAS Scales. Thus, from alanguage comprehension perspective, the BIS/BAS Scales should not be difficult for adolescents tocomplete.
2.3. Procedure
Both the adult and adolescent participants completed the BIS/BAS Scales individually, in smallgroups of 5–30 in a classroom environment, as part of a battery of personality and other self-reportquestionnaires, not reported here. All responses were collected immediately following completion.
298 A. Cooper et al. / Personality and Individual Differences 43 (2007) 295–305
2.4. Analytic procedure
All of the CFA models in this study were tested using LISREL 8.54 (Joreskog & Sorbom,2003). Initially, the 2- and 4-factor structures of the BIS/BAS Scales for adolescents were exam-ined. In the 2-factor model, all of the BIS items loaded on one factor, and all of the BAS itemsloaded on a second factor. In the 4-factor model, all of the relevant BIS, Reward Responsiveness,Drive and Fun Seeking items loaded on their respective latent factors, and the four latent factorscorrelated with each other. Both models were also tested for all participants together, and foradults. For all of the models examined, error variances were uncorrelated. The 4-factor modelis illustrated in Fig. 1.
Between-group age invariance for the BIS/BAS Scales was tested for the measurement andstructural models. At the measurement level, invariance was tested for configural and metricinvariance. The configural invariance model (M1) is the first to be examined. This tests for equal-ity in the number of factors across groups, and support for configural invariance is ascertained ifthis multiple group model shows good fit. When the configural invariance model is supported, themetric invariance model (M2) is tested, by constraining the factor loadings of like items equalacross the groups. Metric invariance is inferred if M2 does not differ from M1. When full metricinvariance is not established, the source of the non-invariance (or items that are not invariant) canbe found by freeing, progressively, the factor loadings for like items with the highest modificationindex until a final partial metric invariance model is obtained. The final invariance model (eitherfull or partial) is then used to test for construct invariance. As suggested by some researchers (e.g.,Byrne, 1998), construct invariance in this study involved invariance in the latent factor variances(M3) and covariances (M4). This involves comparing M3 and M4 (separately) with the final met-ric invariance models (either M2 or the partial metric invariance model). When invariance forthese models is not supported, the source of the non-invariance (the variance or covariance)can be explored using a similar strategy to that described for testing partial metric invariance.
This study used maximum likelihood estimation of the covariance matrix to ascertain statisticalfit. Statistical fit was ascertained using the minimum fit function v2. This index shows the closenessof fit between the unrestricted sample covariance matrix and the restricted (model) covariance ma-trix. As v2 values are inflated by large sample sizes, fit was examined using three practical fit indi-ces, namely the root mean squared error of approximation (RMSEA; Steiger, 1990), thecomparative fit index (CFI; Bentler, 1990), and the standardized root mean square residual(SRMR; Bentler, 1993). The RMSEA provides a measure of model fit relative to the populationcovariance matrix when the complexity of the model is also taken into account. RMSEA values of<.05 are taken as good fit, .05–.08 as moderate fit, .08–.10 as marginal fit and >.10 as poor fit (Hu& Bentler, 1999). The CFI provides a measure of the fit of the hypothesized model relative to theindependent model, with values usually ranging from 0.00 to 1.00. For the CFI, values between.90 and .95 indicate acceptable fit, and values above .95 indicate good fit (Hu & Bentler, 1999).SRMR is the standardized difference between the observed covariance and predicted covariance.A value of zero indicates perfect fit, and values less than .08 indicate acceptable fit (Hu & Bentler,1999).
For this study, between-group invariance was examined from a statistical viewpoint, and froma practical viewpoint. To determine statistical differences between models, the difference in their v2
values was used. This difference is distributed as chi-square. Given that v2 values are sensitive to

Fig. 1. Parameter estimates of the baseline model of the BIS/BAS Scales for adults and adolescents. Note.BIS = Behavior Inhibition System, REW = Reward Responsiveness, DRI = Drive, FUN = Fun Seeking. For both,adults and adolescents, item numbers 1, 8, 13, and 17, as indicated in Table 1, were fixed to unity for the purpose ofidentification.
A. Cooper et al. / Personality and Individual Differences 43 (2007) 295–305 299
sample size and model fit for large numbers of constraints (Cheung & Rensvold, 2002; Little,1997; Marsh, Balla, & McDonald, 1988), as is the case in this study, the critical value for v2
and the differences (D) in v2 were set at p = .001 level, rather than the usual p = .05 level. For

300 A. Cooper et al. / Personality and Individual Differences 43 (2007) 295–305
practical differences between models, the difference for the CFI or DCFI was used. According toCheung and Rensvold (2002), the DCFI is a robust statistic for testing the between-group invari-ance of CFA models. They recommended that invariance can be assumed when this value is �.01or less.
3. Results
3.1. Descriptive scores, skewness and kurtosis of the BIS/BAS scales
Table 1 shows the mean and standard deviation scores for items and scale totals for all partic-ipants together, and separately for the adult and adolescent groups. For convenience, the itemshave been listed so that items belonging to the same latent constructs are grouped together.According to Curran, West, and Finch (1996), for univariate normality, skewness and kurtosisvalues of 0–2, and 0–7, respectively, can be taken as demonstrating sufficient normality. For allparticipants together, the skewness and kurtosis values for the BIS/BAS items ranged from�1.20 to 0.38, and �1.20 to 1.26, respectively. For the adults, the skewness and kurtosis rangedfrom �1.25 to 0.24, and �0.54 to 1.38, respectively, while for adolescents they ranged from �1.07to 0.42, and �0.78 to 1.35, respectively. On the basis of the criteria proposed by Curran et al., allof the BIS/BAS items for both groups had sufficient normality.
3.2. Structural organization of the BIS/BAS scales
The fit indices for the 2-factor model for the adolescent group were as follows: v2
(df = 169) = 793, p < .001, RMSEA = .13 (90% CI = .12–.14), CFI = .84, and SRMR = .10.These figures indicate a poor fitting model. The fit indices for the 4-factor model for this groupwere as follows: v2 (df = 164) = 436, p < .001, RMSEA = .075 (90% CI = .066–.083),CFI = .93, and SRMR = .076. These practical fit indices indicate moderately good fit. Thus,for adolescents, the 4-factor model was a more appropriate fit than the 2-factor model.
The fit indices for 4-factor model for adults were v2 (df = 164) = 610, p < .001, RMSEA = .068(90% CI = .062–.073), CFI = .96, and SRMR = .0769. For the 2-factor model, they were v2
(df = 169) = 1887, p < .001, RMSEA = .16 (90% CI = .15–.16), CFI = .84, and SRMR = .12.Thus the 2-factor model showed poor fit, while the 4-factor model showed adequate fit. Forthe total sample, the fit for the 4-factor model was adequate, v2 (df = 164) = 845, p < .001,RMSEA = .069 (90% CI = .065–.073), CFI = .95, and SRMR = .066, while the fit was poorfor the 2-factor model, v2 (df = 169) = 2421, p < .001, RMSEA = .15 (90% CI = .14–.15),CFI = .85, and SRMR = .11 Given the support for the 4-factor model, and no support for the2-factor model for both adults and adolescents, the 4-factor model was used for the tests involvinginvariance.
3.3. Testing for statistical invariance across adults and adolescents
Table 2 shows the results of the analyses for testing invariance across adult and adolescent rat-ings. As shown for M1, both the RMSEA and SRMR values indicated moderately good model fit.
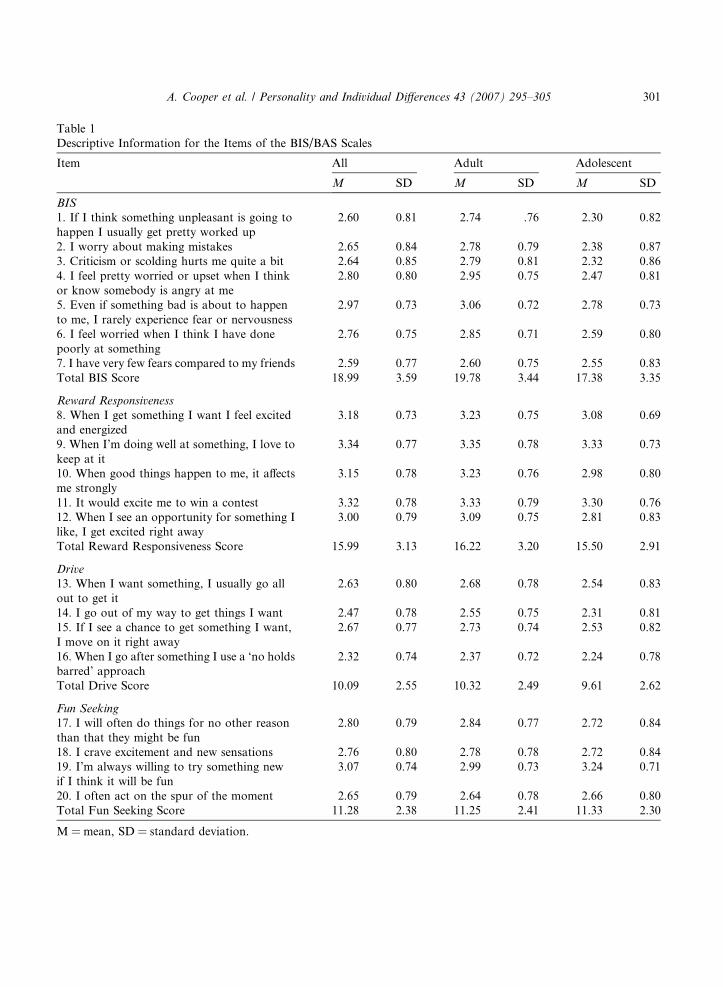
Table 1Descriptive Information for the Items of the BIS/BAS Scales
Item All Adult Adolescent
M SD M SD M SD
BIS
1. If I think something unpleasant is going tohappen I usually get pretty worked up
2.60 0.81 2.74 .76 2.30 0.82
2. I worry about making mistakes 2.65 0.84 2.78 0.79 2.38 0.873. Criticism or scolding hurts me quite a bit 2.64 0.85 2.79 0.81 2.32 0.864. I feel pretty worried or upset when I thinkor know somebody is angry at me
2.80 0.80 2.95 0.75 2.47 0.81
5. Even if something bad is about to happento me, I rarely experience fear or nervousness
2.97 0.73 3.06 0.72 2.78 0.73
6. I feel worried when I think I have donepoorly at something
2.76 0.75 2.85 0.71 2.59 0.80
7. I have very few fears compared to my friends 2.59 0.77 2.60 0.75 2.55 0.83Total BIS Score 18.99 3.59 19.78 3.44 17.38 3.35
Reward Responsiveness
8. When I get something I want I feel excitedand energized
3.18 0.73 3.23 0.75 3.08 0.69
9. When I’m doing well at something, I love tokeep at it
3.34 0.77 3.35 0.78 3.33 0.73
10. When good things happen to me, it affectsme strongly
3.15 0.78 3.23 0.76 2.98 0.80
11. It would excite me to win a contest 3.32 0.78 3.33 0.79 3.30 0.7612. When I see an opportunity for something Ilike, I get excited right away
3.00 0.79 3.09 0.75 2.81 0.83
Total Reward Responsiveness Score 15.99 3.13 16.22 3.20 15.50 2.91
Drive
13. When I want something, I usually go allout to get it
2.63 0.80 2.68 0.78 2.54 0.83
14. I go out of my way to get things I want 2.47 0.78 2.55 0.75 2.31 0.8115. If I see a chance to get something I want,I move on it right away
2.67 0.77 2.73 0.74 2.53 0.82
16. When I go after something I use a ‘no holdsbarred’ approach
2.32 0.74 2.37 0.72 2.24 0.78
Total Drive Score 10.09 2.55 10.32 2.49 9.61 2.62
Fun Seeking
17. I will often do things for no other reasonthan that they might be fun
2.80 0.79 2.84 0.77 2.72 0.84
18. I crave excitement and new sensations 2.76 0.80 2.78 0.78 2.72 0.8419. I’m always willing to try something newif I think it will be fun
3.07 0.74 2.99 0.73 3.24 0.71
20. I often act on the spur of the moment 2.65 0.79 2.64 0.78 2.66 0.80Total Fun Seeking Score 11.28 2.38 11.25 2.41 11.33 2.30
M = mean, SD = standard deviation.
A. Cooper et al. / Personality and Individual Differences 43 (2007) 295–305 301
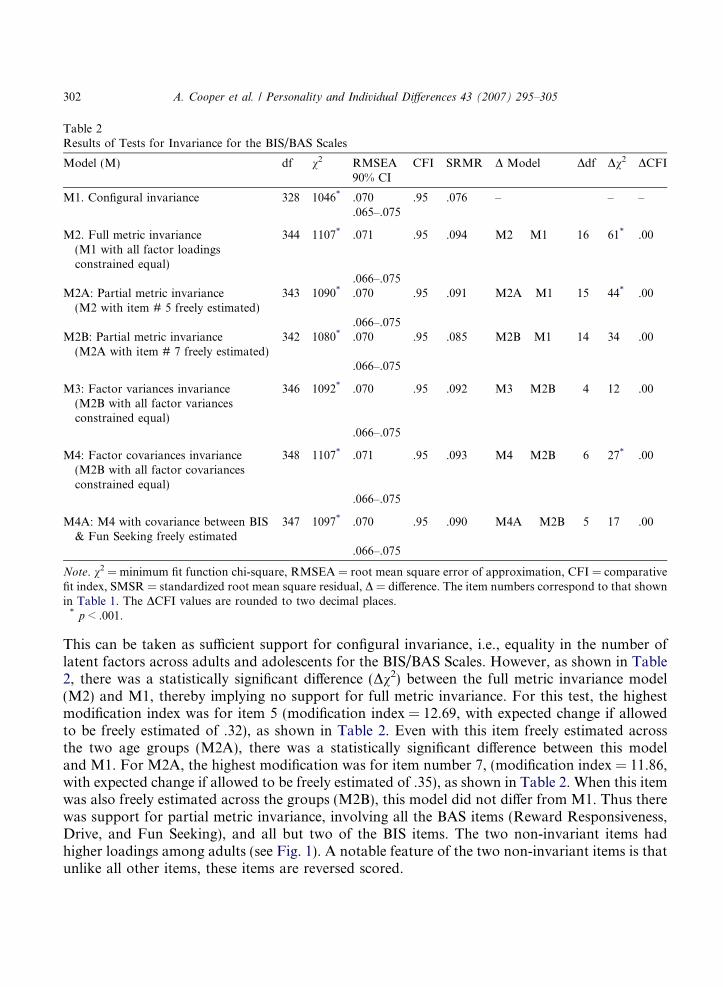
Table 2Results of Tests for Invariance for the BIS/BAS Scales
Model (M) df v2 RMSEA90% CI
CFI SRMR D Model Ddf Dv2 DCFI
M1. Configural invariance 328 1046* .070 .95 .076 – – –.065–.075
M2. Full metric invariance(M1 with all factor loadingsconstrained equal)
344 1107* .071 .95 .094 M2 � M1 16 61* .00
.066–.075M2A: Partial metric invariance
(M2 with item # 5 freely estimated)343 1090* .070 .95 .091 M2A �M1 15 44* .00
.066–.075M2B: Partial metric invariance
(M2A with item # 7 freely estimated)342 1080* .070 .95 .085 M2B �M1 14 34 .00
.066–.075
M3: Factor variances invariance(M2B with all factor variancesconstrained equal)
346 1092* .070 .95 .092 M3 � M2B 4 12 .00
.066–.075
M4: Factor covariances invariance(M2B with all factor covariancesconstrained equal)
348 1107* .071 .95 .093 M4 � M2B 6 27* .00
.066–.075
M4A: M4 with covariance between BIS& Fun Seeking freely estimated
347 1097* .070 .95 .090 M4A � M2B 5 17 .00
.066–.075
Note. v2 = minimum fit function chi-square, RMSEA = root mean square error of approximation, CFI = comparativefit index, SMSR = standardized root mean square residual, D = difference. The item numbers correspond to that shownin Table 1. The DCFI values are rounded to two decimal places.
* p < .001.
302 A. Cooper et al. / Personality and Individual Differences 43 (2007) 295–305
This can be taken as sufficient support for configural invariance, i.e., equality in the number oflatent factors across adults and adolescents for the BIS/BAS Scales. However, as shown in Table2, there was a statistically significant difference (Dv2) between the full metric invariance model(M2) and M1, thereby implying no support for full metric invariance. For this test, the highestmodification index was for item 5 (modification index = 12.69, with expected change if allowedto be freely estimated of .32), as shown in Table 2. Even with this item freely estimated acrossthe two age groups (M2A), there was a statistically significant difference between this modeland M1. For M2A, the highest modification was for item number 7, (modification index = 11.86,with expected change if allowed to be freely estimated of .35), as shown in Table 2. When this itemwas also freely estimated across the groups (M2B), this model did not differ from M1. Thus therewas support for partial metric invariance, involving all the BAS items (Reward Responsiveness,Drive, and Fun Seeking), and all but two of the BIS items. The two non-invariant items hadhigher loadings among adults (see Fig. 1). A notable feature of the two non-invariant items is thatunlike all other items, these items are reversed scored.

A. Cooper et al. / Personality and Individual Differences 43 (2007) 295–305 303
As there was support for partial metric invariance, the invariance for factor variances andcovariances were tested, as described previously. The model for invariance for the factor variances(M3) showed no statistical difference when compared to the partial metric invariance model(M2B), thereby indicating support for equivalency in the variances for all four latent factors.In contrast, the model for invariance for the factor covariance (M4) was statistically significantlydifferent from the partial metric invariance model (M2B). The findings are interpreted as indicat-ing lack of variance in that one or more of the latent covariances were not invariant. The M4modification indices were examined. As the covariance involving the BIS and Fun Seeking factorshad the highest modification index (9.34), M4 was revised with the parameter freely estimatedacross the two groups (M4A). This model did not differ statistically from M2B. These findingssuggest that all but the covariances involved in the BIS and Fun Seeking factors are invariantacross adults and adolescents. For the non-invariant covariance, the covariance was higheramong adolescents than adults, albeit, modestly (see Fig. 1).
3.4. Testing for practical invariance across adults and adolescents
As will be noticed in Table 2 there was no difference in the CFI values between the full metricinvariance model (M2) and configural model (M1). Thus, unlike the test involving Dv2, there wassupport for full metric invariance, based on the DCFI. Given this, the full metric invariance modelwas used to test for invariance for factor variances and covariances. The fit indices for the modelfor invariance for the factor variances (M3) were as follows: v2 (df = 348) =1117, p < .001,RMSEA = .071 (90% CI = .066–.076), CFI = .95, and SRMR = .10, and for covariances wereas follows: v2 (df = 350) = 1132, p < .001, RMSEA = .072 (90% CI = .067–.076), CFI = .95,and SRMR = .10. The CFI values for both of these models are the same as the full metric model,thereby indicating support for full variance and covariance invariance.
4. Discussion
Initially, this study examined the applicability of the 2- and 4-factor BIS/BAS scales models forthe adolescents. The results indicated poor fit for the 2-factor model. In contrast there was ade-quate support for the 4-factor model. These findings support the applicability of the 4-factor mod-el of the BIS/BAS Scales for early to mid adolescents. Similar findings were found for the adultsample, and all participants together.
In relation to measurement invariance examined from a practical viewpoint, the results of thisstudy showed support for full measurement (configural and metric) and structural invariance(variances and covariances) across adolescents and adults. The findings from a statistical view-point were slightly different. For the measurement model, the findings supported configuraland only partial metric invariance. In terms of the structural model, the findings found supportfor invariance for all latent variances and all but one of the covariances. The non-invariant covari-ance was that between the BIS and Fun Seeking Scales.
The support for the configural invariance implies that the BIS/BAS Scales have comparablefactor structure across adolescents and adults. For the statistical tests, of the 20 items, 18 itemsshowed metric invariance. The two non-invariant items were ‘‘Even if something bad is about

304 A. Cooper et al. / Personality and Individual Differences 43 (2007) 295–305
to happen to me, I rarely experience fear or nervousness’’, and ‘‘I have very few fears compared tomy friends’’. Metric invariance examines if the strength of the relationship between each item andits underlying construct is the same across groups. The metric invariance findings can be taken tosuggest that generally the strength of the relationships between items in all three BAS Scales withtheir own latent constructs (Reward Responsiveness, Drive, and Fun Seeking) are the same acrossadults and adolescents. This also means that adults and adolescents give the same meaning to theitems representing these BAS traits. For the two BIS items that did not show metric invariance,adults had higher scores than adolescents, thereby implying that these items are more strongly re-lated to the BIS in adults than adolescents. It should be noted that these two particular BIS itemshave been shown as problematic in a previous CFA study of the BIS/BAS Scales (Cogswell et al.,2006). Despite this, as five of the seven BIS items showed metric invariance, it can be taken thatthere is comparability in the strength of the relationships between items in the BIS Scale with theBIS latent construct across adults and adolescents. As further support of this, there was full mea-surement and structural invariance from a practical viewpoint.
Overall, therefore, it can be taken that there is quite good support for measurement and con-struct invariance for the BIS/BAS Scales across adults and adolescents. These findings can be ta-ken as an indication that the BAS/BIS Scales can be used effectively in RST research with earlyadolescents. They also mean that data obtained on the BIS/BAS Scales from adolescents are di-rectly comparable to scores from adults, and that this measure would be suitable for longitudinalRST studies that span the periods of early adolescence and adulthood.
Although the results of this study have been interpreted as providing support for the use of theBIS/BAS Scales with adolescents, it needs to be noted that the findings in the current study shouldbe viewed with certain limitations in mind. Firstly, as most of the adolescent participants in thisstudy were in early adolescence and as most of the adult participants were in early adulthood, it isuncertain if the results found here are applicable across a wider age range, including children. Sec-ondly, it should be noted that there were fewer girls than boys in the adolescent sample. This maymean that lack of invariance across gender has been obscured in the adolescent sample. Thirdly,the results of this study need also to be seen in the context that to date there is limited agreementon what is the most appropriate sequence of tests that are needed for establishing group invari-ance (Bentler, 1993; Bollen, 1989; Byrne, 1998; Joreskog & Sorbom, 1989; Marsh, 1994). Giventhis, it can be expected that some researchers may not agree with our analytic approach. However,we wish to make the point that our approach for testing group invariance is in accord with accept-able standards that have been used previously (Byrne, 1998).
References
Bentler, P. M. (1990). Comparative fit indexes in structural models. Psychological Bulletin, 107, 238–246.Bentler, P. M. (1993). EQS structural equations program manual. Los Angeles, CA: BMDP Statistical Software.Bollen, K. A. (1989). Structural equations with latent variables. New York: Wiley.Byrne, B. M. (1998). Structural equation modeling with LISREL, PRELIS, and SIMPLIS: basic concepts, applications,
and programming. Mahwah, NJ: Lawrence Erlbaum Associates.Carver, C. S., & White, T. L. (1994). Behavioral inhibition, behavioral activation, and affective responses to
impending reward and punishment: the BIS/BAS scales. Journal of Personality and Social Psychology, 67(2),319–333.

A. Cooper et al. / Personality and Individual Differences 43 (2007) 295–305 305
Cheung, G. W., & Rensvold, R. B. (2002). Evaluating goodness-of-fit indexes for testing measurement invariance.Structural Equation Modeling, 9(2), 233–255.
Cogswell, A., Alloy, L. B., van Dulmen, M. H. M., & Fresco, D. M. (2006). A psychometric evaluation of behaviouralinhibition and approach self report measures. Personality and Individual Differences, 40, 1649–1658.
Coplan, R. J., Wilson, J., Frohlick, S. L., & Zelenski, J. (2006). A person-oriented analysis of behavioural inhibitionand behavioural activation in children. Personality and Individual Differences, 41(5), 917–927.
Curran, P. J., West, S. G., & Finch, J. F. (1996). The robustness of test statistics to nonnormality and specification errorin confirmatory factor analysis. Psychological Methods, 1(1), 16–29.
Gomez, R. (2003). Underlying processes in the poor response inhibition of children with attention-deficit/hyperactivitydisorder. Journal of Attention Disorders, 6(3), 111–122.
Gray, J. A. (1990). Brain systems that mediate both emotion and cognition. Cognition & Emotion, 4(3), 269–288.Heubeck, B. G., Wilkinson, R. B., & Cologon, J. (1998). A second look at Carver and White’s (1994) BIS/BAS scales.
Personality and Individual Differences, 25(4), 785–800.Hu, L. T., & Bentler, P. M. (1999). Cutoff criteria for fit indexes in covariance structure analysis: conventional criteria
versus new alternatives. Structural Equation Modeling, 6(1), 1–55.Iaboni, F., Douglas, V. I., & Baker, A. G. (1995). Effects of reward and response costs on inhibition in ADHD children.
Journal of Abnormal Psychology, 104, 232–240.Joreskog, K. G., & Sorbom, D. (1989). LISREL 7: a guide to the program and applications (second ed.). Chicago, IL:
SPSS Inc.Joreskog, K., & Sorbom, D. (2003). Lisrel 8.54. Lincolnwood, IL: Scientific Software International.Leone, L., Perugini, M., Bagozzi, R. P., Pierro, A., & Mannetti, L. (2001). Construct validity and generalizability of the
Carver-White Behavioural Inhibition System/Behavioural Activation System Scales. European Journal of Person-
ality, 15(5), 373–390.Little, T. D. (1997). Mean and covariance structures (MACS) analyses of cross-cultural data: practical and theoretical
issues. Multivariate Behavioral Research, 32(1), 53–76.Marsh, H. W. (1994). Confirmatory factor analysis models of factorial invariance: a multifaceted approach. Structural
Equation Modeling, 1, 5–34.Marsh, H. W., Balla, J. R., & McDonald, R. P. (1988). Goodness-of-fit indices in Confirmatory Factor Analysis: the
effect of sample size. Psychological Bulletin, 103(3), 391–410.Muris, P., Meesters, C., de Kanter, E., & Timmerman, P. E. (2005). Behavioural inhibition and behavioural activation
system scales for children: relationships with Eysenck’s personality traits and psychopathological symptoms.Personality and Individual Differences, 38(4), 831–841.
O’Brien, B. S., & Frick, P. J. (1996). Reward dominance: associations with anxiety, conduct problems, and psychopathyin children. Journal of Abnormal Child Psychology, 24, 223–240.
Quay, H. C. (1988). The behavioral reward and inhibition system in childhood behavior disorder. In H. C. Quay (Ed.),Attention deficit disorder. New research in attention, treatment, and psychopharmacology (Vol. 3, pp. 176–186).Oxford, England: Pergamon Press.
Steiger, J. H. (1990). Structural model evaluation and modification. Multivariate Behavioral Research, 25, 173–180.

![NOTES ON SCALE-INVARIANCE AND BASE-INVARIANCE FOR … · arXiv:1307.3620v1 [math.PR] 13 Jul 2013 NOTES ON SCALE-INVARIANCE AND BASE-INVARIANCE FOR BENFORD’S LAW MICHAŁ RYSZARD](https://img.pdfslide.net/doc/110x75/5aee16367f8b9a45569086fd/notes-on-scale-invariance-and-base-invariance-for-13073620v1-mathpr-13-jul.jpg)