Embed Size (px)
Citation preview
ICESJ. mar. Sci.,49: 127-143. 1992
The benthic infauna of the North Sea: species distribution andassemblages
A. Kiinitzer, D. Basford, J. A. Craeymeersch,J. M. Dewarumez, J. Dorjes, G. C. A. Duineveld,A. Eleftheriou, C. Heip, P. Herman, P. Kingston,U. Niermann, E. Rachor, H. Rumohr, andP. A. J. de Wilde
Kiinitzer, A., Basford, D., Craeymeersch, J. A., Dewarumez, J. M , Dorjes, J.,Duineveld, G. C. A., Eleftheriou, A., Heip, C , Herman, P., Kingston, P., Niermann, U.,Rachor, H., Rumohr, H., and de Wilde, P. A. J. 1992. The benthic infauna of the NorthSea: species distribution and assemblages. - ICES J. mar. Sci., 49: 127-143.
In 1986 participants of the Benthos Ecology Working Group of ICES conducted asynoptic mapping of the infauna of the southern and central North Sea. Together with amapping of the infauna of the northern North Sea by Eleftheriou and Basford (1989) thisprovides the database for the description of the benthic infauna of the whole North Sea inthis paper. Division of the infauna into assemblages by TWINSPAN analysis separatednorthern assemblages from southern assemblages along the 70 m depth contour.Assemblages were further separated by the 30, 50 m and 100 m depth contour as well asby the sediment type. In addition to widely distributed species, cold water species do notoccur further south than the northern edge of the Dogger Bank, which corresponds to the50 m depth contour. Warm water species were not found north of the 100 m depthcontour. Some species occur on all types of sediment but most are restricted to a specialsediment and therefore these species are limited in their distribution. The factors struc-turing species distributions and assemblages seem to be temperature, the influenceof different water masses, e.g. Atlantic water, the type of sediment and the food supplyto the benthos. Eleftheriou, A. and Basford, D. J. Journal of the Marine BiologicalAssociation of the UK, 69: 123-143.
Key words: benthos, North Sea, assemblages.
Received 21 March 1991; accepted 9 January 1992.
A. Kiinitzer: Alfred-Wegener-Institut fur Polar- undMeeresforschung, Columbusstrafie,D-2850 Bremerhaven, Germany. Present address: Umweltbundesamt, Bismarckplatz 1, D-1000 Berlin 33, Germany. D. Basford: Marine Laboratory, P.O. Box 101, Victoria Road,Aberdeen AB9 8DB, Scotland. J. A. Craeymeersch: Delta Instituut voor HydrobiologischOnderzoek, Vierstraat 28, NL-4401 EA Yerseke, The Netherlands. J. M. Dewarumez:Station Marine, BP 41 Wimereux, F-62930, France. J. Dorjes: Institutfur MeeresbiologieundMeeresgeologie "Senkenberg", Schleusenstr. 39A, D-2940 Wilhelmshaven, Germany.G. C. A. Duineveld & P. A. J. de Wilde: Nederlands Instituut voor Onderzoek der Zee,P.O. Box 59, NL-1790 AB Den Burg/Texel, The Netherlands. A. Eleftheriou: MarineLaboratory, P.O. Box 101, Victoria Road, Aberdeen AB98DB, Scotland. Present address:Department of Biology, University of Crete, P.O. Box 1470, Heraklion 71110, Crete,Greece. C. Heip: lnstilut voor Dierkunde, Ledeganckstraat 35, B-9000 Gent, Belgium.Present address: Delta Instituut voor Hydrobiologisch Onderzoek, Vierstraat 28,NL-4401 EA Yerseke, The Netherlands. P. Herman: Delta Instituut voor HydrobiologischOnderzoek, Vierstraat 28, NL-4401 EA Yerseke, The Netherlands. P. Kingston: Heriot-Watt University, Institute of Offshore Engineering, Research Park Riccarton, EdinburghEH14 4AS, Scotland. U. Niermann: Biologische Anslalt Helgoland, Notkestr. 31,D-2000 Hamburg 52, Germany. E. Rachor Alfred- Wegener-Institut fur Polar- undMeeresforschung, Columbusstrafie, D-2850 Bremerhaven, Germany. H. Rumohr: Institutfur Meereskunde, Dusternbrooker Weg 20, D-2300 Kiel, Germany.
Introduction describe and quantify areas with similar fish food. Duringthe following 20 years several areas in the North Sea were
At the beginning of this century Petersen (1914) devel- investigated for their benthic infauna which were classi-oped the concept of infaunal communities in order to fied into certain communities or assemblages. Most of
1054-3139/92/020127 + 17 $03.00/0
10.1093/icesjms/49.2.127
128
Figure 1. Stations sampled by participants of the North Sea Benthos Survey (NSBS) in 1986. Stations in the northern North Sea(Aberdeen) were sampled between 1980 and 1985.
these surveys were carried out in coastal areas, notfurther north than the Dogger Bank area. A review of theinfaunal assemblages of the North Sea was given byKingston and Rachor (1982), showing the low number ofbenthic surveys in the central and northern North Sea.Investigations in the vicinity of oil platforms suggestedthat infauna assemblages north of the Dogger Bank mightbe similar to those south of it. On the other hand,Glemarec (1973) developed a concept of three differentzones of benthic assemblages along the European NorthAtlantic Continental shelf, reflecting differences in annualvariation of temperature in bottom waters. He divided theNorth Sea into three zones: the southern North Sea up tothe northern edge of the Dogger Bank; the central North
Sea from 60 to 100 m depth; and the northern North Seafrom 100 to 200 m depth. The assemblages of these zonesare further structured by sediment composition. Beforethe North Sea Benthos Survey (NSBS) it was not possibleto confirm or reject Glemarec's concept of the zones in theNorth Sea.
Since in most earlier surveys sampling of bottom faunawas done with different gears, and surveys were spreadover more than half a century, during which majorchanges occurred in the benthic fauna (Kroncke, 1990),the results of these surveys are not comparable. Partici-pants of the Benthos Ecology Working Group of ICEStherefore decided to map the benthic fauna of the wholeNorth Sea during the same period of the year and with
Benthic infauna of the North Sea
0° 2° 4° 6 C
129
). -.vOf NCQ <$ Q '.<S
Infauna assemblages(presence/absence data)
• 1a O3aD 1b • 3bA 2a 0 4aA2b 44b
4° 2° 0° 2'° 4° 6'° 8'° ^ l °
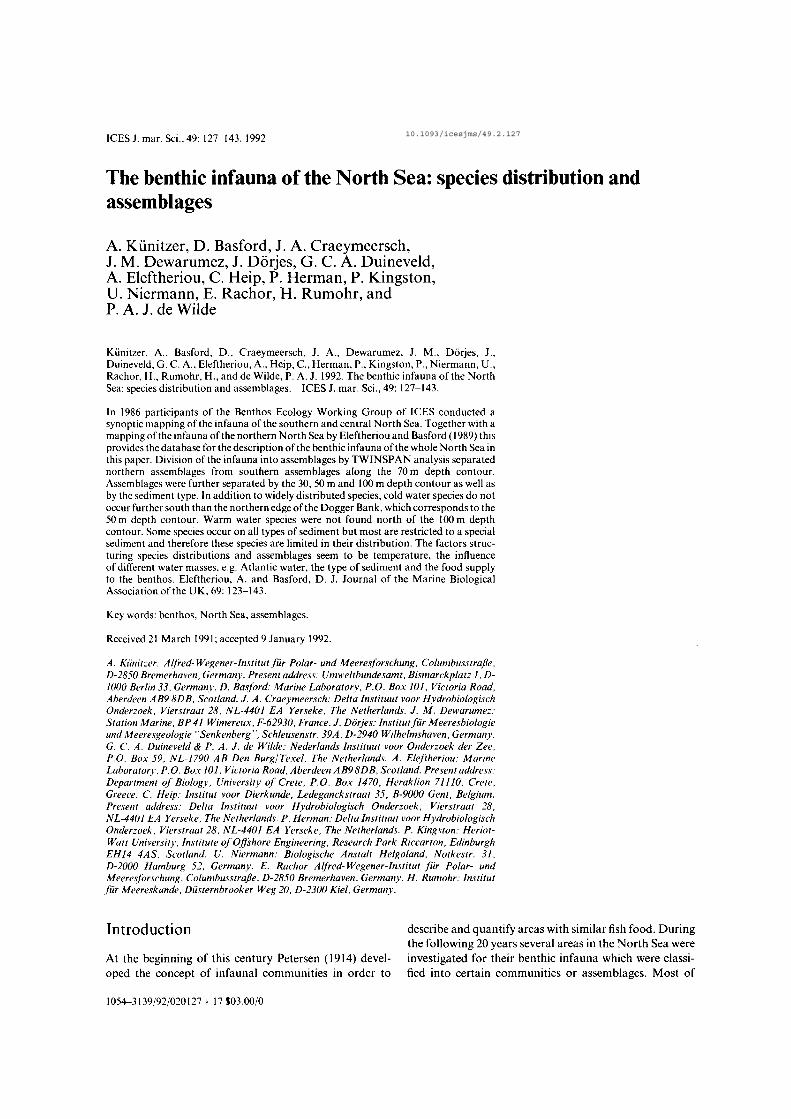
Figure 2. Classification of stations by TWINSPAN, using only species presence/absence data.
1st
2nd
3rd
dichotomy
dichotomy
depth
deposit
dichotomy
depth
deposit
depth
I
1
mainly <30m
coarser sediment
I I
1a 1b
< 70m
I
2
30-70m
finer sediment
I I
2a 2b
30-70m 30-50m
fine sand muddy fine sand
depth
I
3
70-100m
finer sediment
I
3a 3b
> 70m
4
mainly >100m
I
4a 4 b
> 100m
fine sediment coarse sediment
Figure 3. Scheme of TWINSPAN classification (species presence/absence data), showing the environmental parameters of theassemblages.
130
61
59<
57'
55<
53C
51
A. Kiinitzer et al.
0° 2° 4'
Infauna(including densities)
• laDlbAlia• lib
Ollla
• Mb
53<
4° 2° 0° 2° 4° 6° 8°
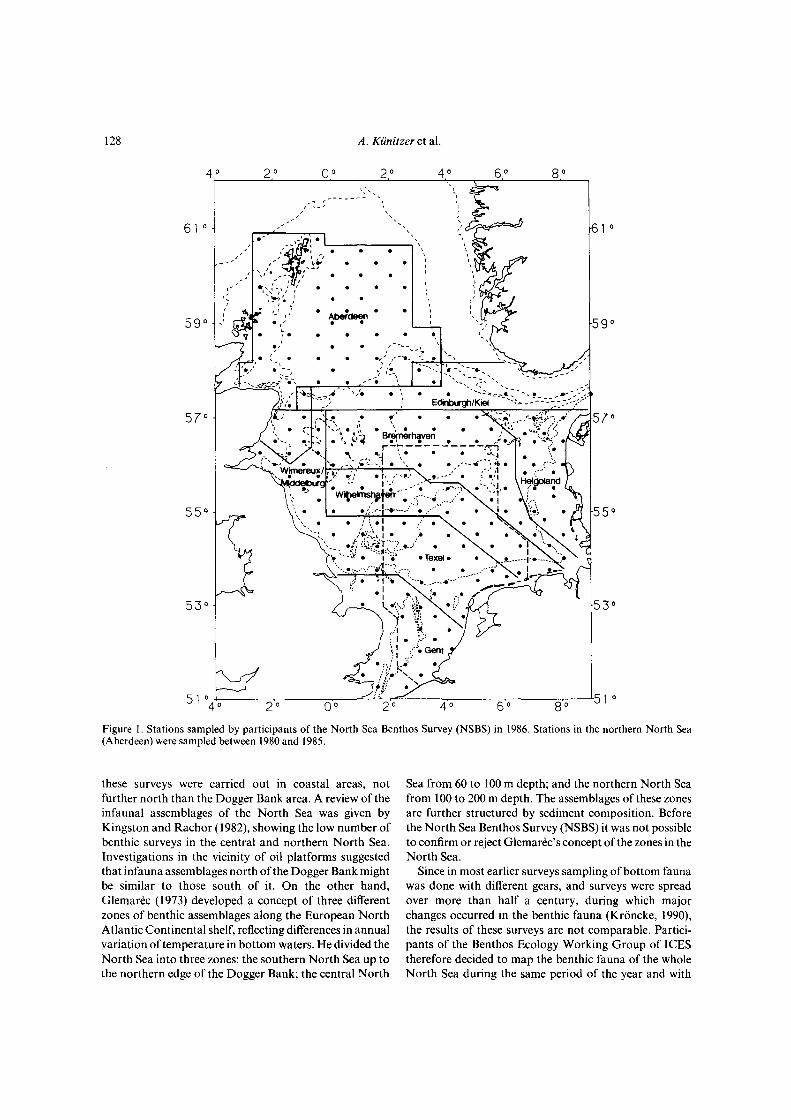
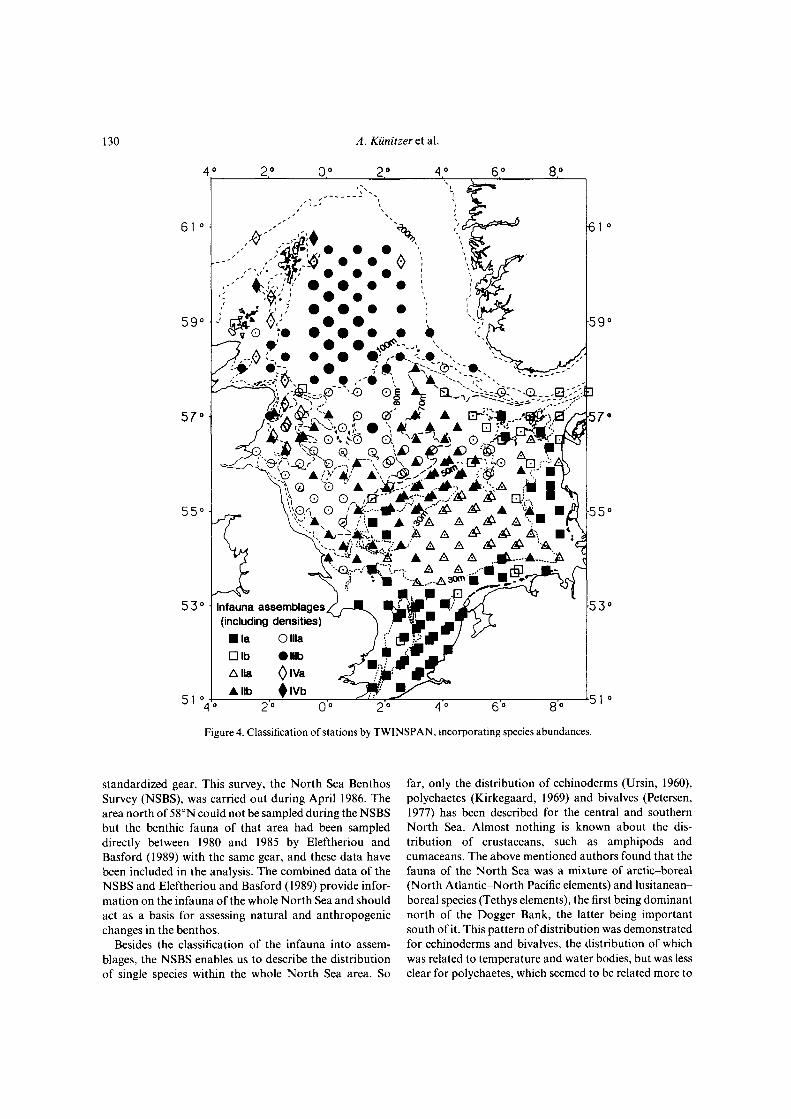
Figure 4. Classification of stations by TWINSPAN, incorporating species abundances.
standardized gear. This survey, the North Sea BenthosSurvey (NSBS), was carried out during April 1986. Thearea north of 58°N could not be sampled during the NSBSbut the benthic fauna of that area had been sampleddirectly between 1980 and 1985 by Eleftheriou andBasford (1989) with the same gear, and these data havebeen included in the analysis. The combined data of theNSBS and Eleftheriou and Basford (1989) provide infor-mation on the infauna of the whole North Sea and shouldact as a basis for assessing natural and anthropogenicchanges in the benthos.
Besides the classification of the infauna into assem-blages, the NSBS enables us to describe the distributionof single species within the whole North Sea area. So
far, only the distribution of echinoderms (Ursin, 1960),polychaetes (Kirkegaard, 1969) and bivalves (Petersen,1977) has been described for the central and southernNorth Sea. Almost nothing is known about the dis-tribution of crustaceans, such as amphipods andcumaceans. The above mentioned authors found that thefauna of the North Sea was a mixture of arctic-boreal(North Atlantic-North Pacific elements) and lusitanean-boreal species (Tethys elements), the first being dominantnorth of the Dogger Bank, the latter being importantsouth of it. This pattern of distribution was demonstratedfor echinoderms and bivalves, the distribution of whichwas related to temperature and water bodies, but was lessclear for polychaetes, which seemed to be related more to

Benthic infauna of the North Sea 131
1st dichotomy
2nd dichotomy
depth
deposit
3rd dichotomy
depth
deposit
indicator species
number of stations
number of species
exp(H-)
lnd.m-2
biomass (g AFDW.m"2)
I
I
mainly <
depth
30m
coarser sediment
I
la
Nephtys c.
I
Ib
Aonides p.
I
< 70m
I
II
30-70m
finer sediment
I
lla
30-50m
muddy fine sand
Nucula n.
Echinooardium c.Phoxocephalus h. Callianassa s.
Urothoe p.
52
27+8
12±4
805 ± 728
9.5 ±9.9
Pisione r.
19
29±9
14±5
873 ± 623
4.3 ±4.3
southern North
Eudorella t.
40
44 + 9
14 + 5
1995 ±1499
12.6+ 7.5
Sea
I
lib
50-70m
fine sand
Ophelia b.
Nephtys 1.
61
43 ±10
28 ± 5
1093 ± 686
7.6 ±6.5
— central
depth
III
finer sediment
I
Ilia
70-100m
46
54 ±16
24 ± 10
1224± 1233
7.417.0
North Sea —
1
Illb
> 100m
Minuspio c.
Thyasira sp.
Aricldea c.
Exogone v.
41
51 ±13
25 + 7
2863 + 1844
3.5 ± 3.7
I
> 70m
I
IV
<100m
coarser sediment
I
IVa IVb
Ophelia b. Protodorvilla k
Exogone h.
Spiophanes b.
Polydrrus sp.
12 2
44 ± 12
23 ± 5
1775 ± 1114
3.8 ± 2.2
northern North Sea
Figure 5. Scheme of TWINSPAN classification (species abundance data), showing the environmental and biotic parameters(mean + s.d.) of the assemblages and the indicator species.
the type of sediment. The present paper tries to combinethe main pattern of species distributions with thedistribution of infaunal assemblages in the North Sea.
Materials and methods
Sampling
Figure 1 shows the grid of 197 stations sampled during theNSBS in April 1986 and 63 stations sampled by Eleftheriouand Basford (1989) between 1980 and 1985, always inspring and early summer. The grid is of 30 x 35 nm withfour stations at the angles of the rectangle and one in thecentre. At each station the infauna was sampled either bybox sampler (usually three cores) and one van Veen grabor during bad weather conditions only by van Veen grab(usually three grabs). The numbers of samples per stationand per participant are given in the fifth report of theICES-Benthos Ecology Working Group (Anon., 1986).Samples were sieved over a 1-mm mesh (a 0.5-mm meshin the northern North Sea), preserved in 5% bufferedformalin and sorted and identified by each participant.
Taxonomic problems
Although many taxonomical problems were solvedduring a special workshop on taxonomy of North Seabenthos held on Helgoland in 1988 (Heip and Niermann,
1988) where invited experts on certain taxonomic groupschecked the identifications of species, the specieslist contained a lot of synonyms (e.g. Paramphinomejejfreysi—P. pulchella, Pectinaria auricoma = Amphicteneauricoma). Spelling and synonyms were checked using theMarine Conservation Society species directory, a codedchecklist of the marine fauna and flora of the British Islesand its surrounding seas (Howson, 1987). The directoryincludes most of the species recorded during the NSBS.Species which do not really belong to the macrobenthosand hence, were badly sampled (e.g. fishes, larval stages,epibenthic species) were removed. During a final work-shop on Texel in 1989 the identification of all species(including those of the northern North Sea) was checkedamong participants and uncertain identifications wereamalgamated into wider groupings.
For the final workshop a list of "suspect" species wasdrawn up by calculating an index of particularity, express-ing the degree to which species were found exclusively byone or a few laboratories. Depending on the number Sobs
of stations in which a species is found, one can calculatethe number L^p of laboratories that should have foundthe species, if the latter were homogeneously distributedover the whole North Sea
I -Lexp -
where Slot = total number of stations, Sj = number ofstations sampled by laboratory i, Ltot = total number of
132
•v---«--- •*" • • •; ' • • • • ! » • • • •
<62/urny—-. ^ »
• 62-125 j / % #
• 125-250 y L * . *250-500 _ f . / 0 1
>500/um C ^
51
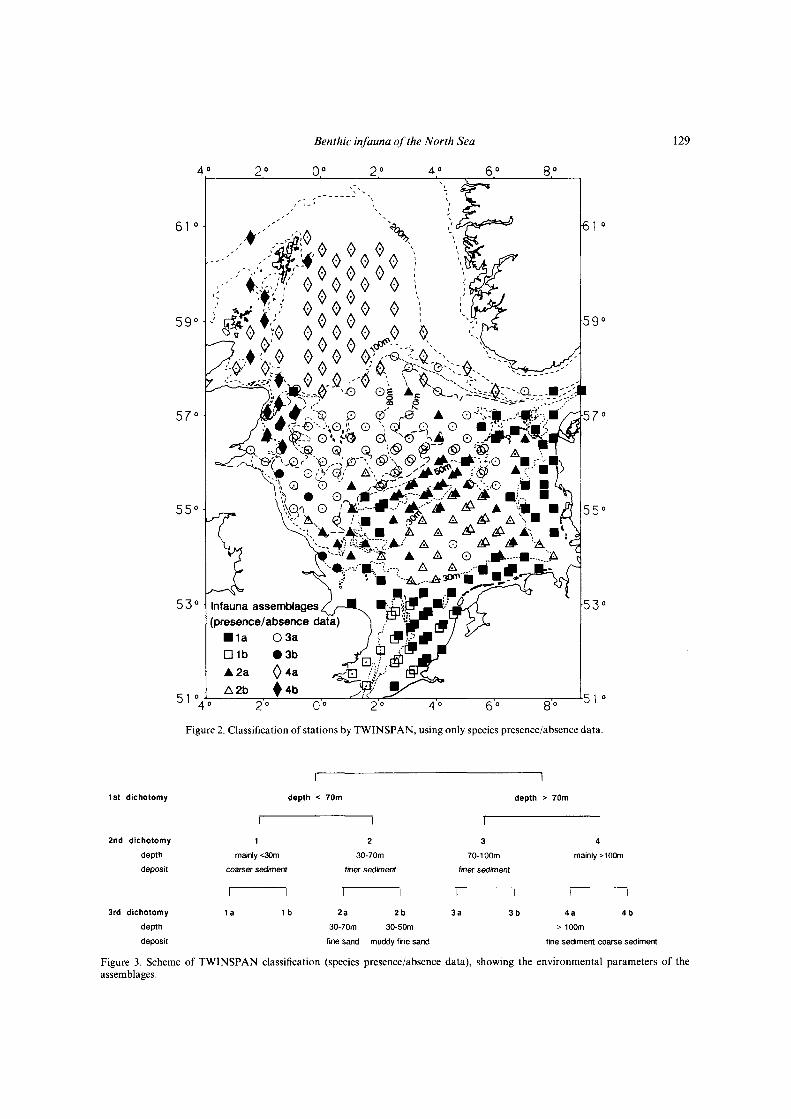
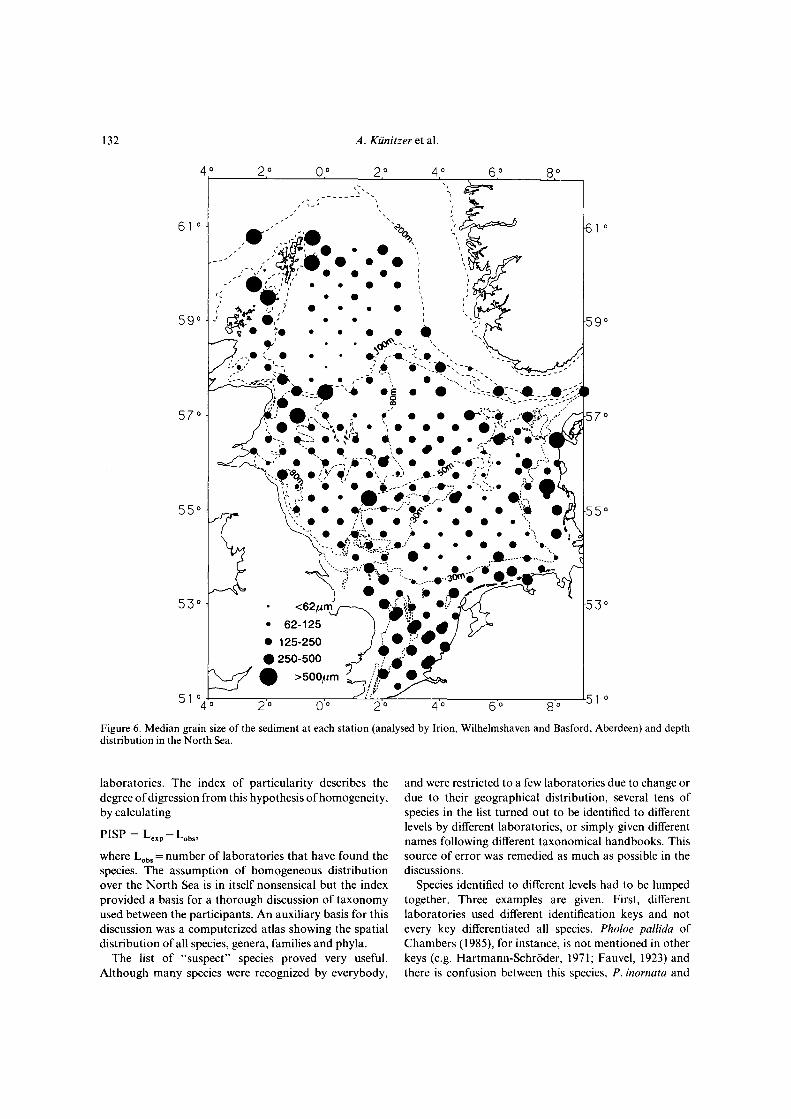
Figure 6. Median grain size of the sediment at each station (analysed by Irion, Wilhelmshaven and Basford, Aberdeen) and depthdistribution in the North Sea.
laboratories. The index of particularity describes thedegree of digression from this hypothesis of homogeneity,by calculating
= Le x p-Lo b s ,
where Lobs = number of laboratories that have found thespecies. The assumption of homogeneous distributionover the North Sea is in itself nonsensical but the indexprovided a basis for a thorough discussion of taxonomyused between the participants. An auxiliary basis for thisdiscussion was a computerized atlas showing the spatialdistribution of all species, genera, families and phyla.
The list of "suspect" species proved very useful.Although many species were recognized by everybody,
and were restricted to a few laboratories due to change ordue to their geographical distribution, several tens ofspecies in the list turned out to be identified to differentlevels by different laboratories, or simply given differentnames following different taxonomical handbooks. Thissource of error was remedied as much as possible in thediscussions.
Species identified to different levels had to be lumpedtogether. Three examples are given. First, differentlaboratories used different identification keys and notevery key differentiated all species. Pholoe pallida ofChambers (1985), for instance, is not mentioned in otherkeys (e.g. Hartmann-Schroder, 1971; Fauvel, 1923) andthere is confusion between this species, P. inornata and
Benthic infauna of the North Sea 133
Pholoesp.
Frequency: 188
21
— 0
640
oANNELIDASigalionidaePholoe
Coniadamaculato
Frequency: 185
13
- 0
107
oANNELIDAGoniadidaeGoniadq
Amphiurafiliformis
Frequency: 183
63
976
oECHINODERMATAAmphiuridaeAmphiura
Spiophanesbombyx
Frequency: 217
17
593O
ANNELIDASpionidaeSpiophanes
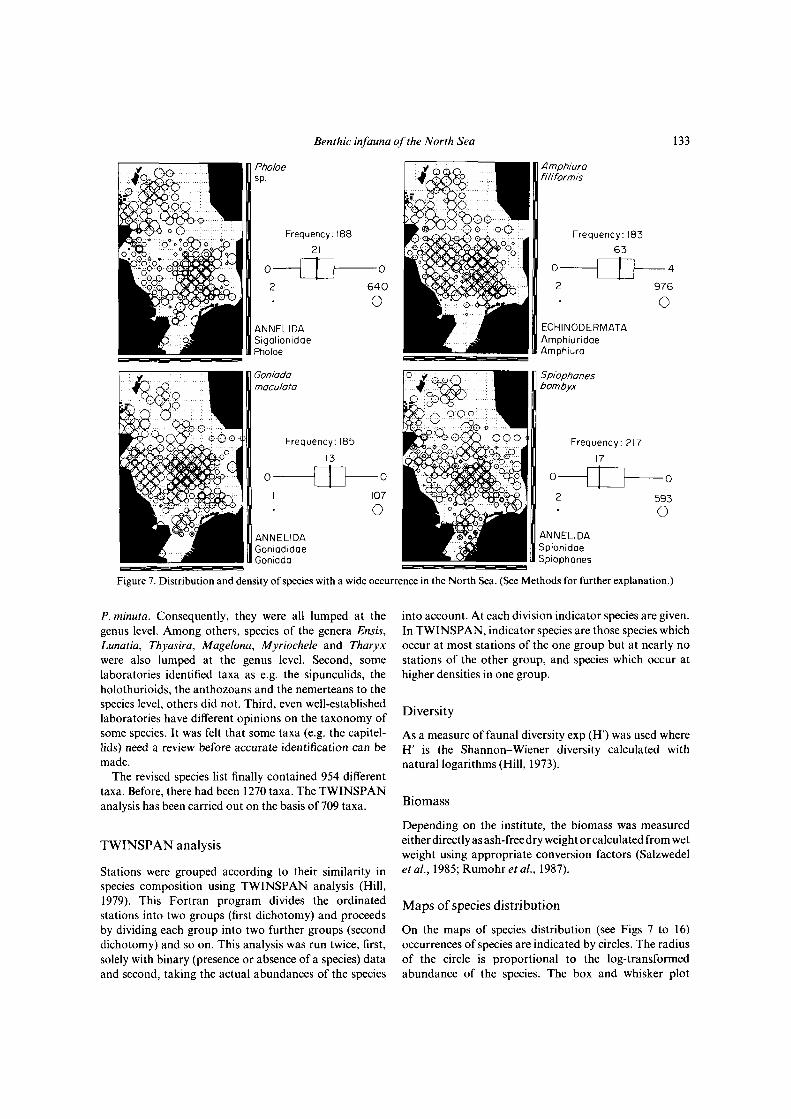
Figure 7. Distribution and density of species with a wide occurrence in the North Sea. (See Methods for further explanation.)
P. minuta. Consequently, they were all lumped at thegenus level. Among others, species of the genera Ensis,Lunatia, Thyasira, Magelona, Myriochele and Tharyxwere also lumped at the genus level. Second, somelaboratories identified taxa as e.g. the sipunculids, theholothurioids, the anthozoans and the nemerteans to thespecies level, others did not. Third, even well-establishedlaboratories have different opinions on the taxonomy ofsome species. It was felt that some taxa (e.g. the capitel-lids) need a review before accurate identification can bemade.
The revised species list finally contained 954 differenttaxa. Before, there had been 1270 taxa. The TWINSPANanalysis has been carried out on the basis of 709 taxa.
TWINSPAN analysis
Stations were grouped according to their similarity inspecies composition using TWINSPAN analysis (Hill,1979). This Fortran program divides the ordinatedstations into two groups (first dichotomy) and proceedsby dividing each group into two further groups (seconddichotomy) and so on. This analysis was run twice, first,solely with binary (presence or absence of a species) dataand second, taking the actual abundances of the species
into account. At each division indicator species are given.In TWINSPAN, indicator species are those species whichoccur at most stations of the one group but at nearly nostations of the other group, and species which occur athigher densities in one group.
Diversity
As a measure of faunal diversity exp (H') was used whereH' is the Shannon-Wiener diversity calculated withnatural logarithms (Hill, 1973).
Biomass
Depending on the institute, the biomass was measuredeither directly as ash-free dry weight or calculated from wetweight using appropriate conversion factors (Salzwedelet al., 1985; Rumohr et al., 1987).
Maps of species distribution
On the maps of species distribution (see Figs 7 to 16)occurrences of species are indicated by circles. The radiusof the circle is proportional to the log-transformedabundance of the species. The box and whisker plot
134 A. Kiinitzer et al.
Ophiuraalb/da
Frequency: 106
- 0
508O
ECHINODERMATAOphiolepidaeOphiura
Chameleagallina
Frequency: 89
10
Echinocardiumcordatum
Frequency: 108
80
O
0 -
2
MOLLUSCAVeneridaeChamelea
243
O
ECHINODERMATASpatangidaeEchinocardium
Tellimyaferruginosa
Frequency: 85
7
- 0
175
oMOLLUSCAMontacutidaeTellimya
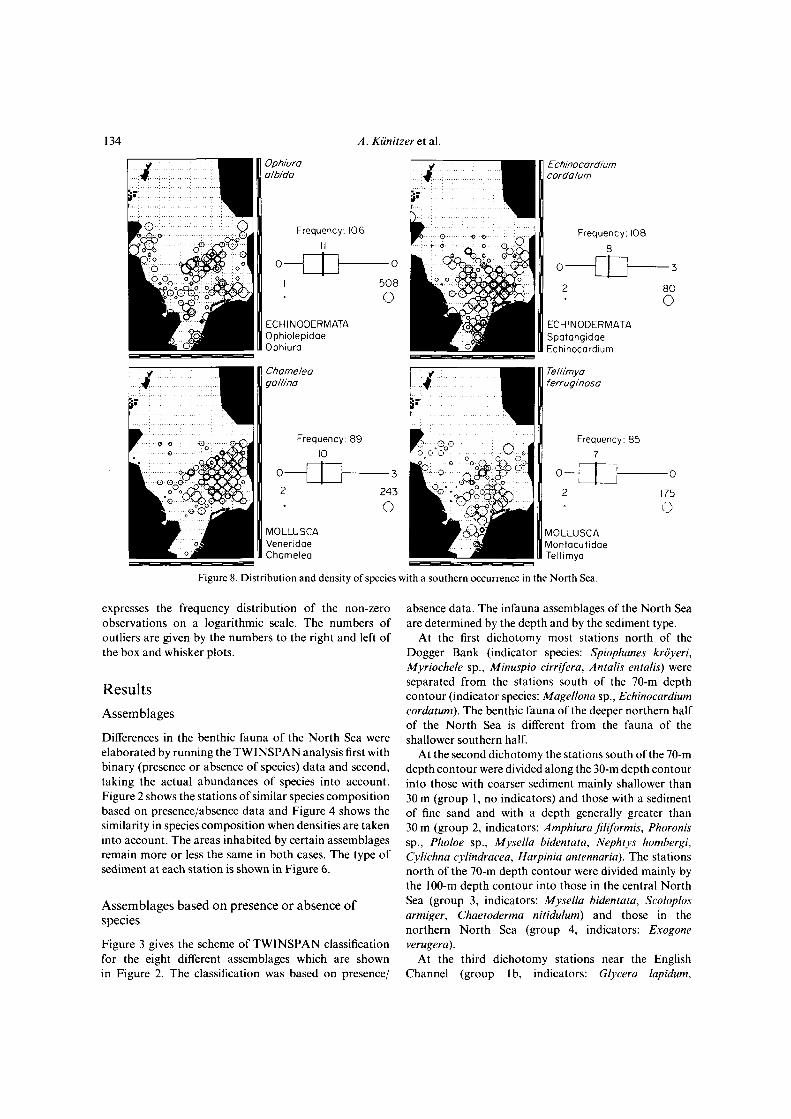
Figure 8. Distribution and density of species with a southern occurrence in the North Sea.
expresses the frequency distribution of the non-zeroobservations on a logarithmic scale. The numbers ofoutliers are given by the numbers to the right and left ofthe box and whisker plots.
Results
Assemblages
Differences in the benthic fauna of the North Sea wereelaborated by running the TWINSPAN analysis first withbinary (presence or absence of species) data and second,taking the actual abundances of species into account.Figure 2 shows the stations of similar species compositionbased on presence/absence data and Figure 4 shows thesimilarity in species composition when densities are takeninto account. The areas inhabited by certain assemblagesremain more or less the same in both cases. The type ofsediment at each station is shown in Figure 6.
Assemblages based on presence or absence ofspecies
Figure 3 gives the scheme of TWINSPAN classificationfor the eight different assemblages which are shownin Figure 2. The classification was based on presence/
absence data. The infauna assemblages of the North Seaare determined by the depth and by the sediment type.
At the first dichotomy most stations north of theDogger Bank (indicator species: Spiophanes kroyeri,Myriochele sp., Minuspio cirrifera, Antalis entalis) wereseparated from the stations south of the 70-m depthcontour (indicator species: Magellona sp., Echinocardiumcordatum). The benthic fauna of the deeper northern halfof the North Sea is different from the fauna of theshallower southern half.
At the second dichotomy the stations south of the 70-mdepth contour were divided along the 30-m depth contourinto those with coarser sediment mainly shallower than30 m (group 1, no indicators) and those with a sedimentof fine sand and with a depth generally greater than30 m (group 2, indicators: Amphiura filiformis, Phoronissp., Pholoe sp., Mysella bidentata, Nephtys hombergi,Cylichna cylindracea, Harpinia antennaria). The stationsnorth of the 70-m depth contour were divided mainly bythe 100-m depth contour into those in the central NorthSea (group 3, indicators: Mysella bidentata, Scoloplosarmiger, Chaetoderma nitidulum) and those in thenorthern North Sea (group 4, indicators: Exogoneverugera).
At the third dichotomy stations near the EnglishChannel (group lb, indicators: Glycera lapidum,
Bent hie infauna of the North Sea 135
Minuspiocirrifera
Frequency: 73
30
370
oANNELIDASpionidaeMinuspio
An talisentalis
Ophiuraaffinis
Frequency: 6310
110
o
Frequency: 78
10
60
oMOLLUSCADentaliidaeAntalis
ECHINODERMATAOphiolepidaeOphiura
Montacutasubstriata
Frequency: 35
10
80
OMOLLUSCAMontacutidaeMontacuta
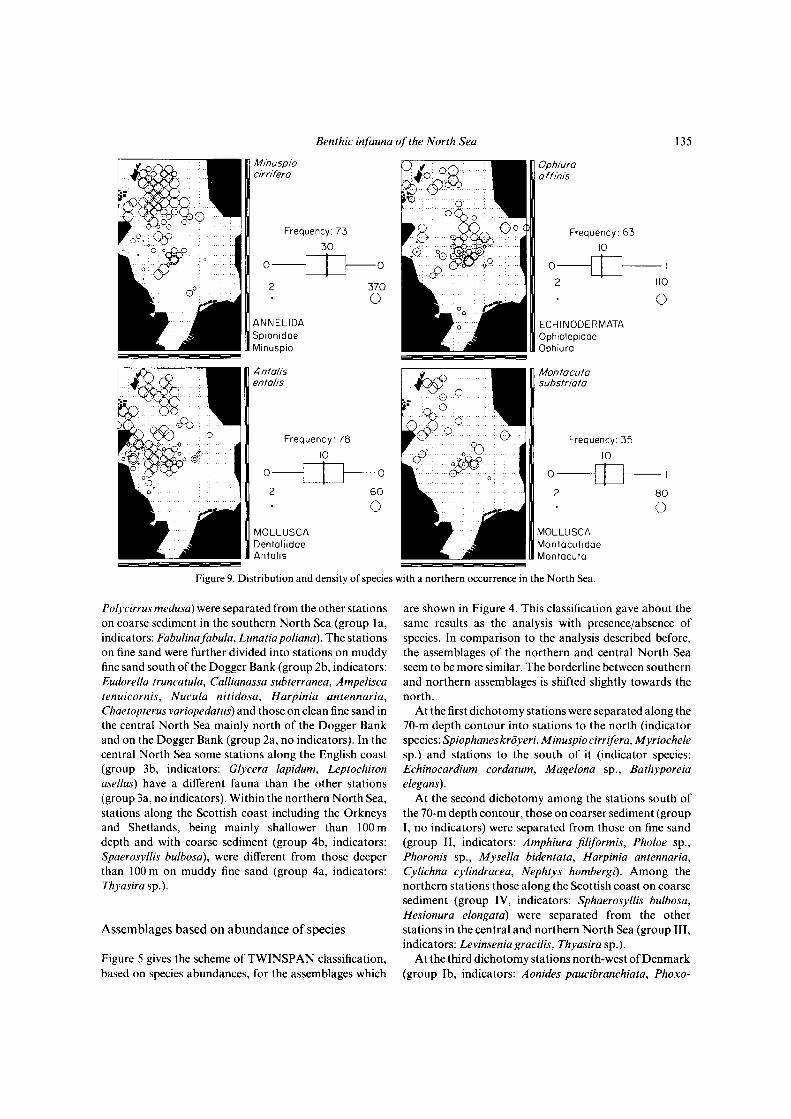
Figure 9. Distribution and density of species with a northern occurrence in the North Sea.
Poly cirrus medusa) were separated from the other stationson coarse sediment in the southern North Sea (group la,indicators: Fabulinafabula, Lunatiapoliana). The stationson fine sand were further divided into stations on muddyfine sand south of the Dogger Bank (group 2b, indicators:Eudorella truncatula, Callianassa subterranea, Ampeliscatenuicornis, Nucula nitidosa, Harpinia antennaria,Chaetopterus variopedatus) and those on clean fine sand inthe central North Sea mainly north of the Dogger Bankand on the Dogger Bank (group 2a, no indicators). In thecentral North Sea some stations along the English coast(group 3b, indicators: Glycera lapidum, Leptochitonasellus) have a different fauna than the other stations(group 3a, no indicators). Within the northern North Sea,stations along the Scottish coast including the Orkneysand Shetlands, being mainly shallower than 100 mdepth and with coarse sediment (group 4b, indicators:Spaerosyllis bulbosa), were different from those deeperthan 100 m on muddy fine sand (group 4a, indicators:Thyasira sp.).
Assemblages based on abundance of species
Figure 5 gives the scheme of TWINSPAN classification,based on species abundances, for the assemblages which
are shown in Figure 4. This classification gave about thesame results as the analysis with presence/absence ofspecies. In comparison to the analysis described before,the assemblages of the northern and central North Seaseem to be more similar. The borderline between southernand northern assemblages is shifted slightly towards thenorth.
At the first dichotomy stations were separated along the70-m depth contour into stations to the north (indicatorspecies: Spiophaneskroyeri, Minuspio cirrifera, Myriochelesp.) and stations to the south of it (indicator species:Echinocardium cordatum, Magelona sp., Bathyporeiaelegans).
At the second dichotomy among the stations south ofthe 70-m depth contour, those on coarser sediment (groupI, no indicators) were separated from those on fine sand(group II, indicators: Amphiura filiformis, Pholoe sp.,Phoronis sp., Mysella bidentata, Harpinia antennaria,Cylichna cylindracea, Nephtys hombergi). Among thenorthern stations those along the Scottish coast on coarsesediment (group IV, indicators: Sphaerosyllis bulbosa,Hesionura elongata) were separated from the otherstations in the central and northern North Sea (group III,indicators: Levinsenia gracilis, Thyasira sp.).
At the third dichotomy stations north-west of Denmark(group Ib, indicators: Aonides paucibranchiata, Phoxo-
136 A. Kunitzer et al.
Echinocyamuspusillus
Frequency: 83
13
2
ECHINODERMATA"ibulariidaeEchinocyamus
Glyceralapidum
Frequency: 70
16
0
2
240
0
0
360
OANNELIDAGlyceridaeGlycera
Spisuloelliptico
Frequency: 43
6
90
oMOLLUSCAMactridaeSpisula
Pisioneremota
Frequency: 29
14
-I
500
oANNELIDAPisionidaePisione
Figure 10. Distribution and density of species with a wide occurrence on coarse sediments in the North Sea.
cephalus holbolli, Pisione remota) were separated from theother stations on coarser sediment (group la, indica-tors: Nephtys cirrosa, Echinocardium cordatum, Urothoeposeidonis). The stations on fine sand were divided intothose on muddy fine sand south of the Dogger Bank(group Ila, indicators: Nucula nitidosa, Callianassasubterranea, Eudorella truncatuld) and those on fine sandin the central North Sea at 50-70-m depth (grouplib, indicators: Ophelia borealis, Nephtys longosetosa).Stations deeper than 70 m were divided along the 100-mdepth contour into those of the northern North Sea(group Illb, indicators: Minuspio cirrifera, Thyasira sp.,Aricidea catherinae, Exogone verugera) and those of thecentral North Sea at about 70-100-m depth (group Ilia,no indicators).
Species number, diversity, density, biomass
The difference in biotic parameters among the assemblagesis shown in Figure 5 for the species number, diversity,density and biomass.
Species number and diversity gradually increase fromthe assemblages shallower than 30 m (group la, Ib) to theassemblages in the 30-70-m depth (group Ila, lib) and are
highest in the assemblages in areas deeper than 70 m(group Ilia, Illb). Towards the Scottish coast (group IV)species number and diversity decrease again.
The variation in densities is too high to show cleardifferences between assemblages. Densities seem to belower in the assemblages on shallow coarse sediment(group la, Ib). They seem to be highest in group Illb but atstations in this group a finer mesh of 0.5 mm instead of1.0 mm was used. Also at the stations of group IV the0.5-mm mesh was used, and therefore densities are higherthan they would have been by using a 1 -mm mesh and arenot directly comparable to the densities in group I and II.
The variation in biomass is also very high. The meanbiomass per assemblage is lowest in the northern NorthSea (groups Illb and IV). The biomass increases towardsthe shallower southern North Sea and reaches highestvalues south of the Dogger Bank (group la, Ila).
Species distribution
Since it is impossible to show the distribution of all speciesin the North Sea, only a few examples will be given here toshow the main patterns. These species were chosen,because they were shown to be typical of individual
Bent hie infauna of the North Sea 137
Glyceraceltica
Frequency:12
13
O
ANNELIDAGlyceridaeGlycera
Phoxocephalusholbolli
Frequency:21
10
Sphaerosyllisbulbosa
Frequency: 1424
0
10
ANNELIDASyllidaeSphaerosyllis
0
320O
— I
50
OARTHROPODAPhoxocephalidaePhoxocephalus
Polycirrusmedusa
Frequency: 20
5
44O
ANNELIDATerebellidaePolycirrus
Figure 11. Distribution and density of species with a restricted occurrence on coarse sediments in the North Sea.
Opheliaborealis
Frequency: 130
25
960
oANNELIDAOpheliidaeOphelia
Bathyporeiaelegans
Frequency: 127
18
o-
2
ARTHROPODAHaustoriidaeBathyporeia
- 0
907
O
Aricideaminuta
Frequency:41
7
60
oANNELIDAParaonidaeAricidea
Figure 12. Distribution and density of species with a wideoccurrence on fine sand in the North Sea.
138 A. Kunitzer et al.
Bathyporeiaguilliamsoniana
Frequency: 54
25
438O
ARTHROPODAHaustoriidaeBathyporeia
Urothoeposeidonis
Fabulinafabulo
Frequency: 68
22
- 0
453O
Frequency: 45
27
757
O
ARTHROPODAHaustoriidaeUrothoe
MOLLUSCATellinidaeFabulina
Sigalionmathildae
Frequency: 37
32
oANNELIDASigalionidaeSigalion
Figure 13. Distribution and density of species with a restricted occurrence on fine sand in the southern North Sea.
Harpiniaantennaria
Frequency: 105
16
320
oARTHROPODAPhoxocephalidaeHarpinia
Glycindenordmanni
Frequency :79
7
°—12
ANNELIDAGoniadidaeGlycinde
400
Eudorellatruncatulo
Frequency: 5413
- 0
130
O
ARTHROPODALeuconidaeEudorella
Figure 14. Distribution and density of species with a wideoccurrence on muddy fine sand in the North Sea.
Benthic infauna of the North Sea 139
Nuculanitidosa
Frequency: 4720
- 0
361
O
MOLLUSCANuculidaeNucula
Chaetopterusvariopedatus
Frequency: 32
70
OANNELIDAChaetopteridaeChqetopterus
Callianassasubterranea
Frequency: 43
20
60
oARTHROPODACallianassidaeCallianassa
Synelmisklatti
Frequency: 31
10
— 0
31
oANNELIDAPilargiidaeSynelmis
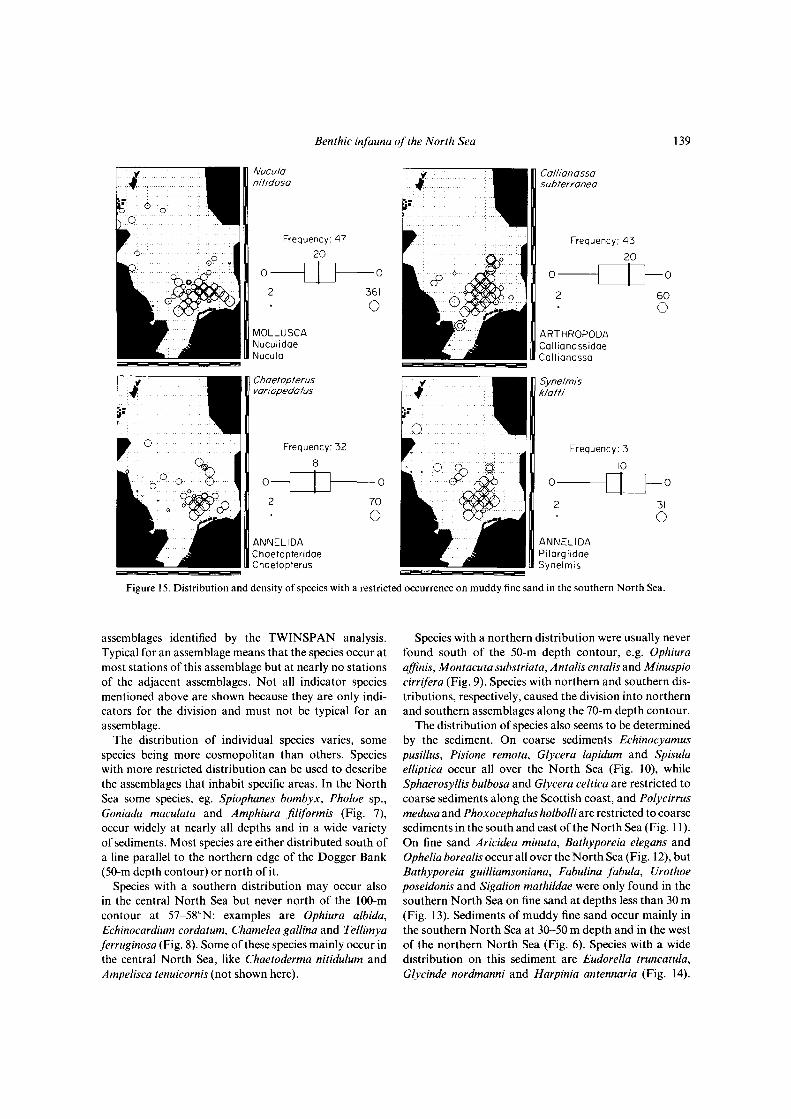
Figure 15. Distribution and density of species with a restricted occurrence on muddy fine sand in the southern North Sea.
assemblages identified by the TWINSPAN analysis.Typical for an assemblage means that the species occur atmost stations of this assemblage but at nearly no stationsof the adjacent assemblages. Not all indicator speciesmentioned above are shown because they are only indi-cators for the division and must not be typical for anassemblage.
The distribution of individual species varies, somespecies being more cosmopolitan than others. Specieswith more restricted distribution can be used to describethe assemblages that inhabit specific areas. In the NorthSea some species, eg. Spiophanes bombyx, Pholoe sp.,Goniada maculata and Amphiura filiformis (Fig. 7),occur widely at nearly all depths and in a wide varietyof sediments. Most species are either distributed south ofa line parallel to the northern edge of the Dogger Bank(50-m depth contour) or north of it.
Species with a southern distribution may occur alsoin the central North Sea but never north of the 100-mcontour at 57-58°N: examples are Ophiura albida,Echinocardium cordatum, Chamelea gallina and Tellimyaferruginosa (Fig. 8). Some of these species mainly occur inthe central North Sea, like Chaetoderma nitidulum andAmpelisca tenuicornis (not shown here).
Species with a northern distribution were usually neverfound south of the 50-m depth contour, e.g. Ophiuraaffinis, Montacuta substriata, Antalis entails and Mlnusplocirrifera (Fig. 9). Species with northern and southern dis-tributions, respectively, caused the division into northernand southern assemblages along the 70-m depth contour.
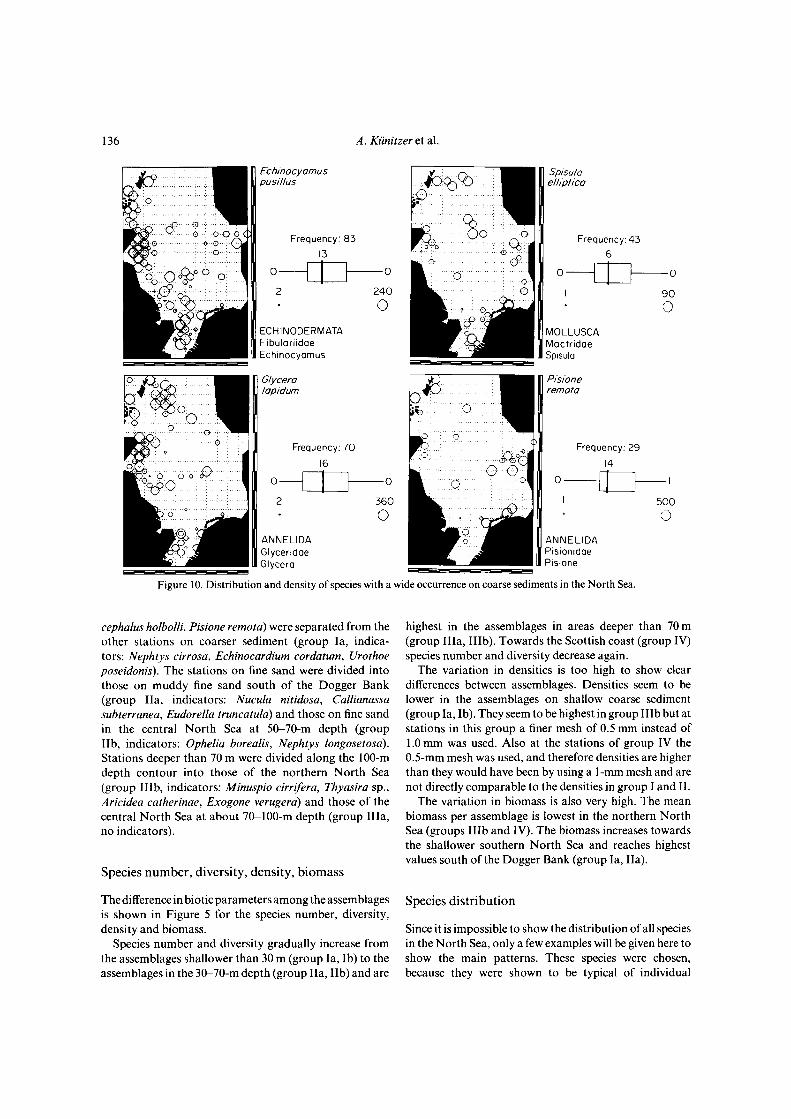
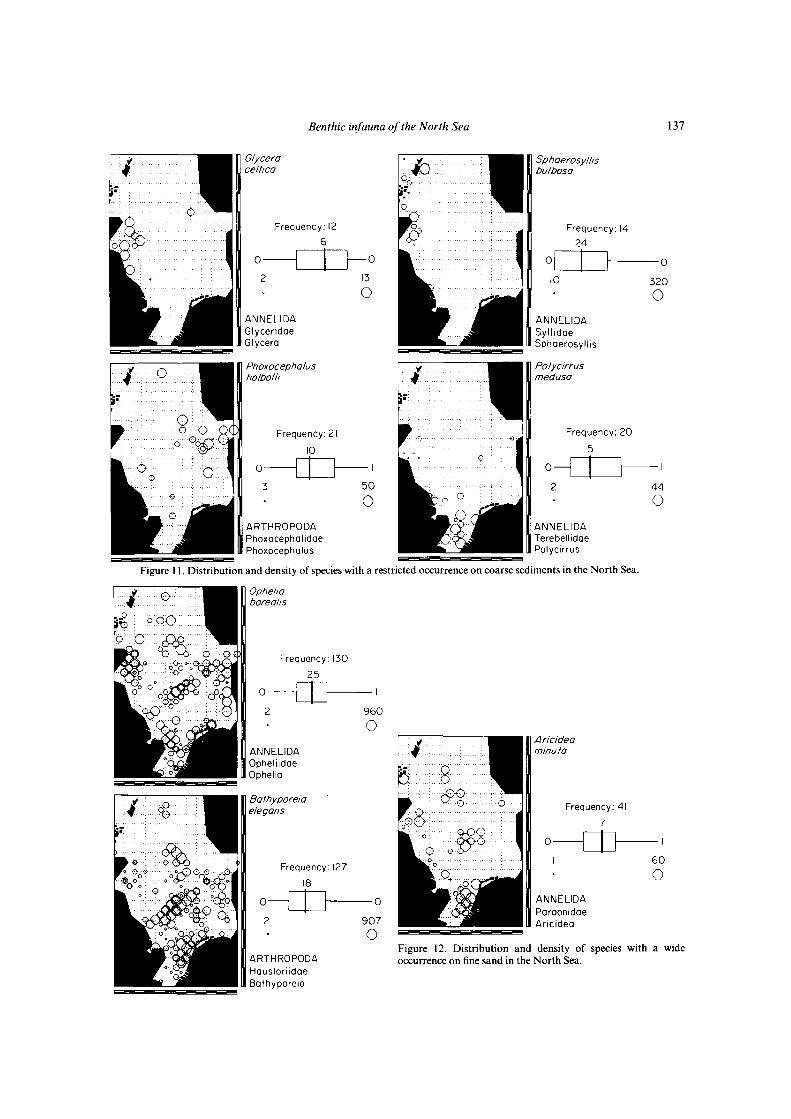
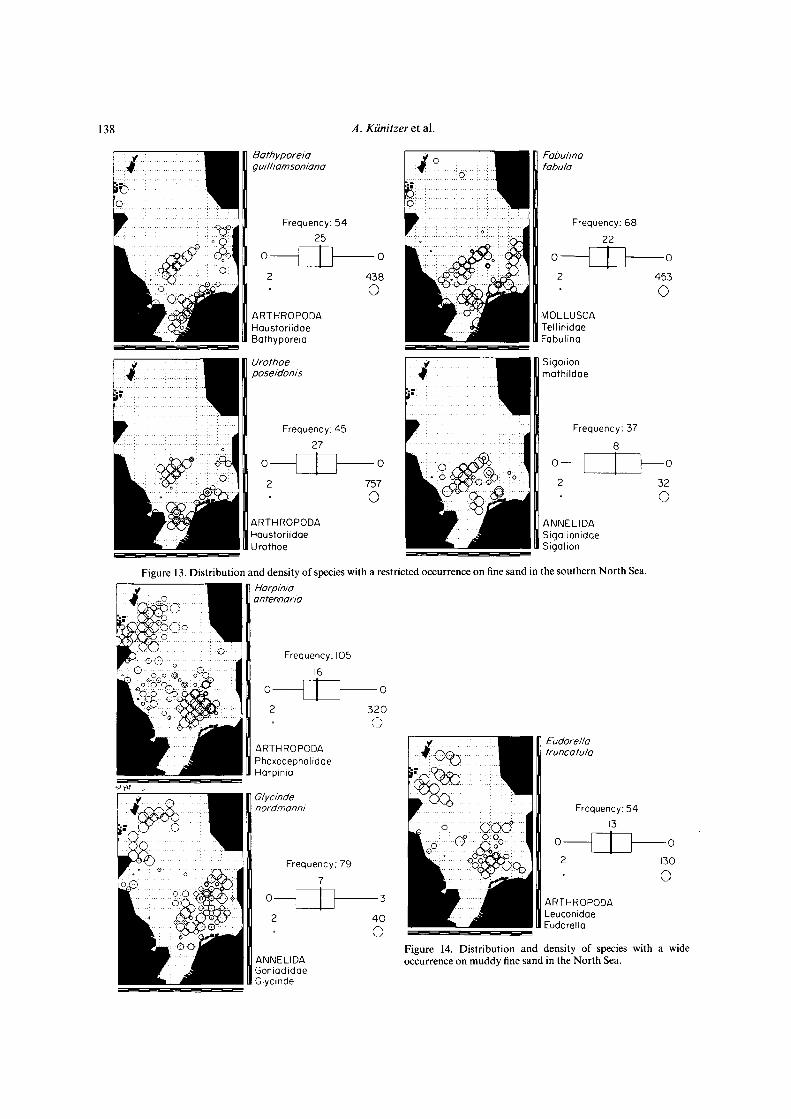
The distribution of species also seems to be determinedby the sediment. On coarse sediments Echlnocyamuspuslllus, Plslone remota, Glycera lapidum and Spisulaelliptlca occur all over the North Sea (Fig. 10), whileSphaerosyllls bulbosa and Glycera celtica are restricted tocoarse sediments along the Scottish coast, and Polycirrusmedusa and Phoxocephalus holbolli are restricted to coarsesediments in the south and east of the North Sea (Fig. 11).On fine sand Aricidea minuta, Bathyporeia elegans andOphelia borealis occur all over the North Sea (Fig. 12), butBathyporeia guilliamsoniana, Fabulina fabula, Urothoeposeidonis and Sigalion mathildae were only found in thesouthern North Sea on fine sand at depths less than 30 m(Fig. 13). Sediments of muddy fine sand occur mainly inthe southern North Sea at 30-50 m depth and in the westof the northern North Sea (Fig. 6). Species with a widedistribution on this sediment are Eudorella truncatula,Glycinde nordmanni and Harpinia antennaria (Fig. 14).
140 A. Kiinitzer et al.
Laonicesarsi
Frequency: 24
30
10
ANNELIDASpionidaeLaonice
Molgulasp.
Frequency: 23
10
0
CHORDATAMolgulidaeMolgula
230
o
10
0
Leuconnasica
Frequency: 16
14
120
O
ARTHROPODALeuconidaeLeucon
Thyasiraferruginea
Frequency: 22
30
- 0
130
O
MOLLUSCAThyasiridaeThyasira
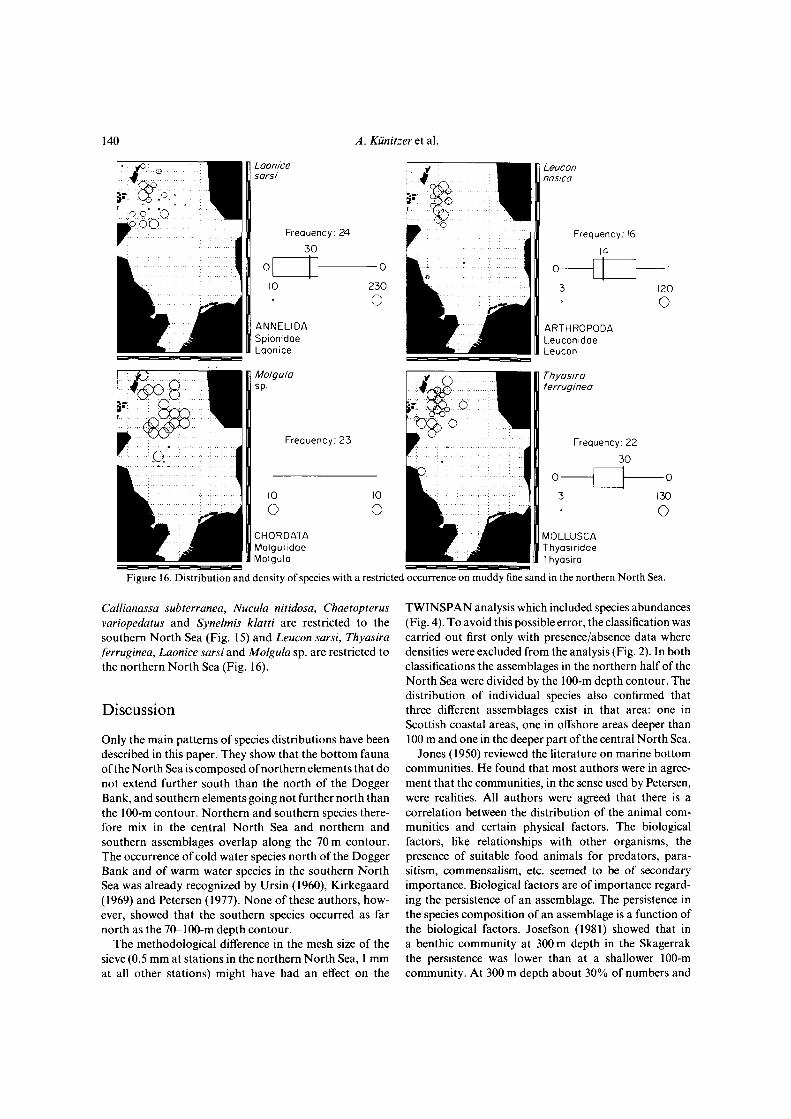
Figure 16. Distribution and density of species with a restricted occurrence on muddy fine sand in the northern North Sea.
Callianassa subterranea, Nucula nitidosa, Chaetopterusvariopedatus and Synelmis klatti are restricted to thesouthern North Sea (Fig. 15) and Leucon sarsi, Thyasiraferruginea, Laonice sarsi and Molgula sp. are restricted tothe northern North Sea (Fig. 16).
Discussion
Only the main patterns of species distributions have beendescribed in this paper. They show that the bottom faunaof the North Sea is composed of northern elements that donot extend further south than the north of the DoggerBank, and southern elements going not further north thanthe 100-m contour. Northern and southern species there-fore mix in the central North Sea and northern andsouthern assemblages overlap along the 70 m contour.The occurrence of cold water species north of the DoggerBank and of warm water species in the southern NorthSea was already recognized by Ursin (1960), Kirkegaard(1969) and Petersen (1977). None of these authors, how-ever, showed that the southern species occurred as farnorth as the 70-100-m depth contour.
The methodological difference in the mesh size of thesieve (0.5 mm at stations in the northern North Sea, 1 mmat all other stations) might have had an effect on the
TWINSPAN analysis which included species abundances(Fig. 4). To avoid this possible error, the classification wascarried out first only with presence/absence data wheredensities were excluded from the analysis (Fig. 2). In bothclassifications the assemblages in the northern half of theNorth Sea were divided by the 100-m depth contour. Thedistribution of individual species also confirmed thatthree different assemblages exist in that area: one inScottish coastal areas, one in offshore areas deeper than100 m and one in the deeper part of the central North Sea.
Jones (1950) reviewed the literature on marine bottomcommunities. He found that most authors were in agree-ment that the communities, in the sense used by Petersen,were realities. All authors were agreed that there is acorrelation between the distribution of the animal com-munities and certain physical factors. The biologicalfactors, like relationships with other organisms, thepresence of suitable food animals for predators, para-sitism, commensalism, etc. seemed to be of secondaryimportance. Biological factors are of importance regard-ing the persistence of an assemblage. The persistence inthe species composition of an assemblage is a function ofthe biological factors. Josefson (1981) showed that ina benthic community at 300 m depth in the Skagerrakthe persistence was lower than at a shallower 100-mcommunity. At 300 m depth about 30% of numbers and
Bent hie infauna of the North Sea 141
biomass were replaced over a 5-year period. Parts of thesechanges could be interpreted in terms of amensalism andcommensalism between trophic or functional groups ofspecies. The persistence of a 80-m community off the coastof Northumberland has been shown to be lower than thatof a 55-m community due to sequential changes in thedominant species which were regarded as evidence ofbiological interaction (Buchanan and Moore, 1986). Thesignificant environmental factors determining assem-blages were shown by Jones (1950) to be temperature,salinity and the nature of the bottom deposit. Within theAtlantic boreal region Jones divided the benthos by thetemperature range and salinity range into shallow watercommunities, offshore communities and deep communi-ties. The latter have their upper limits of distribution at70 m depth. These communities were further structuredby the sediment.
In his model of three infaunal etages in the NorthSea, Glemarec (1973) demonstrated the 50- and 100-mcontours as being important structuring borders for theassemblages in the North Sea. The depth contours bywhich assemblages were separated in our analysis are the30-m, 50-m, 70-m and 100-m contours. As shown in thispaper, the zone deeper than 100 m is inhabited by coldwater species; the one shallower than 50 m is inhabited bywarm water species; and the intermediate zone between 50and 100 m depth is inhabited by cold as well as warmwater species.
The classification of assemblages in this paper showsthat there are more than two depth contours structuringthe benthos and that the 70-m and 30-m contours aremore important for the distribution of assemblages thanthe 50-m depth contour. The separation of the fauna intoa northern and a southern one along the 70-m contourmight be a result of the current pattern in the North Sea.Most of the Fair Isle-Orkney inflow of Atlantic watermoves eastwards at about 57°30'N and only part ofit travels southwards down the coast of England (Lee,1980). The shallow southern North Sea is, in contrastto the deeper northern areas, influenced by the EnglishChannel inflow which extends up to the Dogger Bank.The northern North Sea and part of the central North Seais therefore influenced by a different type of water than therest of the North Sea. Among plankton communitiesthose of the northern and central North Sea are similarbut neritic species are more numerous in the central NorthSea (Adams, 1987). The distribution of larger epifaunahas been shown to be likewise determined by these twodifferent water masses (Frauenheim et al., 1989). The epi-fauna north of the Dogger Bank is different from the onein the southern North Sea.
Another factor determining the distribution ofassemblages is the annual variation of temperature inbottom waters. Large areas of the southern North Seaare not stratified during most of the year (Tomczak andGoedecke, 1964) and therefore the summer temperature of
bottom waters is high (> 10°C) (Tomczak and Goedecke,1962), while in the stratified areas north of the DoggerBank summer temperatures are less than 7°C. In winterthe southern North Sea is colder (4°C) than the rest ofthe North Sea (5-7°C). These differences in temperaturenorth and south of the Dogger Bank might explain whycold water species do not go further south than theDogger Bank. The explanation for why warm waterspecies are not found below 70-100 m depth, althoughthey survive the cold summer temperatures in the centralNorth Sea, might lie in the general current pattern.
A third factor which may cause the differences amongthe assemblages is the availability of food. Large stocksof copepods develop only in the northern North Sea.They consume the summer production of phytoplankton(Fransz and Gieskes, 1984). The faecal pellets do notreach the deep water, being recycled higher in the watercolumn (Krause, 1981) so limiting this source of food tothe benthos in the summer months. This could explainthe low biomass of infauna in the northern North Sea.Further south, main parts of the phytoplankton produc-tion reach the bottom, resulting in better food supply tothe benthos, especially in summer months. Buchanan(1963) has stated already that a relevant ecological factorfor benthic assemblages can be found in the quality of thesuspended matter together with the speed and nature of itsflow over the bottom.
The separation of benthic assemblages along the 30-mdepth contour can be caused by several environmentalfactors. No thermal stratification of the water columndevelops in summer months in the shallow coastal areas,whereas below 30 m depth a stratification may develop(Tomczak and Goedecke, 1964). Strong tidal currentsexist in the shallow coastal zones and the wave actionreaches the bottom, stirring up fine particles of sedimentand organic matter. These areas therefore consist of sandand gravel, while in areas of 30 to 50 m depth the depositusually consists of muddy fine sand. As a consequence ofthese environmental differences, the food availabilitymust be different, resulting in different feeding types.
Besides depth, the sediment structures the distributionof the assemblages. Depth and sediment are interrelatedsince coarser sediments usually occur in shallower areas.As shown in this paper, several species occur on all typesof sediment while other species are restricted to sedi-ments of a certain grain size. This holds for all groups:polychaetes, molluscs, echinoderms and crustaceans.Kirkegaard (1969) found the sediment to be more import-ant than the depth for determining the distribution ofpolychaetes in the North Sea. Also, in the German Bightassociations are mostly tied to different types of bottom(Salzwedel et al, 1985). The bottom fauna communitiesoff the coast of Northumberland, on the other hand, arepoorly correlated with the texture of the bottom sedi-ments (Buchanan, 1963). In the latter area the sedimentconditions of the various communities overlap broadly
142 A. Ktinitzer et al.
and different communities are found in apparently similarsediments. The present results show that northern andsouthern assemblages meet in the area off the coast ofNorthumberland. Since these assemblages seem to bedetermined by different water masses, the sediment mightbe of less importance in structuring the assemblages. Inthe German Bight water masses are more uniform andtherefore the sediment becomes the structuring factor.
The classification of the benthic fauna into assemblagesis a matter of scale. The analysis of the benthic assem-blages, shown here, has been carried out on a broad scaleand shows the differences in species composition withinthe large area of the North Sea. If the benthic infauna ofcertain parts of the North Sea is analysed, as has beendone for the area off the coast of Northumberland(Buchanan, 1963), the Fladenground (Mclntyre, 1961),the German Bight (Salzwedel et al., 1985), the northernNorth Sea (Eleftheriou and Basford, 1989), the vicinity ofthe Ekofisk and Eldfisk oilfields (Gray et al., 1990), oreven for a limited area within the area covered by theNSBS (Kiinitzer, 1990; Duineveld et al., 1991), the eightassemblages described in this paper are divided further.The question is in how much detail we would like to lookat small scale distribution.
Regarding the broad scale of the whole North Sea,assemblages of other benthic groups like the meiofauna(Huys et al., 1990) and the epifauna (Dyer et al., 1983 andFrauenheim et al., 1989) are structured and groupedwithin about the same areas as the macrobenthic infaunaassemblages. The macrobenthic assemblages seem toreflect general environmental differences within theNorth Sea which should be taken into account whenassessing the effects of anthropogenic changes in theNorth Sea. These changes might differ between thevarious assemblages.
ReferencesAdams, J. A. 1987. The primary ecological sub-division of the
North Sea: some aspects of their plankton communities. InDevelopments in fisheries research in Scotland. Ed. by R. S.Bailey and B. B. Parrish. Fishing News, London.
Anonymous, 1986. Fifth report of the Benthos EcologyWorking Groups. ICES 1986/C: 27.
Buchanan, J. B. 1963. The bottom fauna communities and theirsediment relationship off the coast of Northumberland. Oikos,14: 154-175.
Buchanan, J. B., and Moore, J. J. 1986. A broad review of varia-bility and persistence in the Northumberland benthic fauna -1971-85. Journal of the Marine Biological Association of theUK, 66: 641-657.
Chambers, S. 1985. Polychaetes from Scottish waters. Part2. Families Aphroditidae, Sigalionidae and Polyodontidae.Royal Scottish Museum Studies.
Duineveld, G. C. A., Kiinitzer, A., Niermann, U., DeWilde,P. A. W. J., and Gray, J. S. 1991. The macrobenthos of theNorth Sea. Netherlands Journal of Sea Research, 28: 53-65.
Eleftheriou, A., and Basford, D. J. 1989. The macrobenthicinfauna of the offshore northern North Sea. Journal of theMarine Biological Association of the UK, 69: 123-143.
Fauvel, P. 1923. Polychetes errantes. Fauna de France, 5:488.
Fransz, H. G., and Gieskes, W. N. C. 1984. The imbalance ofphytoplankton and copepods in the North Sea. Rapports etProces-Verbaux des Reunions du Conseil International pourl'Exploration de la Mer, 183: 218-225.
Frauenheim, K., Neumann, V., Thiel, H., and Tiirkay, M. 1989.The distribution of the larger epifauna during summer andwinter in the North Sea and its suitability for environmentalmonitoring. Senkenbergiana Marit. 20: 101-118.
Glemarec, M. 1973. The benthic communities of the EuropeanContinental North Atlantic shelf. Oceanography and MarineBiology Annual Reviews, 11: 263-289.
Gray, J. S., Clarke, K. R., Warwick, R. M., and Hobbs, G. 1990.Detection of initial effects of pollution on marine benthos: anexample from the Ekofisk and Eldfisk oilfields, North Sea.Marine Ecology Progress Series, 66: 285-299.
Hartmann-Schroder, G. 1971. Annelida, Borstenwiirmer,Polychaeta. In Die Tierwelt Deutschlands, Ed. by R. Dahl.
Heip, C , and Niermann, U. (Eds) 1989. Taxonomy of North Seabenthos. Proceedings of a workshop organized in Helgoland,8-12 February 1988. Delta Institute, Yerseke.
Hill, M. O. 1979. TWINSPAN-a Fortran program for arrangingmultivariate data in an ordered two-way table by classificationof the individuals and attributes. Ecology and Systematics,Cornell University, New York.
Howson, C. M. (Ed.) 1987. Directory of the British marine faunaand flora. A coded checklist of the marine fauna and flora ofthe British Isles and its surrounding seas. Marine ConservationSociety.
Huys, R., Heip, C. H. R., Herman, P. M. J., and Soetaert, K.1990. The meiobenthos of the North Sea: preliminary results ofthe North Sea Benthos Survey. ICES CM 1990/Mini: 8.
ICES. 1986. Fifth report of the Benthos Ecology WorkingGroup. ICES CM 1986/L: 27.
Jones, N. S. 1950. Marine bottom communities. BiologicalReviews, 25:283-313.
Josefson, A. B. 1981. Persistence and structure of two deepmacrobenthic communities in the Skagerrak (west coastof Sweden). Journal of Experimental Marine Biology andEcology, 50: 63-97.
Kingston, P. F., and Rachor, E. 1982. North Sea level bottomcommunities. ICES CM 1982/L: 41.
Kirkegaard, J. B. 1969. A quantitative investigation of the centralNorth Sea polychaeta. Spolia Zoologica Musei Hauniensis,29: 1-285.
Krause, M. 1981. Vertical distribution of faecal pelletsduring FLEX '76. Helgolander Meeresuntersuchungen, 34:313-337.
Kroncke I. 1990. Macrofauna standing stock of the DoggerBank. A comparison: II. 1951-1952 versus 1985-1987. Arechanges in the community of the northeastern part of theDogger Bank due to environmental changes? NetherlandsJournal of Sea Research, 25: 189-198.
Kiinitzer, A. 1990. The infauna and epifauna of the central NorthSea. Meeresforschung, 33: 23-37.
Lee, A. J. 1980. North Sea: physical oceanography. In Thenorth-west European shelf seas: The sea bed and the sea inmotion. II. Physical and chemical oceanography and physicalresources, pp. 467-493. Ed. by F. T. Banner, M. B. Collins andK. S. Massie, Elsevier, Amsterdam.
Mclntyre, A. D. 1961. Quantitative differences in the fauna ofboreal mud associations. Journal of the Marine BiologicalAssociation of the United Kingdom, 41: 599-616.
Petersen, C. G. J. 1914. Valuation of the sea. II. The animalcommunities of the sea bottom and their importance formarine zoogeography. Rep. Dan. Biol. Stn. 21:
Bent hie infauna of the North Sea 143
Petersen, G. H. 1977. The density, biomass and origin ofthe bivalves of the central North Sea. Meddelelser fraDanmarks Fiskeri- og Havundersogelser, 7: 221-273.
Rumohr, H., Brey, T., and Ankar, S. 1987. A compilationof biometric conversation factors for benthic invertebratesin the Baltic Sea. Baltic Marine Biologists Publication, 9:1-56.
Salzwedel, H., Rachor, E., and Gerdes, D. 1985. Benthicmacrofauna communities in the German Bight. Veraffent-lichungen des Instituto fiir Meeresforschung, Bremerhaven,20:199-267.
Tomczak, G., and Goedecke, E. 1962. Monatskarten derTemperatur der Nordsee, dargestellt fiir verschiedeneTiefenhorizonte. Deutsche Hydrographische Zeitschrift,Erganzungsheft, B(4°), No.7.
Tomczak, G., and Goedecke, E. 1964. Die thermischeSchichtung der Nordsee auf Grund des mittleren Jahresgangsder Temperatur in 1/2°- und 1°-Feldern. Deutsche Hydrogra-phische Zeitschrift, Erganzungsheft, B(4°), No.8.
Ursin, E. 1960. A quantitative investigation of the echinodermfauna of the central North Sea. Meddelelser fra DanmarksFiskeri- og Havundersogelser, 2: 1-204.