Embed Size (px)
Citation preview

A Problem of the First Order
There’s the old story of the man looking for his glasses. His wife asks him why he’s looking in the kitchen when she last saw them in the den. “There’s more light in here,” he replies. In our laziness, we humans tend to solve problems by choosing the path of least resistance, even if it’s less likely to work. Investors are no different: they tend to look for “first-order”
indicators, simple shorthand bits of data that are easy to pluck out of a complex world. Trouble is, these bits are often flawed. Price-to-earnings (p/e) ratios are a good example. The humble and ubiquitous p/e, a fraction solved by dividing the price by the earnings, fails due to its very simplicity. The idea of comparing Coca-Cola (KO) and Pepsico (PEP) based on p/e ratios looks like a good idea. Until you realize that those two companies are in completely different businesses. Despite that familiar expression to denote sameness - “it’s like Coke and Pepsi” - half of PEP is the snack division Frito-Lay, while KO makes only beverages:
THE BERMAN VALUE FOLIO A Trefis Interactive Portfolio Report
Volume 1 Number 5 April 2012
James Berman
James Berman, the president and founder of JBGlobal.com LLC, a registered investment advi-
sory firm (SEC registered), specializes in asset management for high-net-worth individuals and
trusts. Mr. Berman is a faculty member in the Finance Department of NYU SCPS. He has ap-
peared on CNBC and the Fox Business Channel and has been quoted and published in a vari-
ety of publications, including Barron's, Fortune, Bloomberg, The Huffington Post and CNN Mon-
ey. Mr. Berman holds a B.A., Magna Cum Laude, Phi Beta Kappa, in English & American Liter-
ature from Harvard and a J.D. from Harvard Law School.
CONTENTS A Problem of the First Order 1
New Holding: UTX 4
The Opportunity: UTX 5 Company Highlights 6 Heinz (HNZ) 6 ADP (ADP) 7 Wal-Mart (WMT) 8 UPS (UPS) 9 The Berman Value Folio 10

2
Beverages and snacks are businesses with starkly different margin and growth dynamics. Sizing up two separate companies with cookie-cutter ratios is a little like comparing a parcel of land in Manhattan with one in Des Moines by dollars-per-square-foot. Treating Coke and Pepsi as true “comps” — respective benchmarks for comparative valuation — just doesn’t work. But that’s exactly what most people do when they pick stocks.
If Coke and Pepsi aren’t true comps, then what two companies could be? If no two companies are precisely alike, how can p/e ratios identify the better bargain? This doesn’t mean you can’t learn a lot from contrasting one business with another, but it does mean that ratio analysis is unlikely to give you a real bead on value. Discounted cash flow valuation (DCF), in contrast, assesses each business individually. By adjusting expected future cash flows for the time value of money and the risk of investment, a DCF analysis is able to tell if a KO or a PEP is valuable, by itself — and on its own standalone terms. If DCF analysis is so superior, why do people rely on half-baked tidbits like p/e ratios? Because it’s easier. DCF analysis involves hundreds of inputs and myriad assumptions, any one of which, if wrong, can throw off the final result. It’s a complex recipe with numerous ingredients and elaborate preparation. Using p/e ratios is more like slapping together a peanut butter sandwich: sloppy, simplistic and unlikely to win any prizes. Given DCF’s complexity, there’s plenty to be wary of there too. Trefis uses DCF analysis to value stocks, but that valuation is only as good as the inputs. As the old saying goes: garbage in, garbage out. I think Trefis does an excellent job of vetting their own assumptions for realism and accuracy, but it’s always best to tweak the assumptions yourself to establish a range of values.
And don’t fall for the trap of false precision. As Buffett says, it’s better to be approximately right than precisely wrong. No one number can give you an exact solution to anything. Think of a DCF result as only the starting point for a valuation range, not a precise figure.
The Trefis Dow
Ticker
Trefis
Market Price Price
IBM 219.00 207.45
CVX 109.00 103.62
CAT 108.00 108.41
UTX 102.00 81.24
MCD 99.19 97.11
MMM 97.11 87.45
XOM 93.22 85.45
BA 90.91 74.09
WMT 72.53 61.87
JNJ 72.45 64.22
PG 71.56 67.02
KO 70.65 73.95
TRV 63.13 59.99
DD 58.98 53.40
DIS 52.15 42.68
AXP 51.25 58.18
HD 49.36 52.03
VZ 41.89 37.74
KFT 41.83 38.48
MRK 41.15 38.51
JPM 39.00 43.90
HPQ 38.80 24.72
MSFT 37.70 31.44
T 33.97 30.89
INTC 30.52 28.47
PFE 25.11 22.31
CSCO 23.37 20.08
GE 19.97 19.34
AA 12.04 9.99
BAC 8.55 8.92
Raw Sum 1874.39 1732.95
Dow Divisor 0.132129493 0.132129493
DOW
Trefis Market
Price Price
14,186 13,116 Undervalua-tion
8.2%
The Trefis Price for the
Dow is now 14,186, 8.2%
above the market price.

3
By way of example, let’s take the newest addition to the portfolio: Johnson & Johnson (JNJ). It could be tempting to get an idea of JNJ’s intrinsic value by comparing its p/e ratio to other pharmaceutical companies, but that would assume JNJ has true comps which it really doesn't. It would be natural to assume that Merck (MRK) or Pfizer (PFE), as clear competitors, would be the natural comparisons.
But the superficial likenesses are misleading, as a couple of Trefis diagrams make clear. PFE is a true pharma company with traditional drugs comprising the bulk of company value. A pending divestiture of its infant formula product line will leave PFE an unadulterated pharma play. JNJ is a different beast: Rx drugs represent only a third of the value, while medical devices make up half and consumer
OTC products the rest.
While both in the drug business, PFE and JNJ are clearly going to have very different business characteristics. Profitability, growth rates, regulatory risks and cost of capital all will vary with such different product mixes. While JNJ has an average 5-yr operating margin of 25%, for example, PFE’s is only 19%. Pure pharma used to be more profitable than the consumer and device categories but patent expirations have dented margins dramatically. JNJ’s comparative diversification has cushioned it from these headwinds.
To treat these two companies as peers — which nearly all financial sites do — is a real mistake. They’re no more peers than Coke and Pepsi, or countless other stocks that are improperly coupled. PFE’s forward p/e of 9x may look like a steal compared to JNJ’s 12x until you know that the businesses are so different. Ratios won’t tell you, but JNJ could be a much better deal. You have no way to spot better investment opportunities without DCF analysis. In this case, DCF analysis shows they’re both trading at similar discounts to intrinsic value. PFE is no better a deal than JNJ.

4
New Holding: UTX
This month, I added United Technologies (UTX) to the portfolio and bought it in my Fund. UTX is an extraordinary company in three very ordinary businesses: elevators, HVAC systems and aircraft engines.
The elevator business is not glamorous, but it is profitable. The high margins stem from UTX’s dominant market share of 24.5%. Their Otis division manufactures roughly a quarter of global elevators:
Having a quarter of the elevator market in a world where emerging markets are urbanizing and densely populated countries must build upwards is a good thing. Urbanization means verticalization, especially in countries like China where cities must literally build upwards to accommodate growth.
Access interactive Trefis
analysis to get the most
from TBVF
*Test our assumptions *Run your own scenarios *Read forecast rationale *Access Trefis research *Analyze company value

5
The Opportunity: UTX
When I think of less obvious ways to take advantage of Asia’s growth, I think of UTX. There are conventional ways, such as Chinese search engines, fast food chains, and retail stores. But the price of these ideas often all-too-well reflects the opportunity. Baidu (BIDU), for example, is overvalued by any rational measure, including DCF analysis. Underappreciated is the secular trend in China’s tall building construction. It will render U.S. cities small towns by comparison. When you think about it, a skyscraper is really the convergence of several inexorable trends: urban density, economic growth, and the knowledge-based workplace. China is the lynchpin of all these phenomena. When a building goes higher, that means more expensive, efficient and faster elevators. Much of the time, that means Otis. In one of the few true examples of conglomerate synergy, UTX also owns Carrier, one of the world’s largest providers of HVAC systems (heating, ventilation and air conditioning systems), an important component of any tall building. UTX also owns a fire & security division to service major real estate projects. If you’re building a skyscraper, you’re likely to hire UTX. UTX provides one-stop shopping for all the major high-end components of building infrastructure. And UTX has large exposure to emerging markets, with 20% of revenues derived from faster-growing economies like China and India. If you believe, as I do, that the future growth rate for urban development is likely underestimated, then UTX may be even more valuable. For example, Trefis estimates a 3.2% annualized rate over the six year forecast period, with the global market for elevators rising from $53 to $64 billion: Even at this relatively conservative growth rate, UTX is 20% undervalued at $81/share. As a larger proportion of UTX’s growth comes from emerging Asia, growth rates should move marginally higher. If growth rates were to surprise to the upside, UTX’s true value per share is closer to $110. Either way, UTX is likely to deliver a more than satisfactory return.
6
Company Highlights
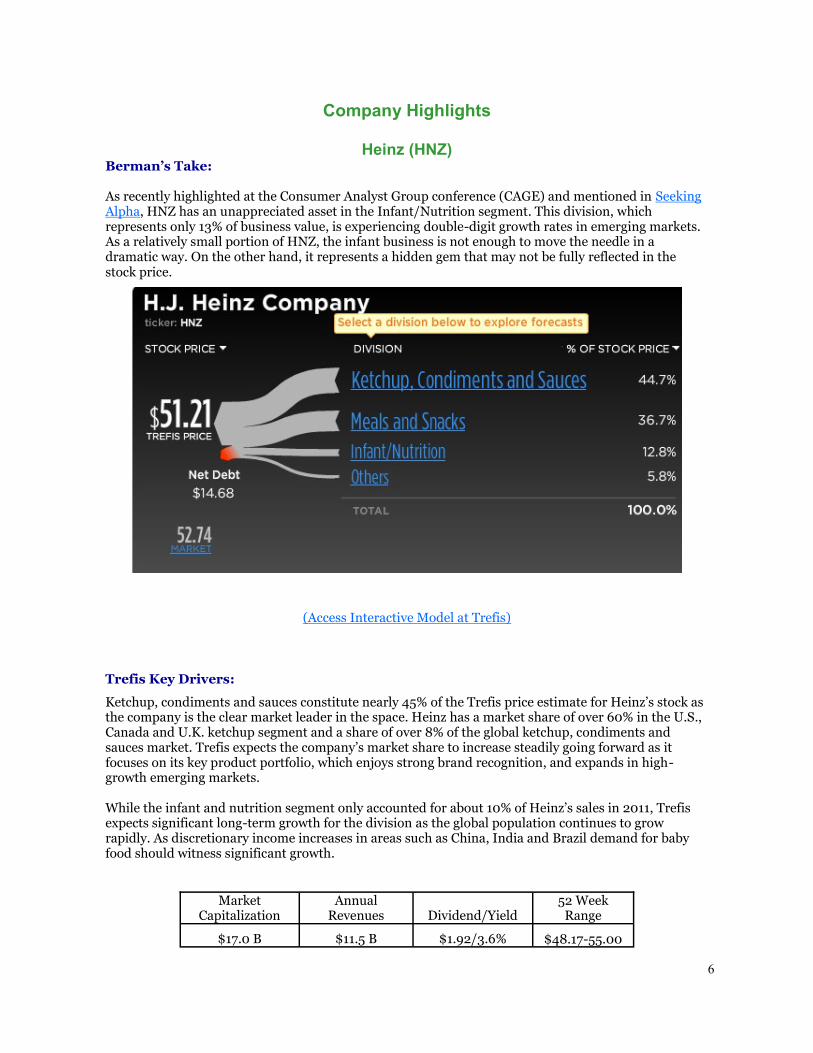
Heinz (HNZ) Berman’s Take: As recently highlighted at the Consumer Analyst Group conference (CAGE) and mentioned in Seeking Alpha, HNZ has an unappreciated asset in the Infant/Nutrition segment. This division, which represents only 13% of business value, is experiencing double-digit growth rates in emerging markets. As a relatively small portion of HNZ, the infant business is not enough to move the needle in a dramatic way. On the other hand, it represents a hidden gem that may not be fully reflected in the stock price.
(Access Interactive Model at Trefis)
Trefis Key Drivers:
Ketchup, condiments and sauces constitute nearly 45% of the Trefis price estimate for Heinz’s stock as the company is the clear market leader in the space. Heinz has a market share of over 60% in the U.S., Canada and U.K. ketchup segment and a share of over 8% of the global ketchup, condiments and sauces market. Trefis expects the company’s market share to increase steadily going forward as it focuses on its key product portfolio, which enjoys strong brand recognition, and expands in high-growth emerging markets. While the infant and nutrition segment only accounted for about 10% of Heinz’s sales in 2011, Trefis expects significant long-term growth for the division as the global population continues to grow rapidly. As discretionary income increases in areas such as China, India and Brazil demand for baby food should witness significant growth.
Market Capitalization
Annual Revenues Dividend/Yield
52 Week Range
$17.0 B $11.5 B $1.92/3.6% $48.17-55.00

7
Company Highlights
ADP (ADP) Berman’s Take: ADP and Paychex (PAYX) hold a virtual duopoly in payroll processing. Despite other players like Intuit, ADP has the largest market share, processing checks for one in six U.S. employees. ADP is one of the few stocks that can do well in a rising interest rate environment, given the “float” or payroll tax proceeds it holds temporarily before remitting to the tax authorities. ADP invests this float in short-term securities. The low rate environment has reduced interest from float. But as rates rise, so will float proceeds.
(Access Interactive Model at Trefis)
Trefis Key Drivers:
ADP has a significant opportunity in the international payroll processing business, as it currently generates less than 25% of its payroll processing revenues from international accounts. Not only is there significant growth in employment in economies such as India and China, but there are many developed markets which ADP has not penetrated. While the company faces strong competition from Paychex, Trefis expects that it will be able to make significant long-term inroads in many international markets. Along with an eventual normalization of interest rates, Trefis expects that ADP’s total client funds should increase steadily over the long-term as economic conditions and employment figures recover. This should allow for a significant boost to interest on client funds.
Market Capitalization
Annual Revenues Dividend/Yield
52 Week Range
$26.8 B $9.9 B $1.58/2.8% $44.72.-57.10

8
Company Highlights
Wal-Mart (WMT) Berman’s Take: In the wake of Best Buy’s (BBY) high-profile store closings, it’s worth asking if the brick ’n mortar model, even for big box chains like WMT, is finally dead. BBY’s problems stem from Amazon’s (AMZN) dominance of the U.S. retail market in goods like electronics — and the unrelenting pricing pressure AMZN brings to bear on competitors. Could WMT soon be a victim as well? I continue to think that WMT is one of the few companies with the requisite scale to challenge AMZN — and that WMT’s cheap price already reflects these concerns.
(Access Interactive Model at Trefis)
Trefis Key Drivers:
While there has been significant pressure on big box retailers domestically as a result of online competition, Trefis expects that Wal-Mart’s international store count will increase at a rate of more than 5% annually throughout its forecast period. Consumers in many high-growth geographies remain relatively cost-conscious, and Wal-Mart’s low-price advantage relative to smaller competitors should result in substantial demand for new stores in these markets.
Wal-Mart’s U.S. stores account for about 53% of the Trefis price estimate for the company’s stock. Slow but steady growth in the saturated U.S. market should allow the company’s U.S. division to remain its most valuable despite being outpaced by international growth. Trefis expects that its scale and low-cost model should enable it to withstand the pressure that most physical retailers are currently facing.
Market Capitalization
Annual Revenues Dividend/Yield
52 Week Range
$210.2 B $447.0 B $1.59/2.4% $48.31-62.63

9
Company Highlights
UPS (UPS) Berman’s Take: UPS (UPS) has reached an agreement to a buy TNT Express, a large European shipping and logistics operation, for $6.8 billion, a hefty 54% premium to the share price. The purchase will push foreign revenues to 36% of the total. Regulatory approval is still required to bless the deal. The combined firm will dwarf competitors FedEx and DHL in scale and give UPS a major advantage in Europe and emerg-ing Asia. The purchase is expensive, however, and could dent long-term dividend growth. The onus will be on UPS management to cut costs and justify the large price tag.
(Access Interactive Model at Trefis)
Trefis Key Drivers:
Not accounting for the TNT Express acquisition, U.S. domestic ground packages account for over 36%
of the Trefis valuation for UPS. Trefis expects steady long-term growth in total domestic ground pack-
age shipments, with an estimated total of more than 3 billion by 2014. The company’s 2010 expansion
of its Worldport air hub greatly expanded its capacity and improved shipping efficiency. This should
allow the company to keep prices competitive in spite of rising fuel costs.
While the supply chain business only constitutes 8.5% of the Trefis price estimate, there is significant
revenue potential as continued globalization is likely to lead to greater supply chain complexity. UPS’
services include transportation, distribution and information services, among others. As companies’
supply chains grow increasingly complex Trefis expects that more of these services will be outsourced.
Market Capitalization
Annual Revenues Dividend/Yield
52 Week Range
$76.6 B $53.1 B $2.28/2.7% $60.74-81.79
10
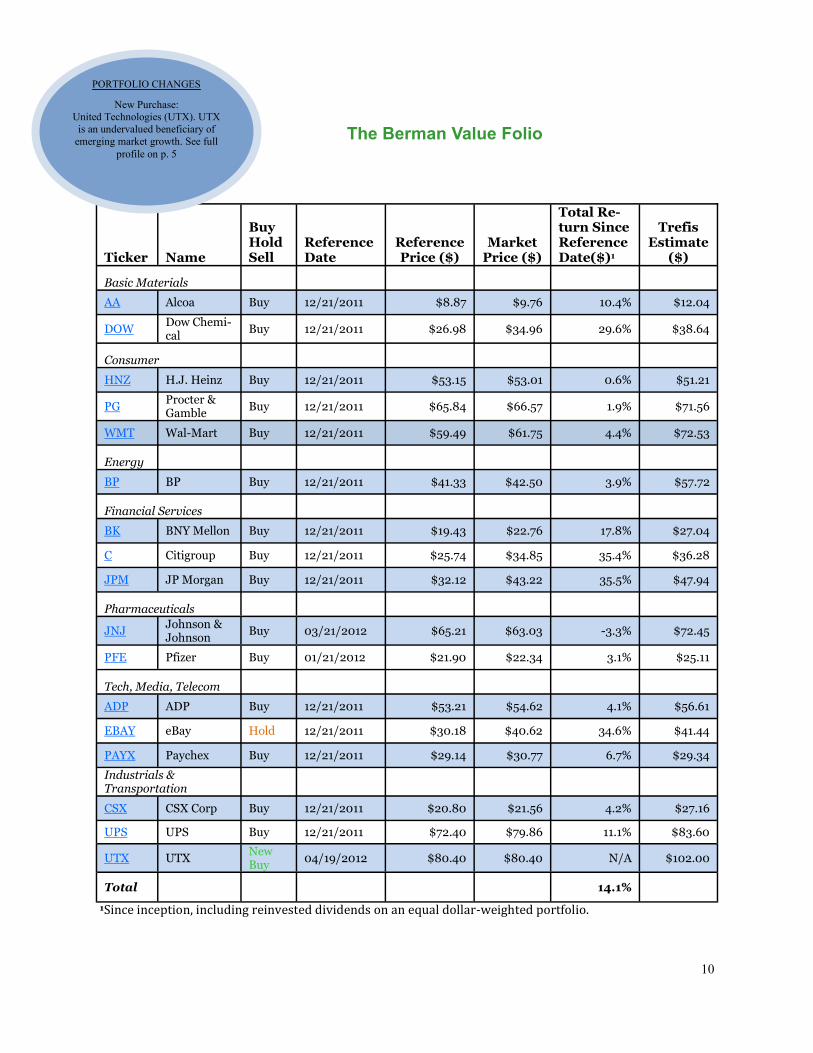
Ticker Name
Buy Hold Sell
Reference Date
Reference Price ($)
Market Price ($)
Total Re-turn Since Reference Date($)1
Trefis Estimate
($)
Basic Materials
AA Alcoa Buy 12/21/2011 $8.87 $9.76 10.4% $12.04
DOW Dow Chemi-cal
Buy 12/21/2011 $26.98 $34.96 29.6% $38.64
Consumer
HNZ H.J. Heinz Buy 12/21/2011 $53.15 $53.01 0.6% $51.21
PG Procter & Gamble
Buy 12/21/2011 $65.84 $66.57 1.9% $71.56
WMT Wal-Mart Buy 12/21/2011 $59.49 $61.75 4.4% $72.53
Energy
BP BP Buy 12/21/2011 $41.33 $42.50 3.9% $57.72
Financial Services
BK BNY Mellon Buy 12/21/2011 $19.43 $22.76 17.8% $27.04
C Citigroup Buy 12/21/2011 $25.74 $34.85 35.4% $36.28
JPM JP Morgan Buy 12/21/2011 $32.12 $43.22 35.5% $47.94
Pharmaceuticals
JNJ Johnson & Johnson
Buy 03/21/2012 $65.21 $63.03 -3.3% $72.45
PFE Pfizer Buy 01/21/2012 $21.90 $22.34 3.1% $25.11
Tech, Media, Telecom
ADP ADP Buy 12/21/2011 $53.21 $54.62 4.1% $56.61
EBAY eBay Hold 12/21/2011 $30.18 $40.62 34.6% $41.44
PAYX Paychex Buy 12/21/2011 $29.14 $30.77 6.7% $29.34
Industrials & Transportation
CSX CSX Corp Buy 12/21/2011 $20.80 $21.56 4.2% $27.16
UPS UPS Buy 12/21/2011 $72.40 $79.86 11.1% $83.60
UTX UTX New Buy
04/19/2012 $80.40 $80.40 N/A $102.00
Total 14.1%
1Since inception, including reinvested dividends on an equal dollar-weighted portfolio.
The Berman Value Folio
PORTFOLIO CHANGES
New Purchase:
United Technologies (UTX). UTX
is an undervalued beneficiary of
emerging market growth. See full
profile on p. 5

11
The Berman Value Folio (TBVF) is published monthly and provides information and investment ideas on stocks. All material in TBVF is copyright 2012 by Trefis and may not be reproduced in whole or in part in any form without written consent. TBVF is intended for experienced investors, who understand the risks, costs, mechanics and consequences of investing. None of the content in this newsletter is intended to be, nor should be interpreted as, a solicitation to buy or sell securities. The selection of portfolio stocks is based on rigorous fundamental analysis. There is, however, no assurance that these securities will produce profits.
Performance results are based on model portfolios and do not reflect actual trading. Actual performance will vary based on a variety of factors, including market conditions and trading costs. TBVF results may not reflect the impact that material economic and market factors might have had on the adviser's decision-making if the adviser were actually managing clients' money in this portfolio. TBVF contains stocks that are managed with a view towards capital appreciation. James Berman and JBGlobal.com may manage other portfolios with different strategies and returns that materially differ from TBVF results. TBVF model results do not reflect the deduction of any advisory fees, brokerage or other commissions, bid-ask spreads and any other expenses that a client would have paid or actually paid in a real portfolio. All return figures assume the reinvestment of all dividends. Returns quoted are for an equal dollar-weighted portfolio, where each holding is purchased in equal dollar weights. Past performance does not guarantee future results. Any forward-looking statement is inherently uncertain and cannot be relied upon as a statement of actual performance. Investment in stocks can result in serious loss. It should not be assumed that recommendations made in the future will be profitable or will equal the performance of the securities in this list.
Although all content is derived from data believed to be reliable, accuracy cannot be guaranteed. James Berman, JBGlobal.com LLC, Insight Guru Inc., Trefis, TBVF’s publisher and distributor(s) and their employees assume no liability whatsoever for any investment losses as a result of securities purchased on TBVF recommendations. TBVF is not intended to provide personalized investment advice. Readers and subscribers should consult their financial advisor before investment.
James Berman is an investor in Insight Guru Inc., the parent company of Trefis, both personally and through the venture fund he subadvises. Employees of TBVF, Insight Guru Inc., JBGlobal.com L.L.C. and Trefis may hold positions in some or all of the stocks mentioned here. James Berman and JBGlobal.com L.L.C. may hold positions in some or all of the stocks mentioned here, both personally and in the accounts and funds they manage for others. No compensation for recommending particular securities, services, or financial advisors is solicited or accepted. If you are unwilling or unable to abide by any conditions of this disclaimer, then you may obtain a refund for the unused portion of your subscription at any time.