Embed Size (px)
Citation preview

The Best Defense Is a Good Offense

Fundamentals
The Seasons for Growing
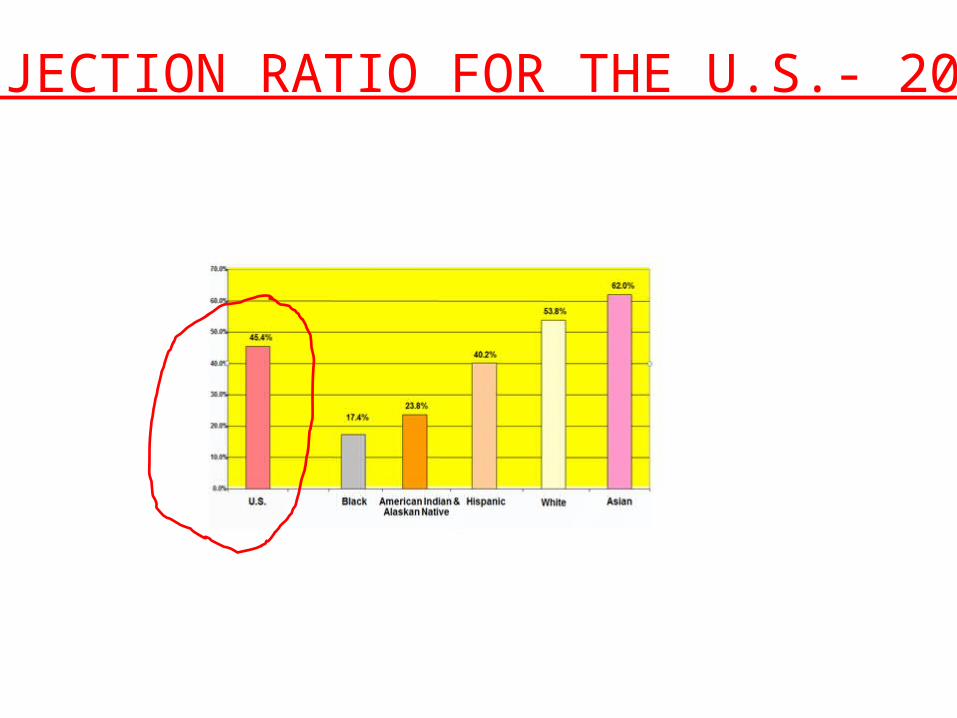
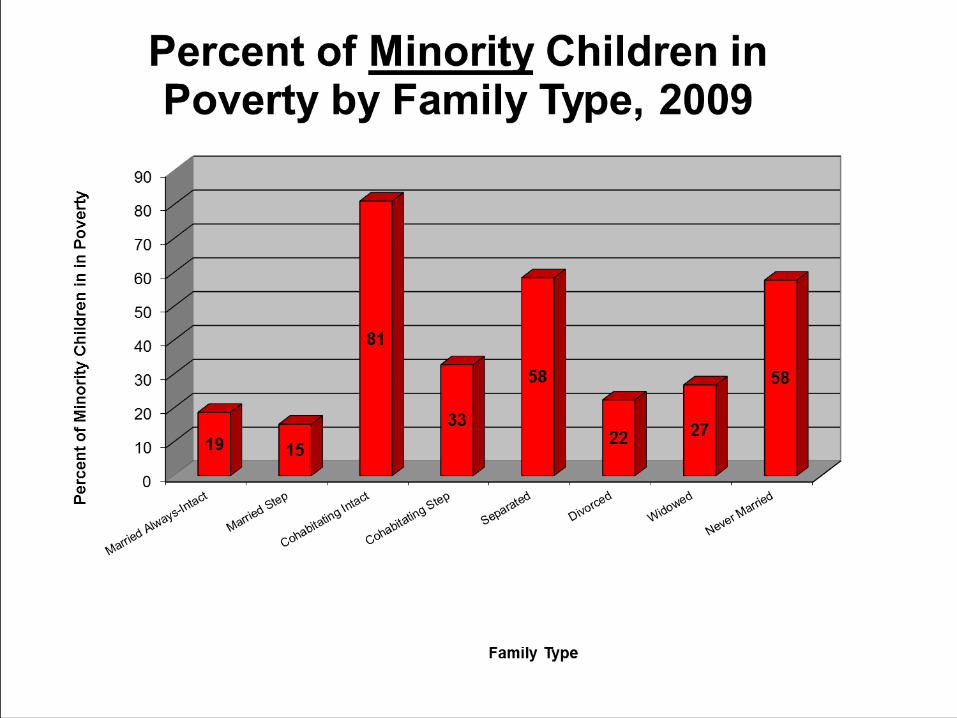
REJECTION RATIO FOR THE U.S.- 2010
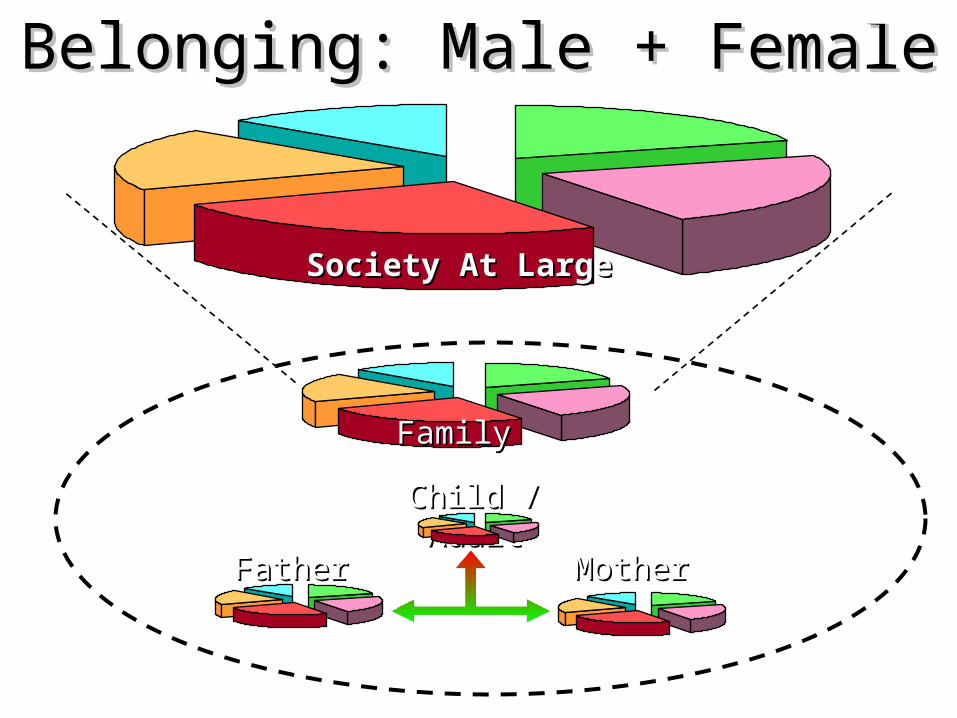
Belonging: Male + Female Belonging: Male + Female
FamilyFamily
Child / AdultChild / Adult
Father Father MotherMother
Society At LargeSociety At Large
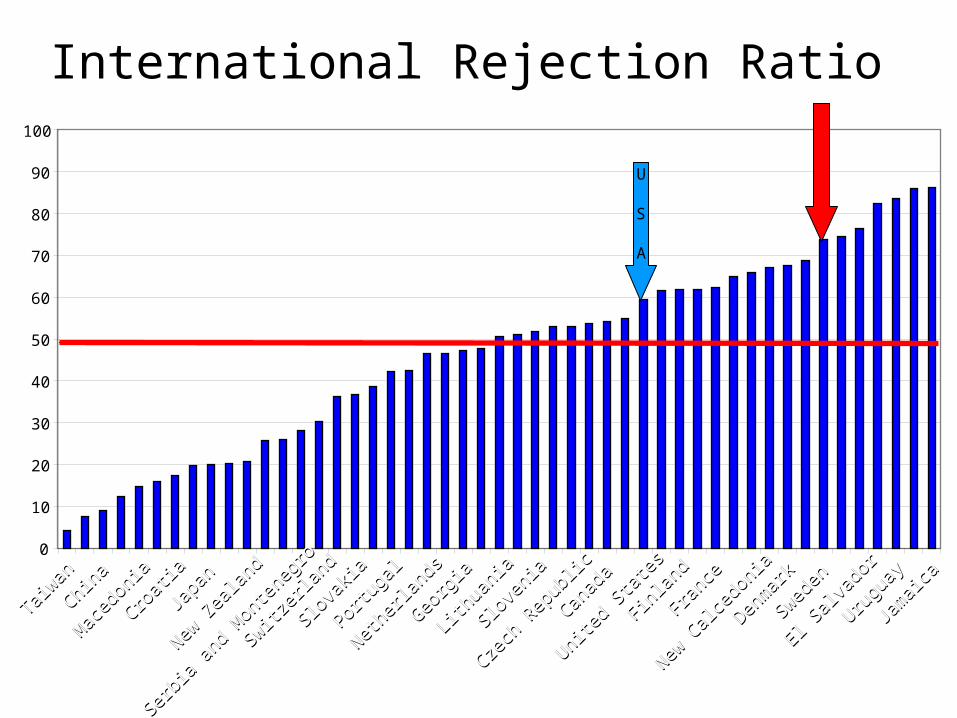
International Rejection Ratio
0
10
20
30
40
50
60
70
80
90
100
Taiwan
Taiwan
China
China
Mac
edon
ia
Mac
edon
ia
Croati
a
Croati
a
Japa
nJa
pan
New Z
ealan
d
New Z
ealan
d
Serbia
and M
onten
egro
Serbia
and M
onten
egro
Switzerl
and
Switzerl
and
Slova
kia
Slova
kia
Portu
gal
Portu
gal
Netherl
ands
Netherl
ands
Georg
ia
Georg
ia
Lithua
nia
Lithua
nia
Slove
nia
Slove
nia
Czech
Rep
ublic
Czech
Rep
ublic
Canad
a
Canad
a
United
Stat
es
United
Stat
es
Finlan
d
Finlan
d
France
France
New C
alced
onia
New C
alced
onia
Denmark
Denmark
Sweden
Sweden
El Salv
ador
El Salv
ador
Urugu
ay
Urugu
ay
Jamaic
a
Jamaic
a
U
S
A

$100
$27
$127
0
20
40
60
80
100
120
140
Com
para
tive
Inco
me
%
Average Unmarried Male Premium Average Married Male
Marriage Premium in Male Income
Source Antovics, K. & Town, R. Am Econ Review V 94, (2004) pp 317-321
+ =
Retreat from Marriage: Black Men (25-54)
by Education Level
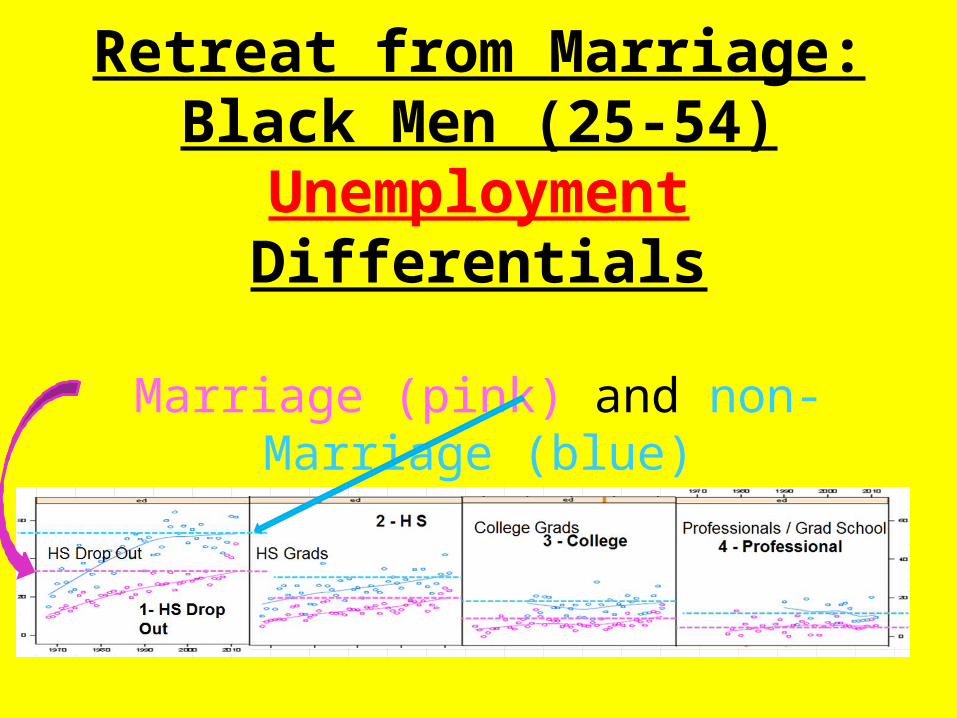
Retreat from Marriage:Black Men (25-54)
Unemployment Differentials
Marriage (pink) and non-Marriage (blue)
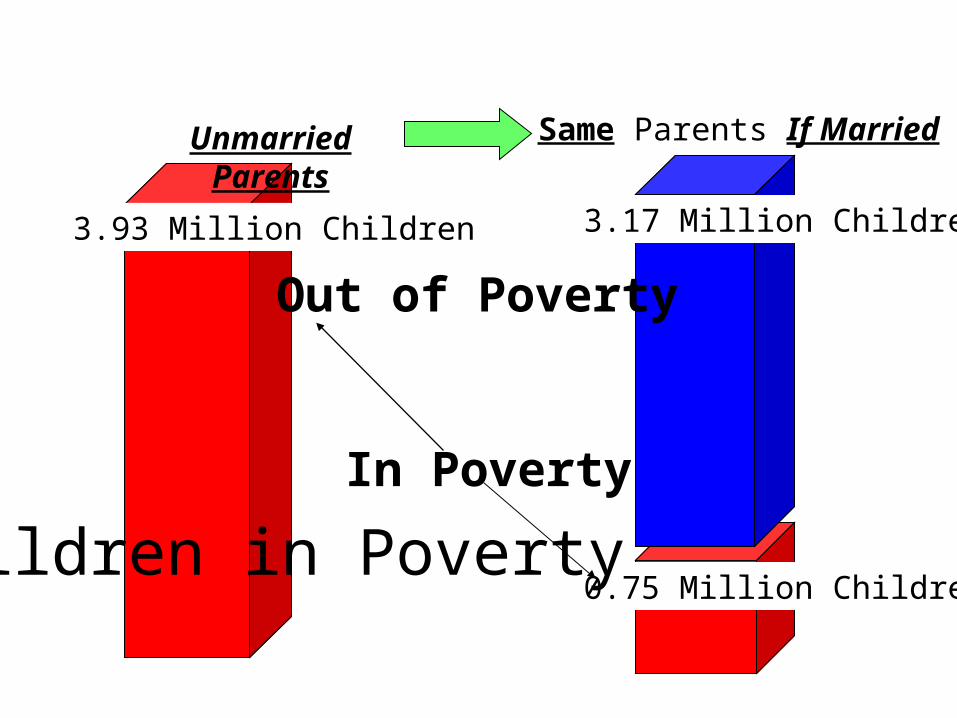
3.93 Million Children 3.17 Million Children
0.75 Million Children
Unmarried Parents Same Parents If Married
Source R Rector (Heritage Fdn) : Analysis of CPS 2001
Children in Poverty
In Poverty
Out of Poverty
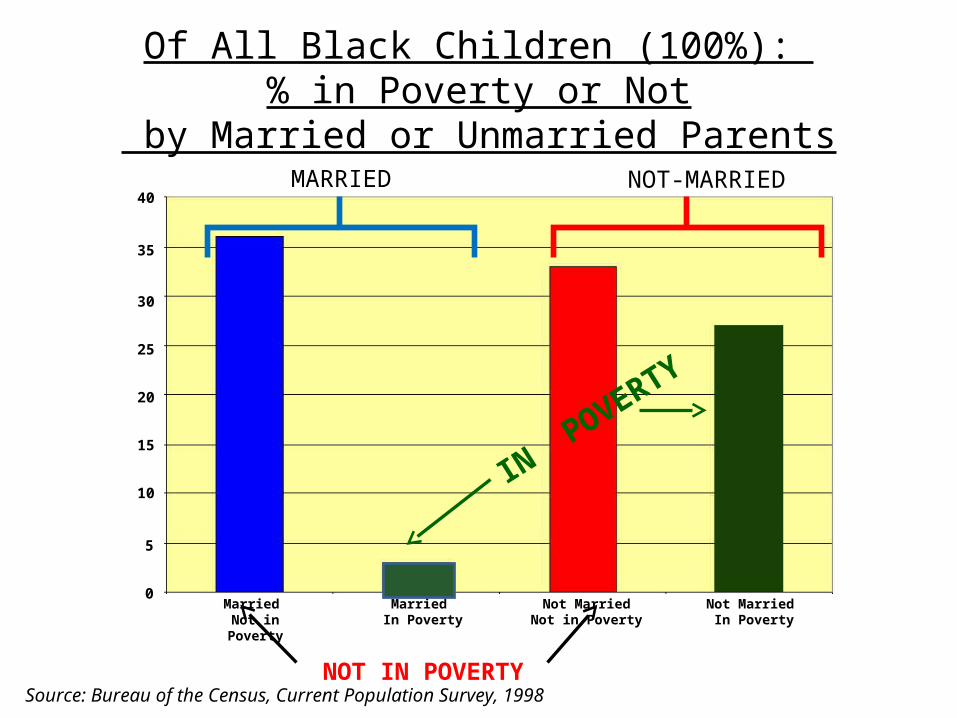
Of All Black Children (100%): % in Poverty or Not
by Married or Unmarried Parents
Married Not in Poverty
Married In Poverty
Not Married Not in Poverty
Source: Bureau of the Census, Current Population Survey, 1998
40
35
30
15
5
Not Married In Poverty
25
20
10
0
MARRIED NOT-MARRIED
IN POVERTY
NOT IN POVERTY
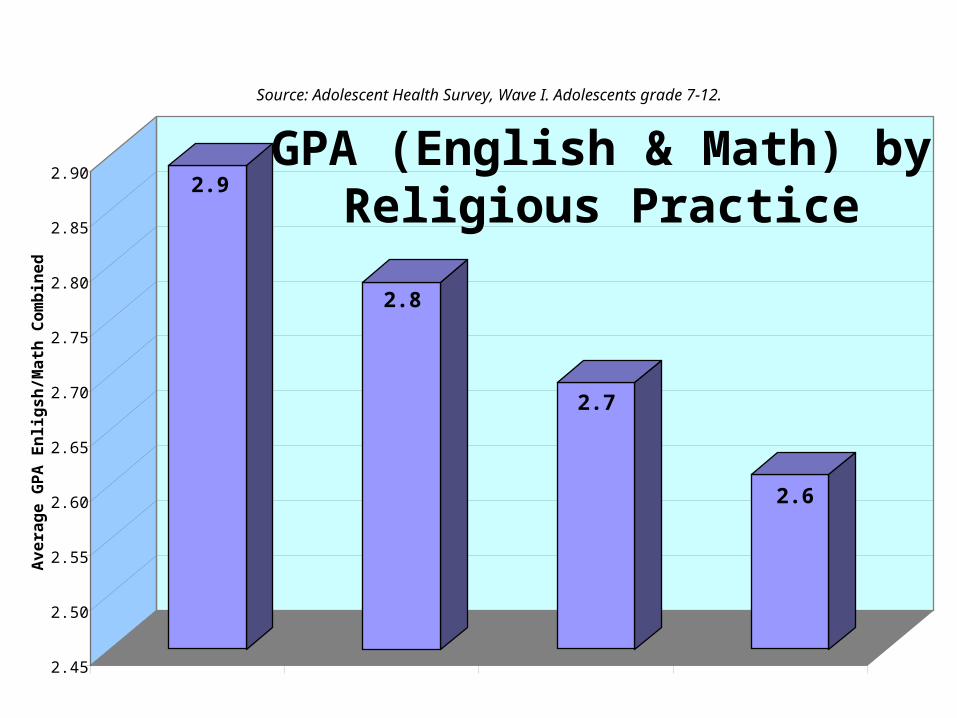
2.9
2.8
2.7
2.6
2.45
2.50
2.55
2.60
2.65
2.70
2.75
2.80
2.85
2.90
Aver
age
GPA
Enl
igsh
/Mat
h Co
mbi
ned
WEEKLY+ MONTHLY+ <MONTHLY NEVER
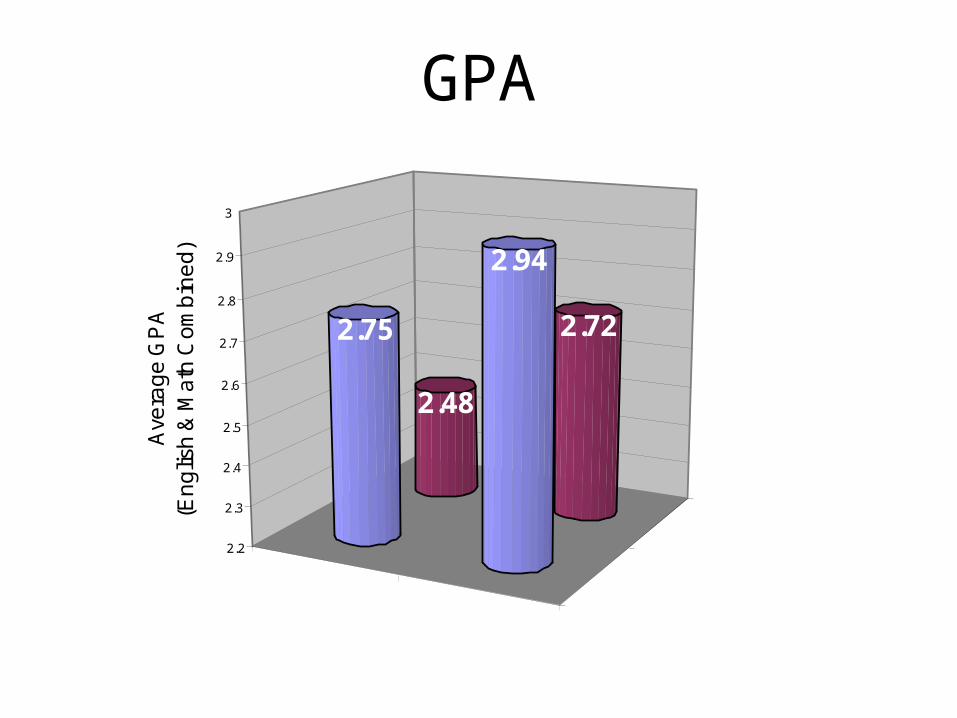
GPA (English & Math) by Religious Practice
Source: Adolescent Health Survey, Wave I. Adolescents grade 7-12.
<MONTHLY/NEVER
WEEKLY/MONTHLY+
INTACT/COHABIT(NATURAL)
ANY REJ ECTION
2.48
2.722.75
2.94
2.2
2.3
2.4
2.5
2.6
2.7
2.8
2.9
3
Ave
rag
e G
PA
(E
ng
lish
& M
ath
Co
mb
ine
d)
GPA
<MONTHLY/NEVER
WEEKLY/MONTHLY+
INTACT/COHABIT(NATURAL)
ANY REJ ECTION
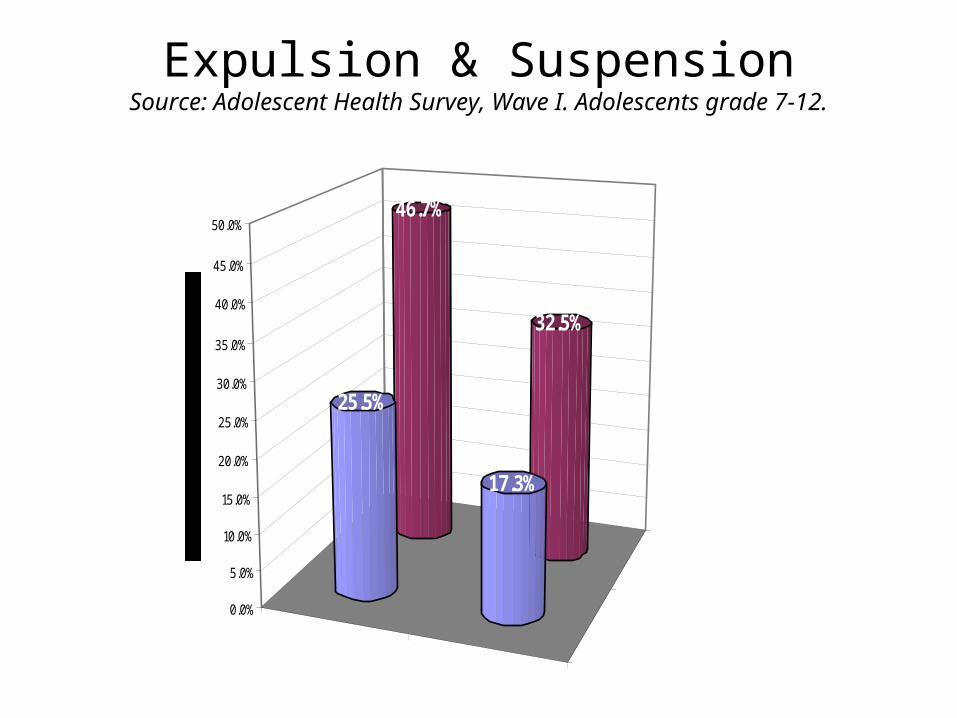
46.7%
32.5%
25.5%
17.3%
0.0%
5.0%
10.0%
15.0%
20.0%
25.0%
30.0%
35.0%
40.0%
45.0%
50.0%
Expulsion & SuspensionSource: Adolescent Health Survey, Wave I. Adolescents grade 7-12.
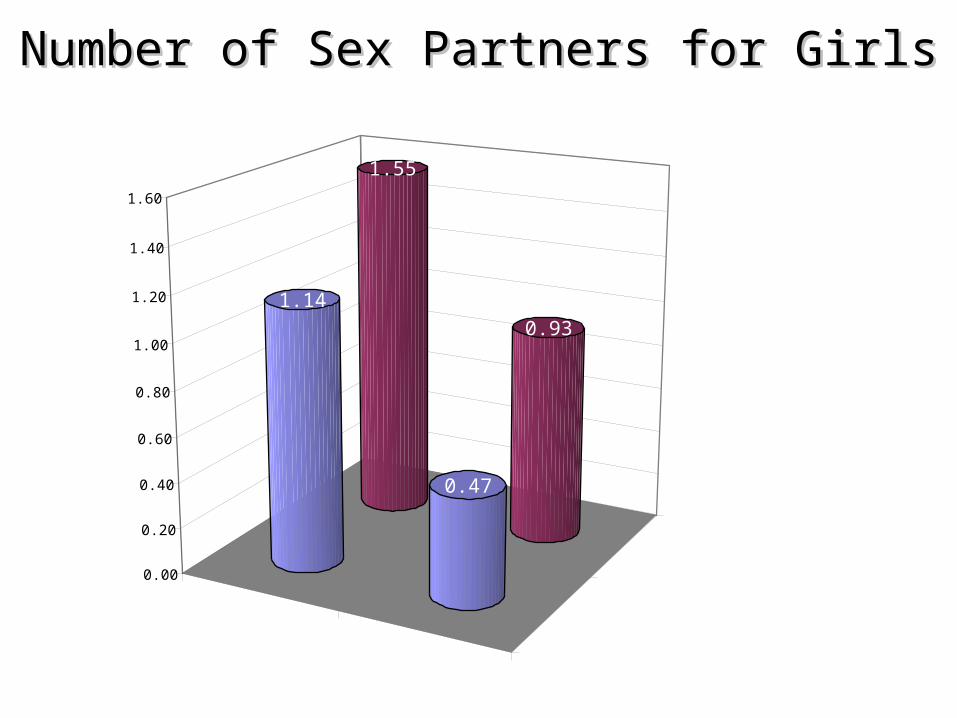
Number of Sex Partners for GirlsNumber of Sex Partners for Girls
<MONTHLY/NEVER
WEEKLY/MONTHLY+
INTACT/COHABIT(NATURAL)
ANY REJECTION
1.55
0.93
1.14
0.47
0.00
0.20
0.40
0.60
0.80
1.00
1.20
1.40
1.60
<MONTHLY/NEVER
WEEKLY/MONTHLY+
INTACT/COHABIT(NATURAL)
ANY REJECTION
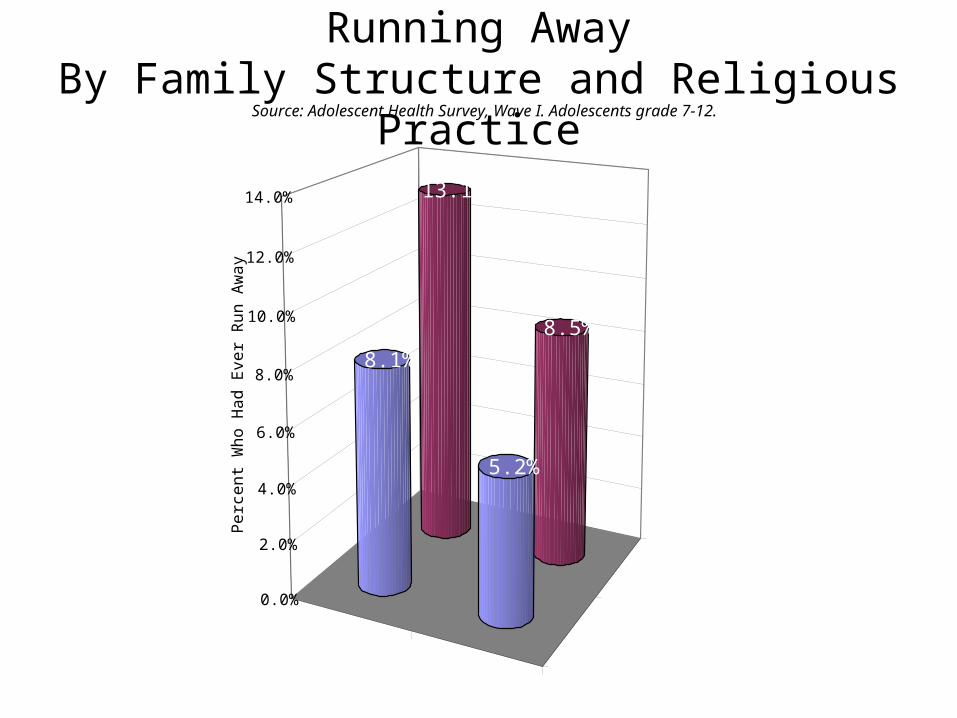
13.1%
8.5%
8.1%
5.2%
0.0%
2.0%
4.0%
6.0%
8.0%
10.0%
12.0%
14.0%
Pe
rce
nt
Wh
o H
ad
Eve
r R
un
Aw
ay
Running AwayBy Family Structure and Religious Practice
Source: Adolescent Health Survey, Wave I. Adolescents grade 7-12.
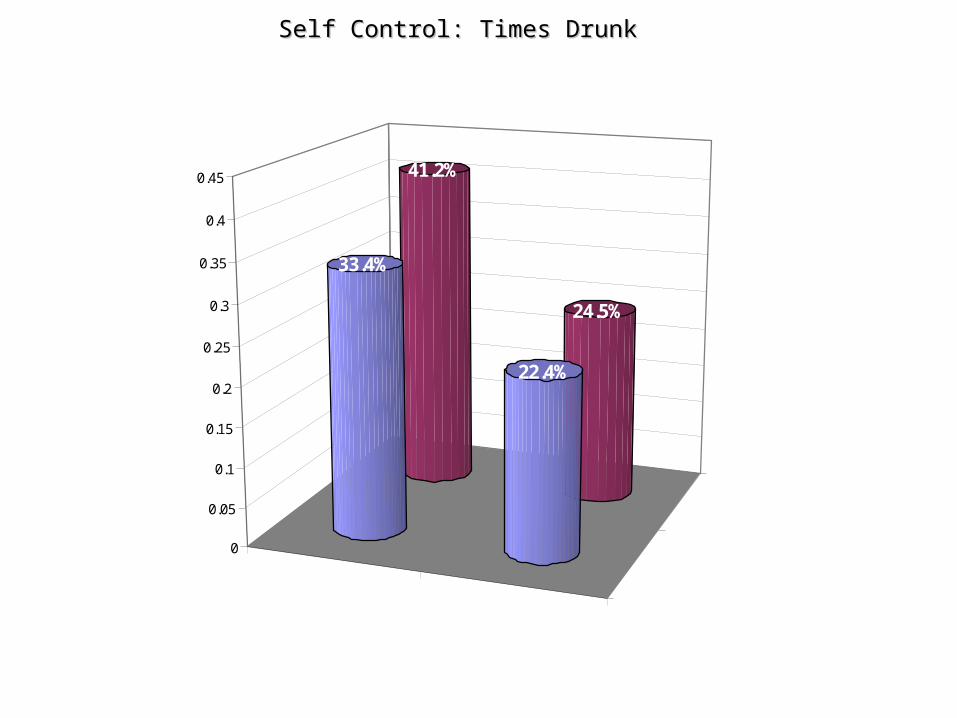
<MONTHLY/NEVER
WEEKLY/MONTHLY+
INTACT/COHABIT(NATURAL)
ANY REJECTION
41.2%
24.5%
33.4%
22.4%
0
0.05
0.1
0.15
0.2
0.25
0.3
0.35
0.4
0.45
Self Control: Times DrunkSelf Control: Times Drunk
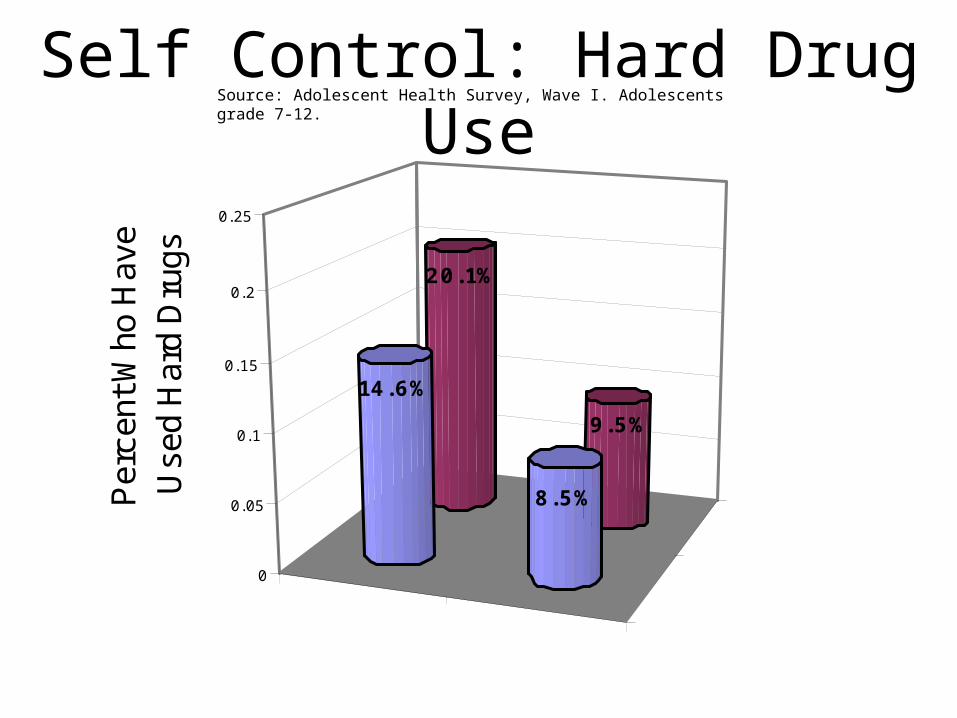
<MONTHLY/ NEVER
WEEKLY/ MONTHLY+
INT ACT / COHABIT (NAT URAL)
ANY RE J E CT ION
20.1%
9.5%
14.6%
8.5%
0
0.05
0.1
0.15
0.2
0.25
Per
cent
Who
Hav
e U
sed
Har
d D
rugs
Self Control: Hard Drug UseSource: Adolescent Health Survey, Wave I. Adolescents grade 7-12.

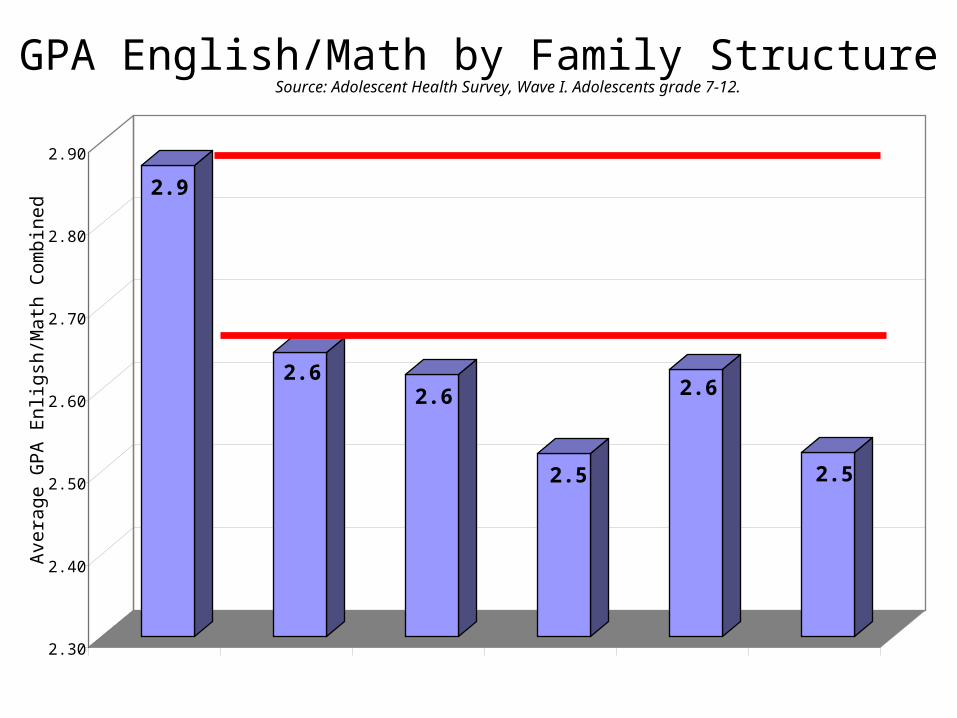
2.9
2.62.6
2.5
2.6
2.5
2.30
2.40
2.50
2.60
2.70
2.80
2.90
Aver
age
GPA
Enl
igsh
/Mat
h Co
mbi
ned
INTACT STEP COHABIT (BOTHNATURAL)
COHABIT (ONENATURAL)
DIVORCED NEVER MARRIED
GPA English/Math by Family StructureSource: Adolescent Health Survey, Wave I. Adolescents grade 7-12.
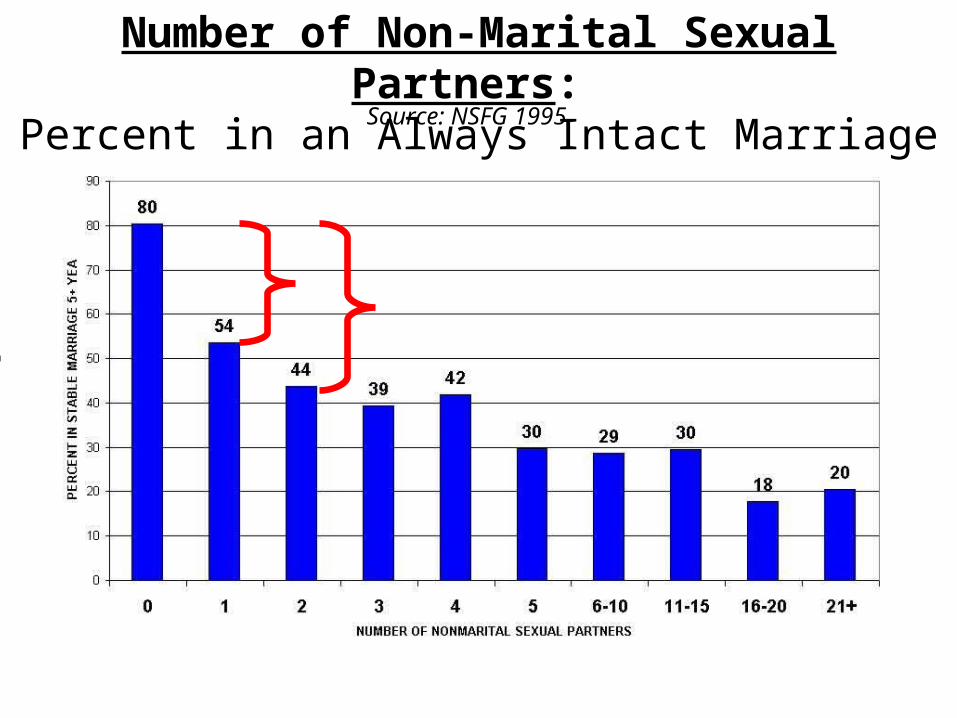
Number of Non-Marital Sexual Partners: Percent in an Always Intact Marriage
Source: NSFG 1995
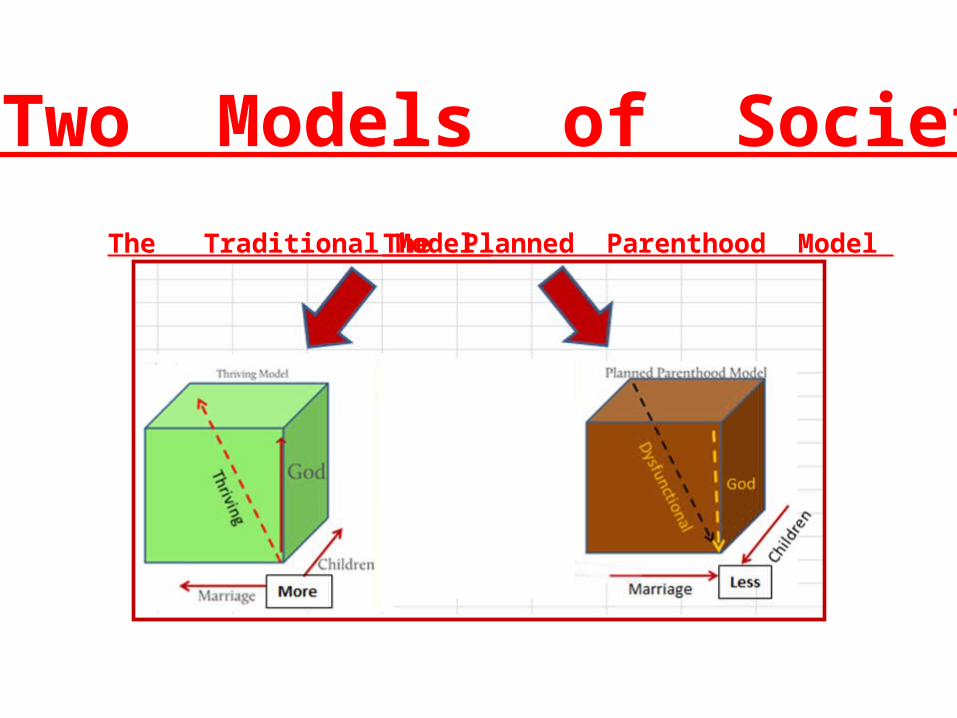
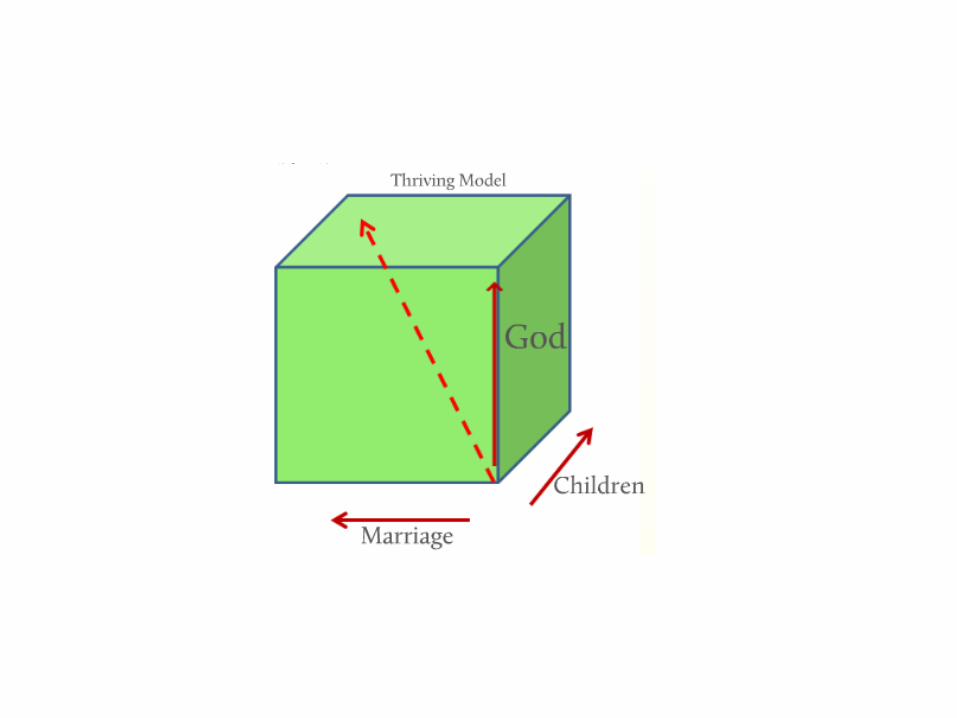
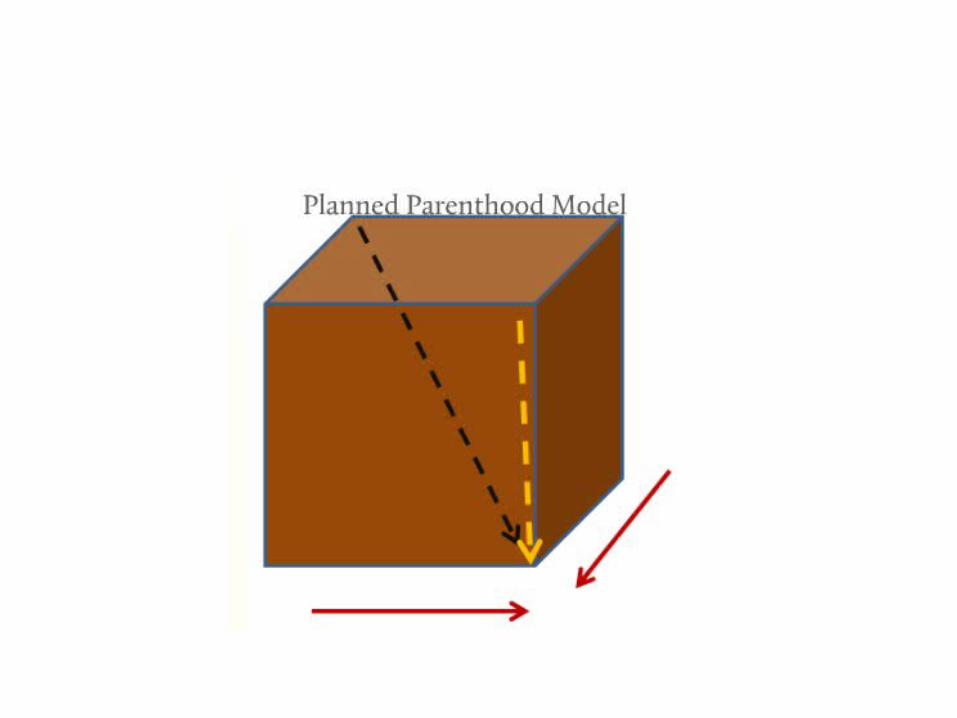
The Two Models of Society
The Traditional Model The Planned Parenthood Model
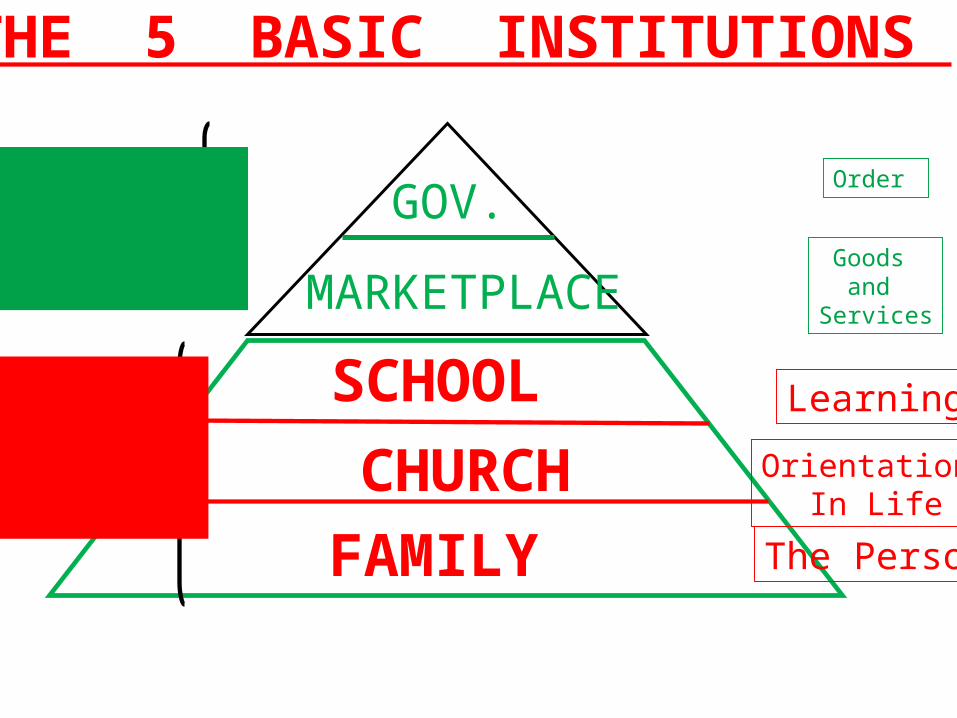
THE 5 BASIC INSTITUTIONS
Providing The
Instruments
FormingThe
Person
GOV.
MARKETPLACE
FAMILY
CHURCH
SCHOOL
Order
Goods and
Services
The Person
Orientation In Life
Learning
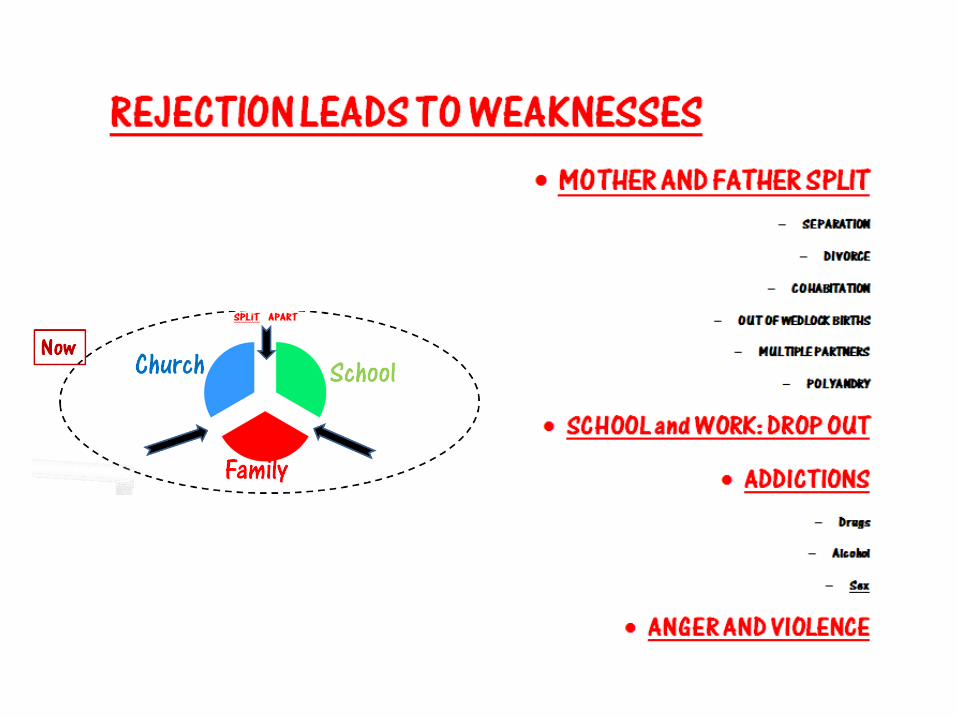
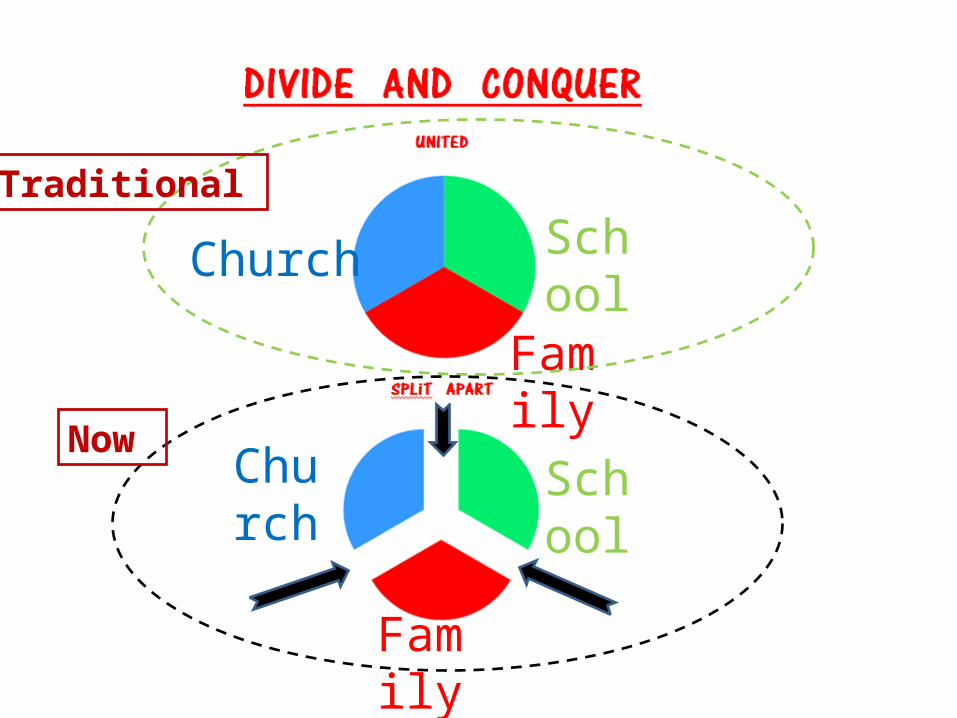
Church
Church
Family
Family
School
School
Traditional
Now
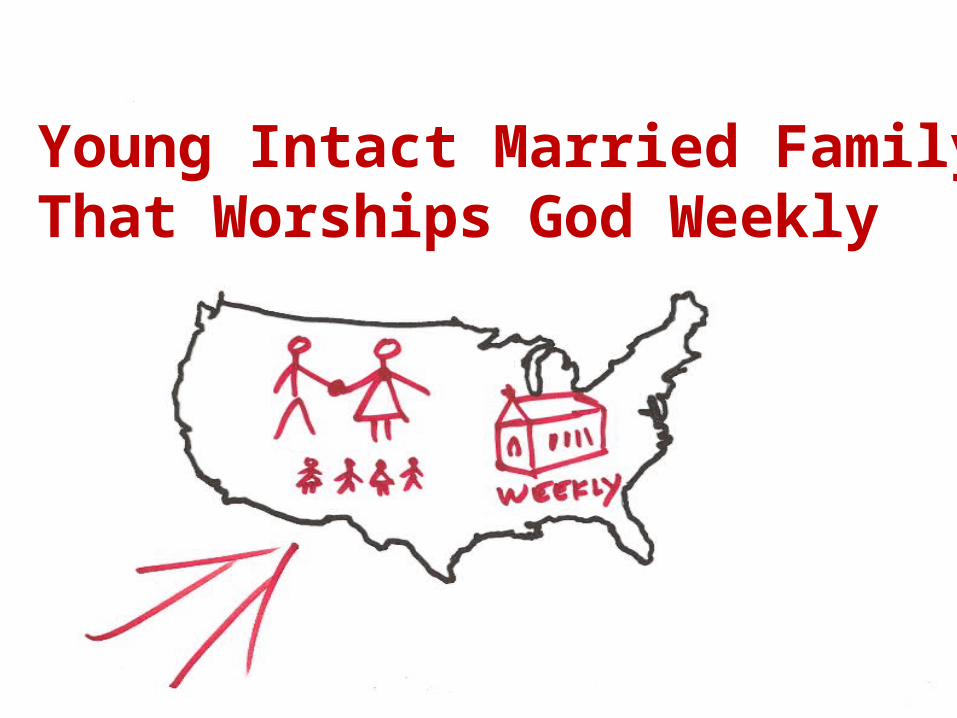
The Young Intact Married Family That Worships God Weekly

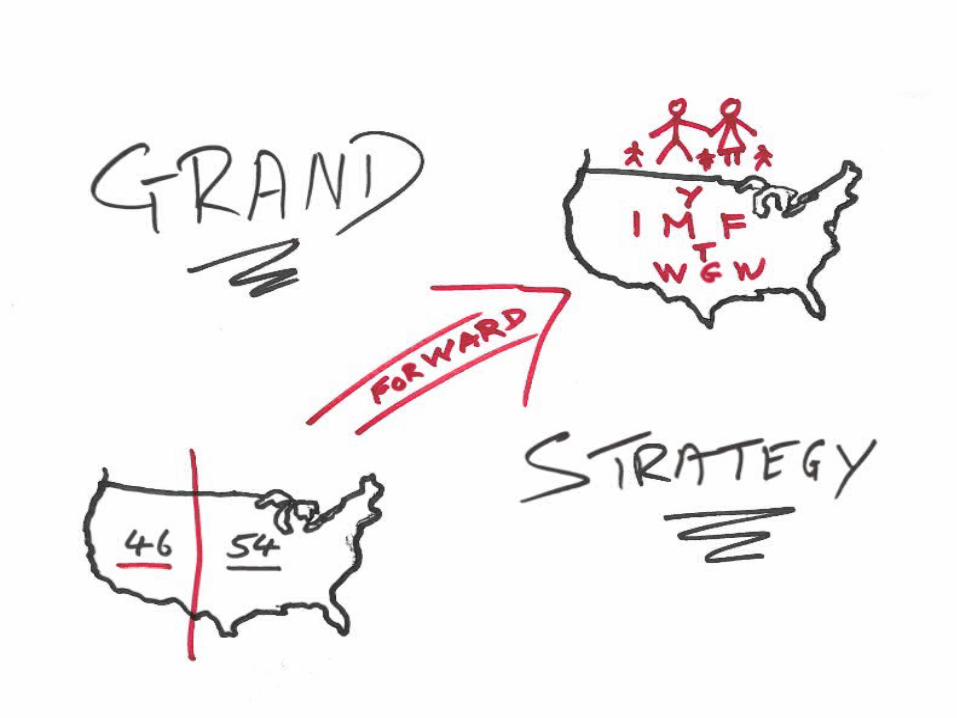
GRAND STRATEGY GROW
YOUNG INTACT MARRIED FAMILIES THAT
WORSHIP GOD WEEKLY
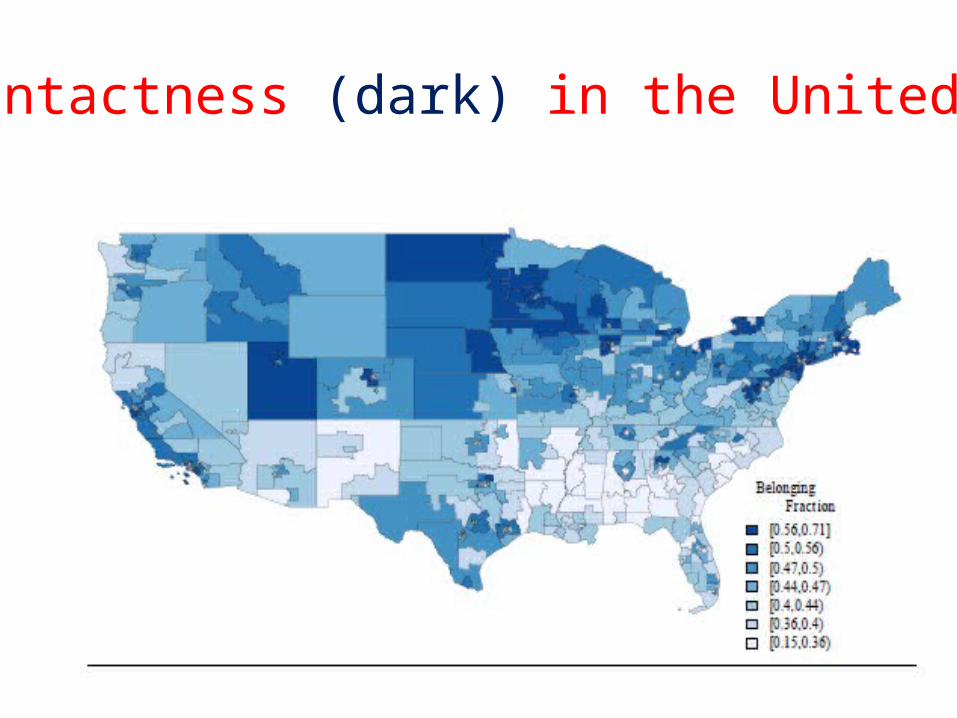
Family Intactness (dark) in the United States

EVERYTHING ELSE
FALLS IN PLACE

EVERYTHING

THIS THIS AND AND
LOTS MORE DATALOTS MORE DATAATAT
www.MARRI.us/Publications/PowerPoint

For questions, or to sign up for our research mailing list
(Used only to notify you about new research products)