Embed Size (px)
Citation preview
The Biobed® Advanced system is cheaper and more reliable
Biobed® SMART and Memthane®
Novel Reactors and their superior control
Lyon; November 27, 2012; 13:45 Jan Pereboom
2
Contents
1. Introduction
2. The Biobed® Advanced granular system
3. The Biobed® SMART reactor control system
4. The Memthane® AnMBR
5. Conclusions

Biothane: competence centre of Veolia Water
Veolia Water • Revenues 12.6 bln€; 69 countries; 97,000 employees (2011)
• Drinking water for 103 mln consumers; sewage of 73 mln inhabitants
Veolia Water Solutions and Technologies (VWS) • Contracting and equipment; 350 proprietary technologies
• Revenue 2.3 bln€; 135 business units; 10,800 employees
Biothane • World market leader for Anaerobic industrial wastewater treatment
• In 35 years more than 530 references were established
3 3
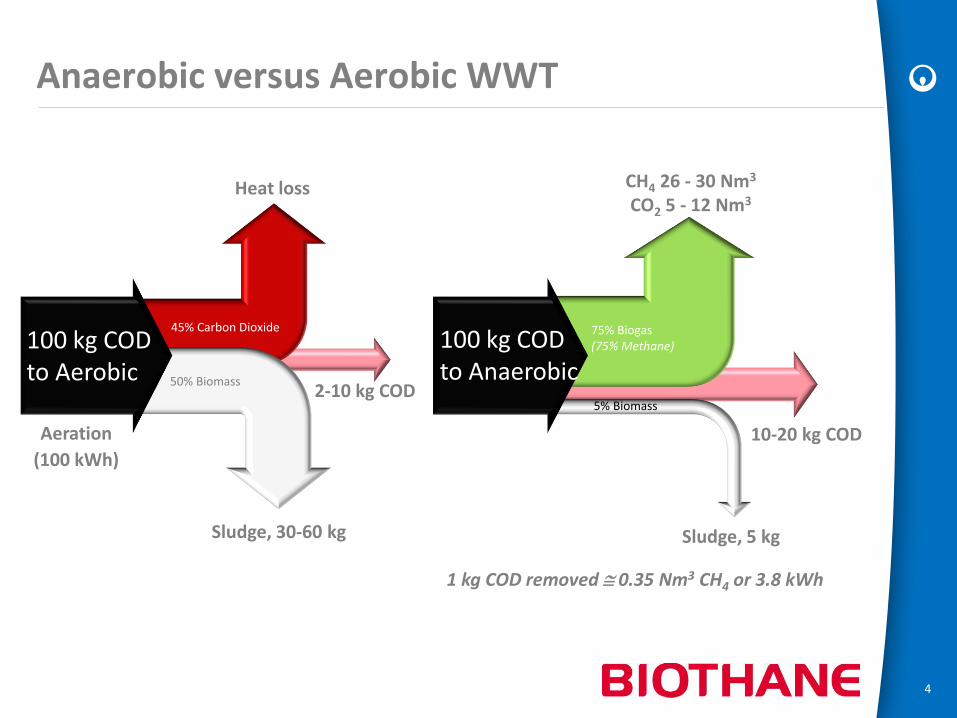
Anaerobic versus Aerobic WWT
45% Carbon Dioxide
50% Biomass
BOD Air (O2)
100 kg COD to Aerobic
BOD (25OC – 35OC)
75% Biogas (75% Methane)
5% Biomass
100 kg COD to Anaerobic
Aeration
(100 kWh)
Sludge, 30-60 kg
Heat loss
2-10 kg COD
CH4 26 - 30 Nm3 CO2 5 - 12 Nm3
Sludge, 5 kg
10-20 kg COD
1 kg COD removed 0.35 Nm3 CH4 or 3.8 kWh
4 4

Biothane’s Granular Technologies
Biobed® Advanced UASB or EGSB • Granular Sludge Bed
• Up to 30 kg COD/m3/d
Biobed® Modular Plant • Compact off-site construction
• 50 ~ 200 m3 reactor volume
• 0.5 ~ 4.0 tCOD/day
5 5
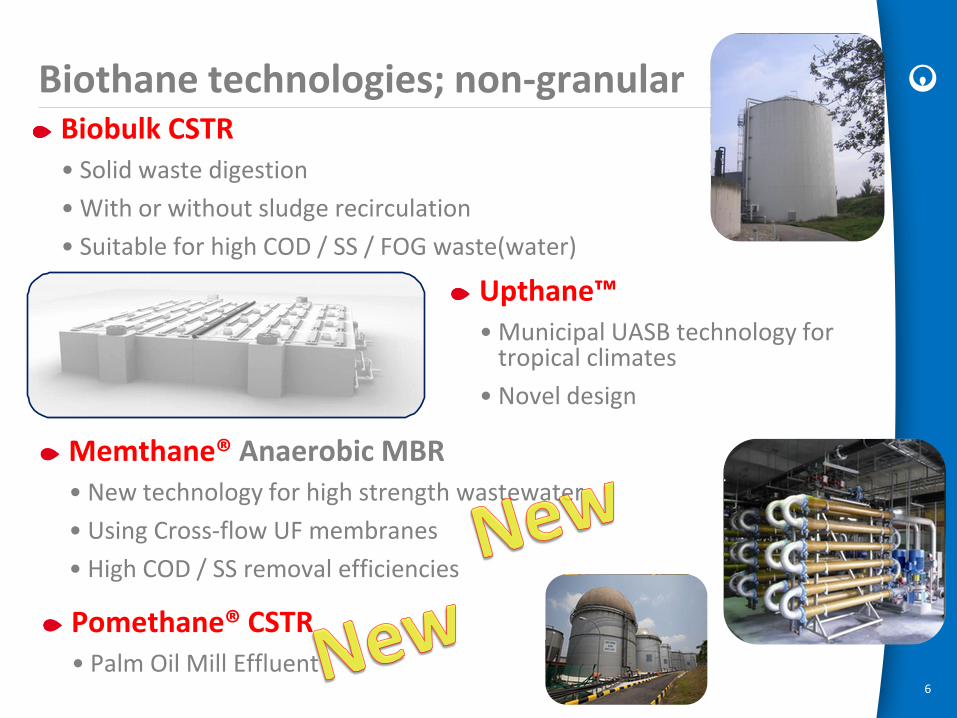
Biothane technologies; non-granular Biobulk CSTR • Solid waste digestion
• With or without sludge recirculation
• Suitable for high COD / SS / FOG waste(water)
6
Upthane™ • Municipal UASB technology for
tropical climates
• Novel design
Memthane® Anaerobic MBR • New technology for high strength wastewater
• Using Cross-flow UF membranes
• High COD / SS removal efficiencies
6
Pomethane® CSTR • Palm Oil Mill Effluent
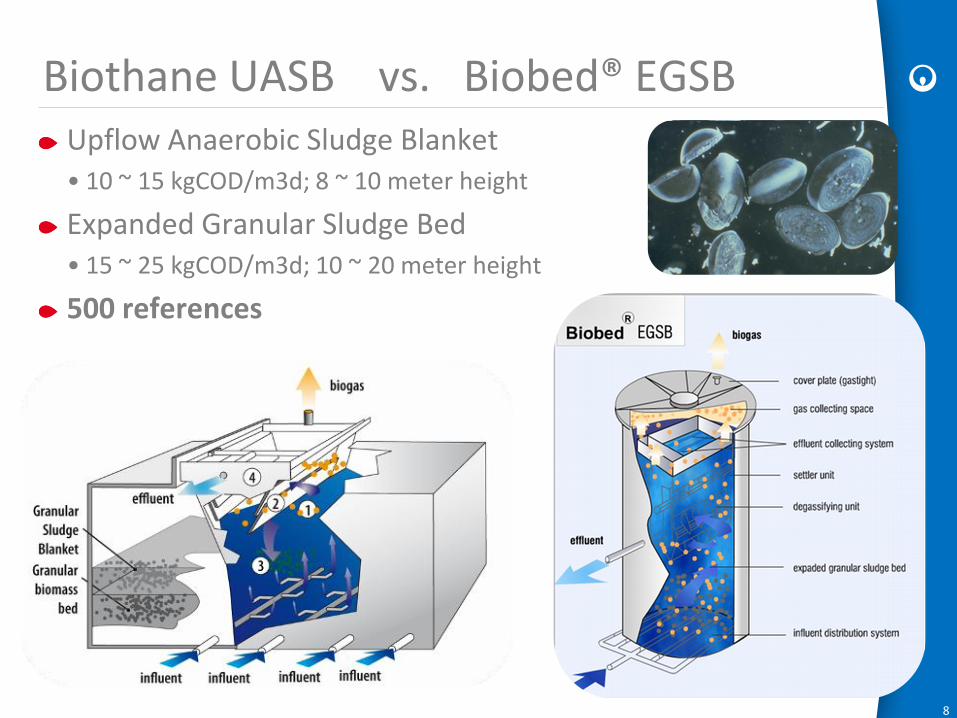
Biothane UASB vs. Biobed® EGSB
8
Upflow Anaerobic Sludge Blanket • 10 ~ 15 kgCOD/m3d; 8 ~ 10 meter height
Expanded Granular Sludge Bed • 15 ~ 25 kgCOD/m3d; 10 ~ 20 meter height
500 references

COD reduction rate EGSB is equal or lower but
Volumetric loading rate is 2-3 x higher
0
20
40
60
80
100
1
31
61
91
12
1
15
1
18
1
21
1
24
1
27
1
30
1
33
1
Kg
CO
D/m
3.d
ay &
re
mo
val %
VLR (kg COD/m3/d) COD removal
1
31
61
91
12
1
15
1
18
1
21
1
24
1
27
1
30
1
Biothane UASB Biobed® EGSB
Biothane UASB vs. Biobed® EGSB

Biobed® Advanced Anaerobic granular technology at the next level
Reduced investment and operating costs
2.

Combining the best of both
+
11
Solution Biobed® Advanced
Advantages of UASB
Advantages of EGSB
Challenge: combining the best of UASB and EGSB
• Excellent performance • High COD removal efficiency • Good biomass inventory
• Reduced investment costs • Higher volumetric loading rates (2-3 times) • Taller reactors (2-3 times) • Smaller footprint

Objectives of Biobed® Advanced & SMART
12
80 %
hydraulicbuffer tank
Anaerobic reactor
Aeration tank
Hydraulic buffer tank
Anaerobic reactor
Aeration tank
Dynamic control
85 % 10 ~ 25% smaller
Improving the anaerobic performance • Thus reducing investment and operating costs
Improving COD removal rate

Novel Biobed® Advanced Settler
13
Patented new settler and reactor design
Multi level biogas separation
TTS; Tilted Tube Separator on top of the settler • Increasing the settler surface area for
• Improving the retention of biomass and SS in the reactor
Robust effluent pipes which replace conventional effluent gutters
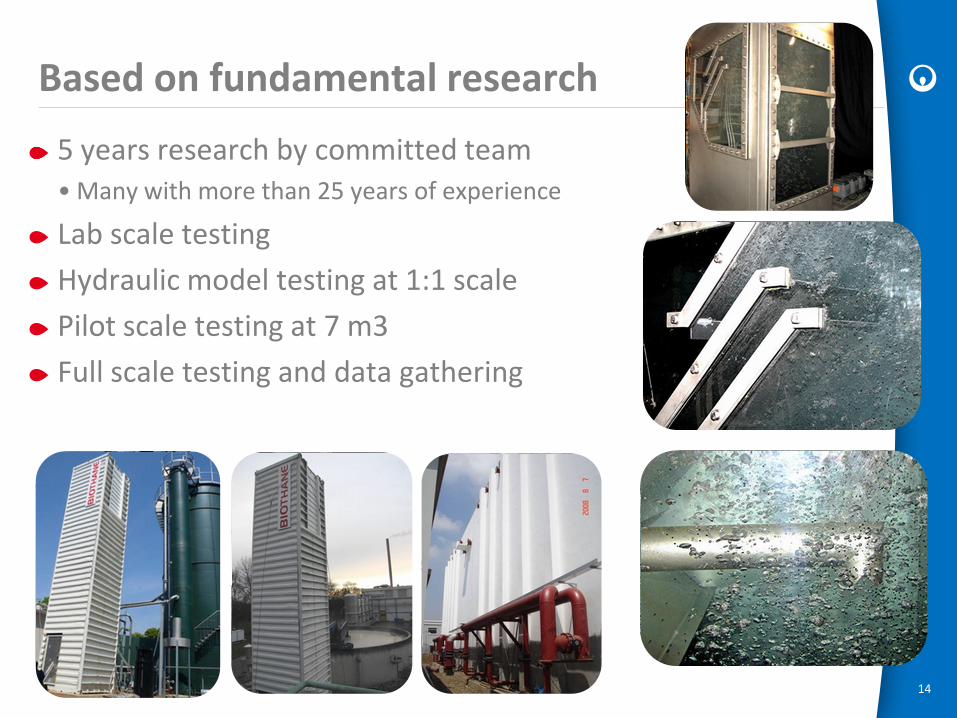
Based on fundamental research
5 years research by committed team • Many with more than 25 years of experience
Lab scale testing
Hydraulic model testing at 1:1 scale
Pilot scale testing at 7 m3
Full scale testing and data gathering
14

0
50
100
150
200
250
300
350
400
450
6 8 10 12 14 16 18 20
Effl
ue
nt
TSS
(mg
/L)
Settler upflow velocity (m/h)
Biothane Pilot plant 2011TSS Effluent vs Vl settler
TSS Effluent
Study of operational data Biobed++ referenc Pilot plant results paper wastewater
Effect of liquid velocity in Advanced settler on effluent SS
• Up to 19 m/h no effect designing at higher upflow velocities
15

Study of operational data Biobed++ referenc
16
Testing results paper wastewater
0
5
10
15
20
25
6/6/11 6/26/11 7/16/11 8/5/11 8/25/11 9/14/11 10/4/11 10/24/11
VLR
(kg
CO
D/m
³/d
)
Biothane Pilot Plant 2011Volumetric loading rate
Pilot plant
Full scale Biobed
Full scale UASB
Pilot: 12.8 kg SCOD/m3.d
BB: 8.9 kg SCOD/m3 .d
UASB:4.28 kg SCOD/m3 .d
Biobed® Advanced pilot 140% loading as compared to EGSB full scale Biobed® Advanced pilot 300% loading as compared to UASB full scale
Advanced Pilot
EGSB full scale
UASB full scale

Biobed® Advanced; smaller settler and reactor
18
Smaller settler height • 1.0 meter lower
• Same net volume loading rate
• Higher gross volumetric loading rate
Higher applicable liquid upflow velocity • Smaller required settler area
Reduced settler price
Substantial influence on Capex and Opex • Lower energy demand
1.0 m
net reactor volume
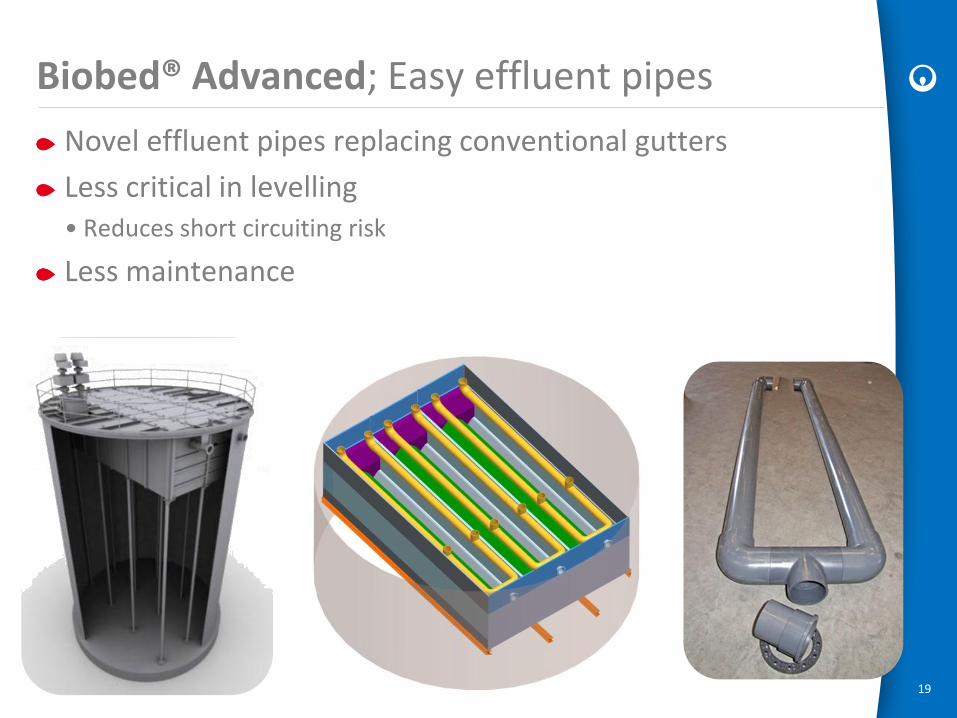
Biobed® Advanced; Easy effluent pipes
19
Novel effluent pipes replacing conventional gutters
Less critical in levelling • Reduces short circuiting risk
Less maintenance
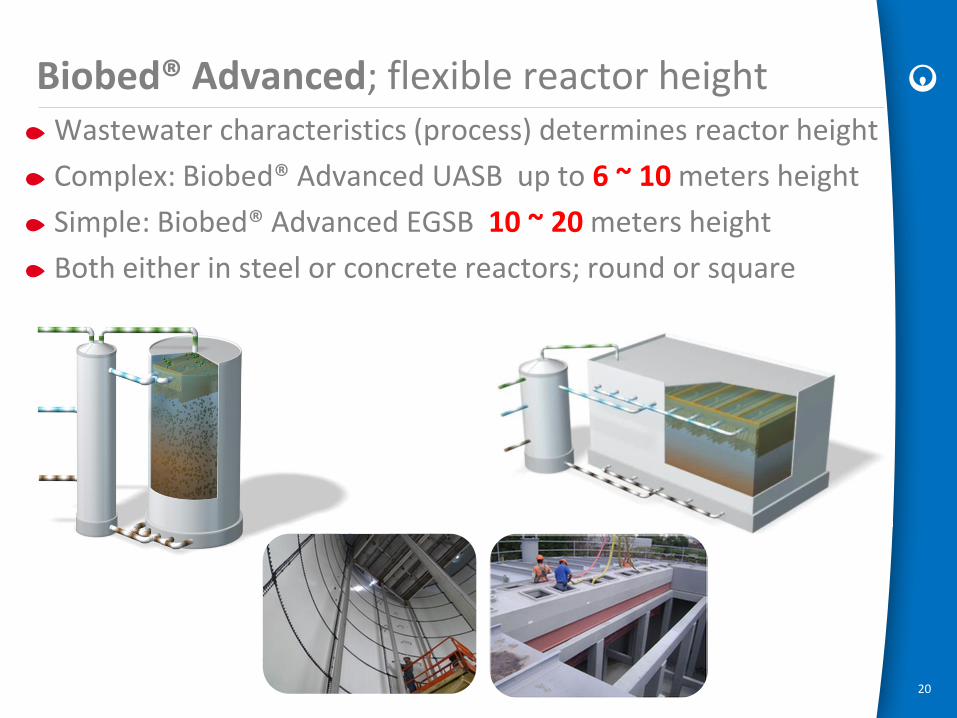
Biobed® Advanced; flexible reactor height
20
Wastewater characteristics (process) determines reactor height
Complex: Biobed® Advanced UASB up to 6 ~ 10 meters height
Simple: Biobed® Advanced EGSB 10 ~ 20 meters height
Both either in steel or concrete reactors; round or square

Biobed® Advanced; Optimizing investment and operating costs
22
Compact settler result in more flexible reactor design
Optimal size: Diameter = 0.8 x Height
Tall is more costly and requires more energy

Biobed® Advanced; Reduced operation costs
25
Novel superior settler • Excellent biomass inventory
• Stable growth of granular biomass
Therefore • High COD removal efficiency (long SRT)
• Less chemical consumption; pH, nutrients, anti-foam
• Less operator attention
Overall lower operating costs • Smaller aerobic post treatment
• Less overall maintenance cost
Confirmed by numerous full scale results
Novel Biobed® SMART control system • Will further improve stability and performance

Biobed® Advanced; Resume of advantages
26
Improved performance • Based on fundamental research
• Improved superior COD removal efficiencies
• Excellent biomass inventory
• No odour emission
Tailor made design • Flexible reactor height
• Flexible in construction; round steel or square concrete
• Easy effluent pipes
Reduced Capex and Opex • Small compact settler and small reactor
• Low chemical consumption
• Reduced aerobic post treatment
• Small foot print
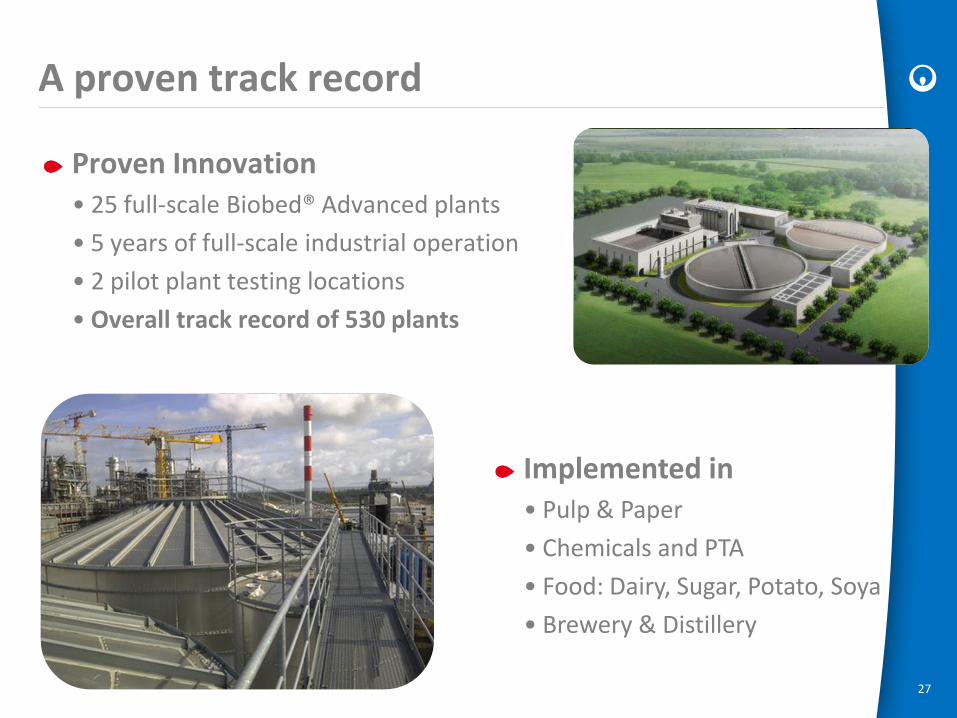
A proven track record
27
Proven Innovation • 25 full-scale Biobed® Advanced plants
• 5 years of full-scale industrial operation
• 2 pilot plant testing locations
• Overall track record of 530 plants
Implemented in • Pulp & Paper
• Chemicals and PTA
• Food: Dairy, Sugar, Potato, Soya
• Brewery & Distillery

0
10
20
30
40
50
60
70
80
90
100
Nov-07 Jun-08 Dec-08 Jul-09 Jan-10 Aug-10 Feb-11 Sep-11 Apr-12 Oct-12
CO
D r
ed
uct
ion
(%)
Date
COD reduction89%
80%
78%
Design
91%
Biobed® Advanced full scale; chemical case
Very high COD removal efficiency for PTA wastewater
Steady biomass increase observed

Biobed® SMART Sludge Management and
Reactor control Techniques
3.

Biobed®SMART reactor control system (1)
Sludge Management and Reactor Control Techniques
Objectives : • Achieve more stable reactor operation
• Achieve higher COD removal efficiency
• Reduce operating costs
30 30
“Real time video from inside the anaerobic reactor”

Development of Biobed® SMART
SMART control box 1. SMART process indicators (early warning)
Online continuous insight for operator in process performance
Based on a combination of different online measurements
Red / green lights to indicate process performance
2. SMART process control loop
Stable process load (dynamic control)
Optimized nutrient dosing
pH optimization
Temperature optimization
3. SMART imaging
Online view on biomass granules in reactor
31
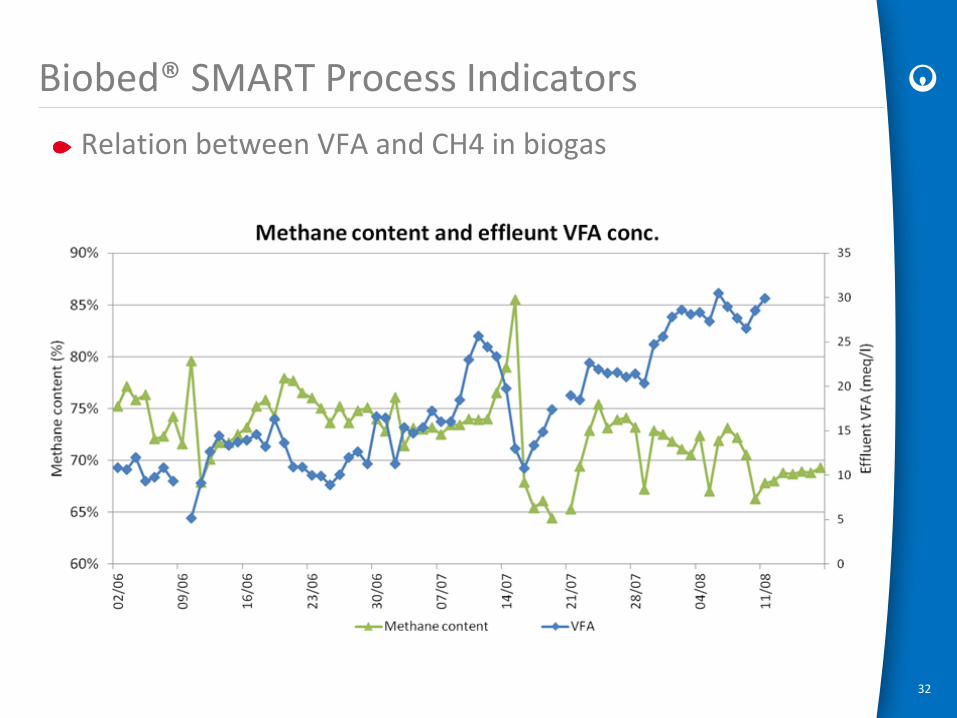
Biobed® SMART Process Indicators
Relation between VFA and CH4 in biogas
32

Biobed® SMART Process Indicators
Capacity indicator defines if spare capacity is left in the plant (in situ biomass activity test) • Based on patented measuring principle
33
0
500
1000
1500
2000
2500
0
20
40
60
80
100
120
140
160
Bio
gas
pro
du
ctio
n (L
/h)
Load
(kg
SCO
D/m
3.d
)
Time
Biogas vs Feed flow
Calculated Load Biogas

Biobed® SMART control loop
Pilot plant results with and without Dynamic Control
34
0.0
0.2
0.4
0.6
0.8
1.0
1.2
1.4
1.6
1.8
No
rm
ali
ze
d g
as p
ro
du
ctio
n
Operational Time (h)
Fluctations in gas production in standard operations
Normalized gas production
0
5
10
15
20
25
30
35
0
0.5
1
1.5
2
2.5
Vo
lum
etric
Lo
ad
ing
Ra
te
(k
g T
CO
D/m
3/d
)
No
rm
ail
ze
d g
as p
ro
du
ctio
n (
-)
Operational Time (h)
Fluctations in gas production SMART Load control
Normalized gas production
Load
Variation + 40%
Variation + 25%

Dynamic Control: Client Case-study
Fruit juice factory in the Netherlands • Flow 600 m3/day
• Load 1.5 ~ 2.0 tons of COD / day
200 m3 Equalisation tank
200 m3 storage tank
3 x 50 m3 Biobed® Modular Plant
High fluctuations in load, flow and low nutrient content
Resulted in poor performance and high costs
From: * Warmenhoven, J.W. and Spanjers, H. (2011). “TOC based control of anaerobic
reactor treating wastewater from a fruit juice packaging factory.” Water Practice & Technology 6 (2)
35
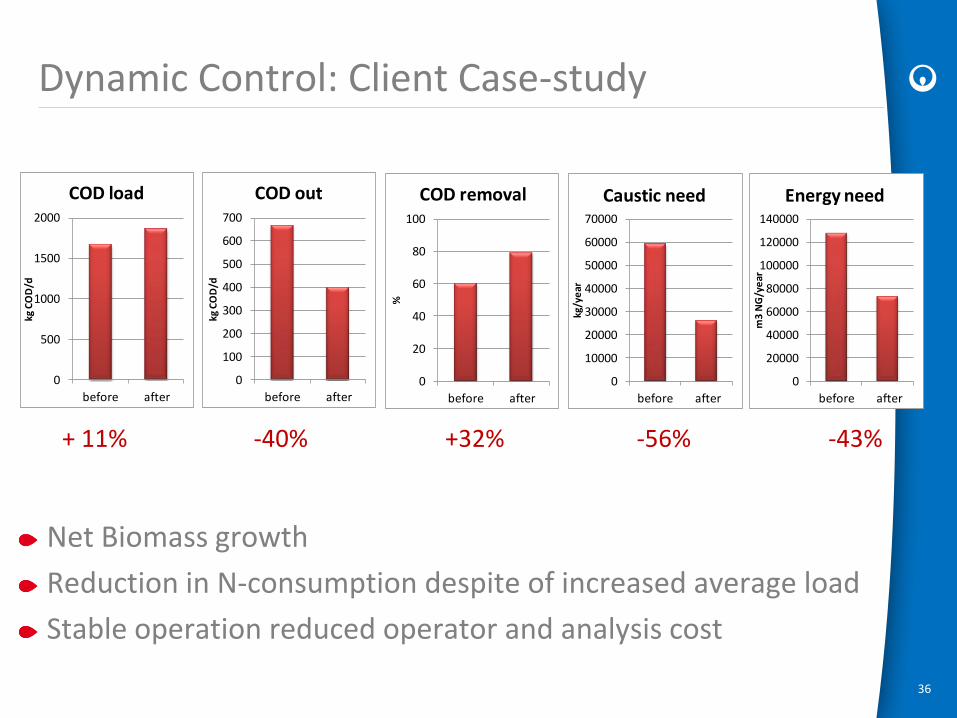
Dynamic Control: Client Case-study
36
Net Biomass growth
Reduction in N-consumption despite of increased average load
Stable operation reduced operator and analysis cost
+ 11% -40% +32% -56% -43%
0
500
1000
1500
2000
before after
kg C
OD
/d
COD load
0
100
200
300
400
500
600
700
before after
kg C
OD
/d
COD out
0
20
40
60
80
100
before after%
COD removal
0
10000
20000
30000
40000
50000
60000
70000
before after
kg/y
ear
Caustic need
0
20000
40000
60000
80000
100000
120000
140000
before after
m3
NG
/ye
ar
Energy need
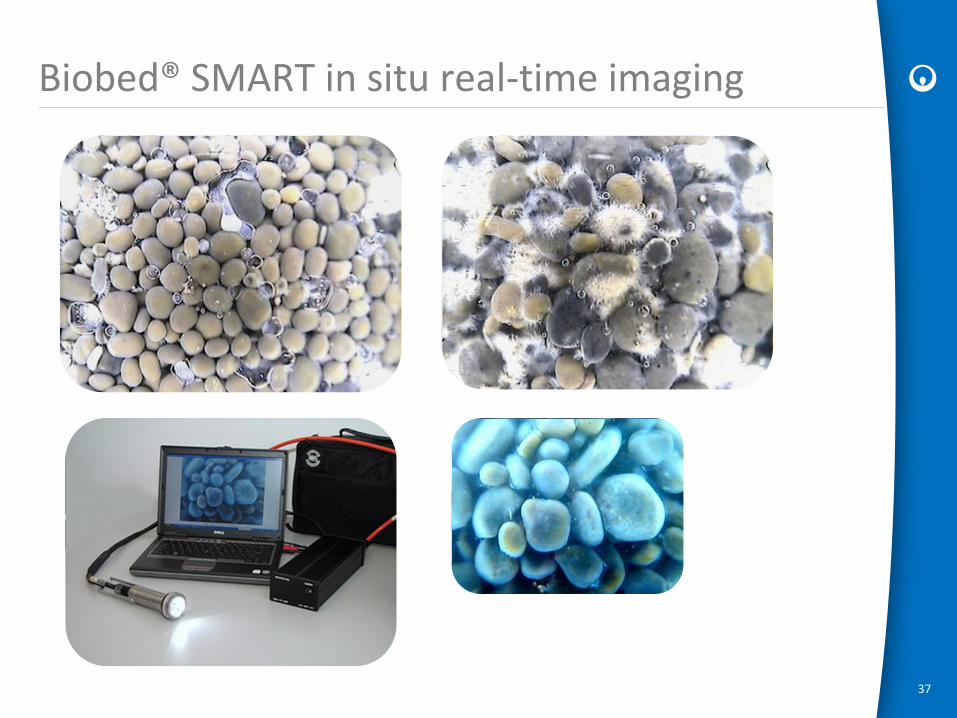
Biobed® SMART in situ real-time imaging
37
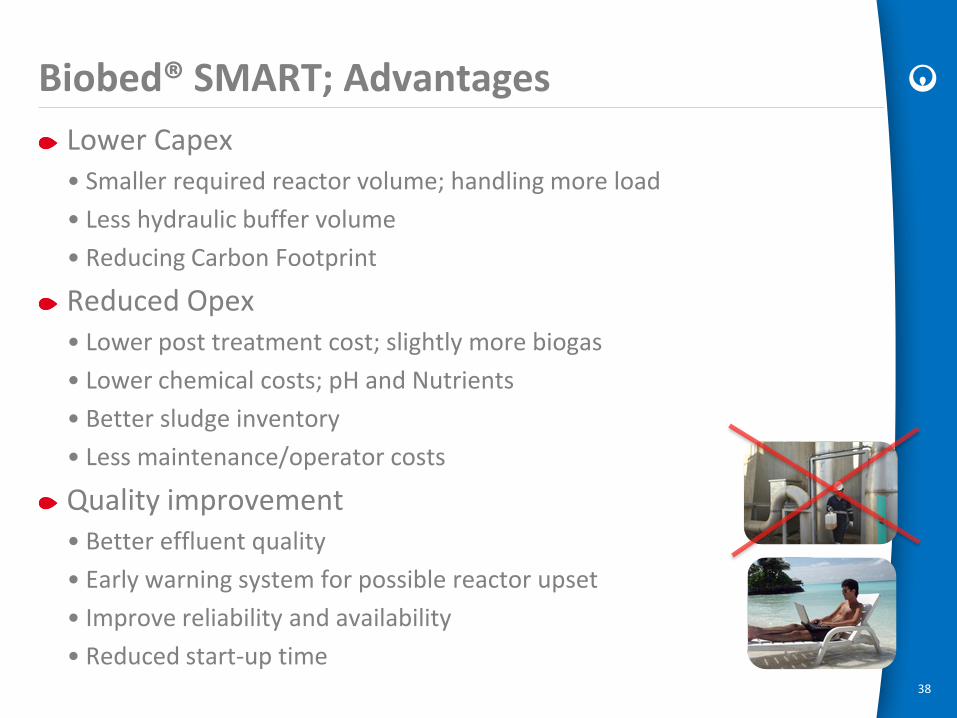
Biobed® SMART; Advantages
38
Lower Capex • Smaller required reactor volume; handling more load
• Less hydraulic buffer volume
• Reducing Carbon Footprint
Reduced Opex • Lower post treatment cost; slightly more biogas
• Lower chemical costs; pH and Nutrients
• Better sludge inventory
• Less maintenance/operator costs
Quality improvement • Better effluent quality
• Early warning system for possible reactor upset
• Improve reliability and availability
• Reduced start-up time

Memthane® The preferred solution for high-strength wastewaters
resulting in crystal clear effluents
4.
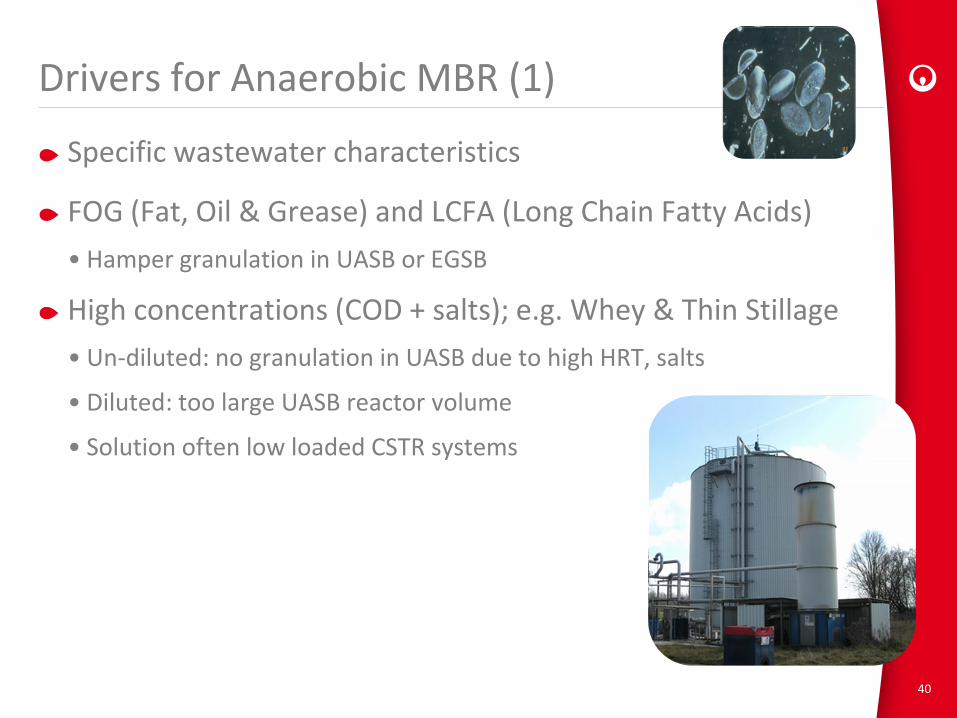
Drivers for Anaerobic MBR (1)
Specific wastewater characteristics
FOG (Fat, Oil & Grease) and LCFA (Long Chain Fatty Acids)
• Hamper granulation in UASB or EGSB
High concentrations (COD + salts); e.g. Whey & Thin Stillage
• Un-diluted: no granulation in UASB due to high HRT, salts
• Diluted: too large UASB reactor volume
• Solution often low loaded CSTR systems
40

Drivers for Anaerobic MBR (2)
Higher loading rate in CSTR digester achieved by
• Uncoupling of HRT and SRT by use of membranes
Higher COD removal efficiencies & clear effluents
• Smaller post treatment; more compact & less energy consumption
• Higher digestion efficiency, more biogas
• Effluent free of suspended solids; easy nutrient recovery
41

Memthane® step-by-ste
Conditioning of high- strength wastewaters.
Influent is fed to the anaerobic bioreactor where the organic components are converted into energy-rich biogas.
Cleaning In Place (CIP)
After anaerobic treatment, the UF membrane unit separates the clean permeate from the biomass.
If required, several polishing techniques are available to further treat the suspended solids free effluent for reuse or recovery of nutrients, while the low COD permeate is often clean enough for direct discharge to sewer.
Biomass is returned to the bioreactor, while a small amount of biomass is removed from the system and discharged after dewatering.
42

Memthane®; Features
Treat high-strength effluent previously considered untreatable • High concentrated streams : COD 15,000 – 250,000 ppm
• Superb effluent quality
• Create product for nutrient recovery (N+P)
Maximize renewable green energy production • Generates biogas from wastewater
• Minimizes carbon footprint and water footprint
Remove COD efficiency: > 98% • Avoids costly aerobic post treatment
• Generates more biogas
Reduced OPEX • Reduces disposal costs while generating biogas
43

Impact of membranes on anaerobic process
44
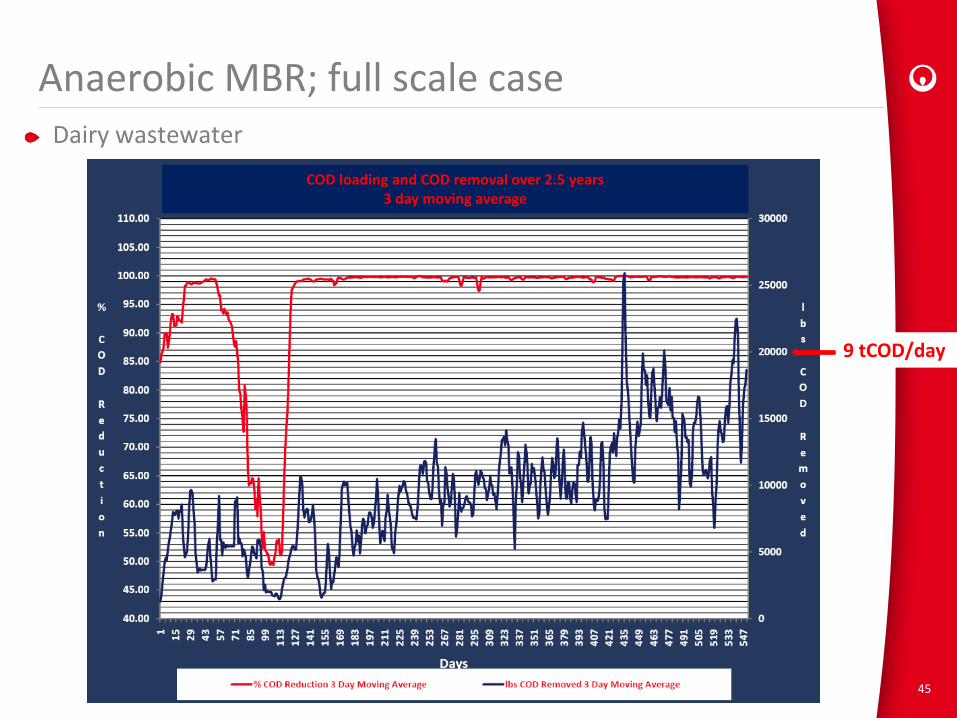
Anaerobic MBR; full scale case Dairy wastewater
45
9 tCOD/day
COD loading and COD removal over 2.5 years 3 day moving average

Memthane®; Track record
Proven Innovation 9 full-scale Memthane® plants
• 4 years of full-scale industrial operation
• 14 pilot plant tests
Implemented in: • Dairy industries
• Bio-ethanol plant; thin stillage
• Cellulosic Bio-ethanol; condensate
• Biodiesel plant
• Food processing
47

Ethanol distillery; Case study
Production Capacity: 10,000 m3 Ethanol per year
Bases: Corn
Flow: 700 m3/day / COD: 48 ton/day
TKN: 720 ppm / t-P: 820 ppm
48

Biogas Boiler
DAF
Stillage Centrate
BT
Dilution Effluent
DAF Float
BIOBED
Post Treatment
Post Treatment
Biogas
BT
AnMBR sludge stream
MEMTHANE
Ethanol distillery- Case study
49

Biogas
Memthane®
Water Re-Use
Evaporator
Thin Stillage
Electricity CHP
Back set water
N - removal Ammonia Stripping
P- removal Struvite & Anitamox
Memthane Development Works…
Water Re-Use RO Treatment
Boiler Feed Water Cooling Water & Other
Ammonia for Re-use
Fertilizer
Decanter
50

Full scale design Bio-ethanol
Memthane® treating thin stillage of 45 ton COD/d
COD removal efficiency > 98 - 99% • Gross caloric value >5.4 MW
Electrical balance • Production 2.2 MWe
• Consumption Memthane® 0.3 MWe
Post treatment options • Struvite precipation
• Water Re-use
• Ammonia re-use
51

Observations and Conclusions
Biobed® Advanced reactor • Reduced investment and operating costs
• Stable and reliable operation
• 25 full scales
Biobed® SMART • Substantial reduction in operating costs
• More stable operation
• Especially as retrofit to existing plants
Memthane® AnMBR • Cost effective solution for concentrated wastewaters
• Crystal clear effluents
53
Biothane: Establishing growth through innovation Thanks for your attention For further information or questions Please contact: Jan Pereboom; Marketing Manager at Biothane [email protected] or visit our booth: Hall 5 F124
54

54 slides minus 8 hidden
23/11/2012 Biobed® Advanced 55


![Cheaper Medicines Act [Revised]](https://img.pdfslide.net/doc/110x75/577d267e1a28ab4e1ea15ff4/cheaper-medicines-act-revised.jpg)