Embed Size (px)
Citation preview
The Market Leader in Open Source Business Intelligence
Tom CahillJaspersoft 29 April 2009
The Blueprint for Buildinga Data Warehouseon Open Source
Let’s talk about…
• Introduction – who is Jaspersoft• Why am I here?• You – what are your expectations?• What is your interest in Data Warehousing?
– Improve Decision-making ?– Improve Data management ?
• How many slides do I have and what should we look at?• Two-way flow: tell me what messages to take back to my
colleagues
©2009 Jaspersoft Corporation. Proprietary and Confidential 2
Company & Products Overview
© 2009 Jaspersoft Corporation. Proprietary and Confidential 3
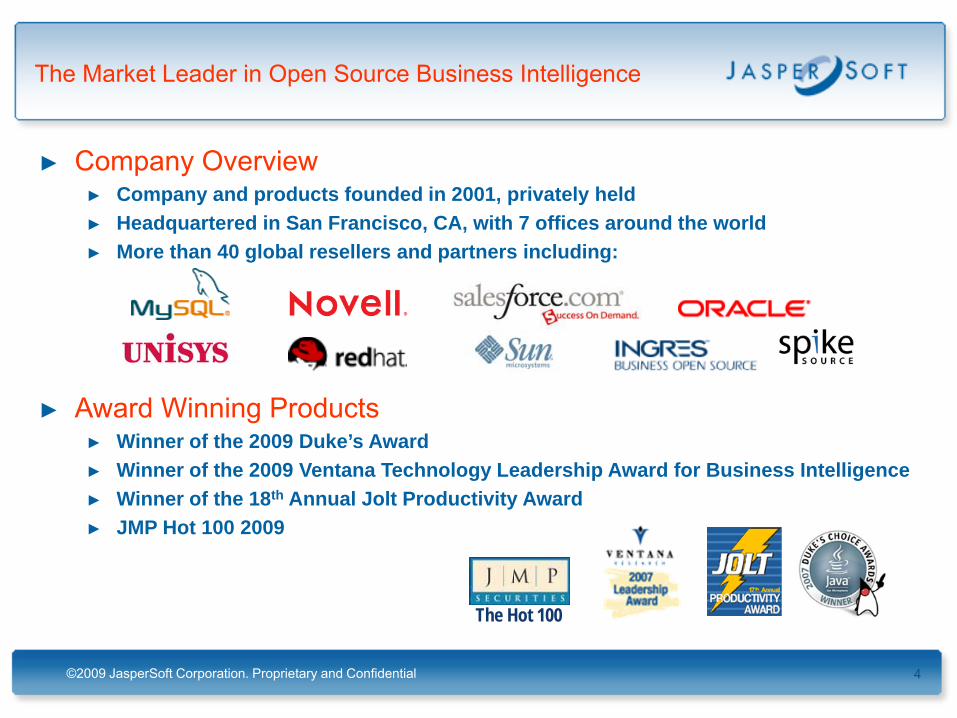
The Market Leader in Open Source Business Intelligence
► Company Overview► Company and products founded in 2001, privately held► Headquartered in San Francisco, CA, with 7 offices around the world► More than 40 global resellers and partners including:
► Award Winning Products► Winner of the 2009 Duke’s Award► Winner of the 2009 Ventana Technology Leadership Award for Business Intelligence► Winner of the 18th Annual Jolt Productivity Award► JMP Hot 100 2009
©2009 JasperSoft Corporation. Proprietary and Confidential 4
The Hot 100
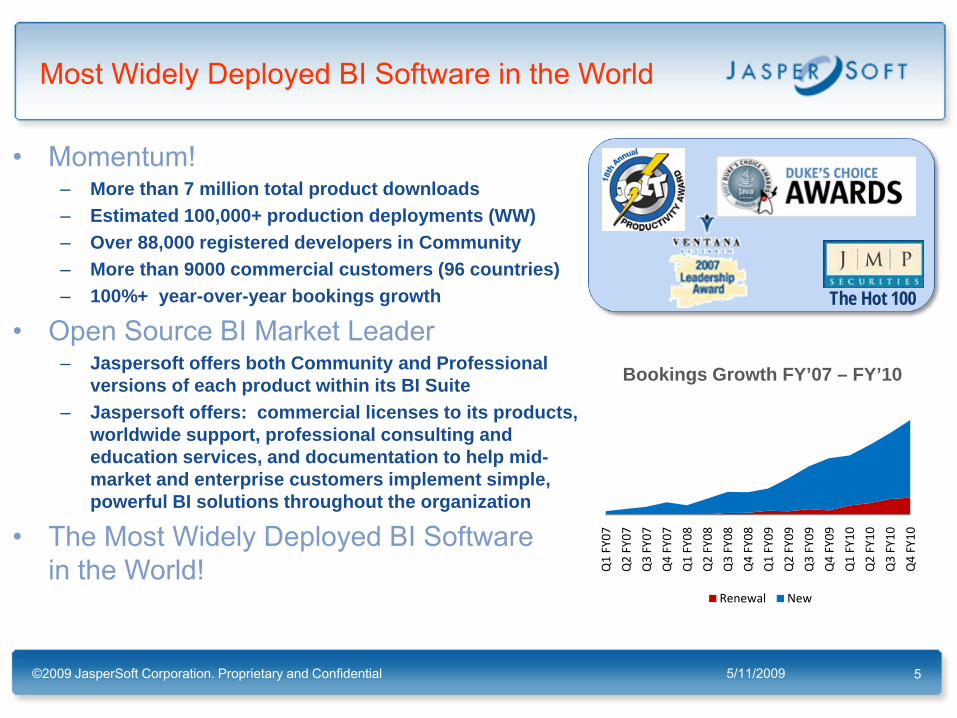
Most Widely Deployed BI Software in the World
• Momentum!– More than 7 million total product downloads– Estimated 100,000+ production deployments (WW)– Over 88,000 registered developers in Community– More than 9000 commercial customers (96 countries)– 100%+ year-over-year bookings growth
• Open Source BI Market Leader– Jaspersoft offers both Community and Professional
versions of each product within its BI Suite– Jaspersoft offers: commercial licenses to its products,
worldwide support, professional consulting and education services, and documentation to help mid-market and enterprise customers implement simple, powerful BI solutions throughout the organization
• The Most Widely Deployed BI Software in the World!
5/11/2009©2009 JasperSoft Corporation. Proprietary and Confidential 5
Bookings Growth FY’07 – FY’10
The Hot 100
Q1 FY07
Q2 FY07
Q3 FY07
Q4 FY07
Q1 FY08
Q2 FY08
Q3 FY08
Q4 FY08
Q1 FY09
Q2 FY09
Q3 FY09
Q4 FY09
Q1 FY10
Q2 FY10
Q3 FY10
Q4 FY10
Renewal New
6© 2009 Jaspersoft Corporation. Proprietary and Confidential
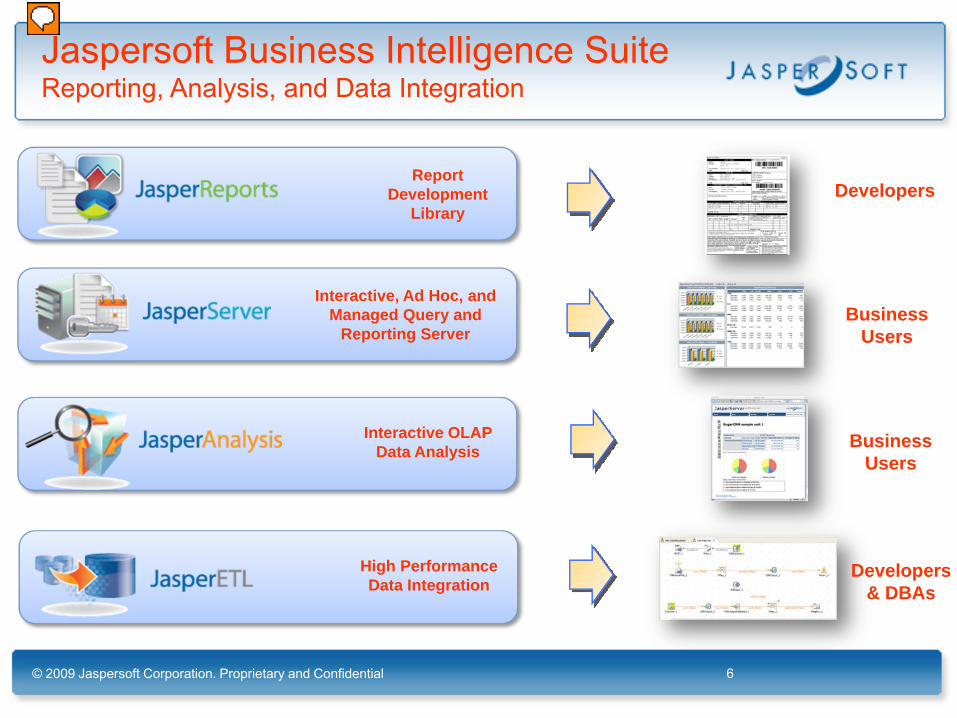
Developers
Business Users
Business Users
Developers & DBAs
Jaspersoft Business Intelligence SuiteReporting, Analysis, and Data Integration
Interactive, Ad Hoc, and Managed Query and
Reporting Server
Interactive OLAP Data Analysis
High Performance Data Integration
Report Development
Library
Building Dynamic Ad Hoc Reports, Charts, and Crosstabs to Perform
Basic Analysis
© 2009 Jaspersoft Corporation. Proprietary and Confidential 7
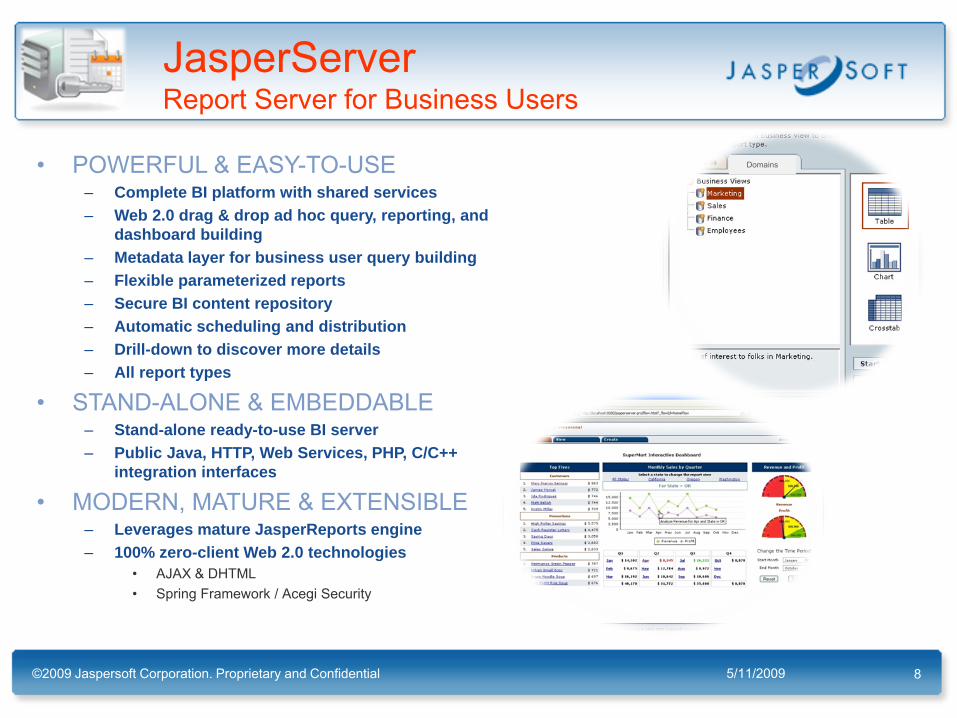
JasperServerReport Server for Business Users
• POWERFUL & EASY-TO-USE– Complete BI platform with shared services– Web 2.0 drag & drop ad hoc query, reporting, and
dashboard building– Metadata layer for business user query building– Flexible parameterized reports– Secure BI content repository– Automatic scheduling and distribution– Drill-down to discover more details– All report types
• STAND-ALONE & EMBEDDABLE– Stand-alone ready-to-use BI server– Public Java, HTTP, Web Services, PHP, C/C++
integration interfaces
• MODERN, MATURE & EXTENSIBLE– Leverages mature JasperReports engine– 100% zero-client Web 2.0 technologies
• AJAX & DHTML• Spring Framework / Acegi Security
5/11/2009©2009 Jaspersoft Corporation. Proprietary and Confidential 8
Domains
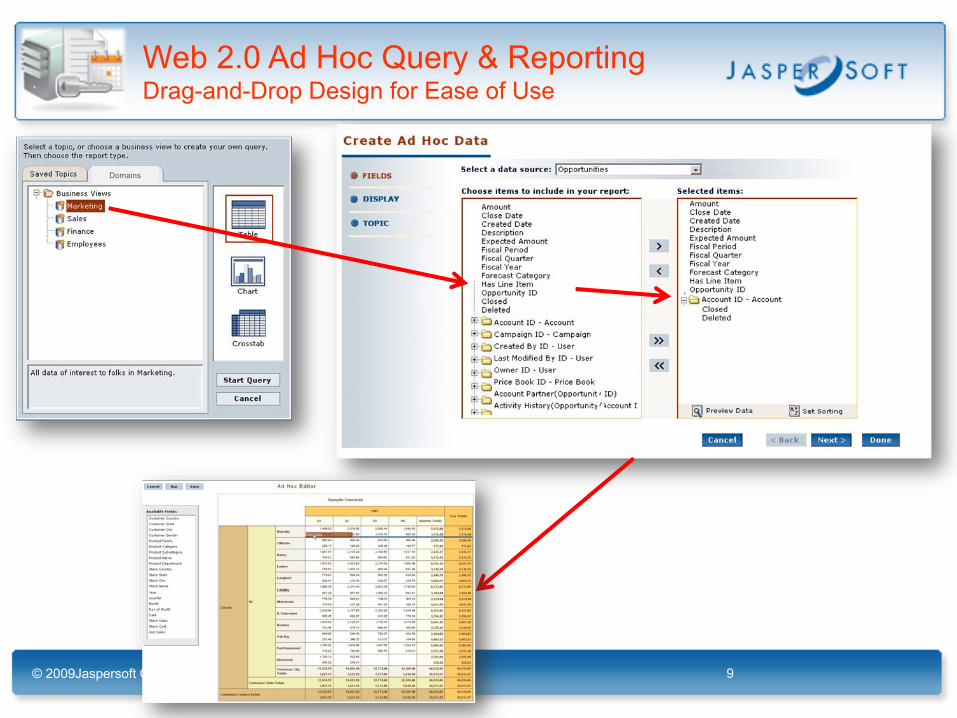
Web 2.0 Ad Hoc Query & ReportingDrag-and-Drop Design for Ease of Use
9© 2009Jaspersoft Corporation. Proprietary and Confidential
Domains
Jaspersoft v3.5JasperServer Integrated Analysis
© 2009 Jaspersoft Corporation. Proprietary and Confidential 10
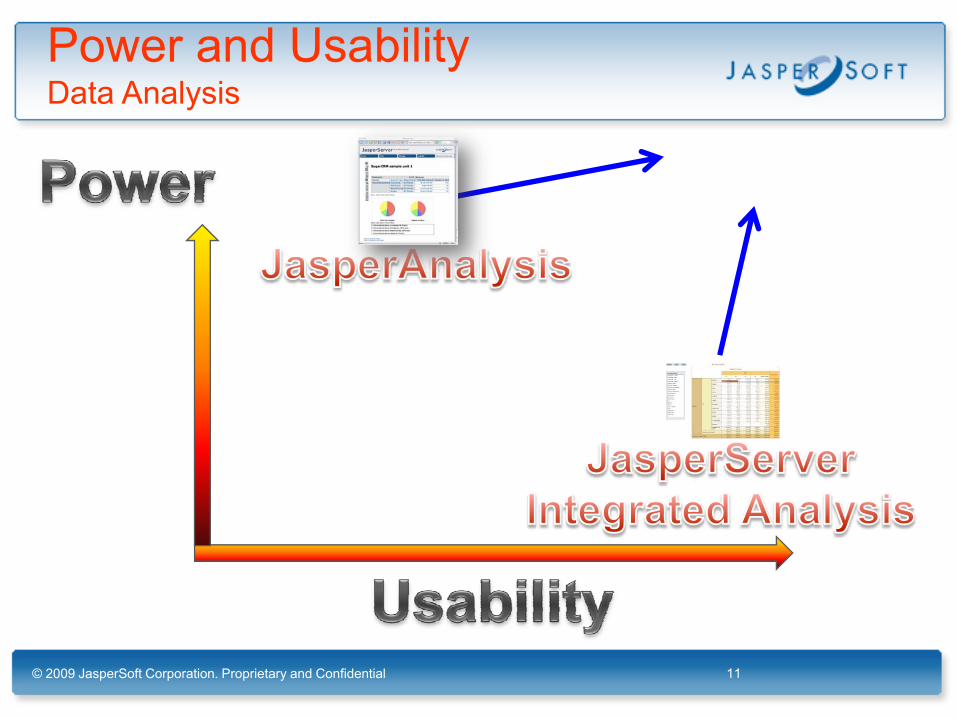
Power and UsabilityData Analysis
11© 2009 JasperSoft Corporation. Proprietary and Confidential

Jaspersoft v3.5Web 2.0 Integrated Analysis on Reports
• Simple to use analysis for business users
– Drag & drop dimensions & measures
– Pivot– Drill
• Builds on Web 2.0 Ad Hoc Query & Domains infrastructure
– Domains metadata• No “OLAP cube” required
– Web 2.0 AJAX engine– In-memory caching engine OR
push-down to RDBMS– Architected for data source
independence
5/11/2009©2009 Jaspersoft Corporation. Proprietary and Confidential 12
Demonstration!
Building OLAP Cubes and Views for High-Volume Data Analysis
© 2009 Jaspersoft Corporation. Proprietary and Confidential 13
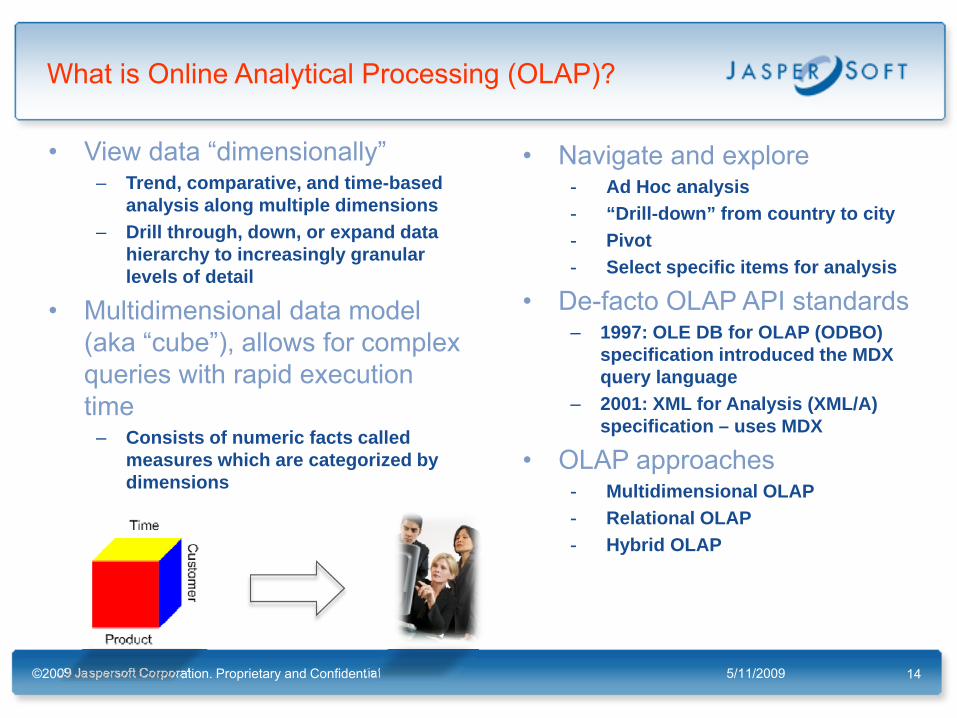
What is Online Analytical Processing (OLAP)?
• View data “dimensionally”– Trend, comparative, and time-based
analysis along multiple dimensions– Drill through, down, or expand data
hierarchy to increasingly granular levels of detail
• Multidimensional data model (aka “cube”), allows for complex queries with rapid execution time
– Consists of numeric facts called measures which are categorized by dimensions
5/11/2009©2009 Jaspersoft Corporation. Proprietary and Confidential 14
• Navigate and explore- Ad Hoc analysis- “Drill-down” from country to city- Pivot- Select specific items for analysis
• De-facto OLAP API standards– 1997: OLE DB for OLAP (ODBO)
specification introduced the MDX query language
– 2001: XML for Analysis (XML/A) specification – uses MDX
• OLAP approaches- Multidimensional OLAP - Relational OLAP- Hybrid OLAP
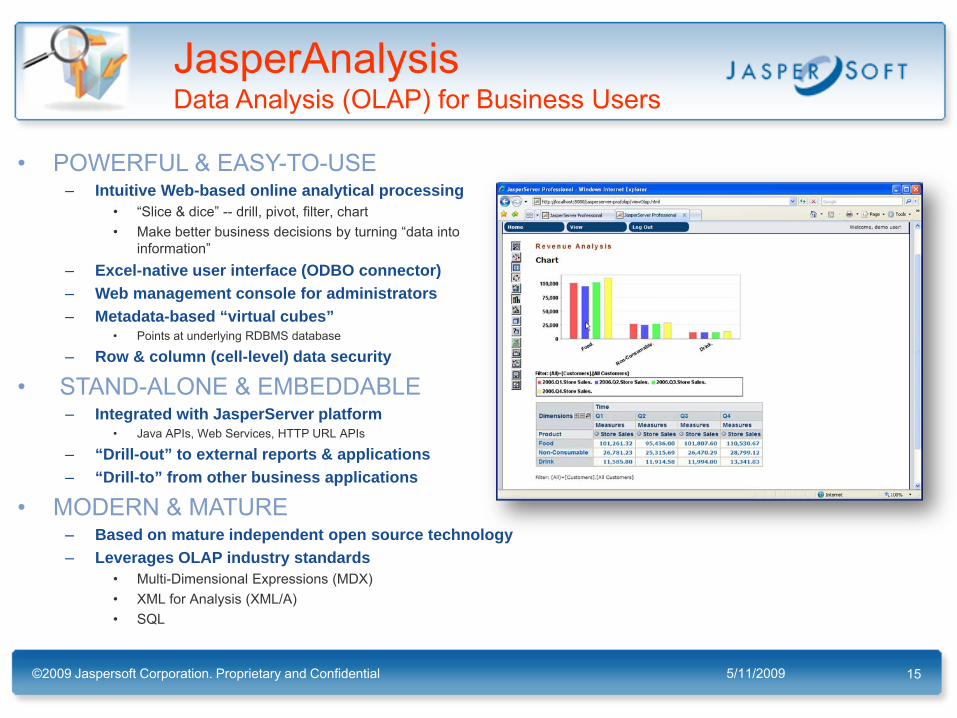
JasperAnalysisData Analysis (OLAP) for Business Users
• POWERFUL & EASY-TO-USE– Intuitive Web-based online analytical processing
• “Slice & dice” -- drill, pivot, filter, chart• Make better business decisions by turning “data into
information”– Excel-native user interface (ODBO connector)– Web management console for administrators– Metadata-based “virtual cubes”
• Points at underlying RDBMS database
– Row & column (cell-level) data security
• STAND-ALONE & EMBEDDABLE– Integrated with JasperServer platform
• Java APIs, Web Services, HTTP URL APIs
– “Drill-out” to external reports & applications– “Drill-to” from other business applications
• MODERN & MATURE– Based on mature independent open source technology– Leverages OLAP industry standards
• Multi-Dimensional Expressions (MDX)• XML for Analysis (XML/A)• SQL
5/11/2009©2009 Jaspersoft Corporation. Proprietary and Confidential 15
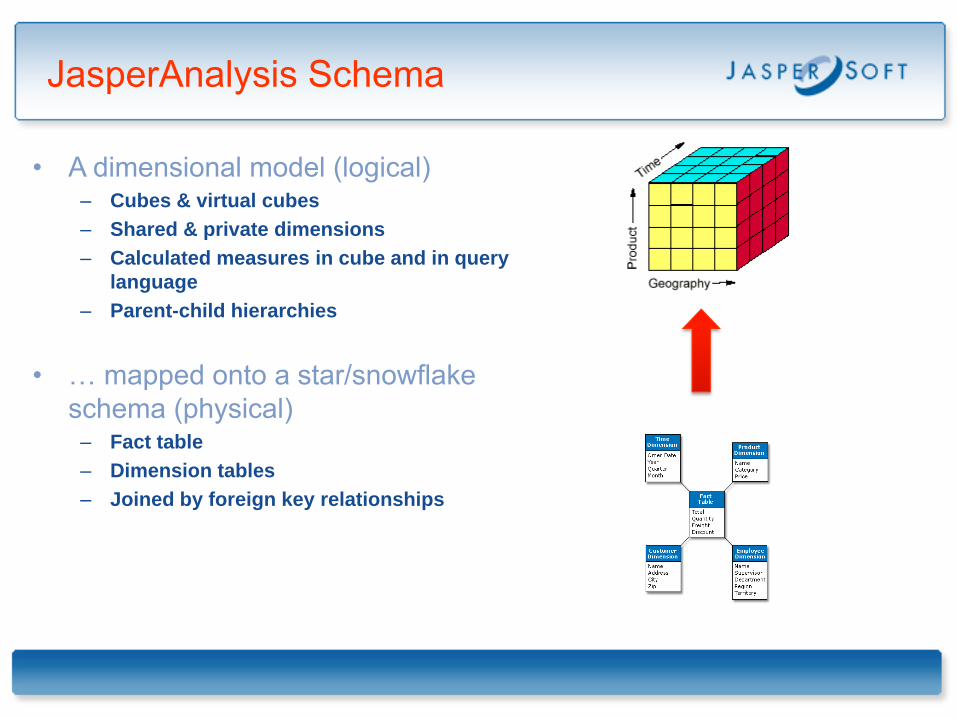
JasperAnalysis Schema
• A dimensional model (logical)– Cubes & virtual cubes– Shared & private dimensions– Calculated measures in cube and in query
language– Parent-child hierarchies
• … mapped onto a star/snowflake schema (physical)
– Fact table– Dimension tables– Joined by foreign key relationships
17© 2009 Jaspersoft Corporation. Proprietary and Confidential
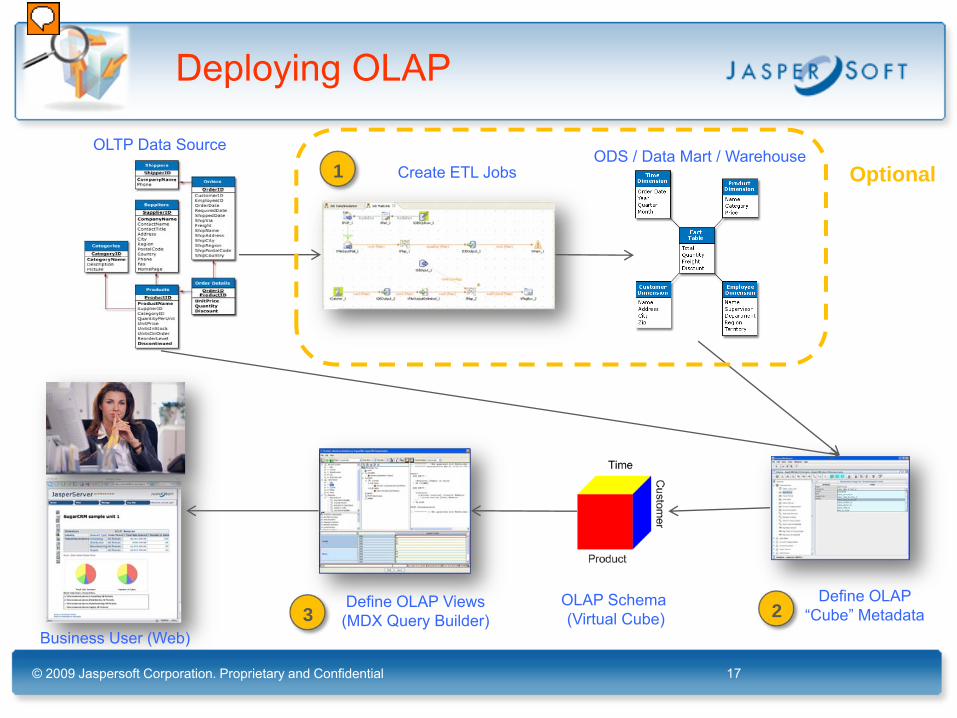
Deploying OLAP
OLTP Data SourceODS / Data Mart / Warehouse
Business User (Web)
OLAP Schema(Virtual Cube)
Define OLAP Views (MDX Query Builder)
1 Create ETL Jobs
Define OLAP “Cube” Metadata
Optional
3 2
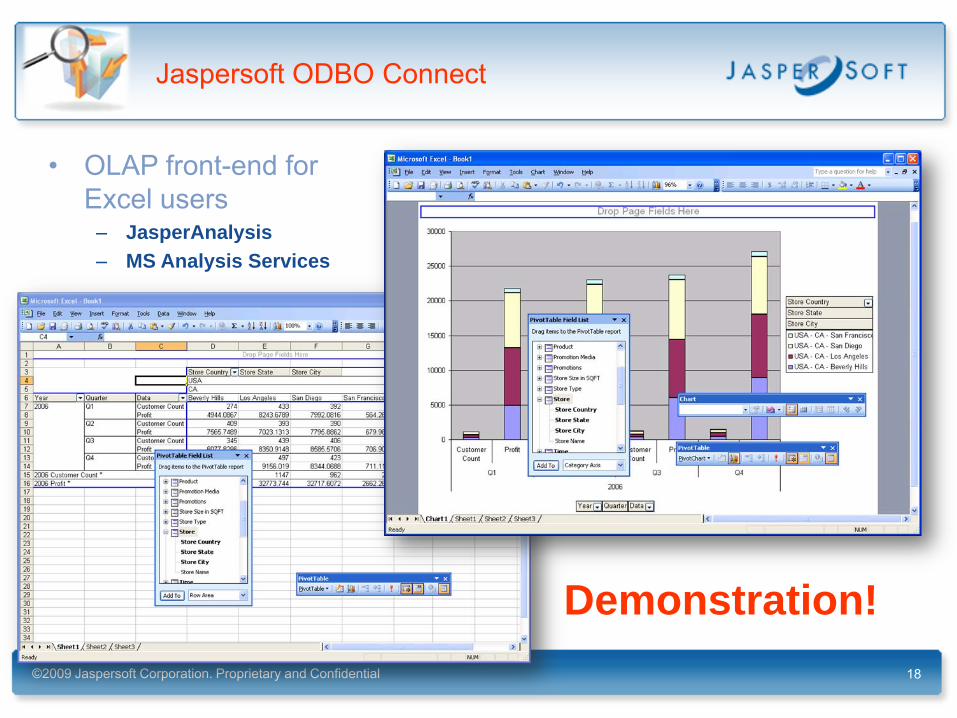
Jaspersoft ODBO Connect
• OLAP front-end for Excel users
– JasperAnalysis– MS Analysis Services
©2009 Jaspersoft Corporation. Proprietary and Confidential 18
Demonstration!
When and How to Use Data Integration (ETL) Tools to Create and
Maintain Dedicated Analytic Data Stores
© 2009 Jaspersoft Corporation. Proprietary and Confidential 19
A New Era of Competition
5/11/2009©2009 Jaspersoft Corporation. Proprietary and Confidential 20
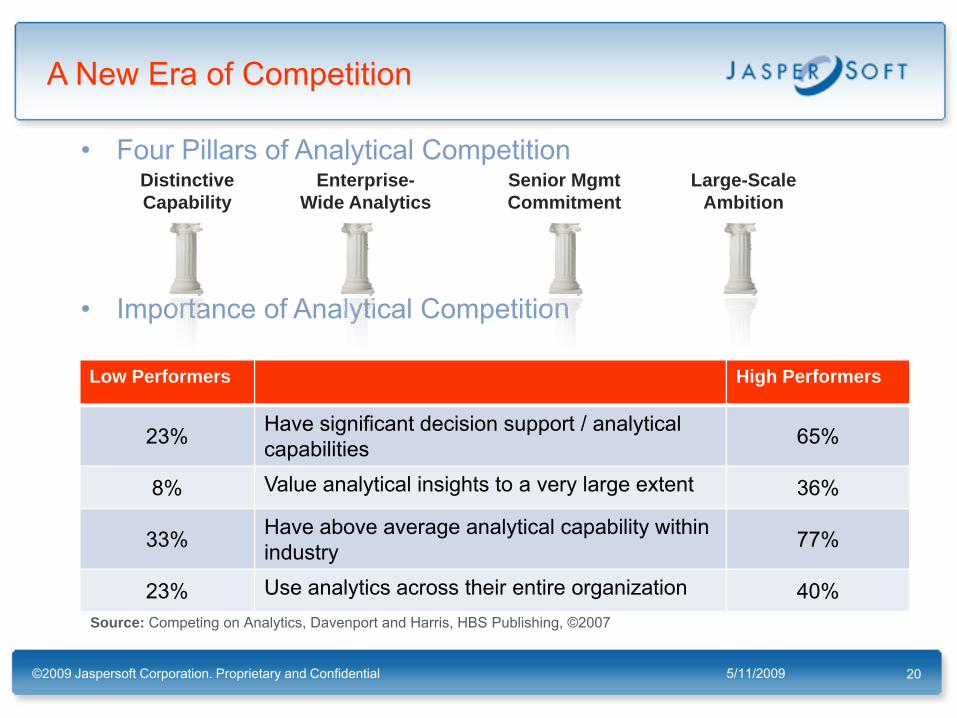
• Four Pillars of Analytical Competition
• Importance of Analytical Competition
Low Performers High Performers
23% Have significant decision support / analytical capabilities 65%
8% Value analytical insights to a very large extent 36%
33% Have above average analytical capability within industry 77%
23% Use analytics across their entire organization 40%
DistinctiveCapability
Enterprise-Wide Analytics
Senior MgmtCommitment
Large-ScaleAmbition
Source: Competing on Analytics, Davenport and Harris, HBS Publishing, ©2007
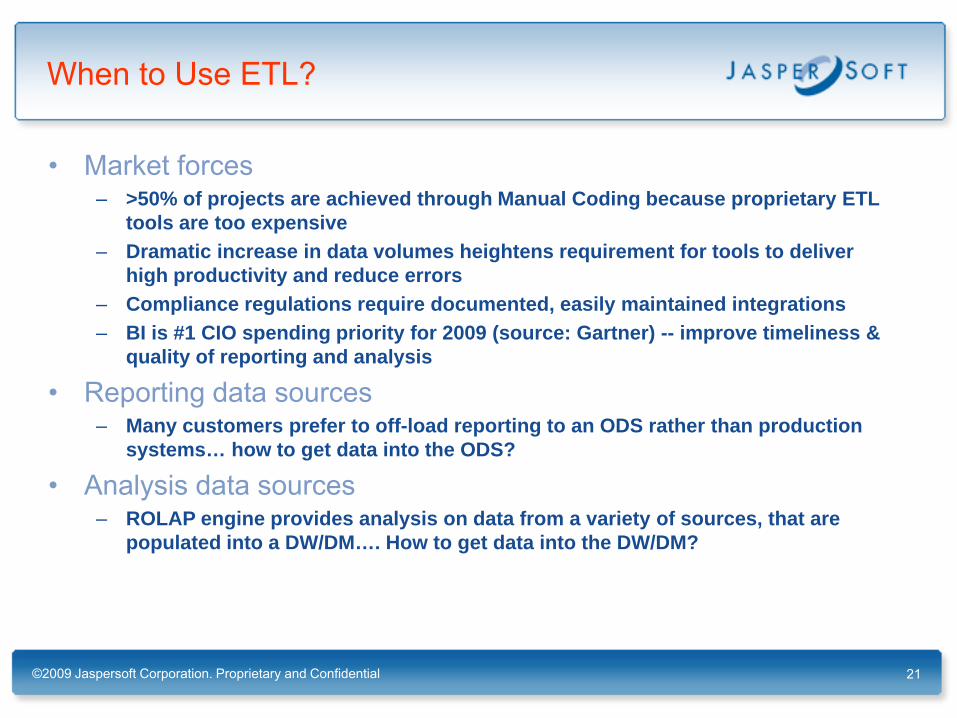
When to Use ETL?
• Market forces– >50% of projects are achieved through Manual Coding because proprietary ETL
tools are too expensive– Dramatic increase in data volumes heightens requirement for tools to deliver
high productivity and reduce errors– Compliance regulations require documented, easily maintained integrations– BI is #1 CIO spending priority for 2009 (source: Gartner) -- improve timeliness &
quality of reporting and analysis
• Reporting data sources– Many customers prefer to off-load reporting to an ODS rather than production
systems… how to get data into the ODS?
• Analysis data sources– ROLAP engine provides analysis on data from a variety of sources, that are
populated into a DW/DM…. How to get data into the DW/DM?
©2009 Jaspersoft Corporation. Proprietary and Confidential 21
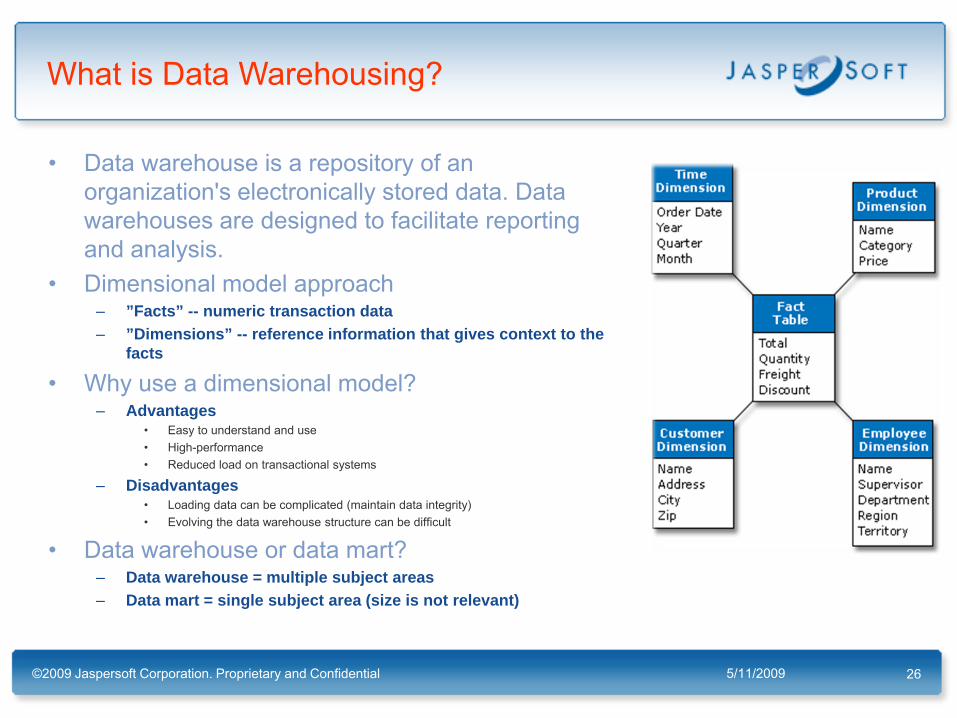
What is Data Warehousing?
5/11/2009©2009 Jaspersoft Corporation. Proprietary and Confidential 26
• Data warehouse is a repository of an organization's electronically stored data. Data warehouses are designed to facilitate reporting and analysis.
• Dimensional model approach– ”Facts” -- numeric transaction data– ”Dimensions” -- reference information that gives context to the
facts
• Why use a dimensional model?– Advantages
• Easy to understand and use• High-performance• Reduced load on transactional systems
– Disadvantages• Loading data can be complicated (maintain data integrity)• Evolving the data warehouse structure can be difficult
• Data warehouse or data mart?– Data warehouse = multiple subject areas– Data mart = single subject area (size is not relevant)
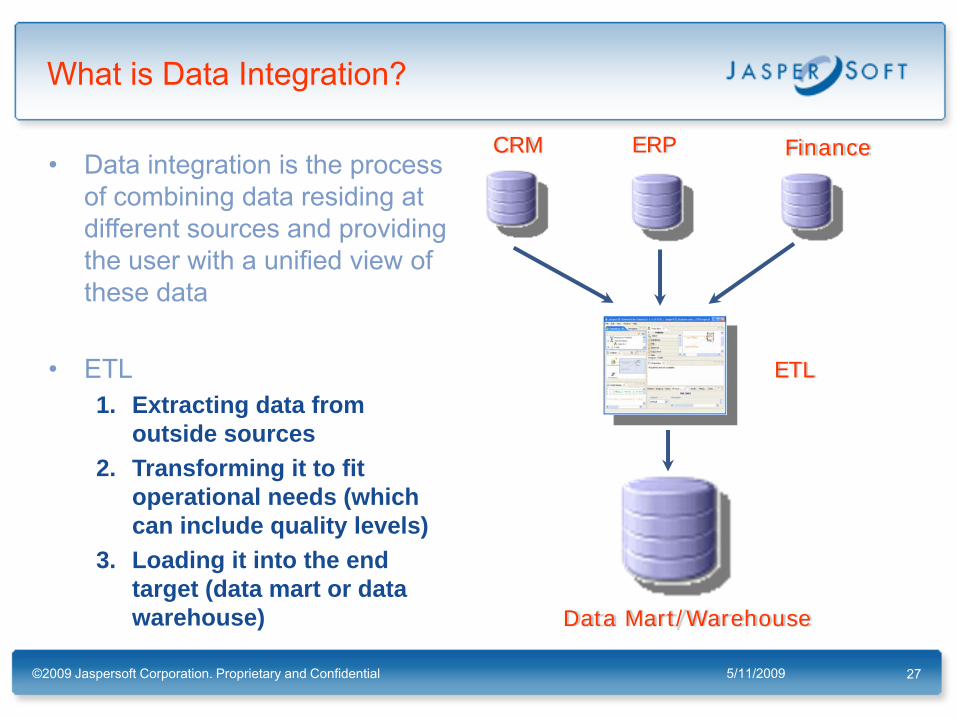
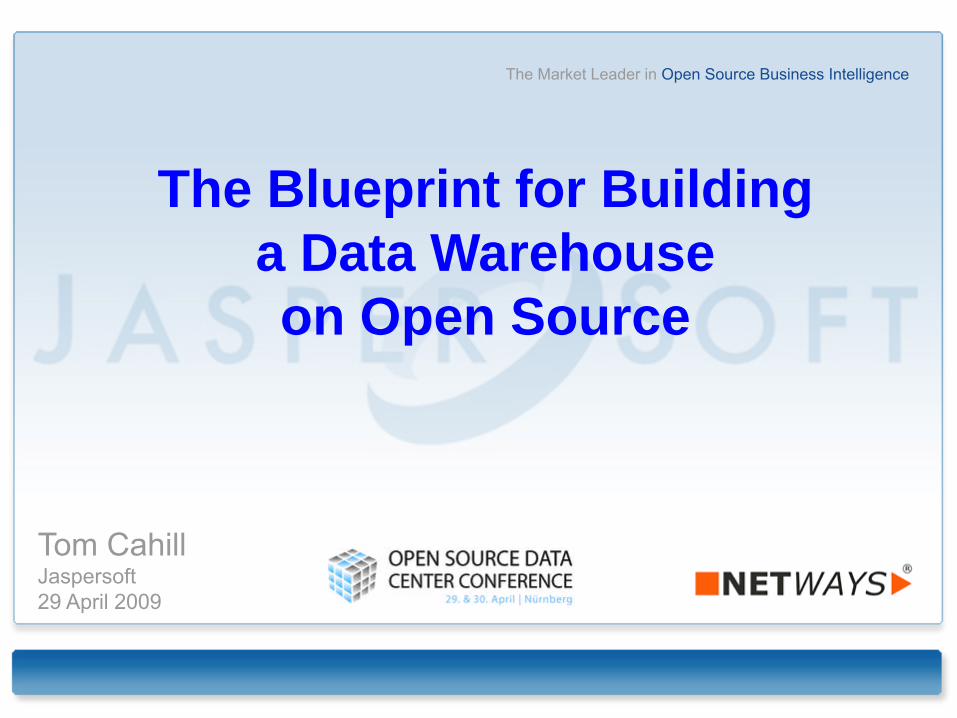
What is Data Integration?
5/11/2009©2009 Jaspersoft Corporation. Proprietary and Confidential 27
• Data integration is the process of combining data residing at different sources and providing the user with a unified view of these data
• ETL1. Extracting data from
outside sources2. Transforming it to fit
operational needs (which can include quality levels)
3. Loading it into the end target (data mart or data warehouse) Data Mart/Warehouse
ETL
CRM ERP Finance
5/11/2009©2009 Jaspersoft Corporation. Proprietary and Confidential 28
The traditional proprietary BI, ETL, and data warehouse market
5/11/2009©2009 Jaspersoft Corporation. Proprietary and Confidential 29
Business Intelligence
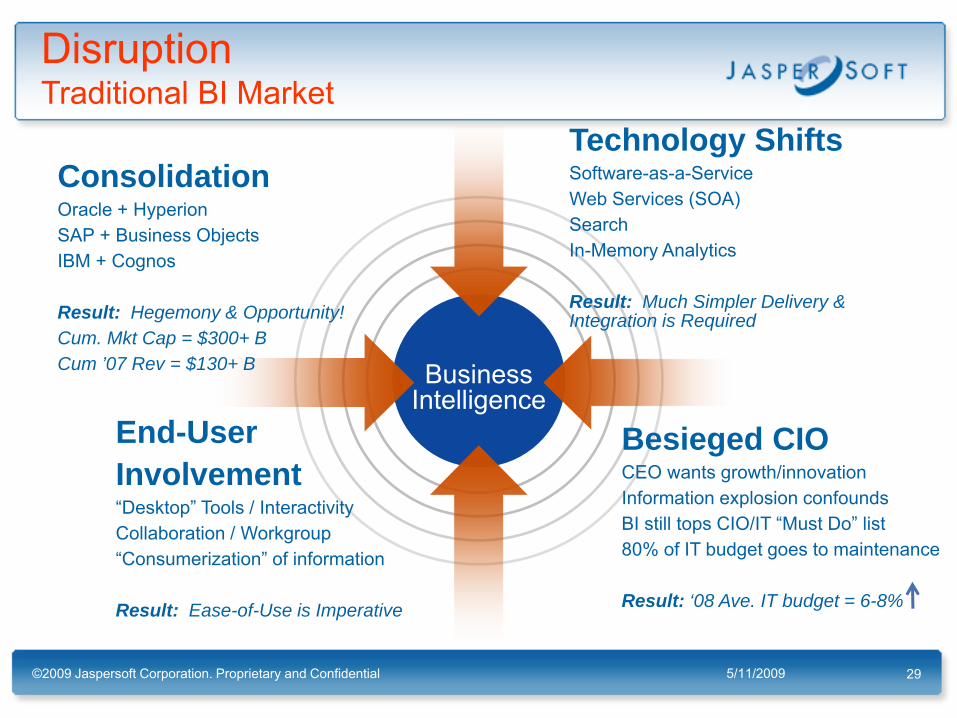
End-User Involvement“Desktop” Tools / InteractivityCollaboration / Workgroup“Consumerization” of information
Result: Ease-of-Use is Imperative
Technology ShiftsSoftware-as-a-ServiceWeb Services (SOA)SearchIn-Memory Analytics
Result: Much Simpler Delivery & Integration is Required
ConsolidationOracle + HyperionSAP + Business ObjectsIBM + Cognos
Result: Hegemony & Opportunity!Cum. Mkt Cap = $300+ BCum ’07 Rev = $130+ B
Besieged CIOCEO wants growth/innovationInformation explosion confoundsBI still tops CIO/IT “Must Do” list80% of IT budget goes to maintenance
Result: ‘08 Ave. IT budget = 6-8%
DisruptionTraditional BI Market
5/11/2009©2009 Jaspersoft Corporation. Proprietary and Confidential 30
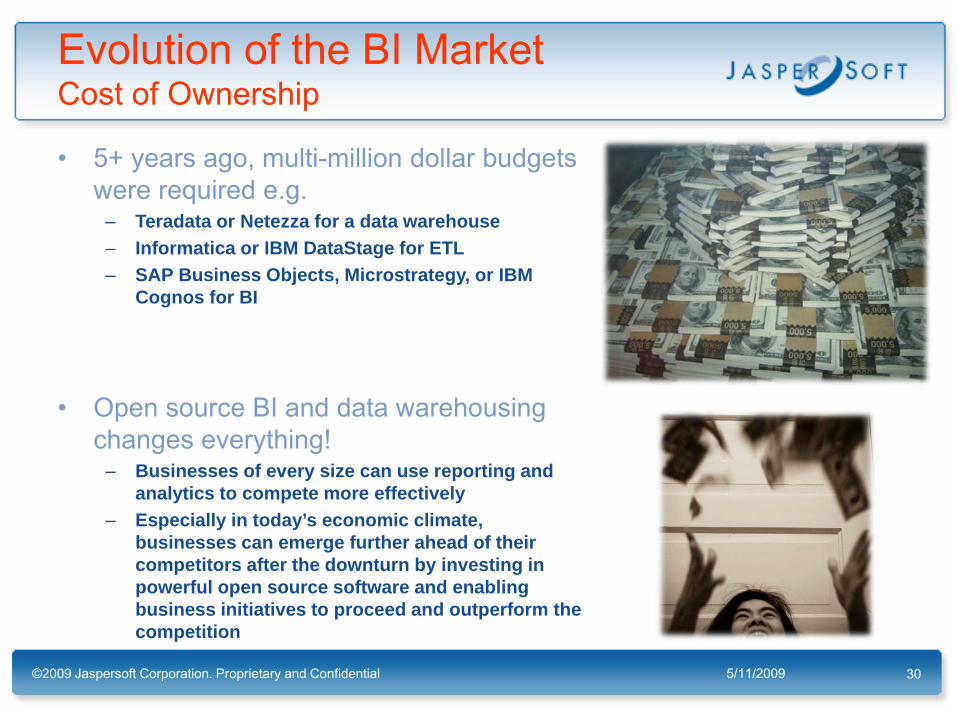
• 5+ years ago, multi-million dollar budgets were required e.g.
– Teradata or Netezza for a data warehouse– Informatica or IBM DataStage for ETL– SAP Business Objects, Microstrategy, or IBM
Cognos for BI
• Open source BI and data warehousing changes everything!
– Businesses of every size can use reporting and analytics to compete more effectively
– Especially in today’s economic climate, businesses can emerge further ahead of their competitors after the downturn by investing in powerful open source software and enabling business initiatives to proceed and outperform the competition
Evolution of the BI MarketCost of Ownership
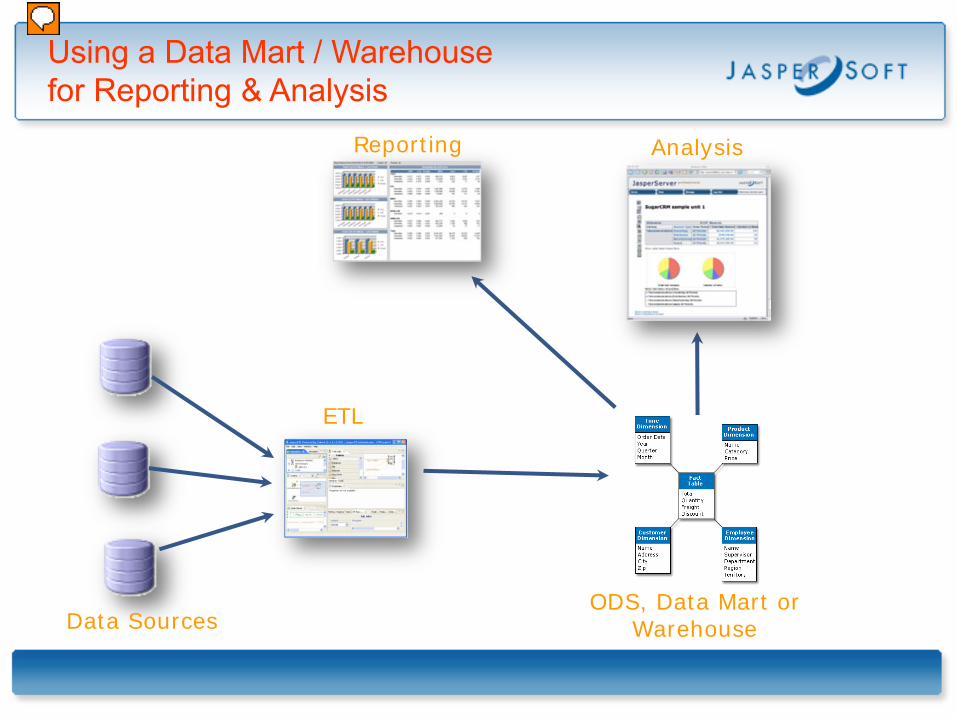
Using a Data Mart / Warehouse for Reporting & Analysis
Data SourcesODS, Data Mart or
Warehouse
Reporting Analysis
ETL
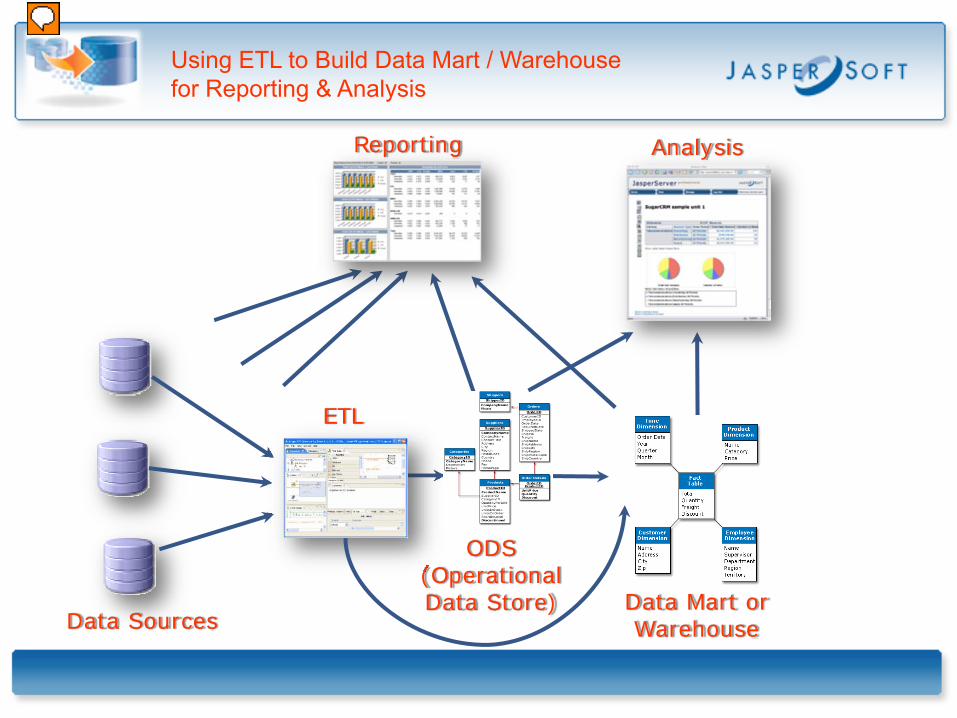
Using ETL to Build Data Mart / Warehouse for Reporting & Analysis
Data Sources
ODS (Operational Data Store) Data Mart or
Warehouse
Reporting Analysis
ETL
5/11/2009©2009 Jaspersoft Corporation. Proprietary and Confidential 33
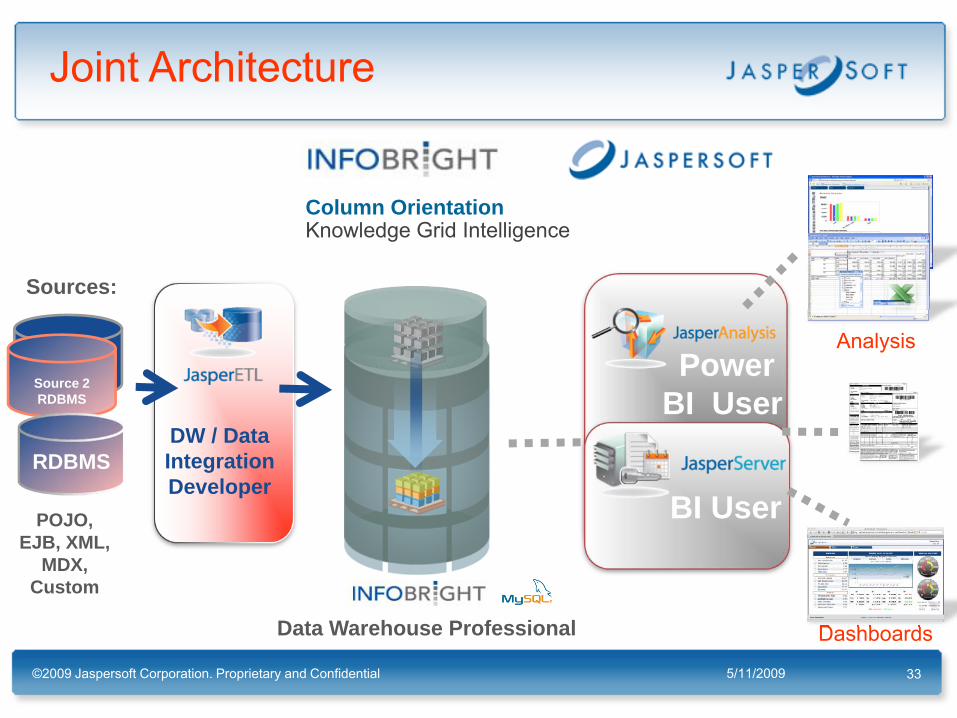
Dashboards
Source 1 RDBMS
Column OrientationKnowledge Grid Intelligence
Source 2RDBMS
RDBMS
POJO, EJB, XML,
MDX, Custom
Sources:
DW / Data Integration Developer
Data Warehouse Professional
BI User
Power BI User
Analysis
Joint Architecture
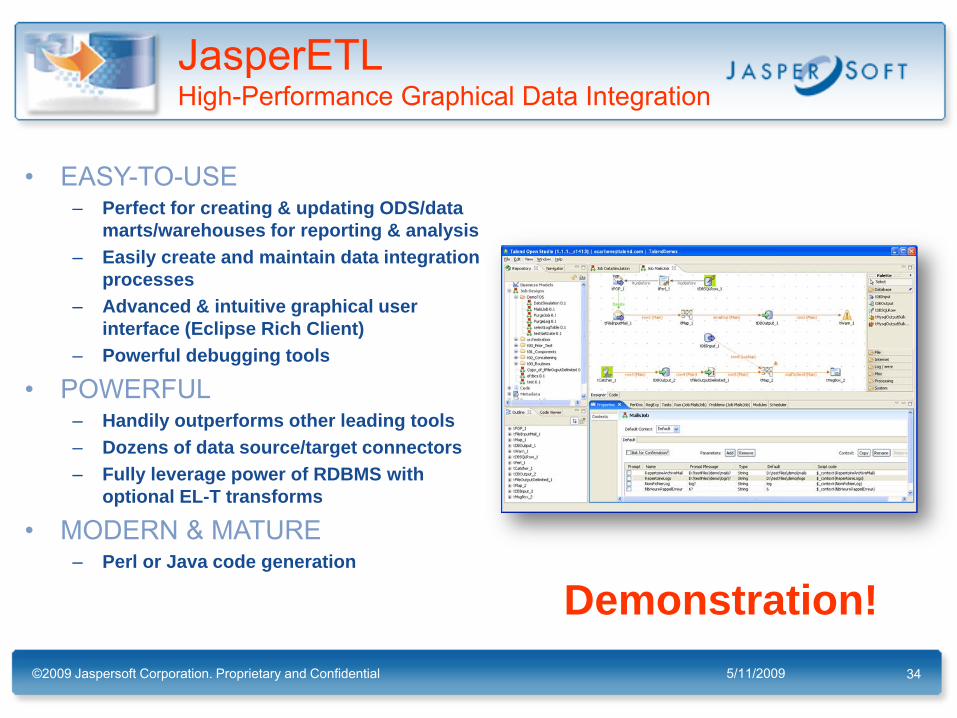
JasperETLHigh-Performance Graphical Data Integration
• EASY-TO-USE– Perfect for creating & updating ODS/data
marts/warehouses for reporting & analysis– Easily create and maintain data integration
processes– Advanced & intuitive graphical user
interface (Eclipse Rich Client)– Powerful debugging tools
• POWERFUL– Handily outperforms other leading tools– Dozens of data source/target connectors– Fully leverage power of RDBMS with
optional EL-T transforms
• MODERN & MATURE– Perl or Java code generation
5/11/2009©2009 Jaspersoft Corporation. Proprietary and Confidential 34
Demonstration!
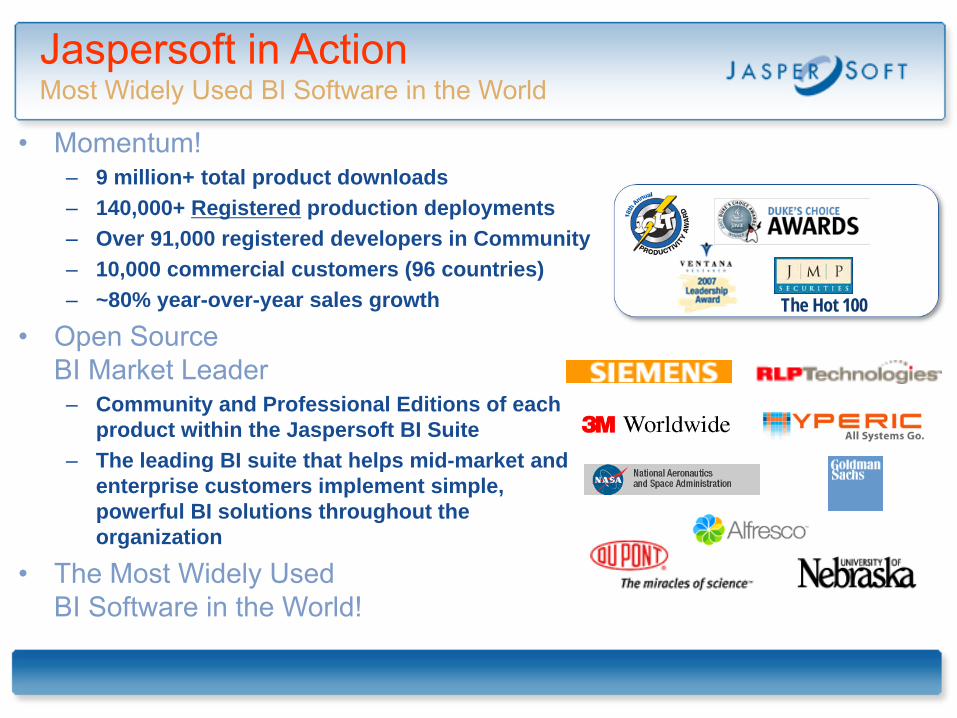
Jaspersoft in ActionMost Widely Used BI Software in the World
• Momentum!– 9 million+ total product downloads– 140,000+ Registered production deployments – Over 91,000 registered developers in Community– 10,000 commercial customers (96 countries)– ~80% year-over-year sales growth
• Open Source BI Market Leader
– Community and Professional Editions of each product within the Jaspersoft BI Suite
– The leading BI suite that helps mid-market and enterprise customers implement simple, powerful BI solutions throughout the organization
• The Most Widely Used BI Software in the World!
The Hot 100
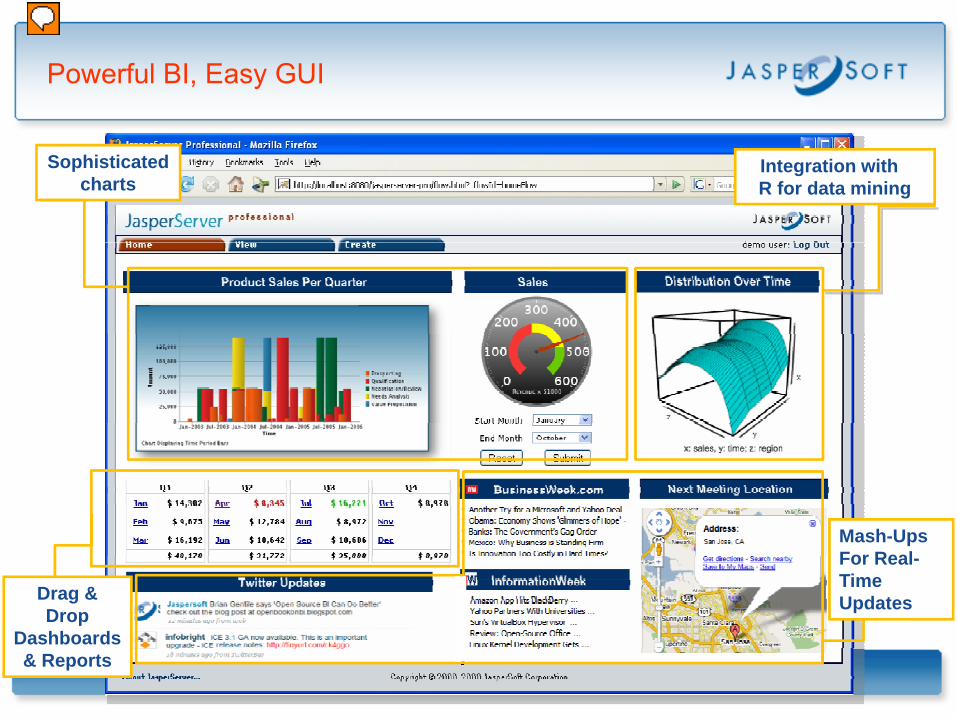
Powerful BI, Easy GUI
Integration with R for data mining
Sophisticated charts
Drag & Drop
Dashboards & Reports
Mash-UpsFor Real-TimeUpdates
Q & A
Web: www.jaspersoft.com
E-mail: [email protected]@[email protected]
[email protected]@jaspersoft.com
Phone: Germany: +49 (0)30 / 8939 1934
© 2009 Jaspersoft Corporation. Proprietary and Confidential 37