Embed Size (px)
Citation preview
UVA-F-1449-SSRN Version 4.3
This case was prepared by Professors James Tompkins and Robert Bruner from public information as a basis for classroom discussion. Copyright © 2004 by the University of Virginia Darden School Foundation, Charlottesville, VA. All rights reserved. To order copies, send an e-mail to [email protected]. No part of this publication may be reproduced, stored in a retrieval system, used in a spreadsheet, or transmitted in any form or by any means—electronic, mechanical, photocopying, recording, or otherwise—without the permission of the Darden School Foundation.
THE BOEING 7E7
We still have a lot to get done as we move toward authority to offer the 7E7 to our customers. The team is making great progress –understanding what our customer wants, developing an airplane that meets their needs, and defining a case that will demonstrate the value of the program.
—Michael Bair, Boeing Senior Vice President.1
In early 2003, Boeing announced plans to design and sell a new “super-efficient” jet dubbed the 7E7 and subsequently called the “Dreamliner.” But news over the next six months depressed a market for aircraft that was already in sharp contraction: the U.S. had gone to war against Iraq, spasms of global terrorism offered shocking headlines, and a deadly illness called SARS had resulted in global travel warnings—for these and other reasons, airline profitability was the worst seen in a generation. This seemed like an incredible environment in which to launch a major new airframe project. But on June 16, 2003, Michael Bair the leader of the 7E7 project, announced at the prestigious Paris Air Show that Boeing was making “excellent progress on the development of the 7E7 and continues to be on track to seek authority to offer the airplane.”2 Bair aimed to seek from Boeing’s Board of Directors early in 2004 a firm commitment to proceed with the project. If the Board approved the plan, he could start collecting orders from airlines and expect passengers to start flying the new jets in 2008. Between now and his recommendation to the Board he would need to complete a valuation of the 7E7 project and gain the support of Boeing’s CEO, Philip Condit and other senior managers. Would the financial analysis show that this project would be profitable for Boeing’s shareholders?
Origins of the 7E7 Project Boeing had not introduced a new commercial aircraft since it rolled out the highly
successful 777 in 1994. Later in the 1990s, however, Boeing announced and then cancelled two
1“Bair Provides Update on Boeing 7E7 Dreamliner.” Le Bourget, June 16, 2003. 2Ibid.
UVA-F-1449
-2-
new commercial aircraft programs. The most prominent of these was the “Sonic Cruiser” which promised to fly 15 to 20 percent faster than any commercial aircraft and bragged a sleek and futuristic design. Unfortunately for Boeing, after two years of developing the Sonic Cruiser, their potential customers were sending a message that passengers were not willing to pay a premium price for a faster ride. Boeing was now long overdue to develop a product that would pull it out of a financial slump and help it regain some of the commercial aircraft business it had lost over the years to Airbus, its chief rival.
With the 7E7, an Airbus executive argued that Boeing seemed to be promising a
“salesperson’s dream and engineer’s nightmare.”3 The 7E7 would carry between 200 and 250 passengers, be capable of both short domestic flights as well as long international hauls, use 20 percent less fuel than existing planes of its projected size and be 10 percent cheaper to operate than Airbus’s A330-200. At a time when major airlines were struggling to turn a profit, less fuel, cheaper operating costs, and long or short distance flexibility would be a very attractive package at the right price.
Skeptics of the 7E7 were not in short supply and suggested that the name “Dreamliner”
was appropriate. To make the plane more fuel efficient, the 7E7 would be the first commercial aircraft built substantially with carbon-reinforced material that was both stronger and lighter than aluminum. In addition, Boeing was promising greater fuel efficiency by using a more efficient engine. Boeing claimed that the use of composites would also reduce its manufacturing costs. The goal would be to design a plane with fewer components that could be assembled in three days as opposed to the existing 20 days it takes to rivet together the Boeing 767. The use of composite materials however had its risks. First, composite materials were suspected as a contributory cause to a plane crash in New York in 2001 and would therefore have to overcome regulatory scrutiny. Second, Boeing would have to radically change its production methods. The last time Boeing had made a major production change was in 1997 in an effort to cut costs. However, the process was not smooth, resulting in two production lines being shut down for 30 days and hundreds of missed airline deliveries.
The ability to produce a short and long distance aircraft would also have to overcome
engineering obstructions. Analysts argued that building a plane that would do short hops in Asia and long Trans-Atlantic flights would require two versions of the plane with different wingspans.4 Boeing engineers were considering the possibility of snap-on wing extensions. The question was whether this would be too costly and technically feasible.
Finally, there was the matter of Boeing’s board. Two of the most powerful members of
the 11-person Board, Harry Stonecipher and John McDonnell, were rumored to have raised serious cost concerns regarding the 7E7. While the cost of developing the 7E7 project could be as high as $10 billion, a veto threat could be imminent if that number did not shrink by billions. More specifically the Board wanted to keep 7E7 development costs down to only 40 percent of
3“Will Boeing’s New Idea Really Fly?” Business Week, June 23, 2003. 4Noted by Richard Aboulafia, a senior analyst at Teal Group consultant, ibid.
UVA-F-1449
-3-
what it took to develop the 777. Pressure from the Board was also to keep the 7E7 per-copy costs to only 60 percent of the 777 costs. In response, Philip Condit, Boeing’s CEO and Chairman, was quoted as saying that “Boeing has a responsibility to develop jetliners for less.”5 He knew however that if Boeing did not take bold risks in the commercial aircraft industry that their days as a serious competitor to Airbus could be numbered. Commercial Aircraft Industry
In 2002, two companies dominated the large plane (100+ seats) commercial aircraft industry: Boeing and Airbus. While Boeing had historically held the lead in this market, by a number of measures Airbus had become number one. In 2002, Airbus had received 233 commercial orders compared to Boeing’s 176 orders, representing 57 percent unit market share and an estimated 53.5 percent dollar value market share.6
Airbus Industrie Airbus was understandably proud of its growth. Established in 1970 by a consortium of
European companies, it took Airbus 23 years to deliver its first 1000 aircraft, another 6 years to deliver the next 1000 and only another 3 years (2002) to pass the 3000 aircraft milestone.7 In 1999, for the first time in its history, it recorded more plane orders than its rival Boeing. Airbus’s large plane commercial aircraft products included the A300/310, A320, A330/340 and A380 family. Airbus touted the A300/310 family as having the flexibility to serve short, medium, and extended-range routes. The widebody twin-engine aircraft was considered midsize with a typical passenger configuration of about 250 passengers. This family first flew passengers in 1983 and it was this aging fleet that provided a replacement opportunity for Boeing’s 7E7. However, while Boeing was betting on the future demand for midsized aircraft, Airbus had announced its A380, superjumbo four-engine jet in 2000. The A380 was due to fly in 2006 with a 550-passenger configuration and long distance range of up to 8000 miles. It would be the largest passenger aircraft ever built.
The Boeing Company
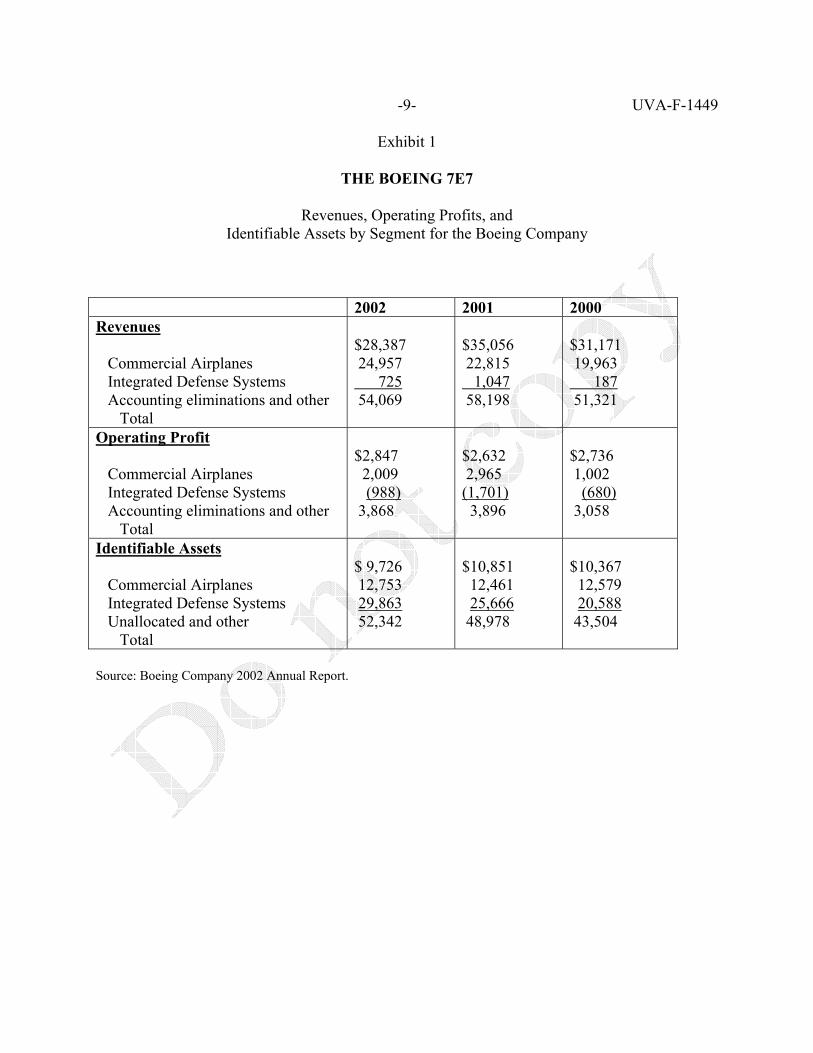
Boeing was split into two primary segments: Commercial Airplanes and Integrated Defense Systems. In 2002 it was awarded $16.6 billion in defense contracts second only to Lockheed Martin with $17.0 billion. Exhibit 1 shows that in 2002 each segment earned Boeing’s revenues almost equally. In addition, while commercial aircraft revenues had been falling,
5“Losing Ground to Airbus, Boeing Faces a Key Choice,” Wall Street Journal April 21, 2003. 62002 Commercial Results, www.airbus.com/ 7In 2001 Airbus formally became a single integrated entity through the transfer of Airbus related assets to the
newly incorporated company owned 80 percent by EADS (European Aeronautic Defense and Space Company) and 20 percent by BAE systems.

UVA-F-1449
-4-
defense revenues had been rising. Analysts believed that Boeing enjoyed significant technology transfers from the defense R&D to the commercial aircraft segment.
The commercial aircraft segment produced and sold six main airframes designed to meet the needs of the short to long-range markets: the 717, 737, and 757 standard-body models, and the 747, 767 and 777 wide-body models. As of December 31, 2002, Boeing had undelivered units under firm order of 1083 commercial aircraft and a declining backlog of about $68 billion. For 2003 they projected 280 commercial aircraft deliveries and between 275 and 300 in 2004. Boeing estimated that the revenues for its commercial airplanes segment in 2003 would be approximately $22 billion, down from $28 billion in 2002. Recognizing the negative impact of the September 11 attacks on commercial aircraft demand, Boeing cut the production rates for 2002 in half and was able to maintain profitability in the segment.
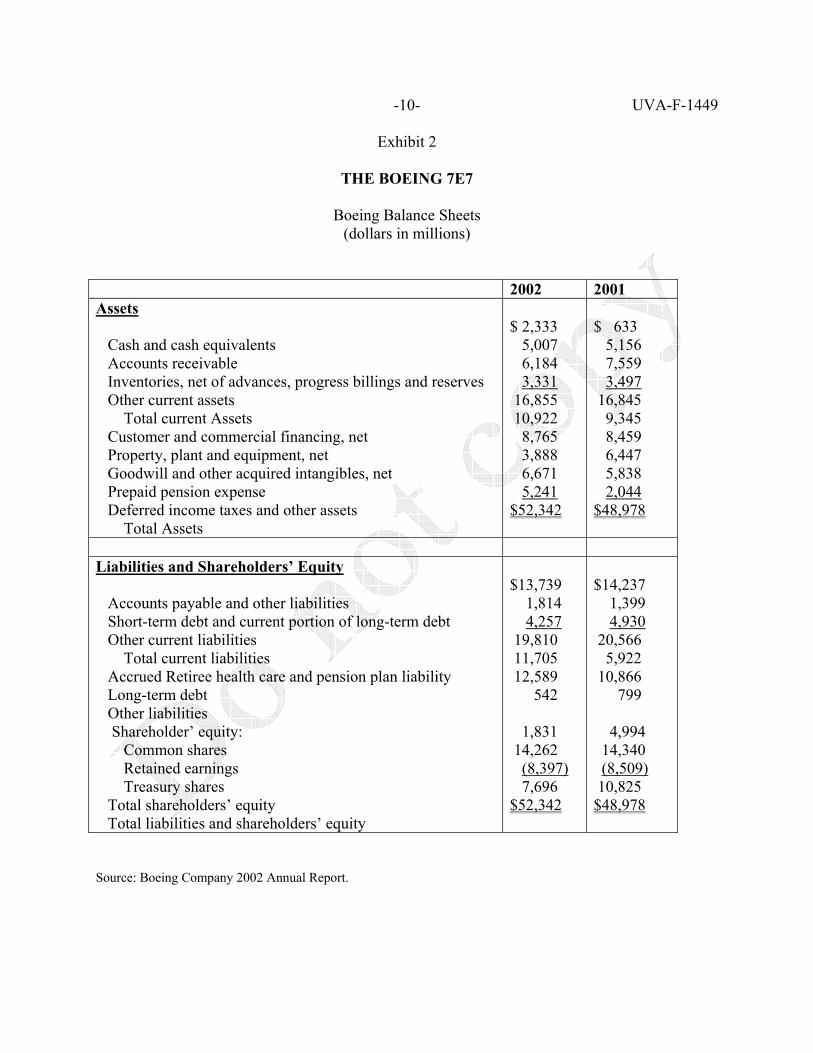
Exhibits 2 and 3 show Boeing’s balance sheet and income statement respectively. While
Boeing’s earnings were down significantly from 2001 to 2002, most of this was the result of an accounting change (SFAS No. 142). However, also contributing to the decline was a drop in commercial airplane deliveries from 527 in 2001 to 381 in 2002. Demand for Commercial Aircraft
The long-term outlook for aircraft demand seemed positive.8 Boeing’s Market Outlook said:
In the short term, air travel is influenced by business cycles, consumer confidence, and exogenous events. Over the long-term, cycles smooth out and GDP, international trade, lower fares, and network service improvements become paramount. During the next 20 years, economies will grow annually by 3.2 percent, and air travel will continue its historic relationship with GDP by growing at an average annual rate of 5.1 percent.
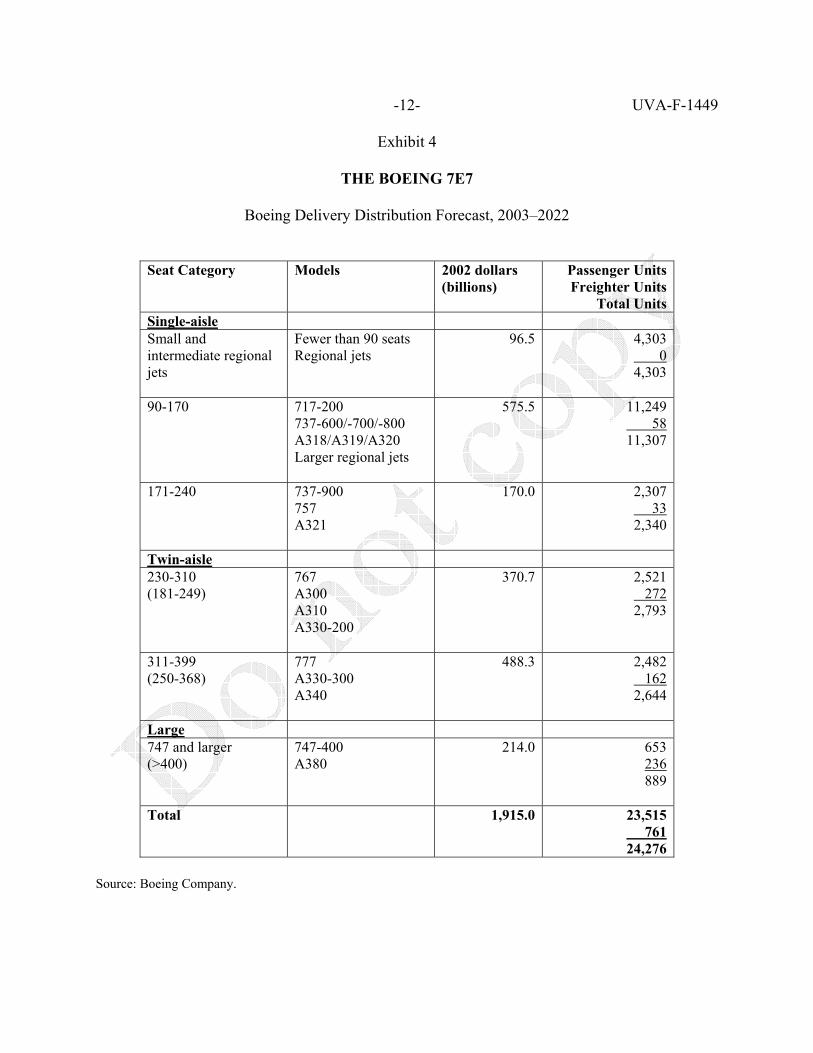
As shown in Exhibit 4, Boeing’s 20-year forecast from 2003 to 2022 was for 24,276 new commercial aircraft valued at $1.9 trillion in 2002 U.S. dollars. The company predicted a composition of 4,303 smaller regional jets (fewer than 90 seats); 13,647 single-aisle airplanes; 5,437 intermediate twin-aisle airplanes, and 889 747-size or larger airplanes. This prediction reflected a world fleet that would more than double with a fourth of the market coming from aircraft replacement and three fourths from projected passenger and cargo growth. Exhibit 5 illustrates Airbus’s 20-year predictions for the years 2000-2020. Although the report was dated 2002, because of the September 11 attacks, numbers included the year 2000 to serve as a benchmark year. For this period, Airbus predicted the delivery of 15,887 new
8The primary sources for commercial aircraft demand estimates include Boeing’s 2003 Current Market Outlook
and Airbus’s 2002 Global Market Forecast 2001-2020. While both reports recognized the negative effects of “exogenous events” such as September 11, 2001, they also both agreed on a healthy long-term outlook.
UVA-F-1449
-5-
commercial aircraft with a value of $1.5 trillion in 2002 U.S. dollars. This included 10,201 single-aisle aircraft; 3,842 twin-aisle aircraft; 1,138 very large aircraft, and 706 freighters. The 15,887-unit forecast did not include planes with less than 90 seats. Although Boeing and Airbus’s numbers are not directly comparable due to the slightly different time periods and aircraft classifications, it appeared that Airbus was more optimistic about the market for large aircraft than Boeing. While Airbus predicted this to be a $270 billion dollar market including 1138 passenger units, Boeing projected only $214 billion with 653 passenger units. Boeing however estimated that the share of intermediate-size planes would increase from 18 percent to 22 percent. In their forecast, they acknowledged that intermediate-size airplanes would allow airlines to economically fly the increased frequencies, city pairs, and non-stop flights requested by passengers. According to a recent study by Frost & Sullivan, they believed that the Airbus market projection for the A380 was “over-optimistic.”9 Aircraft Development and Life Cycle
The development of a new airframe was characterized by huge initial cash outflows that might require between one and two decades to recoup. For example, the development costs for the Boeing 777 were rumored to be $7 billion. Any pricing would not only have to recoup the up-front development costs, but also the production costs. In addition, pricing would be subject to rigorous competitive pressures. In short, because of the financial strains a new product line might create, each new aircraft was a “bet the ranch” proposition. Over time, survival in the industry depended on introducing successful products and having the financial “deep pockets” with which to survive the cash-flow trough.
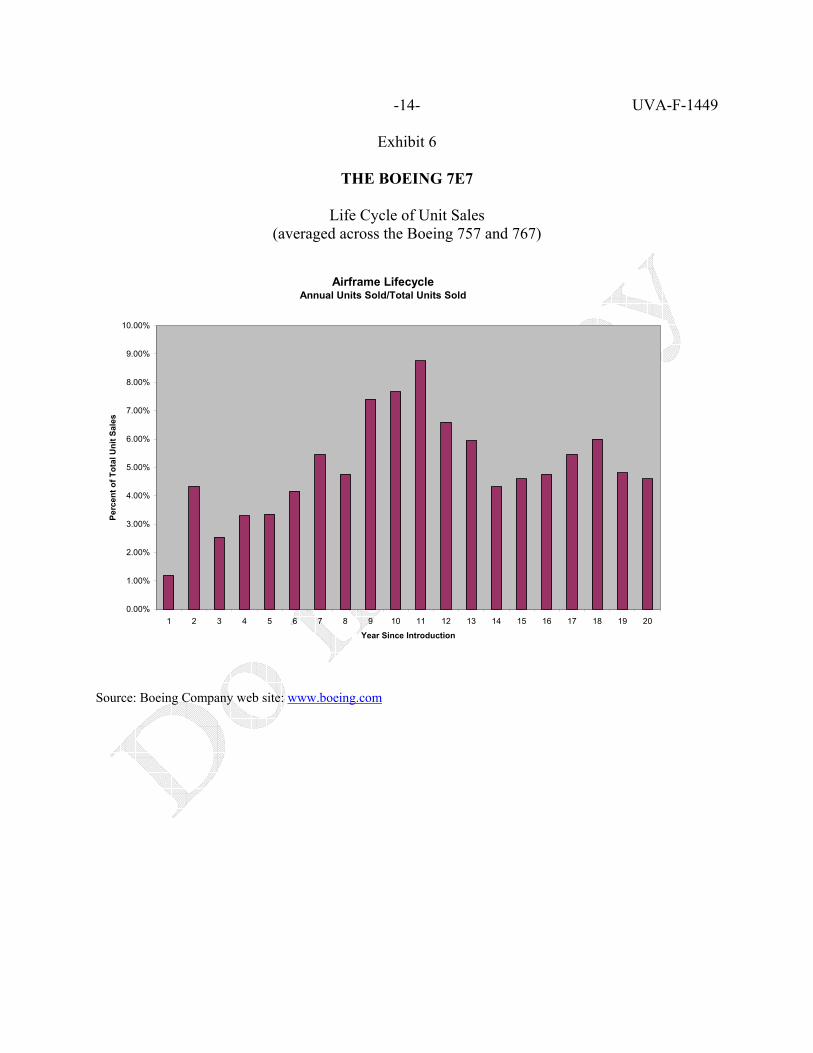
While aircraft sales were subject to short term cyclical deviations, there was some degree
of predictability in sales. Sales would typically peak shortly after the new aircraft introduction and then fall. Thereafter, sales would rise and fall as derivatives of the aircraft were offered. Exhibit 6 shows such cycles for the first 20 years of the 757 and 767 sales. The 7E7
The concept of the 7E7 was driven by customer requirements. Boeing had originally announced in March 2001 its plans to build the Sonic Cruiser, a plane that would fly just below the speed of sound. The success of the Cruiser depended on whether passengers would pay a premium for a faster flight. However, potential airplane customers who had been interested in the Cruiser during a robust commercial air travel market were now focusing on survival. The events of September 11 and the bursting of the technology bubble had led to a significant decline in airplane orders. As a result Boeing solicited updated feedback from a number of potential customers who would soon need to replace their aging fleet of midrange planes such as the 757s,
9“An Ongoing Rivalry”, Avionics Today, August 2003.
UVA-F-1449
-6-
767s, A300s, A310s, A321s, and A330s. Overwhelmingly the revised message from customers was for a plane with lower operating costs.
Based on discussions with over 40 airlines throughout the world, Mike Bair identified a
market to replace midsize planes based not only on lower operating costs, but also a market to allow a midsize plane to go long distances previously only viable by large planes such as the 747. Such flexibility would allow airlines to offer non-stop service on routes that require long range but did not justify larger-sized airplanes. Bair estimated there to be more than 400 city pairs (e.g. Atlanta-Athens) that could be efficiently served on a non-stop basis by the 7E7.
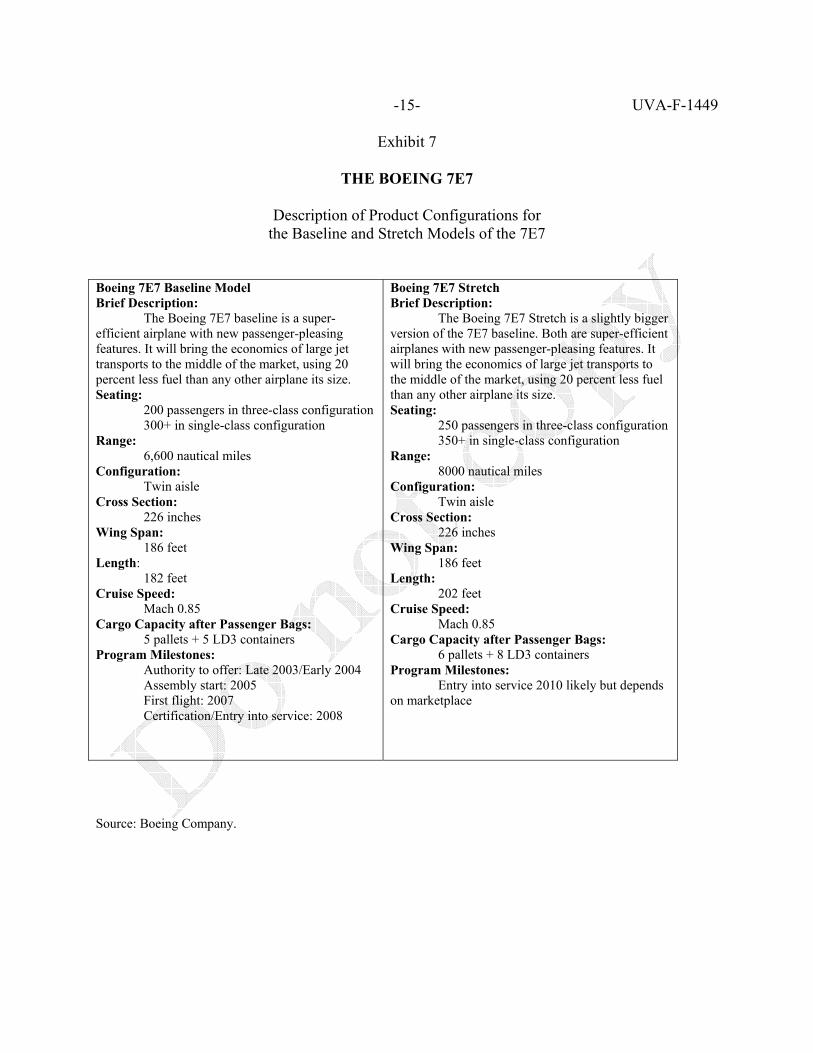
Boeing was considering two members for the 7E7 family, a basic and stretch version.
Exhibit 7 gives Boeing’s description of the two configurations. Other improvements for passengers included wider aisles, lower cabin altitude and increased cabin humidity. In addition, the planes would include systems that provided in-flight entertainment and internet access, real-time airplane systems and structure health monitoring, and crew connectivity. Furthermore, Boeing claimed the 7E7 would have the smallest sound “footprint” with the quietest takeoffs and landings in its class.
Boeing projected a demand for between 2000 and 3000 planes of the 7E7 type within 20 years of each copy entering service. A study by Frost & Sullivan predicted the sale of “at least 2000 B7E7s.”10 However, the demand was highly dependent on whether Boeing could deliver the promised 20 percent cheaper fuel costs and the range flexibility in a mid-size aircraft. Furthermore, if the range flexibility did require “snap-on” wings, such a design may significantly increase the building costs of the aircraft. Not only did Boeing face the engineering uncertainty of being able to deliver such an aircraft, but also the risk of its duplication by Airbus. Airbus had already made the statement that if the fuel efficiency was primarily generated by new engine designs, then it would simply order the more efficient engines for its planes. Any uncertainty in the 7E7 plane specifications and risk of competition clearly put downward pressure on both the price Boeing could demand as well as the number of units it would be able to sell. Financial Forecast and Analysis
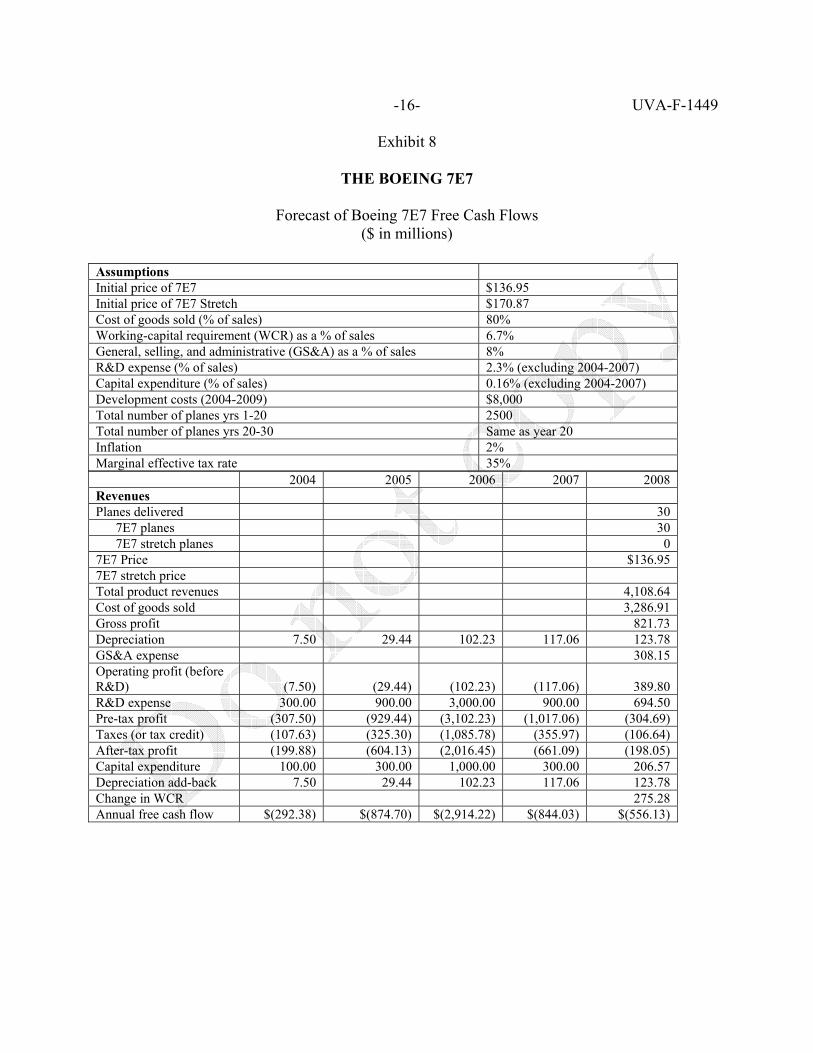
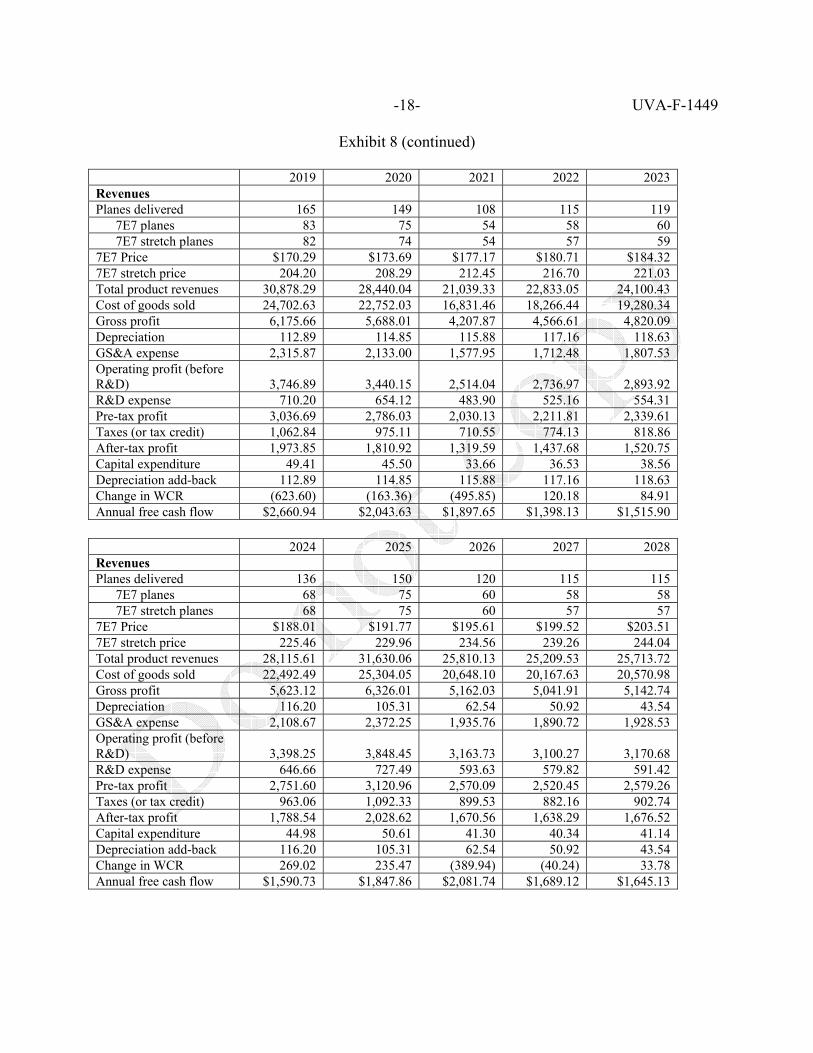
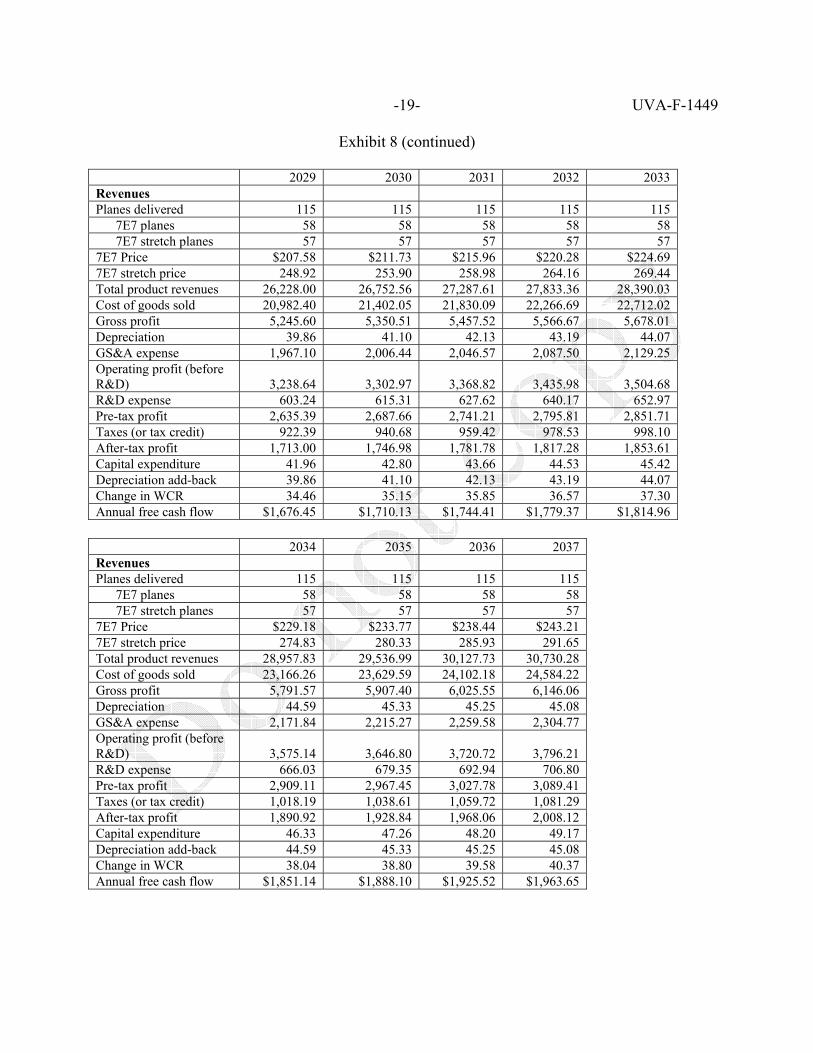
Exhibit 8 contains a 20-year forecast of free cash flows from the Boeing 7E7 project consistent with public information released by Boeing, Airbus, analysts, and other experts in the field. The appendix to this exhibit discusses these forecast assumptions in detail. The primary implication of the forecast is that the 7E7 project would provide an internal rate of return close to 16 percent. This assumes that Boeing would not only deliver the promised plane specifications, but that Airbus would be unable to replicate the 7E7 efficiencies.
Based on analysts’ and Boeing’s expectations, the base case assumes that Boeing could
sell 2500 units in the first 20 years of delivery. Pricing was estimated by using 2002 prices for
10Ibid.

UVA-F-1449
-7-
Boeing’s 777 and 767. The 7E7 would be a hybrid of these two planes in terms of the number of passengers and range. By interpolating between the 777 and 767 prices, it was possible to estimate the value placed on range and number of passengers. Using this methodology, without any premium for the promised lower operating costs, the minimum price for the 7E7 and 7E7 Stretch was estimated to be $114.5 and $144.5 million respectively in 2002 dollars. The forecast assumed that customers would be willing to pay a 5 percent price premium for the lower operating costs.
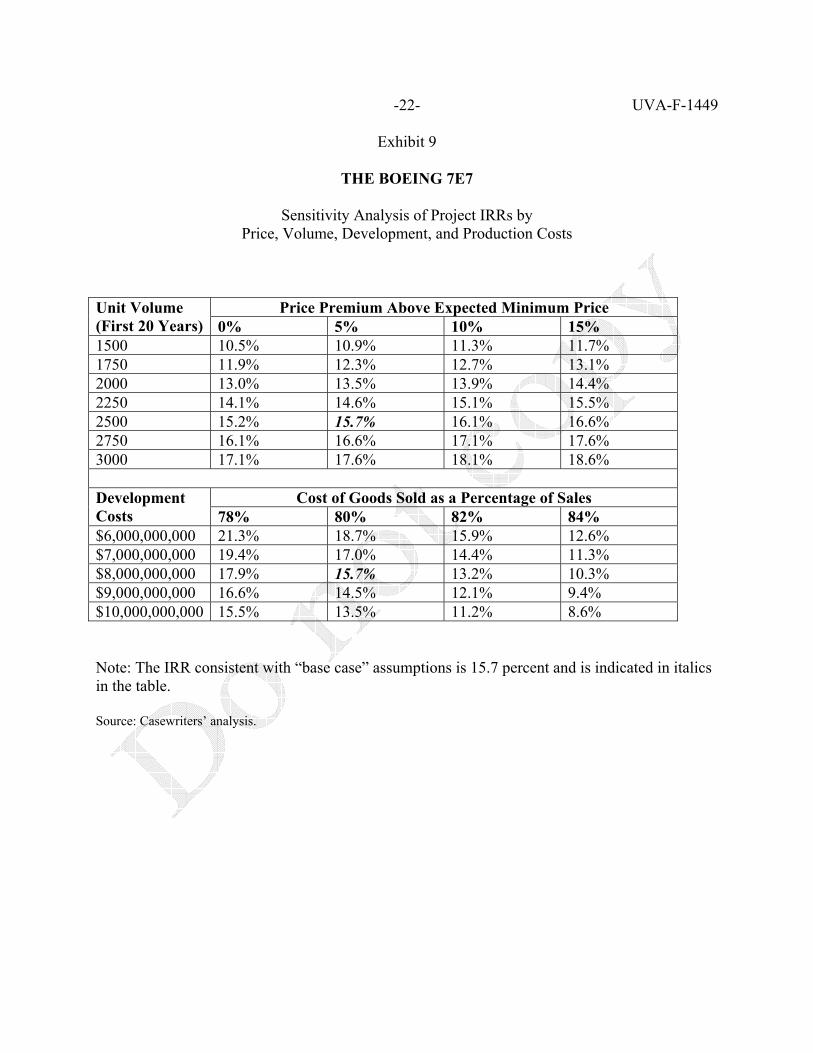
The Internal Rate of Return (IRR) consistent with “base case” assumptions was 15.7 percent. But the estimate of IRR was sensitive to variations in various assumptions. In particular, some obvious uncertainties would be the number of units that Boeing would be able to sell and at what price. For example, if Boeing only sold 1,500 units in the first 20 years, then, as shown in Exhibit 9, the internal rate of return would drop to 11 percent—this might occur if air travel demand worsened or if Airbus entered this segment with a new competing product.
Also unknown were the development costs and the per-copy costs to build the 7E7. Boeing’s Board was anxious to minimize these. The forecast assumes $8 billion for development costs; however, analyst estimates had been in the $6 to $10 billion range. The cost to manufacture the 7E7 was also subject to great uncertainty. On the one hand, engineers were challenged to feasibly build a mid-size aircraft with long-range capabilities. However, the engineering design to achieve this could push building costs up significantly. Conversely, if Boeing succeeded in using composite materials, which required a fraction of the normal assembly time, then construction costs would be lower. Consistent with Boeing’s historic track record, the base case assumes 80 percent as the percentage of cost of goods sold to sales. However, as shown in Exhibit 9, the internal rate of return of the 7E7 was very sensitive to keeping production costs low. Cost of Capital
Boeing’s weighted average cost of capital (WACC) could be estimated using the well-known formula: WACC = (percent Debt)(rd)(1 – tc) + (percent Equity)(re) where rd = Pretax cost of debt capital tc = Marginal effective corporate tax rate percent Debt = Proportion of debt in a market-value capital structure re = Cost of equity capital percent Equity = Proportion of equity in a market-value capital structure
UVA-F-1449
-8-
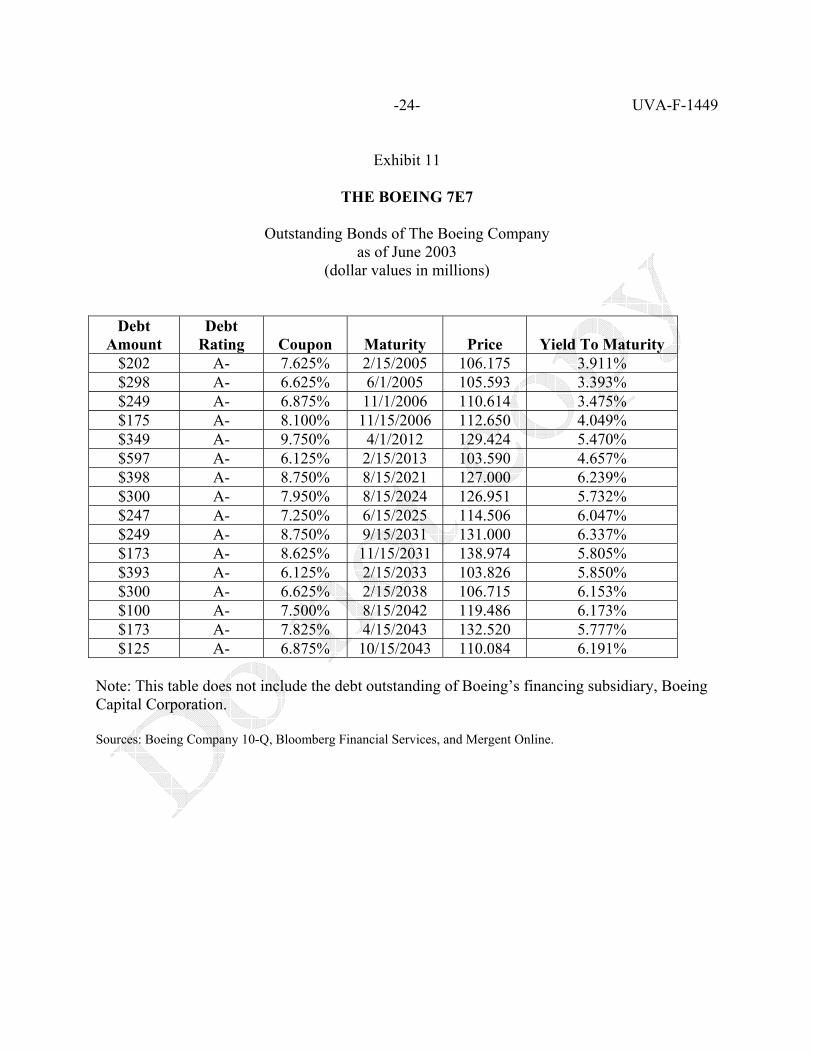
Exhibit 10 gives information about betas and debt/equity ratios for Boeing and comparable companies. Exhibit 11 provides information about Boeing’s outstanding debt issues. While Boeing’s marginal effective tax rate had been smaller in the past, it was expected to be 35 percent. In June 2003, the yield on the 3-month U.S. Treasury bill was 0.85 percent, and the yield on the 30-year Treasury bond was 4.56 percent. On June 16, 2003, Boeing’s stock price closed at $36.41.
Analysts had pointed out that Boeing actually consisted of two separate businesses, the
relatively more stable defense business and the more volatile commercial business. Defense corporations had been beneficiaries when the world became unstable since the terrorist attacks on September 11, 2001. Furthermore, the U.S. along with some of its allies went to war against Iraq on March 20, 2003. While Bush had declared an end to major Iraq combat operations on May 1, 2003, as of June 16, attacks and killings in Iraq continued on a daily basis. A different type of risk had emanated with the outbreak of SARS. On February 1, 2003, China had announced this deadly and contagious illness that had since spread to Canada and Australia. As of June 16, travel warnings were still outstanding. Thus, the question arose of whether one should estimate Boeing’s cost of capital to serve as a benchmark-required rate of return. Would a required return on a portfolio of these two businesses be appropriate for evaluating the 7E7 project? If necessary, how might it be possible to isolate a required return for commercial aircraft? Conclusion
Within the aircraft-manufacturing industry, the magnitude of risk posed by the launching of a major new aircraft was accepted as a matter of course. With huge up-front capital costs in an environment of intense technology and price competition, there was no guarantee of success and major significant losses if the gamble did not pay off. At a time of great political and economic uncertainty Bair said
Clearly, we have to make a compelling business proposition. It could be we’ll still be in a terrible business climate in 2004. But you can’t let what’s happening today cause you to make bad decisions for this very long business cycle. This plane is very important to our future.11 Central to any recommendation he would make to Boeing’s Board of Directors was an
assessment of the economic profitability of the 7E7 project. Would the project compensate the shareholders of Boeing for the risks and use of their capital? Were there other considerations that might mitigate the economic analysis? For instance, to what extent might organizational and strategic considerations influence the board? If Boeing did not undertake the 7E7, would Boeing be conceding leadership of the commercial aircraft business to Airbus?
11“New Team, Name for Boeing ‘Super-Efficient’ Jet,” Seattle Times, January 30, 2003.
UVA-F-1449
-9-
Exhibit 1
THE BOEING 7E7
Revenues, Operating Profits, and Identifiable Assets by Segment for the Boeing Company
2002 2001 2000 Revenues
Commercial Airplanes Integrated Defense Systems Accounting eliminations and other Total
$28,387 24,957 725 54,069
$35,056 22,815 1,047 58,198
$31,171 19,963 187 51,321
Operating Profit
Commercial Airplanes Integrated Defense Systems Accounting eliminations and other Total
$2,847 2,009 (988) 3,868
$2,632 2,965 (1,701) 3,896
$2,736 1,002 (680) 3,058
Identifiable Assets
Commercial Airplanes Integrated Defense Systems Unallocated and other Total
$ 9,726 12,753 29,863 52,342
$10,851 12,461 25,666 48,978
$10,367 12,579 20,588 43,504
Source: Boeing Company 2002 Annual Report.
UVA-F-1449
-10-
Exhibit 2
THE BOEING 7E7
Boeing Balance Sheets (dollars in millions)
2002 2001 Assets
Cash and cash equivalents Accounts receivable Inventories, net of advances, progress billings and reserves Other current assets Total current Assets Customer and commercial financing, net Property, plant and equipment, net Goodwill and other acquired intangibles, net Prepaid pension expense Deferred income taxes and other assets Total Assets
$ 2,333 5,007 6,184 3,331 16,855 10,922 8,765 3,888 6,671 5,241 $52,342
$ 633 5,156 7,559 3,497 16,845 9,345 8,459 6,447 5,838 2,044 $48,978
Liabilities and Shareholders’ Equity
Accounts payable and other liabilities Short-term debt and current portion of long-term debt Other current liabilities Total current liabilities Accrued Retiree health care and pension plan liability Long-term debt Other liabilities Shareholder’ equity: Common shares Retained earnings Treasury shares Total shareholders’ equity Total liabilities and shareholders’ equity
$13,739 1,814 4,257 19,810 11,705 12,589 542 1,831 14,262 (8,397) 7,696 $52,342
$14,237 1,399 4,930 20,566 5,922 10,866 799 4,994 14,340 (8,509) 10,825 $48,978
Source: Boeing Company 2002 Annual Report.

UVA-F-1449
-11-
Exhibit 3
THE BOEING 7E7
Boeing Income Statements (dollars in millions except per share data)
2002 2001Sales and other operating revenues Cost of products and services General and administrative expense Research and development expense Impact of September 11, 2001 charges/(recoveries) Other operating expenses Earnings from operations Other income/(expense) Interest and debt expense Earnings before income taxes Income taxes* Net earnings before cumulative effect of accounting change Cumulative effect of accounting change, net of tax Net earnings Earnings per share
$54,069 45,499 2,534 1,639
(2) 531 3,868 42
(730) 3,180 861 2,319
(1,827) $ 492
$ 0.62
$58,198 48,778 2,389 1,936 935 264 3,896 318
(650) 3,564 738 2,826 1$ 2,827
$ 3.46
Notes: *Boeing’s average tax rate consistent with reported financial performance for 2002 was 27 percent. Yet Boeing’s marginal effective tax rate was 35 percent. Source: Boeing Company, 2002 Annual Report.
UVA-F-1449
-12-
Exhibit 4
THE BOEING 7E7
Boeing Delivery Distribution Forecast, 2003–2022
Seat Category Models 2002 dollars (billions)
Passenger UnitsFreighter Units
Total UnitsSingle-aisle Small and intermediate regional jets
Fewer than 90 seats Regional jets
96.5 4,303 0 4,303
90-170 717-200 737-600/-700/-800 A318/A319/A320 Larger regional jets
575.5 11,249 58 11,307
171-240 737-900 757 A321
170.0 2,307 33 2,340
Twin-aisle 230-310 (181-249)
767 A300 A310 A330-200
370.7 2,521 272 2,793
311-399 (250-368)
777 A330-300 A340
488.3 2,482 162 2,644
Large 747 and larger (>400)
747-400 A380
214.0 653 236 889
Total 1,915.0 23,515 76124,276
Source: Boeing Company.

UVA-F-1449
-13-
Exhibit 5
THE BOEING 7E7
Airbus Delivery Distribution Forecast, 2000–2020
Seat Category (number of seats)
Examples of Models 2002 dollars
(billions)
Units
Single-aisle (passenger)
(100-210)
A318, A319, A320, A321
609 10,201
Twin-aisle (passenger) (250-400)
A330, A340
524 3,842
Very Large (passenger) (>400)
A380 270 1,138
Freighters
106 706
Total 1,509 15,887 Source: Boeing Company.
UVA-F-1449
-14-
Exhibit 6
THE BOEING 7E7
Life Cycle of Unit Sales (averaged across the Boeing 757 and 767)
Airframe LifecycleAnnual Units Sold/Total Units Sold
0.00%
1.00%
2.00%
3.00%
4.00%
5.00%
6.00%
7.00%
8.00%
9.00%
10.00%
1 2 3 4 5 6 7 8 9 10 11 12 13 14 15 16 17 18 19 20
Year Since Introduction
Perc
ent o
f Tot
al U
nit S
ales
Source: Boeing Company web site: www.boeing.com
UVA-F-1449
-15-
Exhibit 7
THE BOEING 7E7
Description of Product Configurations for the Baseline and Stretch Models of the 7E7
Boeing 7E7 Baseline Model Brief Description: The Boeing 7E7 baseline is a super-efficient airplane with new passenger-pleasing features. It will bring the economics of large jet transports to the middle of the market, using 20 percent less fuel than any other airplane its size. Seating: 200 passengers in three-class configuration 300+ in single-class configuration Range: 6,600 nautical miles Configuration: Twin aisle Cross Section: 226 inches Wing Span: 186 feet Length: 182 feet Cruise Speed: Mach 0.85 Cargo Capacity after Passenger Bags: 5 pallets + 5 LD3 containers Program Milestones: Authority to offer: Late 2003/Early 2004 Assembly start: 2005 First flight: 2007 Certification/Entry into service: 2008
Boeing 7E7 Stretch Brief Description: The Boeing 7E7 Stretch is a slightly bigger version of the 7E7 baseline. Both are super-efficient airplanes with new passenger-pleasing features. It will bring the economics of large jet transports to the middle of the market, using 20 percent less fuel than any other airplane its size. Seating: 250 passengers in three-class configuration 350+ in single-class configuration Range: 8000 nautical miles Configuration: Twin aisle Cross Section: 226 inches Wing Span: 186 feet Length: 202 feet Cruise Speed: Mach 0.85 Cargo Capacity after Passenger Bags: 6 pallets + 8 LD3 containers Program Milestones: Entry into service 2010 likely but depends on marketplace
Source: Boeing Company.
UVA-F-1449
-16-
Exhibit 8
THE BOEING 7E7
Forecast of Boeing 7E7 Free Cash Flows ($ in millions)
2004 2005 2006 2007 2008 Revenues Planes delivered 30 7E7 planes 30 7E7 stretch planes 0 7E7 Price $136.95 7E7 stretch price Total product revenues 4,108.64 Cost of goods sold 3,286.91 Gross profit 821.73 Depreciation 7.50 29.44 102.23 117.06 123.78 GS&A expense 308.15 Operating profit (before R&D) (7.50) (29.44) (102.23) (117.06) 389.80 R&D expense 300.00 900.00 3,000.00 900.00 694.50 Pre-tax profit (307.50) (929.44) (3,102.23) (1,017.06) (304.69) Taxes (or tax credit) (107.63) (325.30) (1,085.78) (355.97) (106.64) After-tax profit (199.88) (604.13) (2,016.45) (661.09) (198.05) Capital expenditure 100.00 300.00 1,000.00 300.00 206.57 Depreciation add-back 7.50 29.44 102.23 117.06 123.78 Change in WCR 275.28 Annual free cash flow $(292.38) $(874.70) $(2,914.22) $(844.03) $(556.13)
Assumptions Initial price of 7E7 $136.95 Initial price of 7E7 Stretch $170.87 Cost of goods sold (% of sales) 80% Working-capital requirement (WCR) as a % of sales 6.7% General, selling, and administrative (GS&A) as a % of sales 8% R&D expense (% of sales) 2.3% (excluding 2004-2007) Capital expenditure (% of sales) 0.16% (excluding 2004-2007) Development costs (2004-2009) $8,000 Total number of planes yrs 1-20 2500 Total number of planes yrs 20-30 Same as year 20 Inflation 2% Marginal effective tax rate 35%

UVA-F-1449
-17-
Exhibit 8 (continued) 2009 2010 2011 2012 2013 Revenues Planes delivered 108 64 82 84 104 7E7 planes 108 51 41 42 52 7E7 stretch planes 0 13 41 42 52 7E7 Price $139.69 $142.49 $145.34 $148.24 $151.21 7E7 stretch price 170.87 174.28 177.77 181.33 Total product revenues 15,086.93 9,488.14 13,104.49 13,692.60 17,291.79 Cost of goods sold 12,069.55 7,590.51 10,483.59 10,954.08 13,833.44 Gross profit 3,017.39 1,897.63 2,620.90 2,738.52 3,458.36 Depreciation 123.80 115.66 108.67 102.83 99.64 GS&A expense 1,131.52 711.61 982.84 1,026.94 1,296.88 Operating profit (before R&D) 1,762.06 1,070.36 1,529.40 1,608.75 2,061.83 R&D expense 647.00 218.23 301.40 314.93 397.71 Pre-tax profit 1,115.06 852.13 1,227.99 1,293.82 1,664.12 Taxes (or tax credit) 390.27 298.25 429.80 452.84 582.44 After-tax profit 724.79 553.89 798.19 840.98 1,081.68 Capital expenditure 124.14 15.18 20.97 21.91 27.67 Depreciation add-back 123.80 115.66 108.67 102.83 99.64 Change in WCR 735.55 (375.12) 242.30 39.40 241.15 Annual free cash flow $(11.09) $1,029.48 $643.60 $882.50 $912.51 2014 2015 2016 2017 2018 Revenues Planes delivered 136 119 185 192 219 7E7 planes 68 60 93 96 110 7E7 stretch planes 68 59 92 96 109 7E7 Price $154.23 $157.32 $160.46 $163.67 $166.95 7E7 stretch price 184.95 188.65 192.42 196.27 200.20 Total product revenues 23,064.59 20,569.48 32,626.19 34,554.82 40,185.75 Cost of goods sold 18,451.67 16,455.59 26,100.95 27,643.86 32,148.60 Gross profit 4,612.92 4,113.90 6,525.24 6,910.96 8,037.15 Depreciation 99.95 100.84 103.70 106.87 110.54 GS&A expense 1,729.84 1,542.71 2,446.96 2,591.61 3,013.93 Operating profit (before R&D) 2,783.12 2,470.35 3,974.57 4,212.48 4,912.68 R&D expense 530.49 473.10 750.40 794.76 924.27 Pre-tax profit 2,252.64 1,997.25 3,224.17 3,417.72 3,988.40 Taxes (or tax credit) 788.42 699.04 1,128.46 1,196.20 1,395.94 After-tax profit 1,464.21 1,298.21 2,095.71 2,221.52 2,592.46 Capital expenditure 36.90 32.91 52.20 55.29 64.30 Depreciation add-back 99.95 100.84 103.70 106.87 110.54 Change in WCR 386.78 (167.17) 807.80 129.22 377.27 Annual free cash flow $1,140.48 $1,533.31 $1,339.41 $2,143.88 $2,261.44
UVA-F-1449
-18-
Exhibit 8 (continued) 2019 2020 2021 2022 2023 Revenues Planes delivered 165 149 108 115 119 7E7 planes 83 75 54 58 60 7E7 stretch planes 82 74 54 57 59 7E7 Price $170.29 $173.69 $177.17 $180.71 $184.32 7E7 stretch price 204.20 208.29 212.45 216.70 221.03 Total product revenues 30,878.29 28,440.04 21,039.33 22,833.05 24,100.43 Cost of goods sold 24,702.63 22,752.03 16,831.46 18,266.44 19,280.34 Gross profit 6,175.66 5,688.01 4,207.87 4,566.61 4,820.09 Depreciation 112.89 114.85 115.88 117.16 118.63 GS&A expense 2,315.87 2,133.00 1,577.95 1,712.48 1,807.53 Operating profit (before R&D) 3,746.89 3,440.15 2,514.04 2,736.97 2,893.92 R&D expense 710.20 654.12 483.90 525.16 554.31 Pre-tax profit 3,036.69 2,786.03 2,030.13 2,211.81 2,339.61 Taxes (or tax credit) 1,062.84 975.11 710.55 774.13 818.86 After-tax profit 1,973.85 1,810.92 1,319.59 1,437.68 1,520.75 Capital expenditure 49.41 45.50 33.66 36.53 38.56 Depreciation add-back 112.89 114.85 115.88 117.16 118.63 Change in WCR (623.60) (163.36) (495.85) 120.18 84.91 Annual free cash flow $2,660.94 $2,043.63 $1,897.65 $1,398.13 $1,515.90 2024 2025 2026 2027 2028 Revenues Planes delivered 136 150 120 115 115 7E7 planes 68 75 60 58 58 7E7 stretch planes 68 75 60 57 57 7E7 Price $188.01 $191.77 $195.61 $199.52 $203.51 7E7 stretch price 225.46 229.96 234.56 239.26 244.04 Total product revenues 28,115.61 31,630.06 25,810.13 25,209.53 25,713.72 Cost of goods sold 22,492.49 25,304.05 20,648.10 20,167.63 20,570.98 Gross profit 5,623.12 6,326.01 5,162.03 5,041.91 5,142.74 Depreciation 116.20 105.31 62.54 50.92 43.54 GS&A expense 2,108.67 2,372.25 1,935.76 1,890.72 1,928.53 Operating profit (before R&D) 3,398.25 3,848.45 3,163.73 3,100.27 3,170.68 R&D expense 646.66 727.49 593.63 579.82 591.42 Pre-tax profit 2,751.60 3,120.96 2,570.09 2,520.45 2,579.26 Taxes (or tax credit) 963.06 1,092.33 899.53 882.16 902.74 After-tax profit 1,788.54 2,028.62 1,670.56 1,638.29 1,676.52 Capital expenditure 44.98 50.61 41.30 40.34 41.14 Depreciation add-back 116.20 105.31 62.54 50.92 43.54 Change in WCR 269.02 235.47 (389.94) (40.24) 33.78 Annual free cash flow $1,590.73 $1,847.86 $2,081.74 $1,689.12 $1,645.13
UVA-F-1449
-19-
Exhibit 8 (continued) 2029 2030 2031 2032 2033 Revenues Planes delivered 115 115 115 115 115 7E7 planes 58 58 58 58 58 7E7 stretch planes 57 57 57 57 57 7E7 Price $207.58 $211.73 $215.96 $220.28 $224.69 7E7 stretch price 248.92 253.90 258.98 264.16 269.44 Total product revenues 26,228.00 26,752.56 27,287.61 27,833.36 28,390.03 Cost of goods sold 20,982.40 21,402.05 21,830.09 22,266.69 22,712.02 Gross profit 5,245.60 5,350.51 5,457.52 5,566.67 5,678.01 Depreciation 39.86 41.10 42.13 43.19 44.07 GS&A expense 1,967.10 2,006.44 2,046.57 2,087.50 2,129.25 Operating profit (before R&D) 3,238.64 3,302.97 3,368.82 3,435.98 3,504.68 R&D expense 603.24 615.31 627.62 640.17 652.97 Pre-tax profit 2,635.39 2,687.66 2,741.21 2,795.81 2,851.71 Taxes (or tax credit) 922.39 940.68 959.42 978.53 998.10 After-tax profit 1,713.00 1,746.98 1,781.78 1,817.28 1,853.61 Capital expenditure 41.96 42.80 43.66 44.53 45.42 Depreciation add-back 39.86 41.10 42.13 43.19 44.07 Change in WCR 34.46 35.15 35.85 36.57 37.30 Annual free cash flow $1,676.45 $1,710.13 $1,744.41 $1,779.37 $1,814.96 2034 2035 2036 2037 Revenues Planes delivered 115 115 115 115 7E7 planes 58 58 58 58 7E7 stretch planes 57 57 57 57 7E7 Price $229.18 $233.77 $238.44 $243.21 7E7 stretch price 274.83 280.33 285.93 291.65 Total product revenues 28,957.83 29,536.99 30,127.73 30,730.28 Cost of goods sold 23,166.26 23,629.59 24,102.18 24,584.22 Gross profit 5,791.57 5,907.40 6,025.55 6,146.06 Depreciation 44.59 45.33 45.25 45.08 GS&A expense 2,171.84 2,215.27 2,259.58 2,304.77 Operating profit (before R&D) 3,575.14 3,646.80 3,720.72 3,796.21 R&D expense 666.03 679.35 692.94 706.80 Pre-tax profit 2,909.11 2,967.45 3,027.78 3,089.41 Taxes (or tax credit) 1,018.19 1,038.61 1,059.72 1,081.29 After-tax profit 1,890.92 1,928.84 1,968.06 2,008.12 Capital expenditure 46.33 47.26 48.20 49.17 Depreciation add-back 44.59 45.33 45.25 45.08 Change in WCR 38.04 38.80 39.58 40.37 Annual free cash flow $1,851.14 $1,888.10 $1,925.52 $1,963.65

UVA-F-1449
-20-
Exhibit 8 Appendix
Assumptions Underlying the Forecast of Cash Flows Revenue Estimation In order to project revenues for the project, several assumptions were made about the expected demand and timing for the units, their price and price increases. Demand: Boeing estimated that in the first 20 years they would sell 2000-3000 units.1 Frost & Sullivan, aviation industry analysts predicted at least 2000 units.2 Analysis assumes 2500 units in years 1-20. Years 20-30 assumes unit sales equal to year 20. First delivery of 7E7 expected in 2008 and 7E7 Stretch in 2010. Timing of demand: Units sold per year is the percentage of the total units in the first 20 years as shown in Exhibit 6. Exhibit 6 uses a historical average of the 757 and 767 unit sales during their first 20 years. The Boeing 7E7 is expected to be a replacement aircraft for the 757 and 767. Analysis assumes the 7E7 stretch accounts for only 20% of unit sales in its first year of delivery and 50% thereafter. If the total number of unit sales per year is an odd number, the 7E7 units are rounded up and the 7E7 Stretch are rounded down. Price: The expected price of the 7E7 and Stretch version is a function of the 767 and 777 prices in 2002. Using range and capacity as primary inputs, the 7E7 and 7E7 Stretch would be expected to have a minimum price of $114.5 and $144.5 million respectively in 2002 dollars. This does not include a premium for the expected lower operating costs and flexibility of the 7E7. The analysis assumes a 5% price premium as a benchmark resulting in expected prices of $120.2 and $151.7 million in 2002 dollars. Rate of price increases: Aircraft prices are assumed to increase at the rate of inflation. Inflation is assumed to be 2% per year until 2037. Expense Estimation Cost of goods sold: The average cost of goods sold for Boeing’s commercial aircraft division was 80% over the three-year period 2000-2002. The range was 77.9% to 81.1%. The analysis assumes 80% as the COGS. General, selling, and administrative expense: The average general, selling, and administrative expense for Boeing was 7.5% over the three-year period 2000-2002. The range was 7.4% to 7.7%. The analysis assumes 7.5% as the general, selling, and administrative expense. Depreciation: Boeing depreciated its assets on an accelerated basis. The forecast uses 150% declining balance depreciation with a 20-year asset life and zero salvage value as the base. Research and development as a % of sales: The average research and development expense for Boeing’s commercial aircraft division as a % of commercial aircraft sales was 2.3% over the three-year period 2000-2002. The range was 1.8% to 2.7%. During this period, Boeing did not have any extraordinary new commercial aircraft development expenses. The analysis therefore assumes 2.3% as the

UVA-F-1449
-21-
Exhibit 8 Appendix (continued)
estimated research and development expense. This does not include the initial research and development costs required to design and develop the 7E7. Tax expense: Boeing’s expected marginal effective tax rate was 35%. Other Adjustments to Cash Flow Capital expenditures: The 1998-2002 average for capital expenditures as a % of sales was 0.93%. During this period, Boeing did not have any extraordinary new commercial aircraft development expenses. At the time, Boeing had 6 families of aircraft: the 717, 737, 747, 757, 767, and 777. The average capital expenditures per family line as a percentage of sales was therefore 0.16%. This does not include the initial capital expenditure costs required to develop and build the 7E7. Change in WCR (working capital requirements): For the years 2000–2002, Boeing had negative working capital due to such factors as advance customer payments. The analysis assumes that the commercial segment of Boeing would require positive working capital. The years prior to 2000, Boeing had positive working capital. The 1997-1999 three-year average of working capital as a percentage of sales is 6.7% with a range from 3.5% to 11.2%. The analysis assumes this percentage. Initial development costs: Development costs include research and capital requirements needed to design and build the 7E7. Analysts estimated between $6 and $10 billion.3 The analysis assumes $8 billion. Assuming a launch in 2004, analysts expected spending to peak in 2006. Timing of the development costs are assumed to be 2004: 5%, 2005: 15%, 2006: 50%, 2007: 15%, 2008: 10%, 2009: 5%. It is estimated that 75% of the initial development costs are research and development expenses while the remaining 25% are capital expenditures. Notes: 1“New Team, Name for Boeing ‘Super-Efficient’ Jet,” Seattle Times, January 30, 2003, p. 1. 2“An Ongoing Rivalry,” Aviation Today, August 2003. 3“Boeing Plays Defense,” Business Week, June 3, 2003. Source: Casewriters’ analysis.
UVA-F-1449
-22-
Exhibit 9
THE BOEING 7E7
Sensitivity Analysis of Project IRRs by Price, Volume, Development, and Production Costs
Price Premium Above Expected Minimum Price Unit Volume (First 20 Years) 0% 5% 10% 15% 1500 10.5% 10.9% 11.3% 11.7% 1750 11.9% 12.3% 12.7% 13.1% 2000 13.0% 13.5% 13.9% 14.4% 2250 14.1% 14.6% 15.1% 15.5% 2500 15.2% 15.7% 16.1% 16.6% 2750 16.1% 16.6% 17.1% 17.6% 3000 17.1% 17.6% 18.1% 18.6%
Cost of Goods Sold as a Percentage of Sales Development Costs 78% 80% 82% 84% $6,000,000,000 21.3% 18.7% 15.9% 12.6% $7,000,000,000 19.4% 17.0% 14.4% 11.3% $8,000,000,000 17.9% 15.7% 13.2% 10.3% $9,000,000,000 16.6% 14.5% 12.1% 9.4% $10,000,000,000 15.5% 13.5% 11.2% 8.6%
Note: The IRR consistent with “base case” assumptions is 15.7 percent and is indicated in italics in the table. Source: Casewriters’ analysis.

UVA-F-1449
-23-
Exhibit 10
THE BOEING 7E7
Information on Comparable Companies (specially calculated betas estimated from
daily stock and market returns over the periods indicated).
Boeing Lockheed
Martin Northrop Grumman
Raytheon
Percentage of revenues derived from government (defense and space).
46%
93%
91%
73%
Estimated betas
1. Value Line*
2. Calculated against the S&P 500 index:** 60 months 21 months 60 trading days
3. Calculated against the NYSE composite index: ** 60 months 21 months 60 trading days
1.05 0.80 1.03 1.45 1.00 1.17 1.62
0.60 0.36 0.38 0.34 0.49 0.44 0.37
0.70 0.34 0.31 0.27 0.44 0.36 0.30
0.80 0.43 0.46 0.66 0.59 0.53 0.73
Effective marginal tax rate 0.35 0.35 0.35 0.35
Market-value debt/equity ratios 0.525 0.410 0.640 0.624 Notes: * Value Line betas are calculated from a regression analysis between the weekly percentage change in price of a stock and the weekly percentage changes of the New York Stock Exchange Composite Index. The beta is calculated over the last five years of data. ** Regression periods for the 60-day, 21-month, and 60-month begin on March 20, 2003, September 17, 2001, and June 16, 1998, respectively. Regression periods end on June 16, 2003.
Sources: Casewriters’ analysis and Value Line Investment Survey.
UVA-F-1449
-24-
Exhibit 11
THE BOEING 7E7
Outstanding Bonds of The Boeing Company
as of June 2003 (dollar values in millions)
Debt Amount
Debt Rating Coupon Maturity Price
Yield To Maturity
$202 A- 7.625% 2/15/2005 106.175 3.911% $298 A- 6.625% 6/1/2005 105.593 3.393% $249 A- 6.875% 11/1/2006 110.614 3.475% $175 A- 8.100% 11/15/2006 112.650 4.049% $349 A- 9.750% 4/1/2012 129.424 5.470% $597 A- 6.125% 2/15/2013 103.590 4.657% $398 A- 8.750% 8/15/2021 127.000 6.239% $300 A- 7.950% 8/15/2024 126.951 5.732% $247 A- 7.250% 6/15/2025 114.506 6.047% $249 A- 8.750% 9/15/2031 131.000 6.337% $173 A- 8.625% 11/15/2031 138.974 5.805% $393 A- 6.125% 2/15/2033 103.826 5.850% $300 A- 6.625% 2/15/2038 106.715 6.153% $100 A- 7.500% 8/15/2042 119.486 6.173% $173 A- 7.825% 4/15/2043 132.520 5.777% $125 A- 6.875% 10/15/2043 110.084 6.191%
Note: This table does not include the debt outstanding of Boeing’s financing subsidiary, Boeing Capital Corporation. Sources: Boeing Company 10-Q, Bloomberg Financial Services, and Mergent Online.