Embed Size (px)
Citation preview
O
Aa
LIa
b
c
d
a
A
R
A
A
K
A
C
M
P
I
Au
h1(
braz j infect dis 2 0 1 6;2 0(3):255–261
www.elsev ier .com/ locate /b j id
The Brazilian Journal of
INFECTIOUS DISEASES
riginal article
cost-effectiveness analysis of two differentntimicrobial stewardship programs
ucas Miyake Okumuraa,∗, Bruno Salgado Riverosb, Monica Maria Gomes-da-Silvac,zelandia Veronezed
Clinical Pharmacy Division, Hospital de Clínicas de Porto Alegre, Porto Alegre, RS, BrazilPost Graduation Department, Pharmaceutical Sciences, Universidade Federal do Paraná, Curitiba, PR, BrazilInfectious Disease Division, Hospital de Clínicas, Universidade Federal do Paraná, Curitiba, PR, BrazilInfectious Control Service, Hospital de Clínicas, Universidade Federal do Paraná, Curitiba, PR, Brazil
r t i c l e i n f o
rticle history:
eceived 6 November 2015
ccepted 15 February 2016
vailable online 16 April 2016
eywords:
ntimicrobial stewardship program
ost-effectiveness
ortality
harmacist
a b s t r a c t
There is a lack of formal economic analysis to assess the efficiency of antimicrobial stew-
ardship programs. Herein, we conducted a cost-effectiveness study to assess two different
strategies of Antimicrobial Stewardship Programs. A 30-day Markov model was developed
to analyze how cost-effective was a Bundled Antimicrobial Stewardship implemented in a
university hospital in Brazil. Clinical data derived from a historical cohort that compared
two different strategies of antimicrobial stewardship programs and had 30-day mortality
as main outcome. Selected costs included: workload, cost of defined daily doses, length of
stay, laboratory and imaging resources used to diagnose infections. Data were analyzed by
deterministic and probabilistic sensitivity analysis to assess model’s robustness, tornado
diagram and Cost-Effectiveness Acceptability Curve. Bundled Strategy was more expensive
(Cost difference US$ 2119.70), however, it was more efficient (US$ 27,549.15 vs 29,011.46).
Deterministic and probabilistic sensitivity analysis suggested that critical variables did not
alter final Incremental Cost-Effectiveness Ratio. Bundled Strategy had higher probabilities
of being cost-effective, which was endorsed by cost-effectiveness acceptability curve. As
health systems claim for efficient technologies, this study conclude that Bundled Antimicro-
bial Stewardship Program was more cost-effective, which means that stewardship strategies
with such characteristics would be of special interest in a societal and clinical perspective.
© 2016 Elsevier Editora Ltda. This is an open access article under the CC BY-NC-ND
license (http://creativecommons.org/licenses/by-nc-nd/4.0/).
priate use of antibiotics, which is known to lead to worse
ntroductionntimicrobial stewardship programs (ASP) promote adequatese of antimicrobial drug therapy (ADT) to infected patients.
∗ Corresponding author.E-mail address: [email protected] (L.M. Okumura).
ttp://dx.doi.org/10.1016/j.bjid.2016.02.005413-8670/© 2016 Elsevier Editora Ltda. This is an ophttp://creativecommons.org/licenses/by-nc-nd/4.0/).
They are meant to reduce undesired events due to inappro-
clinical and economic outcomes, such as development ofresistant bacteria, hospitalizations and mortality, in additionto increased ADT-related expenditures.1–4
en access article under the CC BY-NC-ND license
i s . 2 0
by estimating the amount of time spent by each health care
256 b r a z j i n f e c t d
Nowadays, due to increasing health care costs, cost-effectiveness analysis (CEA) are the watershed of many healthsystems, as they provide better planning, financial and humanresources allocation.5
ASP economic outcomes have been analyzed with cost-reduction studies and positive results due to decreasedantibiotics consumption6 and lower hospital length of staywere observed. However, these results are controversial7,8 andthe final outcome may be subject to many confounders.6
Therefore, the incorporation of clinical data and sensitivityanalysis are necessary to assess whether one interventioncould lead to robust economic outcomes.
As a matter of fact, cost-reduction studies are not formaleconomic analysis6 and, to our knowledge, there is only onepublication that investigated whether ASP are cost-effective.9
Furthermore, this single cost-effectiveness publication wasnot free of bias, as there were many theoretical assump-tions when assigning clinical probabilities, leading to resultsthat could be unclear to clinicians due to complex reportingand modeling methods. Moreover, the aforementioned CEAemployed diverse research outcomes (i.e. risk of death), whilecosts were estimated from other health institutions and spe-cific wards, such as critical care units.
Since 2001, some authors have been advocating that welldesigned investigations with economic outcomes are needed,especially on ASP.6,10 In addition, one recent publication hassuggested that different ASP strategies could lead to differ-ent clinical outcomes. In that study, an ASP with proactivecharacteristics lead to improved 30-day mortality results.11
In this context, considering that international literaturelacks direct comparison among ASP strategies, our hypothesiswas that different ASP strategies could also lead to differ-ent economic outcomes. The objective of this research wasto assess whether two different ASP strategies could lead todifferent performance results.
Methods
Ethics and reporting
The present study complies with Helsinki’s Declaration andLocal Bioethics Committee approved it. We followed the sug-gestions of a Panel of Experts to conduct adequate reporting.4
Definitions of two different strategies: conventional andbundled ASP
This CEA compared two different modalities of ASP. We useda previous cohort study that evaluated how Conventional orBundled ASP differed in terms of mortality and antibioticdoses consumption.11
Conventional Strategy was defined as a simplified steward-ship program, which included a clinical pharmacist screeningfor antimicrobial drug-related problem (ADRP), case dis-cussions with infectious disease physicians (ID-MD) and
telephone-based interventions.On the other hand, the Bundled ASP had a more activedesign, which included: prospective auditing and local edu-cation/feedback about antimicrobial therapy prescription;
1 6;2 0(3):255–261
microbiological data discussion with laboratory personnel toguide empirical or preemptive therapy; and face-to-face inter-ventions to improve antimicrobial drug therapy.
Study perspective and other nation-related issues
The perspective of this study was a Southern Brazilian Univer-sity Hospital, which is a 550-bed public and clinical referenceinstitution with an average of 55–65% occupation rate. TheBrazilian Health-System, namely Sistema Único de Saúde (SUS),is a primary care-centered system with universal access to allBrazilian citizens. More information regarding the aforemen-tioned health system should be consulted in excellent reviewspublished elsewhere.12
Costs and definitions
All costs were collected and analyzed as local currency (R$,Brazilian Reais) and converted to United States Dollars (US$).Exchange values were collected at <reuters.com> and theywere expressed as mean value from February to September2013, so R$ 1.00 was equivalent to US$ 0.47.
There were four relevant costs included in this CEA,namely: (I) hospital length of stay/patient-day, (II) cost ofdefined daily doses (DDD)/patient, (III) resources to providemicrobiological and imaging diagnosis of infections, and (IV)human resources workload per day. These variables werecollected through institutional databases, such as medica-tion purchasing receipts and data from hospital’s HumanResources and Planning Department. Table 1 summarizes allcosts accounted for in this study and supplementary materialprovides detailed information.
Hospital length of stay was defined as the average costper patient/day admitted to intensive care units or generalwards, which included water consumption, human resources,medical material costs, and other relevant costs, except cost-related to ADT (see supplementary material).
DDD is a validated tool to standardize the number ofdoses consumed from each medication, allowing compari-son of drug consumption between different health settings.Therefore, DDD was collected according to the originalmethod developed by the World Health Organization.13 DDDwas calculated based on pharmacy dispensation registries.Each unit of DDD was multiplied by the cost of drug,so antimicrobial therapy was expressed as “cost-DDD perpatient”.13
Regarding the costs related to bacterial infections diagno-sis, we defined all diagnostic criteria according to internationalguidelines.14–21 Prevalence of infections and their respectivetopographies were collected from the same previous cohortstudy,9 while costs of antibiograms, cultures, and other lab-oratory and imaging methods were calculated by means ofmicrocosting bottom-up method.22
At last, cost of human workload per day was calculated
staff involved with ASP, whereby Bundled ASP accounted for afull-dedication clinical pharmacist resident and two partiallydedicated ID physicians (one preceptor and one third-yearpost-graduate MD).
b r a z j i n f e c t d i s . 2 0 1 6;2 0(3):255–261 257
Table 1 – Summary of all included costs.
Average per patient Bundled ASP expenditures Conventional ASP expendituresCost (US$) Cost (US$)
Length-of-stay per daya 1457.35 1457.35Antimicrobial consumption 1875.77 ± 107.05 4614.77 ± 174.15Imaging or lab resourcesb 89.04 91.98Cost of workload per dayc 92.79 45.33
DDD, defined daily doses.a The aforementioned table just illustrates the average value of length of stay per patient and mathematical modeling included individual
calculations,b Values considered in mathematical model comprised individual calculations of image or lab resources and the aforementioned values are
only average costs per patient,c Workload was expressed in this table as total ASP hours spend by day.
Notes: See Supplementary Material for more details about cost calculation.
Table 2 – The base case: outcomes, costs per patient, CER, and ICER.
Absolute Risk Direct costs (average value) CER ICER
Conventional ASP 0.6209 US$ 18,013.22 US$ 29,011.46US$ 19,287.54
Bundled ASP 0.7308 US$ 20,132.92 US$ 27,549.15
Conventional ASPa 0.6202 ± 0.08 US$ 18,021.21 ± 5.72 US$ 29,057.10US$ 19,317.58
Bundled ASPa 0.7328 ± 0.11 US$ 20,196.37 ± 6.33 US$ 27,560.55
t-Effectiveness Rate; ICER, Incremental Cost-Effectiveness Ratio.
ER represents the cost per incremental patient that survives 30 days.
C
Tt3dD
t
D
DccI
bwdtdsT3ts
diai
OptimizedStrategy
ConventionalStrategy
Patients eligiblefor the study
Death
Death
AliveAlive
Alive Alive
DeathDist(9)
Dist(10)
Dist(7)
Dist(8)
#
#
#
#
Death
Patient onemore day alive
Patient onemore day alive
ASP, antimicrobial stewardship program; AR, Absolute Risk; CER, Cosa After 10,000 iterations.
Notes: CER represents the cost per patient that survives 30 days. IC
linical outcomes (effectiveness)
ransition probabilities among health states were obtainedhrough effectiveness data.11 For both strategies, we compared0-day mortality, which was expressed as either time-to-eventata or point estimate value: Absolute Risk Rate (AR), Riskifference (RD), and Number Needed to Treat (NNT) (Table 2).
Survival probabilities through each day (out of 30-day mor-ality) were also obtained from the same previous cohort.11
ata analysis
ata were analyzed by comparing both strategies in the basease, by reporting crude costs, clinical outcomes, and effi-iency indicators such as: Cost-Effectiveness Rate (CER) andncremental Cost-Effectiveness Ratio (ICER).
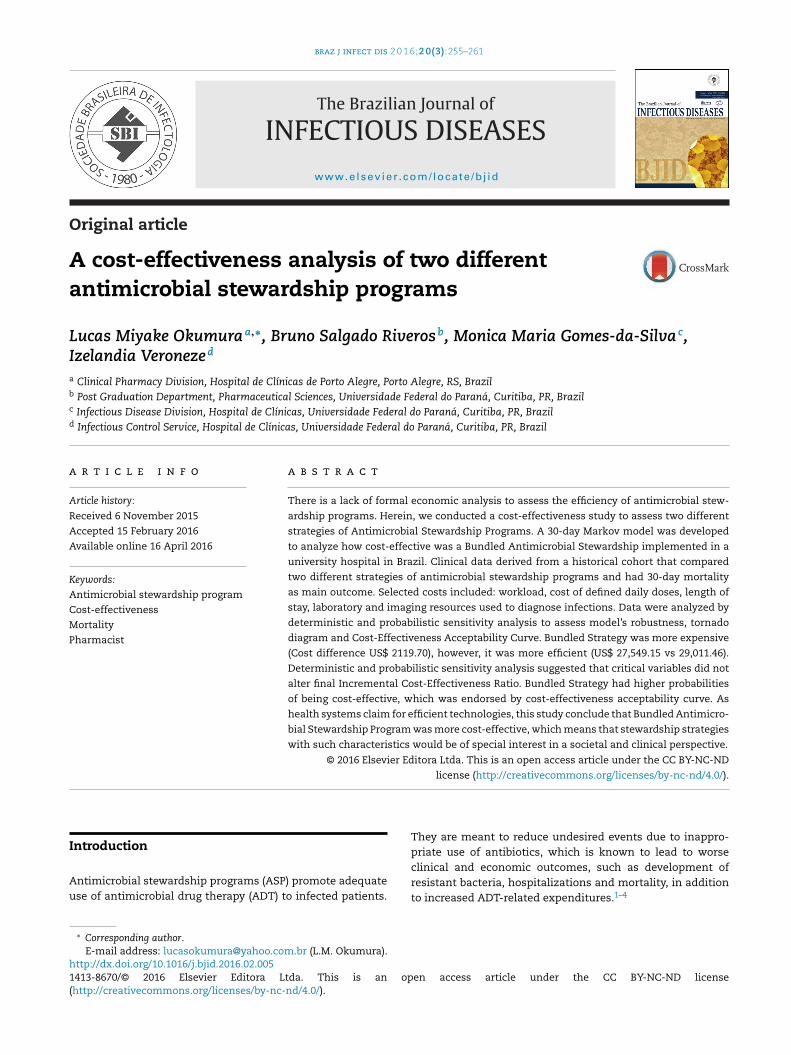
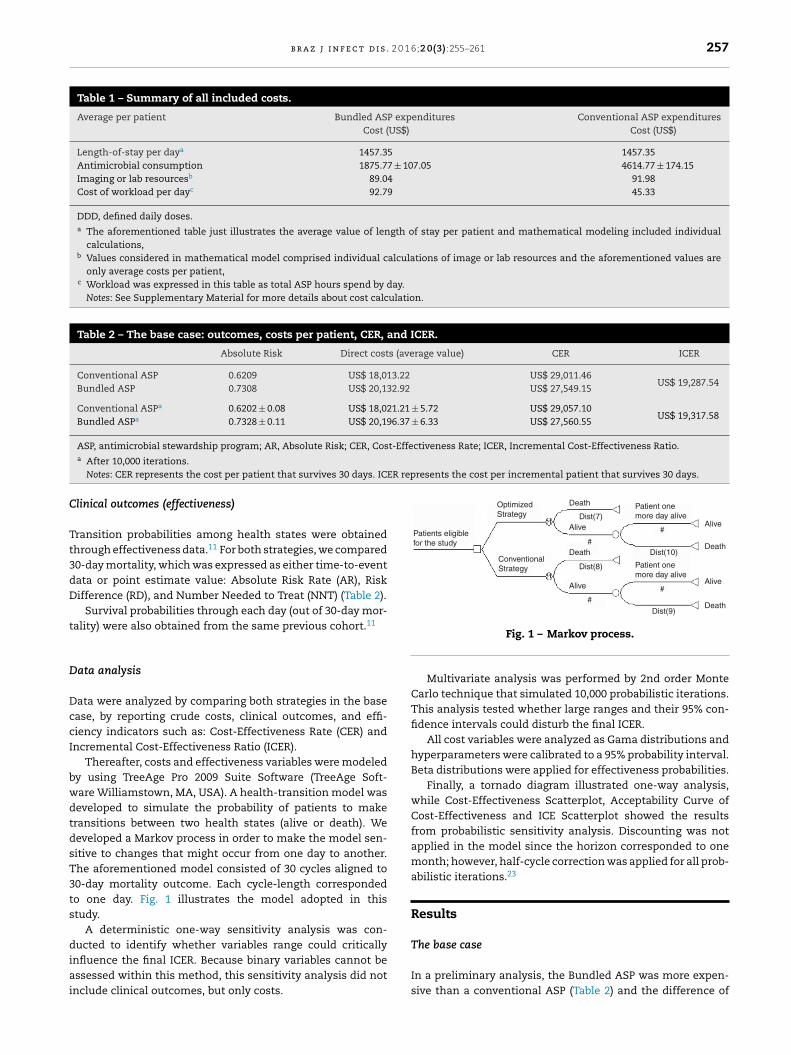
Thereafter, costs and effectiveness variables were modeledy using TreeAge Pro 2009 Suite Software (TreeAge Soft-are Williamstown, MA, USA). A health-transition model waseveloped to simulate the probability of patients to makeransitions between two health states (alive or death). Weeveloped a Markov process in order to make the model sen-itive to changes that might occur from one day to another.he aforementioned model consisted of 30 cycles aligned to0-day mortality outcome. Each cycle-length correspondedo one day. Fig. 1 illustrates the model adopted in thistudy.
A deterministic one-way sensitivity analysis was con-
ucted to identify whether variables range could criticallynfluence the final ICER. Because binary variables cannot bessessed within this method, this sensitivity analysis did notnclude clinical outcomes, but only costs.
Fig. 1 – Markov process.
Multivariate analysis was performed by 2nd order MonteCarlo technique that simulated 10,000 probabilistic iterations.This analysis tested whether large ranges and their 95% con-fidence intervals could disturb the final ICER.
All cost variables were analyzed as Gama distributions andhyperparameters were calibrated to a 95% probability interval.Beta distributions were applied for effectiveness probabilities.
Finally, a tornado diagram illustrated one-way analysis,while Cost-Effectiveness Scatterplot, Acceptability Curve ofCost-Effectiveness and ICE Scatterplot showed the resultsfrom probabilistic sensitivity analysis. Discounting was notapplied in the model since the horizon corresponded to onemonth; however, half-cycle correction was applied for all prob-abilistic iterations.23
Results
The base case
In a preliminary analysis, the Bundled ASP was more expen-sive than a conventional ASP (Table 2) and the difference of

258 b r a z j i n f e c t d i s . 2 0 1 6;2 0(3):255–261
R$29K R$34K
c_obs-otim_intern c_otim_mdct: 8.32 to 24.95
c_otim_equipe: 48.54 to 139.40 c_obs_dx_inf: 3.75 to 11.24
c_obs_mdct: 20.46 to 61.37 c_otim_dx_inf: 3.15 to 9.46
R$39K R$44K
Incremental Cost/Eff
R$49K R$54K
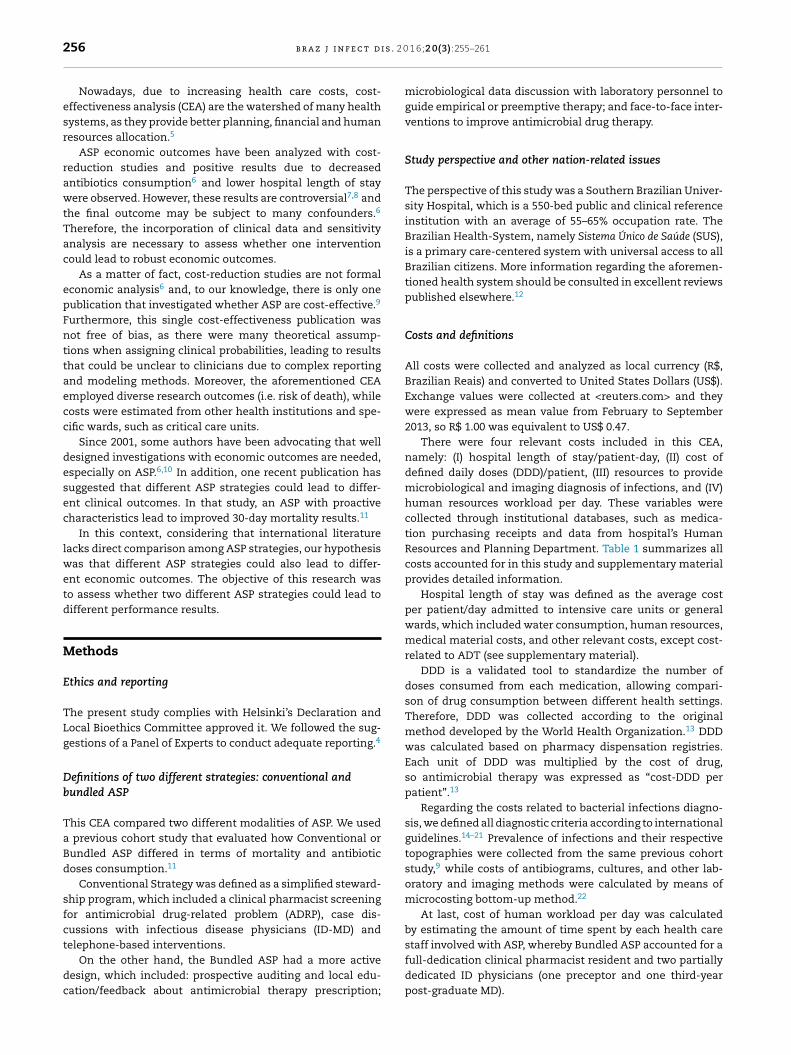
Fig. 2 – Tornado diagram with critical variables. Notes:Vertical line represents final ICER. Critical variables arerepresented as horizontal bars. All variables crossed finalICER, which means that none of them were able to disturbthe final result from base case. c obs-otim intern, length ofstay cost; c otim equipe, Bundled Strategy humanresources cost; c obs medct, antimicrobial cost inConventional Strategy; c c otim medct antimicrobial costin Bundled Strategy; c obs dx inf, bacterial infectionsdiagnostic cost in Conventional Strategy; c otim dx inf,
110K
100K
90K
80K
70K
60K
50K
40KCos
t (R
$)
30K
20K
10K
0K0.00 0.10 0.20 0.30
Effectiveness (survival at 30 days)
Optimized strategy Conventional strategy
0.40 0.50 0.60 0.70 0.80 0.90
Fig. 3 – Scatterplot with 10,000 virtual cohorts. Note: Eachdot represents one virtual cohort, thus, Bundled Strategy islikely to be more effective (y axis) and at similar costs
institution.
bacterial infections diagnostic cost in Bundled Strategy.
crude costs was US$ 2119.70/patient. Considering point esti-mate values, which are expressed as Absolute Risk, BundledASP was more effective and patients are more likely to survive(73.1% vs 62.1%, p < 0.05).
Nevertheless, by observing health economic indicators(CER) the base case suggests that Bundled Strategy was morecost-effective, which was also seen after 10,000 virtual sim-ulations. Finally, ICER suggests that each averted death in 30days costed US$ 19,287.54.
Deterministic sensitivity analysis
ICER did not change when confronting the aforementionedbase case results against critical variables. Therefore, accord-ing to one-way deterministic analysis, previous ICER wasrobust (Fig. 2). We observed that length of stay cost, humanresources, and antimicrobial consumption were the criticalvariables that had the greatest ICER range.
Probabilistic sensitivity analysis
Probabilistic sensitivity analysis showed that ICER was robust.Scatter Plot graph shows that Bundled Strategy stayed clini-cally superior and at similar costs compared to the other group(Fig. 3).
Finally, Cost-Effectiveness Acceptability Curve (CEAC)(Fig. 4) was used to assess whether Bundled ASP would beaffordable in the perspective of the studied health institution.
(x axis).
We observed that Bundled ASP has higher probability ofbeing the most effective (C1 + C2 + C4 = 92.7%) and the mostcost-effective strategy (C1 + C2 vs C4 = 52.6% vs 40.1%).
When ICER was set as Willingness-To-Pay function (diago-nal line represents stakeholders’ cutoff), Acceptability Curvedemonstrated higher probabilities of Bundled Strategy stayunder stakeholders’ willingness-to-pay. These results corrob-orated with previous base case and deterministic analysis.
Discussion
CEA analysis is an interesting tool to improve health systems’performance, so decision-makers can assess and incorporateone technology that is the most cost-effective. In our study, wefound that Bundled ASP Strategy was effective, efficient andat affordable costs, even after 10,000 probabilistic iterations.
Relevant costs and effectiveness
Due to our close relation to Planning Department, it was possi-ble to collect specific data and assemble them in our economicmodeling. Microcosting bottom-up method required time andmay not be feasible to other institutions, but still is a reliableway to collect costs.
Previous CEA that assessed the efficiency of one ASP9 usedsimilar modeling and data analysis. The difference betweenthis and past study is that previous publication included mul-tiple setting clinical probabilities and costs. We also observedthat some data derived from 1999, but manuscript was pub-lished in 2009.
Costs from other settings and inclusion of clinicaloutcomes from different institutions constitute the maindrawback from previous publications. To avoid such bias, webelieve that the present study has overcome these problemsby considering expenditures and clinical data from a single
11
Different ASP interventions were never comparedregarding their efficiency, and international literature lacksdirect comparison between ASP strategies.

b r a z j i n f e c t d i s . 2 0 1 6;2 0(3):255–261 259
90K
70K
50K
30K
10K
–10K
Incr
emen
tal c
ost
Incremental effectiveness
–30K
–50K
–70K
–0.80 –0.60 –0.40 –0.20 0.00 0.20 0.40 0.60 0.80
Fig. 4 – Cost-Effectiveness Acceptability Curve (CEAC) between Bundled and Conventional ASP.
Component Quadrant Incremental effectiveness Incremental cost ICER # of dots %
C1 IV IE > 0 IC < 0 Superior 3414 34.14C2 I IE > 0 IC > 0 <ICER 1851 18.51C3 III IE < 0 IC < 0 >ICER 351 3.51C4 I IE > 0 IC > 0 >ICER 4013 40.13C5 III IE < 0 IC < 0 <ICER 222 2.22C6 II IE < 0 IC > 0 Inferior 149 1.49
Quadrants are read as “I” (upper right, the most effective and expensive), “II” (upper left, the less effective and the most expensive), “III” (lower left,the less effective and less expensive strategy) and “IV (lower right, the best scenario with higher probabilities of effectiveness at lower costs).Diagonal line represents Willingness to Pay Function (WTP) and all virtual cohorts under this curve were considered affordable by the studiedhealth institution.“Component” represents a group of representative dots in CEAC. C1 and C2 represent that Bundled strategy is, respectively, dominant and underW y is mo ss eff
livn
M
ImmMtowlwotc
cfisbaClnha
(
(b) for every US19,000 dollars invested, one will experience
TP function. C4 represents the probability (40%) that Bundled Strategf all iterations) are less representative probabilities and account for le
One could notice that Bundled ASP resembles other pub-ished and practiced stewardships with multiple types ofnterventions11 and, therefore, at this viewpoint, externalalidity is one of the positive aspects of our clinical effective-ess probabilities.
arkov model and accuracy of this study
nstead of choosing a Decision Model Tree, which is com-only used to acute care conditions, Markov Model providesore accuracy for each of the 30-day probabilities. Markovodel could precisely estimate the probability of one patient
o die or to survive each day: costs quantification is dependentn accumulative probabilities of surviving or dying. In otherords, if one patient survives, there would be an accumu-
ative cost in the next day; likewise, if one patient dies, itould probabilistically reduce cost-effectiveness ratio. Previ-us publications9 included a decision tree analysis, and dueo the aforementioned reasons, they were poorly planned andould have methodological bias.
With respect to internal validity, patients should belinically compared and primary site of infection may be insuf-cient to determine if groups are homogeneous.9 In a previoustudy, multivariate analysis determined that Charlson Comor-idity Index could independently predict mortality in patientsssisted by ASP.11 The known association between Charlsonomorbidity Index and Mortality impacts previous study’s
ist of assumptions9, where it was stated that “patients whoever received an active antimicrobial drug therapy wouldave twice as poor outcomes (die twice) as those receiving anctive therapy”. In other words, when defining an economic
ore expensive and above WTP function. C3, C5 and C6 (less than 10%ective and more expensive percentages.
model, we should attempt to choose evidence-based probabil-ities of mortality to accurate predict real cost-effectiveness ofASP.
Other relevant interpretations
CEAC analysis was never performed before in other ASPresearch. It is a comprehensive way to help those who arenot familiar with economic assessments to understand CEA.Nevertheless, to conduct such analysis, we set how muchstakeholders would need to pay to have one Bundled ASP,by considering its structure, clinical and economic outcomes.Herein, we suggested ICER as the Willingness to Pay value(US 19,000 dollars per patient who survived 30-day mortalityoutcome).
ICER was determined as cut off value, because direct orindirect ways of defining “Willingness to Pay” are not vali-dated and are subject to criticism. In addition, clinicians andstakeholders may interpret it more properly if NNT is alsoincorporated.
Therefore, by considering ICER value and that Bundled ASPhas a NNT = 9, we suggest the following interpretations:
a) for every nine patients treated, one will benefit (or achieve30-day outcome);
the benefit;(c) as NNT and ICER conceptions are similar, every nine
patients treated will cost US19,000 dollars and one willhave positive clinical outcome.

i s . 2 0
r
1
1
1
1
1
260 b r a z j i n f e c t d
Limitations
Our study is not free of limitations. The present study usedeffectiveness probabilities from a historical cohort, whichmeans that retrospective data collection should always becautiously interpreted due to incomplete registries, censoring,and research blinding problems.
Moreover, as two different ASP strategies were rarely com-pared in literature, more studies should be performed toassess if previous epidemiological findings (base case) arereproducible. When interpreting our results, one should con-sider the population included in the previous study, which wasbased on general wards and intensive care units inpatients.11
Other health settings should adapt this information beforeextrapolating our results to different practice scenarios.
Although sensitivity analysis corroborated with base case,cost-effectiveness should always consider one perspective.Readers should be aware of our study’s external validity, espe-cially because it was conducted in a Latin American healthservice, and differences are notorious between health systemsand clinical settings.
Finally, although we believe that relevant costs wereincluded in our economic modeling, ICER and Willingness-toPay are not interchangeable concepts. In the present study,we did so because base case was a retrospective study, soall expenditures were already paid by hospital’s financialdepartment. Therefore, we considered that all values underWillingness-to Pay function would be affordable.
Conclusion
Bundled ASP was more cost-effective and also associatedwith higher probabilities of clinical success and at reasonableimplementation costs, while conventional ASP was a cheaperstrategy but less efficient. Therefore, (I) stakeholders shouldbe aware to our critical variables (length of stay and humanresources costs), before implementing an ASP; (II) patientswould receive all advantages from a healthcare program thatpromotes better outcomes; (III) economic assessments are stillsparse in literature, so we wish our study could motivate otherresearchers to conduct other ASP formal economic analyses.
Finally, our results should be assessed in other settings andcountries. Future stewardship researches should made effortstoward coupling well conducted clinical and epidemiologicalstudies, as backbones of economic analysis, once there is aspecial interest on incorporating high performance technolo-gies to health settings and systems.
Funding
The corresponding author was given a monthly scholarshipfrom the Brazilian Ministry of Education (Residência Multi-profissional em Atencão Hospitalar, Ministério da Educacãoe Cultura).
Conflicts of interest
The authors declare no conflicts of interest.
1
1 6;2 0(3):255–261
Appendix A. Supplementary data
Supplementary data associated with this article can befound, in the online version, at http://dx.doi.org/10.1016/j.bjid.2016.02.005.
e f e r e n c e s
1. Dellit TH, Owens RC, McGowan JE Jr, et al. Infectious DiseasesSociety of America and the Society for HealthcareEpidemiology of America guidelines for developing aninstitutional program to enhance antimicrobial stewardship.Clin Infect Dis. 2007;44:159–77.
2. Cosgrove SE, Carmeli Y. The impact of antimicrobialresistance on health and economic outcomes. Clin Infect Dis.2003;36:1433–7.
3. Chaix C, Durand-Zaleski I, Alberti C, et al. Control of endemicmethicillin-resistant Staphylococcus aureus: a cost-benefitanalysis in an intensive care unit. JAMA. 1999;282:1745–51.
4. Digiovine B, Chenoweth C, Watts C, et al. The attributablemortality and costs of primary nosocomial bloodstreaminfections in the intensive care unit. Am J Respir Crit CareMed. 1999;160:976–81.
5. Russell LB, Gold MR, Siegel JE, et al. The role ofcost-effectiveness analysis in health and medicine. Panel onCost-Effectiveness in Health and Medicine. JAMA.1999;276:1172–7.
6. Howard D, Cordell R, McGowan JE Jr, et al. Measuring theeconomic costs of antimicrobial resistance in hospitalsettings: summary of the Centers for Disease Control andPrevention-Emory Workshop. Clin Infect Dis. 2001;33:1573–8.
7. Carmeli Y, Troillet N, Karchmer AW, et al. Health andeconomic outcomes of antibiotic resistance in Pseudomonasaeruginosa. Arch Intern Med. 1999;159:1127–32.
8. Cosgrove SE, Kaye KS, Eliopoulous GM, et al. Health andeconomic outcomes of the emergence of third-generationcephalosporin resistance in Enterobacter species. Arch InternMed. 2002;162:185–90.
9. Scheetz MH, Bolon MK, Postelnick M, et al. Cost-effectivenessanalysis of an antimicrobial stewardship team onbloodstream infections: a probabilistic analysis. J AntimicrobChemother. 2009;63:816–25.
0. McGowan JE Jr. Economic impact of antimicrobial resistance.Emerg Infect Dis. 2001;7:286–92.
1. Okumura LM, Gomes-da-Silva MM, Veroneze I. Effects of aBundled Antimicrobial Stewardship Program on mortality: acohort study. Braz J Infect Dis. 2015;19:246–52.
2. Paim J, Travassos C, Almeida C, et al. The Brazilian healthsystem: history, advances, and challenges. Lancet.2011;377:1778–97.
3. WHO Collaborating Centre for Drug Statistics Methodology.ATC classification index with DDDs website; 2012 [accessed01.08.15].
4. Baddour LM, Wilson WR, Bayer AS, et al. Infectiveendocarditis: diagnosis, antimicrobial therapy, andmanagement of complications: a statement for healthcareprofessionals from the Committee on Rheumatic Fever,Endocarditis, and Kawasaki Disease, Council onCardiovascular Disease in the Young, and the Councils onClinical Cardiology, Stroke, and Cardiovascular Surgery andAnesthesia, American Heart Association: endorsed by theInfectious Diseases Society of America. Circulation.
2005;111:e394–434.5. Tunkel AR, Hartman BJ, Kaplan SL, et al. Practice guidelinesfor the management of bacterial meningitis. Clin Infect Dis.2004;39:1267–84.
2 0 1
1
1
1
1
2
2
2
b r a z j i n f e c t d i s .
6. Dellinger RP, Levy MM, Rhodes A, et al. Surviving sepsiscampaign: international guidelines for management of severesepsis and septic shock: 2012. Crit Care Med. 2013;41:580–637.
7. Solomkin JS, Mazuski JE, Bradley JS, et al. Diagnosis andmanagement of complicated intra-abdominal infection inadults and children: guidelines by the Surgical InfectionSociety and the Infectious Diseases Society of America. ClinInfect Dis. 2010;50:133–64.
8. Gupta K, Hooton TM, Naber KG, et al. International clinicalpractice guidelines for the treatment of acute uncomplicatedcystitis and pyelonephritis in women: a 2010 update by theInfectious Diseases Society of America and the European
Society for Microbiology and Infectious Diseases. Clin InfectDis. 2011;52:e103–20.9. Stevens DL, Bisno AL, Chambers HF, et al. Practice guidelinesfor the diagnosis and management of skin and soft tissue
2
6;2 0(3):255–261 261
infections: 2014 update by the infectious diseases society ofAmerica. Clin Infect Dis. 2014;59:147–59.
0. American Thoracic Society; Infectious Diseases Society ofAmerica. Guidelines for the management of adults withhospital-acquired, ventilator-associated, andhealthcare-associated pneumonia. Am J Respir Crit Care Med.2005;171:388–416.
1. Mandell LA, Wunderink RG, Anzueto A, et al. InfectiousDiseases Society of America/American Thoracic Societyconsensus guidelines on the management ofcommunity-acquired pneumonia in adults. Clin Infect Dis.2007;44:S27–72.
2. Frick KD. Microcosting quantity data collection methods. Med
Care. 2009;47:S76–81.3. Naimark DM, Bott M, Krahn M. The half-cycle correctionexplained: two alternative pedagogical approaches. MedDecis Mak. 2008;28:706–12.