Embed Size (px)
Citation preview
The Building Connections Fund Part one: Evaluation of the Building Connections Fund prior to the Covid-19 pandemic
Abigail Rose, Thomas Abrams, Elizabeth Parker, and Giulia Todres
September 2021
2
Contents
Executive summary ........................................................................................................................................... 5 1. Introduction .................................................................................................................................................... 9
1.1 Loneliness in England .............................................................................................................................. 9 1.2 The Building Connections Fund and the Covid-19 pandemic ............................................................... 10
2. Evaluation methods ..................................................................................................................................... 12 2.1 Aims and research questions: How effective was the BCF prior to the Covid-19 pandemic?............... 12 2.2 Evaluation approach .............................................................................................................................. 13 2.3 Theory of change ................................................................................................................................... 14 2.4 Data collection and analysis .................................................................................................................. 17 2.5 Methodological considerations ............................................................................................................... 21
3. Findings: Understanding the grant holders and service users .................................................................... 26 3.1 Understanding the grant holders ............................................................................................................ 26 3.2 Understanding the service users: How significant was the need for support? What were people’s needs before they attended? ....................................................................................................................... 30
4. Findings: Changes in outcomes, mechanisms of change, and ‘success factors’ ....................................... 39 4.1 How did outcomes change? ................................................................................................................... 39 4.2 Mechanisms of change: How was service users’ experience of the funded activities? ........................ 42 4.3 What were services’ key ‘success factors’? ........................................................................................... 45
5. Summary of findings .................................................................................................................................... 48 6. Considerations and recommendations ........................................................................................................ 50
6.1 Considerations for funding and delivery organisations .......................................................................... 50 6.2 Recommendations for future research .................................................................................................. 50
Appendix A: Data collection tools and resources ............................................................................................ 52 Guidance for grant holders on using surveys and consent procedure ........................................................ 64
References ...................................................................................................................................................... 81
3
Acknowledgements
New Philanthropy Capital is grateful to all of the Building Connections Fund grant holders, the
people who gave up their time to participate in this evaluation, our partners, the Centre for Youth
Impact, and our advisory group (which also includes the What Works Centre for Wellbeing, Bryson
Purdon Social Research, David Pritchard, and Brunel University London). We would also like to
thank The National Lottery Community Fund (The Fund), the Co-op Foundation and the
Department for Digital, Culture, Media and Sport (DCMS) for supporting this evaluation.
4
Related publications
For more of our work on the Building Connections Fund, including part two of our developmental
evaluation, our reflections on running a developmental evaluation, tips to help your remote project
tackle loneliness, and our guidance on co-design, head to thinkNPC.org/bcf.
5
Executive summary
Launched in December 2018 in partnership with The National Lottery Community Fund (The Fund)
and the Co-op Foundation, the £11.5m Building Connections Fund (BCF) was the first ever
government fund dedicated to reducing loneliness in England.1 Grants were awarded to 126
organisations working with people from different age groups and backgrounds, to undertake a wide
range of activities. This included 22 grant holders from the Co-op Foundation’s Youth Strand who
were working with vulnerable young people.
New Philanthropy Capital (NPC) was contracted by the Department for Digital, Culture, Media and
Sport (DCMS) in December 2018 to lead a consortium of evaluation and learning partners in
conducting a mixed methods evaluation of the BCF.
The evaluation’s aims were:
• To capture and disseminate evidence and learning.
• To measure the impact of the BCF in tackling loneliness.
• To build the learning capacity and capability of organisations working to tackle loneliness.
Prior to the onset of the Covid-19 pandemic in March 2020, we worked with grant holders to collect
data from their service users before and after they had accessed BCF projects. This was to be
supported by qualitative interviews with grant holders and their service users. By analysing this
data, we would have been able to better understand the changes that service users experienced
during their time with the BCF projects and contributed to the evidence base as to what works to
tackle loneliness.
The Covid-19 pandemic was a major disruption to grant holders’ work. Service users’ engagement
with projects changed significantly, so it was no longer practical for grant holders to collect follow-
up survey data from their service users. In response, we reflected and changed our design to a
developmental evaluation.i
1 The cross-government interest spans across the Department for Digital, Culture, Media and Sport, the Ministry of Housing, Communities and Local Government, the Department for Education, the Department for Transport, the Department for Work and Pensions, the Department of Health and Social Care, and the Department for Environment, Food and Rural Affairs.
6
This report presents findings from the curtailed initial evaluation approach. It provides a snapshot
of how the BCF was operating and service users’ levels of need prior to the evaluation being
interrupted by the Covid-19 pandemic. However, as the data is incomplete and the sample of
service users for whom we have quantitative baseline and follow-up data is small—and not
necessarily representative of the BCF as a whole—the ability to draw meaningful conclusions
about the effectiveness of the BCF prior to the Covid-19 pandemic is limited. You can read about
our developmental evaluation after the Covid-19 pandemic hit in part two, available at
thinkNPC.org/bcf.
This report analyses data from 118 of the BCF’s 126 grant holders (submitted soon after projects
started in January 2019), as well as data collected by a subset of 23 grant holders who used
surveys to collect baseline and follow-up data from their service users between September 2019
and March 2020. From this subset, a total of 212 baseline and 30 follow-up surveys from service
users have been analysed for this report. The data collected prior to the pandemic indicates:
• In geographical terms, the BCF’s grant holders were relatively evenly spread across England
and targeted a broad mix of service users. 40% (47 of 118) targeted service users in urban
areas, 23% (27 of 118) targeted those on low incomes, and 23% (27 of 118) targeted those
living alone. In terms of age, grant holders primarily targeted younger adults (16-24) and
older people (65-74).
• Grant holders delivered a diverse range of activities, mainly in community-based settings.
The most common activity type was face-to-face ‘befriending, mentoring and peer-to-peer
support’.
• Overall, BCF seems to have successfully targeted service users who were more likely to be
chronically lonely than the national average (they were more likely to answer ‘often/always’ in
response to the direct measure of loneliness question: ‘how often do you feel lonely?’).2
• Across all outcome areas, levels of need were highest for children and younger adults (aged
10-29), and generally lowest for middle-aged adult service users (aged 30-59), with older
adult service users (aged 60+) usually somewhere in the middle.
• Female service users had more concerning levels of mental health and well-being than male,
with 16% (17 of 104) falling into Short Warwick-Edinburgh Mental Well-being Scale
(SWEMWBS) ‘low’ category compared to 8% (7 of 88) of men.3 Similarly, female service
2 Based on an indicative comparison of BCF service users to respondents from the Department for Digital, Culture, Media and Sport’s Community Life Survey: Focus on Loneliness 2019-20. 3 See details on calculations for SWEMWBS in Section 3 for further information.
7
users reported slightly higher levels of chronic loneliness than male (20% versus 16%, or 21
of 107 versus 14 of 90). No difference was found between genders on whether they felt they
had positive relationships.
In terms of changes in outcomes during the data collection period (September 2019 to March
2020), of the 30 service users who completed an eligible follow-up survey:
• Most services users reported improvements around loneliness, confidence, resilience, and
well-being.
• The outcome showing the highest mean positive change was the direct measure of
loneliness (how often do you feel lonely?) which improved by 0.69 points on average (14%).4
• Using a self-reported measure of improvement, 28 out of 30 service users reported that
engaging with the service had reduced or prevented their loneliness ‘somewhat’ or ‘a great
deal’.
Service users who completed both surveys generally reported having a positive experience of
funded activities. The evaluation highlighted that for service users for whom we have data, ‘trusting
staff and volunteers’ and ‘feeling change is possible’ may be two key ‘success factors’ of services
aiming to reduce loneliness.5
The Covid-19 pandemic has re-shaped our world and we are in a very different place to when this
evaluation started. Notwithstanding this context, feedback from grant holders and our own
reflections on this evaluation approach have led to some important learning and recommendations
for evaluations of similar funds. These include:
• Funders must commission the learning and evaluation partner in advance of awarding the grants and finalising the contracts with the grant holders. This would give the learning
and evaluation partner time to develop the necessary support and guidance so it is ready
from the outset, and also to agree what commitment is necessary from grant holders, so as
to be clear about the costs of participation. This wasn’t possible for BCF as grant holders
needed as much time as possible to deliver activity for the proportion of funding which had to
be spent in 2018/19 in line with government accounting rules.
• Data collection is time consuming; funders must ringfence dedicated funding for planning,
data collection and dissemination activities.
4 See details on calculations for change in outcomes in Section 4. 5 By ‘success factors’ we mean the mechanisms of change that correlate the most with a reduction in loneliness.
8
• Grant holders struggle to collect the necessary data; funders must support grant holders to
build their organisational monitoring and evaluation knowledge and experience.
• Data about medium to long-term outcomes for service users is not always helpful for delivery
organisations on a day-to-day basis; funders may want to align their priorities with delivery
partner priorities. Shorter feedback loops and increased formative reflection evaluations
will help maintain levels of engagement with the work.
In this report
We’ve written this report for funders, policymakers in government and charities, researchers, and
front-line charities working to prevent or reduce loneliness. Our report shares the consolidated
findings from the interrupted evaluation of the Building Connections Fund. The report is structured
as follows:
● Section 1, Introduction. The broad context of loneliness in England and the aims of the
BCF.
● Section 2, Evaluation methods. Our evaluation aims and questions, theory of change,
approach to data collection and analysis, and limitations.
● Section 3, Findings: Understanding the grant holders and service users. Findings from
grant holders on their activities and the needs of their service users.
● Section 4, Findings: Changes in outcomes, mechanisms of change and ‘success factors’. Findings from follow-up surveys with service users.
● Section 5, Summary of findings. A summary of key findings from Sections 3 and 4.
● Section 6, Considerations and recommendations. The implications for future policy and
practice, with suggestions for further research.
9
1. Introduction
This section outlines the broad context of loneliness in England, why the BCF was set up, and how the Covid-19 pandemic affected the evaluation.
1.1 Loneliness in England
‘Loneliness is a subjective, unwelcome feeling of lack or loss of companionship, which happens
when we have a mismatch between the quantity and quality of social relationships that we have,
and those that we want. It is often associated with social isolation, but people can and do feel
lonely even when in a relationship or when surrounded by others’
Perlman and Peplau, 1981
Loneliness fluctuates throughout people’s lives, with different causes and needs at different ages.
It is not just about having less contact or a change in relationships, but about a person’s identity
and sense of belonging, and whether they feel their social network is ‘normal’ for their stage of life.ii
Chronic loneliness affects around 6% of people in England, of all ages and backgrounds.iii While
everyone occasionally feels lonely, chronic loneliness, defined as people who report feeling often
or always lonely, can cause significant ill health on a par with smoking or obesity.iv Loneliness is
linked to a greater risk of coronary heart disease, stroke, depression, cognitive decline, Alzheimer’s
and early death.v Loneliness has also been found to be linked to the likelihood of needing to go to
the doctor, hospital, or residential care, and the likelihood of performing poorly at work or at
school.vi Across Britain as a whole, an ONS study from April 2021 suggests that chronic loneliness
has been increasing for adults throughout the pandemic, reaching 7.2% of the population in Great
Britain and particularly prevalent amongst young people, unemployed people, and those living
alone.vii
This paper focuses on the work of the Building Connections Fund (BCF) to reduce and prevent
loneliness prior to the Covid-19 pandemic (prior to March 2020). The work of grant holders during
the pandemic (March 2020 onwards) is evaluated in Part Two, available at thinkNPC.org/bcf.
10
1.2 The Building Connections Fund and the Covid-19 pandemic
The Building Connections Fund (BCF) was an £11.5m cross-government fund in partnership with
The Fund and the Co-op Foundation.6 It was set up in response to the recommendations of the Jo
Cox Loneliness Commission established by Jo Cox, MP for Batley and Spen until her death in
summer 2016, to shine a spotlight on the millions of people who are lonely living in our
communities.viii The BCF was part of the government’s wider package to tackle loneliness,
alongside the first loneliness strategy for Englandix and recommendations on standard measures of
loneliness.x
The BCF aimed to:
• Increase social connections, helping people form strong and meaningful relationships,
creating a sense of community and belonging, and helping people feel more connected.
• Support organisations to build on their existing work, such as by reaching more people or
working in a new area or with a different method or group of people.
• Encourage organisations to join up with others locally.
• Improve the evidence base and learn from what worked and what did not to inform longer-
term policy and funding decisions.
The BCF gave grants to 126 voluntary, community and social enterprise organisations working with
different groups across England.7 Grants were awarded in December 2018. Whilst they varied in
length, most were scheduled to last for just over two years and to end in March 2021. However,
many projects have now been extended due to the Covid-19 pandemic.
We were appointed by DCMS, as the BCF’s evaluation and learning partner, to lead a consortium
including the Centre for Youth Impact, the What Works Centre for Wellbeing, and Brunel University
London. From January 2019 we worked closely with grant holders to collect and analyse data to
build on the limited evidence base around what works to prevent and tackle loneliness, with a
particular focus on what works for young people, as this was identified as an area with notably
limited evidence.xi
6 The cross-government interest spans across the Department for Digital, Culture, Media and Sport, the Ministry of Housing, Communities and Local Government, the Department for Education, the Department for Transport, the Department for Work and Pensions, the Department of Health and Social Care, and the Department for Environment, Food and Rural Affairs. 7 The full list of BCF grant holders can be found here: Grant holder list.pdf (publishing.service.gov.uk).
11
The Covid-19 pandemic significantly impacted the BCF. From March 2020, grant holders were no
longer able to deliver their projects as planned, nor collect data for the original evaluation.
Consequently, we adapted the evaluation to reflect the ever-changing nature of the ‘new normal’.
We took a two-pronged approach:
• Analysing and reporting on the data collected prior to the Covid-19 pandemic; this is the
focus of this report.
• Conducting a developmental evaluation to capture learning during the Covid-19 pandemic;
this is reported on in part two, available at thinkNPC.org/bcf.
Defining loneliness and social isolationxii
Loneliness is different to social isolation. Loneliness is a subjective experience, in that we can
have any number of connections with family, friends, or other people, and still feel lonely. Social
isolation is an objective state—defined in terms of the quantity of social relationships and
contacts.
12
2. Evaluation methods
This section outlines our evaluation aims and questions, why the evaluation approach was taken and how we approached data collection, analysis, and reporting.
2.1 Aims and research questions: How effective was the BCF prior to the Covid-19 pandemic?
The evaluation aims were:
• To capture and disseminate evidence and learning.
• To measure the impact of the BCF in tackling loneliness.
• To build the learning capacity and capability of organisations working to tackle loneliness.
Due to limitations in data collection, we revised our evaluation questions:
• Who were the BCF’s grant holders? Where were they based? Who did the BCF intend to
reach? What services did grant holders intend to provide and in what setting? How did grant
holders expect people to engage with services? (Section 3.1)
• How extensive was the need for support? What were service users’ needs before they
attended? (Section 3.2)
• What changes have service users reported around loneliness, relationships, well-being,
confidence and resilience? (Section 4.1)
• How was service users’ experience of the funded activities? (Section 4.2)
• What were the key ‘success factors’? (Section 4.3)
13
2.2 Evaluation approach
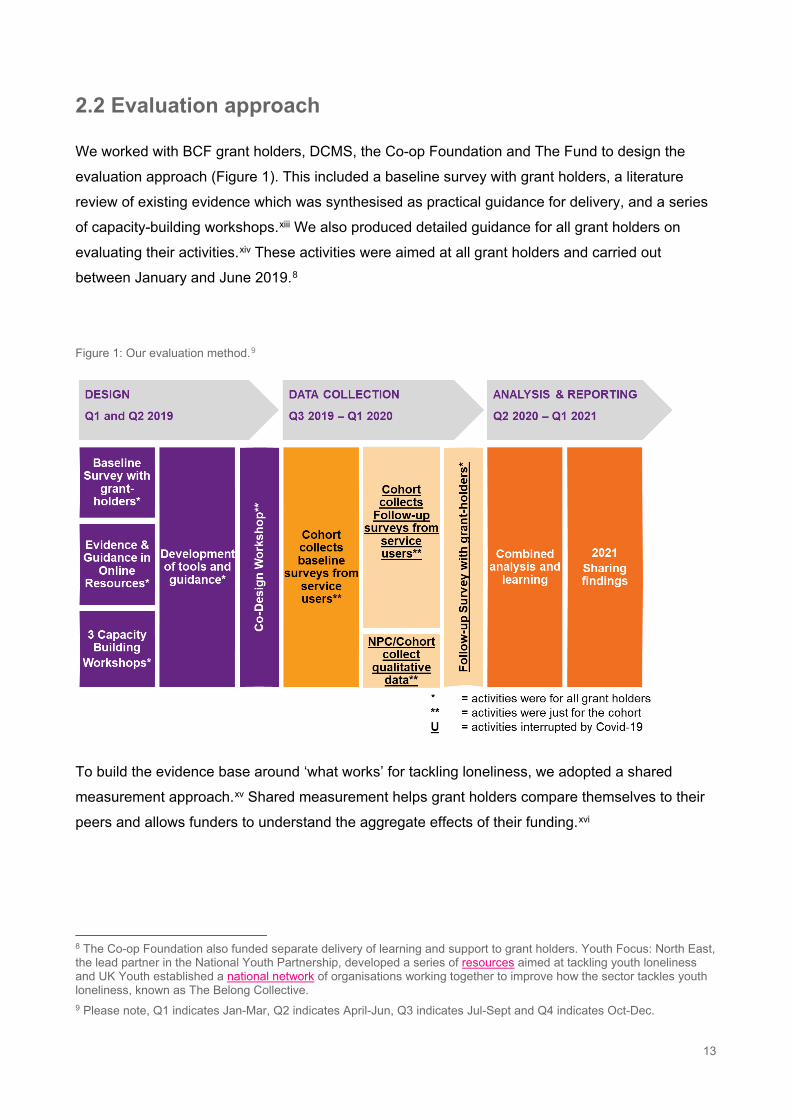
We worked with BCF grant holders, DCMS, the Co-op Foundation and The Fund to design the
evaluation approach (Figure 1). This included a baseline survey with grant holders, a literature
review of existing evidence which was synthesised as practical guidance for delivery, and a series
of capacity-building workshops.xiii We also produced detailed guidance for all grant holders on
evaluating their activities.xiv These activities were aimed at all grant holders and carried out
between January and June 2019.8
Figure 1: Our evaluation method.9
To build the evidence base around ‘what works’ for tackling loneliness, we adopted a shared
measurement approach.xv Shared measurement helps grant holders compare themselves to their
peers and allows funders to understand the aggregate effects of their funding.xvi
8 The Co-op Foundation also funded separate delivery of learning and support to grant holders. Youth Focus: North East, the lead partner in the National Youth Partnership, developed a series of resources aimed at tackling youth loneliness and UK Youth established a national network of organisations working together to improve how the sector tackles youth loneliness, known as The Belong Collective. 9 Please note, Q1 indicates Jan-Mar, Q2 indicates April-Jun, Q3 indicates Jul-Sept and Q4 indicates Oct-Dec.
14
We recruited a group of 26 volunteer grant holders (the ‘cohort’), to collect this common data, of
whom 23 participated with eligible data. The cohort received no additional funding for their
involvement in the evaluation. Cohort members were recruited based on several criteria, including:
• Willingness and capacity to participate in the evaluation.
• Delivery format. We prioritised more regular and frequent delivery.
• Number of expected service users. We prioritised those who would likely give us more data
points.
We also prioritised grant holders targeting young people as we were interested in strengthening
the limited evidence base around tackling youth loneliness.
Once participants had been selected and agreed to be involved, we invited them to an evaluation
co-design workshop in June 2019. During this workshop, we trained participants on shared
measurement, developed shared evaluation questions, refined the shared theory of change,
identified and prioritised common outcomes and mechanisms of change, and discussed data
collection approaches.10
Our overarching evaluation questions were refined further with our partners and funders (DCMS,
The Fund and the Co-op Foundation).
2.3 Theory of change
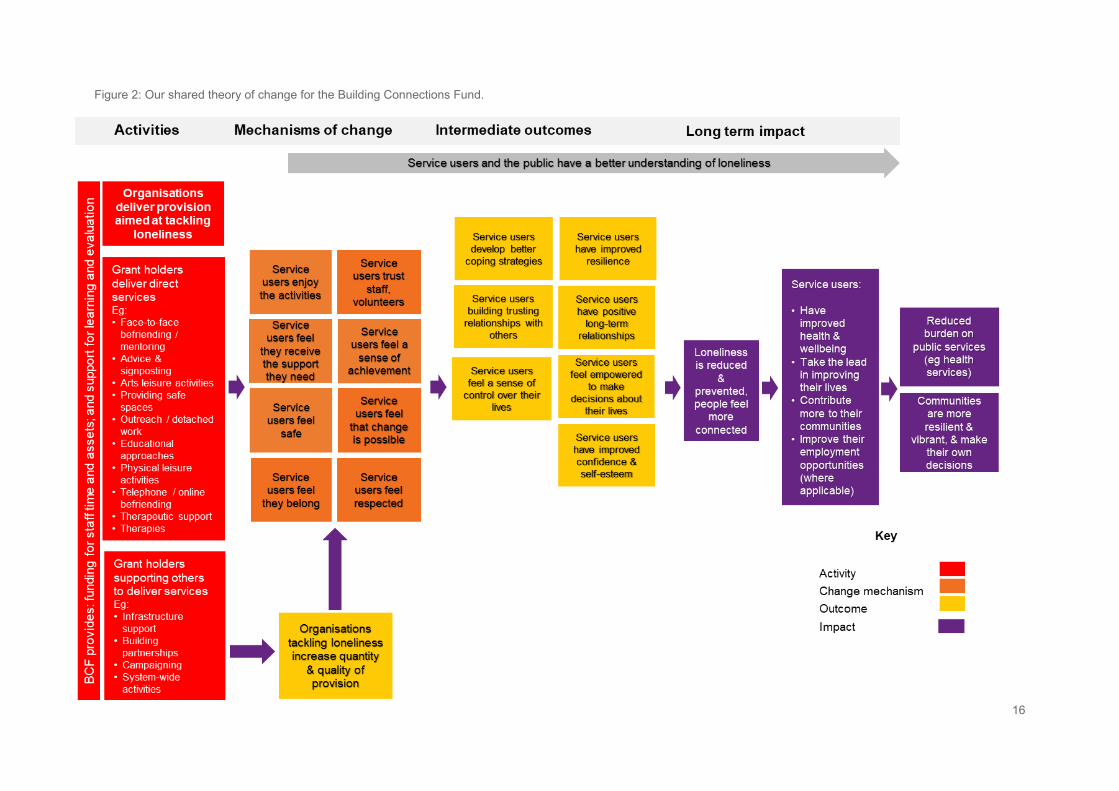
The theory of change, which we co-designed with grant holders, detailed the long-term impact of
the BCF, as well as the intermediate outcomes, the mechanisms of change, and the range of
activities being delivered (Figure 2):
• Impact: The BCF aims to reduce and prevent loneliness over the long term and help people
feel more connected to others. Reducing and preventing loneliness should lead to improved
health and well-being; people taking the lead in improving their lives; people contributing
more to their communities; and improved employment and volunteering opportunities. On a
broader scale, the BCF aims to foster communities which are more resilient, vibrant and
make their own decisions, with less demand on public services.
10 More information on theory of change components used can be found here: Ten steps of theory of change.
15
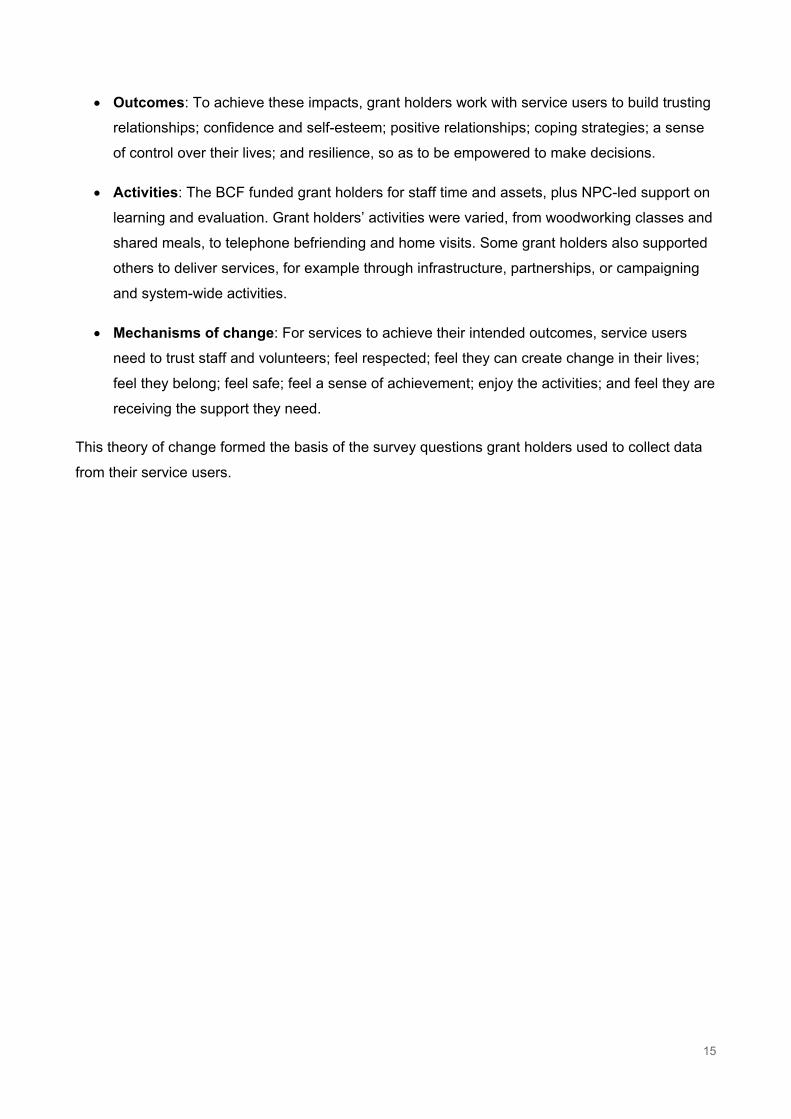
• Outcomes: To achieve these impacts, grant holders work with service users to build trusting
relationships; confidence and self-esteem; positive relationships; coping strategies; a sense
of control over their lives; and resilience, so as to be empowered to make decisions.
• Activities: The BCF funded grant holders for staff time and assets, plus NPC-led support on
learning and evaluation. Grant holders’ activities were varied, from woodworking classes and
shared meals, to telephone befriending and home visits. Some grant holders also supported
others to deliver services, for example through infrastructure, partnerships, or campaigning
and system-wide activities.
• Mechanisms of change: For services to achieve their intended outcomes, service users
need to trust staff and volunteers; feel respected; feel they can create change in their lives;
feel they belong; feel safe; feel a sense of achievement; enjoy the activities; and feel they are
receiving the support they need.
This theory of change formed the basis of the survey questions grant holders used to collect data
from their service users.
16
Figure 2: Our shared theory of change for the Building Connections Fund.
17
2.4 Data collection and analysis
Quantitative data about grant holders: Collection
We collected data about grant holders using an online survey which ran from December 2018 to
January 2019. The survey sought to understand grant holders’ planned activities and the service
users they were expecting to reach.
We sent invitations to all grant holders, followed by several reminders. We received a response
rate of 94% (118 out of 126). Every respondent answered every question, except for optional open
text answers. Many questions allowed for multiple responses.
Quantitative data about grant holders: Analysis
Analysis of this data informed Section 3.1 of this report. We used descriptive statistics to
summarise trends in grant holders’ activities and geographical spread; the service users they were
targeting; and expected reach. After selecting the cohort, we compared responses from the cohort
to all BCF grant holders to assess representativeness (see Box 1 in Section 2.5 for more details).
Quantitative data about service users: Collection
The cohort used two types of survey to collect data from service users (Figure 3):
● Baseline surveys were used to collect data from service users soon after they registered for
that activity. This gave us a baseline measure for the outcomes identified in the theory of
change. These are reported in Section 3.2.
● Follow-up surveys were issued to service users approximately three months after they
completed a baseline survey. They were intended to be repeated up to three times at three-
month intervals.11 These surveys collected feedback data on how they had experienced the
activities so far (to test the mechanisms of change in the theory of change), and outcomes data to understand outcomes experienced since starting to engage. These also included
some open text questions for service users to feedback on their experiences.
We provided grant holders with support to collect data consistently and grant holders piloted the
surveys before use. The final surveys can be found in Appendix A.
11 However, as highlighted, due to the interruptions related to the Covid-19 pandemic, we only collected follow-up surveys once from a smaller proportion of service users.
18
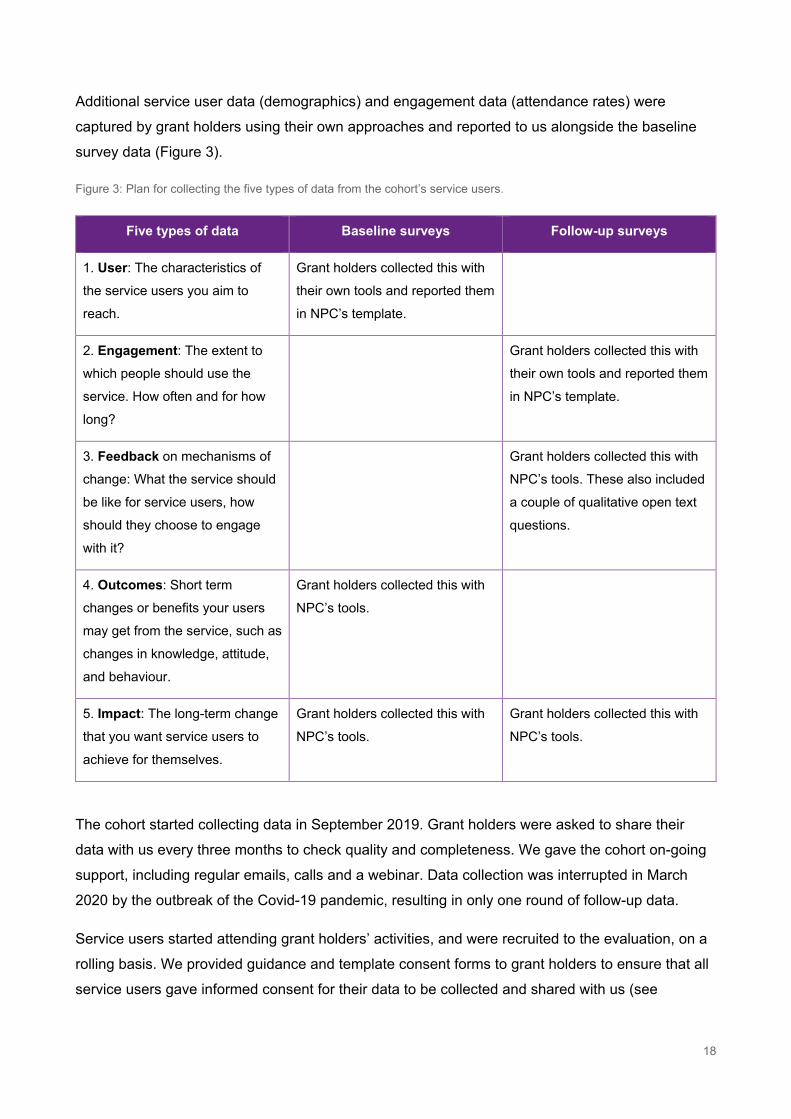
Additional service user data (demographics) and engagement data (attendance rates) were
captured by grant holders using their own approaches and reported to us alongside the baseline
survey data (Figure 3).
Figure 3: Plan for collecting the five types of data from the cohort’s service users.
Five types of data Baseline surveys Follow-up surveys
1. User: The characteristics of
the service users you aim to
reach.
Grant holders collected this with
their own tools and reported them
in NPC’s template.
2. Engagement: The extent to
which people should use the
service. How often and for how
long?
Grant holders collected this with
their own tools and reported them
in NPC’s template.
3. Feedback on mechanisms of
change: What the service should
be like for service users, how
should they choose to engage
with it?
Grant holders collected this with
NPC’s tools. These also included
a couple of qualitative open text
questions.
4. Outcomes: Short term
changes or benefits your users
may get from the service, such as
changes in knowledge, attitude,
and behaviour.
Grant holders collected this with
NPC’s tools.
5. Impact: The long-term change
that you want service users to
achieve for themselves.
Grant holders collected this with
NPC’s tools.
Grant holders collected this with
NPC’s tools.
The cohort started collecting data in September 2019. Grant holders were asked to share their
data with us every three months to check quality and completeness. We gave the cohort on-going
support, including regular emails, calls and a webinar. Data collection was interrupted in March
2020 by the outbreak of the Covid-19 pandemic, resulting in only one round of follow-up data.
Service users started attending grant holders’ activities, and were recruited to the evaluation, on a
rolling basis. We provided guidance and template consent forms to grant holders to ensure that all
service users gave informed consent for their data to be collected and shared with us (see
19
Appendix A for consent forms). In total, 26 grant holders collected 386 baseline surveys and 109
follow-up surveys.
Quantitative data about service users: Cleaning and exclusions
Data collected from the service users was combined to understand the BCF in aggregate. Some
ineligible surveys that appeared to be collected or entered in error were removed. The eligibility of
baseline surveys from the cohort was determined by two criteria:
1. The baseline surveys were taken between September 2019 and March 2020. We
concluded that baseline surveys taken before the start of the small cohort’s pilot period in
September 2019 or after we stopped collecting data in March 2020 were errors. The 38 data
entries which did not meet this criterion were excluded from our analysis.
2. The baseline surveys were taken within one month of service user registration. Grant
holders were asked to conduct surveys within two weeks of service users joining, so that this
data would more accurately reflect how service users felt before substantial engagement with
the service. However, in consultation with DCMS, we relaxed the rule to allow for all
baselines collected within one month (31 days) of new service users joining to be included in
our analysis to give us a bigger sample size. The 171 data entries which did not meet this
criterion were excluded from our analysis.
The eligibility of follow-up surveys were determined by one further criterion:
3. The follow-up survey was taken 8 to 15 weeks after the baseline. Grant holders were
asked to conduct follow-up surveys 10 to 12 weeks after the baseline surveys, so that this
data would more accurately reflect how service users felt after a comparably long
engagement with the service. However, in consultation with DCMS, we relaxed the rule to
allow for follow-ups collected between 8 and 15 weeks after the baselines to give us a bigger
sample size. The 65 data entries which did not meet this criterion were excluded from our
analysis.
These criteria were not mutually exclusive; some baselines and follow-ups were excluded for more
than one reason. If a baseline survey was excluded, the service user’s follow-up survey was also
excluded.
Three members of the cohort did not submit any eligible data in accordance with the criteria above.
In all, 23 grant holders collected 212 eligible baseline surveys and 7 of the 23 grant holders collected
30 eligible follow-up surveys which were analysed in this report. These grant holders are referred to
as ‘the cohort’.
20
Quantitative data about service users: Data analysis
We used descriptive statistics to summarise patterns in the dataset using means, proportions, and
frequencies.12 For baseline outcomes (reported in Section 3.2), we analysed sub-groups, namely
age groups and gender, to compare needs amongst different groups. The analysis excluded
missing data from unanswered questions, such as those who did not submit an age or gender (for
the sub-group analysis), and those who recorded invalid answers (such as a 0 on a 1-3 scale). We
also used inferential statistics, namely statistical tests (unpaired T-Tests), to check how these
findings compared to the wider population.xvii
Follow-up outcomes (reported in Section 4.1) were evaluated by comparing baseline and follow-up
surveys to calculate change over time. We also analysed the self-reported measure, which
recorded service users’ perceived improvements in their loneliness as a result of activities.13 We
did not conduct sub-group analysis on follow-up surveys as the sample size (27-30) was too small.
We only analysed outcomes where there were 27 or more responses.14 For each outcome, we
present the number of service users who experienced a positive change, no change, or negative
change, and the mean percentage change across all respondents. Similarly, for feedback answers
relating to mechanisms of change (reported in Section 4.2), we have used frequencies to show
how service users experienced their activities.
To assess potential ‘success factors’ (Section 4.3), we looked at the correlation coefficient between
answers relating to mechanisms of change and the change experienced in the direct measure of
loneliness—the indicator with which we saw the largest positive change among service users.15
These findings about the correlation coefficient are purely indicative and are not statistically
significant.
Qualitative data about service users
We conducted semi-structured interviews with two service users and one paired interview with
two staff at one organisation. All service users were asked to give informed consent for their data
to be collected and recorded by the grant holders and shared with us. Interviews were analysed
and synthesised into an illustrative case study. To protect the anonymity of these participants, it is
not possible to present more detail of these accounts.
12 A descriptive statistic is a summary statistic that quantitatively describes or summarises features from a collection of information, while descriptive statistics is the process of using and analysing those statistics. 13 Self-reported measure: ‘To what extent do you think coming to the activity helped to reduce or prevent your loneliness?’ 14 The next most answered outcomes only had 12 responses. 15 The corelation coefficient is a statistical measure of the strength of relationship between two sets of data.
21
This data was limited and is therefore used primarily to inform the case study in Box 3 of this
report. All tools and guidance can be found in Appendix A.
2.5 Methodological considerations
In this report, we have made the best use of available data to build a picture of service user needs
and the work of the BCF prior to the outbreak of the Covid-19 pandemic in March 2020.
Limitations: Data collection
As noted above, the Covid-19 pandemic prevented grant holders from continuing to collect
baseline and follow-up data. This was the most significant limitation because the evaluation is
incomplete. As per Box 1, the sample of service users for whom we have quantitative baseline and
follow-up data is small and not necessarily representative of the BCF as a whole and should not be
extrapolated. Therefore, the conclusions and recommendations that can be derived from this
evaluation are necessarily limited.
Throughout the data collection period (September 2019 to March 2020), we supported grant
holders to collect and share data. However, the following challenges arose related to the service
user data collection:
• It was difficult to recruit and retain grant holders in the cohort: the dropout rate was high, and
it was necessary to keep recruitment rolling (see Box 2 for a summary of reflections).
• The quality of grant holders’ data entry was variable: even with advice and guidance, almost
half of all the data submitted was not eligible for analysis, the most common reason being
that baselines were reported more than one month after a new service user registered with a
service. Moreover, not all service users answered every question in their surveys, which
meant that for some questions the response rate is lower.
The Covid-19 pandemic interrupted qualitative data collection which meant we were only able to
conduct a very limited number of interviews (two) and focus groups (one). As such, the survey data
could not be triangulated with the qualitative data as had been originally planned.
An additional limitation comes from the risk of social desirability bias in some service users’
responses.16 In some cases, service users were asked questions by staff members from the grant
16 Social desirability bias is a type of response bias in which respondents over-report positive feelings to be seen favourably by others.
22
holding organisation, such as whether they enjoyed activities or feel they helped them to feel less
lonely, and they may have responded in a way that would have been viewed positively by the staff
member.
Limitations: Analysis
In terms of limitations to analysis, the most important factor was the limited data set. To mitigate
any potential risk of disclosure of identifying information, sub-groups were combined, and those
that contained fewer than 15 people (including ethnic minorities but excluding white minorities and
those who identified their gender as ‘other’) were not analysed.17 We present the absolute
numbers for each sub-group in all the charts and tables for transparency. We do not report on the
number or express percentages when there are fewer than five people represented in a cell.
Limitations: Representativeness of cohort, baselines and follow-ups
As noted above, the cohort was not designed to be representative of the BCF as a whole but rather
to collect the most eligible data possible from the most willing grant holders, and to fill evidence
gaps. Nonetheless, quota sampling ensured that the cohort was fairly representative of the BCF
with regards to geographic spread, targeting of specific characteristics from service users, and
types of activity. It was less representative in terms of target age of service users as we aimed to
increase the number of grant holders in the cohort who targeted younger people. As noted above,
grant holders expecting more service users and those with a willingness and capacity to participate
in the evaluation were also prioritised in the cohort selection.
The 212 service users who completed eligible baseline surveys (from 23 grant holders) were
broadly consistent with the groups targeted for services by the cohort. Although an even higher
proportion of data was collected from younger people than expected.
The 30 service users who completed eligible follow-up surveys came from seven grant holders that
were not representative of the BCF. These service users were older, and more were female than
the cohort as a whole (Figures 4 and 5). More details can be found in Box 1.
As a result of these significant limitations, the conclusions and recommendations that can be derived from this evaluation are necessarily limited.
17 Age groups used for analysis: ‘children and younger adults’ aged 10-29, ‘middle-aged adults’ aged 30-59, and ‘older adults’ aged 60+.
23
Box 1: Spotlight on representativeness of the cohort and eligible data
Geography: While there was a relatively representative geographic spread among cohort
members, there was slightly less cohort representation in Yorkshire and Humber, the North
East, and London when compared to the BCF as a whole.
Service user characteristics: Cohort members targeted specific service user groups in
broadly similar proportions to the full set of BCF grant holders. The cohort was generally
targeting a greater proportion of rural service users and a greater proportion of LGBT+ service
users than the BCF as a whole. A smaller proportion of cohort members were targeting ethnic
minority service users (excluding white minorities) than in the BCF as a whole.
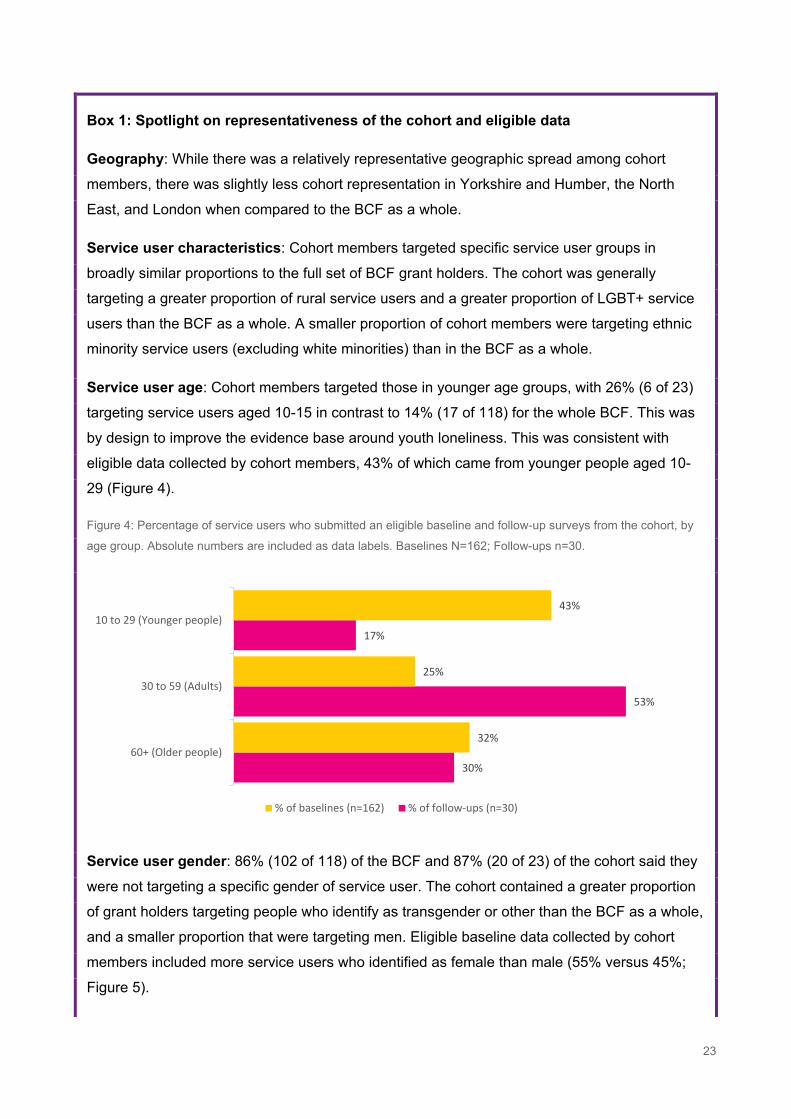
Service user age: Cohort members targeted those in younger age groups, with 26% (6 of 23)
targeting service users aged 10-15 in contrast to 14% (17 of 118) for the whole BCF. This was
by design to improve the evidence base around youth loneliness. This was consistent with
eligible data collected by cohort members, 43% of which came from younger people aged 10-
29 (Figure 4).
Figure 4: Percentage of service users who submitted an eligible baseline and follow-up surveys from the cohort, by
age group. Absolute numbers are included as data labels. Baselines N=162; Follow-ups n=30.
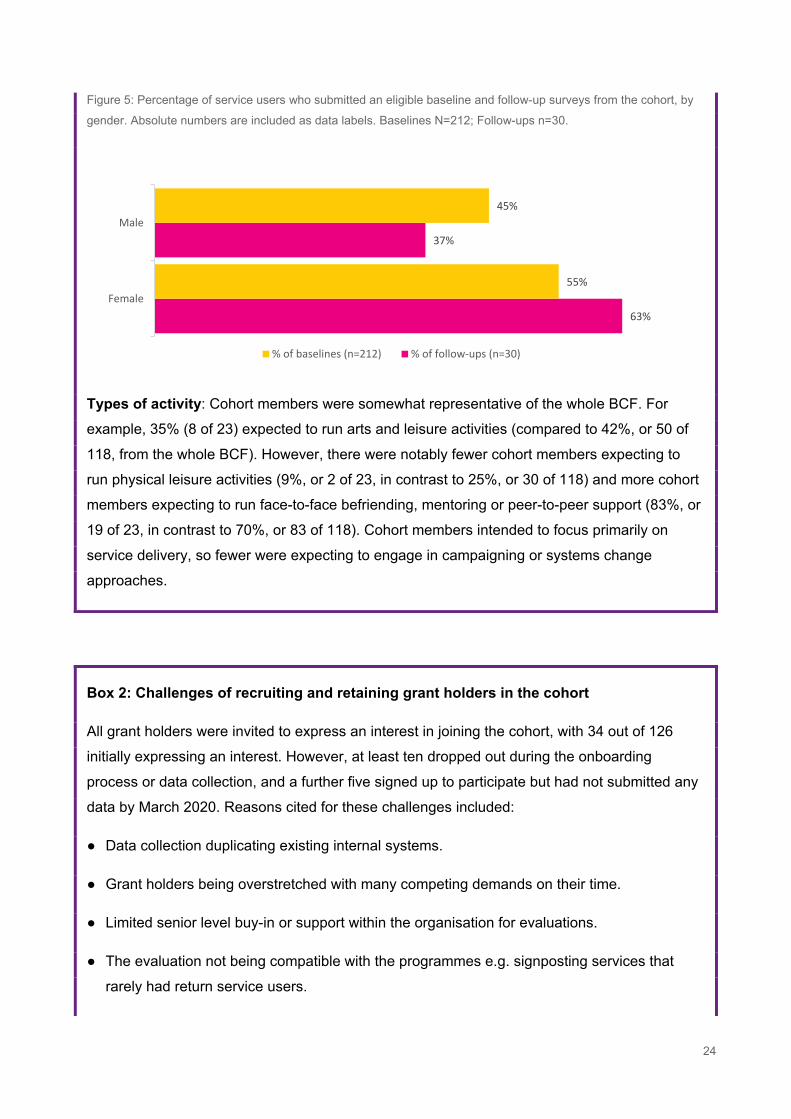
Service user gender: 86% (102 of 118) of the BCF and 87% (20 of 23) of the cohort said they
were not targeting a specific gender of service user. The cohort contained a greater proportion
of grant holders targeting people who identify as transgender or other than the BCF as a whole,
and a smaller proportion that were targeting men. Eligible baseline data collected by cohort
members included more service users who identified as female than male (55% versus 45%;
Figure 5).
30%
53%
17%
32%
25%
43%
60+ (Older people)
30 to 59 (Adults)
10 to 29 (Younger people)
% of baselines (n=162) % of follow-ups (n=30)
24
Figure 5: Percentage of service users who submitted an eligible baseline and follow-up surveys from the cohort, by
gender. Absolute numbers are included as data labels. Baselines N=212; Follow-ups n=30.
Types of activity: Cohort members were somewhat representative of the whole BCF. For
example, 35% (8 of 23) expected to run arts and leisure activities (compared to 42%, or 50 of
118, from the whole BCF). However, there were notably fewer cohort members expecting to
run physical leisure activities (9%, or 2 of 23, in contrast to 25%, or 30 of 118) and more cohort
members expecting to run face-to-face befriending, mentoring or peer-to-peer support (83%, or
19 of 23, in contrast to 70%, or 83 of 118). Cohort members intended to focus primarily on
service delivery, so fewer were expecting to engage in campaigning or systems change
approaches.
Box 2: Challenges of recruiting and retaining grant holders in the cohort
All grant holders were invited to express an interest in joining the cohort, with 34 out of 126
initially expressing an interest. However, at least ten dropped out during the onboarding
process or data collection, and a further five signed up to participate but had not submitted any
data by March 2020. Reasons cited for these challenges included:
● Data collection duplicating existing internal systems.
● Grant holders being overstretched with many competing demands on their time.
● Limited senior level buy-in or support within the organisation for evaluations.
● The evaluation not being compatible with the programmes e.g. signposting services that
rarely had return service users.
63%
37%
55%
45%
Female
Male
% of baselines (n=212) % of follow-ups (n=30)
25
● Grant holders struggling to gain consent from service users and / or their parents in the case
of under 16s.
● Some questions, such as the direct measure of loneliness, were felt to be too intrusive for
certain vulnerable service users or volunteers.
We were in regular contact with all grant holders in the cohort to identify and mitigate these
challenges. For example, we highlighted the benefits of participation for themselves and the
sector, and we developed a dashboard which automatically updated summary tables, charts,
and graphs to allow grant holders to understand their data as it was entered. We also worked
with funders to advocate for the importance of data collection with grant holder staff.
Finally, while grant holders may have been able to request a projected evaluation budget at the
application stage, we had not yet been commissioned as the learning partner, and it was
unclear what, if any, participation in evaluation would be encouraged or expected. There was
no further dedicated funding available for grant holders to take part in the evaluation. Therefore,
any time they did spend on planning, data collection and dissemination activities related to the
evaluation was either ‘borrowed’ from the BCF funding awarded for project delivery or was self-
funded. As evidence building was central to the aims of the BCF, relying on the good will and
voluntary participation of grant holders to collect the necessary data was a significant risk and
challenge.
26
3. Findings: Understanding the grant holders and
service users
This section outlines our findings, analysis, and interpretation on key evaluation questions.
3.1 Understanding the grant holders
Who were the grant holders and where were they based?
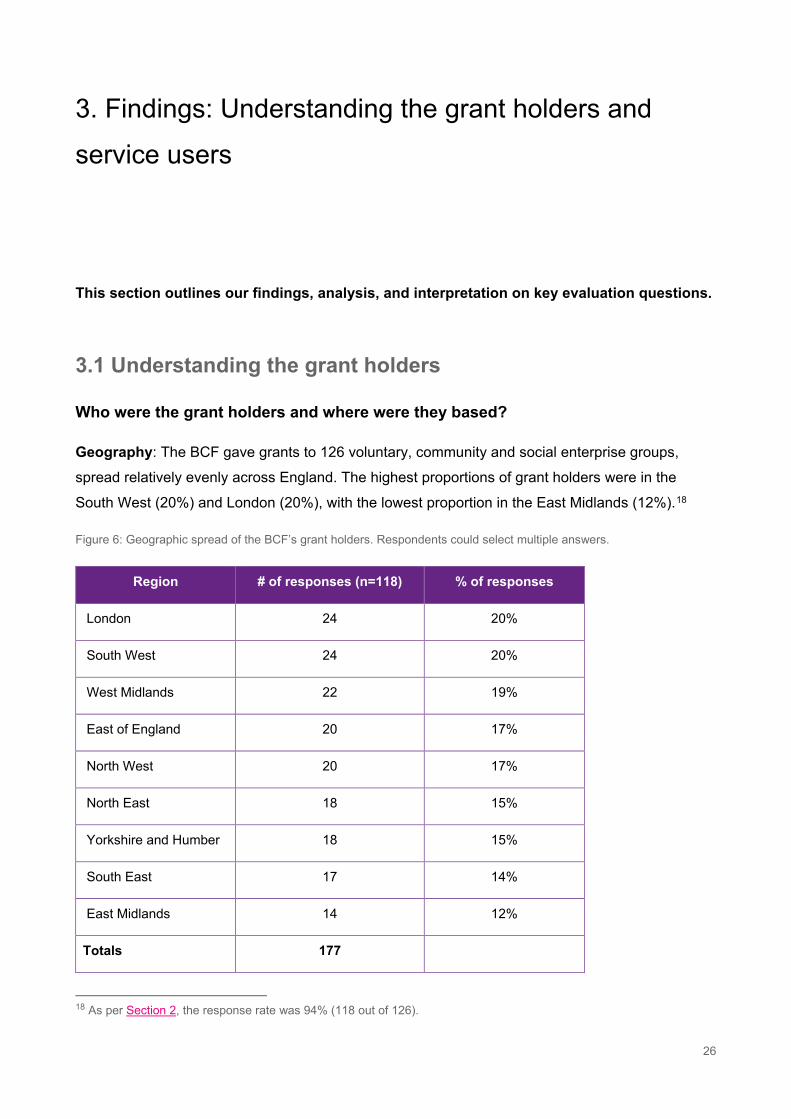
Geography: The BCF gave grants to 126 voluntary, community and social enterprise groups,
spread relatively evenly across England. The highest proportions of grant holders were in the
South West (20%) and London (20%), with the lowest proportion in the East Midlands (12%).18
Figure 6: Geographic spread of the BCF’s grant holders. Respondents could select multiple answers.
Region # of responses (n=118) % of responses
London 24 20%
South West 24 20%
West Midlands 22 19%
East of England 20 17%
North West 20 17%
North East 18 15%
Yorkshire and Humber 18 15%
South East 17 14%
East Midlands 14 12%
Totals 177
18 As per Section 2, the response rate was 94% (118 out of 126).
27
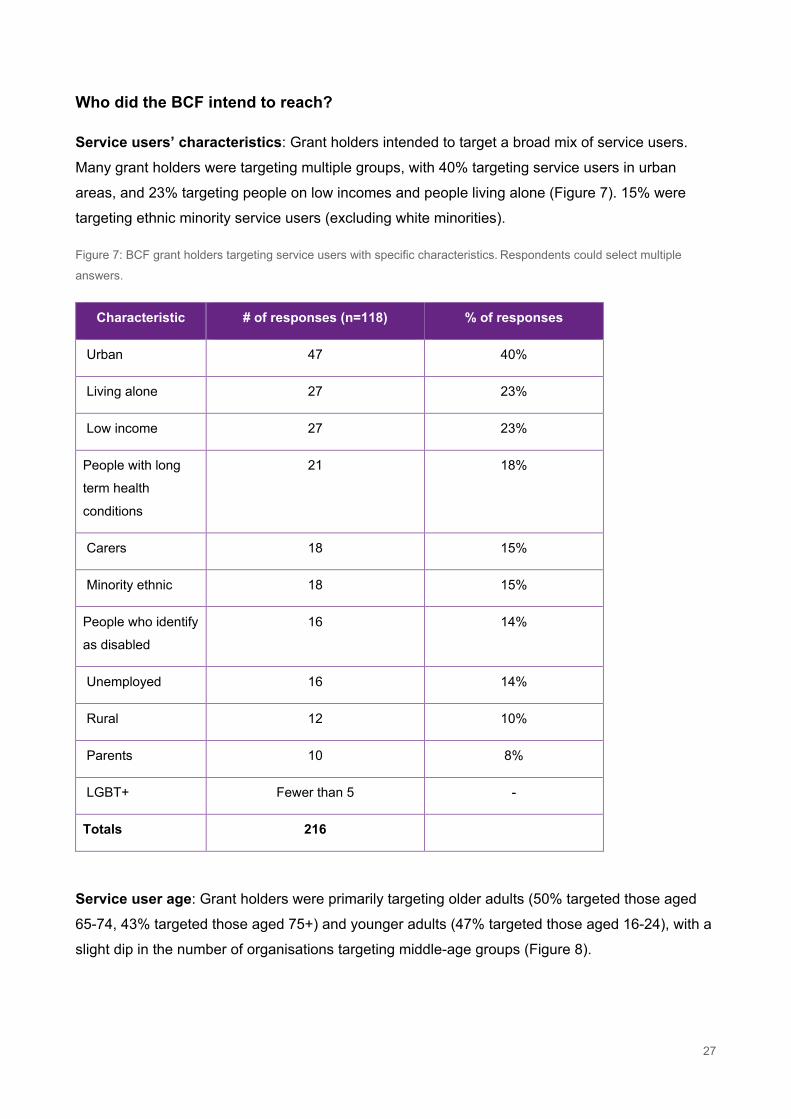
Who did the BCF intend to reach?
Service users’ characteristics: Grant holders intended to target a broad mix of service users.
Many grant holders were targeting multiple groups, with 40% targeting service users in urban
areas, and 23% targeting people on low incomes and people living alone (Figure 7). 15% were
targeting ethnic minority service users (excluding white minorities).
Figure 7: BCF grant holders targeting service users with specific characteristics. Respondents could select multiple
answers.
Characteristic # of responses (n=118) % of responses
Urban 47 40%
Living alone 27 23%
Low income 27 23%
People with long
term health
conditions
21 18%
Carers 18 15%
Minority ethnic 18 15%
People who identify
as disabled
16 14%
Unemployed 16 14%
Rural 12 10%
Parents 10 8%
LGBT+ Fewer than 5 -
Totals 216
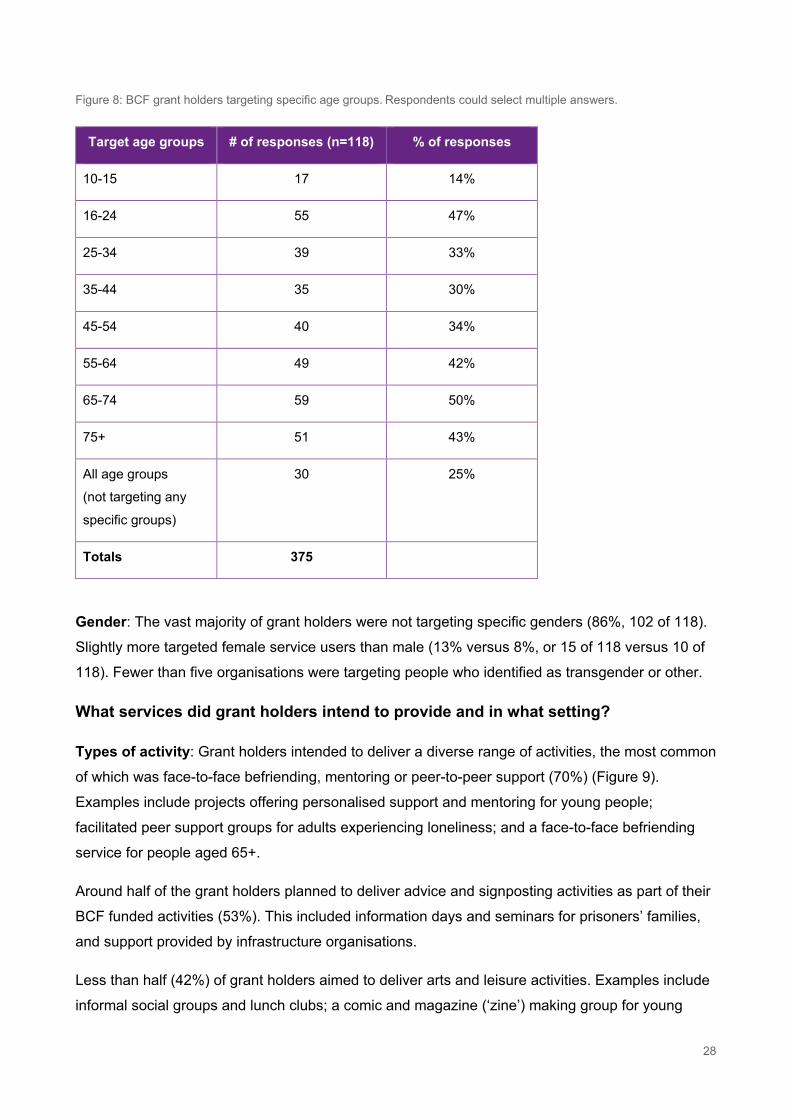
Service user age: Grant holders were primarily targeting older adults (50% targeted those aged
65-74, 43% targeted those aged 75+) and younger adults (47% targeted those aged 16-24), with a
slight dip in the number of organisations targeting middle-age groups (Figure 8).
28
Figure 8: BCF grant holders targeting specific age groups. Respondents could select multiple answers.
Target age groups # of responses (n=118) % of responses
10-15 17 14%
16-24 55 47%
25-34 39 33%
35-44 35 30%
45-54 40 34%
55-64 49 42%
65-74 59 50%
75+ 51 43%
All age groups
(not targeting any
specific groups)
30 25%
Totals 375
Gender: The vast majority of grant holders were not targeting specific genders (86%, 102 of 118).
Slightly more targeted female service users than male (13% versus 8%, or 15 of 118 versus 10 of
118). Fewer than five organisations were targeting people who identified as transgender or other.
What services did grant holders intend to provide and in what setting?
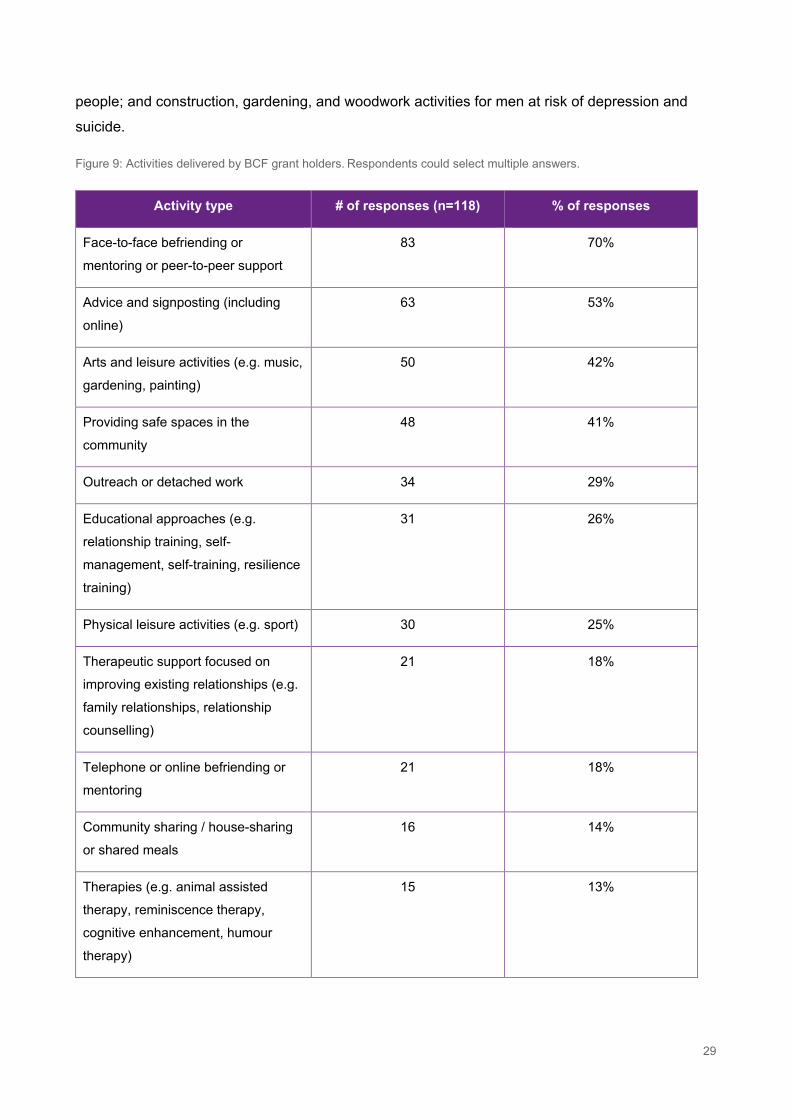
Types of activity: Grant holders intended to deliver a diverse range of activities, the most common
of which was face-to-face befriending, mentoring or peer-to-peer support (70%) (Figure 9).
Examples include projects offering personalised support and mentoring for young people;
facilitated peer support groups for adults experiencing loneliness; and a face-to-face befriending
service for people aged 65+.
Around half of the grant holders planned to deliver advice and signposting activities as part of their
BCF funded activities (53%). This included information days and seminars for prisoners’ families,
and support provided by infrastructure organisations.
Less than half (42%) of grant holders aimed to deliver arts and leisure activities. Examples include
informal social groups and lunch clubs; a comic and magazine (‘zine’) making group for young
29
people; and construction, gardening, and woodwork activities for men at risk of depression and
suicide.
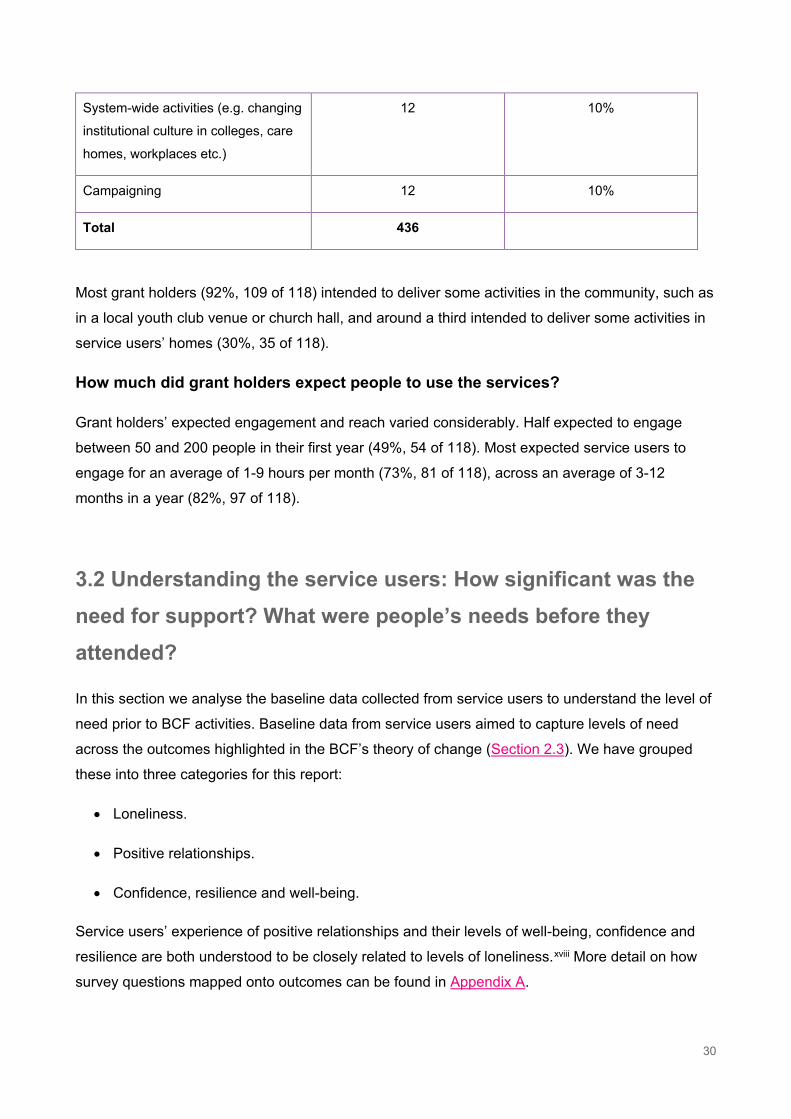
Figure 9: Activities delivered by BCF grant holders. Respondents could select multiple answers.
Activity type # of responses (n=118) % of responses
Face-to-face befriending or
mentoring or peer-to-peer support
83 70%
Advice and signposting (including
online)
63 53%
Arts and leisure activities (e.g. music,
gardening, painting)
50 42%
Providing safe spaces in the
community
48 41%
Outreach or detached work 34 29%
Educational approaches (e.g.
relationship training, self-
management, self-training, resilience
training)
31 26%
Physical leisure activities (e.g. sport) 30 25%
Therapeutic support focused on
improving existing relationships (e.g.
family relationships, relationship
counselling)
21 18%
Telephone or online befriending or
mentoring
21 18%
Community sharing / house-sharing
or shared meals
16 14%
Therapies (e.g. animal assisted
therapy, reminiscence therapy,
cognitive enhancement, humour
therapy)
15 13%
30
System-wide activities (e.g. changing
institutional culture in colleges, care
homes, workplaces etc.)
12 10%
Campaigning 12 10%
Total 436
Most grant holders (92%, 109 of 118) intended to deliver some activities in the community, such as
in a local youth club venue or church hall, and around a third intended to deliver some activities in
service users’ homes (30%, 35 of 118).
How much did grant holders expect people to use the services?
Grant holders’ expected engagement and reach varied considerably. Half expected to engage
between 50 and 200 people in their first year (49%, 54 of 118). Most expected service users to
engage for an average of 1-9 hours per month (73%, 81 of 118), across an average of 3-12
months in a year (82%, 97 of 118).
3.2 Understanding the service users: How significant was the need for support? What were people’s needs before they attended?
In this section we analyse the baseline data collected from service users to understand the level of
need prior to BCF activities. Baseline data from service users aimed to capture levels of need
across the outcomes highlighted in the BCF’s theory of change (Section 2.3). We have grouped
these into three categories for this report:
• Loneliness.
• Positive relationships.
• Confidence, resilience and well-being.
Service users’ experience of positive relationships and their levels of well-being, confidence and
resilience are both understood to be closely related to levels of loneliness.xviii More detail on how
survey questions mapped onto outcomes can be found in Appendix A.
31
Levels of need were found to be high across all three outcome areas, particularly among children
and younger adults (aged 10-29).
Loneliness: General findings
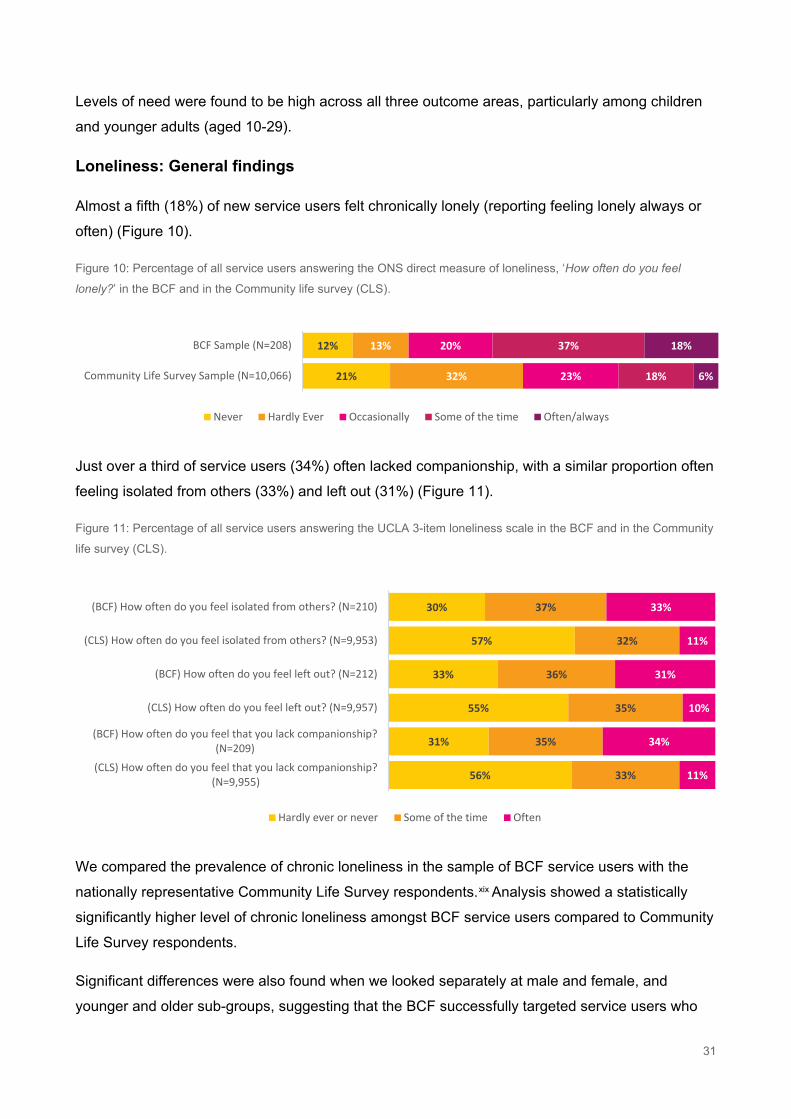
Almost a fifth (18%) of new service users felt chronically lonely (reporting feeling lonely always or
often) (Figure 10).
Figure 10: Percentage of all service users answering the ONS direct measure of loneliness, ‘How often do you feel
lonely?’ in the BCF and in the Community life survey (CLS).
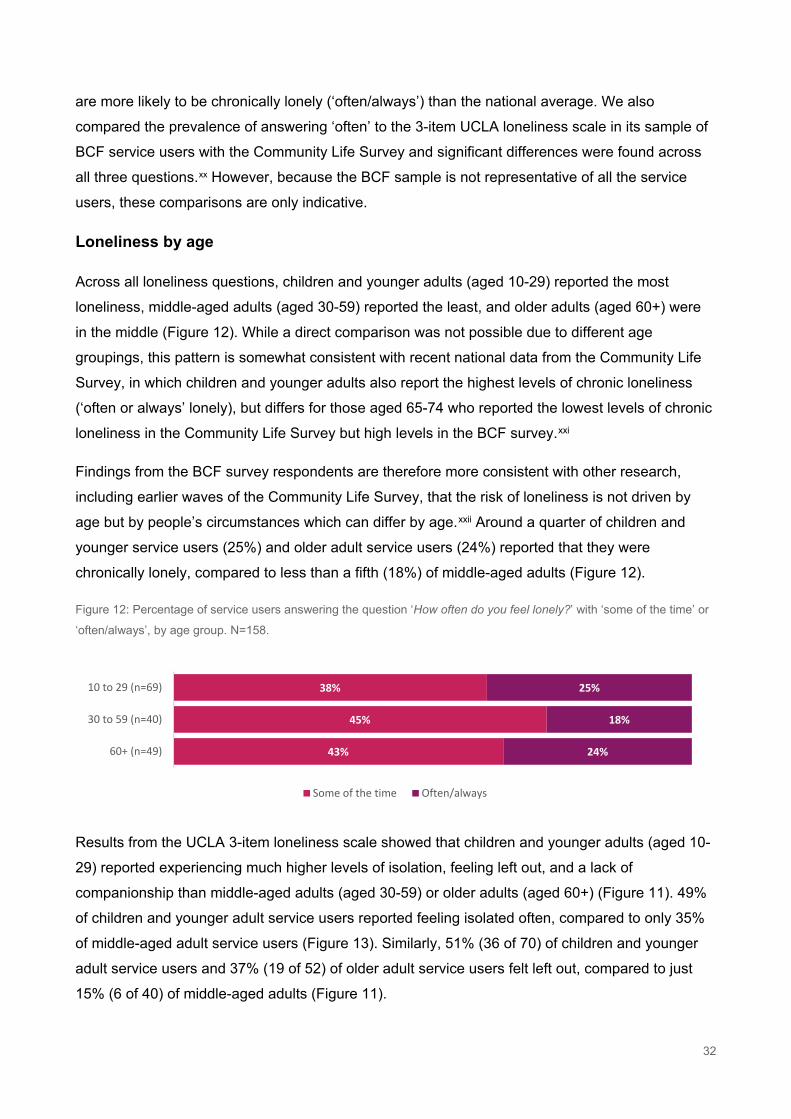
Just over a third of service users (34%) often lacked companionship, with a similar proportion often
feeling isolated from others (33%) and left out (31%) (Figure 11).
Figure 11: Percentage of all service users answering the UCLA 3-item loneliness scale in the BCF and in the Community
life survey (CLS).
We compared the prevalence of chronic loneliness in the sample of BCF service users with the
nationally representative Community Life Survey respondents.xix Analysis showed a statistically
significantly higher level of chronic loneliness amongst BCF service users compared to Community
Life Survey respondents.
Significant differences were also found when we looked separately at male and female, and
younger and older sub-groups, suggesting that the BCF successfully targeted service users who
21%
12%
32%
13%
23%
20%
18%
37%
6%
18%
Community Life Survey Sample (N=10,066)
BCF Sample (N=208)
Never Hardly Ever Occasionally Some of the time Often/always
56%
31%
55%
33%
57%
30%
33%
35%
35%
36%
32%
37%
11%
34%
10%
31%
11%
33%
(CLS) How often do you feel that you lack companionship?(N=9,955)
(BCF) How often do you feel that you lack companionship?(N=209)
(CLS) How often do you feel left out? (N=9,957)
(BCF) How often do you feel left out? (N=212)
(CLS) How often do you feel isolated from others? (N=9,953)
(BCF) How often do you feel isolated from others? (N=210)
Hardly ever or never Some of the time Often
32
are more likely to be chronically lonely (‘often/always’) than the national average. We also
compared the prevalence of answering ‘often’ to the 3-item UCLA loneliness scale in its sample of
BCF service users with the Community Life Survey and significant differences were found across
all three questions.xx However, because the BCF sample is not representative of all the service
users, these comparisons are only indicative.
Loneliness by age
Across all loneliness questions, children and younger adults (aged 10-29) reported the most
loneliness, middle-aged adults (aged 30-59) reported the least, and older adults (aged 60+) were
in the middle (Figure 12). While a direct comparison was not possible due to different age
groupings, this pattern is somewhat consistent with recent national data from the Community Life
Survey, in which children and younger adults also report the highest levels of chronic loneliness
(‘often or always’ lonely), but differs for those aged 65-74 who reported the lowest levels of chronic
loneliness in the Community Life Survey but high levels in the BCF survey.xxi
Findings from the BCF survey respondents are therefore more consistent with other research,
including earlier waves of the Community Life Survey, that the risk of loneliness is not driven by
age but by people’s circumstances which can differ by age.xxii Around a quarter of children and
younger service users (25%) and older adult service users (24%) reported that they were
chronically lonely, compared to less than a fifth (18%) of middle-aged adults (Figure 12).
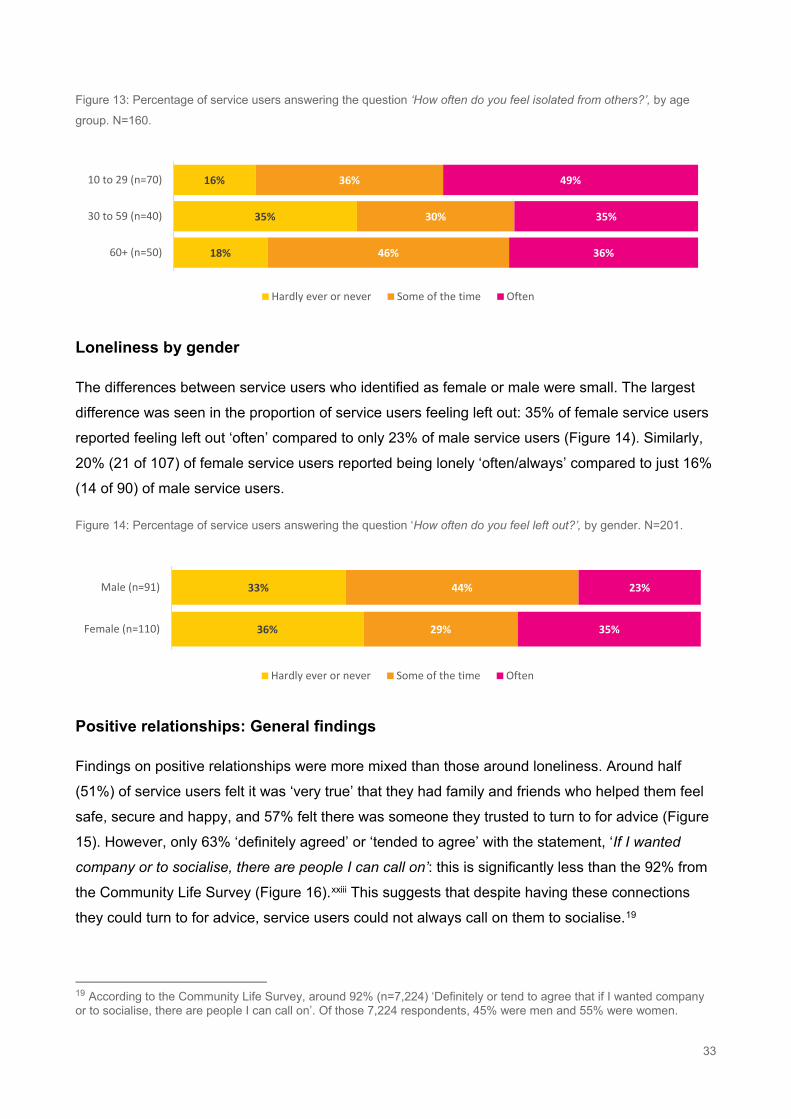
Figure 12: Percentage of service users answering the question ‘How often do you feel lonely?’ with ‘some of the time’ or
‘often/always’, by age group. N=158.
Results from the UCLA 3-item loneliness scale showed that children and younger adults (aged 10-
29) reported experiencing much higher levels of isolation, feeling left out, and a lack of
companionship than middle-aged adults (aged 30-59) or older adults (aged 60+) (Figure 11). 49%
of children and younger adult service users reported feeling isolated often, compared to only 35%
of middle-aged adult service users (Figure 13). Similarly, 51% (36 of 70) of children and younger
adult service users and 37% (19 of 52) of older adult service users felt left out, compared to just
15% (6 of 40) of middle-aged adults (Figure 11).
43%
45%
38%
24%
18%
25%
60+ (n=49)
30 to 59 (n=40)
10 to 29 (n=69)
Some of the time Often/always
33
Figure 13: Percentage of service users answering the question ‘How often do you feel isolated from others?’, by age
group. N=160.
Loneliness by gender
The differences between service users who identified as female or male were small. The largest
difference was seen in the proportion of service users feeling left out: 35% of female service users
reported feeling left out ‘often’ compared to only 23% of male service users (Figure 14). Similarly,
20% (21 of 107) of female service users reported being lonely ‘often/always’ compared to just 16%
(14 of 90) of male service users.
Figure 14: Percentage of service users answering the question ‘How often do you feel left out?’, by gender. N=201.
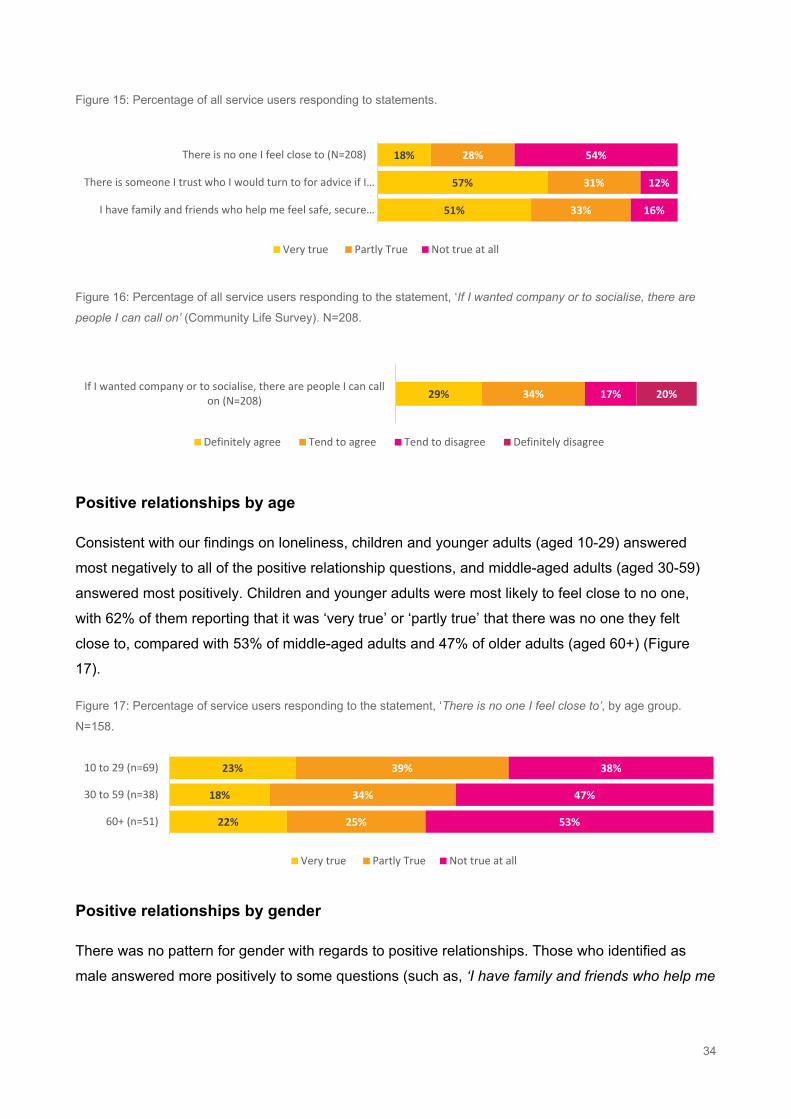
Positive relationships: General findings
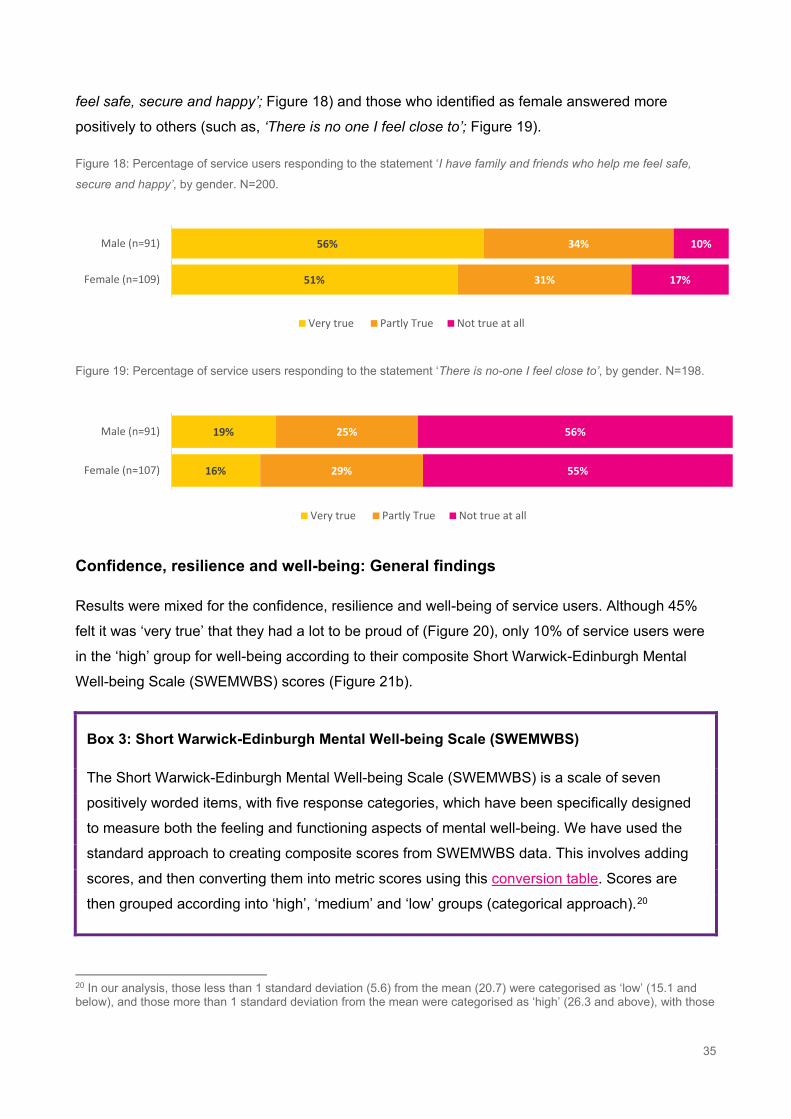
Findings on positive relationships were more mixed than those around loneliness. Around half
(51%) of service users felt it was ‘very true’ that they had family and friends who helped them feel
safe, secure and happy, and 57% felt there was someone they trusted to turn to for advice (Figure
15). However, only 63% ‘definitely agreed’ or ‘tended to agree’ with the statement, ‘If I wanted
company or to socialise, there are people I can call on’: this is significantly less than the 92% from
the Community Life Survey (Figure 16).xxiii This suggests that despite having these connections
they could turn to for advice, service users could not always call on them to socialise.19
19 According to the Community Life Survey, around 92% (n=7,224) ‘Definitely or tend to agree that if I wanted company or to socialise, there are people I can call on’. Of those 7,224 respondents, 45% were men and 55% were women.
18%
35%
16%
46%
30%
36%
36%
35%
49%
60+ (n=50)
30 to 59 (n=40)
10 to 29 (n=70)
Hardly ever or never Some of the time Often
36%
33%
29%
44%
35%
23%
Female (n=110)
Male (n=91)
Hardly ever or never Some of the time Often
34
Figure 15: Percentage of all service users responding to statements.
Figure 16: Percentage of all service users responding to the statement, ‘If I wanted company or to socialise, there are
people I can call on’ (Community Life Survey). N=208.
Positive relationships by age
Consistent with our findings on loneliness, children and younger adults (aged 10-29) answered
most negatively to all of the positive relationship questions, and middle-aged adults (aged 30-59)
answered most positively. Children and younger adults were most likely to feel close to no one,
with 62% of them reporting that it was ‘very true’ or ‘partly true’ that there was no one they felt
close to, compared with 53% of middle-aged adults and 47% of older adults (aged 60+) (Figure
17).
Figure 17: Percentage of service users responding to the statement, ‘There is no one I feel close to’, by age group.
N=158.
Positive relationships by gender
There was no pattern for gender with regards to positive relationships. Those who identified as
male answered more positively to some questions (such as, ‘I have family and friends who help me
51%
57%
18%
33%
31%
28%
16%
12%
54%
I have family and friends who help me feel safe, secure…
There is someone I trust who I would turn to for advice if I…
There is no one I feel close to (N=208)
Very true Partly True Not true at all
29% 34% 17% 20%If I wanted company or to socialise, there are people I can call
on (N=208)
Definitely agree Tend to agree Tend to disagree Definitely disagree
22%
18%
23%
25%
34%
39%
53%
47%
38%
60+ (n=51)
30 to 59 (n=38)
10 to 29 (n=69)
Very true Partly True Not true at all
35
feel safe, secure and happy’; Figure 18) and those who identified as female answered more
positively to others (such as, ‘There is no one I feel close to’; Figure 19).
Figure 18: Percentage of service users responding to the statement ‘I have family and friends who help me feel safe,
secure and happy’, by gender. N=200.
Figure 19: Percentage of service users responding to the statement ‘There is no-one I feel close to’, by gender. N=198.
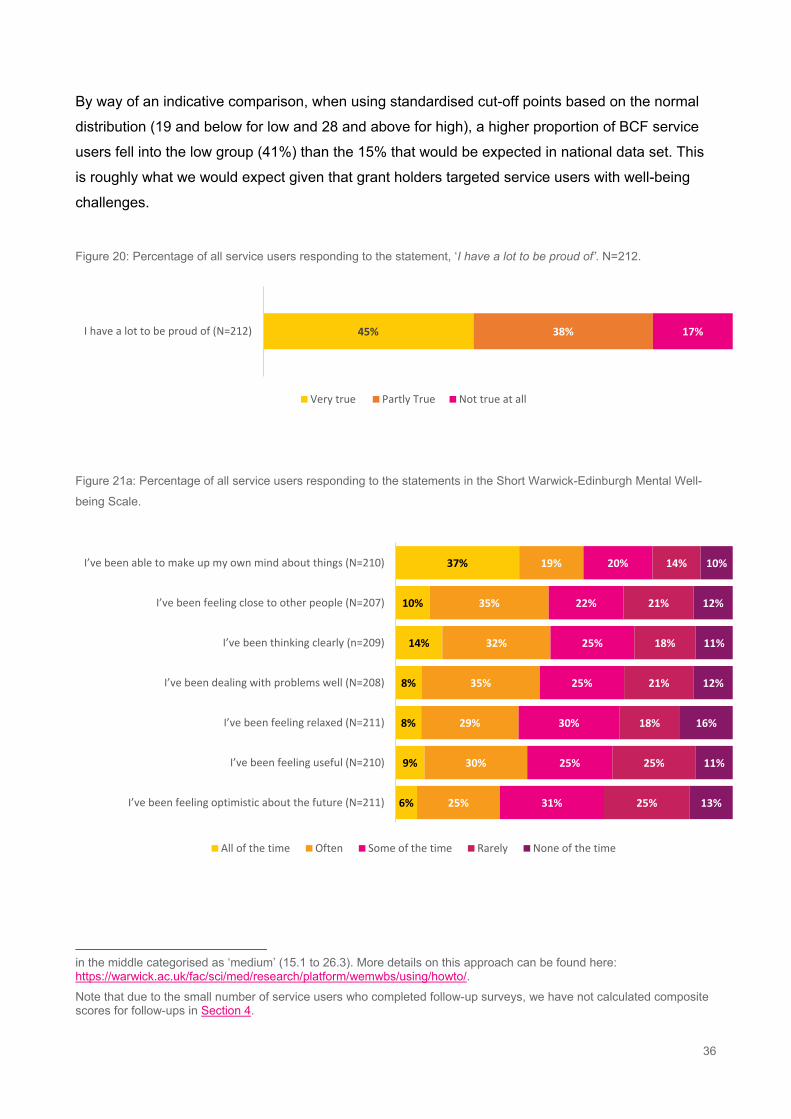
Confidence, resilience and well-being: General findings
Results were mixed for the confidence, resilience and well-being of service users. Although 45%
felt it was ‘very true’ that they had a lot to be proud of (Figure 20), only 10% of service users were
in the ‘high’ group for well-being according to their composite Short Warwick-Edinburgh Mental
Well-being Scale (SWEMWBS) scores (Figure 21b).
Box 3: Short Warwick-Edinburgh Mental Well-being Scale (SWEMWBS)
The Short Warwick-Edinburgh Mental Well-being Scale (SWEMWBS) is a scale of seven
positively worded items, with five response categories, which have been specifically designed
to measure both the feeling and functioning aspects of mental well-being. We have used the
standard approach to creating composite scores from SWEMWBS data. This involves adding
scores, and then converting them into metric scores using this conversion table. Scores are
then grouped according into ‘high’, ‘medium’ and ‘low’ groups (categorical approach).20
20 In our analysis, those less than 1 standard deviation (5.6) from the mean (20.7) were categorised as ‘low’ (15.1 and below), and those more than 1 standard deviation from the mean were categorised as ‘high’ (26.3 and above), with those
51%
56%
31%
34%
17%
10%
Female (n=109)
Male (n=91)
Very true Partly True Not true at all
16%
19%
29%
25%
55%
56%
Female (n=107)
Male (n=91)
Very true Partly True Not true at all
36
By way of an indicative comparison, when using standardised cut-off points based on the normal
distribution (19 and below for low and 28 and above for high), a higher proportion of BCF service
users fell into the low group (41%) than the 15% that would be expected in national data set. This
is roughly what we would expect given that grant holders targeted service users with well-being
challenges.
Figure 20: Percentage of all service users responding to the statement, ‘I have a lot to be proud of’. N=212.
Figure 21a: Percentage of all service users responding to the statements in the Short Warwick-Edinburgh Mental Well-
being Scale.
in the middle categorised as ‘medium’ (15.1 to 26.3). More details on this approach can be found here: https://warwick.ac.uk/fac/sci/med/research/platform/wemwbs/using/howto/. Note that due to the small number of service users who completed follow-up surveys, we have not calculated composite scores for follow-ups in Section 4.
45% 38% 17%I have a lot to be proud of (N=212)
Very true Partly True Not true at all
6%
9%
8%
8%
14%
10%
37%
25%
30%
29%
35%
32%
35%
19%
31%
25%
30%
25%
25%
22%
20%
25%
25%
18%
21%
18%
21%
14%
13%
11%
16%
12%
11%
12%
10%
I’ve been feeling optimistic about the future (N=211)
I’ve been feeling useful (N=210)
I’ve been feeling relaxed (N=211)
I’ve been dealing with problems well (N=208)
I’ve been thinking clearly (n=209)
I’ve been feeling close to other people (N=207)
I’ve been able to make up my own mind about things (N=210)
All of the time Often Some of the time Rarely None of the time
37
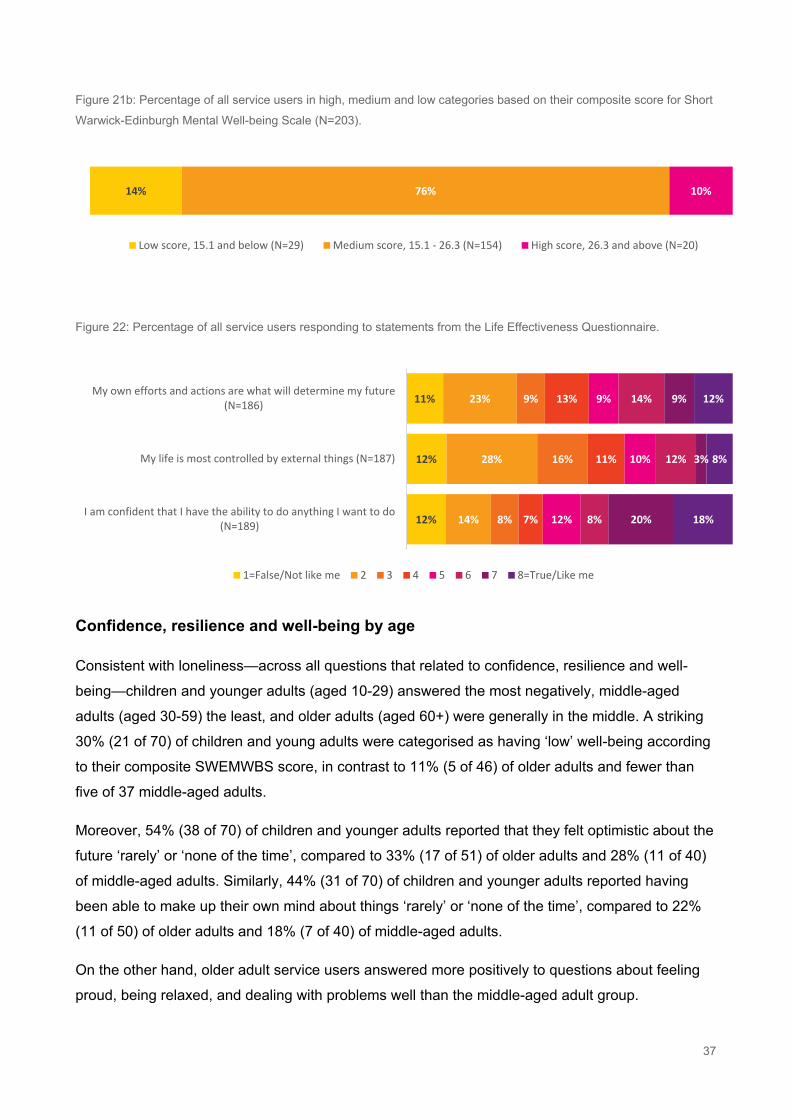
Figure 21b: Percentage of all service users in high, medium and low categories based on their composite score for Short
Warwick-Edinburgh Mental Well-being Scale (N=203).
Figure 22: Percentage of all service users responding to statements from the Life Effectiveness Questionnaire.
Confidence, resilience and well-being by age
Consistent with loneliness—across all questions that related to confidence, resilience and well-
being—children and younger adults (aged 10-29) answered the most negatively, middle-aged
adults (aged 30-59) the least, and older adults (aged 60+) were generally in the middle. A striking
30% (21 of 70) of children and young adults were categorised as having ‘low’ well-being according
to their composite SWEMWBS score, in contrast to 11% (5 of 46) of older adults and fewer than
five of 37 middle-aged adults.
Moreover, 54% (38 of 70) of children and younger adults reported that they felt optimistic about the
future ‘rarely’ or ‘none of the time’, compared to 33% (17 of 51) of older adults and 28% (11 of 40)
of middle-aged adults. Similarly, 44% (31 of 70) of children and younger adults reported having
been able to make up their own mind about things ‘rarely’ or ‘none of the time’, compared to 22%
(11 of 50) of older adults and 18% (7 of 40) of middle-aged adults.
On the other hand, older adult service users answered more positively to questions about feeling
proud, being relaxed, and dealing with problems well than the middle-aged adult group.
14% 76% 10%
Low score, 15.1 and below (N=29) Medium score, 15.1 - 26.3 (N=154) High score, 26.3 and above (N=20)
12%
12%
11%
14%
28%
23%
8%
16%
9%
7%
11%
13%
12%
10%
9%
8%
12%
14%
20%
3%
9%
18%
8%
12%
I am confident that I have the ability to do anything I want to do(N=189)
My life is most controlled by external things (N=187)
My own efforts and actions are what will determine my future(N=186)
1=False/Not like me 2 3 4 5 6 7 8=True/Like me
38
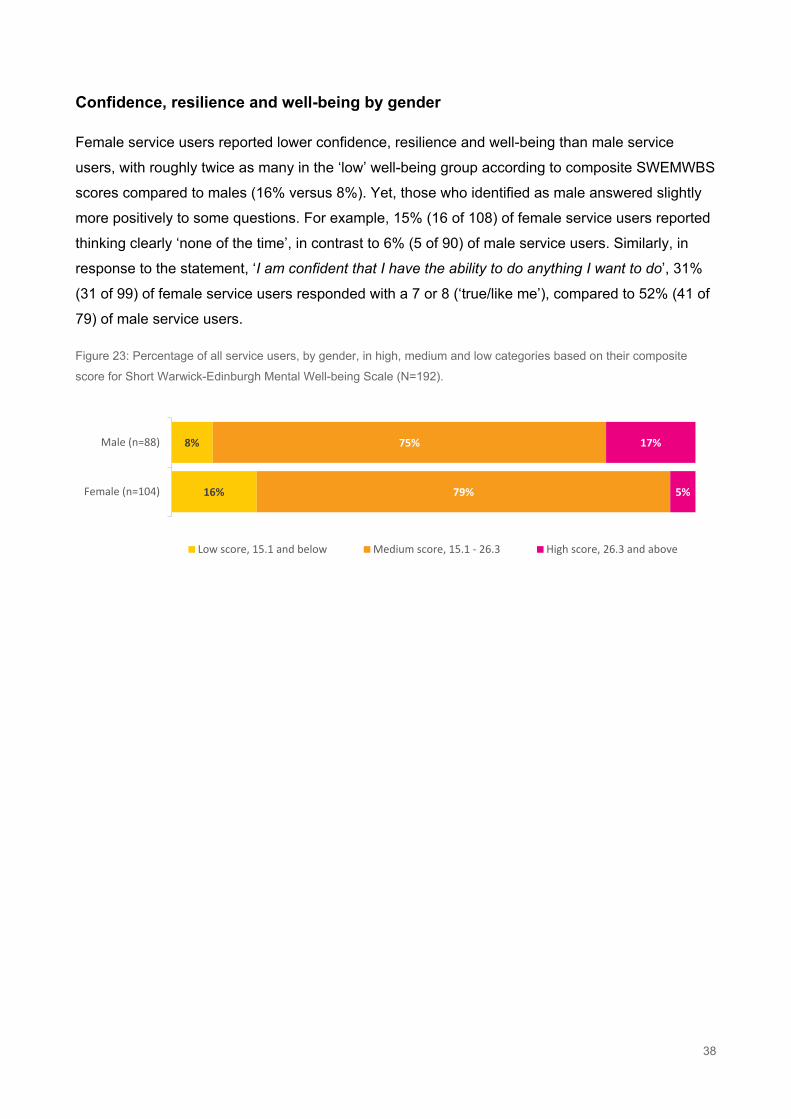
Confidence, resilience and well-being by gender
Female service users reported lower confidence, resilience and well-being than male service
users, with roughly twice as many in the ‘low’ well-being group according to composite SWEMWBS
scores compared to males (16% versus 8%). Yet, those who identified as male answered slightly
more positively to some questions. For example, 15% (16 of 108) of female service users reported
thinking clearly ‘none of the time’, in contrast to 6% (5 of 90) of male service users. Similarly, in
response to the statement, ‘I am confident that I have the ability to do anything I want to do’, 31%
(31 of 99) of female service users responded with a 7 or 8 (‘true/like me’), compared to 52% (41 of
79) of male service users.
Figure 23: Percentage of all service users, by gender, in high, medium and low categories based on their composite
score for Short Warwick-Edinburgh Mental Well-being Scale (N=192).
16%
8%
79%
75%
5%
17%
Female (n=104)
Male (n=88)
Low score, 15.1 and below Medium score, 15.1 - 26.3 High score, 26.3 and above
39
4. Findings: Changes in outcomes, mechanisms of
change, and ‘success factors’
This section outlines our findings, analysis and interpretation on the key evaluation questions. We explore to what extent intended outcomes and mechanisms of change highlighted in the BCF’s theory of change were reached.
4.1 How did outcomes change?
All questions were asked on a numbered scale so we can calculate mean scores. We first
calculated the change that each service user reported for each question between the pre and post
surveys, and then calculated the average or mean change across all service users who responded
to both waves. Different questions had different scales (some questions had three possible
responses, others had five) so we also divided by the number of answer categories for the
question to get a comparable percentage change across questions.
Changes in loneliness
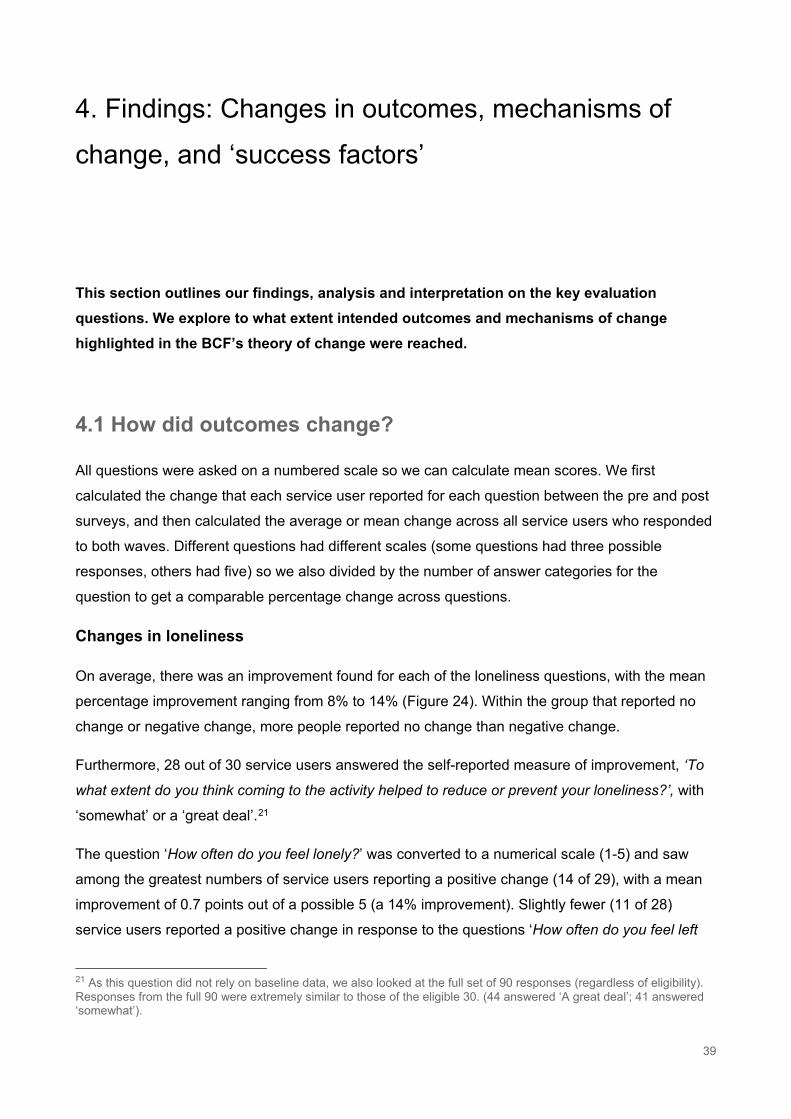
On average, there was an improvement found for each of the loneliness questions, with the mean
percentage improvement ranging from 8% to 14% (Figure 24). Within the group that reported no
change or negative change, more people reported no change than negative change.
Furthermore, 28 out of 30 service users answered the self-reported measure of improvement, ‘To
what extent do you think coming to the activity helped to reduce or prevent your loneliness?’, with
‘somewhat’ or a ‘great deal’.21
The question ‘How often do you feel lonely?’ was converted to a numerical scale (1-5) and saw
among the greatest numbers of service users reporting a positive change (14 of 29), with a mean
improvement of 0.7 points out of a possible 5 (a 14% improvement). Slightly fewer (11 of 28)
service users reported a positive change in response to the questions ‘How often do you feel left
21 As this question did not rely on baseline data, we also looked at the full set of 90 responses (regardless of eligibility). Responses from the full 90 were extremely similar to those of the eligible 30. (44 answered ‘A great deal’; 41 answered ‘somewhat’).
40
out?’ and ‘How often do you feel isolated from others?’. The question with the greatest number of
service users reporting a negative change was ‘How often do you feel that you lack
companionship?’ (n=30), where five service users reported a negative change, compared to ten
who reported a positive change.
Figure 24: Number of service users who reported positive or no / negative change against four loneliness questions and
the mean % change reported.
Changes in positive relationships
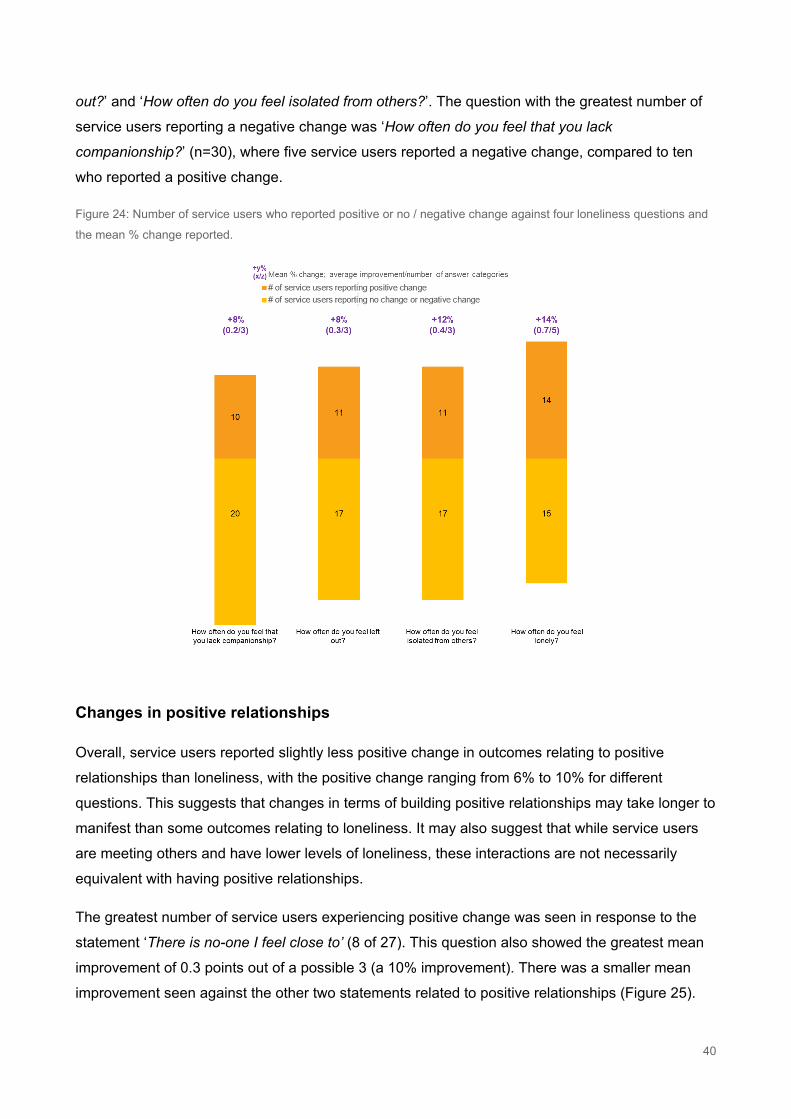
Overall, service users reported slightly less positive change in outcomes relating to positive
relationships than loneliness, with the positive change ranging from 6% to 10% for different
questions. This suggests that changes in terms of building positive relationships may take longer to
manifest than some outcomes relating to loneliness. It may also suggest that while service users
are meeting others and have lower levels of loneliness, these interactions are not necessarily
equivalent with having positive relationships.
The greatest number of service users experiencing positive change was seen in response to the
statement ‘There is no-one I feel close to’ (8 of 27). This question also showed the greatest mean
improvement of 0.3 points out of a possible 3 (a 10% improvement). There was a smaller mean
improvement seen against the other two statements related to positive relationships (Figure 25).
41
Figure 25: Number of service users who reported positive or no / negative change against three positive relationship
questions and the mean % change reported.
Changes in confidence, resilience and well-being
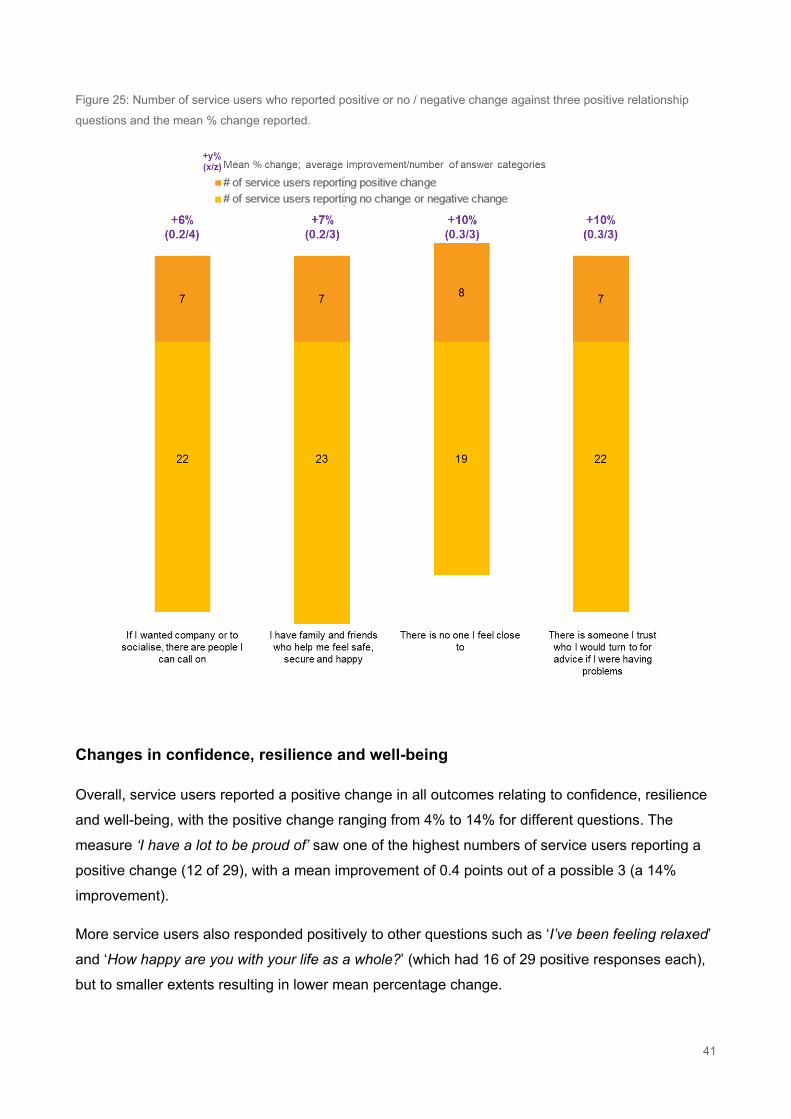
Overall, service users reported a positive change in all outcomes relating to confidence, resilience
and well-being, with the positive change ranging from 4% to 14% for different questions. The
measure ‘I have a lot to be proud of’ saw one of the highest numbers of service users reporting a
positive change (12 of 29), with a mean improvement of 0.4 points out of a possible 3 (a 14%
improvement).
More service users also responded positively to other questions such as ‘I’ve been feeling relaxed’
and ‘How happy are you with your life as a whole?’ (which had 16 of 29 positive responses each),
but to smaller extents resulting in lower mean percentage change.

42
Figure 26: Number of service users who reported positive or no / negative change against nine confidence, resilience
and well-being questions and the mean % change reported.
4.2 Mechanisms of change: How was service users’ experience of the funded activities?
‘As for the home visits with [name], this is an absolutely fantastic addition to each week. He is very
enthusiastic … Always a story, always looks for new topics, I would miss this interaction very much
if any changes were made. He has given some new ideas to try outside of my norm and he goes
out of his way to do anything that assists within his remit.’
Service user
For services to achieve their intended outcomes, the theory of change hypotheses stated that
service users needed to:
43
1. Feel a sense of achievement.
2. Feel safe.
3. Trust staff and volunteers.
4. Enjoy the activities.
5. Feel respected.
6. Receive the support they feel they need.
7. Feel they belong.
8. Feel that change is possible.22
Service users who completed eligible follow-up surveys (30) generally reported positive
experiences of funded activities. 17 (out of 18) service users said they would recommend their
activity to a friend or family member.
Service users feel a sense of achievement
All 16 service users responding to this question reported feeling a sense of achievement through
attending their activities. When asked what they liked about their activities, several service users
commented on feeling a sense of achievement from learning new skills, challenging themselves
and ‘seeing progress.’
Service users feel safe
28 out of 29 service users reported a positive experience in relation to feeling safe while attending
activities: 28 felt safe ‘a great deal’, one felt ‘somewhat’ safe. Some service users commented that
the atmosphere of activities felt peaceful. One service user described the atmosphere at their
activity: ‘no rushing, nice calm place.’
Service users trust staff and volunteers
16 out of 17 service users felt they could trust staff, volunteers, and other participants. The
remaining one out of 17 felt they could trust staff, volunteers, and other participants ‘somewhat’.
22 This list is presented in order of highest mean score to lowest.
44
Service users enjoy the activities
27 out of 30 service users enjoyed the activities ‘a great deal’ (three ‘somewhat’). This was
reflected in the qualitative open text responses in which service users emphasised enjoying
activities; when asked what they liked about their activity, one service user highlighted the variety
of activities, saying they enjoyed ‘the different things to do each week’ and the chance to interact
with new people. When asked what they disliked about the activity sessions, several service users
responded that their only dislike was that the activities did not happen more often: ‘[I’m] just sorry
that it’s not on every week!’
When asked what they disliked about the activities, some service users mentioned travel times or
the timings of sessions as being occasionally tricky.
Service users feel respected
25 out of 29 service users felt respected in activity sessions (the remaining 4 out of 29 felt
‘somewhat’ respected).
Service users receive the support they need
25 out of 29 service users also felt they received the support they needed (four ‘somewhat’), and
appreciated the chance to be among those with a similar experience (‘feeling normal’ and not
judged).
Service users feel they belong
22 service users felt they belonged ‘a great deal’ in activities, with a further seven feeling
‘somewhat’ welcome. One service user also commented that they disliked the tendency of service
users to form exclusive ‘cliques’ in their sessions.
Service users feel that change is possible
While still positive, this area received the fewest positive responses from service users when
compared to the other mechanisms of change. 17 out of 28 service users felt ‘a great deal’
empowered to make a change, with ten service users feeling ‘somewhat’ empowered and one
service user feeling ‘not at all’ empowered.
The open text responses from service users highlighted that the sessions were helpful, ‘it gives me
a sense of purpose and worth,’ and another said they felt proud and it had increased their
confidence, making them ‘more confident to do things.’ One service user explicitly commented on
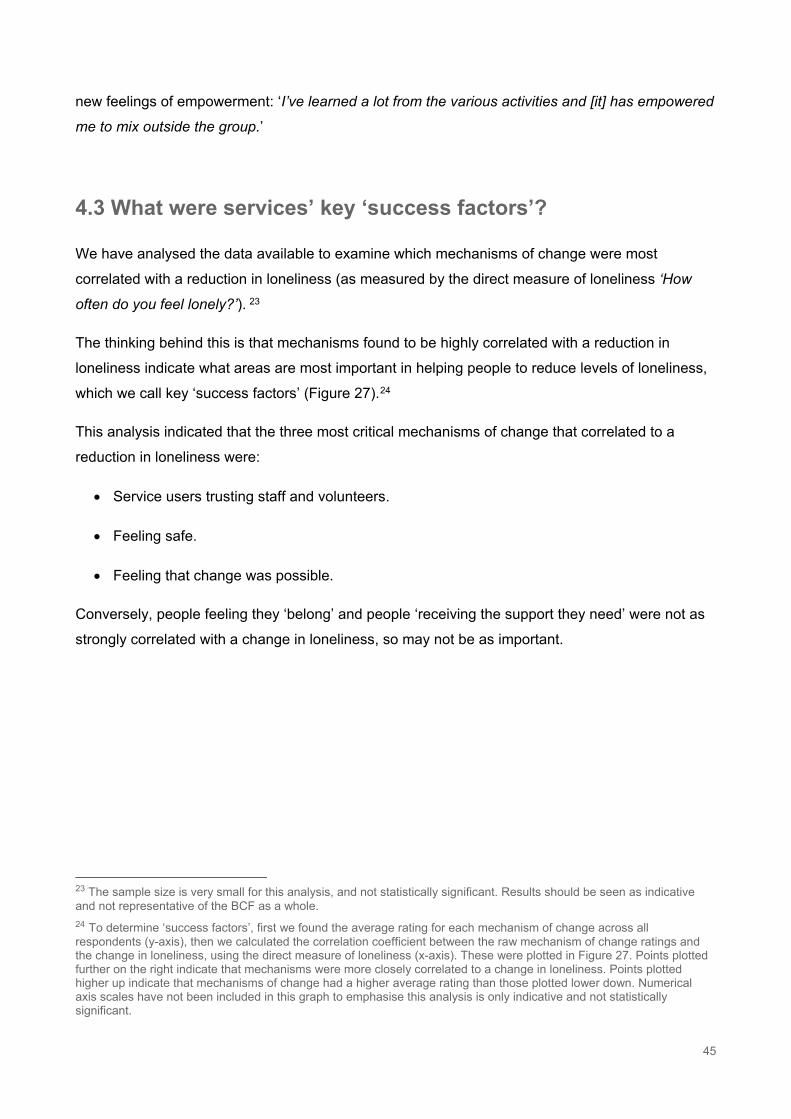
45
new feelings of empowerment: ‘I’ve learned a lot from the various activities and [it] has empowered
me to mix outside the group.’
4.3 What were services’ key ‘success factors’?
We have analysed the data available to examine which mechanisms of change were most
correlated with a reduction in loneliness (as measured by the direct measure of loneliness ‘How
often do you feel lonely?’). 23
The thinking behind this is that mechanisms found to be highly correlated with a reduction in
loneliness indicate what areas are most important in helping people to reduce levels of loneliness,
which we call key ‘success factors’ (Figure 27).24
This analysis indicated that the three most critical mechanisms of change that correlated to a
reduction in loneliness were:
• Service users trusting staff and volunteers.
• Feeling safe.
• Feeling that change was possible.
Conversely, people feeling they ‘belong’ and people ‘receiving the support they need’ were not as
strongly correlated with a change in loneliness, so may not be as important.
23 The sample size is very small for this analysis, and not statistically significant. Results should be seen as indicative and not representative of the BCF as a whole. 24 To determine ‘success factors’, first we found the average rating for each mechanism of change across all respondents (y-axis), then we calculated the correlation coefficient between the raw mechanism of change ratings and the change in loneliness, using the direct measure of loneliness (x-axis). These were plotted in Figure 27. Points plotted further on the right indicate that mechanisms were more closely correlated to a change in loneliness. Points plotted higher up indicate that mechanisms of change had a higher average rating than those plotted lower down. Numerical axis scales have not been included in this graph to emphasise this analysis is only indicative and not statistically significant.
46
Figure 27: Most important mechanisms in determining loneliness. N=30.25
Box 4: Qualitative case study
The grant holder interviewed for this case study worked with people with mental health
difficulties. They received a BCF grant for their woodworking programme. Over 12 weeks,
service users learnt woodworking skills and worked on projects spanning multiple sessions,
such as making bread boards and bird boxes. The grant holder provided minibus transport and
a meal to service users. Each session ended with a group reflection on what had gone well,
what could be done differently, and a chance to celebrate service users’ achievements.
Mechanisms of change
Service users enjoyed the variety of activities on offer and the flexibility of the sessions. They
felt positively challenged both practically and emotionally, gaining a huge sense of achievement
and empowerment from completing projects. They enjoyed learning practical skills from
inspiring tutors. Participants commented that taking home items they had made can spark a
connection with others. The sessions drew service users’ attentions away from their own
anxiety or mental health issues to focus on practical activities. Service users also described
feelings of purpose, usefulness and responsibility, such as when completing a project for the
community or training to become a volunteer.
There was a focus on making participants feel welcomed, accepted, included, and safe; and on
making sure everyone felt supported, cared for, and encouraged. Session ‘ambassadors’ also
25 There are only seven of eight mechanisms because all service users gave the same response to feeling a sense of achievement. There was no valid correlation coefficient.
47
offered to meet potential service users for coffee before sessions so that new service users felt
safe and less anxious about attending.
Outcomes
Many volunteers were former service users from previous programmes, highlighting the role
such programmes can play in improving service users’ confidence and skills, particularly in
relating to and supporting others. Through attending these sessions, service users reported
making new friends both within and outside the sessions; improving their social and
communication skills; and increasing their confidence and self-esteem.
Service users also spoke about gaining new skills and confidence in public speaking, being
more comfortable talking about their experiences, and empathising and spotting signs of
loneliness or mental health difficulties in others as a result of attending sessions.
Service users’ physical health was also improved by attending sessions, for example by
learning how to cook or learning to feel comfortable eating in front of others. However, some
participants did not feel their level of loneliness had substantially changed since engaging with
the programme, suggesting it can take time for service users to experience this change.
48
5. Summary of findings
This section provides a synthesis of the key points covered in this evaluation.
The BCF’s grant holders were relatively evenly spread geographically across England. They targeted a broad mix of service users. Members of the cohort targeted service users in broadly
similar proportions to the whole BCF.
Grant holders intended to deliver a diverse range of activities, mainly in community-based settings. The most popular activity type was face-to-face befriending, mentoring or peer-to-peer
support. Again, members of the cohort were broadly representative of the whole BCF.
There were significantly higher levels of chronic loneliness among service users than the national average, suggesting that grant holders were successful at targeting particularly lonely
people in their communities. Despite many having close family, friends and people they trusted to
turn to for advice, many did not always feel close to others or feel they could call on people to
socialise. This suggests that one type of relationship cannot fulfil all these needs. In terms of
confidence, resilience and well-being, service users were more optimistic about dealing with
present problems but less so about the future.
Levels of loneliness were particularly high among children and younger adult service users. Children and younger adults (aged 10-29) also had the most concerning scores for their
relationships, confidence, resilience and well-being. Scores were also concerning for older adults
(aged 60+). This may be because younger and older age groups are more likely to be going
through significant transitions in life (leaving school, bereavement, etc.), which can make
loneliness worse, undermine positive relationships and harm well-being. However, for some
questions the middle-aged adult group (aged 30-59) answered more negatively than the older adult
age group, so this group should not be overlooked.
Female service users reported higher levels of chronic loneliness and worse well-being than male service users. Female service users reported slightly higher levels of chronic
loneliness than male (20% versus 16%, or 21 of 107 versus 14 of 90), and had more concerning
levels of mental health and well-being than male service users (with 16%, or 17 of 104 falling into
49
Short Warwick-Edinburgh Mental Well-being Scale (SWEMWBS) ‘low’ category compared to 8%,
or 7 of 88 for men).
Despite only having collected one round of follow-up surveys after three months, a large proportion of surveyed service users reported positive change in many of their outcomes.
Every outcomes measure analysed saw a mean positive improvement, ranging from 4% to 14%.
The biggest positive change of any of the outcomes was in the direct measure of loneliness which
saw a mean improvement of 0.69 points (14%). Service users responded overwhelmingly
positively to the self-reported measure of improvement around whether coming to the activity had
reduced or prevented their loneliness. Further research is needed to investigate the extent to which
service users’ loneliness may have worsened without access to grant holder activities.
The biggest mean change was found in loneliness questions and questions relating to confidence, resilience and well-being. Less progress was seen on positive relationships,
suggesting either that changes for these outcome areas are either unlikely to be experienced
within such a short timeframe, and therefore the theory of change needs more time to be borne
out; or that the activities were not successful in bringing these about, and therefore the theory of
change or the service delivery needs to be adjusted.
Surveyed service users generally had a positive experience of funded activities. They noted particularly trusting others and feeling respected whilst at the activities. Their responses
largely appear to support the mechanisms of change that grant holders identified as important (as
presented in the theory of change). Analysis showed that trusting staff and volunteers, feeling change is possible, and feeling safe are three key ‘success factors’ for services working to reduce loneliness, suggesting that organisations might find it helpful to consider these in the
design and delivery of their activities.
50
6. Considerations and recommendations
This section outlines considerations for funding and delivery organisations (Section 6.1) and recommendations for future research (Section 6.2) based on this evaluation. As the data collection was incomplete, the considerations are limited in their scope and represent suggestions based on our analysis.
6.1 Considerations for funding and delivery organisations
• Focus funding and resources to where this evaluation has found need to be greatest. For
example, children and younger adults (aged 10-29), and female service users.
• To mitigate our limitations and ensure inclusivity, future research might focus on where our
sample sizes were too small for analysis, such as ethnic minorities or people identifying as
neither male nor female. This may require supporting organisations to recruit and reach
these populations, which will require a variety of approaches.
• Based on our analysis of ‘success factors’, 26 where relevant or practical, further research
might explore opportunities in service delivery to improve service user experience related to:
o Feeling that change is possible.
o Building trust in staff and volunteers.
o Feeling safe.
6.2 Recommendations for future research
Whilst this evaluation has been able to document the experience of some BCF service users
between September 2019 and March 2020; it was not possible to address the question of ‘what
26 See Section 4.3 on the key ‘success factors’ of the interventions.
51
works well, for whom, and in what context’. We offer the following recommendations for
commissioning and designing future shared measurement evaluations to build this evidence base:
• Commission the learning and evaluation partner in advance of awarding grants and
finalising contracts with grant holders. This would give the learning and evaluation partner
time to develop the necessary support and guidance and put it in place from the outset, and
also to agree what commitment is necessary from grant holders, so as to be clear about what
the costs of participation are. It also mitigates the risk of duplication of monitoring and
evaluation efforts, such as by preventing grant holders from establishing parallel data
collection activities if the shared measurement work does not start until several months into
their project delivery.
• Ring fence dedicated funding for grant holders’ time to plan, collect data and disseminate
information. For example, funders could award each grant holder additional funding
proportionate to the amount of data they collect. Communicating clearly how much time and
resource will be needed from each grant holder, from the beginning, is critical.
• Continue to support grant holders to build their organisational monitoring and evaluation knowledge and experience. Working with grant holders with very varied levels of capacity
and motivation can be resource intensive, and not necessarily efficient or effective.
Moreover, grant holders will find it less resource intensive if they are guided to only collect
what is meaningful to them or to the evaluation and if they are supported to incorporate any
new data requirements into their existing measurement and evaluation processes, rather
than making these additional. This should be considered in the design of future shared
measurement evaluations.
• Include shorter feedback loops and increased reflection in the evaluation for grant
holders to maintain engagement with the evaluation. Motivation for shared measurement
evaluations can wane over time, even for the most dedicated grant holders. We heard from
some grant holders that building the evidence base felt like an abstract goal. The most useful
research works in both the long-term, such as demonstrating change in outcomes and
impacts and therefore value for money, and the short term, such as informing ongoing
delivery and incremental learning.
Finally, there was significant diversity of activities delivered, target groups and settings. This meant
that even without the interruption of the Covid-19 pandemic, the aggregation and sub-group
analysis necessary to build the evidence base would have been challenging; and may not have
yielded strong conclusions. Future funds should consider focusing on a particular target group, or a
particular service or method of delivery, to better build the evidence base.
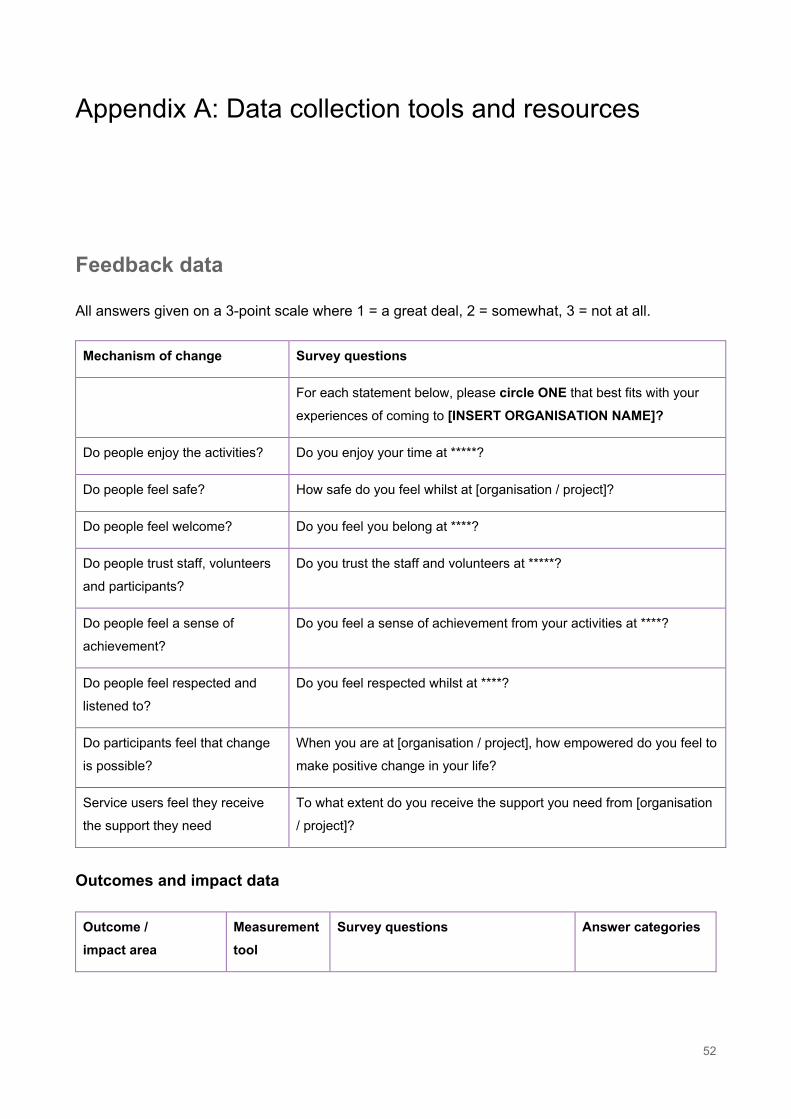
52
Appendix A: Data collection tools and resources
Feedback data
All answers given on a 3-point scale where 1 = a great deal, 2 = somewhat, 3 = not at all.
Mechanism of change Survey questions
For each statement below, please circle ONE that best fits with your
experiences of coming to [INSERT ORGANISATION NAME]?
Do people enjoy the activities? Do you enjoy your time at *****?
Do people feel safe? How safe do you feel whilst at [organisation / project]?
Do people feel welcome? Do you feel you belong at ****?
Do people trust staff, volunteers
and participants? Do you trust the staff and volunteers at *****?
Do people feel a sense of
achievement? Do you feel a sense of achievement from your activities at ****?
Do people feel respected and
listened to? Do you feel respected whilst at ****?
Do participants feel that change
is possible? When you are at [organisation / project], how empowered do you feel to
make positive change in your life?
Service users feel they receive
the support they need
To what extent do you receive the support you need from [organisation
/ project]?
Outcomes and impact data
Outcome / impact area
Measurement tool
Survey questions Answer categories
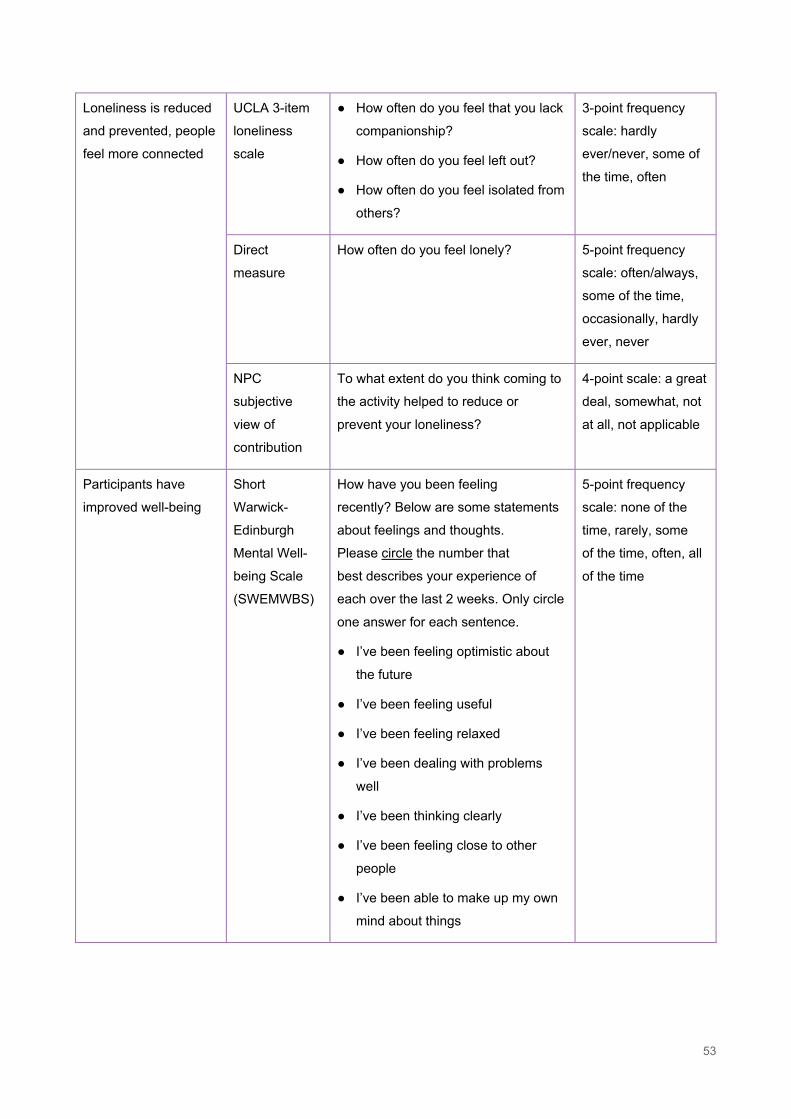
53
Loneliness is reduced
and prevented, people
feel more connected
UCLA 3-item
loneliness
scale
● How often do you feel that you lack
companionship?
● How often do you feel left out?
● How often do you feel isolated from
others?
3-point frequency
scale: hardly
ever/never, some of
the time, often
Direct
measure
How often do you feel lonely? 5-point frequency
scale: often/always,
some of the time,
occasionally, hardly
ever, never
NPC
subjective
view of
contribution
To what extent do you think coming to
the activity helped to reduce or
prevent your loneliness?
4-point scale: a great
deal, somewhat, not
at all, not applicable
Participants have
improved well-being
Short
Warwick-
Edinburgh
Mental Well-
being Scale
(SWEMWBS)
How have you been feeling
recently? Below are some statements
about feelings and thoughts.
Please circle the number that
best describes your experience of
each over the last 2 weeks. Only circle
one answer for each sentence.
● I’ve been feeling optimistic about
the future
● I’ve been feeling useful
● I’ve been feeling relaxed
● I’ve been dealing with problems
well
● I’ve been thinking clearly
● I’ve been feeling close to other
people
● I’ve been able to make up my own
mind about things
5-point frequency
scale: none of the
time, rarely, some
of the time, often, all
of the time
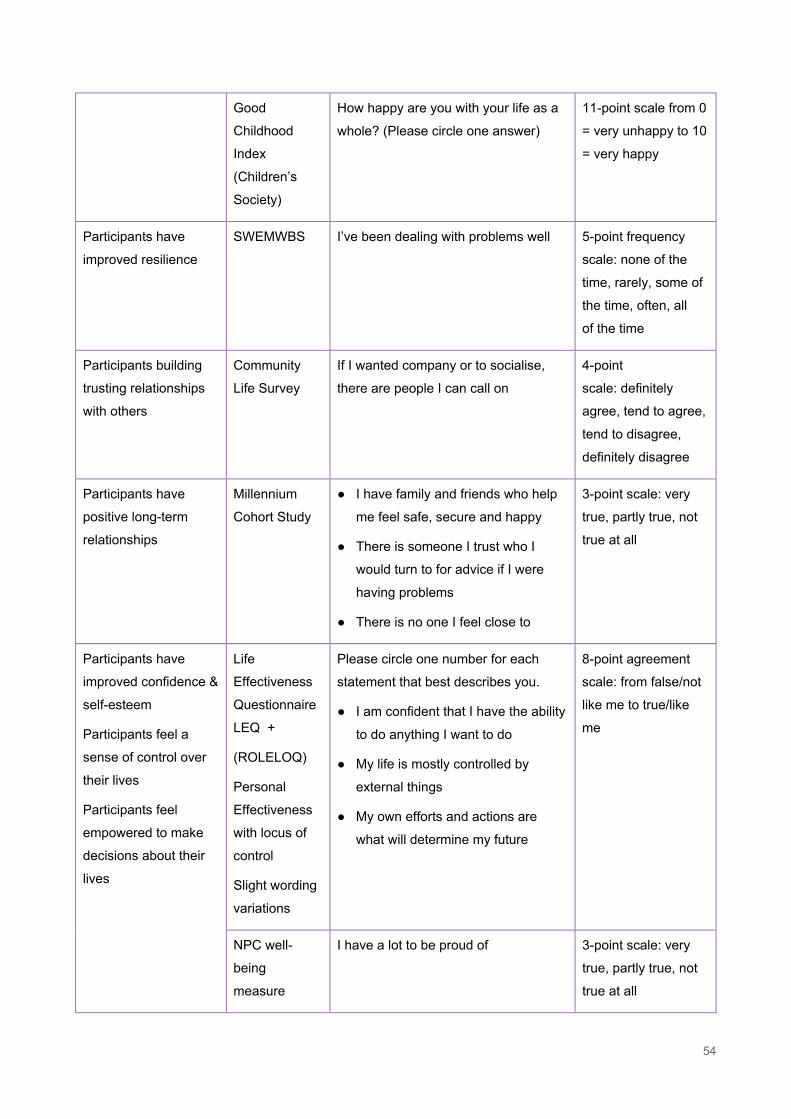
54
Good
Childhood
Index
(Children’s
Society)
How happy are you with your life as a
whole? (Please circle one answer)
11-point scale from 0
= very unhappy to 10
= very happy
Participants have
improved resilience
SWEMWBS
I’ve been dealing with problems well
5-point frequency
scale: none of the
time, rarely, some of
the time, often, all
of the time
Participants building
trusting relationships
with others
Community
Life Survey
If I wanted company or to socialise,
there are people I can call on
4-point
scale: definitely
agree, tend to agree,
tend to disagree,
definitely disagree
Participants have
positive long-term
relationships
Millennium
Cohort Study
● I have family and friends who help
me feel safe, secure and happy
● There is someone I trust who I
would turn to for advice if I were
having problems
● There is no one I feel close to
3-point scale: very
true, partly true, not
true at all
Participants have
improved confidence &
self-esteem
Participants feel a
sense of control over
their lives
Participants feel
empowered to make
decisions about their
lives
Life
Effectiveness
Questionnaire
LEQ +
(ROLELOQ)
Personal
Effectiveness
with locus of
control
Slight wording
variations
Please circle one number for each
statement that best describes you.
● I am confident that I have the ability
to do anything I want to do
● My life is mostly controlled by
external things
● My own efforts and actions are
what will determine my future
8-point agreement
scale: from false/not
like me to true/like
me
NPC well-
being
measure
I have a lot to be proud of 3-point scale: very
true, partly true, not
true at all
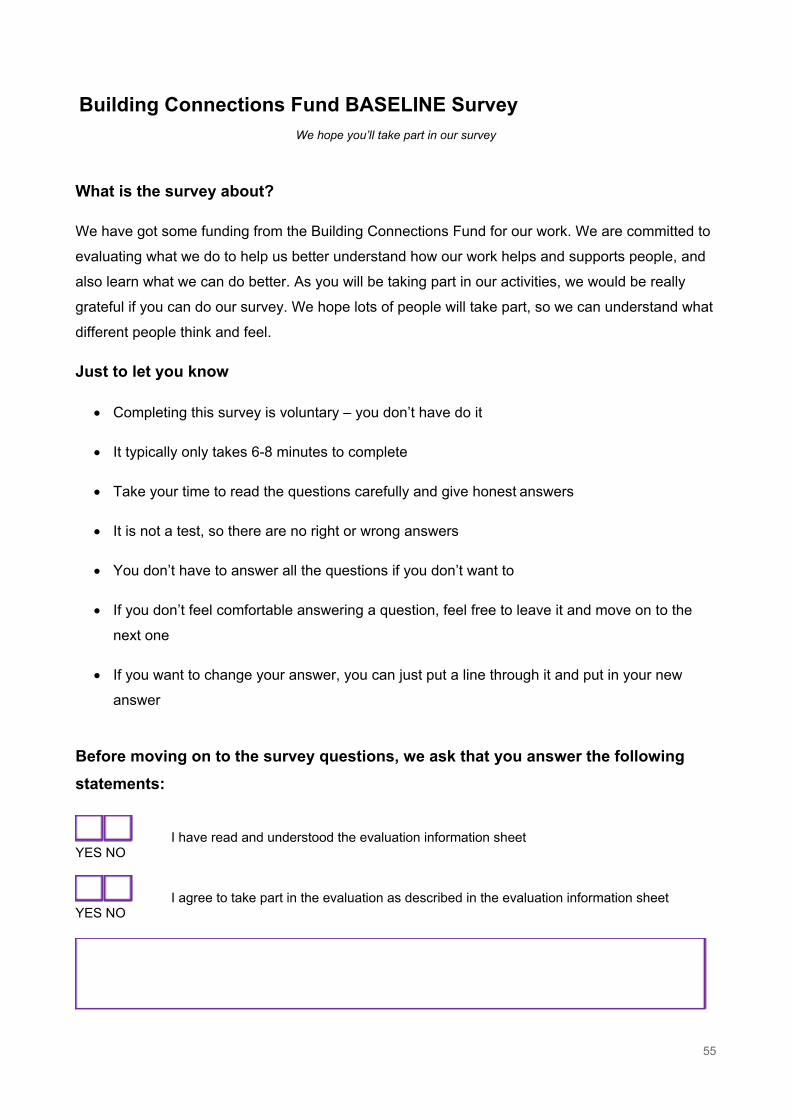
55
Building Connections Fund BASELINE Survey
We hope you’ll take part in our survey What is the survey about?
We have got some funding from the Building Connections Fund for our work. We are committed to
evaluating what we do to help us better understand how our work helps and supports people, and
also learn what we can do better. As you will be taking part in our activities, we would be really
grateful if you can do our survey. We hope lots of people will take part, so we can understand what
different people think and feel.
Just to let you know
• Completing this survey is voluntary – you don’t have do it
• It typically only takes 6-8 minutes to complete
• Take your time to read the questions carefully and give honest answers
• It is not a test, so there are no right or wrong answers
• You don’t have to answer all the questions if you don’t want to
• If you don’t feel comfortable answering a question, feel free to leave it and move on to the
next one
• If you want to change your answer, you can just put a line through it and put in your new
answer
Before moving on to the survey questions, we ask that you answer the following statements:
I have read and understood the evaluation information sheet YES NO
I agree to take part in the evaluation as described in the evaluation information sheet YES NO
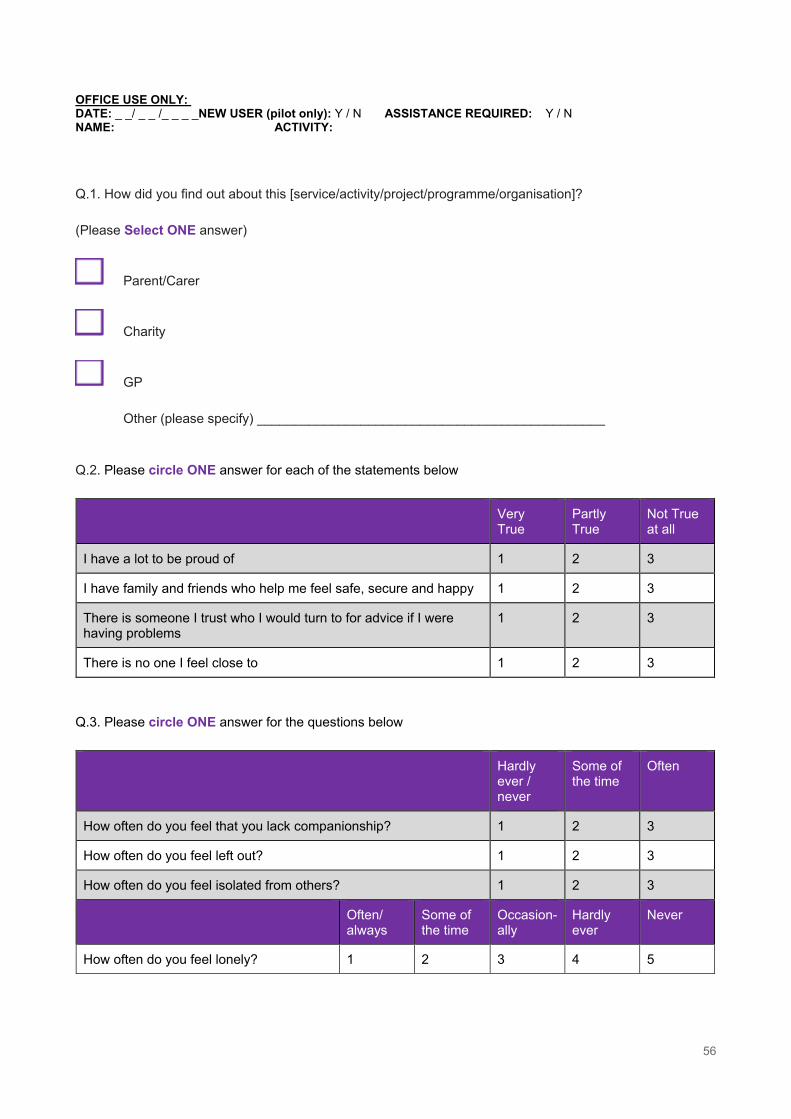
56
OFFICE USE ONLY: DATE: _ _/ _ _ /_ _ _ _NEW USER (pilot only): Y / N ASSISTANCE REQUIRED: Y / N NAME: ACTIVITY: Q.1. How did you find out about this [service/activity/project/programme/organisation]?
(Please Select ONE answer)
Parent/Carer
Charity
GP
Other (please specify) _______________________________________________
Q.2. Please circle ONE answer for each of the statements below
Very True
Partly True
Not True at all
I have a lot to be proud of 1 2 3
I have family and friends who help me feel safe, secure and happy 1 2 3
There is someone I trust who I would turn to for advice if I were having problems
1 2 3
There is no one I feel close to 1 2 3
Q.3. Please circle ONE answer for the questions below
Hardly ever / never
Some of the time
Often
How often do you feel that you lack companionship? 1 2 3
How often do you feel left out? 1 2 3
How often do you feel isolated from others? 1 2 3
Often/ always
Some of the time
Occasion-ally
Hardly ever
Never
How often do you feel lonely? 1 2 3 4 5
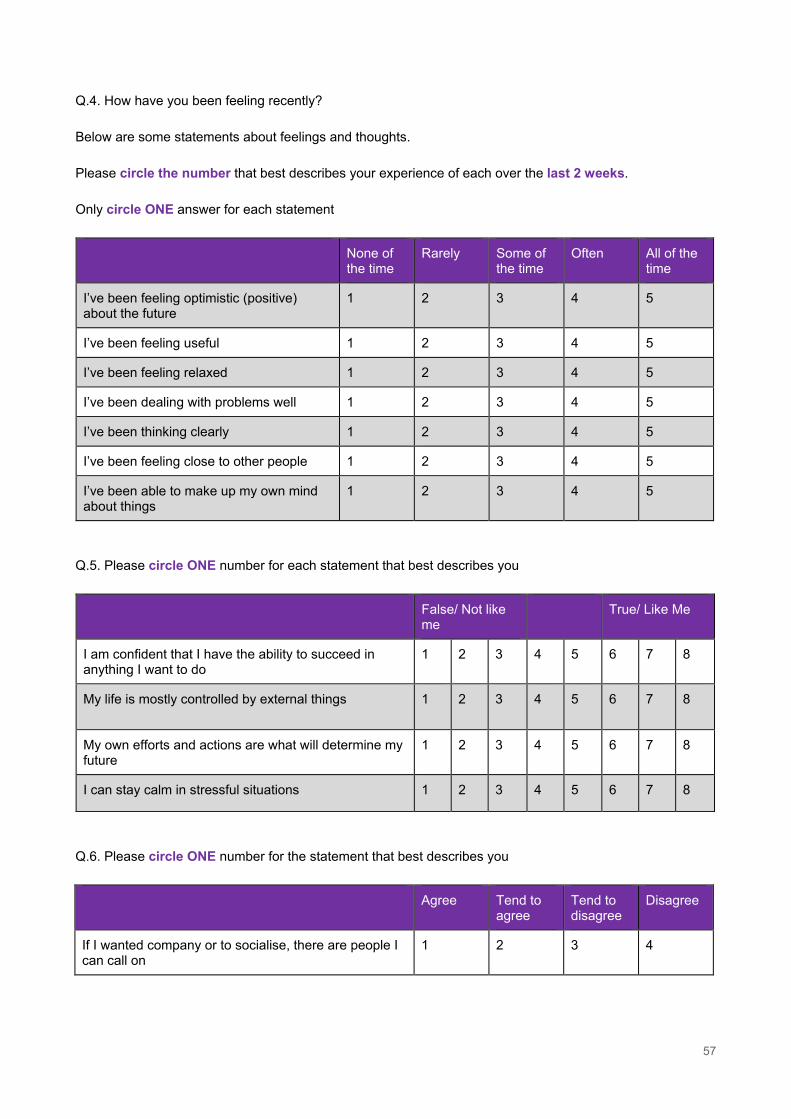
57
Q.4. How have you been feeling recently?
Below are some statements about feelings and thoughts.
Please circle the number that best describes your experience of each over the last 2 weeks.
Only circle ONE answer for each statement
None of the time
Rarely Some of the time
Often All of the time
I’ve been feeling optimistic (positive) about the future
1 2 3 4 5
I’ve been feeling useful 1 2 3 4 5
I’ve been feeling relaxed 1 2 3 4 5
I’ve been dealing with problems well 1 2 3 4 5
I’ve been thinking clearly 1 2 3 4 5
I’ve been feeling close to other people 1 2 3 4 5
I’ve been able to make up my own mind about things
1 2 3 4 5
Q.5. Please circle ONE number for each statement that best describes you
False/ Not like me
True/ Like Me
I am confident that I have the ability to succeed in anything I want to do
1 2 3 4 5 6 7 8
My life is mostly controlled by external things 1 2 3 4 5 6 7 8
My own efforts and actions are what will determine my future
1 2 3 4 5 6 7 8
I can stay calm in stressful situations 1 2 3 4 5 6 7 8
Q.6. Please circle ONE number for the statement that best describes you
Agree Tend to agree
Tend to disagree
Disagree
If I wanted company or to socialise, there are people I can call on
1 2 3 4
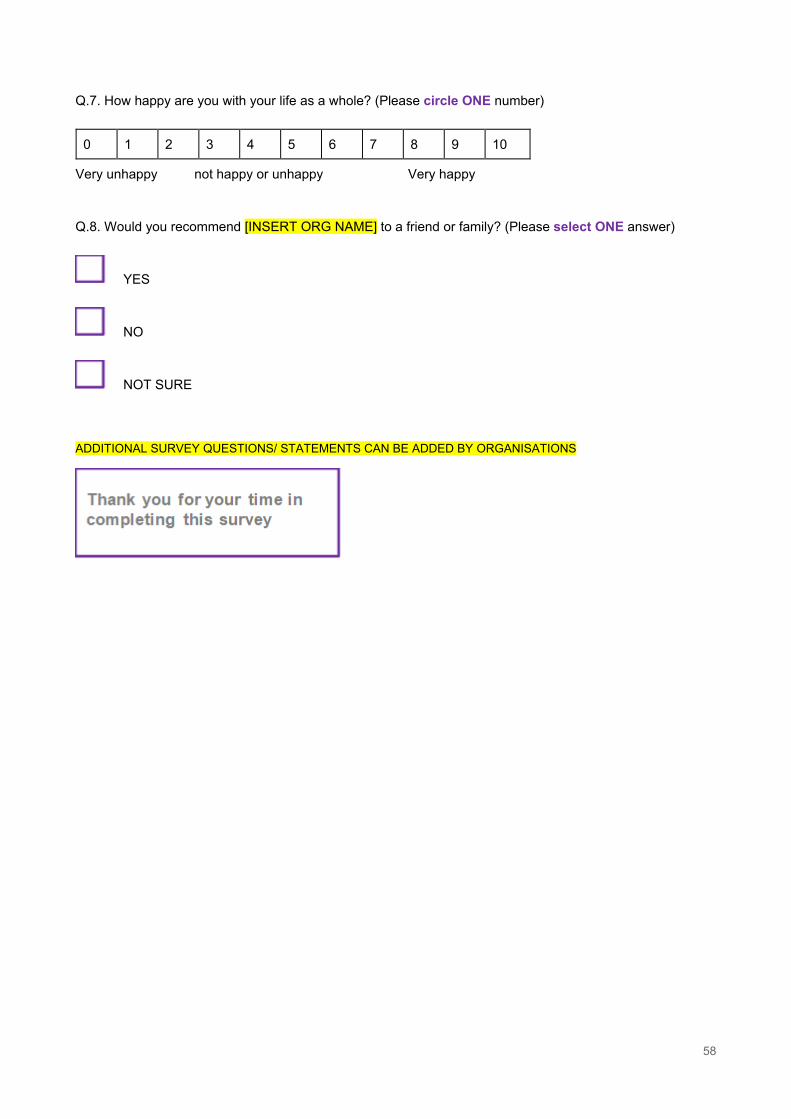
58
Q.7. How happy are you with your life as a whole? (Please circle ONE number)
0 1 2 3 4 5 6 7 8 9 10
Very unhappy not happy or unhappy Very happy Q.8. Would you recommend [INSERT ORG NAME] to a friend or family? (Please select ONE answer)
YES
NO
NOT SURE
ADDITIONAL SURVEY QUESTIONS/ STATEMENTS CAN BE ADDED BY ORGANISATIONS
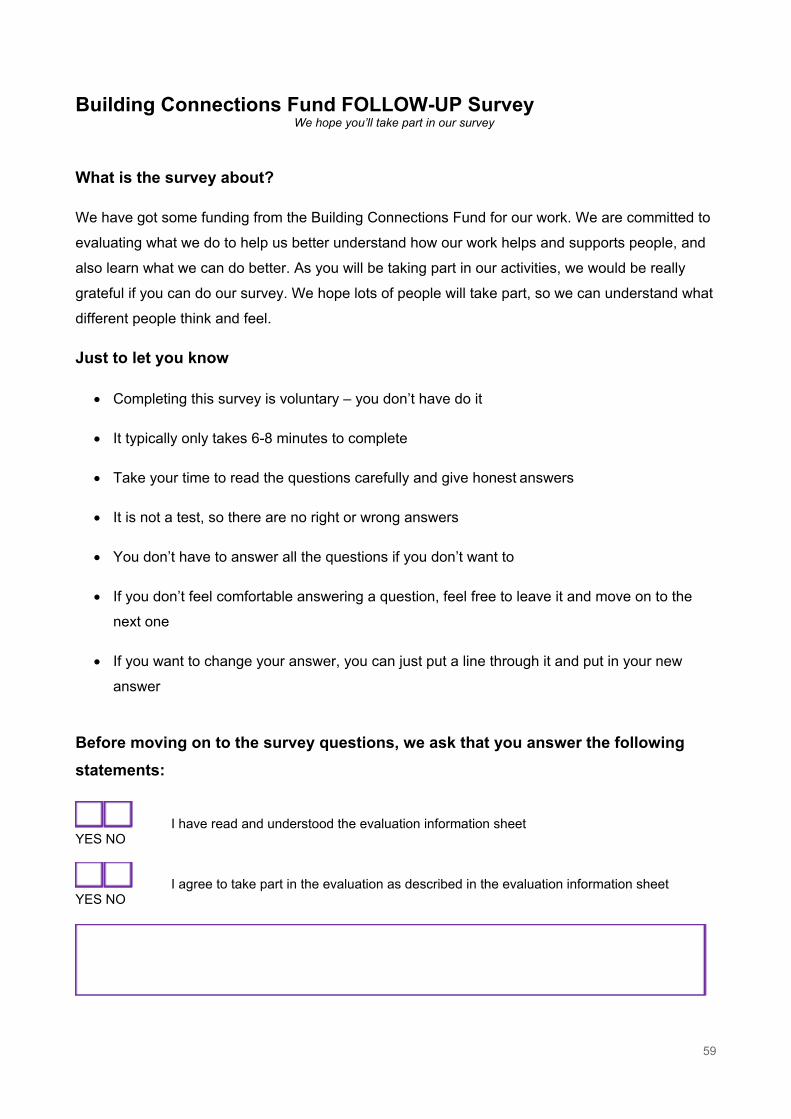
59
Building Connections Fund FOLLOW-UP Survey We hope you’ll take part in our survey
What is the survey about?
We have got some funding from the Building Connections Fund for our work. We are committed to
evaluating what we do to help us better understand how our work helps and supports people, and
also learn what we can do better. As you will be taking part in our activities, we would be really
grateful if you can do our survey. We hope lots of people will take part, so we can understand what
different people think and feel.
Just to let you know
• Completing this survey is voluntary – you don’t have do it
• It typically only takes 6-8 minutes to complete
• Take your time to read the questions carefully and give honest answers
• It is not a test, so there are no right or wrong answers
• You don’t have to answer all the questions if you don’t want to
• If you don’t feel comfortable answering a question, feel free to leave it and move on to the
next one
• If you want to change your answer, you can just put a line through it and put in your new
answer
Before moving on to the survey questions, we ask that you answer the following statements:
I have read and understood the evaluation information sheet YES NO
I agree to take part in the evaluation as described in the evaluation information sheet YES NO
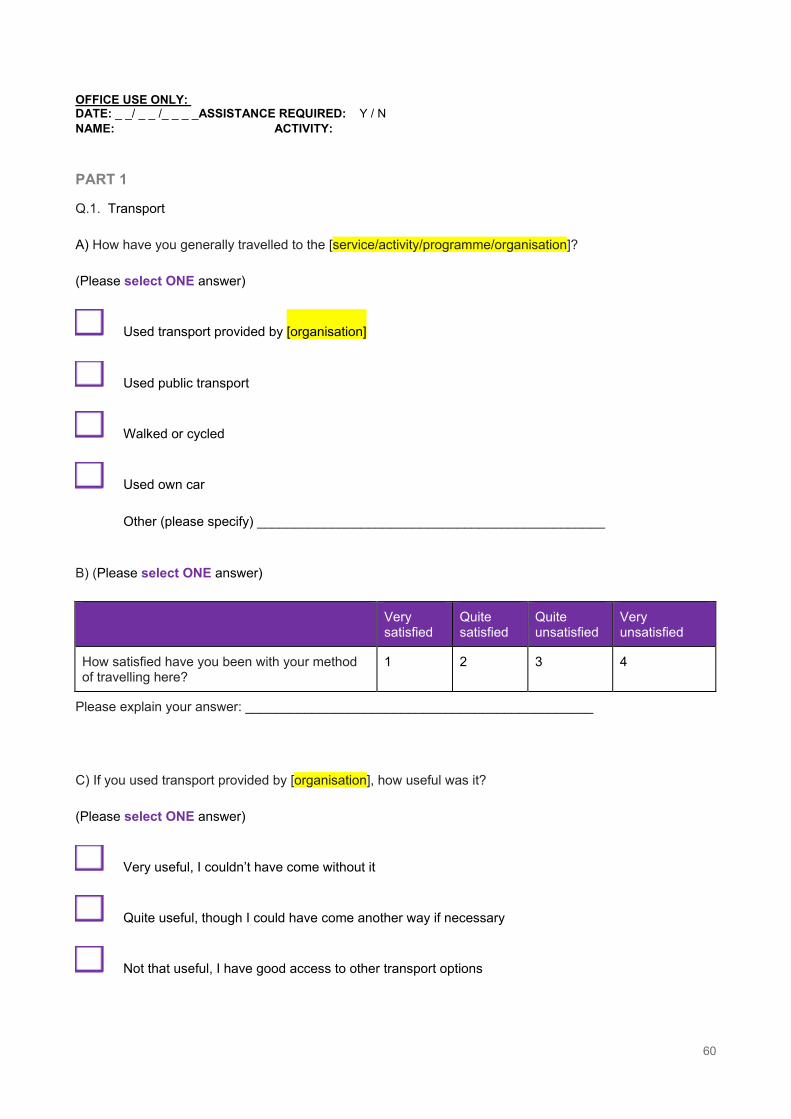
60
OFFICE USE ONLY: DATE: _ _/ _ _ /_ _ _ _ASSISTANCE REQUIRED: Y / N NAME: ACTIVITY: PART 1 Q.1. Transport
A) How have you generally travelled to the [service/activity/programme/organisation]?
(Please select ONE answer)
Used transport provided by [organisation]
Used public transport
Walked or cycled
Used own car
Other (please specify) _______________________________________________
B) (Please select ONE answer)
Very satisfied
Quite satisfied
Quite unsatisfied
Very unsatisfied
How satisfied have you been with your method of travelling here?
1 2 3 4
Please explain your answer: _______________________________________________
C) If you used transport provided by [organisation], how useful was it?
(Please select ONE answer)
Very useful, I couldn’t have come without it
Quite useful, though I could have come another way if necessary
Not that useful, I have good access to other transport options
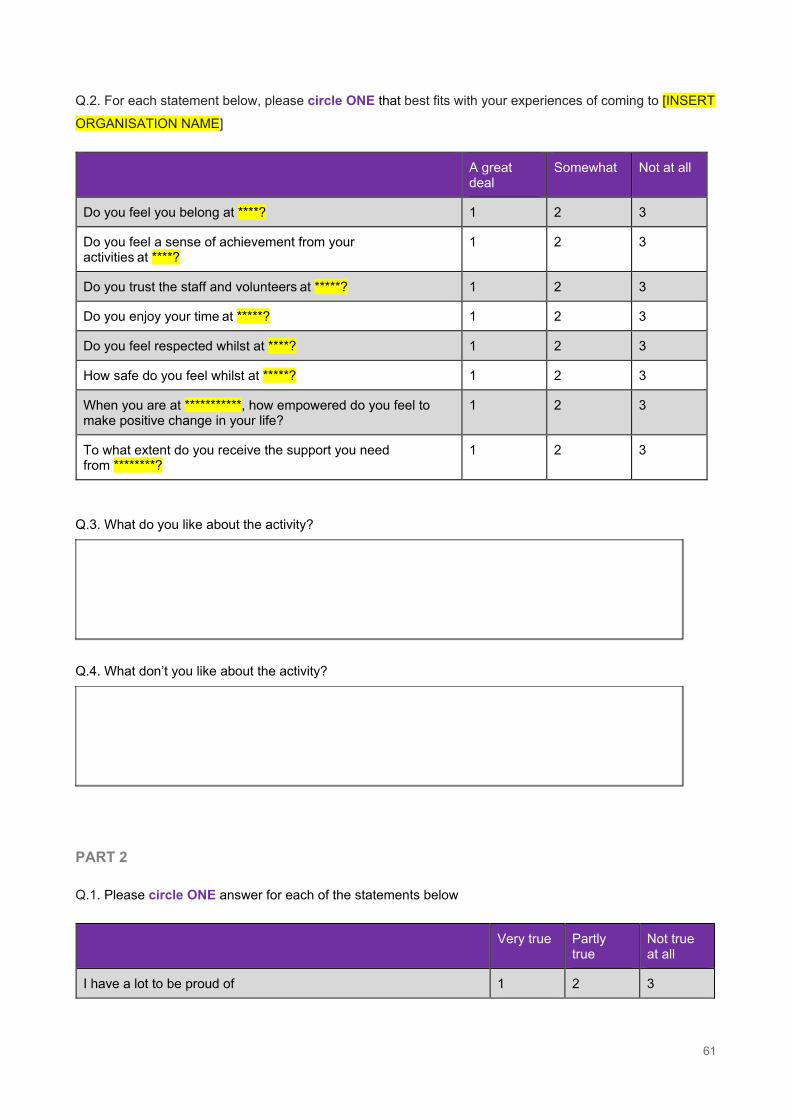
61
Q.2. For each statement below, please circle ONE that best fits with your experiences of coming to [INSERT
ORGANISATION NAME]
A great deal
Somewhat Not at all
Do you feel you belong at ****? 1 2 3
Do you feel a sense of achievement from your activities at ****?
1 2 3
Do you trust the staff and volunteers at *****? 1 2 3
Do you enjoy your time at *****? 1 2 3
Do you feel respected whilst at ****? 1 2 3
How safe do you feel whilst at *****? 1 2 3
When you are at ***********, how empowered do you feel to make positive change in your life?
1 2 3
To what extent do you receive the support you need from ********?
1 2 3
Q.3. What do you like about the activity?
Q.4. What don’t you like about the activity?
PART 2
Q.1. Please circle ONE answer for each of the statements below
Very true Partly true
Not true at all
I have a lot to be proud of 1 2 3
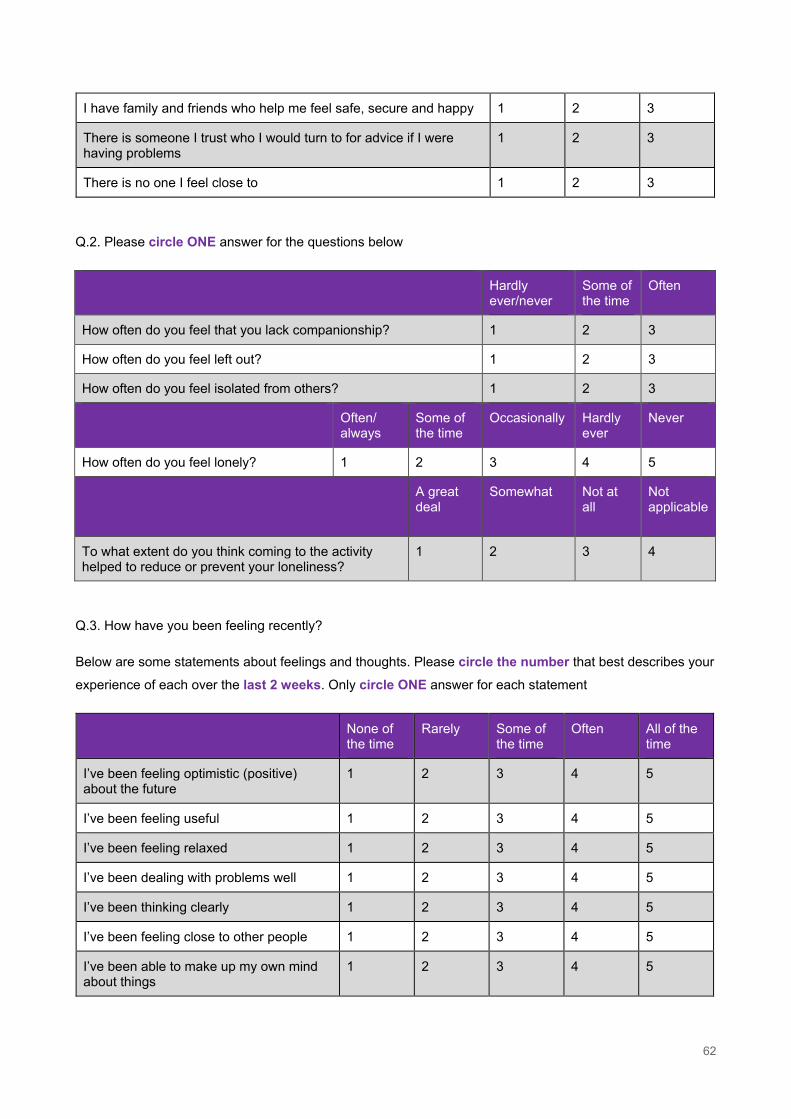
62
I have family and friends who help me feel safe, secure and happy 1 2 3
There is someone I trust who I would turn to for advice if I were having problems
1 2 3
There is no one I feel close to 1 2 3
Q.2. Please circle ONE answer for the questions below
Hardly ever/never
Some of the time
Often
How often do you feel that you lack companionship? 1 2 3
How often do you feel left out? 1 2 3
How often do you feel isolated from others? 1 2 3
Often/ always
Some of the time
Occasionally
Hardly ever
Never
How often do you feel lonely? 1 2 3 4 5
A great deal
Somewhat Not at all
Not applicable
To what extent do you think coming to the activity helped to reduce or prevent your loneliness?
1 2 3 4
Q.3. How have you been feeling recently?
Below are some statements about feelings and thoughts. Please circle the number that best describes your
experience of each over the last 2 weeks. Only circle ONE answer for each statement
None of the time
Rarely Some of the time
Often All of the time
I’ve been feeling optimistic (positive) about the future
1 2 3 4 5
I’ve been feeling useful 1 2 3 4 5
I’ve been feeling relaxed 1 2 3 4 5
I’ve been dealing with problems well 1 2 3 4 5
I’ve been thinking clearly 1 2 3 4 5
I’ve been feeling close to other people 1 2 3 4 5
I’ve been able to make up my own mind about things
1 2 3 4 5
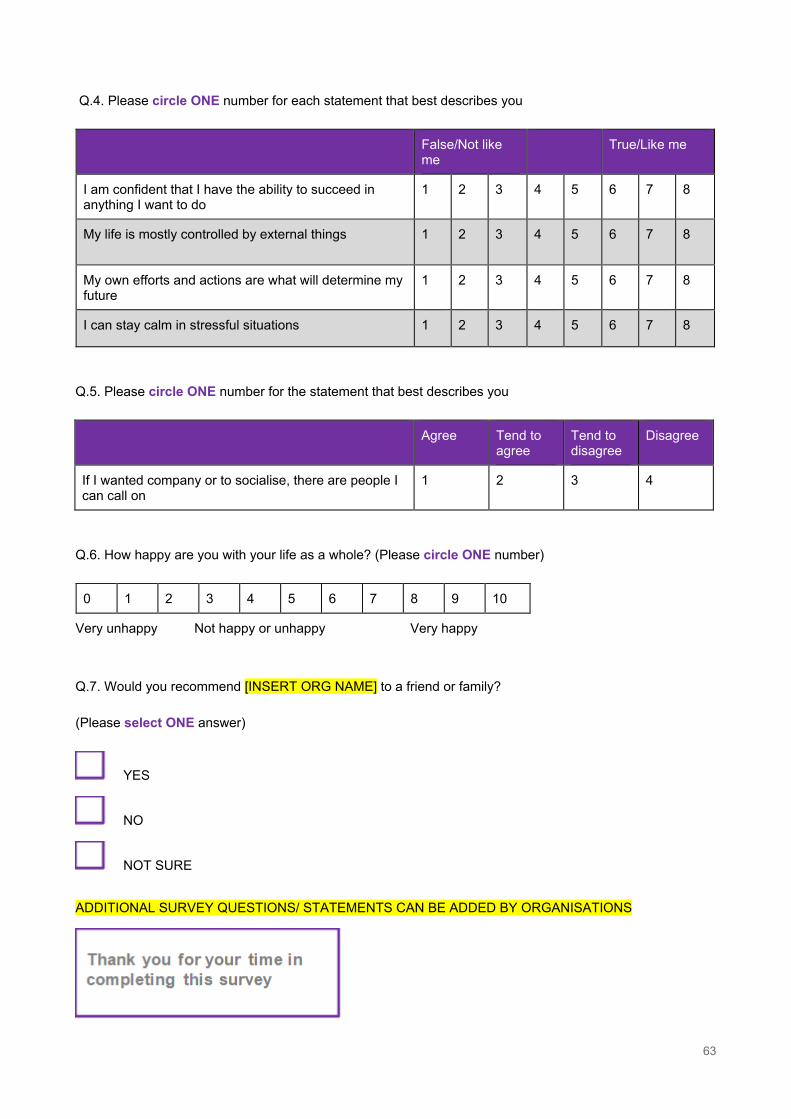
63
Q.4. Please circle ONE number for each statement that best describes you
False/Not like me
True/Like me
I am confident that I have the ability to succeed in anything I want to do
1 2 3 4 5 6 7 8
My life is mostly controlled by external things 1 2 3 4 5 6 7 8
My own efforts and actions are what will determine my future
1 2 3 4 5 6 7 8
I can stay calm in stressful situations 1 2 3 4 5 6 7 8
Q.5. Please circle ONE number for the statement that best describes you
Agree Tend to agree
Tend to disagree
Disagree
If I wanted company or to socialise, there are people I can call on
1 2 3 4
Q.6. How happy are you with your life as a whole? (Please circle ONE number)
0 1 2 3 4 5 6 7 8 9 10
Very unhappy Not happy or unhappy Very happy
Q.7. Would you recommend [INSERT ORG NAME] to a friend or family?
(Please select ONE answer)
YES
NO
NOT SURE
ADDITIONAL SURVEY QUESTIONS/ STATEMENTS CAN BE ADDED BY ORGANISATIONS
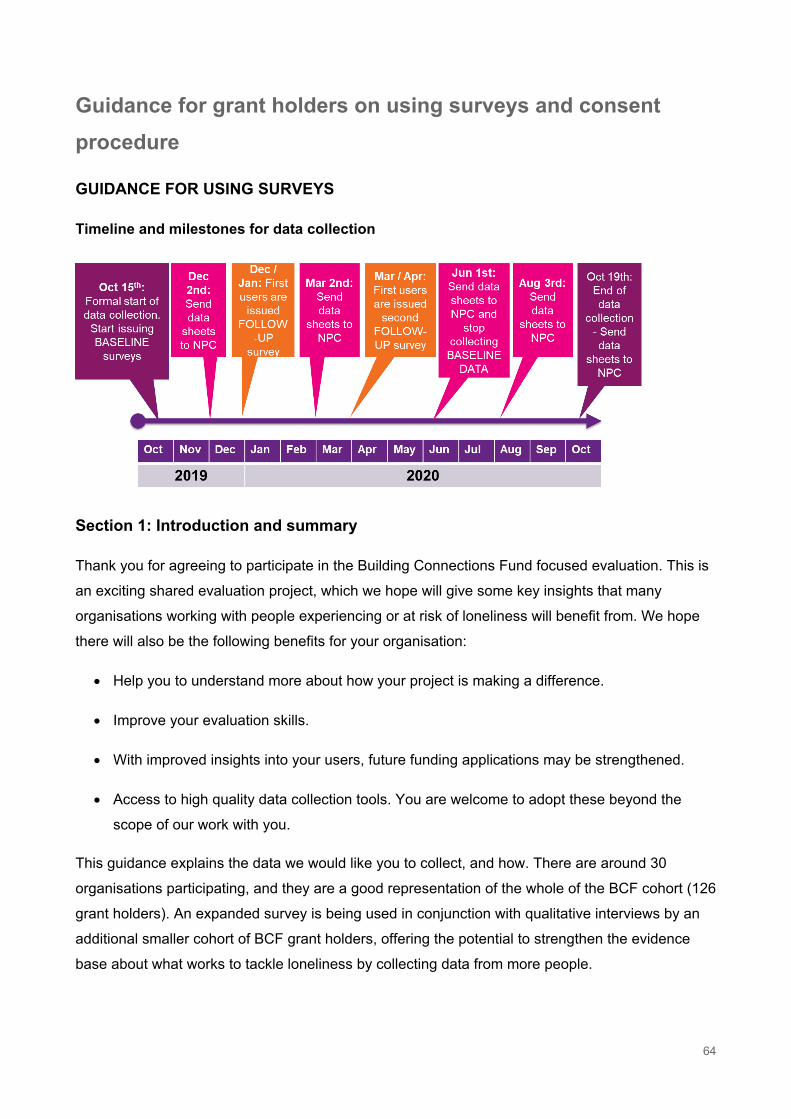
64
Guidance for grant holders on using surveys and consent procedure
GUIDANCE FOR USING SURVEYS
Timeline and milestones for data collection
Section 1: Introduction and summary
Thank you for agreeing to participate in the Building Connections Fund focused evaluation. This is
an exciting shared evaluation project, which we hope will give some key insights that many
organisations working with people experiencing or at risk of loneliness will benefit from. We hope
there will also be the following benefits for your organisation:
• Help you to understand more about how your project is making a difference.
• Improve your evaluation skills.
• With improved insights into your users, future funding applications may be strengthened.
• Access to high quality data collection tools. You are welcome to adopt these beyond the
scope of our work with you.
This guidance explains the data we would like you to collect, and how. There are around 30
organisations participating, and they are a good representation of the whole of the BCF cohort (126
grant holders). An expanded survey is being used in conjunction with qualitative interviews by an
additional smaller cohort of BCF grant holders, offering the potential to strengthen the evidence
base about what works to tackle loneliness by collecting data from more people.
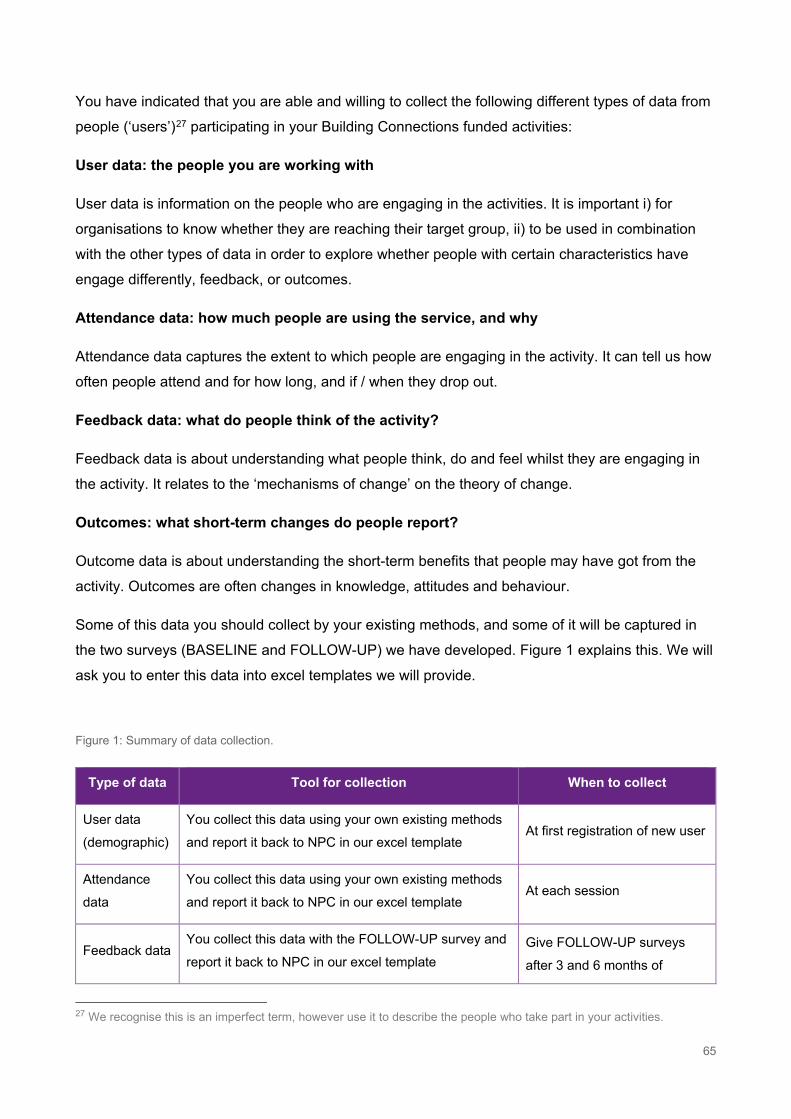
65
You have indicated that you are able and willing to collect the following different types of data from
people (‘users’)27 participating in your Building Connections funded activities:
User data: the people you are working with
User data is information on the people who are engaging in the activities. It is important i) for
organisations to know whether they are reaching their target group, ii) to be used in combination
with the other types of data in order to explore whether people with certain characteristics have
engage differently, feedback, or outcomes.
Attendance data: how much people are using the service, and why
Attendance data captures the extent to which people are engaging in the activity. It can tell us how
often people attend and for how long, and if / when they drop out.
Feedback data: what do people think of the activity?
Feedback data is about understanding what people think, do and feel whilst they are engaging in
the activity. It relates to the ‘mechanisms of change’ on the theory of change.
Outcomes: what short-term changes do people report?
Outcome data is about understanding the short-term benefits that people may have got from the
activity. Outcomes are often changes in knowledge, attitudes and behaviour.
Some of this data you should collect by your existing methods, and some of it will be captured in
the two surveys (BASELINE and FOLLOW-UP) we have developed. Figure 1 explains this. We will
ask you to enter this data into excel templates we will provide.
Figure 1: Summary of data collection.
Type of data Tool for collection When to collect
User data
(demographic)
You collect this data using your own existing methods
and report it back to NPC in our excel template At first registration of new user
Attendance
data
You collect this data using your own existing methods
and report it back to NPC in our excel template At each session
Feedback data You collect this data with the FOLLOW-UP survey and
report it back to NPC in our excel template Give FOLLOW-UP surveys
after 3 and 6 months of
27 We recognise this is an imperfect term, however use it to describe the people who take part in your activities.
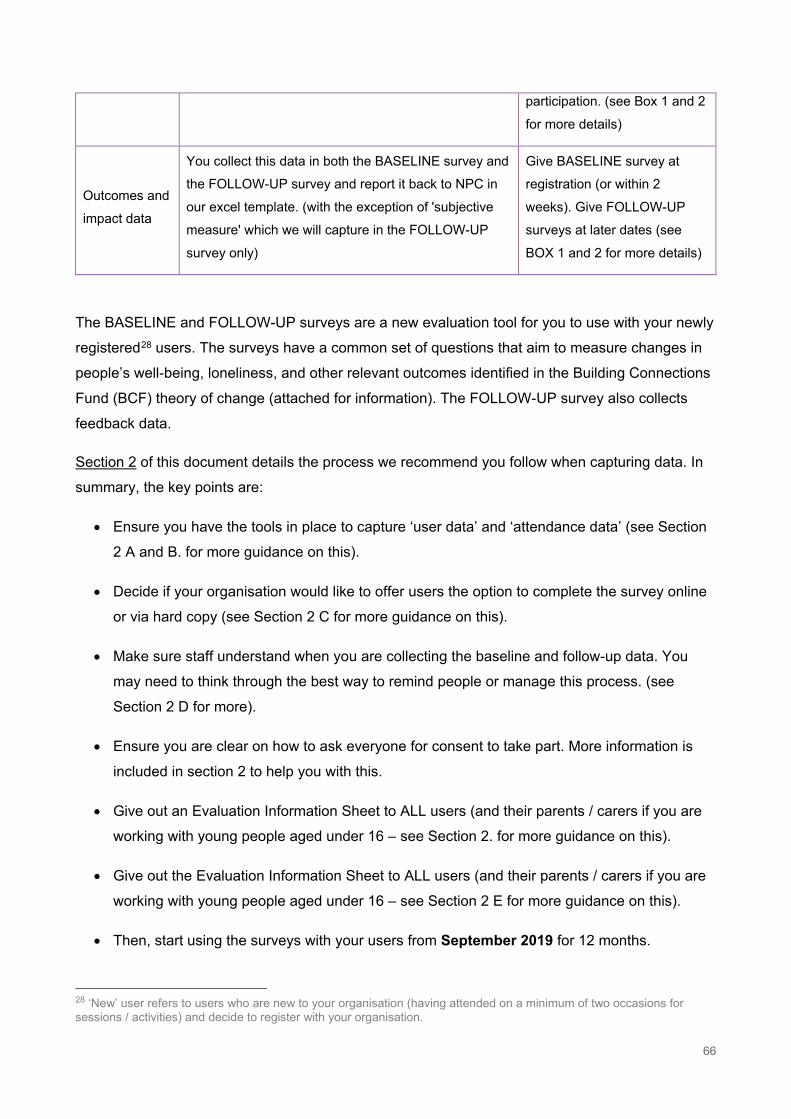
66
participation. (see Box 1 and 2
for more details)
Outcomes and
impact data
You collect this data in both the BASELINE survey and
the FOLLOW-UP survey and report it back to NPC in
our excel template. (with the exception of 'subjective
measure' which we will capture in the FOLLOW-UP
survey only)
Give BASELINE survey at
registration (or within 2
weeks). Give FOLLOW-UP
surveys at later dates (see
BOX 1 and 2 for more details)
The BASELINE and FOLLOW-UP surveys are a new evaluation tool for you to use with your newly
registered28 users. The surveys have a common set of questions that aim to measure changes in
people’s well-being, loneliness, and other relevant outcomes identified in the Building Connections
Fund (BCF) theory of change (attached for information). The FOLLOW-UP survey also collects
feedback data.
Section 2 of this document details the process we recommend you follow when capturing data. In
summary, the key points are:
• Ensure you have the tools in place to capture ‘user data’ and ‘attendance data’ (see Section
2 A and B. for more guidance on this).
• Decide if your organisation would like to offer users the option to complete the survey online
or via hard copy (see Section 2 C for more guidance on this).
• Make sure staff understand when you are collecting the baseline and follow-up data. You
may need to think through the best way to remind people or manage this process. (see
Section 2 D for more).
• Ensure you are clear on how to ask everyone for consent to take part. More information is
included in section 2 to help you with this.
• Give out an Evaluation Information Sheet to ALL users (and their parents / carers if you are
working with young people aged under 16 – see Section 2. for more guidance on this).
• Give out the Evaluation Information Sheet to ALL users (and their parents / carers if you are
working with young people aged under 16 – see Section 2 E for more guidance on this).
• Then, start using the surveys with your users from September 2019 for 12 months.
28 ‘New’ user refers to users who are new to your organisation (having attended on a minimum of two occasions for sessions / activities) and decide to register with your organisation.
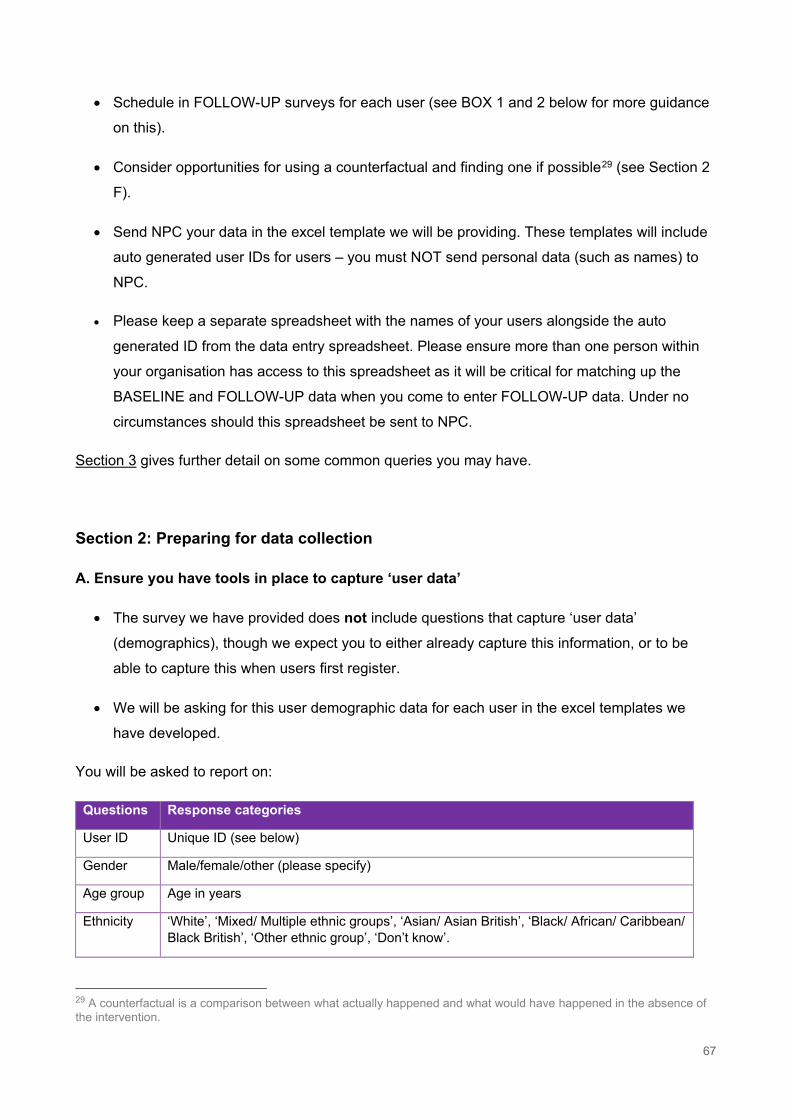
67
• Schedule in FOLLOW-UP surveys for each user (see BOX 1 and 2 below for more guidance
on this).
• Consider opportunities for using a counterfactual and finding one if possible29 (see Section 2
F).
• Send NPC your data in the excel template we will be providing. These templates will include
auto generated user IDs for users – you must NOT send personal data (such as names) to
NPC.
• Please keep a separate spreadsheet with the names of your users alongside the auto
generated ID from the data entry spreadsheet. Please ensure more than one person within
your organisation has access to this spreadsheet as it will be critical for matching up the
BASELINE and FOLLOW-UP data when you come to enter FOLLOW-UP data. Under no
circumstances should this spreadsheet be sent to NPC.
Section 3 gives further detail on some common queries you may have.
Section 2: Preparing for data collection
A. Ensure you have tools in place to capture ‘user data’
• The survey we have provided does not include questions that capture ‘user data’
(demographics), though we expect you to either already capture this information, or to be
able to capture this when users first register.
• We will be asking for this user demographic data for each user in the excel templates we
have developed.
You will be asked to report on:
Questions Response categories
User ID Unique ID (see below)
Gender Male/female/other (please specify)
Age group Age in years
Ethnicity ‘White’, ‘Mixed/ Multiple ethnic groups’, ‘Asian/ Asian British’, ‘Black/ African/ Caribbean/ Black British’, ‘Other ethnic group’, ‘Don’t know’.
29 A counterfactual is a comparison between what actually happened and what would have happened in the absence of the intervention.
68
The excel templates we will be providing will auto generate user IDs based on the initials of your
organisations, the date of the user’s first registration and a sequential number. These user IDs are
critical for keeping users anonymous as well as allowing us to track them longitudinally from the
BASELINE survey to the FOLLOW-UP survey.
B. Ensure you have tools in place to capture ‘attendance data’
• The surveys we have provided do not include questions that capture ‘attendance data’,
though we expect organisations either already capture this information, or we ask that you
start doing so, e.g. via a register.
• We will be asking for this data for each user in the excel templates we will be distributing.
• You will be asked to report on:
1. How many sessions could this person have possibly attended within the collection period?
(the maximum run) (if a user can and does attend multiple activities, please input the
maximum number of sessions that they could have reasonably attended – i.e. a user is
unlikely to attend every session in a busy community centre).
2. How many sessions did this person attend within the collection period?
• Please note that if you run multiple activities and some users engage with multiple, these
should be added to their attendance.
C. Choose whether to give the surveys out in hard copy form or upload them onto an online survey platform and do appropriate preparation
PREPARATION FOR HARD COPY SURVEYS:
Before administering the evaluation surveys with your users, you will need to:
• Customise the survey with your organisation’s name, branding and anything we have
highlighted, and print off copies of the survey.
• Print off copies of an evaluation information sheet.30
30 The evaluation information sheet will be an example of what could be used as a privacy notice to give to users.
69
• Decide WHO will ensure the hard copies are filed securely at your organisation.
• Complete the admin section of the survey, specifying the date; the activity the user is
attending; their name (this is not given to NPC); and whether assistance was given to the
user.
• Please keep a separate spreadsheet with the names of your users alongside the auto
generated ID from the data entry spreadsheet. Please ensure more than one person within
your organisation has access to this spreadsheet as it will be critical for matching up the
BASELINE and FOLLOW-UP data when you come to enter FOLLOW-UP data. Under no
circumstances should this spreadsheet be sent to NPC.
• When giving a user a copy of the survey, ask them to first read the evaluation information
sheet and the introduction and instructions as outlined at the top of the survey. Unless they
tick to say they have read the information sheet, we cannot use their data.
• Ensure they have any appropriate support to help them understand the information sheet
and survey (e.g. talk them through it if they have difficulty reading). Further guidance is given
below.
PREPARATION FOR ONLINE SURVEYS:
• You can upload the questionnaire online to survey software (NPC likes SmartSurvey. Other
options include Survey Monkey and Google Forms).
• Customise the survey with your organisation’s name, branding, and anything we have
highlighted.
• As we will not be accessing online surveys, these can ask users to give their name. When
you input data into our excel templates, please do not include the name but instead use our
automatic user ID number generator. Users are not consenting to you sharing their name
with us so we cannot see any names.
• Please keep a separate spreadsheet with the names of your users alongside the auto
generated ID from the data entry spreadsheet. Please ensure more than one person within
your organisation has access to this spreadsheet as it will be critical for matching up the
BASELINE and FOLLOW-UP data when you come to enter FOLLOW-UP data. Under no
circumstances should this spreadsheet be sent to NPC.
70
PROCESS FOR ALL SURVEYS:
• Only give the survey to new people attending your BCF funded activity or activities.
• Give out the survey to users at specific time points (see BOX 1 and 2), keeping track of who
needs to do the survey when. You might need to set up reminders or a table / spreadsheet of
when to do things.
• Remind people that participation is totally voluntary, and that there are no negative
consequences if they choose not to take part. If they do want to take part, we ask that they
signal their confirmation by ticking the boxes on the first page of the survey. The evaluation
information sheet gives further information.
• Staff / volunteers should offer support to those who struggle to read or understand the survey
questions by reading aloud and repeating the question and response options, where
appropriate. Please DO NOT rephrase questions. If the question is still not properly
understood by the person then suggest to the person they leave the question response
unanswered. Please indicate in the admin section of the survey whether assistance has been
given or not.
• Staff / volunteers should not influence how a person responds, otherwise the response is
invalid.
• Whether hard copy or online, please input survey responses into the excel template. You
should decide WHO will do the data input on the excel template we will provide. Once you
have entered the data in the spreadsheet and sent it to us, the hard copy surveys will either
need to be securely stored or securely destroyed and it is your responsibility to determine the
process for this.31 Your organisation’s data protection policy should specify the process you
should follow.
• Send the completed excel template to us via a secure server, as a password protected
attachment to the email address we will provide at a later date. Send us the password in a
separate email.
• Provide feedback to NPC about the process—and let us know if anything is not working.
31 Refer to GDPR guidance and your organisation’s data protection policy.
71
D. Ensure staff know WHEN to administer surveys and agree process with staff for administering BASELINE and FOLLOW-UP surveys with ‘new’ registered users
This will depend on the type of activity you are doing, i.e. whether it is open access where users
drop in, or whether it is more of a fixed term course. The boxes below give guidance for the most
common structures of interventions in the fund. Your intervention may not completely match these
examples, but try and apply these guidelines to your project as best you can. If you are still
unclear, please contact us.
BOX 1 and 2: When to issue surveys.
BOX 1: SURVEYS TO BE GIVEN TO USERS OF OPEN ACCESS ACTIVITIES
(For NEW users) you will ideally be asking them to complete the survey 3 times:
Baseline survey: First at time of registration or attend first session (or within 2 weeks of first
attending).
Follow-up survey 1: 3 months after first registered with your organisation or activity (whether or
not the user is still attending).
Follow-up survey 2: 6 months after first registered with your organisation or activity.
BOX 2: SURVEYS TO BE GIVEN TO USERS OF FIXED TERM (e.g. 10 week) COURSES
(For NEW users of fixed term courses) you will ideally be asking them to complete the survey 3
times:
Baseline survey: First at time of registration or attend first session (or within 2 weeks of first
attending).
Follow-up survey 1: In the last 2 weeks of the course.
Follow-up survey 2: 3 months after course finished collect follow-up data.
72
Please try and collect follow-up data from all new users, even if they are no longer coming along
3/6 months after they first attended. We’re keen to reach as many users as possible, including
those who have stopped attending.
You should introduce a date flagging system for staff (e.g. calendar reminder) for when each of
these users should receive their follow-up surveys.
E. Ensure all new users (and their parents / carers if they are young people aged under 16) have received a copy of the evaluation information sheet, and that you have obtained consent from parents or carers of young people aged under 16 to take part in the evaluation
• To carry out research you need to ask people if they are happy to take part.
• To carry out research with children and young people aged under 16 you need to ask their
parents or carers if they are happy for their child to take part, before approaching young
people.
• You should give everyone involved (adult users, young people users and their parents /
carers) information on the evaluation to help them decide whether to participate. We have
provided an ‘evaluation information sheet’ as a template which we would encourage you
check, it covers everything you need it to, make any necessary changes and then ensure
everyone has a copy.
• If you are aware of safeguarding issues a specific child or family is facing, you may decide it
is not appropriate for them to be involved in the research at all.
F. Consider whether you have an opportunity to use a counterfactual.
A counterfactual is an estimate of what would have happened in the absence of your intervention,
project or organisation.
Collecting counterfactual data is not required from this evaluation, and we don’t expect this to be
relevant to many organisations. However, if you feel there is an opportunity to do so, please let us
know as soon as possible and we can discuss further with you whether or not this is appropriate.
Please do not collect or send us any counterfactual data without speaking to us first.
73
Further basic guidance on what is involved in collecting counterfactual data is given in the box
below. If after reading it you are interested in pursuing this, please contact us to discuss in detail
what is involved and whether this is feasible.
Counterfactual approaches
A strong counterfactual approach compares the outcomes of people who participate in a
programme or service (the intervention group) with similar people who do not (a control or
comparison group). Depending on how the control or comparison group is selected, statistics
allow researchers or analysts to estimate the likelihood that the programme or service caused
any difference between the outcomes of the two groups.
To make this estimate, you would need to collect data from people who are not receiving your
intervention. This would involve finding a similar group of people to your users, not giving them
the intervention but gathering the same user and outcomes data from them. Then you can
compare the outcomes of people who participate in an activity with similar people who do not.
This gives a stronger indication of whether it is actually your intervention that is causing change
in outcomes, or something else.
You need to be working with a certain number of people for a counterfactual approach to be
worth it. The statistical analysis will only show up a difference (if there is one) when there are
large enough numbers, so if you are only working with a small group of people it will not be
appropriate to consider a counterfactual approach. If you are interested in the counterfactual
approach, please contact us to talk about sample size.
Finding a suitable group of people to collect counterfactual data from can be difficult (or
impossible). It can sometimes be possible through comparing to a ‘natural’ comparison group
such as people on a waiting list, or people in another area not accessing the same services.
For example, the Prison Phoenix Trust runs yoga courses in prisons. Their courses were
oversubscribed so they created a waiting list. They captured user and outcome data from those
on the course and those on the waiting list, and compared the differences to see whether those
on the yoga course had better outcomes than those who had not yet participated.
Another example could be a charity who runs a programme in a number of schools in London
but the programme is implemented in three different ways depending on the school. Comparing
data from the different schools, as well as similar schools that do not implement the
programme, can allow inferences about whether the programme makes a difference and how,
where, and when it is implemented makes a difference.
74
Section 3: Other questions you might have
What can I tell users before they complete survey?
Here’s some key things you might want to tell users. All of this is included either on the survey
cover sheet or the evaluation information sheet, but you may find it helpful to have it to hand:
• Why you’re doing it? This survey is helping your organisation and others to understand how
your work helps and supports people, and also learn what we can do better.
• How long will it take? It typically only takes 6-8 minutes to complete, but take your time to
read the questions carefully.
• Participation is voluntary, so people can choose not to do it. Let users know that participation
is voluntary. Using the service is not contingent on them taking part in the survey. There
won’t be any negative impacts on them.
• How many surveys are there? You will be asking users to complete the survey 3 times, so
that we can track progress over time.
• Give honest answers.
• If they make a mistake, just put a line through it and put in your new answer.
• They do not have to answer all the questions.
• It is not a test / there are no right or wrong answers.
• Their name will be removed before we come to analyse.
• The information they provide is confidential and will only been seen by staff at your
organisation and researchers at NPC and their contracted partners. Before sending
information to NPC and their partners, names will be removed.
• The data will be stored for up to six years, in line with standard policy.
• At any time they can ask to see, amend our delete the information you have given us.
• Remind people that the data will be shared with NPC, a charity who are supporting your
organisation with evaluating your work.
75
What do we do about users who decline to participate or who don’t complete the cover sheet?
There are no negative consequences for users who don’t participate in the evaluation, and this
should be emphasised to them. However, it would be helpful for us to know more about this:
• Please keep a log of the number of people who decline the survey and if any reasons were
given.
• REMOVE and DESTROY surveys that do not have a tick YES for person having read the
study information sheet and a tick YES for consenting to complete the survey. We are
interested in knowing how many this applies to but please do not send us any data from
these surveys.
• Provide feedback to NPC about the process and let us know if anything is not working.
Should we replace our existing evaluation surveys?
Ideally, this should form part of your organisation’s overall approach to monitoring and evaluating
your activity.
We do not require you to stop using any existing evaluation approach that you currently have in
place. However, you may want to review the data you are collecting to avoid duplication and
‘survey fatigue’. This can happen when you ask your users too many questions or give them too
many surveys to fill it. They might get bored or irritated, which can lead to users disengaging
entirely, or reduce the attention they give to the surveys, leading to lower quality data.
You are free to add your existing evaluation questions or any additional questions to the end of the
surveys we have provided. The data from these additional survey questions should not be shared
with NPC and will not be analysed by NPC.
Do I have to ask all of the questions in your surveys?
Ideally, yes, we’d like you to use all the survey questions. However, if you have a really good
reason not to then you can remove these questions. It would be helpful if you could limit this to one
or two questions, and let us know what questions they are and why.
What if I’m already collecting the same data through my existing surveys?
You might already be asking the same questions in your existing surveys that we have included in
our surveys. We don’t recommend asking people the same thing twice. If this is the case, we would
76
suggest streamlining your approach and only asking these questions once. Ideally, you would
replace your surveys with the NPC ones, but we realise you may not want to do this. Instead, you
could combine everything into one survey. Or, remove the questions from your existing survey and
retain them in our survey. Or, if you prefer to keep asking them in your existing survey and input
the data from that into our template, that’s fine. You can then remove those questions from the
NPC survey. Please only do this if you are asking identical questions (with the same wording and
answer options) in your existing surveys.
Can we change the survey?
We ask that you DO NOT change any of the wording in the survey (including introduction) or
ordering of the questions as this could potentially impact on responses. Please talk to us if you
have any concerns with this.
Can we use the survey results?
A key purpose of this survey is to help your organisation better understand the impact it is having
on people, so we recommend that you use the results of your survey to learn and improve your
service delivery. We will be reporting back to you on the survey results as well as any insights we
are able to gather as a result of your work.
Are the surveys anonymous?
No. The surveys ask users to give their name so that you can identify them for the purposes of
linking their responses to an ID number when it comes to data entry. Please DO NOT send the
names of users to NPC please only use each user’s dedicated user ID number generated by our
excel template (based on initials of organisation + date of first registration + sequential number).
Sending names to NPC may breach GDPR regulations.
Please keep a separate spreadsheet with the names of your users alongside the auto generated
ID from the data entry spreadsheet. Please ensure more than one person within your organisation
has access to this spreadsheet as it will be critical for matching up the BASELINE and FOLLOW-
UP data when you come to enter FOLLOW-UP data. Under no circumstances should this
spreadsheet be sent to NPC.
What to do if a safeguarding issue should arise in a user’s survey responses or in dialogue between a staff member and a user following completion of the survey?
The staff member should follow your organisation’s safeguarding policy.
77
Should a safeguarding issue be raised by a user and identified in survey responses through NPC’s
analysis, it will be the responsibility of NPC to notify your organisation of the person’s ID, so that
your organisation can respond—following your organisation’s safeguarding policy.
What will NPC be doing with the data?
We will analyse and summarise all the data we receive in order to build the evidence and inform
the sector on what works in reducing or preventing loneliness.
Our aim is to learn more about the impact of the Building Connections Fund as a whole, so this is
not about assessing individual organisations on how well they are doing.
We will look for trends and patterns across the 30 or so organisations participating in this focused
evaluation. We hope to be able to comment on the outcomes of the fund as a whole (e.g. ‘across
30 organisations we have seen x% improvement in loneliness, with an average improvement of
y%’).
Our findings will be reported in a report to the funders (DCMS, the Co-op Foundation and The
Fund) as well as in a publicly available report which we will specifically share with interested
stakeholders (such as the wider loneliness sector).
What do we do if we have any questions or any issues?
Contact NPC by email: [email protected]
78
Suggested information sheet that grant holders can adapt:
Building Connections Fund Evaluation Information Sheet for adult participants
INSERT ORG NAME receive some funding from the ‘Building Connections Fund’, which is a £11.5
million investment in tackling loneliness from the Department for Digital, Culture, Media and Sport,
(‘DCMS’) and The Fund and the Co-op Foundation. The programme will provide new opportunities
for people to connect and get involved in their communities.
We’re taking part in an evaluation to find out if the activities that we get funding for make a
difference to the people who take part. This information sheet tells you about the information that is
being collected about you for this evaluation.
• Why is my information being collected and what are my rights? For this project, the law
in England allows the government and Co-op Foundation / National Lottery Community
[delete as appropriate] to use information about you because it is a task in the ‘public
interest’. You have the right to:
• Know who is using your information, who it’s shared with and what for
• Ask to see, amend or delete your information at any time
• Who is collecting and using my information? The evaluation has been set up by the
Department for Digital, Culture, Media and Sport (DCMS), and is being carried out by a
charity called New Philanthropy Capital (NPC). They are supported by some other partner
organisations32. INSERT ORG NAME will collect and use your information as well for our
own organisational monitoring and evaluation purposes.
• What information will we be collecting? When you start taking part in our activities, we
ask your name, date of birth, address, gender and ethnicity. Over the next 6-12 months, we
will invite you to answer 3 surveys about your experiences of coming to our organisation, the
32 Bryson Purdon Social Research, David Pritchard and the What Works Centre for Wellbeing and Brunel University London.
ADD YOUR LOGO
79
activities you take part in and, loneliness and how you feel things are going in your life. You
can choose not to do the surveys.
• How will you receive the surveys? If you agree to take part in our evaluation, you will
receive your first evaluation survey when you are attending one of our activities. We will then
give you the same survey once or twice more over the course of 6 months, either when you
are attending INSERT ORG NAME or by sending you an email with a link to the survey.
Therefore, our first survey will ask you to provide your email address for this purpose. We
won't use your email for any other purpose other than sending you the survey and, once our
evaluation is completed, we will delete your email.
• Who will have access to it? Staff at our organisation and at NPC and their research
partners will have access to your data. NPC and their partners will not have access to your
name, as this will be replaced with an identification number before they see it. No one will tell
anybody about your individual data. But if while taking part in this evaluation we think there is
a risk of serious harm to you or anyone else [NOTE TO GRANT HOLDERS: YOU MAY
WANT TO EXPAND ON THIS IF YOU WISH, TO REFLECT YOUR SPECIFIC POLICIES],
we will have to ask for help, which might mean we need to give your name to someone who
can help you.
• What will be shared with NPC and their partners?
• Your age group, gender, ethnicity (we will use an ID number, not your name).
• Your answers to the surveys.
• Date you first came to an activity, what activities you attend and how often.
• What will this information be used for? It will be used to understand what people think of
the activities they take part in and what difference they make. NPC will be able to compare
information from people across the country. They will write reports, blogs, and presentations,
but these reports will not identify you. We hope this evaluation will help our organisation and
other organisations continue to improve our work in the future.
• Where will it be stored and for how long? We will store your information securely on paper
and / or in a database at our organisation. NPC will store the information in a secure online
database with servers based in Ireland, for up to six years.
• What if I want to see, change or delete my information? Contact Thomas Abrams from
NPC at [email protected] to ask to see, change or delete your information. If you
have any complaints report them here: www.ico.org.uk/concerns.

80
• What if I don’t want to participate in the evaluation? Taking part is voluntary. It is up to
you to decide to take part in this evaluation or not. You will not be treated any differently.
• How do I consent to being part of the evaluation? Please indicate you are happy to be
part of this by ticking the appropriate boxes on the survey that accompanies this information
sheet.
• What do I do if I want to make a complaint? If you have any complaints report them here:
www.ico.org.uk/concerns.
81
References
i Parker, E, Evaluating and learning during Covid-19.
ii Department for Digital, Culture, Media and Sport (2018) A connected society: A strategy for
tackling loneliness—laying the foundations for change.
iii Department for Digital, Culture, Media and Sport (2020) Community Life Survey 2019-20.
iv Campaign to End Loneliness (2020) The Psychology of Loneliness Why it matters and what we
can do.
v Valtorta, N.K., Kanaan, M., Gilbody, S. K., Ronzi, S. and Hanratty, B. (2016) Loneliness and
social isolation as risk factors for coronary heart disease and stroke: systematic review and meta-
analysis of longitudinal observational studies Heart (British Cardiac Society) 102(3) and Cacioppo,
J.T. and Hawkley, L.C. (2009) Perceived social isolation and cognition Trends in Cognitive Science
13(1): p. 447-454.
vi Holt-Lunstad, J., Smith, T.B., Baker, M., Harris. T, and Stephenson, D. (2015) Loneliness and
Social Isolation as Risk Factors for Mortality: A Meta-Analytic Review Perspectives on
Psychological Science10(2): p. 227-37 and Aprile D Benner (2010) Loneliness, Academic
Performance and the buffering nature of friendships, Yoolim Shin (2016) Peer relationships, Social
Behaviours, Academic Performance and Loneliness.
vii ONS (2021), Mapping loneliness during the coronavirus pandemic.
viii Jo Cox Loneliness Commission (2018) Combatting loneliness one conversation at a time: A call
to action.
ix Department for Digital, Culture, Media and Sport (2018) A connected society: A strategy for
tackling loneliness—laying the foundations for change.
x Office of National Statistics (2018): Measuring loneliness: guidance for use of the national
indicators on surveys.
82
xi Victor, C. and (2018). An overview of reviews: the effectiveness of interventions to address
loneliness at all stages of the lifecourse. What Works Centre for Wellbeing, p.51.
xii What Works Centre for Wellbeing, Loneliness.
Campaign to End Loneliness (2020), Promising Approaches Revisited: Effective action on
loneliness in later life, p6.
xiii NPC (2019): 10 tips to help your project reduce loneliness.
xiv NPC (2019): Evaluating the Building Connections Fund.
xv NPC: Evidence and shared impact measurement.
xvi NPC (2014): The future of shared measurement: A guide to assessing individual sector
readiness.
xvii Department for Digital, Culture, Media and Sport’s Community Life Survey: Focus on Loneliness
2019-20.
xviii What Works Centre for Wellbeing (2019), A brief guide to measuring loneliness.
xix Department for Digital, Culture, Media and Sport’s Community Life Survey: Focus on Loneliness
2019-20.
xx Department for Digital, Culture, Media and Sport’s Community Life Survey: Focus on Loneliness
2019-20.
xxi Department for Digital, Culture, Media and Sport’s Community Life Survey: Focus on Loneliness
2019-20.
xxii Age UK (2018): All the Lonely People: Loneliness in Later Life, p7.
xxiii Department for Digital, Culture, Media and Sport (2020): Community Life Survey: Focus on
Loneliness 2019-20.