Embed Size (px)
Citation preview
Executive Health and Safety
The burden of occupational cancer in Great Britain Overview report
Prepared by Imperial College London, the Institute of Environment and Health, the Health and Safety Laboratory and the Institute of Occupational Medicine for the Health and Safety Executive 2010
RR800 Research Report
Executive Health and Safety
The burden of occupational cancer in Great Britain Overview report
Lesley Rushton1, Sanjeev Bagga2, Ruth Bevan2, Terry P Brown3, John W Cherrie4, Philip Holmes2, Sally J Hutchings1, Lea Fortunato1, Rebecca Slack2, Martie Van Tongeren3, Charlotte Young3
1 Imperial College London Department of Public Health and Epidemiology Faculty of Medicine St Mary’s Campus, Norfolk Place London W2 3PG
3 Health and Safety Laboratory Mathematical Sciences Unit Harpur Hill Buxton Derbyshire SK17 9JN
2 Institute of Environment and Health Cranfield Health Cranfield University Cranfield MK43 0AL
4 Institute of Occupational Medicine Research Avenue North Riccarton Edinburgh EH14 4AP
The aim of this project was to produce an updated estimate of the current burden of occupational cancer specifically for Great Britain. The primary measure of the burden of cancer used in this project was the attributable fraction (AF) i.e. the proportion of cases that would not have occurred in the absence of exposure; this was then used to estimate the attributable numbers. This involved obtaining data on the risk of the disease due to the exposure of interest, taking into account confounding factors and overlapping exposures, and the proportion of the target population exposed over the period in which relevant exposure occurred. Estimation was carried out for occupational exposures classified by the International Agency for Research on Cancer (IARC) as group 1 (established) and 2A carcinogens (probable).
5.3% (8023) cancer deaths were attributable to occupation in 2005 (men: 8.2% (6366); women 2.3% (1657)). Attributable estimates for total cancer registrations are 13694 (4.0%); and for men: 10074 (5.7%) and women 3620 (2.1%). Occupational attributable fractions are over 2% for mesothelioma, sinonasal, lung, nasopharynx, breast, non-melanoma skin cancer, bladder, oesophagus, soft tissue sarcoma and stomach cancers. Asbestos, shift work, mineral oils, solar radiation, silica, diesel engine exhaust, coal tars and pitches, occupation as a painter or welder, dioxins, environmental tobacco smoke, radon, tetrachloroethylene, arsenic and strong inorganic mists each contribute 100+ registrations. Industries/occupations with high cancer registrations include construction, metalworking, personal/household services, mining, land transport, printing/publishing, retail/hotels/restaurants, public administration/defence, farming and several manufacturing sectors. 56% of cancer registrations in men are attributable to work in the construction industry (mainly mesotheliomas, lung, bladder and non-melanoma skin cancers) and 54% of cancer registrations in women are attributable to shift work (breast cancer).
This project is the first to quantify in detail the burden of cancer due to occupation specifically for GB. There are several sources of uncertainty in the estimates, including exclusion of other potential carcinogenic agents, inaccurate or approximate data and methodological issues. On balance, the estimates are likely to be a conservative estimate of the total attributable burden. Forthcoming reports will present the results for; estimates of Disability-Adjusted Life Years; methods to predict future estimates of the occupational cancers with examples based on important hazards; and the results of sensitivity analysis of these estimates to sources of uncertainty and bias.
This report and the work it describes were funded by the Health and Safety Executive (HSE). Its contents, including any opinions and/or conclusions expressed, are those of the authors alone and do not necessarily reflect HSE policy.
HSE Books
© Crown copyright 2010
First published 2010
All rights reserved. No part of this publication may be reproduced, stored in a retrieval system, or transmitted in any form or by any means (electronic, mechanical, photocopying, recording or otherwise) without the prior written permission of the copyright owner.
Applications for reproduction should be made in writing to: Licensing Division, Her Majesty’s Stationery Office, St Clements House, 2-16 Colegate, Norwich NR3 1BQ or by e-mail to [email protected]
ACKNOWLEDGEMENTS
Funding was obtained from the Health and Safety Executive (HSE). Andrew Darnton from the HSE was responsible for the work on mesothelioma. The contributions to the project and advice received from other HSE and Health and Safety Laboratory staff is gratefully acknowledged. Two workshops were held during the project bringing together experts from the UK and around the world. We would like to thank all those who participated and have continued to give advice and comment on the project. We would also like to thank Gareth Evans for his help in editing and formatting the reports.
ii
i
CONTENTS
EXECUTIVE SUMMARY................................................................................................ v1.0 Introduction .............................................................................................................12.0 Methodology ............................................................................................................3
1.1 Overview Of The Study Design .........................................................................3
2.2 Risk estimates...................................................................................................3
2.3 Exposed population estimation..........................................................................4
2.4 Statistical analysis.............................................................................................5
3.0 Results .....................................................................................................................73.1 Attributable fractions and numbers by cancer site .............................................7
3.2 Deaths And Registrations By Carcinogen And Cancer Site.............................13
3.3 Deaths and registrations by industry sector and carcinogenic agent oroccupational circumstance ..............................................................................22
3.4 Deaths and registrations by industry sector and cancer site ............................41
4.0 Discussion ............................................................................................................. 545.0 Bibliography .......................................................................................................... 586.0 Statistical Appendix .............................................................................................. 61
iii

iv
EXECUTIVE SUMMARY
INTRODUCTION HSE wishes to develop appropriate practical measures to reduce the incidence of occupational cancer in Great Britain; they currently rely on estimates of the effects of occupation on cancer mortality in the US made by Doll & Peto in 1981 (4% of all US cancer deaths with an uncertainty range of 2% to 8%). The overall aims of this project were:
• to produce an updated estimate of the current burden of occupational cancer specifically for Great Britain
• to produce an estimate of the future occupational cancer burden in Great Britain based on recent and current exposures, together with the method for updating this in future
• where the data are sufficiently detailed, to break any headline estimates down into exposure-cancer combinations
This report presents an overview of the results of the current burden of cancer due to occupational carcinogens and circumstances in Great Britain (GB) together with a summary of the methodology developed and the data used.
METHODOLOGY The primary measure of the burden of cancer used in this project was the attributable fraction (AF) i.e. the proportion of cases that would not have occurred in the absence of exposure; this was then used to estimate the attributable numbers. The AF requires the risk of the disease due to the exposure of interest and the proportion of the target population exposed. Estimation was carried out for 2005 for mortality and 2004 for cancer incidence for occupational exposures for classified by the International Agency for Research on Cancer (IARC) as group 1 (established) and 2A carcinogens (probable). . Risk estimates, adjusted where appropriate for confounders, were obtained from key studies, meta-analyses or pooled studies, taking into account study quality. Dose-response risk estimates were generally not available in the epidemiological literature nor were proportions of those exposed at different levels of exposure over time available for the working population in GB. However, where possible risk estimates were obtained for an overall ‘lower’ level and an overall ‘higher’ level of exposure to the agents of concern and matched appropriately to the exposure scenario in question. The risk estimates for occupational exposure to ionising radiation were derived using generalized linear dose response models of excess relative risk per unit of cumulative radiation dose from the United Nations Scientific Committee on the Effects of Atomic Radiation.
The period during which exposure occurred that was relevant to the development of the cancer in the target year 2005 was defined as the risk exposure period (REP). For solid tumours a latency of 10-50 years was assumed giving a REP of 1956-1995; for haematopoietic neoplasms 0-20 year’s latency was assumed giving a REP of 1986-2005. The proportion of the population ever exposed to each carcinogenic agent or occupation in the REP was obtained from the ratio of the numbers ever exposed to the carcinogens of interest in each relevant industry/occupation within GB over the total number of people ever employed. National data were used to obtain these. Account was taken of changes in numbers employed in the primary and manufacturing industry and service sectors in GB over the REP and adjustment was made where appropriate for employment turnover over the period.
v
RESULTS The overall burden in GB attributable to the occupational carcinogens considered was 5.3% (based on deaths (8.2% for men and 2.3% in women). Numbers of attributable deaths are 8019 overall (6362 for men, 1657 for women) and numbers of attributable cancer registrations are 13679 overall (10063 for men, 3616 for women). The AFs by cancer site range from less than 0.01% to 95% overall, the most important cancer sites for occupational attribution being, for men, mesothelioma (97%), sinonasal (46%), lung (21.1%), bladder (7.1%) and NMSC (7.1%), and for women mesothelioma (83%) sinonasal (20.1%), lung (5.3%), breast (4.6%) and nasopharynx (2.5%). Occupation also contributes 2% or more overall to cancers of the larynx, oesophagus, soft tissue sarcoma (STS) and stomach, with in addition for men melanoma of the eye (due to welding) and non-Hodgkin’s lymphoma (NHL). Lung cancer contributes the largest number of attributable deaths for both men and women followed, for men, by mesothelioma, bladder, oesophageal and stomach cancers, and for women, by breast cancer, mesothelioma, bladder and oesophageal cancers. For attributable numbers of cancer registrations, the patterns differ between men and women; for men, lung cancer contributes the largest numbers of registrations followed by NMSC, mesothelioma, bladder, oesophageal and stomach cancers, non-Hodgkin’s lymphomas and sinonasal cancer; for women breast cancer contributes the largest numbers of registrations followed by lung cancer, NMSC, mesothelioma, bladder cancer, non-Hodgkin’s lymphoma, ovarian, sinonasal and oesophageal cancers.
Many carcinogenic exposures in the workplace affect multiple cancer sites. Asbestos contributes the most to both total attributable deaths and registrations (larynx, lung, mesothelioma, stomach). Others making a major contribution to attributable deaths and/or registrations include arsenic (lung), diesel engine exhaust (DEE) (bladder, lung), dioxins (lung), environmental tobacco smoke (ETS) encountered at work in non-smokers (lung), mineral oils (bladder, lung, non-melanoma skin cancer (NMSC), sinonasal), polycyclic aromatic hydrocarbons from coal tar and pitches (NMSC), radon from natural exposure in workplaces (lung), shift work, including flight personnel (breast), silica (lung), solar radiation (NMSC), strong inorganic acid mists (larynx, lung), tetrachloroethylene (cervix, non-Hodgkin’s lymphoma, oesophagus), work as a painter (bladder, lung, stomach) and work as a welder (lung, melanoma of the eye due to ultra violet radiation).
Industry sectors contributing substantially to the total burden includes construction, land transport, manufacture of transport equipment, metal workers, mining, painters and decorators in the construction industry, personal and household services (this sector includes repair trades, laundries and dry cleaning, domestic services, hairdressing and beauty), printing and publishing, public administration and defence, roofers and road repairs, shift work, and wholesale and retail trades. The majority of industry sectors involve exposure to several carcinogens (many over 10) with construction and many of the manufacturing sectors involving potential exposure to between 15 and 20 carcinogens. There are several key exposures which give rise to substantial numbers of registrations across multiple industry sectors. Of note is the contribution of exposure to (i) asbestos, DEE, silica and solar radiation in the construction industry; (ii) asbestos, DEE, ETS (non-smokers), soots and tetrachloroethylene in personal and household services; (iii) asbestos and DEE in land transport (railway, road, pipelines); (iv) asbestos, DEE, silica and solar radiation in mining; (v) ETS (non-smokers) and solar radiation in public administration and defence; (vi) asbestos, ETS (non-smokers) and radon in the wholesale and retail trade, restaurants and hotels and (vii) dioxins, non-arsenical insecticides and solar radiation in farming.
vi
DISCUSSION This project is the first to quantify in detail the burden of cancer due to occupation specifically for GB. The project highlights the impact of occupational exposures, together with the occupational circumstances and industrial areas where exposures to these agents occurred in the past, on population cancer morbidity and mortality. Our methodological approach was developed with advice, discussion and peer review from international experts, including IARC, throughout the project and at two international workshops. It takes account of issues such as latency and the period in which relevant exposure would occur, changes in workforce turnover and employment trends and the potential to be exposed to several carcinogens concurrently and at different levels. These methods have the potential to be adapted for use in other countries and extended to include social and economic impact evaluation.
However, assumptions made in our methodology and uncertainties and inaccuracies in the data may have introduced biases into our estimates. Inclusion of IARC group 2A carcinogens may have inflated our estimates; alternatively exclusion of IARC group 2B (possible) carcinogens and other suspected or unknown carcinogens may have led to an underestimation. Other caveats include inappropriate choice of risk estimates, imprecision in the risk estimates and estimates of proportions exposed, inaccurate assumptions about the risk exposure and latency periods, and in some cases a lack of separate risk (and/or cancer incidence) estimates for women.
Due to the long latent interval of many carcinogens the estimates of current burden are based on exposures occurring in the past. Many of these would have been considerably higher than today and there is evidence of continuing downward trends in the UK in many exposures. However, it should be noted that for many of the carcinogens a major contribution to the burden was made by a large number of workers exposed at low levels and low risk.
On-going work and future reports will address; estimation of the occupational cancer burden using measures such as years of life lost and Disability-Adjusted Life Years; the methods to predict future estimates of the occupational cancers with examples based on important hazards; and methods to assess the sensitivity of these estimates to sources of uncertainty and bias.
vii

viii
1.0 INTRODUCTION
In 1981 in their report to the US Congress, Doll & Peto presented a method of estimating the effects of occupation on cancer mortality in the US (Doll & Peto, 1981). The proportion of cancer they attributed to occupation was about 4% of all US cancer deaths with an uncertainty range of 2% to 8%. More recently they have produced a new estimate of 2% with a range of 1-5% and suggest that less than 1% is known to be avoidable by practicable ways (Doll and Peto, 2005). The Health and Safety Executive (HSE) has relied on the 1981 study to estimate the proportions of cancers in Great Britain (GB) due to occupational exposures, giving an estimate of around 6000 cancer deaths (uncertainty range 3000 to 12000) and 12000 cancer registrations (uncertainty range 6000 to 24000) currently occurring each year in GB. In a later overview of the epidemiology of cancer, Doll & Peto suggested that it is unlikely that occupational hazards account for more than two or three per cent of all fatal cancers in developed countries such as the UK, but they acknowledge that the quantitative evidence is uncertain and the estimate could be out by a factor of two (Doll & Peto, 2003).
HSE wishes to develop appropriate practical measures to reduce the incidence of occupational cancer in Great Britain. These measures could include improved risk assessment, chemical substitution, improved control measures and evidence of their effectiveness. It will be important that these can be employed in small- and medium-sized enterprises as well as larger businesses. Future strategies for deciding where HSE targets its action on workplace carcinogens through policy-making, advice and enforcement activity are dependent on a sound evidence base. This evidence base will also help determine HSE’s priorities for preventing future disease.
It is acknowledged that the estimates of current burden of cancer due to occupational exposures are based on evidence and methodology that is over 25 years old, and that it is now appropriate that the validity of these estimates is reassessed using currently available scientific evidence.
The aims of this project carried out by Imperial College London in collaboration with the Health and Safety Laboratory (HSL), the Institute of Environment and Health (IEH) at Cranfield University and the Institute of Occupational Medicine (IOM) were:
• to produce an updated estimate of the current burden of occupational cancer in Great Britain
• to produce an estimate of the future occupational cancer burden in Great Britain based on recent and current exposures, together with the method for updating this in future
• to the extent that the data will allow, to break any headline estimates down into exposure-cancer combinations
These estimates will inform the HSE’s ongoing deliberations, as part of the cancer project of the Long Latency Disease Programme, on the priorities for intervention on occupational carcinogens.
This report presents an overview of the results of the current burden of cancer due to occupational carcinogens and circumstances in GB together with a summary of the methodology developed and the data used. Separate technical reports for each cancer giving more details of the source data, cancer burden calculations, and statistical methodology will be made available on the HSE website during 2010. Other reports will be published including methods for predicting the future burden of occupational cancers due to recent exposures, and the application of these methods to priority carcinogens and exposure circumstances. Other measures of burden will be reported such as Years of Life Lost and Disability-Adjusted Life Years, as well as a report summarizing the
1

application of a sensitivity analyses to determine the biases and uncertainties surrounding these estimates of cancer burden.
2

2.0 METHODOLOGY
1.1 OVERVIEW OF THE STUDY DESIGN
For each cancer, information on the incidence, mortality and survival trends in GB was obtained and an overview of the aetiology and known and suspected causal factors, including occupationally related factors, was carried out. Estimation was carried out using 2005 data for mortality and 2004 for cancer incidence. Mortality data were obtained from the Office for National Statistics (ONS), and the General Register Office for Scotland. Cancer incidence data were obtained from ONS, Cancer Statistics, Registrations, Series MB1 for England, the Scottish Cancer Registry, and the Welsh Cancer Intelligence and Surveillance Unit.
The attributable fraction (AF) i.e. the proportion of cases that would not have occurred in the absence of an occupational exposure was estimated; this was then used to estimate the attributable numbers. There are several methods for estimating the AF but all depend on knowledge of the risk of the disease due to the exposure of interest and the proportion of the target population exposed (Steenland et al, 2006).
2.2 RISK ESTIMATES
Risk estimates were obtained from key studies, meta-analyses or pooled studies, taking into account quality (including relevance to GB, sample size, extent of control for confounders, adequacy of exposure assessment, and clarity of case definition). Studies could be industry-based cohort studies or population-based case-control studies.
Factors that were considered for the choice of study included: • Representativeness
o Broad based and representative of the occupations or industrial exposures in GB o Included separate evaluations for men and women if relevant
• Study quality o Large sample size o Control for confounders i.e. adjusted analyses carried out o Adequate exposure assessment in the study o Standardised diagnosis of cancer cases o Appropriate comparison or a control population
• Portability, for which there are three key issues: o UK study or similar population, so that the source study and target (GB)
exposures match on types and levels of exposure o Up-to-date study, so that the relevant period of exposure in the source population
is not so long ago that the exposures on which the risk estimates were based no longer match exposures in the target relevant exposure period
o Comparable distribution of known confounders within GB population.
Where possible risk estimates were selected that were adjusted for important confounders or non-occupational risk factors e.g. smoking for lung cancer, smoking and alcohol use for laryngeal cancer. Where only a narrative review was available giving a range of risk estimates from several relevant studies a combined estimate of the relative risks (RR) was calculated based on a random-(for heterogeneous RRs) or fixed- (for homogeneous RRs) effects model. Formal systematic reviews and meta-analyses were carried out to estimate risk estimates for laryngeal and stomach cancers related to asbestos exposure.
3
Dose-response risk estimates were generally not available in the epidemiological literature nor were proportions of those exposed at different levels of exposure over time available for the working population in GB. However, where possible risk estimates were obtained for an overall ‘lower’ level and an overall ‘higher’ level of exposure to the agents of concern and matched appropriately to the exposure scenario in question.
The risk estimates for occupational exposure to ionising radiation were derived using generalized linear dose response models of excess relative risk per unit of cumulative radiation dose from the United Nations Scientific Committee on the Effects of Atomic Radiation (UNSCEAR, 2006). Cumulative lifetime dose was estimated using data from the Central Index of Dose Information (CIDI) (HSE, 1998). For aircrew, who are not covered by CIDI, the mean total lifetime radiation dose per pilot was obtained from a large cohort study of European airline pilots (Langner et al, 2004) and combined with numbers employed obtained from the British Airways Stewards and Stewardesses Union (BASSA, 2008) and the Labour Force Survey.
A substantial proportion of the excess is likely to occur in the large number of workers with low exposures for whom estimates of average risks are inevitably unreliable. Where no risk estimate could be identified for very low/background levels of exposure for a particular carcinogen, a RR was estimated for the ‘lower exposed’ group by (i) taking the harmonic mean of all the available ratios of ‘higher’ to ‘lower’ RR estimates for cancer-exposure pairs for which data were available, (ii) applying this average ratio to the ‘higher’ level estimate for the carcinogen to obtain a ‘lower’ level RR estimate for the carcinogen. If the resulting RR estimate was less than 1, RR was set to one.
2.3 EXPOSED POPULATION ESTIMATION
The period during which exposure occurred that was relevant to the development of the cancer in the target year 2005 was defined as the risk exposure period (REP). For solid tumours a latency of 10-50 years was assumed giving a REP of 1956-1995; for haematopoietic neoplasms 0-20 year’s latency was assumed giving a REP of 1986-2005. The proportion of the population ever exposed to each carcinogenic agent or occupation in the REP was obtained from the ratio of the numbers ever exposed to the carcinogens of interest in each relevant industry/occupation within GB over the total number of people ever employed (Equation 4 in the Statistical Appendix).
If the study from which the risk estimates were obtained was population based, an estimate of the proportion of the population exposed was derived directly from the study data, although such studies were rarely available in practice for GB. If the risk estimate was obtained from an industry-based study, national data sources such as the CARcinogen EXposure database (CAREX) (Pannett et al, 1998), the UK Labour Force Survey (LFS) (LFS, 2009) and Census of Employment (ONS, 2009) were used. CAREX was used for estimating the numbers of the GB population ever exposed to a carcinogen by industry sector. As highlighted above data are not available on the levels of exposure in all industry sectors for all the carcinogens considered, nor the numbers exposed at these levels. The industry sectors were thus allocated to ‘higher’ or ‘lower’ exposure categories assuming distributions of exposure and risk that corresponded broadly to those of the studies from which the risk estimates were selected. The initial allocations were based on the judgment of an experienced human exposure scientist; each assessment was then independently peer-reviewed and if necessary, a consensus assessment agreed. Data from CAREX are not differentiated by sex; 1991 Census data by industry and occupation were used to estimate the relative proportions of men and women exposed. The LFS and Census of Employment data were used to estimate numbers ever employed in specific occupations e.g. welder, painter etc., and for specific industries for carcinogens not included in CAREX.
4
CAREX data for GB relate only to the period 1990-93. For the LFS and CoE an available year was chosen to represent numbers employed about 35 years before the target year of 2005, as this was thought to represent a ’peak’ latency for the solid tumours, and is also close to the mid-point of the REP for estimating numbers ever exposed across the period (for which a linear change in employment levels was implicitly assumed). Where the Census of Employment was used, the data are for 1971. Where the LFS was used, the first year available used was 1979 for solid tumours, and 1991 for short latency cancers.
When CAREX data were used adjustment factors were applied to take account of the change in numbers employed in the primary and manufacturing industry and service sectors in GB over the REP. Adjustment for employment turnover over the period for grouped main industry sectors was also carried out (see equation 3 in the Statistical Appendix). Ideally this requires full national starter and leaver data across the REP for all industry sectors. In the absence of this quality of data, estimating turnover directly using new starters in years within the REPs gives the best approximation for the purpose of estimating those ever exposed. This method estimates starters in the past year as a proportion of the average number employed (Gregg and Wadsworth, 2002). As exposure in occupational epidemiological studies is usually defined as at least one year, we have adapted this to exclude short-term labour turnover. New starters in the past year who are expected to remain employed for at least one year were taken as a proportion of all those expected to be employed for at least 1 year. This was estimated as the number recorded as employed for between 1 and 2 years divided by the total employed for at least one year using LFS data averaged over the REP.
2.4 STATISTICAL ANALYSIS
The AFs have been calculated on a cancer by cancer basis. To estimate the AFs for each cancer/occupational carcinogen Levin’s method was used if risk estimates came from an industry-based study or a review or meta-analysis together with estimates of the proportion of the population exposed from independent national sources of data (Levin, 1953). Miettinen’s method was used if risk estimates and proportion of cases exposed came from a population-based study (Miettinen, 1974) (equations 1 and 2 respectively in the Statistical Appendix). For each AF, a random error confidence interval was calculated using Monte Carlo simulations (Steenland and Armstrong, 2006). The AFs were applied to total numbers of cancer specific deaths (2005) and cancer registrations (2004) for ages that could have been exposed during the REP to give attributable numbers. Where risk estimates were only available from mortality studies AFs derived from these were used for estimation of attributable registrations and vice versa. Similarly if separate AFs for women could not be estimated those for men or for men and women combined were used.
The AF for mesothelioma was derived directly from several UK mesothelioma studies that suggest between 96% and 98% of male mesothelioma cases are due to occupational or paraoccupational (e.g. exposure from living near an asbestos factory or handling clothes contaminated due to occupational exposure) exposure (Yates et al, 1997; Howel et al, 1997; Rake et al, 2009) . Combining the results from Rake et al (2009) with those from two studies in which results were reported separately for females (Goldberg et al, 2006; Spirtas et al, 1994) gave estimates of 75%-90% for females. The ratio of asbestos related lung cancer to mesothelioma deaths has been suggested to be between two-thirds and one (Darnton et al, 2006). Rather than using our standard method for the estimation of numbers of lung cancers attributable to asbestos, we therefore used a ratio of 1:1, lung cancer to mesothelioma deaths; this takes into account of the impact that past levels of exposure to asbestos are having on the current incidence by the
5
direct link to mesothelioma deaths that are still climbing whereas lung cancer in general is declining due to the reduction in smoking. This assumes, however, that lung cancer has a similar pattern of latency as mesothelioma. The total lung cancers attributable to asbestos were allocated between industries by using estimates of relative risk for ‘higher’ and ‘lower’ level exposed (from Goodman et al, 1999) and proportions ever exposed by industry sector (based on CAREX) combined as weights.
For lung cancer associated with radon exposure from natural sources, estimates of rates of lung cancer due to exposure to radon in domestic buildings (NRPB 2000) were applied to estimates of the time employees spend in workplaces where radon exposure occurs.
AFs for all the relevant carcinogenic agents and occupational circumstances were combined into a single estimate of AF for each separate cancer. To take account of potential multiple exposures, strategies including partitioning exposed numbers between overlapping exposures or estimating only for the ‘dominant’ carcinogen with the highest risk were used. The IARC Monograph process has been taking place over many years and has resulted in overlap between substances evaluated. For lung cancer, for example, there are 32 occupations or carcinogenic agents evaluated by IARC. AFs were estimated for 21 of these; for example, substances such as coal-tars and pitches and processes such as coal gasification and coke production were included within our evaluation of Polycyclic Aromatic Hydrocarbons (PAH). Where exposure to multiple carcinogens remained it was assumed that the exposures were independent of one another and that their joint carcinogenic effects were multiplicative. The AFs were then combined to give an overall AF for that cancer using a product sum (equation 5 in the Statistical Appendix). An overall AF for all cancers was estimated by summing the attributable numbers for each, and dividing by the total number of cancers in GB.
6
3.0 RESULTS
The study has quantified for the first time the impact of occupation on the burden of cancer in Britain for all cancer sites and the carcinogens which IARC have classified as having sufficient (group 1) or limited (group 2A) evidence in humans. Estimates of attributable fractions, attributable numbers of deaths (for 2005) and attributable numbers of cancer registrations (for 2004) have been made for:
1. for males and female separately and for the total; 2. for 24 separate cancer sites and the total 3. for 41 separate carcinogens or occupational circumstances 4. for over 60 separate industry sectors.
This report presents summary tables for these results. More detailed results are available in MS Excel tables on the HSE website and will be available in the technical reports for the individual cancer sites.
3.1 ATTRIBUTABLE FRACTIONS AND NUMBERS BY CANCER SITE
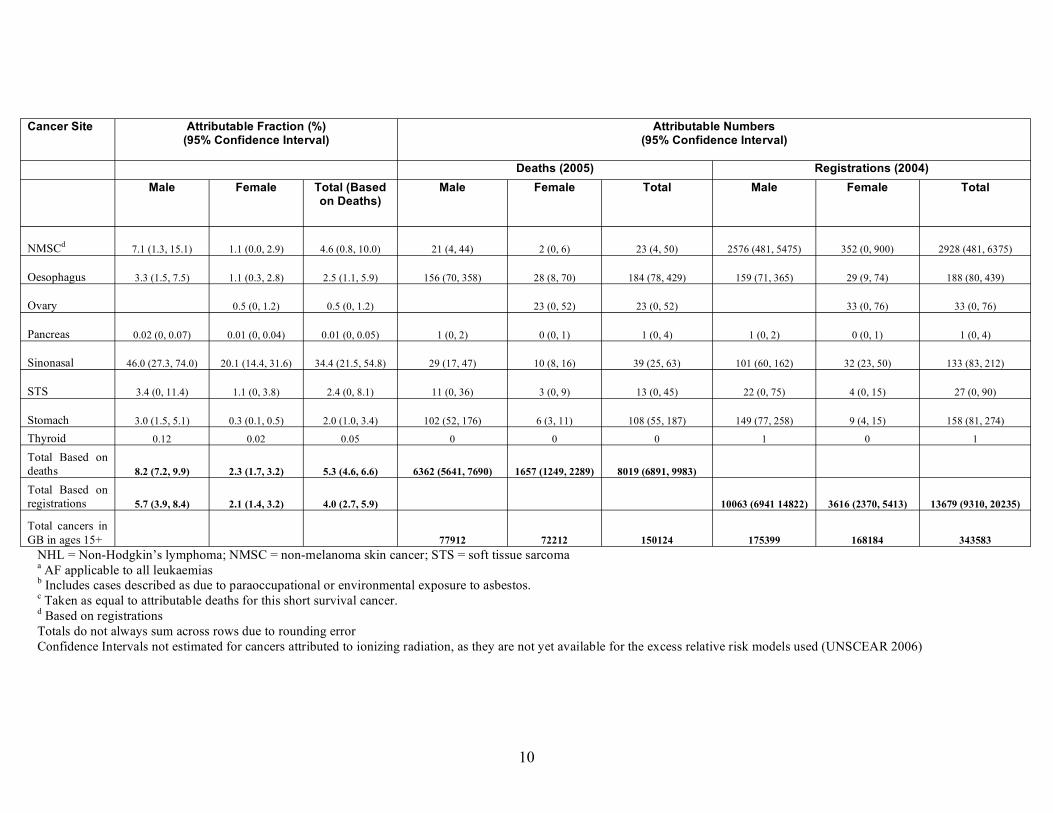
The overall burden by cancer site (AFs, attributable numbers (ANs) and 95% confidence intervals) is given in Table 1A. 8.2% (n = 6362) of cancer deaths in 2005 in men and 2.3% (n = 1657) in women in Britain have been estimated to be due to occupation giving an overall AF of 5.3% (n = 8019). The combined AFs for registrations are 5.7% (n = 10063) for men in 2004 and 2.1% (n = 3616) for women giving an overall AF based on registrations of 4.0% (n = 13679). If only agents and occupations classified by IARC as group 1 and having strong evidence of carcinogenicity in humans are considered, the overall burden reduces to 4.0% (5123 total deaths, 8277 total registrations) (Table 1B). Only 9 cancer sites are involved (bladder, larynx, leukaemia, liver, lung, mesothelioma, non-melanoma skin cancer (NMSC), sinonasal and thyroid). The dominance of asbestos exposure and mesothelioma, asbestos and the many other group 1 carcinogens affecting lung cancer and solar radiation and NMSC means that the reduction in the AF and attributable numbers for men (6.6%, 5123 deaths, 8277 registrations) is far less than for women (1.2%, 862 deaths, 1313 registrations) for whom shift work is most dominant.
In general, attributable fractions and numbers are higher for men than for women, due mainly to the higher proportions of males exposed to occupational carcinogens. The difference between the numbers of attributable deaths and registrations reflects the varying survival from cancer with mortality and registration numbers being similar for poor survival cancers such as lung cancer and mesothelioma; in contrast the difference is much greater for cancers such as breast cancer where survival is improving and for NMSC, which is rarely fatal.
The AFs by cancer site range from less than 0.01% to 95% overall, the most important cancer sites for occupational attribution being, for men, mesothelioma (97%), sinonasal (46%), lung (21.1%), bladder (7.1%) and NMSC (7.1%), and for women mesothelioma (83%) sinonasal (20.1%), lung (5.3%), breast (4.6%) and nasopharynx (2.5%). Occupation also contributes 2% or more overall to cancers of the larynx, oesophagus, soft tissue sarcoma (STS) and stomach, with in addition for men melanoma of the eye (due to welding) and non-Hodgkin’s lymphoma (NHL).
Lung cancer contributes the largest number of attributable deaths for both men and women followed, for men, by mesothelioma, bladder, oesophageal and stomach cancers, and for women, by breast cancer, mesothelioma, bladder and oesophageal cancers. For attributable numbers of cancer registrations, the patterns differ between men and women; for men, lung cancer
7

contributes the largest numbers of registrations followed by NMSC, mesothelioma, bladder, oesophageal and stomach cancers, non-Hodgkin’s lymphomas and sinonasal cancer; for women breast cancer contributes the largest numbers of registrations followed by lung cancer, NMSC, mesothelioma, bladder cancer, non-Hodgkin’s lymphoma, ovarian, sinonasal and oesophageal cancers.
8
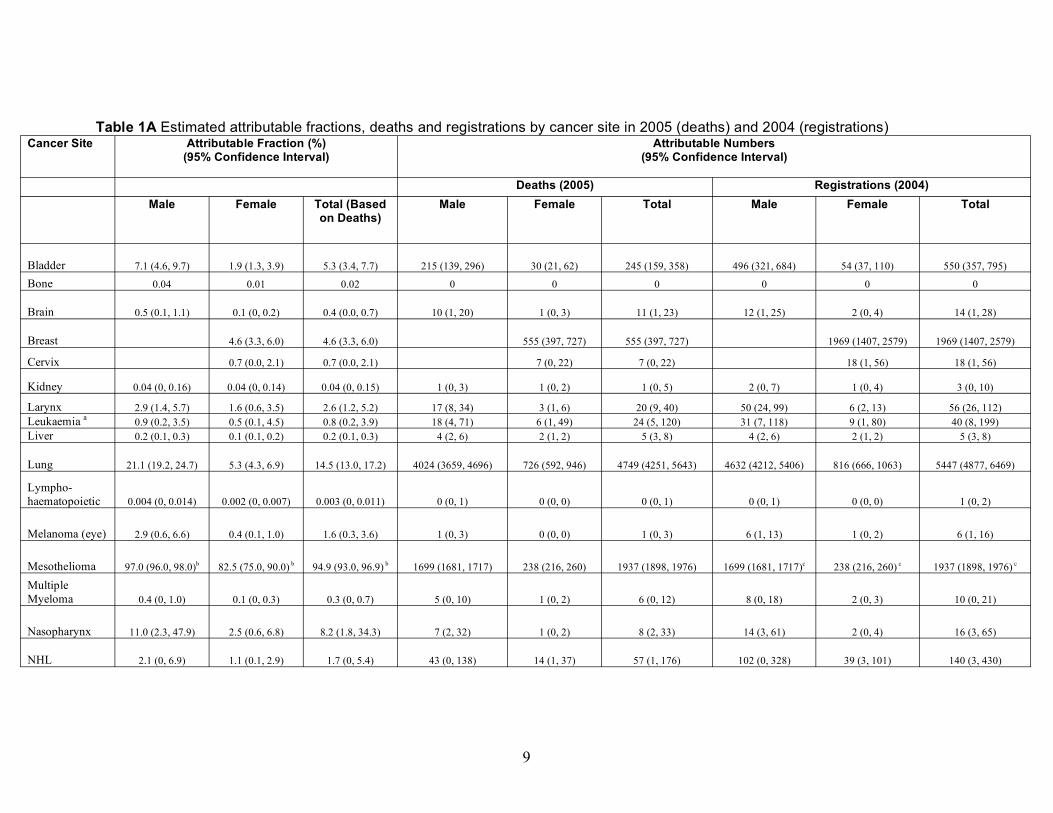
Table 1A Estimated attributable fractions, deaths and registrations by cancer site in 2005 (deaths) and 2004 (registrations) Cancer Site Attributable Fraction (%)
(95% Confidence Interval) Attributable Numbers
(95% Confidence Interval)
Deaths (2005) Registrations (2004) Male Female Total (Based
on Deaths) Male Female Total Male Female Total
Bladder 7.1 (4.6, 9.7) 1.9 (1.3, 3.9) 5.3 (3.4, 7.7) 215 (139, 296) 30 (21, 62) 245 (159, 358) 496 (321, 684) 54 (37, 110) 550 (357, 795)
Bone 0.04 0.01 0.02 0 0 0 0 0 0
Brain 0.5 (0.1, 1.1) 0.1 (0, 0.2) 0.4 (0.0, 0.7) 10 (1, 20) 1 (0, 3) 11 (1, 23) 12 (1, 25) 2 (0, 4) 14 (1, 28)
Breast 4.6 (3.3, 6.0) 4.6 (3.3, 6.0) 555 (397, 727) 555 (397, 727) 1969 (1407, 2579) 1969 (1407, 2579)
Cervix 0.7 (0.0, 2.1) 0.7 (0.0, 2.1) 7 (0, 22) 7 (0, 22) 18 (1, 56) 18 (1, 56)
Kidney 0.04 (0, 0.16) 0.04 (0, 0.14) 0.04 (0, 0.15) 1 (0, 3) 1 (0, 2) 1 (0, 5) 2 (0, 7) 1 (0, 4) 3 (0, 10)
Larynx 2.9 (1.4, 5.7) 1.6 (0.6, 3.5) 2.6 (1.2, 5.2) 17 (8, 34) 3 (1, 6) 20 (9, 40) 50 (24, 99) 6 (2, 13) 56 (26, 112) Leukaemia a 0.9 (0.2, 3.5) 0.5 (0.1, 4.5) 0.8 (0.2, 3.9) 18 (4, 71) 6 (1, 49) 24 (5, 120) 31 (7, 118) 9 (1, 80) 40 (8, 199) Liver 0.2 (0.1, 0.3) 0.1 (0.1, 0.2) 0.2 (0.1, 0.3) 4 (2, 6) 2 (1, 2) 5 (3, 8) 4 (2, 6) 2 (1, 2) 5 (3, 8)
Lung 21.1 (19.2, 24.7) 5.3 (4.3, 6.9) 14.5 (13.0, 17.2) 4024 (3659, 4696) 726 (592, 946) 4749 (4251, 5643) 4632 (4212, 5406) 816 (666, 1063) 5447 (4877, 6469)
Lympho-haematopoietic 0.004 (0, 0.014) 0.002 (0, 0.007) 0.003 (0, 0.011) 0 (0, 1) 0 (0, 0) 0 (0, 1) 0 (0, 1) 0 (0, 0) 1 (0, 2)
Melanoma (eye) 2.9 (0.6, 6.6) 0.4 (0.1, 1.0) 1.6 (0.3, 3.6) 1 (0, 3) 0 (0, 0) 1 (0, 3) 6 (1, 13) 1 (0, 2) 6 (1, 16)
Mesothelioma 97.0 (96.0, 98.0)b 82.5 (75.0, 90.0) b 94.9 (93.0, 96.9) b 1699 (1681, 1717) 238 (216, 260) 1937 (1898, 1976) 1699 (1681, 1717)c 238 (216, 260) c 1937 (1898, 1976) c
Multiple Myeloma 0.4 (0, 1.0) 0.1 (0, 0.3) 0.3 (0, 0.7) 5 (0, 10) 1 (0, 2) 6 (0, 12) 8 (0, 18) 2 (0, 3) 10 (0, 21)
Nasopharynx 11.0 (2.3, 47.9) 2.5 (0.6, 6.8) 8.2 (1.8, 34.3) 7 (2, 32) 1 (0, 2) 8 (2, 33) 14 (3, 61) 2 (0, 4) 16 (3, 65)
NHL 2.1 (0, 6.9) 1.1 (0.1, 2.9) 1.7 (0, 5.4) 43 (0, 138) 14 (1, 37) 57 (1, 176) 102 (0, 328) 39 (3, 101) 140 (3, 430)
9
Cancer Site Attributable Fraction (%) (95% Confidence Interval)
Attributable Numbers (95% Confidence Interval)
Deaths (2005) Registrations (2004) Male Female Total (Based
on Deaths) Male Female Total Male Female Total
NMSCd 7.1 (1.3, 15.1) 1.1 (0.0, 2.9) 4.6 (0.8, 10.0) 21 (4, 44) 2 (0, 6) 23 (4, 50) 2576 (481, 5475) 352 (0, 900) 2928 (481, 6375)
Oesophagus 3.3 (1.5, 7.5) 1.1 (0.3, 2.8) 2.5 (1.1, 5.9) 156 (70, 358) 28 (8, 70) 184 (78, 429) 159 (71, 365) 29 (9, 74) 188 (80, 439)
Ovary 0.5 (0, 1.2) 0.5 (0, 1.2) 23 (0, 52) 23 (0, 52) 33 (0, 76) 33 (0, 76)
Pancreas 0.02 (0, 0.07) 0.01 (0, 0.04) 0.01 (0, 0.05) 1 (0, 2) 0 (0, 1) 1 (0, 4) 1 (0, 2) 0 (0, 1) 1 (0, 4)
Sinonasal 46.0 (27.3, 74.0) 20.1 (14.4, 31.6) 34.4 (21.5, 54.8) 29 (17, 47) 10 (8, 16) 39 (25, 63) 101 (60, 162) 32 (23, 50) 133 (83, 212)
STS 3.4 (0, 11.4) 1.1 (0, 3.8) 2.4 (0, 8.1) 11 (0, 36) 3 (0, 9) 13 (0, 45) 22 (0, 75) 4 (0, 15) 27 (0, 90)
Stomach 3.0 (1.5, 5.1) 0.3 (0.1, 0.5) 2.0 (1.0, 3.4) 102 (52, 176) 6 (3, 11) 108 (55, 187) 149 (77, 258) 9 (4, 15) 158 (81, 274)
Thyroid 0.12 0.02 0.05 0 0 0 1 0 1
Total Based on deaths 8.2 (7.2, 9.9) 2.3 (1.7, 3.2) 5.3 (4.6, 6.6) 6362 (5641, 7690) 1657 (1249, 2289) 8019 (6891, 9983)
Total Based on registrations 5.7 (3.9, 8.4) 2.1 (1.4, 3.2) 4.0 (2.7, 5.9) 10063 (6941 14822) 3616 (2370, 5413) 13679 (9310, 20235)
Total cancers in GB in ages 15+ 77912 72212 150124 175399 168184 343583
NHL = Non-Hodgkin’s lymphoma; NMSC = non-melanoma skin cancer; STS = soft tissue sarcoma a AF applicable to all leukaemias b Includes cases described as due to paraoccupational or environmental exposure to asbestos. c Taken as equal to attributable deaths for this short survival cancer. d Based on registrations Totals do not always sum across rows due to rounding error Confidence Intervals not estimated for cancers attributed to ionizing radiation, as they are not yet available for the excess relative risk models used (UNSCEAR 2006)
10

Table 1B Estimated attributable fractions, deaths and registrations by cancer site in 2005 (deaths) and 2004 (registrations) for agents and occupations classified as IARC group 1 with ‘strong’ evidence of carcinogenicity in humans
Cancer Site Attributable Fraction (%) (95% Confidence Interval)
Attributable Numbers (95% Confidence Interval)
Deaths (2005) Registrations (2004) Male Female Total (Based
on Deaths) Male Female Total Male Female Total
Bladder 0.8 (0.7,3.0) 0.6 (0.5,2.9) 0.7 (0.6,2.8) 24 (20, 91) 10 (9, 39) 34 (29, 130) 55 (47, 211) 18 (16, 70) 73 (63, 280)
Bone 0 0 0 0 0 0 0 0 0
Brain 0 0 0 0 0 0 0 0 0
Breast 0 0 0 0 0 0
Cervix 0 0 0 0 0 0 0 0 0
Kidney 0 0 0 0 0 0 0 0 0
Larynx 2.3 (0.8,5.1) 1.5 (0.5, 3.4) 2.1 (0.8, 4.8) 14 (5, 31) 2 (1, 5) 16 (6, 37) 40 (15, 89) 6 (2, 12) 46 (17, 102) Leukaemia a 0.1 (0, 2.0) 0.2 (0.1, 3.9) 0.2 (0, 2.6) 3 (0, 40) 2 (0, 36) 5 (1, 75) 5 (1, 70) 4 (0, 55) 8 (1, 124) Liver 0.2 (0.1,0.3) 0.1 (0, 0.1) 0.1 (0.1, 0.2) 2 (1, 4) 1 (0, 2) 3 (1, 6 ) 2 (1, 4) 1 (0, 2) 3 (2, 6)
Lung 17.6 (15.5, 19.4) 4.4 (3.5, 5.4) 12.0 (10.2, 13.9) 3347 (2945,3687) 599 (527,660) 3946 (3472,4346) 3853 (3390,4244) 673 (592, 741) 4526 (3982, 4985)
Lympho-haematopoietic 0 0 0 0 0 0 0 0 0
Melanoma (eye) 0 0 0 0 0 0 0 0 0
Mesothelioma 97.0 (96.0, 98.0)b 82.5 (75.0, 90.0) b 94.9 (93.0, 96.9)
b 1699 (1681, 1717) 238 (216, 260) 1937 (1898, 1976) 1699 (1681, 1717)c 238 (216, 260) c 1937 (1898, 1976) c
Multiple Myeloma 0 0 0 0 0 0 0 0 0
Nasopharynx 0 0 0 0 0 0 0 0 0
NHL 0 0 0 0 0 0 0 0 0
11

Cancer Site Attributable Fraction (%) (95% Confidence Interval)
Attributable Numbers (95% Confidence Interval)
Deaths (2005) Registrations (2004) Male Female Total (Based
on Deaths) Male Female Total Male Female Total
NMSCd 7.1 (1.3, 15.1) 1.1 (0.0, 2.9) 4.6 (0.8, 10.0) 21 (4, 44) 2 (0, 6) 23 (4, 50) 2576 (481, 5475) 352 (0, 900) 2928 (481, 6375)
Oesophagus 0 0 0 0 0 0 0 0 0
Ovary 0 0 0 0 0 0 0 0 0
Pancreas 0 0 0 0 0 0 0 0 0
Sinonasal 21.1 (11.8, 34.7) 13.6 (8.2, 22.5) 17.7 (10.2, 29.2) 13 (7, 22) 7 (4, 12) 20 (11, 34) 46 (26, 76) 22 (12, 36) 68 (38, 112)
STS 0 0 0 0 0 0 0 0 0
Stomach 0 0 0 0 0 0 0 0 0
Thyroid 0.12 0.02 0.05 0 0 0 1 0 1
Total Based on deaths 6.6 (6.0, 7.2) 1.2 (1.0, 1.4) 4.0 (3.6, 4.4) 5123 (4665, 5635) 862 (758, 1019) 5986 (5415, 6612)
Total Based on registrations 4.7 (3.2, 6.8) 2.0 (1.3, 2.8) 3.4 (2.3, 4.8) 8277 (5642, 11886) 1313 (839, 2075) 9590 (6482, 13962)
Total cancers in GB in ages 15+ 77912 72212 150124 175399 168184 343583
NHL = Non-Hodgkin’s lymphoma; NMSC = non-melanoma skin cancer; STS = soft tissue sarcoma a AF applicable to all leukaemias b Includes cases described as due to paraoccupational or environmental exposure to asbestos. c Taken as equal to attributable deaths for this short survival cancer. d Based on registrations. Totals do not always sum across rows due to rounding error Confidence Intervals not estimated for cancers attributed to ionizing radiation, as they are not yet available for the excess relative risk models used (UNSCEAR 2006)
12
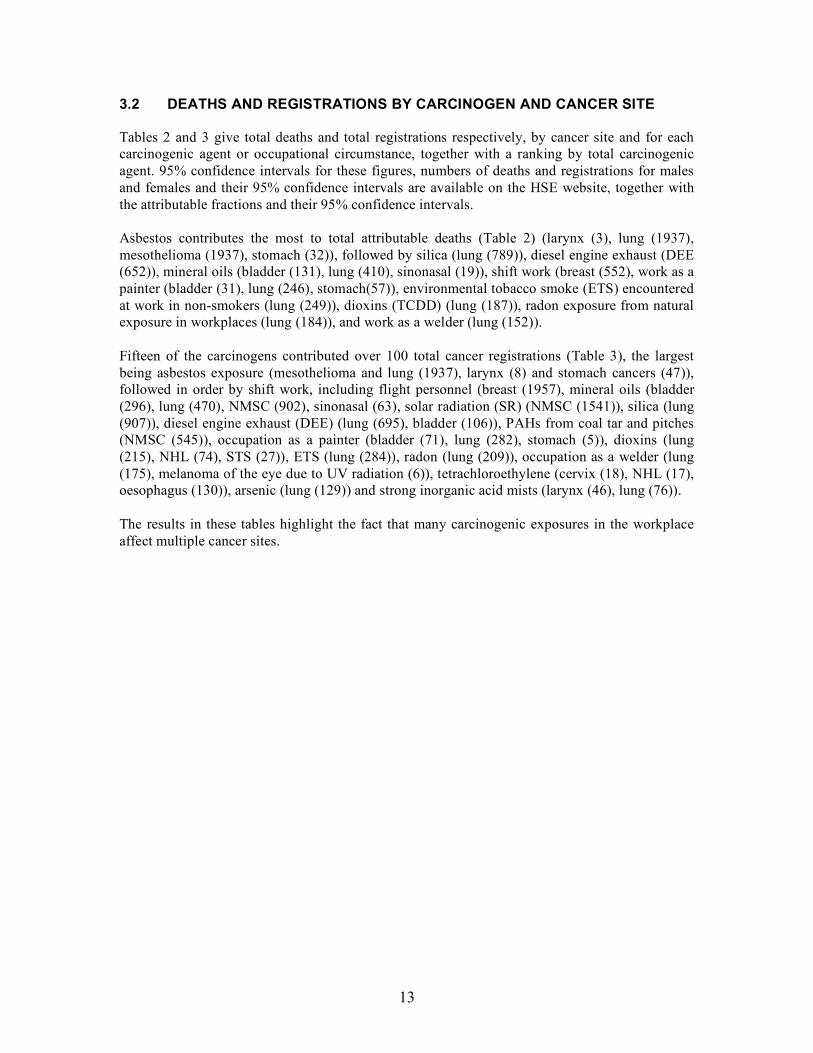
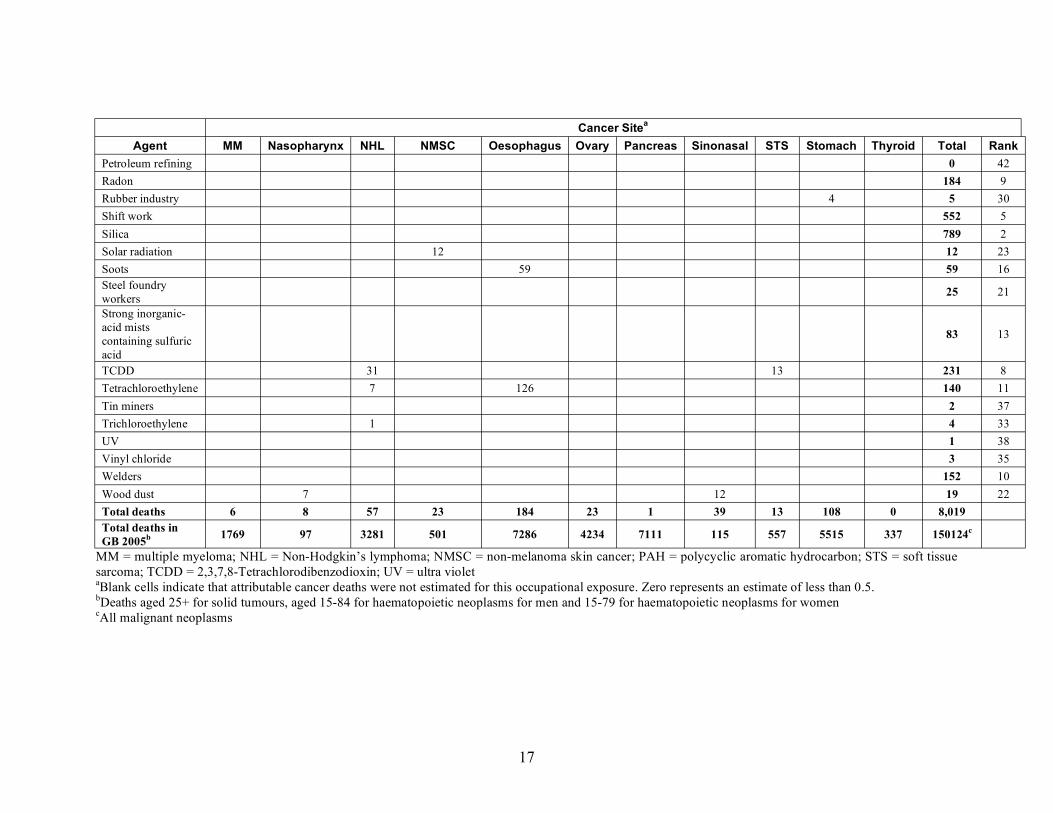
3.2 DEATHS AND REGISTRATIONS BY CARCINOGEN AND CANCER SITE
Tables 2 and 3 give total deaths and total registrations respectively, by cancer site and for each carcinogenic agent or occupational circumstance, together with a ranking by total carcinogenic agent. 95% confidence intervals for these figures, numbers of deaths and registrations for males and females and their 95% confidence intervals are available on the HSE website, together with the attributable fractions and their 95% confidence intervals.
Asbestos contributes the most to total attributable deaths (Table 2) (larynx (3), lung (1937), mesothelioma (1937), stomach (32)), followed by silica (lung (789)), diesel engine exhaust (DEE (652)), mineral oils (bladder (131), lung (410), sinonasal (19)), shift work (breast (552), work as a painter (bladder (31), lung (246), stomach(57)), environmental tobacco smoke (ETS) encountered at work in non-smokers (lung (249)), dioxins (TCDD) (lung (187)), radon exposure from natural exposure in workplaces (lung (184)), and work as a welder (lung (152)).
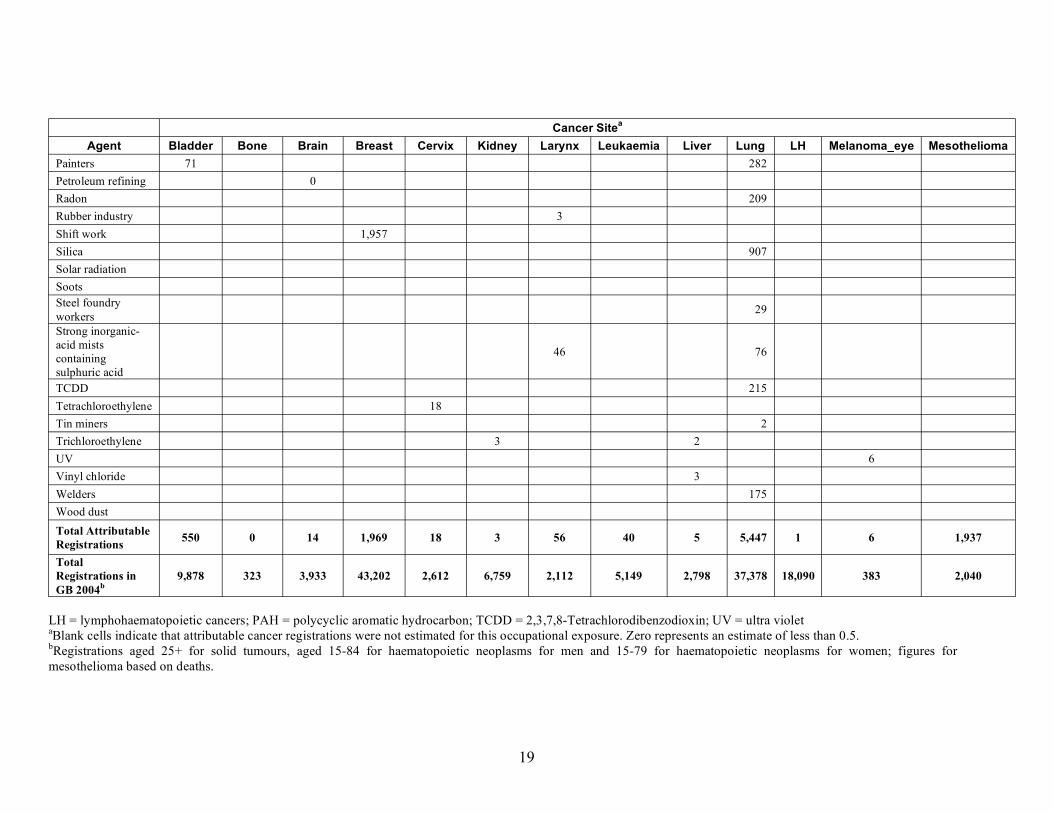
Fifteen of the carcinogens contributed over 100 total cancer registrations (Table 3), the largest being asbestos exposure (mesothelioma and lung (1937), larynx (8) and stomach cancers (47)), followed in order by shift work, including flight personnel (breast (1957), mineral oils (bladder (296), lung (470), NMSC (902), sinonasal (63), solar radiation (SR) (NMSC (1541)), silica (lung (907)), diesel engine exhaust (DEE) (lung (695), bladder (106)), PAHs from coal tar and pitches (NMSC (545)), occupation as a painter (bladder (71), lung (282), stomach (5)), dioxins (lung (215), NHL (74), STS (27)), ETS (lung (284)), radon (lung (209)), occupation as a welder (lung (175), melanoma of the eye due to UV radiation (6)), tetrachloroethylene (cervix (18), NHL (17), oesophagus (130)), arsenic (lung (129)) and strong inorganic acid mists (larynx (46), lung (76)).
The results in these tables highlight the fact that many carcinogenic exposures in the workplace affect multiple cancer sites.
13
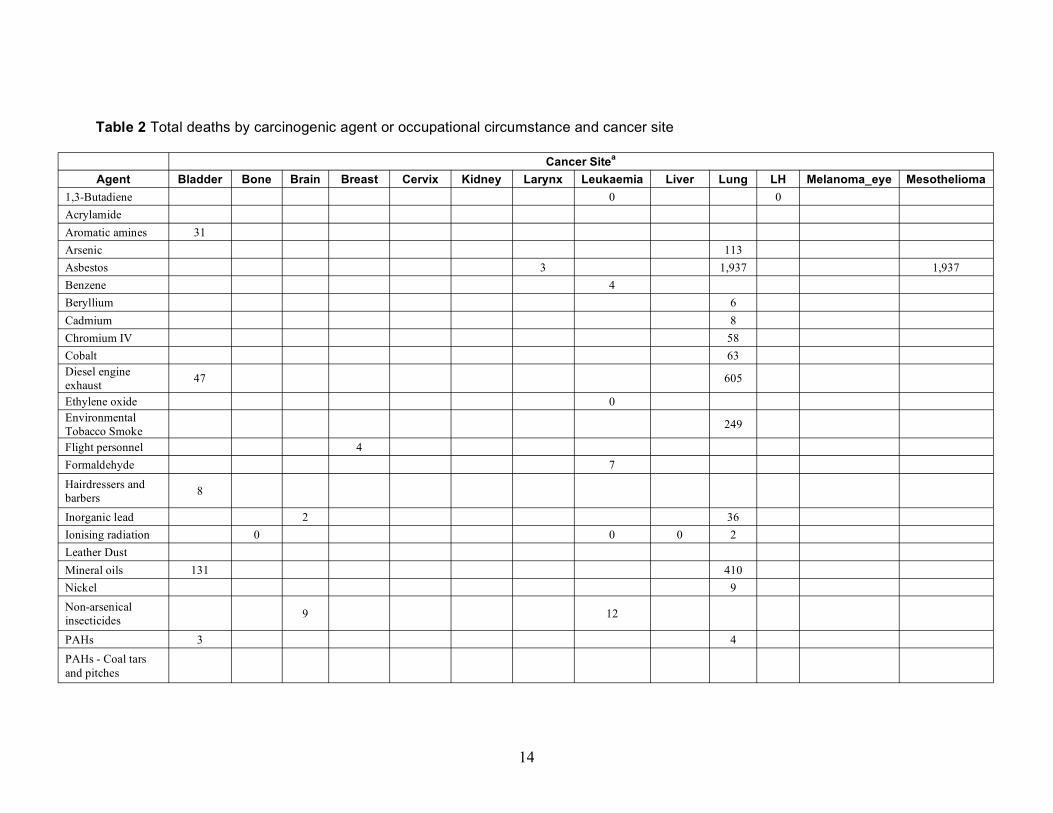
Table 2 Total deaths by carcinogenic agent or occupational circumstance and cancer site
Cancer Sitea
Agent Bladder Bone Brain Breast Cervix Kidney Larynx Leukaemia Liver Lung LH Melanoma_eye Mesothelioma 1,3-Butadiene 0 0 Acrylamide Aromatic amines 31 Arsenic 113 Asbestos 3 1,937 1,937 Benzene 4 Beryllium 6 Cadmium 8 Chromium IV 58 Cobalt 63 Diesel engine exhaust 47 605
Ethylene oxide 0 Environmental Tobacco Smoke 249
Flight personnel 4 Formaldehyde 7
Hairdressers and barbers 8
Inorganic lead 2 36 Ionising radiation 0 0 0 2 Leather Dust Mineral oils 131 410 Nickel 9 Non-arsenical insecticides 9 12
PAHs 3 4 PAHs - Coal tars and pitches
14

Cancer Sitea
Agent Bladder Bone Brain Breast Cervix Kidney Larynx Leukaemia Liver Lung LH Melanoma_eye Mesothelioma Painters 31 246 Petroleum refining 0 Radon 184 Rubber industry 1 Shift work 552 Silica 789 Solar radiation Soots Steel foundry workers 25
Strong inorganic-acid mists containing sulfuric acid
16 67
TCDD (dioxins) 187 Tetrachloroethylene 7 Tin miners 2 Trichloroethylene 1 2 UV 1 Vinyl chloride 3 Welders 152 Wood dust Total deaths 245 0 11 555 7 1 20 24 5 4,749 0 1 1,937 Total deaths in GB 2005b 4642 233 3215 12182 1036 3499 766 3102 2794 32,798 8479 83 2040
NHL= non-Hodgkin’s lymphoma; PAH = polycyclic aromatic hydrocarbon; TCDD = 2,3,7,8-Tetrachlorodibenzodioxin; UV = ultra violet aBlank cells indicate that attributable cancer deaths were not estimated for this occupational exposure. Zero represents an estimate of less than 0.5. bDeaths aged 25+ for solid tumours, aged 15-84 for haematopoietic neoplasms for men and 15-79 for haematopoietic neoplasms for women
15
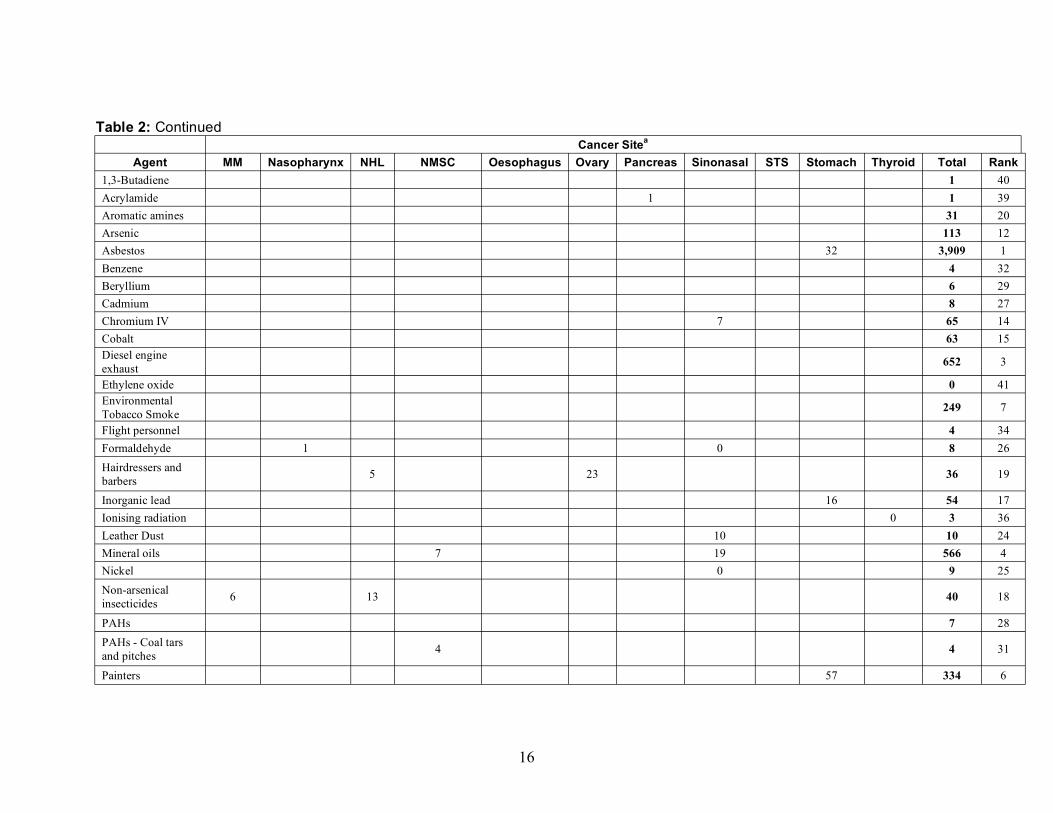
Table 2: Continued Cancer Sitea
Agent MM Nasopharynx NHL NMSC Oesophagus Ovary Pancreas Sinonasal STS Stomach Thyroid Total Rank 1,3-Butadiene 1 40 Acrylamide 1 1 39 Aromatic amines 31 20 Arsenic 113 12 Asbestos 32 3,909 1 Benzene 4 32 Beryllium 6 29 Cadmium 8 27 Chromium IV 7 65 14 Cobalt 63 15 Diesel engine exhaust 652 3
Ethylene oxide 0 41 Environmental Tobacco Smoke 249 7
Flight personnel 4 34 Formaldehyde 1 0 8 26 Hairdressers and barbers 5 23 36 19
Inorganic lead 16 54 17 Ionising radiation 0 3 36 Leather Dust 10 10 24 Mineral oils 7 19 566 4 Nickel 0 9 25 Non-arsenical insecticides 6 13 40 18
PAHs 7 28 PAHs - Coal tars and pitches 4 4 31
Painters 57 334 6
16
Cancer Sitea
Agent MM Nasopharynx NHL NMSC Oesophagus Ovary Pancreas Sinonasal STS Stomach Thyroid Total Rank Petroleum refining 0 42 Radon 184 9 Rubber industry 4 5 30 Shift work 552 5 Silica 789 2 Solar radiation 12 12 23 Soots 59 59 16 Steel foundry workers 25 21
Strong inorganic-acid mists containing sulfuric 83 13
acid TCDD 31 13 231 8 Tetrachloroethylene 7 126 140 11 Tin miners 2 37 Trichloroethylene 1 4 33 UV 1 38 Vinyl chloride 3 35 Welders 152 10 Wood dust 7 12 19 22 Total deaths 6 8 57 23 184 23 1 39 13 108 0 8,019 Total deaths in GB 2005b 1769 97 3281 501 7286 4234 7111 115 557 5515 337 150124c
MM = multiple myeloma; NHL = Non-Hodgkin’s lymphoma; NMSC = non-melanoma skin cancer; PAH = polycyclic aromatic hydrocarbon; STS = soft tissue sarcoma; TCDD = 2,3,7,8-Tetrachlorodibenzodioxin; UV = ultra violet aBlank cells indicate that attributable cancer deaths were not estimated for this occupational exposure. Zero represents an estimate of less than 0.5. bDeaths aged 25+ for solid tumours, aged 15-84 for haematopoietic neoplasms for men and 15-79 for haematopoietic neoplasms for women cAll malignant neoplasms
17
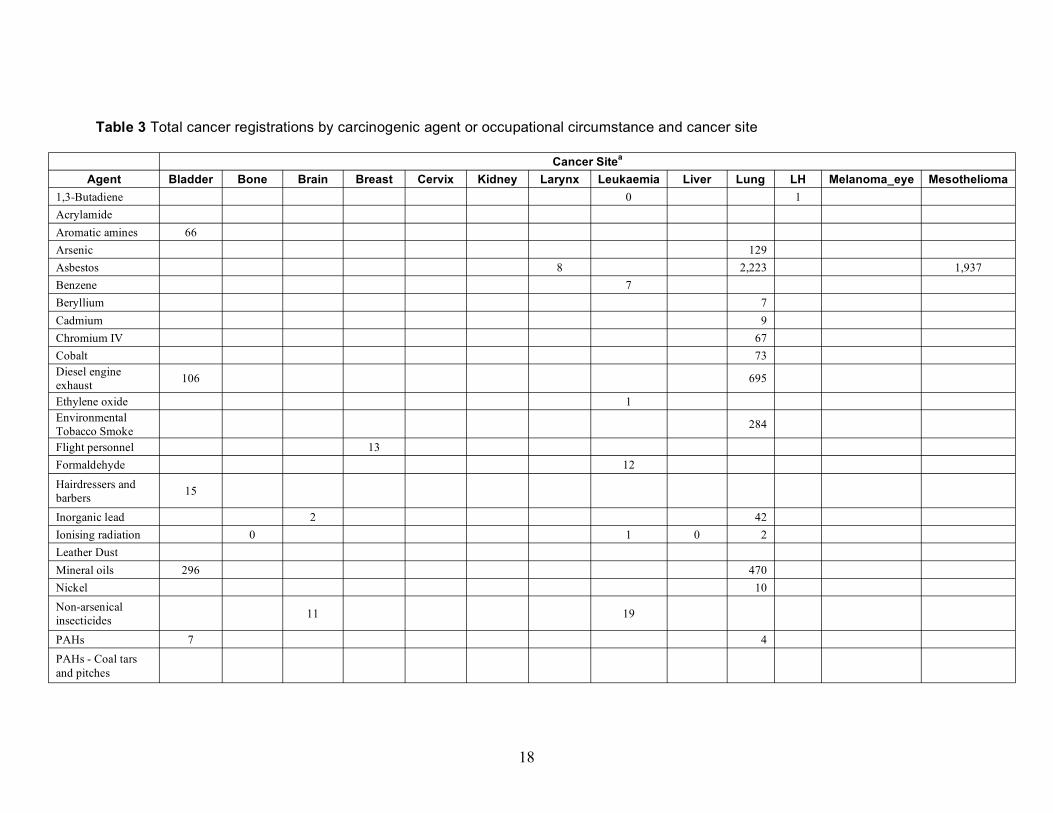
Table 3 Total cancer registrations by carcinogenic agent or occupational circumstance and cancer site
Cancer Sitea
Agent Bladder Bone Brain Breast Cervix Kidney Larynx Leukaemia Liver Lung LH Melanoma_eye Mesothelioma 1,3-Butadiene 0 1 Acrylamide Aromatic amines 66 Arsenic 129 Asbestos 8 2,223 1,937 Benzene 7 Beryllium 7 Cadmium 9 Chromium IV 67 Cobalt 73 Diesel engine exhaust 106 695
Ethylene oxide 1 Environmental Tobacco Smoke 284
Flight personnel 13 Formaldehyde 12
Hairdressers and barbers 15
Inorganic lead 2 42 Ionising radiation 0 1 0 2 Leather Dust Mineral oils 296 470 Nickel 10 Non-arsenical insecticides 11 19
PAHs 7 4 PAHs - Coal tars and pitches
18
Cancer Sitea
Agent Bladder Bone Brain Breast Cervix Kidney Larynx Leukaemia Liver Lung LH Melanoma_eye Mesothelioma Painters 71 282 Petroleum refining 0 Radon 209 Rubber industry 3 Shift work 1,957 Silica 907 Solar radiation Soots Steel foundry workers 29
Strong inorganic-acid mists containing sulphuric acid
46 76
TCDD 215 Tetrachloroethylene 18 Tin miners 2 Trichloroethylene 3 2 UV 6 Vinyl chloride 3 Welders 175 Wood dust Total Attributable Registrations 550 0 14 1,969 18 3 56 40 5 5,447 1 6 1,937
Total Registrations in GB 2004b
9,878 323 3,933 43,202 2,612 6,759 2,112 5,149 2,798 37,378 18,090 383 2,040
LH = lymphohaematopoietic cancers; PAH = polycyclic aromatic hydrocarbon; TCDD = 2,3,7,8-Tetrachlorodibenzodioxin; UV = ultra violet aBlank cells indicate that attributable cancer registrations were not estimated for this occupational exposure. Zero represents an estimate of less than 0.5. bRegistrations aged 25+ for solid tumours, aged 15-84 for haematopoietic neoplasms for men and 15-79 for haematopoietic neoplasms for women; figures for mesothelioma based on deaths.
19
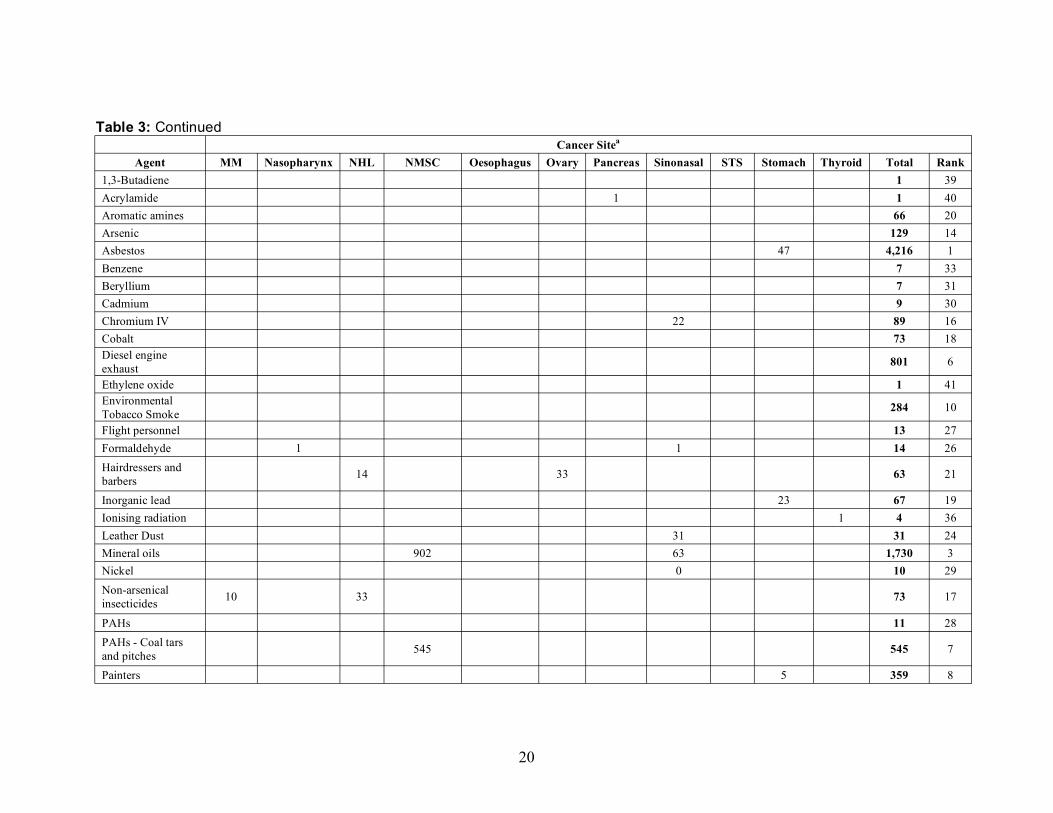
Table 3: Continued Cancer Sitea
Agent MM Nasopharynx NHL NMSC Oesophagus Ovary Pancreas Sinonasal STS Stomach Thyroid Total Rank 1,3-Butadiene 1 39 Acrylamide 1 1 40 Aromatic amines 66 20 Arsenic 129 14 Asbestos 47 4,216 1 Benzene 7 33 Beryllium 7 31 Cadmium 9 30 Chromium IV 22 89 16 Cobalt 73 18 Diesel engine exhaust 801 6
Ethylene oxide 1 41 Environmental Tobacco Smoke 284 10
Flight personnel 13 27 Formaldehyde 1 1 14 26 Hairdressers and barbers 14 33 63 21
Inorganic lead 23 67 19 Ionising radiation 1 4 36 Leather Dust 31 31 24 Mineral oils 902 63 1,730 3 Nickel 0 10 29 Non-arsenical insecticides 10 33 73 17
PAHs 11 28 PAHs - Coal tars and pitches 545 545 7
Painters 5 359 8
20

Cancer Sitea
Agent MM Nasopharynx NHL NMSC Oesophagus Ovary Pancreas Sinonasal STS Stomach Thyroid Total Rank Petroleum refining 0 42 Radon 209 11 Rubber industry 1 4 35 Shift work 1,957 2 Silica 907 5 Solar radiation 1,541 1,541 4 Soots 60 60 22 Steel foundry workers 29 25
Strong inorganic-acid mists containing sulphuric acid
122 15
TCDD 74 27 316 9 Tetrachloroethylene 17 130 164 13 Tin miners 2 38 Trichloroethylene 3 7 32 UV 6 34 Vinyl chloride 3 37 Welders 175 12 Wood dust 14 39 54 23 Total Attributable Registrations 10 16 140 2,928 188 33 1 133 27 158 1 13,679
Total Registrations in GB 2004b
3,006 189 8,236 67,220 7,498 6,197 7,246 378 1,063 7,970 1,519 339156c
MM = multiple myeloma; NHL = Non-Hodgkin’s lymphoma; NMSC = non-melanoma skin cancer; PAH = polycyclic aromatic hydrocarbon; STS = soft tissue sarcoma; TCDD = 2,3,7,8-Tetrachlorodibenzodioxin; UV = ultra violet aBlank cells indicate that attributable cancer registrations were not estimated for this occupational exposure. Zero represents an estimate of less than 0.5. bRegistrations aged 25+ for solid tumours, aged 15-84 for haematopoietic neoplasms for men and 15-79 for haematopoietic neoplasms for women; figures for mesothelioma based on deaths. cAll malignant neoplasms
21
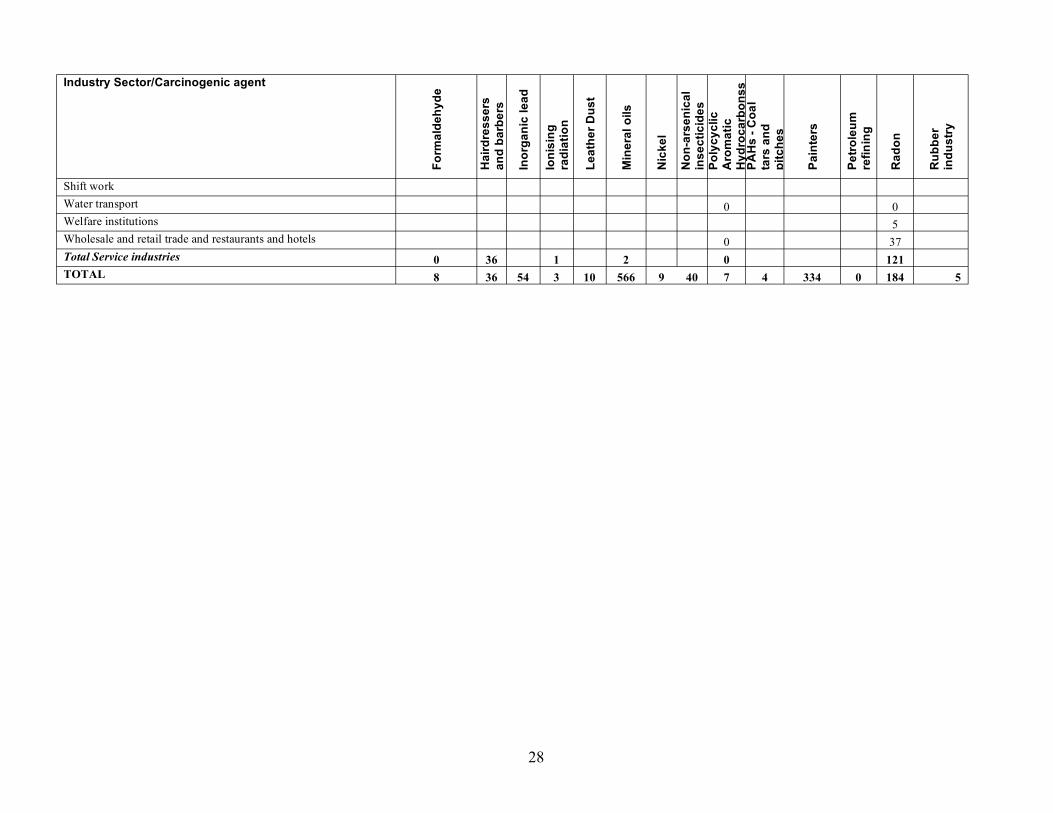
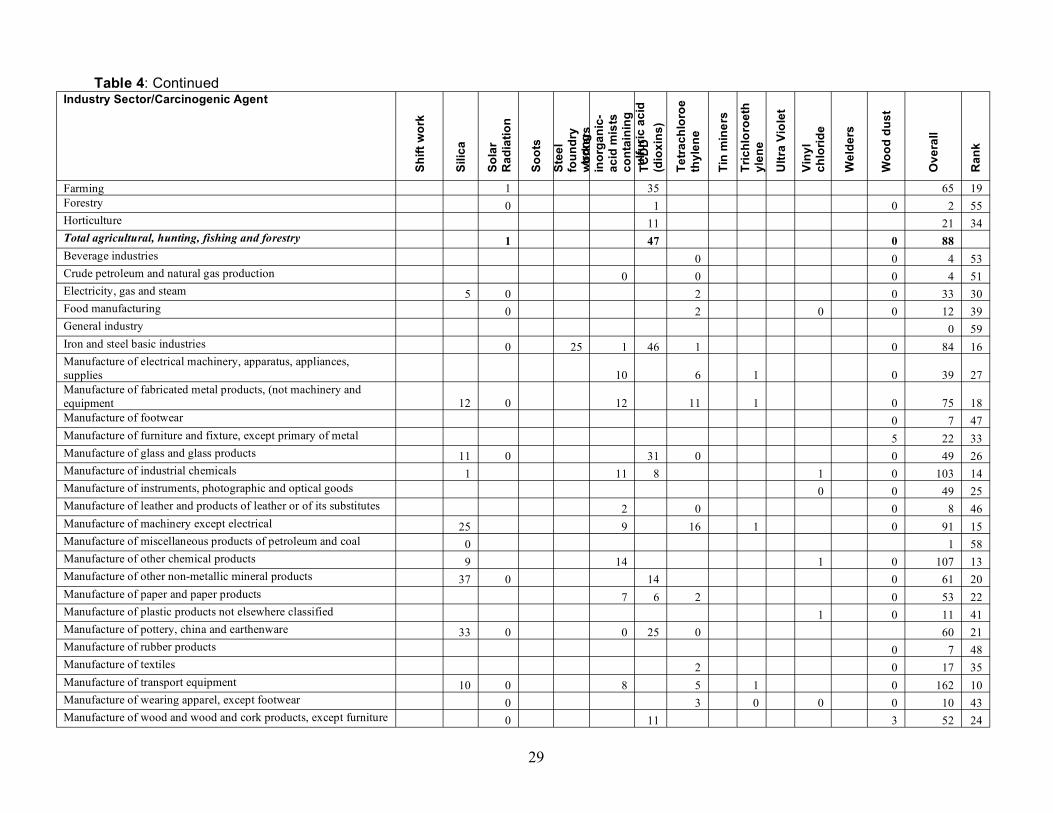
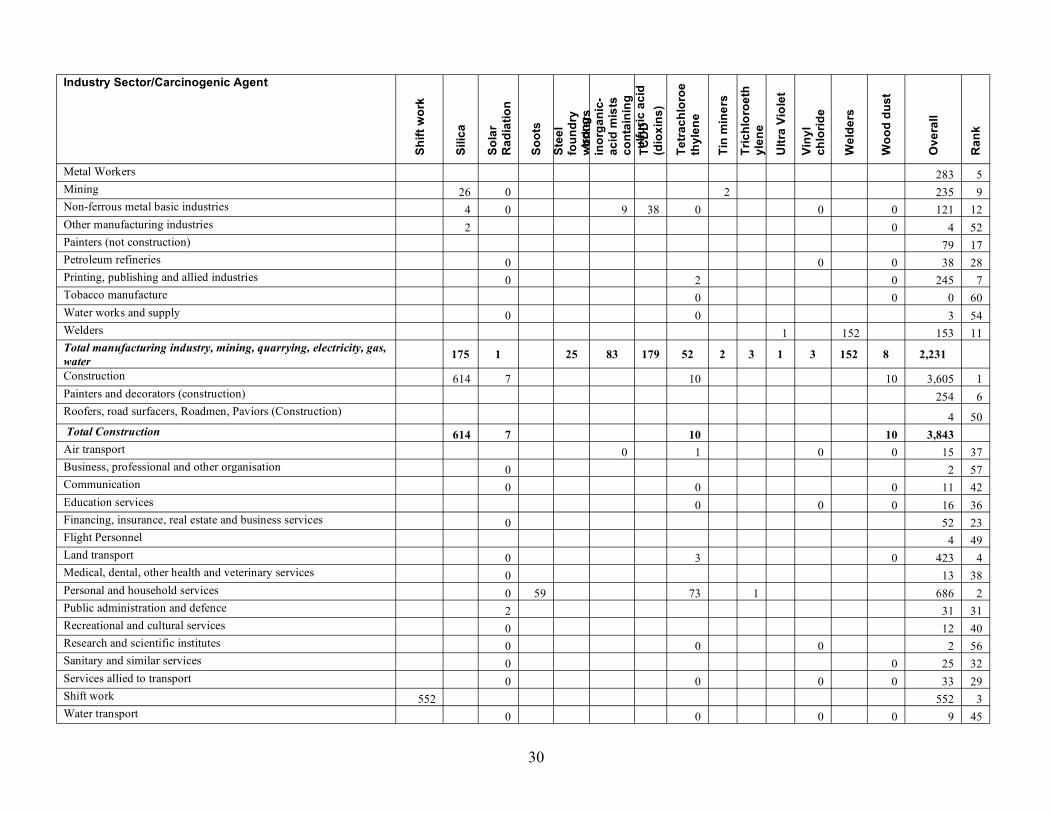
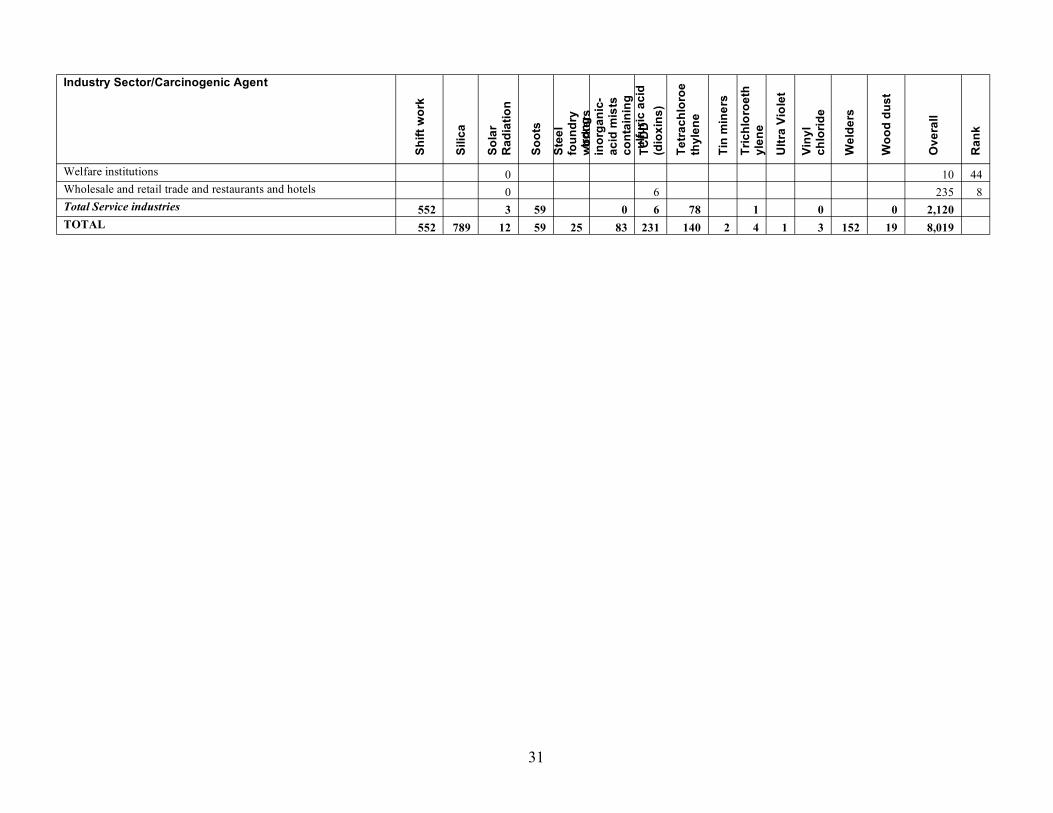
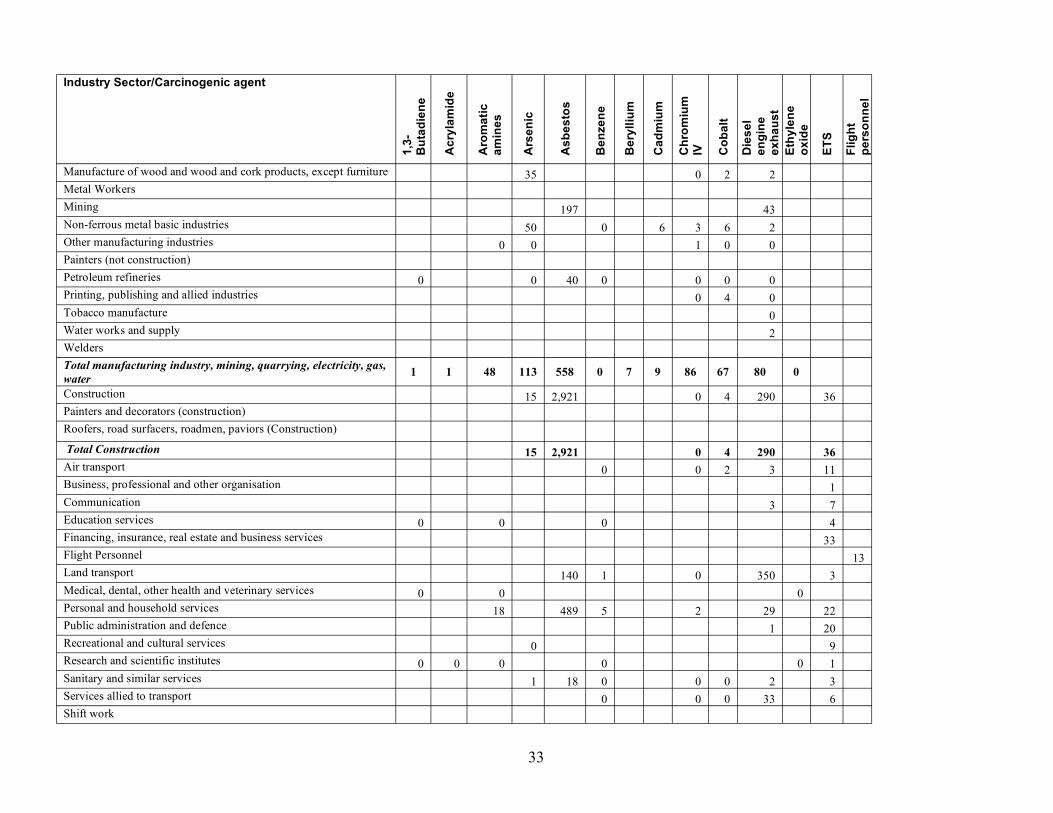
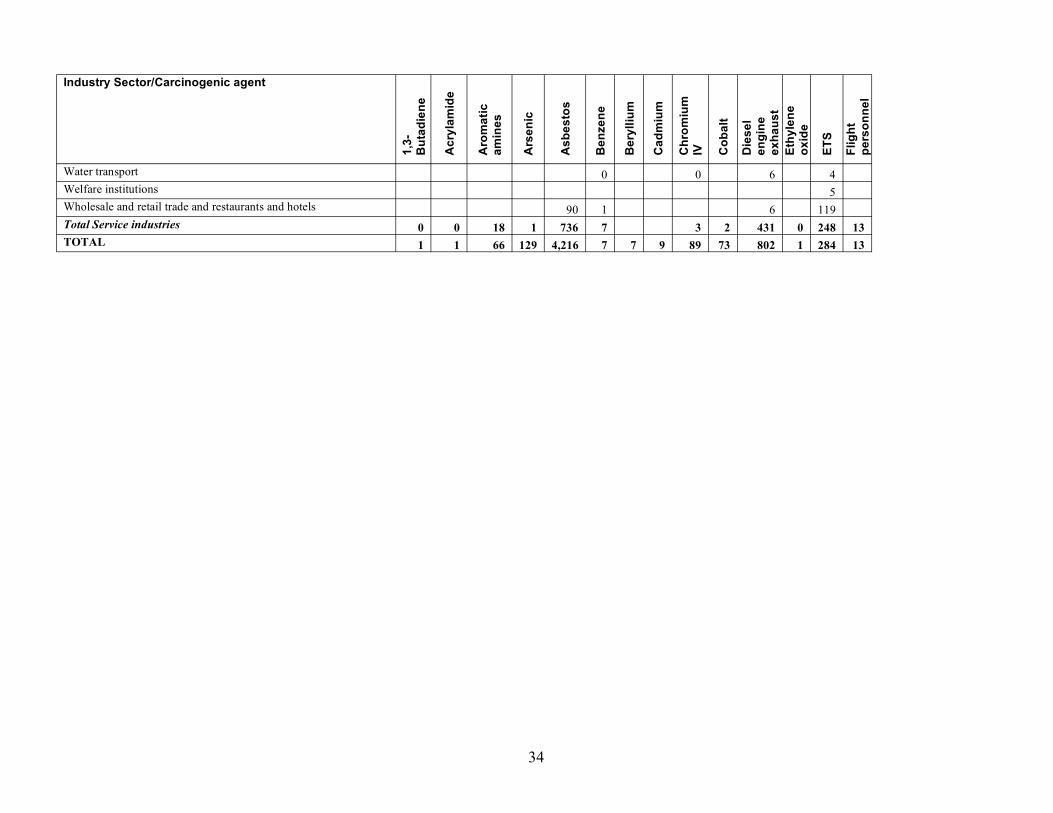
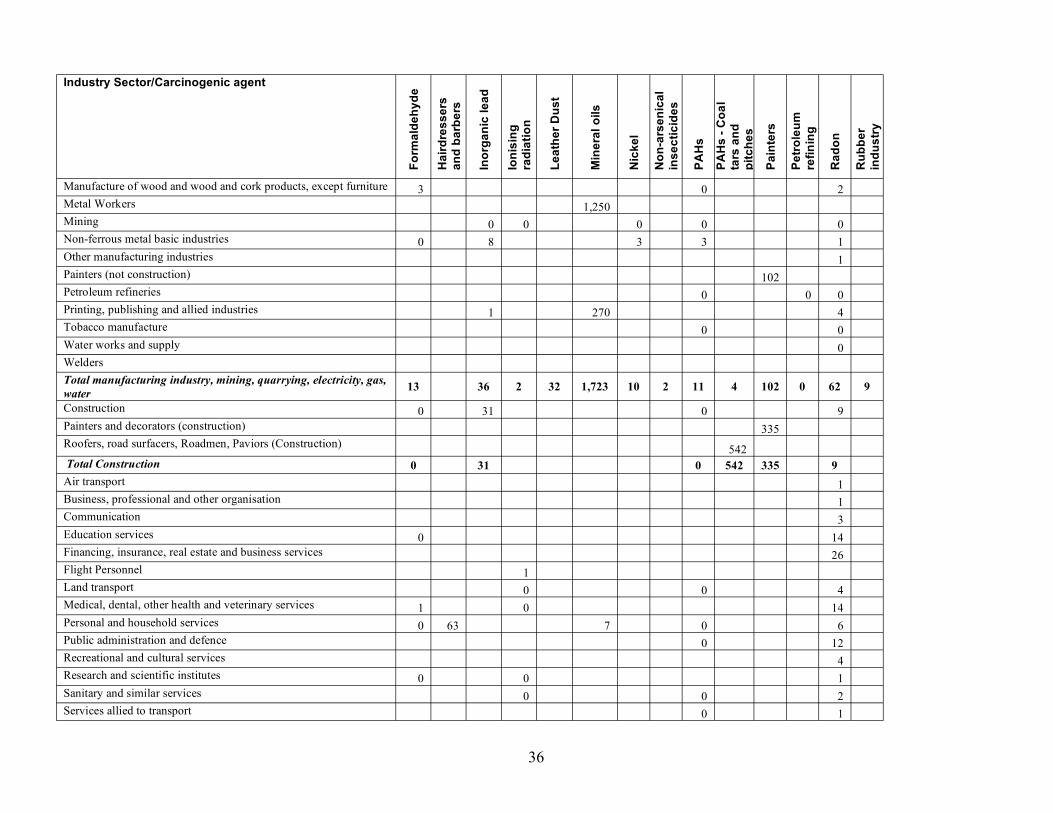
3.3 DEATHS AND REGISTRATIONS BY INDUSTRY SECTOR ANDCARCINOGENIC AGENT OR OCCUPATIONAL CIRCUMSTANCE
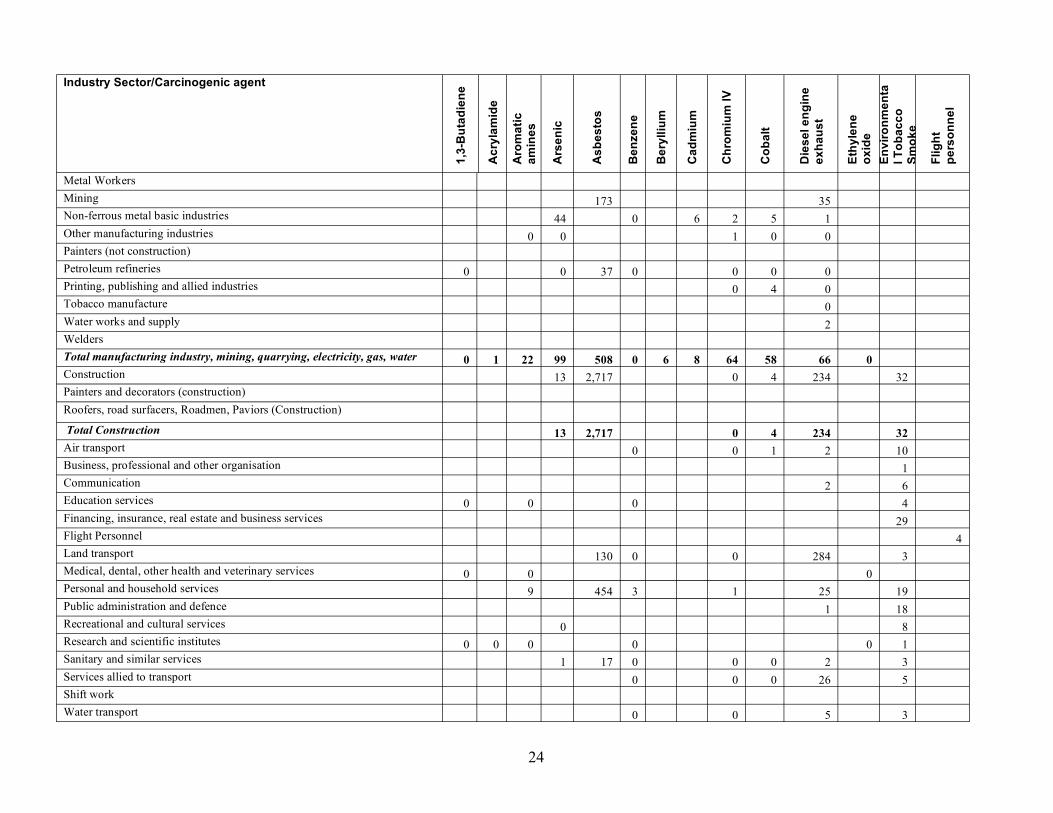
Tables 4 and 5 give total deaths and total registrations respectively, by industry sector and for each carcinogenic agent or occupational circumstance; a rank based on the total over all carcinogenic agents is given for industry sector. Numbers of deaths and registrations for males, females and the total are available on the HSE website, together with the respective attributable fractions.
The top ten industry sectors contributing to the total burden differs between deaths and registrations, being for deaths: construction, personal and household services (this sector includes repair trades, laundries and dry cleaning, domestic services, hairdressing and beauty), shift work, land transport, metal workers, painters and decorators in the construction industry, printing and publishing, wholesale and retail trades, mining, and manufacture of transport equipment; and for registrations: construction, shift work, metal work, personal and household services, roofers and road repairs, land transport, painters and decorators in the construction industry, mining, printing and publishing, and public administration and defence. The difference occurs because of the increased numbers of cancer registrations compared to deaths for longer survival cancers such as breast and NMSC.
Twenty one industry sectors have 100 or more total attributable registrations (Table 5). As can be seen from examination of the columns in both tables 4 and 5, the majority of industry sectors involve exposure to several carcinogens (many over 10) with construction and many of the manufacturing sectors involving potential exposure to between 15 and 20 carcinogens. In addition, the potential occurrence of several exposures in what might be thought as less traditionally exposed sectors e.g. dry cleaning, hairdressing and beauty is highlighted. There are several key exposures which give rise to substantial numbers of registrations across multiple industry sectors. Of note is the contribution of exposure to (i) asbestos, DEE, silica and solar radiation in the construction industry; (ii) asbestos, DEE, ETS (non-smokers), soots and tetrachloroethylene in personal and household services; (iii) asbestos and DEE in land transport (railway, road, pipeline); (iv) asbestos, DEE, silica and solar radiation in mining; (v) ETS (non-smokers) and solar radiation in public administration and defence; (vi) asbestos, ETS (non-smokers) and radon in the wholesale and retail trade, restaurants and hotels and (vii) dioxins, non-arsenical insecticides and solar radiation in farming.
22

Table 4 Total cancer deaths by industry sector and carcinogenic agent or occupational circumstance
Industry Sector/Carcinogenic agent
1,3-
But
adie
ne
Acr
ylam
ide
Aro
mat
ic
amin
es
Ars
enic
Asb
esto
s
Ben
zene
Ber
ylliu
m
Cad
miu
m
Chr
omiu
m IV
Cob
alt
Die
sel e
ngin
e ex
haus
t
Ethy
lene
ox
ide
Envi
ronm
enta
l T
obac
co
Smok
e
Flig
ht
pers
onne
l
Farming Forestry Horticulture Total agricultural, hunting, fishing and forestry Beverage industries 0 0 0 2 Crude petroleum and natural gas production 0 0 0 4 0 Electricity, gas and steam 1 19 0 0 0 2 Food manufacturing 0 3 2 0 General industry Iron and steel basic industries 7 0 0 0 Manufacture of electrical machinery, apparatus, appliances, supplies 5 0 1 0 1 1 Manufacture of fabricated metal products, (not machinery and equipment 0 20 9 2 Manufacture of footwear 0 Manufacture of furniture and fixture, except primary of metal 7 0 7 0 Manufacture of glass and glass products 6 0 0 1 0 Manufacture of industrial chemicals 0 1 0 3 63 0 1 3 5 1 Manufacture of instruments, photographic and optical goods 0 0 2 0 Manufacture of leather and products of leather or of its substitutes 3 0 0 Manufacture of machinery except electrical 5 22 5 2 Manufacture of miscellaneous products of petroleum and coal 0 0 Manufacture of other chemical products 0 0 0 68 0 2 9 1 0 Manufacture of other non-metallic mineral products 1 0 0 6 Manufacture of paper and paper products 0 36 0 1 1 Manufacture of plastic products not elsewhere classified 0 0 0 0 1 0 Manufacture of pottery, china and earthenware 0 1 Manufacture of rubber products 0 0 0 0 0 Manufacture of textiles 11 0 0 1 Manufacture of transport equipment 0 113 0 14 3 1 Manufacture of wearing apparel, except footwear 0 1 1 Manufacture of wood and wood and cork products, except furniture 31 0 2 2
23
Industry Sector/Carcinogenic agent
1,3-
But
adie
ne
Acr
ylam
ide
Aro
mat
ic
amin
es
Ars
enic
Asb
esto
s
Ben
zene
Ber
ylliu
m
Cad
miu
m
Chr
omiu
m IV
Cob
alt
Die
sel e
ngin
e ex
haus
t
Ethy
lene
ox
ide
Envi
ronm
enta
l T
obac
co
Smok
e
Flig
ht
pers
onne
l
Metal Workers Mining 173 35 Non-ferrous metal basic industries 44 0 6 2 5 1 Other manufacturing industries 0 0 1 0 0 Painters (not construction) Petroleum refineries 0 0 37 0 0 0 0 Printing, publishing and allied industries 0 4 0 Tobacco manufacture 0 Water works and supply 2 Welders Total manufacturing industry, mining, quarrying, electricity, gas, water 0 1 22 99 508 0 6 8 64 58 66 0 Construction 13 2,717 0 4 234 32 Painters and decorators (construction) Roofers, road surfacers, Roadmen, Paviors (Construction)
Total Construction 13 2,717 0 4 234 32 Air transport 0 0 1 2 10 Business, professional and other organisation 1 Communication 2 6 Education services 0 0 0 4 Financing, insurance, real estate and business services 29 Flight Personnel 4 Land transport 130 0 0 284 3 Medical, dental, other health and veterinary services 0 0 0 Personal and household services 9 454 3 1 25 19 Public administration and defence 1 18 Recreational and cultural services 0 8 Research and scientific institutes 0 0 0 0 0 1 Sanitary and similar services 1 17 0 0 0 2 3 Services allied to transport 0 0 0 26 5 Shift work Water transport 0 0 5 3
24

Industry Sector/Carcinogenic agent
1,3-
But
adie
ne
Acr
ylam
ide
Aro
mat
ic
amin
es
Ars
enic
Asb
esto
s
Ben
zene
Ber
ylliu
m
Cad
miu
m
Chr
omiu
m IV
Cob
alt
Die
sel e
ngin
e ex
haus
t
Ethy
lene
ox
ide
Envi
ronm
enta
l T
obac
co
Smok
e
Flig
ht
pers
onne
l
Welfare institutions 5 Wholesale and retail trade and restaurants and hotels 83 1 5 104 Total Service industries 0 0 9 1 684 4 1 2 352 0 218 4 TOTAL 1 1 31 113 3,909 4 6 8 65 63 652 0 249 4
25
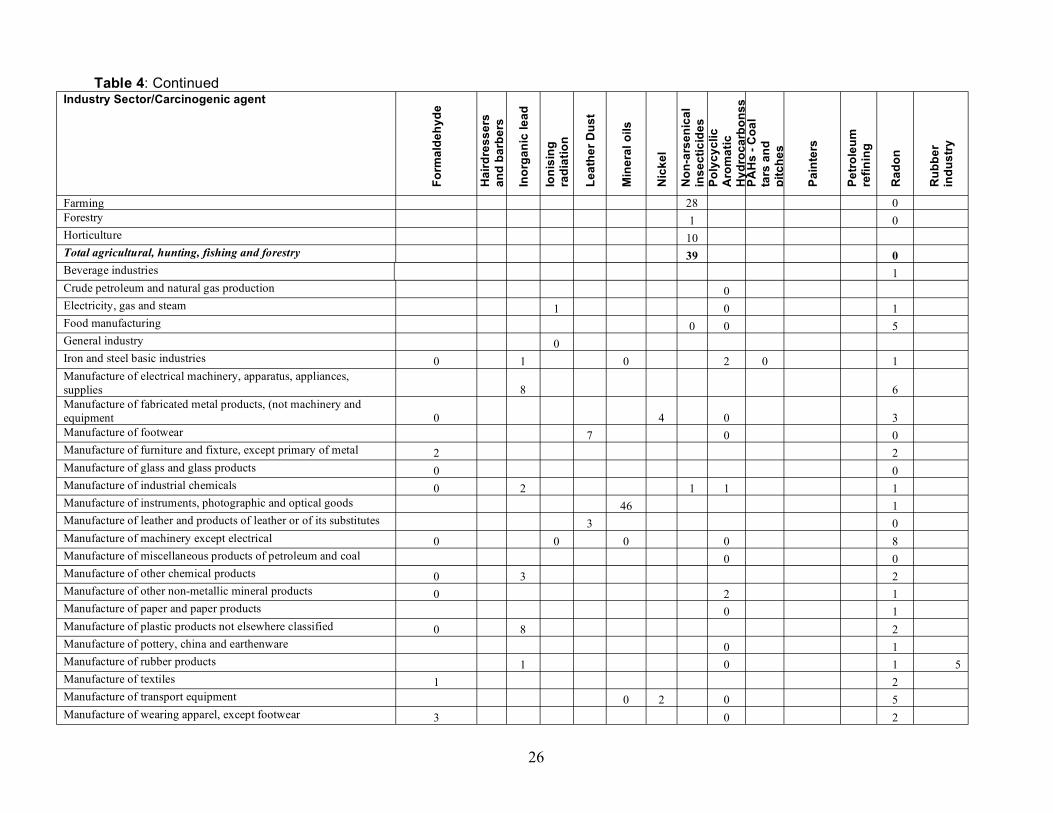
Table 4: Continued Industry Sector/Carcinogenic agent
Form
alde
hyde
Hai
rdre
sser
s an
d ba
rber
s
Inor
gani
c le
ad
Ioni
sing
ra
diat
ion
Leat
her D
ust
Min
eral
oils
Nic
kel
Non
-ars
enic
al
inse
ctic
ides
Po
lycy
clic
A
rom
atic
H
ydro
carb
onss
PA
Hs
-Coa
l ta
rs a
nd
pitc
hes
Pain
ters
Petr
oleu
m
refin
ing
Rad
on
Rub
ber
indu
stry
Farming 28 0 Forestry 1 0 Horticulture 10 Total agricultural, hunting, fishing and forestry 39 0 Beverage industries 1 Crude petroleum and natural gas production 0 Electricity, gas and steam 1 0 1 Food manufacturing 0 0 5 General industry 0 Iron and steel basic industries 0 1 0 2 0 1 Manufacture of electrical machinery, apparatus, appliances, supplies 8 6 Manufacture of fabricated metal products, (not machinery and equipment 0 4 0 3 Manufacture of footwear 7 0 0 Manufacture of furniture and fixture, except primary of metal 2 2 Manufacture of glass and glass products 0 0 Manufacture of industrial chemicals 0 2 1 1 1 Manufacture of instruments, photographic and optical goods 46 1 Manufacture of leather and products of leather or of its substitutes 3 0 Manufacture of machinery except electrical 0 0 0 0 8 Manufacture of miscellaneous products of petroleum and coal 0 0 Manufacture of other chemical products 0 3 2 Manufacture of other non-metallic mineral products 0 2 1 Manufacture of paper and paper products 0 1 Manufacture of plastic products not elsewhere classified 0 8 2 Manufacture of pottery, china and earthenware 0 1 Manufacture of rubber products 1 0 1 5 Manufacture of textiles 1 2 Manufacture of transport equipment 0 2 0 5 Manufacture of wearing apparel, except footwear 3 0 2
26

Industry Sector/Carcinogenic agent
Form
alde
hyde
Hai
rdre
sser
s an
d ba
rber
s
Inor
gani
c le
ad
Ioni
sing
ra
diat
ion
Leat
her D
ust
Min
eral
oils
Nic
kel
Non
-ars
enic
al
inse
ctic
ides
Po
lycy
clic
A
rom
atic
H
ydro
carb
onss
PA
Hs
-Coa
l ta
rs a
nd
pitc
hes
Pain
ters
Petr
oleu
m
refin
ing
Rad
on
Rub
ber
indu
stry
Manufacture of wood and wood and cork products, except furniture 2 0 1 Metal Workers 283 Mining 0 0 0 0 0 Non-ferrous metal basic industries 0 6 3 2 1 Other manufacturing industries 1 Painters (not construction) 79 Petroleum refineries 0 0 0 Printing, publishing and allied industries 1 234 4 Tobacco manufacture 0 0 Water works and supply 0 Welders Total manufacturing industry, mining, quarrying, electricity, gas, water 7 29 2 10 564 9 1 7 0 79 0 55 5 Construction 0 25 0 8 Painters and decorators (construction) 254 Roofers, road surfacers, Roadmen, Paviors (Construction) 4 Total Construction 0 25 0 4 254 8 Air transport 1 Business, professional and other organisation 1 Communication 2 Education services 0 12 Financing, insurance, real estate and business services 23 Flight Personnel 1 Land transport 0 0 3 Medical, dental, other health and veterinary services 0 0 12 Personal and household services 0 36 2 0 6 Public administration and defence 0 11 Recreational and cultural services 4 Research and scientific institutes 0 0 1 Sanitary and similar services 0 0 2 Services allied to transport 0 1
27
Industry Sector/Carcinogenic agent
Form
alde
hyde
Hai
rdre
sser
s an
d ba
rber
s
Inor
gani
c le
ad
Ioni
sing
ra
diat
ion
Leat
her D
ust
Min
eral
oils
Nic
kel
Non
-ars
enic
al
inse
ctic
ides
Po
lycy
clic
A
rom
atic
H
ydro
carb
onss
PA
Hs
-Coa
l ta
rs a
nd
pitc
hes
Pain
ters
Petr
oleu
m
refin
ing
Rad
on
Rub
ber
indu
stry
Shift work Water transport 0 0 Welfare institutions 5 Wholesale and retail trade and restaurants and hotels 0 37 Total Service industries 0 36 1 2 0 121 TOTAL 8 36 54 3 10 566 9 40 7 4 334 0 184 5
28
Stro
n
sulfu
ricac
id
Table 4: Continued Industry Sector/Carcinogenic Agent
Shift
wor
k
Silic
a
Sola
r R
adia
tion
Soot
s
Stee
l fo
undr
y w
orke
rsgin
orga
nic-
acid
mis
ts
cont
aini
ng
TCD
D
(dio
xins
)
Tetr
achl
oroe
th
ylen
e
Tin
min
ers
Tric
hlor
oeth
yl
ene
Ultr
a Vi
olet
Viny
l ch
lorid
e
Wel
ders
Woo
d du
st
Ove
rall
Ran
k
Farming 1 35 65 19 Forestry 0 1 0 2 55 Horticulture 11 21 34 Total agricultural, hunting, fishing and forestry 1 47 0 88 Beverage industries 0 0 4 53 Crude petroleum and natural gas production 0 0 0 4 51 Electricity, gas and steam 5 0 2 0 33 30 Food manufacturing 0 2 0 0 12 39 General industry 0 59 Iron and steel basic industries 0 25 1 46 1 0 84 16 Manufacture of electrical machinery, apparatus, appliances, supplies 10 6 1 0 39 27 Manufacture of fabricated metal products, (not machinery and equipment 12 0 12 11 1 0 75 18 Manufacture of footwear 0 7 47 Manufacture of furniture and fixture, except primary of metal 5 22 33 Manufacture of glass and glass products 11 0 31 0 0 49 26 Manufacture of industrial chemicals 1 11 8 1 0 103 14 Manufacture of instruments, photographic and optical goods 0 0 49 25 Manufacture of leather and products of leather or of its substitutes 2 0 0 8 46 Manufacture of machinery except electrical 25 9 16 1 0 91 15 Manufacture of miscellaneous products of petroleum and coal 0 1 58 Manufacture of other chemical products 9 14 1 0 107 13 Manufacture of other non-metallic mineral products 37 0 14 0 61 20 Manufacture of paper and paper products 7 6 2 0 53 22 Manufacture of plastic products not elsewhere classified 1 0 11 41 Manufacture of pottery, china and earthenware 33 0 0 25 0 60 21 Manufacture of rubber products 0 7 48 Manufacture of textiles 2 0 17 35 Manufacture of transport equipment 10 0 8 5 1 0 162 10 Manufacture of wearing apparel, except footwear 0 3 0 0 0 10 43 Manufacture of wood and wood and cork products, except furniture 0 11 3 52 24
29
Stro
n
sulfu
ricac
id
Industry Sector/Carcinogenic Agent
Shift
wor
k
Silic
a
Sola
r R
adia
tion
Soot
s
Stee
l fo
undr
y w
orke
rsgin
orga
nic-
acid
mis
ts
cont
aini
ng
TCD
D
(dio
xins
)
Tetr
achl
oroe
th
ylen
e
Tin
min
ers
Tric
hlor
oeth
yl
ene
Ultr
a Vi
olet
Viny
l ch
lorid
e
Wel
ders
Woo
d du
st
Ove
rall
Ran
k
Metal Workers 283 5 Mining 26 0 2 235 9 Non-ferrous metal basic industries 4 0 9 38 0 0 0 121 12 Other manufacturing industries 2 0 4 52 Painters (not construction) 79 17 Petroleum refineries 0 0 0 38 28 Printing, publishing and allied industries 0 2 0 245 7 Tobacco manufacture 0 0 0 60 Water works and supply 0 0 3 54 Welders 1 152 153 11 Total manufacturing industry, mining, quarrying, electricity, gas, water 175 1 25 83 179 52 2 3 1 3 152 8 2,231
Construction 614 7 10 10 3,605 1 Painters and decorators (construction) 254 6 Roofers, road surfacers, Roadmen, Paviors (Construction) 4 50 Total Construction 614 7 10 10 3,843 Air transport 0 1 0 0 15 37 Business, professional and other organisation 0 2 57 Communication 0 0 0 11 42 Education services 0 0 0 16 36 Financing, insurance, real estate and business services 0 52 23 Flight Personnel 4 49 Land transport 0 3 0 423 4 Medical, dental, other health and veterinary services 0 13 38 Personal and household services 0 59 73 1 686 2 Public administration and defence 2 31 31 Recreational and cultural services 0 12 40 Research and scientific institutes 0 0 0 2 56 Sanitary and similar services 0 0 25 32 Services allied to transport 0 0 0 0 33 29 Shift work 552 552 3 Water transport 0 0 0 0 9 45
30
Stro
n
sulfu
ricac
id
Industry Sector/Carcinogenic Agent
Shift
wor
k
Silic
a
Sola
r R
adia
tion
Soot
s
Stee
l fo
undr
y w
orke
rsgin
orga
nic-
acid
mis
ts
cont
aini
ng
TCD
D
(dio
xins
)
Tetr
achl
oroe
th
ylen
e
Tin
min
ers
Tric
hlor
oeth
yl
ene
Ultr
a Vi
olet
Viny
l ch
lorid
e
Wel
ders
Woo
d du
st
Ove
rall
Ran
k
Welfare institutions 0 10 44 Wholesale and retail trade and restaurants and hotels 0 6 235 8 Total Service industries 552 3 59 0 6 78 1 0 0 2,120 TOTAL 552 789 12 59 25 83 231 140 2 4 1 3 152 19 8,019
31
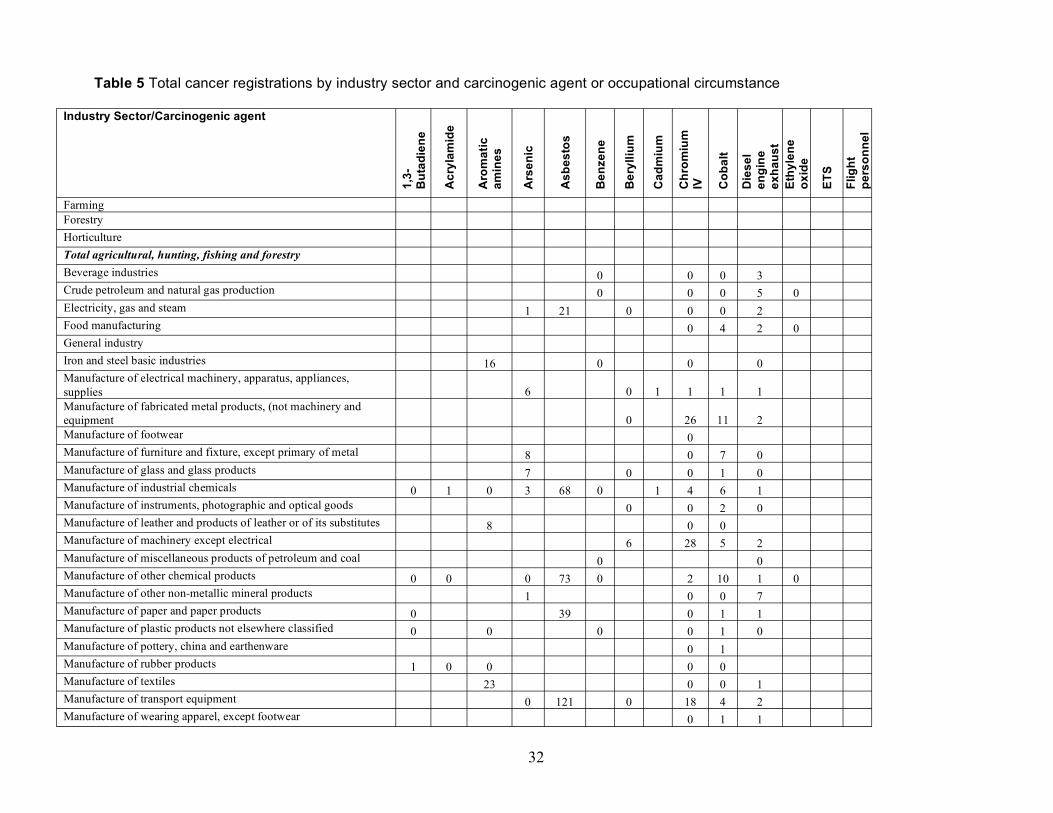
Table 5 Total cancer registrations by industry sector and carcinogenic agent or occupational circumstance
Industry Sector/Carcinogenic agent
1,3-
But
adie
ne
Acr
ylam
ide
Aro
mat
ic
amin
es
Ars
enic
Asb
esto
s
Ben
zene
Ber
ylliu
m
Cad
miu
m
Chr
omiu
m
IV Cob
alt
Die
sel
engi
ne
exha
ust
Ethy
lene
ox
ide
ETS
Flig
ht
pers
onne
l
Farming Forestry Horticulture Total agricultural, hunting, fishing and forestry Beverage industries 0 0 0 3 Crude petroleum and natural gas production 0 0 0 5 0 Electricity, gas and steam 1 21 0 0 0 2 Food manufacturing 0 4 2 0 General industry Iron and steel basic industries 16 0 0 0 Manufacture of electrical machinery, apparatus, appliances, supplies 6 0 1 1 1 1 Manufacture of fabricated metal products, (not machinery and equipment 0 26 11 2 Manufacture of footwear 0 Manufacture of furniture and fixture, except primary of metal 8 0 7 0 Manufacture of glass and glass products 7 0 0 1 0 Manufacture of industrial chemicals 0 1 0 3 68 0 1 4 6 1 Manufacture of instruments, photographic and optical goods 0 0 2 0 Manufacture of leather and products of leather or of its substitutes 8 0 0 Manufacture of machinery except electrical 6 28 5 2 Manufacture of miscellaneous products of petroleum and coal 0 0 Manufacture of other chemical products 0 0 0 73 0 2 10 1 0 Manufacture of other non-metallic mineral products 1 0 0 7 Manufacture of paper and paper products 0 39 0 1 1 Manufacture of plastic products not elsewhere classified 0 0 0 0 1 0 Manufacture of pottery, china and earthenware 0 1 Manufacture of rubber products 1 0 0 0 0 Manufacture of textiles 23 0 0 1 Manufacture of transport equipment 0 121 0 18 4 2 Manufacture of wearing apparel, except footwear 0 1 1
32
Industry Sector/Carcinogenic agent
1,3-
But
adie
ne
Acr
ylam
ide
Aro
mat
ic
amin
es
Ars
enic
Asb
esto
s
Ben
zene
Ber
ylliu
m
Cad
miu
m
Chr
omiu
m
IV Cob
alt
Die
sel
engi
ne
exha
ust
Ethy
lene
ox
ide
ETS
Flig
ht
pers
onne
l
Manufacture of wood and wood and cork products, except furniture 35 0 2 2 Metal Workers Mining 197 43 Non-ferrous metal basic industries 50 0 6 3 6 2 Other manufacturing industries 0 0 1 0 0 Painters (not construction) Petroleum refineries 0 0 40 0 0 0 0 Printing, publishing and allied industries 0 4 0 Tobacco manufacture 0 Water works and supply 2 Welders Total manufacturing industry, mining, quarrying, electricity, gas, water 1 1 48 113 558 0 7 9 86 67 80 0
Construction 15 2,921 0 4 290 36 Painters and decorators (construction) Roofers, road surfacers, roadmen, paviors (Construction)
Total Construction 15 2,921 0 4 290 36 Air transport 0 0 2 3 11 Business, professional and other organisation 1 Communication 3 7 Education services 0 0 0 4 Financing, insurance, real estate and business services 33 Flight Personnel 13 Land transport 140 1 0 350 3 Medical, dental, other health and veterinary services 0 0 0 Personal and household services 18 489 5 2 29 22 Public administration and defence 1 20 Recreational and cultural services 0 9 Research and scientific institutes 0 0 0 0 0 1 Sanitary and similar services 1 18 0 0 0 2 3 Services allied to transport 0 0 0 33 6 Shift work
33
Industry Sector/Carcinogenic agent
1,3-
But
adie
ne
Acr
ylam
ide
Aro
mat
ic
amin
es
Ars
enic
Asb
esto
s
Ben
zene
Ber
ylliu
m
Cad
miu
m
Chr
omiu
m
IV Cob
alt
Die
sel
engi
ne
exha
ust
Ethy
lene
ox
ide
ETS
Flig
ht
pers
onne
l
Water transport 0 0 6 4 Welfare institutions 5 Wholesale and retail trade and restaurants and hotels 90 1 6 119 Total Service industries 0 0 18 1 736 7 3 2 431 0 248 13 TOTAL 1 1 66 129 4,216 7 7 9 89 73 802 1 284 13
34
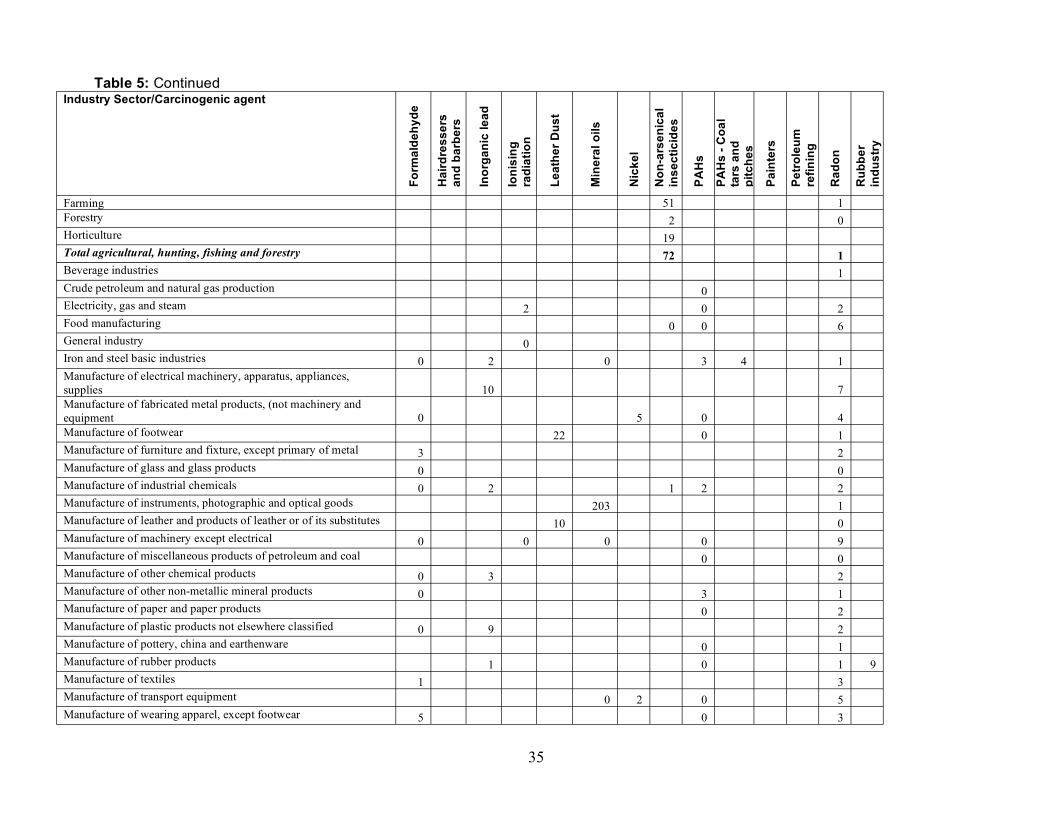
Table 5: Continued Industry Sector/Carcinogenic agent
Form
alde
hyde
Hai
rdre
sser
s an
d ba
rber
s
Inor
gani
c le
ad
Ioni
sing
ra
diat
ion
Leat
her D
ust
Min
eral
oils
Nic
kel
Non
-ars
enic
al
inse
ctic
ides
PAH
s
PAH
s -C
oal
tars
and
pi
tche
s
Pain
ters
Petr
oleu
m
refin
ing
Rad
on
Rub
ber
indu
stry
Farming 51 1 Forestry 2 0 Horticulture 19 Total agricultural, hunting, fishing and forestry 72 1 Beverage industries 1 Crude petroleum and natural gas production 0 Electricity, gas and steam 2 0 2 Food manufacturing 0 0 6 General industry 0 Iron and steel basic industries 0 2 0 3 4 1 Manufacture of electrical machinery, apparatus, appliances, supplies 10 7 Manufacture of fabricated metal products, (not machinery and equipment 0 5 0 4 Manufacture of footwear 22 0 1 Manufacture of furniture and fixture, except primary of metal 3 2 Manufacture of glass and glass products 0 0 Manufacture of industrial chemicals 0 2 1 2 2 Manufacture of instruments, photographic and optical goods 203 1 Manufacture of leather and products of leather or of its substitutes 10 0 Manufacture of machinery except electrical 0 0 0 0 9 Manufacture of miscellaneous products of petroleum and coal 0 0 Manufacture of other chemical products 0 3 2 Manufacture of other non-metallic mineral products 0 3 1 Manufacture of paper and paper products 0 2 Manufacture of plastic products not elsewhere classified 0 9 2 Manufacture of pottery, china and earthenware 0 1 Manufacture of rubber products 1 0 1 9 Manufacture of textiles 1 3 Manufacture of transport equipment 0 2 0 5 Manufacture of wearing apparel, except footwear 5 0 3
35
Industry Sector/Carcinogenic agent
Form
alde
hyde
Hai
rdre
sser
s an
d ba
rber
s
Inor
gani
c le
ad
Ioni
sing
ra
diat
ion
Leat
her D
ust
Min
eral
oils
Nic
kel
Non
-ars
enic
al
inse
ctic
ides
PAH
s
PAH
s -C
oal
tars
and
pi
tche
s
Pain
ters
Petr
oleu
m
refin
ing
Rad
on
Rub
ber
indu
stry
Manufacture of wood and wood and cork products, except furniture 3 0 2 Metal Workers 1,250 Mining 0 0 0 0 0 Non-ferrous metal basic industries 0 8 3 3 1 Other manufacturing industries 1 Painters (not construction) 102 Petroleum refineries 0 0 0 Printing, publishing and allied industries 1 270 4 Tobacco manufacture 0 0 Water works and supply 0 Welders Total manufacturing industry, mining, quarrying, electricity, gas, water 13 36 2 32 1,723 10 2 11 4 102 0 62 9
Construction 0 31 0 9 Painters and decorators (construction) 335 Roofers, road surfacers, Roadmen, Paviors (Construction) 542 Total Construction 0 31 0 542 335 9 Air transport 1 Business, professional and other organisation 1 Communication 3 Education services 0 14 Financing, insurance, real estate and business services 26 Flight Personnel 1 Land transport 0 0 4 Medical, dental, other health and veterinary services 1 0 14 Personal and household services 0 63 7 0 6 Public administration and defence 0 12 Recreational and cultural services 4 Research and scientific institutes 0 0 1 Sanitary and similar services 0 0 2 Services allied to transport 0 1
36
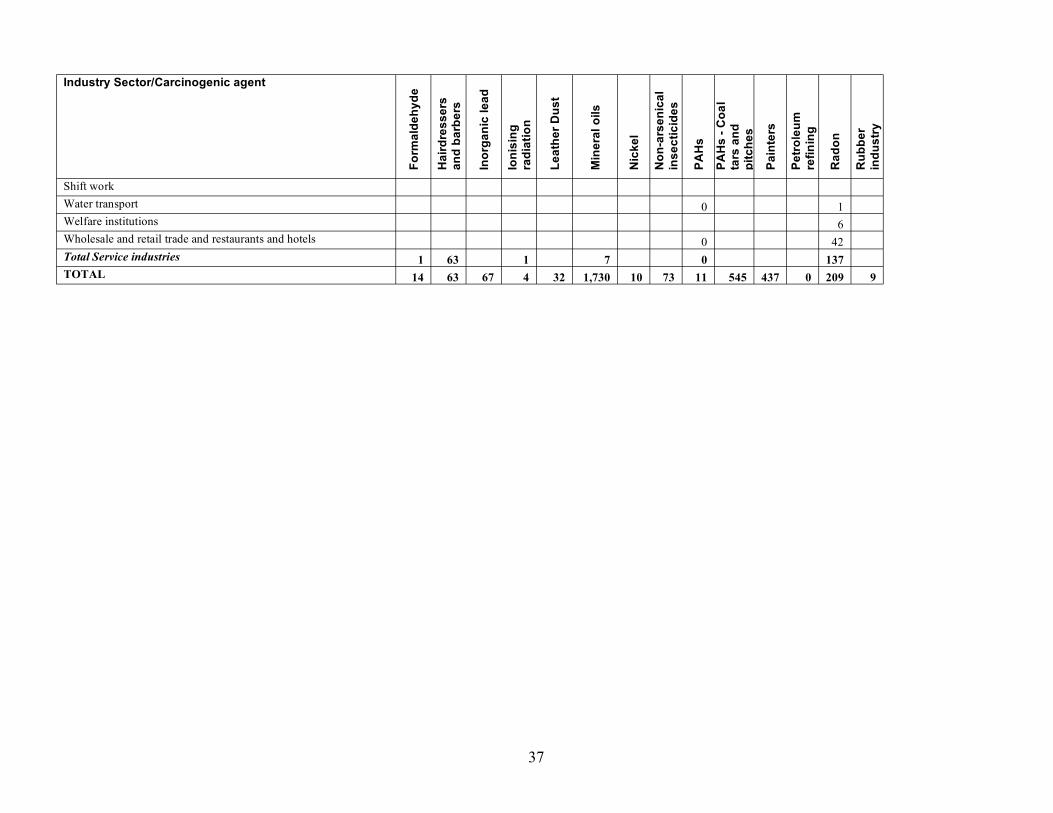
Industry Sector/Carcinogenic agent
Form
alde
hyde
Hai
rdre
sser
s an
d ba
rber
s
Inor
gani
c le
ad
Ioni
sing
ra
diat
ion
Leat
her D
ust
Min
eral
oils
Nic
kel
Non
-ars
enic
al
inse
ctic
ides
PAH
s
PAH
s -C
oal
tars
and
pi
tche
s
Pain
ters
Petr
oleu
m
refin
ing
Rad
on
Rub
ber
indu
stry
Shift work Water transport 0 1 Welfare institutions 6 Wholesale and retail trade and restaurants and hotels 0 42 Total Service industries 1 63 1 7 0 137 TOTAL 14 63 67 4 32 1,730 10 73 11 545 437 0 209 9
37

Stro
n
sulfu
ricac
id
Table 5: Continued Industry Sector/carcinogenic agent
Shift
wor
k
Silic
a
Sola
r R
adia
tion
Soot
s
Stee
l fo
undr
y w
orke
rsgin
orga
nic-
acid
mis
ts
cont
aini
ng
TCD
D
Tetr
achl
oroe
th
ylen
e
Tin
min
ers
Tric
hlor
oeth
yl
ene
UV
Viny
l ch
lorid
e
Wel
ders
Woo
d du
st
Ove
rall
Ran
k
Farming 128 41 220 12 Forestry 7 1 1 11 50 Horticulture 13 31 36 Total agricultural, hunting, fishing and forestry 135 55 1 263 Beverage industries 0 0 4 55 Crude petroleum and natural gas production 0 0 0 5 53 Electricity, gas and steam 6 53 3 0 89 25 Food manufacturing 1 2 0 0 15 45 General industry 0 59 Iron and steel basic industries 0 29 3 75 1 0 135 17 Manufacture of electrical machinery, apparatus, appliances, supplies 15 7 1 0 49
32
Manufacture of fabricated metal products, (not machinery and equipment 14
1 17 13 1 0 94
24
Manufacture of footwear 0 23 39 Manufacture of furniture and fixture, except primary of metal 1 14 34 35 Manufacture of glass and glass products 12 43 0 0 64 29 Manufacture of industrial chemicals 1 16 11 1 0 121 19 Manufacture of instruments, photographic and optical goods 0 0 206 13 Manufacture of leather and products of leather or of its substitutes 2 0 0 20 40 Manufacture of machinery except electrical 28 13 18 2 0 111 20 Manufacture of miscellaneous products of petroleum and coal 1 1 58 Manufacture of other chemical products 10 20 1 0 123 18 Manufacture of other non-metallic mineral products 43 1 19 0 75 26 Manufacture of paper and paper products 9 7 2 0 61 31 Manufacture of plastic products not elsewhere classified 1 0 14 46 Manufacture of pottery, china and earthenware 38 23 0 35 0 98 22 Manufacture of rubber products 0 12 49 Manufacture of textiles 3 0 31 37 Manufacture of transport equipment 11 5 12 6 1 0 188 14 Manufacture of wearing apparel, except footwear 1 3 0 0 0 13 48 Manufacture of wood and wood and cork products, except furniture 2 14 8 69 28
38

Stro
n
sulfu
ricac
id
Industry Sector/carcinogenic agent
Shift
wor
k
Silic
a
Sola
r R
adia
tion
Soot
s
Stee
l fo
undr
y w
orke
rsgin
orga
nic-
acid
mis
ts
cont
aini
ng
TCD
D
Tetr
achl
oroe
th
ylen
e
Tin
min
ers
Tric
hlor
oeth
yl
ene
UV
Viny
l ch
lorid
e
Wel
ders
Woo
d du
st
Ove
rall
Ran
k
Metal Workers 1,250 3 Mining 29 31 2 302 8 Non-ferrous metal basic industries 4 9 14 50 1 0 0 159 16 Other manufacturing industries 2 0 5 54 Painters (not construction) 102 21 Petroleum refineries 7 0 0 48 33 Printing, publishing and allied industries 3 2 0 286 9 Tobacco manufacture 0 0 0 60 Water works and supply 26 0 29 38 Welders 7 175 182 15 Total manufacturing industry, mining, quarrying, electricity, gas, water 200 163 29 122 254 60 2 5 7 3 175 24 3,944
Construction 707 841 11 30 4,816 1 Painters and decorators (construction) 334 7 Roofers, road surfacers, Roadmen, Paviors (Construction) 541 5
Total Construction 707 841 11 30 5,656 Air transport 0 1 0 0 18 42 Business, professional and other organisation 1 3 56 Communication 5 0 0 17 43 Education services 0 0 0 18 41 Financing, insurance, real estate and business services 3 63 30 Flight Personnel 14 47 Land transport 6 3 0 505 6 Medical, dental, other health and veterinary services 1 16 44 Personal and household services 14 60 89 2 804 4 Public administration and defence 240 273 10 Recreational and cultural services 55 69 27 Research and scientific institutes 1 0 0 3 57 Sanitary and similar services 68 0 95 23 Services allied to transport 3 0 0 0 43 34 Shift work 1,957 1,957 2 Water transport 1 0 0 0 11 52
39
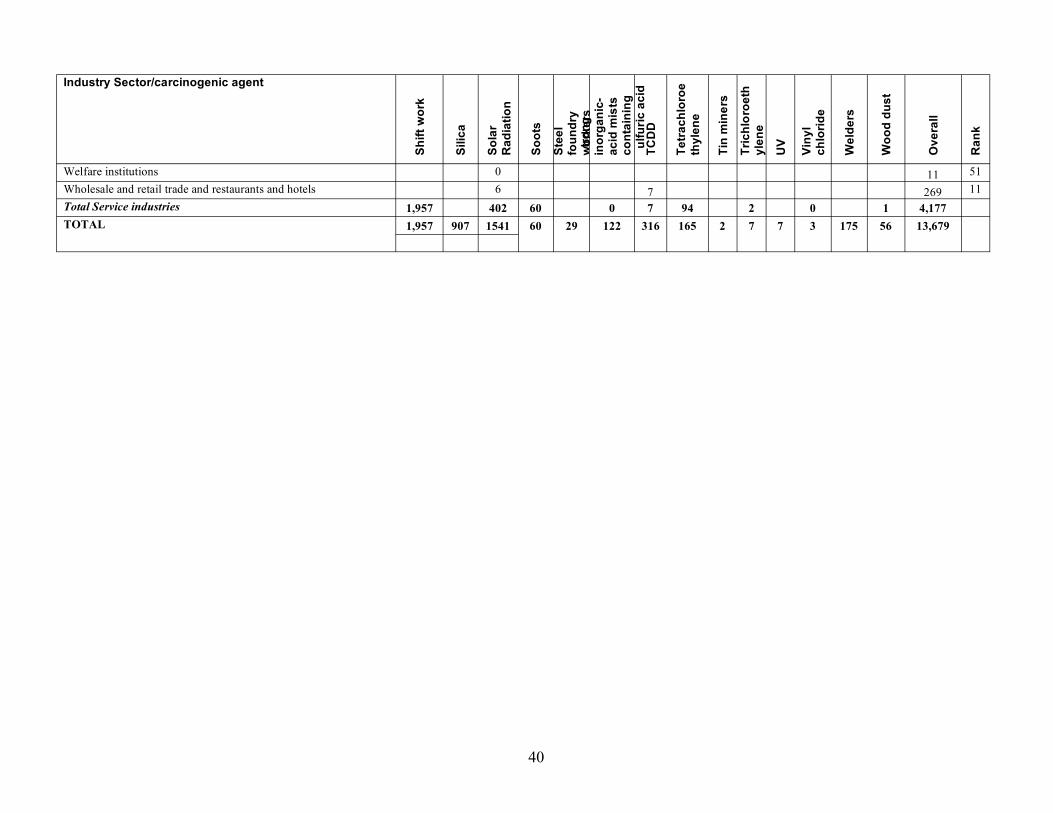
Stro
n
sulfu
ricac
id
Industry Sector/carcinogenic agent
Shift
wor
k
Silic
a
Sola
r R
adia
tion
Soot
s
Stee
l fo
undr
y w
orke
rsgin
orga
nic-
acid
mis
ts
cont
aini
ng
TCD
D
Tetr
achl
oroe
th
ylen
e
Tin
min
ers
Tric
hlor
oeth
yl
ene
UV
Viny
l ch
lorid
e
Wel
ders
Woo
d du
st
Ove
rall
Ran
k
Welfare institutions 0 11 51 Wholesale and retail trade and restaurants and hotels 6 7 269 11 Total Service industries 1,957 402 60 0 7 94 2 0 1 4,177 TOTAL 1,957 907 1541 60 29 122 316 165 2 7 7 3 175 56 13,679
40
3.4 DEATHS AND REGISTRATIONS BY INDUSTRY SECTOR AND CANCER SITE
Tables 6 and 7 give total deaths and total registrations respectively, by industry sector and for each cancer site. Numbers of deaths and registrations for males, females and the total are available on the HSE website, together with the respective attributable fractions. The totals and ranking for industry sector for Tables 6 and 7 are the same as in Tables 4 and 5 respectively.
In addition to the contribution of multiple carcinogens in many industry sectors these tables highlight the multiplicity of types of cancer within industry sectors. For example, from Table 7, there are 7 for farming (brain, leukaemia, lung, multiple myeloma, non-Hodgkin’s lymphoma, NMSC, soft tissue sarcoma, (9 for construction (bladder, brain, larynx, lung, mesothelioma, NMSC, oesophagus, sinonasal and stomach), and 12 for personal and household services (bladder, cervix, kidney, leukaemia, lung, mesothelioma, non-Hodgkin’s lymphoma, oesophagus, ovary, sinonasal, stomach).
41
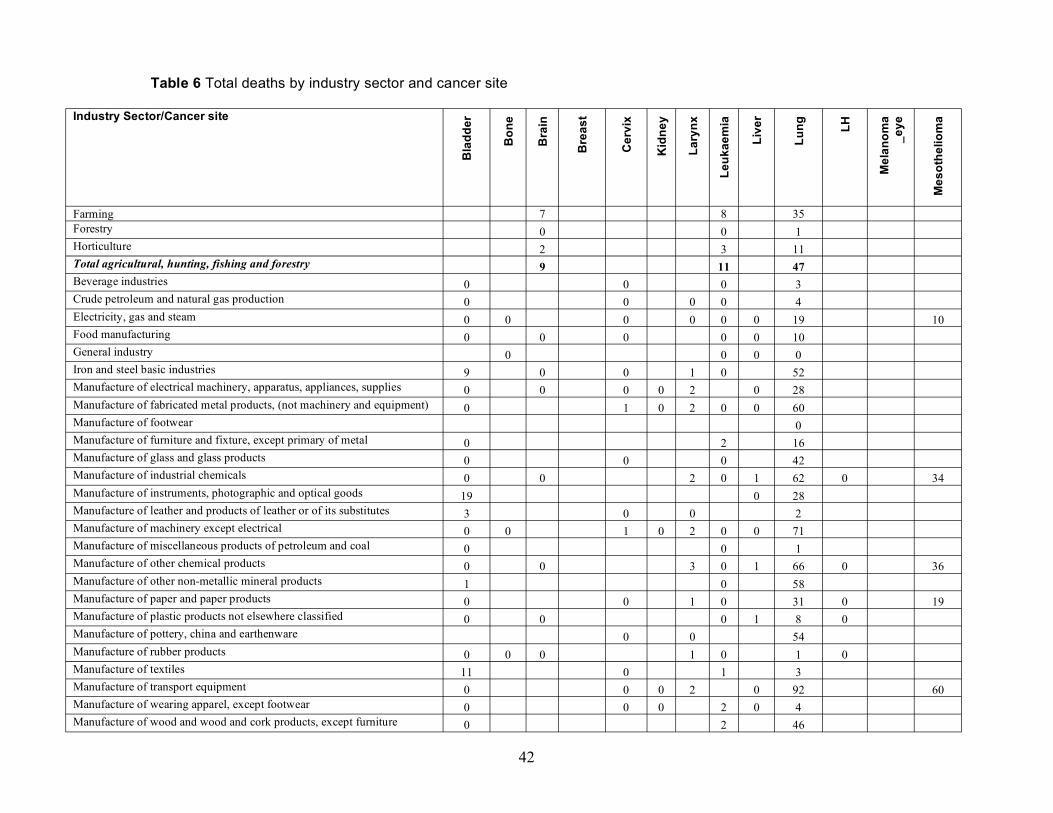
Table 6 Total deaths by industry sector and cancer site
Industry Sector/Cancer site
Bla
dder
Bon
e
Bra
in
Bre
ast
Cer
vix
Kid
ney
Lary
nx
Leuk
aem
ia
Live
r
Lung LH
Mel
anom
a_e
ye
Mes
othe
liom
a
Farming 7 8 35 Forestry 0 0 1 Horticulture 2 3 11 Total agricultural, hunting, fishing and forestry 9 11 47 Beverage industries 0 0 0 3 Crude petroleum and natural gas production 0 0 0 0 4 Electricity, gas and steam 0 0 0 0 0 0 19 10 Food manufacturing 0 0 0 0 0 10 General industry 0 0 0 0 Iron and steel basic industries 9 0 0 1 0 52 Manufacture of electrical machinery, apparatus, appliances, supplies 0 0 0 0 2 0 28 Manufacture of fabricated metal products, (not machinery and equipment) 0 1 0 2 0 0 60 Manufacture of footwear 0 Manufacture of furniture and fixture, except primary of metal 0 2 16 Manufacture of glass and glass products 0 0 0 42 Manufacture of industrial chemicals 0 0 2 0 1 62 0 34 Manufacture of instruments, photographic and optical goods 19 0 28 Manufacture of leather and products of leather or of its substitutes 3 0 0 2 Manufacture of machinery except electrical 0 0 1 0 2 0 0 71 Manufacture of miscellaneous products of petroleum and coal 0 0 1 Manufacture of other chemical products 0 0 3 0 1 66 0 36 Manufacture of other non-metallic mineral products 1 0 58 Manufacture of paper and paper products 0 0 1 0 31 0 19 Manufacture of plastic products not elsewhere classified 0 0 0 1 8 0 Manufacture of pottery, china and earthenware 0 0 54 Manufacture of rubber products 0 0 0 1 0 1 0 Manufacture of textiles 11 0 1 3 Manufacture of transport equipment 0 0 0 2 0 92 60 Manufacture of wearing apparel, except footwear 0 0 0 2 0 4 Manufacture of wood and wood and cork products, except furniture 0 2 46
42
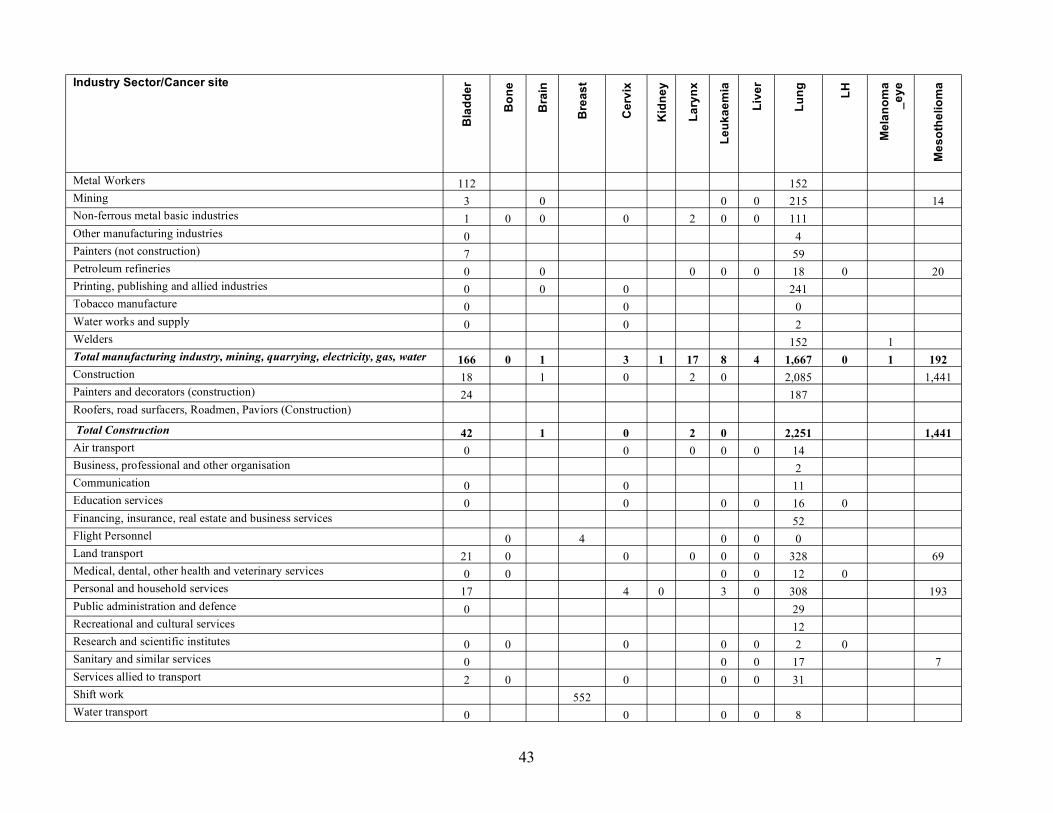
Industry Sector/Cancer site
Bla
dder
Bon
e
Bra
in
Bre
ast
Cer
vix
Kid
ney
Lary
nx
Leuk
aem
ia
Live
r
Lung LH
Mel
anom
a_e
ye
Mes
othe
liom
a
Metal Workers 112 152 Mining 3 0 0 0 215 14 Non-ferrous metal basic industries 1 0 0 0 2 0 0 111 Other manufacturing industries 0 4 Painters (not construction) 7 59 Petroleum refineries 0 0 0 0 0 18 0 20 Printing, publishing and allied industries 0 0 0 241 Tobacco manufacture 0 0 0 Water works and supply 0 0 2 Welders 152 1 Total manufacturing industry, mining, quarrying, electricity, gas, water 166 0 1 3 1 17 8 4 1,667 0 1 192 Construction 18 1 0 2 0 2,085 1,441 Painters and decorators (construction) 24 187 Roofers, road surfacers, Roadmen, Paviors (Construction)
Total Construction 42 1 0 2 0 2,251 1,441 Air transport 0 0 0 0 0 14 Business, professional and other organisation 2 Communication 0 0 11 Education services 0 0 0 0 16 0 Financing, insurance, real estate and business services 52 Flight Personnel 0 4 0 0 0 Land transport 21 0 0 0 0 0 328 69 Medical, dental, other health and veterinary services 0 0 0 0 12 0 Personal and household services 17 4 0 3 0 308 193 Public administration and defence 0 29 Recreational and cultural services 12 Research and scientific institutes 0 0 0 0 0 2 0 Sanitary and similar services 0 0 0 17 7 Services allied to transport 2 0 0 0 0 31 Shift work 552 Water transport 0 0 0 0 8
43
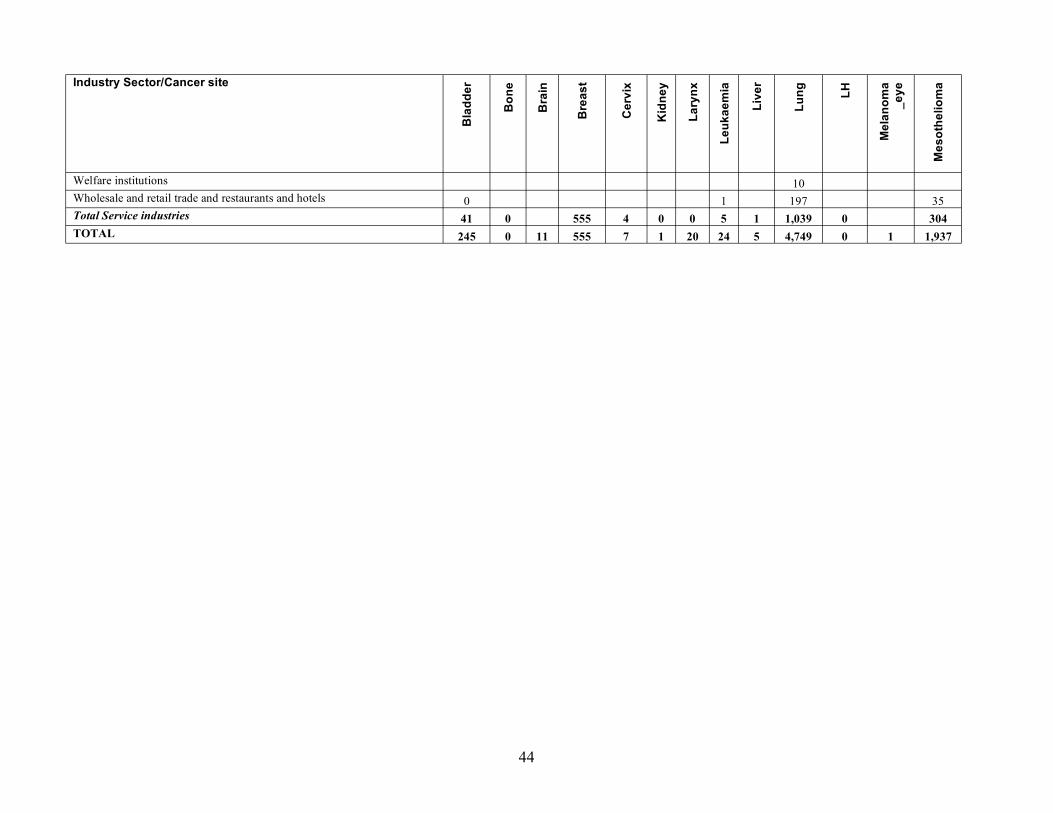
Industry Sector/Cancer site
Bla
dder
Bon
e
Bra
in
Bre
ast
Cer
vix
Kid
ney
Lary
nx
Leuk
aem
ia
Live
r
Lung LH
Mel
anom
a_e
ye
Mes
othe
liom
a
Welfare institutions 10 Wholesale and retail trade and restaurants and hotels 0 1 197 35 Total Service industries 41 0 555 4 0 0 5 1 1,039 0 304 TOTAL 245 0 11 555 7 1 20 24 5 4,749 0 1 1,937
44

Table 6: Continued Industry Sector/Cancer site
Mul
tiple
M
yelo
ma
Nas
opha
rynx
NH
L
NM
SC
Oes
opha
gus
Ova
ry
Panc
reas
Sino
nasa
l
STS
Stom
ach
Thyr
oid
Tota
l
Ran
k
Farming 4 9 1 0 65 19 Forestry 0 0 0 0 0 0 2 55 Horticulture 2 3 0 21 34 Total agricultural, hunting, fishing and forestry 6 0 13 1 0 1 88 Beverage industries 0 0 4 53 Crude petroleum and natural gas production 0 0 4 51 Electricity, gas and steam 0 2 0 0 0 33 30 Food manufacturing 0 0 2 0 12 39 General industry 0 0 59 Iron and steel basic industries 14 0 1 0 6 1 84 16 Manufacture of electrical machinery, apparatus, appliances, supplies 0 5 0 2 39 27 Manufacture of fabricated metal products, (not machinery and equipment 1 0 10 1 75 18 Manufacture of footwear 7 7 47 Manufacture of furniture and fixture, except primary of metal 2 3 22 33 Manufacture of glass and glass products 0 5 0 0 0 2 49 26 Manufacture of industrial chemicals 0 2 1 0 0 1 103 14 Manufacture of instruments, photographic and optical goods 1 2 49 25 Manufacture of leather and products of leather or of its substitutes 0 3 8 46 Manufacture of machinery except electrical 1 14 2 0 91 15 Manufacture of miscellaneous products of petroleum and coal 1 58 Manufacture of other chemical products 0 0 1 107 13 Manufacture of other non-metallic mineral products 2 0 0 1 61 20 Manufacture of paper and paper products 2 0 0 0 53 22 Manufacture of plastic products not elsewhere classified 0 2 11 41 Manufacture of pottery, china and earthenware 4 0 0 0 2 60 21 Manufacture of rubber products 0 0 4 7 48 Manufacture of textiles 0 2 0 17 35 Manufacture of transport equipment 0 0 4 1 1 162 10 Manufacture of wearing apparel, except footwear 0 0 0 3 0 10 43 Manufacture of wood and wood and cork products, except furniture 1 1 0 2 0 52 24
45
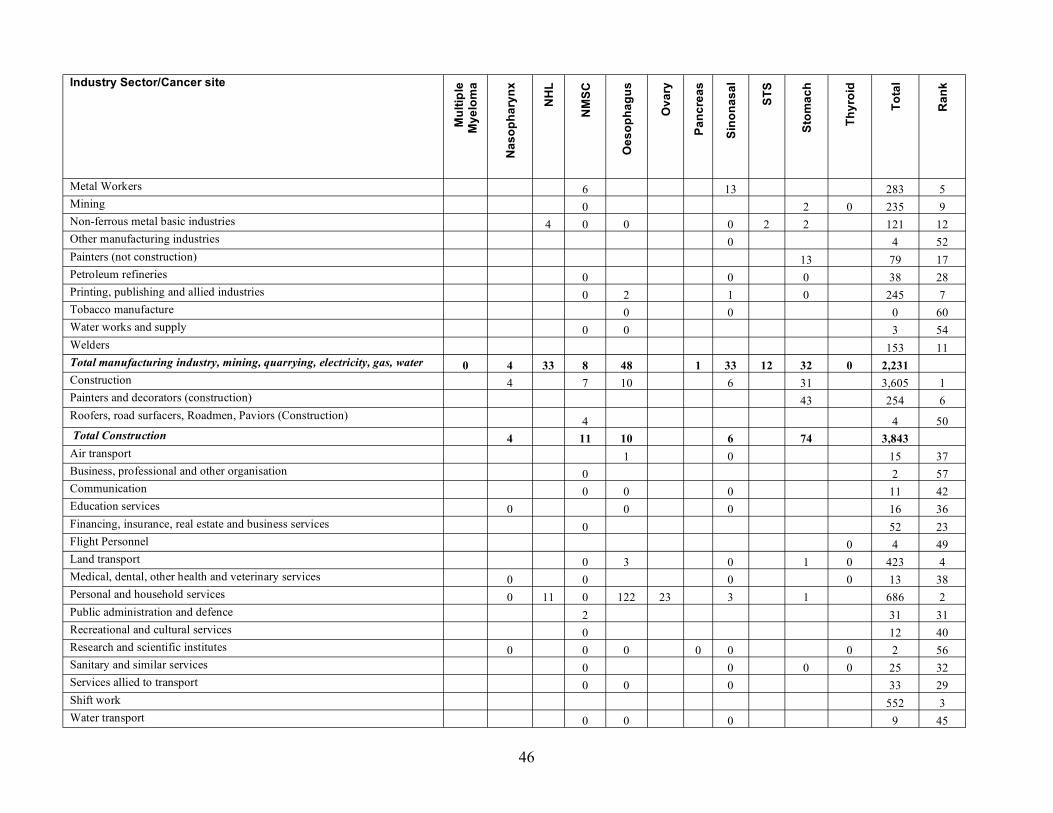
Industry Sector/Cancer site
Mul
tiple
M
yelo
ma
Nas
opha
rynx
NH
L
NM
SC
Oes
opha
gus
Ova
ry
Panc
reas
Sino
nasa
l
STS
Stom
ach
Thyr
oid
Tota
l
Ran
k
Metal Workers 6 13 283 5 Mining 0 2 0 235 9 Non-ferrous metal basic industries 4 0 0 0 2 2 121 12 Other manufacturing industries 0 4 52 Painters (not construction) 13 79 17 Petroleum refineries 0 0 0 38 28 Printing, publishing and allied industries 0 2 1 0 245 7 Tobacco manufacture 0 0 0 60 Water works and supply 0 0 3 54 Welders 153 11 Total manufacturing industry, mining, quarrying, electricity, gas, water 0 4 33 8 48 1 33 12 32 0 2,231 Construction 4 7 10 6 31 3,605 1 Painters and decorators (construction) 43 254 6 Roofers, road surfacers, Roadmen, Paviors (Construction) 4 4 50 Total Construction 4 11 10 6 74 3,843 Air transport 1 0 15 37 Business, professional and other organisation 0 2 57 Communication 0 0 0 11 42 Education services 0 0 0 16 36 Financing, insurance, real estate and business services 0 52 23 Flight Personnel 0 4 49 Land transport 0 3 0 1 0 423 4 Medical, dental, other health and veterinary services 0 0 0 0 13 38 Personal and household services 0 11 0 122 23 3 1 686 2 Public administration and defence 2 31 31 Recreational and cultural services 0 12 40 Research and scientific institutes 0 0 0 0 0 0 2 56 Sanitary and similar services 0 0 0 0 25 32 Services allied to transport 0 0 0 33 29 Shift work 552 3 Water transport 0 0 0 9 45
46
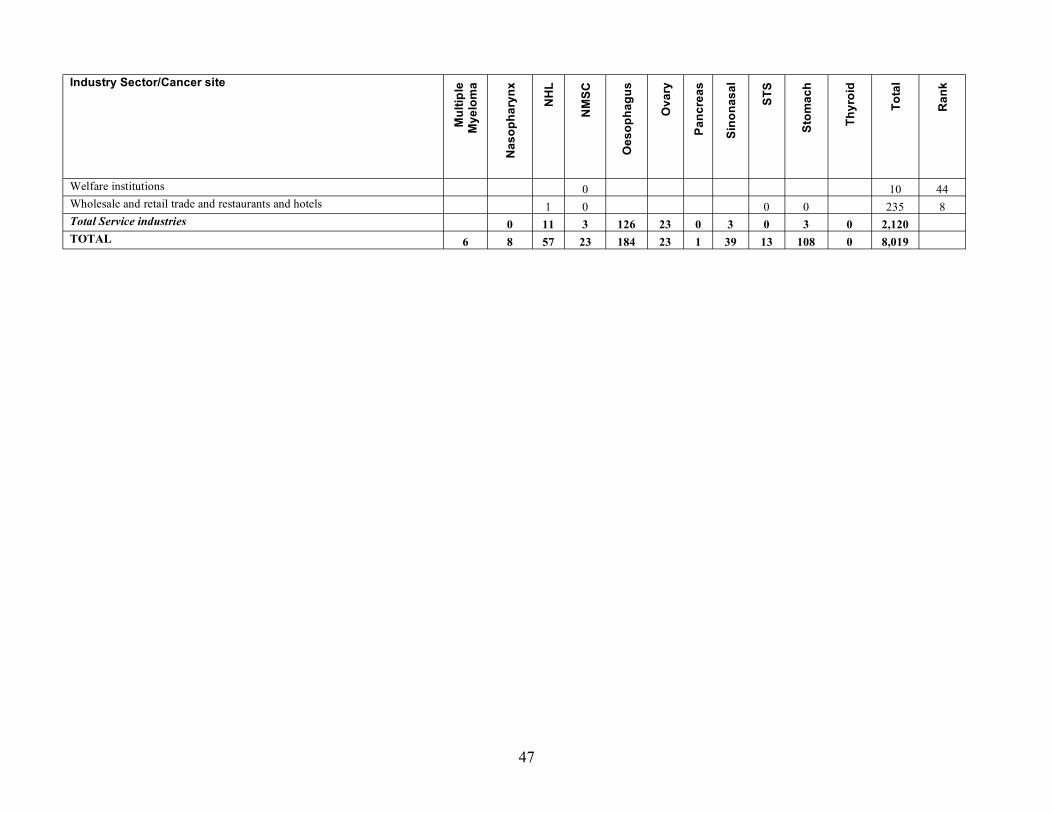
Industry Sector/Cancer site
Mul
tiple
M
yelo
ma
Nas
opha
rynx
NH
L
NM
SC
Oes
opha
gus
Ova
ry
Panc
reas
Sino
nasa
l
STS
Stom
ach
Thyr
oid
Tota
l
Ran
k
Welfare institutions 0 10 44 Wholesale and retail trade and restaurants and hotels 1 0 0 0 235 8 Total Service industries 0 11 3 126 23 0 3 0 3 0 2,120 TOTAL 6 8 57 23 184 23 1 39 13 108 0 8,019
47
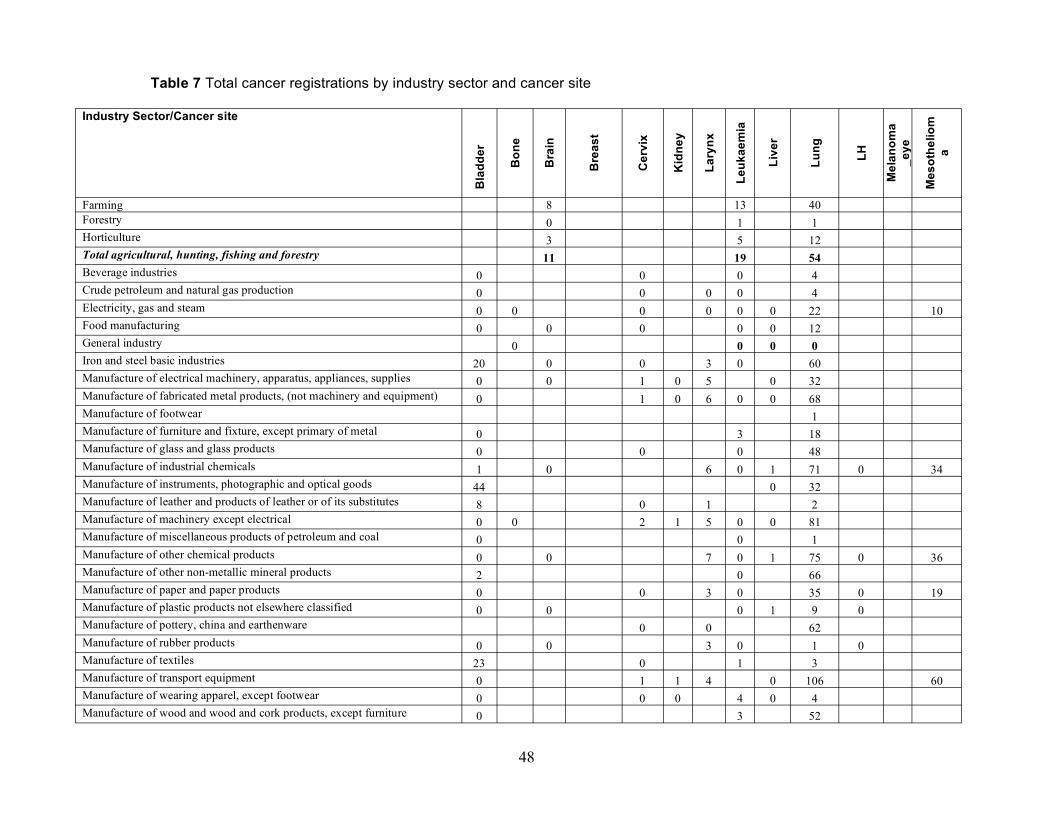
Table 7 Total cancer registrations by industry sector and cancer site
Industry Sector/Cancer site
Bla
dder
Bon
e
Bra
in
Bre
ast
Cer
vix
Kid
ney
Lary
nx
Leuk
aem
ia
Live
r
Lung LH
Mel
anom
a _e
ye
Mes
othe
liom
a
Farming 8 13 40 Forestry 0 1 1 Horticulture 3 5 12 Total agricultural, hunting, fishing and forestry 11 19 54 Beverage industries 0 0 0 4 Crude petroleum and natural gas production 0 0 0 0 4 Electricity, gas and steam 0 0 0 0 0 0 22 10 Food manufacturing 0 0 0 0 0 12 General industry 0 0 0 0 Iron and steel basic industries 20 0 0 3 0 60 Manufacture of electrical machinery, apparatus, appliances, supplies 0 0 1 0 5 0 32 Manufacture of fabricated metal products, (not machinery and equipment) 0 1 0 6 0 0 68 Manufacture of footwear 1 Manufacture of furniture and fixture, except primary of metal 0 3 18 Manufacture of glass and glass products 0 0 0 48 Manufacture of industrial chemicals 1 0 6 0 1 71 0 34 Manufacture of instruments, photographic and optical goods 44 0 32 Manufacture of leather and products of leather or of its substitutes 8 0 1 2 Manufacture of machinery except electrical 0 0 2 1 5 0 0 81 Manufacture of miscellaneous products of petroleum and coal 0 0 1 Manufacture of other chemical products 0 0 7 0 1 75 0 36 Manufacture of other non-metallic mineral products 2 0 66 Manufacture of paper and paper products 0 0 3 0 35 0 19 Manufacture of plastic products not elsewhere classified 0 0 0 1 9 0 Manufacture of pottery, china and earthenware 0 0 62 Manufacture of rubber products 0 0 3 0 1 0 Manufacture of textiles 23 0 1 3 Manufacture of transport equipment 0 1 1 4 0 106 60 Manufacture of wearing apparel, except footwear 0 0 0 4 0 4 Manufacture of wood and wood and cork products, except furniture 0 3 52
48
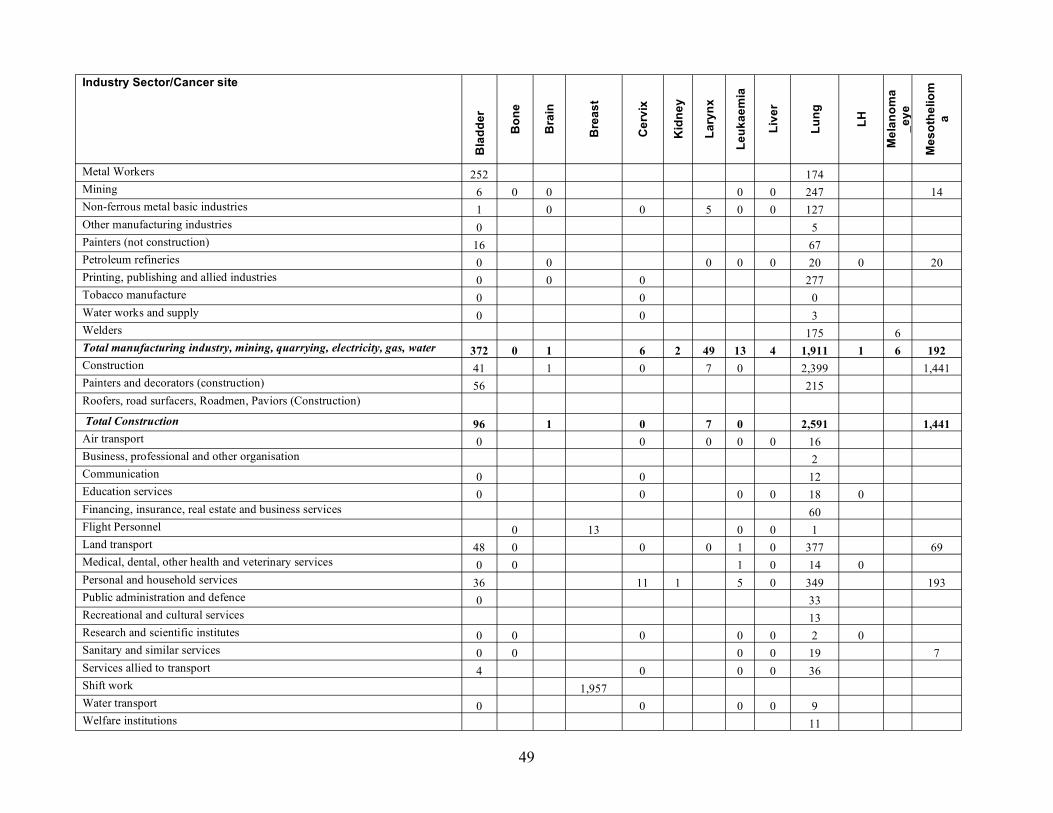
Industry Sector/Cancer site
Bla
dder
Bon
e
Bra
in
Bre
ast
Cer
vix
Kid
ney
Lary
nx
Leuk
aem
ia
Live
r
Lung LH
Mel
anom
a _e
ye
Mes
othe
liom
a
Metal Workers 252 174 Mining 6 0 0 0 0 247 14 Non-ferrous metal basic industries 1 0 0 5 0 0 127 Other manufacturing industries 0 5 Painters (not construction) 16 67 Petroleum refineries 0 0 0 0 0 20 0 20 Printing, publishing and allied industries 0 0 0 277 Tobacco manufacture 0 0 0 Water works and supply 0 0 3 Welders 175 6 Total manufacturing industry, mining, quarrying, electricity, gas, water 372 0 1 6 2 49 13 4 1,911 1 6 192 Construction 41 1 0 7 0 2,399 1,441 Painters and decorators (construction) 56 215 Roofers, road surfacers, Roadmen, Paviors (Construction)
Total Construction 96 1 0 7 0 2,591 1,441 Air transport 0 0 0 0 0 16 Business, professional and other organisation 2 Communication 0 0 12 Education services 0 0 0 0 18 0 Financing, insurance, real estate and business services 60 Flight Personnel 0 13 0 0 1 Land transport 48 0 0 0 1 0 377 69 Medical, dental, other health and veterinary services 0 0 1 0 14 0 Personal and household services 36 11 1 5 0 349 193 Public administration and defence 0 33 Recreational and cultural services 13 Research and scientific institutes 0 0 0 0 0 2 0 Sanitary and similar services 0 0 0 0 19 7 Services allied to transport 4 0 0 0 36 Shift work 1,957 Water transport 0 0 0 0 9 Welfare institutions 11
49

Industry Sector/Cancer site
Bla
dder
Bon
e
Bra
in
Bre
ast
Cer
vix
Kid
ney
Lary
nx
Leuk
aem
ia
Live
r
Lung LH
Mel
anom
a _e
ye
Mes
othe
liom
a
Wholesale and retail trade and restaurants and hotels 0 1 224 35 Total Service industries 90 0 1,969 11 1 1 8 1 1,184 0 304 TOTAL 550 0 14 1,969 18 3 56 40 5 5,447 1 6 1,937
50
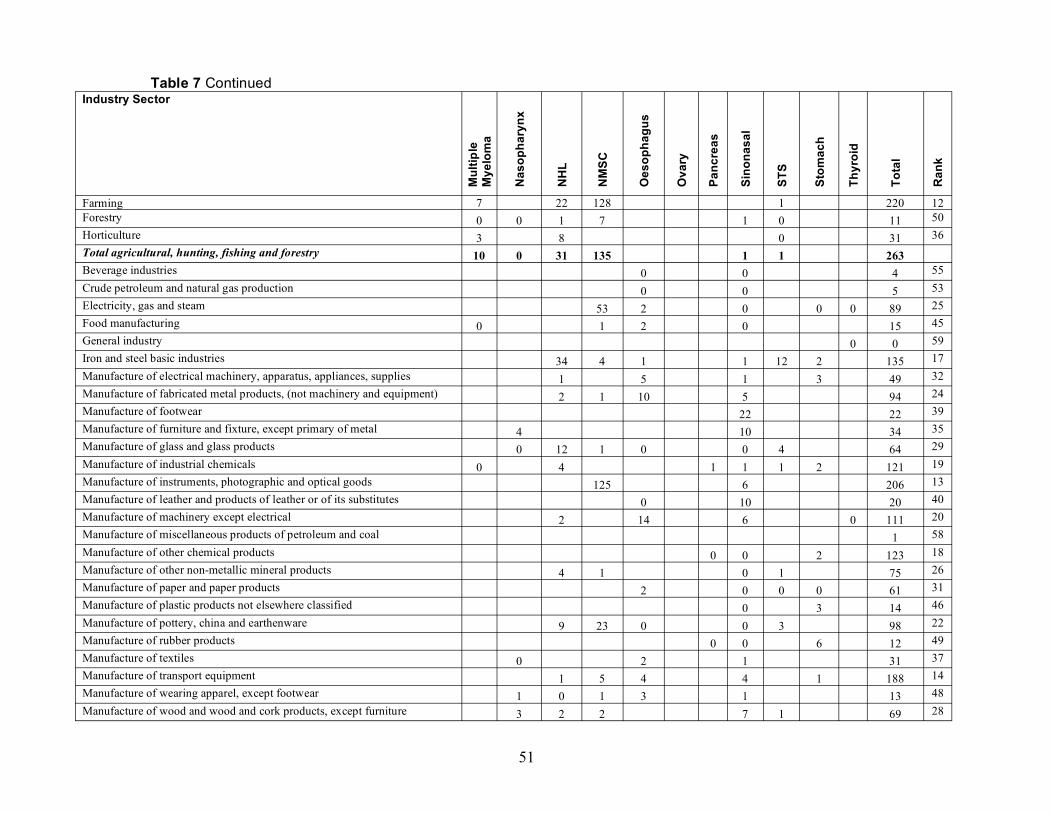
Table 7 Continued Industry Sector
Mul
tiple
M
yelo
ma
Nas
opha
rynx
NH
L
NM
SC
Oes
opha
gus
Ova
ry
Panc
reas
Sino
nasa
l
STS
Stom
ach
Thyr
oid
Tota
l
Ran
k
Farming 7 22 128 1 220 12 Forestry 0 0 1 7 1 0 11 50 Horticulture 3 8 0 31 36 Total agricultural, hunting, fishing and forestry 10 0 31 135 1 1 263 Beverage industries 0 0 4 55 Crude petroleum and natural gas production 0 0 5 53 Electricity, gas and steam 53 2 0 0 0 89 25 Food manufacturing 0 1 2 0 15 45 General industry 0 0 59 Iron and steel basic industries 34 4 1 1 12 2 135 17 Manufacture of electrical machinery, apparatus, appliances, supplies 1 5 1 3 49 32 Manufacture of fabricated metal products, (not machinery and equipment) 2 1 10 5 94 24 Manufacture of footwear 22 22 39 Manufacture of furniture and fixture, except primary of metal 4 10 34 35 Manufacture of glass and glass products 0 12 1 0 0 4 64 29 Manufacture of industrial chemicals 0 4 1 1 1 2 121 19 Manufacture of instruments, photographic and optical goods 125 6 206 13 Manufacture of leather and products of leather or of its substitutes 0 10 20 40 Manufacture of machinery except electrical 2 14 6 0 111 20 Manufacture of miscellaneous products of petroleum and coal 1 58 Manufacture of other chemical products 0 0 2 123 18 Manufacture of other non-metallic mineral products 4 1 0 1 75 26 Manufacture of paper and paper products 2 0 0 0 61 31 Manufacture of plastic products not elsewhere classified 0 3 14 46 Manufacture of pottery, china and earthenware 9 23 0 0 3 98 22 Manufacture of rubber products 0 0 6 12 49 Manufacture of textiles 0 2 1 31 37 Manufacture of transport equipment 1 5 4 4 1 188 14 Manufacture of wearing apparel, except footwear 1 0 1 3 1 13 48 Manufacture of wood and wood and cork products, except furniture 3 2 2 7 1 69 28
51

Industry Sector
Mul
tiple
M
yelo
ma
Nas
opha
rynx
NH
L
NM
SC
Oes
opha
gus
Ova
ry
Panc
reas
Sino
nasa
l
STS
Stom
ach
Thyr
oid
Tota
l
Ran
k
Metal Workers 778 46 1,250 3 Mining 31 4 0 302 8 Non-ferrous metal basic industries 10 9 0 1 3 3 159 16 Other manufacturing industries 0 5 54 Painters (not construction) 19 102 21 Petroleum refineries 7 0 0 48 33 Printing, publishing and allied industries 3 2 4 0 286 9 Tobacco manufacture 0 0 0 60 Water works and supply 26 0 29 38 Welders 181 15 Total manufacturing industry, mining, quarrying, electricity, gas, water 0 7 80 1,066 49 1 111 25 46 0 3,944 Construction 8 841 10 21 46 4,816 1 Painters and decorators (construction) 64 334 7 Roofers, road surfacers, Roadmen, Paviors (Construction) 541 541 5
Total Construction 8 1,370 10 21 109 5,656 Air transport 1 0 18 42 Business, professional and other organisation 1 3 56 Communication 5 0 0 17 43 Education services 0 0 0 18 41 Financing, insurance, real estate and business services 3 63 30 Flight Personnel 0 14 47 Land transport 6 3 0 2 0 505 6 Medical, dental, other health and veterinary services 0 1 0 0 16 44 Personal and household services 0 28 14 125 33 9 2 804 4 Public administration and defence 240 273 10 Recreational and cultural services 55 69 27 Research and scientific institutes 0 1 0 0 0 0 3 57 Sanitary and similar services 68 0 0 0 95 23 Services allied to transport 3 0 0 43 34 Shift work 1,957 2 Water transport 1 0 0 11 52
52
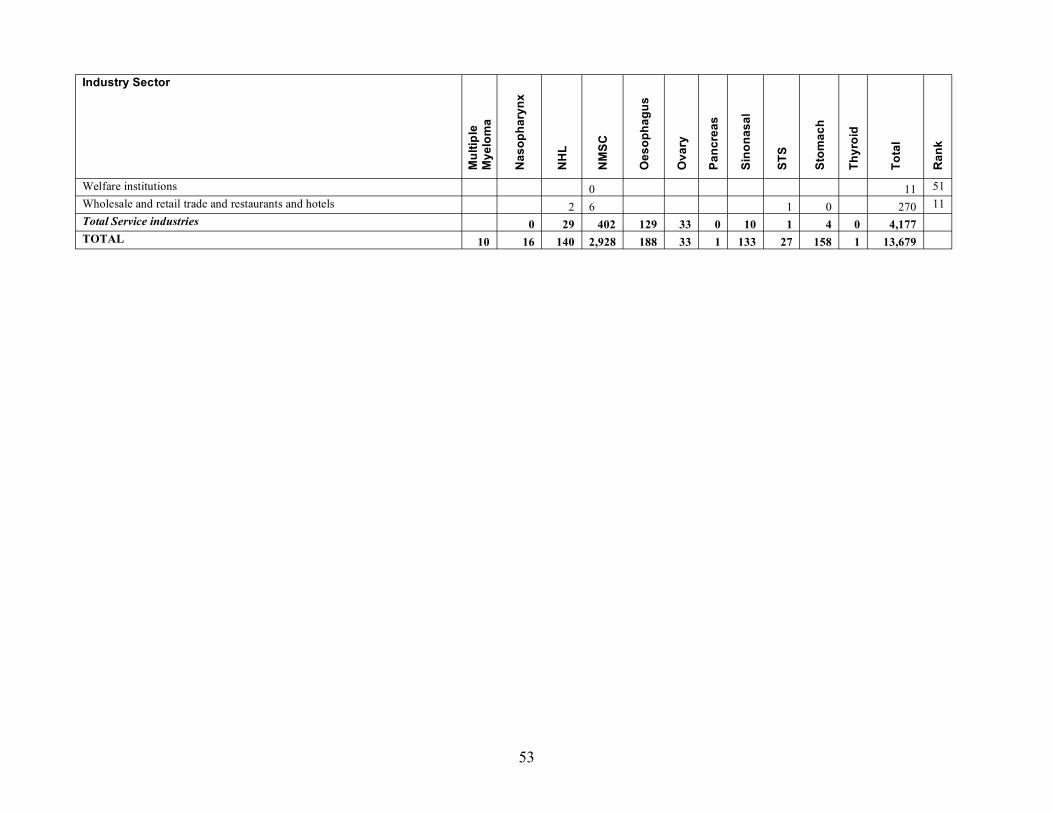
Industry Sector
Mul
tiple
M
yelo
ma
Nas
opha
rynx
NH
L
NM
SC
Oes
opha
gus
Ova
ry
Panc
reas
Sino
nasa
l
STS
Stom
ach
Thyr
oid
Tota
l
Ran
k
Welfare institutions 0 11 51 Wholesale and retail trade and restaurants and hotels 2 6 1 0 270 11 Total Service industries 0 29 402 129 33 0 10 1 4 0 4,177 TOTAL 10 16 140 2,928 188 33 1 133 27 158 1 13,679
53
4.0 DISCUSSION
Our estimate of the fraction of current cancer deaths in the UK due to past occupational exposures is the upper limit of the range of 1%-5% suggested by Doll and Peto (2005). Burden estimates from other studies range between 3 and 10% (Dreyer et al, 1997; Driscoll et al, 2005; Steenland et al, 2003; Nurminen and Karjalainen 2001; Vineis and Simonato, 1991; Gustavsson et al, 200; Landrigan and Markowitz 1989; Leigh et al, 1997). This is partly due to differences in the numbers of cancers and carcinogens considered. For example the global estimate of occupational cancer (Driscoll et al, 2005) included only lung cancer, leukaemia and mesothelioma; their estimate for lung cancer included only 8 carcinogens, arsenic, asbestos, beryllium, cadmium, chromium, DEE, nickel and silica. The 13 additional agents in our study contributed 33% of the total attributable registrations from lung cancer. The relative importance of different cancer sites also changes as more cancer sites are included; for example, in this study with leukaemia (included in the global estimate) being less important than other sites including other haematopoietic malignancies such as non-Hodgkin’s lymphoma.
Our methodological approach was developed with advice, discussion and peer review from international experts, including IARC, throughout the project and at two international workshops. It takes account of issues such as latency and the period in which relevant exposure would occur, changes in workforce turnover and employment trends and the potential to be exposed to several carcinogens concurrently and at different levels. These methods have the potential to be adapted for use in other countries and extended to include social and economic impact evaluation. For example, both the methods and results from the study are currently being utilised to inform an EU project to make recommendations (and to assess the socioeconomic impact) for new European Union Occupational Exposure Limits for 25 recognised carcinogens. It is also being used to underpin the on-going update of the World Health Organisation Global Burden of Disease.
However, assumptions made in our methodology and uncertainties and inaccuracies in the data we have used may have introduced biases into our estimates, the impact of which is not fully captured in the confidence intervals presented. Table 8 gives some of these and the direction of the impact of these on the estimation of the burden due to occupation. On-going work is exploring the sensitivity of the estimates to such sources of uncertainty and bias.
Agents classified by IARC by the end of 2008 as Group I and 2A carcinogens were assessed. Other substances, such as IARC group 2B carcinogens, many of which may be treated as if they were human carcinogens in regulatory settings have not yet been evaluated; our estimates could thus be too low. In addition, our estimates do not include evaluation of the results from the review and update by IARC of all group1 carcinogens carried out in 2009 in which a separate classification was given for all cancer sites that were relevant to specific carcinogens; these classifications could potentially vary between cancer sites for the same substance. For example, asbestos has recently been classified as group 1 for mesothelioma and cancers of the larynx, lung and ovary and as group 2A for colorectal, pharyngeal and stomach cancers (Straif et al, 2009).
Uncertainty or bias may have been introduced in the choice of the study for obtaining data for the risk estimates, for example if the exposures in the source study did not reflect those experienced in GB or distributions of confounders differed between the source population and GB. A major gap in available information was a lack of separate risk estimates for women and/or cancer incidence. The use of risk estimates derived from studies of men for women and mortality risk estimates for incidence may have
54
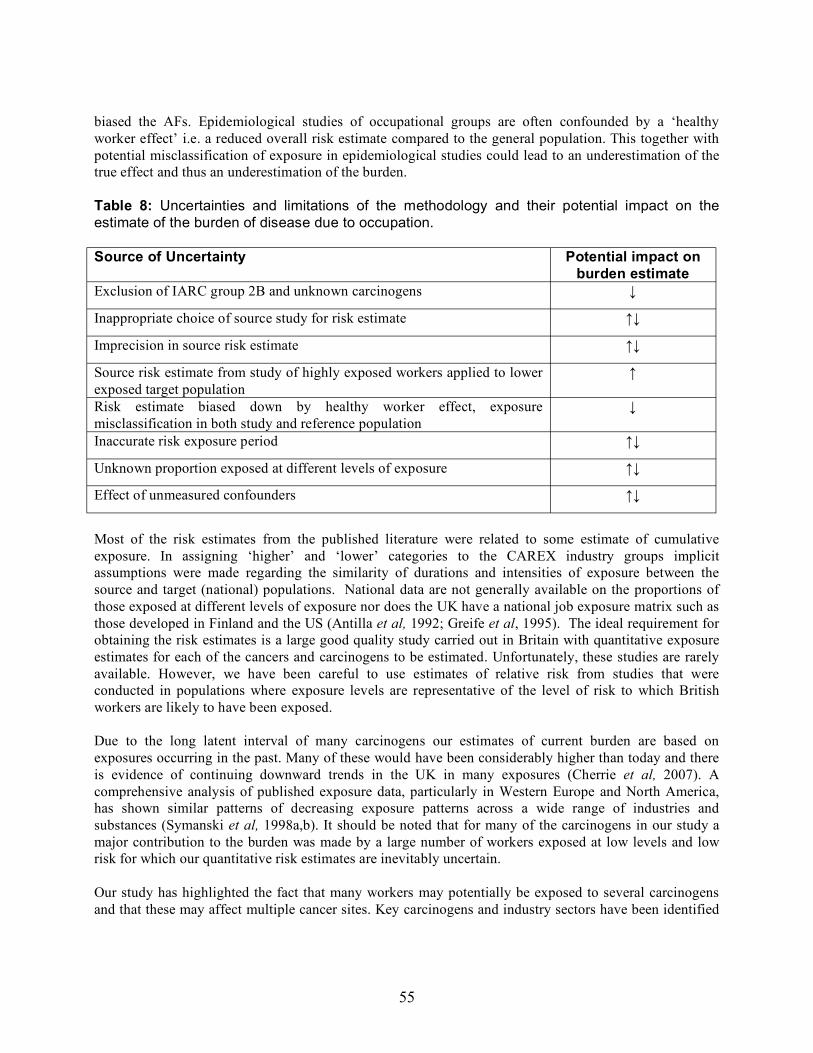
biased the AFs. Epidemiological studies of occupational groups are often confounded by a ‘healthy worker effect’ i.e. a reduced overall risk estimate compared to the general population. This together with potential misclassification of exposure in epidemiological studies could lead to an underestimation of the true effect and thus an underestimation of the burden.
Table 8: Uncertainties and limitations of the methodology and their potential impact on the estimate of the burden of disease due to occupation.
Source of Uncertainty Potential impact on burden estimate
Exclusion of IARC group 2B and unknown carcinogens ↓
Inappropriate choice of source study for risk estimate ↑↓
Imprecision in source risk estimate ↑↓
Source risk estimate from study of highly exposed workers applied to lower ↑ exposed target population Risk estimate biased down by healthy worker effect, exposure ↓ misclassification in both study and reference population Inaccurate risk exposure period ↑↓
Unknown proportion exposed at different levels of exposure ↑↓
Effect of unmeasured confounders ↑↓
Most of the risk estimates from the published literature were related to some estimate of cumulative exposure. In assigning ‘higher’ and ‘lower’ categories to the CAREX industry groups implicit assumptions were made regarding the similarity of durations and intensities of exposure between the source and target (national) populations. National data are not generally available on the proportions of those exposed at different levels of exposure nor does the UK have a national job exposure matrix such as those developed in Finland and the US (Antilla et al, 1992; Greife et al, 1995). The ideal requirement for obtaining the risk estimates is a large good quality study carried out in Britain with quantitative exposure estimates for each of the cancers and carcinogens to be estimated. Unfortunately, these studies are rarely available. However, we have been careful to use estimates of relative risk from studies that were conducted in populations where exposure levels are representative of the level of risk to which British workers are likely to have been exposed.
Due to the long latent interval of many carcinogens our estimates of current burden are based on exposures occurring in the past. Many of these would have been considerably higher than today and there is evidence of continuing downward trends in the UK in many exposures (Cherrie et al, 2007). A comprehensive analysis of published exposure data, particularly in Western Europe and North America, has shown similar patterns of decreasing exposure patterns across a wide range of industries and substances (Symanski et al, 1998a,b). It should be noted that for many of the carcinogens in our study a major contribution to the burden was made by a large number of workers exposed at low levels and low risk for which our quantitative risk estimates are inevitably uncertain.
Our study has highlighted the fact that many workers may potentially be exposed to several carcinogens and that these may affect multiple cancer sites. Key carcinogens and industry sectors have been identified
55
posing varying challenges for risk reduction strategies. These include, asbestos, DEE, ETS (non-smokers), radon, silica, solar radiation and shift work.
Substantial exposure to asbestos in Britain until the 1970s has contributed to a continuing rise in asbestos-related deaths from lung cancer and mesothelioma (Hodgson et al, 2005) and asbestos contributes 30% of the occupationally-related cancer registrations and nearly half of the deaths in our study. Exposure in the construction industry is highlighted in our study along with other dusts such as those containing silica. A recent case-control study of UK mesothelioma patients found high risks associated with exposure to asbestos in the construction industry including work as a plumber, electrician, painter or decorator (Rake et al, (2009). The authors suggest that a substantial proportion of the deaths in carpenters would be among those who installed asbestos installation board as fireproofing and the large amount of asbestos that remains in many older buildings may still be a potential hazard to construction workers involved in renovation, maintenance or asbestos removal. The difficulties of managing asbestos exposures arising during industrial maintenance and repair and the problems of health protection of workers worldwide has been discussed (Wagner, 2007).
Exposure to dusts containing silica is also highlighted in several industry sectors in our study, including the construction industry. Measurements of respirable crystalline silica in the UK construction industry have found levels that greatly exceed the current workplace exposure limit (WEL) of 0.1 mg/m3, particularly for work in confined spaces and without water suppression of dust or effective extraction (Chisholm, 1999).
Diesel engines have a wide range of industrial applications including on-road equipment (most heavy and medium duty trucks and buses use diesel engines) and off-road applications in the mining, rail, construction, distribution and farming industries and in the military, including the use of diesel-powered heavy equipment, locomotives, forklift trucks, ships, tractors and generators. In a recent review of the literature the highest levels of elemental carbon were reported for enclosed underground work sites in mining and construction (elemental carbon (EC): 27-658 µg/m3) (Pronk et al, 2009). Intermediate levels were reported for above-ground semi-enclosed areas involving work as a workshop mechanic, dock
3worker and fire station workers (EC<50 µg/m3), with the lowest levels (EC<25 µg/m ) being reported for enclosed areas separated from the source such as drivers, train crew, parking attendants, vehicle testers and utility service workers.
Cancer in non-smokers due to workplace exposure to ETS may be expected to largely disappear in Britain in future due to the ban now in force; our results demonstrate the impact this exposure may have in countries where no ban is yet enforced. Carcinogens such as naturally occurring radon could also easily be eliminated from workplaces. Our study has extended evaluation of more ‘traditional’ industrial hazards such as asbestos to estimation of the effect of newer and less traditional problems. In 2007 IARC classified shift work, in particular night work, as being group 2A for breast cancer (Straif et al, 2007). The estimate of nearly 2000 breast cancer registrations due to shift work in our study is 54% of all female occupationally-related cancer registrations (1971/3622). The epidemiological evidence evaluated by IARC comes from population-based case-control studies and studies of nurses, marine telephone operators and female flight attendants although in the latter the effect of concomitant exposure to shift work and ionizing radiation is difficult to disentangle. Large studies in other industry groups with collection of good shift pattern data are needed. Denmark recently became the first country to designate breast cancer as an occupational disease for the purpose of receiving compensation (Commentary, 2009). The ramifications of this decision and results such as those in our study could be significant given the large numbers of women working night shifts in Britain and worldwide.
56
Exposure to solar radiation and mineral oils at work was associated with a large number of registrations from NMSC (21% of all attributable registrations). Mortality from NMSC is low but there may be substantial morbidity from disfigurement as the lesions tend to be on the head and neck and as the prevalence is high they represent a considerable economic burden to health services (Trakatelli et al, 2007; Houseman et al, 2003, Boyle et al, 2004) NMSC is thought to be substantially under-registered; our occupationally related figures are thus likely to be under-estimated.
On-going work and future reports will address (i) estimation of the burden due to occupational exposures using other measures such as years of life lost and Disability-Adjusted Life Years, (ii) the methodology that has been developed for predicting future estimates of the occupational cancers due to more recent exposures and application to important exposures identified from the current burden estimation results (iii) exploration of the sensitivity of the estimates to sources of uncertainty and bias.
Summary This project is the first to quantify in detail the burden of cancer due to occupation specifically for Great Britain. The project highlights the impact of occupational exposures, together with the occupational circumstances and industrial areas where exposures to these agents occurred in the past, on population cancer morbidity and mortality; this can be compared with the impact of other causes of cancer. Prioritisation of risk reduction strategies should focus on those workplaces where such exposures are still occurring.
57
5.0 BIBLIOGRAPHY
Antilla A, Jaakkola J, Tossavainen A (1992) occupational exposure to chemical agents in Finland. Finnish Institute of Occupational Health, Helsinki, Finland
BASSA (British Airlines Stewards and Stewardesses Assoc) (2008) Personal communication
Boyle P, Dore JF, Autier P, Ringborg U (2004) Cancer of the skin: a forgotten problem in Europe. AnnOncol 15: 5-6
Cherrie JW, Van Tongeren M, Semple S (2007) Exposure to occupational carcinogens in Great Britain.Ann Occup Hyg 51(8): 653-664
Chisholm J (1999) Respirable dust and respirable silica concentrations from construction activities. IndoorBuilt Environ 8: 94-106
Commentary (2009) Breast cancer on the night shift. Lancet 373: 1054
Darnton AJ, McElvenny DM, Hodgson JT (2006) Estimating the number of asbestos-related lung cancerdeaths in Great Britain from 1980 to 2000. Ann Occup Hyg 50: 29-38
Doll R, Peto R (1981) The cause of cancer. Oxford University Press: Oxford
Doll, R. & Peto, R. (2003). The epidemiology of cancer. In Oxford Textbook of Medicine 4th Edition.
Doll R, Peto R (2005) Epidemiology of cancer. In: Warren DA, Cox TM, Firth JD (Eds.) OxfordTextbook of Medicine, Oxford University Press: Oxford, pp 193-218
Dreyer L, Andersen A, Pukkala E. Avoidable cancers in the Nordic countries. Occupation. APMIS 1997;Supplement 76: 68-79.
Driscoll T, Nelson DI, Steenland K, Leigh J, Concha-Barrientos M, Fingerhut M, Pruss-Ustun A (2005)The global burden of disease due to occupational carcinogens. Amer J Ind Med 48: 419-31
Goldberg M, Imbernon E, Rolland P, Gilg Soit Ilg A, Saves M, de Quillacq A, Frenay C, Chammings S, Arveux P, Boutin C, Launoy G, Pairon J, Astoul P, Galateau-Salle F, Brochard P (2006) The Frenchnational mesothelioma surveillance program. Occup Environ Med 63: 390-395
Goodman, M., Morgan, R.W., Ray, R.M., Malloy, C.D. & Zhao, K. (1999). Cancer in asbestos-exposedoccupational cohorts: a meta-analysis. Cancer Causes and Control, 10, 453-465.
Gregg P, Wadsworth J (2002) Job tenure in Britain, 1975-2000. Is a job for life or just for Christmas? Oxford Bulletin of Economics and Statistics 64:111-134
Greife A, Young R, Carroll M, Sieber W, Pedersen D, Sundin D, Seta J (1995) National Institute forOccupational Safety and Health general industry occupational exposure databases: their structure, capabilities and limitations. Appl Occup Environ Hyg 10: 264-9
58
41
Gustavsson P, Jakobsson R, Nyberg F, Pershagen G, Jarup L, Scheele P. Occupational exposure and lung cancer risk: A population-based case-referent study in Sweden. Amer J Epi 2000;152:32-40.
HSE (1998) Occupational exposure to ionising radiation 1990-1996, analysis of doses reported to the Health and Safety Executive’s Central Index of Dose Information, HMSO, UK
Houseman TS, Feldman SR, Williford PM, Fleischer AB, Goldman ND, Acostamadiedo JM, Chen GJ (2003) Skin cancer is among the most costly of all cancers to treat for the Medicare population. J Am Acad Dermatol 48: 425-9
Howel D, Arblaster L, Swinburne L, Schweiger E, Renvoiz, E, Hatton P (1997) Routes of asbestos exposure and the development of mesothelioma in an English region. Occup Environ Med 54: 403-409
Labour Force Survey. Available at: http://www.statistics.gov.uk/
Langner I, Blettner M, Gundestrup M, Storm H, Aspholm R, Auvinen A, Pukkala E, Hammer GP, Zeeb H, Hrafnkelsson J, Rafnsson V, Tulinius H, Angelis G, Verdecchia A, Haldorsen T, Tveten U, Eliasch H,
Hammer N, Linnersjo A. (2004) Cosmic radiation and cancer mortality among airline pilots: results from a European cohort study (ESCAPE). Radiat Environ Biophys 42(4): 247-256
Landrigan PJ, Markowitz S. Current magnitude of occupational disease in the United States: Estimates for New York. In Occupational health in the 1990s. Developing a platform for disease prevention, Landrigan PJ, Selikoff IJ. (eds) pp. 27-45. Annals of New York Academy of Science: New York, 1989.
Leigh JP, Markowitz SB, Fahs M, Shin C, Landrigan PJ. Occupational injury and illness in the United States. Arch Internal Med, 1997;157:1557-1568.
Levin M (1953) The occurrence of lung cancer in man, Acta Unio Internationalis Contra Cancrum 9: 531-
Lopez AD, Mathers CD, Ezzati M, Jamison DT, Murray CJL (2006) Global and regional burden of disease and risk factors, 2001: systematic analysis of population health data. Lancet 367: 1747-57
Miettinen O (1974) Proportion of disease caused or prevented by a given exposure, trait or intervention. American Journal of Epidemiology 99: 325-332
NRPB (2000) Health risks of radon. National Radiation Protection Board, Chilton, ONS, Census of Employment. Available at: https://www.nomisweb.co.uk/
Nurminen MM, Karjalainen A. Epidemiologic estimate of the proportion of fatalities related to occupational factors in Finland. Scand J Work Environ Health 2001;27:161-213.
Pannett B, Kauppinen T, Toikkanen J, Pedersen J, Young R, Kogevinas M (1998) Occupational Exposure to Carcinogens in Great Britain in 1990-93: Preliminary Results. In Carex: International Information System on Occupational Exposure to Carcinogens. Finnish Institute of Occupational Health, Helsinki
59
Pronk A, Coble J, Stewart PA (2009) Occupational exposure to diesel exhaust: a literature review. J Exp Science Environ Epidem 19: 443-457
Rake C, Gilham C, Hatch J, Darnton A, Hodgson J, Peto J (2009) Occupational, domestic and environmental mesothelioma risks in the British population: a case-control study. B J Cancer 100: 1175-1183
Spirtas R, Heineman EF, Bernstein L, Beebe G, Keehn R, Stark A, Harlow B, Benichou J (1994) Malignant mesothelioma: attributable risk of asbestos exposure. Occup Environ Med 51:804-811
Steenland K, Armstrong B (2006) An overview of methods for calculating the burden of disease due to specific risk factors. Epidemiology 17: 512-519
Steenland K, Burnett C, Lalich N, Ward E, Hurrell J. Dying for work: the magnitude of US mortality from selected causes of death associated with occupation. Amer J Ind Med 2003;43:461-482.
Straif K, Baan R, Grosse Y, Secretan B, El Ghissassi F, Bouvard V, Altieri A, Benbrahim-Tallaa L, Cogliano V (2007) Carcinogenicity of shift-work, painting and firefighting. Lancet Oncology 8(12): 1065-1066
Straif K, Benbrahim-Tallaa, Baan R, Grosse Y, Secretan B, El Ghissassi F, Bouvard V, Guha N, Freeman C, Galichet L, Cogliano V (2009) A review of human carcinogens Part C: metals, arsenic, dust and fibres. Lancet Oncology 10: 453-4
Symanski E, Kupper LL, Rappaport SM (1998a) Comprehensive evaluation of long-term trends in occupational exposure: Part 1. Description of the database. Occup Environ Med 55: 300-309
Symanski E, Kupper LL, Hertz-Picciotto I, Rappaport SM (1998b) Comprehensive evaluation of long-term trends in occupational exposure: Part 2. Predictive models for declining exposures. Occup Environ Med 55: 310-316
Trakatelli M, Ulrich C. del Marmol V, Eudvard S, Stockfleth E, Abeni D (2007) Epidemiology of nonmelanoma skin cancer (NMSC) in Europe: accurate and comparable data are needed for effective public health monitoring and interventions. B J Dermatol 156(Suppl 3): 1-7.
United Nations Scientific Committee on the Effects of Atomic Radiation (2008) Effects of ionising radiation: UNSCEAR 2006, Volume 1, Report to the General Assembly, Annex A, United Nations, New York
Vineis P, Simonato L. Proportion of lung and bladder cancers in males resulting from occupation: a systematic approach. Arch Environ Health 1991;46:6-15.
Wagner GR (2007) The fallout from asbestos. Lancet 369: 973-4
Yates D, Corrin B, Stidolph P, Browne K (1997) Malignant mesothelioma in south east England: clinicopathological experience of 272 cases. Thorax 52: 507-512
60
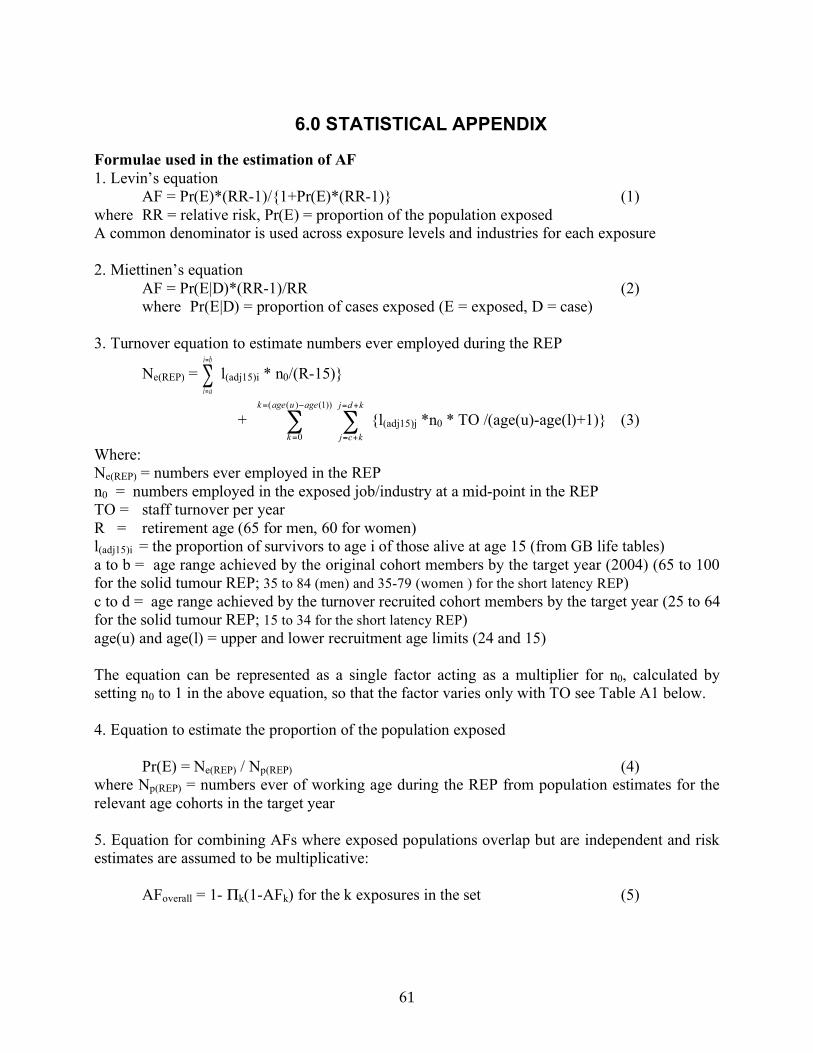
61
6.0 STATISTICAL APPENDIX
Formulae used in the estimation of AF 1. Levin’s equation AF = Pr(E)*(RR-1)/{1+Pr(E)*(RR-1)} (1) where RR = relative risk, Pr(E) = proportion of the population exposed A common denominator is used across exposure levels and industries for each exposure 2. Miettinen’s equation AF = Pr(E|D)*(RR-1)/RR (2) where Pr(E|D) = proportion of cases exposed (E = exposed, D = case) 3. Turnover equation to estimate numbers ever employed during the REP
Ne(REP) = !=
=
bi
ai
l(adj15)i * n0/(R-15)}
+ !"=
=
))1()((
0
ageuagek
k
!+=
+=
kdj
kcj
{l(adj15)j *n0 * TO /(age(u)-age(l)+1)} (3)
Where: Ne(REP) = numbers ever employed in the REP n0 = numbers employed in the exposed job/industry at a mid-point in the REP TO = staff turnover per year R = retirement age (65 for men, 60 for women) l(adj15)i = the proportion of survivors to age i of those alive at age 15 (from GB life tables) a to b = age range achieved by the original cohort members by the target year (2004) (65 to 100 for the solid tumour REP; 35 to 84 (men) and 35-79 (women ) for the short latency REP) c to d = age range achieved by the turnover recruited cohort members by the target year (25 to 64 for the solid tumour REP; 15 to 34 for the short latency REP) age(u) and age(l) = upper and lower recruitment age limits (24 and 15) The equation can be represented as a single factor acting as a multiplier for n0, calculated by setting n0 to 1 in the above equation, so that the factor varies only with TO see Table A1 below. 4. Equation to estimate the proportion of the population exposed Pr(E) = Ne(REP) / Np(REP) (4) where Np(REP) = numbers ever of working age during the REP from population estimates for the relevant age cohorts in the target year 5. Equation for combining AFs where exposed populations overlap but are independent and risk estimates are assumed to be multiplicative: AFoverall = 1- Πk(1-AFk) for the k exposures in the set (5)
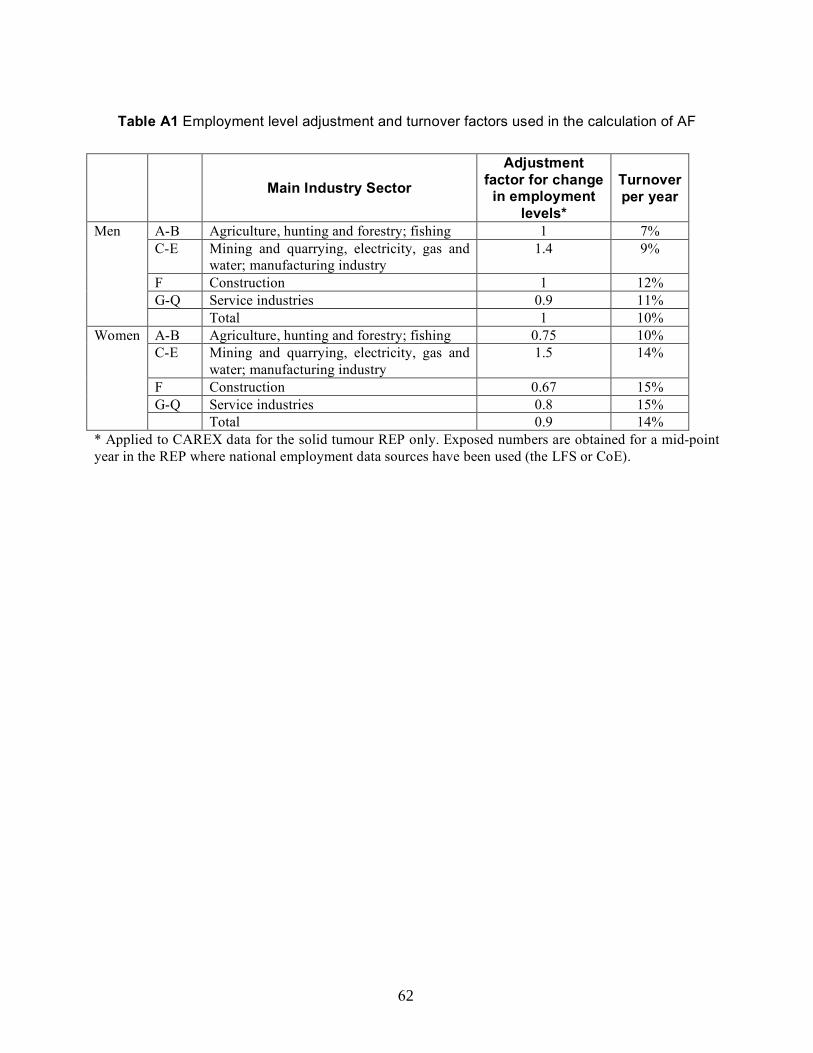
Table A1 Employment level adjustment and turnover factors used in the calculation of AF
Main Industry Sector
Adjustment factor for change
in employment levels*
Turnover per year
A-B Agriculture, hunting and forestry; fishing 1 7% C-E Mining and quarrying, electricity, gas and
water; manufacturing industry 1.4 9%
F Construction 1 12% G-Q Service industries 0.9 11%
Men
Total 1 10% A-B Agriculture, hunting and forestry; fishing 0.75 10% C-E Mining and quarrying, electricity, gas and
water; manufacturing industry 1.5 14%
F Construction 0.67 15% G-Q Service industries 0.8 15%
Women
Total 0.9 14% * Applied to CAREX data for the solid tumour REP only. Exposed numbers are obtained for a mid-point year in the REP where national employment data sources have been used (the LFS or CoE).
62

63

Published by the Health and Safety Executive 04/10
The burden of occupational cancer in Great BritainOverview report
Health and Safety Executive
RR800
www.hse.gov.uk
The aim of this project was to produce an updated estimate of the current burden of occupational cancer specifically for Great Britain. The primary measure of the burden of cancer used in this project was the attributable fraction (AF) ie the proportion of cases that would not have occurred in the absence of exposure; this was then used to estimate the attributable numbers. This involved obtaining data on the risk of the disease due to the exposure of interest, taking into account confounding factors and overlapping exposures, and the proportion of the target population exposed over the period in which relevant exposure occurred. Estimation was carried out for occupational exposures classified by the International Agency for Research on Cancer (IARC) as group 1 (established) and 2A carcinogens (probable).
5.3% (8023) cancer deaths were attributable to occupation in 2005 (men: 8.2% (6366); women 2.3% (1657)). Attributable estimates for total cancer registrations are 13694 (4.0%); and for men: 10074 (5.7%) and women 3620 (2.1%). Occupational attributable fractions are over 2% for mesothelioma, sinonasal, lung, nasopharynx, breast, non-melanoma skin cancer, bladder, oesophagus, soft tissue sarcoma and stomach cancers. Asbestos, shift work, mineral oils, solar radiation, silica, diesel engine exhaust, coal tars and pitches, occupation as a painter or welder, dioxins, environmental tobacco smoke, radon, tetrachloroethylene, arsenic and strong inorganic mists each contribute 100+ registrations. Industries/occupations with high cancer registrations include construction, metalworking, personal/household services, mining, land transport, printing/publishing, retail/hotels/restaurants, public administration/defence, farming and several manufacturing sectors. 56% of cancer registrations in men are attributable to work in the construction industry (mainly mesotheliomas, lung, bladder and non-melanoma skin cancers) and 54% of cancer registrations in women are attributable to shift work (breast cancer).
This project is the first to quantify in detail the burden of cancer due to occupation specifically for GB. There are several sources of uncertainty in the estimates, including exclusion of other potential carcinogenic agents, inaccurate or approximate data and methodological issues. On balance, the estimates are likely to be a conservative estimate of the total attributable burden. Forthcoming reports will present the results for; estimates of Disability-Adjusted Life Years; methods to predict future estimates of the occupational cancers with examples based on important hazards; and the results of sensitivity analysis of these estimates to sources of uncertainty and bias.
This report and the work it describes were funded by the Health and Safety Executive (HSE). Its contents, including any opinions and/or conclusions expressed, are those of the authors alone and do not necessarily reflect HSE policy.