Embed Size (px)
Citation preview

THE BUSINESS CASE FOR POWER GENERATION IN SPACE
FOR TERRESTRIAL APPLICATIONS
Andre Luiz Soresini
The Lauder Institute, University of Pennsylvania
A RESEARCH PAPER
Presented to the Faculties of the University of Pennsylvania in Partial Fulfillment of the
Requirement for the Master of Arts
April 2011
Faculty Advisor: Dr. João (John) Neiva de Figueiredo

ii
TABLE OF CONTENTS
WHY SPACE ENERGY? ............................................................................................................ 1
CONTEXT ..................................................................................................................................... 4
Current Issues ............................................................................................................................... 4
Energy Security ......................................................................................................................................... 4
Climate Change ........................................................................................................................................ 5
Rising Cost and Consumption of Energy .................................................................................................. 6
Vicious Cycle of the Current Energy Generation Model .......................................................................... 8
Endogeneity of Current Energy Generation Options ............................................................... 9
Nuclear Power .......................................................................................................................................... 9
Coal Power Plants .................................................................................................................................. 11
Hydroelectric Plants ............................................................................................................................... 12
Solar Power ............................................................................................................................................ 13
Wind Power ............................................................................................................................................. 15
Historical Background of Solar Power Satellites (SPS) .......................................................... 16
The Cold War, the Space Exploration Programs, and the Oil Crisis in the 70s ..................................... 17
9/11 as an Opportunity to Move away from the Oil/Coal Hold-up Position .......................................... 18
Current Studies ....................................................................................................................................... 20
Advantages & Drawbacks of SPS .............................................................................................. 21
THE TECHNOLOGY OF POWER GENERATION IN SPACE ......................................... 23
Architectures ............................................................................................................................... 23
Sun Tower ............................................................................................................................................... 23
Solar Disc ............................................................................................................................................... 26
Space Satellite Positioning .......................................................................................................... 27
Low Earth Orbit (LEO) ........................................................................................................................... 27
Middle Earth Orbit (MEO) ..................................................................................................................... 28
Geostationary Earth Orbit (GEO) .......................................................................................................... 28
Surface of the Moon ................................................................................................................................ 29
Energy-Capture Methods ........................................................................................................... 30
Photovoltaic ............................................................................................................................................ 30
Solar Dynamic Systems ........................................................................................................................... 32
Power Transmission.................................................................................................................... 33
Radio Frequency ..................................................................................................................................... 33
Laser Beams ............................................................................................................................................ 35
Earth-to-Orbit Transportation (ETO transportation) ............................................................ 36
ECONOMIC VIABILITY OF SPS SYSTEMS ....................................................................... 37
Assessment of Prices ................................................................................................................... 39
Assessment of Costs .................................................................................................................... 40
Financial Model ........................................................................................................................... 41

iii
Sensitivity Analyses ..................................................................................................................... 43
Discount Rate and Corporate Tax Rate .................................................................................................. 44
Retail Price of Electricity and Launch Costs to GEO per kg of Mass Transported ............................... 45
Price of Electricity Growth and Longer than Anticipated SPS Lifespan ................................................ 46
Price of Electricity Growth and Launch Costs to GEO .......................................................................... 47
Possible Future Scenarios........................................................................................................... 49
High Probability Outcome ...................................................................................................................... 49
Medium Probability Outcome ................................................................................................................. 51
POLITICAL FEASIBILITY ..................................................................................................... 52
Political Support: Tax benefits, Government Funding, Public-Private Partnerships.......... 53
International Cooperation.......................................................................................................... 55
CONCLUDING REMARKS ..................................................................................................... 57
EXHIBITS ................................................................................................................................... 60
Exhibit 1 – U.S. Gross Petroleum Imports by country of Origin. Source: U.S. Energy Information
Administration; Analysis: Andre Soresini ............................................................................................... 60
Exhibit 2 – Surface Temperature Analysis. Source: NASA ..................................................................... 61
Exhibit 3 – Nominal and Real Annual Imported Crude Oil Prices. Source: EIA ................................... 62
Exhibit 4 – Total GDP (PPP) vs. Total Energy consumed (quadrillion BTUs) in 2007. Sources: World
Bank, EIA; Analysis: Andre Soresini ...................................................................................................... 63
Exhibit 5 – Greenhouse Gas Emissions from Electricity Production. Source: World Nuclear
Association. ............................................................................................................................................. 64
Exhibit 6 – Solar radiation on the surface of the earth........................................................................... 65
Exhibit 7 – Historical oil prices .............................................................................................................. 66
Exhibit 8 – The Sun Tower SPS Concept ................................................................................................ 67
Exhibit 9 – Artistic Rendering of the Sun Tower..................................................................................... 67
Exhibit 10 – SPS power is beamed directly to a receiving antenna (rectenna) ...................................... 68
Exhibit 11 – A Rectenna could be located either in rural or urban areas .............................................. 68
Exhibit 12 – The Solar Disc SPS concept ............................................................................................... 69
Exhibit 13 – Artistic Rendering of the Solar Disc ................................................................................... 69
Exhibit 14 – Average retail price of electricity in the U.S. in 2009 ........................................................ 70
Exhibit 15 – Worldwide electricity prices for industry ........................................................................... 71
Exhibit 16 – Average worldwide electricity prices ................................................................................. 72
Exhibit 17 – Depiction of the three earth orbits ..................................................................................... 73
Exhibit 18 – From left to right: single-crystal silicon and polycrystalline silicon ................................. 74
Exhibit 19 – GaAs-Solar Panels ............................................................................................................. 74
Exhibit 20 – CdTe Photovoltaic cell Composition .................................................................................. 74
Exhibit 21 – GIGS Photovoltaic cell structure ....................................................................................... 75
Exhibit 22 – a-Si photovoltaic cell composition ..................................................................................... 75
Exhibit 23 – Diagram of a solar dynamic system with water as the working fluid ................................ 76
Exhibit 24 – Average RF output power versus frequency for various electronic devices and
semiconductor systems. ........................................................................................................................... 77

iv
Exhibit 25 – Typical parameters of the transmitting antenna of a SPS. ................................................. 78
Exhibit 26 – Concept demonstration of laser power beaming ................................................................ 78
Exhibit 27 – Examples of Vertical Takeoff and Horizontal Landing (left), Horizontal Takeoff and
Landing (middle), and Vertical Takeoff and Landing (right). ................................................................ 79
Exhibit 28 – Concepts of space elevator (left) and Maglev launching system (right) ............................ 79
Exhibit 29 – Assumptions adopted for the initial financial viability analysis of SPS systems ................ 80
Exhibit 30 – Financial Model for the base-case model with assumptions presented in Exhibit 29 ........ 81
Exhibit 31 – South Korean real interest rates 1971-1991, ..................................................................... 82
Exhibit 32 – Sensitivity Analysis: Real Discount Rate and Corporate Tax Rate .................................... 83
Exhibit 33 – Sensitivity Analysis: Retail Price of Electricity and Transportation Cost to GEO ............ 84
Exhibit 34 – Sensitivity Analysis: Growth of Retail Price of Electricity and SPS Lifespan .................... 85
Exhibit 35 – Sensitivity Analysis: Growth of Retail Price of Electricity and Transportation Costs to
GEO ........................................................................................................................................................ 86
Exhibit 36 – Set of assumptions chosen for the high probability outcome ............................................. 87
Exhibit 37 – Financial model output for the high probability outcome .................................................. 88
Exhibit 38 – Set of assumptions chosen for the medium probability outcome ........................................ 89
Exhibit 39 – Financial model output for the medium probability outcome ............................................ 90
Exhibit 40 – Conceptual Pareto Frontier for currently existing energy sources. ................................... 91
BIBLIOGRAPHY ....................................................................................................................... 92

WHY SPACE ENERGY?
The present paper sheds light on a sustainable power source that has been studied by
NASA since the late-seventies: the Solar Power Satellite (SPS)1, a system which taps solar
energy in outer space and transmits this energy to reception stations on earth. The concept of
SPS systems was first idealized by Dr. Peter Glaser in 1968, amidst the Cold War and the Space
Race. The main goal of the SPS concept is to take advantage of the readily available solar power
that strikes the earth around the clock and, independently of seasonality and other intra-
atmospheric issues, generate energy uninterruptedly in space to be beamed to earth for terrestrial
applications. The main benefit of solar power satellites is the ability to generate electricity
without causing endogenous problems on the surface or the atmosphere of the earth, i.e., it is a
truly exogenous power source.
The motivation for this study is presented in the next section, which focuses on putting
energy security issues in perspective. The section also analyzes the current flawed global model
of energy generation and the fact that economic growth is highly dependent upon a country‟s
ability to expand its energy generation capacity. The endogeneity of currently available power
generating technologies is discussed. Evidence is presented to support the main argument, i.e.,
that all of the existing power generation options, whether fossil-based or renewable, are
inherently endogenous to the Earth. Therefore, all available energy sources depend upon and, in
certain cases, aggravate, rather uncertain long-term environmental conditions for their power
generation capability to perform adequately in steady-state.
1. “Satellite Power System Concept Development and Evaluation Program.” National Space Society, last modified
September 15, 2010, http://www.nss.org/settlement/ssp/library/doe.htm (hereafter cited as NSS, SPS).

2
While achieving short-term the goal of partially avoiding the worsening of environmental
conditions, renewable energy sources still face a great deal of skepticism. Critics have argued
that with rapid worldwide population growth, real estate will not be as easily available in the
future, which might threaten the sustainability of solar power plants, the so-called solar farms.
Scholars have also expressed their skepticism against wind energy, arguing that on-shore wind
farms are undesired by most people, and cite bird mortality as a major shortcoming of this source
of sustainable energy2. Some economists have also argued that biofuels have been forcing
agriculturists to produce fuel instead of food in what in effect is a natural cannibalization of
agricultural goods destined for eating, mankind‟s major source of sustenance. These economists
have said that if this trend continues, the current number of undernourished people, which
amounted to an estimated 925 million people in 2010, will continue to increase3. Besides,
perhaps further exacerbating endogenous problems on the surface of the planet, all of these
renewable energy sources have one weakness in common: they depend upon local environmental
conditions. Windmills depend, for instance, on the seasonality of wind gusts; solar power
depends on the availability of sunshine; biomass, on a combination of frequency of sunshine and
frequency of rain. This means that there is an inherent uncertainty regarding the power
production capability of these resources, which may further increase the risk of blackouts, thus
increasing the needs of coal, oil, or gas-fired power plants to supply the lacking demand for
power that might take place as a result. Additionally, this results in a circular, non-logical
solution for a complex equation, as its result, i.e., the improvement of environmental conditions,
2. “Windmills are killing our birds.” The website of the Wall Street Journal, last modified September 7, 2009,
http://online.wsj.com/article/SB10001424052970203706604574376543308399048.html (hereafter cited as WSJ,
Windmills).
3. “2010 World Hunger and Poverty Facts and Statistics.” World Hunger Organization, accessed September 19,
2010, http://www.worldhunger.org/articles/Learn/world%20hunger%20facts%202002.htm.

3
which is one goal of the CleanTech or Green Products industry, ultimately depends on one basic
variable, i.e., those very environmental conditions in order to achieve the desired results. A
characterization of today‟s energy landscape is presented in the next section, which provides
detailed data, which motivated NASA‟s study of the Solar Power Satellite as a means to
overcome obstacles currently faced by other green energy systems.
After this main motivation for SPS has been thoroughly discussed, and the logical flaws
in the current energy generation model are illustrated, focus is shifted to presenting the
technological possibilities for space-based solar power. The third section provides information
on architectural concepts and the methods for capturing the solar energy in space and beaming it
to Earth, in an attempt to shed light on how some of the main technological concerns for the
development of such an innovative energy generating concept could be addressed. Following this
technological characterization of solar power satellites, an economic viability assessment model
is introduced. Sensitivity analyses are presented, pointing to possible combinations of the most
influential variables, and how these impact the financial base-case model. Possible future
scenarios are then studied, demonstrating the potential of SPS concepts depending on different
stages of technological advancement. Political viability is discussed in the fifth section, which
focuses on the need for joint action among countries around the world for space-based solar
power to become a reality. Finally, concluding remarks are presented. Special focus is given to
SPS‟s unique characteristics of being the only existing power generating concept that is
completely sustainable due to the exogenous nature and ready availability of the virtually infinite
solar energy that strikes the earth atmosphere every day.

4
CONTEXT
In the end of the 90s, the American Physical Society issued a statement regarding its
long-term view of the Energy Situation in the USA. From their point-of-view, the USA should
have adopted a very aggressive plan to cut their consumption of oil then, although the oil costs
back then were still very low (in 1996, for example, one barrel of crude oil cost less than
US$30). Their assessment showed that low-cost oil resources outside the Persian Gulf were
being depleted very rapidly, increasing the likelihood of sudden disruptions in supply4. The
recommendations of the APS to improve the energy consumption scenario in the USA included
the diversification of investments in energy research and development, as well as policies that
promoted efficiency and innovation throughout the energy system. The next subsection will
detail the energy problem with focus on the USA.
Current Issues
Energy Security
Access to increasingly greater amounts of low-cost energy has become fundamental to
the functioning of modern economies. However, the uneven distribution of natural energy
resources among countries has led to formidable vulnerabilities both from the supplier and the
consumer sides. Threats to energy security include political instability of several of the major
global oil suppliers, the cartelization of energy supplies, the competition over energy sources,
attacks on production facilities, as well as accidents and natural disasters5.
4. “Energy: The Forgotten Crisis.” American Physical Society, accessed October 3, 2010,
http://www.aps.org/policy/statements/96_2.cfm.
5. “A New Security Paradigm.” Foreign Policy Journal, last modified September 14, 2009,
http://fletcher.tufts.edu/news/2009/09/opeds/Mylrea-Sept14.shtml.

5
Since APS issued the statement on the Energy Situation of the USA in 1996, a shift has
been noticeable in the pattern of US oil imports. Non-OPEC countries are now responsible for a
larger portion of the oil imported by the US. Exhibit 1 presents the US gross petroleum imports
by country of origin as a percentage of total oil consumed. It is interesting to notice that while
OPEC countries (green-colored countries in the chart) continue to respond for the supply of
roughly 30% of the US oil consumption, non-OPEC countries (blue-colored ones) are now
responsible for the supply of roughly 32% of the oil consumed in the US. This is a sign that the
USA is actually moving away from the extreme oil dependence to OPEC countries, an issue
raised by APS in the late 90s. This clear move from the dependence from OPEC-sourced oil has
led to a major shift towards long-term, reliable neighbor countries, with Canada now being US
largest supplier of oil. Mexico, the UK, and Brazil, also stable nations with strong economic
interests with the USA, have increased immensely its participation in the supply of oil to the
USA since the 1980‟s, as presented in Exhibit 1.
Climate Change
Data collected by various international agencies has showed that climate change is a
global problem that has been increasingly worsening the quality of life on Earth. There is
scientific consensus of global warming, exemplified by Exhibit 2, which presents a chart with
temperature measurements showing that, regardless of geographic location, temperatures are
rising. Nevertheless, potential consequences are much debated, both publicly and politically.
Effects attributed to global warming include physical, ecological, social, and economic
changes. While physical and ecological consequences range from extreme weather changes and
glacier retreat to ocean acidification and the rise of sea level, social issues include impact on the
food supply (due to the elevated concentration of CO2 in the atmosphere, higher temperatures,

6
altered precipitation, and the increased frequency of extreme events) and on health (changes in
water, air and food quality, as well as changes in weather patterns). Scholars have argued that
political risks and conflicts can arise due to heightened competition over natural resources of
increased scarcity6,7
.
Most of the green sources of energy explored around the world in the time being could,
however, intensify political risks and conflicts. There is inherent interest in specific windy or
sunny locations, as they can yield higher energy productivity for renewable energy sources.
However, these locations are also optimal for food production or the settlement of populations.
Therefore, it is also consensus, to some extent, that there is only one possible solution to this
imminent set of problems, which is the reduction in the CO2 emissions from human-related
activities.
Rising Cost and Consumption of Energy
Exhibit 3 presents both nominal and real (CPI-adjusted) crude oil prices over the last
forty years. Current real prices of crude oil are only comparable to the ones observed during the
Iranian Revolution from the late-70s to the early-80s. While it is well known that supply and
demand alone are not the only predictors of oil prices, the cartelization of the industry prevents
countries from completely protecting themselves against unexpected price peaks, despite the
short- and medium-term palliative solution of hedging through financial derivatives.
While the rising cost of energy is an unpredictable variable, it is one that strongly
influences the economic growth of a country. This is because a country‟s GDP is directly
correlated to its energy consumption (see Exhibit 4). As a country‟s economic output grows, the
6. Wilbanks, T.J. et al. “Industry, settlement and society.” Parry, 2007: 357-390.
7. Zhang, D.; Brecke, P.; Lee, H.; He, Y.; Zhang, J. (2007) “Global climate change, war, and population decline in
recent human history”. Proceedings of the National Academy of Sciences of the United States of America 104 (49):
19214-19219. http://www.ncbi.nlm.nih.gov/pmc/articles/PMC2148270/?tool=pmcentrez.

7
country will necessarily require greater energy consumption. To illustrate this point, linear
regressions between these variables were run from the early 1980‟s through 2007. For example,
the regression of the last year, for which data were fully available (2007), is displayed in Exhibit
4. The correlation between total GDP (in PPP terms) and total primary energy consumption for
that year is roughly 0.95.
It is important to highlight the fact that the presence of the USA within the dataset greatly
influences the regression‟s fit curve, its statistical significance, and the resulting predicted curve.
This paper attempts to understand the USA‟s effect in the global context, and how the US‟s
energy patterns impact the energy consumption trend of emerging markets. By including the US
in the regression, the fact that the USA plays a very important role in the current analysis is
acknowledged, as its presence greatly influences future outcomes for emerging economies. The
US has been emerging economies‟ major role-model of economic success and growth, and
therefore might be a good representation of what lies ahead for them if energy consumption
patterns do not change.
As shown in Exhibit 4, the direct correlation between a country‟s economic growth and
its consumption of energy is highly statistically significant. However, the ability of a country to
increase its primary energy production (and consequently its consumption) depends on the cost
of adding capacity to its portfolio of power generation plants. If the fuel of choice is not readily
available, a country‟s dependence on the international, cartelized costs of coal, oil, and gas might
lead to road blocks in a country‟s development efforts. One of the fundamental issues for a
country willing to grow economically is its capacity to generate more power, and therefore, the
internationally observed cost of energy-related commodities plays a major role in determining
the likelihood of a country‟s success in achieving lasting GDP growth.

8
Finally, with the rapid rise of emerging economies, and the even faster growth of the
worldwide middle class, organic energy consumption growth rate is expected to increase, thus
greatly impacting power generation capacity requirements. Studies show that there are roughly
two billion people who are not yet connected to electric power grids8. As countries grow
economically, it is expected that the electric infrastructure will have more capillarity with deeper
penetration. This imminent increase in the penetration of electricity among lower classes in
developing nations will boost demand for electricity in the coming years to an unprecedented
level and require substantial improvement in the quality and quantity of power output all over the
world.
Vicious Cycle of the Current Energy Generation Model
There is a direct correlation between GDP growth and growth in power consumption, as
detailed above. Therefore, the quick rise of emerging economies has been seen as a real threat in
terms of emissions of pollutants and its inherent consequences as several of these economies rely
on fossil fuels. Issues such as the unavoidable exhaustion of natural reserves, the implicit rising
cost of power-related commodities such as oil and coal, and energy security needs have only
aggravated with the enormous increase in global power consumption as emerging economies
have grown in recent decades. These factors have combined to form a vicious cycle in the
current energy generation model, i.e., more energy produced leads to more negative
environmental impact and more negative environmental impact leads to higher global energy
requirements, because there is a resulting need to try to address the negative impact directly
through corrective or adaptive expenditures to more extreme weather conditions.
8. Mankins, J.C., “A Fresh Look at Space Solar Power: New Architectures, Concepts and Technologies”, 38
th
International Astronautical Federation, 1997 (hereafter cited as Mankins, Fresh Look).

9
Planet Earth is the only viable habitat for human beings (thus far), so any impact on the
surface of the earth or its atmosphere can be considered an endogenous problem – endogenous to
our habitat, our environment - with potential impact to our survivability. There is only one way
to reduce the worsening conditions that arise from the increase in the generation and
consumption of energy (however it is produced), which is to somehow manage to transform this
inherently endogenous issue into an exogenous one. This is one of the main goals of a Solar
Power Satellite, i.e., to generate power in such a way that it does not depend on endogenous
variables (e.g., availability of fossil fuels, wind, sunlight, and water), therefore without causing
any potential harm to our habitat, the Earth.
The next subsection describes some of the best known options available for energy
generation and briefly discusses the advantages and drawbacks of each.
Endogeneity of Current Energy Generation Options
Nuclear Power
Nuclear power plants are a great solution for the CO2 issue. They are able to emit up to
98% less CO2 per KWh of electricity generated than coal power plants9, 10
. Nevertheless, nuclear
power plants are probably the source of energy that faces the greatest resistance from the society.
From the bad image caused by the accident of Chernobyl in 1986 (and the related popular
manifestations such as the NIMBY – Not in my backyard – movement) to today‟s improved
security measures, enhanced technological systems and plant‟s efficiency, a lot has changed,
except for the population acceptance. In 1987, only a year after the Chernobyl accident, Italy
9. Spadaro, Joseph V. et al (2000) “Greenhouse Gas Emissions of Electricity Generation Chains – Assessing the
Difference”. International Atomic Energy Agency.
http://www.iaea.org/Publications/Magazines/Bulletin/Bull422/article4.pdf .
10. “Greenhouse Gas Emissions from Power Generation.” World Nuclear Association, accessed October 3, 2010,
http://www.world-nuclear.org/why/greenhouse_gas_from_generation.html (hereafter cited as WNA, Emissions).

10
held a referendum, in which the Italians decided to phase out Italy‟s power plants. It took almost
two decades for Italy to, despite public criticism, pursue the development of a new generation of
nuclear power plants. The March 11th
2011 earthquake off the coast of Japan and the damage
sustained by the Fukushima nuclear reactors has more recently contributed to the public fears. At
this writing there was much still uncertain, but it was clear that one of the consequences of the
Japanese earthquake and its resulting nuclear accident would be a complete reassessment of
nuclear power.
According to public acceptance surveys carried out by the International Atomic Energy
Agency (IAEA), while 70% of the UK population strongly opposed the development of nuclear
power plants within the UK in 1987 (short after the Chernobyl accident), in 2009 only 35% were
opposed to nuclear power, whereas roughly 50% were in favor of nuclear power in 2009. An
even stronger trend was noticed in the USA, with roughly 20% of the American population
opposing power plants in 2009 against 65% in favor of its careful development11
.
Although recent surveys have indicated an increase in public acceptance for nuclear
power plants, the recent earthquake in Japan, and its subsequent tsunami, has cooled public
acceptance12
, by showing the world how powerless mankind is when it comes to environmental
disasters. With the worsening of environmental conditions and the increased likelihood of
extreme weather events, nuclear power plants might be seen as major potential threats, ready to
cause catastrophic impacts where they are located and surroundings.
11. “Dealing with Public Acceptance for Nuclear Power.” International Atomic Energy Agency, last modified
September 23, 2008, http://www.iea.org/work/2008/bangkok/toth_acceptance.pdf.
12. “Japan‟s Disaster May Cool U.S. Acceptance of Nuclear Power.” LiveScience Website, accessed March 27,
2011, http://www.livescience.com/13240-japan-disaster-sway-perception-nuclear-power.html.

11
Another major issue on nuclear power plants is the large generation of nuclear waste,
whose decay process into acceptable radioactive levels takes hundreds of years. Throughout
these years, a safe, enclosed environment is needed. These enclosed environments might be
targets for terrorism, might suffer from extreme weather conditions, or from cataclysms, and any
leakage could have catastrophic proportions.
Coal Power Plants
Due to its ready availability and the relatively low complexity of its plants, coal is still
seen as an easy fix to increasingly growing energy needs, such as in the recent industrialization
process carried out by China. For example, in 2010 China added a new coal-fired plant every 10
days13
. This incredible growth in the Chinese electricity generation capacity mainly through
coal-fired power plants has led China to take the lead as the world‟s greatest emitter of
greenhouse gases.
Coal is still the first solution to the increasing power needs of growing economies
primarily due to its low cost. The direct correlation between economic growth and a country‟s
ability to produce more energy leads emerging economies to look for solutions that are
economically viable in the short-run to support and maintain their economic growth. Exhibit 5
presents a range of CO2 emissions per KWh of electricity generated for each type of power plant
presented in this chapter. Although technologies lowering the CO2 emissions of coal power
plants have been developed, coal is still by far the energy source that causes the greatest
environmental impact in terms of greenhouse emissions, i.e., coal is causing the greatest
endogenous impact of all energy sources listed in this paper. Besides the large emissions of CO2
per KWh of electricity generated, coal plants also face resistance in the coal producing locations.
13. “Pollution from Chinese Coal Casts a Global Shadow.” The website of The New York Times, last modified June
11, 2006, http://www.nytimes.com/2006/06/11/business/worldbusiness/11chinacoal.html.

12
Local populations have been fighting against the environmental impact of coal mining, from
human worker conditions to mountaintop removal to the destruction of vegetation and regional
landscapes.
Hydroelectric Plants
Hydropower is the most widely used form of renewable energy. In 2008, it accounted for
85% of electricity from renewable sources14
. One of the biggest advantages of hydropower is its
virtual independence from fuel-related commodity cost increases, allowing a country to reach
independence in terms of imported energy-related commodities, such as oil, coal, or natural gas.
If well maintained, hydroelectric power plants also enjoy a long life cycle (that can range
anywhere from fifty to a hundred years of operating life). CO2 emissions levels are also very
low, and are originated almost entirely from lifecycle causes (i.e. construction and maintenance
rather than from operations, unlike coal and gas plants).
Although hydropower enjoys a very high level of acceptance among populations in most
parts of the world, it presents some major drawbacks, such as environmental impact, loss of land,
population relocation needs, and the constant risk of a catastrophe in case of a major failure in
dam structure. The most common cause of mobilization from non-governmental environmental
organizations is the environmental impact and the loss of productive lands that the construction
of major hydroelectric power plants cause. A hydropower plant usually requires a large reservoir.
This requires a large area to be inundated, virtually always destroying biologically rich and
productive lowlands. The second biggest concern is the need to dislocate people from their
original habitats. It is estimated that 40-80 million people have been physically displaced as a
14. “Renewables 2010 – Global Status Report.” Renewable Energy Policy Network for the 21
st Century, accessed
September 19, 2010,
http://www.ren21.net/Portals/97/documents/GSR/REN21_GSR_2010_full_revised%20Sept2010.pdf (hereafter
cited as Renewables 2010).

13
direct result of dam constructions worldwide15
. Finally, the collapse of a dam can cause very
large areas to be submerged, impacting local populations. Furthermore, dams have been target of
sabotage, terrorism, and war efforts, such as Operation Chastise in World War II, carried out by
the British Air Force to destroy German Dams that provided not only electricity to major
industrial towns, but also potable water to the neighboring populations16
.
Solar Power
One of the main advantages of solar power is that its adopter becomes less dependent on
fossil fuel supplies, its cartelized players, and resulting uncertain costs. One additional advantage
of solar power is the use of existing unused real estate as its infrastructure, especially in single-
family houses, where it is usually installed on rooftops, eliminating the problem of finding the
required space for solar panels. It is also considered a very clean technology, as it produces
virtually no CO2 while generating electricity (although it does have larger emissions than wind,
hydro, and nuclear throughout its life) and no noise. Its economical viability is also a crucial
decision factor for adopters, who usually see their initial investment breakeven in a couple of
years.
Solar panels also have a major drawback – their dependence on local weather conditions.
Solar power efficiency is dependent on the availability of sunshine and seasonal factors (winters
have fewer daily hours available for energy production than summers). Weather predictability
helps this system be more efficient. Weather is more predictable to the extent that less extreme
weather patterns occur. Lower greenhouse emissions help extreme weather patterns be reduced
15. “The World Commission on Dams Framework – A Brief Introduction.” International rivers organization, last
modified February 29, 2008, http://www.internationalrivers.org/en/way-forward/world-commission-dams/world-
commission-dams-framework-brief-introduction.
16. “Operation Chastise.” The Dambusters Website, accessed October 4, 2010,
http://www.thedambusters.org.uk/chastise_index.html.

14
and, in order for this goal to be reached, renewable sources of energy are needed. In other words,
solar panels depend upon the local environmental conditions where they are installed – although
they are mostly adopted as a means to reduce the environmental impact that the generation of
electricity creates. This can be viewed as a circular reference, i.e., the variable you try to
determine is dependent upon itself.
Several variables influence the efficiency of solar power, such as pollution, the
assumption that sunlight will always be available in the same location (i.e. nothing can block the
sunlight that is supposed to be absorbed by the solar panels to generate electricity), and the
degradation of solar panels over its life cycle (on average 2 to 3% per year17
). This means that
solar panels are expected to halve its electricity generating capacity in anywhere from 24 to 36
years, which has significant impact to the investor, as additional sources will be needed to cover
these losses in capacity to produce electricity, while consumption will likely continue to grow
over time. Also, this means that reinvestments are needed in order for a certain location to
continue producing the same amount of electricity.
Finally, a major issue faced by big investors concerns real estate availability where
electricity is most needed. Although several stakeholders, such as governments, societies,
industrial firms, etc., have quickly accepted the concept of solar farms, the availability of
reasonably low-cost real estate is a major hurdle for a solar farm to be economically and
financially viable. And this issue, already mentioned above, faces skepticism from specialists
and especially from non-governmental organizations focusing on fighting hunger and
undernourishment. These organizations believe that the use of large areas of land that receive a
17. “Photovoltaic Panels Efficiency Degradation Factors.” Renewable Energy Sources Website, accessed October 3,
2010, http://www.renewable-energy-sources.com/2009/07/30/pv-panels-efficiency-degradation-factors/.

15
great influx of sunlight could better be used for agricultural production, so as to help reduce the
large number of undernourished people. This is especially relevant in tropical areas, in which
poverty levels are higher, as exemplified by the DESERTEC project, which intends to produce a
vast amount of electricity in North Africa to cope with the increase in the European demand18
.
Although the North-African nations targeted for the DESERTEC project have most of their
territories covered by the Sahara desert, with the proper availability of energy, farms could be
established, as water could be pumped inland for agricultural purposes or for the needed
improvement of quality of life in that area of the globe.
Wind Power
Wind and solar power share two similar advantages – the capacity to generate electricity
in remote areas that are not covered by national electricity grids, and the fact that these sources
of energy are readily available in nature at no cost. Also, because it takes up only a relatively
small plot of land, wind power has quickly spread out, especially across Europe. Besides its size
and generation capability, wind energy has seen an immense growth fueled by government tax
rebates and other incentives. This is one of the greatest incentives for investors to develop and
install this technology – in general, it takes an average of 10 years for an investor to break even
its initial investment in the windmills, as long as governments maintain the tax incentives and
keep on protecting the indigenous players as they have been doing thus far.
Although the wind power industry has seen 112% growth worldwide from 2006 to 2010,
and is expected to grow roughly 800% through 203019
, it faces some skepticism from critics and
specialists in the energy industry. First, the ten-year break even period depends on the local wind
18. “DESERTEC Foundation.” The Website of the Desertec Project, accessed September 19, 2010,
http://www.desertec.org.
19. “Global Cumulative Wind Power Capacity.” Global Wind Energy Council, accessed October 4, 2010,
http://www.gwec.net/fileadmin/images/Publications/Global_cumulative_wind_power_capacity.jpg.
16
speeds averaging ten miles per hour for long periods of time, besides subsidies. Locations where
the wind speed reaches this average are usually places where there is a high likelihood of strong
storms – in which case a windmill could work as a lightning rod, attracting lightning due to its
height. Once windmills are struck by lightning, both their structure and their capability of
generating power are subject to damage. Therefore, the expected time to breakeven can actually
vary widely, and maintenance costs can pose major threats to its economic viability, even with
governmental tax benefits. Another frequent source of complaints from people who live nearby
windmills is the noise, which is inversely proportional to the wind speed – i.e. the lower the
speed, the noisier the windmill. This invariably causes an even worse perception on neighboring
communities. In addition to these common complaints faced by the wind turbine industry, wind
turbines are also perceived as bird-killer agents20
that interrupt birds‟ migratory paths by being
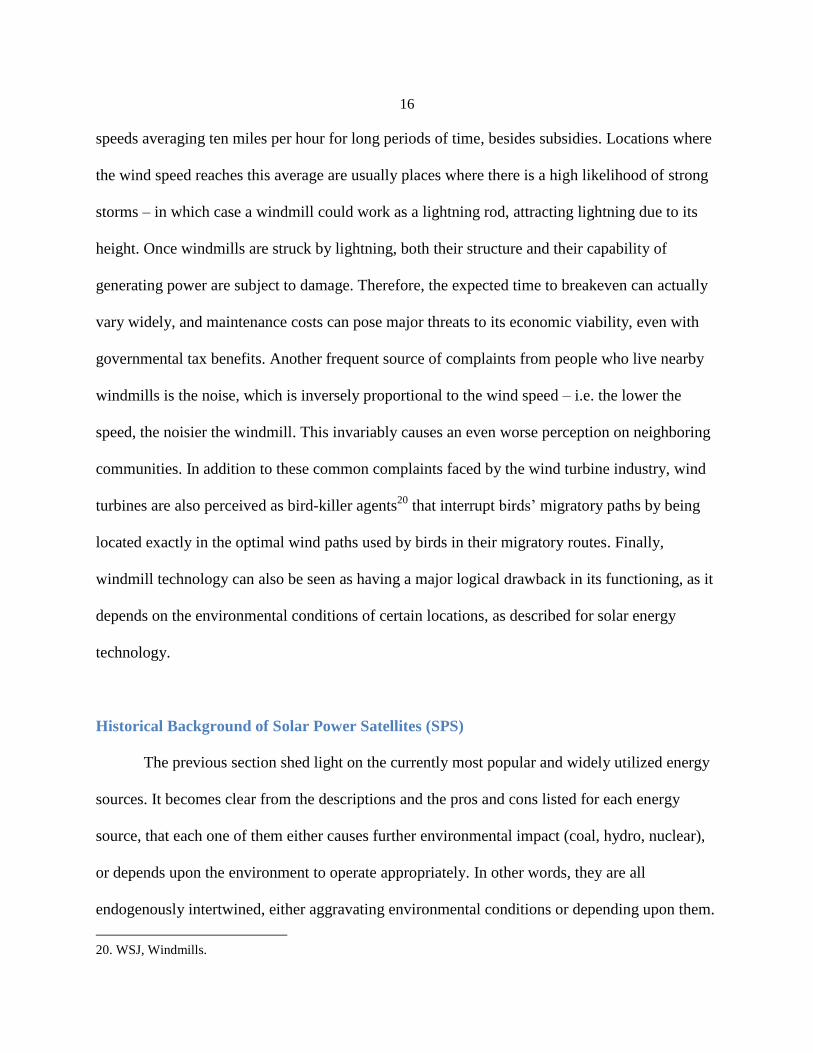
located exactly in the optimal wind paths used by birds in their migratory routes. Finally,
windmill technology can also be seen as having a major logical drawback in its functioning, as it
depends on the environmental conditions of certain locations, as described for solar energy
technology.
Historical Background of Solar Power Satellites (SPS)
The previous section shed light on the currently most popular and widely utilized energy
sources. It becomes clear from the descriptions and the pros and cons listed for each energy
source, that each one of them either causes further environmental impact (coal, hydro, nuclear),
or depends upon the environment to operate appropriately. In other words, they are all
endogenously intertwined, either aggravating environmental conditions or depending upon them.
20. WSJ, Windmills.

17
Since none of the options available present an optimal solution for the energy issues
currently faced by most nations around the world, it becomes crucial that new technologies
emerge. The objective of this section is to explain the historical and strategic reasons that caused
the idea of Solar Power Satellites systems to surface, and how this purely exogenous power
source can help reshape energy generation. This section also briefly comments on current studies
being carried out in this field, and identifies some critical developmental breakthroughs that are
expected to happen in the years ahead.
The Cold War, the Space Exploration Programs, and the Oil Crisis in the 70s
The unique possibility of generating large amounts of energy in space to be beamed by
satellites for terrestrial applications was first suggested during the Cold War. At that time, both
the Soviet Union and the USA were engaged in a fierce competition for space exploration. Major
technological breakthroughs were achieved in the late sixties, which enabled the Soviet Union to
send the first man to space, and the USA to land the first man on the surface of the moon. The
availability of advanced space and satellite technologies enabled scientists to envision concepts
of power generation in space to be beamed down to earth for various terrestrial applications. The
energy shortages of 1973 revitalized conceptual discussions that had begun in the late sixties –
the USA needed a higher level of energy security to drive economic growth. In early 1976, the
Department of Energy (DOE) and NASA initiated an SPS concept development and evaluation
program21
.
Following the joint study conducted by the DOE and NASA from 1976 through 1980, a
preliminary concept was created, and several recommendations were made, with suggestions
regarding next steps, so that the concept could be refined and further developed. The preliminary
21. NSS, SPS.

18
concept resembled that which was suggested by Dr. Peter E. Glaser in 196822
. It was constituted
of a primary electrical source that involved generating electrical power from solar energy in a
geosynchronous orbit, transmitting the power to earth via focused microwave beams, and
collecting and converting the microwave beams into useful electricity on the earth‟s surface
through receiving antennas (rectennas). Additional modular features were considered and
analyzed, and although the document contained a vast amount of detailed information, the
technological breakthroughs required for such a system to operate optimally had not yet been
developed enough. Assumptions made in that report estimated that the concept could become a
reality by the year 2000. The concept was therefore then stored for later use, once additional
breakthroughs allowed it to become a technologically feasible energy source.
9/11 as an Opportunity to Move away from the Oil/Coal Hold-up Position
Strategically speaking, there could have been no better moment to further develop such a
complex energy generating source than the post-9/11 period. Counting with extremely high
public support and the full commitment of tax-payers and industrialists, this point in time could
have marked the beginning of a new era of space exploration to take advantage of the virtually
infinite amount of energy which is independent from seasonal factors and local weather
conditions. The intensity of radiation intercepted in the near-Earth space is about 1.35KW/m2, on
average roughly 580% higher than the radiation that strikes the earth‟s surface23
. Exhibit 6 shows
the seasonality of solar radiation that strikes the earth due to the inherent solstice-equinox
positioning of the earth along its orbit around the sun.
22. Dr. Glaser, Peter E., “Power from the Sun – Its Future”. Science, Vol. 162, November 22, 1968, pp 857-861.
23. Dr. Lior, Noam. “Power from space”. Energy conversion and management 42, 2001 (hereafter cited as NL,
Power from Space).

19
With the economic downturn that followed the terrorist attacks to the World Trade
Center, oil prices plummeted. Exhibit 7 presents a set of historical data on oil prices from 1970
through 2009 (in 2008 USD). Although public support and investments could have been directed
towards the development of SPS so as to reduce the U.S. dependence on foreign energy-related
commodities (especially from the highly cartelized OPEC countries), the lower prices of fossil
fuel commodities due to much reduced demand caused most decision-makers (including SPS
stakeholders) to maintain reliance on oil.
While there has not been significant focus to further develop SPS, even with investments
that are several orders of magnitude lower than the investments directed towards other renewable
energy sources, important developments took place in the 1990‟s. That point in time marked a
series of studies (by NASA, Boeing, and other government-sponsored agencies), which started
redeeming the popularity of the concept of Solar Power Satellites.
Funds have not been made available to develop space-based solar power concepts. In the
last three decades, NASA and the Department of Energy have collectively spent $80M on SPS
studies, whereas nuclear fusion developments received $21B of investments in the same
timeframe.24
While first studies pointed out to financial and economic factors as the major
difficulties in the development of SPS, these early studies relied on the simple extrapolation of
oil prices, which pointed out to a slightly positive-sloped curve, indicating a small increment in
prices over time. In the decade since 9/11, this scenario has changed considerably. Oil prices
skyrocketed from $15/barrel to over $145/ barrel25
in less than a decade. SPS systems seem like
24. “Space-Based Solar Power as an Opportunity for Strategic Security”. National Security Space Office, last
modified October 10, 2007, http://www.nss.org/settlement/ssp/library/nsso.htm (hereafter cited as NSSO, SBSP).
25. Price at the closing of the trading session on the New York Mercantile Exchange on July 3rd 2008.

20
a much more attractive proposition from an economic standpoint in early 2011 than in 2001, as
its competing energy sources have seen a ten-fold rise in costs.
Current Studies
A detailed study conducted in 2007 by the National Security Space Office (NSSO) on the
technical, strategic, economic and financial feasibility of Space-Based Solar Power reached
several conclusions. First, that the strategic opportunity offered by SPS could significantly
advance US and partner security, capability, and freedom of action, which in turn could further
draw attention from both public and private sector investments. Second, although some technical
issues remain partially unanswered, such an energy source is more executable now than ever
before due to recent technological advancements. Third, it suggests that a proof-of-concept
prototype could further increase chances of private investments as well as international
cooperation, so as to mitigate some of the technological risks raised so far.
Following these conclusions, several new studies arose, and a number of private firms
began to heavily invest time, expertise, and resources into this technology. The high visibility
caused by recent discussions and developments in this area spurred interest from U.S. state
governments, with the goal of minimizing dependence on oil, coal, and gas, while mitigating
risks of further environmental impact. For example, the government of California has signed a
contract for procurement of Renewable Energy Resources with Solaren Corporation, which will
provide the State of California with power generated in Space by SPS and beamed to earth for
terrestrial applications by 201626
. This agreement is the first of its kind, and can pave the way to
a new wave of investments from the private sector in this field of technology, providing the U.S.
26. “Contract for Procurement of Renewable Energy Resources Resulting from PG&E‟s Power Purchase Agreement
with Solaren Corporation.“ Public Utilities Commission of the State of California, December 3, 2009,
http://docs.cpuc.ca.gov/PUBLISHED/FINAL_RESOLUTION/110808.htm (hereafter cited as PG&E PPA).

21
with a head-start in this cutting-edge new era of space exploration, with sustainable and
renewable energy-generating objectives.
Other private investments can be found in different countries, from Japan27
to the United
Kingdom28
, and studies have been converging in terms of technology choices, and even in terms
of economic and financial viability. These developments signal that the 40-year old concept of
Space-Based Solar Power can become reality in the current decade if, among other pre-
requisites, countries align efforts, if appropriate policies are put in place, and if similar incentives
as the ones given to nuclear fusion, wind, and solar power, are provided.
Advantages & Drawbacks of SPS
While most issues raised as potential challenges for the development of SPS are directly
related to costs (development, production, launching, and maintenance costs, to name a few),
other drawbacks are worth mentioning. For example, power collected by solar arrays needs to be
electromagnetically beamed to earth for terrestrial use. However, this technology has not been
extensively tested yet (at least not in this order of magnitude), and could be a potential hurdle to
the development of SPS. Also, since the SPS is expected to orbit around the earth, it faces
potential damages by meteorites and cosmic dust. Finally, international agreements have to be
made on space use and power distribution.
Although some risks mentioned above deserve careful and thorough assessment, so as to
mitigate these potential drawbacks of Space-Based Solar Power systems, SPS systems present a
27. “Solarbird Space Systems.” The Mitsubishi Electric Website, accessed October 4, 2010,
http://global.mitsubishielectric.com/bu/space/rd/solarbird/index.html.
28. “Energy market drivers behind Space Solar Power.” The Powersat Corporation Website, accessed October 4,
2010, http://www.powersat.com/.
22
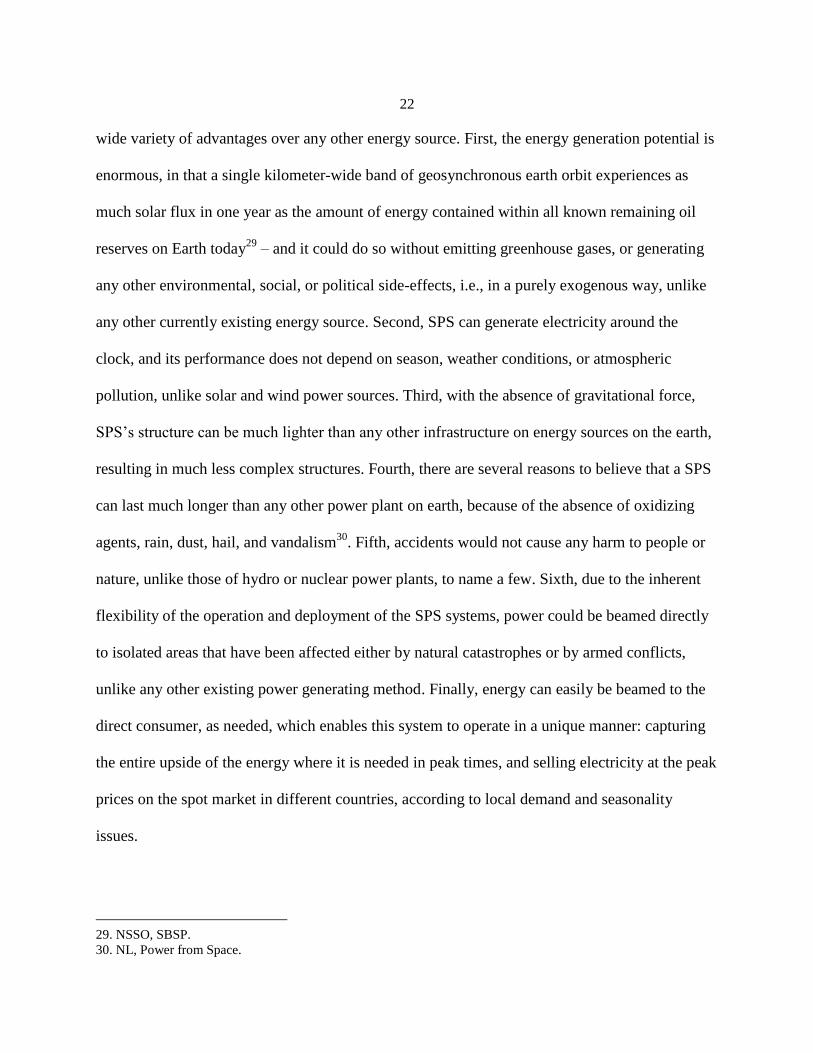
wide variety of advantages over any other energy source. First, the energy generation potential is
enormous, in that a single kilometer-wide band of geosynchronous earth orbit experiences as
much solar flux in one year as the amount of energy contained within all known remaining oil
reserves on Earth today29
– and it could do so without emitting greenhouse gases, or generating
any other environmental, social, or political side-effects, i.e., in a purely exogenous way, unlike
any other currently existing energy source. Second, SPS can generate electricity around the
clock, and its performance does not depend on season, weather conditions, or atmospheric
pollution, unlike solar and wind power sources. Third, with the absence of gravitational force,
SPS‟s structure can be much lighter than any other infrastructure on energy sources on the earth,
resulting in much less complex structures. Fourth, there are several reasons to believe that a SPS
can last much longer than any other power plant on earth, because of the absence of oxidizing
agents, rain, dust, hail, and vandalism30
. Fifth, accidents would not cause any harm to people or
nature, unlike those of hydro or nuclear power plants, to name a few. Sixth, due to the inherent
flexibility of the operation and deployment of the SPS systems, power could be beamed directly
to isolated areas that have been affected either by natural catastrophes or by armed conflicts,
unlike any other existing power generating method. Finally, energy can easily be beamed to the
direct consumer, as needed, which enables this system to operate in a unique manner: capturing
the entire upside of the energy where it is needed in peak times, and selling electricity at the peak
prices on the spot market in different countries, according to local demand and seasonality
issues.
29. NSSO, SBSP.
30. NL, Power from Space.

23
THE TECHNOLOGY OF POWER GENERATION IN SPACE
The previous sections of this paper have set the foundations to understand why a reliable,
secure, expandable, non-polluting, truly exogenous source of energy is a global necessity. Space-
Based Solar Power is very well positioned to capture this opportunity and become the leading
source of electricity around the world in the future. This section sheds light on the technological
concept of Solar Power Satellites which has very simple basic idea: to place very large solar
arrays into earth orbit, collect large amounts of electrical energy, electromagnetically beam this
energy to Earth, and receive it on the surface for terrestrial uses31
.
Architectures
Two SPS architectures are described in this paper: the Sun Tower and the Solar Disc.
NASA and Boeing have studied extensively both concepts in the past decades, and published a
vast amount of papers on these emerging technologies. The descriptions are largely based on
Mankins‟ “Fresh Look at Space Solar Power” paper published in the late 1990s, and further
analyzed and detailed in the NSSO study of 2007.
Sun Tower
The SunTower concept involves four major components: the backbone, the solar power
arrays, the transmitting phased array, and other miscellaneous elements. A gravity gradient
tether-backbone is deployed as part of the tension-stabilized structure design. The backbone is 15
km long and connected to 340 pairs of solar collectors and a circular transmission array facing
earth. Each solar collector is 50-60 meters in diagonal with 1MW net electrical output. The
transmitter is 200-300 meters in diagonal with a transmitting frequency of 5.8GHz. Electronic
31. NSSO, SBSP.

24
beam steering instead of mechanical pointing is used to guide the radio frequency (RF) beam.
The system would initially be deployed in low earth orbit (LEO) and later be migrated to a
higher Earth orbit, either middle earth orbit (MEO), or geostationary earth orbit (GEO). It would
be located in a sun-synchronous orbit, so a solar pointing system would not be required. Exhibit
8 depicts the Sun Tower SPS concept, as envisioned by Mankins, and Exhibit 9 presents an
artistic rendering of the Sun Tower system.
Due to the extensive modularity of the design, relatively small individual systems can be
built and tested with existing facilities, and the manufacturing of the actual SunTower can be
done in a mass production style, benefiting from the economies of scale provided by the large
amount of solar panels or other components needed. Heavy Lift Launch Vehicles (HLLV)
transporting the four components separately are suggested as a means to minimize the costs
associated with launching the SunTower into space. However, combining and stabilizing the four
parts in space would require either assembly by personnel or equipment, which could imply high
costs, or very elaborate kinetically deployed mechanical systems, which can be exceptionally
complex and involve large risks32
.
The general design of the ground receiver is a rectifying antenna (rectenna). It would be a
4km diameter site with direct electrical feed into a commercial power utilities interface (Exhibit
10 presents an image of what a rectenna would look like). Exhibit 11 shows a potential location
of a rectenna, on the suburbs of a major city. Once the beam is intercepted by the rectenna, it is
converted back into electricity. The electricity is then rectified to alternating current (AC), and
32. Mankins, J.C. “A technical overview of the „SunTower‟ solar power satellite concept”. Acta Astronautica 50
(2002): 369-377.

25
fed into the power grid33
. Although rectennas require a large piece of land in which to be
installed, it is important to highlight that the piece of land utilized for the rectenna does not
necessarily need to go unused. Since the intercepting array absorbs the microwaves, but allows
sunlight and rainfall through, the land could be used for farming or ranching without causing any
harm to plants or people underneath. Alternatively, the rectenna could be built as a vast set of
greenhouses34
, in which case the rectenna would serve multiple purposes: intercepting and
converting the power beamed from space, and enabling greenhouses to be installed underneath,
creating a potentially optimal environment for food to be grown. This is an important advantage
of the SPS system versus any other green energy source. As previously mentioned in this paper,
other sources of green energy bring with them inherent endogenous issues, e.g., the use of a
potentially productive piece of land for the production of energy to be consumed by richer
countries, in what can be seen as cannibalization of land, where a silent auction takes place
backstage between hungry, impoverished countries, and richer countries in need of additional
sources of energy. Developed nations, with aligned needs and similar goals could outbid local
agricultural or real-estate players in an unethical, but potentially realistic scenario of dispute for
specific pieces of land that are especially suitable for the installation of solar, wind, or
hydropower plants. This effect of globalization is rather negative for impoverished nations,
where the main focus is on survivability rather than on protecting their assets. In other words,
sometimes economic incentives are misaligned with environmental goals.
33. “The Space Settlement Art Gallery”, accessed September 19, 2010, http://space.mike-combs.com/gallery.htm
(hereafter cited as SSAG).
34. SSAG.

26
Solar Disc
The Solar Disc is a single, rotationally stabilized, spirally constructed, GEO-based system
using differentially spinning elements. A solar disk would have an approximately 3-6 km
diameter. Power is collected from groups of solar panels connected to provide the voltage
required. The center of the disk integrates the power collected and conveyed to the transmitter
array. The array is about 1km in diameter and approximately 1.5-3.0 meters in thickness. A
single transmitting element is projected to be an hexagonal surface about 5 cm in diameter. One
Solar Disc system is estimated to generate power anywhere within a 1-12 GW range. The
rotation ensures that the transmitter array is continuously pointing to earth and the solar panels
are continuously pointing to the sun. Exhibit 12 depicts the Solar Disc SPS concept, as
envisioned by Mankins, and Exhibit 13 presents an artistic rendering of the Solar Disc system. A
unique and cost-effective LEO-to-GEO in-space transportation system is critical to the technical
viability of this system. Just as the Sun Tower system, the Solar Disc also has a highly
modularized design, which minimizes potential transportation and maintenance issues.
The ground receiver is a 5-6+ km site and connects directly to the local utilities‟
interface. This ground receiver would be very similar to the one needed for the Sun Tower. The
characteristics of the receiving antenna would also be similar, and the benefits of this rectenna
would be identical to the ones presented for the Sun Tower. Another important similarity shared
by both systems is that multiple ground sites can be served from one SPS system. The benefit of
having several ground stations served from one SPS system is that the SPS can beam its
produced energy to spots that lack energy the most or that present a more urgent need for
electricity, either due to damaged existing power sources, or due to environmental issues, or as a
means to spur growth of a certain area or industry that does not have electricity infrastructure in

27
place. This would be extremely beneficial from an economic standpoint because it would make it
possible for the operator of the SPS to beam the power generated in space to places with the
highest willingness-to-pay, therefore capturing the peak of the surplus curves in each location,
and boosting its revenues from these places.
Space Satellite Positioning
Possible deployment locations for SPS systems include Low-Earth Orbit (LEO), Middle-
Earth Orbit (MEO), Geostationary Earth Orbit (GEO), as presented by Exhibit 17, and the moon.
The following sections will discuss the advantages and weaknesses of each option.
Low Earth Orbit (LEO)
A Low Earth Orbit is defined as an orbit between 160 and 2,000 km above the surface of
the earth. If deployed within LEO range, it would be on a specific sun-synchronous orbit, in
which the satellite passes all latitudes at the same time as the sun every day. LEO is the closest to
earth among all options, and has been identified as the lowest cost to first power, i.e., the lowest
total cost that would enable a space-based solar power source to become operational. The short
distance minimizes the complexity of power transmission, the required size and weight of the
transmitting antenna, and the energy cost of earth-to-orbit transportation. LEO could also
conceivably become a primary assembly and transfer location for higher orbits.
However, satellites in LEO would spend much time in the Earth‟s shadow and therefore
have significantly lower productivity. One satellite could serve an individual receiving site on the
Earth for only a few minutes. As a result, it would require sophisticated beam steering to cover
more area on the Earth and a large number of ground stations to maximize productivity. In
addition, without an effective capability to de-orbit space debris, a LEO-based object of such
28
large size and surface area would be exposed to the large amount of artificial debris and faced
with high damage risks.
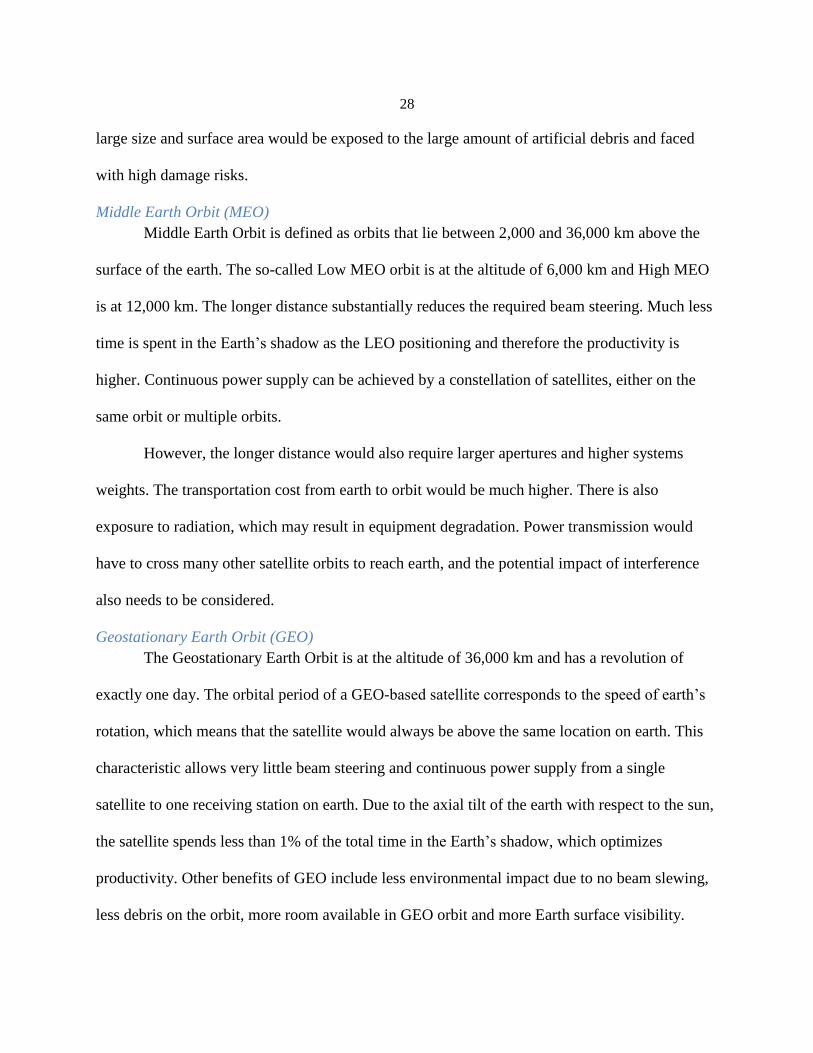
Middle Earth Orbit (MEO)
Middle Earth Orbit is defined as orbits that lie between 2,000 and 36,000 km above the
surface of the earth. The so-called Low MEO orbit is at the altitude of 6,000 km and High MEO
is at 12,000 km. The longer distance substantially reduces the required beam steering. Much less
time is spent in the Earth‟s shadow as the LEO positioning and therefore the productivity is
higher. Continuous power supply can be achieved by a constellation of satellites, either on the
same orbit or multiple orbits.
However, the longer distance would also require larger apertures and higher systems
weights. The transportation cost from earth to orbit would be much higher. There is also
exposure to radiation, which may result in equipment degradation. Power transmission would
have to cross many other satellite orbits to reach earth, and the potential impact of interference
also needs to be considered.
Geostationary Earth Orbit (GEO)
The Geostationary Earth Orbit is at the altitude of 36,000 km and has a revolution of
exactly one day. The orbital period of a GEO-based satellite corresponds to the speed of earth‟s
rotation, which means that the satellite would always be above the same location on earth. This
characteristic allows very little beam steering and continuous power supply from a single
satellite to one receiving station on earth. Due to the axial tilt of the earth with respect to the sun,
the satellite spends less than 1% of the total time in the Earth‟s shadow, which optimizes
productivity. Other benefits of GEO include less environmental impact due to no beam slewing,
less debris on the orbit, more room available in GEO orbit and more Earth surface visibility.

29
On the other hand, because GEO is the highest orbit, satellites would have to be larger
and use more power to compensate for the distance from the Earth. The beam would need to go
through all other orbits and, similarly to MEO, potential impact possibility must be considered.
Transportation costs would also skyrocket. In addition, the GEO orbit is already widely used for
other satellites such as communications and television satellites, as it allows a satellite to be in
continuous communication to a certain point on the surface of the earth. That imposes more
complications when deploying the large SPS system on the orbit.
Surface of the Moon
Another option considered is to construct power collection and beaming equipment on
the moon. Since raw materials from the moon can be utilized, the weight to be transported from
Earth to space would be minimized and so would the associated costs. However, due to the
orbital plane of the moon, all locations on the moon experience a 14-day lunar night. As a result,
power collectors must be constructed on both the east and west side of the moon to provide
constant power. Power from the moon must be beamed a long distance with high precision
steering since the moon is not geostationary. It would also require reflectors or re-transmitters in
Earth‟s orbit, or a global distribution grid to enable continuous power on different locations on
earth. The initial launching and installation costs would be extremely high, although it is possible
that the infrastructure on the moon could be used for later space exploration purposes as well.
This option is recognized as the least viable option due to the additional technical
constraints – from the need to install different sets of power collectors on different sides of the
moon, to the need to install reflectors or re-transmitters. Furthermore, a global distribution
system integrating power grids worldwide seems of extremely difficult execution.

30
Energy-Capture Methods
Photovoltaic
Photovoltaic (PV) cells enable the conversion of solar radiation into direct current
electricity. Photovoltaic materials absorb photons upon exposure to light, and release electrons.
The free electrons move through the cell and fill in orifices, creating direct current electricity.
One single PV cell only produces up to 2 watts of power. As a result, a number of PV cells must
be electrically and physically connected on a support structure to form a PV solar module, which
can provide enough power output in various levels for different applications. Multiple modules
wired together form a PV solar array. The overall PV solar array efficiencies range from 6% to
25%. Experimental high efficiency solar cells have also been developed, with an efficiency of
over 40%35
. Solar concentrators can be made at low cost and could be used to augment the PV
cell output. Crystalline materials have a uniform molecular structure and therefore have higher
efficiency compared to non-crystalline materials. Among crystalline materials, Silicon and
Gallium Arsenide (GaAs) are the current prime candidate materials for PV cells.
Silicon has an electricity output to weight ratio of 30 W/kg36
(this is a typical
measurement of efficiency for these types of materials, representing the energy output per unit of
mass of these materials employed). There are two types of crystalline silicon, single-crystal
silicon and polycrystalline silicon. A single-crystal solid is a material with continuous crystal
lattice over the entire sample with no grain boundaries. The absence of the defects from grain
boundaries gives single-crystal materials special characteristics. Single-crystal silicon has a high
conversion efficiency of 15-20%, and it is very reliable in energy output and outdoor
35. “World Record: 41.1% efficiency reached for multi-junction solar cells at Fraunhofer ISE.” Franhofer Institut,
last modified January 14, 2009, http://www.ise.fraunhofer.de/press-and-media/press-releases/press-releases-
2009/world-record-41.1-efficiency-reached-for-multi-junction-solar-cells-at-fraunhofer-ise.
36. NL, Power from Space.

31
environments37
. However, single-crystalline silicon incurs high manufacturing costs, mainly due
to silicon loss in the wafering process. The opposite of single-crystal is an amorphous structure.
In between the two extremes is polycrystalline, a material that is composed of many crystallites
of varying size and orientation. The different orientation can be either random or directed.
Compared to single-crystal silicon, polycrystalline silicon is less efficient, ranging between 10 to
14% efficiency, but has significantly lower manufacturing costs38
. The visual differentiation
between single-crystal silicon and polycrystalline silicon is presented in Exhibit 18.
Gallium-Arsenide (GaAs) is a compound semiconductor made of gallium (Ga) and
arsenic (As). It has some electronic properties that are superior to those of silicon. It presents
higher saturated electron velocity and electron mobility. Its electricity output to weight ratio is
about 48 W/kg39
, 60% higher than silicon on average. Another advantage is that GaAs has a
direct band gap, which allows for a much higher light absorption and higher efficiency, roughly
25 to 30%40
. Its high resistance to heat is ideal for concentrator systems, and it has strong
resistance to radiation, generating less noise when operating at high frequency. These
characteristics make it a strong candidate for space applications41
. However, GaAs does have
higher production costs when compared to silicon, because silicon is abundant in nature and
relatively cheap to process. Moreover, GaAs panels are estimated to degrade at 2-3% per year in
space42
. Exhibit 19 depicts GaAs solar panels.
37. Mah, O. “Fundamentals of Photovoltaic Materials”, National Solar Power Research Institute, Inc. December
21,1998 (hereafter cited as Mah, PV Materials).
38. Mah, PV Materials.
39. NL, Power from Space.
40. Mah, PV Materials.
41. Mah, PV Materials.
42. NL, Power from Space.

32
Other crystalline materials include Cadmium Telluride (CdTe) and Copper Indium
Gallium Selenide (CIGS). CdTe is the only thin film PV that is cheaper than crystalline silicon
PV. However, it is not as efficient as polycrystalline silicon - the best cell efficiency achieved to
date is 16.5% (see Exhibit 20 for a Diagram of CdTe photovoltaic cell composition). CIGS is
mainly used in PV cells in the form of polycrystalline thin films, with best efficiency achieved of
19.5% (see Exhibit 21 for a diagram of CIGS photovoltaic cell structure).
Amorphous silicon (a-Si) is the non-crystalline form of silicon. a-Si has inferior
electronic performance and is less efficient than crystalline materials. One advantage of a-Si is
that it is more flexible and can be made thinner than crystalline silicon, therefore lowering
material costs. It can also be deposited at very low temperatures, which favors its use in space, an
almost perfect heat-sink location. Exhibit 22 presents a diagram of a-Si photovoltaic cell
composition. Due to its inherent mechanical and chemical properties and resistance to radiation,
GaAs is usually the compound that is chosen when evaluating SPS systems. The economic and
financial viability analysis carried out herein uses GaAs as the chosen compound.
Solar Dynamic Systems
Solar dynamic systems concentrate sunlight into a receiver where solar heat is used to
drive a heat engine connected to an electric generator. The system includes a solar concentrator,
which collects sunlight; a receiver, which receives, stores, and transfers the concentrated solar
energy; a Brayton heat engine, which generates electric power; and a radiator, which emits waste
heat43
. The receiver contains a phase-change salt storage material that absorbs energy and
provides continuous heat throughout the orbit44
. The Brayton heat engine is comprised of a
43. “Solar Dynamic Power System Development for Space Station Freedom.” NASA Glenn Research Center, Staff
of Solar Dynamic Power System Branch, May 1993 (hereafter cited as NASA GRC, Solar Dynamic).
44. NL, Power from Space.

33
turbine, a compressor, and a rotary alternator, and uses helium-xenon as the working gas. The
helium provides superior heat transfer characteristics for the heater, the cooler, and the
recuperator. The xenon gas adjusts the molecular weight to provide superior aerodynamic
performance for maximized turbine and compressor efficiency45
. A recovery heat exchanger
between the turbine discharge and receiver inlet is often used to improve cycle efficiency. The
gas expands through the turbine when heated, cools through the heat exchanger where waste heat
is transferred to a liquid coolant, and pressurizes within the compressor. Waste heat is dissipated
to space via the radiator. The rotary alternator typically provides three-phase, alternating current
at about 1khz46
. Exhibit 23 presents a diagram of solar dynamic system with water as the
working fluid.
Compared to photovoltaic systems, this system can provide continuous power in
LEO/MEO without electricity storage systems47
. This system also has the potential to provide a
much higher efficiency of 20-30%48
, and incurs lower maintenance costs49
.
Power Transmission
Radio Frequency
Radio Frequency (RF) is the transmission of electromagnetic waves with frequencies
below those of visible light. It is generated by oscillations of electromagnetic fields. Current uses
include audio, video, navigation, heating, etc. Wireless power transmission is an already
validated technological breakthrough and has demonstrated high potential. In 2008, Dr. Neville
45. Harty, R.B. Otting, W.D. Kudija, C.T. “Applications of Brayton cycle technology to space power.” Aerospace
and Electronic Systems Magazine, IEEE, 9 (1994): 28-32.
46. Mason, L.S. “A Solar Dynamic Power Option for Space Solar Power.” NASA Glenn Research Center, last
modified July 1999, http://gltrs.grc.nasa.gov/reports/1999/TM-1999-209380.pdf.
47. NL, Power from Space.
48. NL, Power from Space.
49. NASA GRC, Solar Dynamic.

34
Marzwell of the NASA Jet Propulsion Laboratory successfully transmitted energy via RF over a
distance of 92 miles (148 km) and achieved greater than 90% conversion efficiency of energy to
electricity50
.
The DC-to-microwave conversion system could be performed either by microwave tube
system or semiconductor system, or a combination of both. The microwave tube generates high
power microwave with high voltage, while semiconductor system generates low power with low
voltage. Some commonly used methods of microwave tube include the Magnetron, the Traveling
Wave Tube Amplifier (TWTA), and the Klystron. A comparison between different types of
systems is shown in Exhibit 24. The microwave tube is more economical compared to
semiconductors51
. In addition, microwave tubes have a higher power-weight ratio than
semiconductor amplifiers52
. For the same amount of power generated, microwave tubes would be
lighter and more feasible in a SPS system, where weight is an important issue to be considered,
due to the major role that launching costs play into the economic and financial feasibility of SPS
systems.
The transmission is done through an antenna. The antenna could be of any kind, but has
to be a phased array. The phased array generates the beam with specific shape and direction and
can steer the beam if needed. A comparison of different kinds of antennas is shown in Exhibit
25. The antenna array has to be very large (> 0.5 km in diameter) and therefore requires large on-
orbit weight. It is a key driver of whole system mass and as a result it is not very plausible for
50. PG&E PPA.
51. Shinohara, N., “Wireless Power Transmission for Solar Power Satellite.” Georgia Institute of Technology,
accessed November 17, 2010, http://www.sspi.gatech.edu/wptshinohara.pdf (hereafter cited as Shinohara, Wireless
Power).
52. Shinohara, Wireless Power.

35
small amounts of power53
. The frequency of RF used in wireless transmission of power would be
2.45 or 5.8 GHz54
. The beam towards the Earth would be at an intensity of about 1/6 of noon
sunlight, delivering 5-10 GW of electricity55
. As previously mentioned, a rectifying antenna, or
rectenna, is the method of power reception.
Laser Beams
The use of laser to transmit power was first proposed by Grant Logan in 1988, with
technical details worked out in 198956
, but the high cost of taking the concept to operational
status and the distant payoff horizon halted the development of the technology57
. A large-scale
space demonstration is yet to be done. Exhibit 26 depicts what the space demonstration would
look like. Laser beams have much shorter wavelength and as a result can be done through much
smaller apertures. This characteristic allows achieving first power at much lower on-orbit
weights, and much smaller receiver site on earth. A tuned photovoltaic arrays or solar dynamic
engines are the ground receivers.
The main disadvantage would be that laser beams have lower efficiencies both in
generation and reception. It is less mature at high power levels, and may have eye-safety
concerns and be unacceptable to the public58
. The perceived risk of such an exposure by the
general public could create negative public perceptions around the technology, and NIMBY
manifestations could take place, causing the complete stoppage of the development of the power-
receiving site.
53. NSSO, SBSP.
54. Shinohara, Wireless Power. 55. PG&E PPA.
56. Landis, G. A., “My Involvement with Laser Power Beaming”, Geoffrey A. Landis Website, last modified March
6, 2011, http://www.geoffreylandis.com/laser.htp (hereafter cited as Landis, Laser Power Beaming).
57. Landis, Laser Power Beaming.
58. NSSO, SBSP.

36
Earth-to-Orbit Transportation (ETO transportation)
It is argued that direct launch from Earth to Orbit using chemical propellants may be
possible, but highly undesirable due to their low efficiency levels. A nodal architecture would be
preferred, with earth to low-earth orbit as one segment, followed by LEO to geostationary orbit
(GEO) segment. The heavy lift launch vehicle (HLLV) would rely on a two-stage-to-orbit
(TSTO) approach. Reusable launch vehicles (RLV) can be used from earth to LEO. RLV could
be either a two-state-to-orbit (TSTO) rocket powered vertical launch horizontal landing (VTHL –
Vertical Take-off Horizontal Landing) system, or a Maglev assisted air-breathing or airborne
oxygen enrichment horizontal takeoff and landing (HOTOL) system. Examples of VTHL,
HOTOL, and VTL are shown in Exhibit 27. Solar Electric Transfer Vehicles (SETV) would then
be used to transport from LEO to GEO. These infrastructures would require an extensive amount
of operations and maintenance, but a certain number of earth to space launches would make
these systems viable, as the cost of the RLV would be amortized over many launches, therefore
lowering the total cost of launching SPS systems to space.
Other suggested options include gun launch using a space elevator, and a magnetic
levitation launcher (Maglev), shown in Exhibit 28. Space elevator is the most commonly studied
non-rocket space launch means. First proposed by Konstantin Tsiolkovsky in 1895, the operating
principle of the space elevator is similar to the operation of a regular apartment elevator, with a
physical structure providing guidance for the launching of objects. While some concepts are
considered technologically feasible nowadays59
, the gravitational field of the Earth is too strong,
and there are no engineering materials that are sufficiently strong and light to enable this concept
59. “Audacious & Outrageous: Space Elevators.” NASA Science News, accessed March 27, 2011,
http://science.nasa.gov/science-news/science-at-nasa/2000/ast07sep_1/.

37
to be developed on earth. Maglev systems have been first patented in 1907. Since then, a number
of developments, mostly of trains, and extensive testing has been carried out, with top speeds of
581 km/h (361mph) having been reached in Japan in 200360
. The most well-known
implementation of high-speed Maglev is the Shanghai Maglev Train, that transports people
30km (19mi) to the airport in roughly 7 minutes, with top speed of 431km/h (268mph) and
average speed of 250km/h (160mph)61
.
ECONOMIC VIABILITY OF SPS SYSTEMS
Most of the issues in evaluating SPS‟ business viability are related to various costs,
which are sometimes seen as impediments for this technological breakthrough to be widely
accepted and supported, both by governments and by the private sector. The assumptions used to
develop a financial model to assess the financial opportunities associated with building,
launching, and operating a SPS are now presented, together with model results and sensitivity
analyses.
Other important issues currently faced by the energy industry, which have already been
discussed, range from environmental impact (greenhouse gas emissions, pollution, and the need
to handle nuclear waste), to social impact (moving populations to build hydro power plants, or
the cannibalization of highly productive land to produce biofuels instead of food, in a world
where almost one billion people are undernourished), and potential conflicts between neighbor
nations for natural resources (both energy-related commodities and highly desirable real estate
for hydro, solar, or wind power). The eventual exhaustion of fossil-fuel reserves and the real
60. “Maglev transport.” Wikipedia, accessed March 27, 2011,
http://en.wikipedia.org/wiki/Maglev_(transport)#Existing_maglev_systems.
61. IBID.

38
estate issues mentioned before support a definitive, reliable, sustainable solution to be
established that refrains from security, social, political, and environmental issues.
And although the costs associated with developing, launching, and maintaining Solar
Power Satellites have been labeled by some impeditive, this may not be true in the following
possible future scenarios:
Electricity prices are expected to rise, due to the increasingly greater demand by
emerging economies and the potential exhaustion of readily and cost-effectively available natural
fossil-fuel reserves, which will automatically make other alternatives for power generation more
attractive, especially the SPS;
International agreements may provide further incentive for countries to reduce
their carbon emissions, which could further impact the cost of available sources of electricity.
This increase in current available power option costs would further draw attention to a truly
exogenous solution, the SPS;
There are several possibilities for governmental subsidies to support the
development of the SPS system, including energy security funding sources or a similar treatment
given to other sources of energy (like nuclear, solar, or wind power) – either in terms of funds to
be made available for major developments or in terms of tax holidays for firms that invest in
these technologies;
Earth-to-Orbit transportation costs are expected to be considerably reduced due to
the entry of private firms into this sector, which has begun by this writing. The order of
magnitude of this reduction remains unclear, but scientists and other specialists state that costs
can be lowered by several orders of magnitude. This expected transportation cost reduction

39
would signal the maturity of this technology and assure that SPS can be a profitable venture, as
will be seen in the sensitivity analyses below;
SPS could last longer than previously estimated. It is common practice in the
aerospace industry to conservatively choose a set of assumptions satisfying operating conditions
of equipment in space. This is because scientists want to have their tests carried out in space with
a high degree of certainty, with the result that most space-equipment has actually been over-
designed, and has often provided more benefits than they were expected to. In this sense, it is
possible that the degradation of SPS, initially estimated to range from 2-3% per year (leading to
an average life of power generation of roughly 40 years) could be much lower, boosting the
operational life of the SPS and leading to longer-lasting streams of revenues from the sale of
electricity and, therefore, a greater financial return than initially anticipated.
Assessment of Prices
Exhibit 14 presents the average retail price of electricity in the U.S. by state in 2009.
Since the cost of generation and transmission of power generated by a Solar Power Satellite does
not vary depending on the location on Earth to which electricity is beamed, the operator of a SPS
can take advantage of these different retail prices of electricity practiced across different
locations. For example, by beaming power to Hawaii, Connecticut, Alaska, New York State, and
Massachusetts, the average price per KWh that an operator of a SPS can reach is of 19+ cents. It
is important to note, however, that Exhibit 14 presents data for the U.S. only. The average retail
price per KWh of electricity in the U.S. is $0.115 cents. Worldwide electricity prices vary even
more widely. Exhibit 15 presents electricity price data around the globe. Although these are the
prices that utility companies charge industries (and therefore they are lower than average price),

40
it is noticeable that SPS‟s can capture the upside of selling large amounts of electricity to heavy
industrial users in Japan, Italy, or Nicaragua at a 15+ cents per KWh, a 30% higher price than the
average retail price charged in the USA, at current rates.
Exhibit 16 presents data on the worldwide average price of electricity, reinforcing that
more isolated locations have a higher willingness-to-pay for readily available energy sources.
The chart shows that two out of the three most expensive locations are in the Federal Territory of
Nunavut in Canada. There, the price per KWh averages US$65 cents. The flexibility of the SPS
systems enables its operator to take advantage of the surpluses in these isolated areas. One can
expect the demand on those locations to be low when compared to well-developed countries. As
per the chart on Exhibit 16, however, it is clear that well-developed countries with a large
demand for electricity also have much higher average retail prices of electricity per KWh. This is
the case in Denmark (42 cents), Ireland (27 cents), and the Netherlands (26 cents).
The possibility of capturing the consumer surplus or the higher willingness-to-pay for a
cleaner, readily available source of energy around the globe is a major advantage of SPS systems
versus other energy sources. The prices of electricity per KWh mentioned in the previous
paragraphs will be of further help below, when sensitivity analyses are developed to evaluate the
SPS economic and financial viability.
Assessment of Costs
This cost assessment is largely based on the assumptions adopted by the 2007 study
conducted by Boeing entitled Commercial Space Transportation Study. The assumptions used in
the base-case of the financial model of SPS systems are shown in Exhibit 29. These assumptions
are based on a scenario in which technological breakthroughs have managed to lower launch

41
costs to GEO to as low as $400 per kg. The suborbital space tourism market, spearheaded by
Virgin Galactic, has helped the initial development of the space transportation market. Following
the success of Virgin Galactic‟s spaceships, Elon Musk, founder of PayPal and Tesla Motors,
realized that there is a possibility for the private sector to compete with government spacecraft
also in the commercial and scientific space transportation market. He started SpaceX to bring
innovation to a market that has traditionally been dominated by governments and large aerospace
companies. Following the retirement of the Space Shuttle, he expects to be able to make space
transportation immensely cheaper than the current governmental costs of launching and
operating spacecraft per kilogram of space cargo.
Even with such an optimistic scenario launching costs would still represent 77% of the
total cost-to-first-power of an SPS. Boeing estimates that one 11.4GW Solar Power Satellite
system would cost $5,044 million, while its receiving antenna would cost roughly $7,243
million, totaling roughly $12.3 billion in hardware costs. Meanwhile, the transportation costs into
space would total $40.3 billion, given the total structural weight of the SPS of roughly 54,331
metric tons and a launch cost of $400 per kilogram of hardware to be transported into space62
.
Financial Model
Given the assumptions presented in Exhibit 29, a financial model was developed,
assuming that all of the power generated by the SPS and received by the rectenna would be sold
at an average retail price of ¢11.51 of US$, the average residential retail price in the U.S.A. in
62. “Commercial Space Transportation Study.” The Website of NASA HQ, Chapter 3.8.2.2.2.3.3, Boeing, last
modified January 4, 1997, http://www.hq.nasa.gov/webaccess/CommSpaceTrans/ (hereafter cited as
CommSpaceTrans).

42
2009, according to the U.S. Energy Information Administration63
. Other assumptions include
U.S. corporate tax rate of 35%, a discount rate of 7%, and SPS lifetime of 40 years (i.e. 2.5%
degradation of solar cells per year).
Exhibit 30 presents the financial model‟s base-case, and its respective Net Present Value
(NPV) and Internal Rate of Return (IRR). The resulting negative NPV of ($21.8) billion might
seem like a bad deal for such an innovative technology. However, nuclear fusion power, for
example, has received the sum of $21 billion in government funding64
. If this amount of funding
had been made available to SPS developers, the NPV of the SPS systems would be
approximately at its breakeven point. However, this forecast scenario could still be much rosier,
if certain favorable conditions materialize, such as:
Governmental subsidies, either in form of technological funding or tax holidays;
Power provision only to the spot market;
Rising costs of energy-related commodities and, consequently, of existing power
generation methods;
More than one satellite is produced, amortizing the development costs that totals
$8 billion over more units, and substantially reducing the development costs allocated to each
satellite; and
The potential establishment of price surcharges for polluting fossil-fuel power
generation technologies, so as to cover costs associated with pollution and other socio-
environmental side effects of these power sources.
63. “Electric Power Annual – Average Retail Price of Electricity.” U.S. Energy Information Administration,
accessed March 7, 2011, http://www.eia.doe.gov/cneaf/electricity/epa/epat7p4.html.
64. NSSO, SBSP.

43
In order to further investigate the effect of each of the variables that compose the
financial model of the SPS systems, the next subsection presents a series of sensitivity analyses
aimed at presenting possible scenarios in which the space-based solar power concept could bear
fruit, while generating a positive financial return, creating proprietary intellectual knowledge and
transforming the energy industry into a purely exogenous, truly sustainable endeavor.
Sensitivity Analyses
In each of the sensitivity analyses presented in this subsection, two of the base-case
model assumptions were varied while the others remained constant. The intention of each such
analysis is to investigate under which conditions an SPS system could yield positive financial
return to a prospective investor in this technology. Following these analyses, the next subsection
will present some possible future scenarios which could favor the adoption of SPS systems.
44
Discount Rate and Corporate Tax Rate
In the first sensitivity analysis both the discount rate and the corporate tax rates were
varied. The real discount rate is being varied from 9% to -9%. This intends to capture the
potential downside of a higher-than-expected discount rate, but it also tries to capture the
potential upside from lower discount rates. The negative real discount rates reflect the possibility
that inflation is higher than the interest rate. In this case, the real discount rate being negative
means that there is an indirect subsidy being employed either by the country‟s central bank or by
another potential governmental lender. This was the case during the South Korean boom from
the early-70s through the early-90s. Exhibit 31 shows a chart of the real interest rates in South
Korea during this period. These Korean subsidies were intended to boom inland investments and
drive indigenous industries into an unprecedented growth cycle.
The other assumption that was varied simultaneously was the corporate tax rate, which
started at a 35 percent standard rate and was varied down to zero percent, indicating the
maximum tax holiday possible to be given as an incentive to this clean energy source. It is
important to note that effective tax rates of major conglomerates in the U.S.A. have been low due
to enormous benefits, as exemplified by GE, which from 2007 through 2009 had average
effective tax rates of only 7%65
.
The output of this sensitivity analysis is presented in Exhibit 32. From this analysis it
becomes clear that if governments were willing to adopt economic measures similar to the ones
adopted by Korea in the past so as to incentivize the space-based solar power industry, such a
venture could become profitable even at a full corporate tax rate of 35%. However, a
65. “GE Tax Rate Shows Hypocrisy of Obama‟s Energy Tax Plan.” FuelFix Website, accessed March 6, 2011,
http://fuelfix.com/blog/2011/02/14/ge-tax-rate-shows-hypocrisy-of-obamas-energy-tax-plan/ (hereafter cited as GE
Tax Rate).
45
compromise between low rates and tax holidays could be achieved, so as to minimize the total
impact from the government perspective of these industry incentives and subsidies. For example,
for an effective tax rate of 10% (slightly higher than the real rate for GE, for example) and a
discount rate of 5% the SPS becomes a profitable project, if the other assumptions are held
constant. This is certainly not an extreme measure, and could help make solar power satellites
economically and financially viable.
Retail Price of Electricity and Launch Costs to GEO per kg of Mass Transported
SPS systems have the possibility of selling energy in the spot market and the flexibility to
deploy and utilize energy all over the world, depending solely on the installation of a receiving
antenna (rectenna). This enables SPS electricity to be beamed where it is most needed, or where
its operator deems it most profitable. Some countries mentioned above have high electricity costs
per KWh (i.e., the potential revenues per KWh sold for those countries), ranging from
US$0.1151 (average retail price in the U.S.) to US$0.6534 (retail price in the federal territory of
Nunavut in Canada). Between these two numbers, a series of other possibilities were considered,
including selling energy to selected states within the USA (New York, Connecticut,
Massachusetts, Alaska, and Hawaii) and selling electricity to countries with high demand and
high prices in Europe (e.g., France, the Netherlands, Germany, Italy, and Denmark). Moreover,
use of energy for military applications is more expensive. Charania et al (2010) calculated that
the real costs per KWh consumed by the US military in their missions in Iraq and Afghanistan
are US$0.92 and US$1.16 respectively66
. Possible such military applications have also been
considered in the present sensitivity analysis.
66. Charania, A.C. et al, "A rational roadmap for developing a first revenue space solar power satellite".
SpaceWorks Engineering, Inc., accessed March 7, 2011, http://www.sei.aero/eng/papers/uploads/archive/IAC-
10.E6.3.11.pdf.
46
The second assumption that was studied simultaneously was the launch costs to GEO.
Starting with the premises set forth by spacecraft currently under design by SpaceX, and the
NASA agreement to use SpaceX spaceships to the next space missions, it has been determined
that the best current price per kilogram launched into GEO is US$4,87267
. This price has been
brought down to a small fraction of this, following expectations of studies recently carried out by
Boeing and NASA and arriving at a target price per kilogram of US$40068
.
With the other assumptions held constant as per Exhibit 29, the outcome of this
sensitivity analysis is presented in Exhibit 33.
Price of Electricity Growth and Longer than Anticipated SPS Lifespan
Two other important variables to be considered are the ones that answer to the following
hypothetical questions: “What if the retail price of electricity continues to grow?”, and “What if
the SPS lasts longer than it has been anticipated?”. The former intends to address the
phenomenon currently observed around the globe. For example, average retail price per KWh
has more than doubled in Germany (and several other European countries) over the past five
years, leading us to believe that this trend may be ongoing. Starting from the basic assumptions
adopted for the initial financial model, retail price growth has been considered a minimum of 2%
annually (i.e., the average retail price of electricity in the USA would double in roughly 36
years) and a maximum of 18% per annum (it would double in roughly 4 years) over the course of
the ten years considered in the financial model. The latter variable consists in determining what
the benefit would be if the SPS lasted longer than its expected life of 40 years, i.e., if the
67. “Falcon Heavy Overview.” Space Exploration Technologies Corporation, accessed March 7, 2011,
http://www.spacex.com/falcon9_heavy.php#pricing_and_performance (hereafter cited as Falcon Heavy).
68. CommSpaceTrans.

47
degradation of the solar cells were lower in space than they are on the earth (which is a very
reasonable assumption, given the working conditions in space).
Exhibit 34 plots the output of this sensitivity analysis. It can be quickly noticed that the
growth in the retail price of electricity plays a major role in determining the economic feasibility
of the SPS concept. Although a longer lifespan of an SPS is desirable, it is not a major factor
determining its design. This is because the longer it is designed to last, the heavier it will be, and
the transportation costs into GEO have been shown to be by far the most important cost
component that can either enable or prevent SPS systems of becoming a real, viable energy
source concept. Also, the financial benefit of a longer SPS lifetime is not as relevant as other
benefits from lowering transportation costs or the growing worldwide retail price of electricity.
This is because most of the cash flows from this longer lifespan are too far into the future and,
for most realistic discount factors, they become practically negligible.
From the three sensitivity analyses presented in the previous subsections it can be noted
that two variables are the most impactful ones and, therefore, these will be simultaneously varied
in the next sensitivity analysis presented.
Price of Electricity Growth and Launch Costs to GEO
This sensitivity analysis considered current commercially available launch vehicles as the
starting point for the launch cost variable. The maximum transportation cost to GEO considered
in this analysis was for Delta IV, a US-American launch vehicle dated from 2002. With a total
cost of US$155 million, and a payload to GEO that totals 10,843 kg, its cost per kg launched to
GEO amounts to US$14,295. Other two existing launch vehicles were considered: SpaceX
Falcon9, and SpaceX Falcon9-Heavy, whose costs per kilogram transported amount to
US$11,966 and US$4,872 respectively. It is important to point out that the latter is still in fairly

48
early stages of development, while the former is in late stages of testing. This is one of the
possible reasons for such a great discrepancy between both costs. Other costs considered in the
analysis are specialists‟ estimates of the cost reduction potential, taking into account not only
technology advancements, but also potential economies of scale of several launches taking place
in one year. This assumption is based in the fact that SPS systems will require several launches
in order for a single solar power satellite to be transported into space.
The growth in the retail price of electricity considered a vast range of possibilities, from a
more conservative approach, i.e. 6 percent per annum, to a more extreme price increase of 18
percent. Hence, price per KWh is assumed to double every 4 to 12 years, based not only in past
data, but also in the future trend of power consumption, which will very likely force energy-
related commodities into new record price levels.
From the output obtained from this sensitivity analysis (Exhibit 35) it is possible to
conclude that if the energy industry sees a huge increase in its costs – either derived from the
rising cost of energy-related commodities or from other factors (e.g., surcharges on polluting
energy sources so as to cover socio-environmental costs associated with them or the annulment
of tax holidays and other governmental subsidies towards some specific energy sources) – solar
power satellites can become a viable alternative even at launching costs of US$4.9 k per
kilogram of space cargo, associated with SpaceX‟s Falcon9-Heavy launch vehicle.
Based on the sensitivity analyses presented above, possible future scenarios can be
drawn. These future scenarios are divided in two categories: high probability outcome and
medium probability outcome.

49
Possible Future Scenarios
Two possible future scenarios are presented below. The sets of assumptions used, as well
as the set of cash flows obtained, and the net present values and internal rates of return are
presented in each of them. Furthermore, a critical analysis of the assumptions used and which
other components could have been improved if one were to model a more optimistic scenario
based on the two presented below is detailed.
High Probability Outcome
The first scenario is based on the assumption that the lowest possible cost to launch the
SPS will be 20% lower than the one derived from the Falcon9-Heavy launch vehicle, which
corresponds to roughly US$4.9k per kilogram of hardware transported into GEO69
. This
assumption is based on the fact that the price of US$4.9k per kilogram includes a healthy profit
margin from SpaceX. Taking into account the need for multiple launch flights into GEO for an
SPS to be operating in space, there might be economies of scale to be captured and reflected into
the cost of launching a solar power satellite. Compared to the base-case model, three other
assumptions were changed: the initial power price (in US$/KWh), the power price growth (in %
per annum) and the satellite lifespan. For the initial power price, it was assumed that the SPS
operator would beam its power to selected U.S. states (NY, CT, MA, AK, and HI) where the
price of electricity per KWh consumed is the highest, therefore yielding the highest possible
revenues from the U.S. market. The power price growth was assumed to be 4% per year in real
terms. This corresponds to the assumption that prices will rise slowly, doubling within eighteen
years. Finally, the lifespan considered was of 50 years instead of 40, i.e., 2% degradation of the
69. Falcon Heavy.
50
solar cells per year instead of the previously assumed 2.5%. The set of assumptions is presented
in Exhibit 36.
Besides, it was assumed that governmental subsidies would take two distinct forms: tax
holidays (effective corporate tax rate would be as low as GE‟s, i.e. 7%70
) and a low discount rate
would be offered (not as extreme as the negative rates in the Korean model of the 70s, but as low
as 3% in real terms). The corporate tax rate assumed is realistic, as it resembles the benefits
given to companies in similar industries. Given the current state of the economy and the FED
rates that reflect this state, a 3% real discount rate is not infeasible or unrealistic, given that these
types of projects are usually heavily supported by local governments. Nonetheless, no direct
funding from the government was assumed, although this could be expected, given the strategic
role that power from space can play in terms of energy security, technological advancement,
proprietary knowledge, etc.
Exhibit 37 presents the financial model output. Even with no direct governmental
subsidies, the model yields a positive NPV, indicating that, although the launch cost to GEO is
still a major concern (as it amounts to US$340 billion in initial costs), the imminent rising cost of
electricity allied with a strategic choice of markets to which power will be supplied turns space-
based solar power into an interesting alternative. The IRR is approximately zero, because the
initial cash outlays are extremely high, mainly due to the launch costs of the SPS to its intended
geostationary orbit. Although this scenario seems positive, the initial sum needed for the SPS to
become operational is extremely high under launch costs of currently available technologies.
70. GE Tax Rate.

51
Medium Probability Outcome
The second scenario differs from the first one basically in three aspects. First, the launch
cost is assumed to be US$800 per kilogram of hardware to be transported to GEO. This
represents a 100% higher cost than the one estimated by Boeing and NASA in their 2007 study
entitled Commercial Space Transportation Study71
. Nevertheless, it is still approximately 83%
lower than the lowest cost estimated to be available in the near future for commercial hardware
to be launched to space (SpaceX‟s Falcon9-Heavy, US$4.9k/kg). Second, the electricity price
increase per year is assumed to be only 2%, as the SPS systems are expected to lower these price
increases by introducing a new method for power generation, which can lower the impact in
costs of other energy sources by lowering the demand for them. Finally, it was also assumed that
costs associated with maintaining the SPS are expected to be growing at a 2% annual rate,
similarly to the growth experienced by the average retail price in this scenario. This would reflect
a natural tendency of cost increase as the technology ages. The effective corporate tax rate was
assumed to be 20%, i.e., the SPS operator still enjoys some tax break, but not as high as the ones
expected in the previous scenario. The real discount rate chosen was 7%, also much higher than
the previous one, and a very likely discount rate to be used for this type of project.
As Exhibit 39 presents, this scenario yields a much higher NPV. However, the
expectation that launch costs will be lowered by as much as 83% remains unclear, as there are no
available mature technologies capable of achieving such low cost levels nowadays. Unless a
major breakthrough is brought to the market (such as the ones listed in the present work on the
Earth-to-Orbit Transportation section), this scenario does not seem to be realistic in the short-
run.
71. CommSpaceTrans.

52
POLITICAL FEASIBILITY
The previous sections have described the energy industry as inherently endogenous. As
such, although some benefits are achieved locally by some of the most recent energy sources, as
a whole the game being played is a zero-sum game. Especially in the case of fossil-fueled power
plants, the consumption of these energy-related commodities reduces the amount of these
commodities available to others. And since most of the so-called green energy sources depend
upon the same variable – environmental conditions (either sun or wind), whereas the older forms
of energy source are the ones causing these environmental conditions to change, the only way for
the energy industry to become a non-zero-sum game is for an exogenous alternative to come into
play. By showing no direct dependency upon local environmental conditions, but rather by being
dependent solely upon a constant solar influx that strikes Earth‟s atmosphere around the clock,
Space-Based Solar Power offers the hope of transformation into a non-zero-sum game.
Using existing energy sources, an illustrative conceptual Pareto frontier can be built
showing the trade-off between investment needed for a 1% GDP increase of a given country
(given the direct relationship between economic growth and energy consumption growth shown
in section 2) and the direct environmental impact per KWh of electricity generated (see Exhibit
40). In this chart, smaller values are preferred to large ones, since they present lower investment
needed or lower environmental impact. Any of the solutions conceptually presented on the
frontier can be described as Pareto-efficient outcomes. However some of the energy sources
presented as Pareto-efficient might in fact not be so because the direct environmental impact (or
risk) plotted on the x-axis is an ex-ante estimate of the impact caused by these power plants, and
does not take into account potential catastrophic accidents that might take place. That said, it is

53
important to reclassify some of the power sources as Pareto-suboptimal, so as to account for
potential catastrophic failures of these plants, such as nuclear and hydropower. Ex-post,
therefore, nuclear and hydro power could be seen as not belonging on the Pareto frontier due to
the risk of radioactive leaks or dam ruptures, for instance. SPS has been presented in the Pareto
Frontier chart for illustration purposes only because, as explained above, it has the potential of
not being a zero-sum game player due to its inherent exogenous characteristics.
Government measures have deeply impacted the shape of this Pareto frontier, by enabling
some power sources (through removal of tariffs, tax holidays, or other financial subsidies) to
move towards the frontier, and broadening the portfolio of existing energy source options. The
importance of governmental support, therefore, is paramount to the development of newer
technologies that will enable a radical shift in the global energy landscape. This section presents
recommendations that support the development of the solar power satellites and, simultaneously,
move the current heavily endogenous power generation model into sustainable, exogenous, non-
zero-sum game territory.
Political Support: Tax benefits, Government Funding, Public-Private Partnerships
Several countries have established a series of government support incentives to develop
indigenous sources of renewable energy. This is the case of most European countries, the USA,
India, and China, among many others. The energy security issue is still regarded as the most
important problem to be solved by the global energy industry, and solar, wind, nuclear,
geothermal, biofuels, and others are seen as promising in the movement towards energy
sustainability. Worldwide tax benefits and government-sourced funding accounted for a total

54
global investment in clean energy of US$155 billion in 200872
. The Obama Administration‟s
American Recovery and Reinvestment Act of 2009 secured investments of up to US$70 billion
in direct spending and tax credits for clean energy. Moreover, more than seventy countries have
established some type of policy to promote renewable power generation73
.
While other sources of renewable energy, regardless of their endogenous influence over
the environment, have been receiving such an enormous governmental support and funding,
space-based solar power has received virtually none. More funding and support are crucial for
the necessary technologies to be thoroughly developed and extensively tested, so as to ensure
reliable applications of SPS systems in the near future. Due to lack of funding, NASA has
decided to launch the Commercial Crew and Cargo Program to stimulate efforts within the
private sector to develop and demonstrate safe and cost-effective transportation capabilities74
.
This solution has the potential to cost-effectively develop space transportation, given that this is
the most important variable for SPS concept economic viability. SpaceX is one of NASA‟s
partners in the development of new commercial launch vehicles, and has successfully launched
its Falcon9 rocket on September 2010, which flew unmanned into orbit and returned safely75
.
This is a clear sign that the participation of private firms can drive innovation in a quicker way,
so as to enable new breakthroughs, driving down costs and making it more likely that solar
power satellites can become a reality.
72. “Clean Energy Trends 2009.” Clean Edge Website, accessed November 17, 2010,
http://www.cleanedge.com/reports/pdf/Trends2009.pdf.
73. Renewables 2010.
74. “NASA – Commercial Crew and Cargo.” NASA Commercial Crew&Cargo Program Office, accessed March 7,
2011, http://www.nasa.gov/offices/c3po/home/.
75. “SpaceX Launches Success with Falcon9/Dragon Flight.” NASA Commercial Crew&Cargo Program Office,
accessed March 7, 2011, http://www.nasa.gov/offices/c3po/home/spacexfeature.html#.

55
Further government support is necessary, either in terms of funding and tax credits for the
private firms, assets, or cash for this goal to be achieved. The total costs involved in the
development of space-based solar power are extremely high and, therefore, countries have a
strong incentive to cooperate in this process, given the global benefits an SPS can provide, not
only in terms of the huge amount of energy readily available in space, but also in terms of
reduction of environmental impact and other endogenous problems associated with the current
model of power generation on Earth.
International Cooperation
“When you are out in space, you don’t see boundaries. You just see the beauties of the
world.” This was the opening statement of the keynote speech made by Dr. Bobby Braun, NASA
Chief Technologist at the 13th Annual Emerging Technology Update Day at The Wharton
School on Feb 25th 2011. At first, space exploration was perceived as a matter of honor.
Capitalism fought against socialism for space supremacy. Getting there first was a matter of
political superiority, pride. From the Soviets‟ launching of the first manned rocket into space and
returning him safely to earth, to the Americans stepping first on the Moon, a huge technological
leap was made, a scientific treasure that later directly influenced the rapid development of
commercial aviation, telecommunications, and the health care industry, while helping other
industries indirectly. With the fall of the Berlin Wall and the consequent disintegration of the
Soviet Union, space was no longer a neutral location with bipolar „owners‟, the Space Race was
over. The collapse of the Soviet Union gave way to cooperation on space exploration: in June
1992 American President George H. W. Bush and Russian President Boris Yeltsin signed a
cooperation agreement. This resulted in the International Space Station (ISS), primarily by the

56
USA and Russia, but later with several other countries joining (Japan, Canada, Belgium,
Denmark, France, Germany, Italy, The Netherlands, Norway, Spain, Sweden, Switzerland, and
the United Kingdom)76
.
Unofficial estimates indicate that a total of over US$100 billion might have been invested
in the International Space Station over the course of two decades77
. Although some countries
have invested more than others (and also enjoyed more crew time, electrical power rights, and
rights to purchase supporting services necessary for scientific research to be done in space, such
as data upload and download), none of them would have been capable of carrying out these
investments by itself. Nor would some of the recent scientific research initiatives have been
carried out for lack of funds or infrastructure. This cooperation in space can be seen as a lesson
for the future as not only risks and costs are spread out across different stakeholders, but also the
benefits of multicultural development become apparent.
“Fossil fuels were the energy source that shaped 19th
and 20th
century civilization. But
burning coal, oil and gas has proved highly damaging to our environment. Carbon dioxide
emissions, greenhouse effect gases, and fumes all contribute to the disruption in the balance of
our planet’s climate. Global energy consumption is set to triple by the end of the century. And
yet supplies of fossil fuels are depleting and the environmental consequences of their exploitation
are serious. Two questions loom over humanity today: how will we supply all this new energy,
and how can we do so without adding dangerously to atmospheric greenhouse gases? No single
nation can face these challenges alone.”78
– this is the statement that introduces the International
76. “International Cooperation.” NASA - International Space Station Website, accessed March 9, 2011,
http://www.nasa.gov/mission_pages/station/cooperation/index.html.
77. “What‟s the cost of space station?” The Website of MSNBC, accessed March 9, 2011,
http://www.msnbc.msn.com/id/14505278/.
78. “The ITER Story.” ITER Organization Website, accessed March 7, 2011, http://www.iter.org/proj/iterhistory.

57
Thermonuclear Experimental Reactor (ITER) project in its website. ITER is a large-scale fusion
scientific project, aimed at producing ten times the energy it will consume in the fusion process.
Scientific experiments are expected to start in 2019. Since this will be a very large-scale project,
no nation dared meet the challenge by itself. Rather, the European Union, already a consortium
of several nations per se, envisioned this project as a global collaboration effort, and invited
other nations to participate. The ITER location is now under construction with financial and
technological support from the European Union, the USA, China, India, Japan, Russia, and
South Korea. Total costs are estimated to be of 10 billion Euros (or US$13.9 billion, as of Mar
13th
2011) for an estimated net output of 450MW of energy (production of 500MW with the
consumption of 50MW).
Although the ITER project is still in its early stage of development, the great lesson
learned is the rationale used in designing this joint effort: affording such an expensive,
technically challenging power source by means of international collaboration among nations
with aligned interests, i.e., to discover new, reliable, and sustainable energy sources.
Coincidentally (or not), both examples of some of the world‟s largest international cooperation
projects mentioned in the previous paragraphs (ISS and ITER) involve space exploration and
power generation, the exact definition of what a Solar Power Satellite project should be based
on.
CONCLUDING REMARKS
Space-based solar power has been studied only as a byproduct of the Space Race. In the
60s and 70s, innovation was fueled by the cold war, where political motivation made it easier for
the Soviet Union and the United States to fund their space agencies. Several technological
58
breakthroughs were originated from the Space Race of the late-60s, such as cutting-edge
materials and fabrication processes, satellites and their direct influence over telecommunications,
and medical research. However, the technologies available in the sixties were not enough for
solar power satellites to be produced or even tested. The main technological breakthroughs
needed for an SPS to become reality have already been at least partially achieved, such as
wireless power transmission (or power beaming). Although there is definitely need for extensive
testing and technology risk mitigation, at this writing there are no major areas of concern that
would prevent solar power satellites from becoming a reality. The major restriction facing the
development of SPS systems is related to earth-to-orbit transportation costs. And although
private investors (such as Sir Richard Branson‟s Virgin Galactic and Elon Musk‟s SpaceX) have
been exploring and innovating in this area – and thus lowering costs – there is currently not a
readily available technology enabling affordable transportation to space, especially for a huge
satellite that is supposed to weigh around 55 thousand metric tons.
However, the desirability of a purely exogenous energy source is real, and no other power
source available or under development is capable of claiming to be not-purely-endogenous. As a
result, although new power sources might be less polluting and less impactful than the more
primitive energy sources still in use in most countries (such as the ones derived from fossil
fuels), the already delicate state of the environment continues to worsen as time goes by.
Moreover, all of the currently existing power generation options can be characterized as players
of a zero-sum-game, i.e., they shift commodities and/or benefits from one side of the globe to the
other, while potentially having negative environmental impacts. Issues currently faced by the
energy industry worldwide point out to an increasingly need for a non-zero-sum game to be
59
developed, allowing mankind to benefit from a new power source, without jeopardizing the
environment or individual nations.
This paper has detailed several factors supporting SPS systems, either by governmental
direct subsidies (funding), or by indirect support (tax holidays, lower interest rate on the
necessary investments). Some possible scenarios have been presented, all of which illustrate the
potential of the SPS concept, and the potential for investors who choose to undertake projects in
this promising energy field. Finally, international cooperation has been pointed out as crucial for
the success of any venture of this magnitude, given the sheer size of needed investments and the
global potential of resulting benefits. The first Space Race, driven by two separate economies
with much secrecy and no cooperation whatsoever, brought many benefits for mankind all over
the world. A Second Space Race, aiming at discovering and exploring the virtually infinite
source of solar energy available in space, is the only long-term feasible solution for the current
global energy crisis. This solution causes no environmental harm, poses no threat to mankind on
the surface of the earth, and is absolutely unique in one aspect: it is truly exogenous.

60
EXHIBITS
Exhibit 1 – U.S. Gross Petroleum Imports by country of Origin. Source: U.S. Energy Information
Administration79
; Analysis: Andre Soresini
79. “U.S. Crude Oil Imports.” U.S. Energy Information Administration, accessed September 19, 2010,
http://tonto.eia.doe.gov/dnav/pet/PET_MOVE_IMPCUS_A2_NUS_EPC0_IM0_MBBLPD_A.htm.
0%
10%
20%
30%
40%
50%
60%
70%
US Oil Imports (% of total oil consumption)
Others, Non-OPEC
UK
Russia
Mexico
Canada
Brazil
Others, OPEC
Venezuela
Saudi Arabia
Nigeria
Iraq

61
Exhibit 2 – Surface Temperature Analysis. Source: NASA80
80. “Goddard Institute for Space Studies – Surface Temperature Analysis.” NASA GGISS Website, accessed
October 3, 2010, http://data.giss.nasa.gov/gistemp/graphs/.

62
Exhibit 3 – Nominal and Real Annual Imported Crude Oil Prices. Source: EIA81
81. “Short-Term Energy Outlook – Real Energy Prices.” U.S. Energy Information Administration, accessed
September 19, 2010, http://www.eia.doe.gov/EMEU/steo/realprices/index.cfm.
0
10
20
30
40
50
60
70
80
90
100
1968 1972 1976 1980 1984 1988 1992 1996 2000 2004 2008
Annual Imported Crude Oil PriceDollars per barrel
Nominal Price
Forecast
EIA Short-Term Energy Outlook, November 2010
Real Price (Nov 2010 $)

63
Exhibit 4 – Total GDP (PPP) vs. Total Energy consumed (quadrillion BTUs) in 2007. Sources:
World Bank82
, EIA83
; Analysis: Andre Soresini
The following data for GDP in PPP terms is given in USD billion, whereas the total
energy consumption is given in quadrillion BTUs.
82. “World Bank Indicators – GDP (PPP) in constant international $.” World Bank Data Center, accessed September
19, 2010, http://data.worldbank.org/indicator/NY.GDP.MKTP.PP.KD.
83. “International Total Primary Energy Consumption and Energy Intensity.” U.S. Energy Information
Administration, accessed September 20, 2010, http://www.eia.doe.gov/emeu/international/energyconsumption.html.

64
Exhibit 5 – Greenhouse Gas Emissions from Electricity Production. Source: World Nuclear
Association84
.
84. WNA, Emissions.

65
Exhibit 6 – Solar radiation on the surface of the earth85
85. “Earth-Sun Relationships and Incoming Solar Energy.” Sharing of free intellectual assets (SOFIA) Website,
accessed October 4, 2010, http://sofia.fhda.edu/gallery/geography/images/seasons_insolation.gif.

66
Exhibit 7 – Historical oil prices86
86. “Oil Price History and Analysis.” WTRG Economics Website, accessed November 17, 2010,
http://www.wtrg.com/prices.htm.

67
Exhibit 8 – The Sun Tower SPS Concept87
Exhibit 9 – Artistic Rendering of the Sun Tower88
87. Mankins, Fresh Look.
88. “Space Solar Power Satellites – Sun Tower.” Innopedia Website, accessed January 17, 2011,
http://innopedia.wdfiles.com/local--files/space-solar-power-satellites-with-power-beaming-to-aircraft/800px-
Suntower.jpg.

68
Exhibit 10 – SPS power is beamed directly to a receiving antenna (rectenna)89
Exhibit 11 – A Rectenna could be located either in rural or urban areas90
89. “Solar Power Satellite – Rectenna.” Space Studies Institute Website, accessed March 8, 2011,
http://ssi.org/space-art/ssi-sample-slides/.
90. SSAG.

69
Exhibit 12 – The Solar Disc SPS concept91
Exhibit 13 – Artistic Rendering of the Solar Disc92
91. Mankins, Fresh Look.
92. “Space Solar Power Satellites – Solar Disk.” Innopedia Website, accessed January 17, 2011,
http://innopedia.wdfiles.com/local--files/space-solar-power-satellites-with-power-beaming-to-aircraft/800px-
Solardisk.jpg.

70
Exhibit 14 – Average retail price of electricity in the U.S. in 200993
93. “Average Retail Price of Electricity by State, 2009.” U.S. Energy Information Administration, accessed March
7, 2011, http://www.eia.doe.gov/cneaf/electricity/epa/fig7p5.html.

71
Exhibit 15 – Worldwide electricity prices for industry94
94. “Worldwide Electricity Prices for Industry.” PowerStandards.com Website, accessed March 8, 2011,
http://www.powerstandards.com/

72
Exhibit 16 – Average worldwide electricity prices95
95. “Electricity Prices Vary all Around the World.” Maritime Electric Website, accessed March 8, 2011,
http://www.maritimeelectric.com/understanding_electricity/el_comparing_prices.asp.

73
Exhibit 17 – Depiction of the three earth orbits96
Orbit Distance Miles Km 1-way Delay
Low Earth Orbit (LEO) 100-500 160 - 1,400 50 ms
Medium Earth Orbit (MEO) 6,000 - 12,000 10 -15,000 100 ms
Geostationary Earth Orbit (GEO) ~22,300 36,000 250 ms
96. “Satellite Orbits.” InetDaemon Website, accessed March 9, 2011,
http://www.inetdaemon.com/tutorials/satellite/satellite-orbits.shtml.

74
Exhibit 18 – From left to right: single-crystal silicon97
and polycrystalline silicon98
Exhibit 19 – GaAs-Solar Panels99
Exhibit 20 – CdTe Photovoltaic cell Composition100
97. “Monocrystalline and Polycrystalline Silicon Solar Cells.” Rich Solar Website, accessed March 27, 2011,
http://www.richsolar.com/de/product/Solar_Cells.htm.
98. IBID
99. “Top Advancements in Solar Technology – Gallium Arsenide Solar Cell.” EcoFriend Website, accessed March
27, 2011, http://www.ecofriend.com/gallery/gallium-arsenide-solar-cell_69/.
100. “Cadmium Telluride Photovoltaic Film.” MIT Fundamentals of Photovoltaics Website, accessed November 17,
2010, http://ocw.mit.edu/courses/mechanical-engineering/2-626-fundamentals-of-photovoltaics-fall-
2008/chp_CdTe.jpg.

75
Exhibit 21 – GIGS Photovoltaic cell structure101
Exhibit 22 – a-Si photovoltaic cell composition102
101. “Copper Indium Gallium Selenide Polycrystalline Thin Films.” Absolute Astronomy Website, accessed
November 17, 2010,
http://image.absoluteastronomy.com/images/topicimages/c/co/copper_indium_gallium_selenide.gif.
102. “Amorphous Silicon Photovoltaic Cell Composition.” U.S. DOE Energy Efficiency and Renewable Energy
Website, accessed November 17, 2010,
http://www.eere.energy.gov/basics/renewable_energy/images/illust_nip_structure.gif.

76
Exhibit 23 – Diagram of a solar dynamic system with water as the working fluid103
103. “Solar Dynamic System.” Flickr Website, accessed November 17, 2010,
http://farm3.static.flickr.com/2197/2366694264_f34caec302.jpg.

77
Exhibit 24 – Average RF output power versus frequency for various electronic devices and
semiconductor systems104
.
104. Shinohara, Wireless Power.

78
Exhibit 25 – Typical parameters of the transmitting antenna of a SPS105
.
Exhibit 26 – Concept demonstration of laser power beaming106
105. Shinohara, Wireless Power.
106. “Concept Demonstration of Laser Power Beaming.” Lawrence Livermore National Laboratory, accessed
November 17, 2010, https://lasers.llnl.gov/multimedia/publications/images/solar.jpg.

79
Exhibit 27 – Examples of Vertical Takeoff and Horizontal Landing (left)107
, Horizontal Takeoff
and Landing (middle)108
, and Vertical Takeoff and Landing (right)109
.
Exhibit 28 – Concepts of space elevator110
(left) and Maglev launching system (right)111
107. “Vertical Take-Off and Horizontal Landing Launch Vehicle.” Wikipedia, accessed November 17, 2010,
http://en.wikipedia.org/wiki/File:Buran.jpg#filelinks.
108. “XCOR Aerospace EZ-Rocket.” Wikipedia, accessed March 27, 2011, http://en.wikipedia.org/wiki/File:Xcor-
ezrocket-N132EZ-020627-02.jpg.
109. “McDonnell Douglas DC-XA.” Wikipedia, accessed March 27, 2011,
http://en.wikipedia.org/wiki/File:McDonnell_Douglas_DC-XA.jpg.
110. “Space Elevator.” Cosmos Magazine Website, accessed November 17, 2010,
http://www.cosmosmagazine.com/files/imagecache/feature/files/features/print/20081216_space_elevator.jpg.
111. “Maglev Launching System.” G2mil Website, accessed November 17, 2010,
http://www.g2mil.com/maglev.jpg.
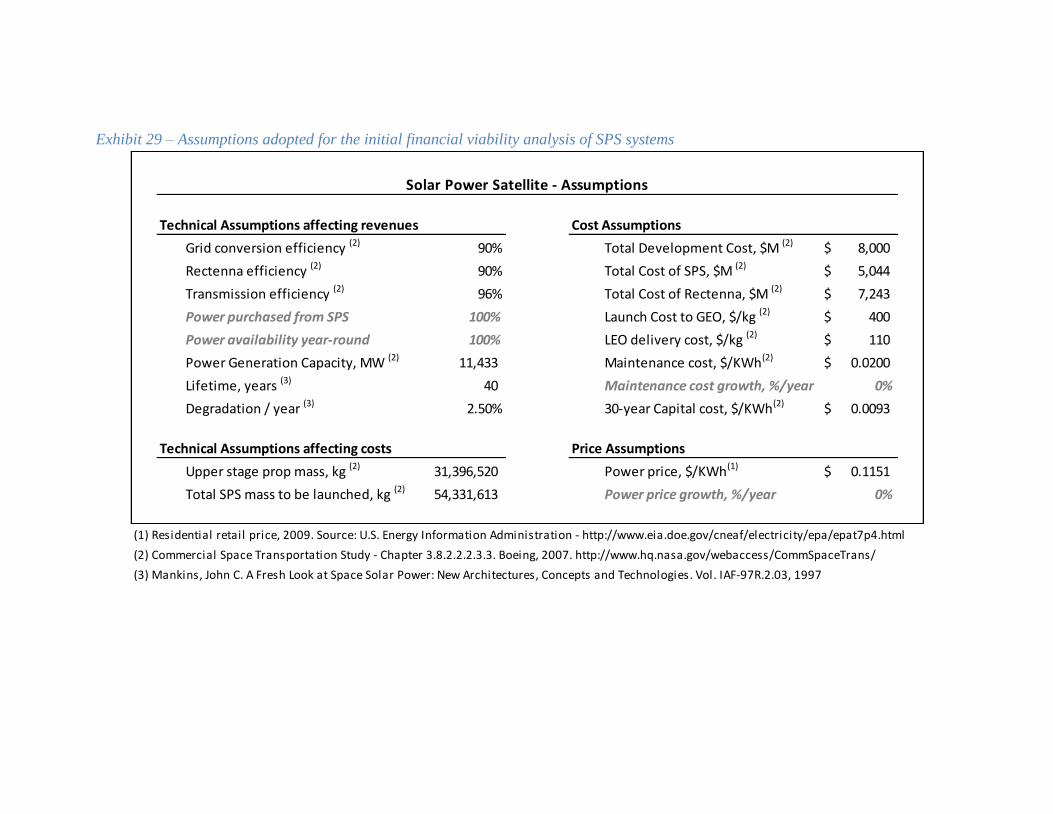
Exhibit 29 – Assumptions adopted for the initial financial viability analysis of SPS systems
Technical Assumptions affecting revenues Cost Assumptions
Grid conversion efficiency (2) 90% Total Development Cost, $M (2) 8,000$
Rectenna efficiency (2) 90% Total Cost of SPS, $M (2) 5,044$
Transmission efficiency (2) 96% Total Cost of Rectenna, $M (2) 7,243$
Power purchased from SPS 100% Launch Cost to GEO, $/kg (2) 400$
Power availability year-round 100% LEO delivery cost, $/kg (2) 110$
Power Generation Capacity, MW (2) 11,433 Maintenance cost, $/KWh(2) 0.0200$
Lifetime, years (3) 40 Maintenance cost growth, %/year 0%
Degradation / year (3) 2.50% 30-year Capital cost, $/KWh(2) 0.0093$
Technical Assumptions affecting costs Price Assumptions
Upper stage prop mass, kg (2) 31,396,520 Power price, $/KWh(1) 0.1151$
Total SPS mass to be launched, kg (2) 54,331,613 Power price growth, %/year 0%
(1) Residential retail price, 2009. Source: U.S. Energy Information Administration - http://www.eia.doe.gov/cneaf/electricity/epa/epat7p4.html
(2) Commercial Space Transportation Study - Chapter 3.8.2.2.2.3.3. Boeing, 2007. http://www.hq.nasa.gov/webaccess/CommSpaceTrans/
(3) Mankins, John C. A Fresh Look at Space Solar Power: New Architectures, Concepts and Technologies. Vol. IAF-97R.2.03, 1997
Solar Power Satellite - Assumptions

81
Exhibit 30 – Financial Model for the base-case model with assumptions presented in Exhibit 29 2011 2012 2013 2014 2015 2016 2017 2018 2019 2020 2021
0 1 2 3 4 5 6 7 8 9 10
Power Generation Capacity
Installed Capacity, MW - 11,433 11,147 10,861 10,575 10,290 10,004 9,718 9,432 9,146 8,860
Cumulative Degradation 0.0% 0.0% 2.5% 5.0% 7.5% 10.0% 12.5% 15.0% 17.5% 20.0% 22.5%
Annual Capacity, MWh - 100,152,029 97,648,228 95,144,427 92,640,627 90,136,826 87,633,025 85,129,224 82,625,424 80,121,623 77,617,822
Power Installation Costs, $M
a. Total Development cost (8,000)
b. Launch Cost (40,268)
c. SPS + Rectenna Cost (12,287)
x. Government Subsidies
Salvage Value
Depreciation 307 307 307 307 307 307 307 307 307 307
d. Depreciation Tax Shield - 108 108 108 108 108 108 108 108 108 108
Operations
Revenues from power 8,964 8,740 8,516 8,291 8,067 7,843 7,619 7,395 7,171 6,947
Power Supply consumed 100% 100% 100% 100% 100% 100% 100% 100% 100% 100%
Price per KWh, $ 0.12 0.12 0.12 0.12 0.12 0.12 0.12 0.12 0.12 0.12
Annual price increase per KWh 0.0% 0.0% 0.0% 0.0% 0.0% 0.0% 0.0% 0.0% 0.0% 0.0%
Cost of Power Generation (2,003) (1,953) (1,903) (1,853) (1,803) (1,753) (1,703) (1,653) (1,602) (1,552)
Maintenance cost per KWh, $ 0.02 0.02 0.02 0.02 0.02 0.02 0.02 0.02 0.02 0.02
Annual cost increase per KWh 0.0% 0.0% 0.0% 0.0% 0.0% 0.0% 0.0% 0.0% 0.0% 0.0%
Capital cost 30-yr amort. (931) (908) (885) (862) (838) (815) (792) (768) (745) (722)
30-yr Capital Cost, $/KWh 0.0093 0.0093 0.0093 0.0093 0.0093 0.0093 0.0093 0.0093 0.0093 0.0093
e. Before Tax Operating Profit - 6,029 5,879 5,728 5,577 5,426 5,276 5,125 4,974 4,823 4,673
f. Tax Expense - (2,110) (2,058) (2,005) (1,952) (1,899) (1,846) (1,794) (1,741) (1,688) (1,635)
After Tax Cash Flows (a+b+c+d+e+f) (60,555) 4,027 3,929 3,831 3,733 3,635 3,537 3,439 3,341 3,243 3,145
Terminal Value 32,275
Discount Factor 1.00 1.07 1.14 1.23 1.31 1.40 1.50 1.61 1.72 1.84 1.97
NPV of Cash Flows (60,555) 3,763 3,431 3,127 2,848 2,591 2,357 2,141 1,944 1,764 1,599
NPV of Terminal Value 16,407
Total NPV (60,555) 3,763 3,431 3,127 2,848 2,591 2,357 2,141 1,944 1,764 18,006
NPV of SPS (21,802) IRR of SPS -4.1%
Figures in US$ M, unless otherwise indicated

Exhibit 31 – South Korean real interest rates 1971-1991112, 113
Notes: a Real (i.e., inflation-adjusted) interest rates were calculated by substracting the GNP deflator rate from a
nominal loan rate.
b The curb market rate is the informal rate at which small savers lend money to commercial and business
borrowers.
112. Fields, Karl J. 1995. Enterprise and the State in Korea and Taiwan. Ithaca, New York: Cornell University Press.
113. Woo, Jung-En. 1991. Race to the Swift: State and Finance in Korean Industrialization. New York, New York:
Columbia University Press.
General
Loan
Export Loan
Machinery
Promotion
Fund
National
Investment
Fund
Curb Marketb
-30
-20
-10
0
10
20
30
40R
eal
Inte
rest
Rat
es (
%)a

Exhibit 32 – Sensitivity Analysis: Real Discount Rate and Corporate Tax Rate
NPV (21,802) 9% 7% 5% 3% 1% -1% -3% -5% -7% -9%
35% (27,567) (21,802) (13,968) (2,957) 13,106 37,517 76,256 140,575 252,385 455,876
30% (25,283) (19,134) (10,786) 934 18,013 43,927 84,984 153,026 271,074 485,475
25% (22,999) (16,467) (7,605) 4,826 22,919 50,337 93,712 165,476 289,762 515,073
20% (20,715) (13,799) (4,423) 8,718 27,825 56,747 102,440 177,927 308,451 544,672
15% (18,431) (11,132) (1,242) 12,609 32,732 63,157 111,168 190,378 327,139 574,271
10% (16,147) (8,464) 1,940 16,501 37,638 69,568 119,896 202,828 345,827 603,869
5% (13,863) (5,797) 5,121 20,392 42,544 75,978 128,624 215,279 364,516 633,468
0% (11,579) (3,129) 8,303 24,284 47,450 82,388 137,352 227,729 383,204 663,067
Discount Rate
Co
rpo
rate
Tax
Rat
e
in US$ M

84
Exhibit 33 – Sensitivity Analysis: Retail Price of Electricity and Transportation Cost to GEO
(1) (2) (3) (4) (5) (6) (7) (8) (9) (10)
NPV (21,802) 0.1151$ 0.1675$ 0.1921$ 0.2649$ 0.3147$ 0.3607$ 0.4181$ 0.6534$ 0.9200$ 1.1600$
4,872$ (405,161)$ (379,873)$ (368,046)$ (332,937)$ (308,933)$ (286,726)$ (259,074)$ (145,629)$ (17,092)$ 98,620$
4,000$ (330,423)$ (305,136)$ (293,309)$ (258,200)$ (234,195)$ (211,989)$ (184,337)$ (70,891)$ 57,645$ 173,357$
2,000$ (158,967)$ (133,680)$ (121,852)$ (86,743)$ (62,739)$ (40,533)$ (12,881)$ 100,565$ 229,102$ 344,813$
1,000$ (73,239)$ (47,952)$ (36,124)$ (1,015)$ 22,989$ 45,195$ 72,847$ 186,293$ 314,830$ 430,542$
800$ (56,093)$ (30,806)$ (18,979)$ 16,130$ 40,135$ 62,341$ 89,993$ 203,439$ 331,975$ 447,687$
600$ (38,948)$ (13,660)$ (1,833)$ 33,276$ 57,280$ 79,487$ 107,139$ 220,584$ 349,121$ 464,833$
400$ (21,802)$ 3,485$ 15,313$ 50,422$ 74,426$ 96,632$ 124,284$ 237,730$ 366,267$ 481,978$
200$ (4,656)$ 20,631$ 32,458$ 67,567$ 91,572$ 113,778$ 141,430$ 254,876$ 383,412$ 499,124$
(1)
(2)
(3)
(4)
(5)
(6)
(7)
(8)
(9)
(10)
Electricity cost in Denmark. Maritime Electric: http://www.maritimeelectric.com/understanding_electricity/el_comparing_prices.asp
Electricity cost in Kugluktuk, Nunavut. Maritime Electric: IBID
Electricity cost for US military in Iraq. Charania, A.C. et al, "A rational roadmap for developing a first revenue space solar power satellite". IAC, 2010.
Electricity cost for US military in Afghanistan. IBID
in US$ M
Electricity cost in France. Europe's Energy Portal - http://www.energy.eu
U.S. retail price per KWh in selected states (NY, CT, MA, AK, and HI). Source: EIA - http://www.eia.doe.gov/cneaf/electricity/epa/fig7p5.html
Electricity cost in the Netherlands. Maritime Electric: http://www.maritimeelectric.com/understanding_electricity/el_comparing_prices.asp
Electricity cost in Germany. Europe's Energy Portal - http://www.energy.eu
Electricity cost in Italy. Europe's Energy Portal - IBID
Retail Price of Electricity ($/KWh)
Lau
nch
to
GEO
($
/kg)
U.S.residential average retail price per kilowatthour. Source: EIA - http://www.eia.doe.gov/cneaf/electricity/epa/fig7p5.html

85
Exhibit 34 – Sensitivity Analysis: Growth of Retail Price of Electricity and SPS Lifespan
(1) (2) (3) (4) (5) (6) (7) (8)
NPV (21,802) 0% 2% 4% 6% 8% 10% 12% 18%
40 (21,802)$ (11,433)$ 2,566$ 21,896$ 49,188$ 88,544$ 146,421$ 567,352$
45 (20,200)$ (8,435)$ 7,940$ 31,403$ 66,009$ 118,482$ 200,105$ 888,206$
50 (18,837)$ (5,769)$ 12,948$ 40,743$ 83,554$ 151,846$ 264,350$ 1,371,675$
60 (16,663)$ (1,270)$ 21,951$ 58,865$ 120,804$ 230,321$ 433,430$ 3,216,402$
70 (15,024)$ 2,339$ 29,750$ 76,187$ 160,960$ 327,455$ 676,732$ 7,518,386$
80 (13,757)$ 5,265$ 36,512$ 92,685$ 204,116$ 447,737$ 1,028,537$ 17,692,595$
90 (12,754)$ 7,665$ 42,386$ 108,363$ 250,415$ 596,899$ 1,539,824$ 42,037,223$
100 (11,943)$ 9,654$ 47,505$ 123,241$ 300,036$ 782,227$ 2,286,573$ 100,858,725$
(1)
(2)
(3)
(4)
(5)
(6)
(7)
(8)
Prices double every 9 years.
Prices double every 7 years.
Prices double every 6 years.
Prices double every 4 years.
Life
tim
e o
f SP
S (y
ears
)
Current assumption - prices are stable forever.
Prices double every 36 years.
Prices double every 18 years.
Prices double every 12 years.
in US$ M Growth of Retail Price of Electricity (% p.a.)

86
Exhibit 35 – Sensitivity Analysis: Growth of Retail Price of Electricity and Transportation Costs to GEO
(1) (2) (3) (4) (5) (6)
NPV (21,802) 6% 8% 10% 12% 14% 18%
(a) 14,295$ (1,169,296)$ (1,142,005)$ (1,095,704)$ (1,044,772)$ (936,087)$ (623,840)$
(b) 11,966$ (969,619)$ (942,328)$ (896,027)$ (845,095)$ (736,410)$ (424,163)$
(c) 4,872$ (361,463)$ (334,171)$ (287,870)$ (236,938)$ (128,253)$ 183,994$
3,000$ (200,997)$ (173,705)$ (127,404)$ (76,473)$ 32,213$ 344,459$
1,500$ (72,405)$ (45,113)$ 1,188$ 52,120$ 160,805$ 473,051$
800$ (12,395)$ 14,896$ 61,198$ 112,129$ 220,815$ 533,061$
400$ 21,896$ 49,188$ 95,489$ 146,421$ 255,106$ 567,352$
200$ 39,042$ 66,333$ 112,634$ 163,566$ 272,251$ 584,498$
(a) Delta IV. http://www.astronautix.com/lvs/deltaiv.htm
(b) SpaceX Falcon9. http://www.spacex.com/falcon9.php#pricing_and_performance.
(c) SpaceX Falcon9-Heavy. http://www.spacex.com/falcon9_heavy.php#pricing_and_performance
(1) Prices double every 12 years.
(2) Prices double every 9 years.
(3) Prices double every 7 years.
(4) Prices double every 6 years.
(5) Prices double every 5 years.
(6) Prices double every 4 years.
Lau
nch
to
GEO
($
/kg)
Growth of Retail Price of Electricity (% p.a.)in US$ M

87
Exhibit 36 – Set of assumptions chosen for the high probability outcome
Technical Assumptions affecting revenues Cost Assumptions
Grid conversion efficiency (2) 90% Total Development Cost, $M (2) 8,000$
Rectenna efficiency (2) 90% Total Cost of SPS, $M (2) 5,044$
Transmission efficiency (2) 96% Total Cost of Rectenna, $M (2) 7,243$
Power purchased from SPS 100% Launch Cost to GEO, $/kg (2) 3,898$
Power availability year-round 100% LEO delivery cost, $/kg (2) 110$
Power Generation Capacity, MW (2) 11,433 Maintenance cost, $/KWh(2) 0.0200$
Lifetime, years (3) 50 Maintenance cost growth, %/year 0%
Degradation / year (3) 2.00% 30-year Capital cost, $/KWh(2) 0.0093$
Technical Assumptions affecting costs Price Assumptions
Upper stage prop mass, kg (2) 31,396,520 Power price, $/KWh(1) 0.1921$
Total SPS mass to be launched, kg (2) 54,331,613 Power price growth, %/year 4%
(1) Residential retail price, 2009 for NY, MA, CT, AK, and HI. EIA - http://www.eia.doe.gov/cneaf/electricity/epa/epat7p4.html
(2) Commercial Space Transportation Study - Chapter 3.8.2.2.2.3.3. Boeing, 2007. http://www.hq.nasa.gov/webaccess/CommSpaceTrans/
(3) Lifespan 25% higher than the one suggested by Mankins, John C. "A Fresh Look"
(4) SpaceX Falcon9-Heavy. http://www.spacex.com/falcon9_heavy.php#pricing_and_performance
Solar Power Satellite - Assumptions

88
Exhibit 37 – Financial model output for the high probability outcome
2011 2012 2013 2014 2015 2016 2017 2018 2019 2020 2021
0 1 2 3 4 5 6 7 8 9 10
Power Generation Capacity
Installed Capacity, MW - 11,433 11,204 10,976 10,747 10,518 10,290 10,061 9,832 9,604 9,375
Cumulative Degradation 0.0% 0.0% 2.0% 4.0% 6.0% 8.0% 10.0% 12.0% 14.0% 16.0% 18.0%
Annual Capacity, MWh - 100,152,029 98,148,988 96,145,948 94,142,907 92,139,866 90,136,826 88,133,785 86,130,745 84,127,704 82,124,664
Power Installation Costs, $M
a. Total Development cost (8,000)
b. Launch Cost (340,110)
c. SPS + Rectenna Cost (12,287)
x. Government Subsidies
Salvage Value
Depreciation 246 246 246 246 246 246 246 246 246 246
d. Depreciation Tax Shield - 17 17 17 17 17 17 17 17 17 17
Operations
Revenues from power 14,960 15,248 15,534 15,819 16,101 16,381 16,658 16,931 17,198 17,461
Power Supply consumed 100% 100% 100% 100% 100% 100% 100% 100% 100% 100%
Price per KWh, $ 0.19 0.20 0.21 0.22 0.22 0.23 0.24 0.25 0.26 0.27
Annual price increase per KWh 4.0% 4.0% 4.0% 4.0% 4.0% 4.0% 4.0% 4.0% 4.0% 4.0%
Cost of Power Generation (2,003) (1,963) (1,923) (1,883) (1,843) (1,803) (1,763) (1,723) (1,683) (1,642)
Maintenance cost per KWh, $ 0.02 0.02 0.02 0.02 0.02 0.02 0.02 0.02 0.02 0.02
Annual cost increase per KWh 0.0% 0.0% 0.0% 0.0% 0.0% 0.0% 0.0% 0.0% 0.0% 0.0%
Capital cost 30-yr amort. (931) (913) (894) (876) (857) (838) (820) (801) (782) (764)
30-yr Capital Cost, $/KWh 0.0093 0.0093 0.0093 0.0093 0.0093 0.0093 0.0093 0.0093 0.0093 0.0093
e. Before Tax Operating Profit - 12,026 12,372 12,717 13,060 13,402 13,740 14,076 14,407 14,734 15,054
f. Tax Expense - (842) (866) (890) (914) (938) (962) (985) (1,008) (1,031) (1,054)
After Tax Cash Flows (a+b+c+d+e+f) (360,397) 11,201 11,523 11,844 12,163 12,481 12,796 13,108 13,416 13,719 14,018
Terminal Value 285,961
Discount Factor 1.00 1.03 1.06 1.09 1.13 1.16 1.19 1.23 1.27 1.30 1.34
NPV of Cash Flows (360,397) 10,875 10,862 10,839 10,807 10,766 10,716 10,658 10,591 10,515 10,430
NPV of Terminal Value 212,782
Total NPV (360,397) 10,875 10,862 10,839 10,807 10,766 10,716 10,658 10,591 10,515 223,212
NPV of SPS 1,950 IRR of SPS 0.03%
Figures in US$ M, unless otherwise indicated

89
Exhibit 38 – Set of assumptions chosen for the medium probability outcome
Technical Assumptions affecting revenues Cost Assumptions
Grid conversion efficiency (2) 90% Total Development Cost, $M (2) 8,000$
Rectenna efficiency (2) 90% Total Cost of SPS, $M (2) 5,044$
Transmission efficiency (2) 96% Total Cost of Rectenna, $M (2) 7,243$
Power purchased from SPS 100% Launch Cost to GEO, $/kg (2) 800$
Power availability year-round 100% LEO delivery cost, $/kg (2) 110$
Power Generation Capacity, MW (2) 11,433 Maintenance cost, $/KWh(2) 0.0200$
Lifetime, years (3) 50 Maintenance cost growth, %/year 2%
Degradation / year (3) 2.00% 30-year Capital cost, $/KWh(2) 0.0093$
Technical Assumptions affecting costs Price Assumptions
Upper stage prop mass, kg (2) 31,396,520 Power price, $/KWh(1) 0.1921$
Total SPS mass to be launched, kg (2) 54,331,613 Power price growth, %/year 2%
(1) Residential retail price, 2009 for NY, MA, CT, AK, and HI. EIA - http://www.eia.doe.gov/cneaf/electricity/epa/epat7p4.html
(2) Commercial Space Transportation Study - Chapter 3.8.2.2.2.3.3. Boeing, 2007. http://www.hq.nasa.gov/webaccess/CommSpaceTrans/
(3) Lifespan 25% higher than the one suggested by Mankins, John C. "A Fresh Look"
Solar Power Satellite - Assumptions

90
Exhibit 39 – Financial model output for the medium probability outcome
2011 2012 2013 2014 2015 2016 2017 2018 2019 2020 2021
0 1 2 3 4 5 6 7 8 9 10
Power Generation Capacity
Installed Capacity, MW - 11,433 11,204 10,976 10,747 10,518 10,290 10,061 9,832 9,604 9,375
Cumulative Degradation 0.0% 0.0% 2.0% 4.0% 6.0% 8.0% 10.0% 12.0% 14.0% 16.0% 18.0%
Annual Capacity, MWh - 100,152,029 98,148,988 96,145,948 94,142,907 92,139,866 90,136,826 88,133,785 86,130,745 84,127,704 82,124,664
Power Installation Costs, $M
a. Total Development cost (8,000)
b. Launch Cost (74,559)
c. SPS + Rectenna Cost (12,287)
x. Government Subsidies -
Salvage Value
Depreciation 246 246 246 246 246 246 246 246 246 246
d. Depreciation Tax Shield - 49 49 49 49 49 49 49 49 49 49
Operations
Revenues from power 14,960 14,954 14,942 14,924 14,898 14,866 14,826 14,779 14,724 14,661
Power Supply consumed 100% 100% 100% 100% 100% 100% 100% 100% 100% 100%
Price per KWh, $ 0.19 0.20 0.20 0.20 0.21 0.21 0.22 0.22 0.23 0.23
Annual price increase per KWh 2.0% 2.0% 2.0% 2.0% 2.0% 2.0% 2.0% 2.0% 2.0% 2.0%
Cost of Power Generation (2,003) (2,002) (2,001) (1,998) (1,995) (1,990) (1,985) (1,979) (1,971) (1,963)
Maintenance cost per KWh, $ 0.02 0.02 0.02 0.02 0.02 0.02 0.02 0.02 0.02 0.02
Annual cost increase per KWh 2.0% 2.0% 2.0% 2.0% 2.0% 2.0% 2.0% 2.0% 2.0% 2.0%
Capital cost 30-yr amort. (931) (913) (894) (876) (857) (838) (820) (801) (782) (764)
30-yr Capital Cost, $/KWh 0.0093 0.0093 0.0093 0.0093 0.0093 0.0093 0.0093 0.0093 0.0093 0.0093
e. Before Tax Operating Profit - 12,026 12,039 12,047 12,050 12,047 12,037 12,021 11,999 11,970 11,934
f. Tax Expense - (2,405) (2,408) (2,409) (2,410) (2,409) (2,407) (2,404) (2,400) (2,394) (2,387)
After Tax Cash Flows (a+b+c+d+e+f) (94,846) 9,670 9,681 9,687 9,689 9,686 9,679 9,666 9,648 9,625 9,596
Terminal Value 106,627
Discount Factor 1.00 1.07 1.14 1.23 1.31 1.40 1.50 1.61 1.72 1.84 1.97
NPV of Cash Flows (94,846) 9,037 8,455 7,908 7,392 6,906 6,449 6,020 5,616 5,236 4,878
NPV of Terminal Value 54,204
Total NPV (94,846) 9,037 8,455 7,908 7,392 6,906 6,449 6,020 5,616 5,236 59,082
NPV of SPS (incl. TV) 27,255 IRR of SPS (incl. TV) 3.7%
Figures in US$ M, unless otherwise indicated

91
Exhibit 40 – Conceptual Pareto Frontier for currently existing energy sources.

BIBLIOGRAPHY
1. “Satellite Power System Concept Development and Evaluation Program.” National Space
Society, last modified September 15, 2010, http://www.nss.org/settlement/ssp/library/doe.htm.
2. “Windmills are killing our birds.” The website of the Wall Street Journal, last modified
September 7, 2009,
http://online.wsj.com/article/SB10001424052970203706604574376543308399048.html.
3. “2010 World Hunger and Poverty Facts and Statistics.” World Hunger Organization, accessed
September 19, 2010,
http://www.worldhunger.org/articles/Learn/world%20hunger%20facts%202002.htm
4. “Energy: The Forgotten Crisis.” American Physical Society, accessed October 3, 2010,
http://www.aps.org/policy/statements/96_2.cfm
5. “A New Security Paradigm.” Foreign Policy Journal, last modified September 14, 2009,
http://fletcher.tufts.edu/news/2009/09/opeds/Mylrea-Sept14.shtml.
6. Wilbanks, T.J. et al. Industry, settlement and society. Parry 2007: 357-390.
7. Zhang, D.; Brecke, P.; Lee, H.; He, Y.; Zhang, J. (2007) “Global climate change, war, and
population decline in recent human history”. Proceedings of the National Academy of Sciences of
the United States of America 104 (49): 19214-19219.
http://www.ncbi.nlm.nih.gov/pmc/articles/PMC2148270/?tool=pmcentrez
8. Mankins, J.C., “A Fresh Look at Space Solar Power: New Architectures, Concepts and
Technologies”, 38th International Astronautical Federation, 1997.
9. Spadaro, Joseph V. et al (2000) “Greenhouse Gas Emissions of Electricity Generation Chains –
Assessing the Difference”. International Atomic Energy Agency.
http://www.iaea.org/Publications/Magazines/Bulletin/Bull422/article4.pdf .
10. “Greenhouse Gas Emissions from Power Generation.” World Nuclear Association, accessed
October 3, 2010, http://www.world-nuclear.org/why/greenhouse_gas_from_generation.html.
11. “Dealing with Public Acceptance for Nuclear Power.” International Atomic Energy Agency, last
modified September 23, 2008, http://www.iea.org/work/2008/bangkok/toth_acceptance.pdf.
12. “Japan‟s Disaster May Cool U.S. Acceptance of Nuclear Power.” LiveScience Website, accessed
March 27, 2011, http://www.livescience.com/13240-japan-disaster-sway-perception-nuclear-
power.html.
13. “Pollution from Chinese Coal Casts a Global Shadow.” The website of The New York Times, last
modified June 11, 2006,
http://www.nytimes.com/2006/06/11/business/worldbusiness/11chinacoal.html.
14. “Renewables 2010 – Global Status Report.” Renewable Energy Policy Network for the 21st
Century, accessed September 19, 2010,
http://www.ren21.net/Portals/97/documents/GSR/REN21_GSR_2010_full_revised%20Sept2010.
pdf.
15. “The World Commission on Dams Framework – A Brief Introduction.” International rivers
organization, last modified February 29, 2008, http://www.internationalrivers.org/en/way-
forward/world-commission-dams/world-commission-dams-framework-brief-introduction.
16. “Operation Chastise.” The Dambusters Website, accessed October 4, 2010,
http://www.thedambusters.org.uk/chastise_index.html.
17. “Photovoltaic Panels Efficiency Degradation Factors.” Renewable Energy Sources Website,
accessed October 3, 2010, http://www.renewable-energy-sources.com/2009/07/30/pv-panels-
efficiency-degradation-factors/.
18. “DESERTEC Foundation.” The Website of the Desertec Project, accessed September 19, 2010,
http://www.desertec.org.

93
19. “Global Cumulative Wind Power Capacity.” Global Wind Energy Council, accessed October 4,
2010,
http://www.gwec.net/fileadmin/images/Publications/Global_cumulative_wind_power_capacity.jp
g.
20. Dr. Glaser, Peter E., “Power from the Sun – Its Future”. Science, Vol. 162, November 22, 1968,
pp 857-861.
21. Dr. Lior, Noam. “Power from space”. Energy conversion and management 42, 2001.
22. “Space-Based Solar Power as an Opportunity for Strategic Security”. National Security Space
Office, last modified October 10, 2007, http://www.nss.org/settlement/ssp/library/nsso.htm.
23. Price at the closing of the trading session on the New York Mercantile Exchange on July 3rd
2008.
24. “Contract for Procurement of Renewable Energy Resources Resulting from PG&E‟s Power
Purchase Agreement with Solaren Corporation.“ Public Utilities Commission of the State of
California, December 3, 2009,
http://docs.cpuc.ca.gov/PUBLISHED/FINAL_RESOLUTION/110808.htm.
25. “Solarbird Space Systems.” The Mitsubishi Electric website, accessed October 4, 2010,
http://global.mitsubishielectric.com/bu/space/rd/solarbird/index.html.
26. “Energy market drivers behind Space Solar Power.” The Powersat Corporation website, accessed
October 4, 2010, http://www.powersat.com/.
27. Mankins, J.C. “A technical overview of the „SunTower‟ solar power satellite concept”. Acta
Astronautica 50 (2002): 369-377.
28. “The Space Settlement Art Gallery”, accessed September 19, 2010, http://space.mike-
combs.com/gallery.htm.
29. “World Record: 41.1% efficiency reached for multi-junction solar cells at Fraunhofer ISE.”
Franhofer Institut, last modified January 14, 2009, http://www.ise.fraunhofer.de/press-and-
media/press-releases/press-releases-2009/world-record-41.1-efficiency-reached-for-multi-
junction-solar-cells-at-fraunhofer-ise.
30. Mah, O. “Fundamentals of Photovoltaic Materials”, National Solar Power Research Institute, Inc.
December 21,1998.
31. “Solar Dynamic Power System Development for Space Station Freedom.” NASA Glenn
Research Center, Staff of Solar Dynamic Power System Branch, May 1993.
32. Harty, R.B. Otting, W.D. Kudija, C.T. “Applications of Brayton cycle technology to space
power.” Aerospace and Electronic Systems Magazine, IEEE, 9 (1994): 28-32.
33. Mason, L.S. “A Solar Dynamic Power Option for Space Solar Power.” NASA Glenn Research
Center, last modified July 1999, http://gltrs.grc.nasa.gov/reports/1999/TM-1999-209380.pdf.
34. Shinohara, N., “Wireless Power Transmission for Solar Power Satellite.” Georgia Institute of
Technology, accessed November 17, 2010, http://www.sspi.gatech.edu/wptshinohara.pdf.
35. Landis, G. A., “My Involvement with Laser Power Beaming”, Geoffrey A. Landis Website, last
modified March 6, 2011, http://www.geoffreylandis.com/laser.htp.
36. “Electric Power Annual – Average Retail Price of Electricity.” U.S. Energy Information
Administration, accessed March 7, 2011,
http://www.eia.doe.gov/cneaf/electricity/epa/epat7p4.html .
37. “GE Tax Rate Shows Hypocrisy of Obama‟s Energy Tax Plan.” FuelFix Website, accessed
March 6, 2011, http://fuelfix.com/blog/2011/02/14/ge-tax-rate-shows-hypocrisy-of-obamas-
energy-tax-plan/.
38. Charania, A.C. et al, "A rational roadmap for developing a first revenue space solar power
satellite". SpaceWorks Engineering, Inc., accessed March 7, 2011,
http://www.sei.aero/eng/papers/uploads/archive/IAC-10.E6.3.11.pdf.

94
39. “Falcon Heavy Overview.” Space Exploration Technologies Corporation, accessed March 7,
2011, http://www.spacex.com/falcon9_heavy.php#pricing_and_performance.
40. “Commercial Space Transportation Study.” The Website of NASA HQ, Chapter 3.8.2.2.2.3.3,
Boeing, last modified January 4, 1997, http://www.hq.nasa.gov/webaccess/CommSpaceTrans/.
41. “Clean Energy Trends 2009.” Clean Edge Website, accessed November 17, 2010,
http://www.cleanedge.com/reports/pdf/Trends2009.pdf.
42. “NASA – Commercial Crew and Cargo.” NASA Commercial Crew&Cargo Program Office,
accessed March 7, 2011, http://www.nasa.gov/offices/c3po/home/.
43. “SpaceX Launches Success with Falcon9/Dragon Flight.” NASA Commercial Crew&Cargo
Program Office, accessed March 7, 2011,
http://www.nasa.gov/offices/c3po/home/spacexfeature.html#.
44. “International Cooperation.” NASA - International Space Station Website, accessed March 9,
2011, http://www.nasa.gov/mission_pages/station/cooperation/index.html.
45. “What‟s the cost of space station?” The Website of MSNBC, accessed March 9, 2011,
http://www.msnbc.msn.com/id/14505278/.
46. “The ITER Story.” ITER Organization Website, accessed March 7, 2011,
http://www.iter.org/proj/iterhistory.
47. “U.S. Crude Oil Imports.” U.S. Energy Information Administration, accessed September 19,
2010,
http://tonto.eia.doe.gov/dnav/pet/PET_MOVE_IMPCUS_A2_NUS_EPC0_IM0_MBBLPD_A.ht
m.
48. “Goddard Institute for Space Studies – Surface Temperature Analysis.” NASA GGISS Website,
accessed October 3, 2010, http://data.giss.nasa.gov/gistemp/graphs/.
49. “Short-Term Energy Outlook – Real Energy Prices.” U.S. Energy Information Administration,
accessed September 19, 2010, http://www.eia.doe.gov/EMEU/steo/realprices/index.cfm.
50. “World Bank Indicators – GDP (PPP) in constant international $.” World Bank Data Center,
accessed September 19, 2010, http://data.worldbank.org/indicator/NY.GDP.MKTP.PP.KD.
51. “International Total Primary Energy Consumption and Energy Intensity.” U.S. Energy
Information Administration, accessed September 20, 2010,
http://www.eia.doe.gov/emeu/international/energyconsumption.html.
52. “Earth-Sun Relationships and Incoming Solar Energy.” Sharing of free intellectual assets
(SOFIA) Website, accessed October 4, 2010,
http://sofia.fhda.edu/gallery/geography/images/seasons_insolation.gif.
53. “Oil Price History and Analysis.” WTRG Economics Website, accessed November 17, 2010,
http://www.wtrg.com/prices.htm.
54. “Space Solar Power Satellites – Sun Tower.” Innopedia Website, accessed January 17, 2011,
http://innopedia.wdfiles.com/local--files/space-solar-power-satellites-with-power-beaming-to-
aircraft/800px-Suntower.jpg.
55. “Solar Power Satellite – Rectenna.” Space Studies Institute Website, accessed March 8, 2011,
http://ssi.org/space-art/ssi-sample-slides/.
56. “Space Solar Power Satellites – Solar Disk.” Innopedia Website, accessed January 17, 2011,
http://innopedia.wdfiles.com/local--files/space-solar-power-satellites-with-power-beaming-to-
aircraft/800px-Solardisk.jpg.
57. “Average Retail Price of Electricity by State, 2009.” U.S. Energy Information Administration,
accessed March 7, 2011, http://www.eia.doe.gov/cneaf/electricity/epa/fig7p5.html.
58. “Worldwide Electricity Prices for Industry.” PowerStandards.com Website, accessed March 8,
2011, http://www.powerstandards.com/

95
59. “Electricity Prices Vary all Around the World.” Maritime Electric Website, accessed March 8,
2011, http://www.maritimeelectric.com/understanding_electricity/el_comparing_prices.asp.
60. “Satellite Orbits.” InetDaemon Website, accessed March 9, 2011,
http://www.inetdaemon.com/tutorials/satellite/satellite-orbits.shtml.
61. “Cadmium Telluride Photovoltaic Film.” MIT Fundamentals of Photovoltaics Website, accessed
November 17, 2010, http://ocw.mit.edu/courses/mechanical-engineering/2-626-fundamentals-of-
photovoltaics-fall-2008/chp_CdTe.jpg.
62. “Copper Indium Gallium Selenide Polycrystalline Thin Films.” Absolute Astronomy Website,
accessed November 17, 2010,
http://image.absoluteastronomy.com/images/topicimages/c/co/copper_indium_gallium_selenide.g
if.
63. “Amorphous Silicon Photovoltaic Cell Composition.” U.S. DOE Energy Efficiency and
Renewable Energy Website, accessed November 17, 2010,
http://www.eere.energy.gov/basics/renewable_energy/images/illust_nip_structure.gif.
64. “Solar Dynamic System.” Flickr Website, accessed November 17, 2010,
http://farm3.static.flickr.com/2197/2366694264_f34caec302.jpg.
65. “Concept Demonstration of Laser Power Beaming.” Lawrence Livermore National Laboratory,
accessed November 17, 2010, https://lasers.llnl.gov/multimedia/publications/images/solar.jpg.
66. “Vertical Take-Off and Horizontal Landing Launch Vehicle.” Wikipedia, accessed November 17,
2010, http://en.wikipedia.org/wiki/File:Buran.jpg#filelinks.
67. “Space Elevator.” Cosmos Magazine Website, accessed November 17, 2010,
http://www.cosmosmagazine.com/files/imagecache/feature/files/features/print/20081216_space_e
levator.jpg.
68. “Maglev Launching System.” G2mil Website, accessed November 17, 2010,
http://www.g2mil.com/maglev.jpg.
69. Fields, Karl J. 1995. “Enterprise and the State in Korea and Taiwan.” Ithaca, New York: Cornell
University Press.
70. Woo, Jung-En. 1991. “Race to the Swift: State and Finance in Korean Industrialization.” New
York, New York: Columbia University Press.