Embed Size (px)
Citation preview

The Business case of Land and Water Literature research and working case studies
Lead Author: Tom Collins,
Contributions made by: Thomas Schuurmans and Frederik Claasen.
Commissioned by
WASH Alliance International
May 2016
Project number 2645-07B
Aidenvironment
Barentszplein 7
1013 NJ Amsterdam
The Netherlands
+ 31 (0)20 686 81 11
www.aidenvironment.org
Aidenvironment is part of Stichting AERA, registered at the Chamber of Commerce of Amsterdam in the Netherlands, number 41208024


Project number 2645-07B 3
The Business case of Land and Water
Contents
Executive Summary 5
Introduction 7
1. The Business Case 9 1.1 What is a business case? 9 1.2 Why is a business case needed? 9 1.3 What is the scope of the business case? 9
2. Landscape users: Water-Food-Energy Nexus 11
3. Managing landscapes: Integrated Perspectives 13
4. The value proposition: Ecosystem Services 15
5. Improving the value proposition: Three Categories of Intervention 17 5.1 Pre-Collapse: stabilize, intensify regime 18 5.2 Post-Collapse: Reversible regime shift 19 5.3 Post-Collapse: Irreversible regime shift 19
6. Revenue Generation: Payments for Ecosystem Services 21 6.1 PES Barriers 22
7. Barriers and Emerging Opportunities 25 7.1 Environmental 25 7.2 Social/Economic 25
8. Solutions: Technology Trends 29
9. Rethinking Landscape Management 31 9.1 Effective tools & strategies from the private sector 31 9.2 Participatory design techniques for tackling complex problems 32
10. Cases 35 10.1 Fogo Island, Newfoundland, Canada 35 10.2 Lake Naivasha, Kenya 36 10.3 Costa Rica 38 10.4 North West Ohio, USA 39 10.5 Indonesia 40
Appendices 41 Appendix I. Figures and Images 43 Appendix II. Literature 47 Appendix III. Websites and Cases 53


Project number 2645-07B 5
Executive Summary
This research was commissioned with the goal of further developing tools to engage business
stakeholders for active improvement of environmental systems’ health. Previous attempts at this have
been made in the past, yet little material success demonstrated in the uptake of tools/approaches for
improving the environmental aspects of business decision-making. The potential in such approaches is
nonetheless widely appreciated: already in his 1934 text Conservation Economics, Aldo Leopold argued
that “conservation will ultimately boil down to rewarding the private landowner who conserves the
public interest.”
Key obstacles in this area remain the quality of data and tools for multi-stakeholder collaboration and as
a result, of business decision-makers’ appreciation for the condition/behavior of environmental
systems. The continuing acceleration of technology is creating conditions for disruptive innovation, yet
momentum to develop these tools remains low, and many technology companies are struggling to
appreciate the implications of these shifts for their own business. By integrating perspectives across
science, development, entrepreneurship, and technology, researchers sought to provide a set of tools
and methods for businesspeople to make sense of such activities in their own business logic, to improve
understanding of the significance of next-generation technologies for users, as well as to guide
innovation in these.
The business case approach described herein was developed to better connect sustainability and core
business value propositions. The preliminary findings of this process are that:
Engaging business stakeholders using familiar (but modified) terminology and approaches to
innovation can improve participation and buy-in, growing the scale and impact of efforts.
The role of technology in further scaling-up restoration projects is significant, but more effort is
needed to refine the design and standardization/interoperability of key functions.
This report (and a second document clarifying the Landscape Canvas in more detail) are to be released
on an open, web-based innovation platform where further discussions can be held, and insight shared.


Project number 2645-07B 7
Introduction
The Wash Alliance International (WAI) actively seeks to learn from past experiences, drawing on these
to inform its approach to future programs, and to share insights with interested parties. Important
components for WAI in 2016 - within which this project is located - are: 1) to prepare a long-term
(2017+) program and secure funding thereto, and 2) to further strengthen the WAI coalition, including
partners on the ground. Meanwhile, existing targets have to be met on drinking water and sanitation
(business as usual).
This report is the product of an Innovation and Learning track in support of the above goals. Within this
track, a working group led by Aidenvironment/RAIN sought to further develop the ‘business case’
around WASH (water for drinking, sanitation, and hygiene) interventions, located on a given landscape.
Such approaches are situated in a broader context of governance systems connecting users of water
across catchment areas (most significantly in regard to food production and energy, as well as climate
resilience); given the considerable role of the private sector in this, there appears to be opportunity to
further improve cooperative models which make use of business thinking. It is hoped this will lead to: 1)
new investment propositions/ approaches to scale-up climate- and landscape-focused funding efforts,
and 2) a clearer understanding of the path forward for innovation in tools to aid implementation of
landscape restoration interventions, as well as more refined methods to cooperating with partners.
Developing the business case for Land and Water is a relatively unexplored topic. To ensure relevance, it
was decided to take a co-creation approach, with a two-day workshop comprised of an external expert
review day, then a WAI-internal discussion day. In preparation for the workshop the team created this
research paper based on desk research and best-practices from literature, then engaged with experts to
discuss findings and gain additional insights, before iteratively testing the approach outlined herein to
structure case analyses and simulations. After feedback was taken into account, a modified framework
was designed, and once again tested. Finally, the team created a white paper called ‘The Business Case
for Land and Water’ introducing and describing the so called Landscape Canvas, a conceptual framework
to be used for developing a business case for land and water related programs and projects.
Chapter 1 describes the definition and importance of the business case, chapter 2 and 3 elaborates on
landscape users and landscape management, chapter 4 and 5 dive into the value proposition the
landscape offers to its users. Chapter 6 touches the topic of revenue generation, which is still a
challenge. This links well to chapter 7 describing the challenges and opportunities. Chapter 8 and 9 are
about finding solutions that help us in defining a business case for rehabilitating land and water. The
paper concludes presenting 5 cases in chapter 10.

Publicatienummer 2645-07B 8
1. The Business Case
The manner in which a business case is put forward here is not simply about how to make money, but
rather how this can optimize how this is done, in respect to collective governance.
1.1 What is a business case?
At its most literal, a ‘business case’ is an argument which is intended to convince a decision-maker to
initiate a particular action on a project or task. If successful, this results in the investment of time,
money, and other resources with the end result of achieving a desired, pre-defined outcome. For
example, one business case (for a manufacturing business) might propose investing in machinery to
increase production of a particular in-demand product, with the goal of increasing sales.
Often, the logic used in such decision-making only considers how the immediate business can pursue its
own isolated gain, without taking into consideration how greater value might be created in cooperation
with other stakeholders (including other businesses), in an optimized way. If self-optimizing logic is
followed by every decision-maker, profits will erode as the environment experiences a progressive
decline in productivity. In order to ensure collective gain, cooperation across multiple - often
disconnected - groups is necessary. New mechanisms for incentivizing this behavior are needed.
It should be emphasized that this is not a discussion of dynamics between similar/competing businesses,
but rather of cooperation across a broader range of groups, which are dependent on each other’s
interaction with land and water. This includes groups who have direct control over the activities that
take place on a specific geographical plot (such as farmers and landowners), businesses which are
dependent upon resources coming from the plot (and thus rely on its continued productivity), as well as
individuals seeking to meet subsistence needs.
Figure 1: Business process innovation

Publicatienummer 2645-07B 9
1.2 Why is a business case needed?
As the World Economic Forum’s 2016 Global Risks Report again made clear, the most significant
concerns of our time are the degraded condition of natural environments, across both land and water.
These risks are not new, but appreciation of their scale – as well as potential to be addressed through
shifts in behavior – continues to increase. “There is growing realization that failure to act, quickly and
effectively [on these risks], could reverse many of the advances of the 20th century” (WEF 2016, p. 50).
Despite increasing clarity on potential opportunities from doing so, unfortunately, “not one global
initiative has succeeded in involving the business sector in the large-scale restoration of degraded lands
and biodiversity” (Ferwerda 2015, p. 37). By clarifying how various information gaps and inefficiencies in
the design, financing and implementation of these projects are increasingly able to be resolved, the
scale and ambition of restoration opportunities might be increased.
1.3 What is the scope of the business case?
In order for a given environmental rehabilitation effort to have maximum likelihood of success, a diverse
group of stakeholders must cooperate with one another on a continuous basis, dynamically negotiating
their activities in response to shifting conditions. If too many groups are involved or certain information
is not made available at the proper time, process inefficiencies will undermine both participation and
the likelihood of optimal outcomes.
For this reason, furtherance of a ‘business case’ for the explicit restoration of land or water is reliant on
a set of underlying technologies. With better tools for efficient communication, information
gathering/processing/visualization, financing, transparency, and more, the co-dependent behaviors of
multiple landscape actors can be monitored, and responses better coordinated. While convincing
business stakeholders is one critical aspect in the success of any effort, helping the providers of such
tools to recognize their influence directly increases the viability and scale of such business cases.
To structure the business case, we identified seven necessary elements - derived from the Business
Model Canvas approach, developed and popularized for use in business decision-making by Alexander
Osterwalder of Strategyzer AG,1 released under Creative Commons license. These are elaborated in
further detail in Section 9 and the additional, practitioner-focused whitepaper.
The natural partners and resources within the landscape;
The activities needed to restore, conserve or maintain functions;
The (human) partners needed to execute such activities;
The value proposition the landscape offers to landscape users;
The relationship landscape users have with the landscape;
The distribution of the proposition of the landscape to its users; and,
The direct users of the landscape.
Beyond providing a common understanding of the key activities and considerations, this approach helps
quantify landscape business cases in terms of revenue streams and cost structures, and thereby inform
1 Modifications were made to the Canvas to improve relevancy at the landscape scale, but initial explanation of the approach made use of the
materials provided at www.strategyzer.com.

Publicatienummer 2645-07B 10
an improved management plan. An expert workshop was held in April, 2016 to seek feedback on the
design and arrangement of these elements, and brainstorm on the practical utility of such approaches.
Making Nature’s Values Visible: TEEB
The most comprehensive effort to date focused on ‘making nature’s values visible’ is The Economics of Ecosystems
and Biodiversity (TEEB). As part of its effort to establish foundational knowledge on this topic, TEEB drew on the
input of thousands of experts and environmental scientists to create a database of monetary values which every
ecosystem type was found to provide. However, because of the diverse (and constantly changing) contexts in which
ecosystems exist around the world, the range of values for any given 1ha ecosystem ‘plot’ was extreme.2
The large range in values (due to context-specific drivers) was found to be shared across all ecosystem types - a
finding which influenced the further development of the TEEB effort. The original TEEB Final Report was released in
2010, but a new ‘work stream’ titled TEEB for Food and Agriculture (TEEBAgFood) emerged, focused on building
understanding of how specific agricultural and food production activities - on specific landscapes - “both depend
upon and impact natural and social capital (in both a positive and negative way), and how they can contribute to
[opportunities for improvement]” (TEEB 2015, p. v).
A second work stream - first named the TEEB Coalition for Business and Enterprise - emerged from the additional
finding that in fact, every business consulted during the TEEB process was both impacted and dependent on natural
systems, and faced context-specific risks and opportunities as a result. The result of this project has been a steadily
increasing interest in moving beyond valuation, toward how to articulate a convincing case for business to actually
pursue these opportunities. In an effort to engage thought leaders on this topic more effectively, the TEEB Coalition
rebranded as the Natural Capital Coalition, and in 2016 is set to publish a Protocol and Framework to guide business
decision-makers. Unfortunately, the use of this report (and others like it) still requires a decision to be made to
engage in opportunities for restoration. Because this decision is at least informed by the availability of information,
incentives, and the ease of collaborating with others, it can be influenced through an improved business case.
2 For example, ‘inland wetlands’ were estimated to create economic benefits ranging from 1000 to 45,000, per hectare.)

Project number 2645-07B 11
2. Understanding usage: Water-Food-Energy Nexus
The Water-Food-Energy discourse is a well-accepted approach for identifying key interactions between
natural and human systems, within the landscape. For a business case perspective, the landscape can be
viewed as a type of factory/facility producing different goods and services (value propositions) for users.
Because of “complex and dynamic interrelationships between water, energy, and food,” any change in
one of these variables should be considered for its materiality to the others. For example, ~80% of
freshwater use is attributed to agriculture, while agriculturally-driven deforestation is also increasingly
implicated in the manifestation of drought and changing rainfall patterns. Any group interested in the
use of water for sanitation and health – a relatively small use type – would do well to consider the
activities of farmers in the area as a point of action.
The need for such systemic perspectives will only increase in the future, as competition for resources is
projected to grow significantly (Fig. 1). The WFE Nexus3 helps planners to “anticipate potential trade-offs
and synergies, [from which] we can then design, appraise, and prioritize response options that are viable
across different sectors” (FAO, 2014a, p. 4). The importance of the Nexus concept can be seen in its
recognition by each individual top-level United Nations group, dedicated to the sub-components: the
UN Inter-agency mechanism on water; UN Food and Agriculture Organization (FAO), as well as UN
Sustainable Energy for All (SE4All) initiative,4 International Renewable Energy Agency (IRENA), and many
sub-groups. In particular, the Nexus framework tends to emphasize the importance of food production
as the most important factor to consider regarding opportunities for improvement of water and land.
3 In some publications, the concept is put forward as a water-energy nexus, while others have elected to include a 4th metric of ‘climate’ or
‘ecosystem.’ A majority of literature favors WFE. 4 UN SG, 2014; FAO 2014a and 2014b, respectively.
Figure 2: Water-Food-Energy Nexus


Project number 2645-07B 13
3. Managing landscapes: Integrated Perspectives
In recent years the use of ‘spatially explicit’ approaches to inform the design and implementation of
rehabilitation efforts has become increasingly popular, due to the power of such visualizations in
highlighting connections between multiple groups, and enabling clear communication/planning. The
World Economic Forum recently released a publication endorsing the use of these approaches, titled
Blueprint for a Greener Footprint, which presented the following infographic (Fig. 2) regarding
‘minimum’ information and stakeholder inputs which should be included in such efforts, alongside three
guiding questions (p. xx):
What resources and functions are critical to people and to the long-term health of lands, waters, and
climate?
How might cumulative changes affect these in the future?
What opportunities are there to address trade-offs and improve economic, social, and environmental
outcomes?
Figure 3: Recommended Minimum inputs/outputs from landscape-scale planning


Project number 2645-07B 15
4. The value proposition: Ecosystem Services
If order for a diverse group of stakeholders to engage with one another across any geography, and for
lessons-learned from any one project to be easily communicated with others, there needs to be a
shared, neutral, and easily understandable language. Ecosystem services has become this language.
Over the past several decades, academic discourse
on the topic has seen numerous definitions of
ecosystem services emerge, creating potential for
miscommunication. In an effort to address this, the
European Environment Agency funds an ongoing
project titled the Common International
Classification for Ecosystem Services (CICES). While
CICES itself is a continuously evolving software
visualization project (now in V4.3), its top-level
categorization provides an authoritative basis with
which to inform this discussion of business cases.
Provisioning services: all nutritional, material, and energetic outputs from living systems.
Regulation & maintenance services: covers all the ways in which living organisms can mediate or
moderate the ambient environment that affects human performance.
Cultural services: all the non-material (and largely non-consumptive), outputs of ecosystems that
affect physical and mental states of people.
Importantly, these three categories are a modification of many earlier definitions - excluding a fourth
category of “supporting services.” This change is significant when considered from the perspective of a
business case: CICES limits itself to the ‘final services’ on which businesses are dependent (Fig. 4), but
emphasizes that these services are produced by a larger ecological system, which is itself impacted by
business’ activities. For business stakeholders, only the activities which increase availability of final
services are obvious, yet other actions (for which there is no existing business benefit or risk-reduction)
will directly affect the level and quality of a final service received by the collective.
Figure 4: Ecosystem Services Publications
Figure 5: Environment & The Social and Economic System


Project number 2645-07B 17
5. Improving the value proposition: 3 Categories
The interrelated concepts of regime shift and resilience are increasingly used by scientists to describe
the non-linear behavior of social-ecological systems, over time, and with only small modifications can be
used to inform design of landscape restoration and financing strategies. This is relevant to the design of
a landscape value proposition, as any decline in regime health is directly associated with a
corresponding decline in the aggregate level of ecosystem services produced by that landscape. Because
of this, “understanding of regime shifts is important [for landscape governance purposes]…as they often
have substantial impacts on human economies and societies, tend to occur unexpectedly, and are
difficult, expensive, and sometimes impossible to reverse” (SEI 2014, p.1).
Regime shifts are defined as “large, persistent, often abrupt change in the structure and function of a
system,” often represented in literature with the use of ‘cup and ball’ diagrams (Fig. 5). Uncontrolled
degradation results in the crossing of a ‘tipping point’ between one stable state and another, with lower
productivity. While this description and illustration help to explain the concept for research purposes
however, they in fact describe precisely the outcome which it is hoped can be avoided.
Because of projects like the Regime Shifts Database, it is established that most drivers of regime shifts
tend to be anthropogenic, and are often attributable to food production and climate change (Rocha et
al. 2015). While the latter implies a need for top-down coordination, a key implication of regime theory
is that there are actually “opportunities for reducing the risk of many types of regime shifts by
addressing local or regional drivers, even in the absence of rapid reduction of global drivers” (ibid, p.1).
In fact, it is increasingly clear that the rehabilitation of degraded ecosystems is a key opportunity for
climate mitigation and adaptation, and that landscape-scale regime recovery strategies are likely to
become important for addressing climate-related risks.
It should be reinforced that regime concepts alone are insufficient to inform a particular landscape
recovery plan – these must be validated through rigorous scientific due diligence on relevant natural
and social systems, due to the dynamic and multi-causal nature of such systems (Duguma et al. 2015).
Based on accumulated understanding of regime shifts, the following three general restoration scenarios
can be proposed, which might be encountered on any given landscape. Each scenario implies a different
level of risk, intervention intensity, duration, and capital requirement, and thus different business cases
and financing strategy.
Figure 6: Example cup-and-ball diagram of regime shift

Publicatienummer 2645-07B 18
5.1 Pre-collapse: stabilize, intensify regime
This includes most conventional conservation and resource management efforts to reduce habitat and
biodiversity loss, then rehabilitate degraded ecosystems. Such efforts are necessary to both 1) reduce
likelihood of further collapse, and 2) increase productivity.
In order to maintain the resilience and productivity of a particular regime over time, research
increasingly supports the notion of a necessary, second type of intervention: dynamic
exercise/disturbance (B). Natural disturbances include fire, flood pulsing, windstorms, insect outbreaks,
and trampling, and can be an integral part of maintaining ecosystem stability and productivity.
Existing groups who are degrading the landscape must be convinced to alter their activities, or decouple
from the landscape altogether. Such interventions can range from retraining programmes and the
development of new skillsets, to incentive-based approaches or blanket moratoriums subject to
stringent enforcement.5 When compared to the level of risk and investment necessary to engineer the
recovery of a collapsed regime (scenarios 2 and 3), a relatively small group of stakeholders and amount
of resources is necessary for these interventions. While the perceived urgency of such interventions may
be low, they are in fact the best use of resources, when possible. Recovery in such systems will often
occur quickly, and the increased economic benefits resulting from improvements in productivity can
quickly offset any initial investment.
5 Significant regime recoveries as a result of blanket bans on activity have been documented in many fisheries, and China’s G2G reforestation efforts.
Figure 7: Pre-collapse regime

Publicatienummer 2645-07B 19
5.2 Post-Collapse: Reversible regime shift
In many human-managed landscapes, a regime shift has already occurred and exhibits the tendency to
remain in this low-productivity state6 unless actively addressed. In 2004, the Society for Ecological
Restoration and IUCN Commission on Ecosystem Management released a joint document defining the
‘principles for ecological restoration.’ Though this document predated the popularization of ‘regime
shift’ terminology, the concept is clearly described therein with the statement that “a degraded
ecosystem can be considered to have been restored when it regains sufficient biotic and abiotic
resources to sustain its structure, ecological processes and functions with minimal external assistance or
subsidy…such a state is often difficult to achieve [but] significant improvements...can be realized even in
the earliest stages of restoration.” The document emphasizes that once a particular restorative
threshold has been crossed, these systems will again “demonstrate resilience to normal ranges of
environmental stress and disturbance” (2004, p. 4).
In order to ensure a likelihood of success, restoration may involve considerable up-front investment of
(financial, labor, and other) resources. If this accounted for during project design, a portion of the
elevated cash flows from regime recovery can be used to repay original financing, and the potentially
significant benefits resulting from significant recovery can even offset a (limited) risk premium.
6 A number of processes and feedbacks responsible for this are elaborated in the Barriers section.
Figure 8: Post-collapse Degradation Extent and Restoration Potential

Publicatienummer 2645-07B 20
5.3 Post-Collapse: Irreversible regime shift
The SER/IUCN Restoration Principles emphasize that whenever possible, “restoration [should attempt]
to return an ecosystem to its historic trajectory. Historic conditions are…the ideal starting point for
restoration design and planning” (SER/IUCN 2004, p. 8). Unfortunately, in some cases the drivers of a
regime shift cannot feasibly be reversed (eg. keystone species extinction, invasive species, monsoon-
scale meteorological shifts, sea level rise, pollution), resulting in situations where a novel landscape
must either be developed, or expectations of local ecosystem services permanently revised downward.
Interventions to establish entirely new landscape types or ecological communities are generally the
most expensive and high-risk: examples include flooding/drainage of an area, novel combinations of
invasive/non-invasive species, or even synthetic biology. This is a controversial and challenging subject,
but is important to consider due to a combination of rapidly changing climatic conditions and limited
budgets.
The (unfortunate) reality is that conservation practitioners already report having to face difficult
decisions about whether to continue “costly yet futile” efforts to save terminally endangered species,
given the potential for “injurious neglect” of other, more ecologically important or climate-resilient
efforts (Gerber 2016). Previous generations of conservationists would likely have considered such
decisions taboo, but times have changed: a 2014 study of expert conservation practitioners found
“widespread agreement with a set of previously contentious approaches and actions, including the need
for frameworks for prioritization and decision-making that take expected losses and emerging novel
ecosystems into consideration (Hagerman & Satterfield 2014, p. 1).
New types of human activity may also need to be facilitated, which might not necessarily have
precedent in that community. In order to increase their likelihood of success, such interventions require
detailed planning, large up-front investments, and are usually of elevated risk compared to 1). In such
cases, particular diligence is needed to inform whether resources be better allocated elsewhere.
Figure 9: Post-Collapse, Landscape Shift

Project number 2645-07B 21
6. Revenue Generation: Payment for Ecosystem Services
Historically, many land and water management tools have used negative incentives to regulate the
behavior of “players” in a particular landscape. Over the past several decades, new approaches have
emerged which are more focused on the use of positive incentives, and these became combined with
the ongoing discussion of ecosystem services. Though some pilot projects had mixed results or
foundered due to context-specific barriers, best practices are beginning to emerge, and new
technologies increase the potential for innovation.
A number of large-scale, long-running PES projects demonstrate the genuine potential for multi-
stakeholder ‘win-wins’ to be realized through appropriately designed and managed projects. As a result
of widespread engagement and experimentation in the topic however, there is an almost overwhelming
diversity in PES language and design. A revised definition of the approach acknowledges that the
concept has become an ‘umbrella term,’ and reinforces the need for certain key conditions to be
observed in order to improve project success rates (and bankability). In general, PES approaches are
schemes which “aim to transfer positive incentives to environmental service providers that are
conditional on the provision of the service, where successful implementation is based on a
consideration of 1) additionality and 2) varying institutional contexts” (Wunder 2014, p. 1).
In large part due to the importance of ensuring conditionality and additionality, developing and
implementing a given PES proposal at a high level of quality remains time- and capital-intensive, and
there continue to be challenges in maintaining cost-effectiveness in project design, monitoring,
landowner participation/negotiation, and more. At the same time, the limited flexibility of potential
service “buyers” and financiers, as well as the failure to take advantage of revenue stacking has reduced
the potential ambition of recovery projects. Unfortunately, this combination of high cost and low
financial flows in PES schemes continues to inhibit their potential to improving the business case. As
described below, rapid progress is being made.
Figure 10: Locating PES as an incentive-based mechanism within a broader suite of environmental policy instruments.

Publicatienummer 2645-07B 22
6.1 PES Barriers
6.1.1 Revenue Stacking
Though achievements in cost efficiencies and risk reduction will continue to improve through advances
in best practices and technologies, the design and implementation of PES schemes remains time- and
money-intensive. Also defined as bundling, coupling, and integrating, the approach of stacking multiple,
individually insignificant PES revenue streams (from multiple beneficiaries, for multiple services) is likely
to contribute significantly to increasing the scale and scope of restoration efforts.
This approach not only offsets high costs, but creates embedded incentives for more holistically
restorative activity by rewarding maximally restorative behavior in participants. The subject of PES
revenue stacking can quickly become technical, but the implications are highly significant on an
everyday basis. For example, due to a lack of rigorous data about the role of seagrass ecosystems in
carbon sequestration, “blue carbon” mitigation projects are as-yet unable to be funded via higher-value,
verified carbon offset markets. A study of the most viable near-term options for funding seagrass
restoration by Hejnowicz et al. (2015) concluded that stacking of multiple payments for the benefits
created by such ecosystems (fish nursery, coastal protection, water filtration, and voluntary carbon
offsets) was the most promising for creation of a stronger financial case.
Previous efforts to implement PES stacking have encountered complications, sometimes even resulting
in a net-loss of total services (Cooley & Olander, 2011). However, several systematic reviews of stacking
have found that “the primary tradeoff is between the aggregate administrative and coordination burden
and overall cost-effectiveness” (Gillenwater, p. 2). While PES revenue stacking concepts remain in large
part theoretical, as technology continues to improve (including the accurate estimation of additionality)
there is a clear possibility to resolve many obstacles, in the near term.
6.1.2 Additionality
Any given change in landscape condition only merits compensation if assurance can be provided to a
reasonable level that it would not typically have occurred without the existence of a scheme. Two
general causes of non-additionality have been outlined as “Pay-for-Nothing, in which the subsidy pays
for a practice that would be done without [additional] incentives, and behavioral substitution, in which
the subsidy generates substitution from an un-incentivized [but equally beneficial] practice to the
incentivized one” (Howard 2016, p. 1). There is some evidence that in certain PES projects, certain
additionality requirements can become problematic: a review of ecosystem services relating to forestry
found that stacked water services and non-timber forest products “might work best if there is no
additionality requirement,” because of a current dearth of cost-effective stacking methods (Savilaakso
et al. 2015, p. ix).
6.1.3 Bid optimization and negotiation streamlining
If we assume that a particular regime recovery plan has been assured to a high likelihood of success, and
that (conditional) agreement for compensation has been secured from eventual beneficiaries, the
further development of a restoration-focused PES scheme is contingent on the successful negotiation of
(financially viable) agreement with landholders. Knowledge of the lower and upper thresholds which a
given participant can be offered is necessary for an efficient negotiation.

Publicatienummer 2645-07B 23
The lower-bound is the willingness to accept (WTA). This can be met with a mix of financial and non-
financial (eg. offers of tenure documentation) incentives, depending on the context. Because of the
participation of multiple landholders in any PES negotiation, the upper-bound should be capped by the
opportunity cost faced by the landowner: if overcompensation occurs, this will reduce the maximum
impact of any investment in restorative behavior, and reduce scheme effectiveness/increase risk.
Because of limited availability of data such as property value appraisals (as well as privacy constraints),
opportunity costs must often be approximated. As with PES stacking, there remain obstacles in the ease
(and accuracy) of these techniques. One promising new method of collecting such information is
through a competitive landowner bidding process (known as a ‘reverse auction’ in PES literature, and as
a ‘procurement auction’ in economics literature). Potential participants can directly provide their WTA
for a given intervention proposal (See Ohio and Indonesia cases for more detail).
Figure 2: Variables affecting opportunity costs


Project number 2645-07B 25
7. Barriers and Emerging Opportunities
The challenge of rehabilitating a degraded social-ecological system at the scale of an entire landscape is
considerable. A general understanding of barriers faced by any landscape rehabilitation project – and
how these are increasingly being addressed through technological and methodological process – helps
to emphasize the “rising tide” of innovation.
7.1 Environmental
Ecosystem complexity and multi causality
Especially in highly degraded, managed landscapes, it can be challenging to establish causality and
accurately identify the mutually-reinforcing drivers of ecosystem decline. Such efforts are aided
considerably through improved information gathering and processing, while progress is being made in
the science of ‘forensic ecology’ and others areas to accurately identify the reason for suppression.
Trophic decline
If the dominant species at the top of a food web is harvested to the point of collapse, harvesting may
then shift to lower trophic levels, suppressing recovery. As demonstrated in the Newfoundland case, a
well-designed PES scheme can not only avert this pressure, but can also significantly accelerate recovery
by instead engaging harvesters in habitat rehabilitation.
Loss of genetic resources
Even in cases where extinction has not occurred, species’ genetic traits may have been subject to
human-driven “drift” as a result of persistent selective pressure (eg. harvesting of larger specimens).
Unless pre-emptively addressed through conservation, such changes place a hard upward limit on
restoration potential. They can be countered with active genetic resource management and engineering
through the use of CRISPR and population-scale interventions.
Uncertainties and assumptions in climate forecasts
The range of uncertainty in climate change impacts and emissions rates influences the consideration of
whether a particular species (or entire landscape type) merits the investment of resources in order to
recover. As understanding of these macro-scale systems continues to progress alongside advances in the
capacity of landscape restoration efforts, risk of improperly allocated resources will decrease.
7.2 Social/Economic
Tenure Insecurity
There are multiple linkages between effective restoration and tenure security; both informal tenure and
migratory land users see little reason in delayed-payoff activity, unless tenure is improved. If not
adequately addressed at the outset, a PES scheme as a may become unviable. This is important to
address, as disputes around the rightful recipient of a given payment are recognized as a primary cause
of PES scheme failure.
Alternatively, a well-designed PES scheme is sometimes still able to engage unsecure landholders in
beneficial activity (FAO 2013, p. 9-10) while also ensuring conditionality. Other PES schemes have even
been able to turn the engagement into an action-point for establishing tenure: in the case of Costa Rica
“expected payments [are] being used to obtain informal credit to pay for tenure documentation (Porras
et al. 2013, p. 63).

Low participant motivation/ambition
Even if there is a likelihood of significant, sustained rehabilitation in the near term, if a regime has been
heavily degraded over an extended, multi-generational period, a phenomenon of known as ‘shifting
baseline syndrome’ can become a key barrier in the motivation of stakeholder groups. This
phenomenon was originally described by fisheries scientist Dr. Daniel Pauly, and is now well-accepted in
conservation literature. As explained in the original (1995) article:
“this syndrome has arisen because each generation…accepts as a baseline the stock
size and species composition that occurred at the beginning of their careers, and uses
this to evaluate changes. When the next generation starts its career, the stocks have
further declined, but it is the stocks at that time that serve as a new baseline. The
result obviously is…a gradual accommodation of the disappearance of resource
species, and inappropriate reference points for evaluating economic losses resulting
from [overharvesting] or for identifying targets for rehabilitation measures” (p. 430).
This effect has several implications for landscape rehabilitation, which can create barriers to recovery if
unanticipated, or alternatively, increase the likelihood of success. Even if a well-designed restoration
plan has been developed, even those familiar with the landscape may be skeptical that an intervention
justifies a large up-front investment. Once recovery has begun to take place however, these
stakeholders may exhibit a tendency to celebrate relatively minor recoveries, and may prematurely
increase pressure to begin harvesting. Though such behavior may decline as public appreciation for
restoration increases, initial motivation barriers can potentially be anticipated with new communication
strategies that emphasize the benefits of regime recovery. Furthermore, the premature celebration of
regime recovery can be anticipated, then used as a point of to further increase engagement and the
ambition of intervention, while averting a potential point of conflict with over-eager harvesters.
Auction friction and transaction costs
If landholders face money or time barriers to participating in restoration schemes such as PES, such
factors can compromise the entire project, by their failure to include of enough high-importance
landholders or other economic actors. If these perspective are not addressed through “design thinking”
approaches, frictions can grow to such an extent that the entire restoration scheme becomes unviable
due to low participation.
Capacity and monitoring
Implementation of PES schemes can be internalized by landholders, or delegated to new groups. Though
certain activities such as tree planting appear relatively straightforward, failure to ensure quality control
can undermine likelihood of success. In addition to improved training capacity and technologically-
assisted monitoring, adoption of digital solutions can enable dynamic responses to address deficiencies.
Duration of restoration/payback
The long-term nature of restoration is dependent on occasionally fragile stakeholder cooperation, as
well as the resources which are invested to encourage recovery. Though the returns of a given project
occur over an extended period of time, the point at which a tangible increase in ecosystem services will
be recognized by paying beneficiaries is important for the viability of any business case.
Certification and labelling Few certification schemes assess sustainability in a landscape context. Both the Lake Naivasha water
quality PES scheme and Fogo Island WWF cases reinforce that 3rd party certification can play an
important a role in the decision-making process of potential PES funders, but these are contingent on
effective monitoring. Care must also be taken that the harvesting behavior of local stakeholders is not
simply pushed into the black market, because of higher-cost certified materials.

Project number 2645-07B 27
8. Solutions: Technology Trends
The viability of landscape-scale restoration efforts will continue to improve on an ongoing basis, as a
result of constantly progressing technological innovation. As use of these advances accelerates,
developers will grow increasingly aware of such use-cases, and as a result of further investment into
innovation will themselves contribute to improving the business case for restoration.
By adopting simplifying heuristics for how such trends are progressing, new use-cases can be imagined
which themselves might create persuasive arguments to develop a particular tool or application. Such
strategies help to reduce the tendency to consider the current levels of development in a given
technology – an important consideration, given the accelerating pace of development.
Digital Earth
Technology and environmental thinking have long been connected – albeit often below the surface, or
at the perceived fringe of popular culture. In fact, these linkages underlie many advances in computing.
Perhaps the best example of this is the well-documented influence of Steward Brand’s 1968 text The
Whole Earth Catalog, on Silicon Valley pioneers.
Then in 1998, U.S. Vice-President Al Gore provided a particularly detailed description of a “Digital Earth”
platform explicitly designed to improve the quality of human-environmental interactions. This vision is
becoming increasingly viable because of continuing improvements in both the spatial and temporal
resolution of sensing technologies and visualization, as well as better understanding of species’
presence, distribution, and health – across individual to planetary scales, in real-time.
The concept has been further developed and received the support of many leading environmental
scientists and conservationists, using the terms Big Data Environmentalism, Geodesign, Internet of Earth
Things, WildTech, Precision Conservation, and many others. The opportunities are significant: simply by
repurposing infrared camera drones and predictive behavior algorithms (both originally developed for
military applications), a small group named Air Shepherd has averted every single Rhinoceros and
Elephant poaching event in its areas of operation for the past 3 years, by complementing the capacity of
existing park rangers. Equally impressive, the Eyes on the Sea Project is creating satellite and artificial
intelligence tools for automated monitoring and reporting of illegal fishing activity to authorities.
Healthcare
Though differences exist, the (human) healthcare sector is directly engaged in dynamic rehabilitation of
living systems, via both anticipatory prevention of complications, and treatment of ongoing ailments.
This process is separated into stages:
1) information gathering,
2) information integration & interpretation,
3) treatment. If complications occur, repeat.
In (environmental) healthcare, each stage is
rapidly improving: Digital Earth technology
to a large extent addresses the first, and
other technologies for multi-stakeholder
collaboration the second, as well as data
visualization/new couplings of human-
machine “superintelligence.” Precision
agriculture and conservation technologies
are reducing the collateral costs of any
course of “treatment,” much in the same
way as precision medicine.
Figure 32: Healthcare Diagnostic Process


Project number 2645-07B 29
9. Solutions: Rethinking Landscape Management
Effective tools and strategies from the private sector which were shown to be supportive in modeling
the business case for Land and Water were Business Model Generation tools, and Shared Value Creation
strategy. These are both used through participatory design techniques like Human Centered Design
method, and Open Innovation Labs (e.g. social labs).
9.1 Effective tools & strategies from the private sector
One of the barriers identified in the landscape multi stakeholder process is the lack of involvement of
the private sector and the lack of having a clear business model for landscape restoration. Some of the
reasons are the complexity of landscape management, the complicated communication around that
matter and the lack of looking into the business value for companies to restore landscapes.
To increase the engagement of private sector, it requires to better understand the logic and language of
these stakeholders. For this purpose, the authors reviewed broadly accepted tools and approaches used
by the private sector, settling on those for Business Model generation and Shared Value Creation.
The Business Model Canvas is the most well-known and widely used toolset to create and develop
businesses. Its goal is to help entrepreneurs ‘describe, design, challenge, invent, and pivot’ their
business model. Supporting materials and examples for new users are widely available online, and the
format of the Business Model Canvas has been used by many to create their own slightly adapted
versions. To name a few: Social Business Model Canvas, Inclusive Business Model Canvas, Lean Canvas,
Social Lean Canvas, Happy Startup Canvas, Culture Canvas… and last but not least, Shared Value Canvas.
A short video guide to the Business Model Canvas: https://www.youtube.com/watch?v=2FumwkBMhLo
Figure 43:

Shared Value Creation
Shared value is a management strategy focused on companies creating measurable business value by
identifying and addressing social problems that intersect with their business. The shared value
framework creates new opportunities for companies, civil society organizations, and governments to
leverage the power of market-based competition in addressing social problems.
The concept was defined in the Harvard Business Review article “Creating Shared Value”
(January/February 2011), by Professor Michael E. Porter and Mark R. Kramer. The authors identified
three ways in which shared value can be created:
Reconceiving products and markets – Defining markets in terms of unmet needs or social ills and
developing profitable products or services that remedy these conditions.
Redefining productivity in the value chain – Increasing the productivity of the company or its suppliers
by addressing the social and environmental constraints in its value chain.
Local cluster development – Strengthening the competitive context in key regions where the company
operates in ways that contribute to the company’s growth and productivity.
The Shared Value framework defines a new role for business in society that goes beyond traditional
models of corporate social responsibility. Rather than focus on mitigating harm in the company’s
existing operations, shared value strategies engage the scale and innovation of companies to advance
social progress. At the same time, shared value offers new ways for other societal actors to engage with
corporations in delivering social impact:
NGOs can evolve their strategic priorities in order to more effectively partner with companies on
shared value strategies
Philanthropic and government bodies can find new ways to incentivize private sector investment in
solving pressing social issues
Investors can gain insight into companies’ future growth and profit potential by understanding how
shared value strategies address social issues that directly impact performance
Individual practitioners, academics, and students around the world can deepen the understanding and
application of shared value within their companies, social enterprises, and academic institutions
While shared value is still early in the adoption cycle, the approach has been embraced by many of the
world’s most respected companies, to address social problems at scale as a core aspect of corporate
strategies.
Source: https://www.sharedvalue.org/about-shared-value
9.2 Effective participatory design techniques in tackling complex problems
Degraded landscapes are complex to restore. In many cases, the interventions are designed by a
relatively small group of experts, with low participation of the actual users of the landscape like
communities, farmers and small businesses. A landscape problem is not only an environmental problem.
It is a social problem as well.
Similar problems like cleaning the ocean are more and more approached via a more experimental and
highly participatory approach. There are two effective approaches which might be very effective in
designing desirable, feasible and viable intervention for restoring shifted regimes: Human-Centered
Design and Social Innovation Labs.
Human-Centered Design thinking
Human-Centered Design (HCD) is a process and a set of techniques used to create new solutions for the
world. Solutions include products, services, environments, organizations, and modes of interaction.

The reason this process is called “human-centered” is because it starts with the people who are being
designed for. The HCD process begins by examining the needs, dreams, and behaviors of the people the
designers seek to affect with solutions. We seek to listen to and understand what they want. We call this
the Desirability lens. We view the world through this lens throughout the design process. Once we have
identified a range of what is Desirable, we begin to view our solutions through the lenses of Feasibility
and Viability. We carefully bring in these lenses during the later phases of the process.
The process of Human-Centered Design starts with a specific Design Challenge and goes through three
main phases: Hear, Create, and Deliver. The process will move your team from concrete observations
about people, to abstract thinking as you uncover insights and themes, then back to the concrete with
tangible solutions.
HEAR: During the Hear phase, your Design Team will collect stories and inspiration from people. You
will prepare for and conduct field research;
CREATE: In the Create phase, you will work together in a workshop format to translate what you
heard from people into frameworks, opportunities, solutions, and prototypes. During this phase you
will move together from concrete to more abstract thinking in identifying themes and opportunities,
and then back to the concrete with solutions and prototypes;
DELIVER: The Deliver phase will begin to realize your solutions through rapid revenue and cost
modeling, capability assessment, and implementation planning. This will help you launch new
solutions into the world.
From the IDEO HCD Toolkit:
Social labs
Over the last decade, a growing movement of practitioners has adopted a more experimental approach
to addressing complex challenges. They don't ask donors to invest in a plan. They ask for investments in
a diverse team, which then manages an idea-generation process. It's talent and engagement that
matters, as well as a process of iteration, trial and error - not a fixed plan which has little chance of
success. Talented teams, properly managed, will inevitably produce outputs and outcomes that are
valuable, for example new services or products, or new skills and capacities, and intellectual property.
Just as there are scientific laboratories to solve scientific problems, and technical labs to solve technical
problems, social labs help to solve social, political, and environmental problems. If the following three
characteristics are codified into the approach, the chance of success is likely to improve considerably.
At the heart of this movement is a phenomenon known as a social laboratory. Social labs focus on
innovating practical actions to address complex social challenges. They have three characteristics:
Involve diverse stakeholders, including the people impacted. By contrast, a planning approach brings
together small groups of experts to develop top-down, command-and-control solution.
Experimental, relying on trial and error to create and manage a portfolio that guides investment
decisions. A planning approach can become vulnerable, through all eggs in one basket.
A systems-based approach that identifies and addresses challenges at the root-cause level; by la
planning approach may address symptoms, not the cause of a social problem.


Project number 2645-07B 33
10. Cases
This chapter describes five interesting cases closely related to the business case of the rehabilitation of
land and water.
10.1 Fogo Island, Newfoundland, Canada
Fishery Improvement Project: Regime Collapse and Recovery
The plight of Newfoundland fisheries has often been recognized (including in the Millennium Ecosystem
Assessment) as an example of how after a regime collapse, “depleted stocks may take years to recover,
or not recover at all, even if harvesting is reduced or eliminated entirely” (2005, p. 3).
However, due to recent developments
some decisions made in the recovery of
this regime can be questioned, and
potentially holds key lessons for other
restoration projects.
After four centuries of fishing, due to a
combination of industrial technology
and mismanagement, cod biomass on
the Canadian east coast underwent a
nearly complete collapse in 1992, with a
moratorium instituted on the basis of
scientific urgency.
The moratorium eliminated the primary economic/ cultural base of the region overnight, resulting in
political, social, and economic disruption. The ban was originally expected to be in place only for a few
years, but due to the lack of recovery has continued for decades. In 2015, scientists reported a surge in
cod biomass, but the ban remains in place for the foreseeable future (source). Part of the reason for the
delay is attributed to shifting water temperature, but local causes of habitat loss appear to have also
contributed to suppression: near-coast trawling during the boom destroyed undersea habitat, and
industrial-scale harvesting of Capelin7 into fertilizer and animal feed (prior to producer marketing and
quick-freeze technology for export of high-value Roe to global markets).
After several other demonstration Fisheries Improvement Projects exhibited restorative successes in
Newfoundland, in 2015 a Capelin and Cod habitat restoration project was initiated on the coast of Fogo
Island by WWF Canada, in collaboration with local fishers. Experimental harvesting of local cod shows
Capelin feeding, and the quality of both the cod and capelin from the area is receiving culinary praise
(source). This project suggests that greater investment into rehabilitation could very likely have
accelerated regime recovery, and will aid productivity/resilience of the regime in the future (source).
The broader case highlights the dangers of scientifically un-informed harvesting, the differing ways in
which technology can play a role in social-ecological sustainability, and the potential risk of terminal
“collapse” diagnoses.
7 ‘Forage fish’ such as Capelin and shrimp are the trophic link between zooplankton and Cod.
Figure 54: Newfoundland codfish populations

10.2 Lake Naivasha, Kenya
Watershed Restoration: Multistakeholder Regime Recovery
Over the past century L. Naivasha has been considerably degraded with the introduction of over two
dozen species, some of which still “dominate each main level of the food web and produce impacts that
are rarely restricted to a single ecosystem service” (Gherardi et al. 2010, p. 2586). In the 1990s, invasive
water hyacinth and water fern caused major fish kills and ecological collapse; these were eventually
repressed through the introduction of natural (insect) predators, and a degraded level of social-
ecological stability emerged. After further compromises to water quality through agricultural and urban
development were even exacerbated by a major drought however, significant wetland losses resulted in
extreme sedimentation and reduction of water quality/volumes, elevating risk of complete collapse
through hyper-eutrophication.
Two pilot projects in the Lake Naivasha landscape (1. Marula, 2. Malewa) demonstrate the potential
opportunity for significant improvements to be realized, given higher levels of coordination and
investment, as well as inclusion of a wider range of stakeholders.
Marula Estates (wetland)
In 2009, a large agricultural landowner of the former northern wetland invested ~€180,000 into
hydrological rehabilitation, with the goal being to reduce downstream sedimentation in L. Naivasha. On
implementing the project, the Estate recognized a notable improvement in wetland function, as well as
biodiversity and landscape productivity, and is seeking external financing for a larger, 2nd phase of
restoration (presentation). Because the landowner was agriculturally-focused, they were unsure of any
novel business case for this investment.
A hydrological study found that while the 2nd Phase could be expected to reduce sedimentation by an
estimated 7%, further improvements would require upstream actions in the catchment. If other revenue
opportunities were developed the project might be internally financeable, but coordination with
upstream landowners would be needed in order to realize goals of considerably reducing sedimentation
and improving water quality.
Figure 65: Marula wetland restoration proposal

Malewa smallholders (riparian restoration)
Independent of the Marula Estate project, a pilot-scale water quality PES scheme began in an upstream
sub-catchment of the Malewa river in 2008, connecting 575 smallholders (2-10 acres) with receiving
$17/year annual payments (totaling $10,000 USD) for water quality improvement through improving the
riparian quality of their land, from a group of L. Naivasha flower businesses. The goal of the scheme is to
“improve water quality [and] secure livelihoods and habitats for biodiversity and sustainable
development” (Nyongesa & Muigai 2012, p.1).
The Malewa project received domestic and international recognition for its design and implementation.
However, despite the pilot sub-catchments8 having been selected on a basis of maximum impact, the
low levels of smallholder participation – in a context of large-scale erosion – created insignificant
benefits for downstream stakeholders (Bertram 2011, p. 29). To salvage participation, a certification was
created for downstream participants, and interest is growing. Annual compensation continues to be
paid to smallholders, and additional plot-level benefits are being realized from reforestation; interest in
further upstream participation is strong (documented in a 2012 follow-up).
Other riparian restoration projects such as Green for Gold in China demonstrate that regime recovery is
most likely to be successful when executed at a full catchment scale. Both the Marula and Malewa
projects have demonstrated initial viability. How can they best be scaled-up? How should the
stakeholders be connected?
8 Pilot projects consist of 1. and 5. in the above map.
Figure 76: Malewa Case Study

10.3 Costa Rica
Reforestation: PES design flexibility; Costs vs. Benefits
Started in 1997 as a trial demonstration of PES alongside a broader ‘policy mix’ to encourage
reforestation, this has become one of just a few multi-decadal, landscape-scale initiatives which have
been closely studied. For the purposes of this white paper, the case elaborates on the significance of
opportunity costs, as well as PES design considerations which influence monitoring and transaction
costs, as well as the potential “upside.”
This case demonstrates the potential for PES implementation even in high opportunity-cost contexts: in
the face of strong urban and industrial deforestation pressure, the government created additional laws
to increase negative incentives against development. Because of the scale of government involvement,9
underlying shifts in the national economy, as well as the type10 of project, calculating additionality is
impossible. Nonetheless, the scheme is generally credited as having significantly contributed to the
recovery of national forest cover - from a low of 20% prior to PES initiation, to in excess of 50%.
Figure 87: Forest Cover in Costa Rica
A detailed review of this scheme was conducted in 2013 with generally positive conclusions, but also
found “common agreement from the literature…that better ‘environmental targeting’ is likely to
increase the programme’s effectiveness.” Instead of allowing landowners to self-select through
voluntary participation, more effort should be made to seek out “areas of environmental importance, to
9 A majority of PES financing was raised via a national tax on fossil fuel and water use, as well as use of regulatory threats to reduce landowner
opportunity costs, by prohibiting urban sprawl. 10
Between 1997 and 2012, 82% of the total US$340 million distributed through the scheme was to encourage the protection of nearly 1 million forest hectares, while only a combined 14% went to restoration and agroforestry. For this reason, many analyses of the Costa Rica project conclude that its “effectiveness increases if it is measured as ‘protecting existing forest’ rather than ‘increasing forest cover.

engage landowners in participation in PES by providing additional incentives” (Porras 2013, p. 33). The
reason for improving spatial targeting (and overhead costs) is that a “voluntary approach does not
necessarily create the continuous blocks of protected forest necessary to provide biological corridors,
buffer zones to protect key water resources, roaming space for large animals like jaguars, or forest on
slopes that help reduce the risk of flooding (ibid, p. 55). If done effectively, these increased costs could
be offset by improved outcomes, by increasing the possibility for ‘trophic cascade’ processes to
accelerate the rate of recovery.
RIMSEC silvopasture (Costa Rica, Colombia, Nicaragua)
Though considerably smaller than the national-scale Costa Rican reforestation PES (with a budget of
US$8.5M), this case provides a useful contrast in terms of design sophistication and a strong, persuasive
business case for landholder participation. Implemented by a Costa Rican forestry research institute, the
RIMSEC project is considered as among the most rigorous in linking the amount of payment distributed
to each landholder to an assessment of additionality and conditionality. This increased /ha costs of the
project considerably (Porras 2013, p. 18), but is offset by the creation of additional plot-level recovery,
and provisioning of detailed, farm-level information plans by facilitators.
This case is among only a few schemes so far to integrate sub-plot “mosaic” ecological planning and
biodiversity analyses to inform the level of compensation, conditional on ongoing improvement. This
elevated data quality also allows the project to provide clear performance metrics and track
improvements over time, and thereby creates opportunity to develop best practices. Although the cost
of such a project was considered “too high for a national-level programme, [it was concluded that]
advances in technology could help to reduce them in the future” (ibid).
10.4 North West Ohio, USA
Reverse Auctions and new technology
The United States-based Conservation Reserve Program (CRP) is the longest-running (and largest) PES
scheme in the world. Started in the ‘dust bowl days’ of the 1930s (and originally called the Soil Bank
Program), farmers are compensated to adopt erosion and land-stabilizing practices. Because of
increasing support and evidence of causal improvements in wildlife populations, the scope of the CRP
expanded to include compensation for actions which improve water quality and create habitat.
Over the summer of 2014 two CRP reverse auctions for water quality improvement in the L. Erie basin
were monitored. The design of the project was developed through the use of reverse auctions, where
landowners were invited (by mail) to submit bids; of 1085 invitations to bid sent to landowners, only 1%
were returned as bid for participation. As a result of this low participation rate, certain landholders were
paid despite the low marginal improvements created by their actions. This “resulted in funding some
bids that provided little benefit to the environment, which meant…a high price per dollar of reduced
phosphorus runoff thus reducing overall cost-effectiveness” (Palm-Forster 2015, source).
A follow-up consultation of non-participating landowners determined that 30% of recipients had had a
lack of knowledge about the auction; 26% were technically ineligible, and 44% were unwilling to bid. The
former obstacles are possible to resolve through technological innovation, but the primary reasons for
unwillingness to participate were reported to have been a result of i) unwillingness to adopt the eligible
practices, ii) perceived auction complexity, and iii) doubts about acceptability of a planned bid.
This case highlights that while a technical solution like a reverse auction may reduce cost inefficiencies
from overcompensation, the added process complexity can effectively create “a hidden transaction
cost,” where farmers respond “by either demanding more money to participate or being unwilling to
apply for the program at all. Both outcomes [also] undermine the cost-effectiveness…A streamlined
bidding process is needed to reduce confusion and make it easier for farmers to participate” (ibid).

10.5 Indonesia reverse auction
When contrasted with the CRP case, an analysis of proposed reverse auctions in Indonesia by Ajayi et al.
(2011) provides a (somewhat dated) glimpse of the viability of reverse auctions in a developing country
context. At the time of writing, it was concluded that the process appears even less viable than in the US
CRP context, but no investigation was made of how the appropriate use of new technologies for tenure
mapping might to address many frictions in the process.
If compared, the CRP and Indonesia cases suggest that ‘technological leapfrogging’ and demographic
(age) differences may in fact make some aspects PES schemes more viable in developing countries, than
developed. By reducing the need for WTA/opportunity cost estimation, technology can play a significant
role in improving the viability of reverse auctions, and underpin significant additional improvements in
cost effectiveness.
Project number 2645-07B 39
Appendices
Appendix I. Figures and Images
Figure 1: Business process innovation overview. Original content by Collins, T., and Proportion
Foundation. 2016.
Figure 2: Water, Food, Energy Nexus
Adapted from IRENA, Renewable Energy in the Water, Energy and Food Nexua, 2015, (p. 15)
IRENA. (2015). Renewable Energy in the Water, Energy and Food Nexus. (pp. 1 – 128, Rep.) IRENA.
Retrieved from
http://www.irena.org/documentdownloads/publications/irena_water_energy_food_nexus_2015.pdf
Figure 3: Minimum Inputs & Outputs for integrated landscape planning
Adapted from: World Economic Forum - Blueprint for a Greener Footprint, 2016, p. 10
The Nature Conservancy, RESOLVE, & World Economic Forum. (2016). Blueprints for a Greener Footprint
Sustainable Development at a Landscape Scale (pp. 1-25, Publication). World Economic Forum.
Retrieved from http://www3.weforum.org/docs/WEF_Blueprint_for_a_Greener.pdf
Figure 4: Ecosystem Services Publications
Adapted from The value of the world's ecosystem services and natural capital. Nature, 1997
Costanza, R., D'Arge, R., De Groot, R., Farber, S., Grasso, M., Hannon, B., . . . Van den Belt, M. (1997). The
value of the world's ecosystem services and natural capital. Nature, 253-260. Retrieved from
http://www.nature.com/nature/journal/v387/n6630/pdf/387253a0.pdf
Figure 5: Environment & The Social and Economic System
Adapted from: EU CICES project 2016 - Common International Classification for Ecosystem Services
Haines-Young, R., & Potschin,, M. (2012). Common International Classification of Ecosystem Services:
Consultation on Version 4, August-December 2012 (Rep.). Retrieved
http://test.matth.eu/content/uploads/sites/8/2012/07/CICES-V43_Revised-Final_Report_29012013.pdf
Figure 6: Regime Shift
Adapted from SEI, Insight #2 Regime Shifts Social-ecological systems contain various tipping points or
thresholds that can trigger large-scale reorganization, 2014 (p.1)
Stockholm Resilience Centre. (2014). Insight #2 Regime Shifts Social-ecological systems contain various
tipping points or thresholds that can trigger large-scale reorganization. (pp. 1-4, Rep.). Stockholm
University. Retrieved from
http://www.stockholmresilience.org/download/18.3e9bddec1373daf16fa438/1381790210379/Insights
_regimeshifts_120111-2.pdf
Figure 7: Pre-collapse Regime
Adapted from SEI, Insight #2 Regime Shifts Social-ecological systems contain various tipping points or
thresholds that can trigger large-scale reorganization, 2014 (p.1)
Stockholm Resilience Centre. (2014). Insight #2 Regime Shifts Social-ecological systems contain various
tipping points or thresholds that can trigger large-scale reorganization. (pp. 1-4, Rep.). Stockholm
University. Retrieved from

http://www.stockholmresilience.org/download/18.3e9bddec1373daf16fa438/1381790210379/Insights
_regimeshifts_120111-2.pdf
Figure 8: Degradation Extent and Restoration Efforts
Adapted from Duguma et al., Landscape Restoration from a Social-Ecological Systems perspective, 2015,
(p. 5)
Duguma, L. A., Minang, P. A., Mpanda, M., Kimaro, A., & Alemagi, D. (2015). Landscape restoration from
a social-ecological system perspective. (pp 63 - 73, Chapter). (P. A., van Noordwijk, M., Freeman, O. E.,
Mbow, C., de Leeuw, J., & Catacutan, D., Eds.). Nairobi, Kenya: World Agroforestry Centre (ICRAF).
Retrieved from http://asb.cgiar.org/climate-smart-landscapes/chapters/chapter5.pdf
Figure 9: Post-Collapse, Irreversible Regime Shift
Adapted from: Insight #2 Regime Shifts Social-ecological systems contain various tipping points or
thresholds that can trigger large-scale reorganization, 2014 (p.1)
Stockholm Resilience Centre. (2014). Insight #2 Regime Shifts Social-ecological systems contain various
tipping points or thresholds that can trigger large-scale reorganization. (pp. 1-4, Rep.). Stockholm
University. Retrieved from
http://www.stockholmresilience.org/download/18.3e9bddec1373daf16fa438/1381790210379/Insights
_regimeshifts_120111-2.pdf
Figure 10: Incentive-based Mechanisms
Adapted from Designing payments for ecosystem services: Lessons from previous experience with
incentive-based mechanisms, 2008, (p. 1)
Jack, B. K., Kousky, C., & Sims, K. R. (2008). Designing payments for ecosystem services: Lessons from
previous experience with incentive-based mechanisms. Proceedings of the National Academy of
Sciences, 105(28), 9465-9470. doi:10.1073/pnas.0705503104
Figure 11: Variables affecting opportunity costs in forest conservation
Adapted from Learning from 20 years of PES in Costa Rica, 2013. (p. 58)
Porras, I., et al. (2013). Learning from 20 years of PES in Costa Rica. (pp. 1 - 76, Rep.). IIED - International
Inst. Environment and Development. Retrived from http://pubs.iied.org/pdfs/16514IIED.pdf
Figure 12: The Healthcare Diagnostic Process
Adapted from: Improving Diagnosis in Health Care, 2015. National Academies of Sciences, Engineering,
and Medicine. Washington, DC: The National Academies Press.
Figure 13: The Business Model Canvas. 2011. Alexander Osterwalder, Strategyzer AG.
www.strategyzer.com
Figure 14: Fogo Island fish population
Adapted from MEA, Ecosystems and Human Well-being: Synthesis. 2005 (p.5)
Millennium Ecosystem Assessment. (2005). Ecosystems and Human Well-being: Synthesis.
Island Press, Washington, DC. Retrieved from
http://www.millenniumassessment.org/documents/document.356.aspx.pdf
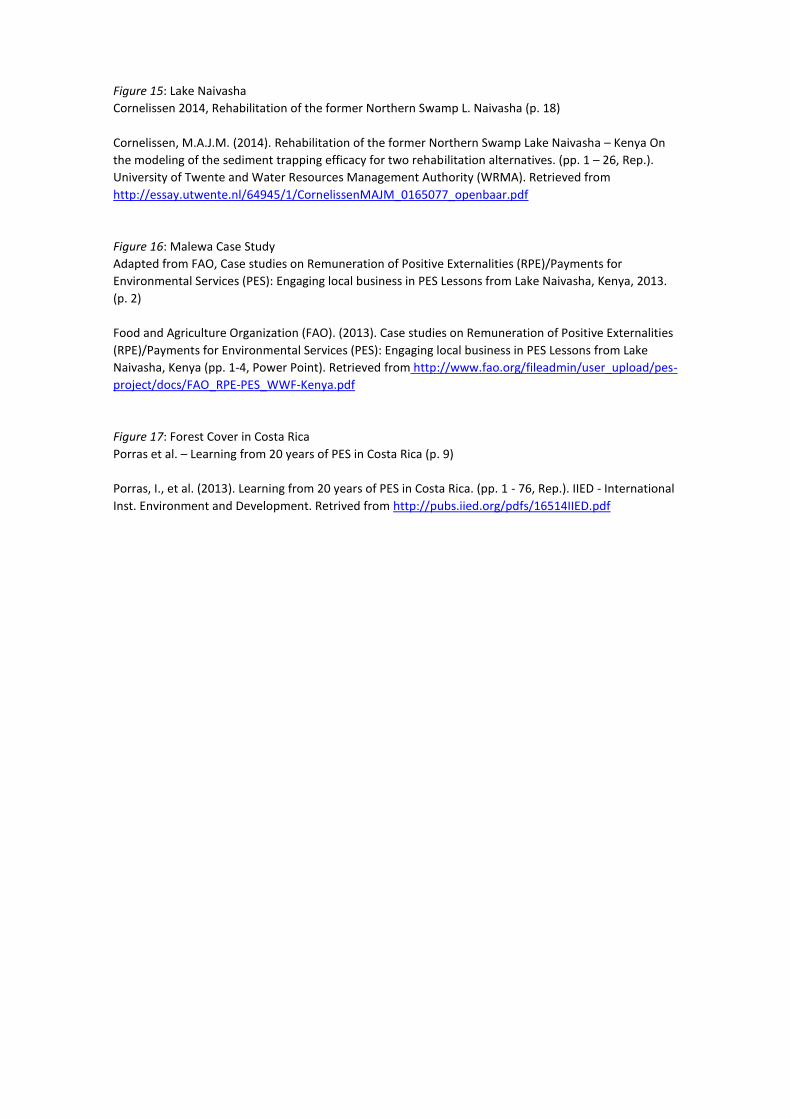
Figure 15: Lake Naivasha
Cornelissen 2014, Rehabilitation of the former Northern Swamp L. Naivasha (p. 18)
Cornelissen, M.A.J.M. (2014). Rehabilitation of the former Northern Swamp Lake Naivasha – Kenya On
the modeling of the sediment trapping efficacy for two rehabilitation alternatives. (pp. 1 – 26, Rep.).
University of Twente and Water Resources Management Authority (WRMA). Retrieved from
http://essay.utwente.nl/64945/1/CornelissenMAJM_0165077_openbaar.pdf
Figure 16: Malewa Case Study
Adapted from FAO, Case studies on Remuneration of Positive Externalities (RPE)/Payments for
Environmental Services (PES): Engaging local business in PES Lessons from Lake Naivasha, Kenya, 2013.
(p. 2)
Food and Agriculture Organization (FAO). (2013). Case studies on Remuneration of Positive Externalities
(RPE)/Payments for Environmental Services (PES): Engaging local business in PES Lessons from Lake
Naivasha, Kenya (pp. 1-4, Power Point). Retrieved from http://www.fao.org/fileadmin/user_upload/pes-
project/docs/FAO_RPE-PES_WWF-Kenya.pdf
Figure 17: Forest Cover in Costa Rica
Porras et al. – Learning from 20 years of PES in Costa Rica (p. 9)
Porras, I., et al. (2013). Learning from 20 years of PES in Costa Rica. (pp. 1 - 76, Rep.). IIED - International
Inst. Environment and Development. Retrived from http://pubs.iied.org/pdfs/16514IIED.pdf

Appendix II. Literature
Bavington, D. (2010). Managed annihilation: An unnatural history of the Newfoundland cod collapse.
Vancouver: UBC Press. Retrieved from
http://www.ubcpress.ca/books/pdf/chapters/2010/ManagedAnnihilation.pdf
BCA, FORES, FORWET. (2013). Review of international case studies of Payment for Ecosystem Services
(PES). (pp. 8 - 11, Rep.). Fores. Retrieved from http://fores.se/wp-
content/uploads/2012/11/Background-2.2-int-cases.pdf
Bernard, F., Dewi, S., Duguma, L., Minang, P. A., Van Noordwijk, M. (2015). Policy Brief - Transforming
REDD+ and achieving SDGs through support for adapt-mitig synergy. (pp. 1 - 4, Rep.). Nairobi: ASB
Partnership for the Tropical Forest Margins, World Agroforestry Center (ICRAF). Retrieved from
http://www.asb.cgiar.org/Publications%202015/PBs/ASB_PB46.pdf
Berttram, D. (2011). Positioning the Kagera TAMP Project in the PES Landscape of East Africa. (pp. 14 -
36, Internship Report). FAO (NRL). Retrieved from
http://www.fao.org/fileadmin/templates/nr/kagera/Documents/davina/Positioning_the_Kagera_TAMP
_-_D._Berttram_updated_case_studies_april_2011.pdf
Bishop, J., Bertrand, N., Evison, W., Gilbert, S., Grigg, A., Hwang, L., . . . Vorhies, F. (2010). TEEB – The
Economics of Ecosystems and Biodiversity Report for Business - Executive Summary 2010. (pp. 1 - 27,
Publication). TEEB. Retrieved from http://img.teebweb.org/wp-content/uploads/Study and
Reports/Reports/Business and Enterprise/Executive Summary/Business Executive Summary_English.pdf
Boissiere, M., Meijaard, E., Guariguata, M. R., Savilaakso, S., Putzel, L. (2015). A review of compliance
and impact monitoring for delivery of forest ecosystem services. (pp. 1-63, Working Paper no. 188).
Bogor, Indonesia: Center for International Forestry Research (CIFOR). Retrieved March 13, 2016, from
http://www.cifor.org/publications/pdf_files/WPapers/WP188Savilaakso.pdf
Blüthgen, N., Simons, N. K., Jung, K., Prati, D., Renner, S. C., Boch, S., . . . Gossner, M. M. (2016). Land
use imperils plant and animal community stability through changes in asynchrony rather than diversity.
Nature Communications Nat Comms, 7, 10697. doi:10.1038/ncomms10697
Bullock, J. M., Aronson, J., Newton, A. C., Pywell, R. F., & Rey-Benayas, J. M. (2011). Restoration of
ecosystem services and biodiversity: Conflicts and opportunities. (pp. 1-9, Rep. No. Review). Wallingford,
Oxfordshire: Centre for Ecology and Hydrology. Retrieved from
http://www3.uah.es/josemrey/Docencia/Materia1Master/Bullock_RestorationReview_TREE_2011_prin
t.pdf
Buttoud, G., Ajayi, O., Detlefsen, D., Place, F., Torquebiau, E. (2013). Advancing Agroforestry on the
Policy Agenda: A guide for decision-makers. (pp. 1 - 50, Working Paper 01). Food and Agriculture
Organization of the United Nations. Retrieved from http://www.fao.org/3/a-i3182e.pdf
Campbell, L. M., N. J. Gray, E. L. Hazen, and J. M. Shackeroff. (2009). Beyond baselines: rethinking
priorities for ocean conservation (pp. 1 - 14, Rep.) Ecology and Society. Retrieved from
http://www.ecologyandsociety.org/vol14/iss1/art14/
Cooley, D., Olander, L. (2011). Stacking Ecosystem Services Payments - Risks and Solutions. (pp. 1 - 28,
Rep.). Nicholas Institute. Retrieved from
https://nicholasinstitute.duke.edu/sites/default/files/publications/stacking-ecosystem-services-
payments-paper.pdf

Costanza, R., D'Arge, R., De Groot, R., Farber, S., Grasso, M., Hannon, B., . . . Van den Belt, M. (1997).
The value of the world's ecosystem services and natural capital. Nature, 253-260. Retrieved from
http://www.nature.com/nature/journal/v387/n6630/pdf/387253a0.pdf
Costanza, R., Groot, R. D., Sutton, P., Ploeg, S. V., Anderson, S. J., Kubiszewski, I., . . . Turner, R. K.
(2014). Changes in the global value of ecosystem services. Global Environmental Change, 26, 152-158.
doi:10.1016/j.gloenvcha.2014.04.002
Cornelissen, M.A.J.M. (2014). Rehabilitation of the former Northern Swamp Lake Naivasha – Kenya On
the modeling of the sediment trapping efficacy for two rehabilitation alternatives. (pp. 1 – 26, Rep.).
University of Twente and Water Resources Management Authority (WRMA). Retrieved from
http://essay.utwente.nl/64945/1/CornelissenMAJM_0165077_openbaar.pdf
Credit Suisse, IUCN. (2016). Conservation Finance - From Niche to Mainstream: The Building of an
Institutional Asset Class. (pp. 1-28, Rep.). Credit Suisse, IUCN, Rockefeller. Retrieved from
https://www.credit-suisse.com/media/assets/corporate/docs/about-
us/responsibility/banking/conservation-finance-en.pdf
Cross, H., McGhee, W. (2015). PES incentives for smallholders to avoid deforestation: lessons learned.
(pp. 1 - 42, Rep.). SHARP. Retrieved from http://www.sharp-
partnership.org/updates/SHARP_2015_smallholder_PES_review_lores.pdf
Crossman, N. D., Burkhard, B., Nedkov, S., Willemen, L., Petz, K., Palomo, I., . . . Maes, J. (2013). A
blueprint for mapping and modelling ecosystem services. Ecosystem Services 4. (pp. 4-14, Rep.). New
York: Department of Natural Resources. Retrieved from
http://www.sciencedirect.com/science/article/pii/S2212041613000041
Duguma, L. A., Minang, P. A., Mpanda, M., Kimaro, A., & Alemagi, D. (2015). Landscape restoration
from a social-ecological system perspective. (pp 63 - 73, Chapter). (P. A., van Noordwijk, M., Freeman, O.
E., Mbow, C., de Leeuw, J., & Catacutan, D., Eds.). Nairobi, Kenya: World Agroforestry Centre (ICRAF).
Retrieved from http://asb.cgiar.org/climate-smart-landscapes/chapters/chapter5.pdf
Duguma, L. A., Wambugu, S. W., Minang, P. A., & Noordwijk, M. V. (2014). A systematic analysis of
enabling conditions for synergy between climate change mitigation and adaptation measures in
developing countries. Environmental Science & Policy, 42, 138-148. Retrieved from
http://www.sciencedirect.com/science/article/pii/S1462901114001178
Ernst and Young, IFAC, & Natural Capital Coalition. (2013, December). Accounting for Natural Capital
The elephant in the boardroom (pp 1 - 20, Rep.). Retrieved
http://www.cimaglobal.com/Documents/Thought_leadership_docs/Sustainability and Climate
Change/CIMA-accounting-for-natural-capital.pdf
Ferwerda, W. (2015). 4 Returns, 3 Zones, 20 Years - A holistic framework for ecological restoration by
people and business for next generations. Revised Ed. (pp. 1-100, 2nd. Edition) (D. Noome & L.
Sawahata, Eds.). Rotterdam: Rotterdam School of Management, Erasmus University i.a.w. IUCN
Commission on Ecosystem Management and Commonland. Retrieved from
http://www.commonland.com/_doc/4returnsframeworkErasmusbookRSMIUCNCEM_1607557431.pdf
Food and Agriculture Organization (FAO), & World Water Council (WWC). (2015). Towards a water and
food secure future: Critical Perspectives for Policy-makers (pp. 1-76, Rep.). FAO & WWC. Retrieved from
http://www.fao.org/nr/water/docs/FAO_WWC_white_paper_web.pdf

Food and Agriculture Organization (FAO). (2014a). The Water-Energy-Food Nexus A new approach in
support of food security and sustainable agriculture. (pp. 1 - 28, Rep.). Food and Agriculture
Organization of the United Nations. Retrieved from
http://www.fao.org/nr/water/docs/FAO_nexus_concept.pdf
Food and Agriculture Organization. (2014b). Walking the Nexus Talk: Assessing the Water-Energy-Food
Nexus in the Context of the Sustainable Energy for All Initiative. (pp. 1 - 150, Rep.). Food and Agriculture
Organization of the United Nations. Retrived from http://www.fao.org/3/a-i3959e.pdf
Fripp, E. (2014). A practical guide to assessing the feasibility of PES projects. (pp. 1-36, Publication).
Center for International Forestry Research (CIFOR). Retrieved from
http://www.cifor.org/publications/pdf_files/Books/BFripp1401.pdf
Gerber, L. R. (2016). Conservation triage or injurious neglect in endangered species recovery.
Proceedings of the National Academy of Sciences Proc Natl Acad Sci USA, 113(13), 3563-3566. Retrieved
from http://www.pnas.org/content/113/13/3563.abstract
Gillenwater, M. (2012). What is Additionality? Part 3: Implications for stacking and unbundling. (No.
003, pp. 1-14, Discussion Paper). Silver Spring, MD: Greenhouse Gas Management Institute. Retrieved
from http://ghginstitute.org/wp-content/uploads/2015/04/AdditionalityPaper_Part-3ver3FINAL.pdf
Hagerman, S. M., & Satterfield, T. (2014). Agreed but not preferred: Expert views on taboo options for
biodiversity conservation, given climate change. Ecological Applications, 24(3), 548-559. Retrieved from
http://onlinelibrary.wiley.com/doi/10.1890/13-0400.1/abstract
Haines-Young, R., & Potschin,, M. (2012). Common International Classification of Ecosystem Services:
Consultation on Version 4, August-December 2012 (Rep.). Retrieved
http://test.matth.eu/content/uploads/sites/8/2012/07/CICES-V43_Revised-Final_Report_29012013.pdf
Harris, L., & Swinton, S. (2012). Designing Effective Conservation Auctions. (pp. 1-22, Rep.). Michigan:
Michigan State University. Retrieved from
https://www.conservationgateway.org/ConservationByGeography/NorthAmerica/wholesystems/greatl
akes/watersheds/Documents/A4 Designing Effective Coonservation Auctions_Final12dec17.pdf.
IRENA. (2015). Renewable Energy in the Water, Energy and Food Nexus. (pp. 1 – 128, Rep.) IRENA.
Retrieved from
http://www.irena.org/documentdownloads/publications/irena_water_energy_food_nexus_2015.pdf
IUCN, Commission on Ecosystem Mgmt. (2004). Ecological Restoration a means of conserving
biodiversity and sustaining livelihoods Rationale for Ecological Restoration. (pp. 1 - 6, Publication). IUCN,
Commission on Ecosystem Mgmt. Retrieved from http://www.ser.org/docs/default-document-
library/ser-iucn-global-rationale.pdf?sfvrsn=2
Jack, B. K., Kousky, C., & Sims, K. R. (2008). Designing payments for ecosystem services: Lessons from
previous experience with incentive-based mechanisms. Proceedings of the National Academy of
Sciences, 105(28), 9465-9470. doi:10.1073/pnas.0705503104
Khanal, R., Paudel, D. (2012). PES Schemes for Conserving Sardu Watershed Nepal: Existing Practices
and Future Prospects. (pp. 1 - 12). (A. Poudyal, Eds). Nepal: International Union for Conservation of
Nature and Natural. Retrieved from
https://cmsdata.iucn.org/downloads/payment_for_ecosystem_services__pes__schemes_for_conservin
g_sardu_watershed_nepal_tec.pdf

Leopold, Aldo. (1934). Conservation Economics. (pp. 537-544). Journal of Forestry. Retrieved from
http://www.ingentaconnect.com/content/saf/jof/1934/00000032/00000005/art00007
Luck, G. W., Harrington, R., Harrison, P. A., Kremen, C., Berry, P. M., Bugter, R., . . . Zobel, M. (2009).
Quantifying the Contribution of Organisms to the Provision of Ecosystem Services. BioScience, 59(3),
223-235. Retrieved from http://bioscience.oxfordjournals.org/content/59/3/223.full.pdf
Millennium Ecosystem Assessment. (2005). Ecosystems and Human Well-being: Synthesis.
Island Press, Washington, DC. Retrieved from
http://www.millenniumassessment.org/documents/document.356.aspx.pdf
Natural Capital Coalition. (2015). Natural Capital Protocol, Principles, and Framework (November, 2015
draft). (pp. 1-9, Publication). Natural Capital Coalition. Retrieved from
http://www.naturalcapitalcoalition.org/js/plugins/filemanager/files/019347_NCC_Brochure_A5_Online.
pdf.
NFFA. (2016, March). African leaders call for action on massive tree planting in Africa. [Press release].
Retrieved from http://newforestsforafrica.org/wp-content/uploads/2016/01/Press-release-March-
2016.pdf
Persson, J. G., Meyfroidt, P., & Tizado, J. (2015). Transformative Transparency: Harnessing the power
of data for supply chain sustainability (pp. 1-4, Rep.). Stockholm: Stockholm Environment Institute.
Retrieved from https://www.sei-international.org/mediamanager/documents/Publications/NEW/SEi-
GCP-DB-TransformativeTransparency.pdf.
Porras, I. (2011). Delivering Conservation and Poverty Reduction in Uluguru, Tanzania. (pp. 1 - 7, Rep.).
IIED, Watershed Markets. Retrieved from
http://www.watershedmarkets.org/documents/Tanzania_Uluguru.pdf
Porras, I. (2011). Naivasha Project Kenya, Equitable Payments for Watershed Services, international
World Wildlife Fund (WWF)/ Cooperative for Assistance and Relief Everywhere (CARE) initiative. (pp. 1 -
4, Rep.) IIED, Watershed Markets, WWF. Retrieved from
http://www.watershedmarkets.org/documents/Kenya_Naivasha_Malewa.pdf
Porras, I., et al. (2013). Learning from 20 years of PES in Costa Rica. (pp. 1 - 76, Rep.). IIED -
International Inst. Environment and Development. Retrived from
http://pubs.iied.org/pdfs/16514IIED.pdf
Rocha, J. C., Peterson, G. D., Biggs, R. (2015). Regime Shifts in the Anthropocene: Drivers, Risks, and
Resilience. (pp. 1 - 16. Rep.). (R. Unsworth, Eds). PLOS ONE. Retrieved from
http://journals.plos.org/plosone/article?id=10.1371/journal.pone.0134639
Sommerville, M. M., Jones, J. P., & Milner-Gulland, E. J. (2009). A revised conceptual framework for
payments for environmental services. Ecology and Society, 14(2), 34th ser. Retrieved from
http://www.ecologyandsociety.org/vol14/iss2/art34/
Stockholm Resilience Centre. (2014). Insight #2 Regime Shifts Social-ecological systems contain various
tipping points or thresholds that can trigger large-scale reorganization. (pp. 1-4, Rep.). Stockholm
University. Retrieved from
http://www.stockholmresilience.org/download/18.3e9bddec1373daf16fa438/1381790210379/Insights
_regimeshifts_120111-2.pdf

Sukhdev, P. (2008). Executive Summary - The Economics of Ecosystems and Biodiversity (Rep.).
Retrieved http://ec.europa.eu/environment/nature/biodiversity/economics/pdf/teeb_report.pdf
The Economics of Ecosystems & Biodiversity. (2015). TEEB for Agriculture and Food: An interim report
(Rep.). Retrieved http://img.teebweb.org/wp-
content/uploads/2015/12/TEEBAgFood_Interim_Report_2015_web.pdf
The Nature Conservancy, RESOLVE, & World Economic Forum. (2016). Blueprints for a Greener
Footprint Sustainable Development at a Landscape Scale (pp. 1-25, Publication). World Economic Forum.
Retrieved from http://www3.weforum.org/docs/WEF_Blueprint_for_a_Greener.pdf
UCRT, Carbon Tanzania. (Updated 2015). Reducing Emissions from Deforestation and Forest
Degradation in the Yaeda Valley, Northern Tanzania. (pp. 1- 49, Rep.). UCRT, Carbon Tanzania. Retrieved
from http://www.planvivo.org/docs/Tech-Spec-Yaeda-Valley-2015.pdf
United Nations. (2014). The UN Secretary General’s Sustainable Energy for All (SE4ALL) Initiative (pp. 1-
3, Rep.). United Nations. Retrieved from
http://www.unep.org/post2015/Portals/50240/Documents/UNEP
Publications/Partnerships/SEA4ALL.pdf
Vera, F. (2011). The Shifting Baseline Syndrome in Restoration Ecology. (pp. 98 - 110, Chapter). (M.
Hall, Eds). New York: Routledge. Retrieved from
http://media.longnow.org/files/2/REVIVE/The%20Shifting%20Baseline%20Syndrome%20in%20Restorati
on%20Ecology_Frans%20Vera.pdf
Walton, M., Vilas, C., Coccia, C., Green, A., Cañavate, J., Prieto, A., . . . Vay, L. L. (2015). The effect of
water management on extensive aquaculture food webs in the reconstructed wetlands of the Doñana
Natural Park, Southern Spain. (pp. 451 - 463, 448). Aquaculture, 448. Retrieved from
http://agrifs.ir/sites/default/files/The effect of water management on extensive aquaculture food webs
in.PDF
World Economic Forum. (2016). Insight Report: Global Risks Report 2016. (pp. 1-103, Rep. 11th
Edition). World Economic Forum. Retrieved from
http://www3.weforum.org/docs/Media/TheGlobalRisksReport2016.pdf
Wunder, S. (2014). Revisiting the concept of payments for environmental services. Retrieved from
http://r1.ufrrj.br/cpda/wp-content/uploads/2015/05/Wunder-Revisiting-PES-definition-Ecol-Econ-2015-
early-view.pdf

Project number 2645-07B 47
Appendix III. Websites and Cases
Websites
Payments for Watershed Markets - Information from Schemes in Developing Countries Case Studies:
Africa. (2016.). Retrieved March 12, 2016, from http://www.watershedmarkets.org/regions/africa.html
Technical Library | planvivo.org. (2016). Retrieved March 10, 2016, from
http://www.planvivo.org/our-approach/technical-library/
UNEP, The Katoomba Group, & Forest Trends. (2008). Payments for Ecosystem Services: A primer (pp
1 - 74, Rep.). Retrieved http://www.unep.org/pdf/PaymentsForEcosystemServices_en.pdf
Cases
Ajayi, O. C., Jack, B. K., & Leimona, B. (2012). Auction Design for the Private Provision of Public Goods
in Developing Countries: Lessons from Payments for Environmental Services in Malawi and Indonesia.
World Development, 40(6), 1213-1223. Retrieved from
http://sites.tufts.edu/kjack/files/2011/08/Ajayi_WorldDev.pdf
Bavington, D. (2010). Managed annihilation: An unnatural history of the Newfoundland cod collapse.
Vancouver: UBC Press. Retrieved from
http://www.ubcpress.ca/books/pdf/chapters/2010/ManagedAnnihilation.pdf
Chiramba, T., Mogoi, S., Martinez, I., & Jones, T. (2011). PES pilot project in L. Naivasha basin, Kenya - a
viable mechansim for watershed services that delivers nautral resource management and improved
livelihoods (Rep.). Retrieved from
http://www.un.org/waterforlifedecade/green_economy_2011/pdf/session_4_biodiversity_protection_c
ases_kenya.pdf
Food and Agriculture Organization (FAO). (2013). Case studies on Remuneration of Positive
Externalities (RPE)/Payments for Environmental Services (PES): Engaging local business in PES Lessons
from Lake Naivasha, Kenya (pp. 1-4, Power Point). Retrieved from
http://www.fao.org/fileadmin/user_upload/pes-project/docs/FAO_RPE-PES_WWF-Kenya.pdf
Gherardi, F., Britton, J. R., Mavuti, K. M., Pacini, N., Grey, J., Tricarico, E., & Harper, D. M. (2011). A
review of allodiversity in Lake Naivasha, Kenya: Developing conservation actions to protect East African
lakes from the negative impacts of alien species. Biological Conservation, 144(11), 2585-2596. Retrieved
from
https://www.researchgate.net/publication/224852502_A_review_of_allodiversity_in_Lake_Naivasha_K
enya_Developing_conservation_actions_to_protect_East_African_lakes_from_the_negative_impacts_of
_alien_species.
Njiru, J., Morara, G., Waithaka, E., & Mugo, J. (2015). Fish kills in lake Naivasha, Kenya: What was the
probable cause? International Journal of Fisheries and Aquatic Studies, 3(1), 179-184. Retrieved from
http://www.fisheriesjournal.com/vol3issue1/Pdf/2-5-50.1.pdf
Nyongesa, J. M., & Muigai, P. (2012). Promoting Green development and growth through linking
downstream water users to upstream land managers (pp 1 - 2, Rep.). Retrieved
http://presa.worldagroforestry.org/files/2012/07/THIRD-PES-EVENT-IN-NAIVASHA-BASIN1.pdf

Pagiola, S., & Press, A. (2013). Regional Integrated Silvopastoral Ecosystem Management Project –
Costa Rica, Colombia and Nicaragua (pp. 1-6, Rep.). The Economics of Ecosystems & Biodiversity.
Retrieved from https://www.cbd.int/financial/pes/costarica-pessilvo.pdf
Palm-Forster, L., Swinton, S., Lupi, F., & Shupp, R. (2016). Too Burdensome to Bid: Transaction Costs
and Pay-for-Performance Conservation (pp. 1-39, Rep.). Department of Applied Economics and Statistics
& Department of Agricultural, Food, and Resource Economics. Retrieved from
http://ageconsearch.umn.edu/bitstream/212816/2/Palm.pdf
Ruhakana, A. (2015). Estimation of the change of Lake Naivasha using earth observation, GIS, and
hydrological model (Rep.). Retrieved https://www.geotechrwanda2015.com/wp-
content/uploads/2015/12/176_Albert-Ruhakana.pdf