Embed Size (px)
Citation preview
INTRODUCTIONEstablishing a carbon price internalizes the cost of green-house gas emissions associated with a business activity by assigning a monetary value to each ton emitted.1 It sends a price signal to the company which can be factored into investment decisions, incentivizing the transition from emissions-intensive to low-carbon alternatives. Typically assigned to one metric ton of carbon-dioxide equivalent (mtCO2e), the price can be a static value or a range of values that changes over time.2
Recent global advances such as the Paris Agreement, the Kigali Amendment to the Montreal Protocol, and a pact to limit airline emissions under the International Civil Aviation Organization (ICAO) signal growing momentum toward a low-carbon transition. Platforms such as the U.N. Global Compact Business Leadership Criteria on Carbon Pricing, the World Bank’s Carbon Pricing Leadership Coalition, and business statements in support of the Paris Agreement illustrate that companies are preparing for this low-carbon future.3
Increasingly, companies are looking for ways to reduce emissions in their internal operations and in their
supply chains. Strategies that put a price on greenhouse gas emissions are already in place in many regions. According to the World Bank, governments in 42 countries and more than 20 cities, states, and provinces have assigned a price on carbon or plan to in the form of carbon taxes or emissions trading systems.4 Companies increasingly are adopting a similar approach, through internal carbon pricing, as part of their climate response strategies. Pricing serves as a risk mitigation tool helping companies prepare both for climate-related physical risks (e.g., impacts of climate change, resource availability, supply chain disruptions) and for risks associated with the transition to a low-carbon economy (e.g., policy, market, reputational).5 Companies also use internal carbon pricing to identify potential opportunities in a carbon-constrained future.
According to 2016 disclosures to the CDP (formerly the Carbon Disclosure Project), more than 1,200 companies worldwide are either pursuing internal carbon pricing or preparing to do so in the following two years—up 23 percent from 2015.6 While most of these
THE BUSINESS OF PRICING CARBONHOW COMPANIES ARE PRICING CARBON TO MITIGATE RISKS AND PREPARE FOR A LOW-CARBON FUTURE
Manjyot Bhan Ahluwalia Center for Climate and Energy Solutions
September 2017
Increasingly, companies across sectors and geographies are turning to an internal carbon price as one tool to help them reduce carbon emissions, mitigate climate-related business risks, and identify opportunities in the transition to a low-carbon economy. Establishing a carbon price across a company can help internalize the cost of greenhouse gas emissions by assigning a monetary value to each ton emitted. The brief describes the business case for internal carbon pricing, the different internal carbon pricing approaches used by companies, and key lessons learned, including: the multiple business benefits of an internal carbon price, the importance of embedding the price in a company’s business strategy, and the benefits and challenges of different types of pricing strategies.
BUSINESS
Center for Climate and Energy Solutions2
companies are based in North America and Europe, the sharpest increase came from companies in the emerging economies, including Brazil, China, India, Mexico, and the Republic of Korea, with and without an explicit government policy on carbon emissions. Some compa-nies in the oil and gas, minerals and mining, and electric power sectors have been managing future carbon policy risk within their risk mitigation strategies and investment decision making since the early 2000s. For example, since 2000, Shell has used an internal carbon price to assess future projects’ potential exposure to carbon regulations when evaluating investment decisions.7 Sixty-three percent of all utilities and 52 percent of all energy companies that disclosed to CDP say they are using an internal carbon price—the highest proportion among key sectors. The use of internal pricing across other sectors is also on the rise. According to the CDP 2016 report, pricing is being adopted by companies in telecommunication services (40 percent), materials (35 percent), finance (31 percent), information and commu-nications technology (25 percent), consumer staples (24 percent), industrials (23 percent), consumer goods (22 percent), and health care (19 percent).8
This brief examines the growing practice of corporate carbon pricing. The first section describes different corpo-rate carbon pricing approaches, including carbon fees, shadow pricing, implicit carbon pricing, and hybrid carbon pricing. Section two explains why internal carbon pricing is rising on the corporate agenda. The third section evaluates the different corporate carbon pricing approaches. The fourth section offers some considerations when developing and implementing an internal carbon price. Section five distills key lessons learned. The last section provides detailed case studies of four global companies that have implemented an internal carbon price.
The companies examined for this brief play strategic roles in the global economy in a wide range of sectors including oil and gas, electric power, banking and financial services, consumer goods, healthcare, informa-tion and communications technology, manufacturing, materials, and transportation. Information for this report was collected from four complementary lines of research:
• A comprehensive review of the perspectives and activities of Fortune 500 companies considering or implementing internal carbon pricing, based on their reporting to the CDP and their corporate sustainability reports;
• In-depth interviews (conducted by C2ES from November 2016 to July 2017) with 20 corporate executives and sustainability practitioners from: Barclays, Bank of America, BHP, DTE Energy, Duke Energy, EMC/Dell, Exelon Corporation, General Electric, General Motors, HP Enterprises, JPMorgan Chase & Co., Mahindra & Mahindra Ltd., Microsoft, NRG Energy, Philips Lighting, Rio Tinto, Siemens, Toyota, The Walt Disney Company, and YES Bank;
• In-depth case studies of internal carbon pricing approaches and experiences of four global multi-sector companies: Microsoft, Royal Dutch Shell, Mahindra & Mahindra Ltd., and BHP; and
• Insights from an internal carbon pricing workshop hosted by C2ES in July 2016 with a multi-sectoral group of global companies, including members of the C2ES Business Environmental Leadership Council (BELC), other Fortune 500 compa-nies, and representatives of the International Finance Corporation (IFC).
C2ES thanks the Microsoft Corp. for its support of this work. As a fully independent organization, C2ES is solely responsible for its positions, programs, and publications. For further informa-tion, please visit: www.C2ES.org/Funding/GuidingPrinciples.
The author would like to thank the representatives of the Business Environmental Leadership Council, many of whom were interviewed or reviewed and provided helpful com-ments on this brief. The author would also like to thank Mi-chael Mondshine at WSP and Aditi Maheshwari at the IFC for their expert review. In addition, the author is grateful to the following C2ES staff for their support and useful edits: Meg Storch, Janet Peace, Laura Rehrmann, and Marty Niland.
The Business of Pricing Carbon 3
CORPORATE CARBON PRICING APPROACHES Companies use a variety of methods to internally price carbon that may be categorized as a carbon fee, a shadow price, or an implicit carbon price.9 Companies may also use a “hybrid” carbon pricing approach that combines aspects of these methods. Internal carbon fees and shadow pricing are the two most common forms used by companies to evaluate and manage climate-related business risks.
CARBON FEE
A carbon fee approach assigns a monetary value to emissions that result from normal business activity. While proceeds would stay within the company it may generate a revenue stream that could be used for projects that can help meet the company’s greenhouse gas reduction goals.
Observed prices suggest that carbon fee levels are relatively low ($5–$20 per metric ton) to avoid overbur-dening business units and ensure internal stakeholder buy-in. The fee generally covers scope 1 (i.e. emissions from sources that are owned or controlled by a company)
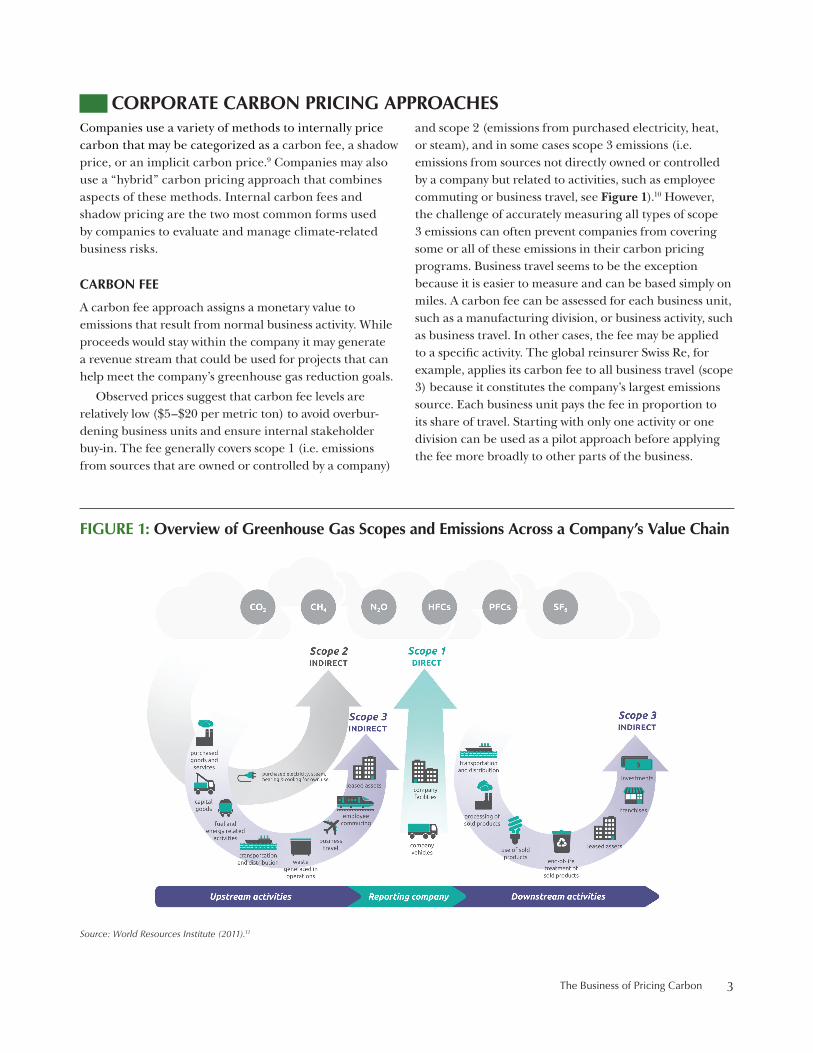
and scope 2 (emissions from purchased electricity, heat, or steam), and in some cases scope 3 emissions (i.e. emissions from sources not directly owned or controlled by a company but related to activities, such as employee commuting or business travel, see Figure 1).10 However, the challenge of accurately measuring all types of scope 3 emissions can often prevent companies from covering some or all of these emissions in their carbon pricing programs. Business travel seems to be the exception because it is easier to measure and can be based simply on miles. A carbon fee can be assessed for each business unit, such as a manufacturing division, or business activity, such as business travel. In other cases, the fee may be applied to a specific activity. The global reinsurer Swiss Re, for example, applies its carbon fee to all business travel (scope 3) because it constitutes the company’s largest emissions source. Each business unit pays the fee in proportion to its share of travel. Starting with only one activity or one division can be used as a pilot approach before applying the fee more broadly to other parts of the business.
FIGURE 1: Overview of Greenhouse Gas Scopes and Emissions Across a Company’s Value Chain
Source: World Resources Institute (2011).11
Center for Climate and Energy Solutions4
While the revenue stream raised by the fee can be used in a variety of ways, it is often used to help pay for products or projects that help the company meet its climate goals. Microsoft, for example, has had an internal corporate carbon fee since 2012 which generates a dedicated, steady source of revenue used to fund green-house gas reduction measures that help the company meet its carbon neutrality commitment. The revenue is invested in energy efficiency projects, renewable energy purchases, and carbon offset projects that help reduce its direct and indirect (scope 1 and 2) emissions, as well as indirect (scope 3) emissions from business travel. (See the Microsoft case study for more detail).12 The Walt Disney Company (Disney) also uses an internal fee and resulting funds are used to pay for reductions (and promote other environmental benefits) in the form of high-quality forest carbon offset credits. Offset credits can provide a way to compensate for internal emissions that are difficult or impossible to directly reduce.13
SHADOW PRICING
In contrast to an actual fee, many companies use a theoretical price on carbon, or a “shadow price,” as a risk-assessment tool to evaluate investments, test assumptions, and guide business strategy in anticipation of future carbon constraints. Often shadow prices are based on the prevailing and/or forecasted price of carbon regulations (e.g., European Union’s Emissions Trading Scheme (EU ETS), the Regional Greenhouse Gas Initiative (RGGI), California’s cap-and-trade program), prevailing and forecasted commodity prices, and technological factors. Shadow prices can also be set in line with other govern-ment policies that implicitly price carbon, including the price of renewables or taxes on certain commodities. For example, some companies, particularly in the materials and industrials sector in India, calculate their shadow price in part based on national government policies such as the coal tax, excise duty on fossil fuels, and the Performance Achieve Trade and Renewable Purchase Obligations schemes.14
Prices may also vary by location or type of activity. While some companies apply a single, uniform price across the company’s operations globally, others use a range of prices, with the higher price used for stress testing carbon intensive projects in highly regulated markets, and/or to account for potential future trigger and/or shock events.15 For example, BP uses an internal carbon price of $40 per metric ton to guide decision-making and applies a higher
value of $80 per metric ton to stress test the robustness of its portfolios in jurisdictions highly exposed to carbon regulations, for example for carbon-intensive assets and projects covered under the EU ETS.
Our research suggests that the single largest motiva-tion for adopting a shadow price is to better understand and anticipate the business risks from existing or expected carbon regulations and shift investments toward projects that would be competitive in a carbon-constrained future. Many companies that operate in jurisdictions with carbon pricing regulations apply a shadow price higher than the current government levels to better prepare for future more stringent regulatory constraints. For example, the shadow price used by the major global oil and gas companies operating in regu-lated carbon markets ranged between $27.92 and $80 per metric ton, even though, the vast majority of global emis-sions covered by a carbon pricing regulation have a price below $10 per metric ton.16 Similarly, Royal DSM, a Dutch health, nutrition, and materials multinational company, uses a shadow price of $55.84 per metric ton which again exceeds the price of the EU ETS that it trades in.17
IMPLICIT CARBON PRICING
Implicit carbon pricing is essentially the marginal abate-ment cost of the measures and initiatives implemented by a company to reduce its greenhouse gas emissions, including the cost of complying with regulations.18 For example, the amount a company spends on renewable energy purchases, energy efficiency projects, carbon offsets, or compliance with fuel economy or energy effi-ciency standards may be used as its implicit carbon price.
Unlike a carbon fee or a shadow price, the implicit price is calculated retroactively based on the measures implemented to mitigate emissions.19 An implicit carbon price also differs from a shadow price because it is not used to assess the implications of future carbon constraints. Instead, an implicit price can help a company understand its carbon footprint, improve internal communication, and evaluate the economic cost of a regulation on the company. Some companies use an implicit pricing strategy as a benchmark before formally launching other carbon pricing approaches—be it a carbon fee or a shadow price.20 Unilever, for example, uses an implicit carbon price of $10 per metric ton, calcu-lated by dividing the cost of generating or purchasing renewable energy by the number of metric tons saved.21
The Business of Pricing Carbon 5
HYBRID CARBON PRICING APPROACHES
The carbon pricing approaches described above are not mutually exclusive and a company may use a combination of these approaches to meet its greenhouse gas reduction goals, influence emissions through the value chain, and make long-term investment decisions. Hybrid carbon pricing can take several forms. Some companies exam-ined for this report use both an internal carbon fee to meet their greenhouse gas reduction goals, and a shadow price to guide future investment decisions.
Disney, for example, uses an internal carbon fee ranging from $10–$20 per metric ton to help meet the company’s target of reducing greenhouse gas emissions by 50 percent from 2012 levels by 2020 and a longer-term goal of zero net direct greenhouse gas emissions from its owned, operated, and leased assets (covering scope 1 and scope 2 emissions).22 Disney also uses a shadow price as a part of its capital planning process to make decisions on capital allocation for new projects, including global construction and IT projects. The shadow price comple-ments Disney’s carbon fee and drives investment in low carbon research and development (R&D) and clean technologies to improve the company’s energy efficiency and resource savings.23
Mahindra & Mahindra Ltd. (M&M), a large, Indian multinational automotive and farm equipment company, uses an internal carbon fee of $10 per metric ton to help reduce its carbon footprint and meet its goal to reduce greenhouse gas emissions 25 percent by 2019 from 2015–2016 levels.24 To complement its carbon fee and advance its long-term carbon neutrality goal, M&M is introducing a shadow price averaging around $50 per metric ton to shift investments to low-carbon procurement and influence the emission reductions of its equipment suppliers.25
In addition to the implicit pricing approach discussed earlier, in 2016, Unilever introduced an internal carbon price of $27 per metric ton to evaluate the business case for significant capital expenditure projects, (e.g., new manufacturing capacity, plants, and equipment). Unilever is now considering whether to also adopt a carbon fee approach to further drive down emissions and evaluate future investments in low-carbon options.26 Since 2017, Unilever has piloted an approach similar to that of a carbon fee: The company reduces the capital expenditure budgets of a business unit determined by that unit’s carbon emissions.27 The “carbon fee” in the form of those reductions has created a Clean Energy Fund for 2017 to invest in installing renewable energy sources on Unilever’s manufacturing sites.28
THE BUSINESS CASE FOR CORPORATE CARBON PRICINGCompanies use internal carbon pricing as a strategic risk management tool to inform decision-making and prepare for a carbon-constrained future. Many compa-nies examined for this report have some form of an internal carbon price and most consider it an integral part of their corporate strategy for addressing climate change risks. This section summarizes the key drivers for adopting an internal carbon price.
GREENHOUSE GAS REDUCTION
Carbon pricing is one of many strategies global compa-nies are adopting to reduce greenhouse gas emissions in their operations and supply chains. More than 290 companies have committed to setting “science-based targets” designed to be in line with limiting warming to 2 degrees Celsius below pre-industrial levels. Over 100 companies have signed on to RE100 committing to purchase 100 percent renewable energy for their global
electricity consumption. Almost half of those companies that have committed to these ambitious greenhouse gas reduction targets already have an internal carbon price or plan to adopt one by 2018.29
Internally pricing carbon monetizes greenhouse gas emissions in a way that can help shift investments to low-carbon options, build internal awareness, align incen-tives, and promote greater stakeholder buy-in around meeting the company’s larger sustainability goals. For example, Unilever has adopted internal carbon pricing to help meet its commitment under RE100 to source 100 percent renewable electricity by 2030 and become “carbon positive” by 2030, directly supporting generation of more renewable energy than Unilever consumes and providing the surplus to markets and communities where it operates.30 The revenue from Microsoft’s carbon fee is invested in energy efficiency projects, renewable energy purchases, and carbon offset projects that help meet its
Center for Climate and Energy Solutions6
goal to achieve carbon neutrality in its operations and supply chain.31 Disney’s carbon fee is helping meet its goal of 50 percent greenhouse gas emissions reduction from 2012 levels by 2020, and ultimately will help achieve net zero direct greenhouse gas emissions at its offices and retail complexes, including theme parks and cruise lines.32 The revenue from its fee is used to purchase high-quality forest credits to offset the emissions gener-ated by scope 1 and 2 activities across its operations.33 M&M recently adopted an internal carbon fee to help meet its goal of reducing greenhouse gas emissions 25 percent by 2019. The carbon fee also aligns with its long-term carbon neutrality goal. As a part of the company’s “promise cycle,” the carbon fee will be revised every three years, in line with M&M’s greenhouse gas goal-setting timeline. Novartis International AG (Novartis), the global healthcare company, applies a shadow price of $100 per metric ton to identify low-carbon projects, such as wind and solar electricity procurement, that most cost-effec-tively meet its absolute greenhouse gas reduction goals of 30 percent by 2020 and 50 percent by 2030, compared with 2010 levels.34 Building an internal carbon price into its investment decisions also helps Novartis identify and shift investments to low-carbon projects.35
CARBON REGULATIONS
According to the World Bank, 42 national jurisdictions and more than 20 cities, states, and regions have a price on carbon either through an emissions trading system or a carbon tax—covering more than 14 percent of global greenhouse gas emissions. Several new carbon pricing systems, including China’s ETS, are expected to increase that to 20–25 percent of global carbon
emissions.36 Over half of the 180 countries that signed the Paris Agreement—accounting for 58 percent of global greenhouse gas emissions—have committed to using carbon pricing instruments to implement their Nationally Determined Contributions (NDCs). The Paris Agreement, the Kigali Amendment to the Montreal Protocol, and the International Civil Aviation Organization’s carbon offsetting and reduction system signal companies to incorporate the business risks of potential future carbon pricing regulations in their strategy and investment decision-making.
Almost every company examined for this report cited preparing for future policies or responding to existing carbon regulations as one of the main reasons for implementing an internal carbon price. This was particularly true for companies that have adopted shadow pricing. Some companies in the oil and gas and minerals and metals sectors consider potential carbon regulations as a core climate-related business risk to their operations and value chains. They are using a shadow price to stay competitive by diversifying their portfolio with low-carbon products and services and screening for risks associated with future carbon regulations. For example, BP anticipates that approximately two-thirds of its direct emissions will be in countries subject to carbon pricing policies by 2020.37 To prepare for a potentially higher carbon price in the coming years, BP uses an internal shadow price of $40 per metric ton to achieve a balanced portfolio and flexible investment strategy. Box 1 provides examples of how some companies have used voluntary emissions trading programs to prepare for cap-and-trade and regulatory requirements expected in their jurisdictions.
The Business of Pricing Carbon 7
INVESTOR AND SHAREHOLDER RELATIONS
Companies are under increasing pressure from key stake-holders, including investors, to not only measure and report their carbon footprint but also to demonstrate how climate-related risks and opportunities are identified, assessed, and adequately managed. An internal carbon price can communicate to investors how a company is managing the shift from high-carbon to low-carbon activities.
A 2017 Investor Climate Compass report found seven out of 10 oil and gas companies, including BP, Conoco Phillips, Eni, Shell, Statoil, Suncor, and Total, have published pathways to a 2-degree Celsius/450 ppm scenario (i.e. keeping global average temperatures well below 2 C from pre-industrial levels by limiting concentration of greenhouse gases to around 450 parts per million—the maximum level suggested by scientists to avoid the most serious impacts of climate change) in response to investor expectations and identified internal carbon pricing as a key input for assessing the robustness of their portfolios to the 2 C transition.42 Other energy companies such as Exxon Mobil, Occidental, and PPL are also experiencing increased pressure from shareholders to disclose climate-related financial risks. In a recent shareholder resolution, 62 percent of its investors voted to instruct Exxon Mobil to publish a report beginning in 2018 analyzing the impacts of climate-related financial risks to its business, including a scenario analysis that
included government carbon regulations consistent with the 2 C target. The company already uses a “proxy cost of carbon,” which in some geographies may approach $80 per metric ton by 2040, to guide the company’s business strategies and investment decisions in response to future carbon regulations.43
In June 2017, the Financial Stability Board’s Task Force on Climate-related Financial Disclosures, an industry-led group chaired by Michael Bloomberg, released its final recommendations.44 It recommended large, publicly traded companies quantify the financial implications of climate-related risks under a transition to a 2 C scenario. The task force also highlighted the use of internal carbon pricing as a key metric when measuring the impact of the transition risks.45 Responding to the task force’s guidance, the Brazilian multinational mining company, Vale has started to pilot shadow pricing in its Brazilian operations when making large capital investments.46
Calls for improved climate risk management and disclosure are coming from large investment houses, asset management companies, and financial regulators. In its 2016 climate change report, BlackRock, the world’s largest asset manager with $5 trillion under manage-ment, identified climate change as a material risk and recommended that asset owners make decisions on future investments and credit implications by quantifying the carbon risks embedded in their current and future
BOX 1: Internal Trading SystemsIn 2000, Shell piloted STEPs (Shell Tradable Emissions Permit System), an internal carbon trading system, to help meet its greenhouse gas reduction target and prepare for the EU Emissions Trading Scheme (ETS) that started in 2005. To prepare for California’s cap-and-trade program launched in 2011, seven companies in the energy sector, including Chevron, NRG Energy, PG&E, and Southern California Edison Company, participated in emissions trading simulations that provided important information on design elements useful for the companies. The results served as input to the California Air Resources Board responsible for the cap-and-trade program’s design and features.38
In anticipation of a 2020 national carbon pricing mechanism, a group of 39 multi-sector Brazilian companies, including Braskem, Banco do Brasil, CPFL Energia, Itaú Unibanco, Telefónica, and Vale, have participated in a volun-tary ETS simulation to gain experience and develop proposals for a policy design to cost-effectively reduce Brazil’s greenhouse gas emissions. The simulation exercise is conducted in partnership with CEBDS (local partner of the World Business Council for Sustainable Development) and the Center for Sustainability Studies’ Business For Climate Platform at the Sao Paulo School of Business Administration.39 The exercise has helped participating companies improve their emissions inventory, understand marginal abatement costs of emission reductions, build capacity to reduce their greenhouse gas emissions, and increase internal awareness about the role of carbon pricing.40 Some of these companies, including CPFL Energia, Itaú Unibanco, and Vale, have now adopted internal carbon pricing strate-
gies to prepare for this policy, and Telefónica plans to use an internal carbon price by 2018.41
Center for Climate and Energy Solutions8
portfolios.47 In March 2017, BlackRock publicly encour-aged companies to consider using the task force recom-mendations in their reporting framework.48 Similarly, financial regulators around the world are encouraging identifying climate as a risk and assessing how these risks are managed. In June 2017, the Bank of England announced it would initiate a review of climate-related risks in the UK banking sector to foster an orderly market transition to a low-carbon economy.49
Recognizing the increasing interest in climate risk management and disclosure, BHP, for example, released its Climate Change: Portfolio Analysis report in 2015, describing its approach to scenario analysis and disclosing a range of internal carbon prices used to inform decision-making in a carbon constrained future. Following the ratification of the Paris Agreement, and the positive reception of the report from industry, inves-tors, and the NGO community, BHP issued an update, Climate Change: Portfolio Analysis—Views after Paris in 2016.50 (See BHP’s case study for more detail.)
RESILIENT SUPPLY CHAINS
The physical impacts of climate change can pose signifi-cant costs on companies and affect the availability of critical raw materials throughout supply and distribution chains.51 Assessing the potential financial implications of these impacts by means of an internal carbon price can help a company assess which risks are most significant. For Novartis, climate change and extreme weather events can significantly disrupt supply chains and damage facilities. Climate change can also result in increased prices for its key inputs, including energy and water. Mitigating these risks is one of the motivations behind the company’s adoption of a shadow price. The tool has helped Novartis drive investments toward energy efficiency, which reduces its exposure to energy supply disruptions.52
COMPETITIVENESS
Internal carbon pricing can shift investment to low-carbon options, spur investment in innovation, and screen for new market opportunities that can increase a company’s competitiveness.53 For M&M, one of the more tangible benefits of its internal carbon fee program has been a faster transition to energy-efficient LED lighting for its vehicles and manufacturing facilities. Along with saving energy and reducing emissions from company operations, M&M is aiming to establish a competitive edge over other automakers in India that have been slower to equip vehicles with LED lighting systems. Its carbon fee program has also spurred innovation resulting in an expansion of low-carbon businesses, including electric and hybrid vehicles, solar energy systems, drip irrigation, and solar-powered generators.54
CORPORATE SUSTAINABILITY
Companies using internal carbon pricing programs are also seeking to demonstrate leadership on sustainability, an issue that matters to their employees, consumers, and communities. By translating climate impacts into a business language, carbon pricing makes sustainability more visible for the company. Microsoft finds that its carbon fee has embedded a culture of sustainability leadership and accountability among its employees, and has had a positive impact on communities through the company’s investments in reforestation, conservation, clean water, and clean energy.55 Disney’s internal carbon fee has engendered a sense of ownership for employees to develop innovative ways to reduce their carbon foot-print, and its investment in high-quality carbon offsets promotes carbon sequestration and protects biodiversity in critical habitats.56
The Business of Pricing Carbon 9
EVALUATING CORPORATE CARBON PRICING APPROACHESOur research suggests there is no one best approach to evaluating climate risks, including how and whether to use a price on carbon emissions. Companies analyzed for this report selected an approach based on their key objectives such as: creating a dedicated revenue stream that could be used to meet greenhouse gas reduction goals, identifying and reducing potential impacts on operations and the supply chain, preparing for future carbon regulations, understanding carbon costs, and responding to stakeholder demands for increased climate-risk disclosure and risk mitigation. Companies also selected an approach based on the trade-offs offered by each. For example, compared to an internal carbon fee, shadow pricing may be easier to implement and justify to senior management. On the other hand, a shadow price does not generate a steady revenue stream that can be used to fund projects or elicit the same broad employee engagement provided by an actual fee charged across business units.
CARBON FEE: BENEFITS, CHALLENGES, AND COMPANY EXAMPLES
Benefits. Putting a financial metric (a dollar value) on carbon emissions builds a common language and makes climate considerations readily understandable across operations and with finance teams. Creating a fund or a revenue stream also helps pay for projects that can reduce a company’s carbon footprint. Requiring a business unit to contribute an allocated fee based on its greenhouse gas emissions directly affects the unit’s bottom line and may incentivize employees to find creative ways to reduce emissions. In the long-run, it can lead to behavior and cultural changes within the company and better prepare it for a carbon-constrained world.
Challenges. A carbon fee may not always be the right tool for meeting a company’s climate objectives. In our interviews, some companies noted they already had initiatives and programs to fund and support renewable energy and energy efficiency without using an internal carbon price. Other financial mechanisms, such as green bonds, may provide larger pools of money for low-carbon investments. (Box 2). Other companies noted a general lack of understanding and clarity about how carbon pricing programs are developed, administered, and implemented. They also questioned how to gain internal stakeholder buy-in. Some companies were concerned that
a carbon fee would be perceived as a punitive measure, particularly by those business units responsible for the greatest amount of greenhouse gas emissions. The challenge of articulating a strong business case for an internal carbon fee was also viewed as a barrier. A carbon fee may also not be feasible in certain sectors, such as electric power. Because electricity is a highly regulated commodity where the emphasis is keeping costs lower for consumers, electric power companies must get approval for cost increases.
Company Examples. Companies have taken different approaches to developing and implementing a carbon fee. In 2012, Microsoft implemented an internal carbon fee to help reach its carbon neutrality commitment and advance its renewable energy goals. The fee is applied on the scope 1 and scope 2 emissions from the company’s 12 business units, including its global data centers, as well as on a part of its scope 3 emissions such as employee air travel. Using the funds collected by the carbon fee, Microsoft has reduced emissions by 9.5 million metric tons of carbon dioxide equivalent (CO2e), purchased more than 14 billion kilowatt-hours (kWh) of green power, and achieved more than $10 million per year in energy cost savings.57 The carbon fee is calculated by dividing the amount of investment needed to meet the company’s carbon neutral commitment by its annual projected greenhouse gas emissions. In recent years, the carbon fee has ranged between $5–$10 per metric ton.58
The Mahindra Group was the first company in India to launch an internal carbon fee on its automotive and farm equipment company, Mahindra and Mahindra Ltd (M&M). The internal carbon fee of $10 per metric ton has been used to help achieve its goal of reducing green-house gas emissions 25 percent by 2019 from 2015–2016 levels.59 The company says the fee has helped accelerate its transition to clean energy sources, invest in energy efficiency, and reduce energy and operating costs.60 (See M&M’s case study for more detail.)
In 2013, Disney adopted a carbon fee ranging from $10–$20 per metric ton applied across all its business units globally. The revenue collected from each busi-ness unit goes into a dedicated fund called the Disney Climate Solutions Fund used to purchase high-quality forest carbon credits to offset its scope 1 and scope 2 emissions.61 Because the carbon fee is charged to each business unit in proportion to its greenhouse gas emis-sions, Disney’s employees are incentivized to reduce their
Center for Climate and Energy Solutions10
carbon footprint and their direct operating costs.62 Since the inception of the carbon fee, Disney has invested $56 million in certified forest carbon projects, resulting in forest conservation, improved forest management, and reforestation globally.63
For the global re-insurer Swiss Re, business travel consti-tutes its largest emissions source and consequently, this is where the company focuses its carbon pricing efforts. Since 2014, Swiss Re has applied an internal carbon fee to business air travel with the expressed purpose of raising awareness and reducing unnecessary business trips. Using the “polluter pays” principle, it allocates the cost of purchasing “voluntary emissions reductions” to each business unit based on their respective share of air travel. Compared to an earlier practice of simply paying for offsets from the central finance group, applying the fee to each business unit has made the cost and carbon footprint of air travel more visible to all employees, incentivizing them to avoid unnecessary flights.64
Unilever’s ice-cream brand, Ben and Jerry’s, uses an internal carbon fee to reduce greenhouse gas emissions associated with its operations and supply chain. Funds collected are invested in developing clean technolo-gies, purchasing solar panels for its factories, installing electric charging vehicle stations at facilities, and improving energy efficiency associated with the produc-tion of materials used in its ice cream. During its first year of application (2015–2016), the company used an internal carbon fee of $10 per metric ton. The company uses a lifecycle analysis approach (“cone-to-cow”) that calculates its carbon footprint across the entire value chain—including emissions and energy used in dairy production, lights and freezers at local grocery stores, and landfill waste.65 The lifecycle analysis revealed that 52 percent of the company’s emissions came from the growth and production of its ice cream ingredients. Ben & Jerry’s now works with its suppliers, largely dairy farms, to mitigate methane emissions associated with dairy production.66 The company uses carbon fee revenues to help farmers invest in clean technologies that enhance the value and use of manure on the farm. One technology diverts 50 percent of methane from lagoons,
cutting 10,000 million metric tons of greenhouse gas emissions over 10 years.67
TD Bank Group has adopted an internal carbon price to meet its commitment under RE100 to source 100 percent renewable electricity for its global operations. The company has also committed to a zero-absolute increase in greenhouse gas emissions, energy, and water use by 2020, relative to a 2015 baseline. In 2016, TD Bank Group applied an internal carbon price of $9 per metric ton on its facilities and global operations. The price is calculated annually based on the cost of purchasing renewable energy credits and carbon offsets and charged back to the business units based on their relative contri-bution to the company’s overall greenhouse gas emis-sions.68 TD Bank Group reports that the internal carbon price has driven innovation, shifted decision making and investment to low-carbon products, and generated real returns for the company’s bottom-line. For example, TD Bank Group has increased financing of low-carbon projects, expanded into new products and services (e.g., lending for small-scale renewables, insurance for hybrid vehicles), and issued a $500 million green bond.69
LVMH is a French multinational luxury goods conglomerate consisting of 70 fashion houses across six sectors including fashion and leather goods, wines and spirits, perfumes and cosmetics, watches and jewelry, and retail. In January 2016, it launched an internal carbon fund to reduce the greenhouse gas emissions associated with production, logistics, and stores’ direct and indirect energy consumption by 25 percent between 2013 and 2020. Each of the houses must contribute $13.50 per metric ton to finance innovative low-carbon projects. The three kinds of projects funded include: procuring energy-efficient equipment, sourcing renewable energy, and investing in R&D to improve understanding and monitoring of energy consumption. In 2016, 28 eligible projects worth $6 million were selected. The projects aim to roll out LED lighting in stores, improve insulation for buildings, monitor consumption virtually in real time, and increase use of renewable energy and waste heat recovery.70
The Business of Pricing Carbon 11
BOX 2: Low-Carbon Financing MechanismsOn-Bill Financing (OBF): On-bill financing is a type of loan made to a customer (homeowner or commercial building owner) to invest in energy efficiency improvements. It is administered either directly by the utility or by an outside administrator (such as a state energy office) along with the utility. OBF programs remove the high upfront costs of efficiency improvements because the customer repays the administering utility or third party over time through a charge on the customer’s utility bills.71 National Grid, for example, has offered OBF for small business U.S. customers since the 1990s. OBF programs can be developed in combination with types of energy efficiency programs that utilities often administer to reduce the cost of energy efficiency adoption.72
Green Pricing Programs: Large energy buyers are participating in green pricing programs (also known as Green Tariffs) offered by some U.S. utilities that allow eligible customers to buy energy from a renewable project directly operated by the utility or by issuing a Renewable Energy Certificate (REC). While some companies have added on-site renewables, it is not always sufficient to meet their electricity needs.73 Through green pricing programs, companies pay a premium to get some or all their electricity from renewable sources from the grid. In turn, customers can get a long-term, fixed-price structure for renewable energy, lowering consumer transaction costs. Most utility green pricing premiums in the United States are in the range of 1¢–2¢ per kWh. Generally, this cost covers any above-market costs of purchasing clean, renewable energy sources.74 Recently, three large retail companies, REI, Starbucks, and Target, subscribed to Green Direct, a green tariff program offered by Washington state’s Puget Sound Energy (PSE). Under the program, the companies will pay a consistent price, even if PSE increases its electricity rates over time for other customers using fossil fuel-based power.75
Special Investment Pools: Companies may also dedicate special pools of capital to low-carbon projects. Green bonds described below can be a part of this investment pool. In 2016, a consortium of leading financial institutions and investors launched the Catalytic Finance Initiative (CFI), directing $8 billion to advance innovative financing structures for investments in clean energy and sustainability.76 Partners of the CFI include Bank of America, HSBC Group, and the International Finance Corporation (IFC), among others. This partnership is a successor to the CFI originally launched by Bank of America in 2014 with a $1 billion commitment to stimulate at least $10 billion in new investment in high-impact clean energy projects by 2022. As part of this initiative, Bank of America announced projects including an $800 million partnership with New York State Green Bank, a $204 million green project bond for wind development in Peru, and a partnership with the Global Alliance for Clean Cookstoves and other commer-cial and development finance institutions to create a $100 million fund to provide clean cooking solutions to millions of households in the developing world. The partnership also supports Bank of America’s commitment under the White House American Business Act on Climate Change to increase the company’s funding from $60 billion to $125 billion in low-carbon financing by 2025.77
Green Bonds: Some companies and banks are financing environmentally friendly projects by issuing “green bonds.” Green bonds act as a vehicle for institutional investors seeking to put their capital in projects that address climate change, and can drive development of low-carbon solutions. Like conventional bonds, green bonds can be issued by a corporate, bank, or government entity. The debt insurance by investors means that the companies do not need to tap into their limited credit lines or cash reserves to fund renewable or energy efficiency projects. A range of govern-ment organizations, including New York’s Metropolitan Transportation Authority, have issued green bonds to unlock private sector investment that supports renewable energy and energy efficiency. Green bonds can also attract socially and environmentally focused investors outside a company’s normal investor base.
In February 2016, Apple issued its first $1.5 billion in green bonds—the largest ever for a U.S. company—to help meet its goal of running 100 percent of its operations on renewable energy. During Apple’s 2016 fiscal year, the company reported that it had allocated an initial $441.5 million in green bonds to finance 16 major projects, includ-ing renewable energy, green buildings, energy efficiency, water efficiency, recycling/material recovery, and safer
Center for Climate and Energy Solutions12
SHADOW PRICING: BENEFITS, CHALLENGES, AND COMPANY EXAMPLES
Benefits. Shadow pricing is the most common form of internal carbon pricing used by companies and offers multiple benefits. A shadow price can help make the business case for investments and R&D in low-carbon options by screening potential investments that would provide a higher rate of return in a carbon-constrained future. Shadow pricing also serves as an important proxy for future carbon regulations. Companies generally set an internal carbon price higher than the current govern-ment pricing levels to “future proof” their businesses against climate-related risks that may be more stringent and result in a higher price on carbon. Shadow pricing can be a particularly helpful risk management tool for companies in the oil and gas, electric power, and metals and mining sectors that have long-lived capital assets and may face the risk of stranded assets and a higher
cost of carbon than today. Companies in the oil and gas and metals and mining sectors analyzed for this report consider shadow prices in line with the $40–$80 per metric ton by 2020 and $50–$100 per metric ton by 2030 recommended by the High-Level Commission on Carbon Prices to stay well below the 2 C target. Box 2 provides a summary of shadow pricing in the electric power sector. Companies in certain sectors already use some form of shadow pricing in their risk assessment and project planning processes, and therefore may find it easier to justify and get internal buy-in for formally using shadow pricing. For example, companies in the electric power sector in the United States already consider an internal carbon price in their Integrated Resource Planning (IRPs) or strategic resource planning. Companies in the oil and gas and metals and mining sectors have inte-grated the price of carbon as an input into companywide risk management processes.
materials. One of the first projects to be funded by the green bonds was Apple’s robotic recycler, Liam, which can disassemble 1.2 million old iPhones annually to recover material for reuse and recycling. Green bonds are also used to finance two renewable energy projects at Apple’s iCloud data centers in Arizona and North Carolina. A combina-tion of 16 such initiatives is projected to save 37 billion kWh of energy and more than 20 million gallons of water, yield 127 megawatts of new renewable energy, divert 6,670 metric tons of waste from landfills, and reduce 191,500 metric tons of annual carbon emissions.78 In June 2017, Apple issued a second bond worth $1 billion to expand its efforts in renewable energy and efficiency, and to use recycled materials to manufacture iPhones and other devices.
Since 2014, Toyota Financial Services, the automaker’s finance and insurance brand in the United States, has is-sued three asset-backed green bonds—the first of their kind in the auto industry. The recent $1.6 billion green bond issued in May 2016 was developed in partnership with Citigroup. The proceeds will be used to fund new retail finance contracts and lease contracts for eight vehicle models in the Toyota and Lexus portfolio that meet specific criteria, including gas-electric hybrid or alternate fuel powertrain, a minimum Environmental Protection Agency (EPA) estimated fuel efficiency, and an EPA-approved smog rating.79
YES Bank, one of India’s largest commercial banks and a leader in responsible banking, has committed to mobi-lizing $5 billion toward climate action. Between 2015 and 2016, the bank issued three green bonds for renewable energy and clean energy projects, expected to annually generate around 2.35 million megawatt-hours of electricity and avoid 2 million metric tons of greenhouse gas emissions.80 In August 2015, the bank issued a first-of-its-kind, emerging-market green bond (Masala bond) $50 million (INR 3.15 billion) in investment by the IFC to address cli-mate change and support India’s ambitious renewable energy goals. The five-year green Masala bond listed on the London Stock Exchange is also the first green bond issued in the offshore rupee markets.81 Proceeds are used to fund renewable energy projects in India. The green Masala bond also advances Yes Bank’s goal to increase lending to small- and medium-sized enterprises by 50 percent by 2020, with a focus on expanding climate finance to women-owned businesses.82
For more information about innovative climate financing, see the C2ES publication Options for Mobilizing Clean Energy Finance.83
The Business of Pricing Carbon 13
Challenges. The theoretical aspect of a shadow price is limiting. Even a “high enough” shadow price may not materially drive long-term financial decisions. One company remarked, “We are not operating in regulated jurisdictions, so a shadow price does not make sense for us. Even if we were to operate in a RGGI market, the carbon prices are so low, they would not meaningfully change [our decision-making].” In the same vein, some companies said applying a shadow price may not be sufficient to shift investments to low-carbon alternatives. In the short run, other factors such as policy and market drivers may influence a company’s decision to switch (or not switch) to low-carbon alternatives. Low natural gas prices, for example, have been a driver for shifting from coal to natural gas. Current low carbon prices across the different regulatory carbon markets and short-term expectations of continued low prices even in regions with strong climate policies discourage companies from using high carbon prices in their scenario planning exercises. For example, three-quarters of the global emissions covered by an explicit carbon regulation have a price below $10 per metric ton, which economists state is not high enough to drive the transition to a low-carbon future. A recent report of the High-Level Commission on Carbon Prices, co-chaired by Joseph Stiglitz and Lord Nicholas Stern, concludes that a regulatory carbon price level of at least $40–$80 per metric ton by 2020 and $50–$100 per metric ton by 2030 will be required to stay well below the 2 C target.84 Most companies set their shadow price using future climate policies and regula-tion as one of the key inputs. Despite momentum in regulatory carbon pricing programs, a lack of clarity and long-term certainty in countries’ climate policies and varying price levels across jurisdictions make it difficult for companies (and investors) to determine the right shadow price or range of prices to make strategic deci-sions. Companies operating in emerging and developing economies without any explicit government carbon policies struggle to determine the range of a shadow price. They often rely on a global average of carbon pricing and/or the other forms of carbon pricing from other national policies such as a coal tax or excise tax on fossil fuels such as petrol and diesel and implicit forms of carbon pricing such as cuts in fossil fuel subsidies.
Despite some of these challenges, companies are using shadow pricing as an input into strategic decision-making and risk management practices. The approach has been most popular in the oil and gas, metals and mining, and electric power sectors that have been
most often subject to existing or future limitations on greenhouse gas emissions. Shadow pricing is also gaining popularity in the financial sector, informing lending and low-carbon investment decisions.
Company Examples. Since 2000, global oil and gas company Royal Dutch Shell (Shell) has generally applied an internal carbon price, called the “GHG Project Screening Value” (PSV), to the total greenhouse gas emissions (scope 1 and scope 2) of all its investments. In addition to using the PSV, currently at $40 per metric ton, Shell also considers greenhouse gas price sensitivi-ties on certain carbon critical projects, (i.e., projects with the largest CO2 emissions profile that are most exposed to carbon pricing regulations). The intent behind Shell’s PSV is not to price forecast; it is a risk management tool that encourages investments in CO2 mitigation technolo-gies in preparation for regulation that will make those investments commercially compelling. From a carbon emissions management perspective, the best points of time for influencing the mitigation options for a project are at its point of development or at the point it needs to be refurbished. Shell states that the mandatory inclusion of a value on carbon in its appraisals focuses manage-ment’s attention on limiting emissions. That, in turn, improves the investment’s robustness to future carbon regulations.85 (See Shell’s case study for more detail.)
BP believes that carbon pricing by governments is the best policy to limit greenhouse gas emissions. It anticipates that approximately two-thirds of its direct emissions will be in countries subject to carbon pricing policies by 2020.86 To prepare for a potentially higher carbon price in the coming years, BP aims to have a balanced and robust portfolio and a flexible investment strategy. Over the next decade, BP plans to reduce the carbon intensity of its upstream portfolio (oil and gas exploration, field development, and production) by shifting investments to natural gas and focusing on quality oil projects such as those in Abu Dhabi, Azerbaijan, and the Gulf of Mexico. Downstream, BP is developing energy-efficient fuels and lubricants. It is also continuing to develop its biofuels and wind businesses.87 BP requires its businesses to use a current, uniform carbon cost of $40 per metric ton for large new projects in industrialized countries. BP also conducts a stress test at a carbon price of $80 per metric ton. The carbon cost, along with energy efficiency, market, and policy consider-ations, encourages investment in low-carbon projects.
BHP, a multinational mining, metals, and petroleum
Center for Climate and Energy Solutions14
company recognizes that future regulatory and policy constraints on carbon could make its carbon-intensive assets less competitive in the long run. The shadow price helps the company make investment decisions and evaluate robustness of its portfolio across all its operations and projects, including project design and equipment selection. The shadow price is informed by a combination of different factors including explicit carbon prices in government regulated emissions trading systems and carbon taxes, as well as implicit carbon prices embedded in climate and energy policies.88 The company’s corporate planning process uses the range of $24–$80 per metric ton to conduct scenario analysis to test the robustness of its portfolio and make investment decisions against government policies, emission reduc-tion targets, and technology developments. The shadow price of $24 per metric ton is used in the company’s central case scenario (i.e. the company’s forecast of what they expect will happen) and the shadow price of $50 per metric ton is used for scenarios consistent with a 2 C world. In addition to scenario analysis, the company also uses a $80 per metric ton to stress tests its portfolio against shock events such as a rapid transition to a 2 C world driven by very ambitious government targets.89 (See BHP’s case study for more detail.)
Since 1998, global metals and mining company Rio Tinto has used a shadow price range in its three climate change scenarios: the Limited Action Scenario where fossil fuels continue to be the dominant energy source; the Regional Differences Scenario where nations focus on domestic concerns and response to adaptation is reactive and local; and the Co-operative Outcomes Scenario which is aligned with the International Energy Agency’s (IEA) 2 C outcome, and in which national policies are implemented faster than current ambition along with a high growth of renewables across all regions.90 The scenario analyses help Rio Tinto make strategic decisions on exploration activity, evaluate new capital investment, assess future product demand and pricing, and test the robustness of its portfolio (e.g., ore reserves) against the physical impacts and regulatory risks of climate change.91 The price range is informed by input from internal and external technical experts, short-term market data, alter-native price forecasts and scenarios, and potential cost impacts and business disruption from potential carbon or other government regulations that impose an implicit price on carbon (e.g., renewable energy targets).92 Based on the scenario analyses, Rio Tinto is expanding in non-carbon minerals such as aluminum, which is used to
make lighter, more fuel-efficient vehicles. Rio Tinto has also increased the use of copper for insulation in build-ings and energy-efficient electrical appliances.93
General Motors (GM) uses a shadow price of $3–$11 per metric ton to drive various capital expenditure deci-sions that would result in a reduction of the company’s direct (scope 1) and indirect (scope 2) emissions from its global business operations. GM’s shadow price range reflects regionally appropriate pricing, for example, under the EU ETS in which the company purchases allowances at $6.19 per metric ton.94 In the United States, GM uses references such as California’s cap-and-trade and the RGGI program. The company anticipates applying a shadow price in its Chinese operations, with the establishment of the Chinese ETS scheme in 2017 and expanding shadow pricing in Canada in anticipation of the pan-Canadian carbon tax.95
In 2015, Novartis began using a shadow price of $100 per metric ton, in line with the World Bank’s estimated cost of climate change to society. Based on the savings determined by the company’s shadow price, the company has identified opportunities for contracting solar and wind electricity to help meet its absolute greenhouse gas reduction goal of 30 percent by 2020 and 50 percent by 2030 from 2010 levels. In 2016, a cross-divisional team of energy managers and experts from Novartis Business Services-Real Estate and Facility Services selected major facility and infrastructure projects that would help achieve the company’s 2020 greenhouse gas reduction goals.96 Novartis has included a shadow price in its invest-ment decisions to: identify projects that most cost-effec-tively reduce greenhouse gas emissions, drive investment toward energy efficiency and renewable energy projects, better anticipate future carbon pricing regulations, reduce compliance costs for several of its production sites covered by existing carbon pricing regulations such as the EU ETS, and build resilience against the impacts of climate change and extreme weather on its facilities and on the price and availability of key energy and water inputs.97
Royal DSM has implemented a uniform shadow price of $55.84 per metric ton. The price includes the financial impact of greenhouse gas emissions (scope 1 and 2) in the valuations of large capital expenditure projects for 2016 and onwards. The company trades in the EU ETS but uses a price higher than the current regulatory carbon price. The higher price drives decisions toward low-carbon options and helps Royal DSM “future proof”
The Business of Pricing Carbon 15
its business against carbon regulations that may affect its operations and supply chain. The shadow price aligns with Royal DSM’s broader sustainability goals of reducing the carbon footprint of its operations and new products, furthering the company’s climate and energy goals of 45 percent reduction in greenhouse gas emis-sions by 2025, and becoming 100 percent renewable in the long-run. The shadow price has engaged its finance department, sparked innovative thinking for its engi-neers and other employees, and embedded carbon costs into decision-making.98
T. Garanti Bankasi A.S. (Garanti Bank) is Turkey’s second largest private bank and the first bank in Turkey to commit to an internal carbon price. Garanti Bank views climate change as a strategic concern to be inte-grated across its business strategy and decision-making mechanisms for project financing.99 Garanti Bank applies a shadow price in the form of a fixed “forestation” fee to reflect the cost of carbon in financing carbon-intensive projects. The bank also uses a range of shadow prices in the financial assessment of all its fossil-fuel-based and renewable energy investments and in capacity building projects. As one of the largest lenders of renewable energy projects in Turkey, the shadow price has helped prioritize investments in renewable over carbon-intensive energy projects. In 2016, its cumulative renewable energy financing exceeded $4.7 billion—a $1 billion increase
from 2014.100 If the bank lends to projects in jurisdic-tions with an emissions trading scheme (both voluntary and regulatory) or a carbon tax, Garanti Bank uses the prevailing carbon price to evaluate those projects. In jurisdictions without any carbon regulation, the bank applies the shadow price based on market and policy drivers, reviewed and updated regularly by the bank’s sustainability team.101
Groupe ADP is a French airport design, construction, and operation company managing directly or indirectly 23 airports including Paris-Charles de Gaulle, Paris-Orly, and Paris-Le Bourget. In 2016, the group reduced its CO2 emissions per passenger by 63 percent compared with 2009 levels at those Paris airports. The group is devel-oping strategies to meet its updated target of reducing CO2 emissions to 65 percent per passenger by 2020 and to advance its long-term carbon neutrality goal.102 At the start of 2017, the group implemented a shadow price on the three Paris airports to improve operational efficiency and steer decision-making toward low-carbon alterna-tives. The group has increased its share of renewable energy for heating its buildings and installed energy-efficient lighting for its landing strips. The group has decided to start with a relatively low shadow price as a first step toward building internal awareness and gaining stakeholder buy-in.103
BOX 3: Internal Carbon Pricing in the Electric Power SectorThe electric power sector is a high-emitting, energy-intensive sector with electricity generation contributing around 25 percent of annual global greenhouse gas emissions.104 This sector is traditionally reliant on fossil-fuel and non-renew-able resources with long-lived assets and investment horizons (20–30 years or longer), and is affected directly by existing and future carbon regulations. As such, this sector has been at the forefront of using internal carbon pricing as a risk management tool to inform business decisions and resource planning.105 In recent years, the imperative to use internal carbon pricing in the electric power sector has accelerated. Sixty three percent of the companies in the utility sector that reported to the CDP indicated they are using internal carbon pricing and 18 percent plan to do so by 2018.106
While mandatory carbon pricing policies cover some but not all electric power companies, many have internal carbon pricing in place to account for the future cost of carbon when making long-term investment decisions. Our research shows that most electric power companies embed an internal carbon price or range of carbon prices as a part of their forward-looking risk assessments. They also consider carbon emissions as one of the biggest risks to their portfolio. The increase in electrification, issues of competitiveness, the threat of stranded assets, issues of reliability, the increase in large corporate electricity customers for renewable energy, and existing and future carbon regulations have pushed the electric power companies to incorporate internal carbon pricing into their business models. These companies also realize the opportunity to explore new markets for cleaner sources of generation (e.g., switching to renewables, nuclear, and investing in carbon capture use and storage technologies).107
Center for Climate and Energy Solutions16
The type and level of carbon price can vary from company to company. Some companies use “shadow” pricing to make strategic decisions about resource deployment, prepare for long-term regulatory risks, make investment deci-sions, respond to consumer demand for resource diversity, and explore new markets and services. While a shadow price can be an economically efficient way to mitigate future climate risks, some companies noted that it is not a suffi-cient signal to deploy large-scale clean energy infrastructure and drive the level of transformation required to support sector decarbonization efforts. Some companies pointed to other policy and market signals, including continuation of renewable energy subsidies, renewable and energy efficiency state mandates, falling capital costs of renewable energy, and lower natural gas prices, that influence the transition to clean energy and resilient infrastructure. An in-ternal carbon fee is not feasible for this sector, since electricity is highly regulated. Electric power companies tend to focus on minimizing consumer costs, and an internal carbon fee applied by an electric power company would not help maintain its cost competitiveness.
Some state public utility commissions (PUCs) require vertically regulated utilities to incorporate the environmental damages of carbon emissions in their integrated resource plans (IRPs). According to David Young at the Electric Power Research Institute, “Internal carbon pricing is an explicit part of the equation for long-term investment decision-mak-ing at many utilities.”108 Beyond the IRP requirements, some electric power companies have started disclosing their internal carbon pricing in response to a broader push from investors and stakeholders through platforms such as Task Force on Climate-related Financial Disclosures and the CDP (formerly, the Carbon Disclosure Project). Even though EPA’s Clean Power Plan rule was stayed by the U.S. Supreme Court in 2016, almost all U.S. electric power companies analyzed for this report continue to incorporate an internal cost of carbon when making long-term investment deci-sions, and continue to plan for a range of carbon regulations in the future.
Duke Energy recognizes the impact of a potential cost on carbon in the form of a carbon tax or a cap-and-trade system on its core electricity business. The company uses a range of carbon prices in its IRP process and runs sce-narios with and without a carbon price to make investment decisions such as whether to upgrade to new emission controls and invest in new generation resource options.109 In the company’s November 2015 IRP, Duke Energy Indi-ana used $17 per metric ton in 2020 under a carbon tax scenario, increasing to $39 per metric ton in 2035. It also ran a sensitivity analysis of $78 per metric ton by 2035 under a higher carbon tax scenario.110
Exelon Corporation, which has one of the lowest carbon emission profiles in the sector (105 pounds per megawatt hour), uses a shadow price to reflect various potential policy scenarios and guide investments in new and existing electric generation projects through 2040. In its 2017 CDP report, Exelon said, “We identify and regularly review key market drivers, including potential regulatory or policy influences such as a price on carbon, and use them in our ongoing analysis to capture a range of plausible future outcomes and develop our overall strategy. Regulation of car-bon is one of many considerations in our planning models, and results are weighed with other issues that may impact market conditions…”111 For assets covered by regional carbon markets, including California’s cap-and-trade program, the RGGI emissions trading program, and Alberta’s carbon tax, the shadow price is determined by the prevailing and forecasted carbon price, along with other variables mentioned above.112 Exelon reports that the use of shadow pricing for carbon emissions, coupled with its inherently low-carbon generation portfolio comprised of nearly 60 percent nuclear and more than 11 percent renewables, has helped create a portfolio that it finds to be balanced and resilient to climate-related regulatory risks.
Detroit-based utility DTE Energy’s future scenarios use a shadow price that assumes future carbon regulations. This scenario guides the company on short-term decisions, such as whether to switch from coal to natural gas, as well as long-run investment decisions, such as whether to retire fossil-fuel powered coal plants and replace them with more renewable energy and nuclear plants. According to DTE Energy, “We wouldn’t be doing our due diligence if we were not considering a long-term cost of carbon in our planning models. It is a part of how we do our business and stra-tegic planning.”113 In May 2017, DTE Energy announced an aggressive goal to reduce the company’s greenhouse gas emissions by more than 80 percent from 2005 levels by 2050.114
The Business of Pricing Carbon 17
Integrated power company NRG Energy has identified carbon emissions as one of the biggest risks to its portfolio. The company uses internal carbon pricing models in its scenario analysis as a part of its “prudent” financial risk as-sessment and its long-term decarbonization strategy. NRG Energy has adopted a wide range of carbon prices that are determined by a combination of the company’s exposure to current and potential carbon pricing regulations and the price of oil, natural gas, and other commodities.115 The range offers an ongoing assessment of trade-offs and market opportunities for NRG’s competitive generation portfolio. In 2016, the company expanded its clean energy portfolio and brought online the Petra Nova Project, the largest carbon capture project in the world at an existing power plant. NRG Energy is also the first U.S.-based power company to establish an approved science-based carbon reduction target, committing to a 50 percent reduction of absolute emissions by 2030, and a 90 percent reduction of absolute emissions by 2050 from a 2014 baseline (covering scopes 1, 2, and 3). Targets covering scope 3 emissions are related to employee commuting and business travel.116
National Grid, an international electricity and gas transmission and distribution company, has used a shadow price to help it make major investment decisions across its operations in the United Kingdom and northeastern United States. In 2016, National Grid UK applied a shadow price of $86 per metric ton on its non-traded carbon emissions, aligned with the government’s social cost of carbon.117 National Grid UK started to use the shadow price to fully account for the lifetime carbon impact of its projects, and make investments in assets and technologies that reduce emissions from its electricity and gas transmission business.118 For example, the company applied the shadow price to guide investments in deploying technologies to detect and reduce leakage of sulfur hexafluoride (SF6) and try an alternative compound. SF6 is a highly effective insulating gas used in high-voltage electrical switchgear, but it has a very high global warming potential. Accounting for the cost of carbon in its investment decisions has helped reduce the company’s carbon footprint, costs, and future risk, increase the energy efficiency of its buildings, and develop low-carbon alternatives.119 In the United States, National Grid has applied an internal price on carbon to reduce emis-sions associated with its vehicle fleet. The company adds a carbon price to the calculated lifetime vehicle emissions (including the fuel price) to invest in the most cost-effective, clean vehicle fleets.120
Engie, a French multinational electric utility company, has adopted region-specific internal carbon prices since 2015 as an input to its strategic analysis of project valuation and investment decisions. All new projects require a mandatory sensitivity analysis based on the internal carbon price. By adopting the internal carbon price, Engie has stopped all new developments of coal power plants and is progressively exiting from its existing coal generation ac-tivities. For example, by the end of 2015, Engie reduced coal capacities by more than 50 percent by selling or closing several coal power plants in Australia, India, the United Kingdom, and the United States.121 Engie also shifted invest-ments to clean energy projects and increased development in low-carbon solutions. In 2015, the company commis-sioned 2.4 gigawatts of renewable energy capacity, increasing its renewable energy electricity production capacity
60 percent from 2009 levels.122
Carbon pricing approaches can be complementary and not mutually exclusive. Some companies take a hybrid approach—instituting a carbon fee to help meet greenhouse gas reduction goals and using a shadow price to inform decisions about long-term asset investments, procurement decisions, or research and development expenditures. While these approaches are used across a range of sectors, our research suggests that some sectors prefer one approach over the other. For example, a carbon fee model is more popular with companies
in the consumer goods, manufacturing and construc-tion, and information and communication technology sectors, while shadow pricing has largely been used by oil and gas, metals and mining, and electric power companies. Some companies in the financial sector are starting to adopt shadow pricing as a complement to other Environmental Social Governance (ESG) tools and metrics used for making project lending and investment decisions. Table 1 compares the characteristics of a carbon fee, shadow price, and implicit carbon pricing.
Center for Climate and Energy Solutions18
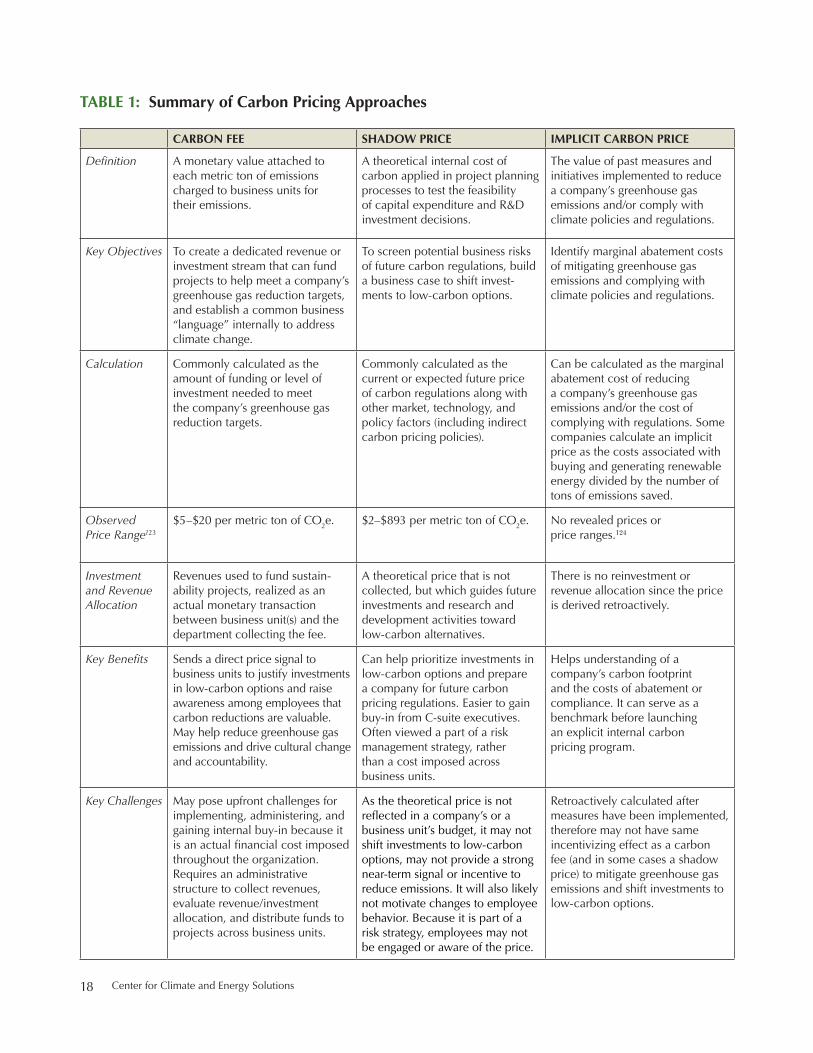
TABLE 1: Summary of Carbon Pricing Approaches
CARBON FEE SHADOW PRICE IMPLICIT CARBON PRICE
Definition A monetary value attached to each metric ton of emissions charged to business units for their emissions.
A theoretical internal cost of carbon applied in project planning processes to test the feasibility of capital expenditure and R&D investment decisions.
The value of past measures and initiatives implemented to reduce a company’s greenhouse gas emissions and/or comply with climate policies and regulations.
Key Objectives To create a dedicated revenue or investment stream that can fund projects to help meet a company’s greenhouse gas reduction targets, and establish a common business “language” internally to address climate change.
To screen potential business risks of future carbon regulations, build a business case to shift invest-ments to low-carbon options.
Identify marginal abatement costs of mitigating greenhouse gas emissions and complying with climate policies and regulations.
Calculation Commonly calculated as the amount of funding or level of investment needed to meet the company’s greenhouse gas reduction targets.
Commonly calculated as the current or expected future price of carbon regulations along with other market, technology, and policy factors (including indirect carbon pricing policies).
Can be calculated as the marginal abatement cost of reducing a company’s greenhouse gas emissions and/or the cost of complying with regulations. Some companies calculate an implicit price as the costs associated with buying and generating renewable energy divided by the number of tons of emissions saved.
Observed Price Range123
$5–$20 per metric ton of CO2e. $2–$893 per metric ton of CO2e. No revealed prices or price ranges.124
Investment and Revenue Allocation
Revenues used to fund sustain-ability projects, realized as an actual monetary transaction between business unit(s) and the department collecting the fee.
A theoretical price that is not collected, but which guides future investments and research and development activities toward low-carbon alternatives.
There is no reinvestment or revenue allocation since the price is derived retroactively.
Key Benefits Sends a direct price signal to business units to justify investments in low-carbon options and raise awareness among employees that carbon reductions are valuable. May help reduce greenhouse gas emissions and drive cultural change and accountability.
Can help prioritize investments in low-carbon options and prepare a company for future carbon pricing regulations. Easier to gain buy-in from C-suite executives. Often viewed a part of a risk management strategy, rather than a cost imposed across business units.
Helps understanding of a company’s carbon footprint and the costs of abatement or compliance. It can serve as a benchmark before launching an explicit internal carbon pricing program.
Key Challenges May pose upfront challenges for implementing, administering, and gaining internal buy-in because it is an actual financial cost imposed throughout the organization. Requires an administrative structure to collect revenues, evaluate revenue/investment allocation, and distribute funds to projects across business units.
As the theoretical price is not reflected in a company’s or a business unit’s budget, it may not shift investments to low-carbon options, may not provide a strong near-term signal or incentive to reduce emissions. It will also likely not motivate changes to employee behavior. Because it is part of a risk strategy, employees may not be engaged or aware of the price.
Retroactively calculated after measures have been implemented, therefore may not have same incentivizing effect as a carbon fee (and in some cases a shadow price) to mitigate greenhouse gas emissions and shift investments to low-carbon options.
The Business of Pricing Carbon 19
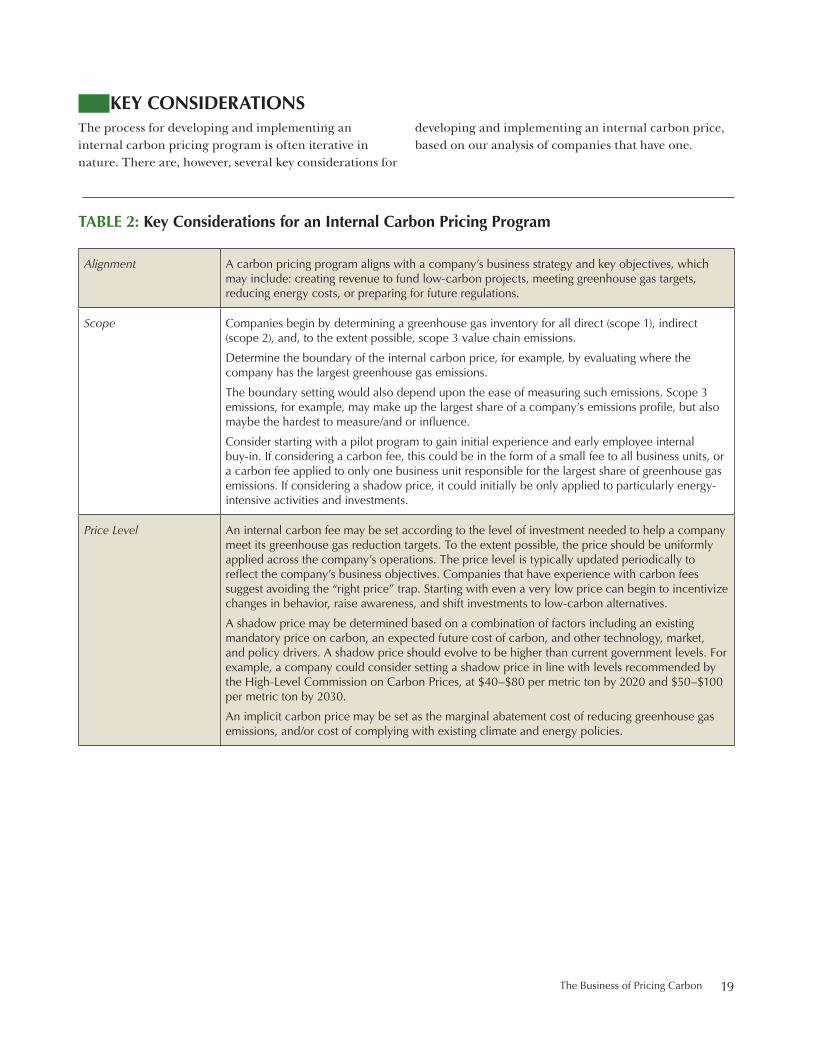
TABLE 2: Key Considerations for an Internal Carbon Pricing Program
Alignment A carbon pricing program aligns with a company’s business strategy and key objectives, which may include: creating revenue to fund low-carbon projects, meeting greenhouse gas targets, reducing energy costs, or preparing for future regulations.
Scope Companies begin by determining a greenhouse gas inventory for all direct (scope 1), indirect (scope 2), and, to the extent possible, scope 3 value chain emissions.
Determine the boundary of the internal carbon price, for example, by evaluating where the company has the largest greenhouse gas emissions.
The boundary setting would also depend upon the ease of measuring such emissions. Scope 3 emissions, for example, may make up the largest share of a company’s emissions profile, but also maybe the hardest to measure/and or influence.
Consider starting with a pilot program to gain initial experience and early employee internal buy-in. If considering a carbon fee, this could be in the form of a small fee to all business units, or a carbon fee applied to only one business unit responsible for the largest share of greenhouse gas emissions. If considering a shadow price, it could initially be only applied to particularly energy-intensive activities and investments.
Price Level An internal carbon fee may be set according to the level of investment needed to help a company meet its greenhouse gas reduction targets. To the extent possible, the price should be uniformly applied across the company’s operations. The price level is typically updated periodically to reflect the company’s business objectives. Companies that have experience with carbon fees suggest avoiding the “right price” trap. Starting with even a very low price can begin to incentivize changes in behavior, raise awareness, and shift investments to low-carbon alternatives.
A shadow price may be determined based on a combination of factors including an existing mandatory price on carbon, an expected future cost of carbon, and other technology, market, and policy drivers. A shadow price should evolve to be higher than current government levels. For example, a company could consider setting a shadow price in line with levels recommended by the High-Level Commission on Carbon Prices, at $40–$80 per metric ton by 2020 and $50–$100 per metric ton by 2030.
An implicit carbon price may be set as the marginal abatement cost of reducing greenhouse gas emissions, and/or cost of complying with existing climate and energy policies.
KEY CONSIDERATIONS The process for developing and implementing an internal carbon pricing program is often iterative in nature. There are, however, several key considerations for
developing and implementing an internal carbon price, based on our analysis of companies that have one.
Center for Climate and Energy Solutions20
Revenue/ Investment Allocation (applicable for an internal carbon fee only)
Each company may have different criteria for allocating and re-investing the resulting revenue. Decisions may be based strictly on financial considerations, or may also include environmental attributes or other corporate preferences.
Companies often tie the allocation of revenues back to the business units that pay the carbon fee to drive innovation, accountability, and behavior change.
Early on, companies establish a transparent set of selection criteria for prioritizing investments in projects. This could include: return on investment, emissions reduction potential, or the addition-ality of emission reduction beyond business as usual. The criteria are shared with the departments that are responsible for making the revenue allocation decisions and the business units that may be competing for funds. For example, some companies let employees come up with innovative ideas to reduce the carbon footprint of their respective business unit. The revenue from the fee may be allocated to fund some those ideas.
Stakeholder Buy-in Regardless of the type of carbon pricing approach being used, getting buy in from throughout the organization—from top management, to the finance manager, to customer-facing employees or shop-floor engineers—is important to drive education, awareness, and accountability about the impact of climate change on the business.
Ensuring that the internal carbon price is integrated into the company’s sustainability strategy may reduce administrative costs, ease implementation, and scale up the carbon program.
Allowing employees to come up with ideas about how to use the carbon price can engender a sense of ownership and understanding about how it is used.
CONCLUSIONS AND LESSONS LEARNED The increasing risks associated with climate change have prompted companies to explore internal carbon pricing as a tool to reduce emissions and better prepare for a transition to a low-carbon economy. Companies are using internal carbon pricing approaches such as a carbon fee, shadow pricing, implicit carbon pricing, and/or combining these strategies into hybrid carbon pricing approaches to mitigate climate-related risks, meet their greenhouse gas targets, prepare for future carbon regulations, respond to increased investor pressure for climate risk disclosure, gain a competitive edge, and showcase corporate responsibility and leadership to customers and communities.
According to our research, there is no one best way to internally price carbon; each has its own benefits and challenges. Each company should evaluate trade-offs and select a carbon approach that helps meet its objec-tives and integrates with its overall business strategy. Corporate carbon pricing should be considered one among many tools that can address climate change, and complement other corporate sustainability tools.
LESSONS LEARNED FROM IMPLEMENTING A CARBON PRICE
• Corporate carbon pricing can be an important risk mitigation tool. Companies that use internal carbon pricing consider it an integral component of their strategy to mitigate climate-related physical risks, such as impacts on resources and supply chain disruptions, and transition risks, such as policy, market, and reputational risks.
• Internal carbon pricing may provide multiple business benefits and should be a tool companies consider as they assess their internal climate change strategy. An internal carbon price can be a good proxy to prepare for future regulatory risks. Companies adopting an internal carbon price often do so to enable them to go beyond specific regulatory requirements, advance their greenhouse gas reduction goals, respond to shareholder concerns, build more resilient supply chains, gain a competi-tive edge, and/or showcase corporate responsibility and leadership.
The Business of Pricing Carbon 21
• Corporate carbon pricing is most effective if embedded in a company’s business strategy. To adequately address climate-related business risks, companies should embed the internal carbon pricing program in their overall carbon reduction strategies and risk assessment processes.
• For a carbon fee approach, the price itself may be secondary. When implementing an internal carbon fee, the price level itself may often be secondary to the internal signal it sends to employees and business units that carbon emissions have costs and need to be managed. Companies find that implementing an internal fee can raise awareness and start an internal conversation about climate change. The fee also translates the issue into business-relevant terms.
• Shadow prices should evolve and escalate over time. To meaningfully affect long-term investment deci-sions, a company’s shadow price needs to reflect the likelihood that the costs of climate change will increase over time. The starting price may also need to be higher than current government levels to prepare for future constraints on greenhouse gas emissions and unexpected climate impacts. For example, a company could consider using a shadow price in line with the levels recommended by the High-Level Commission on Carbon Prices ($40–$80 per metric ton by 2020 and $50–$100 per metric ton by 2030). These price levels are intended to reflect those required to induce low-carbon technology
deployment and limit global average temperature rise to well below 2 C above pre-industrial levels.
• Not every approach is viable for every sector. A carbon fee may not be feasible in certain sectors, such as electric power. Because electricity is a highly regulated commodity where the emphasis is keeping costs lower for consumers, many electric power companies must get approval for cost increases within the organization. A shadow price may be easier to implement in a regulated sector and can help manage climate risk and prioritize low-carbon projects.
• A company can use more than one type of internal carbon pricing. Different carbon pricing approaches are not mutually exclusive. In adopting a hybrid approach, a company may find it can meet multiple objectives, such as using a carbon fee to engage employees and help meet its greenhouse gas reduction targets, while applying a shadow price to inform long-term procurement, R&D, or other investment decisions.
• Corporate carbon pricing is not the only tool to address climate-related risks. Corporate carbon pricing strategies alone will not be sufficient to ensure a transition to a global low-carbon economy. These approaches must be complemented with other greenhouse gas reduction strategies.
COMPANY CASE STUDIES
CASE STUDY #1: THE MICROSOFT CARBON FEE JOURNEY
Microsoft Corporation is a leading U.S. multinational technology company and provider of software, services, devices, and solutions. Microsoft has been carbon neutral in its global operations since July 2012, (i.e., powering its global operations with 100 percent renew-able energy). In 2016, the company committed to procuring at least 50 percent of datacenter energy from solar, wind, and hydropower by 2018, and 60 percent by the early 2020s.125
Microsoft first introduced its carbon fee in July 2012 as a part of its companywide commitment to achieve
net zero greenhouse gas emissions for its data centers, software development labs, offices, manufacturing plants, and employee business air travel. As a part of this “carbon neutral” pledge, Microsoft applies an internal carbon fee to its business groups based on the carbon emissions associated with their electricity consumption (scope 1 and scope 2 emissions) and employee air travel (part of scope 3 emissions). According to the company, the internal carbon fee is central to its commitment to not only achieve carbon neutrality in operations, but also to accelerate positive changes across its suppliers, customers, and the communities it serves.
As Microsoft continues to expand its data center operations worldwide, the company recognizes that it
Center for Climate and Energy Solutions22
will continue to consume and pay for more energy. The company’s environmental sustainability team recognized early on that Microsoft could reduce its emissions if it made the impact of energy consumption and associated emissions more visible across the company. That is when the Microsoft team came upon the concept of a carbon fee. “By switching to a price on carbon and speaking about the impacts of our emissions in a metric that our company understood, we could talk about the impact, charge our business groups, and invest funds to do social and environmental good.”126
Microsoft also requires its business practices to have a positive impact on the communities it serves and so adopted an internal carbon fee to help drive responsible business decisions that encompass both: “While the fee makes good business sense, it also makes good people sense.”127 Funds generated from the fee go beyond reducing Microsoft’s environmental impact to investing in citizenship projects that result in low-carbon fuel supplies, ecosystem protection, and sustainable commu-nities. The fee was also instituted to drive a corporate culture change that raises awareness of the impact of business operations on the environment. The company also recognizes and responds to external stakeholders (investors, non-governmental organizations) looking for companies to demonstrate responsibility by reducing its carbon footprint, and accounting and reporting on those actions in a transparent way.
To gain internal buy-in for a carbon fee, the envi-ronmental sustainability group discussed it with the company’s senior management and key business groups, including the finance division. According to Microsoft, the resulting carbon fee provided the financial justifica-tion to prioritize investments in energy efficiency and sustainability projects that could save money, reduce its environmental footprint, and make a positive social impact on communities. It was the strong alignment of the carbon fee with Microsoft’s business strategy that garnered the buy-in from key internal stakeholders and received “the engagement and attention of really smart people in the company that Microsoft would have not got otherwise.”128
Microsoft’s carbon fee program is evaluated annually to reflect the total investment strategy to maintain and eventually go beyond Microsoft’s carbon neutrality goal. Between 2012 and 2016, the internal carbon fee ranged
from $5–$10 per metric ton. The same price is applied companywide across 12 business units in more than 100 countries.129 The fee is administered by a cross-depart-mental group of representatives from the corporate finance department and environmental sustainability team. The group establishes the carbon price and identifies potential projects to fund with the revenue generated. The carbon fee is determined in two steps:
First, a carbon price is calculated each year by estimating the amount of money Microsoft will need to spend on environmental initiatives (e.g., purchase of green power for its datacenters, cost of electricity consumption by datacenters) to maintain its carbon neutrality goal. That level of investment is divided by the total amount of Microsoft’s projected annual average greenhouse gas emissions. The denominator or projected annual emissions is the projected amount of energy that each business unit (office space, data centers, or business air travel) consumes every quarter. Those kilowatt-hours and gallons of fuel are converted into metric tons of carbon. The resulting formula is:
Price on carbon ($/tCO2e) = yearly funding required for environmental initiatives ($)/projected annual greenhouse gas emissions in boundary (tCO2e)
130
Second, once the carbon price is determined, the carbon fee is charged to business units in proportion to the emissions associated with the energy consumption in their operations and employee air travel:
Carbon fee = Emissions of the business unit X carbon price
The funds that are collected on a quarterly basis from the business units go toward a central carbon fund that Microsoft uses to buy renewable energy through power purchase agreements (PPAs), increase energy efficiency across its global facilities, purchase high-quality carbon offsets for renewable low-carbon development and reforestation, increase e-waste recycling, and invest in R&D (Figure 2). In fiscal year 2015, the carbon fee investments were allocated as: 57 percent in green power and sustainable energy innovation, 22 percent in carbon offset community projects, 19 percent in internal carbon reduction grants that also included supporting carbon reduction projects and e-waste recycling, and 2 percent in program management.
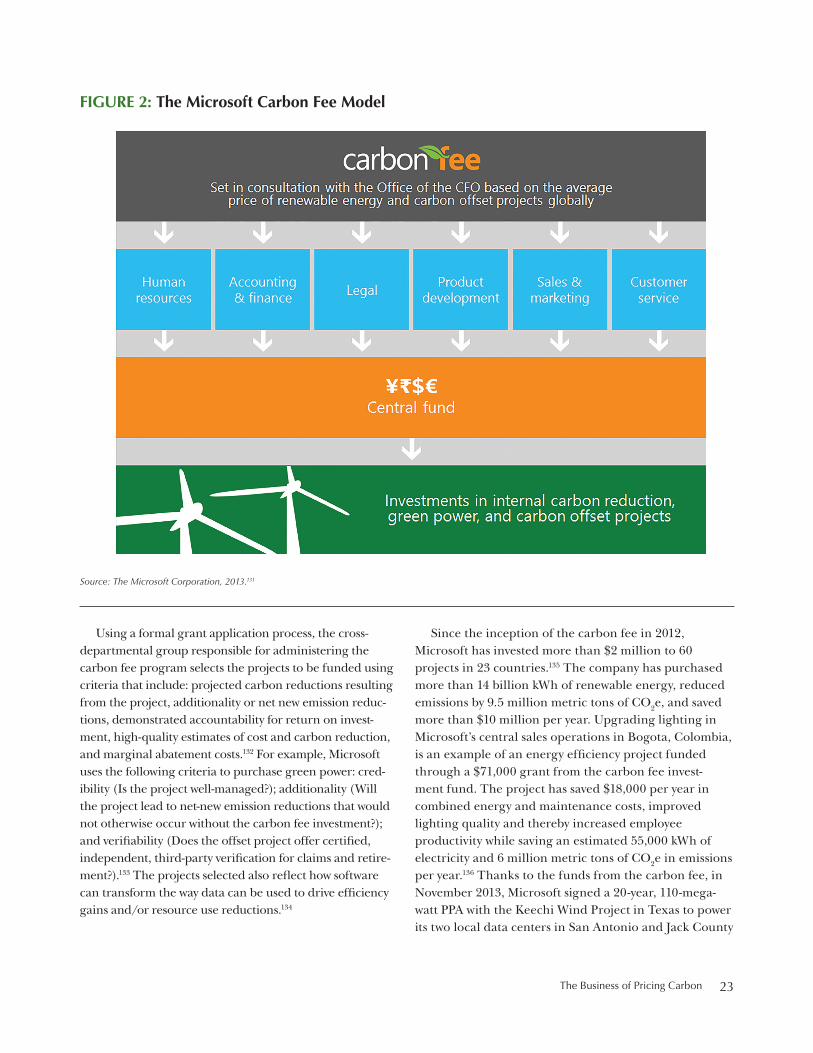
The Business of Pricing Carbon 23
Using a formal grant application process, the cross-departmental group responsible for administering the carbon fee program selects the projects to be funded using criteria that include: projected carbon reductions resulting from the project, additionality or net new emission reduc-tions, demonstrated accountability for return on invest-ment, high-quality estimates of cost and carbon reduction, and marginal abatement costs.132 For example, Microsoft uses the following criteria to purchase green power: cred-ibility (Is the project well-managed?); additionality (Will the project lead to net-new emission reductions that would not otherwise occur without the carbon fee investment?); and verifiability (Does the offset project offer certified, independent, third-party verification for claims and retire-ment?).133 The projects selected also reflect how software can transform the way data can be used to drive efficiency gains and/or resource use reductions.134
Since the inception of the carbon fee in 2012, Microsoft has invested more than $2 million to 60 projects in 23 countries.135 The company has purchased more than 14 billion kWh of renewable energy, reduced emissions by 9.5 million metric tons of CO2e, and saved more than $10 million per year. Upgrading lighting in Microsoft’s central sales operations in Bogota, Colombia, is an example of an energy efficiency project funded through a $71,000 grant from the carbon fee invest-ment fund. The project has saved $18,000 per year in combined energy and maintenance costs, improved lighting quality and thereby increased employee productivity while saving an estimated 55,000 kWh of electricity and 6 million metric tons of CO2e in emissions per year.136 Thanks to the funds from the carbon fee, in November 2013, Microsoft signed a 20-year, 110-mega-watt PPA with the Keechi Wind Project in Texas to power its two local data centers in San Antonio and Jack County
FIGURE 2: The Microsoft Carbon Fee Model
Source: The Microsoft Corporation, 2013.131
Center for Climate and Energy Solutions24
with wind energy. The PPA has brought new renewable energy onto the Texas electric grid, increased the use of renewable energy in Microsoft’s cloud computing, and locked in a price for Microsoft for its energy use over the long term.137
Microsoft’s carbon fee has also led to a positive social impact on communities around the world. The company directs funds from the carbon fee to high-quality emissions reduction projects, such as energy access in least-developed countries and supporting biodiversity and REDD+ forest projects.138 Through investments in more than 50 carbon offset projects in resource conservation and renewable energy, Microsoft has had an impact on more than 7 million people in countries including Brazil, Cambodia, China, Ghana, Guatemala, India, Kenya, Madagascar, Mexico, Mongolia, Peru, and Turkey.139 Microsoft’s carbon fee is also empowering women across developing countries by funding projects that provide agricultural training, efficient cookstoves, clean water, and improved health.
The carbon fee has also had intangible benefits by increasing employee awareness and creating a cultural change in how business units approach their environ-mental impact. By charging each business unit for its energy consumption, the carbon fee has helped drive accountability with internal stakeholders and encourage collective responsibility to reduce the company’s envi-ronmental footprint.140 By providing a central fund that business units could tap into, employees were incentiv-ized to think of innovative ways to reduce emissions.
Microsoft is constantly evolving its carbon fee program to drive a greater impact not only in its own operations but also through its value chain. In November 2016, it decided to take a more holistic approach and go “beyond carbon neutral” by delivering technological solutions to its customers and suppliers to operate efficiently and reduce their carbon footprint. According to Microsoft, the carbon fee program remains a central component of its beyond carbon neutral program. The company will use the funds from the carbon fee to make investments in: renewable energy that expands to energy markets worldwide, carbon offset projects that support sustainable datacenters, low-carbon energy and tech-nology innovation for internal operations and communi-ties worldwide, and tracking and reporting projects that ensure transparency and accountability.141
CASE STUDY #2: ROYAL DUTCH SHELL’S CO2 PROJECT SCREENING VALUE
Royal Dutch Shell (Shell), headquartered in The Hague, Netherlands, is one of the world’s largest global oil and gas companies, operating in more than 70 countries. Shell’s business is divided into three main areas: upstream (explora-tion and production for conventional oil and gas); integrated gas (manufacturing and distribution of liquefied natural gas and gas-to-liquids production, natural gas exploration and extraction, investment in low-carbon energy solutions); and downstream (refining and marketing).
Shell has long recognized climate risks and considers them a core strategic concern.142 To remain competitive in a low-carbon future while meeting a rising global demand for energy, Shell generally applies a greenhouse gas Project Screening Value (PSV) of $40 per metric to all prospective future investments.
In the past, Shell’s climate strategy group was nested within the corporate affairs division. The increasing importance of climate change to Shell’s business strategy led to the creation of Group CO2 in 2005—a dedicated department directly responsible for managing the company’s approach to climate change. The department reports to the executive vice president for safety and envi-ronment. Group CO2 develops Shell’s carbon strategy and uses its greenhouse gas PSV in its internal risk assessment framework to evaluate a project’s potential exposure to future carbon regulations.143
In 1998, Shell conducted its first formal study of the potential impact of climate-related regulations on its global businesses. Anticipating carbon regulation of some form, Shell began integrating carbon prices into the financial decision-making of carbon-intensive projects and assets. Since the early 2000s, Shell has also participated in several carbon trading regimes across different jurisdictions including the United Kingdom’s cap-and-trade program (2002–2007), the EU ETS (2005–present), Alberta’s Specified Gas Emissions Reduction System (2007–present), California’s cap-and-trade program (2013–present), and the Regional Greenhouse Gas Initiative (RGGI) (2009–present).144
Beginning in 2000, Shell generally applied a green-house gas PSV which is currently $40 per metric ton—an investment value to test the exposure to carbon or climate-related regulations for all new and existing projects of all sizes and types across all regions of operation. Shell’s PSV is applied at the point of investment to influence the company’s direct and indirect (scope 1 and 2) emissions.145
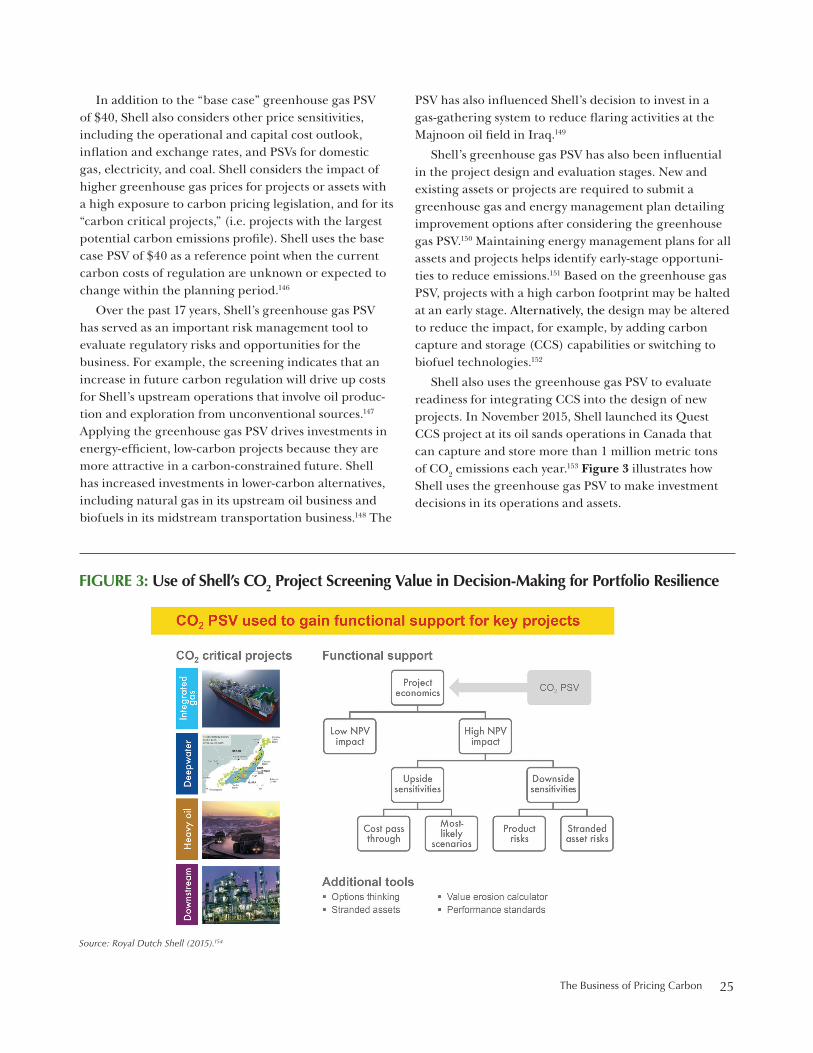
The Business of Pricing Carbon 25
In addition to the “base case” greenhouse gas PSV of $40, Shell also considers other price sensitivities, including the operational and capital cost outlook, inflation and exchange rates, and PSVs for domestic gas, electricity, and coal. Shell considers the impact of higher greenhouse gas prices for projects or assets with a high exposure to carbon pricing legislation, and for its “carbon critical projects,” (i.e. projects with the largest potential carbon emissions profile). Shell uses the base case PSV of $40 as a reference point when the current carbon costs of regulation are unknown or expected to change within the planning period.146
Over the past 17 years, Shell’s greenhouse gas PSV has served as an important risk management tool to evaluate regulatory risks and opportunities for the business. For example, the screening indicates that an increase in future carbon regulation will drive up costs for Shell’s upstream operations that involve oil produc-tion and exploration from unconventional sources.147 Applying the greenhouse gas PSV drives investments in energy-efficient, low-carbon projects because they are more attractive in a carbon-constrained future. Shell has increased investments in lower-carbon alternatives, including natural gas in its upstream oil business and biofuels in its midstream transportation business.148 The
PSV has also influenced Shell’s decision to invest in a gas-gathering system to reduce flaring activities at the Majnoon oil field in Iraq.149
Shell’s greenhouse gas PSV has also been influential in the project design and evaluation stages. New and existing assets or projects are required to submit a greenhouse gas and energy management plan detailing improvement options after considering the greenhouse gas PSV.150 Maintaining energy management plans for all assets and projects helps identify early-stage opportuni-ties to reduce emissions.151 Based on the greenhouse gas PSV, projects with a high carbon footprint may be halted at an early stage. Alternatively, the design may be altered to reduce the impact, for example, by adding carbon capture and storage (CCS) capabilities or switching to biofuel technologies.152
Shell also uses the greenhouse gas PSV to evaluate readiness for integrating CCS into the design of new projects. In November 2015, Shell launched its Quest CCS project at its oil sands operations in Canada that can capture and store more than 1 million metric tons of CO2 emissions each year.153 Figure 3 illustrates how Shell uses the greenhouse gas PSV to make investment decisions in its operations and assets.
FIGURE 3: Use of Shell’s CO2 Project Screening Value in Decision-Making for Portfolio Resilience
Source: Royal Dutch Shell (2015).154
Center for Climate and Energy Solutions26
In its A Better Life with a Healthy Planet: Pathways to Net-Zero Emissions analysis, Shell evaluates potential pathways to a net-zero emissions world.155 While the company doesn’t expect to move to “net-zero” emissions over the next 10 to 20 years, Shell sees a need to continue to explore a “patchwork of solutions,” including renewable energy, carbon capture and storage, biofuels and hydrogen-based fuels, and natural gas production, to prepare for a net-zero emissions future in the longer term.156
In 2016, Shell reported that around half of the company’s production was natural gas and that it plans to continue expanding natural gas production in its future energy mix.157 Shell is involved in several CCS projects and developed CO2 capture technology through its 100 percent interest in Shell Cansolv. The greenhouse gas PSV has also influenced divestment decisions, which are expected to shift investments to exploring new markets and low-carbon assets.
Because of these and other initiatives, as of 2016, Shell has reduced its direct greenhouse gas emissions from facilities by 2 million metric tons of CO2e compared with 2015. Shell largely attributes this achievement to a reduc-tion in flaring activities, divestments in oil production, increased use of CCS, and operational improvements across its facilities.158
Shell’s vice president of Group CO2 said using a uniform and predictable PSV makes it easier to admin-ister and ensure compliance. In practice, Shell typically applies the $40 greenhouse gas PSV across all its projects and assets globally and only uses different price sensi-tives for a handful of carbon critical projects. Shell also emphasizes that while the project screening value approach has been useful as a carbon risk management tool, it complements other systems to internally manage carbon. While the valuation of carbon alone is not a sufficient metric to mitigate future climate-related policy risks, government-led carbon pricing mechanisms that place a meaningful cost on CO2 emissions can stimulate the development of low-carbon technologies, generate revenue for governments and, ultimately, give consumers new energy choices.159
CASE STUDY #3: RISE FOR GOOD WITH MAHINDRA & MAHINDRA’S INTERNAL CARBON FEE
Mahindra & Mahindra Ltd. (M&M) is the world’s largest manufacturer of tractors and is part of The Mahindra Group, a $19 billion multinational federation of compa-nies based in Mumbai, India. The Mahindra Group has operations in 20 key industries and 10 sectors including utility vehicle manufacturing, tractors, information technology, financial services, real estate, energy, logistics, and retail. As the group’s flagship company, M&M contributes half of the group’s revenue and the group’s greenhouse gas emissions from its automotive (SUVs, commercial vehicles), farm equipment (tractors), and agricultural businesses.160
In October 2016, M&M became the first Indian company to launch an internal carbon fee of $10 per metric ton to reduce the company’s carbon footprint and help meet its goal of reducing its greenhouse gas emissions intensity 25 percent by 2019 from 2015–2016 levels.161 In April 2016, M&M also became the first Indian company to sign on to the global EP100 initiative, pledging to double its energy productivity by 2030 from 2005 levels.162
Before determining its carbon fee, M&M estimated that its current spending in carbon reduction measures was at a rate of $6–$7 per metric ton. Based on the those estimates, the company decided to apply $10 per metric ton—a higher and more ambitious carbon price to meet M&M’s near-term greenhouse gas reduction goals and get on a path to achieving future carbon neutrality. M&M’s carbon price reflects the total value of investments in projects that reduce its carbon footprint, including energy efficiency, renewable energy, biofuels, and forest conservation. The calculated value of those investments is a function of the level of emissions reduced or avoided, and the business rate of return.163
The funds collected from the carbon fee are allocated to projects under three major action areas: carbon (e.g., renewable energy, LED lighting, energy-efficient motors and HVACs, efficient buildings and infrastructure); waste (e.g., waste-to-energy projects); and water (e.g., zero effluent discharge). These projects help reduce M&M’s scope 1 and scope 2 emissions from its offices and 17 manufacturing units across India. Projects to be funded are selected by the Projects Team (responsible for finance, accounts, and budgeting), the Environment and Energy Team, and the Group Sustainability Team.
The Business of Pricing Carbon 27
Projects are identified before the beginning of each fiscal year based on a metric used across all three teams. The metric is a combination of reduced or avoided emissions and the rate of return on the investments. This price-setting and investment allocation mechanism enables M&M to revisit and refine the carbon fee program to reflect evolving objectives, coverage, and options. 164
Getting internal stakeholder buy-in for the carbon fee program was not a major hurdle for M&M. Sustainability is already ingrained in its business strategy. According to M&M Managing Director Dr. Pawan Goenka, “Climate change is a major concern for our planet and if left unchecked, it will become unsustainable, especially as emerging economies like India become prosperous and more carbon-intensive. As one of the high-polluting industries, we needed to do our job to make our opera-tions emit less carbon, and that is how we started looking at an internal carbon price.”165 Moreover, senior manage-ment already had evidence of the cost and carbon savings from such initiatives as doubling the company’s energy productivity and increasing its alternative energy procurement. For instance, M&M has saved 58 million kWh of energy from more than 700 energy efficiency projects implemented in the past five years.
The projects funded by the carbon fee make business sense for the company. According to M&M, “So far everything has a clear financial justification. We have a carbon fee [because] it makes great business sense.” For example, $4 million from the carbon fee was used to convert all 17 manufacturing plants to LED lighting, yielding a return on investment in less than one year.166
Since the adoption of the carbon fee in October 2016, M&M has increased its investment in energy efficiency and renewable energy projects, including a 4.2 MW wind energy project, compared with its 2015 “business as usual” levels. The company plans to add renewable energy projects in its new fiscal year.167
The carbon fee also aligns with The Mahindra Group’s “Rise Philosophy,” in which an essential purpose of the business is to drive positive change across stake-holders and communities, enabling them to rise.168 With the carbon fee, M&M will continue to make investments that promote sustainability and prosperity in the commu-nities in which it operates, supporting initiatives such as integrated watershed management, rental farm equip-ment services to marginalized farmers, and support for drought-stricken and struggling farmers across India.
As a part of what the company calls a “promise cycle,” the carbon fee will be re-evaluated every three years in line with M&M’s greenhouse gas goal-setting cycle. Moving forward, M&M plans to closely align its internal carbon pricing practices with The Mahindra Group’s long-term carbon neutrality goal and expand the carbon fee program to other companies within the group. The Mahindra Group is also working toward “Sustainability and Strategy” integration, where it plans to align the internal carbon fee with The Mahindra Group’s Sustainability Framework (Figure 4) consisting of three main pillars including: enabling stakeholders to rise (people), rejuvenating the environment (planet), and building enduring business (profit).
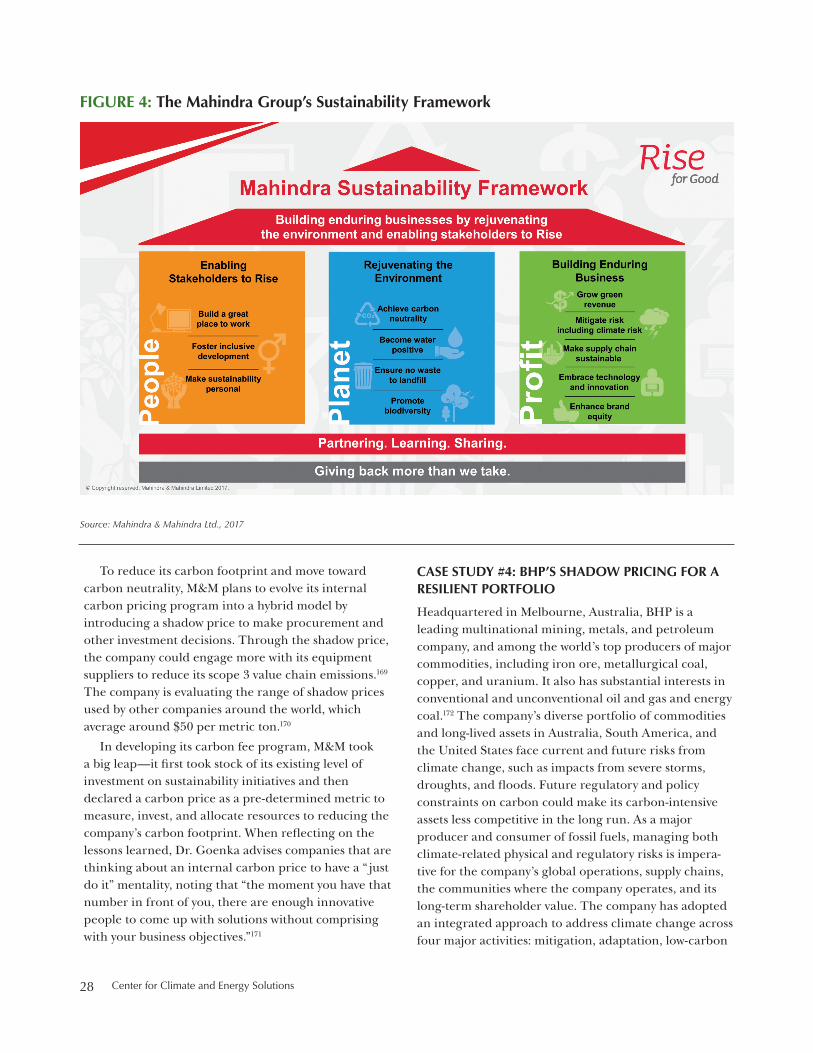
Center for Climate and Energy Solutions28
FIGURE 4: The Mahindra Group’s Sustainability Framework
Source: Mahindra & Mahindra Ltd., 2017
To reduce its carbon footprint and move toward carbon neutrality, M&M plans to evolve its internal carbon pricing program into a hybrid model by introducing a shadow price to make procurement and other investment decisions. Through the shadow price, the company could engage more with its equipment suppliers to reduce its scope 3 value chain emissions.169 The company is evaluating the range of shadow prices used by other companies around the world, which average around $50 per metric ton.170
In developing its carbon fee program, M&M took a big leap—it first took stock of its existing level of investment on sustainability initiatives and then declared a carbon price as a pre-determined metric to measure, invest, and allocate resources to reducing the company’s carbon footprint. When reflecting on the lessons learned, Dr. Goenka advises companies that are thinking about an internal carbon price to have a “ just do it” mentality, noting that “the moment you have that number in front of you, there are enough innovative people to come up with solutions without comprising with your business objectives.”171
CASE STUDY #4: BHP’S SHADOW PRICING FOR A RESILIENT PORTFOLIO
Headquartered in Melbourne, Australia, BHP is a leading multinational mining, metals, and petroleum company, and among the world’s top producers of major commodities, including iron ore, metallurgical coal, copper, and uranium. It also has substantial interests in conventional and unconventional oil and gas and energy coal.172 The company’s diverse portfolio of commodities and long-lived assets in Australia, South America, and the United States face current and future risks from climate change, such as impacts from severe storms, droughts, and floods. Future regulatory and policy constraints on carbon could make its carbon-intensive assets less competitive in the long run. As a major producer and consumer of fossil fuels, managing both climate-related physical and regulatory risks is impera-tive for the company’s global operations, supply chains, the communities where the company operates, and its long-term shareholder value. The company has adopted an integrated approach to address climate change across four major activities: mitigation, adaptation, low-carbon
The Business of Pricing Carbon 29
technology, and portfolio evaluation.173 Since 2004, the company has also adopted a shadow price. For BHP, using “a carbon price in your project and investment valuations develops a proxy for that risk to inform strategic decision-making.”174
BHP’s shadow price range of $24–80 per metric ton is used to make investment decisions and to increase the resilience of its portfolio across operations and projects through 2030.175 The range is informed by a combina-tion of factors including: commodity prices, explicit carbon prices in government-regulated emissions trading schemes and carbon taxes, the implicit carbon prices embedded in other climate and energy public policies, and the company’s ability to import and export emis-sions reductions in the form of tradable credits.176 For jurisdictions without an explicit carbon price, BHP uses a combination of the market, commodity, technology, and policy factors listed above as inputs to determine the shadow price.
The company uses the shadow price to inform decisions to improve energy efficiency and mitigate greenhouse gas emissions from its existing operations. In FY2013, BHP set a five-year target to keep its scope 1 and 2 emissions below its FY2006 baseline. In FY2018, the company set a new target to keep its emissions below its FY2017 baseline and a long-term goal to achieve net zero operational emissions. The company’s entire operations are required to identify, evaluate, and implement suitable greenhouse gas reduction opportunities, including during project design and selection. BHP uses this information to address material greenhouse gas emission sources which may include electricity use, liquid fuel, and fugitive methane. By tracking a project’s greenhouse gas
mitigation opportunities, the company had abated more than 950,000 metric tons of emissions at its operations by 2016. By improving operational efficiency, the company reduced emissions 13 percent from 2015 to 2016.177
BHP also uses the shadow price to evaluate the resilience of the company’s portfolio against a range of plausible scenarios. In its 2015 Climate Change: Portfolio Analysis report, BHP assumes a ‘central case’ of $24 per metric ton by 2030. The central case is the forecast of what BHP expects will happen by 2030 in terms of government climate policies, countries’ emissions reductions targets, economic growth, and technology developments. The central case assumes lower long-term global economic growth projections and stronger growth for renewables.178 The central case is thoroughly reviewed and endorsed periodically by the executive leadership team and BHP’s board of directors.179 BHP tests four alternative scenarios—A New Gear, Closed Doors, Global Accord, and Two Giants—against the central case.180 Every scenario varies in the extent of the global response to climate change. In the Global Accord scenario, for example, BHP expects the global average carbon price to reach $50 per metric ton by 2030. Under this scenario, there is an orderly transition to achieving a 2 C limited world where key global economies such as China, the European Union, and the United States go beyond their current climate commitments and significantly reduce emissions. The higher ambitions are matched by stronger government policy support. Refer to Table 3 for BHP’s expectations for emissions reduction targets and carbon prices through 2030 under the central case and Global Accord scenario.
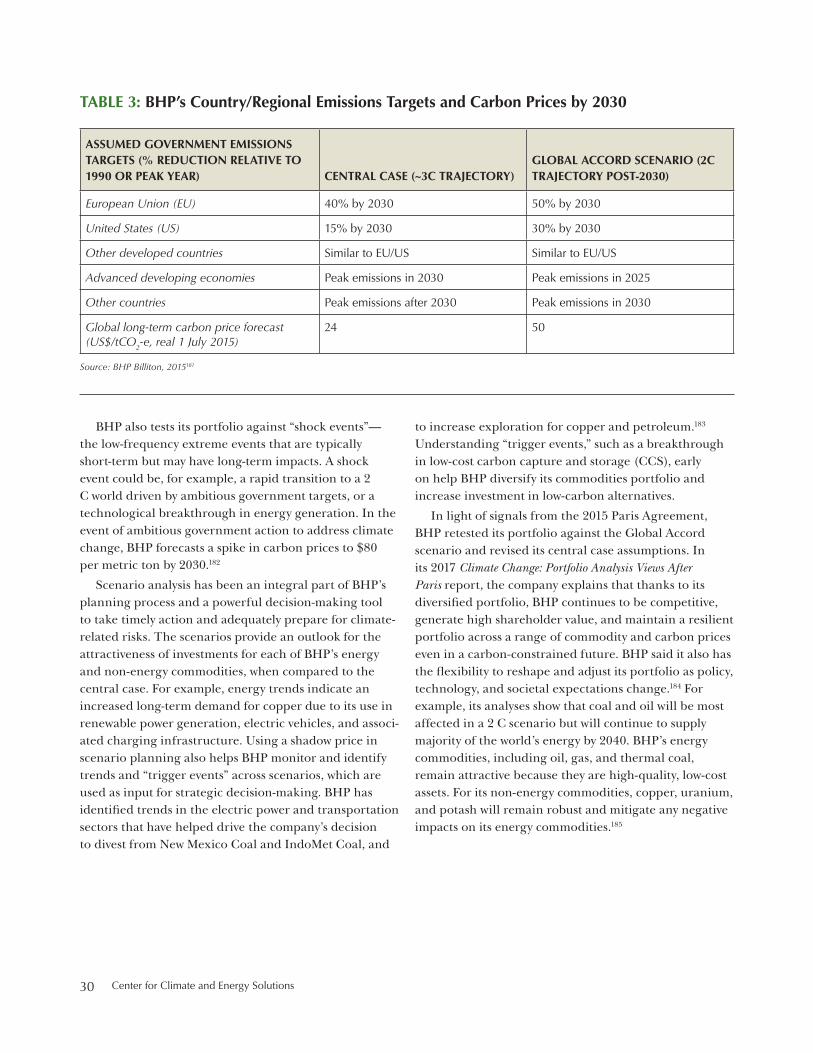
Center for Climate and Energy Solutions30
TABLE 3: BHP’s Country/Regional Emissions Targets and Carbon Prices by 2030
ASSUMED GOVERNMENT EMISSIONS TARGETS (% REDUCTION RELATIVE TO 1990 OR PEAK YEAR) CENTRAL CASE (~3C TRAJECTORY)
GLOBAL ACCORD SCENARIO (2C TRAJECTORY POST-2030)
European Union (EU) 40% by 2030 50% by 2030
United States (US) 15% by 2030 30% by 2030
Other developed countries Similar to EU/US Similar to EU/US
Advanced developing economies Peak emissions in 2030 Peak emissions in 2025
Other countries Peak emissions after 2030 Peak emissions in 2030
Global long-term carbon price forecast (US$/tCO2-e, real 1 July 2015)
24 50
Source: BHP Billiton, 2015181
BHP also tests its portfolio against “shock events”—the low-frequency extreme events that are typically short-term but may have long-term impacts. A shock event could be, for example, a rapid transition to a 2 C world driven by ambitious government targets, or a technological breakthrough in energy generation. In the event of ambitious government action to address climate change, BHP forecasts a spike in carbon prices to $80 per metric ton by 2030.182
Scenario analysis has been an integral part of BHP’s planning process and a powerful decision-making tool to take timely action and adequately prepare for climate-related risks. The scenarios provide an outlook for the attractiveness of investments for each of BHP’s energy and non-energy commodities, when compared to the central case. For example, energy trends indicate an increased long-term demand for copper due to its use in renewable power generation, electric vehicles, and associ-ated charging infrastructure. Using a shadow price in scenario planning also helps BHP monitor and identify trends and “trigger events” across scenarios, which are used as input for strategic decision-making. BHP has identified trends in the electric power and transportation sectors that have helped drive the company’s decision to divest from New Mexico Coal and IndoMet Coal, and
to increase exploration for copper and petroleum.183 Understanding “trigger events,” such as a breakthrough in low-cost carbon capture and storage (CCS), early on help BHP diversify its commodities portfolio and increase investment in low-carbon alternatives.
In light of signals from the 2015 Paris Agreement, BHP retested its portfolio against the Global Accord scenario and revised its central case assumptions. In its 2017 Climate Change: Portfolio Analysis Views After Paris report, the company explains that thanks to its diversified portfolio, BHP continues to be competitive, generate high shareholder value, and maintain a resilient portfolio across a range of commodity and carbon prices even in a carbon-constrained future. BHP said it also has the flexibility to reshape and adjust its portfolio as policy, technology, and societal expectations change.184 For example, its analyses show that coal and oil will be most affected in a 2 C scenario but will continue to supply majority of the world’s energy by 2040. BHP’s energy commodities, including oil, gas, and thermal coal, remain attractive because they are high-quality, low-cost assets. For its non-energy commodities, copper, uranium, and potash will remain robust and mitigate any negative impacts on its energy commodities.185
The Business of Pricing Carbon 31
ENDNOTES1 Through this report, the term “carbon” is used as a broader term for greenhouse gas emission that include:
Carbon Dioxide (CO2), Methane (CH4), Nitrous Oxide, Hydrofluorocarbons, Perfluorocarbons (PFCs); and Sulphur hexafluoride.
2 The internal carbon prices and ranges mentioned through this report use a shorthand of “per metric ton.” For standardization, all prices have been converted to USD per metric ton, based on annual average rate used from June 2015–June 2016.
3 “We are Still In,” last updated June 5, 2017, http://wearestillin.com; Business Urge President to Stay in the Paris Agreement,” Center for Climate and Energy Solutions, accessed August 29, 2017, https://www.c2es.org/international/business-support-paris-agreement, “Business Backs Low-Carbon USA,” Business Backs Low-Carbon USA, accessed May 24, 2017, http://lowcarbonusa.org/business.
4 “Carbon Pricing Dashboard,” World Bank Group, accessed August 29, 2017, http://carbonpricingdashboard.worldbank.org/map_data.
5 Task Force on Climate-related Financial Disclosures, Overview of Recommendations (Basel: Switzerland, Financial Stability Board, 2017), https://www.fsb-tcfd.org/wp-content/uploads/2017/06/TCFD-Recommendations-Overview-062717.pdf.
6 CDP, Embedding a Carbon Price into Business Strategy (New York, NY: CDP 2016), https://b8f65cb373b1b7b15feb-c70d8ead6ced550b4d987d7c03fcdd1d.ssl.cf3.rackcdn.com/cms/reports/documents/000/001/132/original/CDP_Carbon_Price_2016_Report.pdf?1474269757.
7 Partnership for Market Readiness, Preparing for Carbon Pricing: Case Studies from Company Experience: Royal Dutch Shell, Rio Tinto, Pacific Gas & Electric Company (Washington, DC: World Bank Group, 2015), https://www.thepmr.org/system/files/documents/PMR%20Technical%20Note%209_Case%20Studies.pdf.
8 CDP, Embedding a Carbon Price into Business Strategy.
9 United Nations Global Compact, Executive Guide to Carbon Pricing Leadership: A Caring for Climate Report (New York, NY: United Nations Global Compact, 2015), https://www.unglobalcompact.org/library/3711.
10 World Resources Institute, Corporate Value Chain (Scope 3) Accounting and Reporting Standard (Washington, DC: World Resources Institute and World Business Council for Sustainable Development, 2011), https://www.wri.org/publication/greenhouse-gas-protocol-corporate-value-chain-scope-3-accounting-and-reporting-standard.
11 Ibid.
12 Tamara “TJ” DiCaprio, The Microsoft Carbon Fee: Theory and Practice (Redmond, Washington: Microsoft Corporation, 2013), https://www.microsoft.com/about/csr/environment/carbon/.
13 The Walt Disney Company response to the CDP 2016 Climate Survey.
14 The Energy Resources Institute and World Bank Group, Valuation of Energy Costs in the Indian Context: A Survey Based Study of Select Indian Corporates (New Delhi, India: The Energy Resources Institute, 2016), http://cbs.teriin.org/pdf/energy-costs-report/mobile/index.html#p=2.
15 An example of a potential trigger event considered by BHP is a breakthrough in low-cost carbon capture and storage for power generation. Shock events are the unlikely and extreme events that are typically short-lived but have long-term impacts. In BHP’s scenario assessment, the company considers a “shock event” when national governments do not act on climate commitments but then later commit to very ambitious targets to speedily reduce emissions, making up for lost time.
Center for Climate and Energy Solutions32
16 Carbon Pricing Leadership Coalition, Report of the High-Level Commission on Carbon Prices (Washington, D.C.: World Bank Group, 2017), https://static1.squarespace.com/static/54ff9c5ce4b0a53decccfb4c/t/59244eed17bffc0ac256cf16/1495551740633/CarbonPricing_Final_May29.pdf.
17 CDP, Embedding a Carbon Price into Business Strategy.
18 United Nations Global Compact, Executive Guide to Carbon Pricing Leadership: A Caring for Climate Report.
19 EpE and I4CE, Internal Carbon Pricing: A Growing Corporate Practice, (Paris, France: EpE and I4CE, 2016), https://www.i4ce.org/wp-core/wp-content/uploads/2016/09/internal-carbon-pricing-november-2016-ENG.pdf.
20 Manjyot Bhan Ahluwalia, “The Business of Pricing Carbon,” Climate Compass (blog), October 21, 2016, https://www.c2es.org/blog/bhanm/business-pricing-carbon.
21 CDP, The Business Case for Carbon Pricing (New York, NY: CDP), https://b8f65cb373b1b7b15feb-c70d8ead6ced-550b4d987d7c03fcdd1d.ssl.cf3.rackcdn.com/comfy/cms/files/files/000/000/284/original/business-case-for- carbon-pricing.pdf.
22 The Walt Disney Company, Disney’s Environmental Stewardship Goals and Targets (Burbank, CA: The Walt Disney Company), https://ditm-twdc-us.storage.googleapis.com/envirogoalsandtargets.pdf.
23 The Walt Disney Company response to the CDP 2016 Climate Survey.
24 “Mahindra and Mahindra First Indian Company to Announce Carbon Price,” Mahindra & Mahindra Ltd., October 7, 2017, http://www.mahindra.com/news-room/press-release/mahindra-and-mahindra-first-Indian-company-to-announce-Carbon-Price.
25 Hitesh Kataria (Manager, Group Sustainability, The Mahindra Group), in discussion with the author June, 2017.
26 Unilever response to the CDP 2016 Climate Survey.
27 Carbon Pricing Leadership Coalition, 2016-2017 Carbon Pricing Leadership Report.
28 “Our carbon positive ambition,” Unilever, 2017, https://www.unilever.com/sustainable-living/reducing-environmental-impact/greenhouse-gases/our-carbon-positive-ambition/.
29 According to our research, around 45 percent of the 297 companies committed to science-based targets have set an internal carbon price or plan to do so by 2018. Around 43 percent of the 102 companies signed on to RE100 have adopted an internal carbon price or anticipate using one by 2018. Sources: CDP. The Business Case for Carbon Pricing; “Science Based Targets: Companies taking action.” United Nations Global Compact, CDP, World Resources Institute, WWF, We Mean Business Coalition, accessed August 29, 2017, http://sciencebasedtargets.org/companies-taking-action/; “RE100 Companies.” The Climate Group and CDP, accessed August 29, 2017, http://there100.org/companies.
30 “Our carbon positive ambition,” Unilever, 2017.
31 Tamara “TJ” DiCaprio, The Microsoft Carbon Fee: Theory and Practice (Redmond, Washington: The Microsoft Corporation, 2013), https://www.microsoft.com/about/csr/environment/carbon/.
32 The Walt Disney Company, Disney’s Environmental Stewardship Goals and Targets.
33 The Walt Disney Company response to the CDP 2016 Climate Survey.
34 “Energy and Climate.” Novartis, accessed August 29, 2017, https://www.novartis.com/about-us/corporate-responsibility/doing-business-responsibly/health-safety-and-environment/environmental-sustainability/energy-and-climate.
35 Novartis, Corporate Responsibility Performance Report (Basel, Switzerland: Novartis, 2016), https://www.novartis.com/sites/www.novartis.com/files/novartis-cr-performance-report-2016.pdf.
36 Carbon Pricing Dashboard,” World Bank Group, accessed August 29, 2017, http://carbonpricingdashboard.
The Business of Pricing Carbon 33
worldbank.org/map_data.
37 “BP’s role in a lower carbon future,” BP, accessed August 29, 2017, http://www.bp.com/en/global/corporate/sustainability/climate-change/a-lower-carbon-future.html.
38 Partnership for Market Readiness, Preparing for Carbon Pricing: Case Studies from Company Experience: Royal Dutch Shell, Rio Tinto, Pacific Gas & Electric Company (Washington, DC: World Bank Group, 2015), https://www.thepmr.org/system/files/documents/PMR%20Technical%20Note%209_Case%20Studies.pdf.
39 Business For Climate Platform, Lessons Learned from an Emissions Trading System Simulation in Brazil: A Corporate View and Proposals (Sao Paulo, Brazil: Sao Paulo School of Business Administration, 2016), http://mediadrawer.gvces.com.br/publicacoes-ingles/original/sce-epc_proposals-for-an-ets-in-brazil_2016-nov.pdf.
40 Carbon Pricing Leadership Coalition, “Carbon Pricing In Brazil: A conversation with CPFL, Itaú Unibanco and Vale” (webinar, Carbon Pricing Leadership Coalition, June 8, 2016), http://cbey.yale.edu/media/internal-carbon-pricing-practical-experiences-from-the-private-sector.
41 CDP, Embedding a Carbon Price into Business Strategy.
42 Global Investor Coalition on Climate Change, Investor Climate Compass: Oil and Gas: Navigating Investor Engagement (London, UK, 2017), http://www.iigcc.org/files/publication-files/IIGCC_2017_Oil_and_Gas_Investor_Expectations_web.pdf.
43 Exxon Mobil Corporation Response to the CDP 2016 Climate Survey.
44 Task Force on Climate-related Financial Disclosures, Overview of Recommendations (Basel: Switzerland, Financial Stability Board, 2017), https://www.fsb-tcfd.org/wp-content/uploads/2017/06/TCFD-Recommendations-Overview-062717.pdf.
45 Nicolette Bartlett et al., We Mean Business and The Carbon Pricing Corridors: The Market View (New York, NY: CDP, 2017), https://b8f65cb373b1b7b15feb-c70d8ead6ced550b4d987d7c03fcdd1d.ssl.cf3.rackcdn.com/cms/reports/docu-ments/000/002/112/original/Carbon-Pricing-Corridors-the-market-view.pdf?1495638527.
46 Carbon Pricing Leadership Coalition, “Carbon Pricing In Brazil: A conversation with CPFL, Itaú Unibanco and Vale.”
47 BlackRock Investment Institute, Adapting Portfolios to Climate Change: Implications and Strategies for all Investors (New York, NY: BlackRock, 2016), https://www.blackrock.com/investing/literature/whitepaper/bii-climate-change-2016-us.pdf.
48 BlackRock. BlackRock Investment Stewardship Engagement Priorities for 2017-2018 (New York, NY: BlackRock, 2017), http://www.agefi.fr/sites/agefi.fr/files/fichiers/2017/03/blackrock_investment_stewardship_2017-2018_priorities_final.pdf.
49 Bank of England, The Bank of England’s Response to Climate Change (England, UK: Bank of England, 2017), http://www.bankofengland.co.uk/Pages/reader/index.aspx?pub=qb17q2article2&page=1.
50 “Our Actions on Climate Change,” BHP Billiton, accessed August 29, 2017, http://www.bhpbilliton.com/environment/climate-change.
51 Janet Peace and Katy Maher, Weathering the Next Storm: A Closer Look at Business Resilience (Arlington, VA: Center for Climate and Energy Solutions, 2015), https://www.c2es.org/publications/weathering-next-storm-closer-look-business-resilience.
52 CDP, Embedding a Carbon Price into Business Strategy.
53 Carbon Pricing Leadership Coalition, What is the Impact of Carbon Pricing on Competitiveness (Washington, DC: World Bank 2016), http://pubdocs.worldbank.org/en/759561467228928508/CPLC-Competitiveness-print2.pdf.
54 Hitesh Kataria (Manager, Group Sustainability, The Mahindra Group).
Center for Climate and Energy Solutions34
55 Microsoft Corporation, Beyond Carbon Neutral: Expanding Beyond Our Carbon Neutral Operations to Accelerate Global and Local Good (Redmond, Washington: Microsoft Corporation, 2016), https://www.microsoft.com/about/csr/environment/carbon/.
56 “Disney Invests in Protecting Forests Around the World,” The Walt Disney Company, November 19, 2015, https://thewaltdisneycompany.com/isney-invests-in-protecting-forests-around-the-world-see-more-at-https68-71-213-9blogdisney-invests-protecting-forests-around-world/.
57 “Addressing our carbon footprint,” Microsoft Corporation, accessed August 29, 2017, https://www.microsoft.com/about/csr/environment/carbon/.
58 Tamara “TJ” DiCaprio, The Microsoft Carbon Fee: Theory and Practice.
59 “Mahindra and Mahindra First Indian Company to Announce Carbon Price,” Mahindra & Mahindra Ltd.
60 Anirban Ghosh, “Carbon Pricing for Companies in Emerging Markets: The Mahindra Carbon Fee Model” (webinar, Center for Climate and Energy Solutions, February 3, 2017).
61 The Walt Disney Company response to the 2016 CDP Climate Investor Survey.
62 Ibid.
63 Ibid.
64 “Minimizing Business Travel.” Swiss Re, accessed August 29, 2017, http://reports.swissre.com/corporate-responsi-bility-report/2015/cr-report/footprint/our-greenhouse-neutral-programme/minimising-business-travel.html.
65 “Ben & Jerry’s Puts a Price on its Carbon,” Ben & Jerry’s, December 3, 2015, http://www.benjerry.com/values/issues-we-care-about/climate-justice/internal-carbon-tax.
66 “Waste Not, Want Not: Creating Usable Materials from Cow Manure while Reducing Methane,” October 15, 2014, http://www.benjerry.com/whats-new/2014/greenhouse-effect-manure.
67 “A Life Cycle Analysis Study of Some of Our Flavors,” Ben and Jerry’s,” accessed August 29, 2017, http://www.benjerry.com/values/issues-we-care-about/climate-justice/life-cycle-analysis.
68 TD Bank, 2016 Corporate Responsibility Report (Toronto, Canada: TD Bank, 2016), https://www.td.com/document/PDF/corporateresponsibility/2016-Final-CRR_EN.pdf.
69 CDP, Embedding a Carbon Price Into Business Strategy.
70 LVMH, Environmental Report 2016 (Paris, France: LVMH, 2016), https://r.lvmh-static.com/uploads/2017/04/lvmh_rapport-environment_2016en.pdf.
71 Silvia Zhang, On-Bill Financing: Encouraging Energy Efficiency (Arlington, VA: Center for Climate and Energy Solutions, 2013), https://www.c2es.org/docUploads/On_Bill_Financing.pdf.
72 Natural Resources Defense Council, On-Bill Financing. Overview and Key Considerations for Program Design (Washington, DC: Natural Resources Defense Council, 2013). https://www.nrdc.org/sites/default/files/on-bill-financing-IB.pdf.
73 Letha Tawney, Priya Barua, Celina Bonugli and Bryn Baker, Emerging Green Tariffs in the U.S. Regulated Electricity Markets (Washington, DC: World Resources Institute, May 2017), http://www.wri.org/sites/default/files/Emerging_Green_Tariffs_in_US_Reg_Elec_Markets_May_2017_0.pdf.
74 “Green Pricing Programs,” Center for Climate and Energy Solutions, last updated March 2017, https://www.c2es.org/us-states-regions/policy-maps/green-pricing-programs.
75 Letha Tawney, Priya Barua, Celina Bonugli and Bryn Baker, Emerging Green Tariffs in the U.S. Regulated Electricity Markets.
The Business of Pricing Carbon 35
76 Manjyot Bhan Ahluwalia, “Business Can Help on the Road From Agreement to Action on Climate,” Climate Compass (blog), May 11, 2016, https://www.c2es.org/blog/bhanm/business-can-help-road-agreement-action-climate.
77 Bank of America, “Bank of America Announces Industry-leading $125 Billion Environmental Business Initiative, April 6, 2016, http://newsroom.bankofamerica.com/press-releases/environment/catalytic-finance-initiative-brings-together-banks-and-investors-directs-.
78 Apple, Annual Green Bond Impact Report: Covering Fiscal Year 2016 (Cupertino, CA: Apple, 2016), http://files.shareholder.com/downloads/AAPL/4034275272x0x928237/03A2856E-EA7A-4FD0-9C0D-37963A4336DB/Apple_Green_Bond_Report_2016.pdf.
79 “Toyota Financial Services Supports Environmental Sustainability by Expanding Green Bond Program,” Toyota Motor Sales, USA, May 13, 2016, http://corporatenews.pressroom.toyota.com/releases/tfs-environmental-green-bond-expansion-may13.htm.
80 YES Bank, The Green Bond Impact Report: FY 2016-2017 (Mumbai, India: YES Bank, 2017), https://www.yesbank.in/pdf/the_green_bond_impact_report_fy_2016_17_pdf.
81 “IFC Issues First Green Masala Bond,” International Finance Corporation, August 2015, http://www.ifc.org/wps/wcm/connect/news_ext_content/ifc_external_corporate_site/news+and+events/news/ifc+issues+first+green+masala+bond+on+london+stock+exchange.
82 International Finance Corporation, IFC-backed Green Masala Bond Helps Scale Renewables (Washington, DC: International Finance Corporation), https://www.ifc.org/wps/wcm/connect/4f19103e-1d01-4f1f-9296-895ae0c71617/6StoriesOfImpact-YES+Bank+Infra.pdf?MOD=AJPERES.
83 Patrick Falwell, Options for Mobilizing Clean Energy Finance (Arlington, VA: Center for Climate and Energy Solutions, 2015), https://www.c2es.org/docUploads/options-mobilizing-clean-energy-finance.pdf.
84 Carbon Pricing Leadership Coalition, Report of the High-Level Commission on Carbon Prices.
85 Angus Gillespie, Case Study: Shell’s CO2 Project Screening Value (International Emissions Trading Association, 2015), http://www.ieta.org/resources/Resources/GREENHOUSE GAS_Report/2015/Articles/Case_Study_Shells_CO2_Project_Screening_Value_AGillespie.pdf.
86 “BP’s role in a lower carbon future.
87 BP, Sustainability Report 2016 (London, United Kingdom: BP, 2016), https://www.bp.com/content/dam/bp/en/corporate/pdf/sustainability-report/group-reports/bp-sustainability-report-2016.pdf.
88 Fiona Wild (BHP, Vice President Climate and Sustainability), in discussion with the author, March, 2017.
89 BHP Billiton, Integrity Resilience Growth Sustainability Report (Melbourne, Australia: BHP Billiton, 2016), http://static.globalreporting.org/report-pdfs/2016/44555af3257002153c39a6c5c86ccdb0.pdf.
90 Rio Tinto, Climate Change Report (London, UK: Rio Tinto: 2016), http://www.riotinto.com/documents/RT_Climate_change_report.pdf.
91 Rio Tinto response to the CDP 2016 Climate Survey.
92 Rio Tinto, Climate Change Report.
93 Rio Tinto. Partnering for Progress: 2016 Sustainable Development Report (London, UK: Rio Tinto, 2016), http://www.riotinto.com/documents/RT_SD2016.pdf.
94 General Motors Company response to the 2016 CDP Climate Survey.
95 David Tulauskas (Director Sustainability, General Motors), in discussion with the author, December, 2016.
96 “Energy and Climate.” Novartis.
Center for Climate and Energy Solutions36
97 CDP, Embedding a Carbon Price into Business Strategy.
98 Feike Sijbesma, “The Business Case for Carbon Pricing at DSM,” (webinar hosted by the Carbon Pricing Leadership Coalition, July 18, 2016), http://cbey.yale.edu/our-stories/the-business-case-for-carbon-pricing.
99 “Climate Change Management,” Garanti Bank, accessed August 29, 2017, https://www.garanti.com.tr/en/our_company/sustainability/sustainability_approach/climate_change_management.page.
100 Garanti Bank, 2016 Sustainability Report (Istanbul, Turkey: Garanti Bank, 2016), https://www.garanti.com.tr/en/our_company/sustainability/developments/reports.page.
101 Garanti Bank response to the CDP 2016 Climate Survey.
102 “Groupe ADP raises its target for the reduction in CO2 emissions: -65% at the 3 Paris airports between 2009 and 2020,” Groupe ADP, June 21, 2017, http://www.parisaeroport.fr/docs/default-source/groupe-fichiers/presse/cp-avril-juin-2017/groupe-adp-raises-its-target-for-the-reduction-in-co2-emissions.pdf?sfvrsn=2.
103 Jeanne Michon-Savarit (Head of Energy department, Groupe ADP), in discussion with the author, July 27, 2017.
104 “Global Greenhouse Gas Emissions Data,” U.S. Environmental Protection Agency, accessed August 29, 2017, https://www.epa.gov/ghgemissions/global-greenhouse-gas-emissions-data.
105 Joseph Kruger, Hedging an Uncertain Future: Internal Carbon Pricing in the Electric Power Sector (Washington, DC: Resources for the Future, 2017), http://www.rff.org/files/document/file/RFF-Rpt-Kruger-Internal%20Carbon%20Pricing.pdf.
106 CDP, Embedding a Carbon Price into Business Strategy.
107 Some U.S. states including California, Iowa, Minnesota, Massachusetts, Connecticut, Maine, Washington, Delaware, Vermont, and Rhode Island require some form of integrated resource planning from regulated utilities. Some merchant power companies not regulated by PUCs also use carbon pricing for risk assessment. A Resources for the Future report compared the IRPs of 14 electric power companies and the range of carbon prices ranged from $4-$122 per metric ton starting in 2022 to 2035. For further details see: Joseph Kruger, Hedging an Uncertain Future: Internal Carbon Pricing in the Electric Power Sector.
108 David Young (Principal Technical Leader, Electric Power Research Institute), in conversation with the author, May, 2017.
109 Duke Energy response to the CDP 2016 Climate Survey.
110 Duke Energy Indiana, “The Duke Energy Indiana 2015 Integrated Resource Plan,” (Indiana: Duke Energy, 2015), https://www.in.gov/iurc/files/2015_Duke_IRP_Report_Volumn_1_Public_Version.pdf.
111 Exelon Corporation Response to the CDP 2017 Climate Survey.
112 William Brady (Director Corporate Sustainability and Safety, Exelon Corporation), in discussion with the author, February, 2017.
113 Gregory Ryan (Senior technological specialist, DTE Energy), in discussion with the author, December, 2016.
114 “DTE Energy announces plan to reduce carbon emissions by 80 percent,” DTE Energy, May, 2017, http://news-room.dteenergy.com/2017-05-16-DTE-Energy-announces-plan-to-reduce-carbon-emissions-by-80-percent#sthash.bev804p6.dpuf.
115 NRG Energy response to the CDP 2016 Climate Survey.
116 Science Based Targets, “Case Study: NRG Energy,” accessed August 29, 2017, http://sciencebasedtargets.org/case-studies/case-study-nrg/.
117 CDP, Embedding a Carbon Price into Business Strategy.
The Business of Pricing Carbon 37
118 “Our climate commitment,” National Grid, accessed August 29, 2017, http://www2.nationalgrid.com/responsibility/Preserving/Environmental-sustainability/Our-Climate-Commitment/.
119 National Grid. Electricity Transmission: Delivering Our Environmental Future: Annual Statement, March 2017, http://www2.nationalgrid.com/responsibility/Delivering-Our-Environmental-Future/?utm_source=CRHome&utm_medium=web&utm_campaign=DEF2016Launch.
120 National Grid Climate Change response to the CDP 2016 Climate Survey.
121 Carbon Pricing Leadership Coalition, 2016-2017 Carbon Pricing Leadership Report.
122 Engie, 2016 Integrated Report: A New Vision of the Energy World, (Paris, France: Engie, 2016), https://www.engie.ro/corporate/wp-content/uploads/2016/08/POD_ENGIE_rapportintegre2016_EN_rev01_bd.pdf.
123 CDP, Embedding a Carbon Price Into Business Strategy.
124 With exception of Unilever’s revealed implicit carbon price of $10 per metric ton. Source: Unilever Response to the CDP 2016 Climate Survey.
125 “Climate and Energy.” Microsoft, November 2016, https://www.microsoft.com/en-us/about/corporate-responsibility/environment-climate-and-energy.
126 Tamara “TJ” DiCaprio, “The Microsoft Carbon Fee Story” (webinar, Center for Climate and Energy Solutions, September 27, 2016).
127 Ibid.
128 Ibid.
129 Tamara “TJ” DiCaprio, The Microsoft Carbon Fee: Theory and Practice.
130 WSP, Carbon Pricing: Seven Things to Consider When Establishing a Carbon Pricing Program (New York, NY: WSP, 2016), http://www.wsp-pb.com/Globaln/USA/Environment/Sustainability/Materials/SevenThingsCarbonPricing_ 04-16.pdf.
131 Tamara “TJ” DiCaprio, The Microsoft Carbon Fee: Theory and Practice.
132 Tamara “TJ” DiCaprio, Making an Impact with Microsoft’s Carbon Fee: Inspiring a Virtuous Cycle of Environmental Investment and Action (Redmond, Washington: Microsoft Corporation, 2015), https://www.microsoft.com/about/csr/environment/carbon/.
133 Tamara “TJ” DiCaprio, The Microsoft Carbon Fee: Theory and Practice.
134 Rob Bernard (Chief Environmental Strategist, Microsoft Corporation), email communication with the author, July 2017.
135 Tamara “TJ” DiCaprio, Making an Impact with Microsoft’s Carbon Fee.
136 Ibid.
137 “Microsoft Wind Power,” Microsoft Corporation, accessed August 29, 2017, https://www.microsoft.com/environ-ment/renewable.aspx.
138 “Microsoft Global Carbon Fee,” United Nations Framework Convention on Climate Change, accessed August 29, 2017, http://unfccc.int/secretariat/momentum_for_change/items/9261.php.
139 Tamara “TJ” DiCaprio, The Microsoft Carbon Fee: Theory and Practice.
140 Tamara “TJ” DiCaprio, Making an Impact with Microsoft’s Carbon Fee.
141 Microsoft Corporation, Beyond Carbon Neutral: Expanding Beyond our Carbon Neutral Operations to Accelerate Global
Center for Climate and Energy Solutions38
and Local Good (Redmond, Washington, Microsoft Corporation, 2016), http://newsroom.unfccc.int/media/788991/micro-soft_beyond-carbon-neutral.pdf.
142 Royal Dutch Shell response to the CDP 2016 Climate Survey.
143 Partnership for Market Readiness, Preparing for Carbon Pricing: Case Studies from Company Experience: Royal Dutch Shell, Rio Tinto, Pacific Gas & Electric Company.
144 Ibid.
145 Angus Gillespie, Case Study: Shell’s CO2 Project Screening Value.
146 Royal Dutch Shell response to the CDP 2016 Climate Survey.
147 Partnership for Market Readiness. Preparing for Carbon Pricing: Case Studies from Company Experience: Royal Dutch Shell, Rio Tinto, Pacific Gas & Electric Company.
148 Royal Dutch Shell, Sustainability Report 2015, http://reports.shell.com/sustainability-report/2015/energy-transition/addressing-climate-change/collaboration-portfolio-and-adaptation.html.
149 Royal Dutch Shell, Sustainability Report 2016, https://reports.shell.com/sustainability-report/2016/servicepages/download-centre.html.
150 Royal Dutch Shell response to the CDP 2016 Climate Survey.
151 Royal Dutch Shell, Sustainability Report 2016.
152 Royal Dutch Shell, Sustainability Report 2015.
153 Royal Dutch Shell, Shell: Energy Transitions and Portfolio Resilience, http://www.shell.com/sustainability/sustainability-reporting-and-performance-data/performance-data/greenhouse-gas-emissions/portfolio-resilience-to-iea-450-scenario/_jcr_content/par/textimage_728121788.stream/1479323448964/c0617ee1311deff3f478035526b0dba05f-c700c9dd087bfe459a89e2b6471413/ir-shell-and-energy-transitions-reporta4v20-124048.pdf.
154 Angus Gillespie, “Clearing the Air: Ensuring Long Term Value to Shell by Addressing Climate Change and Pricing Carbon” (presentation, Stanford University, Stanford, California, January 12, 2015).
155 Royal Dutch Shell, A Better Life with a Healthy Planet: Pathways to Net-Zero Emissions. http://www.shell.com/energy-and-innovation/the-energy-future/scenarios/a-better-life-with-a-healthy-planet/_jcr_content/par/textimage.stream/1475857466913/a1aa5660d50ab79942f7e4a629fcb37ab93d021afb308b92c1b77696ce6b2ba6/scenarios-nze-brochure-interactive-afwv9-interactive.pdf.
156 Royal Dutch Shell, A Better Life with a Healthy Planet: Pathways to Net-Zero Emissions.
157 Royal Dutch Shell, Sustainability Report 2016.
158 Ibid.
159 Angus Gillespie, Case Study: Shell’s CO2 Project Screening Value.
160 Anirban Ghosh. “Carbon Pricing for Companies in Emerging Markets: The Mahindra Carbon Fee Model” (webinar, Center for Climate and Energy Solutions, February 3, 2017).
161 “Mahindra & Mahindra first Indian company to announce Carbon Price,” Mahindra & Mahindra, Ltd.
162 “New Global EP100 Initiative to Increase Energy Productivity Welcomes Mahindra As First Indian Company,” The Climate Group, April 21, 2016, https://www.theclimategroup.org/what-we-do/news-and-blogs/new-global-ep100-initiative-to-increase-energy-productivity-welcomes-mahindra-as-first-indian-company.
163 Anirban Ghosh. “Carbon Pricing for Companies in Emerging Markets: The Mahindra Carbon Fee Model.”
The Business of Pricing Carbon 39
164 Ibid.
165 Pawan Goenka. “Internal Carbon Pricing- Practical Experiences from the Private Sector: Mahindra & Mahindra,” (webinar, Carbon Pricing Leadership Coalition, February 27, 2017), https://www.youtube.com/watch?v=0SsEsbaf4nI&feature=youtu.be.
166 Anirban Ghosh. “Internal Carbon Pricing-Practical Experiences from the Private Sector Featuring Mahindra & Mahindra.”
167 Hitesh Kataria (Manager, Group Sustainability, The Mahindra Group).
168 Anirban Ghosh (Chief Sustainability Officer, The Mahindra Group), in discussion with the author, November, 2016.
169 Anirban Ghosh. “Internal Carbon Pricing-Practical Experiences from the Private Sector Featuring Mahindra & Mahindra.”
170 Hitesh Kataria (Manager, Group Sustainability, The Mahindra Group).
171 Pawan Goenka. “Internal Carbon Pricing-Practical Experiences from the Private Sector Featuring Mahindra & Mahindra.”
172 HP Billiton, Integrity Resilience Growth Sustainability Report.
173 BHP Billiton, “Climate Change,” accessed August 29, 2017, http://www.bhp.com/environment/climate-change.
174 Fiona Wild (Vice President Climate and Sustainability, BHP).
175 BHP Billiton Response to the CDP 2016 Climate Survey.
176 Fiona Wild (Vice President Climate and Sustainability, BHP).
177 BHP Billiton, “Climate Change.”
178 BHP Billiton, Climate Change: Portfolio Analysis Views after Paris (Melbourne, Australia: BHP Billiton, 2017), http://www.bhpbilliton.com/-/media/bhp/documents/investors/reports/2016/bhpbillitonclimatechangeporfolioanalysis2016.pdf?la=en.
179 BHP Billiton response to the CDP 2016 Climate Survey.
180 BHP Billiton, Climate Change: Portfolio Analysis (Melbourne, Australia: BHP Billiton, 2015), http://www.bhpbil-liton.com/-/media/bhp/documents/investors/reports/2015/bhpbillitonclimatechangeporfolioanalysis2015.pdf.
181 Ibid.
182 BHP Billiton, Climate Change: Portfolio Analysis.
183 BHP Billiton, Climate Change: Portfolio Analysis Views after Paris.
184 Ibid.
185 “Climate Change,” BHP Billiton.

Center for Climate and Energy Solutions40
The Center for Climate and Energy Solutions (C2ES) is an independent, nonpartisan, nonprofit organization working to forge practical solutions to climate change. We advance strong policy and action to reduce greenhouse gas emissions, promote clean energy, and strengthen resilience to climate impacts.
2101 WILSON BLVD. SUITE 550 ARLINGTON, VA 22201 703-516-4146 C2ES.ORG