Embed Size (px)
Citation preview


The Business of Small The Business of Small Business: Part IIIBusiness: Part III
Making The Case for Safety and HealthMaking The Case for Safety and Health
Directorate of Cooperative and State ProgramsDirectorate of Cooperative and State ProgramsOffice of Small Business AssistanceOffice of Small Business Assistance
April 28April 28thth, 2006, 2006

THE BUSINESS CASETHE BUSINESS CASE FOR SAFETY FOR SAFETY
Adding Value and Competitive AdvantageAdding Value and Competitive Advantage
A Joint Initiative of OSHA, Abbott, and A Joint Initiative of OSHA, Abbott, and The Center for Business and Public Policy The Center for Business and Public Policy
at Georgetown Universityat Georgetown University December 2005December 2005

GOAL OF ALLIANCE
• Alliance intended to address the shortage of:– Real world examples and – Practical information
for business executives demonstrating how “excellence in safety” adds value and provides competitive advantage…
for safety and health trainees demonstrating how safety and health programs must be integrated into business

HOW CAN THE MATERIAL BE USED?
• Presentation materials can be used:– Individually
• PowerPoint• Mini-case studies
– Tailored to the audience• By industry sector • PowerPoint slides can be used with all or selected
case study slides based on audience• Case studies can be used as teaching tools by
Business School Lecturers

WHY BE CONCERNED WITH SAFETY?
– Safety is good business– Right thing to do…
– Employee morale / protection of most valuable resource
– Control costs (direct and indirect)
– Safety and health excellence correlates with business excellence (quality, efficiency, profitability)
EXCELLENCE IN SAFETY & HEALTH Adds Business Value and Competitive Advantage …
Safety and Health
Ability to compete
Access to Global Markets
Cost and Risk Reduction
Enhanced Reputation
Employee morale
Improved quality
Improved efficiency
Improved productivity

INTEGRATED INTO THE BUSINESS…
Business Value
Linking steps
• Safety is a core value of the company’s culture
• A systems approach is taken toward safety
• Safety is integrated throughout the company
• Employees participate at all levels
• Corporate Image• Ability to Compete• Access to Global
Markets• Employee Morale• Efficiency and
Productivity• Product and
Service Quality• Cost and Risk
Reduction
• Senior management commitment and involvement
• Employee active participation
• Shared goals and accountability
• Defined roles and responsibilities
• Common language• Effective communication• Right resources• Balanced performance
measures• Knowledge sharing and
information transfer
Safety and Health Principles

BARRIERS TO INTEGRATION
Too often:
– Management has a reactive rather than proactive focus
– Lack of understanding (vocabulary)
– Risks & hazards are poorly communicated
– Safety is considered a cost … not an investment
– Cost/benefit analysis is rarely applied to justify the safety case
– Retrofitting is never as cost-effective as designing it right initially

SAFETY EXCELLENCE MODEL requires…
Management Management CommitmentCommitment
SystemsSystems
Safety and HealthSafety and HealthSite LeadershipSite Leadership
Employee Employee InvolvementInvolvement

VALUE CHAIN IMPACTSBusiness Process
ProcurementProcurement DesignDesign ManufacturingManufacturing ServiceService End of LifeEnd of Life
Leverage supplier
relationships
Safe and ergonomic processes
High quality and
productivity
Customer good-will
Future assets

SYSTEMSPerformance Metrics
Attitudes (set up conditions,
behavior)Program Elements
Physical conditions
Behavior (action)
- Perception surveys- Perception surveys
- Training- Accountability- Communications- Planning & Evaluation
- Roles & Procedures
- Incident Investigations
- Training- Accountability- Communications- Planning & Evaluation
- Roles & Procedures
- Incident Investigations
-Inspections-Audits-Risk assessments
-Prevention & control
-Inspections-Audits-Risk assessments
-Prevention & control
-Observations-Feedback loops
-Observations-Feedback loops
Incident or Near
Miss
- OSHA Recordables
- Lost Workdays
- Restricted Workdays
- OSHA Recordables
- Lost Workdays
- Restricted Workdays
Leading metrics
Trailing metrics
ORC Worldwide Metrics TaskforceORC Worldwide Metrics Taskforce

WHAT DO ACCIDENTS COST YOU?WHAT DO ACCIDENTS COST YOU?
Direct - Insured Costs
“Just the tip of the iceberg”Unseen costs can sink the
ship!
Indirect - Uninsured, hidden Costs - Out of pocketExamples: 1. Time lost from work by injured employee. 2. Lost time by fellow employees. 3. Loss of efficiency due to break-up of crew. 4. Lost time by supervisor. 5. Training costs for new/replacement workers. 6. Damage to tools and equipment. 7. Time damaged equipment is out of service. 8. Loss of production for remainder of the day. 9. Damage from accident: fire, water, chemical, explosives, etc. 10. Failure to fill orders/meet deadlines.11. Overhead costs while work was disrupted. 12. Other miscellaneous costs (over 100 other items may 13. Others? ________________________________
Unknown Costs -
1. Human Tragedy2. Morale3. Reputation

Accident Costs
1% Profit
2% Profit
3% Profit
$ 1,000 $ 100,000 $ 50,000 $ 33,000
$ 5,000 500,000 250,000 167,000
$ 10,000 1,000,000 500,000 333,000
$ 25,000 2,500,000 1,250,000 833,000
$100,000 10,000,000 5,000,000 3,333,000
SALES TO COVER COSTS
It is necessary to sell an additional $250,000 in products or services to pay the cost of $5,000 annual losses

IMPLEMENTING SAFETY EXCELLENCE
– Assume all incidents are preventable
– Assume all exposures/risks can be controlled
– Hold management responsible and accountable for preventing injuries
– Involve employees
– Make working safely a condition of employment
– Train employees to work safely
– Promote off-the-job safety
– Audit safetyAdapted from “Managing Safety: Techniques that Work for the Safety Pro”, Dupont

SAFETY’S ROLE IN BUSINESS FUNCTIONS
FINANCE / FINANCE / ACCOUNTINGACCOUNTING
OPERATIONSOPERATIONS
SAFETY SAFETY
and and HEALTHHEALTH
STRATEGYSTRATEGY
MANAGEMENT / MANAGEMENT / ORGANIZATIONAL ORGANIZATIONAL
BEHAVIORBEHAVIOR
MARKETING / MARKETING / RISK RISK
COMMUNICATIONCOMMUNICATION
The Center for Business and Public Policy at Georgetown University

“The guiding principle of business economics is not the maximization of
profits, but the avoidance of loss”
Peter Drucker
Author, Management Consultant

SUCCESS STORIES VS. BUSINESS CASES
• Success Story -Presents details of a well-handled situation.
Readers hopefully see similarities to future problems.
• Case Study -Poses a decision-focused challenge to
facilitate analysis and discussion. Learning from thinking about issues from the business manager’s
perspective. -Provides teaching notes with discussion questions and
learning objectives

SUCCESS STORIES/CASE STUDIES
– Review the impact of safety programs on the “bottom line” in several industries:– Construction– Foundry– Healthcare (Nursing Homes)– Auto Parts Manufacturing– Insurance– Pharmaceutical

WISCONSIN ALUMINUM FOUNDRY
• Success Story

WISCONSIN ALUMINUM FOUNDRYMSD Cost Analysis1-1-99 thru 10-1-03
Body Part Number Avg. Cost Cost Range
Back 128 $2,285 $81 - $48,851
Arm/Wrist 39 $4,941 $79 - $38,638
Shoulder 29 $5,017 $59 - $52,532

PROBLEM: Employees were required to use a jack hammer to remove and break up air set core from castings. Stressors included vibration & bending over for 4-8 hrs/day.
SOLUTION: A core lump crusher has been purchased to eliminate the use of the jack hammer.
COST: $51,000
COST RECOVERY TIME: 8-12 months
BENEFITS: Eliminated strain from repetition, vibration and poor posture, increased productivity, recovery rate and reduced manpower.
BEFORE AFTER

PROBLEM: Employees in the Finishing Department were sanding 500-1000 castings with many hand movements. The employee must support the weight of the casting (2-10#) while rotating the casting.
SOLUTION: One robotic sander installed.
COST: $176,000
COST RECOVERY TIME: 6-12 months
BENEFITS: Eliminated strain from repetition and force, increased productivity and reduced manpower.
BEFORE AFTER

WISCONSIN ALUMINUM FOUNDRYWorkers Compensation Loss Summary
2000 2001 2002 20030
50
100
150
200
0
100,000
200,000
300,000
400,000
500,000
166
8894
23
388,970
110,01291,059
13,814
NU
MB
ER
OF
CL
AIM
SC
OS
T O
F C
LA
IMS
# CLAIMS $ CLAIMS
(4 months)

STADIUM CONSTRUCTION CASE STUDIES
A number of stadiums were built in the past few years in Region 5.

MILLER PARK STADIUM
July 1999 crane collapse caused the deaths of 3 construction workers.
Hours before collapse of “Big Blue” After collapse of “Big Blue”

July 14, 1999
• Three iron-workers, in a suspended personnel platform monitoring the passage of a roof section, died after falling approximately 300 feet to the ground when the personnel platform was struck by the uncontrolled load of a heavy-lift crane. The victims were working in windy conditions during the construction of a baseball stadium.

The destruction was extensive

The Sad Results
• Delayed the opening for One Year • 100 Million in repairs • Three construction workers killed, several
others injured• On Dec. 1, 2000, a Milwaukee County jury
awarded $94 million in punitive damages and $5.25 million in compensatory damages to the families of three ironworkers killed in the accident. Although the families have been paid $27 million for their loss, the issue of the large punitive damage award is under appeal.

PAUL BROWN STADIUM
– OSHA Partnership– Labor/Management Partnership
Construction took 2-1/2 years and cost $453 million.

PAUL BROWN STADIUM RESULTS
– Significant decrease in expected injuries:– 0.95 lost time rate v. 4.0 for construction
– Significant program savings– $4.6 million less in workers comp and liability
cost than would be expected.
– No fatalities!– Only one fall injury

The Great American Ballpark;WHAT TO DO?
• County Administrator
• Miller Park vs. Paul Brown
• Bad luck vs. good luck?
• OSHA Partnership?
• Safety and Health Program?
• Owner Insurance vs. Contractors’ policies?
• Indicators/Metrics?

GREAT AMERICAN BALLPARK
– OSHA Partnership
•Estimated savings from Owner Control Insurance Program was over $3 million (1999-2003).
•1.2 million hours; 0.8 lost time rate
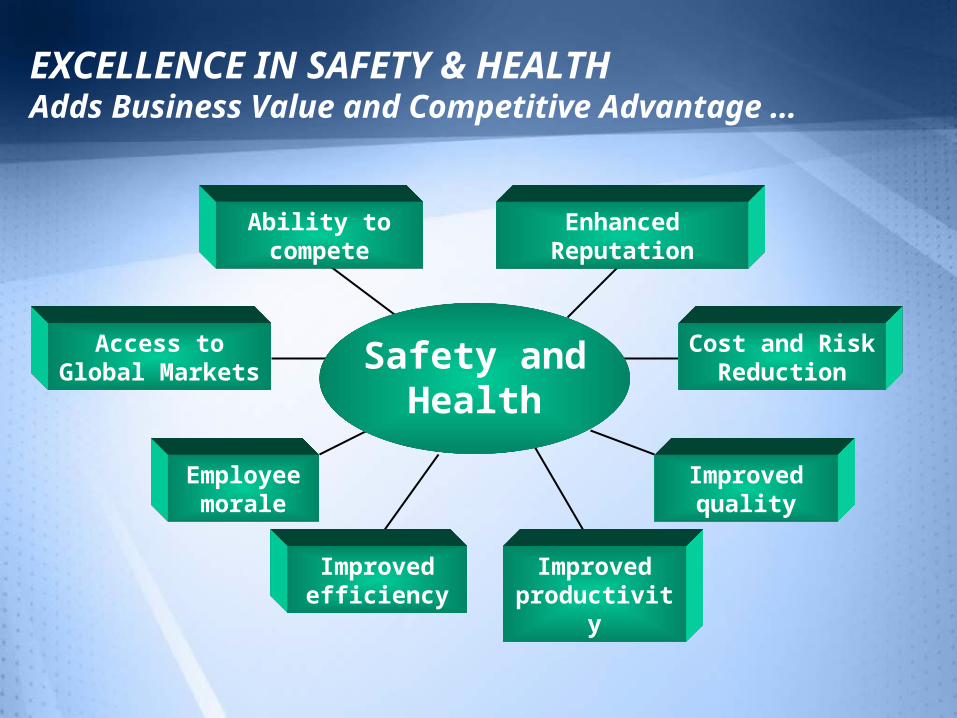
OSHA Abbott Alliance Web PageOSHA Abbott Alliance Web Page


Safety and Health in Small Safety and Health in Small Businesses: Some Businesses: Some
ChallengesChallenges
OSHAOSHAApril 28, 2006April 28, 2006

Lamar ReinschLamar ReinschProfessor of ManagementProfessor of Management
McDonough School of BusinessMcDonough School of Business
Georgetown UniversityGeorgetown [email protected]@georgetown.edu

Increasingly, Organizations Increasingly, Organizations Recognize Workplace Safety Recognize Workplace Safety
as a Good Investmentas a Good Investment

New Factory
IncreasedSales
MoreWidgets
AvailableResources
Return onInvestment
Capital Budgeting Process

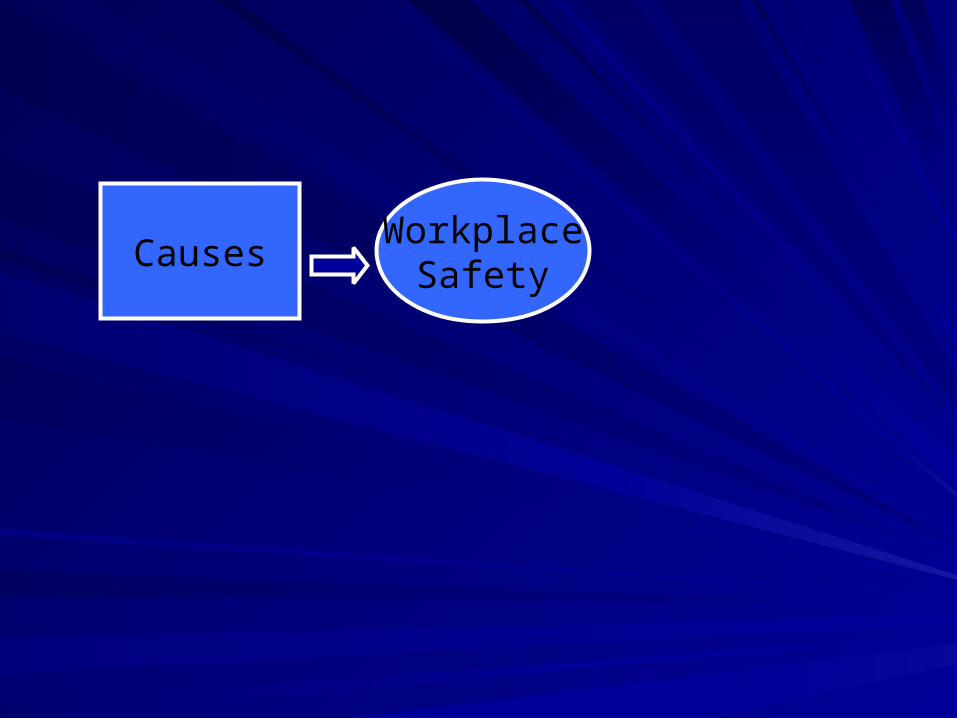
SafetyCauses
SafetyEffects
WorkplaceSafety
AvailableResources
Return onInvestment
Capital Budgeting: Investing in Safety
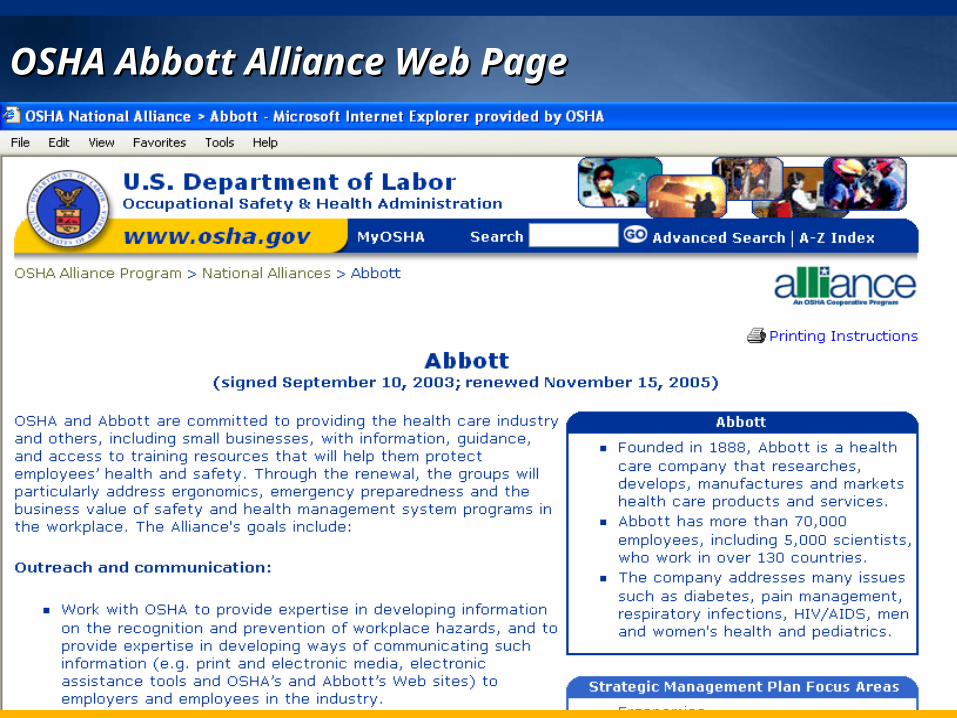
Safety Performance
Pro
du
ctiv
ity/ F
ina
nc
ial P
erfo
rma
nc
e
CausesWorkplace
Safety

Leadership FewerInjuries
LowerRisk
SafetyConsciousness
SafetyClimate
Adapted from Barling, Loughlin, & Kelloway (2002), J. of App. Psy.

EffectsWorkplace
Safety
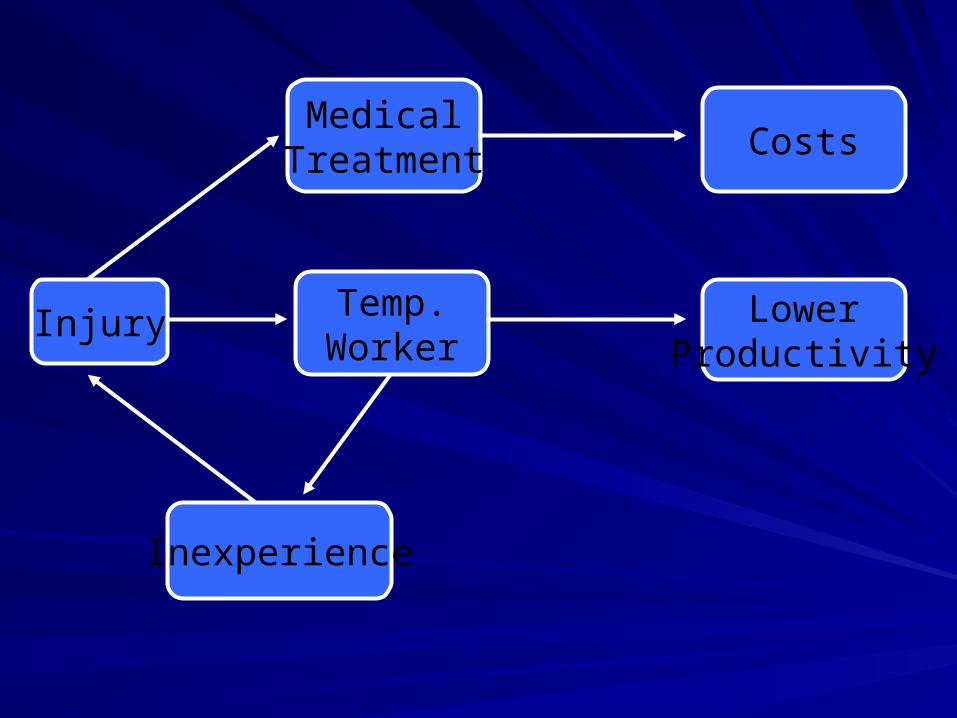
Injury
MedicalTreatment
Temp.Worker
Costs
LowerProductivity
Inexperience

Risk & Injury
PersonalInsecurity
Lower Morale
Costs
LowerProductivity
Turnover
Distraction

Risk &Injury
Lower Morale
NegativeMedia
AttentionHigher
Turnover
+Costs and -Revenue
InvestigationsAnd Lawsuits

SaferWorkplace
Higher Productivity
HigherROI
PositivePR
IncreasedCompany
Value
ReducedCosts

So, Why Isn’t the Value of So, Why Isn’t the Value of Safety and Health Obvious to Safety and Health Obvious to
Small Businesses?Small Businesses?

““Small Businesses” Tend:Small Businesses” Tend:
To Employ Fewer PeopleTo Employ Fewer PeopleTo Be Younger (newer) To Be Younger (newer) OrganizationsOrganizationsTo Be Owner ManagedTo Be Owner ManagedTo Have Less Internal S&H ExpertiseTo Have Less Internal S&H Expertise

Challenge #1: Reasoning Challenge #1: Reasoning from a Small Samplefrom a Small Sample
But, the Risk per Employee is But, the Risk per Employee is Greater in Smaller CompaniesGreater in Smaller Companies

Challenge #2: A Short (and Challenge #2: A Short (and so far Spotless) Historyso far Spotless) History
But, Past Experience Does But, Past Experience Does Not Guarantee Future ResultsNot Guarantee Future Results

Challenge #3: Challenge #3: Understanding Near Understanding Near
MissesMisses
A Near Miss is a Warning – A Near Miss is a Warning – Not a Reassurance Not a Reassurance (Profs. Robin (Profs. Robin Dillon-Merrill & Cathy Tinsley)Dillon-Merrill & Cathy Tinsley)

Challenge #4: Unpleasant Challenge #4: Unpleasant Thoughts are UnpleasantThoughts are Unpleasant
But, failing “to think the But, failing “to think the unthinkable” precludes unthinkable” precludes preparation preparation (Prof. Ian Mitroff)(Prof. Ian Mitroff)
Challenge #5: Challenge #5: Understanding the Understanding the
ConsequencesConsequences
A Serious Accident Can End a A Serious Accident Can End a Small BusinessSmall Business

Challenge #6: “The Challenge #6: “The ‘Experts’ Are Overly ‘Experts’ Are Overly
Cautious”Cautious”
But, the experts would prefer But, the experts would prefer to help businesses to help businesses preventprevent problems problems

Challenge -#7: Hoping Challenge -#7: Hoping for the Bestfor the Best
But, “Hope is Not A Strategy” But, “Hope is Not A Strategy” (Prof. Paul Almeida).(Prof. Paul Almeida).
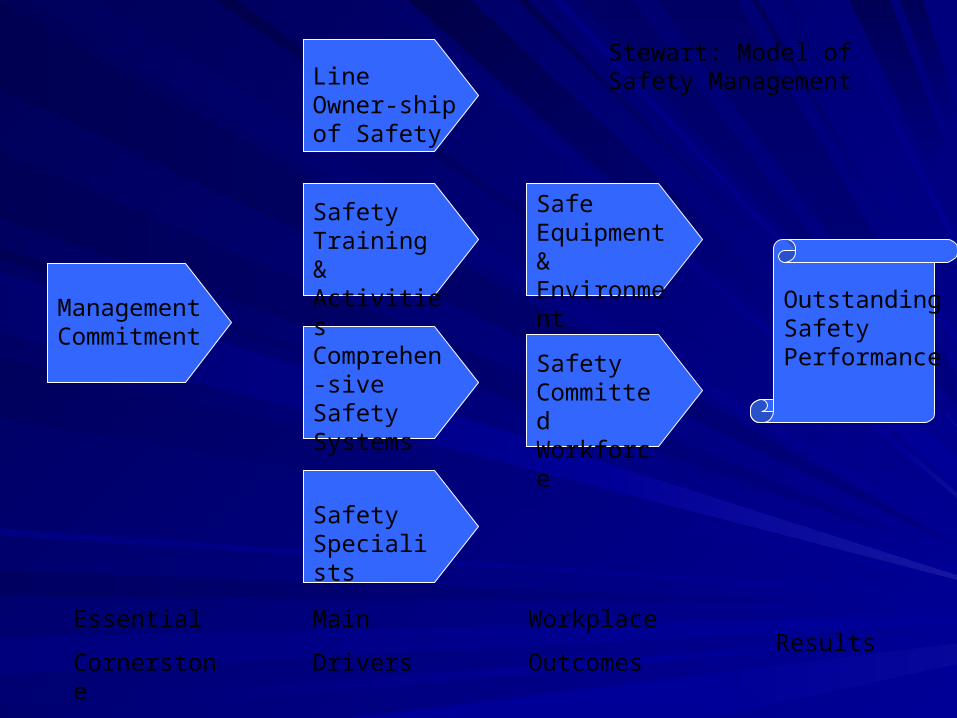
Management Commitment
Line Owner-ship of Safety
Safety Training & Activities
Comprehen-sive Safety Systems
Safety Specialists
Safe Equipment & Environment
Safety Committed Workforce
Outstanding Safety Performance
Main
Drivers
Essential
Cornerstone
Workplace
OutcomesResults
Stewart: Model of Safety Management

Safety & Health Add Value bySafety & Health Add Value by
Reducing Health Care CostsReducing Health Care Costs
Improving ProductivityImproving Productivity
Increasing EfficiencyIncreasing Efficiency
Improving Product/Service QualityImproving Product/Service Quality
Enhancing MoraleEnhancing Morale
Strengthening Company ImageStrengthening Company Image
Aiding CompetitivenessAiding Competitiveness

Safety and HealthSafety and Health
The Right Thing to DoThe Right Thing to Do
A Good InvestmentA Good Investment


Winchester Plant
Visitor Welcome
and
Safety Guide

Company Profile• Locations: Winchester, VA (Headquarters & Production ) - 1996
Fernley, NV - 1999
Olive Branch, MS - 2005• Former division of Mobil Corporation• Trex Company, Inc. is the manufacturer of Trex® decking
and railing, the leading brand of alternative decking lumber in North America.
1) Process 300,000,000 lbs. of used polyethylene each yeara) 50% (apx.) of recycled grocery bags available on the market
2) Process 300,000,000 lbs. of used hardwood/sawdust each year

IMAGINE THE POSSIBILITIES...
• Create Your Space® • Decks & More Decks • Docks, Pools & Marinas
• Patios & Porches • Railings • Fencing • Landscapes • Commercial Showcase • Site Amenities

Production Flow Chart In-Coming Plastic
Weigh Unit
Heating Unit
Mixing Unit
Extruder
Water Bath
In- feed Conveyor Reclaim
Quality Hold Area
Finished Goods Inventory
Cooling Conveyor & Finished Goods Inspection
Traveling Saw
In-Coming Wood
Wood Storage
Wood Hammermill
Magnet
Magnet Magnet
Rock Box
Plastic Granulators
Magnet
Fluff Storage
Contaminant Removal
OR Embossing
In-Coming Wood In-Coming Plastic

Participation Improved OurBottom Line By…
• Reducing work-related accidents/illnesses1) Effective use of trend analysis to target & reduce
employee injuries/illness
2) Development of action plans to focus on critical root causes of accidents
3) Alignment of values/goals with co-employer values/goals (i.e., injury free workplace)

H e a d :
N e c k : 1
C h e s t : 1
B a c k :
W h o l e B o d y :
F a c e :
A r m / S h o u l d e r :
H a n d /
W r i s t :
F i n g e r s :
K n e e :
F o o t :
“B o b b y T R e x ” R e p o r t e d I n j u r i e s t o m y b o d y
S a f e t y T r i a n g le 2 0 0 5
N e a r M is s : P r o p e r t y D a m a g e : F i r e : E n v ir o n m e n t a l : O t h e r :
F ir s t A id
R e c o r d a b le
F a t a lit y
P e l v i s / G r o i n :
Safety Triangle 2006

Participation Improved OurBottom Line By…
• Decreasing Workers’ Compensation Costs1) Provide immediate onsite medical attention
2) Offer a “Modified Duty” program
2003-2004
• Payroll = $18,000,000
• Experience Modifier = 1.17
• Premium = $360,000
2004-2005
• Payroll = $25,000,000
• Experience Modifier = 0.79
• Premium = $360,000

Participation Improved OurBottom Line By…TREX WORKERS' COMPENSATION RATES
1.17 1.15
1.77
0.790.77
0
1
2
3
4
5
6
7
2005 - 2006 2004 - 2005 2003 – 2004 2002 - 2003 2002 - 2001
VA Production Rate
NV Production Rate
MS Production Rate
Experience Modifier

Participation Improved OurBottom Line By…
• Limiting equipment damage & production losses
1) Onsite emergency response (i.e., Industrial FFI/FFII)

Participation Improved OurBottom Line By…
• Ensuring compliance to the latest legislation
OSHA Issues Final Standard on Hexavalent
Chrome

Participation Improved OurBottom Line By…
• Promoting “Continuous Improvement”1) Implementation of an EHS auditing/program
evaluation process involving both internal & external resources (i.e., VOSH, SHARP/VPP worksite representatives, intra-company EHS representatives, etc.)
2) Benchmarking and sharing of “best practices” among other SHARP/VPP worksites
3) Employee EHS Perception Surveys
Participation Improved OurBottom Line By…
• Enhancing public recognition within the composite decking & plastic industries and community
1) Improve company image by demonstrating a commitment to manage & minimize risks to employees, contractors and visitors
2) Share “best practices” with other industries (i.e., NSVSN)

Participation Improved OurBottom Line By…
• Strengthening commitment to safety & furthering awareness among all employees
1) Improve performance through standardization of & adherence to internal EHS policies and procedures
2) Establishment of the T-SHERT Committee to ensure safety & health workplace concerns are listened to and acted upon
3) Development & implementation of a formal EHS training matrix

Participation Improved OurBottom Line By…
H office H plant (HOLIDAYS) A & C B & D
Sun Mon Tue Wed Thu Fri Sat 1
2 3 4Activities Committee Meeting B&D Crew 7-8 am
5 6Activities Committee Meeting A&C Crew 7-8 am
7 8
9 10 1 hour Training A&C Crew 6:00 am/pm
11 B&D T-SHERT
12 1 hour Training B&D Crew 6:00 am/pm
13 14 H 15
16 17 18 A&C T-SHERT Roundtable B Crew 9-10 am Building #1 Training Room
19 20 21 22
23 24
25 26 Roundtable D Crew 9-10 pm Building #1 Training Room
27 Love em’ or Lose em’ class 1-3pm Building #3 Communication Room
28 29
30
2006
April
Participation Improved OurBottom Line By…
• Improving employee communication1) Implementation of a variety of communication
vehicles (i.e., roundtable discussions, focused training sessions, newsletters, employee perception surveys, marquis signs, etc.)

Participation Improved OurBottom Line By…
• Leveraging government resources1) Flow of information from the private sector to
VOSH on successful methods of addressing workplace safety and health
2) Industrial Hygiene services provided by VOSH