Embed Size (px)
Citation preview
Phone: +1-800-525-3915 Website: www.3PLogistics.com Email: [email protected]
TRENDS IN 3PL / CUSTOMER RELATIONSHIPS
November 2016January 2021
Market Size, Major 3PLs, Benchmarking Costs, Prices and Practices
The Business of Warehousing in North America in the E-Commerce Era
All Rights Reserved.
No part of this publication may be reproduced, stored in a retrieval system or transmitted in any form by any means, electronic, mechanical, photocopied, recorded or otherwise, without the prior permission of the publisher, Armstrong & Associates, Inc.
The facts of this report are believed to be correct at the time of publication but cannot be guaranteed. Please note that the findings, conclusions and recommendations that Armstrong & Associates delivers will be based on information gathered in good faith from both primary and secondary sources, whose accuracy we are not always in a position to guarantee. As such, Armstrong & Associates can accept no liability whatsoever for actions taken based on any information that may subsequently prove to be incorrect.
©2021 Armstrong & Associates
ABOUT ARMSTRONG & ASSOCIATES, INC.Armstrong & Associates, Inc. (A&A) was established in 1980 to meet the needs of a newly deregulated domestic transportation market. Since then, through its leading Third-Party Logistics (3PL) market research and history of helping companies outsource logistics functions, A&A has become an internationally recognized key resource for 3PL market information and consulting.
A&A’s mission is to have leading proprietary supply chain knowledge and market research not available anywhere else. As proof of our continued work in supporting our mission, A&A’s 3PL market research is frequently cited in media articles, publications, and securities filings by publicly traded 3PLs. In addition, A&A’s email newsletter currently has over 88,000 subscribers globally.
A&A’s market research complements its consulting activities by providing continually updated data for analysis. Based upon its unsurpassed knowledge of the 3PL market and the operations of leading 3PLs, A&A has provided strategic planning consulting services to over 30 3PLs, supported 23 closed investment transactions, and provided advice to numerous companies looking to benchmark existing 3PL operations or outsource logistics functions.
©2021 Armstrong & Associates
Contents
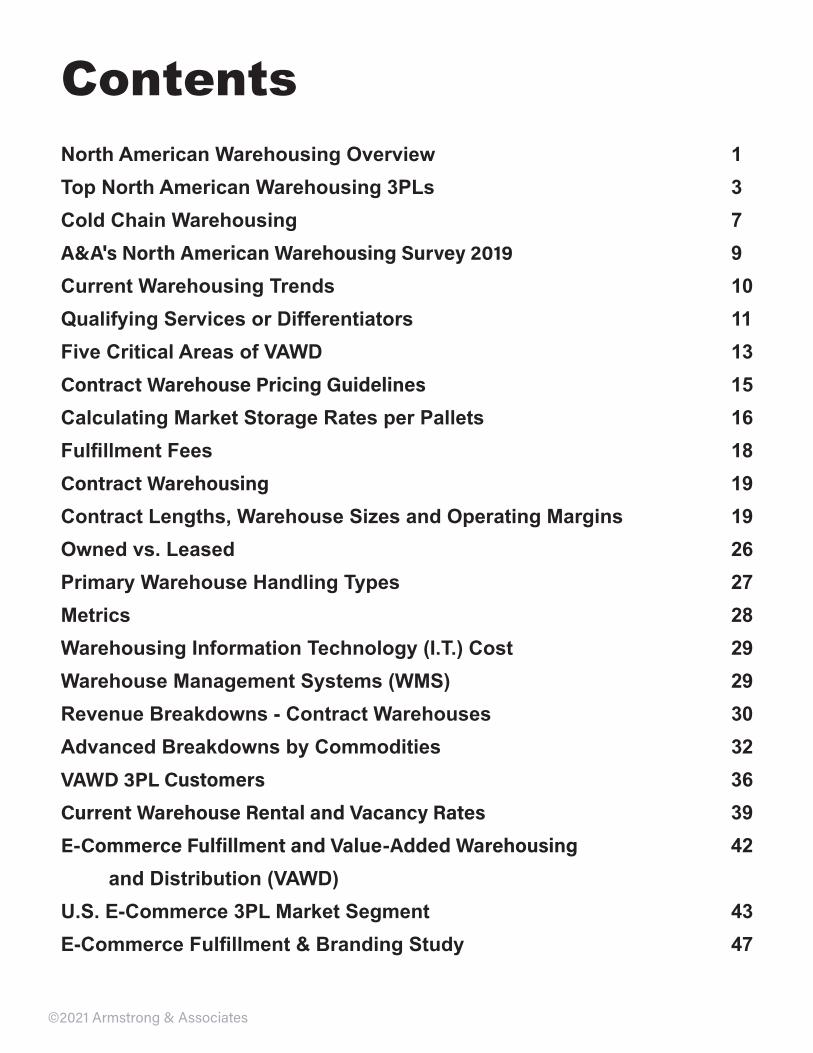
North American Warehousing Overview 1Top North American Warehousing 3PLs 3Cold Chain Warehousing 7A&A's North American Warehousing Survey 2019 9Current Warehousing Trends 10Qualifying Services or Differentiators 11Five Critical Areas of VAWD 13Contract Warehouse Pricing Guidelines 15Calculating Market Storage Rates per Pallets 16Fulfillment Fees 18Contract Warehousing 19Contract Lengths, Warehouse Sizes and Operating Margins 19Owned vs. Leased 26Primary Warehouse Handling Types 27Metrics 28Warehousing Information Technology (I.T.) Cost 29Warehouse Management Systems (WMS) 29Revenue Breakdowns - Contract Warehouses 30Advanced Breakdowns by Commodities 32VAWD 3PL Customers 36Current Warehouse Rental and Vacancy Rates 39E-Commerce Fulfillment and Value-Added Warehousing 42 and Distribution (VAWD)U.S. E-Commerce 3PL Market Segment 43E-Commerce Fulfillment & Branding Study 47
1
OvervIew
©2021 Armstrong & Associates
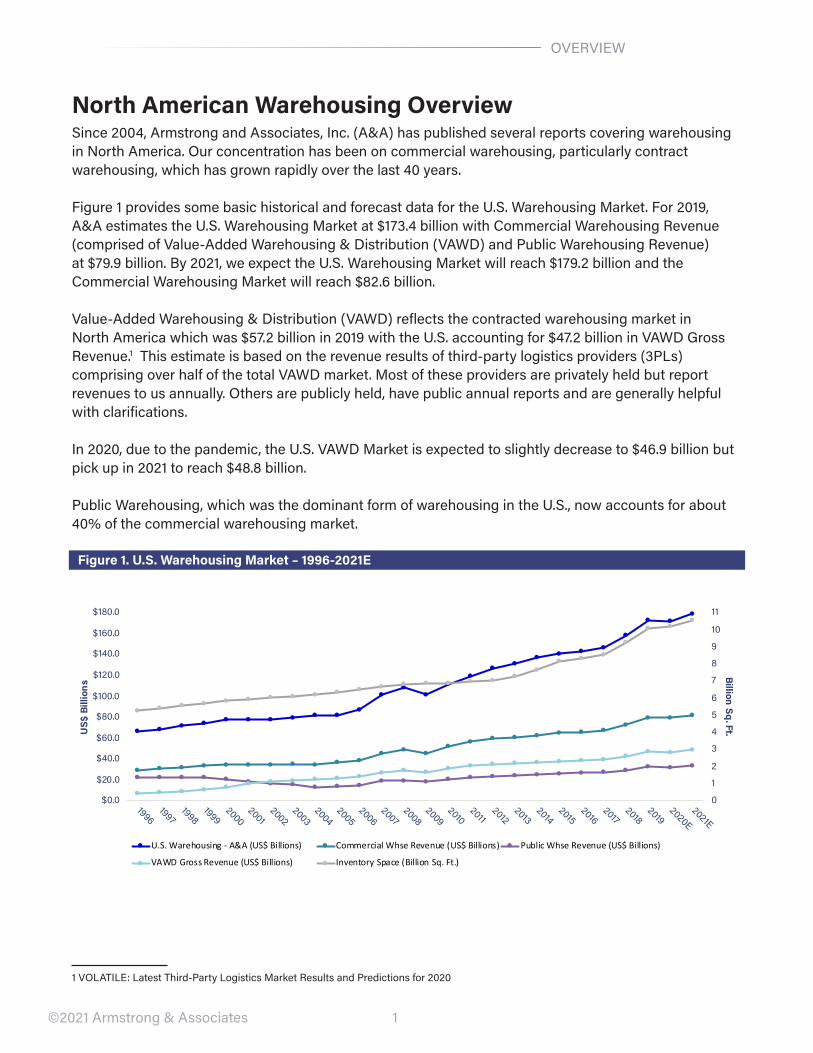
North American Warehousing OverviewSince 2004, Armstrong and Associates, Inc. (A&A) has published several reports covering warehousing in North America. Our concentration has been on commercial warehousing, particularly contract warehousing, which has grown rapidly over the last 40 years.
Figure 1 provides some basic historical and forecast data for the U.S. warehousing Market. For 2019, A&A estimates the U.S. warehousing Market at $173.4 billion with Commercial warehousing revenue (comprised of value-Added warehousing & Distribution (vAwD) and Public warehousing revenue) at $79.9 billion. By 2021, we expect the U.S. warehousing Market will reach $179.2 billion and the Commercial warehousing Market will reach $82.6 billion.
value‐Added warehousing & Distribution (vAwD) reflects the contracted warehousing market in North America which was $57.2 billion in 2019 with the U.S. accounting for $47.2 billion in vAwD Gross revenue.1 This estimate is based on the revenue results of third-party logistics providers (3PLs) comprising over half of the total vAwD market. Most of these providers are privately held but report revenues to us annually. Others are publicly held, have public annual reports and are generally helpful with clarifications.
In 2020, due to the pandemic, the U.S. vAwD Market is expected to slightly decrease to $46.9 billion but pick up in 2021 to reach $48.8 billion.
Public warehousing, which was the dominant form of warehousing in the U.S., now accounts for about 40% of the commercial warehousing market.
Figure 1. U.S. Warehousing Market – 1996-2021E
0
1
2
3
4
5
6
7
8
9
10
11
$0.0
$20.0
$40.0
$60.0
$80.0
$100.0
$120.0
$140.0
$160.0
$180.0
19961997
19981999
20002001
20022003
20042005
20062007
20082009
20102011
20122013
20142015
20162017
20182019
2020E2021E
Billion Sq. Ft.US$
Bill
ions
U.S. Warehousing - A&A (US$ Billions) Commercial Whse Revenue (US$ Billions) Public Whse Revenue (US$ Billions)
VAWD Gross Revenue (US$ Billions) Inventory Space (Billion Sq. Ft.)
1 vOLATILe: Latest Third-Party Logistics Market results and Predictions for 2020
2
OvervIew
©2021 Armstrong & Associates
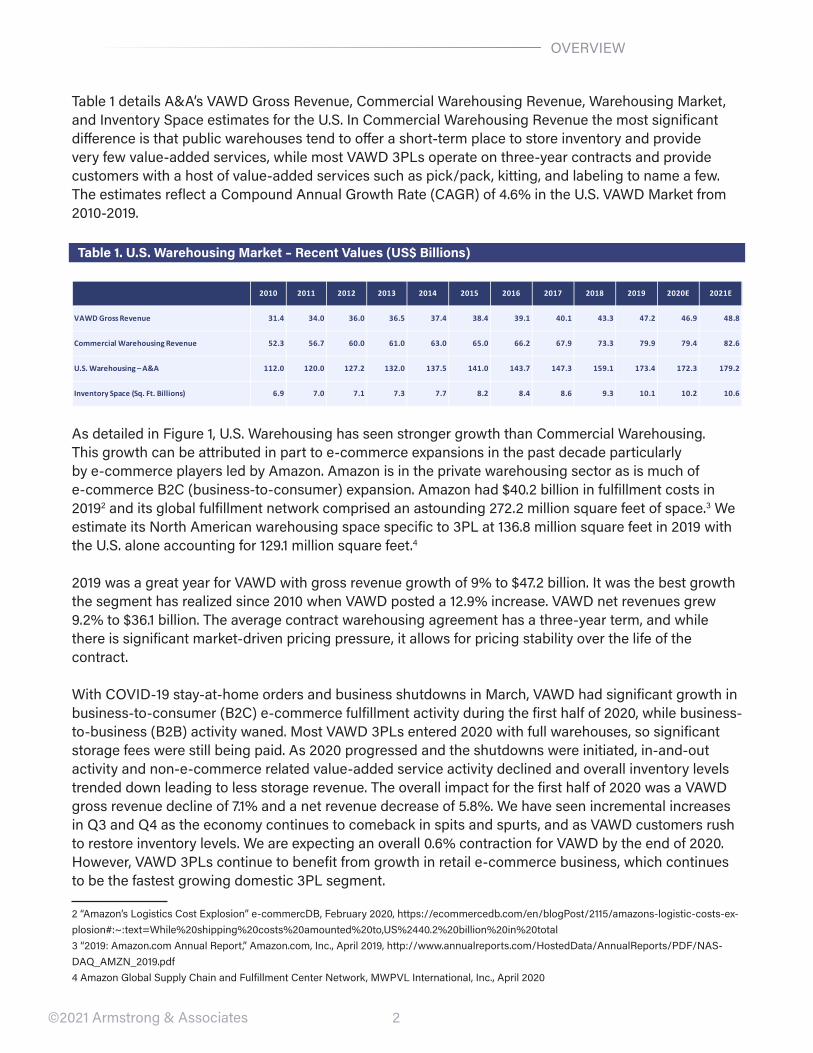
Table 1 details A&A’s vAwD Gross revenue, Commercial warehousing revenue, warehousing Market, and Inventory Space estimates for the U.S. In Commercial warehousing revenue the most significant difference is that public warehouses tend to offer a short-term place to store inventory and provide very few value-added services, while most vAwD 3PLs operate on three-year contracts and provide customers with a host of value-added services such as pick/pack, kitting, and labeling to name a few. The estimates reflect a Compound Annual Growth rate (CAGr) of 4.6% in the U.S. vAwD Market from 2010-2019.
Table 1. U.S. Warehousing Market – Recent Values (US$ Billions)
2010 2011 2012 2013 2014 2015 2016 2017 2018 2019 2020E 2021E
VAWD Gross Revenue 31.4 34.0 36.0 36.5 37.4 38.4 39.1 40.1 43.3 47.2 46.9 48.8
Commercial Warehousing Revenue 52.3 56.7 60.0 61.0 63.0 65.0 66.2 67.9 73.3 79.9 79.4 82.6
U.S. Warehousing – A&A 112.0 120.0 127.2 132.0 137.5 141.0 143.7 147.3 159.1 173.4 172.3 179.2
Inventory Space (Sq. Ft. Billions) 6.9 7.0 7.1 7.3 7.7 8.2 8.4 8.6 9.3 10.1 10.2 10.6
As detailed in Figure 1, U.S. warehousing has seen stronger growth than Commercial warehousing. This growth can be attributed in part to e-commerce expansions in the past decade particularly by e-commerce players led by Amazon. Amazon is in the private warehousing sector as is much of e-commerce B2C (business-to-consumer) expansion. Amazon had $40.2 billion in fulfillment costs in 20192 and its global fulfillment network comprised an astounding 272.2 million square feet of space.3 we estimate its North American warehousing space specific to 3PL at 136.8 million square feet in 2019 with the U.S. alone accounting for 129.1 million square feet.4
2019 was a great year for vAwD with gross revenue growth of 9% to $47.2 billion. It was the best growth the segment has realized since 2010 when vAwD posted a 12.9% increase. vAwD net revenues grew 9.2% to $36.1 billion. The average contract warehousing agreement has a three‐year term, and while there is significant market‐driven pricing pressure, it allows for pricing stability over the life of the contract.
with COvID-19 stay-at-home orders and business shutdowns in March, vAwD had significant growth in business-to-consumer (B2C) e-commerce fulfillment activity during the first half of 2020, while business-to-business (B2B) activity waned. Most vAwD 3PLs entered 2020 with full warehouses, so significant storage fees were still being paid. As 2020 progressed and the shutdowns were initiated, in-and-out activity and non-e-commerce related value-added service activity declined and overall inventory levels trended down leading to less storage revenue. The overall impact for the first half of 2020 was a vAwD gross revenue decline of 7.1% and a net revenue decrease of 5.8%. we have seen incremental increases in Q3 and Q4 as the economy continues to comeback in spits and spurts, and as vAwD customers rush to restore inventory levels. we are expecting an overall 0.6% contraction for vAwD by the end of 2020. However, vAwD 3PLs continue to benefit from growth in retail e‐commerce business, which continues to be the fastest growing domestic 3PL segment.
2 “Amazon’s Logistics Cost explosion” e-commercDB, February 2020, https://ecommercedb.com/en/blogPost/2115/amazons-logistic-costs-ex-plosion#:~:text=while%20shipping%20costs%20amounted%20to,US%2440.2%20billion%20in%20total3 “2019: Amazon.com Annual report,” Amazon.com, Inc., April 2019, http://www.annualreports.com/HostedData/Annualreports/PDF/NAS-DAQ_AMZN_2019.pdf4 Amazon Global Supply Chain and Fulfillment Center Network, MwPvL International, Inc., April 2020
3
TOP wAreHOUSING 3PLs
©2021 Armstrong & Associates
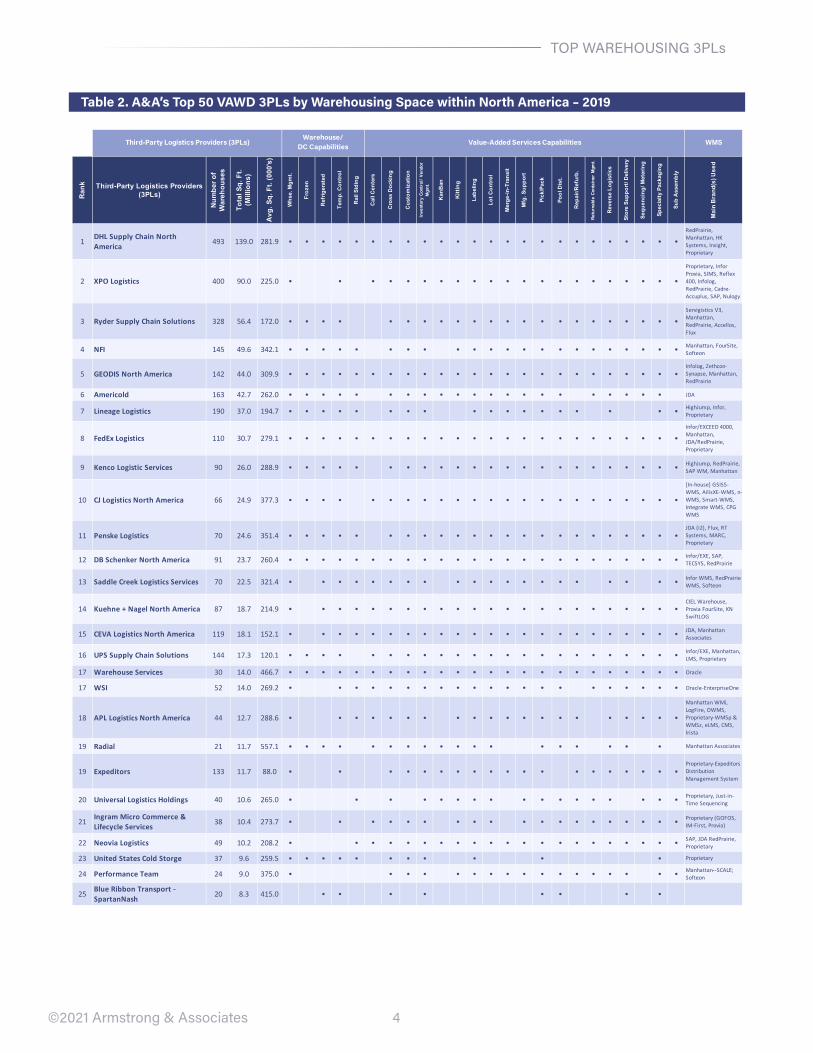
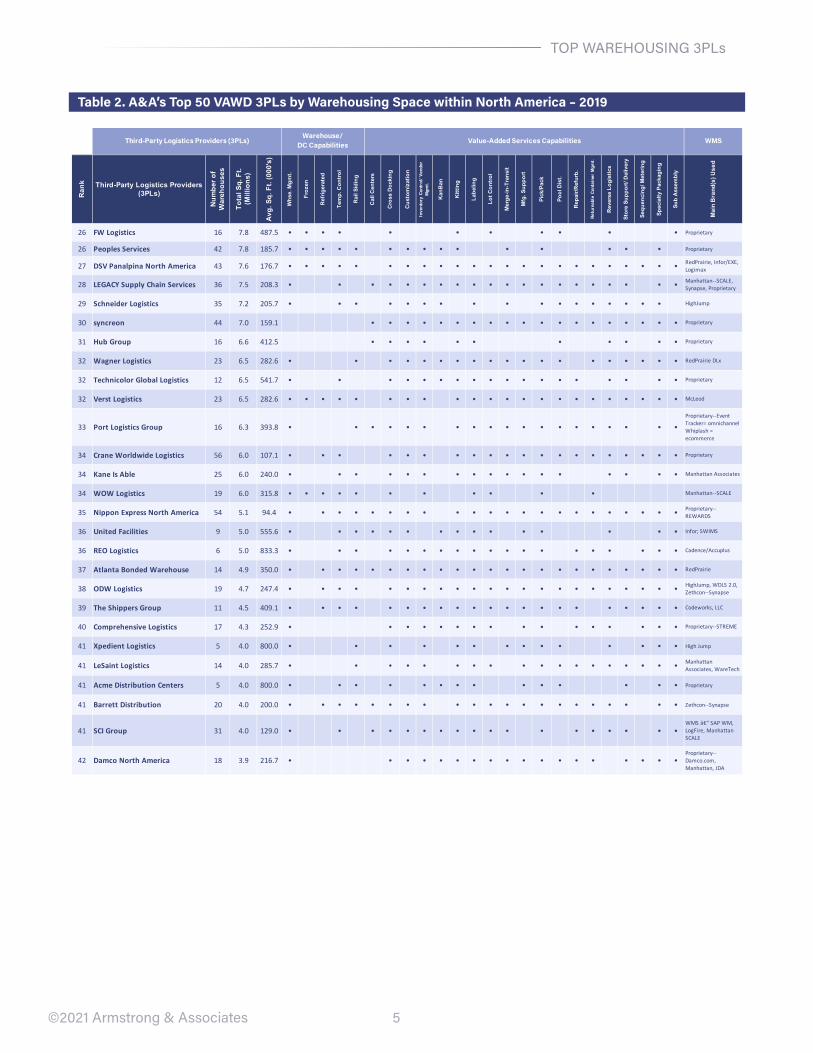
Top North American Warehousing 3PLsTable 2 lists the Top 50 North American warehousing 3PLs based on warehousing space within North America. It also includes their value-added services capabilities and latest warehouse management systems (wMS) used.5 Overall, our Top 50 vAwD 3PLs have 3,825 facilities totaling 940.1 million square feet. They also have an average of 71 warehouses covering 310,973 square feet. DHL Supply Chain leads the pack with 139 million square feet of warehousing space within North America, XPO is second with 90 million square feet, and ryder SCS is third with 56.4 million. when comparing Amazon on a more apples-to-apples basis to the “traditional” 3PLs listed, it ranks second with 136.8 million square feet of space within North America.6
Warehousing Space within North America – 2019
5 A&A’s who’s who in Logistics Online Guide6 Amazon Global Supply Chain and Fulfillment Center Network, MwPvL International, Inc., April 2020 (including Fulfillment Centers, Supple-mental Centers and returns Centers; Pantry/Fresh Food Fulfillment Centers and whole Foods retail Grocery Distribution Centers, and exclud-ing Prime Now Hubs, Sortation Centers, Delivery Stations, Airport Hubs and Data Centers)
4
TOP wAreHOUSING 3PLs
©2021 Armstrong & Associates
Table 2. A&A’s Top 50 VAWD 3PLs by Warehousing Space within North America – 2019
WMS
Rank Third-Party Logistics Providers
(3PLs)
Num
ber o
f W
areh
ouse
s
Tota
l Sq.
Ft.
(Mill
ions
)
Avg.
Sq.
Ft.
(000
's)
Whs
e. M
gmt.
Froz
en
Ref
riger
ated
Tem
p. C
ontr
ol
Rai
l Sid
ing
Cal
l Cen
ters
Cro
ss D
ocki
ng
Cus
tom
izat
ion
Inve
ntor
y Co
ntro
l/ Ve
ndor
M
gmt.
Kan
Ban
Kitt
ing
Labe
ling
Lot C
ontr
ol
Mer
ge-in
-Tra
nsit
Mfg
. Sup
port
Pick
/Pac
k
Pool
Dis
t.
Rep
air/R
efur
b.
Retu
rnab
le C
onta
iner
Mgm
t.
Rev
erse
Log
istic
s
Stor
e Su
ppor
t/ D
eliv
ery
Sequ
enci
ng/ M
eter
ing
Spec
ialty
Pac
kagi
ng
Sub
Ass
embl
y
Mai
n B
rand
(s) U
sed
1 DHL Supply Chain North America 493 139.0 281.9 ● ● ● ● ● ● ● ● ● ● ● ● ● ● ● ● ● ● ● ● ● ● ● ●
RedPrairie, Manhattan, HK Systems, Insight, Proprietary
2 XPO Logistics 400 90.0 225.0 ● ● ● ● ● ● ● ● ● ● ● ● ● ● ● ● ● ● ● ● ●
Proprietary, Infor Provia, SIMS, Reflex 400, Infolog, RedPrairie, Cadre-Accuplus, SAP, Nulogy
3 Ryder Supply Chain Solutions 328 56.4 172.0 ● ● ● ● ● ● ● ● ● ● ● ● ● ● ● ● ● ● ● ● ● ●
Servigistics V3, Manhattan, RedPrairie, Accellos, Flux
4 NFI 145 49.6 342.1 ● ● ● ● ● ● ● ● ● ● ● ● ● ● ● ● ● ● ● ● ● ●Manhattan, FourSite, Softeon
5 GEODIS North America 142 44.0 309.9 ● ● ● ● ● ● ● ● ● ● ● ● ● ● ● ● ● ● ● ● ● ● ● ●Infolog, Zethcon-Synapse, Manhattan, RedPrairie
6 Americold 163 42.7 262.0 ● ● ● ● ● ● ● ● ● ● ● ● ● ● ● ● ● ● ● ● ● JDA
7 Lineage Logistics 190 37.0 194.7 ● ● ● ● ● ● ● ● ● ● ● ● ● ● ● ● ● ●HighJump, Infor, Proprietary
8 FedEx Logistics 110 30.7 279.1 ● ● ● ● ● ● ● ● ● ● ● ● ● ● ● ● ● ● ● ● ● ● ● ●
Infor/EXCEED 4000, Manhattan, JDA/RedPrairie, Proprietary
9 Kenco Logistic Services 90 26.0 288.9 ● ● ● ● ● ● ● ● ● ● ● ● ● ● ● ● ● ● ● ● ● ● ●HighJump, RedPrairie, SAP WM, Manhattan
10 CJ Logistics North America 66 24.9 377.3 ● ● ● ● ● ● ● ● ● ● ● ● ● ● ● ● ● ● ● ● ● ● ●
[In-house] GSISS-WMS, AilisXE-WMS, n-WMS, Smart-WMS, Integrate WMS, CPG WMS
11 Penske Logistics 70 24.6 351.4 ● ● ● ● ● ● ● ● ● ● ● ● ● ● ● ● ● ● ● ● ● ● ●JDA (i2), Flux, RT Systems, MARC, Proprietary
12 DB Schenker North America 91 23.7 260.4 ● ● ● ● ● ● ● ● ● ● ● ● ● ● ● ● ● ● ● ● ● ● ● ●Infor/EXE, SAP, TECSYS, RedPrairie
13 Saddle Creek Logistics Services 70 22.5 321.4 ● ● ● ● ● ● ● ● ● ● ● ● ● ● ● ● ● ● ● ●Infor WMS, RedPrairie WMS, Softeon
14 Kuehne + Nagel North America 87 18.7 214.9 ● ● ● ● ● ● ● ● ● ● ● ● ● ● ● ● ● ● ● ● ● ● ●CIEL Warehouse, Provia FourSite, KN SwiftLOG
15 CEVA Logistics North America 119 18.1 152.1 ● ● ● ● ● ● ● ● ● ● ● ● ● ● ● ● ● ● ● ● ● ● ●JDA, Manhattan Associates
16 UPS Supply Chain Solutions 144 17.3 120.1 ● ● ● ● ● ● ● ● ● ● ● ● ● ● ● ● ● ● ● ● ● ● ●Infor/EXE, Manhattan, LMS, Proprietary
17 Warehouse Services 30 14.0 466.7 ● ● ● ● ● ● ● ● ● ● ● ● ● ● ● ● ● ● ● ● ● ● ● ● Oracle
17 WSI 52 14.0 269.2 ● ● ● ● ● ● ● ● ● ● ● ● ● ● ● ● ● ● ● ● ● Oracle-EnterpriseOne
18 APL Logistics North America 44 12.7 288.6 ● ● ● ● ● ● ● ● ● ● ● ● ● ● ● ● ● ● ● ●
Manhattan WMi, LogFire, OWMS, Proprietary-WMSp & WMSz, eLMS, CMS, Irista
19 Radial 21 11.7 557.1 ● ● ● ● ● ● ● ● ● ● ● ● ● ● ● ● ● ● Manhattan Associates
19 Expeditors 133 11.7 88.0 ● ● ● ● ● ● ● ● ● ● ● ● ● ● ● ● ● ● ●Proprietary-Expeditors Distribution Management System
20 Universal Logistics Holdings 40 10.6 265.0 ● ● ● ● ● ● ● ● ● ● ● ● ● ● ● ● ●Proprietary, Just-in-Time Sequencing
21 Ingram Micro Commerce & Lifecycle Services 38 10.4 273.7 ● ● ● ● ● ● ● ● ● ● ● ● ● ● ● ● ● ● ●
Proprietary (GOFOS, IM-First, Provia)
22 Neovia Logistics 49 10.2 208.2 ● ● ● ● ● ● ● ● ● ● ● ● ● ● ● ● ● ● ● ● ●SAP, JDA RedPrairie, Proprietary
23 United States Cold Storge 37 9.6 259.5 ● ● ● ● ● ● ● ● ● ● ● Proprietary
24 Performance Team 24 9.0 375.0 ● ● ● ● ● ● ● ● ● ● ● ● ● ● ● ● ●Manhattan--SCALE; Softeon
25 Blue Ribbon Transport - SpartanNash 20 8.3 415.0 ● ● ● ● ● ● ● ●
Third-Party Logistics Providers (3PLs)Warehouse/
DC Capabilities Value-Added Services Capabilities
5
TOP wAreHOUSING 3PLs
©2021 Armstrong & Associates
Table 2. A&A’s Top 50 VAWD 3PLs by Warehousing Space within North America – 2019
WMS
Rank Third-Party Logistics Providers
(3PLs)
Num
ber o
f W
areh
ouse
s
Tota
l Sq.
Ft.
(Mill
ions
)
Avg.
Sq.
Ft.
(000
's)
Whs
e. M
gmt.
Froz
en
Ref
riger
ated
Tem
p. C
ontr
ol
Rai
l Sid
ing
Cal
l Cen
ters
Cro
ss D
ocki
ng
Cus
tom
izat
ion
Inve
ntor
y Co
ntro
l/ Ve
ndor
M
gmt.
Kan
Ban
Kitt
ing
Labe
ling
Lot C
ontr
ol
Mer
ge-in
-Tra
nsit
Mfg
. Sup
port
Pick
/Pac
k
Pool
Dis
t.
Rep
air/R
efur
b.
Retu
rnab
le C
onta
iner
Mgm
t.
Rev
erse
Log
istic
s
Stor
e Su
ppor
t/ D
eliv
ery
Sequ
enci
ng/ M
eter
ing
Spec
ialty
Pac
kagi
ng
Sub
Ass
embl
y
Mai
n B
rand
(s) U
sed
26 FW Logistics 16 7.8 487.5 ● ● ● ● ● ● ● ● ● ● ● Proprietary
26 Peoples Services 42 7.8 185.7 ● ● ● ● ● ● ● ● ● ● ● ● ● ● ● Proprietary
27 DSV Panalpina North America 43 7.6 176.7 ● ● ● ● ● ● ● ● ● ● ● ● ● ● ● ● ● ● ● ● ● ● ●RedPrairie, Infor/EXE, Logimax
28 LEGACY Supply Chain Services 36 7.5 208.3 ● ● ● ● ● ● ● ● ● ● ● ● ● ● ● ● ● ● ● ●Manhattan--SCALE, Synapse, Proprietary
29 Schneider Logistics 35 7.2 205.7 ● ● ● ● ● ● ● ● ● ● ● ● ● ● ● ● ● HighJump
30 syncreon 44 7.0 159.1 ● ● ● ● ● ● ● ● ● ● ● ● ● ● ● ● ● ● ● Proprietary
31 Hub Group 16 6.6 412.5 ● ● ● ● ● ● ● ● ● ● ● Proprietary
32 Wagner Logistics 23 6.5 282.6 ● ● ● ● ● ● ● ● ● ● ● ● ● ● ● ● ● ● ● RedPrairie DLx
32 Technicolor Global Logistics 12 6.5 541.7 ● ● ● ● ● ● ● ● ● ● ● ● ● ● ● ● ● ● Proprietary
32 Verst Logistics 23 6.5 282.6 ● ● ● ● ● ● ● ● ● ● ● ● ● ● ● ● ● ● ● ● ● ● McLeod
33 Port Logistics Group 16 6.3 393.8 ● ● ● ● ● ● ● ● ● ● ● ● ● ● ● ● ● ● ●
Proprietary--Event Tracker= omnichannel Whiplash = ecommerce
34 Crane Worldwide Logistics 56 6.0 107.1 ● ● ● ● ● ● ● ● ● ● ● ● ● ● ● ● ● ● ● ● Proprietary
34 Kane Is Able 25 6.0 240.0 ● ● ● ● ● ● ● ● ● ● ● ● ● ● ● ● ● Manhattan Associates
34 WOW Logistics 19 6.0 315.8 ● ● ● ● ● ● ● ● ● ● ● Manhattan--SCALE
35 Nippon Express North America 54 5.1 94.4 ● ● ● ● ● ● ● ● ● ● ● ● ● ● ● ● ● ● ● ● ● ●Proprietary--REWARDS
36 United Facilities 9 5.0 555.6 ● ● ● ● ● ● ● ● ● ● ● ● ● ● ● Infor; SWIMS
36 REO Logistics 6 5.0 833.3 ● ● ● ● ● ● ● ● ● ● ● ● ● ● ● ● ● ● ● Cadence/Accuplus
37 Atlanta Bonded Warehouse 14 4.9 350.0 ● ● ● ● ● ● ● ● ● ● ● ● ● ● ● ● ● ● ● ● ● ● ● RedPrairie
38 ODW Logistics 19 4.7 247.4 ● ● ● ● ● ● ● ● ● ● ● ● ● ● ● ● ● ● ● ● ● ●HighJump, WDLS 2.0, Zethcon--Synapse
39 The Shippers Group 11 4.5 409.1 ● ● ● ● ● ● ● ● ● ● ● ● ● ● ● ● ● ● ● ● ● Codeworks, LLC
40 Comprehensive Logistics 17 4.3 252.9 ● ● ● ● ● ● ● ● ● ● ● ● ● ● ● ● Proprietary--STREME
41 Xpedient Logistics 5 4.0 800.0 ● ● ● ● ● ● ● ● ● ● ● ● ● ● High Jump
41 LeSaint Logistics 14 4.0 285.7 ● ● ● ● ● ● ● ● ● ● ● ● ● ● ● ● ● ●Manhattan Associates, WareTech
41 Acme Distribution Centers 5 4.0 800.0 ● ● ● ● ● ● ● ● ● ● ● ● ● ● Proprietary
41 Barrett Distribution 20 4.0 200.0 ● ● ● ● ● ● ● ● ● ● ● ● ● ● ● ● ● ● ● ● ● Zethcon--Synapse
41 SCI Group 31 4.0 129.0 ● ● ● ● ● ● ● ● ● ● ● ● ● ● ● ● ● ●WMS – SAP WM, LogFire, Manhattan SCALE
42 Damco North America 18 3.9 216.7 ● ● ● ● ● ● ● ● ● ● ● ● ● ● ● ● ● ●Proprietary--Damco.com, Manhattan, JDA
Third-Party Logistics Providers (3PLs)Warehouse/
DC Capabilities Value-Added Services Capabilities
6
TOP wAreHOUSING 3PLs
©2021 Armstrong & Associates
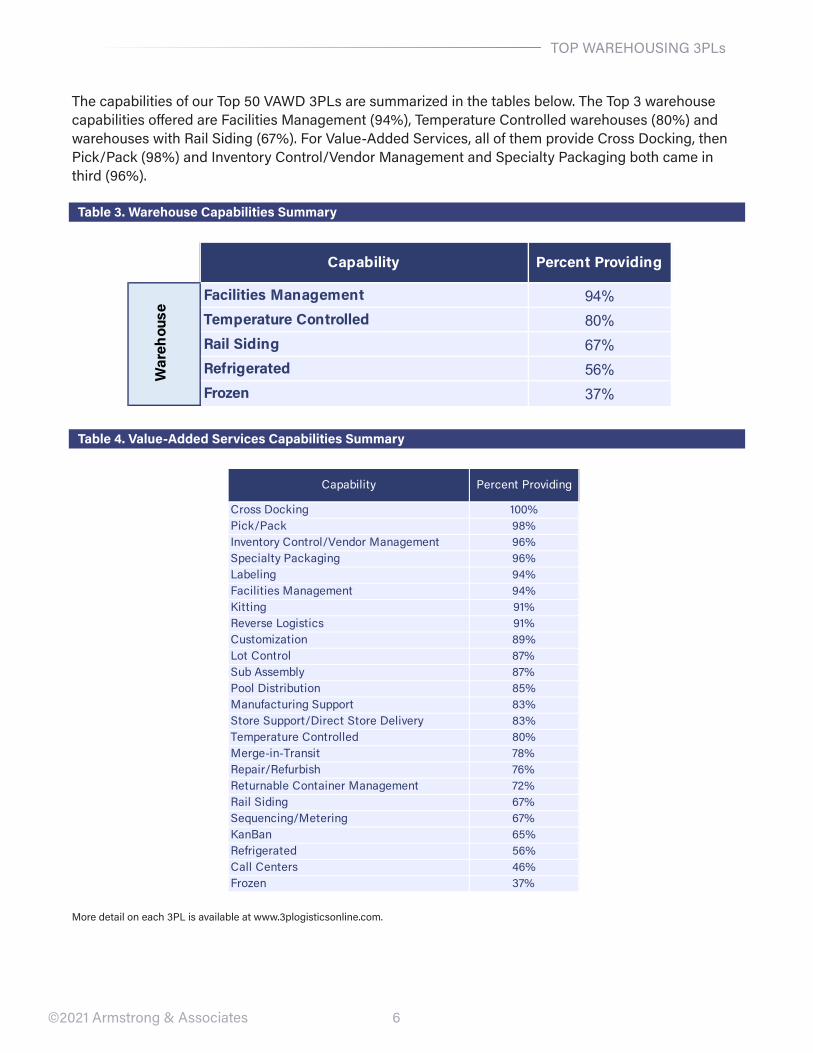
The capabilities of our Top 50 vAwD 3PLs are summarized in the tables below. The Top 3 warehouse capabilities offered are Facilities Management (94%), Temperature Controlled warehouses (80%) and warehouses with rail Siding (67%). For value-Added Services, all of them provide Cross Docking, then Pick/Pack (98%) and Inventory Control/vendor Management and Specialty Packaging both came in third (96%).
Table 3. Warehouse Capabilities Summary
Table 4. Value-Added Services Capabilities Summary
Capability Percent Providing
Facilities Management 94%Temperature Controlled 80%Rail Siding 67%Refrigerated 56%Frozen 37%
War
ehou
se
Capability Percent Providing
Cross Docking 100%Pick/Pack 98%Inventory Control/Vendor Management 96%Specialty Packaging 96%Labeling 94%Facilities Management 94%Kitting 91%Reverse Logistics 91%Customization 89%Lot Control 87%Sub Assembly 87%Pool Distribution 85%Manufacturing Support 83%Store Support/Direct Store Delivery 83%Temperature Controlled 80%Merge-in-Transit 78%Repair/Refurbish 76%Returnable Container Management 72%Rail Siding 67%Sequencing/Metering 67%KanBan 65%Refrigerated 56%Call Centers 46%Frozen 37%
More detail on each 3PL is available at www.3plogisticsonline.com.
7
TOP wAreHOUSING 3PLs
©2021 Armstrong & Associates
Cold Chain WarehousingCold chain warehousing is experiencing a period of unprecedented growth, especially with the rapid expansion of online grocery shopping caused by the pandemic. The Global Cold Chain Alliance (GCCA) estimates that U.S. temperature-controlled warehouses will grow at a CAGr of 4% from 2018 to 2022. Although temp-controlled warehouses make up a small portion of the overall U.S. industrial market, major drivers such as e-commerce, population growth, and evolving consumer behaviors especially during the pandemic, increased space demand from 3PLs serving the food industry. The COvID-19 vaccine has also put cold storage front and center. e-commerce’s one-day or even two-hour delivery windows have increased the addition of cold chain facilities near population centers. New or expanding cold chain operations are struggling to localize themselves closer to their customers.
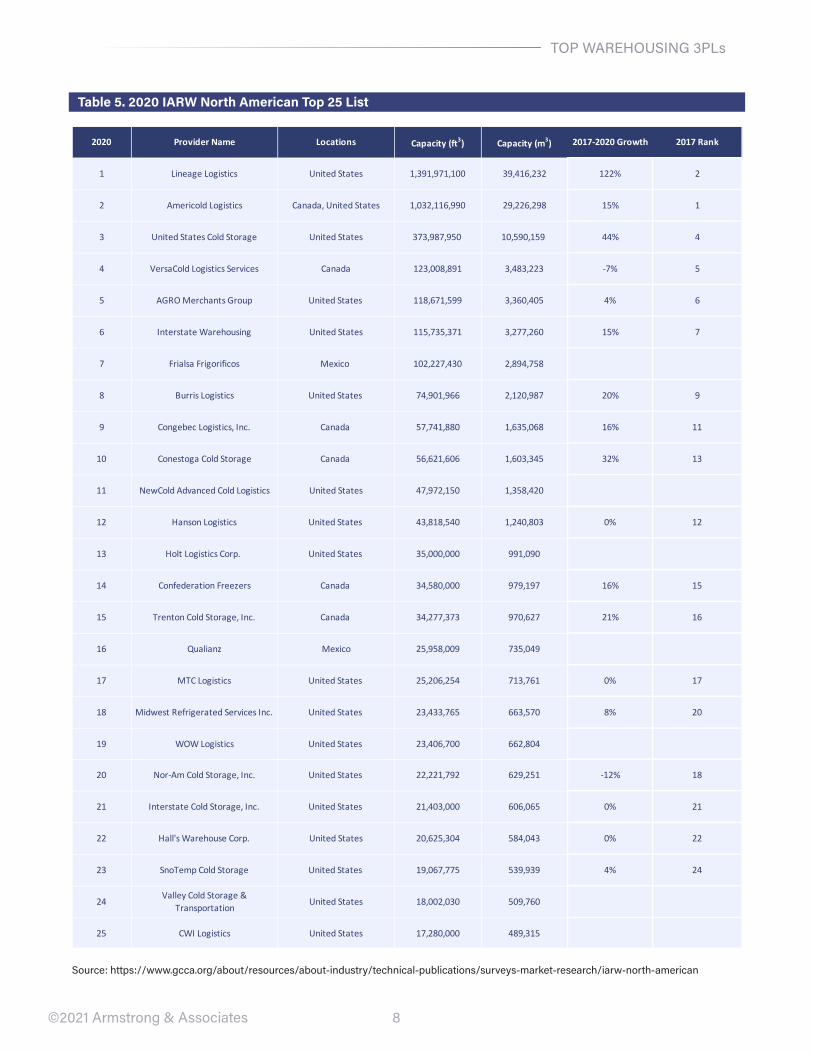
while we have some important refrigerated warehouse operators on our list, information on this specialized business segment from the International Association of refrigerated warehouses (IArw) is particularly useful. Its list of the top North American refrigerated warehouse operators based on their warehouse capacity is below. The Top 3 refrigerated warehousing operators are Lineage Logistics, Americold Logistics and United States Cold Storage, all of which have had substantial growth over the past few years. The capacity of Lineage Logistics grew 122% since 2017 contributed by its multiple acquisition deals in the last several years. In the meantime, 3PLs in the cold storage space are continually investing in technologies ranging from temperature tracking to warehouse management systems and maintain optimal visibility.
8
TOP wAreHOUSING 3PLs
©2021 Armstrong & Associates
Table 5. 2020 IARW North American Top 25 List
2020 Provider Name Locations Capacity (ft3) Capacity (m3) 2017-2020 Growth 2017 Rank
1 Lineage Logistics United States 1,391,971,100 39,416,232 122% 2
2 Americold Logistics Canada, United States 1,032,116,990 29,226,298 15% 1
3 United States Cold Storage United States 373,987,950 10,590,159 44% 4
4 VersaCold Logistics Services Canada 123,008,891 3,483,223 -7% 5
5 AGRO Merchants Group United States 118,671,599 3,360,405 4% 6
6 Interstate Warehousing United States 115,735,371 3,277,260 15% 7
7 Frialsa Frigorificos Mexico 102,227,430 2,894,758
8 Burris Logistics United States 74,901,966 2,120,987 20% 9
9 Congebec Logistics, Inc. Canada 57,741,880 1,635,068 16% 11
10 Conestoga Cold Storage Canada 56,621,606 1,603,345 32% 13
11 NewCold Advanced Cold Logistics United States 47,972,150 1,358,420
12 Hanson Logistics United States 43,818,540 1,240,803 0% 12
13 Holt Logistics Corp. United States 35,000,000 991,090
14 Confederation Freezers Canada 34,580,000 979,197 16% 15
15 Trenton Cold Storage, Inc. Canada 34,277,373 970,627 21% 16
16 Qualianz Mexico 25,958,009 735,049
17 MTC Logistics United States 25,206,254 713,761 0% 17
18 Midwest Refrigerated Services Inc. United States 23,433,765 663,570 8% 20
19 WOW Logistics United States 23,406,700 662,804
20 Nor-Am Cold Storage, Inc United States 22,221,792 629,251 -12% 1820 Nor-Am Cold Storage, Inc. United States 22,221,792 629,251 -12% 18
21 Interstate Cold Storage, Inc. United States 21,403,000 606,065 0% 21
22 Hall's Warehouse Corp. United States 20,625,304 584,043 0% 22
23 SnoTemp Cold Storage United States 19,067,775 539,939 4% 24
24Valley Cold Storage &
TransportationUnited States 18,002,030 509,760
25 CWI Logistics United States 17,280,000 489,315
Source: https://www.gcca.org/about/resources/about-industry/technical-publications/surveys-market-research/iarw-north-american
9
wAreHOUSING SUrveY 2019
©2021 Armstrong & Associates
A&A’s North American Warehousing Survey 2019In the fourth quarter of 2019, A&A collected information from 23 3PLs for our detailed warehousing database. In addition to the General Survey form in Appendix A, we expanded and revised our individual warehouse location database, as well as warehousing fulfillment benchmark data. we received responses covering 668 contract warehouses and 190 3PL warehousing contracts in North America, mostly in the U.S. and Canada.
we asked our survey participants, “How much did your business change from 2017 to 2018?” 83% had positive revenue growth in 2018 with average Year-Over-Year (YOY) growth of 13%. The average gross warehouse revenue for the 23 3PLs was $26,646,791 for 2017 and $28,022,814 for 2018.
we asked, “what percent of your total warehousing revenue in 2018 was from e-commerce warehousing/fulfillment?” and requested the portions of Business-to-Consumer (B2C) and Business-to-Business (B2B) revenue. An average of 20% of total warehousing revenue in 2018 was from e-commerce warehousing/fulfillment. Of that, B2C averaged 60% and B2B averaged 40%.
we also asked, “what percent of your net revenue (without purchased transportation) came from the following functions? Dedicated Contract warehousing, Contract Packaging, Multi-Client Contract warehousing or Multi-Client Public warehousing?” For revenue the averages were: Dedicated Contract warehousing 50.9%, Multi-Client Contract warehousing 31.6%, Multi-Client Public warehousing 15.4% and Contract Packaging 2.1%. By space the averages were: Dedicated Contract warehousing 57.4%, Multi-Client Contract warehousing 25%, Multi-Client Public warehousing 17.1% and Contract Packaging 0.6%.
10
wAreHOUSING SUrveY 2019
©2021 Armstrong & Associates
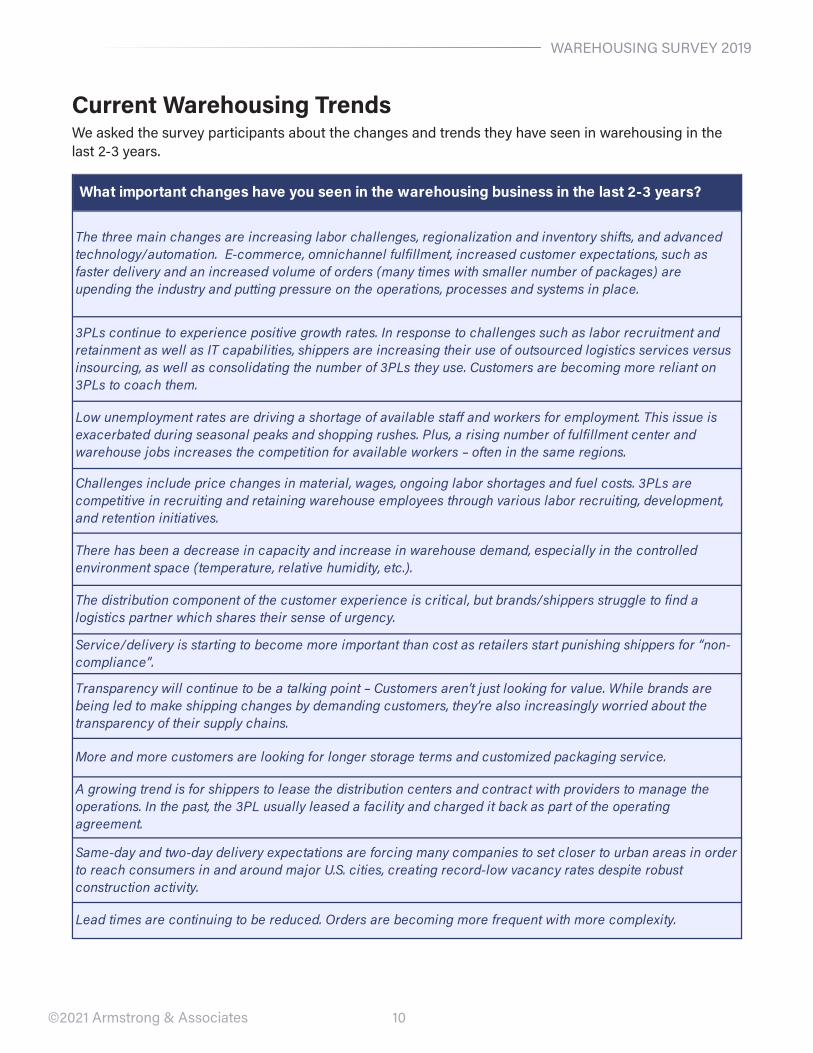
Current Warehousing Trendswe asked the survey participants about the changes and trends they have seen in warehousing in the last 2-3 years.
What important changes have you seen in the warehousing business in the last 2-3 years?
The three main changes are increasing labor challenges, regionalization and inventory shifts, and advanced technology/automation. E-commerce, omnichannel fulfillment, increased customer expectations, such as faster delivery and an increased volume of orders (many times with smaller number of packages) are upending the industry and putting pressure on the operations, processes and systems in place.
3PLs continue to experience positive growth rates. In response to challenges such as labor recruitment and retainment as well as IT capabilities, shippers are increasing their use of outsourced logistics services versus insourcing, as well as consolidating the number of 3PLs they use. Customers are becoming more reliant on 3PLs to coach them.
Low unemployment rates are driving a shortage of available staff and workers for employment. This issue is exacerbated during seasonal peaks and shopping rushes. Plus, a rising number of fulfillment center and warehouse jobs increases the competition for available workers – often in the same regions.
Challenges include price changes in material, wages, ongoing labor shortages and fuel costs. 3PLs are competitive in recruiting and retaining warehouse employees through various labor recruiting, development, and retention initiatives.
There has been a decrease in capacity and increase in warehouse demand, especially in the controlled environment space (temperature, relative humidity, etc.).
The distribution component of the customer experience is critical, but brands/shippers struggle to find a logistics partner which shares their sense of urgency.
Service/delivery is starting to become more important than cost as retailers start punishing shippers for “non-compliance”.
Transparency will continue to be a talking point – Customers aren’t just looking for value. While brands are being led to make shipping changes by demanding customers, they’re also increasingly worried about the transparency of their supply chains.
More and more customers are looking for longer storage terms and customized packaging service.
A growing trend is for shippers to lease the distribution centers and contract with providers to manage the operations. In the past, the 3PL usually leased a facility and charged it back as part of the operating agreement.
Same-day and two-day delivery expectations are forcing many companies to set closer to urban areas in order to reach consumers in and around major U.S. cities, creating record-low vacancy rates despite robust construction activity.
Lead times are continuing to be reduced. Orders are becoming more frequent with more complexity.
11
wAreHOUSING SUrveY 2019
©2021 Armstrong & Associates
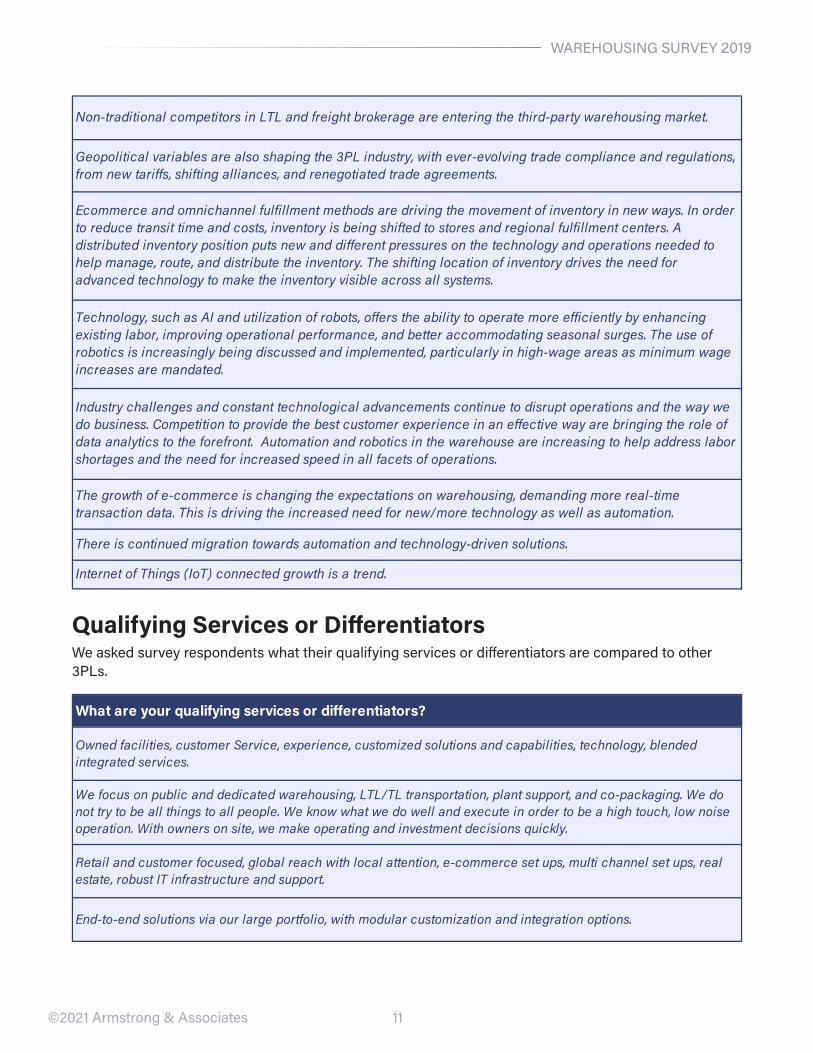
Qualifying Services or Differentiatorswe asked survey respondents what their qualifying services or differentiators are compared to other 3PLs.
Non-traditional competitors in LTL and freight brokerage are entering the third-party warehousing market.
Geopolitical variables are also shaping the 3PL industry, with ever-evolving trade compliance and regulations, from new tariffs, shifting alliances, and renegotiated trade agreements.
Ecommerce and omnichannel fulfillment methods are driving the movement of inventory in new ways. In order to reduce transit time and costs, inventory is being shifted to stores and regional fulfillment centers. A distributed inventory position puts new and different pressures on the technology and operations needed to help manage, route, and distribute the inventory. The shifting location of inventory drives the need for advanced technology to make the inventory visible across all systems.
Technology, such as AI and utilization of robots, offers the ability to operate more efficiently by enhancing existing labor, improving operational performance, and better accommodating seasonal surges. The use of robotics is increasingly being discussed and implemented, particularly in high-wage areas as minimum wage increases are mandated.
Industry challenges and constant technological advancements continue to disrupt operations and the way we do business. Competition to provide the best customer experience in an effective way are bringing the role of data analytics to the forefront. Automation and robotics in the warehouse are increasing to help address labor shortages and the need for increased speed in all facets of operations.
The growth of e-commerce is changing the expectations on warehousing, demanding more real-time transaction data. This is driving the increased need for new/more technology as well as automation.
There is continued migration towards automation and technology-driven solutions.
Internet of Things (IoT) connected growth is a trend.
What are your qualifying services or differentiators?
Owned facilities, customer Service, experience, customized solutions and capabilities, technology, blended integrated services.
We focus on public and dedicated warehousing, LTL/TL transportation, plant support, and co-packaging. We do not try to be all things to all people. We know what we do well and execute in order to be a high touch, low noise operation. With owners on site, we make operating and investment decisions quickly.
Retail and customer focused, global reach with local attention, e-commerce set ups, multi channel set ups, real estate, robust IT infrastructure and support.
End-to-end solutions via our large portfolio, with modular customization and integration options.
12
wAreHOUSING SUrveY 2019
©2021 Armstrong & Associates
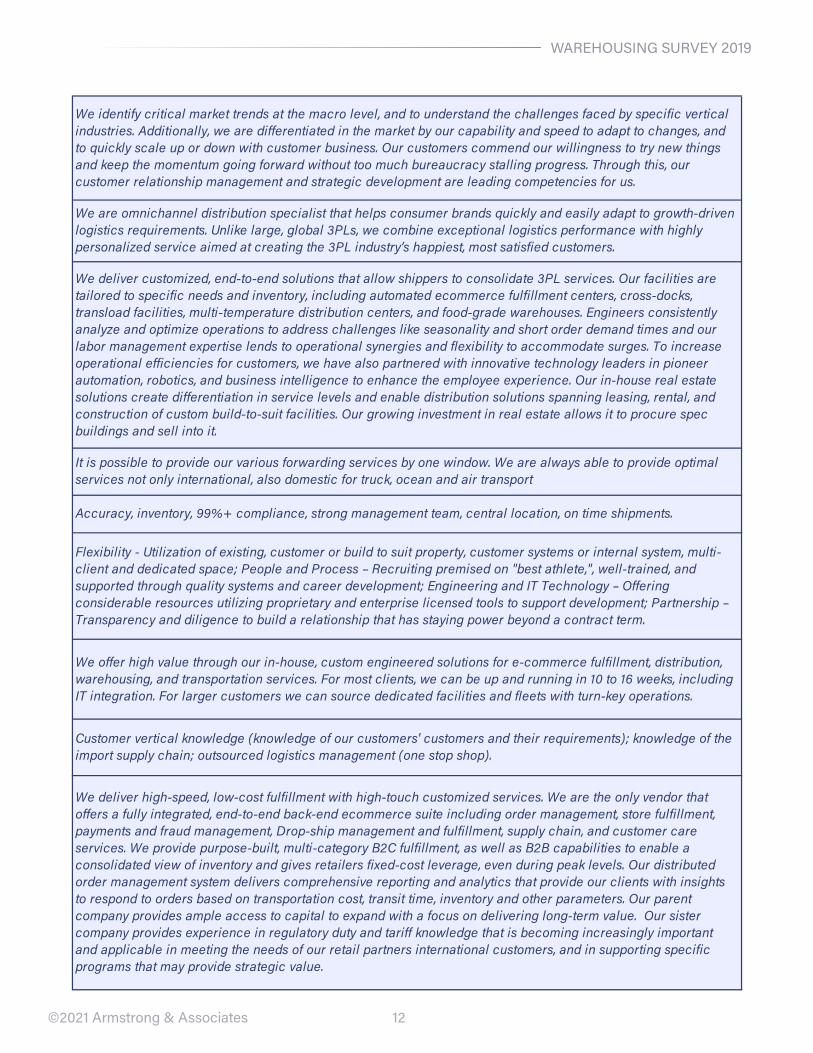
We identify critical market trends at the macro level, and to understand the challenges faced by specific vertical industries. Additionally, we are differentiated in the market by our capability and speed to adapt to changes, and to quickly scale up or down with customer business. Our customers commend our willingness to try new things and keep the momentum going forward without too much bureaucracy stalling progress. Through this, our customer relationship management and strategic development are leading competencies for us.
We are omnichannel distribution specialist that helps consumer brands quickly and easily adapt to growth-driven logistics requirements. Unlike large, global 3PLs, we combine exceptional logistics performance with highly personalized service aimed at creating the 3PL industry’s happiest, most satisfied customers.
We deliver customized, end-to-end solutions that allow shippers to consolidate 3PL services. Our facilities are tailored to specific needs and inventory, including automated ecommerce fulfillment centers, cross-docks, transload facilities, multi-temperature distribution centers, and food-grade warehouses. Engineers consistently analyze and optimize operations to address challenges like seasonality and short order demand times and our labor management expertise lends to operational synergies and flexibility to accommodate surges. To increase operational efficiencies for customers, we have also partnered with innovative technology leaders in pioneer automation, robotics, and business intelligence to enhance the employee experience. Our in-house real estate solutions create differentiation in service levels and enable distribution solutions spanning leasing, rental, and construction of custom build-to-suit facilities. Our growing investment in real estate allows it to procure spec buildings and sell into it.
It is possible to provide our various forwarding services by one window. We are always able to provide optimal services not only international, also domestic for truck, ocean and air transport
Accuracy, inventory, 99%+ compliance, strong management team, central location, on time shipments.
Flexibility - Utilization of existing, customer or build to suit property, customer systems or internal system, multi-client and dedicated space; People and Process – Recruiting premised on "best athlete,", well-trained, and supported through quality systems and career development; Engineering and IT Technology – Offering considerable resources utilizing proprietary and enterprise licensed tools to support development; Partnership – Transparency and diligence to build a relationship that has staying power beyond a contract term.
We offer high value through our in-house, custom engineered solutions for e-commerce fulfillment, distribution, warehousing, and transportation services. For most clients, we can be up and running in 10 to 16 weeks, including IT integration. For larger customers we can source dedicated facilities and fleets with turn-key operations.
Customer vertical knowledge (knowledge of our customers' customers and their requirements); knowledge of the import supply chain; outsourced logistics management (one stop shop).
We deliver high-speed, low-cost fulfillment with high-touch customized services. We are the only vendor that offers a fully integrated, end-to-end back-end ecommerce suite including order management, store fulfillment, payments and fraud management, Drop-ship management and fulfillment, supply chain, and customer care services. We provide purpose-built, multi-category B2C fulfillment, as well as B2B capabilities to enable a consolidated view of inventory and gives retailers fixed-cost leverage, even during peak levels. Our distributed order management system delivers comprehensive reporting and analytics that provide our clients with insights to respond to orders based on transportation cost, transit time, inventory and other parameters. Our parent company provides ample access to capital to expand with a focus on delivering long-term value. Our sister company provides experience in regulatory duty and tariff knowledge that is becoming increasingly important and applicable in meeting the needs of our retail partners international customers, and in supporting specific programs that may provide strategic value.
13
wAreHOUSING SUrveY 2019
©2021 Armstrong & Associates
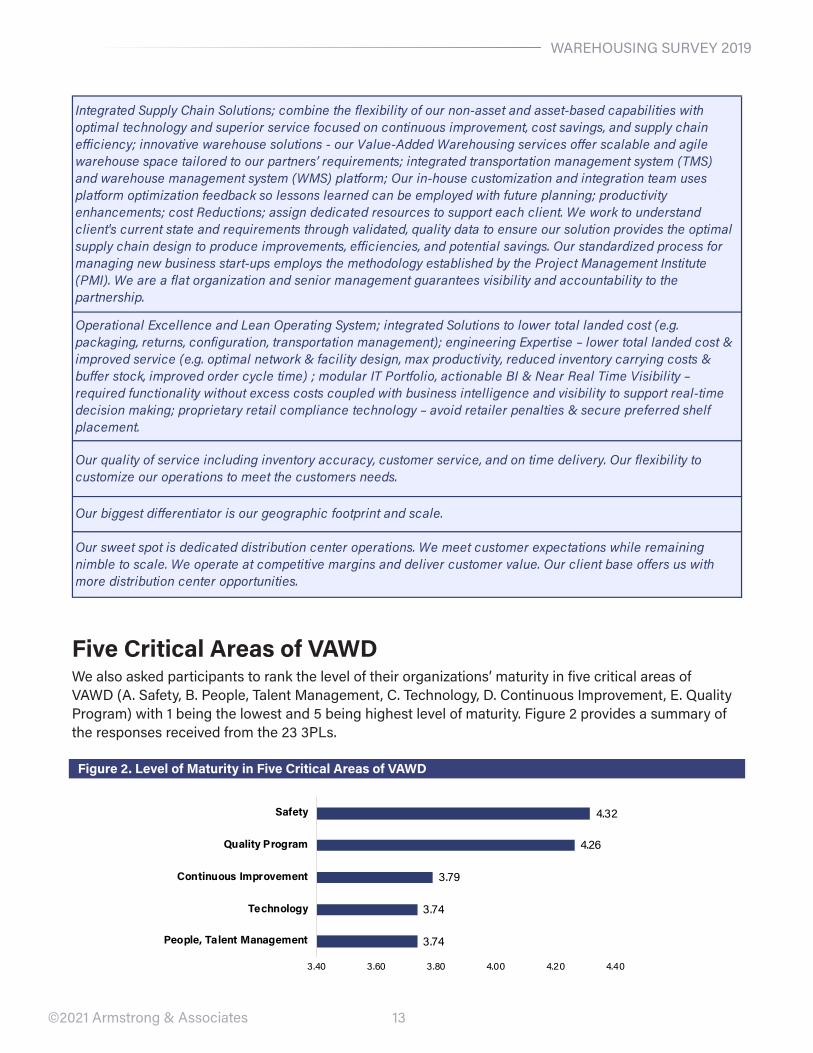
Five Critical Areas of VAWDwe also asked participants to rank the level of their organizations’ maturity in five critical areas of vAwD (A. Safety, B. People, Talent Management, C. Technology, D. Continuous Improvement, e. Quality Program) with 1 being the lowest and 5 being highest level of maturity. Figure 2 provides a summary of the responses received from the 23 3PLs.
Figure 2. Level of Maturity in Five Critical Areas of VAWD
Integrated Supply Chain Solutions; combine the flexibility of our non-asset and asset-based capabilities with optimal technology and superior service focused on continuous improvement, cost savings, and supply chain efficiency; innovative warehouse solutions - our Value-Added Warehousing services offer scalable and agile warehouse space tailored to our partners’ requirements; integrated transportation management system (TMS) and warehouse management system (WMS) platform; Our in-house customization and integration team uses platform optimization feedback so lessons learned can be employed with future planning; productivity enhancements; cost Reductions; assign dedicated resources to support each client. We work to understand client's current state and requirements through validated, quality data to ensure our solution provides the optimal supply chain design to produce improvements, efficiencies, and potential savings. Our standardized process for managing new business start-ups employs the methodology established by the Project Management Institute (PMI). We are a flat organization and senior management guarantees visibility and accountability to the partnership.
Operational Excellence and Lean Operating System; integrated Solutions to lower total landed cost (e.g. packaging, returns, configuration, transportation management); engineering Expertise – lower total landed cost & improved service (e.g. optimal network & facility design, max productivity, reduced inventory carrying costs & buffer stock, improved order cycle time) ; modular IT Portfolio, actionable BI & Near Real Time Visibility – required functionality without excess costs coupled with business intelligence and visibility to support real-time decision making; proprietary retail compliance technology – avoid retailer penalties & secure preferred shelf placement.
Our quality of service including inventory accuracy, customer service, and on time delivery. Our flexibility to customize our operations to meet the customers needs.
Our biggest differentiator is our geographic footprint and scale.
Our sweet spot is dedicated distribution center operations. We meet customer expectations while remaining nimble to scale. We operate at competitive margins and deliver customer value. Our client base offers us with more distribution center opportunities.
3.74
3.74
3.79
4.26
4.32
3.40 3.60 3.80 4.00 4.20 4.40
People, Talent Management
Technology
Continuous Improvement
Quality Program
Safety
14
wAreHOUSING SUrveY 2019
©2021 Armstrong & Associates
It was important that we qualify each critical area of success as the vAwD respondents rank their level of maturity. Clearly Safety is the foundation of warehousing. Most surprising is that people or talent management is ranked low. Now is the time to set a strategy for talent management and employee development.
Safety: Safety expectations are communicated throughout the entire organization. Safety standards are set and measured. There is a safety committee and regular training for all associates. Housekeeping, cleanliness and 5S are all part of the safety program. equipment is checked before usage and lock out tag out processes are set in place. There are safety audits and random safety sweeps. Accidents and near misses are discussed and a root cause analysis is conducted to prevent future near misses or accidents. Good behavior is rewarded. Continuous Improvement: The company vision, mission and values are clearly communicated to all associates. The associates understand the vision, mission, and values and how they can contribute to the purpose. There is a formal Lean/Six Sigma program where there are green belt, black belt and master black belt associates available to all facilities. The visual management is standardized with active metrics used to management the day-to-day business. Lean/Six Sigma tools are easily available to all associates. There is a process in place to manage defects, corrective and preventative action reports. All employees understand how to perform root cause analysis such as fish bone diagrams, SIPOC (Suppliers, Inputs, Process, Outputs, and Customers), 5-why's, DMAIC (Define, Measure, Analyze, Improve and Control), and A4s. Key Performance Indicator (KPI) management is standardized. The business scorecard is aligned with the business vision and mission. All associates understand the metrics that drive success in their department. The employee suggestion program is formalized. The standard work sheets are posted at work-stations to include Leadership Standard work. The leaders are trained on Lean/Six Sigma to include certification.
Quality: There is a formal Quality Program with centralized access to the program. The sites are audited on compliance and there are Quality Sweeps on the effectiveness of the program. Standard Operating Procedures (SOPs) are audited and up to date. There are SOPs for all processes.
Common features of a quality management system are:
1. Document Control (SOPs, job descriptions, standard work, rACI matrix, training matrix...)2. Change Control3. Corrective Action and Preventative Action (CAPA)4. Audit Management5. Compliance Management6. risk Management7. Statistical Process Control8. Supplier Quality Management9. employee Training and Management
People, Talent Management: Job descriptions are formalized and all associates know what is expected of them. The employees have the tools they need to effectively do their job. Performance reviews are conducted for all associates. There is a formal mentorship program in place and the associates actively participate in the program. There is an employee development program where they can grow and learn skills beyond the day-to-day work. roles and responsibilities are somewhat personalized to meet the strengths of the associates.
15
CONTrACT wAreHOUSe PrICING
©2021 Armstrong & Associates
Technology: The Business Intelligence (BI) system is easy to use. The BI tool is used for data analytics, information, reporting, data and process mining, benchmarking, predictive and prescriptive analytics, and strategic decision making. All sites use a Tier-1 wMS. The Learning Management System (LMS) is integrated with the wMS. The Customer relationship Management (CrM) starts with sales and is maintained throughout the tenure of the customer relationship. Customers have access to the data through an online portal that includes real-time inquiries and reporting. The portal is a self-serve tool to view and manage the account. Automation of processes are appropriately used (examples are carousels, conveyors, automatic stacker cranes, robots, pick-to-light, pick-to-voice and automated storage and retrieval systems). There is a digital strategy that includes digital optimization and digital monetization.
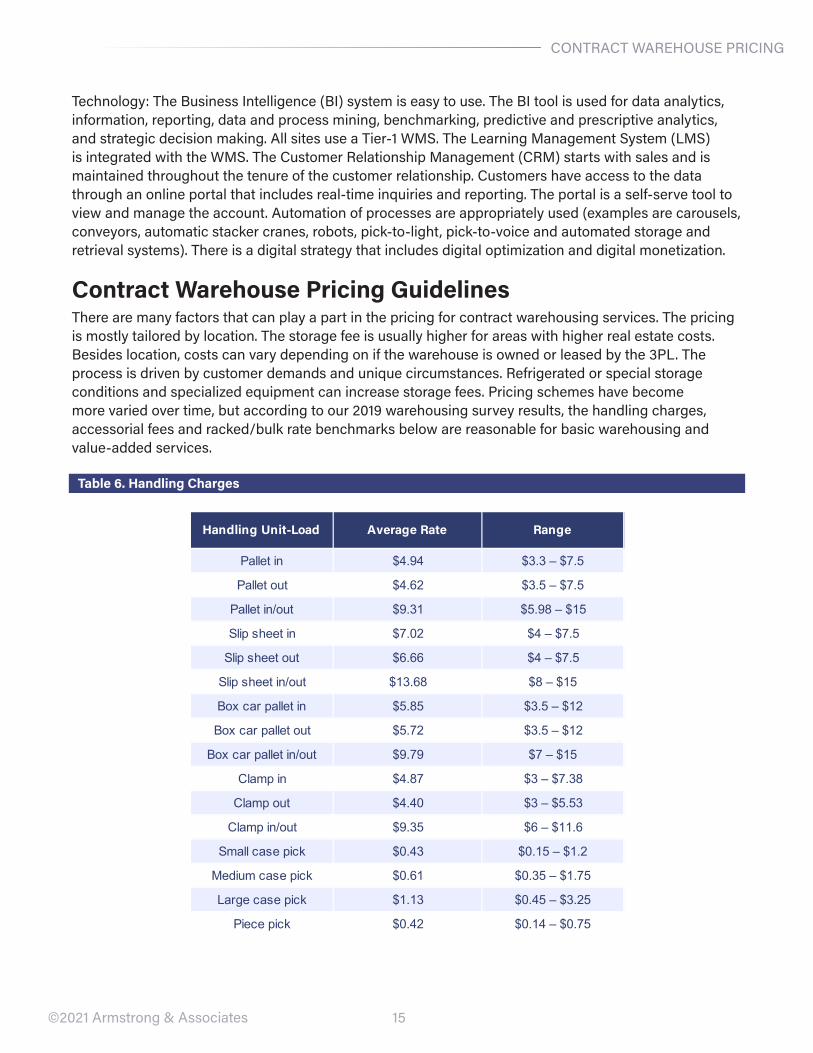
Contract Warehouse Pricing GuidelinesThere are many factors that can play a part in the pricing for contract warehousing services. The pricing is mostly tailored by location. The storage fee is usually higher for areas with higher real estate costs. Besides location, costs can vary depending on if the warehouse is owned or leased by the 3PL. The process is driven by customer demands and unique circumstances. refrigerated or special storage conditions and specialized equipment can increase storage fees. Pricing schemes have become more varied over time, but according to our 2019 warehousing survey results, the handling charges, accessorial fees and racked/bulk rate benchmarks below are reasonable for basic warehousing and value-added services.
Table 6. Handling Charges
Handling Unit-Load Average Rate Range
Pallet in $4.94 $3.3 – $7.5
Pallet out $4.62 $3.5 – $7.5
Pallet in/out $9.31 $5.98 – $15
Slip sheet in $7.02 $4 – $7.5
Slip sheet out $6.66 $4 – $7.5
Slip sheet in/out $13.68 $8 – $15
Box car pallet in $5.85 $3.5 – $12
Box car pallet out $5.72 $3.5 – $12
Box car pallet in/out $9.79 $7 – $15
Clamp in $4.87 $3 – $7.38
Clamp out $4.40 $3 – $5.53
Clamp in/out $9.35 $6 – $11.6
Small case pick $0.43 $0.15 – $1.2
Medium case pick $0.61 $0.35 – $1.75
Large case pick $1.13 $0.45 – $3.25
Piece pick $0.42 $0.14 – $0.75
16
CONTrACT wAreHOUSe PrICING
©2021 Armstrong & Associates
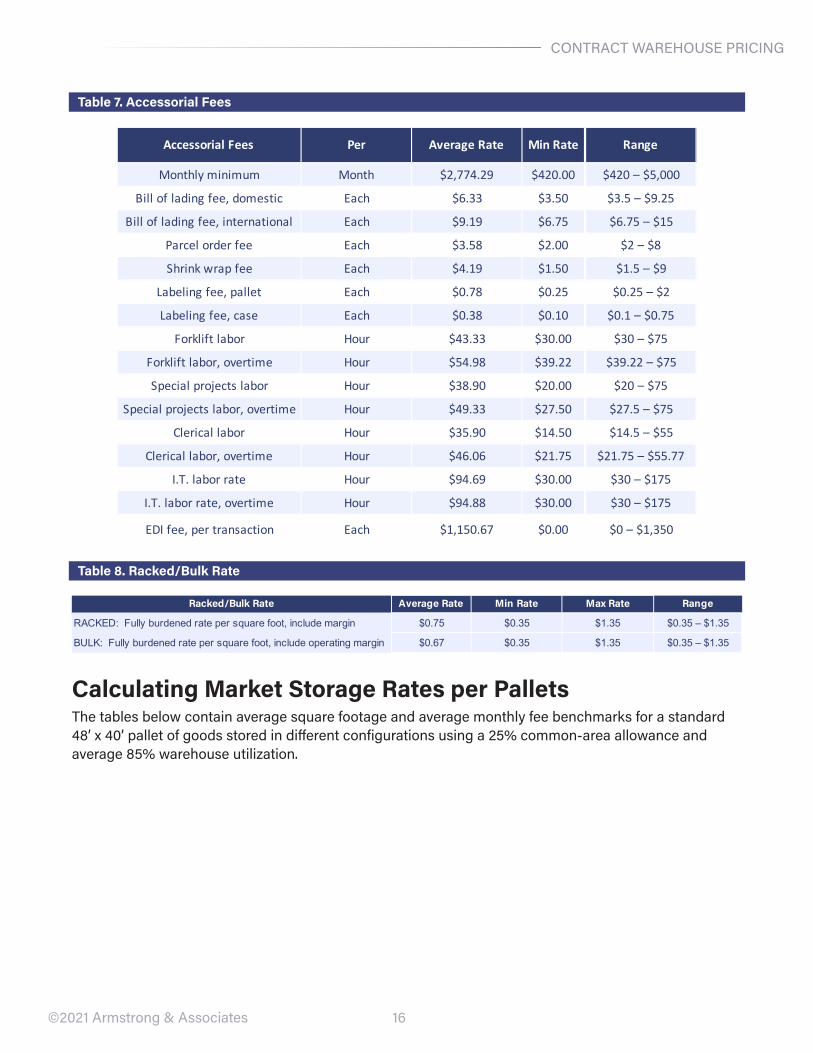
Table 7. Accessorial Fees
Table 8. Racked/Bulk Rate
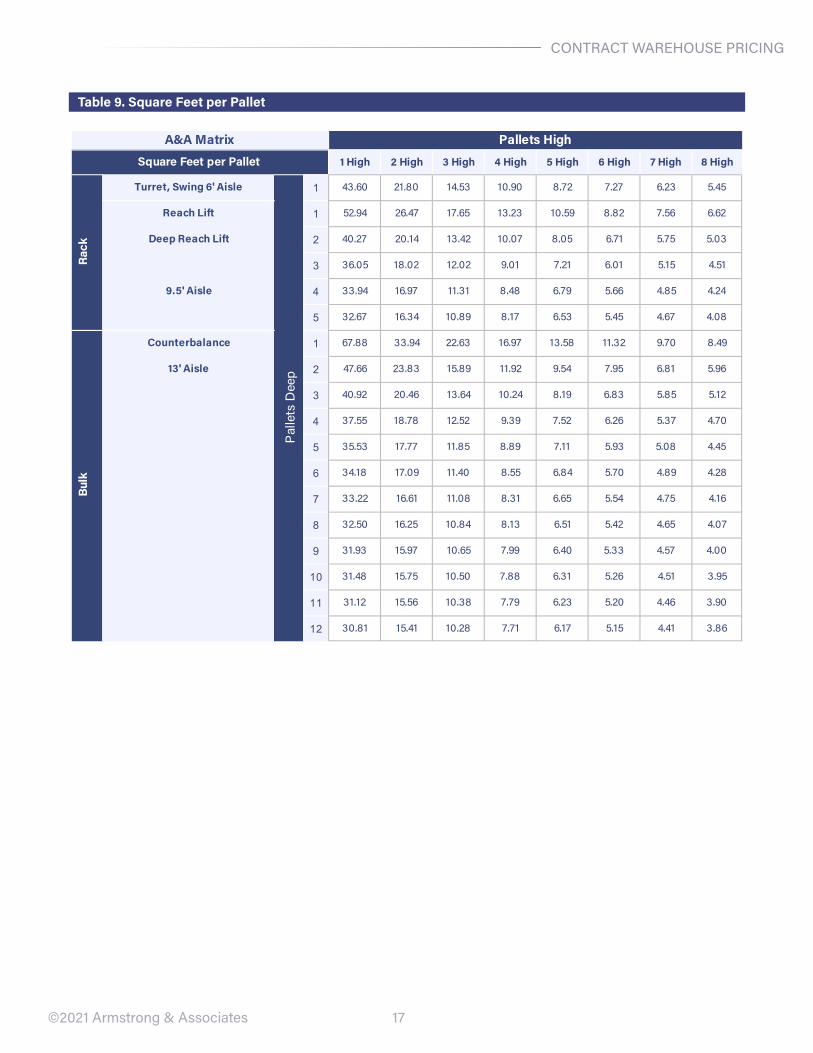
Calculating Market Storage Rates per PalletsThe tables below contain average square footage and average monthly fee benchmarks for a standard 48’ x 40’ pallet of goods stored in different configurations using a 25% common-area allowance and average 85% warehouse utilization.
Accessorial Fees Per Average Rate Min RateMax
Range
Monthly minimum Month $2,774.29 $420.00 $420 – $5,000
Bill of lading fee, domestic Each $6.33 $3.50 $3.5 – $9.25
Bill of lading fee, international Each $9.19 $6.75 $6.75 – $15
Parcel order fee Each $3.58 $2.00 $2 – $8
Shrink wrap fee Each $4.19 $1.50 $1.5 – $9
Labeling fee, pallet Each $0.78 $0.25 $0.25 – $2
Labeling fee, case Each $0.38 $0.10 $0.1 – $0.75
Forklift labor Hour $43.33 $30.00 $30 – $75
Forklift labor, overtime Hour $54.98 $39.22 $39.22 – $75
Special projects labor Hour $38.90 $20.00 $20 – $75
Special projects labor, overtime Hour $49.33 $27.50 $27.5 – $75
Clerical labor Hour $35.90 $14.50 $14.5 – $55
Clerical labor, overtime Hour $46.06 $21.75 $21.75 – $55.77
I.T. labor rate Hour $94.69 $30.00 $30 – $175
I.T. labor rate, overtime Hour $94.88 $30.00 $30 – $175
EDI fee, per transaction Each $1,150.67 $0.00 $0 – $1,350
Average Rate Min Rate Max Rate
$0.75 $0.35 $1.35
$0.67 $0.35 $1.35BULK: Fully burdened rate per square foot, include operating margin $0.35 – $1.35
Racked/Bulk Rate Range
RACKED: Fully burdened rate per square foot, include margin $0.35 – $1.35
17
CONTrACT wAreHOUSe PrICING
©2021 Armstrong & Associates
Table 9. Square Feet per Pallet
1 High 2 High 3 High 4 High 5 High 6 High 7 High 8 High
Turret, Swing 6' Aisle 1 43.60 21.80 14.53 10.90 8.72 7.27 6.23 5.45
Reach Lift 1 52.94 26.47 17.65 13.23 10.59 8.82 7.56 6.62
Deep Reach Lift 2 40.27 20.14 13.42 10.07 8.05 6.71 5.75 5.03
3 36.05 18.02 12.02 9.01 7.21 6.01 5.15 4.51
9.5' Aisle 4 33.94 16.97 11.31 8.48 6.79 5.66 4.85 4.24
5 32.67 16.34 10.89 8.17 6.53 5.45 4.67 4.08
Counterbalance 1 67.88 33.94 22.63 16.97 13.58 11.32 9.70 8.49
13' Aisle 2 47.66 23.83 15.89 11.92 9.54 7.95 6.81 5.96
3 40.92 20.46 13.64 10.24 8.19 6.83 5.85 5.12
4 37.55 18.78 12.52 9.39 7.52 6.26 5.37 4.70
5 35.53 17.77 11.85 8.89 7.11 5.93 5.08 4.45
6 34.18 17.09 11.40 8.55 6.84 5.70 4.89 4.28
7 33.22 16.61 11.08 8.31 6.65 5.54 4.75 4.16
8 32.50 16.25 10.84 8.13 6.51 5.42 4.65 4.07
9 31.93 15.97 10.65 7.99 6.40 5.33 4.57 4.00
10 31.48 15.75 10.50 7.88 6.31 5.26 4.51 3.95
11 31.12 15.56 10.38 7.79 6.23 5.20 4.46 3.90
12 30.81 15.41 10.28 7.71 6.17 5.15 4.41 3.86
A&A Matrix Pallets High
Square Feet per Pallet
Rack
Pal
lets
Dee
p
Bulk
18
CONTrACT wAreHOUSe PrICING
©2021 Armstrong & Associates
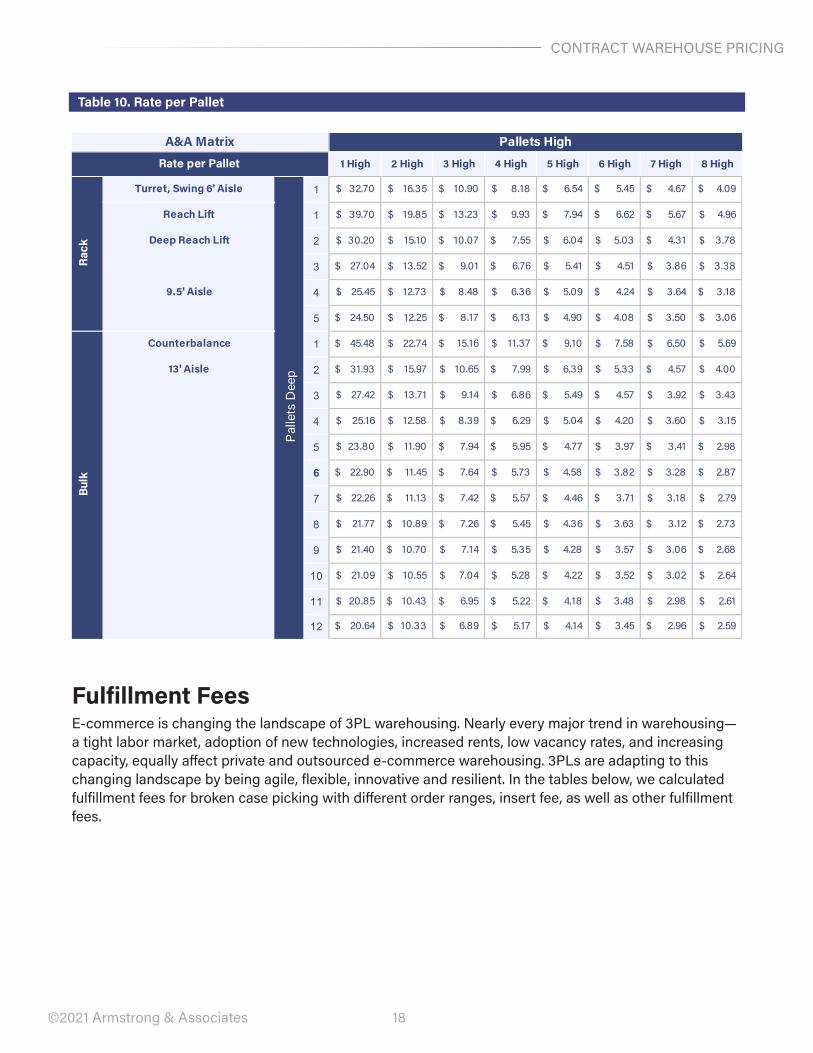
Table 10. Rate per Pallet
Fulfillment Feese-commerce is changing the landscape of 3PL warehousing. Nearly every major trend in warehousing— a tight labor market, adoption of new technologies, increased rents, low vacancy rates, and increasing capacity, equally affect private and outsourced e-commerce warehousing. 3PLs are adapting to this changing landscape by being agile, flexible, innovative and resilient. In the tables below, we calculated fulfillment fees for broken case picking with different order ranges, insert fee, as well as other fulfillment fees.
1 High 2 High 3 High 4 High 5 High 6 High 7 High 8 High
Turret, Swing 6' Aisle 1 32.70$ 16.35$ 10.90$ 8.18$ 6.54$ 5.45$ 4.67$ 4.09$
Reach Lift 1 39.70$ 19.85$ 13.23$ 9.93$ 7.94$ 6.62$ 5.67$ 4.96$
Deep Reach Lift 2 30.20$ 15.10$ 10.07$ 7.55$ 6.04$ 5.03$ 4.31$ 3.78$
3 27.04$ 13.52$ 9.01$ 6.76$ 5.41$ 4.51$ 3.86$ 3.38$
9.5' Aisle 4 25.45$ 12.73$ 8.48$ 6.36$ 5.09$ 4.24$ 3.64$ 3.18$
5 24.50$ 12.25$ 8.17$ 6.13$ 4.90$ 4.08$ 3.50$ 3.06$
Counterbalance 1 45.48$ 22.74$ 15.16$ 11.37$ 9.10$ 7.58$ 6.50$ 5.69$
13' Aisle 2 31.93$ 15.97$ 10.65$ 7.99$ 6.39$ 5.33$ 4.57$ 4.00$
3 27.42$ 13.71$ 9.14$ 6.86$ 5.49$ 4.57$ 3.92$ 3.43$
4 25.16$ 12.58$ 8.39$ 6.29$ 5.04$ 4.20$ 3.60$ 3.15$
5 23.80$ 11.90$ 7.94$ 5.95$ 4.77$ 3.97$ 3.41$ 2.98$
6 22.90$ 11.45$ 7.64$ 5.73$ 4.58$ 3.82$ 3.28$ 2.87$
7 22.26$ 11.13$ 7.42$ 5.57$ 4.46$ 3.71$ 3.18$ 2.79$
8 21.77$ 10.89$ 7.26$ 5.45$ 4.36$ 3.63$ 3.12$ 2.73$
9 21.40$ 10.70$ 7.14$ 5.35$ 4.28$ 3.57$ 3.06$ 2.68$
10 21.09$ 10.55$ 7.04$ 5.28$ 4.22$ 3.52$ 3.02$ 2.64$
11 20.85$ 10.43$ 6.95$ 5.22$ 4.18$ 3.48$ 2.98$ 2.61$
12 20.64$ 10.33$ 6.89$ 5.17$ 4.14$ 3.45$ 2.96$ 2.59$
A&A Matrix Pallets High
Rate per Pallet
Rack
Pal
lets
Dee
p
Bulk
19
CONTrACT wAreHOUSe PrICING
©2021 Armstrong & Associates
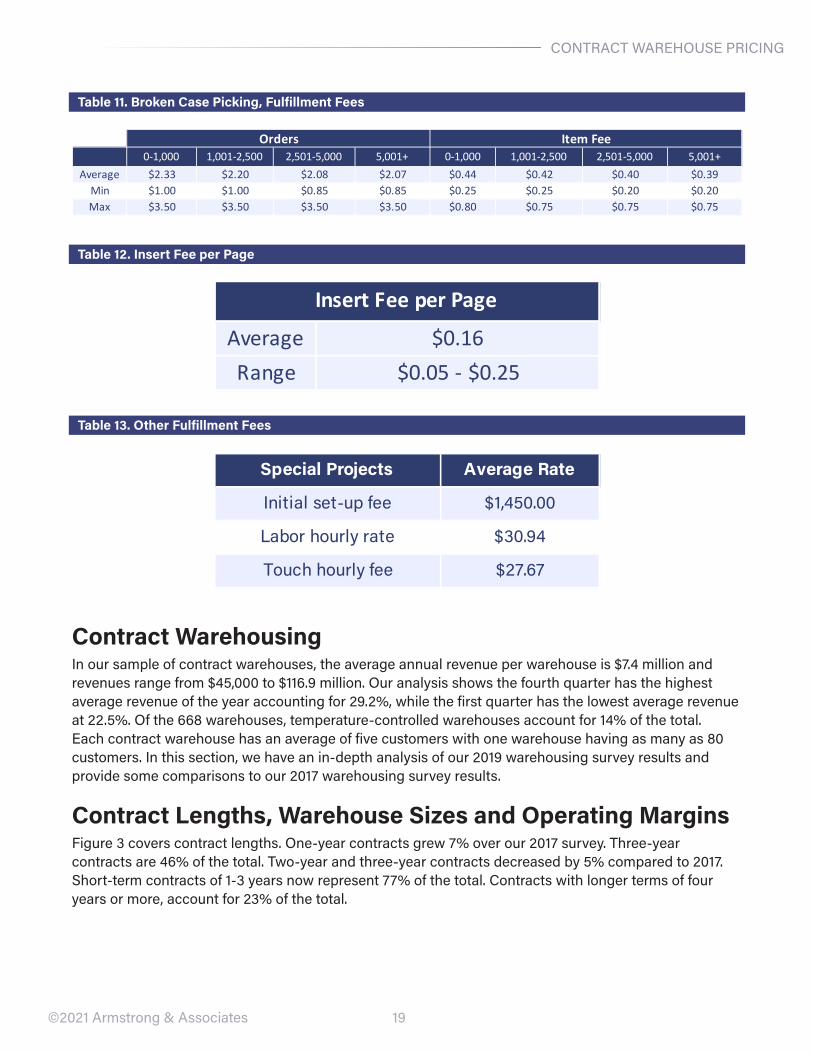
Table 11. Broken Case Picking, Fulfillment Fees
Table 12. Insert Fee per Page
Table 13. Other Fulfillment Fees
Contract WarehousingIn our sample of contract warehouses, the average annual revenue per warehouse is $7.4 million and revenues range from $45,000 to $116.9 million. Our analysis shows the fourth quarter has the highest average revenue of the year accounting for 29.2%, while the first quarter has the lowest average revenue at 22.5%. Of the 668 warehouses, temperature-controlled warehouses account for 14% of the total. each contract warehouse has an average of five customers with one warehouse having as many as 80 customers. In this section, we have an in-depth analysis of our 2019 warehousing survey results and provide some comparisons to our 2017 warehousing survey results.
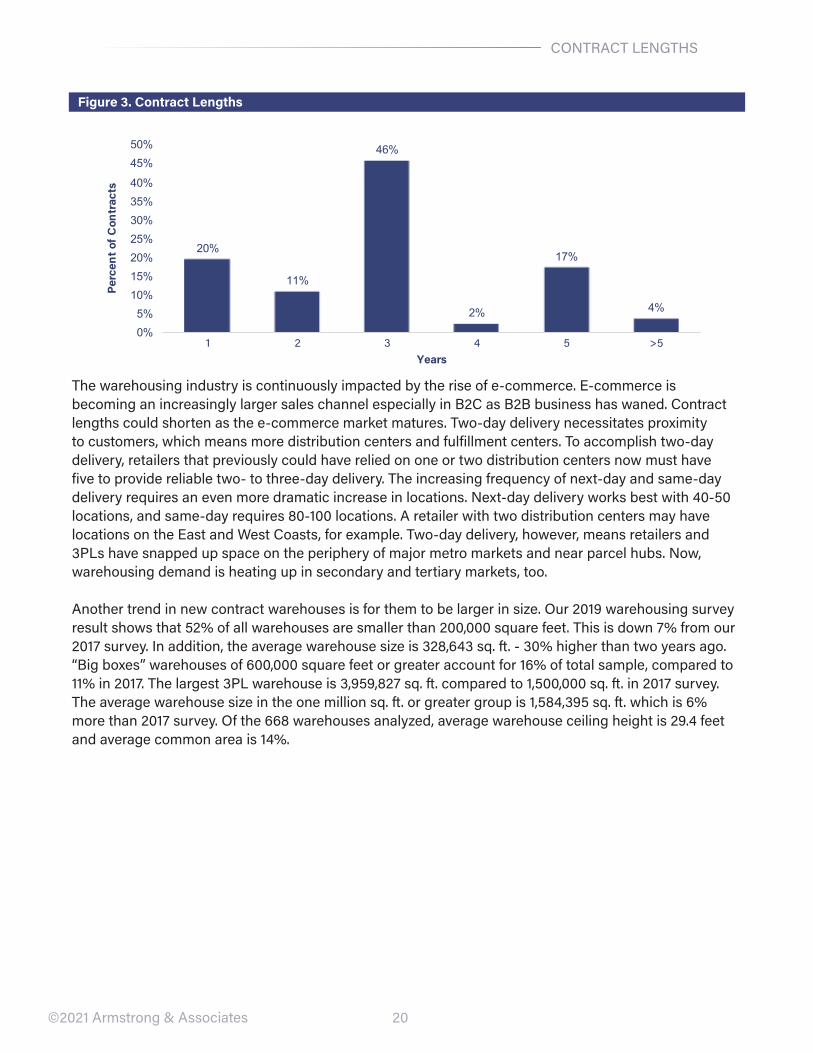
Contract Lengths, Warehouse Sizes and Operating MarginsFigure 3 covers contract lengths. One-year contracts grew 7% over our 2017 survey. Three-year contracts are 46% of the total. Two-year and three-year contracts decreased by 5% compared to 2017. Short-term contracts of 1-3 years now represent 77% of the total. Contracts with longer terms of four years or more, account for 23% of the total.
0-1,000 1,001-2,500 2,501-5,000 5,001+ 0-1,000 1,001-2,500 2,501-5,000 5,001+Average $2.33 $2.20 $2.08 $2.07 $0.44 $0.42 $0.40 $0.39Min $1.00 $1.00 $0.85 $0.85 $0.25 $0.25 $0.20 $0.20Max $3.50 $3.50 $3.50 $3.50 $0.80 $0.75 $0.75 $0.75
Orders Item Fee
Average $0.16Range $0.05 - $0.25
Insert Fee per Page
Special Projects Average Rate
Initial set-up fee $1,450.00
Labor hourly rate $30.94
Touch hourly fee $27.67
20
CONTrACT LeNGTHS
©2021 Armstrong & Associates
Figure 3. Contract Lengths
The warehousing industry is continuously impacted by the rise of e-commerce. e-commerce is becoming an increasingly larger sales channel especially in B2C as B2B business has waned. Contract lengths could shorten as the e-commerce market matures. Two-day delivery necessitates proximity to customers, which means more distribution centers and fulfillment centers. To accomplish two-day delivery, retailers that previously could have relied on one or two distribution centers now must have five to provide reliable two- to three-day delivery. The increasing frequency of next-day and same-day delivery requires an even more dramatic increase in locations. Next-day delivery works best with 40-50 locations, and same-day requires 80-100 locations. A retailer with two distribution centers may have locations on the east and west Coasts, for example. Two-day delivery, however, means retailers and 3PLs have snapped up space on the periphery of major metro markets and near parcel hubs. Now, warehousing demand is heating up in secondary and tertiary markets, too.
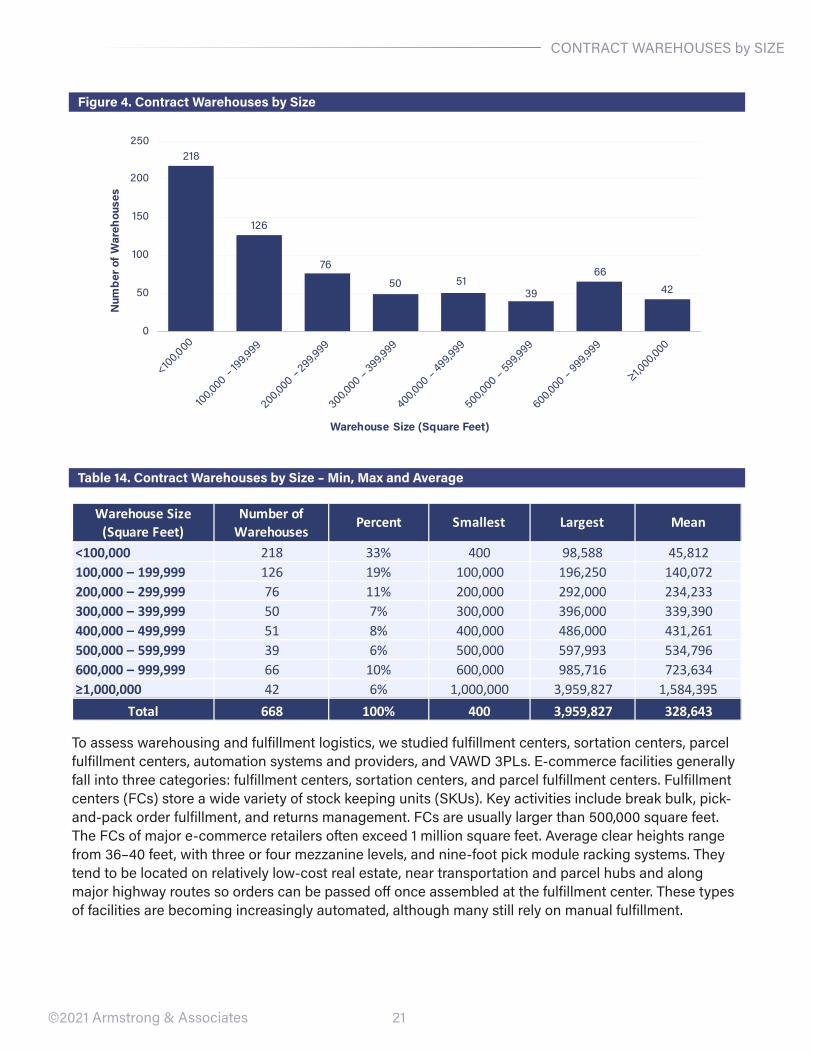
Another trend in new contract warehouses is for them to be larger in size. Our 2019 warehousing survey result shows that 52% of all warehouses are smaller than 200,000 square feet. This is down 7% from our 2017 survey. In addition, the average warehouse size is 328,643 sq. ft. - 30% higher than two years ago. “Big boxes” warehouses of 600,000 square feet or greater account for 16% of total sample, compared to 11% in 2017. The largest 3PL warehouse is 3,959,827 sq. ft. compared to 1,500,000 sq. ft. in 2017 survey. The average warehouse size in the one million sq. ft. or greater group is 1,584,395 sq. ft. which is 6% more than 2017 survey. Of the 668 warehouses analyzed, average warehouse ceiling height is 29.4 feet and average common area is 14%.
20%
11%
46%
2%
17%
4%
0%5%10%15%20%25%30%35%40%
45%50%
1 2 3 4 5 >5
Perc
ent o
f Con
trac
ts
Years
21
CONTrACT wAreHOUSeS by SIZe
©2021 Armstrong & Associates
Figure 4. Contract Warehouses by Size
Table 14. Contract Warehouses by Size – Min, Max and Average
To assess warehousing and fulfillment logistics, we studied fulfillment centers, sortation centers, parcel fulfillment centers, automation systems and providers, and vAwD 3PLs. e-commerce facilities generally fall into three categories: fulfillment centers, sortation centers, and parcel fulfillment centers. Fulfillment centers (FCs) store a wide variety of stock keeping units (SKUs). Key activities include break bulk, pick-and-pack order fulfillment, and returns management. FCs are usually larger than 500,000 square feet. The FCs of major e-commerce retailers often exceed 1 million square feet. Average clear heights range from 36–40 feet, with three or four mezzanine levels, and nine-foot pick module racking systems. They tend to be located on relatively low-cost real estate, near transportation and parcel hubs and along major highway routes so orders can be passed off once assembled at the fulfillment center. These types of facilities are becoming increasingly automated, although many still rely on manual fulfillment.
218
126
76
50 5139
6642
0
50
100
150
200
250
<100,000
100,000 –199,999
200,000 –299,999
300,000 –399,999
400,000 –499,999
500,000 –599,999
600,000 –999,999
≥1,000,000
Num
ber o
f War
ehou
ses
Warehouse Size (Square Feet)
Warehouse Size (Square Feet)
Number of Warehouses
Percent Smallest Largest Mean
<100,000 218 33% 400 98,588 45,812100,000 – 199,999 126 19% 100,000 196,250 140,072200,000 – 299,999 76 11% 200,000 292,000 234,233300,000 – 399,999 50 7% 300,000 396,000 339,390400,000 – 499,999 51 8% 400,000 486,000 431,261500,000 – 599,999 39 6% 500,000 597,993 534,796600,000 – 999,999 66 10% 600,000 985,716 723,634≥1,000,000 42 6% 1,000,000 3,959,827 1,584,395
Total 668 100% 400 3,959,827 328,643
22
CONTrACT wAreHOUSeS by SIZe
©2021 Armstrong & Associates
Sortation is handled at sortation centers and parcel hubs, and cross-docking is a key activity. Some fulfillment may occur from a sortation center location, and therefore storage can include high-velocity SKUs. Sortation centers average between 100,000–500,000 square feet with average clear heights of 24–36 feet. Again, sortation centers are located on relatively low-cost real estate. Placement within a regional/hub-and-spoke distribution network factors into location selection.
Parcel fulfillment centers handle sortation for last-mile delivery, with cross-docking for delivery vans. Parcel fulfillment centers are smaller, usually 100,000 square feet or less, with low clear heights and many cross-docking doors. Parcel fulfillment centers are located within or on the periphery of metro areas.
e-commerce facilities are getting larger and taller due to the variety of SKUs sold by e-commerce retailers and labor-intensive pick-and-pack work e-commerce is driving a shift in the footprint of warehouses. warehouses built in the last five years average nearly 185,000 square feet—143% larger than those built in the pre-recession years of 2002–2007. The shift is vertical, as well: during the same time period, clear height increased about 8%, to 32.3 feet.
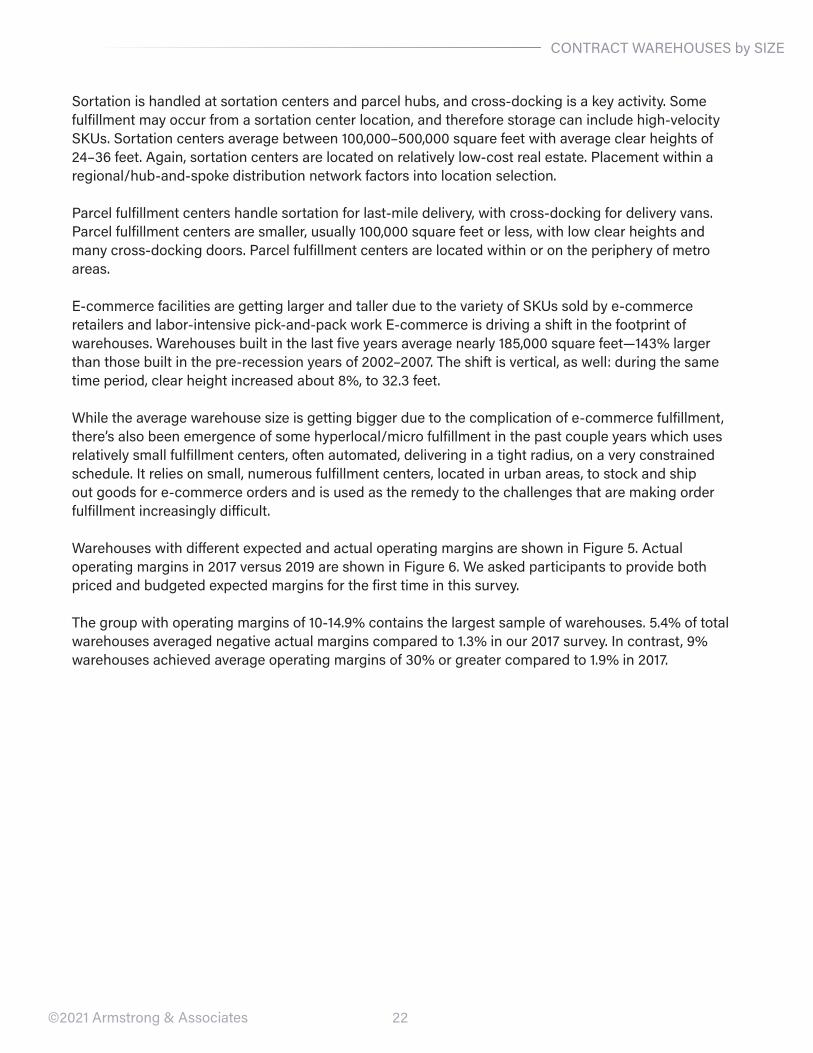
while the average warehouse size is getting bigger due to the complication of e-commerce fulfillment, there’s also been emergence of some hyperlocal/micro fulfillment in the past couple years which uses relatively small fulfillment centers, often automated, delivering in a tight radius, on a very constrained schedule. It relies on small, numerous fulfillment centers, located in urban areas, to stock and ship out goods for e-commerce orders and is used as the remedy to the challenges that are making order fulfillment increasingly difficult. warehouses with different expected and actual operating margins are shown in Figure 5. Actual operating margins in 2017 versus 2019 are shown in Figure 6. we asked participants to provide both priced and budgeted expected margins for the first time in this survey. The group with operating margins of 10-14.9% contains the largest sample of warehouses. 5.4% of total warehouses averaged negative actual margins compared to 1.3% in our 2017 survey. In contrast, 9% warehouses achieved average operating margins of 30% or greater compared to 1.9% in 2017.
Figure 5. Contract Warehouses by Expected and Actual Operating Margins – 2019
23
CONTrACT wAreHOUSe MArGINS
©2021 Armstrong & Associates
Figure 5. Contract Warehouses by Expected and Actual Operating Margins – 2019
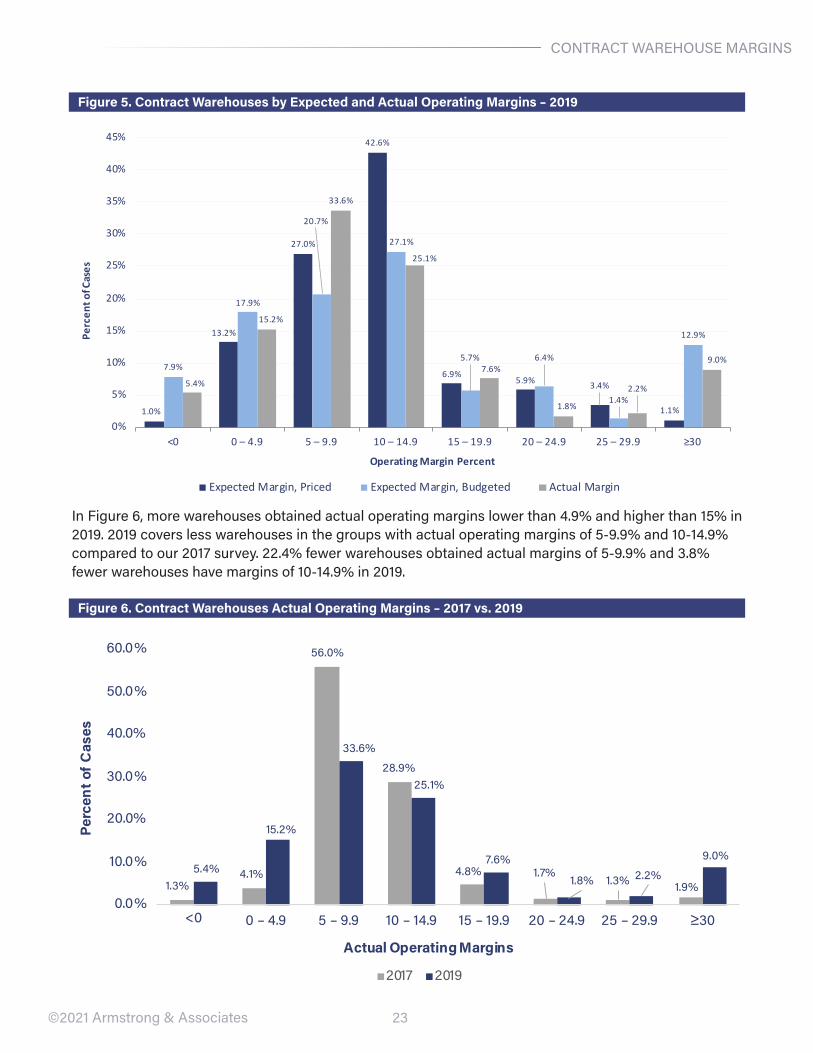
In Figure 6, more warehouses obtained actual operating margins lower than 4.9% and higher than 15% in 2019. 2019 covers less warehouses in the groups with actual operating margins of 5-9.9% and 10-14.9% compared to our 2017 survey. 22.4% fewer warehouses obtained actual margins of 5-9.9% and 3.8% fewer warehouses have margins of 10-14.9% in 2019.
Figure 6. Contract Warehouses Actual Operating Margins – 2017 vs. 2019
1.0%
13.2%
27.0%
42.6%
6.9%5.9% 3.4%
1.1%
7.9%
17.9%
20.7%
27.1%
5.7% 6.4%
1.4%
12.9%
5.4%
15.2%
33.6%
25.1%
7.6%
1.8%
2.2%
9.0%
0%
5%
10%
15%
20%
25%
30%
35%
40%
45%
<0 0 – 4.9 5 – 9.9 10 – 14.9 15 – 19.9 20 – 24.9 25 – 29.9 ≥30
Perc
ent o
f Cas
es
Operating Margin Percent
Expected Margin, Priced Expected Margin, Budgeted Actual Margin
1.3%4.1%
56.0%
28.9%
4.8% 1.7%1.3% 1.9%
5.4%
15.2%
33.6%
25.1%
7.6%
1.8% 2.2%
9.0%
0.0%
10.0%
20.0%
30.0%
40.0%
50.0%
60.0%
<0 0 – 4.9 5 – 9.9 10 – 14.9 15 – 19.9 20 – 24.9 25 – 29.9 ≥30
Perc
ent o
f Cas
es
Actual Operating Margins
2017 2019
24
CONTrACT wAreHOUSe MArGINS
©2021 Armstrong & Associates
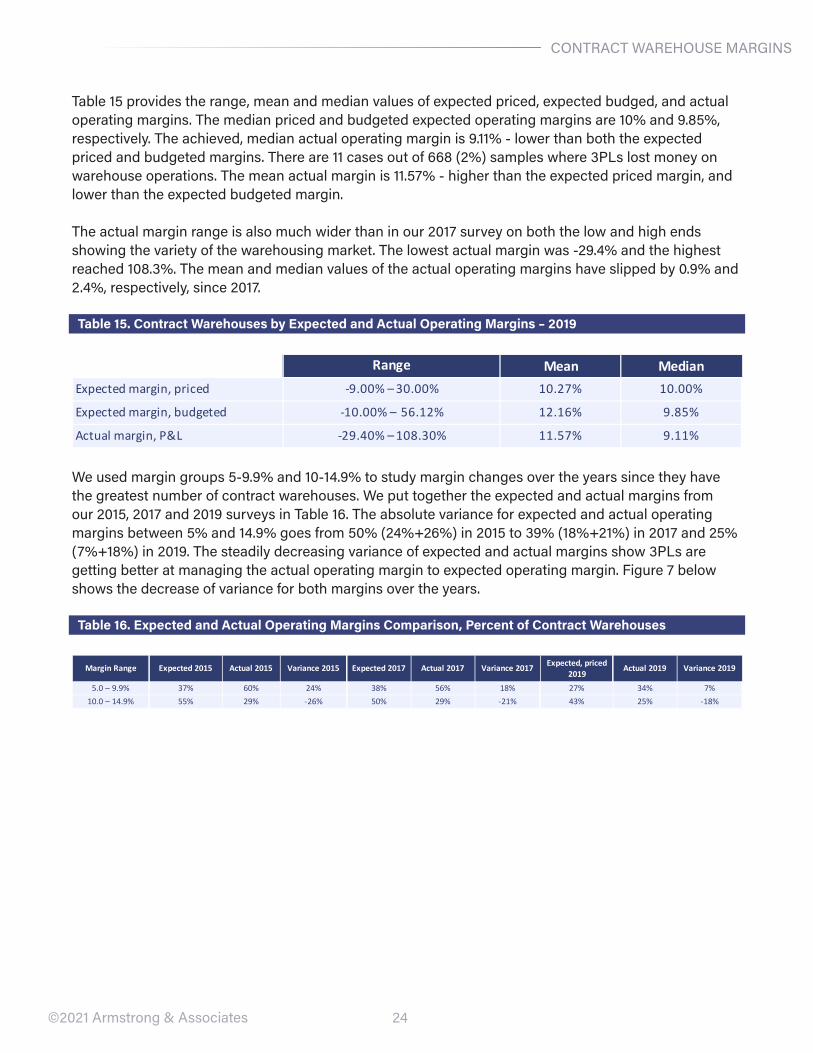
Table 15 provides the range, mean and median values of expected priced, expected budged, and actual operating margins. The median priced and budgeted expected operating margins are 10% and 9.85%, respectively. The achieved, median actual operating margin is 9.11% - lower than both the expected priced and budgeted margins. There are 11 cases out of 668 (2%) samples where 3PLs lost money on warehouse operations. The mean actual margin is 11.57% - higher than the expected priced margin, and lower than the expected budgeted margin.
The actual margin range is also much wider than in our 2017 survey on both the low and high ends showing the variety of the warehousing market. The lowest actual margin was -29.4% and the highest reached 108.3%. The mean and median values of the actual operating margins have slipped by 0.9% and 2.4%, respectively, since 2017.
Table 15. Contract Warehouses by Expected and Actual Operating Margins – 2019
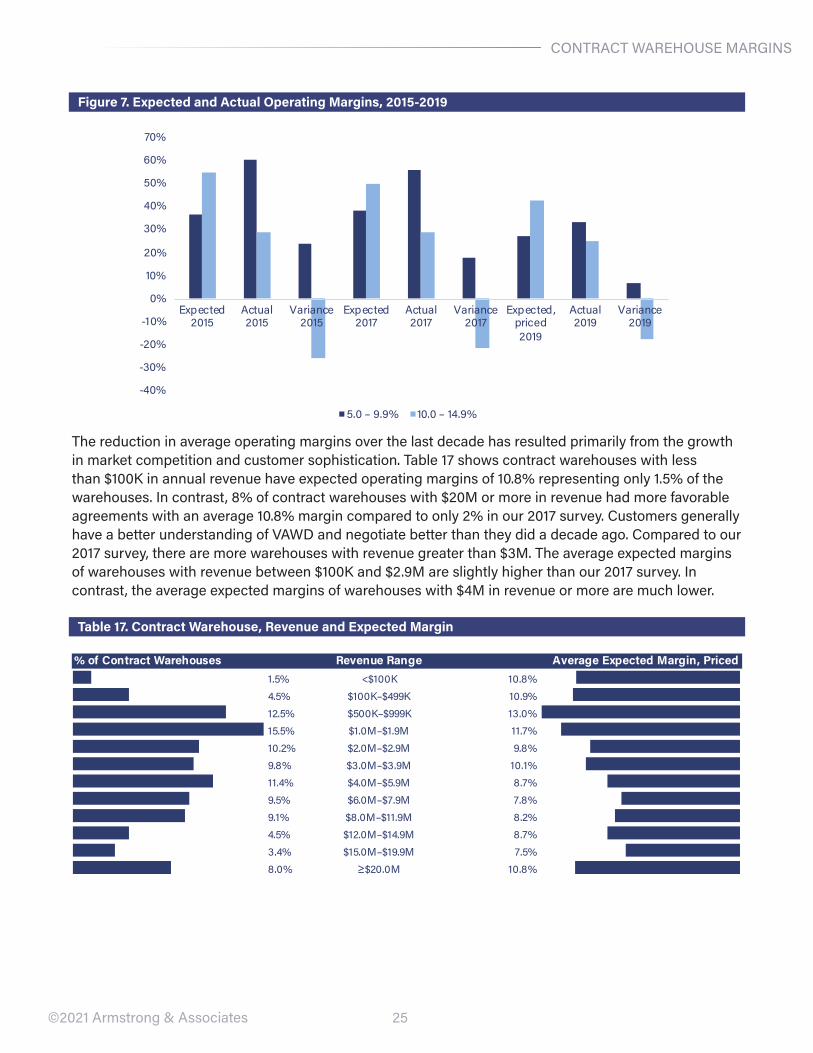
we used margin groups 5-9.9% and 10-14.9% to study margin changes over the years since they have the greatest number of contract warehouses. we put together the expected and actual margins from our 2015, 2017 and 2019 surveys in Table 16. The absolute variance for expected and actual operating margins between 5% and 14.9% goes from 50% (24%+26%) in 2015 to 39% (18%+21%) in 2017 and 25% (7%+18%) in 2019. The steadily decreasing variance of expected and actual margins show 3PLs are getting better at managing the actual operating margin to expected operating margin. Figure 7 below shows the decrease of variance for both margins over the years.
Table 16. Expected and Actual Operating Margins Comparison, Percent of Contract Warehouses
Mean MedianExpected margin, priced 10.27% 10.00%
Expected margin, budgeted 12.16% 9.85%
Actual margin, P&L 11.57% 9.11%
-9.00% – 30.00%
-10.00% – 56.12%
-29.40% – 108.30%
Range
Margin Range Expected 2015 Actual 2015 Variance 2015 Expected 2017 Actual 2017 Variance 2017 Expected, priced 2019
Actual 2019 Variance 2019
5.0 – 9.9% 37% 60% 24% 38% 56% 18% 27% 34% 7%10.0 – 14.9% 55% 29% -26% 50% 29% -21% 43% 25% -18%
25
CONTrACT wAreHOUSe MArGINS
©2021 Armstrong & Associates
Figure 7. Expected and Actual Operating Margins, 2015-2019
The reduction in average operating margins over the last decade has resulted primarily from the growth in market competition and customer sophistication. Table 17 shows contract warehouses with less than $100K in annual revenue have expected operating margins of 10.8% representing only 1.5% of the warehouses. In contrast, 8% of contract warehouses with $20M or more in revenue had more favorable agreements with an average 10.8% margin compared to only 2% in our 2017 survey. Customers generally have a better understanding of vAwD and negotiate better than they did a decade ago. Compared to our 2017 survey, there are more warehouses with revenue greater than $3M. The average expected margins of warehouses with revenue between $100K and $2.9M are slightly higher than our 2017 survey. In contrast, the average expected margins of warehouses with $4M in revenue or more are much lower.
Table 17. Contract Warehouse, Revenue and Expected Margin
-40%
-30%
-20%
-10%
0%
10%
20%
30%
40%
50%
60%
70%
Expected2015
Actual2015
Variance2015
Expected2017
Actual2017
Variance2017
Expected,priced2019
Actual2019
Variance2019
5.0 – 9.9% 10.0 – 14.9%
Revenue Range1.5% <$100K 10.8%4.5% $100K–$499K 10.9%12.5% $500K–$999K 13.0%15.5% $1.0M–$1.9M 11.7%10.2% $2.0M–$2.9M 9.8%9.8% $3.0M–$3.9M 10.1%11.4% $4.0M–$5.9M 8.7%9.5% $6.0M–$7.9M 7.8%9.1% $8.0M–$11.9M 8.2%4.5% $12.0M–$14.9M 8.7%3.4% $15.0M–$19.9M 7.5%8.0% ≥$20.0M 10.8%
% of Contract Warehouses Average Expected Margin, Priced
26
OwNeD vs. LeASeD
©2021 Armstrong & Associates
The buyers of vAwD services always tend to have the upper hand. This is true especially where they own the facilities. we also noticed larger companies increasingly provided purchasing/procurement advisors to outsourcing teams over the past years. In our 2018 3PL rFP Activity and expected Profit Margins Study, we asked, “How often are customers’ procurement/purchasing department personnel involved in their 3PL rFI/rFP process?” There has been expansion of procurement/purchasing department involvement in the rFI/rFP process. There were a variety of answers ranging from very rarely to 100% involvement. 23% companies mentioned 100% involvement of customer’s procurement/purchasing department in the rFI/rFP process. Shippers are applying pressure on 3PLs to drive cost down while the 3PL market becomes increasingly competitive.
During the pandemic, things have changed. One senior transportation manager mentioned that “Shippers are more likely to gravitate toward trusted providers who have been with them for a long time – even if they cost more. when the going gets tough, people fall back on those they know over those offering to save them a few bucks.” For most shippers, this pattern converts to more partnership-based relationships.
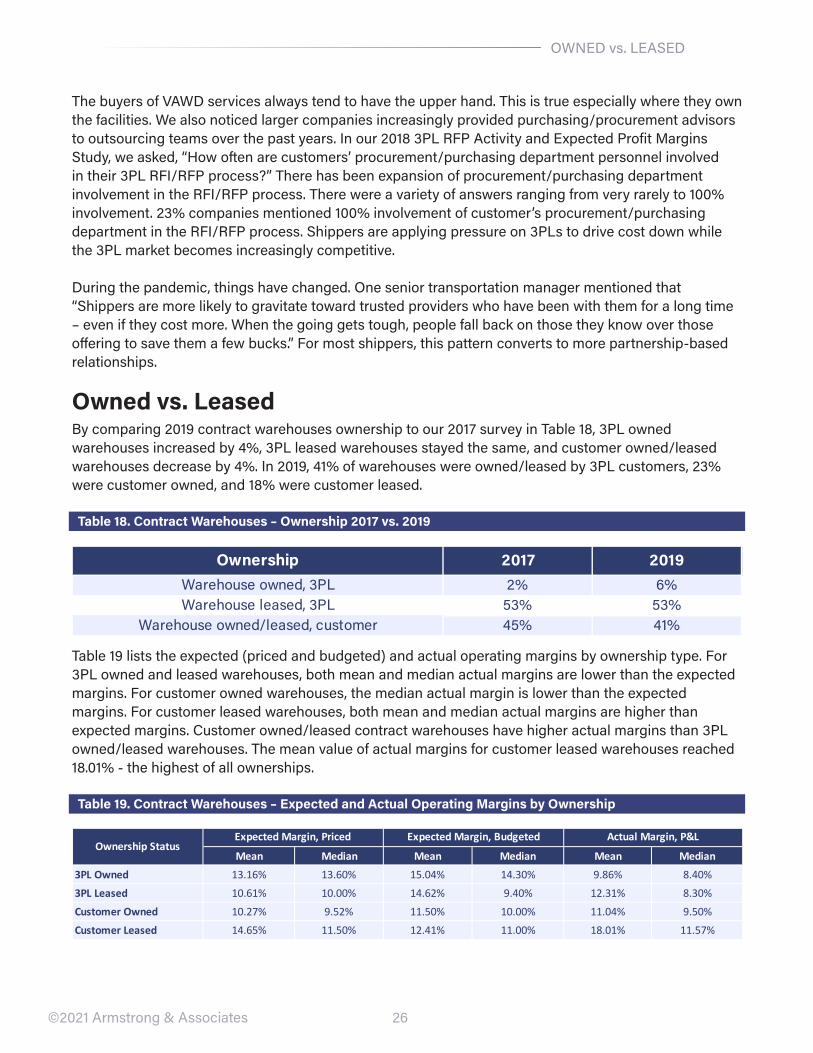
Owned vs. LeasedBy comparing 2019 contract warehouses ownership to our 2017 survey in Table 18, 3PL owned warehouses increased by 4%, 3PL leased warehouses stayed the same, and customer owned/leased warehouses decrease by 4%. In 2019, 41% of warehouses were owned/leased by 3PL customers, 23% were customer owned, and 18% were customer leased.
Table 18. Contract Warehouses – Ownership 2017 vs. 2019
Table 19 lists the expected (priced and budgeted) and actual operating margins by ownership type. For 3PL owned and leased warehouses, both mean and median actual margins are lower than the expected margins. For customer owned warehouses, the median actual margin is lower than the expected margins. For customer leased warehouses, both mean and median actual margins are higher than expected margins. Customer owned/leased contract warehouses have higher actual margins than 3PL owned/leased warehouses. The mean value of actual margins for customer leased warehouses reached 18.01% - the highest of all ownerships.
Table 19. Contract Warehouses – Expected and Actual Operating Margins by Ownership
Ownership 2017 2019Warehouse owned, 3PL 2% 6%Warehouse leased, 3PL 53% 53%
Warehouse owned/leased, customer 45% 41%
Mean Median Mean Median Mean Median
3PL Owned 13.16% 13.60% 15.04% 14.30% 9.86% 8.40%
3PL Leased 10.61% 10.00% 14.62% 9.40% 12.31% 8.30%
Customer Owned 10.27% 9.52% 11.50% 10.00% 11.04% 9.50%
Customer Leased 14.65% 11.50% 12.41% 11.00% 18.01% 11.57%
Ownership StatusExpected Margin, Priced Actual Margin, P&LExpected Margin, Budgeted
27
wAreHOUSe HANDLING TYPeS
©2021 Armstrong & Associates
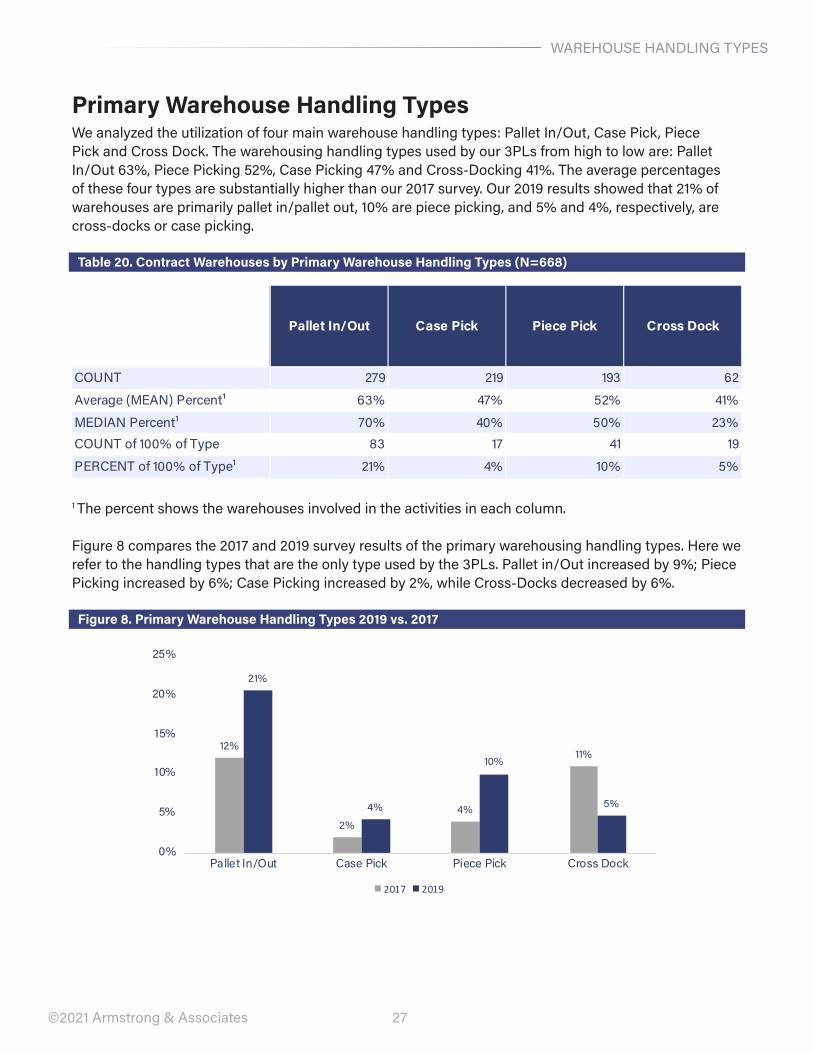
Primary Warehouse Handling Typeswe analyzed the utilization of four main warehouse handling types: Pallet In/Out, Case Pick, Piece Pick and Cross Dock. The warehousing handling types used by our 3PLs from high to low are: Pallet In/Out 63%, Piece Picking 52%, Case Picking 47% and Cross-Docking 41%. The average percentages of these four types are substantially higher than our 2017 survey. Our 2019 results showed that 21% of warehouses are primarily pallet in/pallet out, 10% are piece picking, and 5% and 4%, respectively, are cross-docks or case picking.
Table 20. Contract Warehouses by Primary Warehouse Handling Types (N=668)
1 The percent shows the warehouses involved in the activities in each column.
Figure 8 compares the 2017 and 2019 survey results of the primary warehousing handling types. Here we refer to the handling types that are the only type used by the 3PLs. Pallet in/Out increased by 9%; Piece Picking increased by 6%; Case Picking increased by 2%, while Cross-Docks decreased by 6%.
Figure 8. Primary Warehouse Handling Types 2019 vs. 2017
2015 Contract Warehouses Summary (excluding CEVA and <5K SF)
Pallet In/Out Case Pick Piece Pick Cross Dock
COUNT 279 219 193 62
Average (MEAN) Percent¹ 63% 47% 52% 41%
MEDIAN Percent¹ 70% 40% 50% 23%COUNT of 100% of Type 83 17 41 19
PERCENT of 100% of Type¹ 21% 4% 10% 5%
12%
2%4%
11%
21%
4%
10%
5%
0%
5%
10%
15%
20%
25%
Pallet In/Out Case Pick Piece Pick Cross Dock
2017 2019
28©2021 Armstrong & Associates
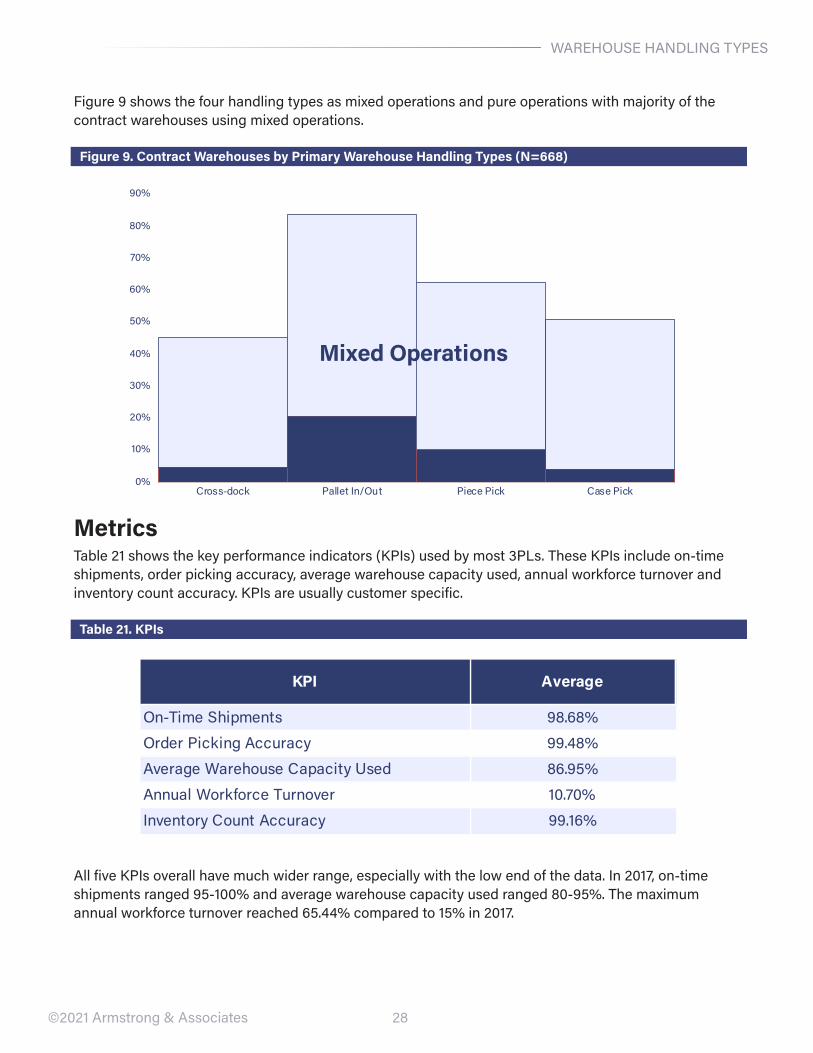
Figure 9 shows the four handling types as mixed operations and pure operations with majority of the contract warehouses using mixed operations.
Figure 9. Contract Warehouses by Primary Warehouse Handling Types (N=668)
MetricsTable 21 shows the key performance indicators (KPIs) used by most 3PLs. These KPIs include on-time shipments, order picking accuracy, average warehouse capacity used, annual workforce turnover and inventory count accuracy. KPIs are usually customer specific.
Table 21. KPIs
All five KPIs overall have much wider range, especially with the low end of the data. In 2017, on-time shipments ranged 95-100% and average warehouse capacity used ranged 80-95%. The maximum annual workforce turnover reached 65.44% compared to 15% in 2017.
0%
10%
20%
30%
40%
50%
60%
70%
80%
90%
Cross-dock Pallet In/Out Piece Pick Case Pick
Mixed Operations
KPI Average
On-Time Shipments 98.68%
Order Picking Accuracy 99.48%
Average Warehouse Capacity Used 86.95%
Annual Workforce Turnover 10.70%
Inventory Count Accuracy 99.16%
wAreHOUSe HANDLING TYPeS
29©2021 Armstrong & Associates
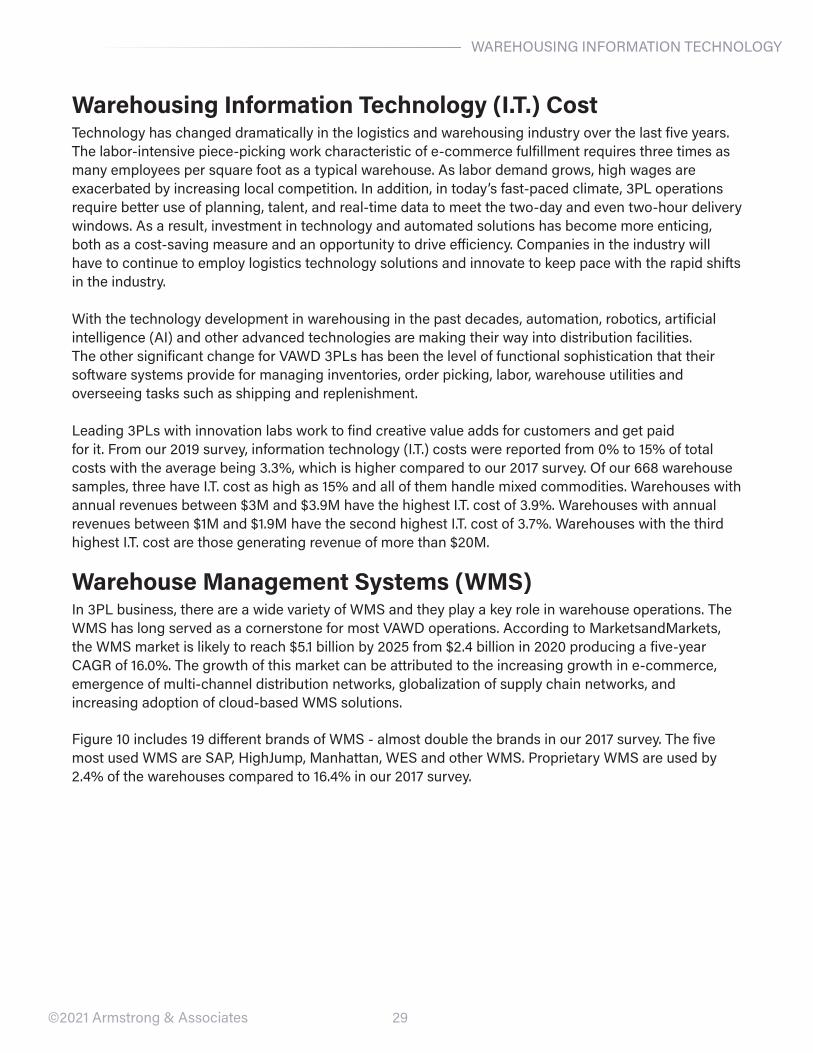
Warehousing Information Technology (I.T.) CostTechnology has changed dramatically in the logistics and warehousing industry over the last five years. The labor-intensive piece-picking work characteristic of e-commerce fulfillment requires three times as many employees per square foot as a typical warehouse. As labor demand grows, high wages are exacerbated by increasing local competition. In addition, in today’s fast-paced climate, 3PL operations require better use of planning, talent, and real-time data to meet the two-day and even two-hour delivery windows. As a result, investment in technology and automated solutions has become more enticing, both as a cost-saving measure and an opportunity to drive efficiency. Companies in the industry will have to continue to employ logistics technology solutions and innovate to keep pace with the rapid shifts in the industry.
with the technology development in warehousing in the past decades, automation, robotics, artificial intelligence (AI) and other advanced technologies are making their way into distribution facilities. The other significant change for vAwD 3PLs has been the level of functional sophistication that their software systems provide for managing inventories, order picking, labor, warehouse utilities and overseeing tasks such as shipping and replenishment.
Leading 3PLs with innovation labs work to find creative value adds for customers and get paid for it. From our 2019 survey, information technology (I.T.) costs were reported from 0% to 15% of total costs with the average being 3.3%, which is higher compared to our 2017 survey. Of our 668 warehouse samples, three have I.T. cost as high as 15% and all of them handle mixed commodities. warehouses with annual revenues between $3M and $3.9M have the highest I.T. cost of 3.9%. warehouses with annual revenues between $1M and $1.9M have the second highest I.T. cost of 3.7%. warehouses with the third highest I.T. cost are those generating revenue of more than $20M.
Warehouse Management Systems (WMS)In 3PL business, there are a wide variety of wMS and they play a key role in warehouse operations. The wMS has long served as a cornerstone for most vAwD operations. According to MarketsandMarkets, the wMS market is likely to reach $5.1 billion by 2025 from $2.4 billion in 2020 producing a five-year CAGr of 16.0%. The growth of this market can be attributed to the increasing growth in e-commerce, emergence of multi-channel distribution networks, globalization of supply chain networks, and increasing adoption of cloud-based wMS solutions.
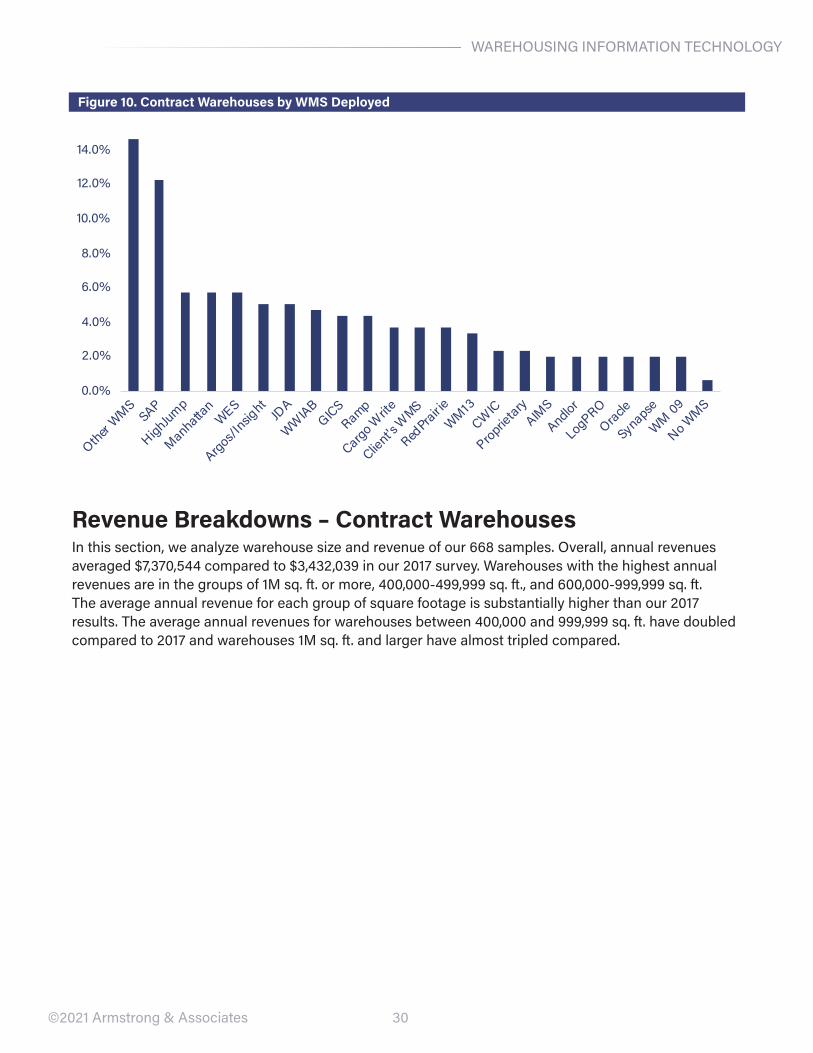
Figure 10 includes 19 different brands of wMS - almost double the brands in our 2017 survey. The five most used wMS are SAP, HighJump, Manhattan, weS and other wMS. Proprietary wMS are used by 2.4% of the warehouses compared to 16.4% in our 2017 survey.
wAreHOUSING INFOrMATION TeCHNOLOGY
30©2021 Armstrong & Associates
Figure 10. Contract Warehouses by WMS Deployed
0.0%
2.0%
4.0%
6.0%
8.0%
10.0%
12.0%
14.0%
Other WMS
SAP
HighJump
Manhattan
WES
Argos/Insig
htJD
A
WWIAB
GICSRamp
Cargo Write
Client's
WMS
RedPrair ie
WM13CW
IC
Proprietary
AIMS
Andlor
LogPROOracle
Synapse
WM 09
No WMS
Revenue Breakdowns – Contract WarehousesIn this section, we analyze warehouse size and revenue of our 668 samples. Overall, annual revenues averaged $7,370,544 compared to $3,432,039 in our 2017 survey. warehouses with the highest annual revenues are in the groups of 1M sq. ft. or more, 400,000-499,999 sq. ft., and 600,000-999,999 sq. ft. The average annual revenue for each group of square footage is substantially higher than our 2017 results. The average annual revenues for warehouses between 400,000 and 999,999 sq. ft. have doubled compared to 2017 and warehouses 1M sq. ft. and larger have almost tripled compared.
wAreHOUSING INFOrMATION TeCHNOLOGY
31©2021 Armstrong & Associates
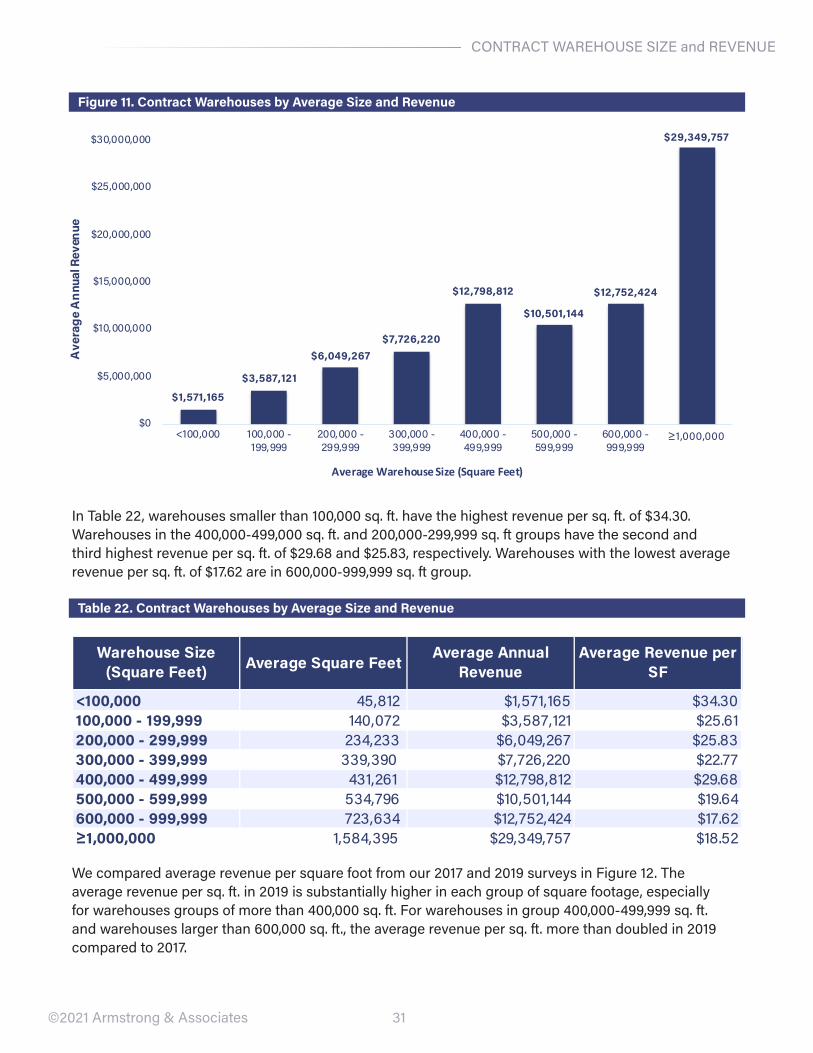
Figure 11. Contract Warehouses by Average Size and Revenue
In Table 22, warehouses smaller than 100,000 sq. ft. have the highest revenue per sq. ft. of $34.30. warehouses in the 400,000-499,000 sq. ft. and 200,000-299,999 sq. ft groups have the second and third highest revenue per sq. ft. of $29.68 and $25.83, respectively. warehouses with the lowest average revenue per sq. ft. of $17.62 are in 600,000-999,999 sq. ft group.
Table 22. Contract Warehouses by Average Size and Revenue
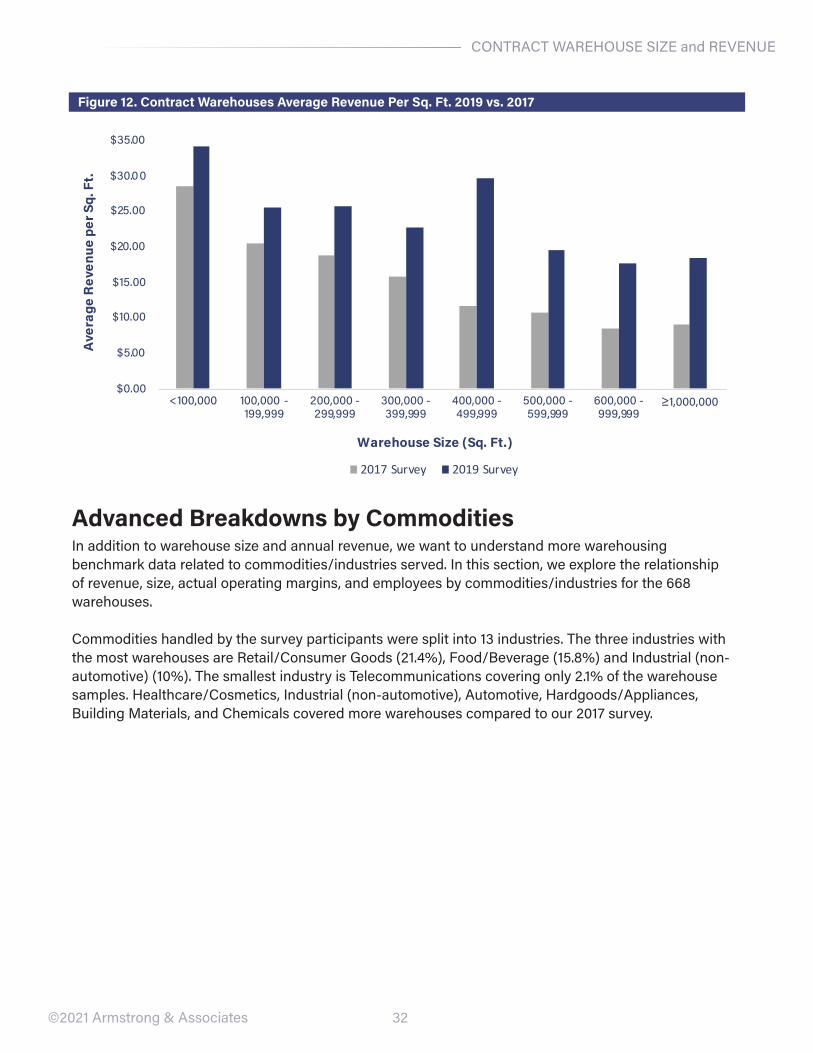
we compared average revenue per square foot from our 2017 and 2019 surveys in Figure 12. The average revenue per sq. ft. in 2019 is substantially higher in each group of square footage, especially for warehouses groups of more than 400,000 sq. ft. For warehouses in group 400,000-499,999 sq. ft. and warehouses larger than 600,000 sq. ft., the average revenue per sq. ft. more than doubled in 2019 compared to 2017.
$1,571,165
$3,587,121
$6,049,267 $7,726,220
$12,798,812
$10,501,144
$12,752,424
$29,349,757
$0
$5,000,000
$10,000,000
$15,000,000
$20,000,000
$25,000,000
$30,000,000
<100,000 100,000 -199,999
200,000 -299,999
300,000 -399,999
400,000 -499,999
500,000 -599,999
600,000 -999,999
≥1,000,000
Ave
rage
Ann
ual R
even
ue
Average Warehouse Size (Square Feet)
Warehouse Size (Square Feet) Average Square Feet
Average Annual Revenue
Average Revenue per SF
<100,000 45,812 $1,571,165 $34.30 100,000 - 199,999 140,072 $3,587,121 $25.61 200,000 - 299,999 234,233 $6,049,267 $25.83 300,000 - 399,999 339,390 $7,726,220 $22.77 400,000 - 499,999 431,261 $12,798,812 $29.68 500,000 - 599,999 534,796 $10,501,144 $19.64 600,000 - 999,999 723,634 $12,752,424 $17.62 ≥1,000,000 1,584,395 $29,349,757 $18.52
CONTrACT wAreHOUSe SIZe and reveNUe
32
CONTrACT wAreHOUSe SIZe and reveNUe
©2021 Armstrong & Associates
Figure 12. Contract Warehouses Average Revenue Per Sq. Ft. 2019 vs. 2017
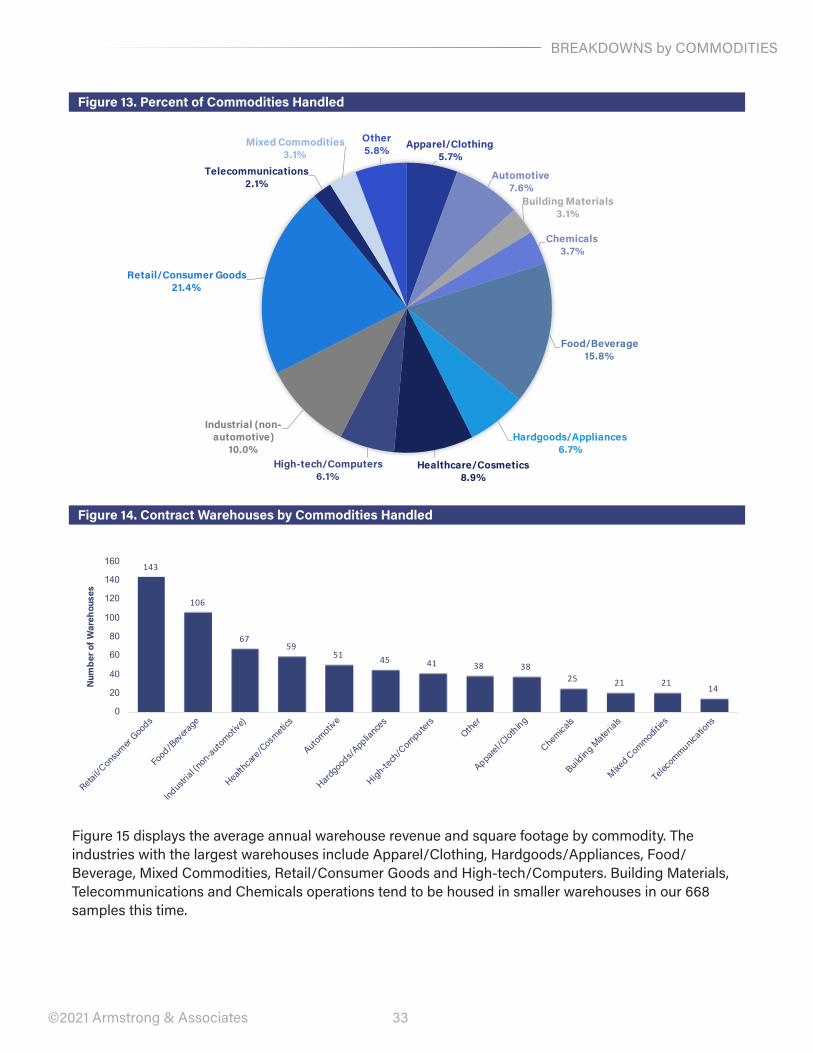
Advanced Breakdowns by CommoditiesIn addition to warehouse size and annual revenue, we want to understand more warehousing benchmark data related to commodities/industries served. In this section, we explore the relationship of revenue, size, actual operating margins, and employees by commodities/industries for the 668 warehouses.
Commodities handled by the survey participants were split into 13 industries. The three industries with the most warehouses are retail/Consumer Goods (21.4%), Food/Beverage (15.8%) and Industrial (non-automotive) (10%). The smallest industry is Telecommunications covering only 2.1% of the warehouse samples. Healthcare/Cosmetics, Industrial (non-automotive), Automotive, Hardgoods/Appliances, Building Materials, and Chemicals covered more warehouses compared to our 2017 survey.
$0.00
$5.00
$10.00
$15.00
$20.00
$25.00
$30.00
$35.00
<100,000 100,000 -199,999
200,000 -299,999
300,000 -399,999
400,000 -499,999
500,000 -599,999
600,000 -999,999
≥1,000,000
Ave
rage
Rev
enue
per
Sq.
Ft.
Warehouse Size (Sq. Ft.)
2017 Survey 2019 Survey
33©2021 Armstrong & Associates
Figure 13. Percent of Commodities Handled
Figure 14. Contract Warehouses by Commodities Handled
Figure 15 displays the average annual warehouse revenue and square footage by commodity. The industries with the largest warehouses include Apparel/Clothing, Hardgoods/Appliances, Food/Beverage, Mixed Commodities, retail/Consumer Goods and High-tech/Computers. Building Materials, Telecommunications and Chemicals operations tend to be housed in smaller warehouses in our 668 samples this time.
Apparel/Clothing5.7%
Automotive7.6%
Building Materials3.1%
Chemicals3.7%
Food/Beverage15.8%
Hardgoods/Appliances6.7%
Healthcare/Cosmetics8.9%
High-tech/Computers6.1%
Industrial (non-automotive)
10.0%
Retail/Consumer Goods21.4%
Telecommunications2.1%
Mixed Commodities3.1%
Other5.8%
143
106
6759
51 45 41 38 3825 21 21
14
0
20
40
60
80
100
120
140
160
Retail/Consu
mer Goods
Food/Bev
erage
Industrial (n
on-automotive)
Healthcare
/Cosmetic
s
Automotive
Hardgoods/Applia
nces
High-tech
/Computers
Other
Apparel/Clothing
Chemicals
Building M
aterials
Mixed C
ommodities
Telecommunicatio
ns
Num
ber o
f War
ehou
ses
BreAKDOwNS by COMMODITIeS
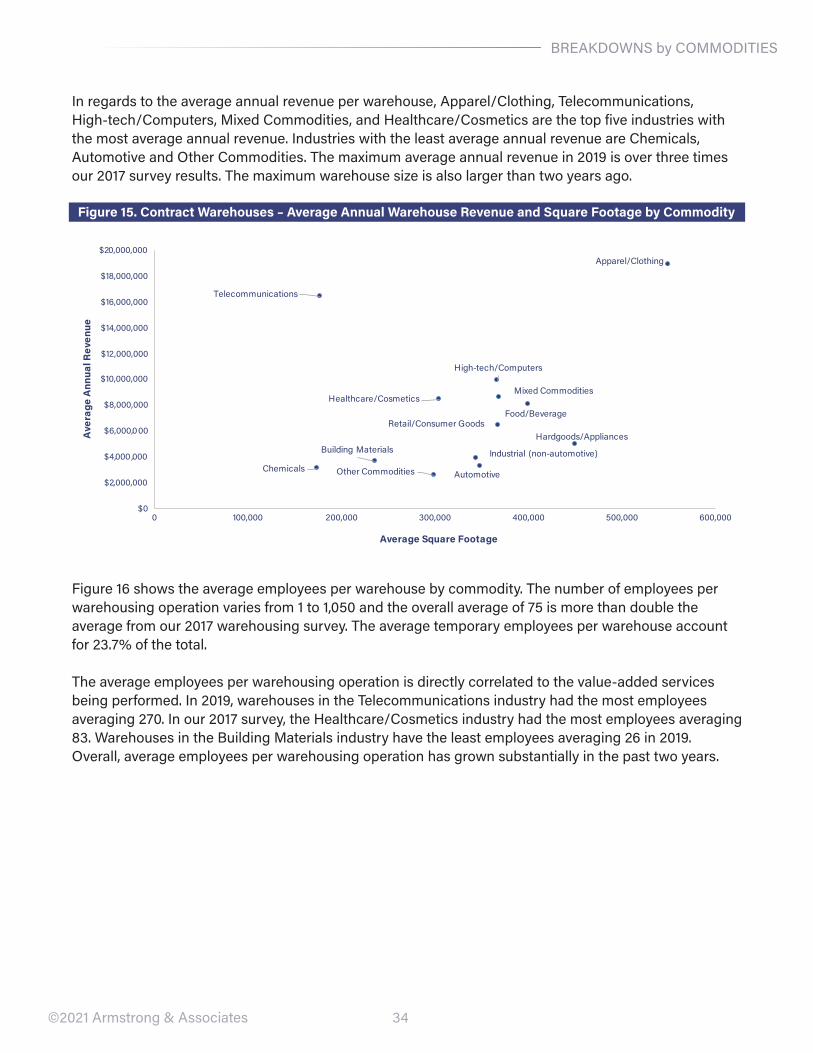
34
BreAKDOwNS by COMMODITIeS
©2021 Armstrong & Associates
In regards to the average annual revenue per warehouse, Apparel/Clothing, Telecommunications, High-tech/Computers, Mixed Commodities, and Healthcare/Cosmetics are the top five industries with the most average annual revenue. Industries with the least average annual revenue are Chemicals, Automotive and Other Commodities. The maximum average annual revenue in 2019 is over three times our 2017 survey results. The maximum warehouse size is also larger than two years ago.
Figure 15. Contract Warehouses – Average Annual Warehouse Revenue and Square Footage by Commodity
Figure 16 shows the average employees per warehouse by commodity. The number of employees per warehousing operation varies from 1 to 1,050 and the overall average of 75 is more than double the average from our 2017 warehousing survey. The average temporary employees per warehouse account for 23.7% of the total.
The average employees per warehousing operation is directly correlated to the value-added services being performed. In 2019, warehouses in the Telecommunications industry had the most employees averaging 270. In our 2017 survey, the Healthcare/Cosmetics industry had the most employees averaging 83. warehouses in the Building Materials industry have the least employees averaging 26 in 2019. Overall, average employees per warehousing operation has grown substantially in the past two years.
Apparel/Clothing
Automotive
Building Materials
Chemicals
Food/Beverage
Hardgoods/Appliances
Healthcare/Cosmetics
High-tech/Computers
Industrial (non-automotive)
Mixed Commodities
Other Commodities
Retail/Consumer Goods
Telecommunications
$0
$2,000,000
$4,000,000
$6,000,000
$8,000,000
$10,000,000
$12,000,000
$14,000,000
$16,000,000
$18,000,000
$20,000,000
0 100,000 200,000 300,000 400,000 500,000 600,000
Ave
rage
Ann
ual R
even
ue
Average Square Footage
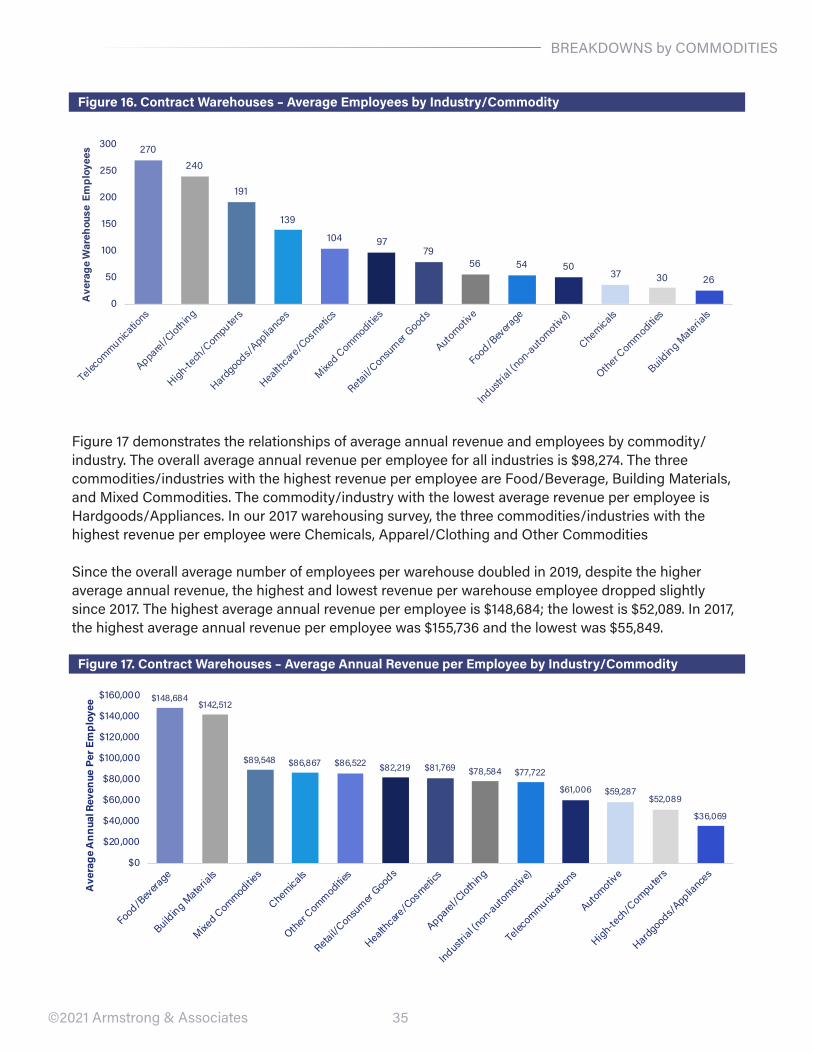
35
BreAKDOwNS by COMMODITIeS
©2021 Armstrong & Associates
Figure 16. Contract Warehouses – Average Employees by Industry/Commodity
Figure 17 demonstrates the relationships of average annual revenue and employees by commodity/industry. The overall average annual revenue per employee for all industries is $98,274. The three commodities/industries with the highest revenue per employee are Food/Beverage, Building Materials, and Mixed Commodities. The commodity/industry with the lowest average revenue per employee is Hardgoods/Appliances. In our 2017 warehousing survey, the three commodities/industries with the highest revenue per employee were Chemicals, Apparel/Clothing and Other Commodities
Since the overall average number of employees per warehouse doubled in 2019, despite the higher average annual revenue, the highest and lowest revenue per warehouse employee dropped slightly since 2017. The highest average annual revenue per employee is $148,684; the lowest is $52,089. In 2017, the highest average annual revenue per employee was $155,736 and the lowest was $55,849.
Figure 17. Contract Warehouses – Average Annual Revenue per Employee by Industry/Commodity
270240
191
139
104 9779
56 54 5037 30 26
0
50
100
150
200
250
300
Telecommunicatio
ns
Apparel/Clothing
High-tech
/Computers
Hardgoods/Applia
nces
Healthcare
/Cosmetic
s
Mixed C
ommodities
Retail/Consu
mer Goods
Automotive
Food/Bev
erage
Industrial (n
on-automotive)
Chemicals
Other Commoditie
s
Building M
aterials
Ave
rage
War
ehou
se E
mpl
oyee
s
$148,684$142,512
$89,548 $86,867 $86,522 $82,219 $81,769 $78,584 $77,722
$61,006 $59,287$52,089
$36,069
$0
$20,000
$40,000
$60,000
$80,000
$100,000
$120,000
$140,000
$160,000
Food/Bev
erage
Building M
aterials
Mixed C
ommodities
Chemicals
Other Commoditie
s
Retail/Consu
mer Goods
Healthcare
/Cosmetic
s
Apparel/Clothing
Industrial (n
on-automotive)
Telecommunicatio
ns
Automotive
High-tech
/Computers
Hardgoods/Applia
nces
Ave
rage
Ann
ual R
even
ue P
er E
mpl
oyee
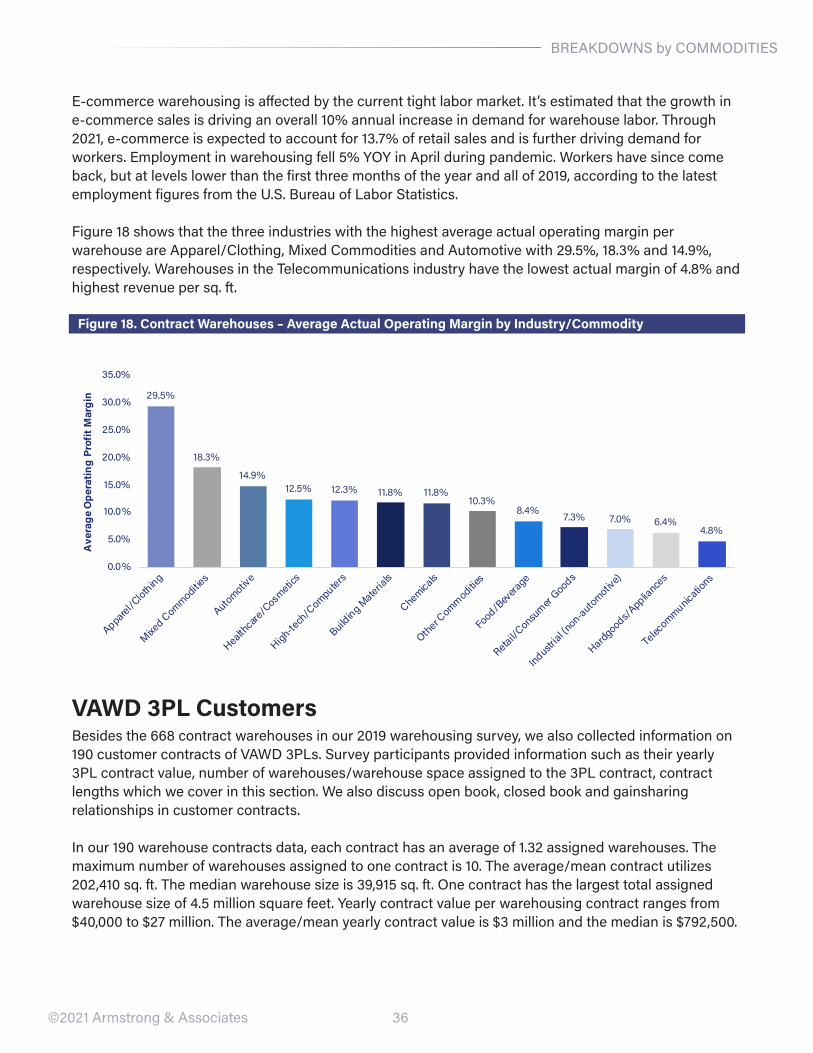
36
BreAKDOwNS by COMMODITIeS
©2021 Armstrong & Associates
e-commerce warehousing is affected by the current tight labor market. It’s estimated that the growth in e-commerce sales is driving an overall 10% annual increase in demand for warehouse labor. Through 2021, e-commerce is expected to account for 13.7% of retail sales and is further driving demand for workers. employment in warehousing fell 5% YOY in April during pandemic. workers have since come back, but at levels lower than the first three months of the year and all of 2019, according to the latest employment figures from the U.S. Bureau of Labor Statistics.
Figure 18 shows that the three industries with the highest average actual operating margin per warehouse are Apparel/Clothing, Mixed Commodities and Automotive with 29.5%, 18.3% and 14.9%, respectively. warehouses in the Telecommunications industry have the lowest actual margin of 4.8% and highest revenue per sq. ft.
Figure 18. Contract Warehouses – Average Actual Operating Margin by Industry/Commodity
VAWD 3PL CustomersBesides the 668 contract warehouses in our 2019 warehousing survey, we also collected information on 190 customer contracts of vAwD 3PLs. Survey participants provided information such as their yearly 3PL contract value, number of warehouses/warehouse space assigned to the 3PL contract, contract lengths which we cover in this section. we also discuss open book, closed book and gainsharing relationships in customer contracts.
In our 190 warehouse contracts data, each contract has an average of 1.32 assigned warehouses. The maximum number of warehouses assigned to one contract is 10. The average/mean contract utilizes 202,410 sq. ft. The median warehouse size is 39,915 sq. ft. One contract has the largest total assigned warehouse size of 4.5 million square feet. Yearly contract value per warehousing contract ranges from $40,000 to $27 million. The average/mean yearly contract value is $3 million and the median is $792,500.
29.5%
18.3%
14.9%12.5% 12.3% 11.8% 11.8%
10.3%8.4% 7.3% 7.0% 6.4%
4.8%
0.0%
5.0%
10.0%
15.0%
20.0%
25.0%
30.0%
35.0%
Apparel/Clothing
Mixed C
ommodities
Automotive
Healthcare
/Cosmetic
s
High-tech
/Computers
Building M
aterials
Chemicals
Other Commoditie
s
Food/Bev
erage
Retail/Consu
mer Goods
Industrial (n
on-automotive)
Hardgoods/Applia
nces
Telecommunicatio
ns
Ave
rage
Ope
ratin
g Pr
ofit
Mar
gin
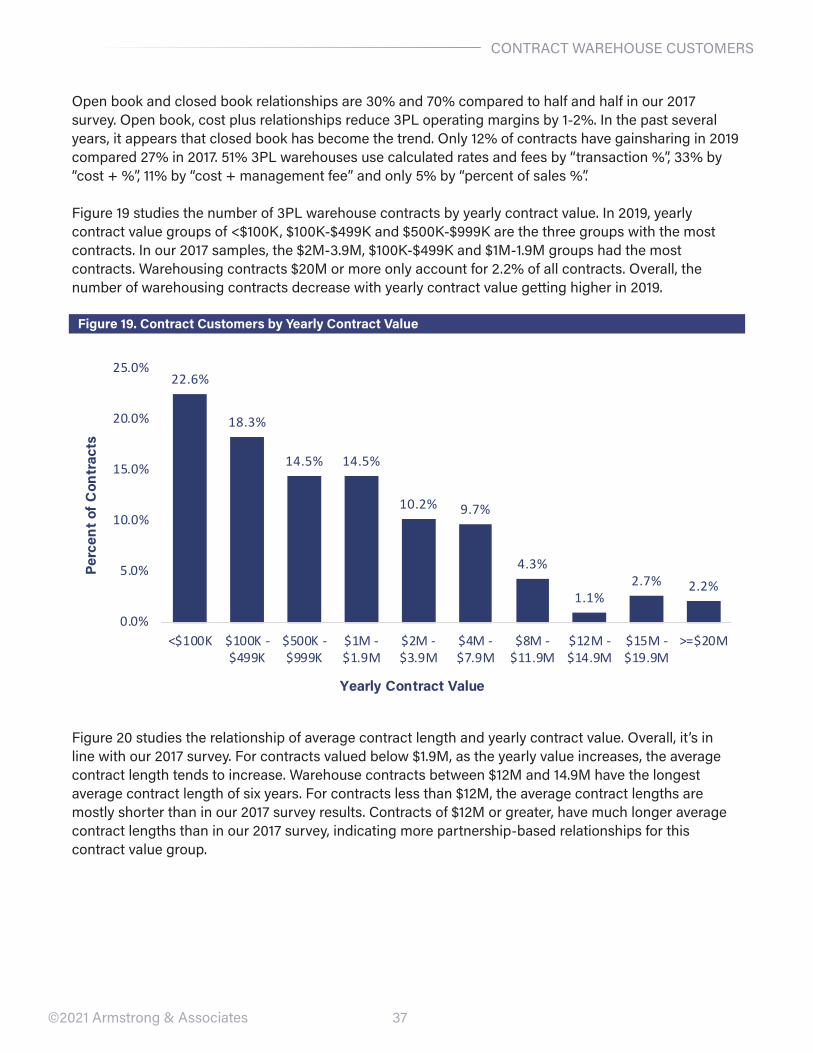
37©2021 Armstrong & Associates
Open book and closed book relationships are 30% and 70% compared to half and half in our 2017 survey. Open book, cost plus relationships reduce 3PL operating margins by 1-2%. In the past several years, it appears that closed book has become the trend. Only 12% of contracts have gainsharing in 2019 compared 27% in 2017. 51% 3PL warehouses use calculated rates and fees by “transaction %”, 33% by “cost + %”, 11% by “cost + management fee” and only 5% by “percent of sales %”.
Figure 19 studies the number of 3PL warehouse contracts by yearly contract value. In 2019, yearly contract value groups of <$100K, $100K-$499K and $500K-$999K are the three groups with the most contracts. In our 2017 samples, the $2M-3.9M, $100K-$499K and $1M-1.9M groups had the most contracts. warehousing contracts $20M or more only account for 2.2% of all contracts. Overall, the number of warehousing contracts decrease with yearly contract value getting higher in 2019.
Figure 19. Contract Customers by Yearly Contract Value
Figure 20 studies the relationship of average contract length and yearly contract value. Overall, it’s in line with our 2017 survey. For contracts valued below $1.9M, as the yearly value increases, the average contract length tends to increase. warehouse contracts between $12M and 14.9M have the longest average contract length of six years. For contracts less than $12M, the average contract lengths are mostly shorter than in our 2017 survey results. Contracts of $12M or greater, have much longer average contract lengths than in our 2017 survey, indicating more partnership-based relationships for this contract value group.
22.6%
18.3%
14.5% 14.5%
10.2% 9.7%
4.3%
1.1%2.7% 2.2%
0.0%
5.0%
10.0%
15.0%
20.0%
25.0%
<$100K $100K -$499K
$500K -$999K
$1M -$1.9M
$2M -$3.9M
$4M -$7.9M
$8M -$11.9M
$12M -$14.9M
$15M -$19.9M
>=$20M
Perc
ent o
f Con
trac
ts
Yearly Contract Value
CONTrACT wAreHOUSe CUSTOMerS
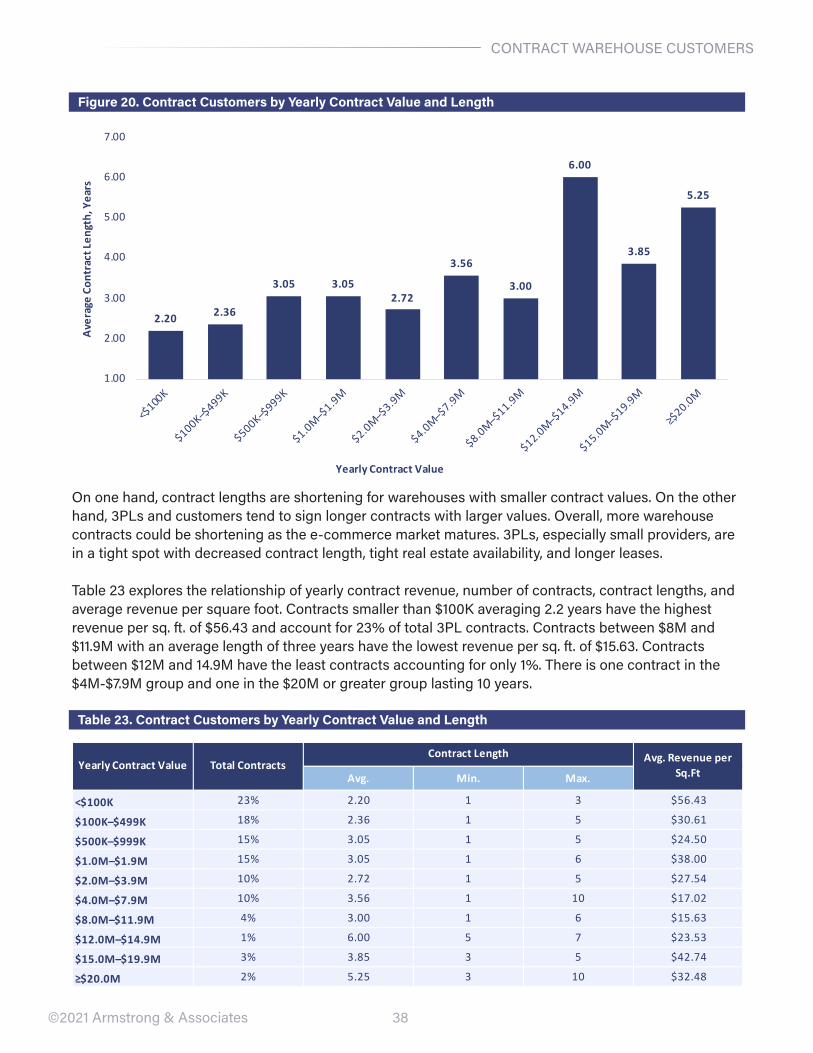
38©2021 Armstrong & Associates
Figure 20. Contract Customers by Yearly Contract Value and Length
On one hand, contract lengths are shortening for warehouses with smaller contract values. On the other hand, 3PLs and customers tend to sign longer contracts with larger values. Overall, more warehouse contracts could be shortening as the e-commerce market matures. 3PLs, especially small providers, are in a tight spot with decreased contract length, tight real estate availability, and longer leases.
Table 23 explores the relationship of yearly contract revenue, number of contracts, contract lengths, and average revenue per square foot. Contracts smaller than $100K averaging 2.2 years have the highest revenue per sq. ft. of $56.43 and account for 23% of total 3PL contracts. Contracts between $8M and $11.9M with an average length of three years have the lowest revenue per sq. ft. of $15.63. Contracts between $12M and 14.9M have the least contracts accounting for only 1%. There is one contract in the $4M-$7.9M group and one in the $20M or greater group lasting 10 years.
Table 23. Contract Customers by Yearly Contract Value and Length
CONTrACT wAreHOUSe CUSTOMerS
2.20 2.36
3.05 3.052.72
3.56
3.00
6.00
3.85
5.25
1.00
2.00
3.00
4.00
5.00
6.00
7.00
<$100K
$100K–$499K
$500K–$999K
$1.0M
–$1.9M
$2.0M
–$3.9M
$4.0M
–$7.9M
$8.0M
–$11.9M
$12.0M–$14.9M
$15.0M–$19.9M
≥$20.0M
Ave
rage
Con
trac
t Len
gth,
Yea
rs
Yearly Contract Value
Avg. Min. Max.
<$100K 23% 2.20 1 3 $56.43
$100K–$499K 18% 2.36 1 5 $30.61
$500K–$999K 15% 3.05 1 5 $24.50
$1.0M–$1.9M 15% 3.05 1 6 $38.00
$2.0M–$3.9M 10% 2.72 1 5 $27.54
$4.0M–$7.9M 10% 3.56 1 10 $17.02
$8.0M–$11.9M 4% 3.00 1 6 $15.63
$12.0M–$14.9M 1% 6.00 5 7 $23.53
$15.0M–$19.9M 3% 3.85 3 5 $42.74
≥$20.0M 2% 5.25 3 10 $32.48
Yearly Contract Value Total ContractsContract Length Avg. Revenue per
Sq.Ft
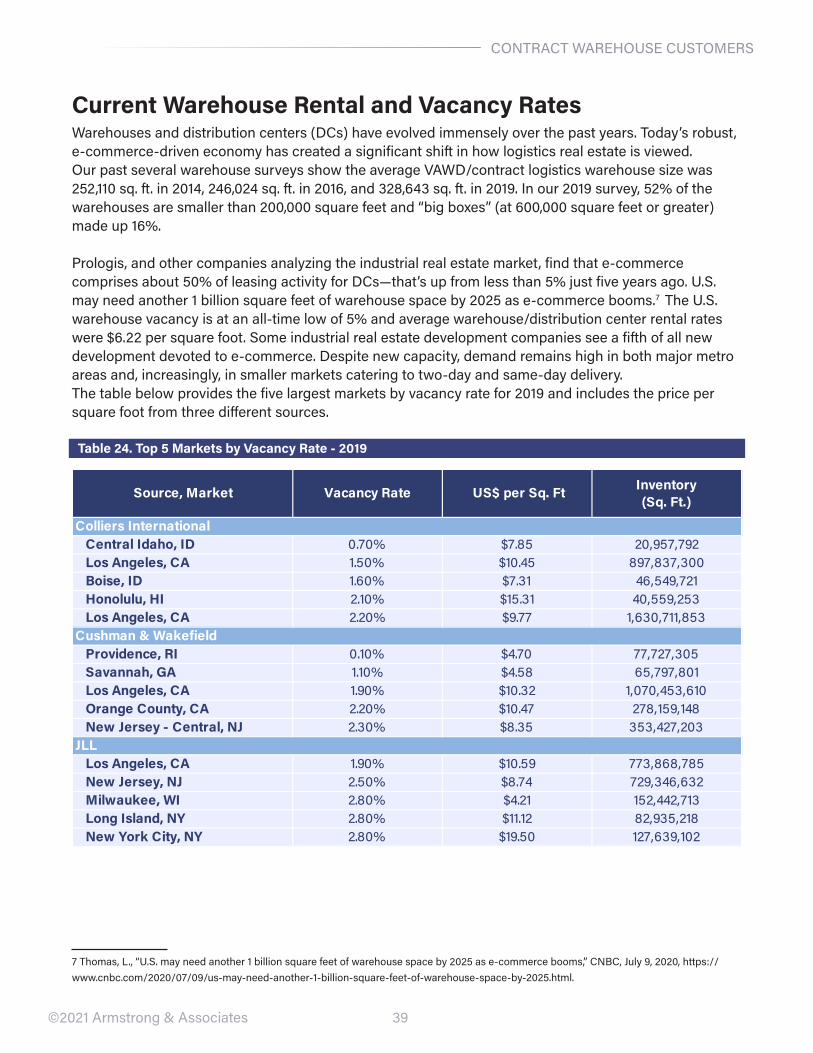
39©2021 Armstrong & Associates
Current Warehouse Rental and Vacancy Rateswarehouses and distribution centers (DCs) have evolved immensely over the past years. Today’s robust, e-commerce-driven economy has created a significant shift in how logistics real estate is viewed. Our past several warehouse surveys show the average vAwD/contract logistics warehouse size was 252,110 sq. ft. in 2014, 246,024 sq. ft. in 2016, and 328,643 sq. ft. in 2019. In our 2019 survey, 52% of the warehouses are smaller than 200,000 square feet and “big boxes” (at 600,000 square feet or greater) made up 16%.
Prologis, and other companies analyzing the industrial real estate market, find that e-commerce comprises about 50% of leasing activity for DCs—that’s up from less than 5% just five years ago. U.S. may need another 1 billion square feet of warehouse space by 2025 as e-commerce booms.7 1The U.S. warehouse vacancy is at an all-time low of 5% and average warehouse/distribution center rental rates were $6.22 per square foot. Some industrial real estate development companies see a fifth of all new development devoted to e-commerce. Despite new capacity, demand remains high in both major metro areas and, increasingly, in smaller markets catering to two-day and same-day delivery.The table below provides the five largest markets by vacancy rate for 2019 and includes the price per square foot from three different sources.
Table 24. Top 5 Markets by Vacancy Rate - 2019
7 Thomas, L., “U.S. may need another 1 billion square feet of warehouse space by 2025 as e-commerce booms,” CNBC, July 9, 2020, https://www.cnbc.com/2020/07/09/us-may-need-another-1-billion-square-feet-of-warehouse-space-by-2025.html.
CONTrACT wAreHOUSe CUSTOMerS
Source, Market Vacancy Rate US$ per Sq. Ft Inventory (Sq. Ft.)
Central Idaho, ID 0.70% $7.85 20,957,792Los Angeles, CA 1.50% $10.45 897,837,300Boise, ID 1.60% $7.31 46,549,721Honolulu, HI 2.10% $15.31 40,559,253Los Angeles, CA 2.20% $9.77 1,630,711,853
Providence, RI 0.10% $4.70 77,727,305Savannah, GA 1.10% $4.58 65,797,801Los Angeles, CA 1.90% $10.32 1,070,453,610Orange County, CA 2.20% $10.47 278,159,148New Jersey - Central, NJ 2.30% $8.35 353,427,203
Los Angeles, CA 1.90% $10.59 773,868,785New Jersey, NJ 2.50% $8.74 729,346,632Milwaukee, WI 2.80% $4.21 152,442,713Long Island, NY 2.80% $11.12 82,935,218New York City, NY 2.80% $19.50 127,639,102
Colliers International
Cushman & Wakefield
JLL
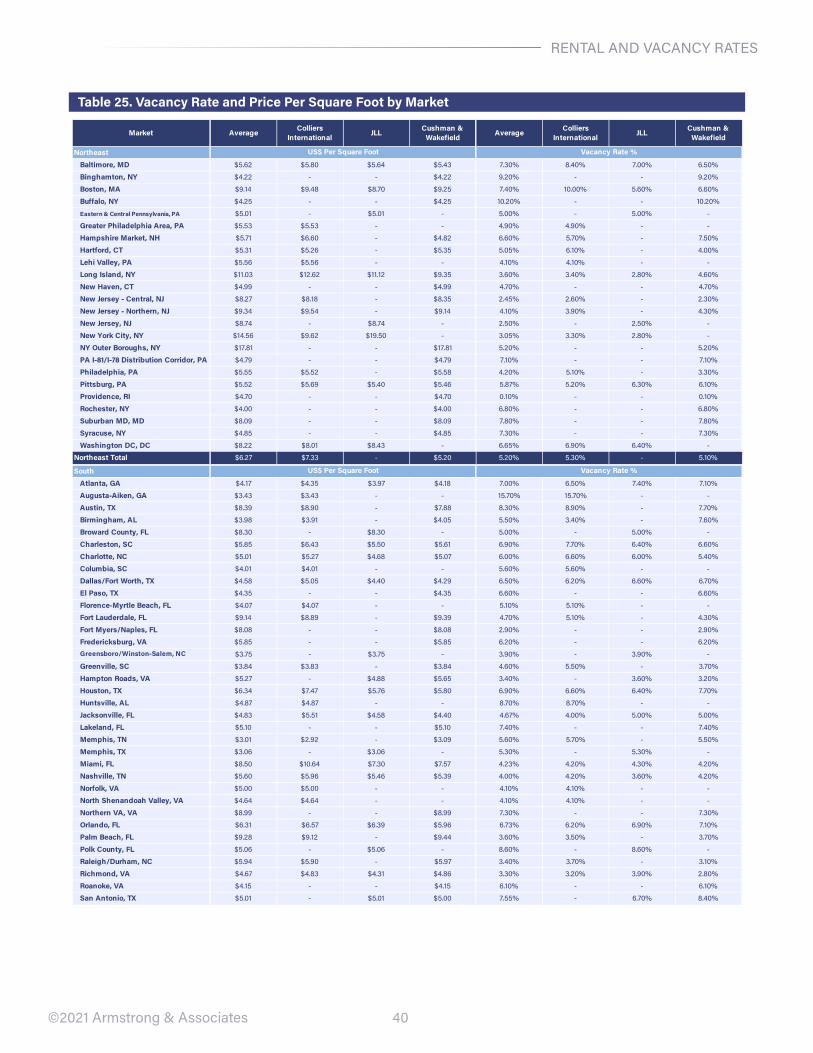
40
reNTAL AND vACANCY rATeS
©2021 Armstrong & Associates
Table 25. Vacancy Rate and Price Per Square Foot by Market
Market Average Colliers International JLL Cushman &
Wakefield Average Colliers International JLL Cushman &
Wakefield
NortheastBaltimore, MD $5.62 $5.80 $5.64 $5.43 7.30% 8.40% 7.00% 6.50%
Binghamton, NY $4.22 - - $4.22 9.20% - - 9.20%
Boston, MA $9.14 $9.48 $8.70 $9.25 7.40% 10.00% 5.60% 6.60%
Buffalo, NY $4.25 - - $4.25 10.20% - - 10.20%
Eastern & Central Pennsylvania, PA $5.01 - $5.01 - 5.00% - 5.00% -
Greater Philadelphia Area, PA $5.53 $5.53 - - 4.90% 4.90% - -
Hampshire Market, NH $5.71 $6.60 - $4.82 6.60% 5.70% - 7.50%
Hartford, CT $5.31 $5.26 - $5.35 5.05% 6.10% - 4.00%
Lehi Valley, PA $5.56 $5.56 - - 4.10% 4.10% - -
Long Island, NY $11.03 $12.62 $11.12 $9.35 3.60% 3.40% 2.80% 4.60%
New Haven, CT $4.99 - - $4.99 4.70% - - 4.70%
New Jersey - Central, NJ $8.27 $8.18 - $8.35 2.45% 2.60% - 2.30%
New Jersey - Northern, NJ $9.34 $9.54 - $9.14 4.10% 3.90% - 4.30%
New Jersey, NJ $8.74 - $8.74 - 2.50% - 2.50% -
New York City, NY $14.56 $9.62 $19.50 - 3.05% 3.30% 2.80% -
NY Outer Boroughs, NY $17.81 - - $17.81 5.20% - - 5.20%
PA I-81/I-78 Distribution Corridor, PA $4.79 - - $4.79 7.10% - - 7.10%
Philadelphia, PA $5.55 $5.52 - $5.58 4.20% 5.10% - 3.30%
Pittsburg, PA $5.52 $5.69 $5.40 $5.46 5.87% 5.20% 6.30% 6.10%
Providence, RI $4.70 - - $4.70 0.10% - - 0.10%
Rochester, NY $4.00 - - $4.00 6.80% - - 6.80%
Suburban MD, MD $8.09 - - $8.09 7.80% - - 7.80%
Syracuse, NY $4.85 - - $4.85 7.30% - - 7.30%
Washington DC, DC $8.22 $8.01 $8.43 - 6.65% 6.90% 6.40% -
Northeast Total $6.27 $7.33 - $5.20 5.20% 5.30% - 5.10%
US$ Per Square Foot Vacancy Rate %
SouthAtlanta, GA $4.17 $4.35 $3.97 $4.18 7.00% 6.50% 7.40% 7.10%
Augusta-Aiken, GA $3.43 $3.43 - - 15.70% 15.70% - -
Austin, TX $8.39 $8.90 - $7.88 8.30% 8.90% - 7.70%
Birmingham, AL $3.98 $3.91 - $4.05 5.50% 3.40% - 7.60%
Broward County, FL $8.30 - $8.30 - 5.00% - 5.00% -
Charleston, SC $5.85 $6.43 $5.50 $5.61 6.90% 7.70% 6.40% 6.60%
Charlotte, NC $5.01 $5.27 $4.68 $5.07 6.00% 6.60% 6.00% 5.40%
Columbia, SC $4.01 $4.01 - - 5.60% 5.60% - -
Dallas/Fort Worth, TX $4.58 $5.05 $4.40 $4.29 6.50% 6.20% 6.60% 6.70%
El Paso, TX $4.35 - - $4.35 6.60% - - 6.60%
Florence-Myrtle Beach, FL $4.07 $4.07 - - 5.10% 5.10% - -
Fort Lauderdale, FL $9.14 $8.89 - $9.39 4.70% 5.10% - 4.30%
Fort Myers/Naples, FL $8.08 - - $8.08 2.90% - - 2.90%
Fredericksburg, VA $5.85 - - $5.85 6.20% - - 6.20%Greensboro/Winston-Salem, NC $3.75 - $3.75 - 3.90% - 3.90% -
Greenville, SC $3.84 $3.83 - $3.84 4.60% 5.50% - 3.70%
Hampton Roads, VA $5.27 - $4.88 $5.65 3.40% - 3.60% 3.20%
Houston, TX $6.34 $7.47 $5.76 $5.80 6.90% 6.60% 6.40% 7.70%
Huntsville, AL $4.87 $4.87 - - 8.70% 8.70% - -
Jacksonville, FL $4.83 $5.51 $4.58 $4.40 4.67% 4.00% 5.00% 5.00%
Lakeland, FL $5.10 - - $5.10 7.40% - - 7.40%
Memphis, TN $3.01 $2.92 - $3.09 5.60% 5.70% - 5.50%
Memphis, TX $3.06 - $3.06 - 5.30% - 5.30% -
Miami, FL $8.50 $10.64 $7.30 $7.57 4.23% 4.20% 4.30% 4.20%
Nashville, TN $5.60 $5.96 $5.46 $5.39 4.00% 4.20% 3.60% 4.20%
Norfolk, VA $5.00 $5.00 - - 4.10% 4.10% - -
North Shenandoah Valley, VA $4.64 $4.64 - - 4.10% 4.10% - -
Northern VA, VA $8.99 - - $8.99 7.30% - - 7.30%
Orlando, FL $6.31 $6.57 $6.39 $5.96 6.73% 6.20% 6.90% 7.10%
Palm Beach, FL $9.28 $9.12 - $9.44 3.60% 3.50% - 3.70%
Polk County, FL $5.06 - $5.06 - 8.60% - 8.60% -
Raleigh/Durham, NC $5.94 $5.90 - $5.97 3.40% 3.70% - 3.10%
Richmond, VA $4.67 $4.83 $4.31 $4.86 3.30% 3.20% 3.90% 2.80%
Roanoke, VA $4.15 - - $4.15 6.10% - - 6.10%
San Antonio, TX $5.01 - $5.01 $5.00 7.55% - 6.70% 8.40%
US$ Per Square Foot Vacancy Rate %
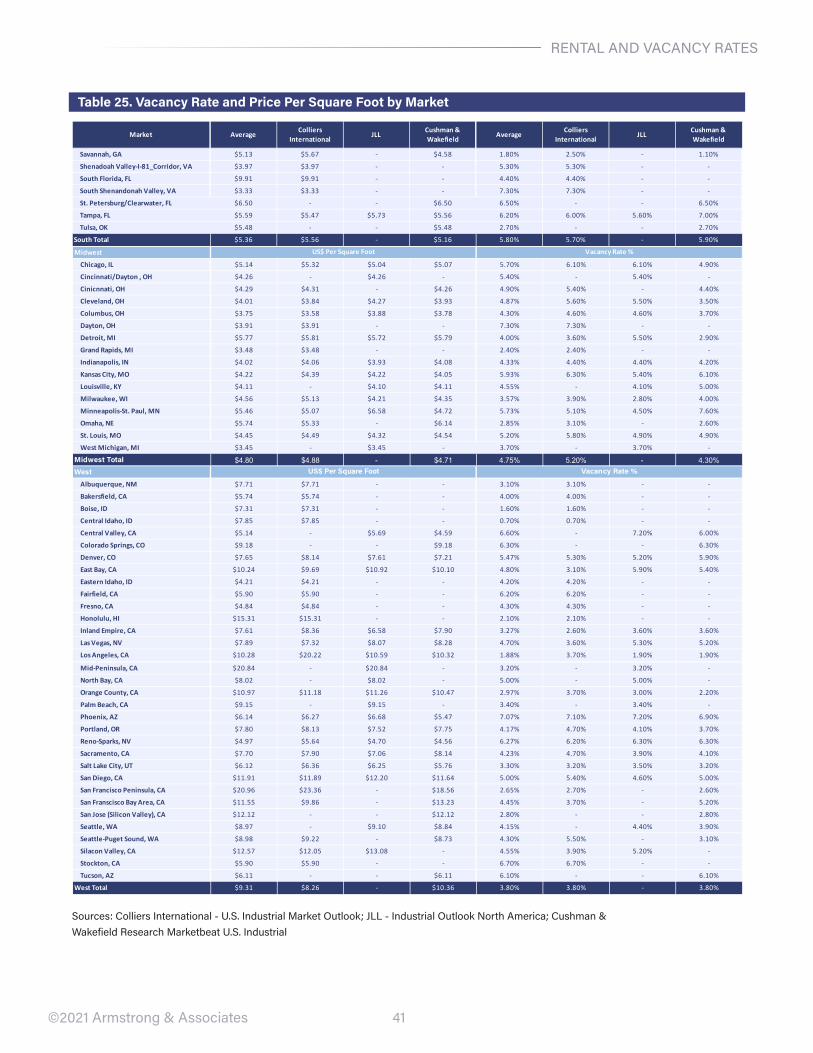
41
reNTAL AND vACANCY rATeS
©2021 Armstrong & Associates
Table 25. Vacancy Rate and Price Per Square Foot by Market
Market AverageColliers
InternationalJLL
Cushman & Wakefield
AverageColliers
InternationalJLL
Cushman & Wakefield
Savannah, GA $5.13 $5.67 - $4.58 1.80% 2.50% - 1.10%
Shenadoah Valley-I-81_Corridor, VA $3.97 $3.97 - - 5.30% 5.30% - -
South Florida, FL $9.91 $9.91 - - 4.40% 4.40% - -
South Shenandonah Valley, VA $3.33 $3.33 - - 7.30% 7.30% - -
St. Petersburg/Clearwater, FL $6.50 - - $6.50 6.50% - - 6.50%
Tampa, FL $5.59 $5.47 $5.73 $5.56 6.20% 6.00% 5.60% 7.00%
Tulsa, OK $5.48 - - $5.48 2.70% - - 2.70%
South Total $5.36 $5.56 - $5.16 5.80% 5.70% - 5.90%
Midwest
Chicago, IL $5.14 $5.32 $5.04 $5.07 5.70% 6.10% 6.10% 4.90%
Cincinnati/Dayton , OH $4.26 - $4.26 - 5.40% - 5.40% -
Cinicnnati, OH $4.29 $4.31 - $4.26 4.90% 5.40% - 4.40%
Cleveland, OH $4.01 $3.84 $4.27 $3.93 4.87% 5.60% 5.50% 3.50%
Columbus, OH $3.75 $3.58 $3.88 $3.78 4.30% 4.60% 4.60% 3.70%
Dayton, OH $3.91 $3.91 - - 7.30% 7.30% - -
Detroit, MI $5.77 $5.81 $5.72 $5.79 4.00% 3.60% 5.50% 2.90%
Grand Rapids, MI $3.48 $3.48 - - 2.40% 2.40% - -
Indianapolis, IN $4.02 $4.06 $3.93 $4.08 4.33% 4.40% 4.40% 4.20%
Kansas City, MO $4.22 $4.39 $4.22 $4.05 5.93% 6.30% 5.40% 6.10%
Louisville, KY $4.11 - $4.10 $4.11 4.55% - 4.10% 5.00%
Milwaukee, WI $4.56 $5.13 $4.21 $4.35 3.57% 3.90% 2.80% 4.00%
Minneapolis-St. Paul, MN $5.46 $5.07 $6.58 $4.72 5.73% 5.10% 4.50% 7.60%
Omaha, NE $5.74 $5.33 - $6.14 2.85% 3.10% - 2.60%
St. Louis, MO $4.45 $4.49 $4.32 $4.54 5.20% 5.80% 4.90% 4.90%
West Michigan, MI $3.45 - $3.45 - 3.70% - 3.70% -
Midwest Total $4.80 $4.88 - $4.71 4.75% 5.20% - 4.30%West
Albuquerque, NM $7.71 $7.71 - - 3.10% 3.10% - -
Bakersfield, CA $5.74 $5.74 - - 4.00% 4.00% - -
Boise, ID $7.31 $7.31 - - 1.60% 1.60% - -
Central Idaho, ID $7.85 $7.85 - - 0.70% 0.70% - -
Central Valley, CA $5.14 - $5.69 $4.59 6.60% - 7.20% 6.00%
Colorado Springs, CO $9.18 - - $9.18 6.30% - - 6.30%
Denver, CO $7.65 $8.14 $7.61 $7.21 5.47% 5.30% 5.20% 5.90%
East Bay, CA $10.24 $9.69 $10.92 $10.10 4.80% 3.10% 5.90% 5.40%
Eastern Idaho, ID $4.21 $4.21 - - 4.20% 4.20% - -
Fairfield, CA $5.90 $5.90 - - 6.20% 6.20% - -
Fresno, CA $4.84 $4.84 - - 4.30% 4.30% - -
Honolulu, HI $15.31 $15.31 - - 2.10% 2.10% - -
Inland Empire, CA $7.61 $8.36 $6.58 $7.90 3.27% 2.60% 3.60% 3.60%
Las Vegas, NV $7.89 $7.32 $8.07 $8.28 4.70% 3.60% 5.30% 5.20%
Los Angeles, CA $10.28 $20.22 $10.59 $10.32 1.88% 3.70% 1.90% 1.90%
US$ Per Square Foot Vacancy Rate %
US$ Per Square Foot Vacancy Rate %
Mid-Peninsula, CA $20.84 - $20.84 - 3.20% - 3.20% -
North Bay, CA $8.02 - $8.02 - 5.00% - 5.00% -
Orange County, CA $10.97 $11.18 $11.26 $10.47 2.97% 3.70% 3.00% 2.20%
Palm Beach, CA $9.15 - $9.15 - 3.40% - 3.40% -
Phoenix, AZ $6.14 $6.27 $6.68 $5.47 7.07% 7.10% 7.20% 6.90%
Portland, OR $7.80 $8.13 $7.52 $7.75 4.17% 4.70% 4.10% 3.70%
Reno-Sparks, NV $4.97 $5.64 $4.70 $4.56 6.27% 6.20% 6.30% 6.30%
Sacramento, CA $7.70 $7.90 $7.06 $8.14 4.23% 4.70% 3.90% 4.10%
Salt Lake City, UT $6.12 $6.36 $6.25 $5.76 3.30% 3.20% 3.50% 3.20%
San Diego, CA $11.91 $11.89 $12.20 $11.64 5.00% 5.40% 4.60% 5.00%
San Francisco Peninsula, CA $20.96 $23.36 - $18.56 2.65% 2.70% - 2.60%
San Franscisco Bay Area, CA $11.55 $9.86 - $13.23 4.45% 3.70% - 5.20%
San Jose (Silicon Valley), CA $12.12 - - $12.12 2.80% - - 2.80%
Seattle, WA $8.97 - $9.10 $8.84 4.15% - 4.40% 3.90%
Seattle-Puget Sound, WA $8.98 $9.22 - $8.73 4.30% 5.50% - 3.10%
Silacon Valley, CA $12.57 $12.05 $13.08 - 4.55% 3.90% 5.20% -
Stockton, CA $5.90 $5.90 - - 6.70% 6.70% - -
Tucson, AZ $6.11 - - $6.11 6.10% - - 6.10%
West Total $9.31 $8.26 - $10.36 3.80% 3.80% - 3.80%
Sources: Colliers International - U.S. Industrial Market Outlook; JLL - Industrial Outlook North America; Cushman & wakefield research Marketbeat U.S. Industrial
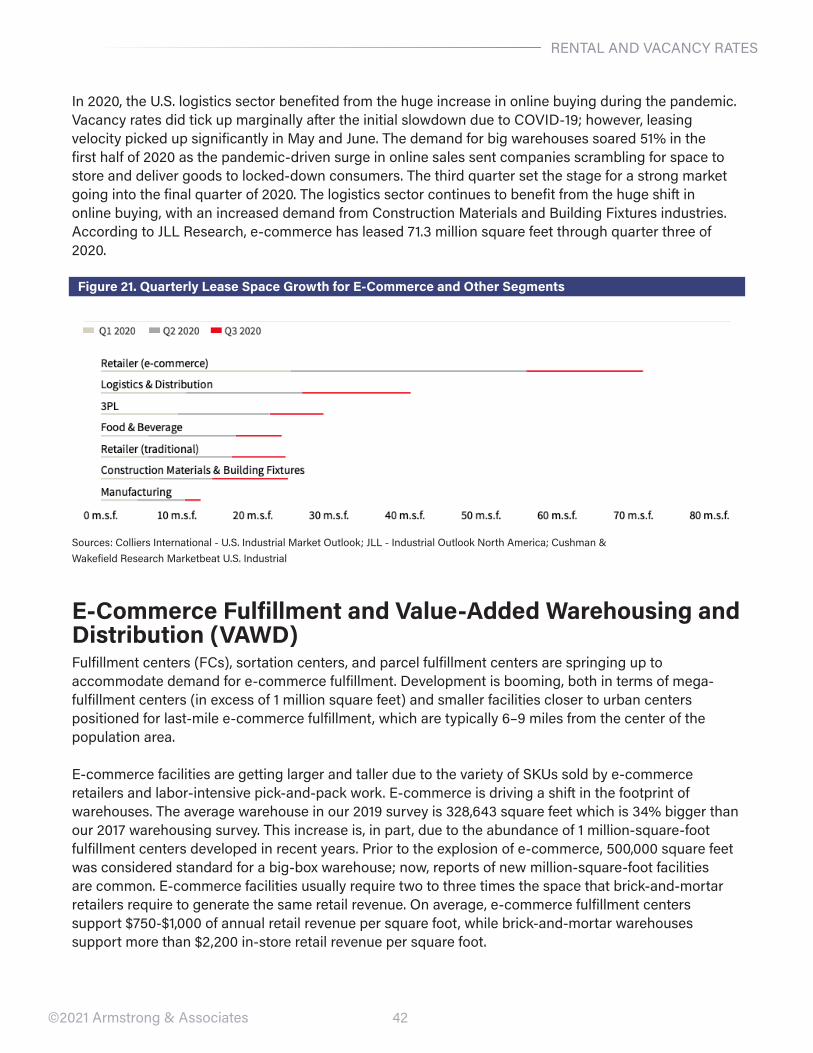
42
reNTAL AND vACANCY rATeS
©2021 Armstrong & Associates
Sources: Colliers International - U.S. Industrial Market Outlook; JLL - Industrial Outlook North America; Cushman & wakefield research Marketbeat U.S. Industrial
In 2020, the U.S. logistics sector benefited from the huge increase in online buying during the pandemic. vacancy rates did tick up marginally after the initial slowdown due to COvID-19; however, leasing velocity picked up significantly in May and June. The demand for big warehouses soared 51% in the first half of 2020 as the pandemic-driven surge in online sales sent companies scrambling for space to store and deliver goods to locked-down consumers. The third quarter set the stage for a strong market going into the final quarter of 2020. The logistics sector continues to benefit from the huge shift in online buying, with an increased demand from Construction Materials and Building Fixtures industries. According to JLL research, e-commerce has leased 71.3 million square feet through quarter three of 2020.
Figure 21. Quarterly Lease Space Growth for E-Commerce and Other Segments
E-Commerce Fulfillment and Value-Added Warehousing and Distribution (VAWD)Fulfillment centers (FCs), sortation centers, and parcel fulfillment centers are springing up to accommodate demand for e-commerce fulfillment. Development is booming, both in terms of mega-fulfillment centers (in excess of 1 million square feet) and smaller facilities closer to urban centers positioned for last-mile e-commerce fulfillment, which are typically 6–9 miles from the center of the population area.
e-commerce facilities are getting larger and taller due to the variety of SKUs sold by e-commerce retailers and labor-intensive pick-and-pack work. e-commerce is driving a shift in the footprint of warehouses. The average warehouse in our 2019 survey is 328,643 square feet which is 34% bigger than our 2017 warehousing survey. This increase is, in part, due to the abundance of 1 million-square-foot fulfillment centers developed in recent years. Prior to the explosion of e-commerce, 500,000 square feet was considered standard for a big-box warehouse; now, reports of new million-square-foot facilities are common. e-commerce facilities usually require two to three times the space that brick-and-mortar retailers require to generate the same retail revenue. On average, e-commerce fulfillment centers support $750-$1,000 of annual retail revenue per square foot, while brick-and-mortar warehouses support more than $2,200 in-store retail revenue per square foot.
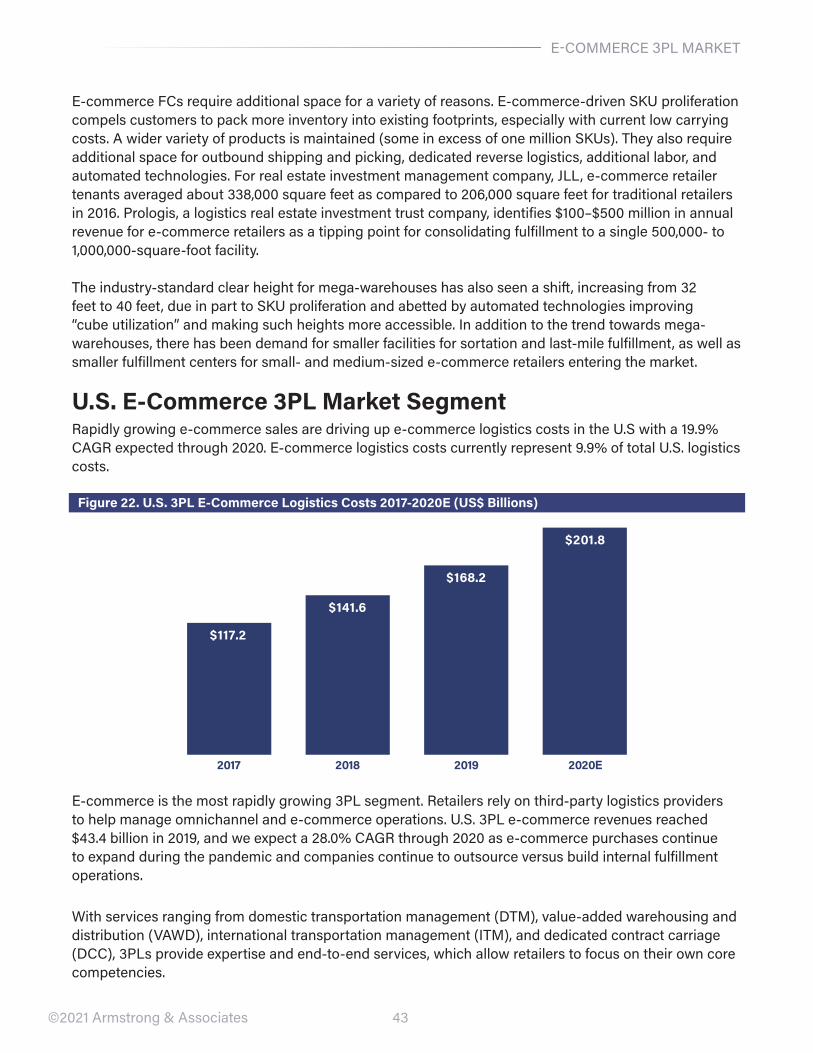
43©2021 Armstrong & Associates
e-commerce FCs require additional space for a variety of reasons. e-commerce-driven SKU proliferation compels customers to pack more inventory into existing footprints, especially with current low carrying costs. A wider variety of products is maintained (some in excess of one million SKUs). They also require additional space for outbound shipping and picking, dedicated reverse logistics, additional labor, and automated technologies. For real estate investment management company, JLL, e-commerce retailer tenants averaged about 338,000 square feet as compared to 206,000 square feet for traditional retailers in 2016. Prologis, a logistics real estate investment trust company, identifies $100–$500 million in annual revenue for e-commerce retailers as a tipping point for consolidating fulfillment to a single 500,000- to 1,000,000-square-foot facility.
The industry-standard clear height for mega-warehouses has also seen a shift, increasing from 32 feet to 40 feet, due in part to SKU proliferation and abetted by automated technologies improving “cube utilization” and making such heights more accessible. In addition to the trend towards mega-warehouses, there has been demand for smaller facilities for sortation and last-mile fulfillment, as well as smaller fulfillment centers for small- and medium-sized e-commerce retailers entering the market.
U.S. E-Commerce 3PL Market Segmentrapidly growing e-commerce sales are driving up e‐commerce logistics costs in the U.S with a 19.9% CAGr expected through 2020. e‐commerce logistics costs currently represent 9.9% of total U.S. logistics costs.
Figure 22. U.S. 3PL E-Commerce Logistics Costs 2017-2020E (US$ Billions)
e‐commerce is the most rapidly growing 3PL segment. retailers rely on third‐party logistics providers to help manage omnichannel and e‐commerce operations. U.S. 3PL e‐commerce revenues reached $43.4 billion in 2019, and we expect a 28.0% CAGr through 2020 as e‐commerce purchases continue to expand during the pandemic and companies continue to outsource versus build internal fulfillment operations.
with services ranging from domestic transportation management (DTM), value‐added warehousing and distribution (vAwD), international transportation management (ITM), and dedicated contract carriage (DCC), 3PLs provide expertise and end‐to‐end services, which allow retailers to focus on their own core competencies.
$117.2
$141.6
$168.2
$201.8
2017 2018 2019 2020E
e-COMMerCe 3PL MArKeT
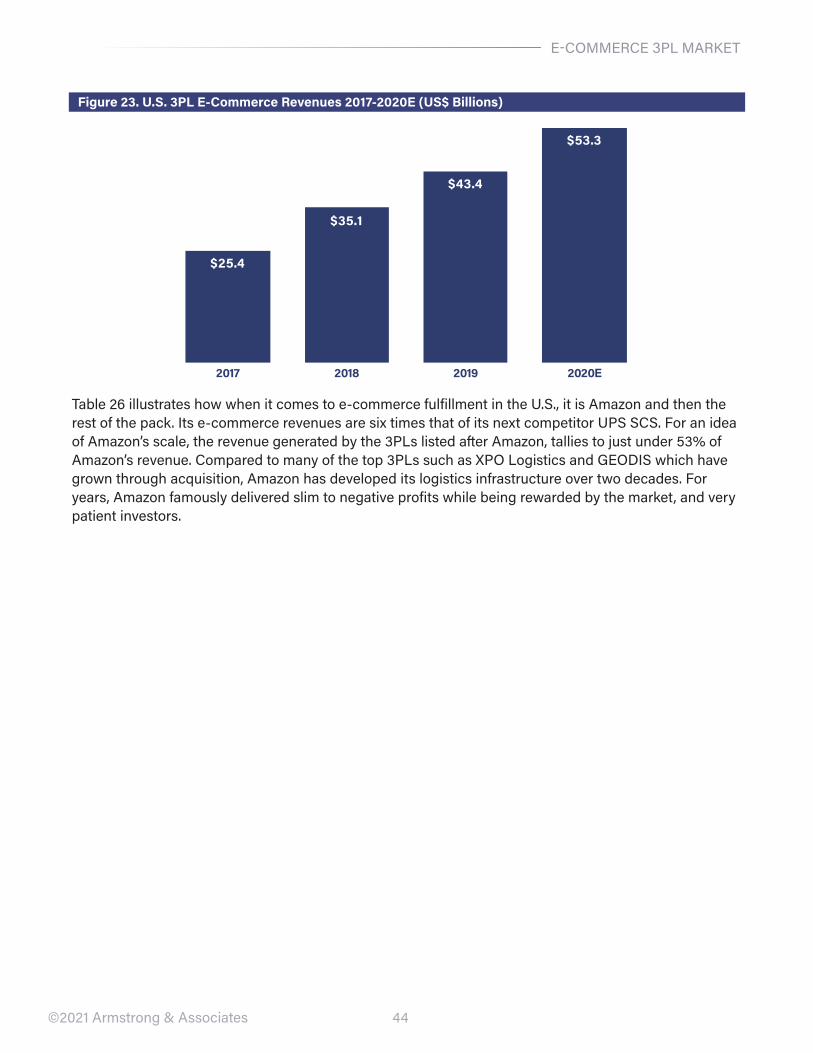
44
e-COMMerCe 3PL MArKeT
©2021 Armstrong & Associates
Figure 23. U.S. 3PL E-Commerce Revenues 2017-2020E (US$ Billions)
Table 26 illustrates how when it comes to e‐commerce fulfillment in the U.S., it is Amazon and then the rest of the pack. Its e-commerce revenues are six times that of its next competitor UPS SCS. For an idea of Amazon’s scale, the revenue generated by the 3PLs listed after Amazon, tallies to just under 53% of Amazon’s revenue. Compared to many of the top 3PLs such as XPO Logistics and GeODIS which have grown through acquisition, Amazon has developed its logistics infrastructure over two decades. For years, Amazon famously delivered slim to negative profits while being rewarded by the market, and very patient investors.
$25.4
$35.1
$43.4
$53.3
2017 2018 2019 2020E
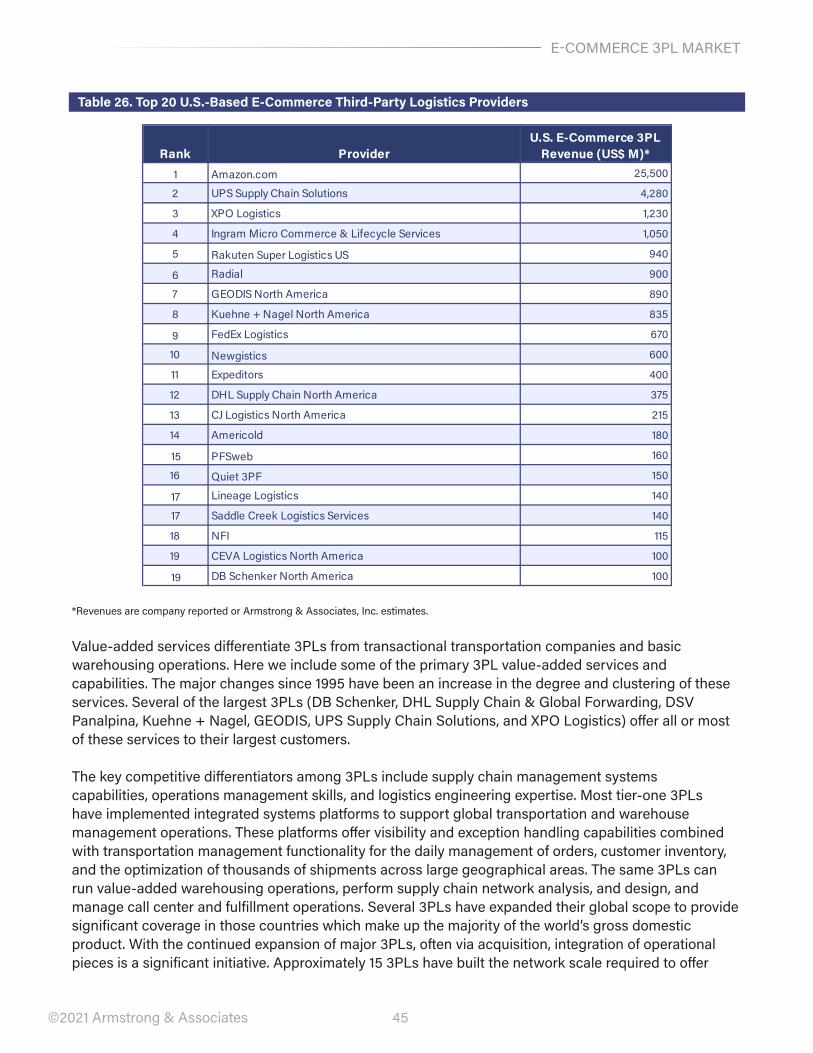
45
e-COMMerCe 3PL MArKeT
©2021 Armstrong & Associates
Table 26. Top 20 U.S.-Based E-Commerce Third-Party Logistics Providers
value-added services differentiate 3PLs from transactional transportation companies and basic warehousing operations. Here we include some of the primary 3PL value-added services and capabilities. The major changes since 1995 have been an increase in the degree and clustering of these services. Several of the largest 3PLs (DB Schenker, DHL Supply Chain & Global Forwarding, DSv Panalpina, Kuehne + Nagel, GeODIS, UPS Supply Chain Solutions, and XPO Logistics) offer all or most of these services to their largest customers.
The key competitive differentiators among 3PLs include supply chain management systems capabilities, operations management skills, and logistics engineering expertise. Most tier-one 3PLs have implemented integrated systems platforms to support global transportation and warehouse management operations. These platforms offer visibility and exception handling capabilities combined with transportation management functionality for the daily management of orders, customer inventory, and the optimization of thousands of shipments across large geographical areas. The same 3PLs can run value-added warehousing operations, perform supply chain network analysis, and design, and manage call center and fulfillment operations. Several 3PLs have expanded their global scope to provide significant coverage in those countries which make up the majority of the world’s gross domestic product. with the continued expansion of major 3PLs, often via acquisition, integration of operational pieces is a significant initiative. Approximately 15 3PLs have built the network scale required to offer
Rank ProviderU.S. E-Commerce 3PL
Revenue (US$ M)*1 Amazon.com 25,500
2 UPS Supply Chain Solutions 4,280
3 XPO Logistics 1,230
4 Ingram Micro Commerce & Lifecycle Services 1,050
5 Rakuten Super Logistics US 940
6 Radial 900
7 GEODIS North America 890
8 Kuehne + Nagel North America 835
9 FedEx Logistics 670
10 Newgistics 600
11 Expeditors 400
12 DHL Supply Chain North America 375
13 CJ Logistics North America 215
14 Americold 180
15 PFSweb 160
16 Quiet 3PF 150
17 Lineage Logistics 140
17 Saddle Creek Logistics Services 140
18 NFI 115
19 CEVA Logistics North America 100
19 DB Schenker North America 100
*revenues are company reported or Armstrong & Associates, Inc. estimates.
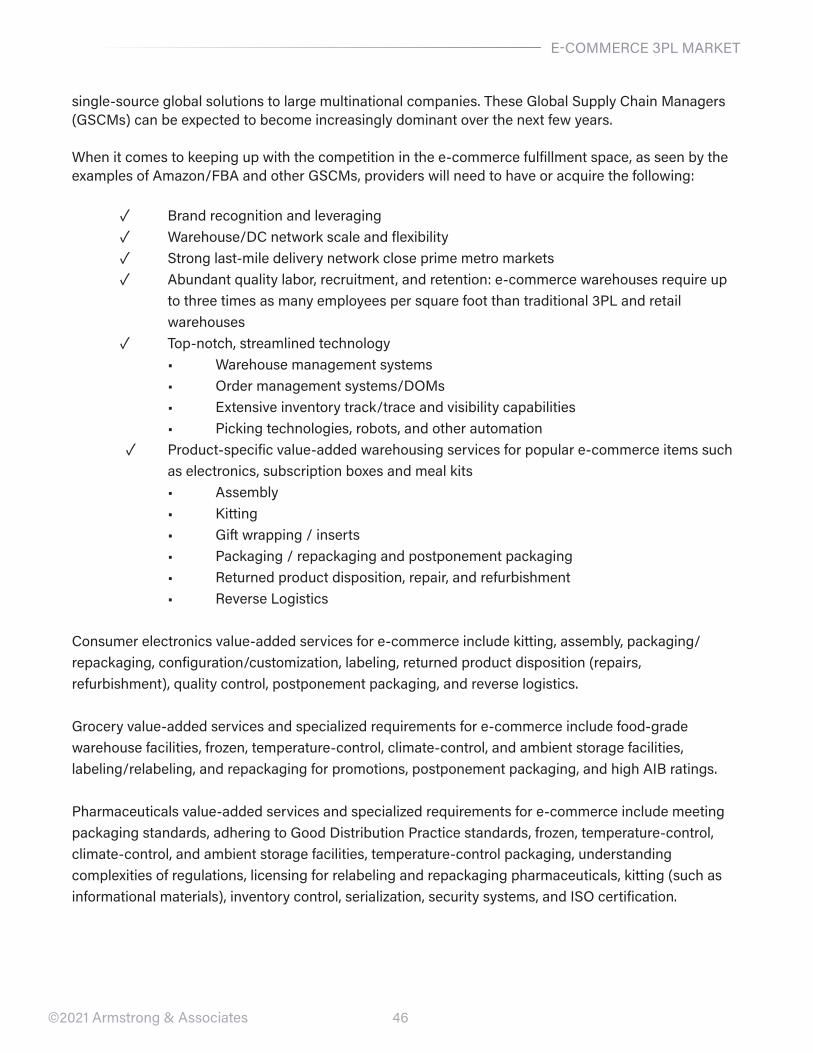
46
e-COMMerCe 3PL MArKeT
©2021 Armstrong & Associates
single-source global solutions to large multinational companies. These Global Supply Chain Managers (GSCMs) can be expected to become increasingly dominant over the next few years.
when it comes to keeping up with the competition in the e-commerce fulfillment space, as seen by the examples of Amazon/FBA and other GSCMs, providers will need to have or acquire the following:
✓ Brand recognition and leveraging ✓ warehouse/DC network scale and flexibility ✓ Strong last-mile delivery network close prime metro markets ✓ Abundant quality labor, recruitment, and retention: e-commerce warehouses require up
to three times as many employees per square foot than traditional 3PL and retail warehouses
✓ Top-notch, streamlined technology• warehouse management systems• Order management systems/DOMs• extensive inventory track/trace and visibility capabilities• Picking technologies, robots, and other automation
✓ Product-specific value-added warehousing services for popular e-commerce items such as electronics, subscription boxes and meal kits
• Assembly• Kitting• Gift wrapping / inserts• Packaging / repackaging and postponement packaging• returned product disposition, repair, and refurbishment• reverse Logistics
Consumer electronics value-added services for e-commerce include kitting, assembly, packaging/repackaging, configuration/customization, labeling, returned product disposition (repairs, refurbishment), quality control, postponement packaging, and reverse logistics.
Grocery value-added services and specialized requirements for e-commerce include food-grade warehouse facilities, frozen, temperature-control, climate-control, and ambient storage facilities, labeling/relabeling, and repackaging for promotions, postponement packaging, and high AIB ratings.
Pharmaceuticals value-added services and specialized requirements for e-commerce include meeting packaging standards, adhering to Good Distribution Practice standards, frozen, temperature-control, climate-control, and ambient storage facilities, temperature-control packaging, understanding complexities of regulations, licensing for relabeling and repackaging pharmaceuticals, kitting (such as informational materials), inventory control, serialization, security systems, and ISO certification.
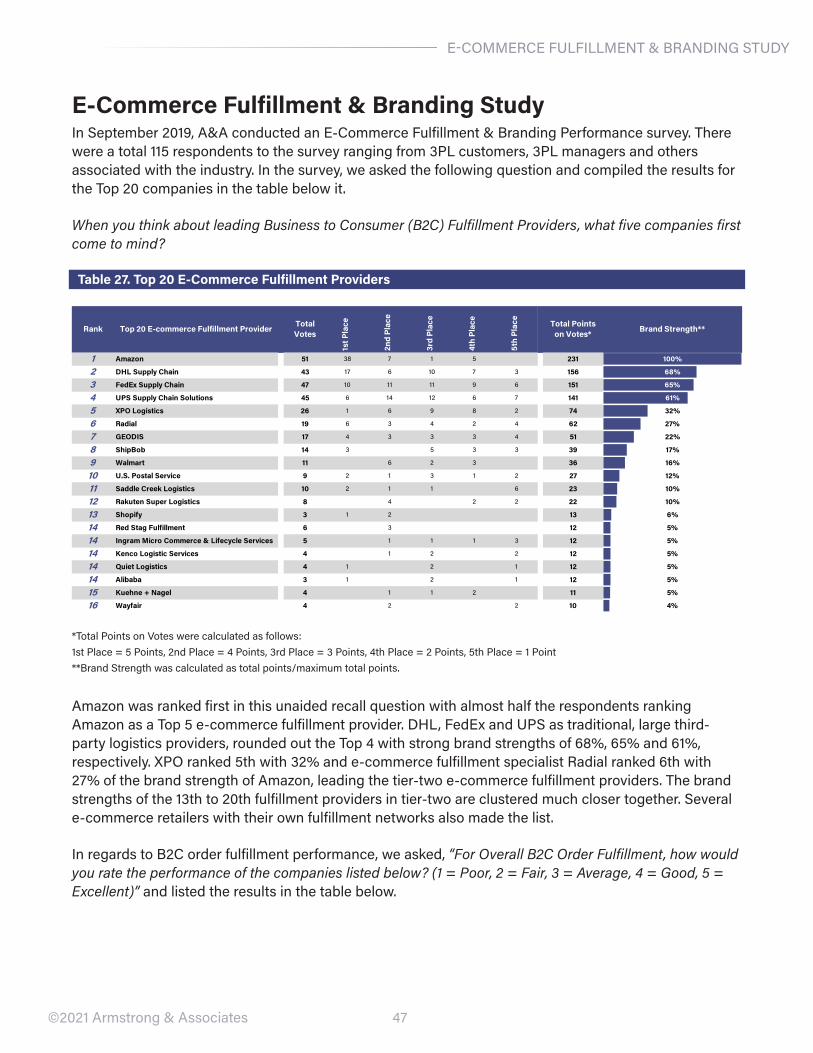
47©2021 Armstrong & Associates
E-Commerce Fulfillment & Branding StudyIn September 2019, A&A conducted an e-Commerce Fulfillment & Branding Performance survey. There were a total 115 respondents to the survey ranging from 3PL customers, 3PL managers and others associated with the industry. In the survey, we asked the following question and compiled the results for the Top 20 companies in the table below it.
When you think about leading Business to Consumer (B2C) Fulfillment Providers, what five companies first come to mind?
Table 27. Top 20 E-Commerce Fulfillment Providers
*Total Points on votes were calculated as follows: 1st Place = 5 Points, 2nd Place = 4 Points, 3rd Place = 3 Points, 4th Place = 2 Points, 5th Place = 1 Point **Brand Strength was calculated as total points/maximum total points.
Amazon was ranked first in this unaided recall question with almost half the respondents ranking Amazon as a Top 5 e-commerce fulfillment provider. DHL, Fedex and UPS as traditional, large third-party logistics providers, rounded out the Top 4 with strong brand strengths of 68%, 65% and 61%, respectively. XPO ranked 5th with 32% and e-commerce fulfillment specialist radial ranked 6th with 27% of the brand strength of Amazon, leading the tier-two e-commerce fulfillment providers. The brand strengths of the 13th to 20th fulfillment providers in tier-two are clustered much closer together. Several e-commerce retailers with their own fulfillment networks also made the list.
In regards to B2C order fulfillment performance, we asked, “For Overall B2C Order Fulfillment, how would you rate the performance of the companies listed below? (1 = Poor, 2 = Fair, 3 = Average, 4 = Good, 5 = Excellent)” and listed the results in the table below.
Rank Top 20 E-commerce Fulfillment Provider Total Votes
1st P
lace
2nd
Plac
e
3rd
Plac
e
4th
Plac
e
5th
Plac
e
Total Points on Votes* Brand Strength**
1 Amazon 51 38 7 1 5 231 100%
2 DHL Supply Chain 43 17 6 10 7 3 156 68%
3 FedEx Supply Chain 47 10 11 11 9 6 151 65%
4 UPS Supply Chain Solutions 45 6 14 12 6 7 141 61%
5 XPO Logistics 26 1 6 9 8 2 74 32%
6 Radial 19 6 3 4 2 4 62 27%
7 GEODIS 17 4 3 3 3 4 51 22%
8 ShipBob 14 3 5 3 3 39 17%
9 Walmart 11 6 2 3 36 16%
10 U.S. Postal Service 9 2 1 3 1 2 27 12%
11 Saddle Creek Logistics 10 2 1 1 6 23 10%
12 Rakuten Super Logistics 8 4 2 2 22 10%
13 Shopify 3 1 2 13 6%
14 Red Stag Fulfillment 6 3 12 5%
14 Ingram Micro Commerce & Lifecycle Services 5 1 1 1 3 12 5%
14 Kenco Logistic Services 4 1 2 2 12 5%
14 Quiet Logistics 4 1 2 1 12 5%
14 Alibaba 3 1 2 1 12 5%
15 Kuehne + Nagel 4 1 1 2 11 5%
16 Wayfair 4 2 2 10 4%
e-COMMerCe FULFILLMeNT & BrANDING STUDY
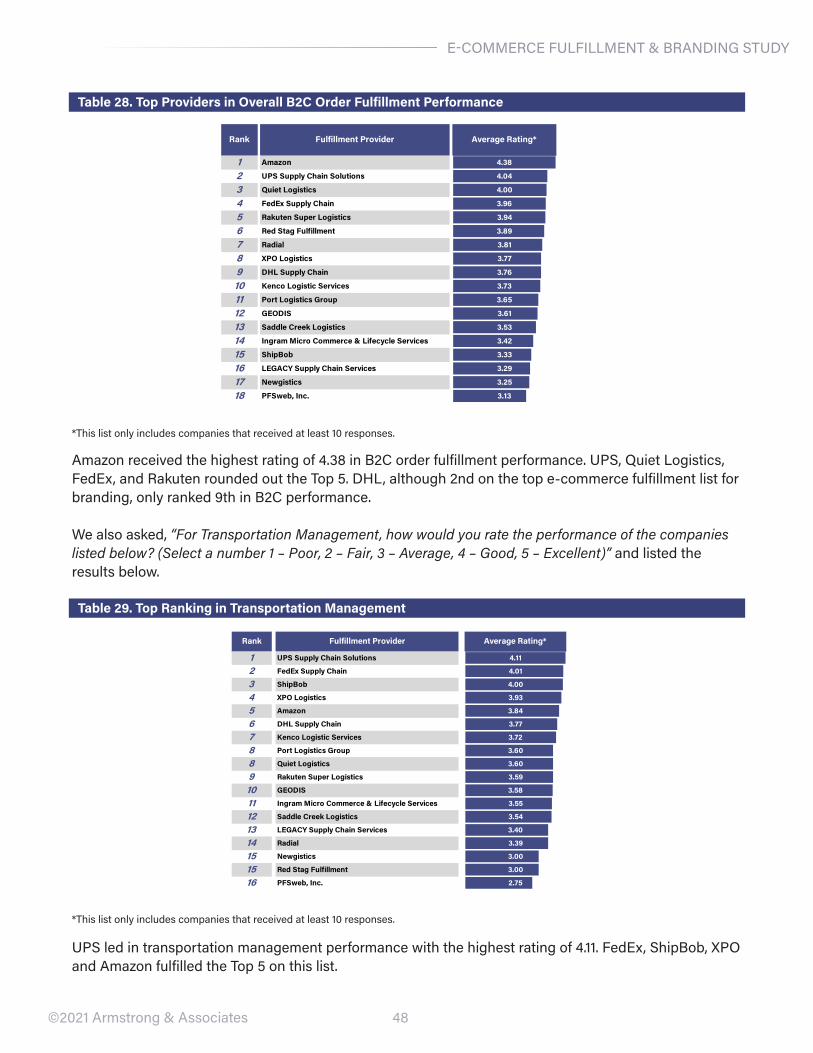
48©2021 Armstrong & Associates
Table 28. Top Providers in Overall B2C Order Fulfillment Performance
Amazon received the highest rating of 4.38 in B2C order fulfillment performance. UPS, Quiet Logistics, Fedex, and rakuten rounded out the Top 5. DHL, although 2nd on the top e-commerce fulfillment list for branding, only ranked 9th in B2C performance.
we also asked, “For Transportation Management, how would you rate the performance of the companies listed below? (Select a number 1 – Poor, 2 – Fair, 3 – Average, 4 – Good, 5 – Excellent)” and listed the results below.
Table 29. Top Ranking in Transportation Management
UPS led in transportation management performance with the highest rating of 4.11. Fedex, ShipBob, XPO and Amazon fulfilled the Top 5 on this list.
e-COMMerCe FULFILLMeNT & BrANDING STUDY
Rank Fulfillment Provider Average Rating*
1 Amazon 4.38
2 UPS Supply Chain Solutions 4.04
3 Quiet Logistics 4.00
4 FedEx Supply Chain 3.96
5 Rakuten Super Logistics 3.94
6 Red Stag Fulfillment 3.89
7 Radial 3.81
8 XPO Logistics 3.77
9 DHL Supply Chain 3.76
10 Kenco Logistic Services 3.73
11 Port Logistics Group 3.65
12 GEODIS 3.61
13 Saddle Creek Logistics 3.53
14 Ingram Micro Commerce & Lifecycle Services 3.42
15 ShipBob 3.33
16 LEGACY Supply Chain Services 3.29
17 Newgistics 3.25
18 PFSweb, Inc. 3.13
Rank Fulfillment Provider Average Rating*
1 UPS Supply Chain Solutions 4.11
2 FedEx Supply Chain 4.01
3 ShipBob 4.00
4 XPO Logistics 3.93
5 Amazon 3.84
6 DHL Supply Chain 3.77
7 Kenco Logistic Services 3.72
8 Port Logistics Group 3.60
8 Quiet Logistics 3.60
9 Rakuten Super Logistics 3.59
10 GEODIS 3.58
11 Ingram Micro Commerce & Lifecycle Services 3.55
12 Saddle Creek Logistics 3.54
13 LEGACY Supply Chain Services 3.40
14 Radial 3.39
15 Newgistics 3.00
15 Red Stag Fulfillment 3.00
16 PFSweb, Inc. 2.75
*This list only includes companies that received at least 10 responses.
*This list only includes companies that received at least 10 responses.
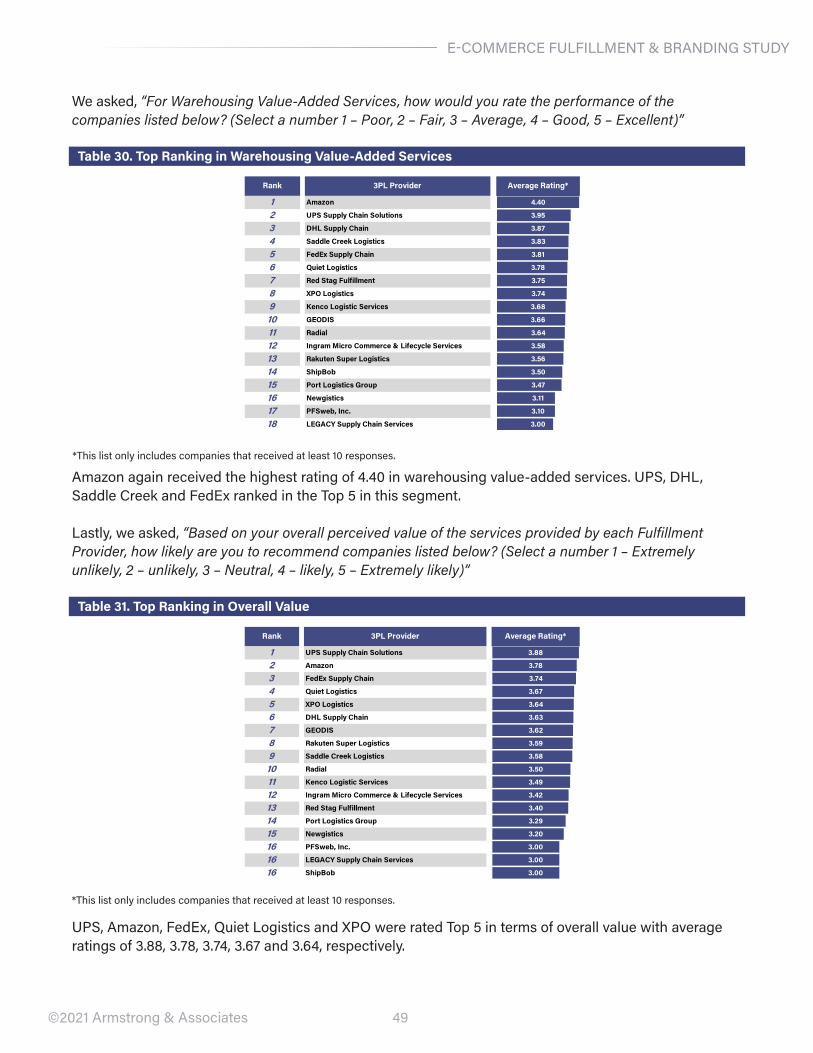
49©2021 Armstrong & Associates
we asked, “For Warehousing Value-Added Services, how would you rate the performance of the companies listed below? (Select a number 1 – Poor, 2 – Fair, 3 – Average, 4 – Good, 5 – Excellent)”
Table 30. Top Ranking in Warehousing Value-Added Services
Amazon again received the highest rating of 4.40 in warehousing value-added services. UPS, DHL, Saddle Creek and Fedex ranked in the Top 5 in this segment.
Lastly, we asked, “Based on your overall perceived value of the services provided by each Fulfillment Provider, how likely are you to recommend companies listed below? (Select a number 1 – Extremely unlikely, 2 – unlikely, 3 – Neutral, 4 – likely, 5 – Extremely likely)”
Table 31. Top Ranking in Overall Value
UPS, Amazon, Fedex, Quiet Logistics and XPO were rated Top 5 in terms of overall value with average ratings of 3.88, 3.78, 3.74, 3.67 and 3.64, respectively.
*This list only includes companies that received at least 10 responses.
*This list only includes companies that received at least 10 responses.
Rank 3PL Provider Average Rating*
1 Amazon 4.40
2 UPS Supply Chain Solutions 3.95
3 DHL Supply Chain 3.87
4 Saddle Creek Logistics 3.83
5 FedEx Supply Chain 3.81
6 Quiet Logistics 3.78
7 Red Stag Fulfillment 3.75
8 XPO Logistics 3.74
9 Kenco Logistic Services 3.68
10 GEODIS 3.66
11 Radial 3.64
12 Ingram Micro Commerce & Lifecycle Services 3.58
13 Rakuten Super Logistics 3.56
14 ShipBob 3.50
15 Port Logistics Group 3.47
16 Newgistics 3.11
17 PFSweb, Inc. 3.10
18 LEGACY Supply Chain Services 3.00
Rank 3PL Provider Average Rating*
1 UPS Supply Chain Solutions 3.88
2 Amazon 3.78
3 FedEx Supply Chain 3.74
4 Quiet Logistics 3.67
5 XPO Logistics 3.64
6 DHL Supply Chain 3.63
7 GEODIS 3.62
8 Rakuten Super Logistics 3.59
9 Saddle Creek Logistics 3.58
10 Radial 3.50
11 Kenco Logistic Services 3.49
12 Ingram Micro Commerce & Lifecycle Services 3.42
13 Red Stag Fulfillment 3.40
14 Port Logistics Group 3.29
15 Newgistics 3.20
16 PFSweb, Inc. 3.00
16 LEGACY Supply Chain Services 3.00
16 ShipBob 3.00
e-COMMerCe FULFILLMeNT & BrANDING STUDY
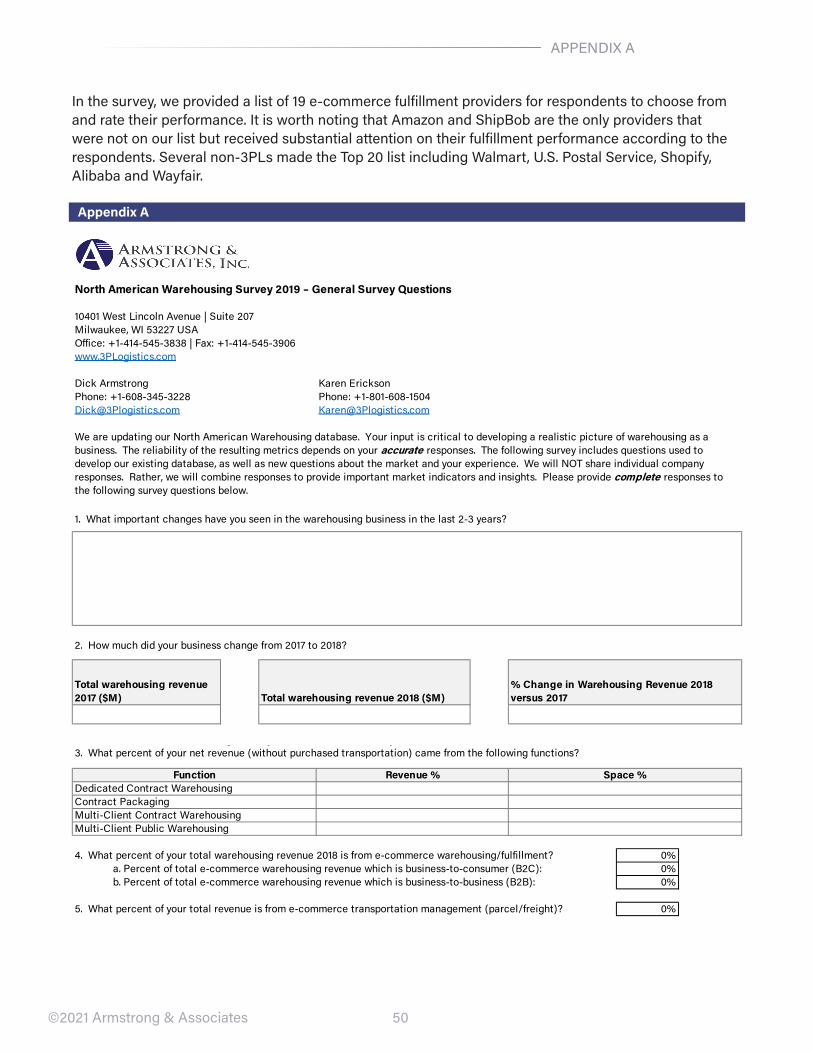
50©2021 Armstrong & Associates
In the survey, we provided a list of 19 e-commerce fulfillment providers for respondents to choose from and rate their performance. It is worth noting that Amazon and ShipBob are the only providers that were not on our list but received substantial attention on their fulfillment performance according to the respondents. Several non-3PLs made the Top 20 list including walmart, U.S. Postal Service, Shopify, Alibaba and wayfair.
Appendix A
North American Warehousing Survey 2019 – General Survey Questions
10401 West Lincoln Avenue | Suite 207Milwaukee, WI 53227 USA Office: +1-414-545-3838 | Fax: +1-414-545-3906www.3PLogistics.com
Dick Armstrong Karen EricksonPhone: +1-608-345-3228 Phone: [email protected] [email protected]
1. What important changes have you seen in the warehousing business in the last 2-3 years?
2. How much did your business change from 2017 to 2018?
Total warehousing revenue 2017 ($M) Total warehousing revenue 2018 ($M)
% Change in Warehousing Revenue 2018 versus 2017
We are updating our North American Warehousing database. Your input is critical to developing a realistic picture of warehousing as a business. The reliability of the resulting metrics depends on your accurate responses. The following survey includes questions used to develop our existing database, as well as new questions about the market and your experience. We will NOT share individual company responses. Rather, we will combine responses to provide important market indicators and insights. Please provide complete responses to the following survey questions below.
North American Warehousing Survey 2019 – General Survey Questions
4. What percent of your total warehousing revenue 2018 is from e-commerce warehousing/fulfillment? 0%a. Percent of total e-commerce warehousing revenue which is business-to-consumer (B2C): 0%b. Percent of total e-commerce warehousing revenue which is business-to-business (B2B): 0%
5. What percent of your total revenue is from e-commerce transportation management (parcel/freight)? 0%
3. What percent of your net revenue (without purchased transportation) came from the following functions?
Revenue %Function Space %Dedicated Contract WarehousingContract PackagingMulti-Client Contract WarehousingMulti-Client Public Warehousing
APPeNDIX A
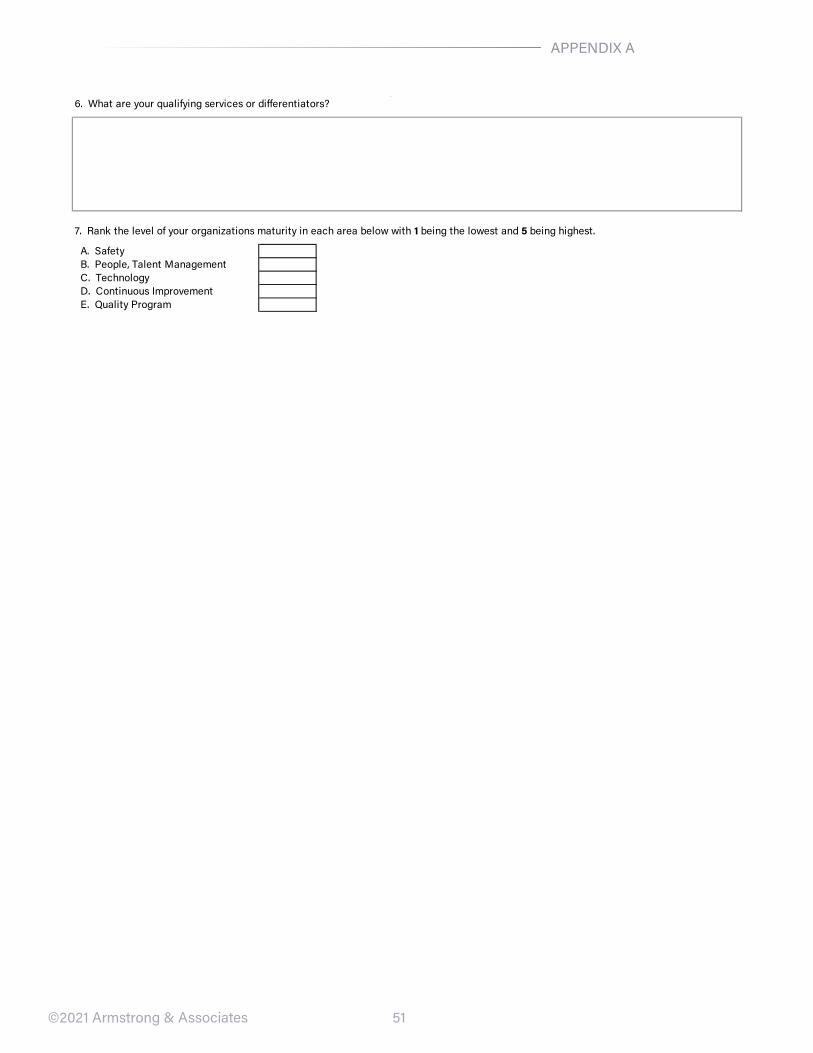
51
APPeNDIX A
©2021 Armstrong & Associates
North American Warehousing Survey 2019 – General Survey Questions6. What are your qualifying services or differentiators?
7. Rank the level of your organizations maturity in each area below with 1 being the lowest and 5 being highest.
A. SafetyB. People, Talent ManagementC. TechnologyD. Continuous ImprovementE. Quality Program
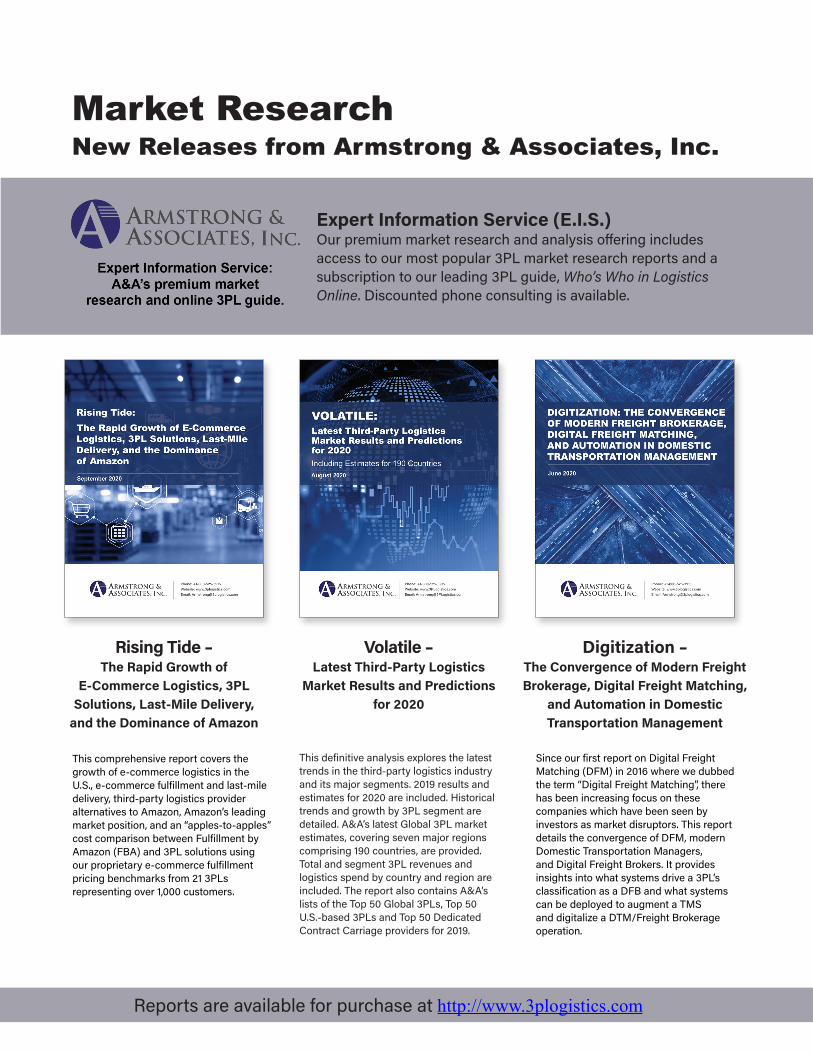
Market Research New Releases from Armstrong & Associates, Inc.
Expert Information Service (E.I.S.) Our premium market research and analysis offering includes access to our most popular 3PL market research reports and a subscription to our leading 3PL guide, Who’s Who in Logistics Online. Discounted phone consulting is available.
reports are available for purchase at http://www.3plogistics.com
Digitization – The Convergence of Modern Freight Brokerage, Digital Freight Matching,
and Automation in Domestic Transportation Management
Since our first report on Digital Freight Matching (DFM) in 2016 where we dubbed the term “Digital Freight Matching”, there has been increasing focus on these companies which have been seen by investors as market disruptors. This report details the convergence of DFM, modern Domestic Transportation Managers, and Digital Freight Brokers. It provides insights into what systems drive a 3PL’s classification as a DFB and what systems can be deployed to augment a TMS and digitalize a DTM/Freight Brokerage operation.
Volatile – Latest Third-Party Logistics
Market Results and Predictions for 2020
This definitive analysis explores the latest trends in the third-party logistics industry and its major segments. 2019 results and estimates for 2020 are included. Historical trends and growth by 3PL segment are detailed. A&A’s latest Global 3PL market estimates, covering seven major regions comprising 190 countries, are provided. Total and segment 3PL revenues and logistics spend by country and region are included. The report also contains A&A’s lists of the Top 50 Global 3PLs, Top 50 U.S.-based 3PLs and Top 50 Dedicated Contract Carriage providers for 2019.
Rising Tide – The Rapid Growth of
E-Commerce Logistics, 3PL Solutions, Last-Mile Delivery,
and the Dominance of Amazon
This comprehensive report covers the growth of e‐commerce logistics in the U.S., e-commerce fulfillment and last-mile delivery, third-party logistics provider alternatives to Amazon, Amazon’s leading market position, and an “apples-to-apples” cost comparison between Fulfillment by Amazon (FBA) and 3PL solutions using our proprietary e-commerce fulfillment pricing benchmarks from 21 3PLs representing over 1,000 customers.