Embed Size (px)
Citation preview

Report of the Nationa1Research Institute for Earth Science and Disaster Prevention,No,541 January,1995
The C1imate Simu1ated by the JMA G1oba1Mode1
Part2:Tropica1Precipitation
By
1Masato SUGI*,R.D.NAIR*まand Nobuo SATO*榊
W〃o〃α1地∫θακ〃刎’舳θ〃肋7肋S6加6θα〃ゴ眺α∫伽〃θ閉ガo〃
‡*1〃肋〃1〃∫肋肋ψτθ6伽0/0馴,K肋〃妙肌〃肋
榊ノ;φα〃〃θ肋κ010gゴ0α1λgθ〃0ツ
Abstract
A34-year simu1ation of the g1oba1atmospheric circu1ation has been performed
using the Japan Meteoro1ogical Agency(JMA)91obal model.The simulated c1imate
of tropical outgoing longwave radiation(OLR)and precipitation are compared with
the observed c1imate of OLR.The seasonal mean fieId is genera11y we11simu1ated by
the mode1.However,severa1deficiencies in the simu1ation can be identified,1)
Convective activity around the Phi1ippines is weak.2)The convective area over Africa
is shifted eas亡ward and the convective area over the Amazon sp1its into two parts.3)
Asian monsoon precipitation extends north-eastward.4)The area of1arge inter
-annual variation of convective activity over the equatoria1Pacific is shifted west-
ward、
KeyWords:mode1,climate,JMA,tropical,Precipitation
1. Introduction
The main objective of the c1imate mode1ing study at the Nationa1Research Institute
for Earth Science and Disaster Prevention(NIED)is to predict the posibi1ity of a disaster
based on the prediction of future climate.For this purpose,a very accurate prediction
of the geographical distribution of precipitation is required.For re1iab1e prediction of
precipitation,the mode1is required to simu1ate the present c1imate of precipitation very
accurate1y. Apart from this specific purpose,the accurate simu1ation of tropica1
ホAtmospheric and Hydrospheric Science Division
一18!_

Report of the National Research Institute for Earth Science and Disaster Prevention,No,54.January,1995
precipitation is important because tropica1convecti▽e heating is the major driving force
of the genera1circu1ation of the earth’s atmosphere,and therefore the mo(1e1’s deficiency
in the tropica1convection is like1y to1ead to a deficiency in the mode1’s globa1c1imate.
In this paper,we investigate the tropica1convective activity in the Japan Meteoro-
1ogica1Agency(JMA)91oba1model(JMA,1993;Sugi功αZ.,1990).We examine the
climate of outgoing1ongwave radiation(OLR)as we11as precipitation in the tropics
simu1ated by the mode1and compare them with the observed c1imate of OLR.
For the verification of the simu1ated convective activity,we use the observed c1imate
of OLR(Kawahara,1990),which is derived from the NOAA sate11ite observation for the
period of1974-1987, The observed climate of the seasonal mean OLR(Fig.1)is
computed as the10year average of the seasonal mean OLR for the period1974-85(the
data for1978is absent).The seasona1mean is defined as a3month mean:Dec-Jan-Feb
for winter,Mar-Apr-May for spring,Jun-Ju1-Aug for summer and Sep-Oct-Nov for
autumn.The interamua1variation(IAV)of OLR(Fig.3)is the standard deviation of the
seasona1mean OLR.For the computation of the intra-seasona1variation(ISV)of OLR
(Fig.5),the pentad OLR data is used.First,the climato1ogica1average is subtracte(i to
remove the amua1variation.Then,the nine pentad moving average is subtracted to
remove the inter-amua1variation.The ISV is defined as the standard deviation of the
resultant pentad data for each season.
The simu1ated c1imate of OLR and precipitation of the JMA g1oba1mode1is
computed using the result of a34-year time integration of the mode1,as in Sugiθ≠α1.
(1995).The same computationa1procedure is used for the mode1data as for the observed
data.The averaging period is different for the mode1and the observed data,but we have
checked that the difference due to the averaging period does not affect much the resu1ts
presented in this paper.
2. Outgoing1ongwave radiation(OLR)
2.1 Seasona1mean
The observed and simulated c1imates of the seasonal mean OLR are shown in Fig.
1and Fig.2,respective1y.The areas be1ow220W/m2,which correspond to active
convective areas,are shaded inbothfigures.Notethatthecontoursabove240W/m2are
not drawn in Fig.1.Overa11agreement is good between the model c1imate and observed
climate.However,some discrepancies can be pointed out.The active convection area
over Africa in the mode1is shifted eastward compared to the observations in winter,
一182_

The Climate Simulated by the JMA Global Model Part2=Tropical Precipitation-M.SUGI,θエα/.
spring and autumn.The convection area in the model over the Amazon sp1its into two
parts in winter and spring.In summer,from Africa to South Asia,the be1t-shaped low
OLR area extends too much in the mode1. In the observation,there is an active
convection area over the westem Pacific near the Phi1ippines,but it does not appear in
the mode1.Instead,strong convections are concentrated in the regions near the equator
such as Sumatra,Borneo and New Guinea.
2.2 Inter-annual variability(IAV)
Figs.3and4show the observed and simu1ated inter-amual variabi1ity(IAV)of the
seasona1mean OLR.These two figures do not agree with each other.In the observation,
the IAV signa1associated with ENSO is evident,particu1ar1y in the winter.These signaIs
are not seen in the OLR in the model.The1argest amp1itude of IAV in the model appears
over the eastern Pacific at the1atitude around10.N in the winter and spring,but the
amp1itude is relative1y sma11over this region in the observation,
2.3 Intra-seasollal v肌iabi1ity(ISV)
Fig.5and6show the observed and simu1ated intraseasona1variabi1ity(ISV).The
correspondence between the simulated and observed climates is much better than in the
case of IAV.In genera1,the amp1itude of the simu1ated ISV is1ess than that of the
observed one.Note that the contour interva1s are different in the two figures.In the
mode1,there is no area where the ISV is larger than30W/m2,In the observation,the
large ISV areas are concentrated in the region from the Indian Ocean to the westem and
midd1e Pacific Ocean.
In winter,the1arge amp1itude of ISV in the mode1is seen in the south of20.S,while
it is seen in the north of20℃in the observation.In spring,two maxima of ISV are seen
over the east Indian Ocean and New Guinea in the observation,but they are not c1ear in
the mode1.In summer,over the westem Pacific near the Phi1ippines,the amp1itude of
ISV is large in the observation but sma11in the mode1.The wide area over the Arabian
Sea is covered with1arge ISV in the observation,whi1e the1arge ISV region in the mode1
is concentrated in a narrow band in the north of the Arabian Sea.In autumn,areas of
1arge ISV appear in the east Indian Ocean and around the Phi1ippines in the observation,
whi1e the areas of1arge ISV in the model are shifted northward of these regions.
_183一

Report ofthe National Research Institutefor Earth Science and Disaster Prevention,No,54・January,1995
0 30E 60E gOE 120ε 150E 180 150W ,20W 90W 60W 30,7
・10N
20N
叩
20S
・lOS
璽まll.◎’一
・・、尚..
40N
20N
Eq
20S
40S
NORM^L C011tOur in工onol i520w/皿・with日r・obεlow220w/皿1・h日d・d WlNTER
0 30E 60E gOE 】20E 150E 180 150W 120W 90} 60W 30W
イ0N
20N
叩
20s
・10S
’一も一‘
」’1’一留季∴
’ 誰 ■ 2{〇 一 ■
・亀
・1・簿象1繕・・・…辿...
龍1
.,.く...
葦脅グ
40N
20N
Eq
20S
40S
NO尺M^L COnしOur inユor”o1 i・20w/而・}ith・r・ob・low220w/而・・hod・d SPRlNG
0 30E 60E gOE 120E 150E 180 150、.■ 120W gOW 60W 30刊
40N
20N
Eq
20S
40S
一≡爵’二
幸
、、司o.、、
’美芋筆’ll・亀、’’’
留
”
40N
20N
EQ
20S
40S
NORMAL ・㎝t。・ri^・rwl is20η/m・with・r・abE.loπ220w/而1sト日dEd SUMMER
0 30E 60E gOE 120E 一50E 一80 150} 120W gOW 60π 30W
40N 40N
20N
Eq
20S
40S
宴’
・一・;嚢1嚢ぺい 驚1一20N
EQ
20S
40S
NORMAL coπtour i11tEr}Ol is20w/而・岬iLh日r“below220w/m・shaded AUTUMN
Fig.1 Observed seasonal mean OLR(Kawahara,!990).Contour interva1
is20w/m2.Areas below220W/m2are shaded.Contours above
240W/m2are not drawn.
_184一

The Climate Simulated by the JMA Globa1Mode1Part2:Tropical Precipitation-M.SUGI,〃αZ.
4ZN
20N
EQ
2ZS
4ZS
0 22E 6酬≡ 10②E 140E 18⑦ 14ZW 1②‘…lW 60〕 20)
織1111舳:獺…....腺、稻洲:1=1=糊榊舳w1’’’一’’’.1:灘1 {’l1l.一一’・’・=・1・1・・’・芋’・=・’・一・’・…・一一・・^・.
一1一
2他111舳1榊..I岨w■ …■一..1
1 . ■ 1=
1’1 ■ 一■ 一 一1 ■ 1 一 ■1 一一一一一一し一一一‡_一一1一一一一一一←一一一一L_1一一一⊥一鵜一 =
一’‘・■■■■‘’’・一■■■■■■’一■一」■’■■ ■ ■ ■ 1 1・ 一一 ‘‘
・ 一 1 ■ 1 一 ’■;
■ ■■1一一 1 1 111■ 1 1 ’=銚珊111: l
I■
■ 1 1 1 11鑑1111、.11’“一一一一一一一一一一一.’’一一・一一一一一一十一一一一一■ 一 1 ■一 一 1 1’一..・’^ ・・・…W・・一一“’1-r一’’’一↑’1’’一11’一’’一「’一’“’‘孤一’一’ 2・.・....^・ .1.誰一一’
’一■ ’・=1:’.・.1…・・・・…ll・.・.・圭1一=:=:::=’ I
1
一I一■一 一 一■ …1…1一…’’’↑’二↑噌…寸’r嚢.11■ P 一..…鞘・一・・.
一11
一
■ 一 一 1 ■一
一 1 1■ l 1 1
■ 1 1 1■
一一一一一’一一一一・一一一4一一一一一1一一一一,一ε4 I 1 1 ■ ’ ・ 1一一一
■■■‘・ ’・一・‘・一 一一一一一宇.一一一■..‘‘’一一1一一■‘‘.一一1■仁一一■一■一■一一一■■■O .lil11 - 1 I l I 1 ‘一・一.一 一■一・一一1
■ 1■ ■ ■ ■ 1 1 1 1 , 1■ =
MEAN OLR WINTER
4ZN
2ZN
EQ
2ZS
4ZS
40N
20N
EQ
2ZS
4ZS
⑦ 20E 6ZE 1Z②E
一掃電…と一1-1
‘・.____■__ 1一一..一 ・・’_’ __’_■_■・240.・トー一
MEAN OLR
14ZE 18Z 、
1一幽ヒ>一 I l 一
・雷’“す.
“3一.“1“一1二一
=.θ
14②W ; ’
一一一,㌧一一一斗一一
2岬
1 “■
十ヤ
1ZZW 60H 2Z)
}
…十一一一 一一秘、一十一一一一一一
1 1
- 1
+s蓬SPRING
4ZN
2ZN
EQ
20S
4⑦S
40N
20N
EQ
2ZS
40S
⑦ 2②E 6ZE lO②E
一グ ー
{
一一一一・十一一一一十一一一一市亭一十一一一一十一一一一一1
_______■___ ____■_以OL_■
...一,.......、...^、.. 3aa鮎
MEAN OLR
14ZE 182
百 1 一‘ ’ ’ ’ ‘ ‘ 一 ’ 一一 一
為1
■
I 1り
14ZH 10ZW 60W 20W
’砿 1 ・r・一一 一■■1一 一 1 1 1 1 1 1 i l ’・一1一■・i■‘‘’’’_ ___’』㌧・ 1__止__ _ ■;‘ ’
1112㍗1榊1111111111111111≡≡1.
..j”≦手:事_φ_
’ ’ 一 圭 一 熱 亭 串
SUMMER
4ZN
20N
Eq
2②S
4②S
4ZN
2螂N
EQ
20S
40S
‘≡1 20E 60E lOZE 140E 18Z 「4ZW 100W 6②〕 2ZW
llあ=.’..’一望 …’1’・!.一I一.’11I一■一 一‘・ ’一.一一†一一一一・・■一■■■■■■r一■■‘・.「.一・ ’一一一・ 一・・1.一一11 ■1-11‘‘1.・主1・lll1l・1{・1:.
l1111l≡1葦一■
1、’1‘ 1一一一■ 1. 一11・.一一一一一■1
■1■1.■1
一■11- 111■ 1茸瀞ψ .一1■11一
1
“.. ^}一干1一5.一I・r一一一一¶1■
一一
.1.’一号⊥一‘.・一一一一一・一I■
・・■
1 ; Il1111一 11.1.12仰一■一一一1■■一■一■■■■■■■■一 ■■ ■一■11 111 ■■1 11■.
■■■・一一 一1
1-2鰍一■■一一トー■■‘.■一.・・一一‘トー一‘一・‘十・一一一1111.lll1 一一■一■一一’’1’一‘“‘
MEAN OLR AUTUMN
4ZN
2②N
EQ
2ZS
4ZS
Fig.2 Simulated seasonal mean OLR.Contour interva1is20W/m2.
Areas below220W/m2are shaded.
_185一

Report of the National Research Institute for Earth Science and Disaster Prevention,No,54;January,1995
30E 60E gOE ]20E 150E 180 150W 120W gOW 60W 30W
40N
20N
[Q
20S
イOS
・1争、
Q
...1⑤
=黛1.’’
■ 一 1 ■
.、 一 ■1’ ■ . 一 ■ ■ 1 ■ ■ 一 ■ 1 一
WlNTER
40N
20N
EQ
20S
40s
S.D.(川TER州Nu^L) conto.r in[ε・”1is5w/而・wiしh日・・日obow20w/m・・hod・d
30E 60E gOE i20E 150E 100 150W 120W gOW 60W 30w
40N
20N
Eq
20S
40S
.咋
1’’^’1’…{…’’‘’専…
ム・岬{・二
α’’’I’1二・
、㌻奉嚢季奉・1 ・事、
・琴、…
SPRlNG
40N
20N
EQ
20S
40S
S.D。(1NTER^NNuムL〕 ・㎝tourint官r”l i・5w/n・}i川ore日日bo・e2㎝/m・5hoded
30E 60E gOE 120E I50E 一80 150W 120W gOW 60W 30W
40N
20N
EQ
20S
40S
’6
㌔.
’’イ,I’’
’ド!・一・}
轡勢
SUMMER
40N
20N
EQ
20S
40S
S.D.{]NTERANN∪AL〕
30E 60E
COn工Our into『”a】
90E ,20E
i・5w/mwi川・・蜆・b。岬20w/m・・h・d・d
一50E ]δO 】50W 120W gOW 60H 30w
40N
20N
EQ
20S
40S
峯箏11簿1{、と1、
今
AUTUMN
40N
20N
Eq
20S
40S
S.D.(】NTER^NNu^L〕
Fig.3
COn⊥Our int~r”1 i・5}/ml}i止hπ蜆・boΨ艘20w/m・・hodod
Observed inter-amual variation(IAV)of the seasonal mean OLR
(Kawahara,1990).Contour interval is5W/m2.Areas above
20W/m2are shaded.
_186一

The Climate Simulated by the JMA Global Model Part2:Tropical Precipitation-M-SUGI,2丘α1.
② 20E 6ZE l ZOE 140E 180 14ZW 10②W 60〕 2②W
4ZN
20N
EQ
2のS
40S
...一..谷…、一一s一竿…一r…一一一一1一一一一一一 ≡袖一一・1一一一一一≡一一一一一一一
面 5.o
,lllll1録章:議、lllllζ隼11111
4ZN
2②N
EQ
2②S
4ZS
S.D(INTERANNUAL)
螂 2②E
OLR
6ZE 1螂ZE 140E 18臼 14ZW 1②酬 6洲
WINTER
2②W
4ZN
2ZN
EQ
2②S
4ZS
一一ぶ あ 一= 、一S 一一一1一=…十一一一一一十一一一一十一一一一斗一一一一
1Φ .1......÷..1...一.、ユ
δ 嚢グー1 、、1蔓I
.一丁一珂一f 持・瞭く一’’一’戸一一一F’「o■’
一1一串一一紹十一一一一一ら一一十…一一一1一一や一一61一■)一
I 1 l I
■…↑ウー■’丁…t’一一’’一「.一一一↑…’一
一1r一一一÷一碑一一十一一{一一一一
’一 一梨も、一一←一一一一一一千一一一一一一一
一1…、 . 、
’1’こ彗 斗ζ茸’一一{一一’■’
十’一ま’’一’一’1一’’†’’’.1一一Q■’
1 ■θ 1 ‘
1す一一一一一一丁一一..一一百一“’・=一■■’.「■一一■’■‘
4ZN
2②N
EQ
2ZS
4②S
S.D(INTERANNUAL)
② 20E
OLR
6ZE l OZE 140E 18② 140W 1②②〕 6州
SPRING
20)
4ZN
2ZN
EQ
2⑦S
4ZS
由
一‘ ‘・・『・■
1、一一一一一一十一一…キー一一一、一甘専一十一十一
一・一十…一一†一一一1一一一十一一一一一1一一
一一一一一1一一一一
一一…1一一一・†一一一一丁θ
■E〕・一一一;一.一・1一一 一 一’.・トー一一一一’→■■一一一一=一
→ ・ ’ ; 一一一一 1一 一輪、一十一 1 一一一一
θ 1
{⊃ 1 1 1一一十押一一一†一一一一一1一一一†一一一一一†一一…1一
SUMMER
4ZN
2⑦N
EQ
2②S
4⑦S
S.D(INTERANNUム山)
Z 2ZE
OLR
60E l O②E 14ZE 18Z 140) 1臼Z〕 6洲 2ZW
4②N
2ZN
EQ
2ZS
4臼S
あ一一一一一 一谷
‘一’‘’’合一 一一
111111迎1111…lllll;…芒
一十一…†一1…一一一千一一一一一十一一一一一1一一
1触
級…茎。一÷・一・寺一ト1一…1一ム2一一
一≡暖11詳讐一む一一・†一τ一り一一十タ1・一一一一一†一一r一一一一一一一1一一一†一一一一1一一一一一≡一一一一一†一一一一一一
40N
2②N
EQ
2②S
4ZS
S.D(INTERANNUAL) OLR AUTUMN
Fig.4 Simulated inter-amua1variation(IAV)of the seasona1mean OLR-
Contour interva1is5W/m2.Areas above15W/m2are shaded.
_187一

Report of the National Research Institute for Earth Science and Disaster Prevention,No,54;January,1995
030匡:60EgOE120E150E180150冊 120W 90W 60π 30W
40N 40N
20N 20N
Eq
20S
、Eq
20S
一〇S 40S
S・D.(1NTn^Sε^SON^L) WlNTER
030E60EgOE120E】50E180150W120W gOW 60W :ヨO岬
40N
20N
Eq
20S
40S
ピ“ …
帆1
$、..、o、、
1帰 。
・・べと・
一文11
40N
20N
Eq
20S
40S
S-D一{lNTR^SE^SON^L) SPRlNG
0 30E 6帆 90E 120E 15gE 1昌O 150W 120W gOW 60W 30刊
・;0N
20N
EQ
20S
一10s
、、
9
か 伺
1③、
■
祭 ’ ■ ■ ■
■ 一
..弓
40N
20N
EQ
20S
4CS
S.D.{1NTR^SE^SON^L〕 SUMMER
0 30E 60E gOE i20E 150E 180 150η 120W 90W 60岬 30、一
イON
20N
EQ
20S
40S
㌔、l1}1・1{
1∵確 ~
一べ
40N
20N
Eq
20S
40S
S.D一{]NTR^SE^SONAL) AUTUMN
Fig.5 Observed intra-seasona1variation of OLR (Kawahara,1990).
Contour interval is5W/m2.Contours below20W/m2are not
drawn.Areas above30W/m2are shaded.
_188一

The Climate Simlated by the JMA Globa1Mode1Part2: Tropical Precipitation-M-SUGI,8601.
藺 20E 6ZE 1Z②E 14ZE 18Z 14ZW 100W 6洲 2ZW
4ZN
20N
EQ
2四S
4ZS
一一一…1・一谷 一一ド≦§一竿一一一一二1一一一一一一芋一一一一一一
1㌧、1 .j..6妻.1....…...
l l、 ,φ直1 ’’
1り 一
1 1科 1 一一一一ト.■一一一■→一’・一1一一
.I. ‘. _’. ㌔
; 1 .q1に)...且.1..
1 向.l l
40N
2②N
EQ
20S
4②S
S.D(INTRASEASONAL)
Z 20E 6ZE
OLR
100E 14ZE 18Z 14⑦W 1藺②〕 6Z〕
WINTER
2②)
4ZN
20N
EQ
2ZS
4ZS
一一一一一…一谷 一一一丁一一S一字一一一一「…一…ξ・
’’…一麟1’爾一’’一一. H 1
簗簑.
15.lO
…l1三11;;ll
』.、 .一。『
‘’‘‘τ・ミテ‘・’・r■■一
l l l 1蝕 1 1
1 1 1 → 、 l l
llllll1誓護、叫、1
≒一一一し一一」一9一一十一一一≒一一へ{一一一蔓… 」..=:乏…一
1 ■ 17.5 令■ l 1 1
40N
2②N
EQ
2ZS
40S
S,D(INTRASEASONAL)
Z 2②E 6ZE
OLR
1ZZE 140E 180 14臼) 1ZOW 6州
SPRING
2ZW
4②N
20N
EQ
2ZS
4②S
1 1I 1 み’「1 1 ・1 1 一 ■ 1I ’’1 - 1 1 1盟貫凄;1;二1纒嚢 11
一一一一一」.ぶ I l I’■f・一’■■r■■.’■‘1一一一1一. 一 ■■’■ 一r■1一■一・1-1一一’=一
一 1 1 一■ 一 一 一’
一.嚇.411
1一.;織.... 一一一一・・. 1
■
、 1 1、。 一 ■一 ’一
I11 ●I 1
I■■1 1 I . 1 1 1
・駈’t’一■‘’1一’’一一一. 1
. 1■ ■ ■一 ■ 1 一■ ■ 1
1;;115.Ol. ■ 1 - I ■ 11 11 1■
I ■ ■ ■一一一一’.’F’一一一一丁一一一『■一’’1’.r…’■’ll,1I l l 1 1 1-r-i‘‘一‘■,’一一一1一■r一■一‘一‘r一‘I■■一■r.一一一・.r.一一一一一一
1 ■1 1一一1一.■・F.一一一¶一.一.一I一
÷2く」111.11 1■ ■
一十…∴終← 一 11 ■ I . 1 一 一 ■
■ ■ ■ 1■ ■ 一 1■ 一 1
lO’ 1 1 1 1 1‡い$睾一十…†…r…i…’r…
■ ■ 1■ 1 1
一一一一一■・■・一1.一一r一一.‘.‘’,’一‘’‘一一トi■一一一一1 1 1 1
I 1 1 1 1 11 I 1 1 ■ 1=
1 1一 ■、十タト. 1 1 ■ 1 1 , 1 ■. .150 . 一 一 1 ■一トー→一…十一≒一…十…1㍉一1 ■ 一 一 ■ 1 1
4②N
20N
EQ
20S
4ZS
S.D(INTRASEASONAL) OLR SUMMER
0 2ZE 60E 1Z②E 140E 18Z 14Z) 1ZZ〕 6ZW 20W
40N
20N
EQ
20S
4②S
…一一一1一谷 …r-S一宇一一一一「一一一一一
■
一一一一一丁一…T・T・一一寺』一に一
」一一一一む一一 一一↑v一一;一一一
一一一…†一一■’’†’一I一一一言.一一.一.†一一一一一†一.1一
一一.一一一 一一一個一 1袖
、誓…rマー聾江 ≡…も峯三5
5. 1 一舳≡’・一1婆琴、.‘幸’f’く1
r…’1τ1…1斧警薫‡㌻ 鱗葦轟一一
†一一一一一す…一一一亨一・一一一†一杵…十一一一一一一一一一τ一一一丁一一一1一…一…一す…一一一
4②N
2②N
EQ
2ZS
4②S
S.D(INTRASEASONAL) OLR AUTUMN
Fig.6 Simu1ated intra-seasonal variations of OLR.Contour interval is
2.5W/m2.Contours be1ow15W/m2are not drawn.Areas above
20W/m2are shaded.
一189一

Report of the Nationa1Research Institute for Earth Science and Disaster Prevention,No,54; January,1995
② 20E 60E 120E 140E 18Z 14回W lZO〕 60W 20W
4ZN
20N
EQ
22S
40S
111 あ;1{ ’’ 1II・ 1■lI.一
111
一■1一■1 ■1■1 = 一。一一■一一 1-1 ・.・1■
一1 一1一 11
4ZN
2②N
EQ
2ZS
4②S
MEAN TOTAL PRECIPITATION WINTER
Z 20E 60E 1ZOE 140E 18Z 14ZW 1ZO〕 60〕 2ZW
4ZN
2ZN
EQ
20S
40S
1 あ 1一 .
一。一牟一一一 1 1一一一■一r一■■ ’’.’・’・
. 1.・lo11・1=一■・右…ヲー」』一・一葛千斗一
1 ■
、11.1 一
1 1 1■
I I I一⑳一■.・一■L一■一11..1・.一■.・ 一■一■・一一■一一■ ■’一L・一一1 .. , 一 ■1 =
1,11毎簑 =
㌣ζ』1-4I=、.リ。榊..l1;
11㌧一≡幸1 =
壮…紬令一,■ ll1識11≡1一■1÷一一■一■■■’’‘’■ 1.・・.、.
^1■ 1 ’.
1 = 1一I=・L■一一一一一1
■一■一■■ ‘■
1 1 1 1=
一・一‘ 1
■■111,’一一1一一I
一 一 1 ’ ■1‘lll11・.■1一一 一 1 一 ■ ■■十一一一一一ト・一・一・1‘’一一r・’・■‘1一一11一十一一1一一‘.’’.’I.1■1
1 11 . = = I
I一一,I ■= 1 ■ l1■一i■1
=
・.1- 1 = 1
I 1 1.一I一…’・‘‘.一一一・・一^一・・.・一・一一一・一一・ ■ 1■一11■1■1 一 一 一 1 ■ 1
I ・ I l一.一.一F一一.一一「一’’一一一■‘り’†’‘一1一’一一‘†.1一’‘「.’一’’一一i1一一一’†’一.一“‘’1‘’‘「’…’一‘’
1一 一一.1■ 11;
’ll;1一’ 1■1
4ZN
2ZN
EQ
2ZS
4②S
MEAN TOTAL PRECIPITATION SPRING
0 2臼E 6ZE 10②E 140E 18⑦ 14Z) 1ZO〕 6洲 20〕
4ZN
20N
EQ
2ZS
40S
一■一 一一一■・一占二 一1一
一 ■ 翻
一一§一宇一一一二1 1 一=二一・・一一一1言一一一一一≒・
= 。チ蟻 一’艮 ^‘’‘..’一』’’‘「‘‘一.1』 .■1’.‘.一一』’一 9’.
14. 1て φ . ; ル= ■
、 . 、 . 1’一㌻ξ
一樽一1一一↑一 …一一紗1一†一一一一†一一一一†一三千一一苛一1
1 へ
SUMMER
4ZN
2ZN
EQ
2ZS
4ZS
MEAN TOTAL PRECIPITATION
0 2ZE 6ZE 10螂E 14ZE 18回 14Z〕 10②〕 6螂W 2Z〕
40N
2ZN
EQ
2ZS
4ZS
1 ・
ムFl ・ l1 1■一■’’ ■ 11
一一一1.一杜 1■1一■■r■■■■一一1■一一一■■
一‘■i■,一
一一一一十一一一→…一一十一…一→一2…一一一一■ 一 一 1 1 一一1‘‘’ 11’・’・’・11・
ll^’1
11一一一 .■■■■ I・■ 一1 . 一1-1■
11一’・’’」■■■■■一
■■■■■ 一■一一■ 一 ’■一一1 ■
.....L....、圭...j.....」..1..L⊥.基.工、_.1_
11一I ■
I 1
一■■一,■’
,
1 微箪…一
一 1一‘
,
■一一■一■■L■■■■I ■1.1
I- 1-1、■ll l一・一一.一、’一一一一一一十一一一二一一一一一一十一一一一十一一一一一一
1
1-1■’ 1’
■1 1i一
■ I 一 ■ I l
塁i盈..炉■11
1■ ■一一一.11
1』一 ■ ’ 1 1一■11一一一・一1.■11 一 ’’一一’一一1一一一十一ザー一一一’r一一「ラー一’’1‘一’’言.「一1‘..
■ ■一.一.一.一一、一.一一■■
一 ■一 1
4②N
20N
EQ
2ZS
4ZS
MEAN TOTAL PRECIPITATION AUTUMN
Fig.7 Simulated seasona1mean precipitation.Contours areユ,2,4,8,.
mm/day,Areas above8mm/day are shaded.
一190一

The C1imate Sim1ated by the JMA Global Mode1Part2=
② 20E 6ZE lOZE 140E 18②
Tropical Precipitation-M.SUGI,〃α1.
14Z〕 1ZO〕 6ZH 20W
40N
20N
EQ
2ZS
40S
一撫1^岳←コー‘■ ■1■
’’ J....に1_↓舞_ 1一...1‘ 一一 1
一一一一一 ‘・・一’「[一…一.一“一一一→一一一丁一
■ 1■‘’■一■■■■I
1■■.一一一一L一一一・■一一一一1.一■1一一一一I一‘‘’1■.1
‘
口.一一一.・‘・一
1-1一.l1■I■■■・1■.一■一1
’
…「Tl¶一等;}.一一.一 ・.。。
^
■1‘
l1鮒一’1、.1l‘・.
1一俄轟、1 .ol. ’1■一11■1一‘一‘一1 ・■1一 一 .■ 一I一一.一・一一.二・一一一.一一・L一.“一・一___一一 珊
.盟....
1一一11 ■.1 ■111■11I1
blll.‘一.1.一I・一1■1■■1
11し
I
汀夕一・.1 1.1一..
一一.1一・’一一一・’‘一’■■一・■1■1111I1一■一■一I.一一■一I■1■1 一一一一一 一一一1-11-I一一一‘I
“1一・’.一F一‘・一■.■‘‘‘■一一‘“一’一一■’■ト■’■‘■一.1■1.1I11 一
一一一一.、‘一1・一.■■
4ZN
20N
EQ
20S
4ZS
S.D(INTERANNU凶工)
0 2②E 60E
TOTAL PRECIPITATION
1ZOE 140E 180 140W lO②W
WINTER
6②W 2ZW
40N
2ZN
EQ
2ZS
40S
I 1一一.一一.一8一一 唇←j一一■、 ’・’
一‘一■’. ‘‘一
一 1 1I ■ 1- 1 1
’’…一豚…一丁一一一TI一’1袖
一’一.I-Tてフ■ 一i‘
II.i-1-1・r‘‘1.■=
=. 1 一. 1 11 工 1 ■■■1一一・一.一一
1I..
■一一一一 ■■・一■II・ ■ .・一・・
■ 11,11 .1 .■….’一…’…#小ト’■’1一一一一’一
:’給十…
1“ o olo’I......!..(由艘. .2・O11=1■■1
.由 ・璽勢 一 ■ ■■
■.一 一一一一一一一一
■ 1・ 1I.1・.・■■1■ 0 、一一
一 ■ 1■ 1,。■1,1
11-1
匂
・・. 1.一一 ■’・・一 ■ 一1■」一一1■・・一L’・’」■、一1■..’.■‘・・■■■I ■ ■ 一一、
■■■
■一’ 一一■1I
一 11..、.① 11■
■1■一■一一.ト’’1一一一
一一一・・ 1一.一一■ I一一.■ 刃一卦一一⊥十一一→一一 一・一・=
1
‘■一’’‘■・’’‘一一.1
4ZN
20N
EQ
2ZS
4②S
S.D(INTERANNUAL)
2 2ZE 6ZE
TOTAL PRECIPITATION
lOOE 14ZE 18Z 140W lOO〕
SPRING
6舳 20)
40N
20N
EQ
2ZS
4ZS
・一一一一一・一谷 ;一r一§辛一
....、1...ll..、賃、..谷
1 ;、 1一一一一1…一一キー一一一、一言与一斗一一
.…一†…’†一一一.一’1一’…†一
一一二1一一一一一一一……:一一一≡
..、.....一 黎鎖
一一一一1_暮二一
一’一†一’I…テ’’■一’†’…一亨一壱
q
.θ
一一†夕1一一一
1.....l 1袖 = 1
+一一一一一一÷一一一一 一 一稔:一十一一一一一・÷一一一一一一
4...口;⊆⊇≧・ .. 1. ..;.......
= = も ; ; 1+…十一一一一十一一一一す一一一1一一1一一一一一一1一一一一一一一
4ZN
20N
EQ
2ZS
4ZS
S.D(INTERANNUAL)
Z 2ZE 6ZE
TOTAL PRECIPITATION
lOOE 14ZE 18Z 140W lZ藺W
SUMMER
60W 2Z〕
40N
2ZN
EQ
2ZS
4ZS
…一一一・一尖 …rS一年一一一二1
...、..; .j.
「σ1撃1
’.…†’’一’†一1’…言’…’一す.一‘†一
Ω...1 =琳
.蔓窒.三三...三...>士、..1.牟 、o,≡
l1撃三11豊蜜.受1ニニ:ニニニニギ;≡簑11ゼ1
’一一一†一一一一†一一一一一;一・一一紗1一一十†一一一十一一一十一…十一一1一一十一一一一一
4ZN
2②N
EQ
2ZS
4ZS
S.D(INTERANNUAL) TOTAL PRECIPITATION AUTUMN
Fig.8 Simulated inter-amual variation(IAV)of seasonal mean precipita-
tion.Contour interva1is1mm/day.Areas above3mm/day are
shaded.
一191一
Report of the National Research Institute for Earth Science and Disaster Prevention,No,54.January,1995
Z 2ZE 60E l Z②E 140E 18Z 140〕 1Z②〕 6臼〕 2Z)
4ZN
20N
EQ
20S
4②S
一一一1・尖1一η岳しコ = 〆’ 1I 1 ■1 1 一 .一■一■■一’’・2
11 I ■1-1一一1一一一一“1『一一.■一一「一‘‘一・一一一.r一一■一「一‘’一・「一・一一一1・一一一一一一
, 一‘ I = ;ll~11’1 ■11
, ・‘’l I 一■1■
= 1■ 1- 1 ■ 1 1■ 1
一一1一 一 I = 11。. 一一、、、。
=一.1・・一』一■一1■一■』■.一■■■一■.’’一一■
‘..・■‘・』.1 一’宇‘ 一一1’.一一■一■‘1 ■■ 一
1■1■.■ 一 ■11
1 ■1‘
’≒1一 ■一 1 11 I
1.・
■
●・
■1I■■一■一r■■一■■一『■■一■・’.『一■一一‘‘一一’一1’’…11ll1l11酷=1一
灘嚢 ■.1
1’:≡1書一言1・‘’..
1,1
.
1 ・
llll ■ ll一
I
■ 1一■..・‘・■■■’■一■一■■■’‘.I.・一.1一一1 1 1
1I;;1=
一1一一一一■一■F一‘一.一一一一 一■1一一一“■一一一■一一一■‘・一一・一一・■・“’‘一.一一■■I■1‘,‘.一・一.■・,・.・・.1
11■1 1 1 1111
i.1・1■lllll 1 ■11 1 ■
4ZN
2②N
EQ
2ZS
40S
S,D(INTRASEASONAL)
Z 20E
TOTAL
6ZE l OOE
PRECIPITATION
140E 18Z 14臼〕 1②ZW 6ZW
WINTER
2②)
4ZN
2⑦N
EQ
2ZS
4②S
…抽.罫←ギ=
■‘一一・・ 1
lll1揖.1’一’r.’・一.’一“一r’’一‘一一r.一.一’・一.一1一一一一’一’r‘‘’r一’一’一一一’‘
一一‘’1■ = = 1一■ 111- l I■1 1一 = l1llllll’,一I-11一.一1■ = o.・■
‘‘■一■一」■■一一一一一■一■■■■1■ 一■一一■一一■一■■■一1 一■一■■一一■’■L・‘.・
一■ ■■ 義
1’
’■■一.ll ■,、111,1 =■1鶴一一一一一一一r・・■.・,o
= 1一一一・一十一一一一⑭二 11■■一1■1’’
1■一、l1爵1㌔ 11d_な樹’鱒 :l1蜴 1 i 1 2 . I’1一一一 11
1
一一一‘1・・L1一・’・.・・1■1■■一一■
、’.llll・1.・一一』。・一一・一一・一一‘一」’・一・・一‘一・一一一1一一I一一一一一・’‘‘・一一.■一一一一
.・1■I 111’P’1=
■.■一■一11■■■一一7一一1
11 I‘1一■ =
11 一 一11111111■II1
.‘一’’‘一 一一一一一一1’一’一一一一言巧一一’
l1 ll 1; 1・.1114’lI1I一■1-1
4②N
2ZN
EQ
20S
4ZS
S.D(INTRASEASONAlL)
② 2②E 6⑦E
TOTAL
1⑦OE
PRECIPITATION
140E 18藺 14ZW 1Z州
SPRING
60) 2藺W
4ZN
20N
EQ
2ZS
4ZS
……1竿鴛’妾1,ll111・
= :# 1 .
≡\ ≡js.
1 l l l c51一一一一一十一…十…一一一、十一十一一
口 1 1 に......」...」..、...
匹 1 1
. ≡サ≡2 = = 『D’..十.’一一一’rウ’一十’’.r’■’
一1一一藪、斧一一す一一一
1o
l....o.
’τ’’“羽
40N
2ZN
EQ
2ZS
40S
S,D(INTRASEASONA工)
Z 20E 6ZE
TOTAL
1ZZE
PRECIPITATION
14ZE 18Z 14ZW 1②舳
SUMMER
6Z) 2ZW
4ZN
20N
EQ
20S
4ZS
一一≡傘…嶋ギ・コ…一…≡一、、1.一.11=0
、 ■ .’ I .
一 1… .・一L______一______一一一一.・ ・.’■‘.!・L_’ I lI ,1 -I ・l 1 斜 1, 1 ■ 1
’,1
■ 一 ■ I 1 1…1’111一・一一十一・一一千……1・一・・ ■ l I I ■ 1- l l ; l l -1 1一一一」一一一一一⊥一ムー十一一トー1一一」⊥一一..邸、←……1一一一一一一一
…γ一機…㌻り二≡一
11l l■ 1 1
l l ’ l l ;・111
1 1
1 1 , 1 1
l l ; l 1 ;1■ i ■
=ll1l1 1 ■ ■ ■ 1 1
1 ■ , l i一■一一一・■‘一■一■一一’一一一一■一“一一一一‘1・ト・‘‘’‘・■‘一‘一・I一←■一一一■・
1 1 ; l l l■ l i ■ I l
一一・ザーター一一1…1r一…→一一1一一一■一一1一一1 1 1 1 - 1 1 - 1
4⑦N
2ZN
EQ
2②S
40S
S.D(INTRASEASONAL)
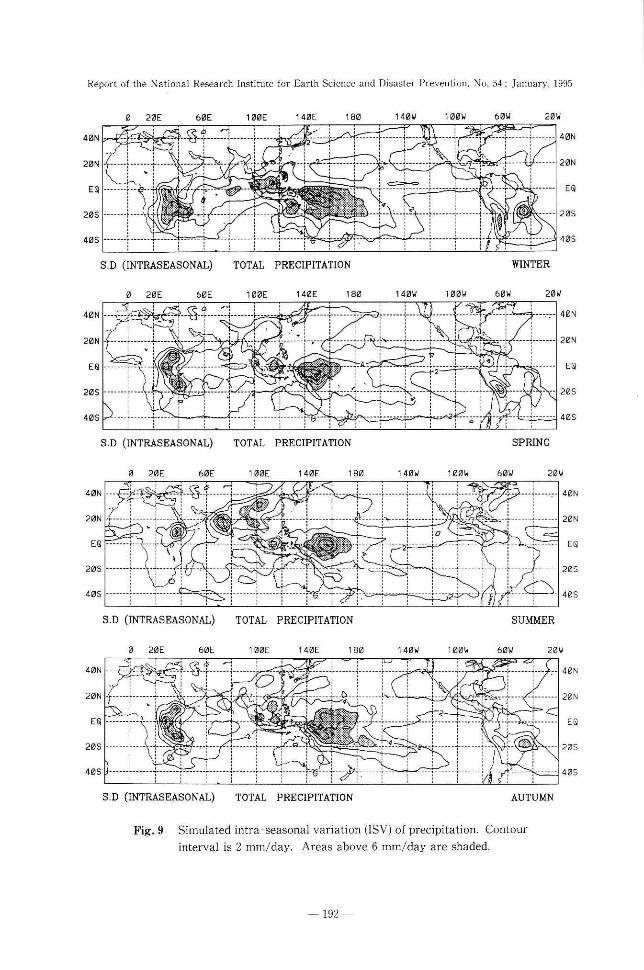
Fig.9
TOTAL PRECIPITATION AUTUMN
Simulated intra-seasonal▽ariation(ISV)of precipitation.Contour
interval is2mm/day.Areas above6mm/day are shaded.
一192

The Climate Simu1ated by the JMA G1obal Model Part2: Tropical Precipitation-M-SUGI,召チα1。
② 2②E 6②E lZ②E 140E 18Z 140W lO②H 60W 2Z〕
4ZN
2ZN
EQ(a)
20S
4ZS
‘11 聯L二≡. 1. ’‘.. 1l1一十ト梢一紗1“l11-11
、
_一一」£一一 ’‘■・‘一.
・ .一■■一■
1^’一 1=. 畷1
■1-1…一$1醸 榊織
1-l19一一■1一一’.一___’.1■一一一一.“」I0一.・\.1’
一一.一一」‘・一・一一■」■一■一一1
一一一■‘’ ・.一一一 ‘5■:’.一1 ‘・’‘.
1 ’晃 ■一■ 1.
■.1==1蛾…:…=撫11:1:1一
撚’一1:琵 = I
{ 膨1■■・一一一■一・・‘・『‘I 一 ’’一一2 ‘‘.一・一 一一.¶一一一
Il11 =・’’’ム‘
11, 1 ; = ’一一1“.’;=
11一一‘‘’・」一■一■一」一一・1
一I■1、’1.ll一_」・_一一’』一一一一一_一」_一一_」__一_一」一一一■一_一一一竈11・l 1 =
’‘・一・L‘‘・.■
‘1一.一
l l11■’一.・一一一一一1一一11■.1■1.一■1
1111 1■■1I■1■ ■1■.11一■ 1
ター簑…一ドーP 11一■11一=
.■ ■1■
一一一一一一一一一_一1一一一一一。…一一一一。一一一一一一2一一一 ■一一.一一一■ ■
1■一11一■■1 1
SUMMER
40N
2ZN
EQ
2ZS
40S
CONVECTIVE PRECIPmATION
0 20E 6ZE lZ②E 140E 18Z 140W 1⑦②〕 60H 20〕
(b)
40N
2②N
EQ
2ZS
4ZS
一如1.丁。冨字一コ1 ■I■一1.’
1 ・1.1..一....1_.1.....、」魁.1......1......・・■.一.Ii’1・一・.r1-rrr■・・r1・一
1 ■一‘’1■一111■ 1■■Il・讐■lll11;■1■111
ll■一一一一一』1___’_一一_・‘‘一‘i一‘‘■止_.1■■
一一
1-1臼.1一11一1-1
I一’一一一r’■’’T1’.ぴ一¶一’一一一丁一一’一一一11,1 1一一一.
一←…㌧給←
..l1lllll ■1..3__1_斗_一仁一↓_←斗_」_峯虹μ仁一諮≡∴∴㌧羊ぺ、llll;1111-llll 11
■、’1lll■ .■」 ・ ..」一 ‘ ■一LI 一一■■」・一・・一一一L一一一一一一■一一一一・‘‘■一一 ■、・‘1“.1■lll
1■一.1.i
11■,1Ill’1.1;・・一‘・L‘.‘・‘’.・一..一111
■11■■・I111I1111I-11■1■1■ 一I .
1■1■■1
1 .一.II■・I.一一■・.・一■■■一,■ ・‘・ 11・一一一一
11 一榊榔.W.、....11、..。・。冊^事:’’1一一一一r議
SUMMER
40N
2②N
EQ
2ZS
4ZS
LARGESCム山E PR1≡:CIPITATION
Fig.10 Simulated convective and stable precipitation for summer.
(a)Convective precipitation.(b)Stab1e(1arge sca1e)Precipitation.
Contours are1,2,4,8,、..mm/day.Areas above2mm/day in(a)
and8mm/day in(b)are shaded.
一193一

Report of the National Research Institute for Earth Science and Disaster Prevention,No,54’January,1995
3. Precipitation
3.1 Seasoml mean
The observed and simu1ated seasona1mean OLR(Fig.1and2)and simu1ated
precipitation fie1ds(Fig.7)agree with each other qua1itative1y. The discrepancies
between the observed and simu1ated OLR,such as the eastward shift of simu1ated
African precipitation and the sp1it of simu1ated Amazon precipitation are even more
evident in Fig.7.Concentration of simu1ated precipitation towards the equator over the
westem Pacific in summer is also evident.
3.2 Inter-annual variabi1ity(IAV)
Different from the simu1ated OLR(Fig.4),the simu1ated precipitation(Fig.8)shows
a1arge IAV over the westem to central equatoria1Pacific.The simu1ated maximum
IAV of precipitation is1ocated west of the date1ine compared to the observed maximum
IAV of OLR1ocated east of the data1ine,The amp1itude of the IAV of observed OLR
in the winter is much1arger than the other seasons,whi1e the amplitudes of IAV of the
simulated precipitation are not so different among the seasons.
3.3 Intm-seaso皿a1variabi肚y(ISV)
The ISV of the observed OLR(Fig.5)is1arge over the eastern Indian Ocean and
westem Pacific,and it is relative1y weak over other convective1y active regions such as
Africa or Centra1and South America.In contrast,the areas of large ISV of simu1ated
precipitation(Fig.9)almost coincide with those of1arge mean precipitation(Fig.7),
although the1argest ISV is concentrated in the westem Pacific region.Particular1y,in
the summer and autumn the large ISV in the observed OLR is1ocated around the
Phi1ippines,while that of simu1ated precipitation is1ocated over the equator,east of New
Guinea.This seems to suggest that the rain-producing tropical disturbances are not
active around the Philippines in the mode1in these seasons.
4. Discussion and conc111sions
The geographica1distributions of seasona1mean OLR and precipitation agree we11
with that of the observed OLR.The convective activity in the tropics is genera11y weII
simu1ated by the mode1.However,there are some discrepancies between the simulation
and the observation.Four major deficiencies of the simu1ation can be pointed out as
fo11ows:
1)The active convection region observed in the summer around the Phi1ippines is not
simu1ated wel1in the model.The weak convective activity over this region may be due
一194一

The Climate Simulated by the JMA Global Mode1Part2:Tropical Precipitation-M.SUGI,〃〃、
to the1ack of active tropica1disturbances in the mode1.On the other hand,convection
is active over theequatoria1regions inthemodel.We arenotsure,atpresent,whether
the lack of disturbances around the Phi1ippines is a resu1t or a cause of the concentra-
tion of convective activity over the equatoria1regions in the model.A1so,the weak
convective activity around the Philippines in the mode1seems to be c1oseIy re1ated to
the strong south-westerly monsoon f1ow a1ong the east coast of the Asian continent
and weak westerly flow over the South China Sea(Fig.3(b)of Sugiθ≠αム1995).
2)The active convection region over Africa in the mode1is shifted to the east of the
observed position,and the convection region over the Amazon is sp1it into two parts
in the mode1.These findings indicate that the active convections over the inland
regions are not simulated we11in the mode1.This may be related to the1and surface
processes in the mode1.The land surface may be too dry over these regions to supply
sufficient moisture for active convective precipitation.The diuma1cyc1e may not be
strong enough to produce much convective precipitation over these regions in the
mode1.
3)The region of the simu1ated south-east Asian monsoon precipitation extends too far
north-eastward,with too much precipitation over the east area of the Tibetan P1ateau.
The1ack of rain producing disturbances in the southem part of the monsoon region
may be responsible for this.Fig.10shows the simu1ated seasonal mean precipitation
by convection and large sca1e condensation(stab1e precipitation).It is c1ear from this
figure that the1arge portion of the in1and precipitation is produced by stable precipita-
tion,which is mainly maintained by a stab1e monsoon f1ow and orographic effect,
4)The region of the1arge IAV of precipitation over the equatoria1Pacific in the mode1
is1ocated considerab1y to the west of that of the observed OLR,and it shows much1ess
seasona1variation in intensity as compared to the observation.This seems to be
c1ose1y related to the mode1’s tendency of concentration of precipitation over the
western equatoria1Pacific.Also,it may be re1ated to the weak convective activity
aromd the Philippines in the mode1as mentioned above.
Genera11y,the distribution of the seasona1mean OLR is fair1y well simulated by the
mode1,but the variabi1ity of OLR is not weu simulated,particu1ar1y in the inter-annual
time sca1e.Because the OLR is very sensitive to clouds,the simu1ation of OLR depends
on the simu1ation of clouds in the mode1.The accurate simulation of c1ouds is genera11y
difficu1t,and it is1ike1y that c1ouds are not well simu1ated in the JMA global mode1.
Therefore,the disagreement between the simulated and the observed OLR does not
一195一

Report of the National Research Institute for Earth Science and Disaster Prevention,No,54’January,1995
necessari1y mean that the convective activity in the mode1is different from the observa-
tion.The re1ationship between the convective precipitation and OLR in the mode1may
be different from that of the observed.Idea11y,observed precipitation climate shou1d be
used instead of OLR for verification of simu1ated precipitation c1imate.However,the
data for the IAV and ISV of precipitation is not sufficient at present.More observed
data is desirable to improve the observed precipitation climato1ogy.
In order to cure the above-mentioned deficiencies in the simu1ation,further study on
the possib1e causes of such deficiencies is necessary.Particu1ar1y,the sensitivity of the
simulation to the parameterization scheme of cumu1us convection needs to be examined.
The activity of tropical disturbances with short time scales also needs to be examined to
improve the c1imate of the tropica1precipitation of the mode1.
5.Ackmw1edgments This study is conducted as a part of a special research project“A study of disaster
predictioning1oba1hydro1ogicalprocesses”attheNationa1ResearchInstituteforEarth
Science and Disaster Prevention(NIED).The computation is made using a CRAY
-YMP2E at NIED.The authors wou1d1ike to express their sincere thanks to the Japan
Meteoro1ogical Agency for providing us with the JMA g1oba1forecast mode1and
a11owing us to use it for our study.
I{eferences
1)JMA(1993):Out1ine of Operationa1Numerical Weather Prediction at Japan Meteorological
Agency,Appendix to Progress Report on Numerica1Weather Prediction,JMA,128pp-
2)Kawahara,M.(1990):Inter-amua1andintra-seasonalvariabi1ityoflargescaleconvectiveactivity,
Meteor.Res.Notes,168,5~42(in Japanese).
3)Sugi,M.,K.Kuma,K.Tada,K.Tamiya,N.Hasegawa,T.Iwasaki,S.Yamada and T-Kitade
(1990):Description and performance of the JMA Operationa1G1obal Spectra1Model(JMA
-GSM88),Geophys.Mag.,43-3,ユ05~130.
4)Sugi,M.,Kawamura,R.,Sato,NI(1995):The C1imate Simu1ated by the JMA Globa1Model,part
1=G1obal Feature,ReportoftheNat.Res.Inst.forEarthScienceandDisasterPrevention,No.54,
155~180.
(Accepted:17August,1994)
一196一

The C1imate Simu1ated by the JMA G1obal Mode1Part2:Tropica1Precipitation-M.SUGI,θfα1.
気象庁全球モデノレの気候特性(2)熱帯の降水
杉 正人*・R.D.NAIR**・佐藤信夫***
*防災科学技術研究所 気圏・水圏地球科学技術研究部
榊インド国立カラグプールエ科大学
榊気象庁 予報部 数値予報課
要 旨
気象庁全球モデルを用いて全球大気大循環の34年間の変化のシミュレーションを行い,
シミュレートされた熱帯の外向きの長波放射量(OLR)と降水量を観測されたOLRと比較
した.季節平均場は,モデルによって大体良好に再現されている.しかし,次のような,
いくつかの欠点が認められる.1)モデルでは,熱帯太平洋北西部での対流活動が弱い.2)
アフリカの対流活動域が実際より東にずれている.また,アマゾンの対流活動域が東西に
分かれている.3)アジアモンスーンの降水域が北東方向に伸びている.4)熱帯太平洋の
年々変動の大きな領域が実際と比べて西にずれている.
キーワード1モデル(model),気候(climate),気象庁(JMA),熱帯(tropica1),降水
(Precipitation)
一197一


![53 53B 54€¦ · 53 54 Arnold > Valley Road > Jubilee Campus > QMC > Clifton Saturdays Service Number: 53 53 53 54 54 54 54 54 54 54 53 53 53 Arnold, Front Street [Stand 3]... 07:21](https://img.pdfslide.net/doc/110x75/6015ec4bed21201a772315fb/53-53b-54-53-54-arnold-valley-road-jubilee-campus-qmc-clifton.jpg)


![Large-scale Biaxial Friction Experiments Using a …dil-opac.bosai.go.jp/publication/nied_report/PDF/81/81-3...Beeler et al., 2012; McLaskey and Kilgore, 2013]. The loading is applied](https://img.pdfslide.net/doc/110x75/5f32cf21922c58143872d9ad/large-scale-biaxial-friction-experiments-using-a-dil-opacbosaigojppublicationniedreportpdf8181-3.jpg)