Embed Size (px)
Citation preview
The Calibration of Expert Judgment:
Heuristics and Biases beyond the laboratory
Derek J. Koehler
University of Waterloo
Lyle Brenner
University of Florida
Dale Griffin
University of British Columbia
To appear in T. Gilovich, D. Griffin, & D. Kahneman (Eds.) Heuristics and Biases: The
Psychology of Intuitive Judgment.

2
The Calibration of Expert Judgment
The study of how people use subjective probabilities is a remarkably modern concern, and was
largely motivated by the increasing use of expert judgment during and after World War II
(Cooke, 1991). Experts are often asked to quantify the likelihood of events such as a
stockmarket collapse, a nuclear plant accident, or a presidential election (Ayton, 1992; Baron,
1998; Hammond, 1996). For applications such as these, it is essential to know how the
probabilities experts attach to various outcomes match the relative frequencies of those
outcomes, that is, whether experts are properly “calibrated”. Despite this, relatively few studies
have evaluated how well descriptive theories of probabilistic reasoning capture the behavior of
experts in their natural environment. In this chapter, we examine the calibration of expert
probabilistic predictions “in the wild” and assess how well the heuristics and biases perspective
of judgment under uncertainty can account for the findings. We then review alternate theories of
calibration in light of the expert data.
Calibration and miscalibration.
Miscalibration presents itself in a number of forms. Figure 1 displays four typical patterns of
miscalibrated probability judgments. The solid diagonal line, identity line, or line of perfect
calibration, indicates the set of points at which judged probability and relative frequency
coincide. The solid line marked A, where all judgments are higher than the corresponding
relative frequency, represents overprediction bias. The solid line B, where all judgments are
lower than the corresponding relative frequency, represents underprediction bias. The dotted line
C, where judgments lower than 50% are too low and judgments higher than 50% are too high
represents overextremity bias. The dotted line D, where judgments lower than 50% are too high
and judgments higher than 50% are too low represents underextremity bias. Note that
overextremity entails overly radical judgments (too close to 0 and 100) and underextremity
entails overly conservative judgments (too far from 0 and 100). Combinations of under- or
overprediction and either of the extremity biases are also possible, and result in lines that cross
the diagonal at points other than 50%. Overconfidence, the poster child of judgmental biases, is
a simple summary term (average subjective probability minus overall outcome frequency) that
does not uniquely identify any one of these patterns (Wallsten & Budescu, 1983). Nonetheless,
when referring to previous research we will often use the term overconfidence as this simple bias
measure is often the primary statistic reported.

3
Each of the four patterns illustrated in Figure 1 is consistent with the use of judgmental heuristics
(e.g., Kahneman & Tversky, 1973), and the pattern found depends on specific qualities of the
judgmental task or situation and how they interact with the relevant heuristics (Griffin &
Tversky, 1992; Griffin, Gonzalez, & Varey, 2000). The neglect of base rates that follows from
reliance on judgmental heuristics leads to overprediction bias (A) when the outcome base rate is
low and underprediction bias (B) when the outcome base rate is high. The neglect of evidence
quality that follows from reliance on judgmental heuristics leads to overextremity bias (C) when
the evidence quality is low and underextremity bias (D) when the evidence quality is high. The
dependence of miscalibration upon the difficulty of the task and the knowledge of the judge (the
difficulty or hard-easy effect) was established as the fundamental bias in general knowledge
calibration by Lichtenstein, Fischhoff, & Philips (1982) in their comprehensive review.
Nonetheless, general claims about the ubiquity of “overconfidence” continue to dominate
managerial and academic textbooks.
The Model
The predictions of the heuristics and biases perspective are typically qualitative in nature, but
recently Brenner (1995) introduced a parametric model of calibration that makes precise
quantitative predictions. Random Support Theory (RST) (Brenner, 1995) combines elements of
Support Theory (Rottenstreich & Tversky, 1997; Tversky & Koehler, 1994) and Signal Detection
Theory (e.g., Tanner & Swets, 1954) to fit calibration data and yield a set of psychologically
meaningful parameters. Support Theory itself is a “coherence theory” of subjective probability
and evidence strength, describing when and why intuitive probability judgments depart from the
syntactic rules of probability theory. Random Support Theory extends the logic of Support
Theory to the semantic question of the “correspondence” of the probability and the actual
outcome (cf. Hammond, 1996). According to RST, probability judgments reflect the balance of
evidence captured by underlying distributions of support for correct and incorrect hypotheses.
Based on the observed probability judgments and the associated outcomes, RST provides an
efficient summary of these underlying support distributions. We will focus on three parameters
of the model. Alpha ( measures the judge’s discrimination ability, defined as the difference in
support for correct and incorrect hypotheses, indexing the quality or “weight” of the evidence.
Sigma () measures the extremity of the judge’s responses, defined as the tendency to depart
from the base rate value, indexing the perceived strength of the evidence.Beta ( measures the
differential support received by the focal hypothesis; among other things, can be viewed as an
index of a judge’s sensitivity to the outcome base rate.

4
In this model, good calibration arises when is matched to so that extremity of judgment is
appropriate for the level of evidence quality, and when the outcome base rate is matched by the
use of . A zero response bias (is appropriate when the base rate is 50%; an increasingly
negative response bias maintains calibration as the base rate moves below 50%, and an
increasingly positive response bias maintains calibration as the base rate moves above 50%. The
patterns of miscalibration presented in Figure 1 were generated by RST: overprediction was
simulated by a low base rate (20% probability of focal outcome) with no bias adjustment ),
and a balance between extremity and discriminability (); underprediction was simulated by a
high base rate (80% probability of focal outcome) with no bias adjustment ), and a balance
between extremity and discriminability (); overextremity was simulated by a moderate base
rate (50%), and greater extremity than discriminability ); and underextremity was
simulated by a moderate base rate (50%), and less extremity than discriminability ().
Support theory and RST are closely related to the strength-weight model of confidence and
calibration (Griffin & Tversky, 1992), sharing an assumption that confidence or judged
probability reflects the support or strength of evidence for the focal hypothesis relative to that for
its alternative. These models all belong to a class we will refer to as direct support models,
because of their common assumption that confidence (when measured via judged probability)
reflects a direct translation of the support, or strength of evidence, of the focal outcome relative
to that of its alternative. Direct support models naturally depict judgments of confidence as case-
based, in the sense that support is based on an assessment of the available evidence regarding the
case at hand. In case-based judgment, the impression conveyed by the evidence determines the
degree of confidence, with little regard given to the reliability of the relationship between the
evidence and the target event. Such an interpretation is consistent with the observation that
people are often insensitive to characteristics of the larger set of events to which the specific case
at hand belongs, such as base rates or evidence quality (e.g., Kahneman & Tversky, 1973). In
certain cases, set-based characteristics may be treated by people as arguments in a case-based
evaluation; for example, the base rate of a medical condition may be one argument considered by
a physician (“there is a lot of that going around”). However, such usage typically will lead to
underweighting of the base rate compared to the ideal statistical model. The impact of a base-
rate “argument” seems to be determined by its apparent relevance to the case at hand (Tversky &
Kahneman, 1982) rather than by considerations of the reliability of the evidence, as in the
Bayesian model. When base rates are used, as in a within-subjects design, they are used in an
additive manner, rather than in the multiplicative manner required by the Bayesian model
(Novemsky and Kronzon, 1999). This is consistent with the notion that when base rates are

5
salient, they are used to adjust the case-based impression, which acts as an anchor (Griffin &
Tversky, 1992).
An advantage of direct support models is that, in many cases, people can provide direct ratings of
the extent to which the available evidence supports a given hypothesis. Consider as an example a
study reported by Tversky and Koehler (1994, Study 3; for details, see Koehler, 1996), in which
subjects assessed the probability that the home team would win in each of 20 upcoming
basketball games among a set of 5 Pacific Division NBA teams. Subjects were asked to rate the
strength of each of the five teams, which was assumed to be monotonically related to the team’s
support in the confidence assessment via a power transformation. As shown in Figure 2 (circles),
the predictions based on the team strength ratings, fit the mean probability judgment data quite
closely. Koehler, Brenner, and Tversky (1997) report the results of a number of additional
studies in which direct ratings of support are used successfully to fit probability judgments.
The triangles in Figure 2 represent mean judgments of evidence strength and mean probability
judgments for general knowledge questions (Varey, Griffin, & James, 1998). Subjects in a
“support” condition were asked to report the proportion of evidence available to them supporting
each alternative whereas subjects in a “confidence” condition reported their subjective
probability that each alternative was correct. For both sports predictions and general knowledge
answers, the slope of the best-fitting regression line is very close to 1.0, consistent with the
notion that respondents directly translated their impressions of support into probability judgments
(cf. Kahneman & Tversky, 1973).
Out of the laboratory.
Most theories of judgmental calibration were developed on the basis of laboratory data from the
two-alternative (half-range) forced-choice paradigm, usually with general knowledge questions
as the object of judgment (see Lichtenstein et al, 1982). There are a number of reasons for this
tradition. General knowledge or “almanac” studies are quick and efficient, producing hundreds
of easy-to-score judgments from hundreds of subjects, whereas it is both difficult and time-
consuming to assess the quality of judgments made in applied settings: Loftus and Wagenaar
(1988), for example, took three years to collect judgments about self-reported wins and losses
from 182 trial lawyers. The two-alternative paradigm is closely linked to research and theory on
“meta-cognition”, the study of how well people can monitor their own knowledge (e.g., Nelson,
Leonesio, Landwehr, & Narens, 1986), and more generally has a long history in psychophysics.
In addition, the half-range measure of probability fits the intuitive notion of “confidence,”
running from complete uncertainty (.5) to complete certainty (1.0).

6
This reliance on half-range studies, however, has obscured several important issues. For full-
range judgments the focal hypothesis for a given domain can be defined in alternate ways (e.g., a
set of basketball games can be assessed in terms of wins for the home team, or wins for the team
higher in the standings) and many measures of judgmental calibration are sensitive to the choice
of the designated event (Liberman and Tversky, 1993). This complication is avoided in half-
range studies, but at the cost of losing some important information about human judgment. Most
critically, half-range studies confound the role of outcome base rate and task difficulty. In a
typical half-range study, the outcome can be summarized by the overall percent correct, which
serves to define the expected outcome or base rate as well as the difficulty of the question set.
In a half-range study, the effects of base rate and difficulty or discriminability may be
distinguished by designating one of the possible responses to each item as a target, implicitly
creating a one-alternative judgment task (cf. Ferrell and McGoey, 1980). However, these
manipulated targets are often arbitrary (e.g., P(True) vs. P(False). In true one-alternative
judgments (e.g., predicting the likelihood of a given disease, or predicting the likelihood of
winning a court case), the base rate of the positive outcome is clearly separable from the
difficulty of discriminating positive outcomes from negative outcomes. Predicting a nuclear
accident or a stock market bubble may be difficult either because the event is rare or because the
available evidence is not diagnostic (or both)— a distinction that may make all the difference to
understanding and debiasing such judgments.
Expert Judgment: A question of competence?
Many commentators have argued that expert judgments, at least those made in a naturalistic
setting, may be immune from the systematic judgmental biases found in laboratory experiments.
The prevalence of judgmental biases is often blamed on factors intrinsic to the psychology
laboratory such as unmotivated subjects and misleading and unrepresentative questions (see, e.g.,
Shanteau, 1999). Thus, “decision heuristics…appear more likely to create biases in the
psychology laboratory than in the [medical] clinic” (Schwarz & T. Griffin, 1986, p. 82), and
“biases found readily in other research are not evident in the judgements of professional auditors”
(Smith & Kida, 1991, p. 485). By and large such conclusions were obtained from domain
experts completing pencil-and-paper measures in their domains of expertise, rather than from the
observation and assessment of expert judges in their day-to-day activities.
There are many reasons to expect that the judgments of experts will depart systematically from
the judgments of novices (Shanteau, 1999). Experts know more, they can organize cues into

7
larger “chunks” (Chase & Simon, 1973), and they can recognize patterns more easily, more
accurately and more quickly (Glaser, 1990; Klein, 1998). As Simon noted in his classic studies
of expert judgment, experts seem particularly good at that part of recognition that consists of
automatic pattern-matching between a stimulus and a category (Chase and Simon, 1973; Simon,
1979). All these statements are consistent with a direct support account, and in terms of our
guiding model imply that in well-ordered domains, expert judgments will have a higher than
novice judgments, reflecting experts’ greater ability to correctly discriminate between different
outcomes. However, the ability to order cases in terms of the likelihood of a given outcome
(discrimination) does not necessarily correspond to the ability to assign the appropriate level of
probability to that outcome (calibration) (Liberman & Tversky, 1993). Thus, depending on the
problem environment, even the most knowledgeable and perceptive expert may nonetheless
show the patterns of miscalibration portrayed in Figure 1 (see Stewart, Roebber, & Bosart, 1997,
and Wagenaar & Keren, 1986, for related arguments).
Previous Theories Applied to Experts
According to the confirmatory bias model of Koriat, Lichtenstein, and Fischhoff (1980), a
general tendency towards overconfidence arises from people’s inclination to recruit reasons from
memory that confirm the focal hypothesis. The stronger and more numerous the reasons that are
recruited, the greater is the confidence expressed in the selected answer. Because this process
inclines the judge to overlook reasons against the selected answer, however, he or she is likely to
be overconfident that the selected answer is correct. Consistent with this claim, Koriat et al.
reported that asking subjects to generate reasons favoring and opposing both options in a 2AFC
task reduced overconfidence relative to a control condition in which no such reasons were
generated. Furthermore, asking subjects to generate reasons contradicting their preferred
alternative reduced overconfidence relative to a control condition while generation of supporting
reasons had no effect.
Experts might be more or less susceptible to confirmatory bias than novices. On the one hand,
their extensive experience may help them learn to evaluate evidence in a more impartial manner,
and could also lead them to spontaneously generate alternatives to the focal hypothesis. On the
other hand, the broader knowledge base of experts might lead them to more readily generate a
biased set of reasons favoring the focal hypothesis.
It should be noted that the results of Koriat et al.’s (1980) studies have proven somewhat difficult
to replicate (e.g., Fischhoff & MacGregor, 1982). Biased recruitment of evidence may play a
more pronounced role when the focal hypothesis is highly self-relevant such that the judge is

8
motivated to confirm (or disconfirm) it. Hoch (1985), for example, reported results consistent
with the confirmatory search model in a study of predictions made by business school students
about the outcomes of their job searches, all of which were evaluatively positive (e.g., receiving
more than three job offers). When compared to the actual job search outcomes, the students’
predictions proved to be substantially overconfident in the sense of overestimating these positive
events’ likelihood of occurrence (the pattern of overprediction in Figure 1); furthermore,
overprediction was greater for low-baserate events. As predicted by the confirmatory search
model, asking students to generate reasons why the target event would not occur substantially
reduced this overconfidence, while asking them to generate reasons supporting the target event’s
occurrence had no influence. Confirmatory search processes, then, might be apparent only in the
assessment of highly self-relevant outcomes, producing optimistic overconfidence (Kahneman &
Lovallo, 1993; Kahneman & Tversky, 1995; Taylor & Brown, 1988). Experts may not generally
exhibit such an optimistic bias, as the outcomes they assess do not typically concern themselves
personally.
Some researchers have argued that the prevalence of overconfidence in two-alternative laboratory
tasks is attributable to biased selection of particularly difficult or surprising items, a concern first
raised by May (1986). Derived from a Brunswikian framework in which cue-based
representations of the environment are constructed from experience (Brunswik, 1943, 1955),
ecological models draw attention to the manner in which the events serving as the target of
judgment in laboratory tasks are selected or constructed (Björkman, 1994; Gigerenzer et al, 1991;
Juslin, 1994). Ecological models are based on an explicit or implicit assumption that people are
able to accurately internalize cue-based environmental probabilities. According to the ecological
models, people produce these ecological or cue validities when asked for confidence
assessments, and should be expected to be well-calibrated as long as test items are selected from
the reference class in an unbiased manner. Miscalibration, on this account, is a result of non-
representative sampling of test items.
The ecological models predict perfect calibration for tasks in which judgment items are randomly
selected from a natural reference class. Consistent with such claims, early comparisons between
“selected” and “representative” tasks revealed substantial overconfidence for selected tasks but
little or no overconfidence for the representative tasks (Gigerenzer et al., 1991; Juslin, 1994).
Critics, however, have noted that such experiments confounded method of item selection with
task difficulty (Griffin & Tversky, 1992): The easier, representative tasks would be expected to
yield less overconfidence than the more difficult, selected tasks on the basis of difficulty alone.
Moreover, a number of studies using representative sampling have nonetheless found

9
overconfidence (e.g., Budescu, Wallsten, & Au, 1997; Griffin & Tversky, 1992; Paese &
Sniezek, 1991; Suantak, Bolger, & Ferrell, 1996; Schneider, 1995; Sniezek, Paese & Switzer,
1990). A survey of 25 tasks employing representative sampling (Juslin, Olsson, & Björkman,
1997) reveals a clear pattern of overconfidence for difficult tasks and underconfidence for easy
tasks, contrary to the predictions of the ecological models that no such effect should occur under
representative sampling.
For full-range tasks, the ecological models imply that there should be no systematic effect of
discriminability or target event base rate on calibration; indeed, as long as representative
sampling is used, these models predict perfect calibration regardless of level of discriminability
or base rate. Both of these variables have been found to influence full-range calibration for
general knowledge items (e.g., Lichtenstein et al., 1982; Smith & Ferrell, 1983), contrary to the
predictions of the ecological models. One might argue, however, that such laboratory studies fail
to satisfy representative design. By contrast, representative sampling of items is essentially
satisfied by definition in studies of on-the-job assessments of experts; the items judged by an
expert in practice should reflect the natural reference class of items for which the judge’s
expertise is relevant. Ecological models, then, predict that experts should be uniformly well
calibrated in the studies we review below.
Although Random Support Theory was developed in the heuristics and biases tradition, it can
represent the predictions of a number of theories of judgment, based on how the parameters of
the model vary with changes in base rate and evidence quality. The notion of case-based
judgment from the heuristics and biases perspective suggests that as the outcome base rate varies
across tasks and contexts, the bias parameter will remain essentially constant (neglect of base
rate), and that as the level of evidential weight or discriminability varies, the extremity parameter
will remain essentially constant (neglect of evidence quality). Case-based judgment implies
that support will reflect the evidence related to the particular case at hand, and will not be
sensitive to aggregate properties of the set of judgment items. Consequently, the parameters of
the RST model that ought to reflect these aggregate properties ( and will remain roughly
constant despite changes in base rate or evidence quality.
In contrast, the general confirmatory bias model implies a positive measure of focal bias ()
regardless of the task characteristics, and the special case of optimistic bias is characterized by a
positive focal bias for positive events and a negative focal bias for negative events. Ecological
models predict that, with representative sampling of items, calibration will be perfect, implying
10
that in ecologically meaningful situations will track changes in base rate and will track
changes in discriminability.
The Data
We review research on calibration from five applied domains: medicine, meteorology, law,
business, and sports. Wherever possible, we restrict ourselves to studies where the judges were
making predictions as part of their daily professional activities and where the stimuli were
neither selected nor restricted by the researchers. Due to space limitations—and to limitations on
data we were able to collect from secondary sources—we focus only on the shape of calibration
curves relating outcome frequency to probability judgments, even though RST makes precise
predictions about the expected distribution of judgments. Our approach is necessarily descriptive
and we do not explore the variety of quantitative performance measures available to diagnose
miscalibration (see e.g. Harvey, Hammond, Lusk, & Mross, 1992; Murphy &Winkler, 1992;
Stewart & Lusk, 1994; Yates, 1992; Yates & Curley, 1985).
Expert judges and expert judgments: Two textbook examples.
Before we present the summaries of data collected across five domains of expertise, we first
review two paradigmatic examples of excellent calibration. Few textbook discussions of
calibration and prediction fail to mention the essentially perfectly calibrated predictions of expert
bridge players (Keren, 1987) and meteorologists predicting rain in Chicago (Murphy and
Winkler, 1972). In fact, these two case studies have been enough to convince many
commentators of the intrinsic superiority of expert calibration in the field. It is useful to consider
how these classic examples fit into our theoretical framework before continuing on to review less
well-known data sets.
Perfect calibration is theoretically possible with various possible combinations of outcome base
rate and discriminability or difficulty. Indeed, ecological models predict perfect calibration in
any naturalistic or representative environment. Case-based or direct support models predict
excellent calibration when the base rate is moderate (near 50%) and when evidence quality is
moderate. These conditions are well met in the predictions of the world-class bridge players
studied by Keren (1987). The probability of successfully obtaining a given contract (the focal
outcome) was moderate (55%) and so no response bias was needed or found (observed =.05).
Furthermore, the players were moderately good at discriminating between successful and
unsuccessful contracts (=.96, where =0 represents no ability to discriminate, and values
above 1.3 represent excellent discrimination); and this level of discriminability was almost

11
exactly matched by the moderate extremity of predictions (=.90). Thus, excellent calibration
can be entirely consistent with a heuristic case-based account such as direct support theory.
The government meteorologists studied by Murphy and Winkler (1977) were also moderately
good at discriminating between days with and without rain (=1.09), and also showed moderate
extremity of judgment (=.94). However, rain fell on only 26% of the days, so a substantially
negative response bias was required (and obtained) to maintain calibration (=-.71). Here,
excellent calibration marks a distinct departure from the predictions of the heuristic case-based
account. As we discuss below in our review of meteorologists’ predictive judgment, it is
difficult to know if this sensitivity is a tribute to clinical or actuarial judgment, as meteorologists
combine statistical summary data with intuitive adjustments.
Not all published data sets reviewed below provided enough information to fit the full RST
model. However, all provided a calibration curve or table relating subjective probabilities to
actual outcomes, the base rate of the target or focal outcome, and some measure of
discriminability (usually Az, the area under the Receiver Operating Characteristics curve in SDT,
which itself is a linear transformation of d' in SDT, of in RST, and of the ordinal correlation of
discrimination recommended by Liberman & Tversky, 1993). In the absence of complete data,
we provide a graphical and qualitative comparison of the direct support predictions with the
expert data. As a simple default or null prediction, we create “direct support” calibration curves
by setting the extremity parameter to 1, indicating a moderate level of judgmental extremity
that is insensitive to evidence quality, and by setting the response bias parameter to 0,
indicating no sensitivity to outcome base rate, and allowing discriminability and base rate to vary
from one data set to the next. We then examine the fit of the direct support curves to the
observed judgments.
These direct support curves serve as “neglect models”, indicating the pattern of judgments
expected if base rate and discriminability are completely neglected. Observed curves that fall
close to these predicted curves provide evidence consistent with the case-based neglect account.
Observed curves that fall closer to the identity line than the predicted curves imply some
sensitivity to base rate and discriminability.
Domain 1: Calibration in Medical Settings
We begin with the expert domain for which the widest variety of data sets is available. Over the
last 20 years, there has been a growing interest in the quality of physicians’ prognostic and
diagnostic judgments and this interest is now reflected in a substantial body of empirical research

12
(see Dawson, 1993 and Winkler & Poses, 1993, for reviews). Data points from nine such studies
are presented in Figure 3, and Table 1 provides accompanying information such as the target
event, base rate, and , the RST measure of discriminability. Figure 3 also shows simulated
curves based on random support theory with constant and (i.e., our null “neglect model”), for
three combinations of base rate and discriminability. The theoretical curves give a good
qualitative fit to the data points.
The data summarized in Figure 3 reveal that, across the different sets of medical events,
physicians’ judgments show marked overprediction (when base rate is high and discriminability
is high), good calibration (when base rate is moderate and discriminability is high), and marked
underprediction (when base rate is very low and discriminability is low). These variations in
calibration are clearly inconsistent with ecological theories or the presence of an overall
confirmatory bias in favor of the focal hypothesis. Nor are they consistent with the form of the
confirmatory bias explanation that is most common in the medical decision making literature: the
“value-induced bias” or “warning bias” (Edwards & von Winterfeldt, 1986). According to this
account, described by Wallsten (1981), physicians tend to exaggerate the likelihood of very
severe conditions, either because their utilities contaminate their probability estimates, or because
they search for signs of a dangerous condition. This account implies that overprediction should
increase with the severity of the event; in fact, both a very severe negative event (heart attack)
and a positive event (surviving cancer for five years) show moderate overprediction whereas a
rare but relatively mild negative event (streptococcal throat infection) shows gross
overprediction.
The pattern of calibration across studies is also inconsistent with the many accounts that
implicate regular feedback (whether event-based or in terms of probability scoring) as the key to
good calibration (Keren, 1988; Edwards & von Winterfeldt, 1986). Because the physicians in all
studies had clear, unambiguous event-based feedback regarding events that they could not control
(Murphy & Brown, 1994), feedback cannot explain the marked variation in the calibration of
their probability judgments. There is also no clear distinction in terms of quality of calibration
between prognostic (predictive) judgments (where physicians might accept that the events truly
are uncertain) and diagnostic judgments (where the correct answer is at least theoretically
knowable), in contrast to suggestions by Winkler and Poses (1993; see also Wagenaar & Keren,
1985). There is considerable variation in calibration between studies within the category of
prognostic judgments (e.g., between surviving cancer for several years and surviving as an in-
patient in an intensive care ward for a few days or weeks) as well as between studies within the

13
category of diagnostic judgments (e.g., between having streptococcal throat infection and having
a heart attack).
Winkler and Poses (1993) noted that “many factors could have contributed to such differences,
but one that seems to stand out is the base rate.” Consistent with direct support models and more
general heuristic models such as “prediction by evaluation” (Kahneman & Tversky, 1973), the
pattern of overprediction and underprediction is strongly related to the base rate likelihood of the
target events, and to a lesser extent (particularly for the heart attack study) to the discriminability
of the relevant hypotheses. This is exactly what would be expected if the physicians were
reporting the support for the relevant hypotheses with little regard for the base rate likelihood of
the events or the discriminability of the hypotheses.
The outcomes represented in Figure 3 differ in many ways other than base rate and
discriminability. Figure 4, however, displays two calibration curves that are roughly matched for
outcome and discriminability and differ only in time scale and hence base rate of survival. These
data from Poses et al. (1997) represent survival predictions for cardiac patients over a three-
month and one-year period. Although the shorter time frame seems intuitively “easier” to predict
(and indeed yields a slightly higher value of the discriminability index ), consistent with the
direct support account the three-month predictions show a more marked underprediction bias due
to the more extreme base rate (i.e., 81% vs. 59% survival rate).
The direct support account is consistent with the finding that personal experience with a patient
(relative to written descriptions) increased overprediction in diagnosing cardiac failure (Bobbio,
Detrano, Shandling, Ellestad, Clark, Brezden, Abecia, & Martinezcaro, 1992). It is also
consistent with the report that physicians’ judgments of the probability of bacteremia were
correlated with the availability of cases of bacteremia in their memory (Poses & Anthony, 1991).
Both the vivid experience that comes with personal contact with a patient and easily accessible
memories of a given outcome could give rise to stronger impressions of support for a hypothesis.
The apparent neglect of base rate across these studies fits the earlier observation that experienced
physicians (sometimes) and medical students (frequently) neglected the prevalence rate of a
disease when making a diagnosis, and tended to characterize uncertain hypotheses by “50-50”
ratings rather than by their prevalence rate (Wallsten, 1981). Eddy’s (1982) classic report on
probabilistic thinking in medicine also highlighted the many barriers to physicians’ use of base
rate information. It is unlikely that the present findings reflect ignorance on the part of the
physicians as their judgments of prevalence rates have been found to be quite accurate (e.g.,

14
Bobbio, Deorsola, Pistis, Brusca, & Diamond, 1988; Christensen-Szalanski, 1982). For example,
in a study on diagnosis of skull fractures (DeSmet, Fryback, & Thornbury, 1979), physicians’
mean estimate of fracture incidence was 2.2% (with a range from 0 to 10%), when the actual rate
was 2.9%. The results of this study, which was not included in Figure 3 because of space
limitations, show the same dramatic overprediction found by Christensen-Szalanski and
Bushyhead (1981) in their study of pneumonia diagnosis (base rate 3.4%).
Not all instances of base rate effects on calibration represent neglect of known base rates; when
the base rate varies across populations or cohorts, it can be very difficult for a judge to make
appropriate adjustments. For example, Tape, Heckerling, Ornato and Wigdon (1991)
investigated pneumonia diagnoses in three medical centers in different U.S. states. Both the base
rate likelihood of pneumonia and the validity of common diagnostic cues varied markedly in the
three centers. As Yates (1994) noted in his discussion of these data, if the more extreme base
rate in Illinois (11% confirmed cases in the sample) was known and taken into account by the
physicians, these judgments should have been easier than those in Nebraska (32% pneumonia
cases). However, the probability judgments in Illinois showed much more overprediction than
the probability judgments in Nebraska. These data were originally analyzed with the lens model
equations (Hammond, Hursch & Todd, 1964; Tucker, 1964), which do not include base rate
neglect as a possible source of judgmental bias. Stewart and Lusk (1994) have presented a more
inclusive model of forecasting skill that adds base rate bias and regression bias (insufficient
adjustment for low predictability) to the lens model decomposition; this combination of
calibration principles with the lens model approach is highly consistent with the RST approach
we outline here.
In medical settings, it is instructive to consider the patient as an additional source of expert
judgment, one with privileged access to internal states. Two recent studies have compared
physician and patient judgments of survival for patients with metastatic colon and lung cancer
(Weeks, Cook, O’Day, Peterson, Wenger, Reding, Harrell, Kussin, Dawson, Connors, Lynn, &
Phillips, 1998) and for “seriously ill” patients (Arkes, Dawson, Speroff, Harrell, Alzola, Phillips,
Desbiens, Oye, Knaus, Connors, & SUPPORT investigators, 1995). Surviving six months was
considerably less common for the cancer patients (about 45% of whom survived six months) than
for the mixture of seriously ill patients (about 70% of whom survived six months), and in both
cases physicians were moderately good at discriminating those who would survive from those
who would die (’s between .8 and .9, respectively). Thus, the direct support model implies that
the physicians should be well calibrated for the cancer patients, and show distinct
underprediction for the seriously ill patients. This pattern was indeed found, as displayed in

15
Figures 5a and 5b. Also displayed in Figures 5a and 5b are the patients’ self-predictions of
survival. They are notably less discriminating than the physicians’ judgments, and show a
marked positive or “optimistic” bias, which is absent from the physicians’ judgments.
Domain 2: Calibration in Weather Forecasting
The calibration of American meteorologists predicting precipitation (e.g., Murphy & Winkler,
1972) has been described as “superb” (Lichtenstein et al, 1982), “champion” (Edwards & von
Winterfeldt, 1986) and as an “existence proof” of good calibration (Wallsten & Budescu, 1983).
There are at least five non-exclusive explanations for this excellent calibration: the use of
sophisticated computer models and centrally-provided forecasts that allow direct “pattern-
matching” of present cues to past outcomes (e.g., Fischhoff, 1988), the clear and unambiguous
feedback received by the forecasters coupled with their knowledge that they cannot affect the
outcome (Murphy & Winkler, 1984; Keren, 1991), training in probabilistic thinking (Murphy &
Brown, 1984), the explicit presentation of base rates that allow their use as an “anchor” at the
time of prediction, and, consistent with the direct support account, the combination of accurate
cues (i.e., high discrimination) with moderate base rates.
Some historical information casts doubt on the necessary roles of computer models and training
in probabilistic thinking. Murphy and Winkler (1984) present data collected by Hallenback
(1920) on his probabilistic predictions of rain in the Pecos Valley in New Mexico. These
predictions (base rate 42%), based on composite weather maps, show very good calibration, with
only a small tendency towards underprediction in the middle and high ranges. However, they
cannot be described as a triumph of intuitive judgment; they were really a triumph of early
weather technology in the actuarial mode. Hallenback (1920) described a pattern-matching or
“table look-up” strategy in which certain prototypical weather patterns were matched with the
relative frequency of past outcomes: “The basis of this method is a series of composite weather
maps showing the frequency of precipitation, in percentages, with different types of pressure
distribution” (p. 645).
Winkler and Poses (1993) noted that the excellent calibration of modern American weather
forecasters predicting rain may be related to the moderate base rate (about 25% in the Murphy &
Winkler, 1972, analysis mentioned earlier), and contrasted this with the poorer calibration of
weather forecasters predicting extreme storms (base rate 13%). However, they cautioned that the
forecasters also have more experience with forecasting precipitation than forecasting storms. A
closer look at the moderate overprediction of storms indicates an intriguing pattern: “a strong

16
tendency to overforecast existed for the smaller areas and... a tendency to underforecast existed
for the larger areas” (Murphy, 1981, p. 72). That is, when storms are rare (as in smaller forecast
areas) forecasters tend to overuse high probabilities; when storms are more common (as in larger
forecast areas) forecasters tend to underuse high probabilities, consistent with base rate neglect
and the direct support account.
Murphy and Daan (1984) reported another striking finding in their study of Dutch weather
forecasters. The forecasters were given detailed probabilistic feedback based on one year’s worth
of predictions. Data collected during the second year of the study showed that this feedback
served to reduce the overprediction observed in the first year so that the overall calibration curve
(averaged across many prediction events) for the second year followed the identity line fairly
closely. However, as Murphy and Daan (1984) noted, “the amount of overforecasting increases,
in general, as the sample climatological probabilities of the events decrease in both years” (p.
416). Figure 6 displays this pattern for the prediction of various weather events along with the
relevant direct support lines (representing complete neglect of base rates and evidence quality).
Weather events have been categorized in terms of base rate and discriminability as shown in
Table 2.
Consistent with the general predictions of direct support theory, when the meteorological event
was common, calibration was very good, whereas when the event was rare, there was marked
overprediction. Did this occur because the meteorologists were reporting the strength of their
evidence for a given hypothesis without due regard for the base rate, or because the rarer events
were also more severe and meteorologists were determined not to miss them? It is impossible to
rule out the presence of a “warning bias” in this situation, but data from other types of forecasts
seem to cast doubt on this explanation. Much more overprediction is found for predictions of
rainfall greater than 1.4 mm (base rate 9%) than predictions of rainfall greater than .2mm (base
rate 20%), although the former is by no means an extreme amount of rain. Similarly, there is
more overprediction when judges evaluate whether visibility will be less than 4 km (base rate
17%) than when they evaluate whether visibility will be less than 10 km (base rate 44%). In this
case, the “4 km” prediction does not include extreme or dangerous events as these form another
category, visibility less than 1 km (base rate 3%, with extreme overprediction). Although value-
induced or warning biases may add to the tendency for overprediction, the evidence suggests that
the base rate had a substantial and independent effect on miscalibration. Inspection of Figure 6
reveals that the empirical lines are somewhat closer to the line of perfect calibration than the RST
prediction lines; this indicates that the meteorologists were giving more weight to the base rate
than the “neglect” model predicted. As discussed above, this discrepancy from the case-based
17
support model may be a result of the considerable technical information provided to the weather
forecasters or because of their training in statistical models.
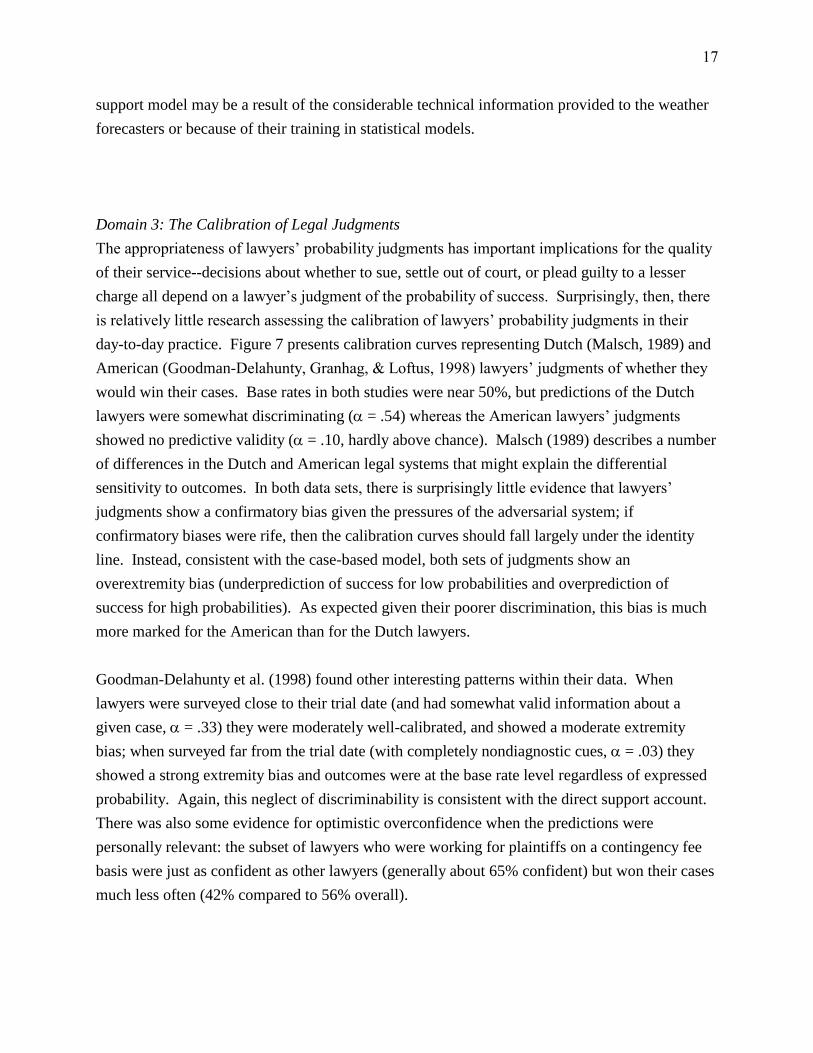
Domain 3: The Calibration of Legal Judgments
The appropriateness of lawyers’ probability judgments has important implications for the quality
of their service--decisions about whether to sue, settle out of court, or plead guilty to a lesser
charge all depend on a lawyer’s judgment of the probability of success. Surprisingly, then, there
is relatively little research assessing the calibration of lawyers’ probability judgments in their
day-to-day practice. Figure 7 presents calibration curves representing Dutch (Malsch, 1989) and
American (Goodman-Delahunty, Granhag, & Loftus, 1998) lawyers’ judgments of whether they
would win their cases. Base rates in both studies were near 50%, but predictions of the Dutch
lawyers were somewhat discriminating ( = .54) whereas the American lawyers’ judgments
showed no predictive validity ( = .10, hardly above chance). Malsch (1989) describes a number
of differences in the Dutch and American legal systems that might explain the differential
sensitivity to outcomes. In both data sets, there is surprisingly little evidence that lawyers’
judgments show a confirmatory bias given the pressures of the adversarial system; if
confirmatory biases were rife, then the calibration curves should fall largely under the identity
line. Instead, consistent with the case-based model, both sets of judgments show an
overextremity bias (underprediction of success for low probabilities and overprediction of
success for high probabilities). As expected given their poorer discrimination, this bias is much
more marked for the American than for the Dutch lawyers.
Goodman-Delahunty et al. (1998) found other interesting patterns within their data. When
lawyers were surveyed close to their trial date (and had somewhat valid information about a
given case, = .33) they were moderately well-calibrated, and showed a moderate extremity
bias; when surveyed far from the trial date (with completely nondiagnostic cues, = .03) they
showed a strong extremity bias and outcomes were at the base rate level regardless of expressed
probability. Again, this neglect of discriminability is consistent with the direct support account.
There was also some evidence for optimistic overconfidence when the predictions were
personally relevant: the subset of lawyers who were working for plaintiffs on a contingency fee
basis were just as confident as other lawyers (generally about 65% confident) but won their cases
much less often (42% compared to 56% overall).
18
Domain 4: Calibration in Business Settings
Indirect evidence implies that optimistic overconfidence, a focal bias towards the desirable
outcome (Kahneman & Lovallo, 1993; Kahneman & Tversky, 1995), may be prevalent in
business settings. Financial forecasts made over the last century have been consistently too
optimistic (Hogarth & Makridakis, 1981). For example, Wall Street analysts expected the
Standard and Poors 500 Index to post average earnings growth of 21.9% per year from 1982 to
1997, whereas actual annual earnings growth averaged 7.6% (Cadsby, 2000). A survey of
macro-economic predictions from 14 OECD countries indicated that industrial firms were
systematically overly optimistic in their production estimates (Madsen, 1994); further analyses
implicated a search for confirming evidence, as it took more and stronger evidence to lead firms
to predict decreased production than increased production. A series of laboratory studies by
Bazerman, Neale and colleagues showed that people in negotiation settings overestimate the
probability their final offer would be accepted and were overly optimistic that a third party would
rule in their favor (Bazerman & Neale, 1982; Neale & Bazerman, 1983; Farber & Bazerman,
1986, 1989). A survey of almost 3000 new business owners revealed that they were
unrealistically optimistic about their own business succeeding (81% probability of success for
their own business vs. 59% probability of businesses like theirs, whereas a realistic estimate is
somewhere in the range of 30-70%, Cooper, Woo, & Dunkelberg, 1988).
Figure 8 displays the calibration of professional American economic forecasters predicting the
likelihood of economic recession at various points in the future. The plot shows an over-
extremity bias that increases with an increasing time frame, as discriminability decreases (Braun
& Yaniv, 1992). When the economists predicted the outcome of the current quarter, they had
valid models and cues with which to work ( = 1.17); however, the base rate of recession was
relatively low (about 20%), and so marked overprediction occurred for subjective probabilities
above .6. As the time horizon increased, the judges moderated the extremeness of their
predictions but not enough to match the declining validity of their models and cues, and so for
forecasts two quarters ahead ( = .58), overprediction was found for subjective probabilities
above .4. When the forecast horizon was four quarters ahead, the judges’ cues and models were
essentially worthless ( 0, indicating no discrimination), and so regardless of the judged
probability of recession (which ranged from 0 to 90%) the observed frequency of recession was
always close to the base rate value. The observed curves are generally consistent with the
predictions of the random support model; however, the observed judgments are markedly higher
(i.e., closer to the line of perfect calibration) than are the direct support lines, implying that the
economists were at least somewhat sensitive to the base rate.

19
There are a number of studies on stock market prediction, although few lend themselves to
calibration analyses. In an analysis of trading at large discount brokerage houses, Odean (1997)
reported a bias towards overtrading, such that purchased stocks underperformed sold stocks,
consistent with optimistic overconfidence in stock choice. In a laboratory study with real-life
information, undergraduate and graduate students in finance courses were asked to predict the
probability that a given stock (earning) would increase by more than 10%, increase by between
5% and 10%, and so on (Yates, McDaniel, & Brown, 1991). The primary finding was the
graduate students (“experts”) were more likely to attend to non-predictive cues and so were more
poorly calibrated than the undergraduate students, who made less extreme and less variable
predictions. In a series of follow-up studies, stock brokers and related financial professionals
predicted changes in the Turkish stock market (Onkal & Muradoglu, 1994); the primary finding
was that calibration became poorer with longer time intervals, and that the relative performance
of experts and semi-experts depended on the time horizon. The bottom line in Figure 9
represents the calibration of Turkish stockbrokers predicting whether the share price of each in a
set of Turkish companies would increase or decrease over a one-week period. Although the
stockbrokers showed some ability to discriminate successful from unsuccessful companies ( =
.45), only 2 of the 22 companies actually increased in price over the target week (presumably a
bear market on the newly deregulated Turkish market) and in the face of this very low base rate
the traders showed a marked overprediction bias.
Domain 5: Calibration in Sports.
In no other domain are predictions more ubiquitous—or arguably less important—than in sports.
Commentators, fans, bookies, and bettors all have a reason for assessing the probability of a win,
the chances of the champion surviving the first round, and the likelihood of setting a new world
record. Sports events have been a major source of data for studies of predictive judgment, but
few of these studies have used expert judges. An exception to this rule is the study of horserace
odds by economists interested in the rationality of the aggregate market. Odds for horse races
shift as a result of the money placed by large numbers of individual investors, so the
unbiasedness of such odds is a test of the rationality of market forces. Many studies have
revealed a small but systematic bias such that posted odds and wagered amounts for favorites
(high probability winners) are too low whereas posted odds and wagered amounts for longshots
(low probability winners) are too high (termed the “favorite-longshot bias” for obvious reasons,
e.g., Snyder, 1978; Thaler & Ziemba, 1988). This has been explained by general risk-seeking in
gamblers (the pleasure of the long-shot) and by loss aversion driving gamblers to try to turn their
losses into gains by a big win. It has even been tied to an “overconfidence” bias, though the
observed pattern is actually one of underextremity.

20
We know of one cross-national study of expert commentators (television and newspaper sports
reporters) that offers a clear test case for the direct support account. Ayton and Onkal (1996)
asked media commentators in England and Turkey to give probabilistic predictions for a set of
football (soccer) Cup Matches in their own countries. The natural target hypothesis is a home
team win. In fact, there was a marked home field advantage in the Turkish cup games and little
home field advantage in the English cup games; in other words, the base rate for a home team
win was high (80%) in Turkey and moderate (close to 50%) in England. The commentators in
both countries were moderately (and equally) good at discriminating between winning and losing
teams ( = 1.07) leading to a situation in which the direct support account implies good
calibration for the English commentators and substantial underprediction for the Turkish
commentators. As the top lines in Figure 9 attest, this pattern emerged very clearly.
Summary of the Data
In all domains of expert judgment surveyed, systematic miscalibration was observed. In each
case, the observed patterns matched the qualitative predictions of the heuristics and biases
perspective, as embodied by the direct support account. Nonetheless, there were notable
differences among the domains in the magnitude of miscalibration, such that the judgments of
experts with the greatest training and technical assistance in statistical modeling (meteorologists
and economists) were less biased than the direct support account predicted. Judgments of
experts with less training in normative judgmental models, such as physicians, stockbrokers, and
sports commentators, were captured well by the direct support account.
Other Stochastic Models
In this section we briefly discuss two additional models of subjective probability calibration that,
like RST, incorporate stochastic components in their attempt to reproduce calibration curves.
With appropriate supplemental assumptions, both models are capable in theory of reproducing
the patterns of miscalibration found in our review of expert judgments. We argue, however, that
in most cases RST offers a more parsimonious account that yields more easily interpreted
parameter values, providing a framework that allows insights into the psychological
underpinnings of miscalibration.
Partition Model.
At the time of the Lichtenstein et al. (1982) review, the only existing model precise enough to be
fit to empirical data was the decision variable partition model (herein the partition model) of

21
Ferrell and McGoey (1980). In the tradition of signal detection theory, this model describes
confidence judgment as a process of partitioning an internal decision variable (which might be
thought of as a feeling of confidence) into confidence categories, which are used in making the
overt judgment or response. The decision variable itself is not scaled in terms of probability;
instead, the judgment is assumed to arise from a partition of some underlying variable. The
model successfully fits calibration curves found in general knowledge tasks, though it should be
noted that in such applications the number of free parameters is relatively high when compared to
the number of data points being fit. Perhaps more impressive is the partition model’s
performance when supplemented by the assumption that the judge’s set of partition cutoffs is
insensitive to changes in task difficulty in the absence of performance feedback (Ferrell &
McGoey, 1980; Smith & Ferrell, 1983; Suantak, Bolger, & Ferrell, 1996). Although there exists,
for any given level of proportion correct, a set of cutoffs that would ensure perfect calibration,
Ferrell and colleagues have found that the miscalibration observed in experimental contexts is
often well accounted for by a single set of cutoffs that is not changed over large variations in task
difficulty. In this sense, the partition model with fixed cutoffs can be seen as a close relative of
RST with fixed extremity and focal bias parameters.
Perhaps the single greatest weakness of the partition model is its agnosticism regarding the
underlying determinants of the unobservable decision variable, that is, the feeling of confidence
upon which the partition is constructed. The model makes no attempt to specify how evidence is
evaluated to arrive at the feeling of confidence, or how the judge goes about partitioning the
resulting decision variable. In this sense, the partition model might be construed rather narrowly
as a model of the response stage of the confidence assessment process, as Ferrell has
acknowledged (e.g., Ferrell, 1994, p. 433). While the partition model typically produces a good
fit to empirical calibration curves (and response proportions), achieving such a fit requires
estimation of a fairly large number of parameters. For example, to fit a full-range calibration
dataset with 11 probability categories (0%, 10%, … , 100%), the partition model requires
discriminability and base rate parameters comparable to those of RST, but in addition requires
estimation of a set of 10 cutoff values, for which RST substitutes only two additional parameters
(extremity and focal bias). Arguably, RST’s parameter values are also more readily interpreted
(e.g., in terms of case- versus class-based reasoning) than those of the partition model.
Error Models.
A number of researchers have considered the consequences of unreliability in confidence
judgments for the assessment of calibration. Erev, Wallsten, and Budescu (1994; also Wallsten
& Budescu, 1983) offered a Thurstonian “true score plus error” model in which an underlying

22
feeling of confidence is subjected to some degree of stochastic variation prior to being translated
into an overt judgment. They assumed, for demonstration purposes, that the underlying “true”
judgment equals the actuarial probability of the event being judged, and investigated how error
due to unreliability affected the resulting calibration analysis. To illustrate, suppose that a
weather forecaster’s true judgment based on a set of forecasting cues is equal to the actual
probability of precipitation given those cues, but that his or her overt judgment is subject to some
error. How does this error influence calibration? Erev et al. (1994; also Budescu, Erev, and
Wallsten, 1997), assuming a particular instantiation of their general model, demonstrated using
simulation data that calibration curves can indicate overextremity even when the confidence
judgments themselves are unbiased estimates of the true probability subject to symmetric error.
This result arises primarily from effects of regression, but may also be enhanced by boundary
effects due to rounding at scale endpoints. Pfeifer (1994) independently developed a very similar
thesis to that of Erev et al. Such error models generally produce greater overextremity as the
degree of error increases, and in this sense can account for the difficulty effect.
The results of Erev et al. can be interpreted in two ways, as a methodological prescription or as a
descriptive model of probability judgment. The methodological prescription highlights the perils
of diagnosing overconfidence on the basis of the calibration curve, since “error alone” can
produce the appearance of overconfidence in such a curve even when underlying “true”
judgments are unbiased. Brenner, Koehler, Liberman, and Tversky (1996) argued that the
standard measure of overconfidence in 2AFC tasks, namely the difference between mean
confidence and overall accuracy, provides an unbiased estimate of aggregate overconfidence
which is not subject to the same kind of regression effect apparent in the calibration curve. In
response to the more general methodological recommendations of Erev et al, Brenner (2000)
raised questions about the appropriateness of evaluating calibration on hard-to-define true scores
rather than well-defined actual judgments.
Budescu, Wallsten, and Au (1997) assess the relative contributions of measurement error and
systematic bias (i.e., over- or underconfidence) to overall miscalibration, using the Wallsten and
González-Vallejo (1994) statement verification model. The reliability of subjective probability
judgments is assessed from replicate judgments and used to estimate the degree of miscalibration
expected on the basis of error alone (i.e., in the absence of systematic bias), which is then used to
construct a less strict standard of “ideal” performance than that which is usually employed, the
identity line of perfect calibration. (Klayman, Soll, González-Vallejo, & Barlas, 1999, offer
another method for separating effects of systematic error and unreliability of judgments.) Using
this method, Budescu, Wallsten, and Au (1997) found substantial overextremity, even after

23
correcting for the unreliability of the assessments, in a full-range task involving the relative
populations of pairs of cities. As a descriptive model, then, the assumption of an unbiased “true
score” subject to error is not a sufficient account of the miscalibration found in this and other
laboratory tasks.
Several researchers (Björkman, 1994; Juslin et al., 1997; Juslin, Wennerholm, & Olsson, 1999;
Soll, 1996) have recently offered modified ecological models in which stochastic error
components have been introduced as a way of improving the fit of such models to actual
calibration data. In such models, the “internal” probability is only an estimate of the
corresponding ecological probability, unbiased but subject to sampling error. Soll (1996), Juslin
et al. (1997), and Budescu, Erev, and Wallsten (1997) have shown, using simulations, that a
modified ecological model incorporating sampling error can produce overconfidence that
increases with task difficulty (as determined by the uncertainty of the environment and the
sample size, i.e., number of available previous cases matching the present one). Soll (1996)
further demonstrated, in a cue-based task somewhat different from the typical calibration
experiment, that subjects appeared to be able to produce unbiased estimates of the ecological
conditional probabilities associated with a set of cues, even though in terms of calibration these
subjects were substantially overconfident.
Sampling error alone, it should be noted, cannot produce underextremity (Juslin et al., 1997, p.
197). Given the number of empirical studies which have reported underconfidence for relatively
easy tasks (e.g., Baranski & Petrusic, 1994; Björkman, Juslin, & Winman, 1993; Brake, Doherty,
& Kleiter, 1997; Griffin & Tversky, 1992; Juslin et al., 1999; Suantak et al., 1996), it is clear that
sampling error, by itself, cannot account for the full range of results from calibration
experiments. Moreover, at a conceptual level, it is not entirely clear what it means to argue that a
judge’s confidence assessments are not systematically biased, but instead merely fail to account
for the uncertainty associated with prediction based on the available evidence. Arguably, it is
precisely such uncertainty which the judge is expected to convey in his or her confidence
assessment. This issue highlights an apparent conflict of goals between proponents of error
models, who are concerned with whether the judge says what she means (i.e., gives a confidence
assessment that properly reflects the corresponding “internal” probability), and the typical
“consumer” of such assessments in everyday life, who is more concerned with whether the judge
means what she says (i.e., gives a confidence assessment that properly reflects the actual
probability of being correct). The consumer of judgments by Soll’s (1996) subjects, for example,
is unlikely to take much comfort in the purported accuracy of these subjects’ underlying

24
judgments upon discovering that when they indicated confidence in the range of 90 to 100%,
they were accurate approximately 60% of the time.
Conclusion
Our survey of the calibration of probabilistic judgments in applied settings has identified the
discriminability of the hypotheses and the base rate likelihood of the outcome as major predictors
of miscalibration in experts’ everyday judgments. Consistent with direct support models and the
partition model—and with the difficulty effect described by Lichtenstein et al—good calibration
is found when discriminability is high and base rates are moderate; overprediction is found when
base rates are low; underprediction is found when base rates are high; and an extremity bias
(what is usually meant by the term “overconfidence”) is found when discriminability is low and
base rates are moderate. Apparently, the prevalence of overprediction and overconfidence in
many domains is not a sign that people are intrinsically biased to give high or extreme
probabilities, but that important domains are marked by low base rates and by relatively non-
diagnostic information (e.g., identification of drug users in transport industries by personal
interviews) (Griffin & Varey, 1996).
The observed pattern of miscalibration in expert judgment is consistent with the predictions of
the case-based direct support models derived from the literature on judgmental heuristics. Other
models fared less well. Contrary to the predictions of ecological models, expert judgments
exhibited systematic miscalibration despite representative sampling of judgment items. In the
expert data sets we examined, there is little or no indication of a general bias in favor of the focal
hypothesis, as implied by the confirmatory bias model. In particular, there was little evidence of
optimistic bias in these data sets. Note, however, that most of the judgments were generally not
self-relevant. When the issues were extremely self-relevant, such as the patients’ predictions of
their own survival, there was considerable optimistic bias shown. Apparently, an optimistic bias
can sometimes contribute to but is not a necessary condition for miscalibration of subjective
probability. Other stochastic models, like RST, might be able to reproduce the pattern of
miscalibration in expert judgments that we described (or any other pattern), with appropriate
supplemental assumptions. We find the general framework of support theory in which RST is
based, however, to provide a useful and psychologically plausible interpretation of the patterns
that we found: Assessments of probability typically reflect a direct translation of the support
provided by the evidence for the target hypotheses, with little regard to the reliability of the
evidence or the base rate of the outcome.

25
The identification of subjective probability with psychological support or strength of evidence
gives rise to two very different reactions. According to some scholars, personal or subjective
probabilities are of little interest because they do not reflect the way that people naturally process
uncertainty (which is presumed to be through frequency counts, Gigerenzer, 1994). A second
approach is to accept that subjective probabilities are not only natural, but inescapable. A
historical review of the use of concepts related to “chance” in English literature noted that “With
one exception, all quotations found…are subjective probabilities. They all are expressions of
degrees of belief, at least in a poetic sense, that an event will happen” (Bellhouse and Franklin,
1997, p. 80). Consider the following statement, taken from a recent financial column: “Three
months ago, I might have put the risk of an Asia-wide credit crunch...at less than 10 per cent,
now I’d say it is approaching 30 to 40 percent”. How can this statement about a unique, not to
say unprecedented, event be reworded in frequency terms?
Our guess is that there will always be judgments made in terms of subjective probability or odds
about unique events, and many such judgments, even by experts, will fail the test of
correspondence. Accepting this, these results imply that training in probability and statistics, and
in particular, training in the distinction between intuitive support and extensional probability, is
essential to improve judgmental calibration in applied fields (see Stewart & Lusk, 1994, for one
useful categorization of the skills needed for proper calibration). The attainment of expertise
may sometimes imply good discrimination, but it rarely ensures good calibration.

26
References
Arkes, H.R., Dawson, N.V., Speroff, T., Harrell, F.E. Jr., Alzola, C., Phillips, R., Desbiens, N.,
Oye, R.K., Knaus, W., Connors, A.F. Jr. and the SUPPORT Investigators (1995). The
covariance decomposition of the probability score and its use in evaluating prognostic
estimates. Medical Decision Making, 15, 120-31.
Ayton, P. (1992). On the competence and incompetence of experts. In G. Wright. &
F. Bolger (Eds.), Expertise and decision support, (pp. 77-105). Plenum Press, New
York.
Ayton, P. & Önkal, D. (1996). Effects of Expertise on Forecasts and Confidence in
Forecast. Paper presented at the International Symposium on Forecasting, Istanbul,
Turkey.
Baranski, J.V., & Petrusic, W.M. (1994). The calibration and resolution of confidence in
perceptual judgments. Perception and Psychophysics, 55, 412-428.
Baron, J. (1998). Judgment misguided: Intuition and error in public decision making.
New York: Oxford University Press.
Bazerman, M. H., & Neale, M. A. (1982). Improving negotiation effectiveness under final offer
arbitration: The role of selection and training. Journal of Applied Psychology, 67, 543-548.
Bellhouse, D.R. and Franklin, J. (1997). The language of chance. International Statistical
Review, 65(1), 73-85.
Björkman, M. (1994). Internal cue theory: Calibration and resolution of confidence
in general knowledge. Organizational Behavior and Human Decision
Processes, 58, 386-405.
Björkman, M., Juslin, P., & Winman, A. (1993). Realism of confidence in sensory

27
discrimination: The underconfidence phenomenon. Perception and Psychophysics, 54, 75-81.
Bobbio M., Deorsola A., Pistis G., Brusca A., & Diamond G.A. (1988). Physician perception of
exercise electrocardiography as a prognostic test after acute myocardial infarction. American
Journal of Cardiology, 62, 675-8.
Bobbio, M., Detrano, R., Shandling, A.H., Ellestad, M.H., Clark, J., Brezden, O., Abecia, A., &
Martinezcaro, D. (1992). Clinical Assessment of the Probability of Coronary-Artery Disease –
Judgmental Bias From Personal Knowledge. Medical Decision Making, 12, 197-203.
Brake, G.L., Doherty, M.E., & Kleiter, G.D. (1997). A Brunswikian approach to calibration of
subjective probabilities. Unpublished manuscript, Bowling Green State University.
Braun, P.A. & Yaniv, I. (1992). A case study of expert judgment: Economists probabilities
versus base-rate model forecasts. Journal of Behavioral Decision Making, 5, 217-231.
Brenner, L.A. (1995). A stochastic model of the calibration of subjective probabilities.
Unpublished doctoral dissertation, Stanford University.
Brenner, L.A. (2000). Should observed overconfidence be dismissed as a statistical artifact?
Critique of Erev, Wallsten, and Budescu (1994). Psychological Review,
107(4), 943-946.
Brenner, L. A., Koehler, D. J., Liberman, V., & Tversky, A. (1996). Overconfidence in
probability and frequency judgments: A critical examination. Organizational Behavior
Brunswik, E. (1943). Organismic achievement and environmental probability. Psychological
Review, 50, 255-272.
Brunswik, E. (1955). Representative design and probabilistic theory in a functional psychology.
Psychological Review, 62, 193-217.

28
Budescu, D.V., Erev, I., & Wallsten, T.S. (1997). On the importance of random error in the
study of probability judgment. Part I: New theoretical developments. Journal of Behavioral
Decision Making, 10, 157-171.
Budescu, D.V., Wallsten, T.S., & Au, W.T. (1997). On the importance of random error in the
study of probability judgment. Part II: Applying the stochastic judgment model to detect
systematic trends. Journal of Behavioral Decision Making, 10, 173-188.
Casby, T. (2000). The ten biggest investment mistakes Canadians make and how to avoid them.
Toronto: Stoddart.
Centor, R.M., Dalton, H.P., & Yates, J.F. (1984). Are physicians’ probability estimates better or
worse than regression model estimates? Paper presented at the Sixth Annual Meeting of the
Society for Medical Decision Making, Bethesda, MD.
Chase, W. G., & Simon, H. A. (1973). Perception in chess. Cognitive Psychology, 4, 55-81.
Christensen-Szalanski, J.J.J., and Beach, L.R. (1982). Experience and the Base-rate Fallacy.
Organizational Behavior and Human Performance, 29, 270-278.
Christensen-Szalanski, J.J.J., and Bushyhead, J.B. (1981). Physicians' Use of Probabilistic
Information in a Real Clinical Setting. Journal of Experimental Psychology: Human
Perception and Performance, 7, 928-935.
Cooke, R. M. (1991). Experts in Uncertainty. New York: Oxford University Press.
Cooper, A., Woo, C., & Dunkelberg, W. (1988). Entrepreneurs’ perceived chances for success.
Journal of Business Venturing, 3, 97-108.
Dawson, S. (1993). Decision-Making and Leadership: Heller, F. Journal of Management Studies,
30(3), 479-481.
DeSmet A.A., Fryback D.G., & Thornbury J.R. (1979). A second look at the utility of
radiographic skull examination for trauma. American Journal of Roentgenology,132(1):95-9.

29
Eddy, D. M. (1982). Probabilistic reasoning in clinical medicine: Problems and opportunities. In
D. Kahneman, P. Slovic & A. Tversky (Eds.), Judgment under uncertainty: Heuristics and
biases (pp. 249-267). Cambridge: Cambridge University Press.
Edwards, W. and von Winterfeldt, D. (1986). Cognitive illusions and their implications for the
law. Southern California Law Review, 59, 225-276.
Erev, I., Wallsten, T.S., & Budescu, D.V. (1994). Simultaneous over and underconfidence: The
role of error in judgment processes. Psychological Review, 101, 519-527.
Farber, H.S., & Bazerman, M.H. (1986). The General Basis of Arbitrator Behavior: An Empirical
Analysis of Conventional and Final Offer Arbitration. Econometrica, 54, 1503-1528.
Farber, H.S., & Bazerman, M.H. (1989). Divergent Expectations as a Cause of Disagreement in
Bargaining: Evidence from a Comparison of Arbitration Schemes. Quarterly Journal of
Economics, 104, 99-120.
Ferrell, W.R. (1994). Discrete subjective probabilities and decision analysis: Elicitation,
calibration, and combination. In G. Wright and P. Ayton (Eds.), Subjective probability (pp.
411-451). Chichester: Wiley.
Ferrell, W.R., & McGoey, P.J. (1980). A model of calibration for subjective probabilities.
Organizational Behavior and Human Performance, 26, 32-53.
Fischhoff, B. (1988). Judgment and decision making. In R. Sternberg & E. E. Smith, (Eds.), The
psychology of human thought. New York: Cambridge University Press.
Fischhoff, B. & MacGregor, D. (1982). Subjective confidence in forecasts. Journal of
Forecasting, 1, 155-172.
Gigerenzer, G. (1994). Why the distinction between single-event probabilities and frequencies is
important for psychology (and vice versa). In G. Wright and P. Ayton (Eds.), Subjective
probability (pp. 129-161). Chichester: Wiley.

30
Gigerenzer, G., Hoffrage, U., & Kleinbölting, H. (1991). Probabilistic mental models: A
Brunswikian theory of confidence. Psychological Review, 98, 506-528.
Glaser, R. (1990). Expertise. In M. W. Eysenk, A. N. Ellis, E. Hunt, & P. Johnson-Laird (Eds.),
The Blackwell dictionary of cognitive psychology. Oxford, England: Blackwell Reference.
Goodman-Delahunty, J., Granhag, P.A. & Loftus, E.F. (1998). How well can lawyers
predict their chances of success? Manuscript submitted for publication.
Griffin, D., Gonzalez, R., & Varey, C. (2000). The heuristics and bias approach to judgment
under uncertainty. In A. Tesser & N. Schwarz (Eds.), Blackwell handbook of social
psychology, Vol 1: Intraindividual processes. Oxford, UK: Blackwell.
Griffin, D., & Tversky, A. (1992). The weighing of evidence and the determinants of confidence.
Cognitive Psychology, 24, 411-435.
Griffin, D., & Varey, C. (1996). Towards a consensus on overconfidence. Organizational
Behavior and Human Decision Processes, 65, 227-231.
Hallenback, C. (1920). Forecasting precipitation in percentages of probability. Monthly Weather
Review, 645-647.
Hammond (1996). Human Judgment and Social Policy: Irreducible Uncertainty,
Inevitable Error, Unavoidable Injustice. New York: Oxford.
Hammond, K., Hursch, C., and Todd, F. (1964). Analyzing the components of
Clinical Inference. Psychological Review, 71, 438.
Harvey, L.O., Jr., Hammond, K.R., Lusk, C.M., & Mross, E.F. (1992). Application of signal
detection theory to weather forecasting behavior. Monthly Weather Review, 120, 863-883.
Hoch, S. J. (1985). Counterfactual reasoning and accuracy in predicting personal events. Journal
of Experimental Psychology: Learning, Memory, and Cognition, 11, 719-731.

31
Hogarth, R. & Makridakis, S. (1981). Beyond discrete biases: Functional and dysfunctional
aspect of judgmental heuristics. Psychology Bulletin, 90, 115-137.
Juslin, P. (1994). The overconfidence phenomenon as a consequence of informal experimenter
guided selection of almanac items. Organizational Behavior and Human Decision Processes,
57, 226-246.
Juslin, P., Olsson, H., & Björkman, M. (1997). Brunswikian and Thurstonian origins of bias in
probability assessment: On the interpretation of stochastic components of judgment. Journal
of Behavioral Decision Making, 10, 189-209.
Juslin, P., Wennerholm, P., & Olsson, H. (1999). Format dependence in subjective probability
calibration. Journal of Experimental Psychology: Learning, Memory, and Cognition, 25,
1038-1052.
Kahneman, D. and Lovallo, D. (1993) Timid choices and bold forecasts. A cognitive perspective
on risk taking. Management Science, 39, 17-31.
Kahneman, D., & Tversky, A. (1973). On the psychology of prediction. Psychological Review,
80, 237-251.
Kahneman, D., & Tversky, A. (1995). Conflict resolution: A cognitive perspective. In K. Arrow
et al. (Eds.), Barriers to Conflict Resolution, Chapter 3. New York: Norton.
Keren, G. (1987). Facing uncertainty in the game of Bridge: a calibration study. Organizational
Behavior and Human Decision Processes, 39(8), 98-114.
Keren, G. (1988). On the ability of monitoring non-veridical perceptions and uncertain
knowledge: Some calibration studies. Acta Psychologica, 67(2), 95-119.
Keren, G. (1991). Calibration and probability judgments: Conceptual and methodological issues.
Acta Psychologica, 77, 217-273.
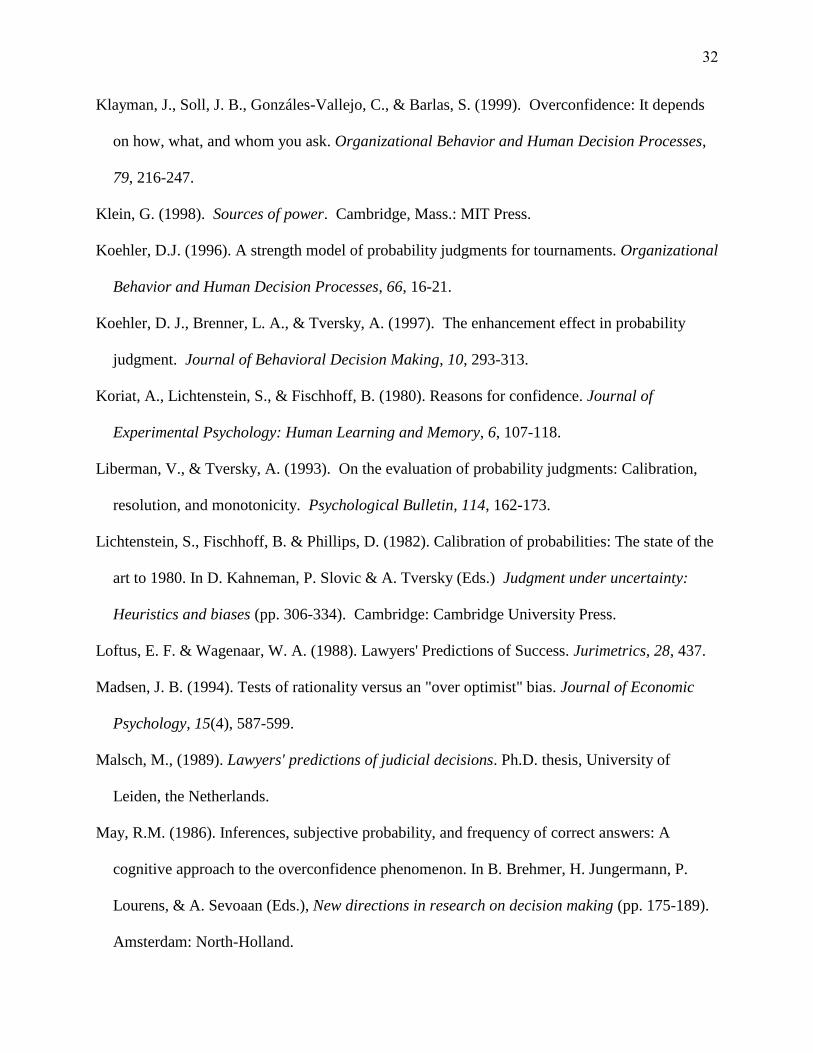
32
Klayman, J., Soll, J. B., Gonzáles-Vallejo, C., & Barlas, S. (1999). Overconfidence: It depends
on how, what, and whom you ask. Organizational Behavior and Human Decision Processes,
79, 216-247.
Klein, G. (1998). Sources of power. Cambridge, Mass.: MIT Press.
Koehler, D.J. (1996). A strength model of probability judgments for tournaments. Organizational
Behavior and Human Decision Processes, 66, 16-21.
Koehler, D. J., Brenner, L. A., & Tversky, A. (1997). The enhancement effect in probability
judgment. Journal of Behavioral Decision Making, 10, 293-313.
Koriat, A., Lichtenstein, S., & Fischhoff, B. (1980). Reasons for confidence. Journal of
Experimental Psychology: Human Learning and Memory, 6, 107-118.
Liberman, V., & Tversky, A. (1993). On the evaluation of probability judgments: Calibration,
resolution, and monotonicity. Psychological Bulletin, 114, 162-173.
Lichtenstein, S., Fischhoff, B. & Phillips, D. (1982). Calibration of probabilities: The state of the
art to 1980. In D. Kahneman, P. Slovic & A. Tversky (Eds.) Judgment under uncertainty:
Heuristics and biases (pp. 306-334). Cambridge: Cambridge University Press.
Loftus, E. F. & Wagenaar, W. A. (1988). Lawyers' Predictions of Success. Jurimetrics, 28, 437.
Madsen, J. B. (1994). Tests of rationality versus an "over optimist" bias. Journal of Economic
Psychology, 15(4), 587-599.
Malsch, M., (1989). Lawyers' predictions of judicial decisions. Ph.D. thesis, University of
Leiden, the Netherlands.
May, R.M. (1986). Inferences, subjective probability, and frequency of correct answers: A
cognitive approach to the overconfidence phenomenon. In B. Brehmer, H. Jungermann, P.
Lourens, & A. Sevoaan (Eds.), New directions in research on decision making (pp. 175-189).
Amsterdam: North-Holland.

33
Murphy, A. H. (1981). Subjective quantification of uncertainty in weather forecasts in the United
States. Meteorolgische Rudschau, 34, 65-77.
Murphy, A. H., and Brown, B. G. (1984). A comparative evaluation of objective and subjective
weather forecasts in the United States. Journal of Forecasting, 3, 369-393.
Murphy, A. H., and Daan, H. (1984). Impacts of feedback and experience on the quality of
subjective probability forecasts: Comparison of results from the first and second years of the
Zierikzee experiment. Monthly Weather Review, 112, 413-423.
Murphy, A.H., and Winkler, R.L. (1977). Can weather forecasters formulate reliable
probability forecasts of precipitation and temperature? National Weather
Digest, 2, 2-9.
Murphy, A. H., and Winkler, R. L. (1984). Probability forecasting in meteorology. Journal of the
American Statistical Association, 79, 489-500.
Murphy, A. H., & Winkler, R. L. (1992). Diagnostic verification of probability forecasts.
International Journal of Forecasting, 7, 435-455.
Neale, M. A., & Bazerman, M. H. (1983). The effect of perspective taking ability under alternate
forms of of arbitration on the negotiation process. Industrial and Labor Relations Review, 36,
378-388.
Nelson, T., Leonesio, R., Landwehr, R., & Narens, L. (1986). A comparison of three predictors
of an individual's memory performance: The individual's feeling of knowing vs. the normative
feeling of knowing vs. base-rate item difficulty. Journal of Experimental Psychology:
Learning, Memory & Cognition, 21, 279-287.
Novemsky, N., & Kronzon, S. (1999). How are base-rates used, when they are used: A
comparison of additive and Bayesian models of base-rate use. Journal of Behavioral Decision
Making, 12, 55-69.

34
Odean, T. (1998). Are Investors Reluctant to Realize Their Losses? Journal of Finance, 53(5),
1775-98.
Onkal, D. and Muradoglu, G. (1994). Evaluating probabilistic forecasts of stock prices in a
developing stock market. European Journal of Operational Research, 74, 350-358.
Paese, P. W., & Sniezek, J. A. (1991). Influences on the appropriateness of confidence in
judgment: Practice, effort, information, and decision-making. Organizational Behavior and
Human Decision Processes, 48, 100-130.
Pfeifer, P.E. (1994). Are we overconfident in the belief that probability forecasters are
overconfident? Organizational Behavior and Human Decision Processes, 58, 203-213.
Poses, R.M. & Anthony, M. (1991). Availability, wishful thinking, and physicians' diagnostic
judgments for patients with suspected bacteremia. Medical Decision Making, 11, 159-168.
Poses, R.M.; Smith, Wally R.; McClish, D.K.; Huber, E.C.; Clemo, F.L..W.; Schmitt, B.P.;
Alexander-Forti, D.; Racht, E.M.; Colenda, C.C. III & Centor, R.M. (1997). Physicians'
survival predictions for patients with acute congestive heart failure. Archives of International
Medicine, 157, 1001-1007.
Rottenstreich, Y., & Tversky, A. (1997). Unpacking, repacking, and anchoring: Advances in
support theory. Psychological Review, 104, 406-415.
Schneider, S.L. (1995). Item difficulty, discrimination, and the confidence-frequency effect in a
categorical judgment task. Organizational Behavior and Human Decision Processes, 61, 148-
167.
Schwarz, S. & Griffin, T. (1986). Medical thinking: The psychology of medical judgment and
decision making. New York: Springer Verlag.
Shanteau, J. (1999). Decision making by experts: The GNAHM effect. In J. Shanteau, B.
Mellers, & D. Schum (Eds.), Decision research from Bayesian approaches to normative

35
systems: Reflections on the contributions of Ward Edwards. Norwell, MA: Kluwer Academic
Publishers.
Simon, H.A. (1979). Models of Thought (Volume I). New Haven: Yale University Press.
Smith, J. F., & Kida, T. (1991). Heuristics and biases: Expertise and task realism in auditing.
Psychological Bulletin, 109, 472-489.
Smith, M., & Ferrell, W.R. (1983). The effect of base rate on calibration of subjective probability
for true-false questions: Model and experiment. In P. Humphreys, O. Svenson, & A. Vari
(Eds.), Analyzing and aiding decisions. Amsterdam: North-Holland.
Sniezek, J.A., Paese, P.W., & Switzer, F.S. (1990). The effect of choosing on confidence in
choice. Organizational Behavior and Human Decision Processes, 46, 264-282.
Snyder,W (1978) Horse Racing: Testing the Efficient Markets Model. Journal of Finance, 33(4).
Soll, J.B. (1996). Determinants of overconfidence and miscalibration: The roles of random error
and ecological structure. Organizational Behavior and Human Decision Processes, 65, 117-
137.
Stewart, T. R. and Lusk, C. M. (1994). Seven components of judgmental forecasting skill:
Implications for research and the improvement of forecasts. Journal of Forecasting, 13, 575-
599.
Stewart, T. R., Roebber, P. J. and Bosart, L. F. (1997). The importance of the task in analyzing
expert judgment. Organizational Behavior and Human Decision Processes, 69, 205-219.
Suantak, L., Bolger, F., & Ferrell, W.R. (1996). The hard-easy effect in subjective probability
calibration. Organizational Behavior and Human Decision Processes, 67, 201-221.
Tanner, W. P. Jr., & Swets, J. A. (1954). A decision-making theory of visual detection.
Psychological Review, 61, 401-409.

36
Tape, T. G., Heckerling, P. S., Ornato, J. P., and Wigton, R. S. (1991). Use of clinical judgment
analysis to explain regional variations in physicians' accuracies in diagnosing pneumonia.
Medical Decision Making, 11, 189-197.
Taylor, S. E. & Brown, J. D. (1988). Illusion and well- being: A social psychological perspective
on mental health. Psychological Bulletin, 103, 193-210.
Thaler, R. H. and Ziemba, W. T. (1988). Parimutural Betting Markets: Racetracks and Lotteries.
Journal of Economic Perspectives 2(2):161-174.
Tucker, L. R. (1964). A suggested alternative formulation in the developments by Hursch,
Hammond, and Hursch, and by Hammond, Hursch, and Todd. Psychological Review, 71(6),
528-530.
Tversky, A., & Kahneman, D. (1982). Evidential impact of base rates. In D. Kahneman, P. Slovic
& A. Tversky (Eds.) Judgment under uncertainty: Heuristics and biases (pp. 153-160).
Cambridge: Cambridge University Press.
Tversky, A., & Koehler, D.J. (1994). Support theory: A nonextensional representation of
subjective probability. Psychological Review, 101, 547-567.
Varey, C. A., Griffin, D. W, & James, M. (1998) The Effect of Context on Confidence.
Unpublished Manuscript, University of Sussex.
Wagenaar, W.A. & Keren, G.B. (1985). Calibration of probability assessments by professional
blackjack dealers, statistical experts, and lay people. Organizational Behavior and Human
Decision Processes, 36, 406-416.
Wagenaar, W. A., & Keren, G. B. (1986). Does the Expert Know? The reliability of predictions
and confidence ratings of experts. In E. Hollnagel, G. Manici, & D. D. Woods (Eds.),
Intelligent Decision Support in Process Environments (pp. 87-103). Berlin: Springer-Verlag.

37
Wallsten, T. S. (1981). Physician and medical student bias in evaluating diagnostic information.
Medical Decision Making, 1, 145-164.
Wallsten, T. S., & Budescu, D.V. (1983). Encoding subjective probabilities: A psychological and
psychometric review. Management Science, 29, 151-173.
Wallsten, T. S., & Gonzáles-Vallejo, C. (1994). Statement verification: A stochastic model of
judgment and response. Psychological Review, 101, 490-504.
Weeks, J.C.; Cook, E.F.; O'Day, S.J.; Peterson, L.M.; Wenger, N.; Reding, D.; Harrell, F.E.;
Kussin, P.; Dawson, N.V.; Connors, A.F., Jr.; Lynn, J.; Phillips, R.S. (1998). Relationship
between cancer patients' predictions of prognosis and their treatment preferences. Journal of
the American Medical Association, 279, 1709-1714.
Winkler, R.L. and Poses, R.M. (1993). Evaluating and combining physicians' probabilities of
survival in an intensive care unit. Management Science, 39, 1526-43.
Yates, J.F. (Ed.). (1992) Risk-taking behavior. Chichester, England: Wiley.
Yates, J. F. (1994). Subjective probability accuracy analysis. In G. Wright & P. Ayton (Eds.),
Subjective probability (pp. 381-410). Chichester, England: Wiley.
Yates JF & Curley SP. (1985). Conditional distribution analyses of probabilistic forecasts.
Journal of Forecasting, 4, 61-73.
Yates, J. F., McDaniel, L.S., & Brown, E. S. (1991). Probabalistic forecasts of stock prices and
earnings: The hazards of nascent expertise. Organizational Behavior and Human Decision
Processes, 49, 60-79.

Table 1
Target event description, baserate (BR), and discriminability () for medical calibration studies
depicted in Figure 3.
––––––––––––––––––––––––––––––––––––––––––––––––––––––––––––––––––––––––––––––
study target event BR
––––––––––––––––––––––––––––––––––––––––––––––––––––––––––––––––––––––––––––––
low D, very low BR
Christensen-Szalanski & Bushyhead (1981) pneumonia 2.7% 0.23*
Poses, Cebul, Collins, & Fager (1985) streptococcal pharyngitis 4.9% 0.33*
Poses & Anthony (1991) bacteremia 7.9% 0.50
high D, low BR
Tierney et al. (1986) myocardial infarction 12% 1.13
Centor, Dalton & Yates (1994) streptococcal throat infection 25% 1.04
Mackillop & Quirt (1997) cancer survival 28% 1.34
high D, high BR
McClish & Powell (1989) ICU survival 75% 1.23
Poses et al. (1990) ICU survival 77% 1.04
Detsky et al. (1981) ICU survival 91% 1.04*
––––––––––––––––––––––––––––––––––––––––––––––––––––––––––––––––––––––––––––––
* Value of discriminability parameter for these studies were computed based on relevant values
estimated from published graphs, as the necessary values were not explicitly provided in the
source article.
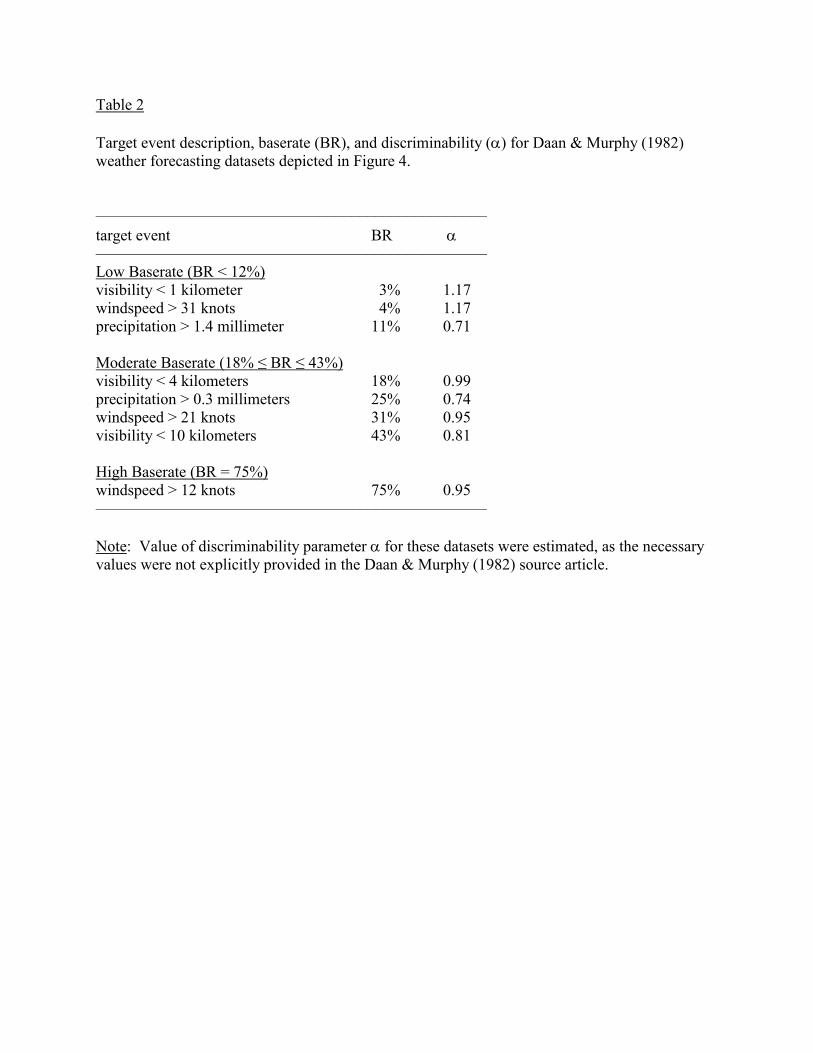
Table 2
Target event description, baserate (BR), and discriminability () for Daan & Murphy (1982)
weather forecasting datasets depicted in Figure 4.
–––––––––––––––––––––––––––––––––––––––––––––––––
target event BR
–––––––––––––––––––––––––––––––––––––––––––––––––
Low Baserate (BR < 12%)
visibility < 1 kilometer 3% 1.17
windspeed > 31 knots 4% 1.17
precipitation > 1.4 millimeter 11% 0.71
Moderate Baserate (18% ≤ BR ≤ 43%)
visibility < 4 kilometers 18% 0.99
precipitation > 0.3 millimeters 25% 0.74
windspeed > 21 knots 31% 0.95
visibility < 10 kilometers 43% 0.81
High Baserate (BR = 75%)
windspeed > 12 knots 75% 0.95
–––––––––––––––––––––––––––––––––––––––––––––––––
Note: Value of discriminability parameter for these datasets were estimated, as the necessary
values were not explicitly provided in the Daan & Murphy (1982) source article.

Figure 1
Calibration curves, generated by RST simulations, illustrating distinction between miscalibration
due to consistent overprediction (or underprediction) of target event probability versus that due to
judgments which are overly (or insufficiently) extreme.
Note: Neglect model predictions based on RST simulation assuming no focal bias ( = 0) and
fixed judgmental extremity ( = 1). Over/underprediction curves constructed assuming fixed
discriminability ( = 1) with varying target event base rate (BR = 20% for overestimation; BR =
80% for underestimation). Over/underextremity curves constructed assuming fixed base rate
(BR = 50%) with varying discriminability ( = 2.0 for overextremity; = 0.5 for
underextremity).

Figure 2
Confidence as predicted by normalized direct ratings of support, for basketball game predictions
(Koehler, 1996; Tversky & Koehler, 1994) and general knowledge questions (Varey, Griffin, &
James, 1998).
Note: Basketball data compares mean judged probability assigned to predicted winning team
(inferred from full-range probability assigned to home team) with normalized direct ratings of
“team strength” obtained from the same group of subjects. General knowledge data compares
mean confidence in selected 2AFC answer with direct ratings of “proportion of evidence”
supporting chosen alternative obtained from a separate group of subjects.

Figure 3
Physicians. Calibration of physicians’ judgments, represented by circle (very low BR), square
(low BR), and triangle points (high BR), compared with predictions of neglect model. See Table
1 for details of these studies.
Note: Neglect model predictions based on RST simulation assuming no focal bias ( = 0) and
fixed judgmental extremity ( = 1). Discriminability (D) and base rate (BR) are approximately
matched to the empirical datasets as follows: For low D, = 0.7; for high D, = 1.0; very low
BR = 5%; low BR = 30%; and high BR = 80%.

Figure 4
Physicians. Calibration curves for heart patient survival predictions reported by Poses et al.
(1997) compared with predictions of neglect model. Triangles represent 90-day (BR = 81%)
prognoses; squares represent 1-year (BR = 64%) prognoses.
Note: Neglect model predictions based on RST simulation assuming no focal bias ( = 0) and
fixed judgmental extremity ( = 1). Discriminability ( = 0.41 for 90-day prognoses and 0.33 for
1-year prognoses) and base rate are matched to values reported by Poses et al. (1997).

Figure 5a
Physicians and patients. Calibration curves from Weeks et al. (1998) study of yoked patient
(circles) and physician (squares) predictions of patient survival (BR = 44.7%), compared with
neglect model predictions.
Note: Neglect model predictions based on RST simulations with fixed judgmental extremity
( = 1). Discriminability ( = 0.82 for physicians and = 0.57 for patients) and base rate are
matched to values reported by Weeks et al. (1998), assuming positive (“optimistic”) focal bias
( = 2) for patients but not for physicians ( = 0).

Figure 5b
Physicians and patients. Calibration curves from Arkes et al. (1995) study of yoked patient
(circles) and physician (squares) predictions of patient survival (BR = 70%), compared with
neglect model predictions.
Note: Neglect model predictions based on RST simulations with fixed judgmental extremity
( = 1). Discriminability ( = 0.87 for physicians and = 0.22 for patients) and base rate are
matched to values reported by Arkes et al. (1995), assuming positive (“optimistic”) focal bias (
= 2) for patients but not for physicians ( = 0).

Figure 6
Meteorologists. Calibration of weather forecasts in Daan & Murphy (1982) study, represented by
circles (very low BR), squares (low BR), and triangles (high BR), compared with predictions of
neglect model (derived from RST simulations). See Table 2 for details of these forecasts.
Note: Neglect model predictions based on RST simulation assuming no focal bias ( = 0) and
fixed judgmental extremity ( = 1). Discriminability (D) and base rate (BR) is matched to
average values from the Daan & Murphy (1982) study, with = 1.19, 0.86, and 0.96 in the very
low (BR = 6%), low (BR = 29%), and high (BR = 75%) base rate conditions, respectively.

Figure 7
Lawyers. Calibration curves from Dutch lawyers (Malsch, 1989; represented by circles) and
American lawyers (Goodman-Delahunty et al., 1998; represented by triangles), compared with
predictions of neglect model.
Note: Neglect model predictions based on RST simulations assuming no focal bias ( = 0) and
fixed judgmental extremity ( = 1). Discriminability and base rate (BR) are matched to values
from original studies, with = 0.54 and BR = 47.5% for Malsch (1989), and = 0.15 and BR =
56% for Goodman-Delahunty et al. (1998). Neglect model curves are truncated for purposes of
presentation.

Figure 8
Economists. Calibration of economists’ forecasts of recession (i.e., decrease in real gross
national product) at varying forecast horizons of one to four quarters beyond time of prediction
(Q0 to Q3, respectively; Braun & Yaniv, 1992), compared with predictions of neglect model.
Note: Neglect model predictions based on RST simulations assuming no focal bias ( = 0) and
fixed judgmental extremity ( = 1), assuming that discriminability decreases at longer forecast
horizons ( = 1, 0.7, 0.4, and 0.1 for Q0 to Q3, respectively). Accuracy values of calibration
curves estimated from Exhibit 1 of Braun and Yaniv (1992); data points representing 20 or fewer
observations have been excluded, and neglect model curves truncated accordingly. Base rate line
indicates approximate historical base rate probability of recession from 1947 to the time the
forecasts were made (see Braun & Yaniv, 1992, pp. 224-227).

Figure 9
Sportswriters and stockbrokers. Calibration curves from Onkal and Ayton (1997) study of
sportswriters predicting winners in upcoming English (moderate BR, represented by circles) and
Turkish (high BR, represented by triangles) football (soccer) games, and from Onkal and
Muradogui (1996) study of expert stock market predictions (very low BR, represented by
squares), compared with neglect model predictions.
Note: Neglect model predictions based on RST simulations assuming no focal bias ( = 0) and
fixed judgmental extremity ( = 1). Base rate values for soccer predictions matched to those
reported by Onkal and Ayton (1997) for English (BR = 56%) and Turkish (BR = 83%) games,
assuming common discriminability ( = 1.07). Base rate (BR = 3%) and discriminability ( =
0.45) for stock predictions matched to data reported by Onkal and Muradogiu (1996).