Embed Size (px)
Citation preview
for internal use only
Beverly Hirtle, Federal Reserve Bank of New York
(joint work with James Vickery, Anna Kovner and
Meru Bhanot)
Federal Reserve in the 21st Century Symposium
March 24, 2015
The Capital and Loss Assessment Under Stress
Scenarios (CLASS) Model
The views expressed in this presentation are those of the speaker and do not
necessarily represent the views of the Federal Reserve Bank of New York or the
Federal Reserve System.
2
Measuring systemic risk using top-down stress testing models
Supervisory stress testing on the rise as a financial stability tool:
DFAST/CCAR stress testing framework in US
EBA EU-wide stress tests in Europe
Prudential Regulatory Authority stress testing in UK
Also an increasing number of simpler “top-down” stress testing models
developed by academics and policy researchers.
Today:
1. Outline one such framework: the Capital and Loss Assessment
under Stress Scenarios (CLASS) model.
2. Use CLASS to study evolution of the “capital vulnerability” of US
banking system over time, as well as variation across firms.
3 for internal use only
Background: Supervisory Stress Testing

4
In banking, “capital” refers to common and preferred equity and (sometimes) long-term subordinated debt
Key function is that capital can absorb losses and protect the bank from failure A bank is (technically) solvent as long as capital (common equity) is positive
Same as for other firms, but particularly important in banking due to high leverage
“Failure” when equity gets too small for creditors and counterparties to be certain that their debts will be repaid Can lead to a run -- illiquidity
Likely occurs before common equity is completely gone
Background: Bank Capital

5
Background: Regulatory Capital Ratios
The Federal Reserve specifies a series of regulatory capital ratios. BHCs are required to have current capital ratios that exceed minimum required levels
Regulatory capital ratios have different measures of “capital” in the numerator and different measures of “assets” in the denominator: Capital measures: common equity (minus deductions); Tier 1 capital (common equity
plus preferred); Total regulatory capital (Tier 1 capital plus (some) subordinated debt).
Asset measures: risk-weighted assets (different positions weighted according to risk) and average assets (equal weights for all positions).
Risk-weighted assets account for off-balance sheet positions; new definition of average assets will also.
In the U.S., these ratios are now transitioning to the new “Basel III” definitions and required minimum levels

6
Significant uncertainty about the extent of losses at individual banking companies and in the banking system as a whole Uncertainty because many assets were opaque and difficult to value
Uncertainty because of accounting
Uncertainty about how bad it might get
Regulatory capital ratios are backward looking Based on book values of equity, rather than market values
Do not incorporate losses not yet recognized under accounting rules
Market values incorporate these losses, or at least market expectations of these losses
Common equity is what matters Other forms of “capital” were significantly discounted by market participants
Regulatory capital ratios did not focus on common equity – no regulatory capital ratio based on common equity alone
Lessons from the Financial Crisis

7
Market and Book Values of Common Equity

8
Most did not reduce dividends until relatively late in the crisis
What were the banks doing?
05
10
15
$ B
illio
n
1Q05 2Q05 3Q05 4Q05 1Q06 2Q06 3Q06 4Q06 1Q07 2Q07 3Q07 4Q07 1Q08 2Q08 3Q08 4Q08 1Q09 2Q09 3Q09 4Q09
All top-tier domestic bank holding companies with assets over $5 billion as of Q1 2005.Source: Federal Reserve Y-9C Reports
2005 to 2009
Figure 1Dividends Paid by Large Bank Holding Companies

9
Most did not reduce dividends until relatively late in the crisis
Further reductions in capital, even as conditions deteriorated
What were the banks doing?
05
10
15
$ B
illio
n
1Q05 2Q05 3Q05 4Q05 1Q06 2Q06 3Q06 4Q06 1Q07 2Q07 3Q07 4Q07 1Q08 2Q08 3Q08 4Q08 1Q09 2Q09 3Q09 4Q09
All top-tier domestic bank holding companies with assets over $5 billion as of Q1 2005.Source: Federal Reserve Y-9C Reports
2005 to 2009
Figure 1Dividends Paid by Large Bank Holding Companies
2008
2009
10
A stress test measures what might happen to a bank’s capital if the economy deteriorates A hypothetical exercise based on a particular economic scenario
Stress tests are a way to bring a forward-looking perspective to assessing whether a bank has sufficient capital
Stress testing many banks at once provides information not just about individual banks, but about the banking system as a whole This was critical during the financial crisis
Stress tests do not tell us what losses currently are or might be under all circumstances, but they do provide a kind of upper bound if the scenario is severe enough Can help address uncertainty about individual banks and the banking system
Why stress tests?

11
2009: Supervisory Capital Assessment Program (SCAP) performed during the height of the financial crisis
focus on 19 largest individual BHCs – 2/3 of the assets of the banking system
banks had to raise capital to meet any shortfall relative to target
published individual BHC results – a big innovation
banks raised $100 billion in new common equity following the SCAP
2011: Comprehensive Capital Analysis and Review (CCAR) supervisory assessment of capital adequacy; initially 19 largest BHCs, now 31 largest
assessment of both quantity of capital and of BHCs’ internal management processes
both BHC-run and supervisory stress test projections are inputs
disclosure of supervisory results starting in 2012
2013: Dodd-Frank Act Stress Tests (DFAST) requires BHC-run and supervisory stress test projections; initially 18 largest BHCs, now 31 largest
disclosure of supervisory and BHC results starting in 2013
History of U.S. Stress Testing
12
Calculate what happens to regulatory capital under hypothetical stressed economic and financial market conditions (“scenarios”)
Final outputs are “stressed” regulatory capital ratios
Book value, following GAAP accounting and regulatory capital rules
Key equation in the stress test:
Capitalt = Capitalt-1 + Net Incomet – Dividendst
Project net income and components under stressed conditions
Revenues, operating expenses, and losses
Dividends and other capital actions (share repurchases or issuance) are assumptions about future actions
Also need to project the denominators of the capital ratios – assets and risk-weighted assets
What do U.S. bank stress tests do?

13
Three step process:
Define the hypothetical scenarios
Collect data from the banks
Use the data in models to project net income and capital
How are the stress tests calculated?

14
Federal Reserve develops three economic and financial market scenarios Baseline, Adverse, Severely Adverse
Scenarios made public in November of each year
Severely Adverse scenario in 2015: A deep recession and sharp fall in asset prices
U.S. and international variables
Sharp rise in credit spreads, especially in the corporate sector, and financial market volatility
Trading positions at largest BHCs also subject to global market shock (big moves in spreads, rates, prices)
Default of largest counterparty at 8 large BHCs, after global market shock
Adverse scenario for 2015: Milder recession than severely adverse
Growth slowdown in all country groups
Rise in interest rates along the yield curve
Includes milder version of global market shock to trading and counterparty default
Stress scenario horizon runs from Q4 2014 to Q4 2016 (nine quarters)
Step One: Baseline and Stress Scenarios

15
To generate stress test results that accurately reflect each bank, need information about each bank’s assets, liabilities, income and expenses
Banks provide extensive data on their loan, securities, and trading portfolios; business activities; revenue and expenses; and balance sheet on regulatory reports
FR 14-M, FR 14-Q and FR 14-A regulatory reports
Firm-specific risk attributes, loss protection/mitigation, revenue and expense drivers, portfolio composition
Millions of data elements per bank
Step Two: Collect Data from the Banks

16
The Federal Reserve uses bank data and the scenario variables as inputs to models developed or selected by the Federal Reserve to project losses, revenues, expenses, the balance sheet, risk-weighted assets, and capital Federal Reserve models with bank input data
With few exceptions, independent estimates, not adjustments to bank projections
Federal Reserve models capture “typical” bank behavior Models calibrated using industry-wide data
No firm-specific adjustments, just firm-specific input data
Very limited use of “fixed effects”
Consistent assumptions across banks
Results therefore vary, perhaps significantly, from what the banks themselves would project
Key objective is consistency across banks
Step Three: Models and Output

17
DFAST/CCAR 2015 Stress Test Results
Severely Adverse Scenario:
Aggregate net income (loss) for the 31 participating BHCs of -$222B
Pre-provision net revenue of $310B
Projected loan loss provisions of $382B
Projected trading/counterparty losses of $103B
Other losses of $47B
Aggregate capital ratios fall 300 to 500 basis points to minimum values
Range among individual BHCs is wide, from ~0 to more than 1000 basis points

18
Change in Tier 1 Common Capital Ratio:
DFAST 2015, Severely Adverse Scenario
Figure 10. Change from 2014:Q3 to minimum tier 1 common ratio in the severely adverse scenario
Ally
American Express
Bank of America
Bank of NY-Mellon
BB&T
BBVA
BMO
Capital One
Citigroup
Citizens
Comerica
Deutsche Bank
Discover
Fifth Third
Goldman Sachs
HSBC
Huntington
JPMorgan Chase
KeyCorp
M&T
Morgan Stanley
MUFG Americas
Northern Trust
PNC
Regions
Santander
State Street
SunTrust
U.S. Bancorp
Wells Fargo
Zions
Minimum ratio
Actual 2014:Q3 ratio
Median=8.5%
0.0 5.0 10.0 15.0 20.0 25.0 30.0 35.0 40.0 Percent
Note: Estimates are for the nine-quarter period from 2014:Q4–2016:Q4 as a percent of average assets.

19
First-lien Mortgages, 40
Trading and Counterparty, 103
Credit Cards, 83
Commercial and Industrial, 68 Securities, 18
Junior Liens and HELOCs, 34
Commercial Real Estate, 53
Other Consumer, 35
Other Loans, 28
Other Losses, 29
Projected Losses in the Severely Adverse Scenario DFAST/CCAR 2015, Billions of Dollar
Total Losses: $490 Billion

20
How are the stress test results used?
Input to the CCAR
One part of the assessment of whether a BHC has enough capital to withstand stress and continue to operate
A complement to the qualitative assessment of each BHC’s internal risk management, risk measurement, and capital adequacy policies and processes
CCAR assessment affect BHCs’ ability to pay dividends and do share repurchases
Stress test results published by the Federal Reserve (“Dodd-Frank Act Stress Test” results -- DFAST)
Aggregate as well as individual BHC results
Results under two scenarios: severely adverse and adverse
BHCs also disclose their own stress test results under severely adverse (same scenario, BHC-specific calculations)
Most recent results released March 5

21 for internal use only
Overview of the CLASS Model
22
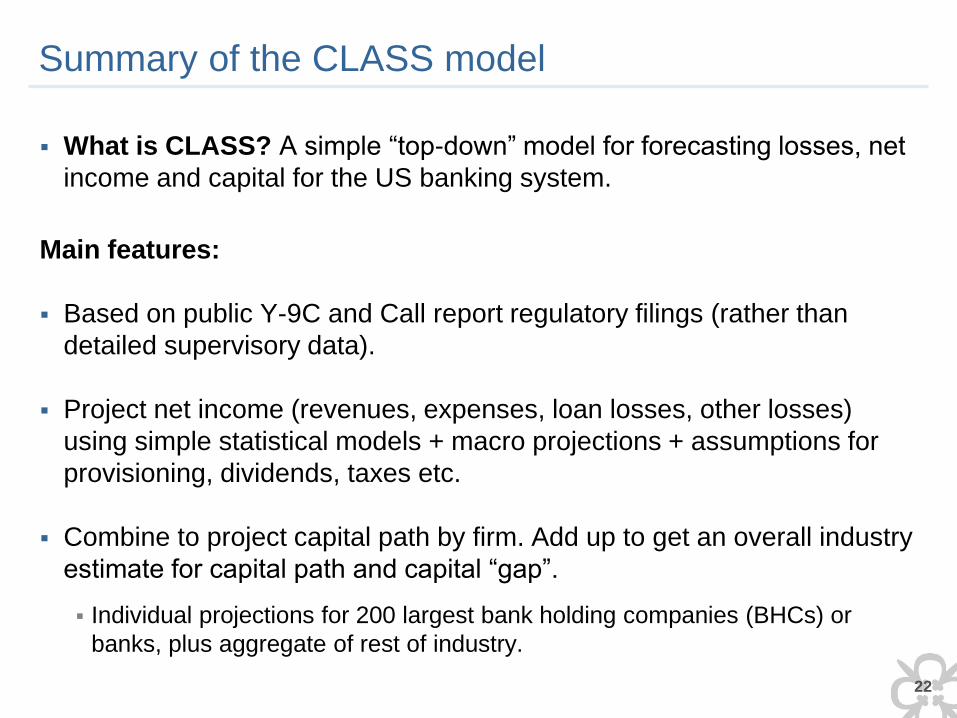
Summary of the CLASS model
What is CLASS? A simple “top-down” model for forecasting losses, net
income and capital for the US banking system.
Main features:
Based on public Y-9C and Call report regulatory filings (rather than
detailed supervisory data).
Project net income (revenues, expenses, loan losses, other losses)
using simple statistical models + macro projections + assumptions for
provisioning, dividends, taxes etc.
Combine to project capital path by firm. Add up to get an overall industry
estimate for capital path and capital “gap”.
Individual projections for 200 largest bank holding companies (BHCs) or
banks, plus aggregate of rest of industry.

23
Regression Models
General structure:
ratiot = α + β1 ratiot-1 + β2 macrot + β3 Xt + εt
ratio : financial ratio of interest (e.g. net interest margin)
macrot : selected macroeconomic variables
Xt : other controls (e.g., asset portfolio shares, time trend)
Mix of time-series models and firm-level pooled regression models.
Estimated by OLS using Y-9C and Call data. (See paper for estimates.)
Forecasts generated dynamically, using autoregressive structure.

24
Some key assumptions (more details in paper)
Balance sheet growth: Asset balances grow at 1.25% per quarter,
consistent with historical average. Liability growth is a residual (A=L+E).
Model has “toggle” in which asset growth depends on the scenario.
Loan loss reserving: Forward looking provisioning rule. Reserves
bounded above next four quarters of projected net chargeoffs (NCOs).
Within range, provision expense = NCOs.
Taxes: Firms taxed at 35% statutory rate. Tax losses carried forward,
subject to regulatory capital limits on qualifying deferred tax assets.
Dividends / distributions: Firms converge to long-run payout ratio of
45%, or to zero dividends if net income < 0. Net equity issuance = 0.
25
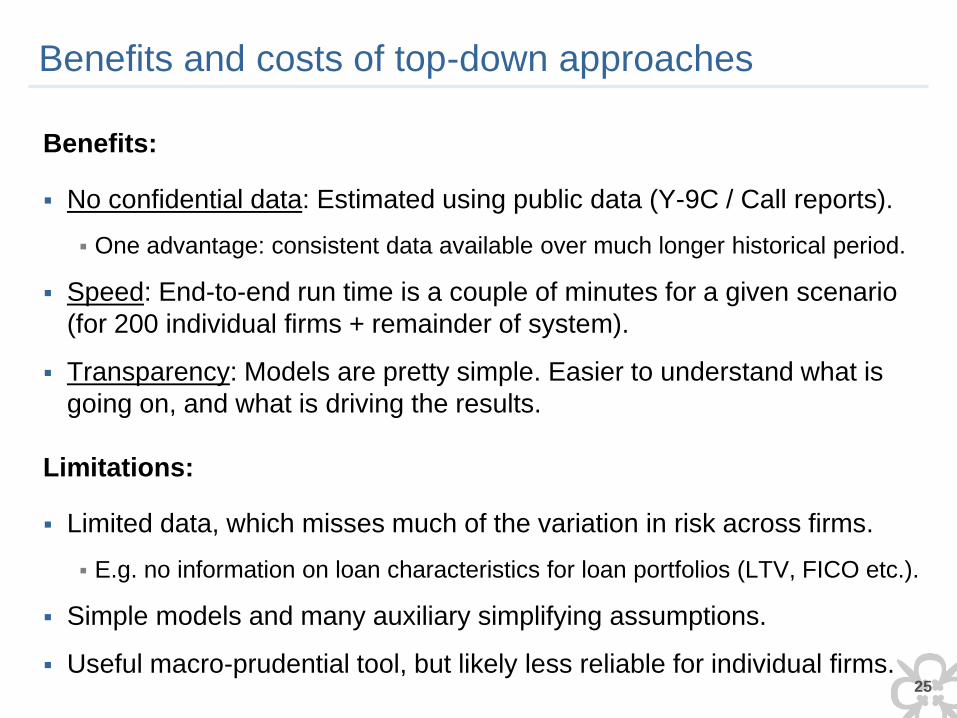
Benefits and costs of top-down approaches
Benefits:
No confidential data: Estimated using public data (Y-9C / Call reports).
One advantage: consistent data available over much longer historical period.
Speed: End-to-end run time is a couple of minutes for a given scenario
(for 200 individual firms + remainder of system).
Transparency: Models are pretty simple. Easier to understand what is
going on, and what is driving the results.
Limitations:
Limited data, which misses much of the variation in risk across firms.
E.g. no information on loan characteristics for loan portfolios (LTV, FICO etc.).
Simple models and many auxiliary simplifying assumptions.
Useful macro-prudential tool, but likely less reliable for individual firms.
26
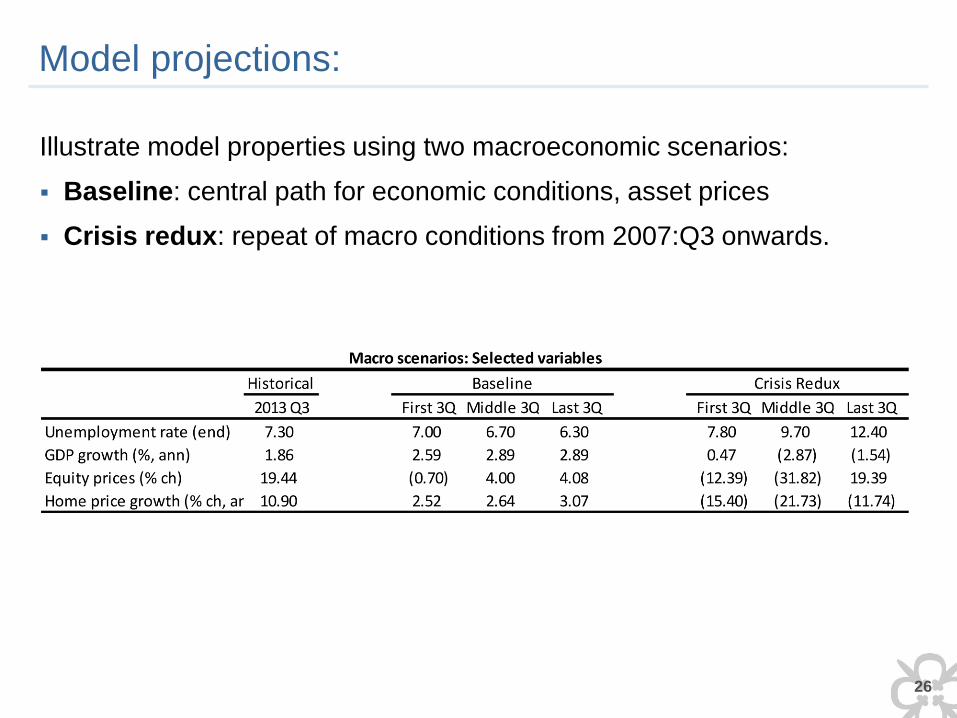
Model projections:
Illustrate model properties using two macroeconomic scenarios:
Baseline: central path for economic conditions, asset prices
Crisis redux: repeat of macro conditions from 2007:Q3 onwards.
27
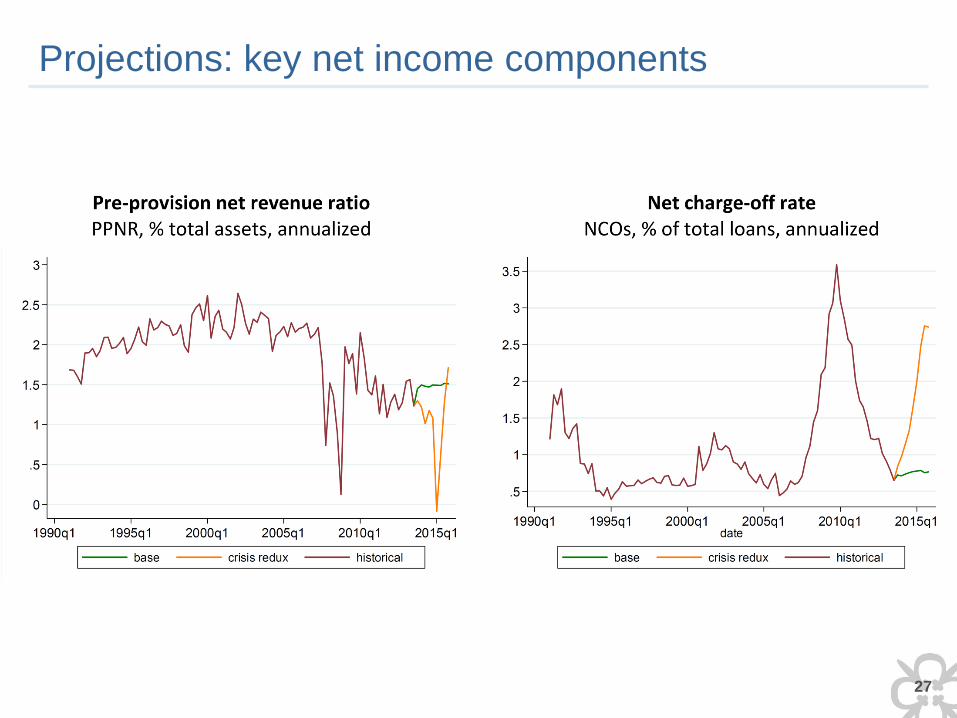
Projections: key net income components

28
Capital projections
Capital ratio: tier 1 common equity as % of risk-weighted assets

29 for internal use only
CLASS Model and Financial Stability
30
Top-down models and risk assessment through the cycle
Top down models can help shed light on how stress testing might
perform over longer time horizon – e.g., leading up to the financial crisis.
Key policy question: is the Fed’s supervisory stress testing program built
to respond to a build-up of risk in advance?
As capital risks increase, would like firms’ capital planning to respond
(e.g., reduce payout ratio to build up higher capital).
Concern: Procyclicality. Models often project lower risk in “good times”
Adrian and Shin (2012): VAR declined in period before the crisis.
Credit loss projections on loan portfolio depend on current
performance status. Lower % of delinquent loans during booms.

31
Time path of industry stress capital gap: CLASS model
Graph: Industry capital “gap” estimated at different points in time (i.e.
seed model with bank balance sheet data from different quarters).
Each run, use the same “crisis redux” scenario, and hold model fixed.
Two thresholds: 5% & 8% tier 1 common equity / risk weighted assets.

32
Evolution of the capital gap: key findings
Industry capital gap today significantly below crisis peak, as well as pre-
crisis levels. E.g., relative to 8% T1C/RWA threshold:
2002: Gap = $100bn
2008: Gap > $500bn
Today: Gap < $10bn
CLASS identifies buildup of capital vulnerability several years prior to the
crisis, starting around 2004, intensifying in 2007-08.
Banks paid high dividends during this period (Acharya et al. 2011,
Hirtle 2014).
Results suggestive that stress testing program backed by supervisory
action could have been very valuable in lead-up to the crisis.
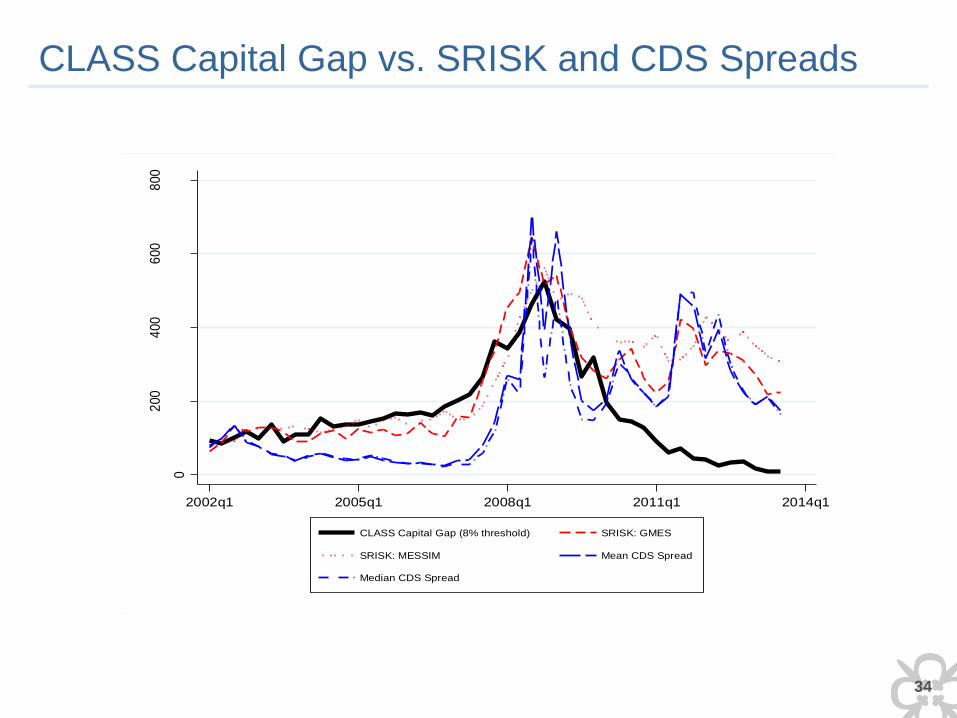
CLASS identifies rise in risk earlier than market-based measures (e.g.,
SRISK, CDS spreads etc.). Reason: low risk premia / high valuations.

33
Comparison to Other Measures of Capital Adequacy
SRISK: A capital gap measure based on large changes in the market value of common equity.
Acharya, Engle and Richardson (2012) http://vlab.stern.nyu.edu/public/static/capital_shortfall-2012.pdf
CDS spreads for large U.S. investment and commercial banks
34
CLASS Capital Gap vs. SRISK and CDS Spreads
0
200
400
600
800
% o
f a
vera
ge 2
00
2 v
alu
e
2002q1 2005q1 2008q1 2011q1 2014q1
CLASS Capital Gap (8% threshold) SRISK: GMES
SRISK: MESSIM Mean CDS Spread
Median CDS Spread

35
Real-time vs full-sample capital gap
Alternative calculation: “real time” capital gap based on model
estimated only up to time t (rather than full sample)
Similar overall results (e.g., buildup of gap from 2004-07).
Lower level of capital gap prior to financial crisis, however.
0
200
400
600
800
Ca
pital G
ap (
$bn
), 8
% T
hre
sh
old
2002q1 2004q1 2006q1 2008q1 2010q1 2012q1
Ex-Post Capital Gap Ex-Ante Capital Gap
36
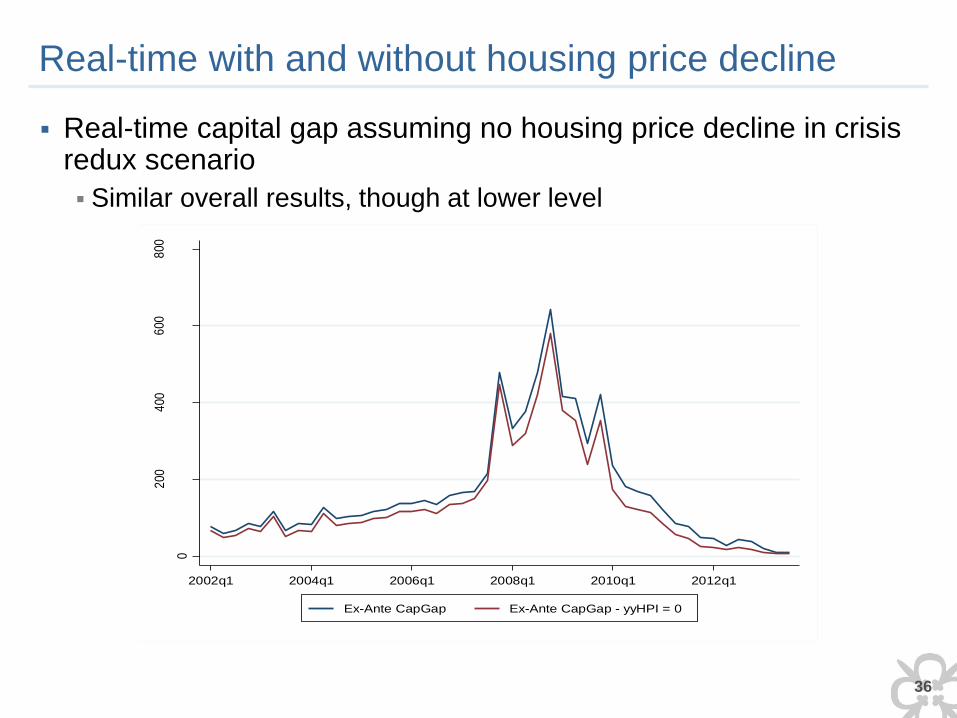
Real-time with and without housing price decline
Real-time capital gap assuming no housing price decline in crisis redux scenario
Similar overall results, though at lower level
0
200
400
600
800
Ca
pita
l Ga
p ($
bn),
8%
Th
resh
old
2002q1 2004q1 2006q1 2008q1 2010q1 2012q1
Ex-Ante CapGap Ex-Ante CapGap - yyHPI = 0

37
Which firms are vulnerable to macro stress?
Figure: correlation between initial capital ratio (T1C/RWA) and
projected change in capital ratio during stress scenario.
Recently: riskier firms hold more capital, consistent with “precautionary”
view of bank capital. (Desirable from financial stability perspective).
Earlier: correlation less negative, sometimes positive!
38
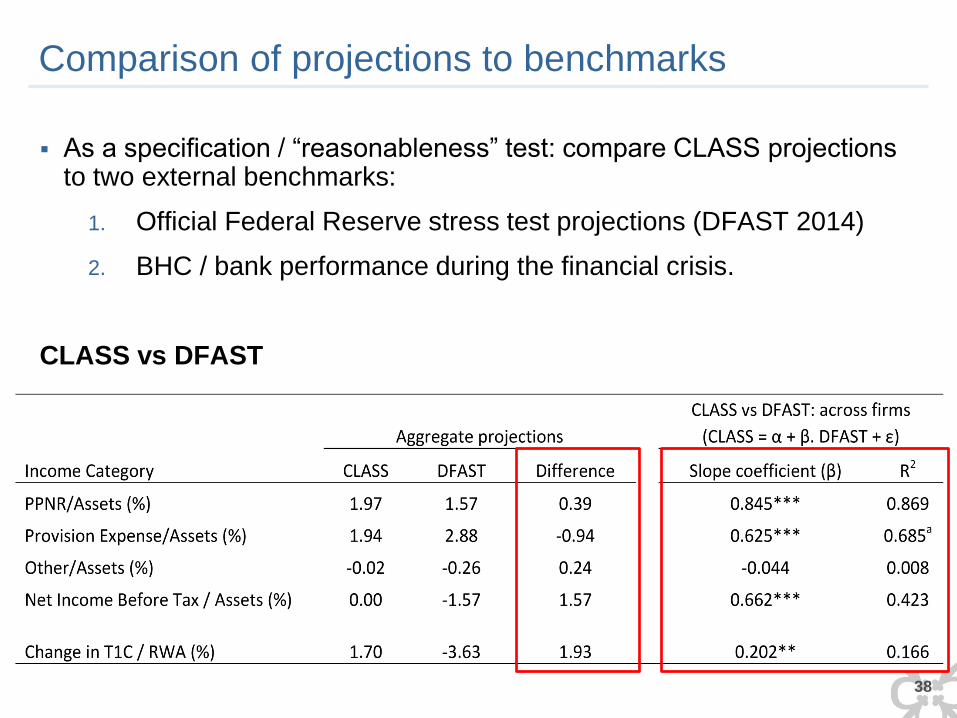
Comparison of projections to benchmarks
As a specification / “reasonableness” test: compare CLASS projections to two external benchmarks:
1. Official Federal Reserve stress test projections (DFAST 2014)
2. BHC / bank performance during the financial crisis.
CLASS vs DFAST

39
Comparison to benchmarks (cont…)
CLASS vs Financial Crisis (2007:q3 to 2008:q4)

40
Summing up: the CLASS model
Simple model that projects bank income and capital under different
macroeconomic scenarios, based on public data.
Not a substitute for detailed bottom-up stress testing modelling, but has
a variety of complementary uses (e.g., “what if” analysis”).
Projections from the model suggest that the US banking system is less
vulnerable to undercapitalization than before or during the 2007-09
financial crisis.
Measured capital vulnerability started to increase in 2004, well before crisis.
Suggests that this kind of stress-testing framework may help provide useful
early warning signals.

41
For more details:
CLASS Model Paper can be found at:
http://www.newyorkfed.org/research/staff_reports/sr663.html

42
APPENDIX
43
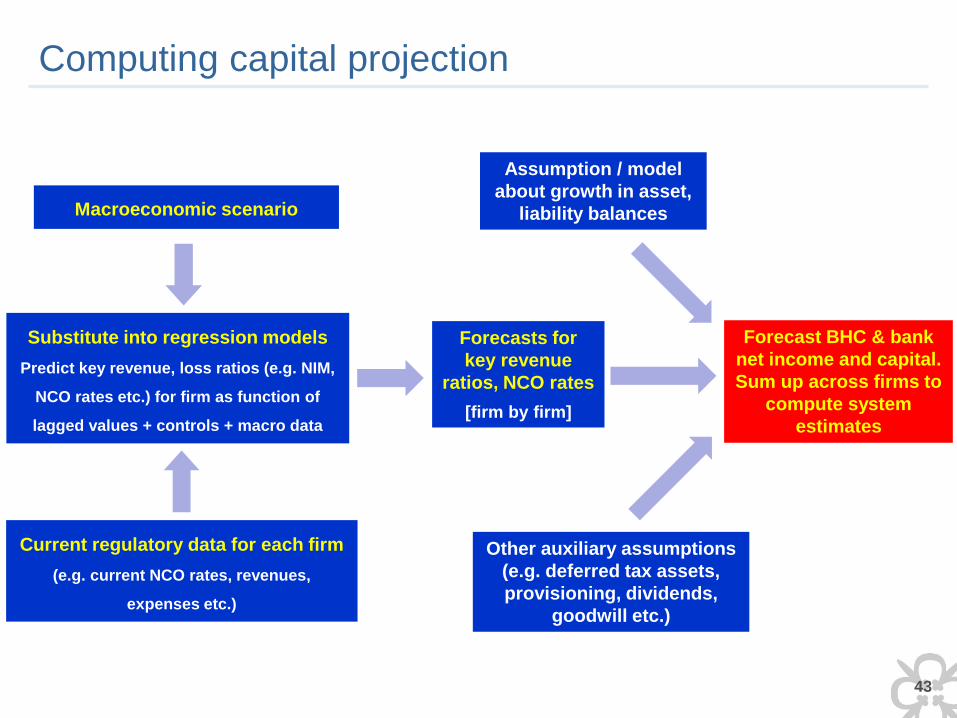
Computing capital projection
Forecasts for
key revenue
ratios, NCO rates
[firm by firm]
Macroeconomic scenario
Substitute into regression models
Predict key revenue, loss ratios (e.g. NIM,
NCO rates etc.) for firm as function of
lagged values + controls + macro data
Current regulatory data for each firm
(e.g. current NCO rates, revenues,
expenses etc.)
Assumption / model
about growth in asset,
liability balances
Other auxiliary assumptions
(e.g. deferred tax assets,
provisioning, dividends,
goodwill etc.)
Forecast BHC & bank
net income and capital.
Sum up across firms to
compute system
estimates

44
Sensitivity to model assumptions
Asset growth assumption has very significant effect on projections.
Mechanical effect: assets are the denominator of the capital ratio.
Key stress testing question: How much should assets grow during scenario?
Provisioning and payout assumptions also matter, but less critical.