Embed Size (px)
Citation preview

A Greenhouse Gas Impacts Assessment of Consumer Demand in California
$
THE CARBON WE CONSUME

Dear Green City California Member,
As we begin to see and experience the effects of global climate change at home in our own communities, and as international and national policies to address dangerous greenhouse gas emissions fail to materialize, cities in California are continuing to lead the way towards a more sustainable future. Addressing the greenhouse gas footprint of consumable goods (ie. the stuff we buy) is a new and important area of focus for local governments seeking innovative ways to take action against climate change. Cities are hubs of culture, innovation and economic production. As such, our choices about what we buy and those which we encourage our citizens to make, have a tremendous impact on regional, national and global GHG emissions.
In 2010, the World Watch Institute published its ground-breaking State of the World Report: Transforming Cultures. The report calls on us to undertake one of the “greatest culture shifts imaginable: from cultures of consumerism to cultures of sustainability.” Following this call for change and seeking to ignite action, the City of San Francisco Department of Environment, on behalf of the members of Green Cities California, commissioned a consumption-based greenhouse gas assessment for the state of California. It is my hope that the following full study and summary will help deepen our definition of what it means to take climate action, and strengthen our efforts to creatively and vigorously address the tremendous challenges we face with a rapidly destabilizing climate system.
Sincerely,David Assmann
LETT
ER F
ROM
DAV
ID A
SSM
AN
N
Deputy DirectorSan Francisco Department of Environment
www.sfenvironment.org
x

3
Letter from David Assmann
An Introduction to Consumption Based Carbon Accounting
California CBEI Study
Food’s FootprintThe Race to Your DiningTableTop Three OffendersWhat will you choose?
Acknowledgments & Defining Consumption
...x
...4
...5
...14
...16
...17
...18 TABL
E O
F C
ON
TEN
TS

4
A new and evolving approach to GHG inventories is one that measures the lifecycle emissions associated with a region’s consumption of goods and services. This consumption assessment method offers a radically different way of looking at a community’s contribution to global climate change.
Traditional greenhouse gas inventories evaluate the emissions associated with a diverse set of activities within a geographic area. These activities can include use of energy by the industrial, commercial and residential sectors, transportation trips that occur within, and to a community, use of electricity, and decomposition of waste in landfills. Some of theses emissions – like those that come from with electricity production and waste disposal - may occur outside of the geographic area of that community. But typically, a traditional greenhouse gas inventory focuses on emissions that physically originate inside the community. While this method can be effective when analyzing the carbon content and efficiency of fuels used to move and power the community in question, it frequently understates the emissions that cities’ are responsible for as hubs of final consumer demand and lifestyle trends.
A consumption assessment also involves a geographic area, but unlike the traditional geographic based inventory where emissions are assigned based on fuels and energy consumed in the community, consumption based assessments attempt to estimate all emissions - both inside and outside the community - that arise as a consequence of consumption activities within that community. Consumption in this case is defined as final demand, the stuff we buy and activities we engage in our cities, and is viewed as the root driver, or cause of the greenhouse gas emissions associated with the lifecycle carbon footprint of these goods and services.
AN
INTR
OD
UC
TIO
N T
O
CO
NSU
MPT
ION
BA
SED
CA
RBO
N A
CC
OU
NTI
NG
5
CA
LIFO
RNIA
CO
NSU
MPT
ION
-BA
SED
EM
ISSI
ON
S IN
VEN
TORY
(CBE
I) ST
UD
Y
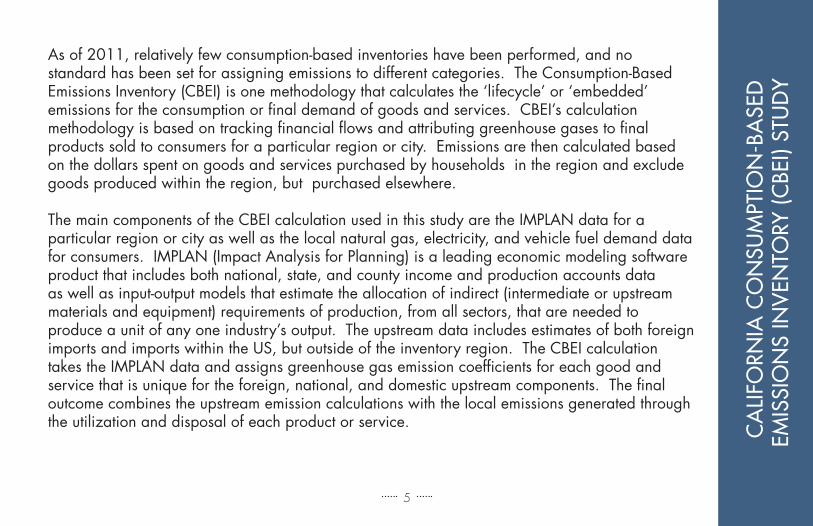
As of 2011, relatively few consumption-based inventories have been performed, and no standard has been set for assigning emissions to different categories. The Consumption-Based Emissions Inventory (CBEI) is one methodology that calculates the ‘lifecycle’ or ‘embedded’ emissions for the consumption or final demand of goods and services. CBEI’s calculation methodology is based on tracking financial flows and attributing greenhouse gases to final products sold to consumers for a particular region or city. Emissions are then calculated based on the dollars spent on goods and services purchased by households in the region and exclude goods produced within the region, but purchased elsewhere.
The main components of the CBEI calculation used in this study are the IMPLAN data for a particular region or city as well as the local natural gas, electricity, and vehicle fuel demand data for consumers. IMPLAN (Impact Analysis for Planning) is a leading economic modeling software product that includes both national, state, and county income and production accounts data as well as input-output models that estimate the allocation of indirect (intermediate or upstream materials and equipment) requirements of production, from all sectors, that are needed to produce a unit of any one industry’s output. The upstream data includes estimates of both foreign imports and imports within the US, but outside of the inventory region. The CBEI calculation takes the IMPLAN data and assigns greenhouse gas emission coefficients for each good and service that is unique for the foreign, national, and domestic upstream components. The final outcome combines the upstream emission calculations with the local emissions generated through the utilization and disposal of each product or service.

6
Production
California Total Emissions (million mT CO2-e)
Appliances, HVAC
Appliances, other
Clothing
Concrete, cement and lime
Construction
Electronics
Food and beverages
467.891
0.454
3.930
18.995
0.050
48.060
36.331
96.465
CA
LIFO
RNIA
’S 2
008
CO
NSU
MPT
ION
-BA
SED
EM
ISSI
ON
S BY
LIF
E-C
YCLE
PH
ASE
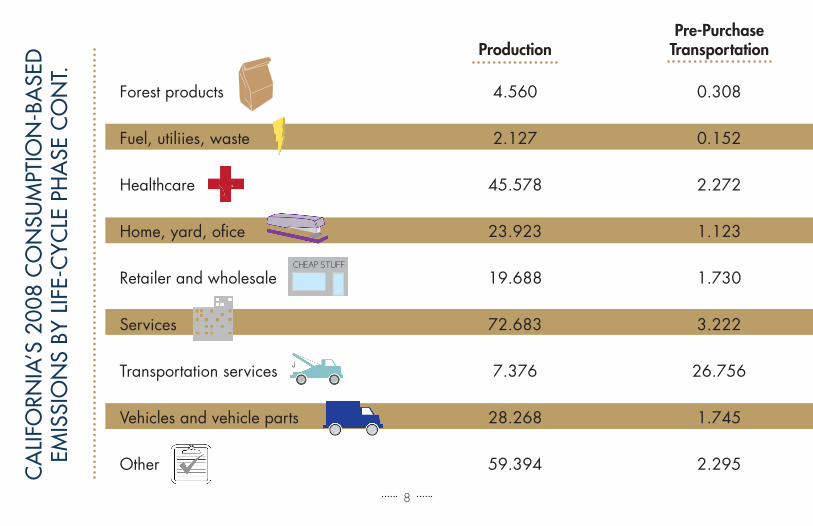
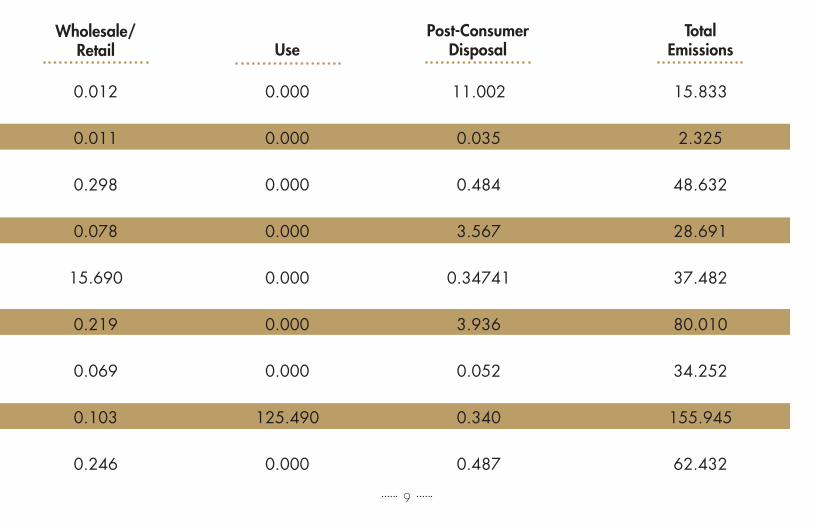
This table reports California’s 2008 consumption-based emissions by life-cycle phase totaling 834 million metric tons CO2 -e. Production-phase emissions account for 56 percent of the total; pre-purchase transportation, 6 percent; wholesale and retail, 2 percent; use, 31 percent; and post-consumer disposal less than 5 percent.

7
Production
467.891
0.454
3.930
18.995
0.050
48.060
36.331
96.465
50.988
0.030
0.149
0.097
0.001
3.944
1.141
6.022
17.958
0.002
0.009
0.013
0.000
0.579
0.256
0.372
257.917
72.673
47.532
0.000
0.000
0.000
12.222
0.000
38.886
0.004
0.065
0.065
0.003
5.368
0.190
12.913
833.639
73.163
51.685
19.171
0.054
57.952
50.140
115.774
Pre-Purchase Transportation
Wholesale/ Retail
Use
Post-Consumer Disposal
Total Emissions
8
Forest products
Fuel, utiliies, waste
Healthcare
Home, yard, ofice
Retailer and wholesale
Services
Transportation services
Vehicles and vehicle parts
Other
4.560
2.127
45.578
23.923
19.688
72.683
7.376
28.268
59.394
0.308
0.152
2.272
1.123
1.730
3.222
26.756
1.745
2.295CA
LIFO
RNIA
’S 2
008
CO
NSU
MPT
ION
-BA
SED
EM
ISSI
ON
S BY
LIF
E-C
YCLE
PH
ASE
CO
NT.
CHEAP STUFF
Production
Pre-Purchase Transportation
9
0.308
0.152
2.272
1.123
1.730
3.222
26.756
1.745
2.295
0.012
0.011
0.298
0.078
15.690
0.219
0.069
0.103
0.246
0.000
0.000
0.000
0.000
0.000
0.000
0.000
125.490
0.000
11.002
0.035
0.484
3.567
0.34741
3.936
0.052
0.340
0.487
15.833
2.325
48.632
28.691
37.482
80.010
34.252
155.945
62.432
Wholesale/ Retail
Use
Post-Consumer Disposal
Total Emissions

10
This table reports California’s 2008 consumption-based emissions by type of consumer. Household emissions account for 76 percent of the total; business investment and government, 12 percent each.
CA
LIFO
RNIA
’S 2
008
CO
NSU
MPT
ION
-BA
SED
EM
ISSI
ON
S BY
CO
NSU
MER
TYP
ECalifornia Total Emissions (million mT CO2-e)
Appliances, HVAC
Appliances, other
Clothing
Concrete, cement and lime
Construction
Electronics
Food and beverages

11
Household
636.810
62.631
39.914
18.818
0.022
5.998
18.171
111.678
98.200
10.388
11.500
0.351
0.032
17.188
6.834
3.821
98.628
0.144
0.271
0.001
0.000
34.765
25.135
0.272
833.639
73.163
51.685
19.171
0.054
57.952
50.140
115.771
Government Investment Total

12
Forest products
Fuel, utiliies, waste
Healthcare
Home, yard, office
Retailer and wholesale
Services
Transportation services
Vehicles and vehicle parts
Other
CA
LIFO
RNIA
’S 2
008
CO
NSU
MPT
ION
-BA
SED
EM
ISSI
ON
S BY
CO
NSU
MER
TYP
E C
ON
T.Household
10.121
1.075
44.619
24.866
34.466
69.714
28.686
136.215
29.817
.5.760
0.337
1.354
1.643
0.633
9.604
4.170
15.260
9.294
Government
CHEAP STUFF

13
What follows is a condensed summary of the California CBEI study that was commissioned by the City and County of San Francisco for Green Cities California. For the purposes of this discussion, and in light of interest expressed by GCC members, we have chosen to highlight the carbon intensity of food consumed in the Golden State.
0.002
0.913
2.659
2.182
2.354
0.751
1.397
4.470
23.311
15.833
2.325
48.632
28.691
37.482
80.070
34.252
155.945
62.432
Investment Total
FOOD

14
FOO
D’S
FO
OTP
RIN
T The Race to Your Dining Table
6.205 MMT
3.101 MMT
1.136 MMT
2.151 MMT
4.046 MMT
2.770 MMT
Condiments,oils and sweetners
Fresh fruit, nuts and vegetables
Frozen food
Poultry and eggs
Processed fruit, nuts and vegetables
*all units are expressed in million mT CO2 -e
Seafood

15
Beverages 12.410 MMT
18.487 MMT
9.775 MMT
29.869 MMT
10.502 MMT
11.227 MMT
Dairy
Grains, baked goods, cereal, roasted nuts, nut butters
Red meat
Restaurants
Other food and agriculture

16
Top Three Offenders
2%
1Restaurants
3Beverages
2Red Meat
Juice

17
We make choices every day. What will you choose?
18.478 MMT
6.205 MMT4.046 MMT

18
DEF
ININ
G C
ON
SUM
PTIO
N
“Every new advance of the price to the consumer is a new incentive to him to retrench the quality of his consumption.”
- Burke.
Websters Dictionary: Con`sump´tionn. 1. The act or process of consuming by use, waste, etc.; decay; destruction.
Wikipedia: ConsumptionEconomics •Useoffinalgoodsbyaconsumeruntildisposal.
Material Management Approaches for State and Local Climate Protection: ConsumptionFinal demand; the purchases of goods and services (including energy) by households and governments. Includes business purchases that are classified as investment or capital – typically, goods that are kept in inventory for more than one year, and not quickly passed on to another business. Other business-to-business expenditures are not part of “consumption”, in order to avoid double-counting.
Terms
19
Marx, Capital on “Commodity” A commodity is an object outside of us, a thing that by its properties satisfies human wants of some sort or another. The nature of such wants, whether, for instance, if they spring from the stomach or from fancy, makes no difference. Neither are we concerned to know how the object satisfies these wants, whether directly as means of subsistence, or indirectly as means of production.
Mark, Capital on “Consumers”The conception of “consumer” is an illusion possible only once production and consump-tion have been alienated as apparently separate and independent processes... Every act of consumption is equally an act of production, so the alienation of one from the other is a social construction. Since wage-workers produce only to earn a living, and are alien-ated from their own labour, the illusion is created that their only real life is as a consumer. But nothing could be more powerless than a consumer.
Inspired Economist on “Consumer Power”Every dollar you spend is a vote for how you want the world to be and who you want to control it.

This California CBEI Study was conducted by the Stockhom Environment Institute, U.S. Center. http://sei-us.org/ClimateEconomics. Its year of assessment was 2008. For further details please see the SF-CBEI -TechnicalReport-Part3 SEI. For more information on Consumption based accounting please visit http://captoolkit.wikispaces.com. This report was produced for the Fall 2011 Green Cities California retreat by the SF Department of Environment Climate Team’s Climate Action Coordinator Calla Rose Ostrander, Information Management Associate Marcus Keller and graphics by Paula Chiu.