Embed Size (px)
Citation preview

The Cartesian Plane
Just as you can represent real numbers by points on a real number line, you can represent ordered pairs of real numbers by points in a plane called the rectangular coordinate system, or the Cartesian plane, after the French math-ematician René Descartes (1596–1650).
The Cartesian plane is formed by using two real number lines intersecting atright angles, as shown in Figure 1.1. The horizontal real number line is usuallycalled the x-axis, and the vertical real number line is usually called the y-axis.The point of intersection of these two axes is the origin, and the two axes dividethe plane into four parts called quadrants.
Each point in the plane corresponds to an ordered pair of real num-bers x and y, called coordinates of the point. The x-coordinate represents thedirected distance from the y-axis to the point, and the y-coordinate represents thedirected distance from the x-axis to the point, as shown in Figure 1.2.
�x, y�
�x, y�
2 CHAPTER 1 Functions, Graphs, and Limits
1.1 T H E C A R T E S I A N P L A N E A N D T H E D I S TA N C E F O R M U L A
■ Plot points in a coordinate plane and read data presented graphically.■ Find the distance between two points in a coordinate plane.■ Find the midpoints of line segments connecting two points.■ Translate points in a coordinate plane.
E X A M P L E 1 Plotting Points in the Cartesian Plane
Plot the points and
SOLUTION To plot the point
imagine a vertical line through on the x-axis and a horizontal line through 2on the y-axis. The intersection of these two lines is the point The otherfour points can be plotted in a similar way and are shown in Figure 1.3.
��1, 2�.�1
��1, 2�
��2, �3�.��1, 2�, �3, 4�, �0, 0�, �3, 0�,
−3
−4
1 32 4−1−3 −2−4
1
2
3
4
−1
−2
x-axis
Vertical real line
Horizontal real lineOrigin
Quadrant II Quadrant I
Quadrant III Quadrant IV
y-axis
F I G U R E 1 . 1 The Cartesian Plane
x-axis
x
y
(x, y)
y-axis
F I G U R E 1 . 2
xx(3, 0)(0, 0)
(3, 4)
(−1, 2)
(−2, −3)−3
−4
1 32 4−1−3 −2−4
1
3
4
−1
−2
y
F I G U R E 1 . 3
S T U D Y T I P
The notation denotes both a point in the plane and an open interval onthe real number line. The context will tell you which meaning is intended.
�x, y�
Directed distancefrom x-axis
Directed distancefrom y-axis
x-coordinate y-coordinate
T R Y I T 1
Plot the points and ��1, �2�.��3, 2�, �4, �2�, �3, 1�, �0, �2�,
360040_0101.qxd 1/3/05 1:31 PM Page 2

Using a rectangular coordinate system allows you to visualize relationshipsbetween two variables. It would be difficult to overestimate the importance ofDescartes’s introduction of coordinates to the plane. Today his ideas are in com-mon use in virtually every scientific and business-related field. In Example 2,notice how much your intuition is enhanced by the use of a graphical presentation.
SECT ION 1.1 The Cartesian Plane and the Distance Formula 3
E X A M P L E 2 Sketching a Scatter Plot
The amounts A (in millions of dollars) spent on snowmobiles in the United Statesfrom 1993 through 2002 are shown in the table, where t represents the year.Sketch a scatter plot of the data. (Source: National Sporting Goods Association)
SOLUTION To sketch a scatter plot of the data given in the table, you simplyrepresent each pair of values by an ordered pair and plot the resultingpoints, as shown in Figure 1.4. For instance, the first pair of values is representedby the ordered pair (1993, 515). Note that the break in the t-axis indicates that thenumbers between 0 and 1992 have been omitted.
�t, A�,
t 1993 1994 1995 1996 1997 1998 1999 2000 2001 2002
A 515 715 910 974 975 883 820 894 784 808
T R Y I T 2
From 1991 to 2000, the enrollments E (in millions) of students in U.S. public colleges are shown, where t represents the year. Sketch a scatter plotof the data. (Source: U.S. National Center for Education Statistics)
t 1991 1992 1993 1994 1995 1996 1997 1998 1999 2000
E 11.3 11.4 11.2 11.1 11.1 11.1 11.2 11.1 11.3 11.8
Dol
lars
(in
mill
ions
)
Year
Amounts Spent on Snowmobiles
t
A
1993 1995 1997 1999 2001
200
400
600
800
1000
1200
F I G U R E 1 . 4
S T U D Y T I P
In Example 2, you could letrepresent the year 1993.
In that case, the horizontal axiswould not have been broken,and the tick marks would havebeen labeled 1 through 10(instead of 1993 through 2002).
t � 1
The scatter plot in Example 2 is only one way to represent the
given data graphically. Two other tech-niques are shown at the right. The firstis a bar graph and the second is a linegraph. All three graphical representa-tions were created with a computer. If you have access to computer graph-ing software, try using it to representgraphically the data given in Example 2.
T E C H N O L O G Y
Dol
lars
(in
mill
ions
)
Year
Amounts Spent on Snowmobiles
t
A
1993 1995 1997 1999 2001
200
400
600
800
1000
1200
Dol
lars
(in
mill
ions
)
Year
Amounts Spent on Snowmobiles
t
A
1993 1995 1997 1999 2001
200
400
600
800
1000
1200
360040_0101.qxd 1/3/05 1:31 PM Page 3

The Distance Formula
Recall from the Pythagorean Theorem that, for a right triangle with hypotenuseof length c and sides of lengths a and b, you have
Pythagorean Theorem
as shown in Figure 1.5. (The converse is also true. That is, if thenthe triangle is a right triangle.)
Suppose you want to determine the distance d between two points and in the plane. With these two points, a right triangle can be formed, asshown in Figure 1.6. The length of the vertical side of the triangle is
and the length of the horizontal side is
By the Pythagorean Theorem, you can write
This result is the Distance Formula.
d � ��x2 � x1�2 � �y2 � y1�2.
d � ��x2 � x1�2 � �y2 � y1�2
d2 � �x2 � x1�2 � �y2 � y1�2
�x2 � x1�.
�y2 � y1�
�x2, y2��x1, y1�
a2 � b2 � c2,
a2 � b2 � c2
4 CHAPTER 1 Functions, Graphs, and Limits
E X A M P L E 3 Finding a Distance
Find the distance between the points and
SOLUTION Let and Then apply the DistanceFormula as shown.
Distance Formula
Substitute for and
Simplify.
Use a calculator.
Note in Figure 1.7 that a distance of 5.83 looks about right.
� 5.83
� �34
� ��5�2 � �3�2
y2.x1, y1, x2, � ��3 � ��2��2 � �4 � 1�2
d � ��x2 � x1�2 � �y2 � y1�2
�x2, y2� � �3, 4�.�x1, y1� � ��2, 1�
�3, 4�.��2, 1�
The Distance Formula
The distance d between the points and in the plane is
d � ��x2 � x1�2 � �y2 � y1�2.
�x2, y2��x1, y1�
T R Y I T 3
Find the distance between the points and �2, 4�.��2, 1�
c
b
a
a2 + b2 = c2
F I G U R E 1 . 5 Pythagorean Theorem
x
d
x2 − x1
(x2, y2)
x2
(x1, y1)y1
y2
x1
y2 − y1
y
F I G U R E 1 . 6 Distance BetweenTwo Points
4
3
21 43−2 −1−1
−3x
3
d
5
(3, 4)
1
(−2, 1)
y
F I G U R E 1 . 7
360040_0101.qxd 1/3/05 1:31 PM Page 4

The figures provided with Examples 3 and 4 were not really essential to thesolution. Nevertheless, we strongly recommend that you develop the habit ofincluding sketches with your solutions—even if they are not required.
SECT ION 1.1 The Cartesian Plane and the Distance Formula 5
E X A M P L E 4 Verifying a Right Triangle
Use the Distance Formula to show that the points and are vertices of a right triangle.
SOLUTION The three points are plotted in Figure 1.8. Using the DistanceFormula, you can find the lengths of the three sides as shown below.
Because
you can apply the converse of the Pythagorean Theorem to conclude that the triangle must be a right triangle.
d12 � d2
2 � 45 � 5 � 50 � d32
d3 � ��5 � 4�2 � �7 � 0�2 � �1 � 49 � �50
d2 � ��4 � 2�2 � �0 � 1�2 � �4 � 1 � �5
d1 � ��5 � 2�2 � �7 � 1�2 � �9 � 36 � �45
�5, 7��2, 1�, �4, 0�,
E X A M P L E 5 Finding the Length of a Pass
In a football game, a quarterback throws a pass from the five-yard line, 20 yardsfrom the sideline. The pass is caught by a wide receiver on the 45-yard line,50 yards from the same sideline, as shown in Figure 1.9. How long was the pass?
SOLUTION You can find the length of the pass by finding the distance betweenthe points and
Distance Formula
Simplify.
So, the pass was 50 yards long.
� 50
� �900 � 1600
d � ��50 � 20�2 � �45 � 5�2
�50, 45�.�20, 5�
T R Y I T 4
Use the Distance Formula to show that the points andare vertices of a right triangle.�6, �3�
�5, 5�,�2, �1�,
8
6
4
2
642x
d3
d1
d2
(5, 7)
(2, 1)
(4, 0)
y
F I G U R E 1 . 8
10 20 30 40 50
(20, 5)
(50, 45)
Line of scrimmage
F I G U R E 1 . 9
S T U D Y T I P
In Example 5, the scale along the goal line showing distance from the sidelinedoes not normally appear on a football field. However, when you use coordi-nate geometry to solve real-life problems, you are free to place the coordinatesystem in any way that is convenient to the solution of the problem.
T R Y I T 5
A quarterback throws a passfrom the 10-yard line, 10 yardsfrom the sideline. The pass iscaught by a wide receiver onthe 30-yard line, 25 yards fromthe same sideline. How longwas the pass?
360040_0101.qxd 1/3/05 1:31 PM Page 5

The Midpoint Formula
To find the midpoint of the line segment that joins two points in a coordinateplane, you can simply find the average values of the respective coordinates of thetwo endpoints.
6 CHAPTER 1 Functions, Graphs, and Limits
The Midpoint Formula
The midpoint of the segment joining the points and is
Midpoint � �x1 � x2
2,
y1 � y2
2 .
�x2, y2��x1, y1�
E X A M P L E 6 Finding a Segment’s Midpoint
Find the midpoint of the line segment joining the points and asshown in Figure 1.10.
SOLUTION Let and
Midpoint � �x1 � x2
2,
y1 � y2
2 � ��5 � 92
, �3 � 3
2 � �2, 0�
�x2, y2� � �9, 3�.�x1, y1� � ��5, �3�
�9, 3�,��5, �3�
T R Y I T 6
Find the midpoint of the line segment joining and �2, 8�.��6, 2�
E X A M P L E 7 Estimating Annual Sales
Starbucks Corporation had annual sales of $2.65 billion in 2001 and $4.08 billionin 2003. Without knowing any additional information, what would you estimatethe 2002 sales to have been? (Source: Starbucks Corp.)
SOLUTION One solution to the problem is to assume that sales followed a linear pattern. With this assumption, you can estimate the 2002 sales by findingthe midpoint of the segment connecting the points and
So, you would estimate the 2002 sales to have been about $3.37 billion, as shownin Figure 1.11. (The actual 2002 sales were $3.29 billion.)
Midpoint � �2001 � 20032
, 2.65 � 4.08
2 � �2002, 3.37�
�2003, 4.08�.�2001, 2.65�
T R Y I T 7
Maytag Corporation had annual sales of $4.32 billion in 2001 and $4.79 bil-lion in 2003. What would you estimate the 2002 annual sales to have been?(Source: Maytag Corp.)
Sale
s(i
n bi
llion
s of
dol
lars
)
Year
Starbucks Corporation’s Annual Sales
2001 2002 2003
Midpoint
(2002, 3.37)
(2003, 4.08)
(2001, 2.65)2.5
3.0
3.5
4.0
4.5
F I G U R E 1 . 1 1
9
6
3
63
−3
−6
−3−6x
(9, 3)
(2, 0)
Midpoint(−5, −3)
y
F I G U R E 1 . 1 0
360040_0101.qxd 1/3/05 1:31 PM Page 6

Translating Points in the Plane
SECT ION 1.1 The Cartesian Plane and the Distance Formula 7
E X A M P L E 8 Translating Points in the Plane
Figure 1.12(a) shows the vertices of a parallelogram. Find the vertices of the par-allelogram after it has been translated two units down and four units to the right.
SOLUTION To translate each vertex two units down, subtract 2 from eachy-coordinate. To translate each vertex four units to the right, add 4 to each x-coordinate.
Original Point Translated Point
The translated parallelogram is shown in Figure 1.12(b).
�1 � 4, 4 � 2� � �5, 2��1, 4��3 � 4, 6 � 2� � �7, 4��3, 6��3 � 4, 2 � 2� � �7, 0��3, 2��1 � 4, 0 � 2� � �5, �2��1, 0�
(3, 6)
(1, 0)
(1, 4)
(3, 2)
−4
−6 12
8
(3, 6)
(7, 4)
(5, 2)
(7, 0)(1, 0)
(1, 4)
(3, 2)
(5, 2)−
−4
−6 12
8
(a)
F I G U R E 1 . 1 2
(b)
T R Y I T 8
Find the vertices of the parallelogram in Example 8 after it has been translatedtwo units to the left and four units down.
Transforming Points in a Coordinate Plane
Example 8 illustrates points that have been translated (or slid ) in a coordinate plane.The translated parallelogram is congruent to (has the same size and shape as) theoriginal parallelogram. Try using a graphing utility to graph the transformed parallelo-gram for each of the following transformations. Describe the transformation. Is it atranslation, a reflection, or a rotation? Is the transformed parallelogram congruent tothe original parallelogram?
T A K E A N O T H E R L O O K
a.
b.
c. ��x, �y��x, y�
�x, �y��x, y�
��x, y��x, y�
Many movies now use extensivecomputer graphics, much of whichconsists of transformations ofpoints in two- and three-dimen-sional space. The photo aboveshows a scene from Shrek. Themovie’s animators used computergraphics to design the scenery,characters, motion, and even thelighting in each scene.
DREAMWORKS/THE KOBAL COLLECTION
360040_0101.qxd 1/3/05 1:31 PM Page 7

In Exercises 1–6, (a) find the length of each side of the right triangle and (b) show that these lengths satisfy the PythagoreanTheorem.
1. 2.
3. 4.
5. 6.
In Exercises 7–14, (a) plot the points, (b) find the distancebetween the points, and (c) find the midpoint of the line segmentjoining the points.
7. 8.
9. 10.
11. 12.
13. 14.
In Exercises 15–18, show that the points form the vertices of thegiven figure. (A rhombus is a quadrilateral whose sides have thesame length.)
Vertices Figure
15. Right triangle
16. Isosceles triangle
17. Rhombus
18. Parallelogram
In Exercises 19–22, use the Distance Formula to determinewhether the points are collinear (lie on the same line).
19. 20.
21. 22.
In Exercises 23 and 24, find x such that the distance between thepoints is 5.
23. 24.
In Exercises 25 and 26, find y such that the distance between thepoints is 8.
25. 26. �5, 1�, �5, y��0, 0�, �3, y�
�2, �1�, �x, 2��1, 0�, �x, �4�
��1, 1�, �3, 3�, �5, 5���2, �6�, �1, �3�, �5, 2��0, 4�, �7, �6�, ��5, 11��0, �4�, �2, 0�, �3, 2�
�0, 1�, �3, 7�, �4, 4�, �1, �2��0, 0�, �1, 2�, �2, 1�, �3, 3��1, �3�, �3, 2�, ��2, 4��0, 1�, �3, 7�, �4, �1�
��2, 0�, �0,�2 ��1, �3 �, ��1, 1���3, 7�, �1, �1��2, 2�, �4, 14��2
3, �13�, �5
6, 1��12, 1�, ��3
2, �5���3, 2�, �3, �2��3, 1�, �5, 5�
x
c
b
a (1, 1)
(−4, 1)
y
(−4, 3)
xcb
a (1, −2)(−3, −2)
y
(−3, 3)
x
cb
a
(2, 5)
(6, −2)(2, −2)
y
x
ba
c(7, 1)
(7, 4)(−3, 1)
y
x
ba
c
(1, 1) (13, 1)
(13, 6)y
x
bc
a
(4, 3)
(4, 0)(0, 0)
y
8 CHAPTER 1 Functions, Graphs, and Limits
E X E R C I S E S 1 . 1
The following warm-up exercises involve skills that were covered in earlier sections. You will use these skills in the exercise set for this section.
In Exercises 1–6, simplify each expression.
1. 2.
3. 4.
5. 6.
In Exercises 7–10, solve for x or y.
7. 8.
9. 10.�7 � y
2� �3
x � ��5�2
� 7
��6 � 2�2 � ��2 � y�2 � �52��3 � x�2 � �7 � 4�2 � �45
�8 � �18�27 � �12
�3 � ��1�2
5 � ��4�2
���2 � 0�2 � ��7 � ��3��2��3 � 6�2 � �1 � ��5��2
P R E R E Q U I S I T ER E V I E W 1 . 1
* The answers to the odd-numbered and selected even exercises aregiven in the back of the text. Worked-out solutions to the odd-numbered exercises are given in the Student Solutions Guide.
*
360040_0101.qxd 1/3/05 1:31 PM Page 8
27. Use the Midpoint Formula repeatedly to find the threepoints that divide the segment joining and into four equal parts.
28. Show that is one of the points oftrisection of the line segment joining and Then, find the second point of trisection by finding themidpoint of the segment joining
and
29. Use Exercise 27 to find the points that divide the line seg-ment joining the given points into four equal parts.
(a)
(b)
30. Use Exercise 28 to find the points of trisection of the linesegment joining the given points.
(a)
(b)
31. Building Dimensions The base and height of thetrusses for the roof of a house are 32 feet and 5 feet,respectively (see figure).
(a) Find the distance d from the eaves to the peak of theroof.
(b) The length of the house is 40 feet. Use the result of part (a) to find the number of square feet of roofing.
32. Wire Length A guy wire is stretched from a broadcast-ing tower at a point 200 feet above the ground to an anchor125 feet from the base (see figure). How long is the wire?
In Exercises 33 and 34, use a graphing utility to graph a scatterplot, a bar graph, or a line graph to represent the data. Describeany trends that appear.
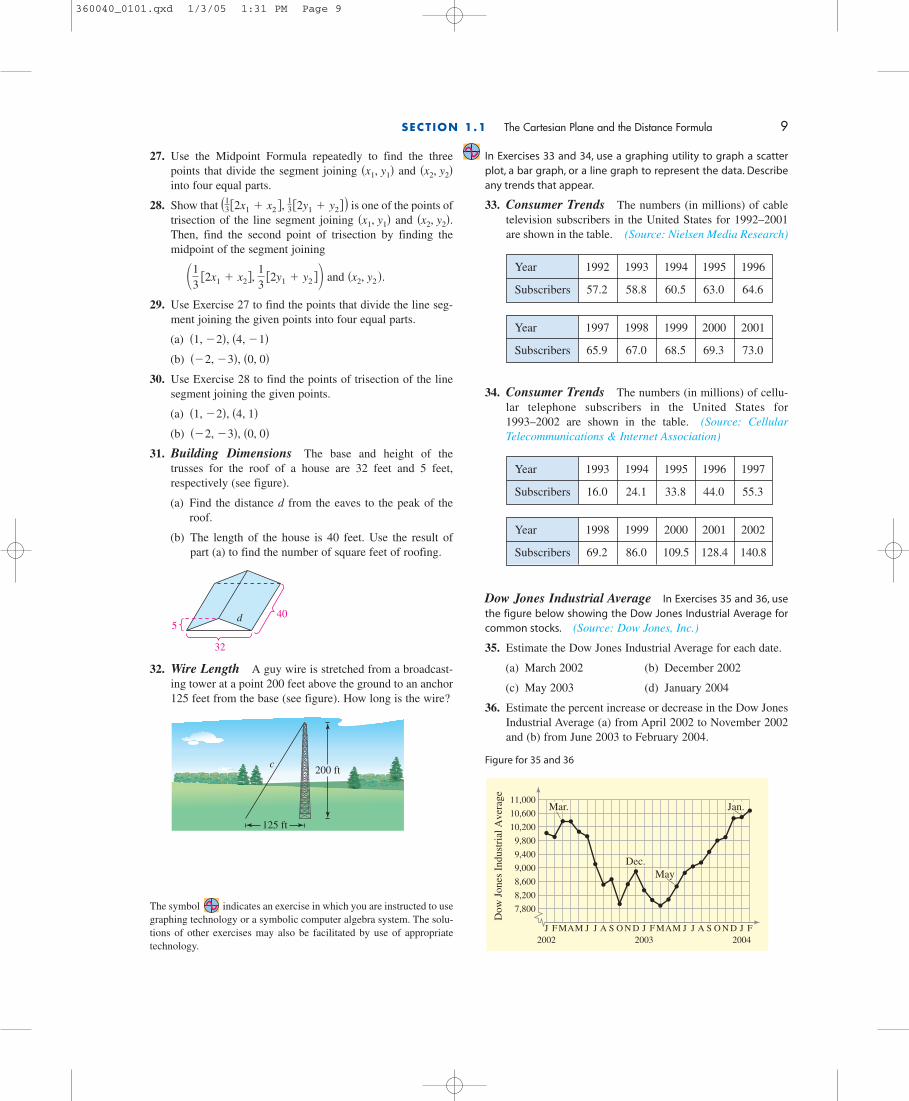
33. Consumer Trends The numbers (in millions) of cabletelevision subscribers in the United States for 1992–2001are shown in the table. (Source: Nielsen Media Research)
34. Consumer Trends The numbers (in millions) of cellu-lar telephone subscribers in the United States for1993–2002 are shown in the table. (Source: CellularTelecommunications & Internet Association)
Dow Jones Industrial Average In Exercises 35 and 36, usethe figure below showing the Dow Jones Industrial Average forcommon stocks. (Source: Dow Jones, Inc.)
35. Estimate the Dow Jones Industrial Average for each date.
(a) March 2002 (b) December 2002
(c) May 2003 (d) January 2004
36. Estimate the percent increase or decrease in the Dow JonesIndustrial Average (a) from April 2002 to November 2002and (b) from June 2003 to February 2004.
Figure for 35 and 36
Dow
Jon
es I
ndus
tria
l Ave
rage
2002 2003 2004J F MAM J J A S O N D J F MAM J J A S O N D J F
7,800
8,200
8,600
9,000
9,400
9,800
10,200
10,600
11,000Mar.
Dec.May
Jan.
200 ft
125 ft
c
540
32
d
��2, �3�, �0, 0��1, �2�, �4, 1�
��2, �3�, �0, 0��1, �2�, �4, �1�
�x2, y2 �.�13
�2x1 � x2�, 13
�2y1 � y2 �
�x2, y2�.�x1, y1��1
3�2x1 � x2 �, 13�2y1 � y2��
�x2, y2��x1, y1�
SECT ION 1.1 The Cartesian Plane and the Distance Formula 9
Year 1992 1993 1994 1995 1996
Subscribers 57.2 58.8 60.5 63.0 64.6
Year 1997 1998 1999 2000 2001
Subscribers 65.9 67.0 68.5 69.3 73.0
Year 1993 1994 1995 1996 1997
Subscribers 16.0 24.1 33.8 44.0 55.3
Year 1998 1999 2000 2001 2002
Subscribers 69.2 86.0 109.5 128.4 140.8
The symbol indicates an exercise in which you are instructed to usegraphing technology or a symbolic computer algebra system. The solu-tions of other exercises may also be facilitated by use of appropriatetechnology.
360040_0101.qxd 1/3/05 1:31 PM Page 9

Construction In Exercises 37 and 38, use the figure, whichshows the median sales prices of existing one-family homes sold(in thousands of dollars) in the United States from 1987 to 2002.(Source: National Association of Realtors)
37. Estimate the median sales price of existing one-familyhomes for each year.
(a) 1987 (b) 1992
(c) 1997 (d) 2002
38. Estimate the percent increases in the value of existing one-family homes (a) from 1993 to 1994 and (b) from 2001to 2002.
Figure for 37 and 38
Research Project In Exercises 39 and 40, (a) use the MidpointFormula to estimate the revenue and profit of the company in2001. (b) Then use your school’s library, the Internet, or someother reference source to find the actual revenue and profit for2001. (c) Did the revenue and profit increase in a linear patternfrom 1999 to 2003? Explain your reasoning. (d) What were thecompany’s expenses during each of the given years? (e) Howwould you rate the company’s growth from 1999 to 2003?(Source: Walgreen Company and The Yankee Candle Company)
39. Walgreen Company
40. The Yankee Candle Company
Computer Graphics In Exercises 41 and 42, the red figure istranslated to a new position in the plane to form the blue figure.(a) Find the vertices of the transformed figure. (b) Then use agraphing utility to draw both figures.
41.
42.
43. Economics The table shows the numbers of ear infec-tions treated by doctors at HMO clinics of three differentsizes: small, medium, and large.
(a) Show the relationship between doctors and treated earinfections using three curves, where the number of doc-tors is on the horizontal axis and the number of earinfections treated is on the vertical axis.
(b) Compare the three relationships.
(Source: Adapted from Taylor, Economics, Fourth Edition)
y
3
1
31x
(0, 2)
(1, 3)
(3, 1)
(2, 0)
3 un
its
3 units
y
321
3
1
−3
x
3 un
its
2 units
(−3, −1)
(−1, −2)
(0, 0)
Med
ian
Sale
s Pr
ice
(in
thou
sand
s of
dol
lars
)
Year
80
90
100
110
120
130
140
150
160
1989 1991 1993 1995 1997 1999 2001
10 CHAPTER 1 Functions, Graphs, and Limits
Year 1999 2001 2003
Revenue (millions of $) 17,839 32,505
Profit (millions of $) 624.1 1157.3
Year 1999 2001 2003
Revenue (millions of $) 256.6 508.6
Profit (millions of $) 34.3 74.8
Cases per Cases per Cases per Number ofsmall clinic medium clinic large clinic doctors
0 0 0 0
20 30 35 1
28 42 49 2
35 53 62 3
40 60 70 4
The symbol indicates an exercise that contains material from text-books in other disciplines.
360040_0101.qxd 1/3/05 1:31 PM Page 10