Embed Size (px)
Citation preview

1
IMPACTS ON DEVELOPING COUNTRIES OF CHANGINGPRODUCTION AND CONSUMPTION PATTERNS IN
DEVELOPED COUNTRIES:THE CASE OF ECOTOURISM IN COSTA RICA
DRAFT
Prepared for:
UNITED NATIONS ENVIRONMENT PROGRAMMEin conjunction with
Institute for Environmental StudiesVrije Universiteit
Amsterdam
Prepared by:INCAE
Costa RicaProject Director: Crist Inman, Ph.D.
Research Team: Nathalia Mesa, Reyna Oleas, Juan Jose de los Santos

1
1. Introduction
Costa Rica, a small Central American country with approximately 3.5 million people and a GrossNational Product (GNP) of US$2,400 per capita in 1995 (WRI, 1996), has gone through severalsuccessful periods of resource-based exportation. In successive waves--first coffee, then beef,followed by bananas and currently tourism—each resource has seen periods of intense expansion inoutput. The boom in Costa Rica’s tourism market began in 1987, and by 1995 the industry wasgenerating US $659.6 million per annum. This made tourism the top generator of foreign revenuesand 7.5% of Costa Rican GDP, above the banana industry (US$ 633.2 million), coffee (US$ 417.1million) and beef (US$ 43.6 million) (ICT, 1995).
Tourism is the largest economic sector in the world, generating US$381 billion in 1995, excludingthe approximately US$57 billion spent on international transport. Costa Rica has gone fromaccounting for 0.8% of world tourism income in 1986 to 1.9% in 1993; tourism income “per capita”is now approximately US$140 per annum, the highest in Central America. From 1969 to 1982tourist arrivals rose at an average of 9% per year, compared with the 14% growth rate during the1986 to 1994 period (Aylward et al.). Hard currency from tourism grew from 3% of GDP in 1987 to8.5% in 1994 (ICT, 1995), providing income to 11.7% of the economically active population, (whichis above the world average of 10%).
Early visitorship by scientists and conservationists, along with the development of Costa Rica’sNational Park system, were the keys to the current importance of ecotourism to the country(Budowsky, T., 1990). The growth of ecotourism in Costa Rica has been greatly facilitated by thepresence of institutions such as the Organization for Tropical Studies (OTS) and the Institute forBiodiversity (INBIO), which helped to create Costa Rica’s image abroad. The research andpublications of the scientists working at these institutions has helped create an image of Costa Ricathat is appealing to ecotourists (Rovinsky, Y.).
Costa Rica accounts for roughly 5% of global biodiversity, which gives the country a competitiveadvantage in the natural resources needed for the development of ecotourism. Although the countryhas more deforested land than any other Latin American nation (Blake), it also has the highestpercentage of protected land in the world (Fenell and Eagles). Additionally, Costa Rica haspreserved these lands and natural habitats in such a way that they are more accessible to tourists thanthose of any other country in the region (Budowski, 1993).
This early investment in the creation of a national conservation system--today valued at US$1.2billion (Umaña, A., 1996)—has helped Costa Rica develop a strong image as a nature-orientedtourism destination. In the last ten years the total number of visitors to the National Park has grownfairly consistently. The percentage of foreign tourists in Costa Rica who also visit the parks hasvaried between 30-60% per year, and the annual growth in foreign visitorship to the National Parkshas varied even more considerably (see the following table). Most private sector tourist enterprisescite the rise in park entrance fees for foreigners as the major cause for the decrease in visitorship inthe mid-1990s. CANATUR estimated an income loss for the country of US$65 million during thisperiod.

2
Table 1FOREIGNER VISITATION TO COSTA RICAN NATIONAL PARKS - 1997
Year Total Visitation by Foreignersto Costa Rica
Growth(%)
National Park Ticketssold to Foreigners
Growth(%)
1988 329,000 125,0001989 376,000 14 167,000 331990 435,000 16 213,000 271991 504,000 16 273,000 281992 611,000 21 322,000 181993 684,000 12 404,000 251994 762,000 11 378,000 -61995 784,000 3 252,000 -331996 781,000 -0,7 269,000 7
Source: Area de Estadísticas, ICT; Dirección de Parques Nacionales, 1997.
Given the importance of tourism in the global economy, along with Costa Rica’s strong nicheposition in ecotourism, the growth of interest in ecotourism, and Costa Rica’s recent experimentswith costing and pricing of its natural environment, we are interested in understanding the structureof the country’s ecotourism segment. Little research has been done to establish whether ecotourismis a viable niche alternative to mass-market tourism as a tool of economic development. We seek todo so here as a first attempt to understand the value chain of ecotourism in Costa Rica. This isexploratory work, rather than an attempt to test hypotheses or build a theory. It is a case study of theinfluence of Northern Hemisphere actors on Costa Rica’s economy.

3
2. Tourism: The World’s Largest Industry
This case study examines Costa Rica’s ecotourism segment primarily because tourism has become soimportant a source of economic development in Southern Hemisphere countries. Tourism hasbecome a symbol of opportunity in virtually every corner of the globe. International travelers andtourists directly and indirectly create more than 10% of the world’s GDP and capital investment.This accounts for 11% of all consumer expenditure and 7% of total world government spending. Anew job is created every 2.4 seconds by the global tourism sector. It is estimated that, during 1996,255 million people--a number close to the total population of the United States--worked for traveland tourism around the world. “Tourism is an economic, environmental and social force of globalproportions” (Saayman).
2.1 Structure of the Travel and Tourism Industry
2.11 Components of Demand
The demand for travel and tourism is the need to travel domestically or internationally for social,business, cultural, religious, recreational, and holiday purposes. People who travel away from homeare visitors or excursionists. However, only over-night visitors are tourists (McIntyre). Tourism isdivided into domestic and international tourism. Domestic tourism is 10 times larger thaninternational tourism. This study will concentrate on international tourism, of which 75% is withinthe same global region.
The main actors in the tourism industry have historically been industrialized countries, capturing in1996 55.82% of the total 594 million international tourist arrivals and 63.97% of the total US$ 423billion international tourist receipts (WTO, 1997). Continental Europe has typically been the mostvisited region in the world. During 1996, two thirds of world tourist arrivals and half of worldtourism receipts were in Europe. France, The United States and Spain have been, since 1980, theworld’s top tourism destinations receiving annually around 25% of all world tourist arrivals. TheUnited States, France and Italy have also been the world top tourism earners since 1980, receivingfrom 25% to 29% of all world tourist receipts annually. The world’s top tourism spenders are alsoindustrialized countries: Germany, The United States and Japan accounted for 37.36% of all 1995tourism expenditures.
2.12 Components of Supply
The travel and tourism industry includes a wide range of economic and social interactions. Tourismsupply is an interconnection of many different sectors of the economy. Generally, these sectorsinclude direct travel services, private and public transportation, food consumption, accommodations,marketing, and natural, cultural, and manmade attractions. All international airlines, airports, roads,restaurants, hotels, lodges, travel books, cultural fairs, museums, and sport events are sectors of thetourism industry.
The tourism industry is fragmented into a large number of businesses and lacks market leaders(Stephen). Large hotel chains, international airlines and major tour wholesalers are the few strongplayers that exist, allowing them to have a strong impact on travel choices made by tourists. The restof the industry is supplied by millions of service providers around the world.
This fragmentation has prevented the tourism industry from integrating and developing policy clout

4
or creating enough lobby pressure to be noticed (Lipman). It also explains why tourism, being thelargest industry in the world, is not yet perceived as a primary economic activity. Tourism does notfeature in industrialized countries’ national charts of accounting; and public policies regardinginvestment, jobs, or infrastructure do not consider their impact on travel and tourism.
The industry’s conditions favor small businesses over large businesses, explaining its highfragmentation. It is difficult to become a large market holder in tourism because of its low barrier toentry, its seasonality, its global scope, and its reliance on a high degree of personalized service(Stephen). It is relatively easy to enter the tourism market--becoming a guide, a taxi driver, oropening a souvenir shop--because no high investments are required.
It is also easier for small businesses to cope with the seasonality of tourism. Furthermore, smallbusinesses have some advantages in providing customized personal service. On-site owners areoften more attentive to customer needs than armies of employees. Large “chain” service providers,such as hotels or restaurants, have brand name advantages over small independent providers, butthese are more a function of marketing economies of scale than reputation for superior service.Furthermore, while chains are going global at a rapid pace, they are still vastly outnumbered bysmall, independent service providers in most tourism destinations.
2.2 Travel and Tourism Industry Growth Pattern
International travel and tourism has had a remarkable record of consistent growth, expanding fasterthan the world’s GDP in the last four decades (Vialle). During the last 40 years, travel and tourismhas been growing 7.2% in volume and 12.3% in value per year (Vialle). Massive tourism startedafter World War II, with only 2 million international tourists during 1942. Eight years later, in 1950,the industry had multiplied 12 times to 25 million world tourists. Twenty years later, in 1970, thenumber more than quintupled to 175 million tourists.
Today this number has more than tripled to 594 million tourists around the world. “Internationaltourists have increased by more than 1500% in the past thirty years” (Lickorish, 37). In the UnitedStates alone, over the past decade, world tourism arrivals have grown by 72% and internationaltourism receipts are up 217% (Dogget). Travel and tourism’s constant growth shows strongresistance to economic fluctuations. Only twice has its growth rate decreased: during the Gulf Warin 1991, and during 1993´s economic recession in the developed world (WTO, 1997).
The international tourism industry has grown consistently, but not homogeneously. Industrializedcountries are losing a small percentage of their substantial market share to developing countries.International tourist arrivals to developing countries have increased at an average of 6.2% annuallyduring the last 16 years, faster than the 3.8% average rate of developed countries. Tourism receiptsalso increased faster from 1980-1996 in developing countries, with an annual mean of 9.9% versusthe 8.5% annual mean of developed countries.
Moreover, within developing countries, practically all of the increase in tourist receipts in the lastsixteen years corresponds to Asian/Pacific countries (except China), which rose from 7.4% in 1980to 14% in 1995, capturing half of developing country receipts in 1996 . The same pattern occurred intourist arrivals: from having 6.1% in 1980, the region increased its market share to 10.3% in 1996,and captured one third of 1996 developing countries tourist arrivals.
Latin America and the Middle East are the regions losing most of their market share of developing

5
countries tourist arrivals and receipts to the Asian region. However, all developing countries haveincreased their growth rates of arrivals and receipts. Africa, for example, has the highest percentagegrowth of tourist arrivals and receipts from 1995 to 1996 in the world.
The forecasts for the tourism industry are as promising as its history. “[Tourism’s] GDP contributionis forecast to grow at a healthy 46% in real terms over the next decade” (Cummings and Mills). TheWTO forecasts that tourism’s absolute contribution to the world economy will have more thandoubled by 2005, having US$7.1 trillion in gross output, employing 305 million people, generating11.4%of global GDP, US$1,613 billion in investment, and US$1369 billion in tax revenue(www.wttc.org/wttcgate.nsf, 5/2/97). The high-flying region will be Asia, where growth between7% and 10% is expected, that will eventually lead the region to capture half of international travel by2005 (Lipman).
Tourism’s historic and expected future growth rates have brought much attention to the industry as aphenomenon. Tourism is now being investigated in scholarly communities worldwide. FuturistJohn Naisbitt predicts “the 21st century economy will be driven by 3 super service sectors:Telecommunications, Information Technology, and Travel and Tourism” (WTTC).
2.3 Economic Impacts of Travel and Tourism
The economic and social effects of traveler’s money on consumption, trade, investment, taxation, andemployment are enormous. Tourism, being a labor-intensive industry, has above average potential tocreate employment. “Tourism is the world’s largest generator of jobs” (WTTC). It creates jobsdirectly in travel and stimulates jobs across the economy in other related sectors; this underliestourism’s added value as a job creator. The wide range of transactions undertaken by or for travelershas an impact on construction, telecommunications, agriculture, retail, and others. Kodak and Fujiowe much of their job security to tourism; 50% of all photographs are travel related (Cummings andMills).
Tourism is an important job-creating tool because it can be targeted to particular regions bringingjobs and infrastructure to locations that were never imagined. Many developing countries usetourism to create jobs and gain transfer of technology. Mexico planned and developed its top touristdestination, Cancun, in large part by offering land at negligible prices in exchange for the jobs andknow-how associated with large international service providers constructing and operating theirbusinesses there.
Tourism’s annual employment growth rate of 5.2 %, is 50% faster than the world annual employmentgrowth rate of 2.45%. Over 100 million new tourism jobs across the global economy are forecastedover the next decade. Besides tourism’s importance in job creation, the industry’s multiplier effectintensifies tourism’s contribution to national and local income. Since tourist consumption moneywill be re-spent again, this will increase national tourist consumption by a factor equal to the tourismincome multiplier. The benefits of the multiplier depend on the amount of tourist revenues that leakout of the economy through savings, taxes, and imports.
Economies with high leakage, that depend on imports, have high taxes and/or savings rates, have alow multiplier effect and therefore receive fewer benefits from tourism. This is the case for mostdeveloping countries, were large hotel chains import most of their raw materials and take most oftheir profits to their home country. In industrialized countries, the multiplier effect is between 1 and2.5, while in most underdeveloped countries, it is much lower. The World Bank calculated that

6
“approximately 55% of gross tourism revenues to developing countries leak back to developedcountries” (Ziffer).
The effect on a country’s balance of payments is another important economic impact of tourism.When a tourist spends money in another country, it is a debit on its country’s BOP, and a credit onthe tourist destination BOP. Expenditures by nationals on foreign tourism are imports, and foreignerexpenditures in the home country are exports. A country that increases the rate of internationalarrivals is exporting more tourist services. Tourist service export is the major source of strongforeign currency entrance to most developing countries, more important than traditional exportingproducts (WTO, 1997).
Finally, the travel and tourism industry affects societies by the economic externalities that it carries.Externalities are positive or negative impacts that affect non-participating parties (Ziffer). Positiveimpacts are the advantages of having tourism, and are not a problem like the negative impacts.Physical damages to public natural resources due to tourism is an example of an economic loss borneby the local community, that tourists may not be forced to pay. An increase in prices due to a newdemand of wealthy tourists, is a pecuniary externality that locals must pay for, too. Communitiesmust develop public or private methods that force their tourists to bear the full costs of their trip.
Tourism’s economic and social consequences are just recently beginning to be recognized.Governments now have a direct interest in the development of tourism within their country. It isevident that “21st century job-creating strategies should highlight the new service sectors likeTelecommunications, Information Technology and Travel and Tourism” (Cummings and Mills).
2.4 Travel and Tourism Industry Segmentation
To segment is to divide the potential market of a product or service into a number of subgroups, ashomogeneous as possible (Tabares). It is a useful tool for marketing mass-oriented products orservices like tourism. The tourism market is already heavily segmented, and it is segmenting evenmore as people become more sophisticated in their holiday expectations. This study categorizesinternational tourists into five different segments according to the objective of their trip. Thesegments are the following:
Business Tourists- This segment accounts for 30% of international travel (McIntyre). Thetourist travels to do business, attend a business-related convention, or enjoy a paid vacation.
Holiday Tourist- 70% of international tourists is in this segment. Holiday tourists aredivided into traditional tourists --taking sun and beach vacations, doing urban sightseeing-- or specialinterest tourists --those who prefer to take advantage of their vacation doing something different oftheir interest. Within the special interest segment, five different sub-segments are evident:
Cultural Heritage Tourism - people who travel to experience, and learn from a new culture.
Sports Tourism – tourists who want to play a certain sport, like ski, or want to watch a sport, (e.g. theOlympic Games).
Professional Interest Tourism – professionals traveling to visit places that are related to theirprofession, like an architectural landmark to an architect, or Venezuela to a Spanish languageteacher.

7
Health Tourism – people who travel with the purpose of feeling better at the end of the trip; likegoing to a spa to cleanse the body with healthy food, practicing yoga, and/or simply relaxing.
Nature Tourism – nature lovers who travel with the only intention of having contact with nature; likevisiting the Grand Canyon, observing elephants on an African safari, or touring the National Parksystem of Costa Rica.
Duty Tourism- Tourists with the purpose of accomplishing a family or religious duty. Thissegment, along with the Academic and Medicinal segments, accounts for 10% of internationaltourists. (Note: Business traveling is also considered a duty, but its high participation in totalinternational tourism makes it a different segment).
Academic Tourism- Tourists who are traveling with the purpose of learning or teachingsomething. It includes students, researchers, and teachers.
Medicinal Tourism- The purpose of this traveler is to be cured of a sickness or injury, orreceive medical treatment.
The cultural heritage and the nature sub-segments of the holiday tourist segment, when combined,create the ecotourism sub-segment of the market. This combination follows from the EcotourismSociety’s definition of ecotourism. With this in mind, it is possible to categorize the elements withinthis sub-segment as follows:
Hard ecotourism: Involves an intense or scientific interest in nature, sometimes strenuousphysical effort and some non-hotel accommodations. Some of the activities included in this segmentare bird watching, nature photography and botanical trips. The butterfly farm visitors are not includedin this segment because there are not many tourists who come specifically to see butterflies (JimWolf, Mariposario de Monteverde). During the last few years this type of tourist has been demandingmore amenities, now often expecting to have a comfortable hotel for accommodations. (Piza,07/1997). This has raised the price of doing business, especially when combined with the need forspecialized guides that charge more for the trips, and the orientation to destinations that are moreinaccessible and create higher transportation costs.
General or soft ecotourism: This segment is growing faster than any other and includes thetourists who want to observe wildlife, a natural environment or a culture closely, but casually. Hikingis the most common activity, and may be combined with any of the activities in the hard ecotourismcategory, but is generally less intense, less deeply educational, and may not be the only type oftourism activity for which the trip was taken (i.e. a soft ecotourism activity may be followed by aweek at a beach resort).
Adventure ecotourism: Involves moderate- to high-risk activities like surfing, scuba diving,snorkeling, wind surfing, whitewater rafting, sport fishing, kayaking and canoeing, bungee jumping,and boldering. Usually this type of tourist is less interested in the complexity or structure of theecosystem where the activity is taking place, but will take steps to learn about the fundamentals ofthese issues in order to protect the future availability of their favored outdoor activity. Whether thistype of activity can rightly be considered ecotourism has been debated because some of the activitiesincluded in this segment don’t fit the principle of respecting to the natural environment withoutchanging it.

8
Educational ecotourism: Describes the trips organized by educational or other type ofinstitutions that involve formal lectures of topics related with the environment. This segmentincludes scientists who come for research purposes and for extended stays in the country.

9
3. Important Driving Forces Behind Tourism’s Northern Actors
Industrialized countries’ tourists, businesses, governments, and NGOs are the main force behindworld travel and tourism. They are the force that created, developed, and run the largest industry inthe world. Their own driving forces determine the direction and magnitude of tourism shifts. Whatare the changes and conditions that influence northern actors in their decision-making, and, therefore,affect the tourism industry? Northern countries’ economic health, industrial and technologicalprogress, northerners’ values and lifestyle patterns, demographic changes, product differentiation andsegmentation, and globalization are the six main driving forces behind tourism’s northern actors.
3.1 Northern Economic Health
The industrial revolution that northern countries started at the turn of the 20th century led themthrough constant economic expansion and to the large and diversified capitalist economies they havetoday. The United States has been growing at a constant 2.9% annually for the last century, makingits GDP multiply 13 times in the last 35 years (U.S. Bureau of the Census). Japan is another successstory, increasing its per capita income from US$2,540 in 1972 to US$28,190 in 1992 (World Bank).
Industrialized countries’ economic success has greatly affected northern people, businesses andorganizations, and, therefore, their decisions. The constant increase in industrialized countriescitizen’s disposable income and leisure time expanded northerners’ opportunities and alternatives.This incredible wealth is a major driving force behind northerners’ investment and consumptiondecisions. Northern tourists have the greatest amount of income available (Clech), and as a result“tourism rose in the scale of consumer preference, from a luxury to a necessity, [becoming] anessential part of a new mobile way of life” (Lickorish, 38).
“50% of Europeans go away on a holiday, 40% of them taking trips abroad” (37). In 1992, Europeproduced one third of the world’s GDP, and accounted for 56% of the US$152 billion spentworldwide in tourism. It is evident that national and world economic health, exchange rates, andmarket changes influence tourism buying behavior (Cook). In 1988, 75% of Japanese travelers saidthey had increased their traveling because a strong yen had made traveling abroad inexpensive(Ohashi).
Also, only twice in this century has international tourism’s growth rate slowed down: during the1991 Gulf War, and the 1993 industrialized countries’ recession (WTO, 1997). Both of these eventsthreatened the economic well being of northerners, and therefore they reduced their internationaltraveling consumption. In conclusion, the travel and tourism industry has grown at the rate ofindustrialized countries’ growth, and its optimistic expected future growth is also based on northerneconomies promising forecasts. It is evident that northerners’ decisions and consumption patternsare a function of the economic health of their countries.
3.2 Northern Industrial and Technological Progress
This century’s economic expansion not only brought an incredible amount of wealth to northerners,but also unimaginable industrial and technological progress. New revolutionary products andservices -airplanes, cars, computers, fax machines, and credit cards to mention a few- are constantlychanging the way of doing things in industrialized countries. This steady industrial and technologicaldevelopment is the second major driving force behind northern actor's decisions. It has multipliedthe types of activities northerners can engage in, and lowered the price of doing them.

10
In particular, technological development has transformed the travel and tourism industry. “Aviationbecame established, with almost complete transfer of long-distance passenger traffic to the air. Thewide bodied jet aircraft dramatically reduced the cost and time of such travel” (Lickorish, 38).Traveling across the United States, a pilgrimage that took months sixty years ago, can be done in afive-hour flight today. This progress has revolutionized the magnitude and scope of business andtourism. The industrial and technological revolution is constantly enriching and easing northerners’lives and businesses, in turn influencing their consumption decisions.
3.3 Northern Values and Lifestyle Patterns
However, not only external factors--like the size of their disposable income or the creation of newproducts or services at lower prices--affect northerners in making their consumption and investmentdecisions. Northerners are also influenced by their own values and lifestyle patterns. Even thougheach person, or organization, has a unique life led by unique sets of beliefs, there are four values thatappear to influence the majority of northerners. Individualization is one of them. As northernersdeveloped, the economic dependence on the family diminished, elevating individual goals overfamily or group goals.
Northerners have the opportunity to identify and develop their own personal interests. They study,work and live to reach their own personal goals, and therefore became very independent in theirdecision making and lifestyle patterns. Today, the tourist market is expanding because more youngpeople and women in ascendancy are traveling (Lipman). The idea of a woman anthropologisttraveling independently to study a site, or an adolescent to do water rafting, was not common severalyears ago. Today, this independence represents one of the most valued principles in the north.
The importance given to education and active learning is a second value seen in the majority ofnortherners. They demand products and services that provide them with new educationalexperiences. Northerners want more activity- and learning-oriented tourism, in which theyunderstand and take advantage of the location they are visiting (McIntyre). “[A] 1988 surveyconducted by the National Tour Association found that 93 percent of those queried believed that theopportunity to learn while traveling was an important consideration in their travel choices” (Ayala,50). A third value evident in most northerners is environmental awareness. “Environmentalprotection has become what politicians call a ‘consensus issue’” (Cook, 127) to northerners, and theywill change their buying or investment decision if they see a negative environmental impact.
“Studies of the German and American travel market indicate that environmental consideration arenow a significant element of traveler’s destination-choosing process, down to –in the case ofGermans- the environmental programs operated by individual hotels. Moreover, environmentalquality is now a decisive factor in destination choice for one out of every two German tourists”(Ayala, 50).
Moreover, this environmental awareness has increased parallel to the growth of northerners’ interestsin nature. “[M]illions of Europeans are active ornithologists, wildlife photographers, and haveconservation interests,” (Travis, 34) and 72% of Japanese overseas trips are with the purpose ofenjoying nature (WTO, 1994). The final important lifestyle pattern influencing northerners today istheir increasing concern about fitness and health. They “want to be more healthy, eat better foods,enjoy pure air and water, take exercise, diet, enjoy nature” (Travis, 33). Science and medicinealerted northerners of the physical problems related with overweight, stress and habits. Health and

11
spa tourism used to be only medicinal, remedial and curative. Today, northerners engage in health-tourism for more holistic purposes. They want tourism involving recreational activity, sport,exercise, and to become educated on control of habits, renewing the mind, and dealing with stress.
3.4 Northern Demographic Changes
Northern demographic changes are the fourth major driving force behind tourism’s northern actors.As demographics change, northerners make different consumption and investment decisions as agroup. The northern consumer has changed and therefore there has been a change in the demand fortravel and leisure activities. Current northern demographic changes have benefited the travel andtourism industry because the total number of international tourists has increased, and the types oftourists have diversified. One major demographic trend is the aging of the northern population(Cook).
There is a greater number of active and relatively well to do senior citizens, increasing the seniormarket demand for leisure products and services (Lickorish). Mature northerners will be a primemarket for the travel industry particularly because of their increasing purchasing power and theirgood health conditions (Cook, Clech). They are already a good and stable market for many tourismsectors, but they will be much larger, stronger, and diversified in their travel preferences.
Another demographic trend is the increase of northern women working and becoming independent.“Women will account for 47% of the US labor force at the turn of the century” (Cook, 122). And,with global business expanding, the number of business travelers, and businesswomen, will increase.Also, as mentioned above, younger people and women are traveling to places they never chosebefore.
Finally, the number of Americans in their peak earning years, from 45 to 54 years, have increaseddramatically during the 1990s (Cook). Reaching this age, experts say the “Baby Boomers” willincrease their savings and recreation demands. However, they will have less leisure time, and willdemand a greater number of shorter vacations per year. Also, early retirees are entering the tourismmarket with better health and wealth (Lipman). Northerner’s socio-demographic changes greatlyinfluence their consumption and investment decisions.
3.5 Globalization
For northerners, the world is much more accessible today; they can go to or read about any place theyare interested in. The media brings detailed scenes of what used to be remote locations into northernhomes, while northern universities teach Swahili and global politics. Northerners know that theirlivelihood opportunities and alternatives are no longer limited to their country or origin, but extendthroughout the world. Globalization is the sixth driving force influencing northern consumption andinvestment decisions.
A world with fewer trade and technological barriers opened up thousands of investment opportunitiesfor northern businesses around the world, and increased their competition as well. Globalization hasalso broadened the scope of action of northern governments and organizations. Northerners havebegun to take responsibility for global problems they did not even recognize fifty years ago. Theglobal environment and economic development of poorer nations are on the agenda of northernorganizations today. This wider scope of action – that includes the world-- has greatly influencednorthern consumers, businesses, governments and NGOs in their decisions.
12
3.6 Product Differentiation and Segmentation
Today’s marketers attract their customers by differentiating their products or services from thecompetition. Products and services are designed with unique characteristics to attract the segment ofthe market that considers these features important. Northerners have a shampoo, a computer, a car,or a stereo for each type of person in the market. This marketing strategy has greatly influencednorthern consumption and investment decisions. It has increased the number of products offered inthe market, and the sophistication of the requirements of northern consumers. Product differentiationand segmentation is the fifth major driving force influencing tourism among northern actors.Tourism planners differentiate themselves according to the new trends and values of northerners.Today, niche marketing has replaced mass marketing of tourism (Ayala). It is a strategy thatpositions the destination in the market by responding to the current diversification of tourists’demand.

13
4. Trends in Northern Tourism Markets
The driving forces described above are changing northern tourism actors and shaping today’s tourismmarket. How have these driving forces influenced today’s tourism market trends, northern tourismbusinesses, northern governments and NGOs?
4.1 Tourism Market Trends
The determinants of demand have changed to benefit tourism. The driving forces have allowed anexpansion of the market to include many more people, and to allow a high level of segmentation.Tourism demand as a whole has dramatically increased due to northerner’s economic success, newtechnologies, and globalization. A large mobile population of sophisticated foreign travelers hasbeen created.
Tourist attractions around the world have changed and developed to satisfy these new geographic andactivity-based market segments, each with their own characteristics and motivations. Traditionalforms of tourism --resorts and urban sightseeing-- remain popular, but have been enriched to satisfytourists’ expectations of environmental awareness, more individual expression, possibilities to learn,and recreation activities. They offer experiences that were considered special interest tourism before.
Special interest tourism emerged a decade ago to satisfy the wide range of activities northerners want(McIntyre). It has grown rapidly to become a collection of unique travel experiences for each tourist(Forbes). Today, special interest tourism takes the client to more exotic and remote places, whileproviding deep educational experiences. Northerners see special interest tourism as a gateway tonew experiences. Adventure, rural, cultural, health and natural tourism are the segments of specialinterest tourism that are penetrating traditional tourism markets today (WTO, 1994).
Northerners’ new lifestyles and values are the main driving force behind these new types of tourism.As northerners have become more individualized, they prefer products that address their specific,individual needs. They want more custom-made tours that allow them to investigate, practice orexperience their own special interests. Tourists want individual expression, more opportunities tolearn, and more activity, and increasingly reject mass-oriented generic tours.
Nature tourism and ecotourism are high growth areas within special interest tourism. Ecotouristsemerged simultaneously with the growth of the environmental protection movement, and the highereducational levels of northerners (WTO, 1994). Northerners’ interest in natural environments andtraditional cultures takes them to less developed places that lack mass tourism infrastructure. Forexample, in the United States nearly 6000 birdwatchers from 35 states and 5 foreign countriesflocked into High Island during the two-month spring season in 1992. They spent about $2.5 millionin the area, even though High Island has only one restaurant and one motel (Dickinson andEdmondson, 47).
While accurate figures on the number of ecotourists globally are difficult to obtain, it was estimatedthat there were 235 million worldwide ecotourists in 1988, with an economic impact of US$233billion that year (Eagles, 9). Even though this was a small percentage of the total number ofinternational tourists that year, their high rate of growth and affluent character has attractedsubstantial commercial attention (Ayala). Moreover, ecotourism is a new platform for enhancing thecompetitive strength of countries and regions as international destinations because very littleinfrastructure is required, and the economic benefits seem to be higher due to lower leakage.

14
Like nature tourism, cultural tourism has expanded very rapidly. There has been a dramatic growthin cultural tourism in the US travel market, directed towards experiencing the arts and heritage of alocation. It “is the hottest growing area right now in travel and tourism” (Goeldner, 64). Northernersdo not want to simply see or eat something new: they want to be linked to the different culture andrespect their values, literature, music, arts and crafts (Travis). They seek different places, events, andexperiences that have a strong identity.
4.2 Northern Tourism Business
Northern tourism businesses --airlines, hotels, car rentals, and restaurants-- have changed theirinvestment decisions due to these driving forces. “Consumers today are discriminating anddemanding. They have a strong sense of value and believe in spending their hard-earned money onhigh quality, time efficient and environmentally sensitive goods and services” (Cook, 125). This iswhy environmental awareness has become essential in northern tourism management.
The travel and tourism industry will be forced into environmental responsibility because touristsincreasingly demand it. “The great love affair between Americans and wildlife is why 11 majorcorporations [contributed] $3.6 million [in 1996] to the Nature Conservancy, up from 3.1 million in1995” (Dickinson and Edmonson, 48). British Airways worked its way to be in the top 20% of thecompanies the London Stock Exchange monitors for environmental responsibility, and be ranked bythe UN among the top 5 worldwide companies that report on environmental issues (Douglas). Theairline’s voluntary standards of environmental awareness will give the company monopoly rentswhen northerners demand only environmentally friendly airlines, a growing trend.
4.3 Northern Governments and Organizations
Throughout the world, governments are increasingly recognizing the role of travel and tourism, andare making it a strategic development priority. It powerfully stimulates growth and jobs through themultiplier effect. Strong foreign currency enters the country, and as exports increase, it benefits thebalance of payments. Since 1992, the governments of Australia, Argentina, Brazil, China, andJapan, have been heavily promoting this sector (Lipman). Moreover, tourism may represent anopportunity for comparative advantage and competitiveness among underdeveloped countries.
The governments of the United States and the European Union, the regions most benefited bytourism, have been the latest to recognize the industry’s importance. Tourism in the United States isthe top service exported, and the second largest employer (Dogget). This success seems to come inspite of a lack of government support. In May of 1996, the US Commerce Department eliminatedthe US Travel and Tourism Agency, making the US the only major country in the world without anational tourist agency. The European Union is beginning to wake up to tourism, after a steadyerosion of its market share (Lipman).

15
5. Factors Affecting the Demand for Costa Rica’s Ecotourism
There are plenty of international and national factors affecting the demand for Costa Rica’secotourism services (Lindberg and Hawkins). International changes occurring worldwide thatconstantly influence ecotourists’ demand function were mentioned above as driving forces.Ecotourists’ income, environmental awareness, image and perception of uniqueness of thedestination are proportional to the demand for nature tourism; while the cost of traveling is not.
Like international factors, the conditions at the country of destination also affect the ecotourismdemand function. An increase in the quality of the ecotourism experience will lead to an increase inecotourists’ demand. The same thing happens with the quality of the attraction: as it becomes better,more visitors will want to visit the attraction. The country’s political and economic stability alsoinfluences ecotourism demand. Tourists do not want to be in danger and will significantly reducetheir demand if they feel insecure. Finally, an increase in the demand for an attraction will lead to anincrease in the demand for complementary tourism goods and services. An ecotourist has paidsignificant costs to be in the country and to visit a particular destination, and therefore will try to getthe most out of his tourism experience by visiting other parks, restaurants, and purchasing relatedgoods.
Costa Rica has good conditions for attracting international Ecotourists. The country has a very goodimage in developed countries; most importantly it has an excellent reputation within the NorthAmerican tourism market (Lindbergh and Hawkins). Moreover, its attractions and ecotourismexperience are satisfactory for Ecotourists. A 1996 survey made by the Costa Rican TourismInstitute to international travelers indicated that 53% of the foreigners interviewed evaluated theprotected areas as excellent, and 40% as good (ICT, 1995).
The ecotourism experience in Costa Rica is different from other types of tourist experiences. In othernature-oriented destinations, like Africa, the tourists will always encounter animals and even have tobe protected from them. In Costa Rica the tourist must emerge himself into the rainforest to see thebiodiversity of plants and insects. Ecotourists must search for the species they want to see. Thismakes Costa Rica less expensive compared to Africa (even exclusive of transportation), but moreexpensive than mass tourism destinations like Cancun (Piza, 11/01/97)).
As with any commodity, mass production of tourism reduces the costs and increases competitivenessin the market. The ecotourism experience is differentiated from mass tourism by includingpersonalized services, a site of exceptional value, and a low cultural impact. Moreover, theuniqueness of the Costa Rican attractions is also a factor behind its higher price. Costa Rica’scompetitive advantage is its high biodiversity located within small distances, which makes theattractions easily accessible to the ecotourist. Finally, Costa Rican tourism-related industries shouldrecognize the increase in demand for their products as complementary goods and services forecotourism. According to Boo, in the majority of protected areas, tourists are not given enoughopportunities to spend money.
Today, the managers of Costa Rican protected areas cannot use a systematic analysis of the demandfactors of ecotourism, because no such analytical tools exist (Lindberg and Hawkins). Decision-makers must use their intuition and knowledge of the ecotourism market to know the importance ofeach demand factor and respond to it efficiently. However, the initial results of a Costa Rican surveysuggest that the most important demand factors that influence the appropriate fee level are the

16
tourists’ income, the quality of the experience, the tourist’s age and year of education, and thenumber of protected areas visited in Costa Rica.
17
6. Definitions of Ecotourism in Costa Rica
The definition of ecotourism is widely known by ecotourists. They know that “[e]cotourism isabout creating and satisfying a hunger for nature, about exploiting tourism’s potential forconservation and development, and about averting its negative impact on ecology, culture andaesthetics” (Lindberg and Hawkins, 8). The Ecotourism Society gives the most widely accepteddefinition of ecotourism: “responsible travel to natural areas which conserves the environment andsustains the well being of local people” (8).
Lewis Stringer (1994) makes clear in his work, Tourism in Costa Rica: Vanguard or Old Guard, thatthere is no single universal definition for ecotourism in Costa Rica, and the term ecotourism has asmany different meanings as people want to give it. The concept is often presented ambiguously inthe media and in the tourist industry itself. Tour operators and government agencies in Costa Ricause the term to attract a growing population of travelers who are concerned with the environment.The incentive to do so is great, as shown in a study by the Travel Industry Association of America(1991) which demonstrates that 85% of travelers were predisposed to pay more for the “privilege” toexperience a well-preserved natural environment.
The problem arises when the supply side of tourism, that is all the tourism-related businesses, defineecotourism. Since there are no widely accepted principals that define an ecotouristic hotel,restaurant or attraction today in Costa Rica, many establishments brazenly promote themselves as“green” or ecotouristic without backing up their claims.
The supply of ecotourism services in Costa Rica began with hard-core ecotourism offerings. Theeconomic benefits that ecotourism brought gave incentives to other tourism businesses, referred toby many ecotourism pioneers as “greenwashers,” to capitalize on the image the pioneers had createdand abuse the concept of “eco” and/or “sustainability” to capture more rents (Piza, 11/01/97).Greenwashers are free-riders on the public good—the global image of Costa Rica as an Eco-destination—created by the early ecotourism providers.
Difficult questions are raised by this greenwashing phenomenon. Most notably, when largeinternational tourism service providers raise their brand flags in Costa Rica, then promote theseservices to potential consumers in developed economies, they tend to promote their offering cloakedin a green cape. They promote their service in the context of ecotourism. Naturally, they want tocapitalize on peoples’ interest in Costa Rica as a natural destination. But critics are concerned thatthese organizations are capturing rents from the investments made by ecotourism pioneers, many ofwhom committed life savings to the purchase and protection of rainforest (often at suboptimal ratesof return when compared to conventional investment returns).
These newer entrants into the tourism economy of Costa Rica, however, may be making unnoticedcontributions that will help the pioneers realize their fair returns. Given a limited national budget fortourism promotion, the private promotions of Costa Rica (for example by tour wholesalers/operators,or hotels) as a natural destination has undoubtedly led to greater visibility and probably increasedvisitation as well. These visitors spend money visiting protected areas. There is no easy way tocompare the value of land protection investments with promotion expenditures, so the frictionbetween hardcore and softcore operators catering to eco-conscious travelers is likely to continue.
Increasingly, however, it may be difficult for greenwashers to get away with unsubstantiated claims.The Costa Rican Tourism Board will officially launch the Certification for Sustainable Tourism

18
during 1998 that will attack directly “greenwashers”. This optimistic program will classify tourismbusinesses on their degree of sustainability. The program will create standards that will definetourism businesses. It will also assure that the expectations of future ecotourists have when comingto Costa Rica will be fulfilled; that is that both- the supply and demand- will have the samedefinition of ecotourism.
For the purpose of this study we will define ecotourism as the Ecotourism Society does, bearing inmind that responsible travel is characterized by visitors having the motive to understand the culturaland natural history of the environment.

19
7. Key Actors in Costa Rican Tourism and their Policies
The two public sector actors that most directly impact tourism are the Costa Rican Tourism Board(ICT), and the Ministry of the Environment (MINAE). While there are other governmental agenciesthat have a strong influence on the sector (e.g. public safety, infrastructure, etc.), these are the twowith the most direct stake and impact.
7.1 Costa Rican Tourism Board (ICT)
The ICT is a Ministry of the federal government whose budget comes primarily from taxes ontourism activity. The ICT is responsible for tourism development and regulation in Costa Rica,tending to such issues as transportation, infrastructure, foreign investment, promotion/advertising,and zoning.
Although ecotourism is the niche that put Costa Rica on the map of the global tourism industry, ithas not been the focus of the development efforts of ICT in the past. Incentives provided forinvestment by ICT were typically designed to attract large scale, mass-tourism style destinationdevelopments, rather than ecotourism development. These large projects, both conceptually andpractically speaking, do not tend to be consistent with the image or reality of ecotourism asoriginally pioneered in the country.
However, in the last few years, the ICT has changed it policy regarding tourism to promote andguarantee that the concept of ecotourism retains integrity. Today, nature figures prominently in theinternational promotional campaigns for Costa Rican tourism, and the ICT is launching a regulatoryinitiative that is the hallmark of the ICT’s attention to ecotourism. The ICT's Natural ResourcesDepartment created the Certificate for Tourism Sustainability (CST) as a tool for guaranteeing thatmass tourism or “greenwashing” will not destroy ecotourism.
7.11 Certificate for Sustainable Development
Analyzing the tourism trends in Costa Rica for the last five to ten years, the ICT recognized threeevident trends (Lizano, 1998). The first trend is a change occurring in worldwide tourism due to newdriving forces in the north. The WTO estimates that non-dominant tourism (which includes all thenew forms of tourism that are not sun and beach) will grow at a rate of 25% to 30% annually, whiletraditional tourism will grow at a rate of 2% to 4% annually.
The second trend the ICT recognized is that tourism in Costa Rica in the last ten years has beenmostly ecotourism. “All tourist attractions in Costa Rica are based on natural resources”, and ICTsurveys found out that more than 70% of tourists that come to Costa Rica are interested in non-dominant tourism (Lizano, 1998). Moreover, Costa Rica’s tourism infrastructure is mostlyecotouristic: 80% of Costa Rican hotels have less than 40 rooms. The third evident trend in CostaRica in the last ten years is the emergence of “greenwashers”, businesses that --without beingecotouristic-- take advantage of Costa Rica’s ecotouristic image and use it as a marketing tool.
Recognizing these three trends in Costa Rica’s tourism, the ICT knows that it is in the best interest ofCosta Rica, being a mainly ecotouristic destination, to maintain its position in the nature tourismmarket because of the wonderful growth perspectives the ecotourism segment has. The ICT alsorealized that greenwashers, not being ecotouristic but claiming to be so, lower the quality of Costa

20
Rica’s ecotourism and could eventually damage Costa Rica’s good reputation as a nature tourismdestination.
From this analysis, the ICT recognized that tourism has economic and conservation elements thatneed to be in balance, and are not in balance at the time in Costa Rica. Today, there is much moreinterest and activity in the economic aspects of tourism, while the conservation aspects, whichinclude the maintenance of the natural resources, culture and society, have been forgotten. The ICTclaims that the imbalance of the economic and conservation elements of tourism is the main problemof Costa Rica’s tourism. It is the reason why greenwashers claim to be ecotouristic only to increasetheir rent capture, without doing any conservation activity.
The ICT envisioned a program with the main objective of balancing the economic and environmentalelements of tourism in Costa Rica: “[i]t is time to change the tourism tide to a more integral one,namely, sustainable tourism” (CST,2). The ICT defines sustainable tourism as
“the balanced interaction of three basic factors within the tourism industry: 1-Proper stewardship of our natural and cultural resources; 2- Improvement of the quality of life of the local communities; and 3- Economic success, that can contribute to other programs of national development ” (CST,2)
To reach such vision, the ICT is currently implementing the Certification for Sustainable Tourismprogram (known also CST), with the main objective of turning the concept of sustainability intosomething real, practical and necessary in the context of a country’s tourism competitiveness. Theprogram aims at “improving the way in which the natural and social resources are utilized, tomotivate the active participation of the local communities, and to support the competitiveness of thebusiness sector” (CST,2).
The CST program categorizes and certifies each tourism company according to the level of impact ithas on sustainability. Four fundamental aspects of sustainability are evaluated through aquestionnaire:
“1- Physical-biological parameters, evaluates the interaction between the company and itssurrounding habitat;
2- Infrastructure and services, evaluates the management policies and the operationalsystems within the company and infrastructure
3- External clients, evaluates the interaction of the company with its clients terms of howmuch it allows and invites the client to be an active contributor to the company’s policies onsustainability;
4- Socio-economic environment, evaluates the interaction of the company with the localcommunities and the population in general” (CST,3).
The performance on each field will be graded on a percentage basis. The tourism companies areclassified into five sustainability bands, granted by using the lowest percentage achieved in the fourfields evaluated. The following table shows the five sustainability bands and the correspondingpercentage of fulfillment needed to obtain each band.

21
Certification on Sustainable TourismSustainability Bands
Band % fulfillment0 20%1 20% - 39%2 40% - 59%3 60% - 79%4 80% - 94%5 more than 94%
In terms of sustainability, the degree of fulfillment represented by each band should be concomitantwith the different aspects mentioned. For example, to achieve a band 3 category, it is necessary tocomplete at least with 60% of the established conditions for the four areas evaluated. Using thelowest percentage of fulfillment in the four levels gives incentives for equal development in the foursustainability aspects. After the evaluation and classification, the tourism company will be given asticker with the logo and level of band achieved.
The ICT plans to have private companies doing the questionnaires, while a committee of fourspecialists in each of the four aspects will audit the results of the classifications. Moreover, this ICTcommittee will be monitored by a higher committee formed by people form the ICT and othergovernmental and non-governmental institutions.
The planning of the CST program took three years, and its implementation is already started. TheCST program is voluntary so that only interested businesses will join, and its efforts are not ruined bybusinesses that --because of the mandatory requirement-- cheat the authorities. Eventually, the ICTknows that being on the CST program will be necessary to compete. The program was designed forall types of companies in the tourism industry, but the first stage will include only lodgingcompanies. Even though, the CST program has not been officially launched yet, by December of1997, 100 hotels were already inscribed, 31 were visited and 9 were categorized.
The CST program has enormous implications for the Costa Rican tourism sector. The CST is a newway to differentiate Costa Rica’s tourism industry with respect to its competitors. “Undoubtedly, thiswill enhance the country’s image as an authentic destination for naturalist tourists, thus increasingconsiderably the competitiveness of our national tourism product” (CST, 5). It also directly attacks“greenwashers” by providing reliable information on the firms that are really making progress inproducing sustainable tourism. Moreover, the CST motivates tourism executives to improve theiruse of company resources, promoting savings and their efficient utilization. Finally, the CSTprogram will increase the demand, and therefore the development and production, of goods andservices by firms with a sustainable orientation. This will strengthen an industrial sector that operateswithin parameters of sustainability. Tourism will lead the way into making a more sustainable CostaRican economy.
The ICT’s policy, through its CST program, intends to balance the economic and environmentalaspects of Costa Rica’s tourism. Moreover, the certificate will lower the information costs betweentourists and ecotourism hotels and attractions in Costa Rica. In the future, tourists can check theband of sustainability a hotel has and decide if it satisfies them before arriving to Costa Rica.Therefore, their expectations of ecotourism be satisfied: if they choose a level 1 hotel, they know

22
that it will not be as ecological as if they had chosen a level 5 hotel, but it is certainly moreecological than if they had chosen an unclassified hotel. Ecotourists, thanks to the CST program,can be sure of their tourism choices in the future, and will have a smaller probability of beingdisappointed.
7.2 Ministry of the Environment (MINAE)
MINAE is responsible for managing the protected areas system of the country. Within MINAE, SINAC wascreated to manage more than one hundred protected areas that are divided into 11 Conservation Areas. Theyinclude all the national territory in addition to the protected areas, so that conservation as an integratedprocess is guaranteed. This integration is meant to coordinate with other agencies, including:
The Governmental Forestry Administration (AFE), in charge of the conservation of the forestryresources of the country. The AFE manages with the National Fund for Forestal Financing (FONAFIFO).
The Director General for Wildlife (DGVS) which plans, develops and controls the flora and fauna ofCosta Rica. The DGVS manages the Wildlife Fund.
The National Park Service (SPN) is in charge of the development and administration of NationalParks, assessing in legal and policy issues to MINAE. The SPN manages the National Parks Fund, which in1996 had a deficit as a result of a decrease in the entrance fees.
SINAC needs better infrastructure and visitors’ services to achieve a proper conservation of the areas theymanage. The total system expenditures during 1996 were nearly US$ 11,000,000. Nevertheless, SINACfunds are inadequate either to finish buying appropriated lands or to finance operating budgets, includingbasic protection. SINAC needs to spend approximately an additional US$ 2,000,000 on infrastructuredevelopment to meet its objectives (Olson). From the 126 different protected sites in Costa Rica, there areonly 25 with finished General Managerial Plans, and only 3 which are officially declared in status ofprotected areas in Costa Rica (MINAE). Detailed plans exist, but no funds are available to carry out theseplans.
In Costa Rica ecotourism has been linked to the development of the National Park System. The firstprotected area dates from 1963, and since then new areas have been added up to compile 126different sites. While tourist arrivals grew, and it was obvious National Parks had an important roleto play, an antagonistic relationship between tourism development interests and the conservationistsbegan to develop. It was clear that the protected areas system was not designed to accommodate theincreasing number of tourists, but for preserving natural habitat (Rovinsky, 1993). This waspredictable in that neither economic nor social implications had been considered during thedevelopment of the protected areas. It was not until the mid-1980s that MINAE began to takeeconomic analysis of protected areas seriously.

23
Table 3PROTECTED AREAS OF COSTA RICA
Categories Number Extension(1,000 Hectares)
% of TotalProtected Areas
% of TotalCountry
National Parks 23 837 52 16,4Biological Preserves 10 41 3 0,58National Monuments 1 0,3 0 0Forestry Preserves 12 291 18 5,7Protected zones 32 191 12 3,6Wildlife Refugees 34 197 12 3,86Swamps 14 50 3 1
TOTAL 126 1,608 100 31,2Source: SINAC and Bermudez, A. in Monestel; SPN in Lizano, R., 1997.
7.3 National Parks Entrance Fees
By 1993, a tripartite commission was created in which ICT, CANATUR and MINAE could discussthe topics of economic analysis of protected areas with the aim of integrating them into the decisionmaking process. The two major topics selected as top-priority were financing of the protected areas(which covered the economical issue) and negative environmental impact protection (which coveredpartially the social issue). The link between these two topics is the entrance fee policy to NationalParks.
Entrance fees, which are set by MINAE after consulting the tripartite commission, go back to theCosta Rican treasury. The budget that will be spent on national parks is set by the Costa Ricancongress.
Governmental and private institutions set the entrance fee to the various Costa Rican protected areasaccording to the objectives they have. Fees may be set to maximize profit, just like any otherbusiness, or to maximize social welfare. Also, they might be reduced to bring people into the regionand benefit the area’s related industries. Regardless of the objective of setting fees, a “knowledge ofthe demand for the ecotourism attraction will be necessary to set fees. That is, how many touristswill visit the attraction and how much are they willing to pay?” (Dixon and Sherman, 84).
The changes in National Parks entrance fees in the last years and their effect in demand will bediscussed in section 9, Willingness to pay for Costa Rica’s Ecotourism.

24
Table 4NATIONAL PARKS INCOME DUE TO TOURISM IN THE 1990´s
Year Colones(millions)
Dollars(thousands)
Visitors(thousands)
1990 24 242 4531991 40 340 4961992 76 579 6391993 147 1016 7721994 237 1501 7001995 465 2585 6351996 - - 659
(-) No data available.Source: Bermudez, F., 1996; in Monestel, L. 1997.
7.3 Private Sector Actors
There are private sector counterparts to both MINAE, with respect to protected areas, and to ICT. Privatereserves have always existed in Costa Rica, but it is with the concept of “buffer” zones that their importancehas risen as a complement to the large public reserves (Bien). The growth of private reserves has beenexplosive. From the three members the Red Costarricense de Reservas Naturales had before 1980, in 1997there are more than 50, accounting for 1% of the national territory. Property-owners eligible to join theassociation may hold up to 5% of the land in the country.
Table 2PRIVATE NATURE RESERVES : A HISTORICAL REVIEW
1989-90 1991-92 1993-94 1995-96
Number of reserves 15 20 26 29
Per cent increase in number of reserves 33.3% 30% 11,5%
Average price per person $61.5 $61.7 $73.3 $73.3
number of operations for which priceinformation is averaged
10 17 22 26
Hectares of reserve 16,260 436 added 3093 added 745 added
Source: Olson, N., 1997.
There are four categories of private reserves:
1. Non Governmental Organizations (NGO´s): There are approximately 20, and their properties tend to belarge.
2. Ecotourism operators: Bien estimates that there are around 150 in this category with properties averaging200 hectares. They have educational, scientific, conservation or tourist purposes. The capital comes frombanks and investors.

25
3. Conservation-minded landowners. This group of property owners has often inherited their land. Thereare several hundred of them, varying in size.
4. Peasants. Based on a FUNDECOR estimate there are 1,500 landowners who are engaged in some formof land conservation.
Public-private partnerships with regard to protected areas remain untapped opportunities. The potentialpartnerships (De Shazo) could take various forms:
1. Tourist Development Partnership. The park service provides tourist destinations that attract visitors fromwhom the tourism industry benefits through a set of charges and fees transferring financial resources.This already happens in Costa Rica, 60% of the ICT is financed by the taxes on tourism services (forexample, 3% tax on hotel rooms and 5% tax on international travel purchased in Costa Rica). But thereare still centralized structures that do not allow the money to be entirely used for conservation purposes.On the other hand, the concept of user fees plays little part in the actual financing of visitor managementin protected areas. It has been stated that while 70 agencies sell tours to the protected areas, only 5agencies collaborate in some manner with the national parks (Salazar, S., & Evans-Pritchard, D., 1992).
2. Corporate Sponsor Partnerships. This associates National Parks with private, for-profit businesses that
value the protected areas as sanctuaries of the nature heritage. This can be achieved trough contributions,licensing fees, donation of equipment, etc.
3. The Service Provision Partnership. This opportunity involves businesses providing improved or even
new services to the park at competitive prices. This has already been developed in Costa Rica on alimited scale. Volcano Poas is a model of this type of partnership.
The private sector counterpart to ICT is the National Chamber of Tourism (CANATUR), representsthe interests of the private tourist sector as a whole. Politically, it is the most powerful privateinstitution dealing with tourism, and observers claim that it tends to be oriented to the interests ofhoteliers inclined towards mass tourism.
Other private sector institutions include the National Chamber of Tourist Microentrepreneurs(CANAMET), who have in recent years promoted to small firms in the tourism sector the concept ofenvironmentally friendly business practices; the Costa Rican Network of Private Preserves; and adiverse group of local and international foundations, cooperatives and NGOs. Among others thereare the following: Fundación Neotrópica, Ecotourism Society, Fundacion Ebert, Center for TropicalStudies (CST), The National Institute of Biodiversity (INBio), “Universidad para la Paz”,“Consorcio Cooperativo Red Ecoturística Nacional” (COOPRENA), “Fundación TallerInternacional de Servicios” (TAIS), “Asociación Costarricense de Promoción del Turismo”(ACOPROT), etc.
26
8. Major Environmental Impacts of Tourism in Costa Rica
Tourist activity can have impacts of various types: environmental, cultural, economic and social.According to Briassoulis (1992) the environmental impacts of ecotourism are difficult to categorize,identify and measure due to the fact that ecotourism relies completely on the conservation of naturalresources which are generally public property.
Although tourism is in fact an “industry with no chimneys”, it has been widely observed that tourismdevelopment can destroy the environment. The case of the Spanish Mediterranean coast is anexample. Though Costa Rica seems to have avoided the more deleterious effects of internationaltourism present in many other developing countries (Chant, 1992) the country is now at a crossroadson how to continue developing in a sustainable manner. As conservation does not imply preservationand to achieve it there must be an economic input, it seems ecotourism fits perfectly well to fill thisgap. In this section we will try to review the environmental impacts that arise from the developmentof ecotourism in Costa Rica.
The major environmental benefits are:
A) Direct contributions to environmental conservation causes on the part of the tourism sector areone major source of benefits.There are two outstanding examples of such contributions. The “Park Rangers Fund”, administeredby “Fundación Neotrópica” an NGO based in Costa Rica, was launched in 1992 with a combinedgift of US$ 25,000 from Horizontes Nature Tours and Costa Rica Exhibitions, two Costa Rican touroperators focused on ecotourism (Horizontes, 1992). The objective is to improve the living andworking conditions of park rangers. So far the fund has disbursed over US$38,000 as well as over1,000,000 colones.
The second contribution is the ICT´s environmental program, which are very diverse. Someparticular projects include:
The preparation of “General Managerial Plans 1995-99” for the National Parks and“Regulatory Plans for the Miritime Terrestrial Zone”;
$8,000,000 colones for the Poas visitor center in 1991; $12,000,000 colones for the construction of trails at Carara in 1993; among many others.
Nevertheless the importance of these programs when looking at the ICT as a whole is very small.From 1991 to 1995 the average expenditures on environmental projects as a percentage of total ICTexpenditures was only 4% (Olson N., 1996).

27
Table 5ICT FINANCIAL EXPENDITURES ON ENVIRONMENTAL PROJECTS, 1991-1995.
(in million Colones)
TOPIC 1991 1992 1993 1994 1995Conservation 13 4,5 17 0 43National Parks planning 0 0 40 60 3Coastal zone planning 7 4,4 30 49 19Research and Program Development 0 0 3 17 3Environmental Education 0 6 12 2 13Publicity 0,5 1,6 1 0,1 14TOTAL 20.5 16.5 103 128.1 95
Source: Olson, N., 1996.
B) Conservation activities by private reserve owners are another source of benefits. Although themajority of conservation in Costa Rica is neither motivated nor financed by tourism revenues (AmosBien, coordinator of the “Red Costarricense de Reservas Privadas”, in Naomi Olson, 1997), tourismin general, and ecotourism in particular, are making substantial private conservation activityfinancially possible. Private investments in conservation for tourism provide environmental benefitsin terms of biodiversity conservation, watershed protection and carbon sequestration.
Eco-efficient and environmentally friendly hotel operations are a third major source. Though theseare terms also used to “green wash” businesses due to marketing advantage, thoughtfully sited andconstructed hotels exist, as do those whose operations are carried out to minimize environmentalimpacts. It is possible that Costa Rica has avoided some negative impacts of hotel siting,construction and design simply due to the fact that the great majority of its hotels are small. 70% ofthe hotels in Costa Rica have fewer than 20 rooms (Price, M., 1996).
Though big hotels are actually more capable of getting economies of scale in certain types ofenvironmental mitigation investments, they normally are in places where demand is high andprimary factors to be environmentally friendly have not usually been taken into account from thebeginning. Nevertheless, in a study of 92 lodges located around national parks (so they are not arepresentative sample from the total) done by Segleau, J. (1995) over two years, 49% of them weredoing “more than necessary” to pursue their environmental bottom line.
Creation of local jobs is yet another source of benefits. The best documented example and biggestsuccess in Costa Rica is Monteverde. The tourism industry in Monteverde has resulted in thecreation of some 80 different businesses, of which a significant percentage is locally owned. Theyare diversified among hotels, restaurants, cafeterias, craft and bookstores, cooperatives, etc. In total,more than 400 full -time and 140 part-time jobs have been directly generated (Williams, 1992).
Nevertheless, local people now face the challenge of consolidating an activity that has traditionallybeen seasonal and often fleeting in character (Price, M., 1996). They must effectively converttourism and conservation to a solid and long-lasting productivity. Furthermore, they shouldincorporate it as a way of life and a part of Costa Rican culture, so that better diffusion of the activity
28
is achieved.
Finally, environmental education activities should be taken into account as benefits. In manydefinitions of ecotourism, tourist education is fundamental. There is a strong indication that“...nature-based tourism has served to focus public attention on public conservation areas and greatlyincreased their inherent value in the minds of Costa Rican citizens...heightened awareness has led togreater park visitation by Costa Ricans...” (Piza, 07/1997). The Rainforest Aerial Tram, whosevisitors acclaim the educational aspect of the experience, has received in the last three years over150,000 people, including 15,000 students who are admitted at no fee. The rainforest awarenessinitiative of the tram is a particularly good example of this type of benefit.
The major negative impacts of ecotourism:
Environmentally destructive business siting, construction and operation are becoming more andmore of a serious problem. According to Lawrence Pratt (in Naomi Olson, 1997): “...most of thenegative environmental and social impacts of tourism are predetermined in the siting, design andconstruction phases. There are too many cases where developers build a hotel or destination that isan environmental disaster, institute a water reduction and recycling program, and then demand arating as an environmentally responsible business”.
One of the more extreme examples of environmentally destructive siting in Costa Rica took place inLa Cruz, Guanacaste where seven tourist developments found that their site delivered only saltwater. With respect to construction practices, in Costa Rica it has been a frequent cause ofdestruction of vegetation, soils and aquatic resources. At Papagayo, in Guanacaste dumping ofconstruction wastes has damaged coral reefs. At Playa Tambor it has involved filling in mangroves.
Damage caused by visitor impact in areas of conservation is another source of concern. The use ofnatural areas over their “carrying capacity” leads them to degradation. There is evidence that this ishappening in some locations. For example, Leslie Haysmith, Hoare et al. (199) reported the trails atChiripo and Poas to have suffered damage. Other may include divers touching tropical fish, leavingthem susceptible to infection, migration of monkeys from Cabo Blanco reserve since it opened to thepublic are reported to be have decreased the population of the howler monkey up to 40% and thewhite-faced monkey up to 27%.
Another source of concern is image inconsistency. The majority of visitors to Costa Rica(approximately 70%) have an interest in “sun and beach,” which is usually associated with thecategory of mass tourism. However, the Costa Rica tourism market is a segmented one. The centralmental image that most foreigners have of the country is one of a peace-loving, friendly, idealisticplace of special natural beauty (Naomi Olson, 1997). An example of a change of image from anatural history to a sun and beach destination is given by Louis Wilson of Hotel Las Tortugas atPlaya Grande in Guanacaste. He arrived at Tamarindo over 20 years ago and tells of how thedevelopment at Tamarindo due to hotels, lights and large scale visitorship coming to photographturtles near to the sea, is changing the experience and image for the visitors to this area (in NaomiOlson, 1997)—not to mention the actual destruction of turtle nesting patterns.
Because it is typically considered part of the definition of ecotourism, we must also consider theimpact of ecotourism on local culture. Despite the deeply rooted tradition of democracy in CostaRica, the formal mechanisms for local participation in tourism and resource management in generalare very few (Meadows, D., 1993). This set the trap for the transformation of the local communities.

29
A good example of this is the study of 22 tourist projects taken from the ICT list to obtain the“Contrato Turístico” (Tourist Contract). 77% of these projects violated the stated principals ofecotourism on cultural grounds (Umaña, F., 1996).
Nevertheless, besides Monteverde, there are some very good particular examples that leave an opendoor for a change. ATEC (Talamanca Association for Ecotourism and Conservation) is an NGObordering the Costa Rican section of the International Park of “La Amistad”, attempting to force thegovernment for legislative reforms to assure development that is in the interest of local people. Theindigenous reserves at Talamanca are an example of what indigenous groups (who still represent anaverage 5% of the total population in Latin America) can accomplish through ecotourism.

30
9. Willingness to pay for Costa Rica’s Ecotourism
For most goods and services, prices are established in the market place through the process of buyingand selling. However, there are market imperfections that make it extremely hard to value certaingoods and services. These market imperfections are conditions that prevent normal marketoperations. Many of the benefits of natural protected areas, such as their ecological, biological oraesthetic value are subject to these market imperfections, and therefore it is very hard to know theirtotal economic value. Without a market-place, the willingness to pay that individuals normallycompare with the price when making a purchasing decision is unknown.
For example, biological diversity is widely recognized as important, but how much money is itworth? Biological diversity is not sold around the corner or produced and bought regularly like acommodity. “Environmental goods and services often have no market price tag and a considerableamount of uncertainty can surround their true value and significance” (Turner, Pearce, and Bateman,108). The problem is that if these market imperfections are not adjusted for, these goods and serviceswill have distorted market prices that do not reflect their true value. All Costa Rican public andprivate protected areas are subject to these market imperfections. They face non-rivalry, non-exclusivity and offsite effects that distort their market prices.
Non-rivalry occurs when the total supply of a good is not diminished when enjoyed by consumers(Dixon and Sherman). A tree or a river is not like a car or a hamburger that once consumed becomespart of the buyer. Costa Rican protected areas stay there to be used by the following visitors. Thereis no rivalry among consumers because there is ‘enough’ for everyone in the short-run. This is amarket imperfection because, in the long run, the rainforest will be scarce, and the amount consumedby each visitor was not charged appropriately.
Costa Rican protected areas are undervalued because of their non-excludability, too. Everyonereceives the same level of benefits from an attractive view, clean air, and pure water; these are allnon-excludable goods. Costa Rican natural parks were bordered and put under protection to reducetheir non-excludability, and the negative externalities often related with it. Today, visitors cannot cuta tree just because they want to, as they might have thirty years ago. However, non-excludabilityallows many people to benefit from the natural reserves freely: the park’s water is enjoyed bydownstream users.
“Since they cannot be excluded from enjoying its benefits, there is no incentive for these users toreveal how much the park is worth to them. As a result, [public or private managers] cannot easilyestimate and charge for all the benefits this areas provided” (Dixon and Sherman, 28-29). Moreover,the benefits of a protected area go beyond national borders, and the country protecting the area isfreely providing benefits to the world.
Rainforests have a major role in carbon cycles, climate regulation, and genetic resource conservation(Kramer and Mercer). People who live thousands of miles from where protection activities takeplace benefit from these services. However, these beneficiaries never ordered these services, so theyare not required to pay for them either. Worldwide natural protected areas, including the ones inCosta Rica, are undervalued because their total real benefits are neither accounted nor paid for.
Market adjustments are necessary to recognize the total economic value of Costa Rican protectedareas. Regardless if the benefits are paid for or not, if the total economic value of environmentalgoods is not well estimated, less than the optimum amount of protected areas will be established in

31
the world (Dixon and Sherman). Further, developed countries could be ‘free riding’ in the sense thatthey are greatly benefiting from the existence of these natural areas, while theses areas areundervalued, and mostly located in poor developing countries.
The ‘free’ benefits received from these types of goods are known as the consumer’s surplus, or thenet willingness to pay (WTP). The gross WTP is the price consumers paid to enjoy the benefits plusthe consumer surplus. Therefore, to make the appropriate valuation and price changes to thesegoods, the net WTP must be known.
9.1 The Total Economic Value Concept
The total economic value of Costa Rican protected areas and their future development options is thesum of their use value, option value, and existence value (Turner, Pearce, Bateman). Their use valueincludes the direct and indirect benefits provided by the parks. These include recreation benefits likehiking, surfing, rafting and bird watching. Enjoying a television show, a magazine article, or a birdanalysis about Costa Rican parks are direct benefits, too. Costa Rican protected areas also provideessential environmental functions that indirectly support economic activities and human welfare.These include medicine investigation, plant genetics, education, nutrient recycling, watershedprotection, air pollution reduction, microclimatic functions, and carbon store.
Swanson and Barbier highlight the importance of measuring these benefits: “if mechanisms are not inplace to appropriate the value of genetic resources[,] the full value of wildlands will not beappreciated and the depletion of genetic stocks will continue” (Swanson and Barbier, 60). Moreover,these protected areas are an option of future use for many individuals. This hope of someday havingthe opportunity to visit a certain area or observe certain species in the wild is their option value.Finally, some individuals are satisfied just to know these parks exist; this is called the existence vale.
9.2 Methods of Evaluating Costa Rican Protected Areas
It is very hard to measure the total economic value of environmental goods and services, but recentlyprogress has been made placing monetary values on many of these benefits (Dixon and Sherman).Costa Rican protected areas are worth what the world society is willing to pay for them. But, howcan we know their willingness to pay? How do economists quantify the monetary benefits ofprotected areas? There are many methods that try to express non-market environmental goods inmonetary units. These methods have been modernized over time, but all of them have limitations.Still, if they are carefully applied, they provide valid and reliable estimates.
About ten different valuation techniques exist, and a number of them can be applied to the valuationof Costa Rican parks (Dixon and Sherman; Turner, Pearce, and Bateman). The first type oftechniques is based on market prices. The change-in-productivity approach and loss-of-earningsapproach evaluate the changes in the park’s productivity or human productivity due to a change inenvironmental use. The second type of technique tries to estimate the value of the parks byanalyzing the price paid for a closely associated good that is traded in the market.
Ideally, the surrogate good chosen should be a perfect substitute for Costa Rican protected areas.These include methods like the property value approach, which tries to eliminate all the variablesthat determine the real state price, but the environment, and therefore determining the environment’svalue. Properties located next to natural areas or with scenic views have higher prices. That extravalue given by the environment is what analysts try to find.

32
The wage differential approach finds the difference in wage levels for similar jobs in differentenvironmental areas to evaluate the environment. Finally, the travel cost approach has been widelyused to value recreation benefits from protected areas, like the ones in Costa Rica. This approachuses the pattern of recreational use of a park to derive a demand curve and estimate the total amountof consumer’s surplus. It assumes that people react to increased travel costs as they would react toincreased fee rates. Increasing travel costs are then the surrogate for increasing admission fees, andare used to determine consumer surplus and willingness to pay.
This technique surveys visitors to find out the distances they traveled. Knowing the costs and thequantity of visitors that incurred them, a surrogate demand curve is created. Normally per capita useof the park will decrease as distance to the park increases. This is an excellent technique to estimatethe recreational value of an area. Using it, analysts have found that “[t]he fees for park use are oftenmuch lower than the individual would actually be willing to pay” (36).
The third types of techniques used are based on surveys. Surveys are necessary when dealing withbarter goods that never enter the market, and therefore the market and surrogate market techniquescannot be used. The only way to find out the net WTP is to question individuals about their reactions(Dixon and Sherman). The Contingent Valuation Method (CVM) finds the total value of the good bymeasuring the consumer’s surplus and adding it to the price. It measures the consumer’s surplus intwo ways: compensating variation (CV) and equivalent variation (EV).
CV is the payment that individuals require to be equally well off if they are forced to face newcircumstances that are not as favorable. It is the compensation they demand for giving up a right orthe WTP to get the right. EV differentiates from CV, in that the satisfaction level is measured afterthe change is made, and not before like in CV. EV measures how much money individuals are WTPto avoid returning to a situation, or their willingness to accept (WTA) to forego returning to theoriginal situation. The WTP and WTA reflect the individual’s preferences, and the value of the goodin question they have in their minds (Pearce and Moran). Theoretically, these two measures shouldbe similar, but in most studies they are not. Personal income limits individuals in the WTP and not inthe WTA, making the later several times larger than WTP in practical studies.
Economists measure CVM mainly by doing five types of surveys (Dixon and Sherman). Biddinggame surveys ask individuals the maximum and minimum amount they would pay for certainenvironmental good. The surveyor could ask for a single bid or an open-ended bid, and get aminimum WTA compensation. Another survey, the take it or leave it experiment, offers individualsa certain amount of money for a situation. They have the option to take it or leave it. The trade-offgame asks individuals to choose between two bundles of goods, each with different amounts ofenvironmental protection and price. Surveys asking for money returns cannot be done withindividuals with barter economies. Economists overcome this by using the costless-choice method,where individuals are asked to choose between a good and an environmental situation, instead ofmoney. Finally, economists try to find the WTP or WTA using the Delphi technique. Experts areasked to evaluate, discuss and reevaluate a good in question many times until the final value isdetermined.
The fourth type of techniques used to evaluate environmental goods or services is based on costsfound in the marketplace. Instead of measuring the benefits, these techniques measure the costs ofchanging the environmental good or service into alternative uses. The opportunity-cost approachmeasures the opportunity cost of changing the environmental good. There are also expenditure-
33
based approaches that measure the costs of negative environmental impacts. The preventiveexpenditures method measure the total costs actually incurred to protect the environmental area. Themitigation-cost approach measures the potential costs of reversing an environmental damage. Thereplacement-cost approach compares the costs of preventing an environmental damage with the costof replacing the productive assets destroyed by the damage. The shadow project looks at the costs ofhaving a substitute for the environmental good or service that was damaged. If a forest providedfirewood, then this method would measure the costs of getting firewood from somewhere else.
9.3 Valuation Methods Applied to Costa Rican Protected Areas
There have been few attempts to estimate the value of wildlife tourism in developing countries(Swanson and Barbier). “Of the limited selection of studies that do exists on the value of wildlifetourism, the valuation is usually confined to the direct costs and benefits of tourism, with little, ifany, analysis of external impacts of wildlife tourism” (143).
Probably the most complete of the studies that evaluate Costa Rican protected areas is Tobias andMendelsohn’s 1991 estimate of the value of ecotourism at Monteverde Cloud Forest BiologicalPreserve (also known as MCRF). Using the travel cost valuation technique, and “[b]ased on datafrom the reserve’s headquarters on the frequency of ecotourists visits, distance from the site,population density and illiteracy rate from each of Costa Rican eighty-one cantons, the authorsderived a demand function for visits to the site” (145).
Figure 1 shows the travel cost demand function Tobias and Mendelsohn derived for the protectedarea. It shows the willingness to purchase different quantities of trips as the travel costs change.Like in any downward sloping demand curve, as the travel price increase, the quantity of travel tripsdemand reduces. It also shows the consumer surplus, or net WTP. With an entrance fee of $3, theconsumer surplus is the shaded area below the demand curve and above the cost line. Knowing theconsumer surplus for each canton and adding all of them up, the analysts came up with a “nationalrecreational value of the entire site of approximately $100,000 per annum” (145). They alsocalculated a present value of the MCRF, using a 4% real interest rate and assuming that the real valueof the site remains constant over time, it is between US$2.4 million and $2.9 million. Diving this bythe average 3000 visitors per year, the site is worth about $35 per visit.

34
Figure 1- Visitation Demand and Consumer Surplus
Price 12-
10-
8-
6-
4-
2-
0-
0 1 2 3 4 5 6 7 8
Quantity of Trips
Source: M. Swanson, Timothy and B. Barbier, Edward. Economics for the Wilds: Wildlife,Diversity and Development. Island Press: Washington DC, 1992.
Swanson and Barbier argue that this estimate is undervalued. A major reason is that it onlyrepresents the value of the site by national visitors, and the international visitation rate during 1992was four times larger than the national visitation rate. Further, foreigners should have a higher valuefor MCRF because they have higher incomes and the lack of nearby substitutes. Finally, “therecreational value of the site does not capture any potential preservation values of the site” (146).
Besides Tobias and Mendelsohn’s studies, Besleme and Aguilar (1994) also used the travel costmethod to measure the value of ecotourism in the Carara Biological Reserve. Covering 4,700hectares and with 26,754 visitors annually, this reserve is one of the largest and most visited of CostaRican national parks (www.magi.com/crica/info/tico_parks.html, 11/14/97). Their model isdifferent from Tobias and Mendelsohn’s because, instead of using population density and illiteracyrate as the socioeconomic values, they used household density and illiteracy rate.
Everything else in their study follows the same pattern of Tobias and Mendelsohn study. The result isan estimate of the ecotourism value of the reserve. “By observing travel behavior, this studyrevealed that Costa Ricans are willing to pay $31 more that they pay per visit to this site, resulting inan annual potential domestic recreational value of $185,515” (Besleme and Aguilar, 2). However,the demand equation derived in the study has a coefficient of variation, r squared, of 0.27949, whichmakes the estimate somewhat unreliable.
Other surveys and studies have been done to determine the willingness to pay for Costa Ricanecotourism. Elizabeth Boo’s 1990 surveys “suggest that nature tourists are willing to spend moremoney than other tourists” (Boo, 36). Also, a Baldares and Laardman study (1990) “revealed that

35
both Costa Ricans and foreigners agreed that entrance fees to the three most popular national parks(and to Monteverde) should be raised” (Lindbergh and Hawkins, 88). A demand curve analysisestimated that the maximizing entrance fee was US$1.20.
However, this is a low estimate because the survey had some difficulties: it was done in the lowseason and its questions were wrongly worded. Lindberg and Hawkins also describe a 1992 studythat ranked Central American parks in terms of quality of the attraction and cost of travel from theUnited States. It compared Costa Rican prices and ease of viewing wildlife with other ecotourismdestinations like Africa. The study estimates that the appropriate fee for a typical Central Americanpark is between US$5 and $10 per day.
Two other studies determined the indirect and global value of Costa Rican protected areas. TheCosta Rican National Institute of Biodiversity, INBio, is working on the evaluation of Costa Ricangenetic resources, too (Swanson and Barbier). The final study will present an extensive database ofthe Costa Rican native species. Costa Rican genetic resources are raw materials for manypharmaceutical and other products. This database will help identify the real value of these geneticresources by calculating their percentage share on the final value of these products.
The second study, by Kramer and Mercer (1997), used CVM to find the American’s WTP forinsuring that a large enough stock of rainforests is protected so that the world keeps receiving itsbenefits forever. Ninety one percent of the interviewed knew what a rainforest is, and 61% had plansfor visiting one. Moreover, “two-thirds of the households indicated that industrialized countriesshould share the costs of protecting remaining forest” (208). The U.S. public supports internationalfinancing of world rainforests, including Costa Rican, and is willing to pay a significant contributionto ensure rain forest protection. “On average, respondents were willing to make a one time paymentof approximately $21-31 per household to protect an additional 5 percent of tropical forests” (196).
Now that the concept of willingness to pay, its valuation methods, and the studies done in the CostaRica have been explained, let us look at the historic relationship between the entrance fees to CostaRican private and public natural reserves and the visitation rate by international and national visitors.
9.4 Historic Reaction of Visitors Demand to Entrance Fee Changes
We have learned the difficulties of finding the total economic benefits of Costa Rican protectedareas, and the WTP of the visiting Ecotourists. Knowing all these market imperfections, what areCosta Ricans actually charging for their natural environment? The following sections summarizesthe historic entrance fees and corresponding visitation rates to all national parks in Costa Rica, andtwo important private protected areas: Palo Verde Biological Station and Monteverde Cloud ForestPreserve
9.41 National Parks: 1979-1993
Entrance fees to Costa Rican national parks were conservatively managed from 1979 until 1993.There was no price discrimination between international, national, student, and researcher visitors.The fee was held constant from 1979 to 1981 at $0,23. Then it was lowered for the next two years at$0,13. It was raised constantly every year after 1983 until 1986. From 1986 to 1989 the fee was heldat $0,44. All visitors paid the same entrance fee for this 15 year period, with the only exception of1990, when the fee for international visitors was raised to $1,18, while nationals paid $, 60. After

36
1990, fees became equal for all visitors again at $, 80. The fee was raised again to $1,57 during 1992and 1993.
Even though the fees were identical and increasing for all visitors during 14 years of this 15 yearperiod, national and international demand to Costa Rican national parks behaved differently. At thebeginning, during 1982, national visitors more than doubled international visitors, but, after 1990,internationals had already outnumbered the national visitors to Costa Rican national parks. Not eventhe 1990 and 1992 entrance fee increases of around 270% to internationals slowed their increasingdemand. Entrance fees of $1,18 and $1,57 did not affect foreigners’ consumption.
International visitor’s demand increased almost exponentially after 1987 from 71,723 visitors to apeak of 404,342 visitors during 1993. Only during 1983 both types of visitors reduced their demandaround 5 percent. Economic, political or trend factors could explain this sudden reduction ofdemand, because it was certainly not a response to price changes. During that year the fee was at itslowest price ever.
Costa Rican visitors’ demand during the 15 year period was not as energetic as international visitors’demand. Still, it grew so that national visitors had more than doubled by 1993. Costa Rican’sdemand for national parks only decreased during 1983, 1989 and 1991 in the fifteen-year period.The 1989 decrease cannot be a reaction to price changes-- just like the 1983 decrease in demandexplained above-- because fees remained at its constant level at $0,44 since 1986. However, the1991 decrease in their demand could be due to the fee increase to $0,80 during that year. Moreover,the following year, 1992, seemed a more reasonable year for nationals to decrease their demand dueto the 100% increase in the entrance fee price. In contrast, national tourists increased their demandby 44,000 visitors in 1992.
9.42 National Parks: 1994-1996
1994 was a revolutionary year in the public park’s entrance fees: international visitors were charged1000% more at $15, while Costa Rican nationals were charged 20% less at $1.27. Suddenly theauthorities recognized the willingness to pay of international visitors. International and nationaldemand reacted to the price changes dramatically, too. Foreigners reduced their visitation rate toalmost half of what it used to be in 1993 during the following two years, while “the number of ‘rich’tourists entering the country rose by 9%” (Aylward, Allen, Echeverría and Tosi, 339).
The 1994 rise in prices of 1000% was done by MINAE without previous consultation to the othertwo parts of the tripartite commission: ICT and CANATUR. CANATUR was in total disagreementdue to the opposition of the tourist operator sector. The fact that the number of tourists visitingNational Parks decreased in 1994 for the first time in the last decade increased tension. At the end of1995 the number of foreign visitors to the National Parks decreased by 33.4% when compared withthe end of 1994 (SINAC, 1996). A decision was reached in 1996 to lower the park entrance fee by50%, which eased some of the tensions between the three parties, to $6.
This reduction reactivated international visitor’s demand to national parks; it started growing again in1996. National visitors to the parks reduced their demand during 1994, even though their fee wasreduced. Only, after 1995 and 1996, when their fee was reduced even more, did nationals’ visitationrate started growing again. Today, the past drastic entrance fee changes have made national touristsoutnumber international tourists in national parks again.

37
Besides being an unexpected increase in national parks entrance fees, the 1994 changes are importantbecause they mark the beginning of price differentiation in the national park’s fee structure. Sincethat year, national and international tourists are charged different fees for enjoying Costa Rica’snational parks. Differential pricing is common within the tourism industry. Airlines and hotelsdifferentiate their prices to take advantage of the inelasticity of demand of last minute emergencytravelers and business travelers. Other ecotourism destinations, like Peru, Ecuador and Kenya, alsohave higher fee rates for foreign visitors who are willing to pay higher prices than nationals(Lindberg and Hawkins).
However, national parks are not the only important reserves for ecotourists. In Costa Rica, theemphasis on nature tourism by the government has led to the development of a variety of privatesector initiatives, such as lodge developments and guide services (Boo). The most interesting of themis the emergence of private protected areas for tourism. “Costa Rica is a [world] leader in havingprivately owned protected areas”( Dixon and Sherman, 192). Monteverde Cloud Rain Forest(MCRF), La Selva Biological Station, OTS, and Marenco are some of these private natural reserves.They tend to be small, with simple accommodations and managed by highly motivated people.Private reserves generate a lot of income and have higher levels of local participation than otherprotected areas (Boo) (Dixon and Sherman). What has been their entrance fee structures andvisitation rate?
9.43 Private Parks: Palo Verde Biological Station
The Palo Verde Biological Station is one of the four reserves owned and managed by the NGOOrganización para Estudios Tropicales (OET). Entrance fees in Palo Verde are differentiatedbetween two groups. A higher tariff is charged to visitors that come for special workshops, seminarsand natural history groups. A lower tariff is charged to the resting visitors, including researchers,groups, and others. Still, both fees are much higher than fees charged at national parks. Today,entering the park costs US$25: four times the price of entering any public park.
However, it is important to notice that the OET does not discriminate its fee prices betweenforeigners and nationals. The only sudden change occurred during 1993 when the fees were raised27% to normal visitors and 43% to the special workshops visitors. Normal visitor demand had beenincreasing constantly since 1991. But in 1993, the new higher fees or other external factors loweredthe park’s demand.
The external factors must be considered because it was also in 1993 when the national’s parksvisitation rate declined without any fee changes. A year later, Palo Verde’s entrance fees werereduced 16% to normal visitors and 11% to special workshop visitors. This fee change triggered ademand growth of normal visitors from 2418 in 1993 to 3929 in 1995. The demand for specialworkshops is small and has been decreasing over time: it reduced its market share from being 15% oftotal visitors to Palo Verde during 1991, to being only 2% during 1996. This reduction of specialworkshop visitor could be a reaction to the increase in their entrance fee relative to other visitors andparks. Special workshop visitors paid $10 dollars more than normal tourists to Palo VerdeBiological Station in 1991. Today they are paying $20 more. And, compared with national parks’entrance fee, special workshop visitors’ fee is seven times larger.
9.44 Private Parks: Monteverde Cloud Forest Preserve
Monteverde has been a success story in the last twenty years: the visitation rate today is 100 times
38
larger than during 1974. During the first fifteen years, the number of visitors to the Preserve grew ataverage growth rates of over 25%. However, from 1989 to 1992, this rate increased to 41%. Whenthe Preserve started, the entrance fee was $2.30 for all visitors.
Monteverde’s fee structure was highly differentiated. During 1995, five different fees were charged(Table 2). Then, the group fee was reduced, and finally today is the same as the foreigners’ fee.Elizabeth Boo strongly argued in her 1990 book that Costa Rican natural parks were undervalued,and the entrance fees were insufficient. She claims that “[h]igher entrance fees need to be institutedif parks are to generate their own income and become economically autonomous” (40). The truth isthat, even though demand sank, much more income was generated with the 1994 rise on publicparks’ fees.
The most appropriate method for setting fees will depend on the park’s local conditions, and thecapacity Costa Rica has to analyze the WTP for its ecotourism (Lindberg and Hawkins). The studiesalready done in Costa Rica, although somewhat unreliable, give estimates an optimum entrance feethat ranges from $1.25 to $31. Still, the responsible decision-makers can evaluate the market andposition themselves strategically within the supply of ecotourism destinations. “In Costa Rica, forexample, fees charged at the private Monteverde Cloud Forest Reserve could serve as an example forfees at national parks” (88). Even though Monteverde is somewhat different from most of thenational parks, the fact that it is charging much higher fees, suggest that Ecotourists are willing topay that higher fee, and therefore it can be charged at other parks.
No economic activity can exist if it is not profitable, which is why the cost-benefit ratio is essential.The little experience we have in evaluating natural resources has made it very difficult to define thereal cost of ecotourism’s raw materials: natural and cultural attractions. Information costs putsecotourism at risk because its raw materials could be undervalued, and therefore on their way todestruction.

39
10. Economic Implications of Ecotourism in Costa Rica: The Value Chain
10.1 Objective
The main objective of this study is to identify the value chain for ecotourism in Costa Rica. Whatexactly is the value chain, and why is it important? “The idea of a value chain was first suggested byMichael Porter (1985) to depict how customer value accumulates along a chain of activities that leadto an end product or service” (CMA et al, 2). Costa Rica’s ecotourism value chain is a description ofthe whole ecotourism process, from its raw materials to its final consumption. Costa Rican serviceproviders, by knowing their position within this value chain, can identify the activities that are moreor less critical to achieve a competitive advantage.
Ecotourists already pay for all the profit margins along the entire value chain. By doing verticallinkage analysis, Costa Rican ecotourism service providers can asses their current competitiveadvantages and create strategies to maximize the value delivered to customers and minimize theircosts. Moreover, it is very important to identify Costa Rica’s ecotourism value chain because theindustry’s most important raw material, the environment, is very hard to appraise (see section 9).
Due to market imperfections, prices charged for environmental goods need to be adjusted if theirtotal economic value is to be accounted for. Finding the WTP for these protected areas is a verydifficult task. The value chain helps this evaluation by identifying the environmental goods’percentage share in the final market price of an ecotourism vacation. However, before doing anyanalysis, the value chain for ecotourism in Costa Rica, with the appropriate costs and revenuesassigned to the value adding processes, must be identified.
10.2 Methodology
The identification and estimation of Costa Rica’s ecotourism value chain was carried out in twosteps. First, the ecotourism’s industry structure was identified. Second, the costs and revenues ofeach value-adding process were found and assigned.
Step 1: The Ecotourism Industry Structure
Figure 2 graphically shows how the ecotourism industry is structured. Ziffer’s 1989 description ofthe ecotourism industry structure remains valid today (Piza 10/18/97, Lizano 10/22/97). Ecotouristsmay purchase their vacation in three different outlets: at a travel agency at home, a land operator inCosta Rica, or from the local entrepreneurs at the ecotourism destination. The ground and localoperators purchase the ecotourism services from the local entrepreneurs and create complete packagetours. These package tours are then bought by wholesalers, tour operators and/or travel agencieslocated anywhere in the world. As a result, the value adding processes in the ecotourism industryare:
1. Costa Rican Local Entrepreneurs- includes all the businesses, governmental Organizationsand NGO’s providing goods and services to Ecotourists in Costa Rica
2. Ground and Land Operators- located in Costa Rica3. Wholesalers, Tour Operators and Travel Agents- located outside of Costa Rica4. Airlines- providing essential transportation services to International Ecotourists
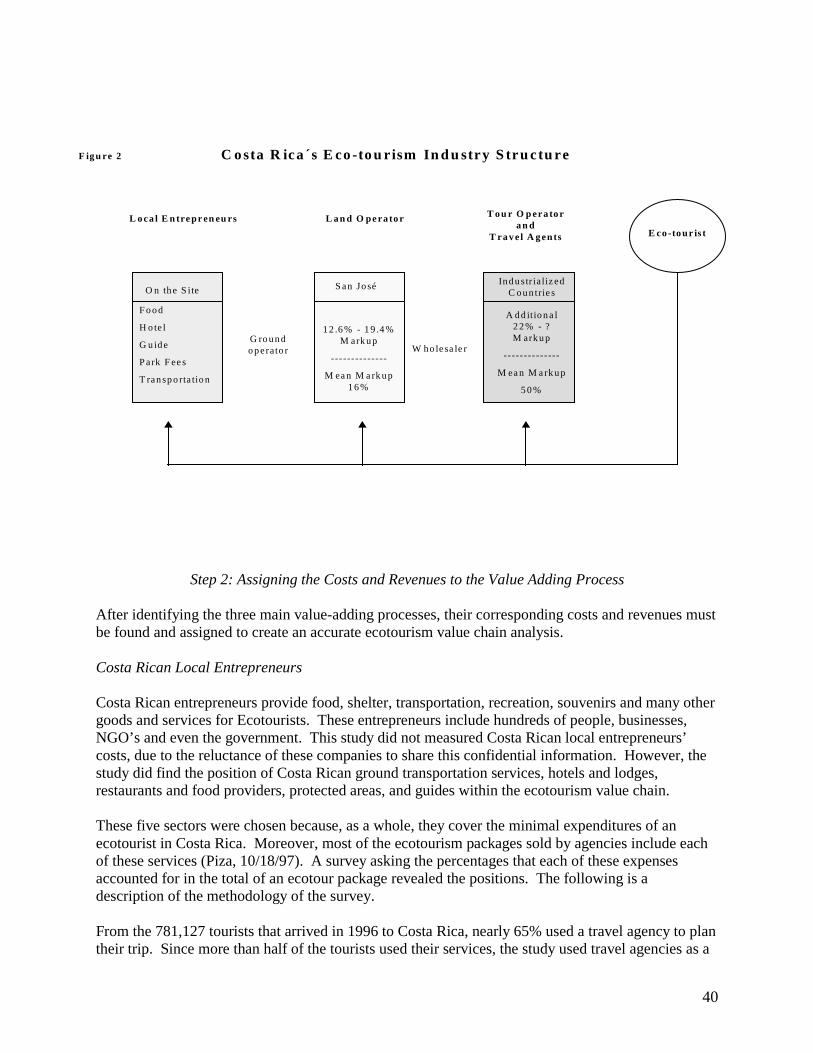
40
Step 2: Assigning the Costs and Revenues to the Value Adding Process
After identifying the three main value-adding processes, their corresponding costs and revenues mustbe found and assigned to create an accurate ecotourism value chain analysis.
Costa Rican Local Entrepreneurs
Costa Rican entrepreneurs provide food, shelter, transportation, recreation, souvenirs and many othergoods and services for Ecotourists. These entrepreneurs include hundreds of people, businesses,NGO’s and even the government. This study did not measured Costa Rican local entrepreneurs’costs, due to the reluctance of these companies to share this confidential information. However, thestudy did find the position of Costa Rican ground transportation services, hotels and lodges,restaurants and food providers, protected areas, and guides within the ecotourism value chain.
These five sectors were chosen because, as a whole, they cover the minimal expenditures of anecotourist in Costa Rica. Moreover, most of the ecotourism packages sold by agencies include eachof these services (Piza, 10/18/97). A survey asking the percentages that each of these expensesaccounted for in the total of an ecotour package revealed the positions. The following is adescription of the methodology of the survey.
From the 781,127 tourists that arrived in 1996 to Costa Rica, nearly 65% used a travel agency to plantheir trip. Since more than half of the tourists used their services, the study used travel agencies as a
C osta R ica ´s E co -tou r ism In d u stry S tru c tu re
L o ca l E n tre pr en eu rs L a n d O pe ra to r T o u r O p era to ra n d
T ra v e l A g ents
O n th e S ite S an José Industr ia l izedC oun tries
F ood
H ote l
G u ide
Park F ees
T ransporta tion
12 .6% - 19 .4%M arkup
--------------
M ean M arkup16%
A dd it iona l22% - ?M arkup
--------------
M ean M arkup
50%
E co -to ur is t
G roundoperato r W ho lesa le r
F ig u re 2

41
primary source of information. According to the 1996 ICT Statistical Yearbook, there are 168receptive tourist agencies in Costa Rica. The ICT divided these agencies into groups according to thetype of service they provided. One group (group 1) contains the top seven agencies specialized inecotourism services: they sell the largest variety and quantity of ecotourism packages (ICT, 1997).
A second group (group 2) includes 21 tourism agencies that have in common that 75% or more oftheir tour packages are ecotourism packages. The third group (group 3) is much larger and includesthose agencies that target high-income tourists with environmental interests. According to the ICT,these three groups are the total population of the Costa Rican agencies that specialize in ecotourism.
The study surveyed a sample of these agencies to make inferences about the costs and revenues ofthe total population of travel agencies that provided ecotourism services. The survey was sent to the28 agencies of groups 1 and 2, and to 6 more agencies randomly chosen from group 3. Moreover, itwas also sent to the Organization for Tropical Studies (OTS) because it controls 80% of the totaleducational ecotours in Costa Rica. The survey briefly described the characteristics of an ecotourand then asked five questions. Figure 3 shows graphically what the survey asked for.
Costa Rica’s Eco-tourism Industry StructureSurvey 1 Questions
Local Entrepreneurs Land Operator
Tour Operatorand
Travel Agents
On the Site San JoséIndustrialized
Countries
Food
Hotel
Guide
Park Fees
Transportation
QUESTION 4:
% markup towholesalers, tour
operators andtravel agents
QUESTION 5:
Additional %markup toEco-tourist
Eco-tourist
GroundOperator
Wholesaler
Note: The 5 questions in Survey 1 relate to tourism packages randomly chosen by respondents
QUESTION 2: Price/day of theEco-tour pakage to Eco-tourist
QUESTION 1:
Cost of the tourto ground andland operators
QUESTION 3:
% markup toEco-tourist
Figure 3

42
The first question asked the managers for the costs per day of a randomly chosen ecotour package.The study did not ask specifically for a type of ecotourism package related to a segment (i.e. soft,hard, adventure, or specialized ecotourism packages) because the results would have been limited tothat segment, and the remaining population of ecotourists would have been omitted from the study.According to Piza, the majority of Costa Rica’s ecotourism is soft ecotourism. However, softecotourism is still ecotourism and should not be confused with mass tourism. Soft ecotourists do thesame things hard Ecotourists do, they just do them differently. “And the differences in their dailyexpenditures is insignificant” (Piza, 10/18/97).
The study had a 54% response rate: 19 of the 35 surveys were answered. The data was used in a t-student distribution analysis with infinite population and a 90% of confidence. Although theresponse rate was relatively high, the total number of responses was low enough that the readershould consider these findings with great caution. That is, this is an exploratory analysis, and wepresent the findings in a form that most social scientists will recognize—not as a statement of ourcomfort with making claims with the associated confidence levels. Table 6 shows the results forquestion 1. It is important to notice that the percentage of each category is not the percentage of thefinal cost of the ecotourism package, but from the total cost of the ecotourism package to CostaRican ground or land operators.
Table 6Total Cost of an Ecotourism Package to Costa Rican Ground and Land Operators
Various Sector’s Percentage Share of the Total Cost90% Confidence
IntervalMean
Transportation 19.20% 32.24% 25.72%
Hotel or Lodge 20.95% 42.94% 31.94%
Food Providers 17.66% 26.74% 22.22%
Ecotourism Recreation Entrance Fees 4.80% 19.49% 12.15%
Guide 9.44% 18.16% 13.80%
Others 8.84% 28.56% 17.58%
Total Cost of the Package (US$ /day) $79.11 $140.42 $109.77
Note: ‘Others’ include administrative and extra costs of the Ecotour
The study tells us, with 90% confidence, that the total cost of an Ecotour package per day will bebetween $79.11 and $140.42, and the mean package cost is $110 per day. Moreover, the studyshows the mean percentage cost --and corresponding percentage intervals-- of each of the sectors thatprovide services in the package. A Costa Rican tour operator can be 90% confident that a guide forthe next ecotour would not cost more than 18% or less than 9.44% of the package’s total cost. Thesurvey revealed each sector’s percentage share of the total ecotour package cost to ground and landoperators, and therefore situated these industries within Costa Rica’s ecotourism value chain.
Ground Operators and Land Operators

43
The remaining questions in the survey asked managers more about the ecotour they randomly chose:(2) what is its price to an ecotourist in Costa Rica ($/day), (3) the percentage markup to ecotouristsin Costa Rica, (4) the percentage markup to wholesalers, tour operators and travel agenciesworldwide, and (5) if available, the additional markup the later ones charge ecotourists in developedcountries for that same package. The results of the t-student analysis with an infinite population and90% of confidence are shown in Table 2.
Table 7Ground and Land Operator’s Percentage Markups of Ecotourism Package Tours
90 % ConfidenceInterval
Mean
Price charged to Ecotourist ($/day) $96.90 $183.64 $140.27
Markup to Ecotourist (%) 27.25% 41.41% 34.33%
Markup to international wholesalers, touroperators and travel agencies (%)
12.65% 19.35% 16%
International wholesaler, tour operator andtravel agents’ additional % markup toEcotourists
17.18% 26.94% 22.06%
The most important data from table 7 is the percentage markup that ground operators and landoperators charge to international wholesalers, tour operators and travel agencies. The study revealedthat there is a 90% probability that Costa Rican ground and land operators charge a markup tointernational agencies that is between 12.65% and 19.35%.
Wholesalers, Tour Operators and Travel Agencies
This study was narrowed to include only the wholesalers, tour operators, and travel agencies fromindustrialized countries. To find these actor’s position in the value chain, a second survey was sentto forty randomly chosen, tour operators and travel agencies in the United States and Europe. Thesurvey asked two questions: (1) how the company arranges their ecotour packages (through a CostaRican agency or by company itself), and (2) the final price of a randomly chosen ecotour.
Ten of the forty companies answered the survey (a response rate of 25%). In relation to the firstquestion, 100% of the respondents said their ecotours were arranged by a Costa Rican agency. Thisconfirms that the industry structure follows the design in Figure 1. The second question asked for thefinal prices they charged for Costa Rican ecotourism packages. The results allow us to infer thatthere is a 90% probability that the final price per day of an Costa Rican ecotour purchased from aNorth American or European tour operator or travel agency is between $174.17 and $206.811, with amean of $190.49.

44
Table 8Price of Costa Rican Ecotour Package in Industrialized Countries
90% Confidence Interval Mean Price$174.17 $206.811 $190.49
This suggests that an ecotour package with a mean cost of $110 to a land operator (Table 6), and soldto a wholesaler, tour operator or travel agency with a mean percentage markup of 16% (Table 7) at$128, is then sold by these agencies to industrialized countries’ ecotourists at a mean final price of$190 (Table 8). According to this, international wholesalers, tour operators and travel agenciestogether can charge an additional mean markup of 50%.
If this mean final price is realistic, then there is a discrepancy in the information given by the landoperators, who said that a mean 22% markup was charged by industrialized countries’ wholesalers,tour operators and travel agencies –all together- to the ecotourist. Either they have incorrectinformation about what the end packager is able to charge as a premium, which would mean that theend packager is reaping greater returns—perhaps at the expense of the land operator who wouldcharge more if he had better information. The other possibility is that the cost and/or markuppercentage of the operator is higher than reported.
Airlines
Airlines are major actors in Costa Rica’s ecotourism value chain. This study focuses onindustrialized country’s ecotourists, and this is the only mean of transportation they can use to cometo Costa Rica. The airfare’s share of the total price of the ecotourism package was found by findingthe average cost it has to the average ecotourist. Table 9 shows the number of tourists that cameduring 1996 from each of the developed countries, and the average cost of their airfare to Costa Rica.These data were used to calculate a weighted average of the airfare cost from developing countries toCosta Rica. The result says the airfare cost from the major industrialized countries is $775 per trip,or $95 per day.
The weighted average cost of the airfare per trip was added to the prices international tour operatorsand travel agencies said they charged for the total land cost to calculate the final total price of thesepackages. The t-student analysis revealed that, 90% of all the Costa Rican ecotourism packages soldin industrialized countries will have a price within $265.45 and $311.33 daily including airfare, andthe mean price is $288. Table 10 shows the results:
Table 91996 Arrivals to Costa Rica from Major Developed Countries Through Juan Santamaría
International Airport: Corresponding 11/97Airfare PricesCountry of Origin Total Tourists 11/97 – Airfare (US$)
Canada 36,271 628
United States 271,320 637
Europe 129,478 1,049
Japan 5,543 2,134

45
Sources: ICT, 1997, Olympia Tourist Agency
Table 10Price of Costa Rican Ecotour Package in Industrialized Countries Including Airfare
90% Confidence Interval Mean Price$265.45 $311.33 $288.33
10.3 The Assumptions of the Study
The following list summarizes the assumptions done in the study:
In step 1: The Ecotourism Industry Structure
a. Assumed tour operators and travel agents from the north do not buy their tour packages fromCosta Rican ground operators or local entrepreneurs, but only from land operators in Costa Rica.
In step 2: Assigning the Costs and Revenues to the Value Adding Process
a. Assumed that northern ecotourists used a package tour to plan their vacation. No independentecotourists were included in the study.b. Assumed that northern ecotourists’ only expenditure in Costa Rica is an ecotourism package thatincludes the food, hotel, transportation, entrance fee, guides and extra costs of the land operator. Noother expenditure by ecotourists in Costa Rica (souvenirs, extra food or events) was considered in thestudy.c. Assumed the list of 3 groups of agencies given by the ICT formed the total population ofproviders of ecotourism packages in Costa Rica.d. Assumed that all ecotourism packages chosen by the agencies were conducting ecotourism,regardless of being hard, soft, adventure or educational ecotourism.e. Assumed that all agencies were honest.f. Assumed that northern ecotourists can only reach Costa Rica by airplane.g. Assumed that northern ecotourists purchased airplane tickets at a travel agency on November of1997. Discount tickets or charter airplane tickets were not included in the study.
10.4 The Value Chain for Ecotourism in Costa Rica
The previous section identified Costa Rica’s ecotourism value chain. Figures 4 and 5 are therecompilation of all the average information gathered in the study. Figure 4 suggests that on averagean ecotourist coming from an industrialized country to Costa Rica pays $288 a day. Of this $95 go tothe airline, $65 to the foreign wholesalers, tour operators and travel agencies, $18 to the Costa Ricanland operator, and $110 to Costa Rican local entrepreneurs. Of these $110 spent locally, on average,$23 goes to all the ground transportation related businesses, $28 goes to all the hotel relatedbusinesses, $20 to the food providing businesses, $11 to the protected areas as entrance fees, $12 tothe guide, and $16 to the land operator’s management, administration and extra costs.
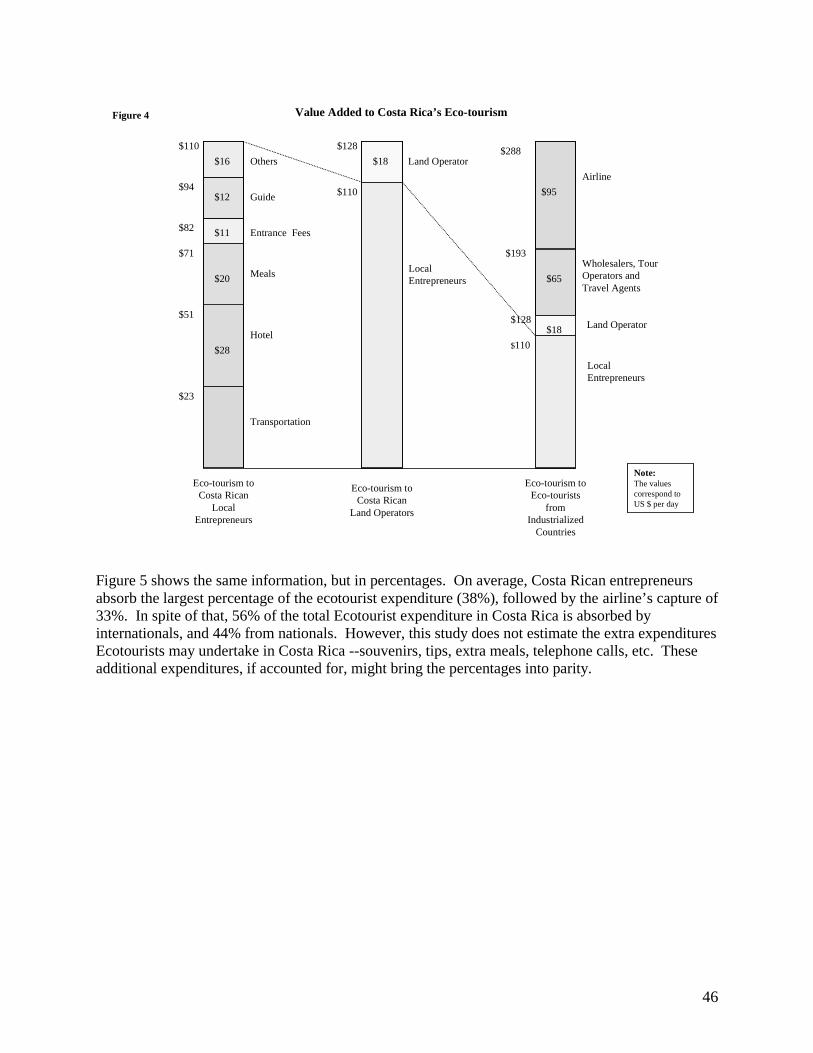
46
Hotel
Meals
Entrance Fees
Guide
Others Land Operator
Transportation
Wholesalers, TourOperators andTravel Agents
Airline
Value Added to Costa Rica’s Eco-tourism
$110
$128
$193
$288$128
$110
$110
$23
$51
$71
$82
$94
Eco-tourism toCosta Rican
LocalEntrepreneurs
Eco-tourism toEco-tourists
fromIndustrialized
Countries
Eco-tourism toCosta Rican
Land Operators
$11
$18
$12
$16
$20
$28
$95
$65
$18
Note:The valuescorrespond toUS $ per day
LocalEntrepreneurs
Land Operator
LocalEntrepreneurs
Figure 4
Figure 5 shows the same information, but in percentages. On average, Costa Rican entrepreneursabsorb the largest percentage of the ecotourist expenditure (38%), followed by the airline’s capture of33%. In spite of that, 56% of the total Ecotourist expenditure in Costa Rica is absorbed byinternationals, and 44% from nationals. However, this study does not estimate the extra expendituresEcotourists may undertake in Costa Rica --souvenirs, tips, extra meals, telephone calls, etc. Theseadditional expenditures, if accounted for, might bring the percentages into parity.

47
Hotel
Meals
Entrance Fees
Guide
Others Land Operator
Transportation
Wholesalers, TourOperators andTravel Agents
Airline
Value Added to Costa Rica’s Eco-tourism
38%
44%
67%
100%44%
38%
38%
8%
18%
25%
29%
33%
Eco-tourism toCosta Rican
LocalEntrepreneurs
Eco-tourism toEco-tourists
fromIndustrialized
Countries
Eco-tourism toCosta Rican
Land Operators
4%
6%5%
4%
7%
10%
33%
23%
6%
Note: the % valuesinside the boxescorrespond to % oftotal Eco-tourismexpenditure per day
LocalEntrepreneurs
LocalEntrepreneurs
Land Operator
Figure 5
Before analyzing Costa Rica’s ecotourism value chain more in depth, it is important to consider someof the strengths and weaknesses of this type of study. The costs and revenues used in its elaborationare for one period only. Long-term changes in cost structures, investments, inflation, violence inCentral America, a war with Iraq-- almost any economic change in the world can make today’scurrent data to be outdated by next period. These results must be interpreted with care not to projecttoday’s ecotourism value chain onto the expected behavior of tomorrow’s ecotourist, or tomorrow’secotourism industry.

48
11. Conclusions: International and National Rent Capture from Costa Rica’s Ecotourism
Tourism is a widely praised industry because of the rapid development --through job creation,technology transfer, investments, and others-- it can bring to remote underdeveloped communities.As mentioned earlier, it has been even considered by worldwide organizations as the industry thatwill lead the world into sustainable development. Nevertheless, tourism, especially mass tourism,involves much leakage due to the large expenditures on imports and foreign operators’ repatriation ofprofits.
Strasdas (1994) states that only one third of revenues from mass tourism stays in the country ofdestination, the other two thirds go to airlines and tour operators. From this one third, however, onlya small amount is for local people and conservationists; most of it goes to the capital of the country.From our value chain analysis, we found that 44% of the ecotourist’s expenditure is spent in CostaRica. Of that 44%, how much leaks out of the economy due to imports and foreign investment isrelated to four factors:
(1) The total 56% captured by the airline, wholesalers, tour operators and travelagencies leave the country
(2) The total 19% captured by the guide, the entrance fees, the land operator and itsadministrative and extra expenses (i.e. others) stay in Costa Rica
(3) Costa Rican hotels and food producers capture almost all of their share, but asmall percentage that leaks due to food imports and other imports. 80% of Costa Ricanhotels have less than 40 rooms and are owned by Costa Rican residents that re-spendtheir money locally and pay taxes.
(4) Costa Rican transportation sector captures the least percentage of the sectorsbecause all the cars and buses it uses are imported to Costa Rica, plus the gasoline theyuse.
Table 11 estimates, based on these assumptions, of the national and international percentage rentcapture of these goods and service. The final result, 37% of national rent capture, is not a lowpercentage, considering that there are no Costa Rican airlines that could compete for the 33% of theshare captured by international airlines.

49
Table 11Estimation of National and International Rent Capture of Costa Rica’s Ecotourism
Revenues
Rent Captureactivity national internationalguide 4%
others 5%
entrances 4%
land operator 6%
meal 6% 1%
hotel 8% 2%
transportation 4% 4%
wholesalers, t.o, t.a 23%
airlines 33%
TOTAL 37% 63%
We concur with Lindbergh and Hawkins that if Costa Rica wants to increase its national rent captureby reducing leakage, the following recommendations may help:
1. Create employment in the ecotourism industry by training and forming skilled individuals thatcould become guides and managers.
2. Ecotourists want to use existing local modes of transportation- whenever possible, use localboats, canoes, mules, or taxis.
3. Improve the linkages with agriculture and fishing- Ecotourists tend to be interested in localcuisine
4. New Eco- tourism constructions should be small scale and in remote locations, with the use oflocal labor and materials.
5. Develop local handicrafts and other souvenirs (107)
The next logical step in this research agenda, now that some approximation has been made about thevalue chain for ecotourism in Costa Rica, is to examine the value chain for mass tourism in the samecountry. There is a tendency for this country right now to move away from its roots in nature-basedtourism, towards mass or non-nature-based tourism (beachfront, golf, etc.). Before this tendencygains much more momentum, it would be valuable to know which form of tourism is moreappropriate for the long-term sustainable development of the country.

50
WORKS CITED
Aylward, Bruce and Allen, Katie and Echeverría, Jaime and Tosi, Joseph. “Sustainableecotourism in Costa Rica: the Moneteverde Cloud Forest Preserve” Biodiversity andConservation 5, 315-343 (1996).
Ayala, Hana. “Resort Ecotourism: A Paradigm for the 21st Century” Cornell Hotel andRestaurant Administration Quarterly, 1996
Bermúdez, F., 1996. Propuesta de variables para definir tarifas de ingreso a las areas silvestresprotegidas para visitantes no residentes. Tesis presentada para optar al grado académico de licenciatura en administración de empresas y actividades turísticas. Universidad Internacional de las Américas. Carrera de Turismo. San José, Costa Rica.
Besleme C., Katherine and Aguilar, Bernardo. “An Economic Valuation of Carara BiologicalReserve: Potential Tourism Values as an Incentive for Conservation” III Biennal Meeting of the International Society for Ecological Economics “Down to Earth, Practical Applications of Ecological Economics San José, 1994.
Bien, Amos. “El Papel de las Reservas Privadas en la Conservación y el Ecoturismo” . Ponencia en el seminario Turismo Sostenible celebrado en Costa Rica. UNA. Costa Rica. 1997
Blake, B. and Becher, A. The new key to Costa Rica. Publications in English. San José. Costa Rica: 1991.
Briassoulis, H., & Van Der Straaten, J., Tourism and the Environment: Regional, Economic and Policy Issues. The Netherlands: 1992.
Budowsky, Gerardo. “Tourism and Environmental Conservation: Conflict, Coexistence or Simbiosis?” Environmental Conservation N° 31: 1976.
Budowsky, Tamara. “Ecoturismo a la Tica”. Hacia una Centroamerica Verde; Seis Casos de Conservación Integrada. Stanley Heckandon Moreno y Otros. 2 ed. San José, Costa Rica: Editorial DEI, 1993.
Boo, Elizabeth. Ecotourism: The Potentials and Pitfalls. World Wildlife Fund: WashingtonDC 1990.
Certified Management Accountant, Institute of Management Accountants, Cosnsortium for Advanced Manufacturing - International. “Value Chain Analysis for Assessing Competitive Adavantage” Management Accounting Guideline 42 June 1996.
Chant, S., 1992. “Tourism in Latin America: perspectives from Mexico and Costa Rica” Tourism and the Less Developed Countries. New York, USA.

51
Clech, Christiane. “The European Senior Travel Market: A Golden Opportunity for The Traveland Tourism Industry” World Travel and Tourism Review: Indicators, Trends andIssues. Ritchie, J.R. Brent, and Hawkins, Donald E. (eds). Vol. 3 CAB International,Wallingford: 1993.
Cook, Suzanne. “Changing Demographics, Attitudes, and Lifestyles of the U.S. Consumer”World Travel and Tourism Review: Indicators, Trends and Issues. Ritchie, J.R. Brent,and Hawkins, Donald E. (eds). Vol. 3 CAB International, Wallingford: 1993.
“Certification for Sustainable Development”, ICT Department of Natural Resources, April 1997.
Cummings, Barbara, and Mills, Jeff. “Open Travel Markets – Creating Jobs”www.wttc.org/wttcgate.nsf 10/08/97
Dickinson, Rachel and Edmonson, Brad. “Golden Wings” American Demographics,Dec. 1996
Dixon A., John and Sherman B., Paul. Economics of Protected Areas: A New Look at theBenefits and Costs. Island Press: Washington DC, 1990.
Dogget, Leslie R. “Tourism Industries: A New Office Joins the International Trade Administration” Business America. Vol.117. Iss:7. July 1996 p:15-17.
Douglas W, Nelms. “Environmental Focus” Air Transport World Vol. 34, Iss:6, June 1997, p:149-151
Eagles, Paul F.J. “Understanding the Market for Sustainable Tourism” McCool, Stephen;Watson, Alan E.; (eds) Linking Tourism, the Environment, and SustainabilityMinneapolis, 1995.
Fenell, D. A., and Eagles, P., 1990. Ecoourism in Costa Rica: a conceptual framework. Journalof parks and recreation administration, 8.1. USA.
Forbes, Robert J. and Maree S. “Special Interest Travel - Creating Today´s Market DrivenExperiences” World Travel and Tourism Review: Indicators, Trends and Issues. Ritchie,J.R. Brent, and Hawkins, Donald E. (eds). Vol. 3 CAB International, Wallingford: 1993.
Goledner, C.R. “The 1997 Travel Outlook” Journal of Travel Research Vol.35, Iss:3, Winter1997, p:61-65
Horizontes, Horizontes Nature Tours News 1:1 Costa Rica, 1992
Instituto Costarricense de Turismo (ICT). 1995. Encuesta aerea de extranjeros en la epoca turistica alta. Area de Estadistica. Costa Rica.
Instituto Costarricense de Turismo (ICT). 1995. Plan estrategico de desarrollo turistico sostenible

52
de Costa Rica 1995-1999 (Actualizacion del plan para 1993-1998). San jose, Costa Rica.
ICT. Classification of Tourism Agencies. Interview. 07/07/97
Kramer A., Randall and Evan D., Mercer. “Valuing a Global Environmental Good: USResidents’ Willingness to Pay to Protect Tropical Rain Forests” Land EconomicsMay 1997, 73 (2): 196-210.
Lickorish, Leonard J. “Development of Tourism in, to and from Europe”. RaymondBar-On, Raphael and Even-Zahav, Moshe (eds). Investments and Financing in theTourism Industry: Papers presented at The First International Conference on Investmentsand Financing in the Tourism Industry, Jerusalem, Israel, May 16-21, 1993
Lindberg, Kreg and Hawkins E., Donald (eds.) Ecotourism: A Guide for Planners and Managers The Ecotourism Society: Vermont, 1993.
Lipman, Geoffrey. “Generating Investments in the World´s Largest Industry” RaymondBar-On, Raphael and Even-Zahav, Moshe (eds). Investments and Financing in theTourism Industry: Papers presented at The First International Conference on Investmentsand Financing in the Tourism Industry, Jerusalem, Israel, May 16-21, 1993
Lizano, R. 1997. Tarifas en parques nacionales. El caso de Costa rica; estudio de caso. No publicado. INCAE. Alajuela, Costa Rica.
Lizano, Rodolfo. ICT Department of Natural Resources. Interview.10/22/97
Lizano, Rodolfo. ICT Department of Natural Resources. Presentation 30/01/98
McIntyre, George. Sustainable Tourism Development: Guide for Local Planners.WTO:Madrid, Spain. 1993
MINAE. Interview with Héctor Arce 11/17/97
Monestel, L., 1997. Situacion financiera e institucional del Sistema Nacional de Areas de Conservación (SINAC). No publicado. INCAE. Alajuela, Costa Rica.
OET (Organización para Estudios Tropicales) Interview with Annie Simpson deGamboa. 11/17/97
Ohashi, Taiji. “Japanese Outbound Tourism” World Travel and Tourism Review: Indicators,Trends and Issues. Ritchie, J.R. Brent, and Hawkins, Donald E. (eds). Vol. 3 CABInternational, Wallingford: 1993.
OTS. Gamboa, Annie. Interview. 07/07/97
Pearce, David and Moran, Dominic. The Economic Value of Biodiversity Earthscan
53
Publications Ltd.: London. 1994.
Piza, María Amelia. Horizontes Travel Agency (Land operator). Interview 07/1997
Piza, María Amelia. Horizontes Travel Agency (Land operator). Interview 10/22/97
Piza, María Amelia. Horizontes Travel Agency (Land operator). Interview 10/18/97
Price, M., 1996. People and Tourism in Fragile Environments. West Sussex. England.
Rovinsky, Y., 1993. Private Reserves, Parks and Ecotourism in Costa Rica, in Nature Tourism: Managing for the environment. Washington. USA.
Saayman, Melville. “A Model for Strategic Planning and Marketing for Regional Tourism Development”. Raymond Bar-On, Raphael and Even-Zahav, Moshe (eds) Investments and Financing in the Tourism Industry: Papers presented at The FirstInternational Conference on Investments and Financing in the Tourism Industry,Jerusalem, Israel, May 16-21, 1993
Salazar, S. & Evans-Pritchard, D., 1992. Agencias de turismo ecológico y áreas protegidas. Editorial in the newspaper: La República. San José. Costa Rica.
Segleau, J. 1995. La empresa de hospedaje ecoturistico en Costa Rica y sus aportes al desarrollo sostenible: una propuesta de clasificacion. Tesis para la obtencion del titulo de la Maestría turismo ecológico de la ULACIT. San José. Costa Rica.
Stephen F., Witt and Wiz, Moutinho (eds). Tourism Marketing and Management Handbook.Prentice Hall. UK:1989.
Strasdas, Wolfgang. “Rettet Sightseeing den Planeten?” Die Tageszeitung, 9/3/1994.
Swanson M., Timothy and Barbier B., Edward. Economics for the Wilds Island Press:Washington DC, 1992.
Tabares Cardenas, Fabio. La Segmentacion del MercadoTuristico- Comercializacion y VentaMexico, Editorial Trillas, agosto 1991
Thuermer, Karen, E. “A Tour of an Overlooked Export Sector” World Trade Journal vol:9 Iss:11 date:nov 1996
Travis, Anthony. “New Demand Trends and the Wide Range of New Tourism Products inEurope” Seminar on New Forms of Demand, New Products, WTO Nicosia, Cyprus,May 1991.
Turner R., Kerry and Pearce, David and Bateman, Ian. Environmental Economics The JohnsHopkins University Press: Baltimore. 1993

54
U.S. Bureau of the Census. Statistical Abstract of the U.S.:1996. Washington D.C:: 1996.
Umaña, A. 1990. La herencia de los recursos naturales. La Uruca, San José. Costa Rica.
Umaña, A. 1996. El financiamiento del desarrollo sostenible. Centro Latinoamericano de Competitividad y Desarrollo Sostenible (CLACDS). INCAE. Alajuela. Costa Rica.
Umaña, F. 1996. Modelo para clasificar y evaluar proyectos ecoturisticos. Tesis para la obtencion del titulo de la Maestría turismo ecológico de la ULACIT. San José. Costa Rica.
Vialle, Olivier. Global Distribution Systems (GDSs) In the Tourism Industry. 1995, Madrid, WTO.
www.magi.com/crica/info/tico_parks.html, 11/14/97
www.wttc.org/wttcgate.nsf, 5/2/97
Williams, W., 1992. Ecotourism and buffer zone management at Monteverde Reserve. Consultant´s report. United States International Agency for Development- Regional Central American Official Programe. San Jose. Costa Rica.
World Bank. World Tables:1994. Johns Hopkins University Press. Baltimore:1994.
WTO. Agenda 21 for the Travel and Tourism Industry: Towards Environmentally SustainableDevelopment. Spain, 1994
WTO. Tendencias del Mercado Turistico: Americas 1986-1996. Madrid:Spain, 1997
Ziffer, Ecotourism: The Uneasy Alliance. Working Papers, 1989.

55
Table 1 Total National and International Visitors to Costa Rican National Parks and
Corresponding Entrance Fees1979-1996
YEAR TOTALVISITORS
NationalTourists
Fee $ International Tourists Fee $
1979 Nd Nd ,23 Nd ,23
1980 Nd Nd ,23 Nd ,23
1981 Nd Nd ,23 Nd ,23
1982 205,640 140,262 ,13 65,378 ,13
1983 194,402 134,136 ,13 60,266 ,13
1984 234,063 170,101 ,21 63,962 ,21
1985 245,662 182,161 ,39 63,501 ,39
1986 261,967 191,911 ,44 70,056 ,44
1987 287,047 215,324 ,44 71,723 ,44
1988 360,222 235,512 ,44 124,710 ,44
1989 394,742 228,206 ,44 166,536 ,44
1990 453,033 240,036 ,60 212,997 1,18
1991 496,406 222,975 ,80 273,431 ,80
1992 605,287 283,126 1,57 322,161 1,57
1993 772,025 367,683 1,57 404,342 1,57
1994 700,434 322,148 1,27 378,286 15,10
1995 634,835 362,341 1,12 251,740 15,10,7, 5,29
1996 658,657 389,883 ,98 268,774 6
Source: Bermúdez, Fernando. 1996 MINAE