Embed Size (px)
Citation preview

63
The Case of the Underground Passage: Putting the Clues Together to Understand Karst Processes
By B. Mahler1, B. Garner1, and N. Massei21U.S. Geological Survey, 8027 Exchange Drive, Austin, TX 78754 2UMR 6143 M2C, Département de Géologie, Université de Rouen, 76821 Mont Saint-Aignan cedex, France
ABSTRACT
Contaminants in surface water entering karst aquifers in focused recharge can be transported rapidly through the system to discharge at springs. Such contaminants act as anthropogenic tracers of ground-water transport; analysis of their breakthrough curves as they discharge from springs allows identification and apportionment of contaminant sources, and can provide insight into aquifer structure and function. At Barton Springs, the principal outlet for the Bar-ton Springs segment of the Edwards aquifer, near Austin, Texas, breakthrough curves for several anthropogenic and natural tracers have been analyzed. The proportion of discharge composed of recent recharge is determined with a mix-ing model for oxygen-18: following rainfall, an initial increase in discharge related to pressure transfer is clearly seen, followed by a further increase consisting of an increasing proportion of recently recharged water, which reaches a max-imum about 48 hours after rainfall. First appearance of contaminants varies from less than 20 to more than 40 hours after rainfall, depending on the contaminant, aquifer conditions, and location of contaminant source. Decomposition of breakthrough curves of sediment, nutrients, pesticides, and volatile organic compounds at the different spring ori-fices indicates the existence and approximate location of multiple conduit flow routes, contaminant times of travel, and probable contaminant sources. Differences in breakthrough curve shape and magnitude indicate urban runoff, contam-inant spills, and infiltration through the soil zone as sources of different contaminants. Comparison of contaminant loads in recharging surface water to those estimated for the decomposed breakthrough curves allows apportionment of contaminants to the five watersheds contributing recharge to the aquifer.

64
Spatial and Temporal Variations in Epikarst Storage and Flow in South Central Kentucky’s Pennyroyal Plateau Sinkhole Plain
By Chris Groves1, Carl Bolster2, and Joe Meiman31Hoffman Environmental Research Institute, Western Kentucky University, Bowling Green KY 421012USDA ARS Animal Waste Management Research Unit, Bowling Green KY 421043Division of Science and Resource Management, Mammoth Cave National Park, Mammoth Cave, KY 42259
ABSTRACT
The well-developed karst aquifers of south central Kentucky’s Pennyroyal Plateau are impacted by contamination from animal waste and other agricultural inputs. Understanding fate and transport of these and other contaminants first requires knowledge of flow and storage behaviors within the impacted aquifers, complicated by significant heterogeneity, anisotropy, and rapid temporal variations. Here we report on spatial and temporal variations in vadose zone flow and water chemistry (or quality) within Cave Spring Caverns, Kentucky beneath agricultural lands on a well-developed sinkhole plain. Weekly sampling of three underground waterfalls show statistically significant differences in water quality, though the sites are laterally within 160 m and are all located about 25 m underground, in a groundwater basin of about 315 km2. These reflect a combination of differences in epikarst flow and land use above the cave. High-resolution (minutes) monitoring of precipitation recharge along with flow and specific conductance in one of the waterfalls reveals a significant storage and mixing reservoir within the soil/epikarst zone. Varying precipitation rates and antecedent moisture conditions result in a range of storm responses observed at the waterfall, depending in part on whether this reservoir is filled or depleted. Slow and rapid flow paths through this storage zone were observed, the latter triggered by high recharge rates. These observations are generally consistent with the interpretations of Perrin and others (2003) from a Swiss limestone aquifer in a somewhat different hydrogeologic setting, strengthening the idea that epikarst and, more generally, vadose zone storage play a key role influencing flow and transport within karst aquifer systems.
INTRODUCTION
Well-developed karst aquifers are extremely vulnerable to contamination due to the ease and rapidity with which fluids can enter and move through these systems. For example, within south central Kentucky’s Pennyroyal Plateau, contamina-tion of groundwater by agricultural contaminants associated with animal waste such as fecal bacteria and nitrate is widespread (Currens, 2002; Conrad and others, 1999). Understanding agricultural impacts on karst aquifers is particularly challenging due to significant heterogeneity and anisotropy typ-ically found in these systems, which can lead to large spatial and temporal variations in flow and water chemistry conditions.
The epikarstic, or subcutaneous zone (Will-iams, 1983; Perrin and others, 2003; Jones and oth-ers, 2003) forms an important component of many karst flow systems. The typically perched epikarst aquifer forms in the vicinity of the soil/bedrock interface where fractures have been widened from dissolution by acidic soil water. As the infiltrating water quickly approaches equilibrium with respect to the limestone bedrock, dissolution rates drop, as does solutionally-enhanced permeability. As a result the epikarst constitutes a relatively high permeabil-ity zone in comparison with less permeable rocks below. Evaluating the impacts of epikarst flow and storage is critical for understanding the fate and transport of agricultural contaminants within karst aquifers.

65
Recently progress has been made in under-standing the details of karst flow and geochemical processes by high-resolution monitoring with elec-tronic probes and digital data loggers (e.g. Baker and Brunsdon, 2003; Charleton, 2003; Groves and Meiman, 2005; Liu and others, 2004). The impor-tance for understanding karst dynamics comes not as much for the ability to automatically collect data in relatively remote locations, as for the ability to col-lect high temporal resolution data. Flow and chemi-cal data with a resolution of minutes capture all significant structures of hydrologic variation, even for karst systems. This can be useful for interpreting information about aquifer structure by comparing the detailed timing and magnitudes of related phe-nomena. In a recent example, Liu and others (2004) interpreted controls on aquifer behavior in south-west China’s tower karst by comparing rates, direc-tions, and magnitudes of changes in water levels, specific conductance (spC), saturation indices, and PCO2 in storm responses from a large karst spring and nearby well.
While the long-term goal of the research we describe here is to quantitatively understand funda-mental controls on relationships between agricul-tural land use and karst groundwater quality, here we evaluate epikarst flow and storage within south cen-tral Kentucky’s Pennyroyal Plateau sinkhole plain based on vadose water sampling from three water-falls located beneath active farming land. Evaluating the hydrologic behavior of the epikarst at the site is a critical step to quantitatively evaluating the fate and transport of agricultural contaminants.
FIELD SITE
Three subsurface waterfalls are being moni-tored, as well as rainfall and other atmospheric parameters, within and above Cave Spring Caverns (Figures 1-4) near Smiths Grove, Kentucky. The cave is located beneath a small portion of the exten-sive sinkhole plain of the Pennyroyal Plateau within the Mississippian Plateaus Section of the Interior Low Plateaus Physiographic Province. Just over 2 km of large horizontal cave passages pass beneath several farm fields, with the cave floor typically
about 25 m below the ground surface. Water enters at numerous locations as perennial or intermittent streams or waterfalls. The recharge area lies within the Graham Springs Groundwater Basin (Ray and Currens, 1998) which discharges at Wilkins Blue-hole on the Barren River, 18 km to the southwest. Wilkins Bluehole is the second largest spring in Kentucky, with a minimum discharge of 0.56 m3/s (Ray and Blair, in press).
The cave is formed within the upper part of the Mississippian St. Louis Limestone (Richards, 1964). The Lost River Chert, a discontinuous unit of silica-replaced limestone typically 2-3 m thick near the site, lies between the ground surface and the cave. Locally, beds dip gently to the west at about 1-2º.
South central Kentucky has a humid-subtropi-cal climate. Using climatic data from the Mammoth Cave and Bowling Green areas, Hess (1974) esti-mated that the area has a mean precipitation of 1,264 mm/yr, and the mean-annual temperature is 13oC. Late summer and early fall are drier than other months. Hess (1974) estimated that mean-annual potential evaporation is 800 mm, varying from near zero to over 100 mm/mo.
The three percolation waterfalls--1, 2, and 3 in order moving into the cave--fall between about 5 and 8 m from the ceiling along the east side of the main passage starting about 40 m north of the cave’s entrance, within a 160 m section of the passage (Figure 1).
METHODS
There are three related sampling programs: sur-face weather conditions, weekly sampling and labo-ratory analysis of water at the three waterfalls, and 2-minute monitoring of flow, specific conductance (spC), pH, and temperature at waterfall 1. Details of these sampling programs are provided as follows:
Surface Rainfall
On the surface 110 m south of the cave entrance is an automated HOBOTM weather station that col-lects rainfall, temperature, wind speed and direction,

66
relative humidity, and solar radiation (Figure 2). Rainfall is resolved to the nearest 0.25 mm, and summed every five minutes. Due to interference by birds over part of the reported period, we utilized five-minute rainfall after 25 March 2005 (including storms 2, 3, and 4 discussed below) from the National Park Service Atmospheric Monitoring Sta-tion near the town of Pig, 9.5 km to the northeast.
Field Collection and Laboratory Analysis
Water was collected from each waterfall weekly in sterile, acid-washed HDPE bottles and stored on ice. In most cases water was analyzed within three hours of collection. Water samples were analyzed for a suite of parameters indicative of limestone weathering (e.g. Ca, Mg, alkalinity, and specific conductance (spC)) and agricultural impact (e.g., NO3, PO4, and NH4). Alkalinity was measured using the inflection point titration method (Rounds and Wilde, 2001) and reported as mg/L CaCO3 mg/L. Ca and Mg were analyzed in triplicate using inductively coupled plasma optical emission spectroscopy (ICP-OES). NO3, PO4, and NH4 were measured in triplicate using a Lachat “QuickChem” method. Preliminary analysis indicated that particulate-associated Ca, Mg, and nutrients were minimal; subsequently water samples were not filtered prior to analysis. Dissolved oxygen (DO), pH and spC were measured in the field with a YSI 556 multi probe system (YSI Environmental). Data were collected from February 23, 2005 to May 25, 2005 for Ca, Mg, spC, and DO (n=13), March 3, 2005 to May 25, 2005 for alkalinity (n=12), and March 23, 2005 to May 25, 2005 for NO3, PO4, and NH4 (n=10).
Data Logging at Waterfall One
The site is equipped with an array of electronic sensors and loggers and tied to a common tipping bucket rain gauge (Campbell Scientific (CSI) TE525) resolving tips of 0.1 mm. Discharge from the rain gauge is directed into 10-mm Tygon tubing which feeds a PVC flow-through chamber (20 mm ID) mounted with a series of three Cole-Parmer double-junction industrial in-line ATC pH sensors.
Each pH sensor is connected to a three-meter shielded coaxial cable and terminates in the instru-ment box (Pelican 1400) at a Cole-Parmer preampli-fier to increase signal stability. This pH system can resolve pH to +/- 0.01 SU. The pH flow-through chamber discharges into a section of 10-mm Tygon tubing where it is split into three paths, each passing through a CSI CS547A-L specific conductance/tem-perature sensor. This sensor can resolve temperature to +/- 0.1oC and specific conductivity to +/- 0.001 mS. The three paths are then rejoined into a single section of tubing and positioned at an elevation approximately 40 cm higher than the sensors to assure pipe-full conditions. The signal from the rain gauge is split into three cables, each connected to a CSI CR10X digital micrologger (Figure 3). Each micrologger is connected to its corresponding set of pH, conductivity (spC) and temperature sensors. This redundancy in spC, temperature, pH, and data loggers not only ensures backup in the case of mal-function, but when fully operational we calculate means, standard deviations, and coefficients of vari-ation (CV) for each observation. The 14,359 spC observations (each made in triplicate) reported in this paper had an average CV of 2.7%. This value is similar to the CV of Waterworks Spring (2%) which has been considered the only perennial "diffuse flow" spring in the region. Waterworks Spring is located near conduit dominated Wilkins Bluehole, which has a greater CV at 14% (Quinlan and others, 1983; p. 57).
Every 30 seconds the micrologger program is executed. The program is set to output tip totals from the rain gauge every five minutes, and to average the 30-second pH, spC, and temperature values every two minutes. To reduce redundant data the program compares the current two-minute average values of each sensor to that of the previous two-minute aver-age. If the absolute value of change exceeds a preset value--the current two-minute average values for all sensors is committed to final storage. In any event, the current two-minute values are always stored once per hour. In this way we achieve two-minute resolution even during hourly recording, because we know under those static conditions the observations have not varied beyond the threshold value.

67
The waterfall flow data are given in tips per minute for the tipping bucket gage, but these do not yield discharge directly because some of the water, especially at higher flows, falls outside of the bucket orifice. These data thus only give a relative flow indication, but the signals (Figure 5) give a clear indication of dry and wet conditions and their correlation with rainfall events. We are in the process of developing a rating curve relating tips per minute to actual discharge, which we measure periodically by catching the flow in a large tarp and measuring the volumetric flow rate with a 10 liter bucket.
Statistical Analysis of Water Quality Data
Single-factor analysis of variance (ANOVA) was used to determine if statistically significant differences exist in important water quality parameters between the three waterfalls. Differences between waterfall locations may reflect different residence times and land use activities at the surface. Prior to analysis, Ca, NO3, PO4, and spC were log-transformed whereas Mg was inverse-transformed to obtain approximately normal distributions. Alkalinity, on the other hand, was normally distributed so no transformation was needed. Fisher’s t-test was used to compare means between different waterfalls (Helsel and Hirsch, 1993). All statistical analyses were performed using SAS version 9.1 (SAS Institute Inc., 2003).
RESULTS
Temporal Variations at Waterfall One
Between 21 March and 10 April 2005, precipi-tation, waterfall flow, and spC data reflect four suc-ceeding rain events that occurred over progressively wetter antecedent moisture conditions. Although we currently lack data for a rating curve, discharge directly measured under very dry conditions at the waterfall (31 May 2005) was 0.04 L s-1. Using an empirical value of 1.98 L s-1 km-2 for unit base flow (Quinlan and Ray, 1995), derived from preliminary data for the autogenic recharge area of the Graham Springs Basin (Joe Ray, Kentucky Division of
Water, personal communication, 2005), this dis-charge corresponds to an estimated recharge area for the waterfall of about 2 ha. Estimates of three epikarst spring recharge areas at other sites in Ken-tucky range from 4-8 ha (Ray and Idstein, 2004). Although the rainfall data after 25 March (storms 2-4) are from 9.5 km away, they show close correla-tion to the cave signals when there was a response.
Responses of the cave parameters show a vary-ing behavior following the different storm events and thus provide information on flow and storage within the aquifer system. Flow in the waterfall, ini-tially under relatively dry conditions, began to increase within 2.3 hours of the onset of significant rainfall measured above the cave system, and showed a clear flow increase of about 120% that returned to the original condition within about 1.5 days. However, there was no systematic change in the spC signal following this rainfall, as explained later.
About three days later a more intense storm occurred with obvious differences in the cave response. While the timing of the flow increase was similar to the first storm (though rain data for this storm are from the NPS station), flow rates stayed more than twice as high as the initial condition for more than four days without significant rainfall, rather than returning quickly to pre-storm levels. The spC signal from relatively dilute rainfall quickly moving through the system was also clear and corre-sponded to rainfall intensity, reaching a low of about 160 µS cm-1, or about 70% of pre-storm levels, after an intense thunderstorm cell in which rainfall inten-sity exceeded 5 cm hr-1. We lost data on peak water-fall flow rate because the flow exceeded the limits of the tipping bucket mechanism, but later modified the equipment to accommodate higher flows.
The next storm, about four days later, was dif-ferent from the first two with respect to both signals. Flow rates continued at a similarly high level with-out an appreciable increase, while spC dropped again in very clear relation to rainfall. In contrast to the second storm, however, spC took more than seven days to rise to the same level that had taken

68
only two days after the previous rainfall, even though starting at a higher minimum level.
Finally, a small storm about five days later, which began with waterfall flow rates at a similarly high rate and spC still uniformly rising through time to pre-storm three levels, had little or no impact on waterfall behavior.
Spatial Water Quality Variations
Significant variations in water quality were observed between the three waterfalls (Figure 6). Both Ca and Mg were significantly higher in water-fall 2 and this is consistent with higher alkalinity and spC values at this location. The average Ca concen-tration for waterfall 2 was 50.7 mg L-1 compared to 32.1 mg L-1 and 33.4 mg L-1 for waterfalls 1 and 3, respectively (Figure 6A). Similarly, the average concentration of Mg in waterfall 2 was 8.57 mg L-1 compared to 5.93 mg L-1 for waterfall 1 and 5.02 mg L-1 for waterfall 3 (Figure 6B). Alkalinity and spC were also highest in waterfall 2. Mean alkalinity for waterfall 2 was 106 mg CaCO3 L-1 and for water-falls 1 and 3 the mean concentrations were 73.3 mg CaCO3 L-1 and 60.0 mg CaCO3 L-1, respectively (Figure 6C). Mean spC was 328 µs cm-1 for water-fall 2, 236 µs cm-1 for waterfall 1, and 238 µs cm-1 for waterfall 3. Differences between waterfall 2 and waterfalls 1 and 3 were statistically significant at the 99% confidence level (Figure 6D).
As was the case with Ca, Mg, spC, and alkalin-ity, PO4 was significantly higher in waterfall 2 (p < 0.001) compared to waterfalls 1 and 3 (Figure 6E). PO4 concentrations averaged 0.204 mg L-1 in water-fall 2 whereas mean concentrations were only 0.063 mg L-1 and 0.047 mg L-1 for waterfalls 1 and 3, respectively. NO3, on the other hand, was highest in waterfall 3 and lowest in waterfall 1 (Figure 6F). The average concentrations of NO3-N were 10.4 mg L-1, 8.19 mg L-1, and 5.60 mg L-1 for waterfalls 1, 2, and 3, respectively. (For reference, the EPA NO3-N Maximum Contaminant Level for drinking water is 10 mg L-1) Statistical analysis on log-transformed NO3-N data indicated that concentrations between the three waterfalls were significantly different (p < 0.001). NH4 concentrations were at or below
detection limit (0.02 mg L-1) for all sampling times at each location.
DISCUSSION
Although the three waterfalls are separated lat-erally by a total of only about 160 m and at about the same depth underground, within a groundwater basin of over 315 km2 (Ray and Currens, 1998), sta-tistically significant differences occur in water chemistry between the three sites. These appear to result from a combination of different land use types and subsurface flow path conditions. Differences between parameters expected to result from dissolu-tion of limestone, including Ca, Mg, alkalinity (closely related to bicarbonate concentrations), and spC, appear to indicate a difference in residence times for the flow paths leading to these waterfalls. Increased residence times may be due to greater flow path lengths and/or slower rates of movement through the epikarst and sections of the vadose zone below. Waterfall 2, for example (Figures 6A-6D), shows significantly higher concentrations than waterfalls 1 and 3 with respect to each of these four parameters.
The elevated concentrations of NO3 and PO4 measured in the waterfalls, particularly in waterfalls 2 and 3, suggest impact from agricultural land use in the cave’s recharge zone. Although we currently lack data to discriminate the individual waterfall recharge zones (tracer testing is in progress to eval-uate these), there are three different patterns in the concentrations of these compounds (Figures 6E and 6F) and indeed three general types of land use above the cave (Figure 1). Above and south of the first 90 m of the cave entrance (Figure 1, parcel A) is resi-dential, the area to the north over the next 200 m (parcel B) had row crops (wheat) during the sam-pling period, and the area across the road to the east (parcel C) had cattle production. The row crops had both animal waste and chemical fertilizers applied before and during the study, while no chemicals were applied to either parcel A or C during or before sampling. While somewhat speculative until more data become available, a hypothesis consistent with the results so far might indicate that waterfalls 1, 2,

69
Figure 1. Map of the entrance area to Cave Spring Caverns showing sampling locations in relation to surface.
Figure 4. Water sampling at Waterfall Three using remote device to avoid a shower while sampling.
Figure 2. Weather station for recharge mea-surements, showing typical surface landscape above the cave system.
Figure 3. Triplicate Data logger system at Water-fall One.

70
and 3 have at least partial recharge zones in parcels A, B, and C, respectively. This is indicated by water relatively low in both NO3 and PO4 from A (residen-tial), higher in both from B (animal and chemical fertilizers), and from C where NO3 is high from cattle waste but PO4 is low because no fertilizer was applied. As the rocks within which the cave has formed are dipping to the west, it is feasible that some parts of the waterfall recharge zones could be located to the east in parcel C.
Comparison between rainfall and flow and spC at waterfall 1 (Figure 6) reveals significant storage within the soil/epikarst above the cave, as well as slow and rapid flow paths through the epikarst whose functions depend on recharge rates and ante-cedent moisture. The spC signal at the onset of the record (~220 mS cm-1) represents water that has reached an approximate chemical equilibrium with the soil/epikarst system. This signal is at times diluted by rainfall that has a typical spC of 10-15 mS cm-1 as measured at the NPS Atmospheric Monitor-ing Station (Bob Carson, National Park Service, per-sonal communication).
While the flow conditions clearly responded to the input from the first rainfall (~day 81) the fact that spC did not change suggests that no dilute rainwater reached the probes, and that the storm input altered the hydraulic gradients within the epikarst in a way that pushed through a slug of previously-stored water, which drained through in about 1.5 days. While another possibility is that rainwater did indeed come through quickly but had within a short period developed the chemical characteristics of the epikarst storage, consideration of later storms, dis-cussed below, makes this unlikely.
The intense rainfall beginning on day 86 was sufficient to impact the waterfall’s spC indicating a relatively rapid transport of rainwater through the system within about one-half day, although it is impossible to measure this timing more accurately as these rainfall data came from 9.5 km away. Once this flow had been established, water from a large, very intense thunderstorm cell (occurring over the cave at about the same time as the more distant rain
gauge, based on observations at the cave) caused a precipitous drop in spC within hours. While the spC returned to within 5% of its pre-storm values with less than eight hours after the spC minimum, the fact that flow remained high instead points to a signifi-cant epikarst storage reservoir. We interpret the dif-ferences in these two storms to suggest that this reservoir was relatively depleted during the dry ante-cedent conditions prior to the first storm, but was “replenished” during the large recharge event of storm 2. Differences in the three-dimensional head distributions within the epikarst water between the filled and depleted reservoir conditions account for differences in the responses. The more gradual return to prestorm spC conditions over the next sev-eral days reflects both mixing of storage and rainfall waters, as well as chemical reactions (limestone dis-solution, for example) that increase the ionic strength of recharge water. The storm 2 response also suggests a recharge intensity threshold above which a rapid flow path is established, in addition to the more diffuse flow paths continually present.
These interpretations are consistent with the response from the third storm (day 92), which was intense but occurred under antecedent conditions with relatively full epikarst storage. The return to pre-storm chemical conditions is more gradual than in the previous storm, however, reflecting the greater proportion of storm to chemically equili-brated water within the reservoir. These two responses also indicate that the timescale for chemi-cal mixing/ equilibration for these waters is on the order of several or more days, confirming that the slug of water pushed through during the first storm was already in the aquifer prior to that storm’s onset.
Using flow and isotope measurements of rain-fall and spring water, as well as underground streams leading to the spring, Perrin and others (2003) concluded that the soil/epikarst system forms an important mixing reservoir and were able to dis-criminate waters contributed by diffuse and rapid flow through the epikarst reservoir, the latter operat-ing when a threshold recharge rate has been exceeded. These findings are similar to those obtained in the present study, and taken together, the

71
Figure 5. Plots of flow rate and mean specific conductance for waterfall 1 in Cave Spring Cav-erns, along with rainfall above the cave.

72
Figure 6. Boxplots of (A) calcium (mg L-1), (B) magnesium (mg L-1), (C) alkalinity as CaCO3 (mg L-1), (D) specific conductance (µS cm-1), (E) phosphate (mg L-1), and (F) nitrate-N (mg L-1). Boxes with same letter are not significantly different based on Fisher’s t-test on means of transformed (ca, Mg, Spc, NO3, and PO4) and untransformed data (alkalinity).

73
two studies provide quantitative evidence to strengthen the hypothesis that vadose zone storage plays a key role influencing flow and transport within a variety of karst aquifer systems.
ACKNOWLEDGMENTS
Funding for this work was provided by the US Department of Agriculture Agricultural Research Service. We appreciate very much the kind cooper-ation of Bill, Linda, and Nick Marohnic for access to their land and cave, as well as the assistance of Stacy Antle, Ben Estes, Deana Groves, Pat Kambesis, Tinesha Mack, Alanna Storey, Ben Tobin, Heather Veerkamp, and Carol Wicks who provided support to the project. We also thank Joe Ray and Chuck Taylor for thoughtful reviews of this manuscript.
REFERENCES
Baker, A. and C. Brunsdon, 2003, Non-linearities in drip water hydrology; an example from stump Cross Cav-erns, Yorkshire. Journal of Hydrology, v. 277, pp.151-163.
Charleton, R.A., 2003, Towards defining a scallop domi-nant discharge for vadose conduits; some preliminary results. Cave and Karst Science. v. 30, p. 3-7.
Conrad, P.G., D.I. Carey, J.S. Webb, J.S. Dinger, and M.J. McCourt, 1999, Ground Water Quality in Ken-tucky: Nitrate-Nitrogen. Kentucky Geological Survey Information Circular 60, Series IX, 5 p.
Currens, J.C, 2002, Changes in groundwater quality in a conduit-flow-dominated karst aquifer, following BMP implementation. Environmental Geology, v. 42, p. 525-531.
Groves, C. and J. Meiman, 2005, Weathering, geomor-phic work, and karst landscape evolution in the Cave City groundwater basin, Mammoth Cave, Kentucky. Geomorphology, v. 67, p. 115-126.
Helsel, D.R., and R.M. Hirsch, 1993, Statistical methods in water resources. Elsevier, Amsterdam, p. 529.
Hess, J., 1974, Hydrochemical Investigations of the cen-tral Kentucky Karst Aquifer System. Ph.D. thesis, Department of Geosciences, The Pennsylvania State University.
Jones, W.K., D.C. Culver, and J.S. Herman (eds.), 2004, Epikarst. Charles Town, WV: Karst Waters Institute, 160 p.
Liu, Z., C. Groves, D. Yuan, and J. Meiman, 2004, South China Karst Aquifer Storm-Scale Hydrochemistry, Ground Water, v. 42, p. 491-499.
Quinlan, J.F. and Ray, J.A., 1995, Normalized base-flow discharge of ground water basins: A useful parameter for estimating recharge area of springs and for recognizing drainage anomalies in karst terranes, in Beck, B.F. and Stephenson, B.F., ed., The Engineering Geology and Hydrogeology of Karst Terranes: Rotterdam, A.A. Balkema, p. 149-164.
Perrin, J., P-Y. Jeannin, and F. Zwahlen, 2003, Epikarst storage in a karst aquifer: a conceptual model based on isotopic data, Milandre test site, Switzerland. Journal of Hydrology vol. 279, p. 106–124.
Ray, J.A., and Idstein, P.J, 2004, Unpredictable surface exposure of epikarst springs in Kentucky, USA: in Epikarst, Jones, W.K., D.C. Culver, and J.S. Herman (eds.), Karst Waters Institute Special Publication 9, p. 140-141.
Ray, J.A. and Currens, J.C., 1998, Mapped karst ground-water basins in the Beaver Dam 30 x 60 Minute Quad-rangle, Kentucky Geological Survey.
Richards, P.W., 1964, Geologic map of the Smiths Grove quadrangle, Kentucky. US Geological Survey Geo-logic Quadrangle Map GQ 357.
Rounds, S.A., and Wilde, F.D., eds., September 2001, Alkalinity and acid neutralizing capacity (2d ed.): U.S. Geological Survey Techniques of Water-Resources Investigations, book 9, chap. A6., section 6.6.
SAS System for Windows, version 9.1, SAS Institute Inc., Cary, NC, 2002.
Williams, P.W., 1983, The role of the subcutaneous zone in karst hydrology. Journal of Hydrology v. 61, p. 45-67.
74
Comparison of Water Chemistry in Spring and Well Samples from Selected Carbonate Aquifers in the United States
By Marian P. Berndt1, Brian G. Katz1, Bruce D. Lindsey2, Ann F. Ardis3, and Kenneth A. Skach41U.S. Geological Survey, 2010 Levy Avenue, Tallahassee, FL 323102U.S. Geological Survey, 215 Limekiln Road, New Cumberland, PA 170703U.S. Geological Survey, 8027 Exchange Drive, Austin, TX 787544U.S. Geological Survey, 10615 SE Cherry Blossom Drive, Portland, OR 97216
ABSTRACT
Water chemistry in samples from 226 wells and 176 springs were assessed to determine if samples from springs and wells have similar concentrations of selected properties such as dissolved solids, dissolved oxy-gen, nitrate, and calcite and dolomite saturation indices. Samples were collected in seven carbonate aqui-fers–Edwards-Trinity, Floridan, Mississippian, Basin and Range, Valley and Ridge, Springfield Plateau, and Ozark. Comparisons were made between concentrations of inorganic constituents in water samples from springs and from wells within the same aquifer. Results were variable, but showed that concentrations were not significantly different between samples from springs and wells for most properties. Nitrate and dis-solved solids concentrations were only significantly different between spring and well samples in one or two of the seven aquifers; however, dissolved oxygen concentrations were significantly different between well and spring samples in four of the seven aquifers. Median calcite and dolomite saturation index values were significantly different between well and spring samples in three of the seven aquifers. Spring samples prob-ably represent water from shallower parts of the aquifer flow systems and thus represent parts of the flow system that are most susceptible to contamination from land-use practices. These results indicate that the collection of water from springs should be considered critical to adequately characterize water quality in carbonate aquifers.
INTRODUCTION gram. This number of samples from carbonate aqui-
About 20 percent of the ground water with-drawn for drinking water in the United States is from carbonate aquifer systems (M.A. Maupin, U.S. Geo-logical Survey, written commun., 2004). Under-standing the factors that control water quality in these systems requires information on water chemis-try from the aquifer matrix, fractures, and from sec-ondary porosity features (e.g., solution conduits). Comprehensive monitoring strategies that include the sampling of both springs and wells (Quinlan, 1989) have been used to interpret geochemical vari-ability that arises from ground-water flow through different parts of a carbonate aquifer system (Scan-lon, 1990; Adamski, 2000).
Water samples were collected from 226 wells and 176 springs in seven carbonate aquifers from 1993 through 2003 as part of the U.S. Geological Survey’s National Water-Quality Assessment Pro-
fers around the United States represents an opportunity to explore the differences in major-ion chemistry between samples collected from wells and from springs. Limestone and dolomite units were sampled within the following aquifers: Edwards-Trinity, Floridan, Mississippian, Basin and Range, Valley and Ridge, Springfield Plateau, and Ozark (fig. 1). These limestone and dolomite units range in age from Cambrian to Quaternary (Adamski, 2000; Miller, 1990; Maclay, 1995) and some are interlay-ered with sandstone or chert layers (Dettinger and others, 1995; Johnson, 2002; Kingsbury and Shel-ton, 2002).
COMPARISON OF SAMPLES FROM SPRINGS AND WELLS WITHIN SELECTED AQUIFERS
Spring and well water samples were collected from seven aquifers—Edwards-Trinity, Floridan, Mississippian, Valley and Ridge, Basin and Range,

75
Springfield Plateau, and Ozark. Within each aquifer, the number of water samples collected from springs ranged from 6 to 58 samples and the number of sam-ples from wells ranged from 18 to 57 (fig. 2). In the Floridan aquifer system, samples were collected exclusively from the Upper Floridan aquifer, thus Upper Floridan will be used for the remainder of this discussion. Comparisons were made only between
the water samples from springs and wells within a given hydrogeologic setting in each aquifer.
For example, in the Upper Floridan aquifer, samples were collected from throughout the extent of the aquifer, but spring water samples were col-lected only in southwestern Georgia; thus, these spring water samples were compared only to well samples collected in the same hydrogeologic setting in southwestern Georgia. The nonparametric Wil-coxon rank-sum test (Helsel and Hirsch, 1992) was used to determine if concentrations of constituents were significantly different (level of significance 0.05) between water samples collected from wells and springs.
Major Dissolved Species
Calcium-bicarbonate is the dominant water type for all of the aquifers and aquifer systems; however, the chemical composition of water sam-ples from the springs and wells in the Basin and Range aquifer system was highly variable. In most aquifers, fewer than half of the 14 inorganic constit-uents examined showed significant differences in
Figure 1. Location of spring and well sites sampled from 1993-2003.
Figure 2. Number of spring and well samples col-lected from selected aquifers.

76
Table 1. Summary of p-values from Wilcoxon rank-sum test comparing concentrations between samples from springs and wells.
[P-values lower than the level of significance, 0.05, are shaded gray; <, less than]
Aquifer Cal-cium
Magne-sium
So-dium
Potas-sium Iron Manga-
neseBica-
bonateSul-fate
Chlo-ride Nitrate Silica pH
Dis-solved oxygen
Dis-solved solids
Edwards-Trinity 0.20 0.78 0.46 0.36 1.00 0.51 0.01 0.63 0.52 0.98 0.75 0.98 0.63 0.38
Upper Floridan 0.68 0.69 0.58 0.59 0.01 0.01 0.45 0.37 1.00 0.16 0.80 <0.01 0.12 0.52
Mississip-pian 0.70 0.61 0.05 0.72 0.14 0.44 0.74 0.38 0.08 0.36 0.18 0.11 <0.01 0.40
Valley and Ridge 0.36 0.18 0.17 0.06 <0.01 <0.01 0.16 0.01 0.29 0.09 0.10 0.08 <0.01 0.05
Basin and Range 0.08 0.85 0.25 0.44 <0.01 <0.01 0.25 0.24 0.92 0.98 1.00 0.09 0.66 0.25
Springfield Plateau 0.34 0.08 0.54 <0.01 0.33 0.10 <0.01 0.16 <0.01 <0.01 <0.01 <0.01 <0.01 0.05
Ozark <0.01 <0.01 0.04 0.51 0.45 0.09 0.05 0.12 0.23 0.95 0.94 0.05 <0.01 <0.01
concentrations between springs and well samples (table 1). The greatest number of inorganic constitu-ents with significant differences in concentration was seven in the Springfield Plateau aquifer. In three aquifers—Edwards-Trinity, Mississippian and Basin and Range—significant differences in con-centrations were noted for only one or two proper-ties, indicating that samples collected from springs and wells were collected from ground water from similar locations within the aquifer flow systems.
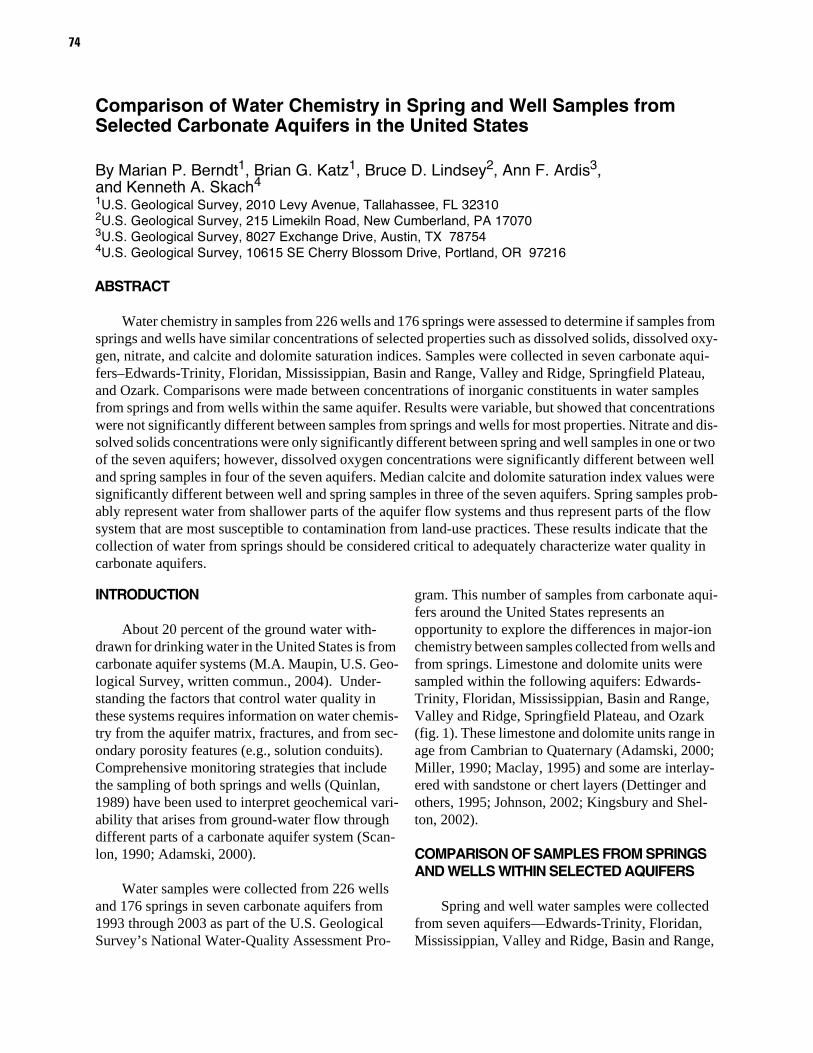
The range in dissolved solids concentrations among the seven aquifers provides some informa-tion about the relative residence times and flow path lengths in the aquifers. Aquifers with greatest median dissolved solids concentrations in spring and well samples, the Edwards-Trinity aquifer (322 and 294 milligrams per liter (mg/L), respectively) and the Basin and Range aquifer (410 and 364 mg/L, respectively), also had the greatest median well depths—1,270 feet (Edwards-Trinity) and 940 feet (Basin and Range). The median well depths for wells in the other aquifers ranged from 87 to 227 feet. Water from the deeper wells with greater
dissolved solids concentrations may indicate that longer flow paths and older ground water are being sampled in these aquifers. Dissolved solids concen-trations were only significantly different between spring and well samples in the Valley and Ridge and Ozark aquifers (fig. 3).
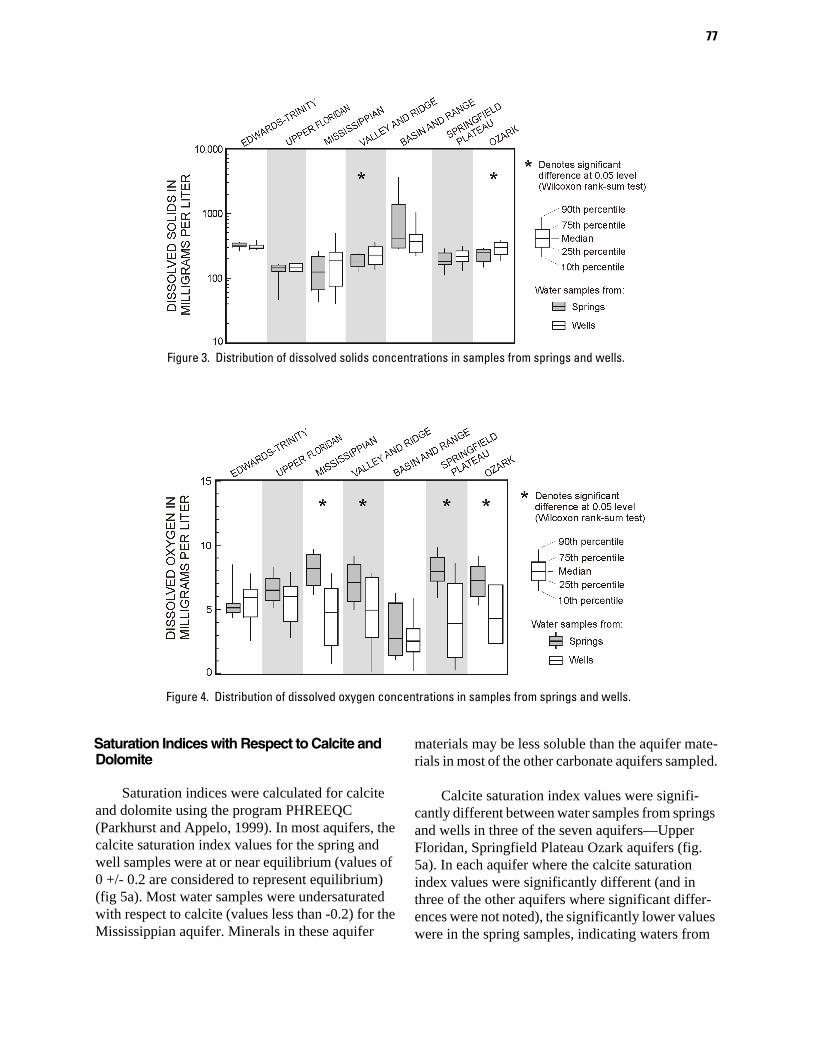
Median dissolved oxygen concentrations ranged from 2.5 mg/L in water samples from the Basin and Range aquifer wells to about 8 mg/L for springs in several of the aquifers (fig. 4). In four of the seven aquifers, dissolved oxygen concentrations were significantly different between samples from springs and wells (fig. 4). In each aquifer where sig-nificant differences in dissolved oxygen were noted, the spring samples have the greater dissolved oxy-gen concentrations, indicating generally younger waters and more dynamic flow systems. The median dissolved oxygen concentration in water samples from wells was greater than that for springs in the Edwards-Trinity aquifer. Deeper, more regional circulation of ground water may account for lower dissolved oxygen concentrations in some springs in the Edwards-Trinity aquifer.
77
Figure 3. Distribution of dissolved solids concentrations in samples from springs and wells.
Figure 4. Distribution of dissolved oxygen concentrations in samples from springs and wells.
Saturation Indices with Respect to Calcite and Dolomite
Saturation indices were calculated for calcite and dolomite using the program PHREEQC (Parkhurst and Appelo, 1999). In most aquifers, the calcite saturation index values for the spring and well samples were at or near equilibrium (values of 0 +/- 0.2 are considered to represent equilibrium) (fig 5a). Most water samples were undersaturated with respect to calcite (values less than -0.2) for the Mississippian aquifer. Minerals in these aquifer
materials may be less soluble than the aquifer mate-rials in most of the other carbonate aquifers sampled.
Calcite saturation index values were signifi-cantly different between water samples from springs and wells in three of the seven aquifers—Upper Floridan, Springfield Plateau Ozark aquifers (fig. 5a). In each aquifer where the calcite saturation index values were significantly different (and in three of the other aquifers where significant differ-ences were not noted), the significantly lower values were in the spring samples, indicating waters from

78
Figure 5. Distribution values for (a) calcite saturation index, (b) dolomite saturation index, and (c) calcium to magnesium molar ratio in samples from springs and wells.

79
springs were more undersaturated with respect to calcite than water from wells. The lower calcite sat-uration index values also indicate that spring waters may originate from shallower parts of the flow sys-tems than the water withdrawn from wells.
Spring and well water samples for most of the aquifers were undersaturated with respect to dolo-mite (fig 5b). Only spring and well samples from the Basin and Range aquifer and well samples from the Ozark aquifer were at or near equilibrium with respect to dolomite (values mostly between -0.2 to 0.2) (fig 5b). Dolomite saturation index values for the spring and well samples were significantly dif-ferent in three of the seven aquifers—Upper Flori-dan, Springfield Plateau, and Ozark (fig. 5b)—the same three aquifers where significant differences were noted for calcite saturation index values. In each of the three aquifers where dolomite saturation index values were significantly different (and in the four aquifers where significant differences were not noted), the significantly lower values were in the spring samples indicating that the spring samples were more undersaturated with respect to dolomite than the samples from wells.
The molar ratio of calcium to magnesium was calculated for each sample to determine if this ratio correlates with the relative amount of dolomite in the carbonate aquifers. Results show that in five of the aquifers, calcium-magnesium molar ratios were
less than about 5, and are consistent with the reported mineralogy for the Edwards-Trinity, Mis-sissippian, Valley and Ridge, Basin and Range, and Ozark aquifers (fig. 5c) (Maclay, 1995, Kingsbury and Shelton, 2002, Johnson, 2002, Dettinger and others, 1995, and Adamski, 2000). The three aqui-fers where the most dolomite is indicated (where the calcium-magnesium ratios were lowest), Edwards-Trinity, Basin and Range and Ozark aquifers, were also the aquifers where dolomite saturation index values were highest (greater than -1.0) (figs. 5b and 5c).
Nitrate
Median nitrate concentrations in the seven aqui-fers ranged from 0.32 to 2.5 mg/L (fig. 6). Median concentrations were lowest (less than 1.0 mg/L) in the spring and well water samples from the Basin and Range and the Ozark aquifers. Although median nitrate concentrations did not exceed the maximum contaminant level of 10 mg/L, several median nitrate concentrations ranged from 1 to 4 mg/L, which may indicate anthropogenic inputs. Nitrate concentrations were only significantly different between spring and wells samples in the Springfield Plateau aquifer. The significantly higher concentra-tions in nitrate in water samples from springs rela-tive to wells in the Springfield Plateau was noted by Adamski (2000) who attributed the higher nitrate concentrations to the greater susceptibility of
Figure 6. Distribution of nitrate concentrations in samples from springs and wells.

80
springs to surface sources of contamination. The land use in the area overlying the Springfield Plateau aquifer is predominantly agriculture (Adamski, 1996).
IMPLICATIONS FOR USE OF SPRINGS IN THE CHARACTERIZATION OF WATER QUALITY IN CARBONATE AQUIFERS
Differences in chemistry between spring waters and well water reflect ground-water movement in distinct parts of the flow system. Higher dissolved oxygen concentrations, lower saturation indices with respect to calcite and dolomite, and lower dis-solved solids concentrations relative to water from wells, indicate that springs discharge ground water mainly from shallow parts of most of the studied aquifer systems. Exceptions are the Basin and Range and the Edwards-Trinity aquifers, where deeper cir-culation of ground water may occur prior to dis-charge from springs. Chemical differences between water from springs or wells also are related to the hydrologic conditions at the time of sampling. Rain-fall patterns should be evaluated along with spring discharge at the time of sampling to characterize the contribution of recent recharge to the aquifer and its impact on ground-water chemistry.
There were no consistent patterns when com-paring nitrate concentrations in spring waters and well water. Nitrate concentrations were significantly higher in spring water than in ground water in the Springfield Plateau aquifer, but not in the adjacent Ozark aquifer. Nitrate concentrations were higher in spring waters than in well waters from the Valley and Ridge aquifer, but nitrate concentrations in spring waters were similar or lower than nitrate con-centrations in well waters from the Edwards-Trinity, Upper Floridan, Mississipian, and Ozark aquifers. These differences likely reflect the complex relation between nitrate concentrations in ground water and various nitrogen sources, and include past and present land-use and waste-management practices, and hydrologic and climatic variability.
Spring samples most likely represent water from shallower parts of the aquifer flow systems, and flow through large solution openings in carbon-ate aquifer systems. These parts of the flow system
are also the parts of the aquifer systems most suscep-tible to contamination from land-use practices. For these reasons, obtaining water samples from springs, in addition to wells, may be necessary for adequate characterization of water quality in carbonate aqui-fers and for addressing their susceptibility to con-tamination.
REFERENCES
Adamski, J.C., 1996, Nitrate and pesticides in ground water of the Ozark Plateaus region in Arkansas, Kan-sas, Missouri, and Oklahoma: U.S. Geological Survey Fact Sheet FS-182-96, 4 p.
Adamski, J.C., 2000, Geochemistry of the Springfield Plateau aquifer of the Ozark Plateau Province in Arkansas, Kansas, Missouri, and Oklahoma, USA: Hydrological Processes, vol. 14, p. 849-866.
Dettinger, M.D., Harrill, J.R., Schmidt, D.L., and Hess, J.W., 1995, Distribution of carbonate-rock aquifers and the potential for their development, southern Nevada and adjacent parts of Arizona, California, and Utah: U.S. Geological Survey Water-Resources Investiga-tions Report 91-4146, 100 p.
Helsel, D.R., and Hirsch, R.M., 1992, Statistical methods in water resources: New York, Elsevier, 522 p.
Johnson, G.C., 2002, Water quality of springs in the Valley and Ridge Physiographic Province in the Upper Tennessee River Basin, 1997: U.S. Geological Survey Water-Resources Investigations Report 02-4180, 24 p.
Kingsbury, J.A., and Shelton, J.M., 2002, Water quality of the Mississippian carbonate aquifer in parts of middle Tennessee and northern Alabama, 1999: U.S. Geological Survey Water-Resources Investigations Report 02-4083, 36 p.
Maclay, R.W., 1995, Geology and hydrology of the Edwards aquifer in the San Antonio Area, Texas: U.S. Geological Survey Water-Resources Investigations Report 95-4186, 64 p.
Miller, J.A., 1990, Ground water atlas of the United States, Segment 6, Alabama, Florida, Georgia, and South Carolina: U.S. Geological Survey Hydrologic Investigations Atlas 730-G, 28 p.
Parkhurst, D.L., and Appelo, C.A.J., 1999, User's Guide to PHREEQC (Version 2)--A Computer Program for Speciation, Batch-Reaction, One-Dimensional

81
Transport, and Inverse Geo-chemical Calculations. U.S. Geological Survey Water-Resources Investiga-tions Report 99-4259, accessed at http://www-brr.cr.usgs.gov/projects/GWC_coupled/phreeqc/html/final.html, on June 2, 2005.
Quinlan, J.F., 1989, Ground-water monitoring in karst terranes: Recommended protocols and implicit assumptions: U.S. Environmental Protection Agency Report EPA/600/X-89/050, 79 p.
Scanlon, B.R., 1990, Relationships between groundwater contamination and major-ion chemistry in a karst aqui-fer. Journal of Hydrology, 119, p. 271-291.