Embed Size (px)
Citation preview
Session 2525
Proceedings of the 2001 American Society of Engineering Education Annual Conference & Exposition Copyright 2001, American Society of Engineering Education
The Catapult Experience – A Learning Project on Taguchi Method for Design Optimization
Dr. Ming Z. Huang, P.E.
Department of Mechanical Engineering Florida Atlantic University
Abstract Quality Engineering, a topic of practical importance to industry, is typically not given adequate attention in most engineering curriculum except perhaps in industrial engineering. While the extent of exposure of students to this topic may vary by discipline, its need has been unequivocally established, per ABET Criteria 3 (b)(c), that all should have the ability to design and conduct experiments and to analyze and interpret data-skills which are central to practice of quality engineering. In this paper, we present the plan and implementation of a guided project that integrates the learning and application of the Taguchi Method into a hands-on product design and test optimization experience. Made popular by Japanese manufacturers, the Taguchi method has since received widespread acceptance as the de facto standard technique to optimize the process and quality of engineering in major industries such as automotive and aerospace. With the task of design and construction of a catapult as the context of activities, the project serves as an ideal vehicle through which students can learn and apply the theory of Taguchi method in practice. In addition, it also provides an effective framework in which students are exposed to all elements of a real-life product development process, from design, analysis, prototyping, testing, to optimization. I. Introduction The capstone design experience in the Mechanical Engineering program at Florida Atlantic University consists of a sequence of two three credit hour courses, EML 4521C Engineering Design and EML 4551 Design Project. For a period spanning two semesters, typically Fall and Spring, mechanical engineering seniors working in teams, take on major projects that integrate elements of design, analysis, prototyping, and testing. While students entering the capstone sequence would already have a fair amount of exposure to various specific aspects of design and the design process at large, they generally lack a clear understanding of the framework and standards with which design projects are carried out in practice. Therefore a major emphasis of the course activities is to expose students to standard industrial practices; e.g., from maintaining logbooks, conducting design reviews, to producing engineering books complete with production drawings, and thus to require that the subsequent execution and deliverables of the project be conforming to such standards. An important aspect of engineering practice in industry is that of quality engineering. It has been recognized that the quality, when measured as variations from the nominal (‘target’), is achieved
Page 6.983.1
Proceedings of the 2001 American Society of Engineering Education Annual Conference & Exposition Copyright 2001, American Society of Engineering Education
most effectively through design, namely by designing quality into products and processes to minimize the variations, not by usual practice of inspection1. Such is the philosophy of the Taguchi Method, an off-line quality control approach developed by Dr. Genichi Taguchi. Made popular by Japanese manufacturers, the Taguchi method has received widespread acceptance in recent years as the de facto standard technique to optimize the process and quality of engineering in major industries such as automotive and aerospace. In this paper, we present the plan and implementation of a guided project that integrates the learning and application of the Taguchi Method into a hands-on product design and test optimization experience. With the task of design and construction of a catapult as the context of activities, the project serves as an ideal vehicle through which students can learn and apply the theory of Taguchi method in practice. In addition, it also provides an effective framework in which students are exposed to all elements of a real-life product development process, from design, analysis, prototyping, testing, to performance optimization. II. Taguchi Method – A Basic Introduction of Working Mechanics In this section, we provide a basic introduction to the Taguchi Method. Drawing from contents in several texts 1,2, the materials described herewith illustrate in a condensed form the extent to which the subject was covered in about four classes over a period of two weeks in the Engineering Design. Note that a complete study of the topic usually calls for no less than a full course in itself. The goal was to cover enough so that students are able to appreciate and apply, in a just-in-time manner, basic concepts and techniques of quality engineering in the light of Taguchi’s approach to a hands-on mini project that followed the lectures. The students are provided with a list of references 1-4 for more detailed studies of the subject.
A. Taguchi Quality Enhancement Strategy Central to Taguchi’s approach to quality enhancement are the following concepts. Variation, manifest as a lack of consistency, is the main cause that gives rise to poor product quality and hence should be the yardstick for quality, not limits of tolerance. The traditional practice of relying on the use of upper and lower limits, namely the so-called ‘goal-post’ criterion, in gauging or inspection processes as the measure of quality is no longer adequate. Taguchi further advocated that cost of quality should be measured as function of deviation from the standard and the losses should be measured system-wide. There are two elements of variations: deviation from the target and variations with respect to others in the group. The methodology developed by Taguchi aimed at reducing both. This, in a nutshell, is accomplished by taking a system approach to optimizing the design of product or process, making the design insensitive to the influence of uncontrollable factor (robustness), and reducing variation around the target without necessarily eliminating the cause of variation (cost effective). A key issue in this methodology is being able to identify what factors and how they influence the process. Taguchi advocated the use of team brainstorming to identify the process
Page 6.983.2
Proceedings of the 2001 American Society of Engineering Education Annual Conference & Exposition Copyright 2001, American Society of Engineering Education
factors and by way of experiments to ascertain quantitatively the degree to which each factor affects the performance of product. Hence a major element of the Taguchi Method is his unique approach for the design of experiment, which is introduced next. B. Taguchi Design of Experiment Taguchi developed an effective design of experiment technique using the Orthogonal Arrays (OA) he constructed to lay out the experiments. Taguchi’s orthogonal arrays, in essence, are special cases of partial factorial design of experiments, which is based on the popularly known method of factorial designs by Fisher5. A full factorial design will identify all possible combinations for a given set of factors. For example, in an experiment involving 7 factors, each at two levels, the total number of full factorial combinations will be 128 (27). Taguchi identified a special case, which comprises a subset of the full combinations, which features the same number combinations of the levels, i.e., (1,1), (1,2), (2,1), (2,2) with 1 and 2 denoting low and high states of the level, between any two factors. He further eliminated redundancy in the full factorial arrays and arrived a standardized set of arrays, namely the OA’s, that not only can be efficiently applied to obtain meaningful results similar to those from using the full factorial, but also allows for uniform guideline of applications to be established. For the same 7-factor example mentioned above, the L8 OA can be applied based on the Taguchi design, which calls for 8 experiments instead of 128 needed with the full factorial design. In addition to a significant reduction in the experiments, the methodology also prescribes a structured framework in which factors are to be assigned. In other words, once the factors have all been identified and the appropriate OA selected, the way in which the factors can be assigned, though flexible, are very structured. And with the ‘balanced or orthogonal’ nature of the array, effects of each factor at different levels are guaranteed to come into play in the results of experiments. A further clarification of this will be provided in the example later. The results of the experiments are then analyzed, by studying the main effects of each of the factors and by applying the standard statistical analysis of variation (ANOVA). These analyses are directed to achieve one or more of the following objectives: (1) Establish the optimum condition for a product or process; (2) Estimate the contribution of individual factors; and (3) Establish the response under the optimum condition. It should be noted that although Taguchi built his method on well-developed concepts of optimization through the design of experiments, his philosophy regarding the value of quality and the procedure for carrying out experiments were new. In particular, the Taguchi Method has been merited to have two powerful features that set it apart from others. First, it is a disciplined way of developing a product or investigating complex problems. Second, it provides a means to cost effectively investigate the available alternatives. As a result it has become very popular in quality engineering practices. While there are many advantages, a major limitation of the method is that the timing of application is critical, i.e. the technique can only be effective when applied early in the design of product or process.
Page 6.983.3
Proceedings of the 2001 American Society of Engineering Education Annual Conference & Exposition Copyright 2001, American Society of Engineering Education
In summary, the Taguchi method is implemented generally in four steps as follows: 1. Brainstorm the quality characteristics and design parameters important to the product or
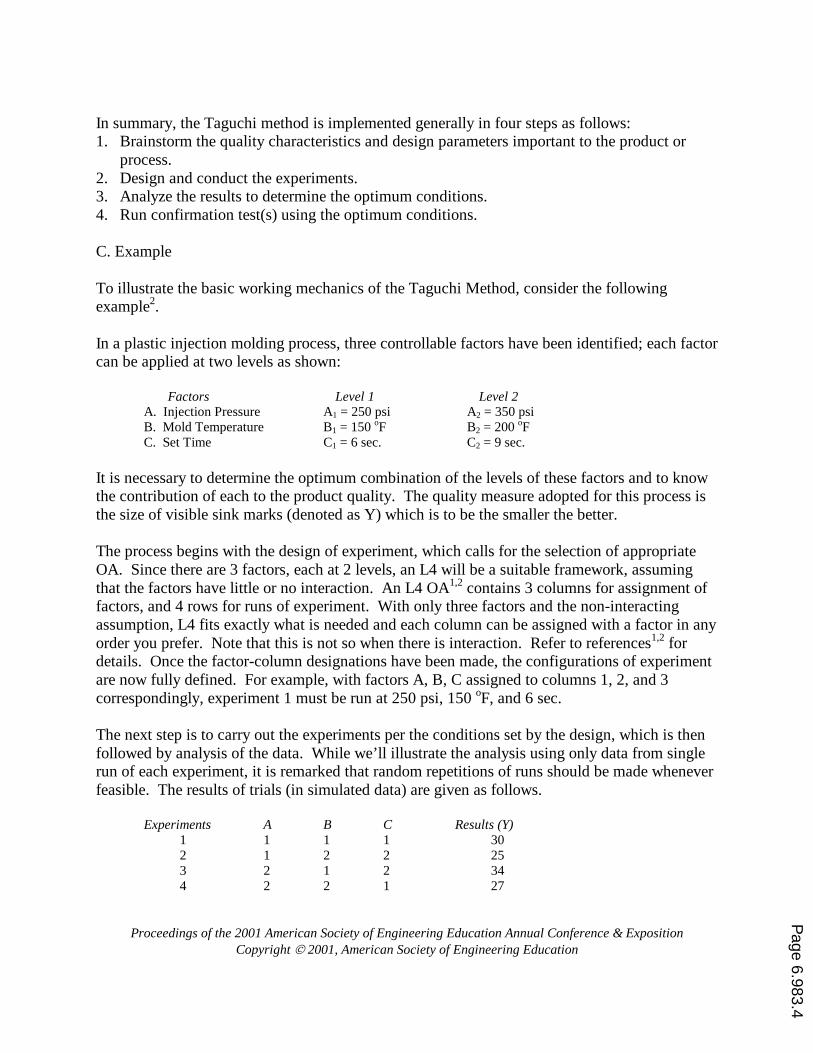
process. 2. Design and conduct the experiments. 3. Analyze the results to determine the optimum conditions. 4. Run confirmation test(s) using the optimum conditions. C. Example To illustrate the basic working mechanics of the Taguchi Method, consider the following example2. In a plastic injection molding process, three controllable factors have been identified; each factor can be applied at two levels as shown: Factors Level 1 Level 2 A. Injection Pressure A1 = 250 psi A2 = 350 psi B. Mold Temperature B1 = 150 oF B2 = 200 oF C. Set Time C1 = 6 sec. C2 = 9 sec. It is necessary to determine the optimum combination of the levels of these factors and to know the contribution of each to the product quality. The quality measure adopted for this process is the size of visible sink marks (denoted as Y) which is to be the smaller the better. The process begins with the design of experiment, which calls for the selection of appropriate OA. Since there are 3 factors, each at 2 levels, an L4 will be a suitable framework, assuming that the factors have little or no interaction. An L4 OA1,2 contains 3 columns for assignment of factors, and 4 rows for runs of experiment. With only three factors and the non-interacting assumption, L4 fits exactly what is needed and each column can be assigned with a factor in any order you prefer. Note that this is not so when there is interaction. Refer to references1,2 for details. Once the factor-column designations have been made, the configurations of experiment are now fully defined. For example, with factors A, B, C assigned to columns 1, 2, and 3 correspondingly, experiment 1 must be run at 250 psi, 150 oF, and 6 sec. The next step is to carry out the experiments per the conditions set by the design, which is then followed by analysis of the data. While we’ll illustrate the analysis using only data from single run of each experiment, it is remarked that random repetitions of runs should be made whenever feasible. The results of trials (in simulated data) are given as follows. Experiments A B C Results (Y) 1 1 1 1 30 2 1 2 2 25 3 2 1 2 34 4 2 2 1 27
Page 6.983.4
Proceedings of the 2001 American Society of Engineering Education Annual Conference & Exposition Copyright 2001, American Society of Engineering Education
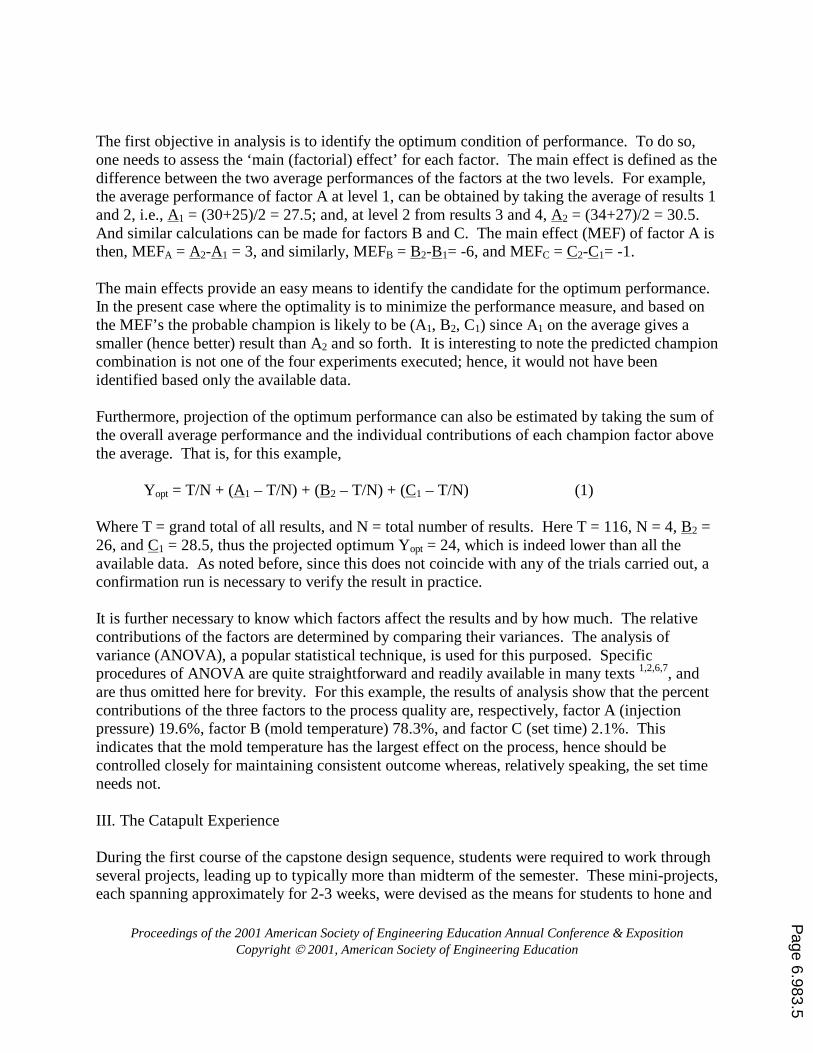
The first objective in analysis is to identify the optimum condition of performance. To do so, one needs to assess the ‘main (factorial) effect’ for each factor. The main effect is defined as the difference between the two average performances of the factors at the two levels. For example, the average performance of factor A at level 1, can be obtained by taking the average of results 1 and 2, i.e., A1 = (30+25)/2 = 27.5; and, at level 2 from results 3 and 4, A2 = (34+27)/2 = 30.5. And similar calculations can be made for factors B and C. The main effect (MEF) of factor A is then, MEFA = A2-A1 = 3, and similarly, MEFB = B2-B1= -6, and MEFC = C2-C1= -1. The main effects provide an easy means to identify the candidate for the optimum performance. In the present case where the optimality is to minimize the performance measure, and based on the MEF’s the probable champion is likely to be (A1, B2, C1) since A1 on the average gives a smaller (hence better) result than A2 and so forth. It is interesting to note the predicted champion combination is not one of the four experiments executed; hence, it would not have been identified based only the available data. Furthermore, projection of the optimum performance can also be estimated by taking the sum of the overall average performance and the individual contributions of each champion factor above the average. That is, for this example,
Yopt = T/N + (A1 – T/N) + (B2 – T/N) + (C1 – T/N) (1) Where T = grand total of all results, and N = total number of results. Here T = 116, N = 4, B2 = 26, and C1 = 28.5, thus the projected optimum Yopt = 24, which is indeed lower than all the available data. As noted before, since this does not coincide with any of the trials carried out, a confirmation run is necessary to verify the result in practice. It is further necessary to know which factors affect the results and by how much. The relative contributions of the factors are determined by comparing their variances. The analysis of variance (ANOVA), a popular statistical technique, is used for this purposed. Specific procedures of ANOVA are quite straightforward and readily available in many texts 1,2,6,7, and are thus omitted here for brevity. For this example, the results of analysis show that the percent contributions of the three factors to the process quality are, respectively, factor A (injection pressure) 19.6%, factor B (mold temperature) 78.3%, and factor C (set time) 2.1%. This indicates that the mold temperature has the largest effect on the process, hence should be controlled closely for maintaining consistent outcome whereas, relatively speaking, the set time needs not. III. The Catapult Experience During the first course of the capstone design sequence, students were required to work through several projects, leading up to typically more than midterm of the semester. These mini-projects, each spanning approximately for 2-3 weeks, were devised as the means for students to hone and
Page 6.983.5
Proceedings of the 2001 American Society of Engineering Education Annual Conference & Exposition Copyright 2001, American Society of Engineering Education
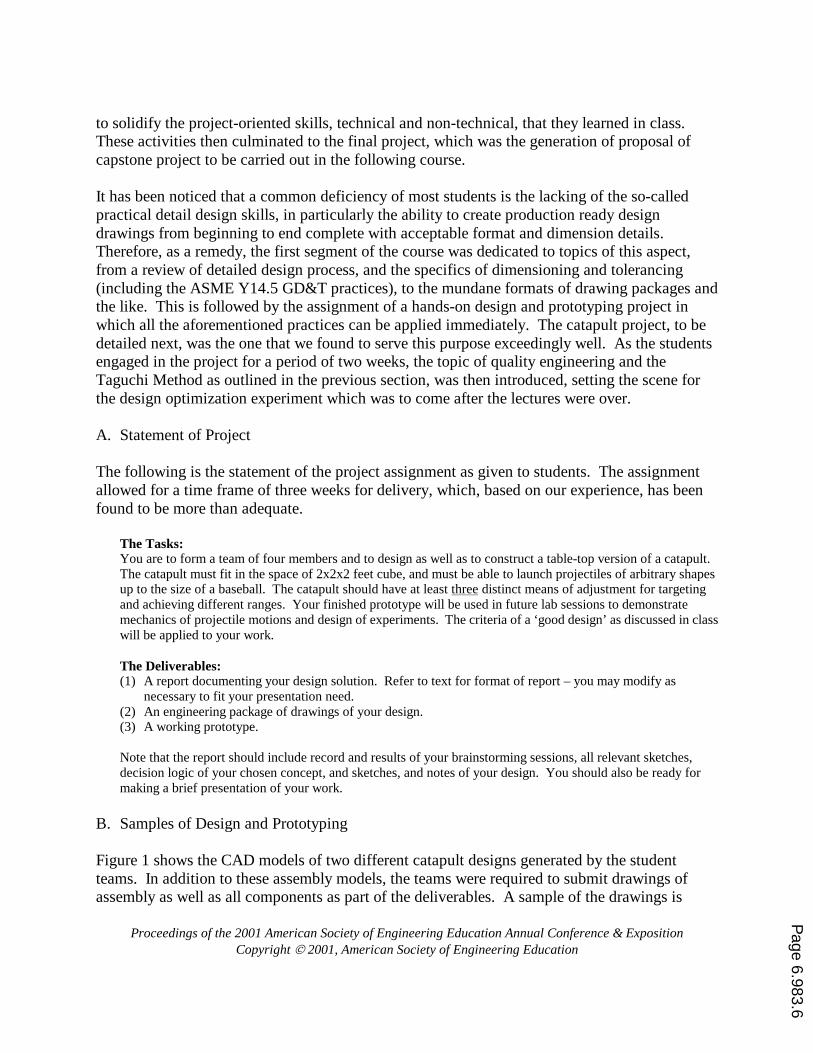
to solidify the project-oriented skills, technical and non-technical, that they learned in class. These activities then culminated to the final project, which was the generation of proposal of capstone project to be carried out in the following course. It has been noticed that a common deficiency of most students is the lacking of the so-called practical detail design skills, in particularly the ability to create production ready design drawings from beginning to end complete with acceptable format and dimension details. Therefore, as a remedy, the first segment of the course was dedicated to topics of this aspect, from a review of detailed design process, and the specifics of dimensioning and tolerancing (including the ASME Y14.5 GD&T practices), to the mundane formats of drawing packages and the like. This is followed by the assignment of a hands-on design and prototyping project in which all the aforementioned practices can be applied immediately. The catapult project, to be detailed next, was the one that we found to serve this purpose exceedingly well. As the students engaged in the project for a period of two weeks, the topic of quality engineering and the Taguchi Method as outlined in the previous section, was then introduced, setting the scene for the design optimization experiment which was to come after the lectures were over. A. Statement of Project The following is the statement of the project assignment as given to students. The assignment allowed for a time frame of three weeks for delivery, which, based on our experience, has been found to be more than adequate.
The Tasks: You are to form a team of four members and to design as well as to construct a table-top version of a catapult. The catapult must fit in the space of 2x2x2 feet cube, and must be able to launch projectiles of arbitrary shapes up to the size of a baseball. The catapult should have at least three distinct means of adjustment for targeting and achieving different ranges. Your finished prototype will be used in future lab sessions to demonstrate mechanics of projectile motions and design of experiments. The criteria of a ‘good design’ as discussed in class will be applied to your work. The Deliverables: (1) A report documenting your design solution. Refer to text for format of report – you may modify as
necessary to fit your presentation need. (2) An engineering package of drawings of your design. (3) A working prototype. Note that the report should include record and results of your brainstorming sessions, all relevant sketches, decision logic of your chosen concept, and sketches, and notes of your design. You should also be ready for making a brief presentation of your work.
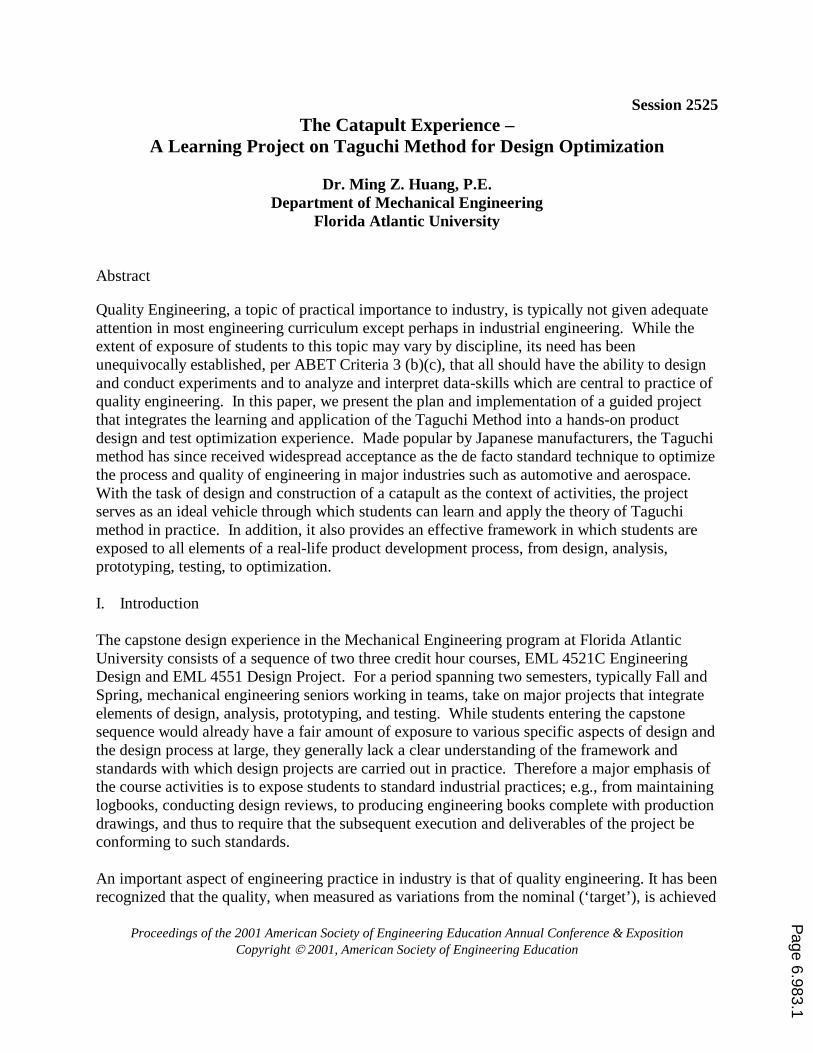
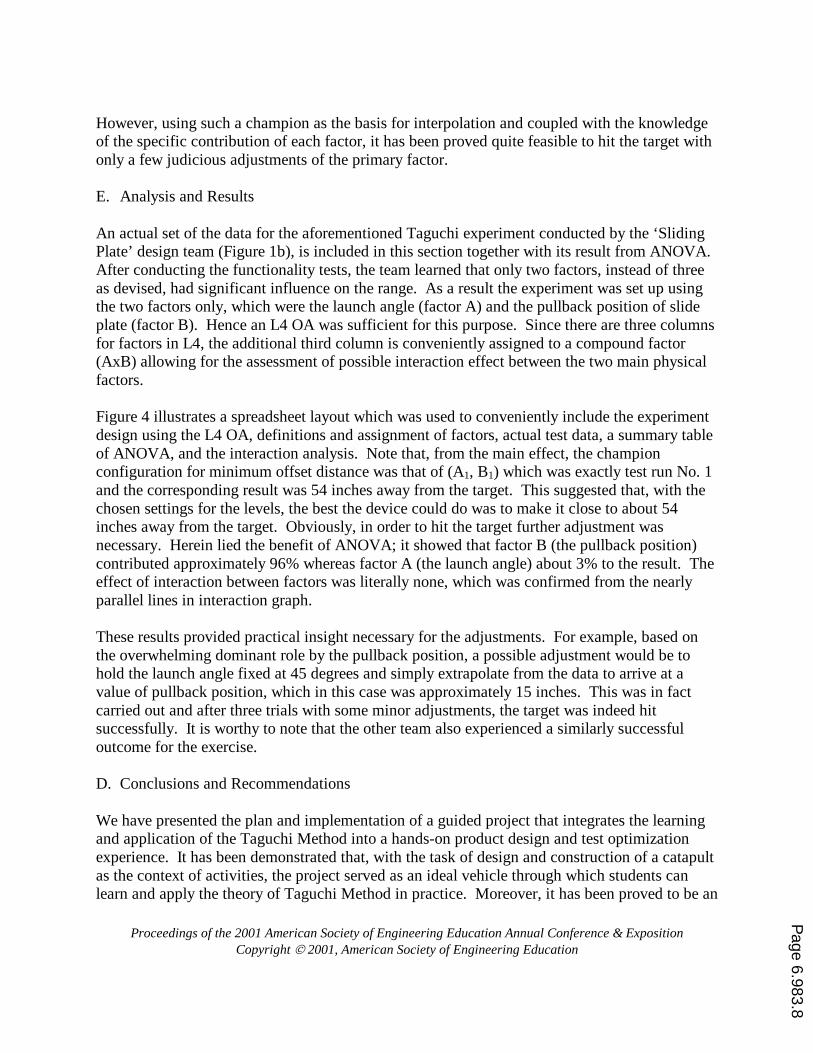
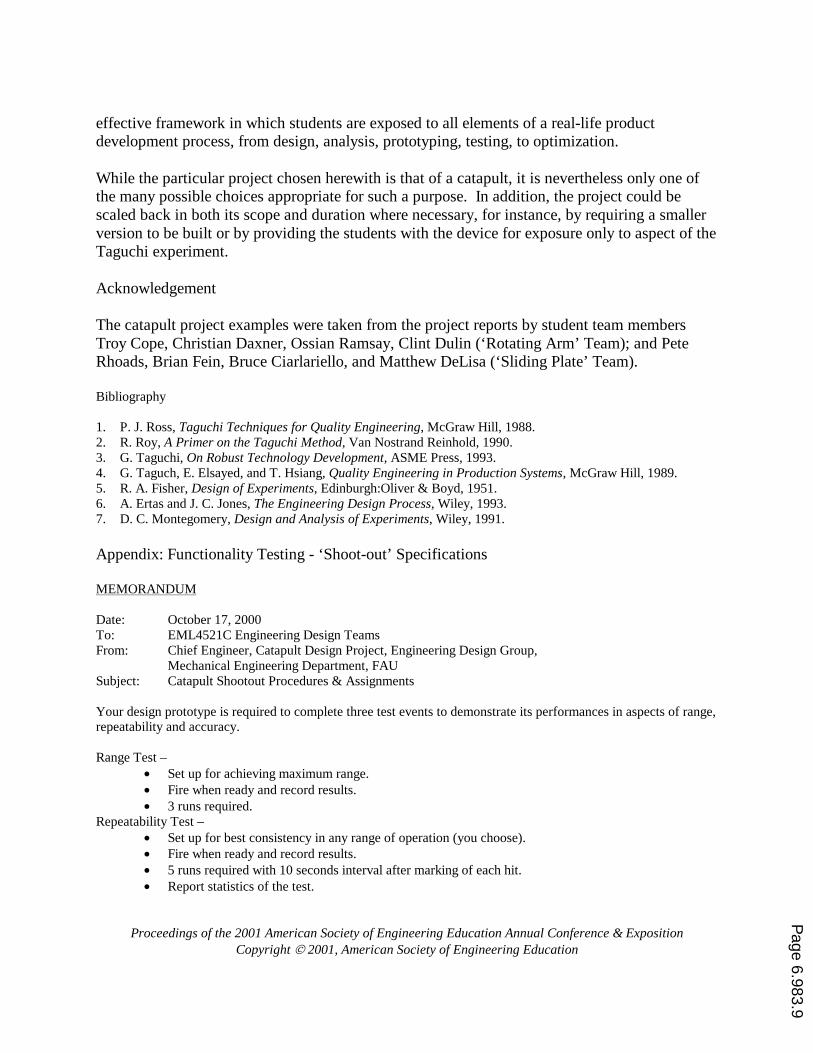
B. Samples of Design and Prototyping Figure 1 shows the CAD models of two different catapult designs generated by the student teams. In addition to these assembly models, the teams were required to submit drawings of assembly as well as all components as part of the deliverables. A sample of the drawings is
Page 6.983.6
Proceedings of the 2001 American Society of Engineering Education Annual Conference & Exposition Copyright 2001, American Society of Engineering Education
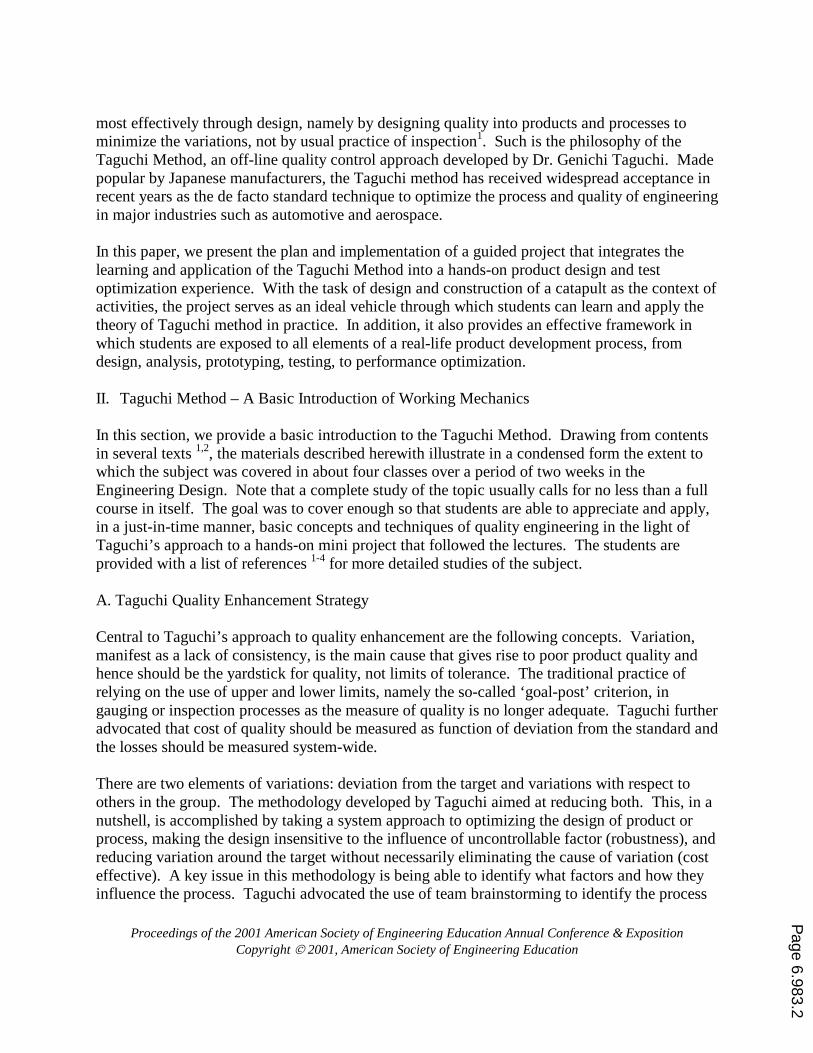
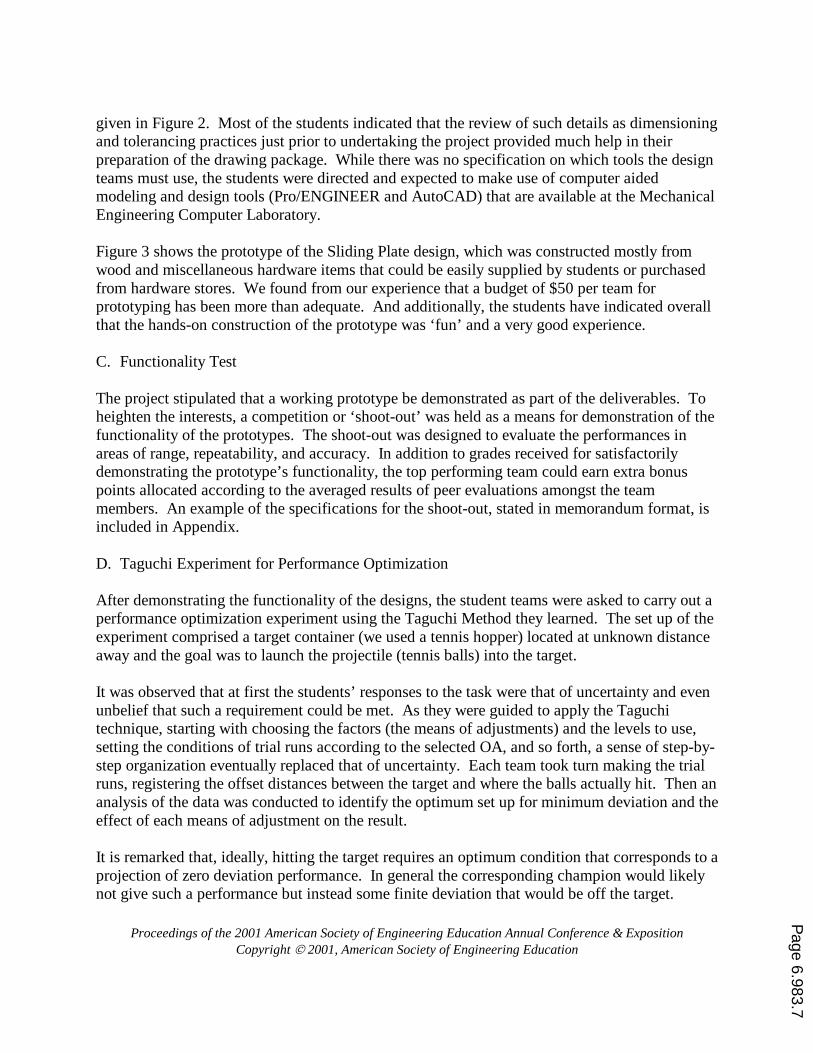
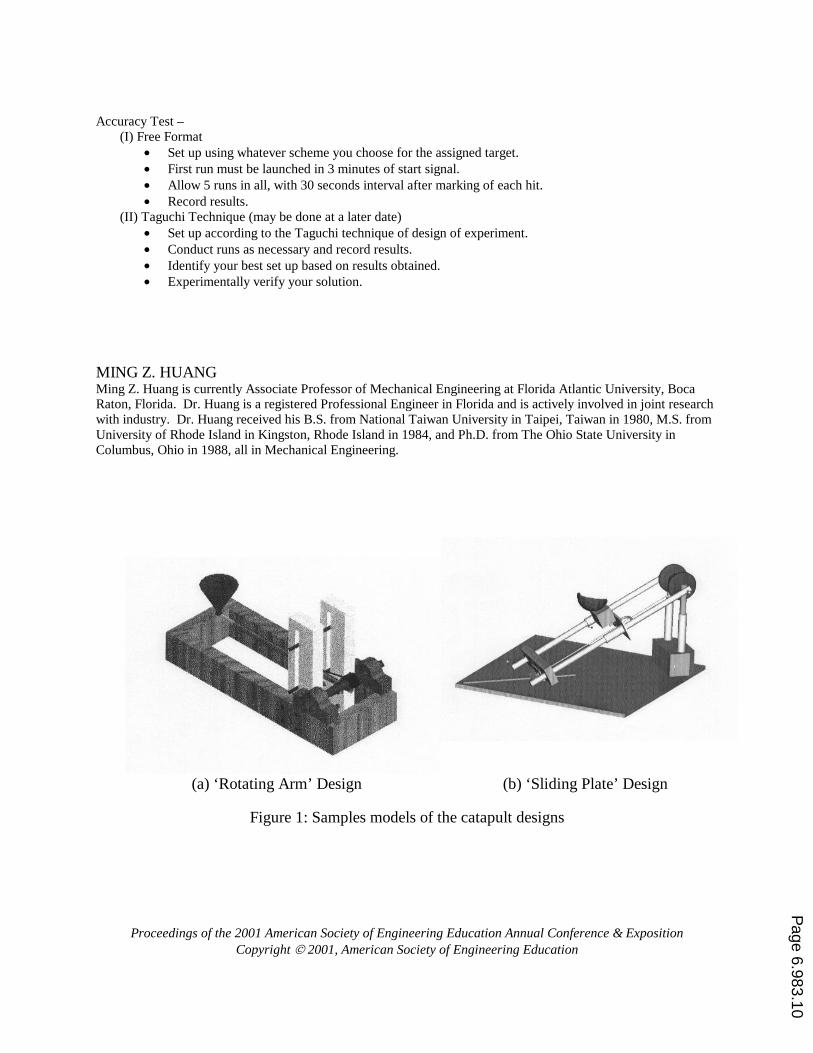
given in Figure 2. Most of the students indicated that the review of such details as dimensioning and tolerancing practices just prior to undertaking the project provided much help in their preparation of the drawing package. While there was no specification on which tools the design teams must use, the students were directed and expected to make use of computer aided modeling and design tools (Pro/ENGINEER and AutoCAD) that are available at the Mechanical Engineering Computer Laboratory. Figure 3 shows the prototype of the Sliding Plate design, which was constructed mostly from wood and miscellaneous hardware items that could be easily supplied by students or purchased from hardware stores. We found from our experience that a budget of $50 per team for prototyping has been more than adequate. And additionally, the students have indicated overall that the hands-on construction of the prototype was ‘fun’ and a very good experience. C. Functionality Test The project stipulated that a working prototype be demonstrated as part of the deliverables. To heighten the interests, a competition or ‘shoot-out’ was held as a means for demonstration of the functionality of the prototypes. The shoot-out was designed to evaluate the performances in areas of range, repeatability, and accuracy. In addition to grades received for satisfactorily demonstrating the prototype’s functionality, the top performing team could earn extra bonus points allocated according to the averaged results of peer evaluations amongst the team members. An example of the specifications for the shoot-out, stated in memorandum format, is included in Appendix. D. Taguchi Experiment for Performance Optimization After demonstrating the functionality of the designs, the student teams were asked to carry out a performance optimization experiment using the Taguchi Method they learned. The set up of the experiment comprised a target container (we used a tennis hopper) located at unknown distance away and the goal was to launch the projectile (tennis balls) into the target. It was observed that at first the students’ responses to the task were that of uncertainty and even unbelief that such a requirement could be met. As they were guided to apply the Taguchi technique, starting with choosing the factors (the means of adjustments) and the levels to use, setting the conditions of trial runs according to the selected OA, and so forth, a sense of step-by-step organization eventually replaced that of uncertainty. Each team took turn making the trial runs, registering the offset distances between the target and where the balls actually hit. Then an analysis of the data was conducted to identify the optimum set up for minimum deviation and the effect of each means of adjustment on the result. It is remarked that, ideally, hitting the target requires an optimum condition that corresponds to a projection of zero deviation performance. In general the corresponding champion would likely not give such a performance but instead some finite deviation that would be off the target.
Page 6.983.7
Proceedings of the 2001 American Society of Engineering Education Annual Conference & Exposition Copyright 2001, American Society of Engineering Education
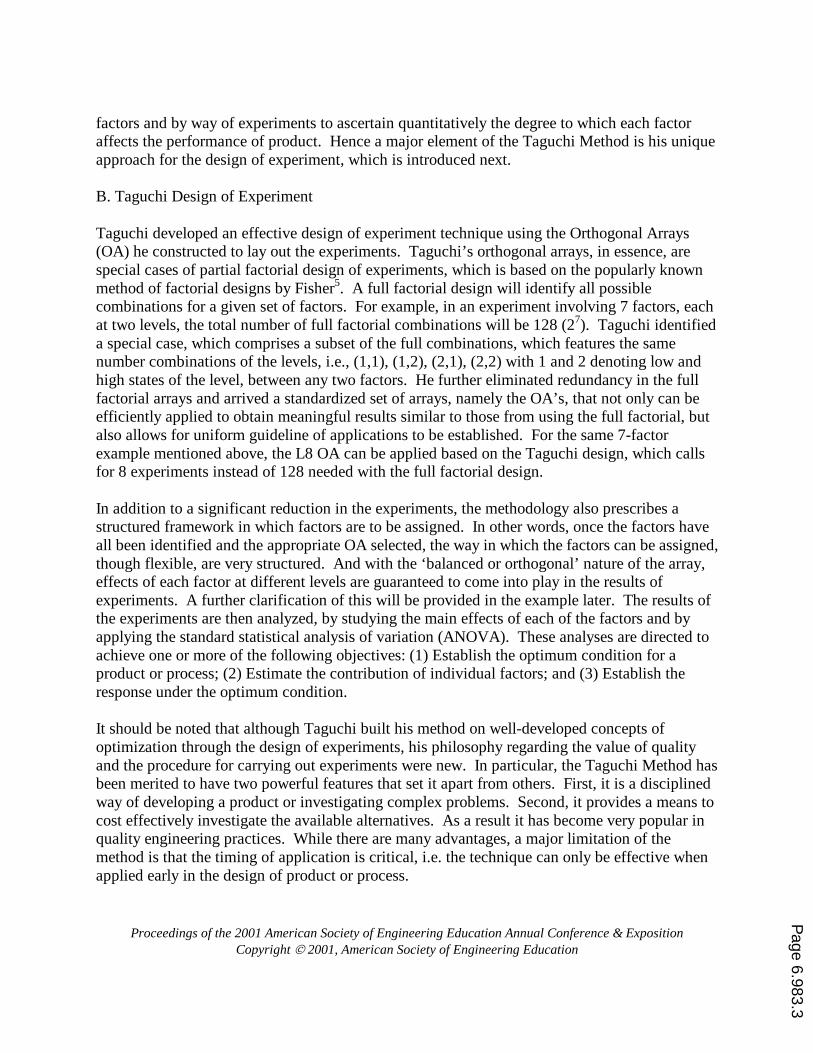
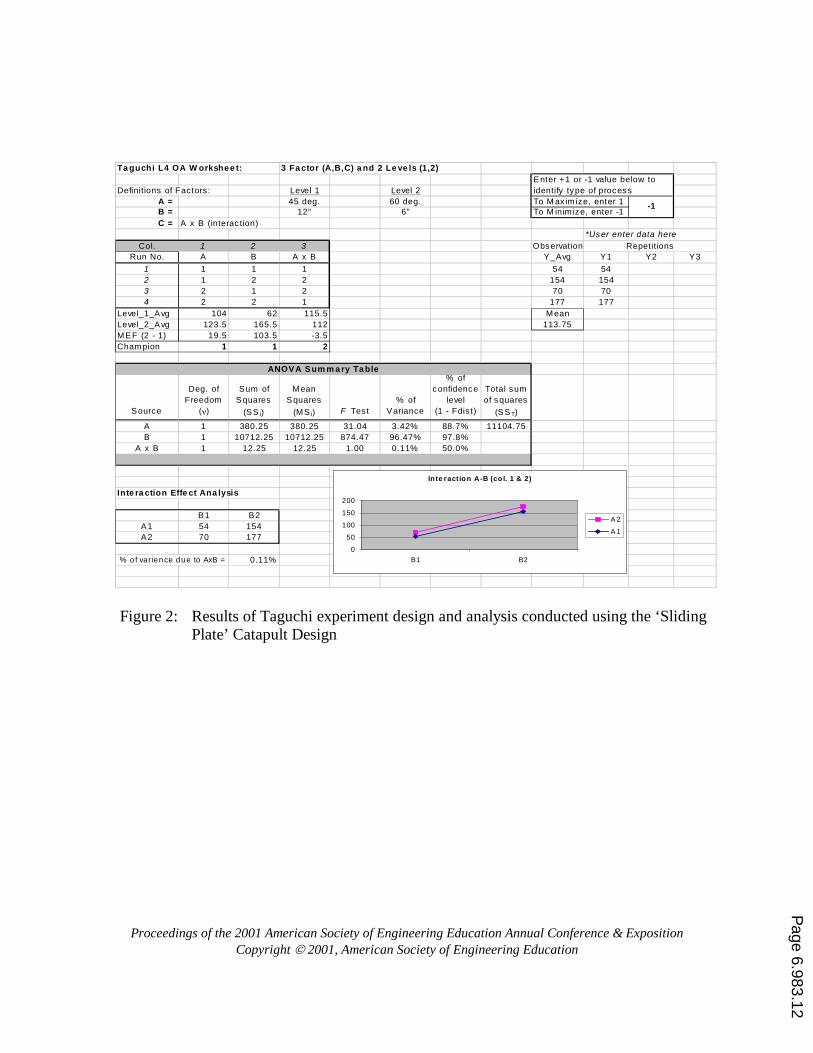
However, using such a champion as the basis for interpolation and coupled with the knowledge of the specific contribution of each factor, it has been proved quite feasible to hit the target with only a few judicious adjustments of the primary factor. E. Analysis and Results An actual set of the data for the aforementioned Taguchi experiment conducted by the ‘Sliding Plate’ design team (Figure 1b), is included in this section together with its result from ANOVA. After conducting the functionality tests, the team learned that only two factors, instead of three as devised, had significant influence on the range. As a result the experiment was set up using the two factors only, which were the launch angle (factor A) and the pullback position of slide plate (factor B). Hence an L4 OA was sufficient for this purpose. Since there are three columns for factors in L4, the additional third column is conveniently assigned to a compound factor (AxB) allowing for the assessment of possible interaction effect between the two main physical factors. Figure 4 illustrates a spreadsheet layout which was used to conveniently include the experiment design using the L4 OA, definitions and assignment of factors, actual test data, a summary table of ANOVA, and the interaction analysis. Note that, from the main effect, the champion configuration for minimum offset distance was that of (A1, B1) which was exactly test run No. 1 and the corresponding result was 54 inches away from the target. This suggested that, with the chosen settings for the levels, the best the device could do was to make it close to about 54 inches away from the target. Obviously, in order to hit the target further adjustment was necessary. Herein lied the benefit of ANOVA; it showed that factor B (the pullback position) contributed approximately 96% whereas factor A (the launch angle) about 3% to the result. The effect of interaction between factors was literally none, which was confirmed from the nearly parallel lines in interaction graph. These results provided practical insight necessary for the adjustments. For example, based on the overwhelming dominant role by the pullback position, a possible adjustment would be to hold the launch angle fixed at 45 degrees and simply extrapolate from the data to arrive at a value of pullback position, which in this case was approximately 15 inches. This was in fact carried out and after three trials with some minor adjustments, the target was indeed hit successfully. It is worthy to note that the other team also experienced a similarly successful outcome for the exercise. D. Conclusions and Recommendations We have presented the plan and implementation of a guided project that integrates the learning and application of the Taguchi Method into a hands-on product design and test optimization experience. It has been demonstrated that, with the task of design and construction of a catapult as the context of activities, the project served as an ideal vehicle through which students can learn and apply the theory of Taguchi Method in practice. Moreover, it has been proved to be an
Page 6.983.8
Proceedings of the 2001 American Society of Engineering Education Annual Conference & Exposition Copyright 2001, American Society of Engineering Education
effective framework in which students are exposed to all elements of a real-life product development process, from design, analysis, prototyping, testing, to optimization. While the particular project chosen herewith is that of a catapult, it is nevertheless only one of the many possible choices appropriate for such a purpose. In addition, the project could be scaled back in both its scope and duration where necessary, for instance, by requiring a smaller version to be built or by providing the students with the device for exposure only to aspect of the Taguchi experiment. Acknowledgement The catapult project examples were taken from the project reports by student team members Troy Cope, Christian Daxner, Ossian Ramsay, Clint Dulin (‘Rotating Arm’ Team); and Pete Rhoads, Brian Fein, Bruce Ciarlariello, and Matthew DeLisa (‘Sliding Plate’ Team). Bibliography 1. P. J. Ross, Taguchi Techniques for Quality Engineering, McGraw Hill, 1988. 2. R. Roy, A Primer on the Taguchi Method, Van Nostrand Reinhold, 1990. 3. G. Taguchi, On Robust Technology Development, ASME Press, 1993. 4. G. Taguch, E. Elsayed, and T. Hsiang, Quality Engineering in Production Systems, McGraw Hill, 1989. 5. R. A. Fisher, Design of Experiments, Edinburgh:Oliver & Boyd, 1951. 6. A. Ertas and J. C. Jones, The Engineering Design Process, Wiley, 1993. 7. D. C. Montegomery, Design and Analysis of Experiments, Wiley, 1991. Appendix: Functionality Testing - ‘Shoot-out’ Specifications MEMORANDUM Date: October 17, 2000 To: EML4521C Engineering Design Teams From: Chief Engineer, Catapult Design Project, Engineering Design Group, Mechanical Engineering Department, FAU Subject: Catapult Shootout Procedures & Assignments Your design prototype is required to complete three test events to demonstrate its performances in aspects of range, repeatability and accuracy. Range Test –
• Set up for achieving maximum range. • Fire when ready and record results. • 3 runs required.
Repeatability Test – • Set up for best consistency in any range of operation (you choose). • Fire when ready and record results. • 5 runs required with 10 seconds interval after marking of each hit. • Report statistics of the test.
Page 6.983.9
Proceedings of the 2001 American Society of Engineering Education Annual Conference & Exposition Copyright 2001, American Society of Engineering Education
Accuracy Test – (I) Free Format
• Set up using whatever scheme you choose for the assigned target. • First run must be launched in 3 minutes of start signal. • Allow 5 runs in all, with 30 seconds interval after marking of each hit. • Record results.
(II) Taguchi Technique (may be done at a later date) • Set up according to the Taguchi technique of design of experiment. • Conduct runs as necessary and record results. • Identify your best set up based on results obtained. • Experimentally verify your solution.
MING Z. HUANG Ming Z. Huang is currently Associate Professor of Mechanical Engineering at Florida Atlantic University, Boca Raton, Florida. Dr. Huang is a registered Professional Engineer in Florida and is actively involved in joint research with industry. Dr. Huang received his B.S. from National Taiwan University in Taipei, Taiwan in 1980, M.S. from University of Rhode Island in Kingston, Rhode Island in 1984, and Ph.D. from The Ohio State University in Columbus, Ohio in 1988, all in Mechanical Engineering.
(a) ‘Rotating Arm’ Design (b) ‘Sliding Plate’ Design
Figure 1: Samples models of the catapult designs
Page 6.983.10
Proceedings of the 2001 American Society of Engineering Education Annual Conference & Exposition Copyright 2001, American Society of Engineering Education
Figure 2: Sample assembly drawing of the ‘Slide Plate’ catapult design
Figure 3: Prototype of the Sliding Plate catapult
Page 6.983.11
Proceedings of the 2001 American Society of Engineering Education Annual Conference & Exposition Copyright 2001, American Society of Engineering Education
Figure 2: Results of Taguchi experiment design and analysis conducted using the ‘Sliding
Plate’ Catapult Design
Ta guchi L4 OA W orkshee t: 3 Fa ctor (A,B,C) a nd 2 Le ve ls (1,2)
Definitions of Factors: Level 1 Level 2A = 45 deg. 60 deg. To M ax im ize, enter 1B = 12" 6" To M inim ize, enter -1C = A x B (interac tion)
*User enter data hereCol. 1 2 3 Observat ion
Run No. A B A x B Y_Avg Y1 Y2 Y3
1 1 1 1 54 542 1 2 2 154 1543 2 1 2 70 704 2 2 1 177 177
Level_1_Avg 104 62 115.5 MeanLevel_2_Avg 123.5 165.5 112 113.75MEF (2 - 1) 19.5 103.5 -3.5Champion 1 1 2
Source
Deg. of Freedom
(ν)
Sum of Squares
(SS i)
Mean Squares
(MS i) F Test% of
Variance
% of confidence
level (1 - Fdist)
Total sum of squares
(SS T)
A 1 380.25 380.25 31.04 3.42% 88.7% 11104.75B 1 10712.25 10712.25 874.47 96.47% 97.8%
A x B 1 12.25 12.25 1.00 0.11% 50.0%
Inte ra ction Effe ct Ana lysis
B1 B2A1 54 154A2 70 177
% o f varience due to AxB = 0.11%
Enter +1 or -1 value below to identify type of process
-1
ANOVA Sum m a ry Ta ble
Repetitions
In te raction A-B (co l. 1 & 2)
0
50
100
150
200
B1 B2
A 2
A 1
Page 6.983.12