Embed Size (px)
Citation preview
Presentation of Results:
Sixth Annual
The Center for Community Studies at Jefferson Community College
Mr. Joel LaLone, Research Director Mr. Larry Danforth, Research Coordinator
October 2020
6

Page 1
Table of Contents Section 1 – Introduction and Methodology ..................................................... 4
Section 1.1 – Methodology – How This Data Was Collected ................................................. 4
Table 1 – Response Rates for the 6th Annual St. Lawrence County Survey of the Community ..................................6
Section 1.2 – Demographics of the sample – Who was Interviewed? .................................... 7
Table 2 – Geographic Distribution of Participants of the 6th Annual St. Lawrence County Survey of the Community7 Table 3 – Demographics of the October 2020 St. Lawrence County Sample .............................................................8
Section 2 - Summary of Findings .................................................................. 10
Section 2.1 – The Most Notable Study Finding in 2020 – The Presidential Election – Who says polling is broken? ......................................................................................................... 10
Figure 1 – 2020 Presidential Election Polling Prediction versus Actual Election Outcome ........................................ 11 Table 4 – St. Lawrence County 2020 Presidential Election Poll Cross-Tabulations ................................................. 11
Section 2.2 – Quality of Life in St. Lawrence County ............................................................ 12
Figure 2 – 2020 Results of Tracked Community Indicators ....................................................................................... 12
Section 2.3 – Personal Opinions – Issues in Our Society and Communities ........................ 13
Figure 3 – Comparing Dominance of Personal Opinions Regarding Societal Issues ................................................ 13
Section 2.4 – COVID-19 – Residents’ Opinions and Behaviors ........................................... 14
Figure 4 – COVID-19 – Residents’ Opinions and Behaviors...................................................................................... 14
Section 2.5 – Personal Financial Situation ........................................................................... 15
Figure 5 – Residents’ Personal Financial Situation .................................................................................................... 15
Section 2.6 – What Direction are Things Heading? St. Lawrence County & the Country ..... 16
Figure 6 – Direction of St. Lawrence County and the Country ................................................................................... 16
Section 2.7 – St. Lawrence County Trail System ................................................................. 17
Figure 7 – St. Lawrence County Trail System ............................................................................................................ 17
Section 2.8 – Legalization of Recreational Use in New York State – Opinions About Growth and Sale in St. Lawrence County ......................................................................................... 18
Figure 8 – Opinions About the Growth and Sale of Marijuana in St. Lawrence County – If Legalized ....................... 18
Section 2.9 – Internet Access and Use in St. Lawrence County–Employment and Learning19
Figure 9 Internet Access and Use in St. Lawrence County – Employment and Learning ....................................... 19
Section 3 - Detailed Statistical Results ......................................................... 20
Table 5 – Sample Sizes for each of the Twenty-One Years of the St. Lawrence County Annual Survey ................. 20 Table 6 – Sample Size and Margin of Error for Common Demographic Subgroups to be Compared in 2020 ......... 21 “Framing” a Statistic – Providing Perspective to Better Understand, Interpret, and Use this Survey Data ....................... 21
Section 3.0 – Technical Comments to Assist Interpretation of the Data ............................... 22
Margin of Error – Constructing Confidence Intervals to Estimate for an Entire Population .......................................... 22 Table 7 – More Detailed Margins of Error for Varying Sample Sizes and Varying Sample Proportions ................... 24
Significance Testing – Testing for Statistically Significant Relationships (Differences) ............................................... 25 Trend Analysis – How does one decide if St. Lawrence County has “statistically significantly” changed over time? .. 26 Regional Comparisons – How does one decide if St. Lawrence County is “statistically significantly” different from Jefferson and/or Lewis Counties? ............................................................................................................................... 27 Associated Explanatory Variables – How does one decide if there is a “statistically significant” relationship? ............ 27 Comparing Similarly-scaled Variables (Survey Items) in 2020 .................................................................................... 28
Section 3.1 – Quality of Life Issues in St. Lawrence County – Detailed Investigation of 2020 Results ................................................................................................................................. 30
Table 8 – SUMMARY – Quality of Life Issues in St. Lawrence County – Year 2020 ................................................ 30 Table 9 – Trends in Quality-of-Life Issues in St. Lawrence County (2000-2020) - % Indicating Excellent or Good .. 31 Table 10 – Trends in Quality-of-Life Issues in St. Lawrence County (2000-2020) - % Indicating Poor ....................... 31 Table 11 – Quality of the Environment ....................................................................................................................... 32 Table 12 – Healthcare Quality .................................................................................................................................... 33 Table 13 – Policing and Crime Control ....................................................................................................................... 34 Table 14 – Availability of Good Jobs .......................................................................................................................... 35 Table 15 – Quality of K-12 Education ......................................................................................................................... 36

Page 2
Table 16 – Overall State of the Local Economy .......................................................................................................... 37 Table 17 – Overall Quality of Life in the Area ............................................................................................................. 38
Section 3.2 – Personal Opinions – Issues in Our Society and Communities ........................ 39
Table 18 – SUMMARY – Comparing Dominance of Opinions Regarding Various Societal Issues ............................ 40 Table 19 – Climate Change ........................................................................................................................................ 41 Table 20 – Responsibility for Healthcare .................................................................................................................... 42 Table 21 – Presidential Approval ................................................................................................................................ 43 Table 22 – Building a Physical Wall on US-Mexico Border ........................................................................................ 44 Table 23 – Same-Sex Relationships .......................................................................................................................... 45 Table 24 – Abortion .................................................................................................................................................... 46 Table 25 – Systemic Racism and Social Injustice ...................................................................................................... 47 Table 26 – Gun Control and Rights ............................................................................................................................ 48 Table 27 – Of the following five issues, which do you believe is the most important issue facing the nation right now?
.................................................................................................................................................................. 49
Section 3.3 – COVID-19 – Residents’ Opinions and Behaviors ........................................... 50 Table 28 – In the past two weeks, how often have you worn a homemade or store bought respiratory mask when
going out in public? ................................................................................................................................... 50 Table 29 – How serious are your concerns about a lack of trust in the information about COVID-19 that you see in the
media? ...................................................................................................................................................... 52 Table 30 – How satisfied are you with the actions that the United States public health leadership like the CDC have
taken in response to COVID-19? .............................................................................................................. 53 Table 31 – How satisfied are you with the actions that President Trump and the US government have taken in
response to COVID-19? ........................................................................................................................... 54 Table 32 – How satisfied are you with the actions that Governor Cuomo and the New York State government have
taken in response to COVID-19? .............................................................................................................. 55 Table 33 – How satisfied are you with the actions that the local County Public Health Department has taken in
response to COVID-19? ........................................................................................................................... 56 Table 34 – Which of the following best describes your feelings about the coronavirus in our country? ...................... 57 Table 35 – "The food supply chain challenges caused by the coronavirus pandemic have increased the value I put on
local food producers." ............................................................................................................................... 58 Table 36 – In March 2020, the New York State Legislature voted and approved to grant emergency powers for
Governor Andrew Cuomo to make decisions in response to COVID-19. Which of the following two statements is closest to your opinion about whether or not it is time to rescind these powers? ............... 59
Section 3.4 – Personal Financial and Employment Situations ............................................. 60 Table 37 – When considering you or your family's personal financial situation has it gotten better, stayed about the
same, or gotten worse in the past 12 months? ......................................................................................... 60 Table 38 – What is your current occupation? ............................................................................................................. 61
Section 3.5 – What Direction are Things Heading? – St. Lawrence County & the Entire Country ................................................................................................................................. 63
Table 39 – Generally speaking, would you say things in St. Lawrence County are heading in the right or wrong direction? .................................................................................................................................................. 63
Table 40 – Generally speaking, would you say things in this country are heading in the right or wrong direction? .... 64
Section 3.6 – The St. Lawrence County Trail System .......................................................... 65
Table 41 – "Motorized trails in St. Lawrence County are safe.” .................................................................................. 65 Table 42 – "There is adequate law enforcement presence on the County’s motorized trail system." ......................... 66 Table 43 – "More people would utilize the motorized trail system if it were safer." ..................................................... 67 Table 44 – “Hiking and walking trails are easy to find and well-marked." ................................................................... 68
Section 3.7 – Potential Legalization of Recreational Marijuana Use in New York State – Opinions about Growth and Sale in St. Lawrence County .................................................... 69
Table 45 – If recreational marijuana were legalized by New York State, would you support or oppose the sale of marijuana in St. Lawrence County? .......................................................................................................... 69
Table 46 – If recreational marijuana were legalized by New York State, would you support or oppose allowing farmers
to grow and profit from this new industry in St. Lawrence County? .......................................................... 70
Section 3.8 – Internet Access and Use in St. Lawrence County–Employment and Learning71
Table 47 – What kind of Internet connection do you use at home? ............................................................................ 71 Table 48 – Is anyone living in your household currently working remotely using the Internet?................................... 72 Table 49 – Is anyone living in your household currently learning remotely from home using the Internet? ................ 73
Appendix - The Survey Instrument ................................................................ 74

Page 3
Acknowledgements
Sponsors of the Sixth Annual St. Lawrence County Survey of the Community
The Center for Community Studies would like to thank following two local organizations for their generous financial support of this survey.
Student Associates who worked on this study:
Cruz Alvarezloredo Madison Dillenback Caleb Landry Lauryn Quinn Penelope Arias-Barber Skylar Doyle Cynthia Leedy Sam Robinson Johnathan Barnes Mikayla Estrada Emory Matott Sterling Rosado Hunter Beach Samantha Farone Autumn McAllister Lordess Signil Madison Bradshaw Kellen Flanders Jaymie Monnat Viridiana Silva Hillary Bridge Emily Gardner Jaeden Moscarelli Hollace Stevens Jenna Buzyniski Clayton Hall Alyssa Nugara Erica Suschinski Nadia Callahan Joseph Henry Dylan O'Connor Samantha Thornthwaite Brianna Chest Nicholas Henry Kate O'Neil Marissa Valvo Jordan Crown, Jordan Riana Jenne Olivia Ososkalo Rossana Villena Kyra Daly Abigail Jock Kanoelani Paredes Meghan Wardell Donti Deerr Cassandra Johnson Bryan Parker Justin White Jeremy Dening Kaylee Johnson Miranda Peary Rebekah Widrick Kelsy Dennie Samia Krazoun Kathryn Perry
Faculty Supervisors Mr. Joel LaLone ........................................................................................ Professor of Mathematics
Research Director for the Center for Community Studies Mr. Larry Danforth ...................................................................... Assistant Professor of Mathematics
Research Coordinator for the Center for Community Studies Mr. Andrew Draper .................................................................... Assistant Professor of Mathematics
The Advisory Board of the Center for Community Studies
Mary Corriveau Maryrose Eannace Carl McLaughlin Steve Todd Larry Danforth Richard Halpin John O’Driscoll Eric Virkler John Deans Joel LaLone Ryan Piche Henricus Wagenaar Andy Draper Joseph Lawrence Megan Stadler Dave Zembiec Sonja Draught Tracy Leonard Ty Stone
For more information, please contact
The Center for Community Studies at Jefferson Community College
1220 Coffeen Street Watertown, New York 13601
E-mail: [email protected] Website: www.sunyjefferson.edu/community/community-studies/

Page 4
The Sixth Annual St. Lawrence County Survey of the Community
Section 1 – Introduction and Methodology
The Center for Community Studies at Jefferson Community College was established in October 1999, to engage in a variety of community-building and community-based research activities and to promote the productive discussion of ideas and issues of significance to our region. In collaboration with community partners, the Center conducts research that will benefit the local population and engages in activities that reflect its commitment to enhancing the quality of life of the area.
The annual survey of the community in St. Lawrence County is one activity conducted each year by the Center to gauge current attitudes and opinions of St. Lawrence County adult citizens. This activity results in a yearly updated inventory of the attitudes and opinions of adult citizens of St. Lawrence County. This survey has been completed annually in each of five years from 2015 to 2019. Due to the COVID-19 pandemic, the annual survey was completed in October of 2020. Similar annual studies are conducted in Jefferson County in April and Lewis County in October.
This document is a summary of the results of the Sixth Annual St. Lawrence County Survey of the Community, including comparisons with results from its first five years. Additionally, the key community demographic characteristics of Gender, Age, Education Level, Household Income Level, and Political Ideology are investigated as potential explanatory variables that may be correlated with quality-of-life indicators for the region, using the current 2020 survey results. It is standard methodology with professional surveys to provide this more detailed information to the reader – information that may assist in explaining the overall findings – by reporting the results for all subgroups within these key demographic variables. The most recent results in each of the neighboring counties of Jefferson and Lewis are presented when possible to add perspective to the current St. Lawrence County results. The results provide important information about contemporary thinking of citizens. Over time this will continue to provide important baseline and comparative information as well.
Note that due to the COVID-19 pandemic during 2020, the sampling in St. Lawrence County was postponed from the customary June sampling mentioned above; data for all three surveys was collected in October in 2020. Therefore, any county-level regional comparisons illustrated in this report are not only comparisons of studies that were completed in the same calendar year, but in 2020 the sampling actually occurred simultaneously in the three counties.
Section 1.1 – Methodology – How This Data Was Collected
The original survey instrument used in the annual survey of the community was constructed in Spring 2000 by a team of Jefferson Community College faculty. The instrument is modified each year by the Center for Community Studies, with input from its staff and Advisory Board, community leaders, and students employed at the Center throughout the current academic year, to include new questions of relevance to local organizations, agencies, and residents. Each year the survey includes approximately 50 questions including a core group of about 20-25 questions asked regularly to determine potential trends in attitude over time. Most of these core questions are worded in the same way in each of the three counties to help allow for regional comparison. Several survey questions are asked on an every-other-year or every third-year basis. Newly developed questions regarding current county topics are typically introduced into the survey instrument each year.
The primary goal of the Annual Survey of the St. Lawrence County Community is to collect data regarding quality-of-life issues of importance to the local citizens. A secondary goal is to provide a very real, research-based, learning experience for undergraduate students enrolled at Jefferson Community College. In accomplishing this second goal, students are involved in all aspects of the research, from survey question review and editing, to data collection (interviewing), to data entry and cleansing, to data analysis. The students analyze the data collected in this study as assignments in statistics classes. All final responsibility for question-phrasing, question-inclusion versus omission, final data analysis, interpretation, and reporting of findings lies exclusively with the professional staff of The Center. Data analysis of the information collected through the annual survey will transpire with faculty and students in the classrooms at Jefferson; however, any statistical analysis reported in this document has been completed by the professional staff of The Center. Copies of the introductory script and survey instrument used in this study are attached as an appendix.
This study included completing interviews of 435 St. Lawrence County adult residents. A mixed-mode sampling methodology was employed in this study with two blended samples: 226 interviews/surveys completed using telephone-interview methodology and 209 additional surveys completed via an online survey after email invitation mode.

Page 5
In accordance with the American Association of Public Opinion Research (AAPOR) Transparency Initiative pledge, the following details and disclosure for the telephone-interviewing and online surveying employed in this study, including the following characteristics and facts should be considered by any reader:
1. (T) Dates of Data Collection: October 26 – October 31, 2020.
2. (R) Recruitment: Telephone: All telephone participants were recruited to participate via random selection from a list of all
available valid active residential and cellular telephone lines in St. Lawrence County, New York, USA.
Online: All online participants were recruited to participate via an email invitation with a link to the survey embedded.
3. (A) Population Under Study: All adult residents of St. Lawrence County, New York, USA. There are approximately
110,000 residents in the county. Approximately 90,000 of the 110,000 results are adults.
4. (N) List Source: Telephone: Electronic Voice Services, Inc., www.voice-boards.com
Online: Bulk Email Superstore, www.contactai.com, and InfoUSA
5. (S) Sampling Design: Telephone: The entire phone list described in #2 was randomized, and approximately 4,000 valid residential
and cellular phone numbers were selected to contact to invite to participate in the survey.
Online: The entire email address list described in #4 was randomized, and approximately 10,000 email addresses of residents of St. Lawrence County, NY were selected to contact to invite to participate in the survey.
6. (P) Population Sampling Frame: Telephone: As described in #2, the sampling frame includes all available residential listed phone numbers,
for adults in St. Lawrence County, NY, both landlines and cellular phones included.
Intercept: As described in #5, the sampling frame includes all available email addresses of residents of St. Lawrence County, NY.
7. (A) Administration:
Telephone: Survey administered via telephone from a remote call center, only in English, using SurveyMonkey as the CATI system.
Online: Survey administered online from an email invitation, only in English, using SurveyMonkey.
8. (R) Researchers: The study is an annual survey completed by the Center for Community Studies at Jefferson
Community College, with funding provided by the College and two community sponsors: the Northern New York Community Foundation, Inc., and the Development Authority of the North Country, Inc., Watertown, New York, USA
9. (E) Exact Wording of Survey: Survey instrument is attached as an appendix
10. (N) Sample Sizes: As is discussed in much greater detail for this study later in this report: n=435 overall for the study,
with an overall average margin of error of ±5.2%, including the design effect for weighting.
11. (C) Calculation of Weights: As is discussed in much greater detail for this study later in this report: results are
weighted by gender, age, educational attainment, and sampling modality with calibration of the online results toward telephone results to address potential social desirability bias and weights trimmed to decrease design effect. Target weighting parameters are obtained from the U.S. Census for gender, age, and educational attainment.
12. (Y) Contact Information: Mr. Joel LaLone, Research Director, contact information on page 3.

Page 6
Further details of study methodology and sampling include that a total of 435 interviews of St. Lawrence County adult residents were completed. A mixed-mode sampling methodology was employed in this study with two blended samples: 226 interviews/surveys completed using telephone-interview methodology, and 209 additional surveys completed via an online survey after email invitation mode. One-third of the total sample selected (141 of the 423 interviews who provided their phone ownership information) indicated that they are “cell-only”. After weighting, these cell-only participants account for 46% of this Upstate New York sample. To be eligible to complete the survey, the resident was required to be at least 18 years old. All telephone calls were made between 4:00 and 9:00 p.m. on the evenings of October 26 – October 30, 2020 from a virtual remote call center that was supervised synchronously online from Watertown, New York. The Jefferson Community College students who completed the telephone interviews had completed training in both human subject research methodology and effective interviewing techniques. Professional staff from the Center supervised all interviewing at all times. The online sampling was supervised by the professional staff at the Center, with two reminder follow-up emails sent to any non-responders over the six-day sampling time spanning October 26 – October 31, 2020. No rewards, neither pre-incentives nor post-incentives, were used in either of the two sampling modalities to encourage participation.
When each of the telephone numbers in the random telephone sampling portion of this study was attempted, one of four results occurred: Completion of an interview; a Decline to be interviewed; No Answer/Busy; or an Invalid Number (including both disconnected numbers, as well as numbers for individuals who do not currently reside in St. Lawrence County). Voluntary informed consent was obtained from each resident before the interview was completed. This sampling protocol included informing each resident that it was his or her right to decline to answer any and all individual questions within the interview. To be categorized as a completed interview at least one-half of the questions on the survey had to be completed. A resident’s refusal to answer more than one-half of the questions was considered a decline to be interviewed. The typical length of a completed telephone survey was approximately 10 minutes. Declines to be interviewed (refusals) were not called back in an attempt to convince the resident to reconsider the interview. If no contact was made at a telephone number (No Answer/Busy), a maximum of two call-backs were made to the number. Telephone numbers that were not successfully contacted were ultimately categorized as No Answer/Busy. No messages were left on answering machines at homes where no person answered the telephone. The introductory script of the online version of the survey acquired consent and validation of adult age and within-county residence. The response rate results for the study are summarized in Table 1.
Table 1 – Response Rates for the 6th Annual St. Lawrence County Survey of the Community
Within the fields of social science and educational research, when using a hybrid design including both cell phone and landline telephone interview methodology, a response rate of approximately 7% of all valid phone numbers attempted, and approximately 25% of all successful contacts where a person is actually talking on the phone, are both considered quite successful. Response rates of over 2% when email invitations are sent to opt-in email accounts with an invitation to complete a survey online with no incentives or rewards are typical. The methodology employed in this annual survey continues to meet industry standards.
Methodology UtilizedNumber
Completed
(unweighted)
Number
Completed
(weighted)
Percent of Total
Sample
(weighted)
Number who are
“Cell only”
(weighted)
Percent of
Sample who are
“Cell only”
Telephone interviews on Landline 156 129 29% 0 0%
Telephone interviews on Cell Phones 70 97 21% 68 16%
Online Surveys 209 218 50% 126 30%
Total Interviews 435 435 100% 194
Response rates for LANDLINES & CELL
PHONES COMBINED attempted in this study:
Complete
Interview
Decline to be
InterviewedNo Answer/ Busy TOTALS
% of Valid Numbers 7% 18% 75% 100%
% of Contacted Residents 23% 77% - 100%
Response rates for ONLINE SURVEYS
attempted in this study:Complete Survey
Did Not Complete
SurveyTOTALS
Count 209 9246 9455
Percent 2.2% 97.8% 100%

Page 7
Section 1.2 – Demographics of the sample – Who was Interviewed?
This section of the report includes a description of the results for the demographic variables included in the sample. The demographic characteristics of the sampled adult residents can be used to attain three separate objectives.
1. Initially, this information adds to the knowledge and awareness about the true characteristics of the population of adult residents in the sampled county (e.g. What is the typical household size, educational profile, and household income level in St. Lawrence County?).
2. Secondly, this demographic information facilitates the ability for the data to be sorted or partitioned to investigate for significant relationships – relationships between demographic characteristics of residents and their attitudes and behaviors regarding quality of life in St. Lawrence County. Identification of significant relationships allows local citizens to use the data more effectively, to better understand the factors that are correlated with various aspects of life in the county.
3. Finally, the demographic information also serves an important purpose when compared to established facts about St. Lawrence County to analyze the representative nature of the sample that was randomly selected in this study, and to determine the post-stratification weighting schematic to be applied to the data.
The results of the demographic questions in the survey are summarized in Table 2 and Table 3.
The following is the distribution of town, village, or city of residence of the participating respondents in the Sixth Annual St. Lawrence County Survey of the Community, and after application of post-stratification weights for Gender, Age, Education, and Sampling Modality, and calibration of the online results. These self-reported residences closely parallel that which is true for the distribution of all St. Lawrence County adults; the entire county was proportionally represented accurately in this study.
Table 2 – Geographic Distribution of Participants of the 6th Annual St. Lawrence County Survey of the Community
The results of the other demographics questions recorded as part of this study can be found in Table 3. The table contains the unweighted (raw) sample size for each demographic group along with the percentage of the overall sample represented by each group after weighting has been applied. The unweighted sample sizes should be used when determining confidence interval estimates for any of the subsample statistics in this report.
Town of Residence: Count (raw) % (weighted) % Town of Residence: Count (raw) % (weighted) %
Brasher 11 2% 2% Madrid 11 2% 1%Canton 45 7% 11% Massena (Town) 23 6% 9%Clare 0 0% 0% Massena (Village) 27 6% 2%Clifton 5 2% 1% Morristown 4 1% 2%Colton 7 1% 2% Norfolk 23 6% 4%De Kalb 6 2% 2% Ogdensburg 53 13% 10%De Peyster 2 1% 1% Oswegatchie 14 3% 4%Edwards 6 2% 1% Parishiville 8 2% 2%Fine 6 1% 1% Piercefield 0 0% 0%Fowler 8 2% 2% Pierrepont 6 3% 2%Gouverneur 38 12% 6% Pitcairn 1 0% 1%Hammond 6 1% 1% Potsdam 41 8% 16%Hermon 3 1% 1% Rossie 1 0% 1%Hopkinton 5 1% 1% Russell 6 1% 2%Lawrence 2 0% 1% Stockholm 14 3% 3%Lisbon 19 3% 4% Waddington 11 4% 2%Louisville 12 2% 3% Not sure/Refused 11 3% -Macomb 0 2% 1% TOTAL: n=435 100% 100%
U.S. Census
Estimates
U.S. Census
Estimates
6th Annual Survey Sample
(October 2020)(weighted by Gender, Age,
Education, Phone Ownership)
6th Annual Survey Sample
(October 2020)(weighted by Gender, Age,
Education, Phone Ownership)

Page 8
Table 3 – Demographics of the October 2020 St. Lawrence County Sample
In general, Tables 2 and Table 3 demonstrate that after weighting the data collected in this study for Gender, Age, Education, and Sampling Modality, the responses to the demographic questions for the St. Lawrence County residents who are included in the survey (those who actually answered the telephone and completed the survey, and those who completed the survey online) appear to closely parallel that which is true for the entire adult population of the county. The targets for demographic characteristics were drawn from the U.S. Census updates for St. Lawrence County. Gender, Age, Education, were selected as the factors by which to weight the survey data, as the data collected in this Sixth Annual St. Lawrence County Survey of the Community is susceptible to the typical types of sampling error that are inherent in telephone methodology: women were more likely than men to answer the telephone and/or agree to a survey; older residents are more likely to participate in the survey than younger adult residents; those individuals with higher formal education levels are more likely to agree to the interviews are more likely to participate than residents of rural regions. To compensate for this overrepresentation of females, older residents, and the highly educated in the sample collected in this study, post-stratification weights for Gender, Age, Education Level, and Sampling Modality have been applied in any further analysis of the data analyzed in this report.
When using the sample statistics presented in this report to estimate that which would be expected for the entire St. Lawrence County adult population, the exact margin of error for this survey is question specific. The margin of error depends upon the sample size for each specific question, the resulting sample percentage for each question, the confidence level utilized, and the design effect. Sample sizes will vary for each question in a survey, since some questions are only appropriate for certain subgroups, though in this survey most questions were designed to be answered by all participants. Additionally, sample sizes differ for each question as a result of persons refusing to answer questions. In general, the results of this survey for any questions that were answered by the entire sample of 435 residents may be generalized to the population of all adults at least 18 years of age residing in St. Lawrence County with a 95% confidence level to within a margin of error of approximately ±5.2 percentage points. For question results that are presented for subgroups the resulting smaller sample sizes in these instances allow generalization to the specific subpopulation of all adults at least 18 years of
Demographic Characteristics:
Raw Sample Size (n to be used to determine
margin of error for
subgroups)
Weighted
Percent
Male 170 49.9%
Female 253 50.1%
Transgender 0 0.0%
18-39 years of age 45 33.6%
40-59 years of age 135 34.3%
60 years of age or older 243 32.1%
Less than high school graduate 3 2.2%
High school graduate (including GED) 106 41.0%
Some College, no degree 102 23.5%
Associate's Degree 66 12.5%
Bachelor's Degree 62 10.4%
Graduate Degree 85 10.3%
$25,000 or Less 42 16.8%
$25,001 - $50,000 79 23.9%
$50,001 - $75,000 85 26.0%
$75,001 - $100,000 61 15.0%
More than $100,000 68 18.3%
Very Conservative 25 7.7%
Conservative 98 25.4%
Middle of the Road 171 43.4%
Liberal 67 9.9%
Very Liberal 19 4.9%
Not Sure 18 8.6%
Gender: (U.S . Ce nsus: S t. La wre nc e County 5 1% Ma le )
Age: (U.S . Ce nsus: S t. La wre nc e County 2 5 % unde r 3 5 , 2 2 % a re 6 5 a nd olde r)
Education: (U.S . Ce nsus: S t. La wre nc e County a mong those 2 5 + 2 3 % ha ve a t le a st a 4 yr. de gre e )
Household Income: (U.S . Ce nsus S t. La wre nc e County 2 6 % < $ 2 5 ,0 0 0 a nd 3 6 % > $ 7 5 ,0 0 0 )
Political Ideology:

Page 9
age residing in the county (e.g. generalization of some specific characteristics of sampled females to all St. Lawrence County adult females) with a 95% confidence level to within a margin of error of larger than approximately ±5.2 percentage points. For more specific detail regarding the margin of error for this survey, please refer to the Technical Comments in Section 3.0 of this report and/or contact the professional staff at the Center for Community Studies.
In order to maximize comparability among the six annual surveys that have been completed in St. Lawrence County, the procedures used to collect information and the wording of the core questions asked have remained virtually identical. All past studies were conducted in the months of either June or July each year (recall that this year’s study was conducted in October) to control for seasonal variability, and the total number of interviews completed ranged from 354 to 832, depending upon the year. All interviewers have been similarly and extensively trained preceding data collection each year. Data management, cleansing, and transformation techniques used have remained similar throughout. The survey methodology used to complete the Sixth Annual St. Lawrence County Survey of the Community is comparable to that used in the previous five years (the lone except being that the data for 2020 was collected in October). Furthermore, post-stratification weights for gender, age, education level, and phone ownership have also been applied to all results from the first five years of surveying to maximize the representativeness of the collected sample of adults. Online surveying was blended into the overall sample for the first time in 2019. This maintenance of consistent methodology from year to year allows for valid comparisons for trends over the twenty-year period that will be illustrated later in this report.
Throughout this report, key community demographic characteristics of Gender, Age, Education Level, Political Ideology, and Household Income Level are investigated as potential explanatory variables that may be associated with quality-of-life indicators and other community behavior and opinion variables for the county. It is standard methodology with professional surveys to provide this further rich information to the reader – information that may assist in explaining the overall findings – by reporting the cross-tabulated results for all subgroups within key demographic variables. The results provide important information about contemporary thinking of citizens and over time will continue to provide important baseline and comparative information as well. For more specific detail regarding margin of error and tests of statistical significance completed within this study, please refer to Section 3.0- “Technical Comments to Assist Interpretation of the Data” and/or contact the professional staff at the Center for Community Studies.
All data compilation and statistical analyses within this study have been completed using SPSS, Release 27.

Page 10
Section 2 - Summary of Findings
Section 2.1 – The Most Notable Study Finding in 2020 – The Presidential Election – Who says polling is broken?
We at the Center for Community Studies have devoted over two decades to continuously studying and implementing best practices in survey methodology to ensure that we take every measure possible to complete polling (survey research) where the sample results that we publish are, in fact, very good estimates of that which would be true if we did survey/interview every adult in the North Country populations.
So how are we doing? How close are our estimates? Is our polling at the Center broken? How would one even know if there is a severe problem?
To answer these questions, a bit of background regarding polling error should prove helpful. In general, when a sample estimate (poll) deviates from that which is true for an entire population it is considered “error”, and there are three predominate sources of error in survey sampling:
1. Random error 2. Measurement bias error 3. Sampling bias error
To minimize these three potential sources of error the following procedures are implemented at the Center:
1. To reduce random error – our sample sizes are a minimum of 400 individuals all times and at times surpass 700-800, with a larger sample size mathematically reducing the margin of error in estimation.
2. To reduce measurement bias error – every effort is made to edit and pilot survey items to maximize clarity, definition, and interpretation by participants to help us maximize the likelihood that we are measuring that which we intent to measure in an unbiased manner. In political polling, a significant source of measurement error, in addition to survey question phrasing, could be due to the definitions of “who is a likely voter” and/or “how to treat a likely voter who reports as undecided”.
3. To reduce sampling bias error – we devote great efforts to identifying the best sampling methodology (telephone? online? mail? intercept?) that will help us collect a sample that is representative of the population of interest in any study, and we study and understand the characteristics of the population of interest so that whenever do have a biased sample we are able to correctly mathematically adjust for the sampling bias via weighting and calibration algorithms.
So, given these potential sources of error and our processes used to minimize these errors, how are we doing?
Here’s the key – once every four years pollsters are afforded the opportunity to test their methodology, or determine how they are doing, since every four years there is an election where both a sample poll may be completed, and after the election the true population voting result is known! Therefore, as part of this 6th Annual Survey of the Community, we at the Center took the opportunity to test ourselves, see how well our polling estimates the 2020 Presidential Election results in the county. In fact, since the COVID-19 pandemic in 2020 caused a postponement in annual surveys in St. Lawrence and Jefferson Counties, we at the Center had the opportunity to test ourselves three times – poll regarding the election in St. Lawrence, Lewis, and Jefferson County in late October 2020, then after all votes are certified, check to see – is our polling broken? Note that with a sample size of n=384 Likely Voters in St. Lawrence County participating in this October 2020 study, the county-specific Margin of Error is ±6.1%. Therefore, if our prediction of the results of the November 3, 2020 Presidential Election for St. Lawrence County were to fall within ±6.1% of the actual certified vote count, there would be no evidence at all that our polling at the Center is broken. Similarly, a sample size of n=440 Likely Voters in Lewis County participating in this October 2020 study generates a county-specific Margin of Error of ±6.0%, and a sample size of n=513 Likely Voters in Jefferson County participating in this October 2020 study generates a county-specific Margin of Error of ±5.7%.
Again, how are we doing? Please proceed to the following page to observe!
To best interpret the results on Page 12 the reader should focus on the transition from lighter shaded gray bars to the darker gray bars in each county (this reflects the change from “day-of” reported votes to “all valid votes including early, absentee, and day-of”). Clearly in each county the absentee votes when counter reduced the level of support for Trump in the election in the total group of votes cast. Similarly, to best interpret the results below the reader should focus on the transition from lighter shaded maroon bars to the darker maroon bars in each county (this reflects the change from raw survey results collected to our predictions after weighting the sample for gender, age, education, party affiliation, sampling modality, and military affiliation toward the targets that we at the Center predicted would be the actual turn-out rates in the 2020 Presidential Election. Clearly in each county after weighting, our estimates of Trump support increased after weighting and calibrating the sample results.

Page 11
Figure 1 – 2020 Presidential Election Polling Prediction versus Actual Election Outcome
The key take-away’s from this graph (comparing dark gray bars to dark maroon bars):
1. Our estimates agreed with actual election results when comparing counties, we predicted greatest support for Trump in Lewis County (63.8%), then Jefferson County (55.7%), and finally St. Lawrence County (52.6%). This is the correct relative standing of support, where the actual results in the three counties were 68.6%, 58.4%, and 54.8%, respectively.
2. Most importantly, all three polling estimates in the counties fell well within the margins of error based upon our sample sizes:
Finally, readers may find it interesting when the results for St. Lawrence County participants are cross-tabulated
by the same key demographic variables that will be analyzed and reported throughout the remainder of this report.
Subgroup results below for voting preference are very interesting and telling, and most times not unexpected.
Table 4 – St. Lawrence County 2020 Presidential Election Poll Cross-Tabulations
SUMMARY:
Some national pollsters used sample sizes of n=1,000, and even at times n=1,500, yet their poll predictions missed the
actual election results by well more than 10%. We at the Center could venture guesses about why so many pollsters
missed by so far, but those would be just that – guesses, without knowledge of their sampling, weighting, calibrating
techniques (which are typically not shared in detail). However, the evidence provided in this report suggests that polling
by the Center for Community Studies is not broken, and as a result, we have every confidence that our survey research
currently does, and in the future will continue to, well estimate the statistics that our community based clients partner us
to study and report regarding all types of key community issues. We use the same rigorous methodology and
mathematical analysis for all community issues that we employed in this political-election-self-test completed in October
2020.
County Margin of Error Actual Error in the Poll
Jefferson ±5.7% 58.4%-55.7% = 2.7%
Lewis ±6.0% 68.6%-63.8% = 4.8%
St. Lawrence ±6.1% 54.8%-52.6% = 2.2%
Male FemaleUp to
$25,000
$25,001-
$50,000
$50,001-
$75,000
$75,001-
$100,000
Over
$100,000
% Vote for Trump 52.6% 59.8% 45.0% 62.1% 53.7% 51.7% 37.8% 51.1%
Sample Size 384 156 225 34 72 82 59 67
All St.
Lawrence
County
Gender Annual Household Income
18-39 40-59 60-69 70+HSG or
Less
Some
College
4+ Year
DegreeRep Dem. Ind.
% Vote for Trump 58.4% 54.9% 51.0% 45.9% 63.2% 55.5% 29.0% 83.2% 17.1% 48.1%
Sample Size 36 123 116 106 83 156 142 152 139 61
Age Groups Education Party

Page 12
Section 2.2 – Quality of Life in St. Lawrence County
Figure 2 – 2020 Results of Tracked Community Indicators
2.2 – Key Findings/Observations (Tables 8-17)
Current Levels:
Seven community characteristics that have been studied since the first survey in 2015 have been included again as part of the 2020 survey. Current results for these seven community indicators include that St. Lawrence County adult residents are most satisfied with the Quality of the environment (71%), Quality of K-12 education (60%), and Policing and crime control (60%), with at least three out of every five respondents indicating each to be Excellent or Good. The two characteristics of most concern are the Availability of good jobs (52%) and the Overall state of the local economy (40%) with the highest Poor rates, both of which are at least twice as high as the third highest rate.
Trends:
Although four of the seven community indicators studied in 2020 display current levels of satisfaction similar to those seen in past years but the Excellent or Good rates of Healthcare quality (44%), Quality of K-12 education, and the Overall quality of life in the area (55%) are the lowest reported since 2015. On the other hand, only one of the recorded Poor ratings is higher than recorded in previous years; the 10% of participants reporting Poor for the Overall quality of life in the area is only one percent higher than rates reported in previous years that ranged from 7% to 9%.

Page 13
Section 2.3 – Personal Opinions – Issues in Our Society and Communities
Figure 3 – Comparing Dominance of Personal Opinions Regarding Societal Issues
2.3 – Key Findings/Observations (Tables 18-27)
Current Levels:
A section of eight survey items that relate to personal opinions of residents regarding issues that typically are of great importance to residents of any community and society was included in this annual for the second consecutive year in 2020. The issues studied in 2020 include healthcare funding, the role of government, Presidential approval, gun control and rights, abortion, same-sex relationships, social injustice, and the building of a physical wall on the U.S.-Mexico border. The goal has been to learn what the overall predominate opinions are among the St. Lawrence County adult community. The results in 2020 are summarized in the graph above, with some themes that may typically be considered as a conservative stance and others that are typically considered as a liberal stance being dominant among county adult residents at times.
Among the eight studied issues, a majority of residents favor the moderate (blue) stance for six of the eight issues, while a majority of residents favor the conservative (red) stance for two of the eight issues. The issues that result with the most dominant or singular opinion include (at least twice the support of the opposing viewpoint): 70% believe same-sex relationships are all right, 68% believe that abortion is a woman’s right, 68% agree that systemic racism and social injustice are major problems in our country, 67% believe social security is the responsibility of the government, and 66% believe that climate change is proven science.
When asked the largest issue facing our nation at the current time, the most common response is “jobs and the economy” (40%), followed closely by the “coronavirus” (37%).
Trends:
Among the eight personal opinion issues studied in 2020 seven were also studied in 2019; the current levels of support for varying views have remained very consistent for six of the seven issues but a significant change can be seen in the approval for President Trump. The rate reporting that the President is good for the county increased from 43% in 2019 to 57% in 2020.

Page 14
Section 2.4 – COVID-19 – Residents’ Opinions and Behaviors
Figure 4 – COVID-19 – Residents’ Opinions and Behaviors
2.4 – Key Findings/Observations (Tables 28-36)
Current Levels:
St. Lawrence County adult residents were surveyed by the Center for Community Studies in collaboration with local Public Health Departments in an extensive COVID-19 impact study in March-April of 2020. This original study included approximately 50 survey questions related to behaviors, fears, satisfactions, impacts, and expectations. To observe and act upon change, seven of these survey questions were included for a second round of study seven months later in this October 2020 annual survey. In October 2020 it has been found that a large majority of St. Lawrence County residents wear masks outside in public regularly and that three-quarters express concern in trusting the COVID-19 information that they see in the media. Satisfaction with the COVID-19 response by the four different organizations or agencies varies greatly from a low of 47% to a high of 80% with a much higher satisfaction rating with St. Lawrence County Public Health. Finally, a majority (70%) believe that COVID-19 is a major problem, with the largest portion of these individuals (54%) believing that the worst is yet to come, while 24% believing that COVID-19 is not a major problem.
Trends:
The most noticeable trends found between April 2020 and October 2020 include:
1. Have not worn a mask outside in public in past two weeks decreased tremendously from 80% to 3% 2. Have worn a mask outside in public daily in past two weeks increased tremendously from 7% to 71% 3. “Somewhat or Very Concerned” with lack of trust in the information about COVID-19 that they see in the media
increased from 61% to 75% 4. “Satisfied” with the COVID-19 response by the CDC and the US Public Health decreased from 67% to 57% 5. “Satisfied” with the COVID-19 response by President Trump and the US Government decreased from 54% to 47% 6. “Satisfied” with the COVID-19 response by Governor Cuomo and the NY Government decreased from 60% to 49% 7. “Satisfied” with the COVID-19 response by the local Public Health Department increased from 68% to 80% 8. Believe that COVID-19 is a major problem – the worst is behind us: increased from 5% to 16% 9. Believe that COVID-19 is a major problem – the worst is yet to come: decreased by a very large margin from 87%
to 54% 10. Believe that COVID-19 is not a major problem: increased tremendously from 4% to 24%

Page 15
Section 2.5 – Personal Financial Situation
Figure 5 – Residents’ Personal Financial Situation
2.5 – Key Findings/Observations (Tables 37-38)
Current Levels:
St. Lawrence County adult residents in 2020 most commonly describe their personal financial situation as “unchanged in the past 12 month”; however, among those who have experienced a change, residents are almost four times more likely to respond “things have gotten worse” (31%) than they are to express “things have gotten better´(8%).
Trends:
The rate of expressing “gotten better” in 2020 (8%) is the lowest ever recorded in the County while the rate responding “gotten worse” is the highest ever recorded. This result may be expected as a response to the COVID-19 pandemic. The 8% “gotten better” rating is almost 10% lower than the previously reported lowest rate of 17% in 2017 while the “gotten worse” rate is 10% higher than the previous highest rate of 21% in 2019.

Page 16
Section 2.6 – What Direction are Things Heading? St. Lawrence County & the Country
Figure 6 – Direction of St. Lawrence County and the Country
2.6 – Key Findings/Observations (Tables 39-40)
Current Levels:
In 2020, St. Lawrence County adult residents seem to be very equally split about the opinions of the County’s direction with 36% of respondents indicating things are headed in the right direction and 34% stating that things are headed in the wrong direction. Residents are not as optimistic with the direction of the entire country with only 27% believing the country is headed in the right direction and 54% believing the country is headed in the wrong direction.
Trends:
St. Lawrence County residents’ attitude about the direction of the country was studied for the second time in 2020, first being studied in 2019. The 2020 rate of those who believe the country is heading in the right direction is significantly lower than the 39% reported in 2019 while the rate who believe the country is headed in the right direction increased from 48% in 2019.
Page 17
Section 2.7 – St. Lawrence County Trail System
Figure 7 – St. Lawrence County Trail System
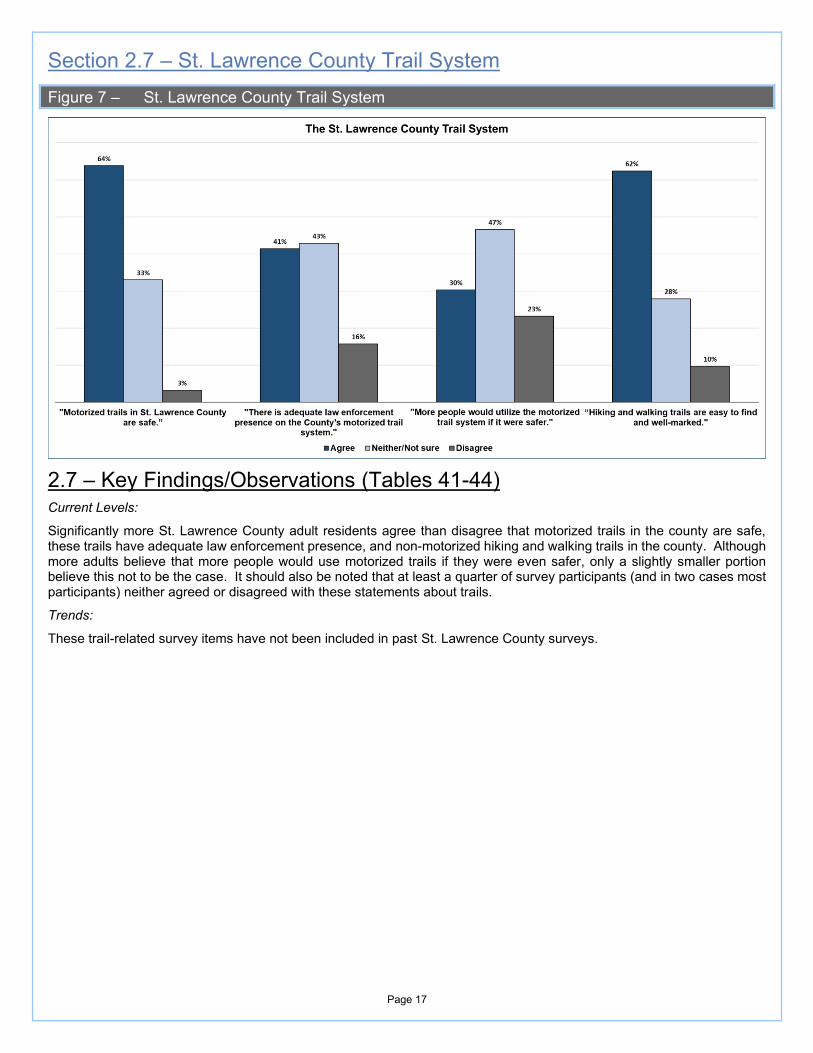
2.7 – Key Findings/Observations (Tables 41-44)
Current Levels:
Significantly more St. Lawrence County adult residents agree than disagree that motorized trails in the county are safe, these trails have adequate law enforcement presence, and non-motorized hiking and walking trails in the county. Although more adults believe that more people would use motorized trails if they were even safer, only a slightly smaller portion believe this not to be the case. It should also be noted that at least a quarter of survey participants (and in two cases most participants) neither agreed or disagreed with these statements about trails.
Trends:
These trail-related survey items have not been included in past St. Lawrence County surveys.

Page 18
Section 2.8 – Legalization of Recreational Use in New York State – Opinions About Growth and Sale in St. Lawrence County
Figure 8 – Opinions About the Growth and Sale of Marijuana in St. Lawrence County – If Legalized
2.8 – Key Findings/Observations (Tables 45-46)
Current Levels:
If the industry of marijuana growth was to become legalized in New York State, St. Lawrence County adult residents strongly support both allowing farmers to grow and profit from the industry (71% support, 17% oppose) and the sale of marijuana in the county (61% support, 23% oppose).
Trends:
These legalized-marijuana survey items have not been included in past St. Lawrence County surveys.

Page 19
Section 2.9 – Internet Access and Use in St. Lawrence County–Employment and Learning
Figure 9 Internet Access and Use in St. Lawrence County – Employment and Learning
2.9 – Key Findings/Observations (Tables 47-49)
Current Levels:
Almost all St. Lawrence County adult residents report that they access the Internet from home (less than 1% report no access at home). The most common ways that residents access the Internet at home are via cable TV modem access and via using their cellular phone. Nearly a quarter of county residents report that an individual in their household is working from home while nearly thirty percent report that someone is learning remotely from home using the Internet at the K-12 level and nearly 10% taking college coursework at home using the Internet:
• 23% of households include someone who is working at least part of their job remotely from home
• 28% of households include someone who is learning remotely from home at the K-12 education level
• 11% of households include someone who is learning remotely from home at the college education level
Trends:
These Internet-access survey items have not been included in past St. Lawrence County surveys.

Page 20
Section 3 - Detailed Statistical Results This section of the Final Report of Study Findings provides a detailed presentation of the results for each of the
questions in the survey. There are nine separate sections of detailed statistical results to follow (Sections 3.0-3.8). The first of these sections (Section 3.0) includes technical comments and is provided to explain the details of how to best interpret the included statistics. Descriptions of the correct margin of error to use for any provided statistic and how to determine statistical significance are explained in detail within these technical comments. Following the technical comments in Section 3.0 are eight sections of detailed presentation of statistical results for each of the questions in included in this study. The survey questions included in this study and analyzed in this report have been organized into the following sections:
Section 3.1 – Quality of Life Indicators in St. Lawrence County (Tables 8-17) Section 3.2 – Personal Opinions – Issues in Our Society and Communities (Tables 18-27) Section 3.3 – COVID-19 – Residents’ Opinions and Behaviors (Tables 28-36) Section 3.4 – Personal Financial and Employment Situations (Tables 37-38) Section 3.5 – What Direction are Things Heading? – St. Lawrence County and the Entire Country (Tables
39-40) Section 3.6 – The St. Lawrence County Trail System (Tables 41-44) Section 3.7 – Potential Legalization of Recreational Marijuana Use in New York State – Opinions about
Growth and Sale in St. Lawrence County (Tables 45-46) Section 3.8 – Internet Access and Use in St. Lawrence County – Employment and Learning (Tables 47-
49)
The organization of the tabular presentation of statistical results in each of these eight sections is as follows.
(1) The current 2020 St. Lawrence County results for all sampled residents are combined and summarized in a frequency distribution that shows the sampled frequency (unweighted) and sample proportion (weighted) for each possible survey response for the survey question (recall, the results are weighted by Gender, Age, Education Level, and Sampling Modality).
(2) A trend analysis is completed and shown in a table for each survey question that was measured in St. Lawrence County at least twice since surveying began in 2015. Trends are also illustrated graphically with line graphs and bar graphs.
(3) A Northern New York regional comparison analysis is completed and shown in a table for each survey question that was also measured in either Jefferson or Lewis County in the year 2020. Regional county comparison results are also illustrated graphically with a clustered bar graph.
(4) The results for each 2020 St. Lawrence County survey question have been cross-tabulated by each of the demographic factors of Gender, Age, Education Level, Household Income, and Political Ideology.
Statistically significant trends, county comparisons, and relationships between variables may be identified by using the descriptions and examples in the “Technical Comments” section in this report, Section 3.0.
When comparing results across time, the sample sizes collected each year should be considered. The sample sizes for each of the six years of the St. Lawrence County Annual Survey of the Community are summarized in the following Table 5. It should be noted that although the sample size in 2019 was 832 most survey questions were answered by approximately 500 county residents.
Table 5 – Sample Sizes for each of the Twenty-One Years of the St. Lawrence County Annual Survey
The statistics reported in the correlative tables in this report (cross-tabulations by gender, age, education, political ideology, and household income) are percentages within the sampled subgroups. To determine the raw unweighted sample size for each subgroup – to avoid over-interpretation – the reader should refer to the bottom row of each cross-tabulation table provided. In summary, these unweighted within-subgroup sample sizes are summarized in Table 6. Again, all study findings should be considered with sample sizes in mind. Statistical tests of significance take into consideration and reflect these varying sample sizes. The typical sample size within each demographic subgroup is shown, along with the appropriate approximate margin of error for each of these subgroup sample sizes, in the following table.
Year of Study 2015 2016 2017 2018 2019 2020
Total Sample Size 442 354 374 466 832* 435

Page 21
Table 6 – Sample Size and Margin of Error for Common Demographic Subgroups to be Compared in 2020
“Framing” a Statistic – Providing Perspective to Better Understand, Interpret, and Use this Survey Data
The rationale behind providing so many analyses (statistics) for every survey question included in this study is that one never fully understands the information contained in a reported statistic without “framing” that statistic. Framing involves adding a richer perspective to the value of some reported statistic. For example, when St. Lawrence County residents were asked the survey question: ““When considering you or your family's personal financial situation has it gotten better, stayed about the same, or gotten worse in the past 12 months?”, the results in the current 2020 community study indicate that 30.7% of the participants indicated that things have gotten worse (reported later in Table 37). So .... what does this 30.7% really mean? Often-times community-based researchers will describe the process of “framing” a statistic as completing as many as possible of the six following comparisons (frames) to better understand a reported statistic from a sample:
• Within Response Distribution
(Is it a majority? 4:1 ratio? “Twenty times more likely to respond with “increased” .... than “decreased”?)
• Trend Across Time
(Has it increased? Decreased?)
• Compare to Target/Benchmark
(Compare to an agency or community’s goal or target?)
• Compare to some regional average/partner?
(Compare to a larger regional average or regional partner - Lewis or Jefferson County?)
• Ranking Among Similar Variables
(Among many different similar locations, characteristics, options, or attributes, that all use the same response scale, is this
specific item ranked first? last?)
• Cross-tabulations by Potential Explanatory Variables
(Do different political ideological people differ in opinion or behavior? Age-dependent? Gender-dependent? Education-
dependent? Income-dependent? Political Ideology-dependent?)
The design of this final study report of findings includes all of the various types of tables that are necessary to allow community leaders to best “frame the statistics” included in this report, best understand the statistics included, and make best decisions in the future regarding how to use the statistics. As has been mentioned previously, if one has further questions about “framing a statistic” please contact the professional staff at the Center for Community Studies.
Demographic Characteristics:
Raw Sample Size (n to be used to determine
margin of error for
subgroups)
Approximate
Margin of Error
Male 170 ±8.3%
Female 253 ±6.8%
18-39 years of age 45 ±16.0%
40-59 years of age 135 ±9.3%
60 years of age or older 243 ±6.9%
High school graduate or less 109 ±10.3%
Some College (less than 4 year degree) 168 ±8.3%
College graduate (4+ year degree) 147 ±8.9%
Less than $25,000 42 ±16.6%
$25,001 - $50,000 79 ±12.1%
$50,001 - $75,000 85 ±11.7%
$75,001 - $100,000 61 ±13.8%
More than $100,000 68 ±13.1%
Conservative 123 ±9.7%
Neither 189 ±7.8%
Liberal 86 ±11.6%
Political Ideology:
Gender:
Age:
Education:
Household Income:

Page 22
Section 3.0 – Technical Comments to Assist Interpretation of the Data
The results of this study will be disseminated to, and utilized in decision-making by, a very wide array of readers – who, no doubt, have a very wide array of statistical backgrounds. The following comments are provided to give guidance for interpretation of the presented findings so that readers with less-than-current statistical training might maximize the use of the information contained in the Sixth Annual Survey of the Community in St. Lawrence County.
Margin of Error – Constructing Confidence Intervals to Estimate for an Entire Population
When data is collected, of course, it is only possible for the researcher to analyze the results of the sample data, the data from the group of individuals actually sampled, or in this case, actually interviewed. However, it is typically the goal of the researcher to use this sample data to draw a conclusion, or estimate that which they believe is true, for the entire population from which the sample was selected. To complete this estimation the standard statistical technique is to construct a confidence interval – an interval of values between which one can be 95% certain, or confident, that the true population value will fall. For example, if a researcher interviews n=500 randomly selected participants from some population of size N=100,000 individuals, and the researcher finds that x=200 of the 500 sampled participants indicate that they “agree” with some posed statement (200 out of 500 would be 40%), then the researcher can never be 100% certain that if all 100,000 population members were, in fact, interviewed that the result for this entire population investigated would be that 40% (that would be 40,000 out of the 100,000) would “agree.” In general, one can never guarantee with 100% certainty that a statistic for some random sample will perfectly, exactly, result the same as the value that describes the entire population (this value is called a “parameter”). Fortunately, considering the types of variables and resulting data that typically are generated in survey research, use of the statistical tools of probability distributions and sampling distributions allows the determination of a very important distance – the distance that one would expect 95% of the samples of size n to fall either above or below the true population value. This distance is commonly referred to as the margin of error. Once this distance (margin of error) is measured, there is a 95% probability that the sample result (the result of the n=500 sampled participants in the illustration above) will fall within that distance of the true population value. Therefore, to construct the very useful and easily-interpreted statistical estimation tool known as a confidence interval, all one must do is calculate the margin of error and add-and-subtract it to-and-from the sample result (statistic) and the outcome is that there is a 95% chance that the resulting interval does, in fact, include the true population value within the interval.
To illustrate the above-described concepts of margin of error and confidence intervals, recall that the margin of error for this survey has been earlier stated in the Methodology section in this report as approximately ±5.2 percentage points when a survey question is answered by all 435 participants. Therefore, when a percentage is observed in one of the included tables of statistics in this report, the appropriate interpretation is that we are 95% confident that if all St. Lawrence County adult residents were surveyed (rather than just the 435 who were actually surveyed), the percentage that would result for all residents would be within ±5.2 percentage points of the sample percentage that we surveyed, calculated, and reported in this study.
For example, in Table 17, it can be observed that 44.2% of the sample of 433 adults in St. Lawrence County reported that they believe the Overall Quality of Life in the Area is Good. With this sample result, one could infer with 95% confidence that if all St. Lawrence County adults were asked – somewhere between 39.0% and 49.4% of the population of the nearly 90,000 adults in St. Lawrence County would report that they think the quality of life in the area is good (generated by starting with the 44.2% that was found in the sample and adding-and-subtracting the margin of error of ±5.2%). This resulting interval (39.0%-49.4%) is known as a 95% Confidence Interval.
The consumer of this report should use this pattern when attempting to generalize any of these survey findings for survey questions that were answered by all, or almost all, 435 participants in this study to the entire adult population of St. Lawrence County. When attempting to generalize results for survey questions which had smaller sample sizes (investigating demographic subgroups such as only females, examining results from a study in a previous year, or comparing to results in another county), the resulting margin of error will be larger than ±5.2 percentage points.
Margin of Error – More Detail for Those Interested in Maximizing Precision and Accuracy of Estimates
The preceding introductory example used a margin of error of ±5.2%, as a result of an illustration that used nearly all of the 435 participants in this study. Again, the margin of error when using the sample results in this study to construct a confidence interval to estimate a population percentage will not always be ±5.2%. There is not one universal value of a margin of error that can be precisely calculated and used for the results for every question included in this survey, or for that matter, any multiple-question survey. Calculation methods used in this study for generating the margin of error depend upon the following factors, which include three factors in addition to the sample-size factor that has just been mentioned:

Page 23
1. The sample size is the number of adults who validly answered the survey question. The sample size will vary from question to question due to the use of multiple versions of the survey instrument, some questions only being posed after screening questions, and since all individuals have the right to omit any question. Additionally, the sample sizes differ in previous years and in the other counties. In general, the smaller the sample size then the larger the margin of error, and conversely, the larger the sample size then the smaller the margin of error.
2. The sample proportion or percentage is the calculated percentage of the sample who responded with the answer or category of interest (e.g. responded “Agree” or “Good”). This percentage can vary from 0%-100%, and, of course, will change from question to question throughout the survey. In general, the further that a sample percentage varies from 50% in either direction (approaching either 0% or 100%), the smaller the margin of error. Conversely, the closer that the actual sample percentage is to 50% then the larger is the resulting margin of error. As an example, if 118 out of 502 sampled residents rate a particular characteristic of the county as Excellent, then the sample proportion would be 118 ÷ 502 = 0.235 = 23.5%.
3. The confidence level is used in generalizing the results of the sample to the population that the sample represented. In this study, the standard confidence level used in survey research, 95% confidence level, will be used for all survey questions.
4. The design effect (DEFF) is a factor used in the calculation of the margin of error that compensates for the impact upon the size of the margin of error of having a sample whose demographic distributions do not well-parallel the distributions of the entire population that the sampling is attempting to represent. In general, the further that the sample demographic distributions deviate from the population distributions then the larger the design effect (margin of error), and conversely, the closer that the sample demographic distributions parallel the population distributions then the smaller the design effect (margin of error). Essentially the design effect reflects the magnitude of the impact that reliance upon weighting of sample results will have upon the reliability of population estimates. Note that the design effect for estimates in this study is 1.89.
In mathematical notation, the margin of error for each sample result for this study would be represented as:
ME = 1.96√p(100 − p)
n∙ √DEFF
where n = sample size = # valid responses to the survey question
p = sample percentage for the survey question (between 0%-100%)
1.96 = the standard normal score associated with the 95% confidence level
DEFF = the design effect where
( )22
=
i
i
w
wnDEFF , wi = post-stratification weight associated with the ith individual sampled
An example of using this Margin of Error formula would be that if 500 residents are sampled and validly answer some survey question, and 170 of those 500 residents report that they believe a particular issue to be a Major concern in the area, then the sample proportion is p = (170/500) = 0.34 = 34%. Therefore, the margin of error for this sample (whose n is only 500) that has a sample proportion that deviates quite largely from 50%, is found by:
ME = 1.96√p(100 − p)
n∙ √DEFF = 1.96√
34(100 − 34)
500∙ √1.89 = 5.7%
Since the sample size varies (in fact, is conceivably different for each question on the survey) and the sample percentage varies (also, conceivably different for each question on the survey) the Table 7, found on the following page, has been provided for the reader to determine the correct margin of error to use whenever constructing a confidence interval using the sample data presented in this study. This table was generated using the ME formula shown above.

Page 24
Table 7 – More Detailed Margins of Error for Varying Sample Sizes and Varying Sample Proportions
30 50 75 100 125 150 175 200 225 250 300 350 400 435
2% 6.9% 5.3% 4.4% 3.8% 3.4% 3.1% 2.9% 2.7% 2.5% 2.4% 2.2% 2.0% 1.9% 1.8%
4% 9.6% 7.5% 6.1% 5.3% 4.7% 4.3% 4.0% 3.7% 3.5% 3.3% 3.0% 2.8% 2.6% 2.5%
6% 11.7% 9.0% 7.4% 6.4% 5.7% 5.2% 4.8% 4.5% 4.3% 4.0% 3.7% 3.4% 3.2% 3.1%
8% 13.3% 10.3% 8.4% 7.3% 6.5% 6.0% 5.5% 5.2% 4.9% 4.6% 4.2% 3.9% 3.7% 3.5%
10% 14.8% 11.4% 9.3% 8.1% 7.2% 6.6% 6.1% 5.7% 5.4% 5.1% 4.7% 4.3% 4.0% 3.9%
12% 16.0% 12.4% 10.1% 8.8% 7.8% 7.1% 6.6% 6.2% 5.8% 5.5% 5.1% 4.7% 4.4% 4.2%
14% 17.1% 13.2% 10.8% 9.3% 8.4% 7.6% 7.1% 6.6% 6.2% 5.9% 5.4% 5.0% 4.7% 4.5%
16% 18.0% 14.0% 11.4% 9.9% 8.8% 8.1% 7.5% 7.0% 6.6% 6.2% 5.7% 5.3% 4.9% 4.7%
18% 18.9% 14.6% 12.0% 10.4% 9.3% 8.5% 7.8% 7.3% 6.9% 6.5% 6.0% 5.5% 5.2% 5.0%
20% 19.7% 15.2% 12.4% 10.8% 9.6% 8.8% 8.1% 7.6% 7.2% 6.8% 6.2% 5.8% 5.4% 5.2%
22% 20.4% 15.8% 12.9% 11.2% 10.0% 9.1% 8.4% 7.9% 7.4% 7.1% 6.4% 6.0% 5.6% 5.4%
24% 21.0% 16.3% 13.3% 11.5% 10.3% 9.4% 8.7% 8.1% 7.7% 7.3% 6.6% 6.2% 5.8% 5.5%
26% 21.6% 16.7% 13.6% 11.8% 10.6% 9.7% 8.9% 8.4% 7.9% 7.5% 6.8% 6.3% 5.9% 5.7%
28% 22.1% 17.1% 14.0% 12.1% 10.8% 9.9% 9.1% 8.6% 8.1% 7.7% 7.0% 6.5% 6.0% 5.8%
30% 22.5% 17.5% 14.3% 12.3% 11.0% 10.1% 9.3% 8.7% 8.2% 7.8% 7.1% 6.6% 6.2% 5.9%
32% 22.9% 17.8% 14.5% 12.6% 11.2% 10.3% 9.5% 8.9% 8.4% 7.9% 7.3% 6.7% 6.3% 6.0%
34% 23.3% 18.1% 14.7% 12.8% 11.4% 10.4% 9.6% 9.0% 8.5% 8.1% 7.4% 6.8% 6.4% 6.1%
36% 23.6% 18.3% 14.9% 12.9% 11.6% 10.6% 9.8% 9.1% 8.6% 8.2% 7.5% 6.9% 6.5% 6.2%
38% 23.9% 18.5% 15.1% 13.1% 11.7% 10.7% 9.9% 9.2% 8.7% 8.3% 7.6% 7.0% 6.5% 6.3%
40% 24.1% 18.7% 15.2% 13.2% 11.8% 10.8% 10.0% 9.3% 8.8% 8.3% 7.6% 7.1% 6.6% 6.3%
42% 24.3% 18.8% 15.4% 13.3% 11.9% 10.9% 10.1% 9.4% 8.9% 8.4% 7.7% 7.1% 6.6% 6.4%
44% 24.4% 18.9% 15.4% 13.4% 12.0% 10.9% 10.1% 9.5% 8.9% 8.5% 7.7% 7.1% 6.7% 6.4%
46% 24.5% 19.0% 15.5% 13.4% 12.0% 11.0% 10.2% 9.5% 9.0% 8.5% 7.8% 7.2% 6.7% 6.4%
48% 24.6% 19.0% 15.5% 13.5% 12.0% 11.0% 10.2% 9.5% 9.0% 8.5% 7.8% 7.2% 6.7% 6.5%
50% 24.6% 19.1% 15.6% 13.5% 12.1% 11.0% 10.2% 9.5% 9.0% 8.5% 7.8% 7.2% 6.7% 6.5%
52% 24.6% 19.0% 15.5% 13.5% 12.0% 11.0% 10.2% 9.5% 9.0% 8.5% 7.8% 7.2% 6.7% 6.5%
54% 24.5% 19.0% 15.5% 13.4% 12.0% 11.0% 10.2% 9.5% 9.0% 8.5% 7.8% 7.2% 6.7% 6.4%
56% 24.4% 18.9% 15.4% 13.4% 12.0% 10.9% 10.1% 9.5% 8.9% 8.5% 7.7% 7.1% 6.7% 6.4%
58% 24.3% 18.8% 15.4% 13.3% 11.9% 10.9% 10.1% 9.4% 8.9% 8.4% 7.7% 7.1% 6.6% 6.4%
60% 24.1% 18.7% 15.2% 13.2% 11.8% 10.8% 10.0% 9.3% 8.8% 8.3% 7.6% 7.1% 6.6% 6.3%
62% 23.9% 18.5% 15.1% 13.1% 11.7% 10.7% 9.9% 9.2% 8.7% 8.3% 7.6% 7.0% 6.5% 6.3%
64% 23.6% 18.3% 14.9% 12.9% 11.6% 10.6% 9.8% 9.1% 8.6% 8.2% 7.5% 6.9% 6.5% 6.2%
66% 23.3% 18.1% 14.7% 12.8% 11.4% 10.4% 9.6% 9.0% 8.5% 8.1% 7.4% 6.8% 6.4% 6.1%
68% 22.9% 17.8% 14.5% 12.6% 11.2% 10.3% 9.5% 8.9% 8.4% 7.9% 7.3% 6.7% 6.3% 6.0%
70% 22.5% 17.5% 14.3% 12.3% 11.0% 10.1% 9.3% 8.7% 8.2% 7.8% 7.1% 6.6% 6.2% 5.9%
72% 22.1% 17.1% 14.0% 12.1% 10.8% 9.9% 9.1% 8.6% 8.1% 7.7% 7.0% 6.5% 6.0% 5.8%
74% 21.6% 16.7% 13.6% 11.8% 10.6% 9.7% 8.9% 8.4% 7.9% 7.5% 6.8% 6.3% 5.9% 5.7%
76% 21.0% 16.3% 13.3% 11.5% 10.3% 9.4% 8.7% 8.1% 7.7% 7.3% 6.6% 6.2% 5.8% 5.5%
78% 20.4% 15.8% 12.9% 11.2% 10.0% 9.1% 8.4% 7.9% 7.4% 7.1% 6.4% 6.0% 5.6% 5.4%
80% 19.7% 15.2% 12.4% 10.8% 9.6% 8.8% 8.1% 7.6% 7.2% 6.8% 6.2% 5.8% 5.4% 5.2%
82% 18.9% 14.6% 12.0% 10.4% 9.3% 8.5% 7.8% 7.3% 6.9% 6.5% 6.0% 5.5% 5.2% 5.0%
84% 18.0% 14.0% 11.4% 9.9% 8.8% 8.1% 7.5% 7.0% 6.6% 6.2% 5.7% 5.3% 4.9% 4.7%
86% 17.1% 13.2% 10.8% 9.3% 8.4% 7.6% 7.1% 6.6% 6.2% 5.9% 5.4% 5.0% 4.7% 4.5%
88% 16.0% 12.4% 10.1% 8.8% 7.8% 7.1% 6.6% 6.2% 5.8% 5.5% 5.1% 4.7% 4.4% 4.2%
90% 14.8% 11.4% 9.3% 8.1% 7.2% 6.6% 6.1% 5.7% 5.4% 5.1% 4.7% 4.3% 4.0% 3.9%
92% 13.3% 10.3% 8.4% 7.3% 6.5% 6.0% 5.5% 5.2% 4.9% 4.6% 4.2% 3.9% 3.7% 3.5%
94% 11.7% 9.0% 7.4% 6.4% 5.7% 5.2% 4.8% 4.5% 4.3% 4.0% 3.7% 3.4% 3.2% 3.1%
96% 9.6% 7.5% 6.1% 5.3% 4.7% 4.3% 4.0% 3.7% 3.5% 3.3% 3.0% 2.8% 2.6% 2.5%
98% 6.9% 5.3% 4.4% 3.8% 3.4% 3.1% 2.9% 2.7% 2.5% 2.4% 2.2% 2.0% 1.9% 1.8%
Varying
Sample %'s
Varying Sample Sizes

Page 25
Illustration of how to use Table 7: To estimate the percentage in the population of St. Lawrence County adults aged 18-39 who believe the County is headed in the right direction, one must first refer to Table 39 to determine the sample size and percentage of sampled adults who responded believe this to be the case. From Table 39, it is found that 32.6% of the sampled adults aged 40-59 in 2020 indicated that St. Lawrence County is headed in the right direction and the total number of respondents in this age group for this question is n = 127. Reference to Table 7 on the preceding page indicates that the appropriate margin of error would be ±11.2% (used n=125 and used p=32%). Therefore, we can be 95% confident that if all St. Lawrence County adults aged 40-59 were asked, the resulting percentage who would indicate that the County is headed in the right direction would be within ±11.2% of the 32.6% found in this sample. The interpretation of this would be that we are 95% confident that among all St. Lawrence County adults aged 40-59 the percentage who believe St. Lawrence County is headed in the right direction would be somewhere between 21.4% and 43.8%.
It should be noted that the margin of error is a measurement of random error, error due to simply the random chance of sampling; however, in survey research, it is humans who are being interviewed. When surveying humans there are other potential sources of error, sources of error in addition to random error (which is the only error encompassed by the margin of error). Response error, nonresponse error, process error, bias in sample selection, bias in question-phrasing, lack of clarity in question-phrasing, social desirability bias, acquiescence bias, and undercoverage are common sources of other-than-random error. Methods that should be, and have been employed in this St. Lawrence County study, to minimize these other sources of error are: maximum effort to select the sample randomly, piloting and testing of utilized survey questions, extensive training of all data collectors (interviewers), and application of post-stratification algorithms. Hence, when using this study data to make estimates to the entire St. Lawrence County adult population, as is the case in standard survey research practices, the margin of error will be the only error measurement cited and interpreted.
Significance Testing – Testing for Statistically Significant Relationships (Differences)
The technical discussion of statistical techniques above has focused on the statistical inference referred to as estimation – construction of confidence intervals using the margins of error described in Table 7. To take full advantage of the data collected in this study, other statistical techniques are of value. Tests for significant trends over time within St. Lawrence County, tests for differences between St. Lawrence, Jefferson, and Lewis Counties, and for significantly correlated factors with measured quality of life-related variables within St. Lawrence County are presented as well.
A comment or two regarding “statistical significance” could help readers of varying quantitative backgrounds most appropriately interpret the results of what has been statistically analyzed. Again, because the data for this Annual Survey of the St. Lawrence County Community is based on a sample of 435 adult residents, as opposed to obtaining information from every single adult resident in St. Lawrence County, there must be a method of determining whether an observed relationship or difference in the sample survey data is likely to continue to hold true if every adult resident in the region were, in fact, interviewed. To make this determination, tests of statistical significance are standard practice in evaluating sample survey data.
For example, if the sample data shows that male residents are less likely to believe that healthcare is societal responsibility than female residents (64.6% of men believe healthcare is a societal responsibility and that government should ensure that good healthcare is available to all people vs. 69.9% of women, Table 20), the researcher would want to know if this lower rate among male residents would still be present if they interviewed every St. Lawrence County adult rather than just the sample of 434 adults who were actually interviewed and provided this information. To answer this question, the researcher uses a test of statistical significance. The outcome of a test of statistical significance will be that the result is either “not statistically significant” or the result is “statistically significant.”
The meaning of “not statistically significant” is that if the sample were repeated many more times (in this case that would mean many more different groups of n=435 randomly selected local adults from the approximately 90,000 adults in St. Lawrence County), then the results of these samples would not consistently show that male residents are less likely to believe healthcare is a societal responsibility than female residents. Some samples would have males lower and some would have females lower. In this case, the researcher could not report with high levels of confidence that the male rating of societal responsibility for healthcare is statistically significantly different from the female rate. Rather, the difference found between the two genders in the one actually-selected sample of size n=435 local residents would be interpreted as small enough that it could be due simply to the random chance of sampling – not statistically significant. Again, the determination of “how far apart is far enough apart to be statistically significant?” is calculated by using sampling distributions and the margins of error described earlier. These tools allow the measurement of how far apart sample subgroups must be to be interpreted as a very unlikely difference to occur simply by random chance (if one assumes that the population values for the subgroups are, in fact, equal).
Conversely, the meaning of “statistically significant” is that if the sample were repeated many more times, then the results of these samples would consistently show that males are less likely to believe healthcare is a societal responsibility than female adults; and further, if every St. Lawrence County adult were interviewed, we are confident that the rate among male adults in the entire population of St. Lawrence would be lower than the rate among female adults. One can never be

Page 26
100% certain (or confident) that the result of a sample will indicate appropriately whether the population percentages are, in fact, different from one another or not. The interpretation of a “statistically significant” difference is that it is so large that there is a probability of less than 5% that this difference occurred simply due to the random chance of sampling (if one assumes that the population values for the subgroups are, in fact, equal) – instead, it is considered a “real” difference. In statistical vocabulary and notation, this would be represented as a p-value of less than 5% (p < 0.05).
Trend Analysis – How does one decide if St. Lawrence County has “statistically significantly” changed over time?
Whenever possible in this report, comparisons are made between the current results and the results from the previous studies. The research question that is being investigated in these comparisons is: “Has there been any statistically significant change in attitudes or behaviors among the adult residents in St. Lawrence County between 2015 and 2020?”
When interpreting the comparisons that have been provided, the reader should consider the following factors. The Center for Community Studies also completed the earlier St. Lawrence County studies. The earlier studies used sampling methodology that was very similar to that which was utilized in the present 2020 St. Lawrence County study, as well as similar post-stratification weighting procedures. However, the earlier survey instruments that were used are not exactly the same instrument that has been used in 2020. Therefore, only the questions/items that were also measured in earlier studies are available for trend analysis to compare with the current results. With the similar methodologies and weighting procedures that have been applied, it is valid to make comparisons between the studies – observe changes or trends. It should be noted one more time that the data was collected in October in 2020 opposed to the typical data collection in June when making comparisons to previous years.
How does one determine if the observed difference in rates (or, percentages) from different years of this study is large enough to be statistically significant, or so small that it is not statistically significant? The technique that is recommended in this study to determine whether a statistically significant trend has occurred in St. Lawrence County is to apply the following method that has also been recommended by the New York State Department of Health in its presentation of the Expanded Behavioral Risk Factor Surveillance System (BRFSS). The NYSDOH 2009 Expanded BRFSS (on page 12 of 151 in that report) cites the following:
“When the confidence intervals of two estimates of the same indicator from different areas (or, subgroups) do not overlap, they may be said to be statistically significantly different, i.e., these differences are unlikely related to chance and are considered true differences. If there is any value that is included in both intervals, the two estimates are not statistically significantly different.”
In other words, first the reader must identify the specific response choice of interest. For example, is one interested in only investigating a response of Excellent, or is one more interested in collapsing the two possible response choices of Excellent and Good together into a response choice group that could be referred to as At Least Good? Then, after observing the sample sizes for the years to be compared (Table 5 of this report), one may refer to Table 7 in this study to identify the correct approximate margins of error (or directly calculate these margins of error with more accuracy and precision using the ME formula shown and demonstrated earlier in this section) if estimating proportions (or, “percentages” or “rates”) for differing years. With these margins of error, two separate confidence intervals may be constructed, one for each year, and the overlap-vs.-non-overlap rule recommended above by the NYSDOH may be applied to determine whether or not the observed sample difference between years should be considered statistically significant. This technique for testing for statistical significance does include the design effect in measuring the standard error.
To illustrate a trend analysis, please consider the Availability of Good Jobs variable. Reference to Table 14 of this report shows that:
In 2015: in St. Lawrence County: n=442 participants (found in Table 5 earlier in this report), and in Table 14 p=56% responded Poor; therefore, from Table 7 the approximate margin of error is ±6.4%. The resulting confidence interval for 2015 is: 56%±6.4%, or (50%, 62%).
In 2020: in St. Lawrence County: n=433 participants, and in Table 14 p=51.9% responded Poor; therefore, from Table 7 the approximate margin of error is ±6.5%. The resulting confidence interval for 2020 is: 51.9%±6.5%, or (45%, 58%).
Since these two confidence intervals do overlap, the difference between 2015 and 2020 in St. Lawrence County (the six trend) is not considered statistically significant. In other words, based upon the sample data collected in this survey, the rate of evaluating the Availability of Good Jobs in St. Lawrence County as Poor has not changed significantly between 2015 and 2020. The 52% rate of responding Poor in 2020 is not far enough away from (below) the 56% rate found in 2015 to be a statistically significant change, this difference is very likely to occur by random chance if the satisfaction rates in the entire adult population in the county are truly the same in these two compared years.

Page 27
Regional Comparisons – How does one decide if St. Lawrence County is “statistically significantly” different from Jefferson and/or Lewis Counties?
Throughout this report, county comparison tables have been provided. These tables have been included to investigate the similarities and differences between St. Lawrence County and the two other counties in the North Country Region. A very small difference between these within-subgroup rates (or, proportions) could be small enough to quite likely occur simply due to the random chance of sampling when the real populations in each of these counties are equal – found to be not a statistically significant difference (p>0.05). Conversely, a very large difference between these proportions could be large enough to be quite unlikely to occur simply due to the random chance of sampling when the real populations in the counties are equal – found to be a statistically significant difference (p<0.05).
How does one determine if the observed difference in rates (or, percentages) when comparing subgroups is large enough to be statistically significant, or so small that it is not statistically significant? The rule that should be applied to determine statistical significance is:
1. Sample percentages in the same row and sub-table (comparing counties) not sharing the same subscript are significantly different at p<0.05.
2. Sample percentages in the same row and sub-table (comparing counties) sharing the same subscript are not significantly different at p<0.05.
All tests have been completed using the two-proportion z-test. Subsequent cell adjustment for all pairwise comparisons within a row of each innermost sub-table using the Bonferroni Multiple Comparison corrections has been completed when necessary. Tests assume equal variances. All results for all significance tests are reported in the associated cross-tabulation contingency tables using APA-style subscripts.
As an example, the county comparison table for the quality-of-life indicator Policing and Crime Control is shown below, included as part of Table 13 in the report.
This cross-tabulation table shows that in 60.5% of St. Lawrence County participants rate Policing and Crime Control as either Excellent or Good in 2020, while the rates in Jefferson County and Lewis County are 69.1% and 75.7% respectively. The subscripts for each of the Excellent or Good ratings for St. Lawrence County (b) differs from those for both Jefferson and Lewis County (both a). This indicates that the Excellent or Good rate of 60.5% in St. Lawrence County is statistically significantly different than the 69.1% in Jefferson County and the 75.7% in Lewis County. Note that the rates for Jefferson and Lewis County are not statistically significantly different. The process is appropriate whenever comparing counties within this report.
Associated Explanatory Variables – How does one decide if there is a “statistically significant” relationship?
The same process described above to determine a significant differences between counties is used to compare different demographic subgroups, with the same tests applied, and the same decision rule applied. The rule that should be applied to determine statistical significance is:
1. Sample percentages in the same row and sub-table (comparing counties) not sharing the same subscript are significantly different at p<0.05.
2. Sample percentages in the same row and sub-table (comparing counties) sharing the same subscript are not significantly different at p<0.05.
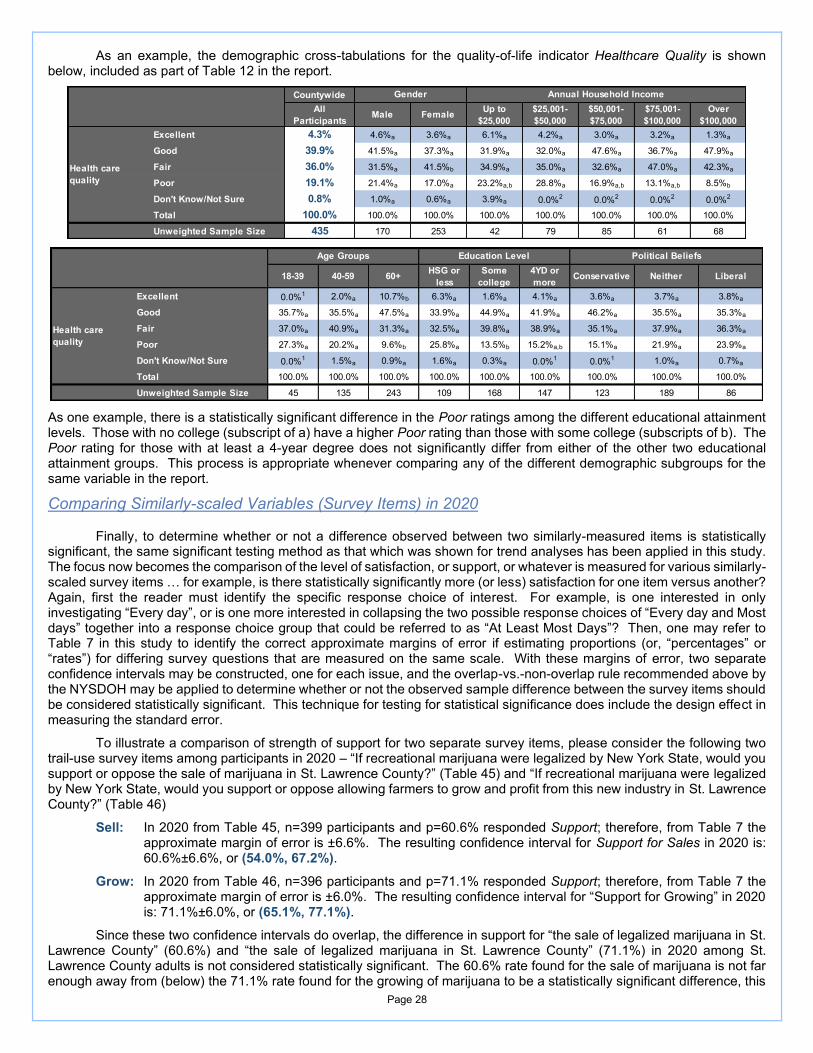
Page 28
As an example, the demographic cross-tabulations for the quality-of-life indicator Healthcare Quality is shown below, included as part of Table 12 in the report.
As one example, there is a statistically significant difference in the Poor ratings among the different educational attainment levels. Those with no college (subscript of a) have a higher Poor rating than those with some college (subscripts of b). The Poor rating for those with at least a 4-year degree does not significantly differ from either of the other two educational attainment groups. This process is appropriate whenever comparing any of the different demographic subgroups for the same variable in the report.
Comparing Similarly-scaled Variables (Survey Items) in 2020
Finally, to determine whether or not a difference observed between two similarly-measured items is statistically significant, the same significant testing method as that which was shown for trend analyses has been applied in this study. The focus now becomes the comparison of the level of satisfaction, or support, or whatever is measured for various similarly-scaled survey items … for example, is there statistically significantly more (or less) satisfaction for one item versus another? Again, first the reader must identify the specific response choice of interest. For example, is one interested in only investigating “Every day”, or is one more interested in collapsing the two possible response choices of “Every day and Most days” together into a response choice group that could be referred to as “At Least Most Days”? Then, one may refer to Table 7 in this study to identify the correct approximate margins of error if estimating proportions (or, “percentages” or “rates”) for differing survey questions that are measured on the same scale. With these margins of error, two separate confidence intervals may be constructed, one for each issue, and the overlap-vs.-non-overlap rule recommended above by the NYSDOH may be applied to determine whether or not the observed sample difference between the survey items should be considered statistically significant. This technique for testing for statistical significance does include the design effect in measuring the standard error.
To illustrate a comparison of strength of support for two separate survey items, please consider the following two trail-use survey items among participants in 2020 – “If recreational marijuana were legalized by New York State, would you support or oppose the sale of marijuana in St. Lawrence County?” (Table 45) and “If recreational marijuana were legalized by New York State, would you support or oppose allowing farmers to grow and profit from this new industry in St. Lawrence County?” (Table 46)
Sell: In 2020 from Table 45, n=399 participants and p=60.6% responded Support; therefore, from Table 7 the approximate margin of error is ±6.6%. The resulting confidence interval for Support for Sales in 2020 is: 60.6%±6.6%, or (54.0%, 67.2%).
Grow: In 2020 from Table 46, n=396 participants and p=71.1% responded Support; therefore, from Table 7 the approximate margin of error is ±6.0%. The resulting confidence interval for “Support for Growing” in 2020 is: 71.1%±6.0%, or (65.1%, 77.1%).
Since these two confidence intervals do overlap, the difference in support for “the sale of legalized marijuana in St. Lawrence County” (60.6%) and “the sale of legalized marijuana in St. Lawrence County” (71.1%) in 2020 among St. Lawrence County adults is not considered statistically significant. The 60.6% rate found for the sale of marijuana is not far enough away from (below) the 71.1% rate found for the growing of marijuana to be a statistically significant difference, this
Countywide
All
ParticipantsMale Female
Up to
$25,000
$25,001-
$50,000
$50,001-
$75,000
$75,001-
$100,000
Over
$100,000
Excellent 4.3% 4.6%a 3.6%a 6.1%a 4.2%a 3.0%a 3.2%a 1.3%a
Good 39.9% 41.5%a 37.3%a 31.9%a 32.0%a 47.6%a 36.7%a 47.9%a
Fair 36.0% 31.5%a 41.5%b 34.9%a 35.0%a 32.6%a 47.0%a 42.3%a
Poor 19.1% 21.4%a 17.0%a 23.2%a,b 28.8%a 16.9%a,b 13.1%a,b 8.5%b
Don't Know/Not Sure 0.8% 1.0%a 0.6%a 3.9%a 0.0%2 0.0%2 0.0%2 0.0%2
Total 100.0% 100.0% 100.0% 100.0% 100.0% 100.0% 100.0% 100.0%
Unweighted Sample Size 435 170 253 42 79 85 61 68
Gender Annual Household Income
Health care
quality
18-39 40-59 60+HSG or
less
Some
college
4YD or
moreConservative Neither Liberal
Excellent 0.0%1 2.0%a 10.7%b 6.3%a 1.6%a 4.1%a 3.6%a 3.7%a 3.8%a
Good 35.7%a 35.5%a 47.5%a 33.9%a 44.9%a 41.9%a 46.2%a 35.5%a 35.3%a
Fair 37.0%a 40.9%a 31.3%a 32.5%a 39.8%a 38.9%a 35.1%a 37.9%a 36.3%a
Poor 27.3%a 20.2%a 9.6%b 25.8%a 13.5%b 15.2%a,b 15.1%a 21.9%a 23.9%a
Don't Know/Not Sure 0.0%1 1.5%a 0.9%a 1.6%a 0.3%a 0.0%1 0.0%1 1.0%a 0.7%a
Total 100.0% 100.0% 100.0% 100.0% 100.0% 100.0% 100.0% 100.0% 100.0%
Unweighted Sample Size 45 135 243 109 168 147 123 189 86
Age Groups Education Level Political Beliefs
Health care
quality

Page 29
10.5% difference in support is not tremendously unlikely to occur by random chance if the support rates in the entire St. Lawrence County adult population are truly the same for these two compared similarly-scaled types of potential marijuana policies.
Finally, the preceding comments regarding statistically significant differences between subgroups are comments addressing statistical significance … which, of course, is not one-and-the-same as practical significance. The reader should be reminded that statistical significance addresses the concept of probability, as follows – “is this difference likely to occur in a sample of size n ≈ 500 (or, even smaller, at times) if there is no difference in the entire sampled population? Could the result simply be due to chance?” Alternatively, practical significance is an interpretation that is left to the subject area expert, since practical significance addresses the concept of usefulness, as follows – “is this result useful in the real world?” A difference identified in a sample may be statistically significant without being practically significant; however, a difference identified in a sample may not be practically significant without being statistically significant.
Please direct any questions regarding margin of error, confidence intervals, other sources of sampling error, tests of statistical significance, and practical significance to the professional staff at the Center for Community Studies.

Page 30
Section 3.1 – Quality of Life Issues in St. Lawrence County – Detailed Investigation of 2020 Results
Table 8 shows the detailed results for all seven quality-of-life indicators recorded in 2020. There are a total of 21 quality-of-life indicators that are longitudinally tracked in the county with certain indicators studied every year and others only studied every-other year. The dark-blue-shaded number in each row is the largest result found for each survey question, providing an easy method to determine whether a quality-of-life indicator is most commonly perceived currently as excellent, good, fair, or poor.
Table 8 – SUMMARY – Quality of Life Issues in St. Lawrence County – Year 2020
The following graph highlights all seven of the studied quality-of-life indicators in 2020, providing the ability for one to observe the most positively and most negatively perceived community aspects – take a current snapshot of opinions/satisfactions. The community indicators are sorted from top to bottom of the graph from the most to the least positively perceived by residents.
Excellent Good Fair PoorDon't
Know
Quality of the Environment 22% 49% 24% 5% 0%
Healthcare Quality 4% 40% 36% 19% 1%
Policing and Crime Control 13% 47% 31% 8% 1%
Availability of Good Jobs 1% 12% 34% 52% 2%
Quality of K-12 Education 12% 48% 27% 6% 8%
Overall State of the Local Economy 3% 13% 43% 40% 1%
Overall Quality of Life in the Area 11% 44% 34% 10% 0%

Page 31
Next, each of these seven studied indicators is presented as a motion picture – how have attitudes changed over time in St. Lawrence County? The bolded, and dark-cell-shaded number in each row of Table 9 is the largest percentage responding Excellent or Good found throughout the studied six years for each survey question. Similarly, the bolded, and dark-cell-shaded number in each row of Table 10 is the largest percentage responding Poor found throughout the twenty-one years of study.
Table 9 – Trends in Quality-of-Life Issues in St. Lawrence County (2000-2020) - % Indicating Excellent or Good
Table 10 – Trends in Quality-of-Life Issues in St. Lawrence County (2000-2020) - % Indicating Poor
Tables 11-17, shown on the following pages, provide the greatest level of detail in results in 2020 for the seven investigated quality-of-life indicators. In these seven tables (pages), the result for each of the quality-of-life indicators is shown, including all possible responses to each survey question in 2020. A trend analysis is also completed for each of the quality-of-life indicators, comparing to results from earlier years of study in the county. Additionally, results for similar studies completed in 2020 in each of Jefferson County and Lewis County are also shown for regional comparison. Finally, cross-tabulations by six key demographic factors (Gender, Age, Education, Political Ideology, and Annual Household Income) have been completed using the 2020 St. Lawrence County data for each survey question. Inspection of the results after cross-tabbing by any of these five demographic factors allows the reader to better understand factors that may be significantly associated with perceptions of quality-of-life characteristics of the county. A similar reporting design, or approach, will be utilized throughout the remainder of this report for every individual survey question included in the survey instrument.
2015 2016 2017 2018 2019 2020
Quality of the Environment 73% 67% 70% 71% 76% 71%
Healthcare Quality 58% 56% 49% 50% 55% 44%
Policing and Crime Control 66% 53% 65% 65% - 60%
Availability of Good Jobs 10% 12% 15% 14% 16% 13%
Quality of K-12 Education 65% 67% 72% 69% 71% 60%
Overall State of the Local Economy 19% 20% 21% 16% 22% 16%
Overall Quality of Life in the Area 61% 59% 60% 63% 70% 55%
2015 2016 2017 2018 2019 2020
Quality of the Environment 6% 7% 9% 7% 8% 5%
Healthcare Quality 11% 12% 15% 19% 13% 19%
Policing and Crime Control 6% 14% 10% 13% - 8%
Availability of Good Jobs 56% 62% 58% 52% 42% 52%
Quality of K-12 Education 4% 6% 8% 6% 7% 6%
Overall State of the Local Economy 39% 42% 35% 42% 39% 40%
Overall Quality of Life in the Area 9% 8% 9% 7% 8% 10%

Page 32
Table 11 – Quality of the Environment
2020 St. Lawrence County Results: Trend Analysis - Graphical Presentation:
Trend Analysis:
Northern New York Regional Comparison:
St. Lawrence County Cross-tabulations (2020):
Unweighted
Frequency
Weighted
Percentage
Excellent 104 22.3%
Good 229 49.2%
Fair 89 23.6%
Poor 12 4.7%
Don't Know/Not Sure 1 0.2%
Totals 435 100.0%
Quality of the
environment
St. Lawrence Jefferson Lewis
Excellent 22.3% 24.3% 39.8%
Good 49.2% 47.4% 46.0%
"Excellent or Good" 71.5%a 71.7%a 85.9%b
Fair 23.6%a 25.4%a 12.5%b
Poor 4.7%b 2.6%a,b 0.9%a
Don't Know/Not Sure 0.2%a 0.3%a 0.7%a
Totals: 100.0% 100.0% 100.0%
Unweighted n: 435 585 474
County
Quality of the
environment
Countywide
All
ParticipantsMale Female
Up to
$25,000
$25,001-
$50,000
$50,001-
$75,000
$75,001-
$100,000
Over
$100,000
Excellent 22.3% 24.8%a 19.6%a 18.0%a 14.9%a 31.8%a 20.8%a 28.5%a
Good 49.2% 51.9%a 47.8%a 40.3%a 51.4%a 48.9%a 53.9%a 51.6%a
Fair 23.6% 15.6%a 30.5%b 38.1%a 24.7%a,b 19.3%a,b 24.1%a,b 14.2%b
Poor 4.7% 7.2%a 2.0%b 1.6%a 9.0%a 0.0%2 1.3%a 5.7%a
Don't Know/Not Sure 0.2% 0.5%a 0.0%2 2.0%a 0.0%2 0.0%2 0.0%2 0.0%2
Total 100.0% 100.0% 100.0% 100.0% 100.0% 100.0% 100.0% 100.0%
Unweighted Sample Size 435 170 253 42 79 85 61 68
Gender Annual Household Income
Quality of the
environment
18-39 40-59 60+HSG or
less
Some
college
4YD or
moreConservative Neither Liberal
Excellent 21.7%a 18.9%a 26.2%a 24.9%a 15.6%a 27.8%a 28.6%a 19.1%a 16.5%a
Good 41.5%a 57.0%b 50.9%a,b 40.8%a 57.8%b 54.4%a,b 49.9%a 48.2%a 51.9%a
Fair 26.0%a 23.0%a 20.0%a 27.7%a 22.8%a 14.7%a 15.7%a 30.2%b 19.2%a,b
Poor 10.8%a 1.1%b 2.0%b 5.9%a 3.9%a 3.1%a 5.8%a,b 1.9%a 12.3%b
Don't Know/Not Sure 0.0%1 0.0%1 0.8%a 0.6%a 0.0%1 0.0%1 0.0%1 0.5%a 0.0%1
Total 100.0% 100.0% 100.0% 100.0% 100.0% 100.0% 100.0% 100.0% 100.0%
Unweighted Sample Size 45 135 243 109 168 147 123 189 86
Age Groups Education Level Political Beliefs
Quality of the
environment

Page 33
Table 12 – Healthcare Quality
2020 St. Lawrence County Results: Trend Analysis - Graphical Presentation:
Trend Analysis:
Northern New York Regional Comparison:
St. Lawrence County Cross-tabulations (2020):
Unweighted
Frequency
Weighted
Percentage
Excellent 28 4.3%
Good 191 39.9%
Fair 152 36.0%
Poor 61 19.1%
Don't Know/Not Sure 3 0.8%
Totals 435 100.0%
Healthcare
quality
2015 2016 2017 2018 2019 2020
Excellent 14% 11% 8% 13% 8% 4%
Good 45% 46% 41% 37% 46% 40%
Fair 29% 31% 35% 30% 30% 36%
Poor 11% 12% 15% 19% 13% 19%
Don't Know 2% 1% 1% 0% 2% 1%
St. Lawrence Jefferson Lewis
Excellent 4.3% 15.0% 12.6%
Good 39.9% 43.4% 52.7%
"Excellent or Good" 44.2%b 58.4%a 65.4%a
Fair 36.0%a 33.0%a 22.4%b
Poor 19.1%b 7.7%a 10.7%a
Don't Know/Not Sure 0.8%a 0.9%a 1.6%a
Totals: 100.0% 100.0% 100.0%
Unweighted n: 435 584 474
County
Healthcare
quality
Countywide
All
ParticipantsMale Female
Up to
$25,000
$25,001-
$50,000
$50,001-
$75,000
$75,001-
$100,000
Over
$100,000
Excellent 4.3% 4.6%a 3.6%a 6.1%a 4.2%a 3.0%a 3.2%a 1.3%a
Good 39.9% 41.5%a 37.3%a 31.9%a 32.0%a 47.6%a 36.7%a 47.9%a
Fair 36.0% 31.5%a 41.5%b 34.9%a 35.0%a 32.6%a 47.0%a 42.3%a
Poor 19.1% 21.4%a 17.0%a 23.2%a,b 28.8%a 16.9%a,b 13.1%a,b 8.5%b
Don't Know/Not Sure 0.8% 1.0%a 0.6%a 3.9%a 0.0%2 0.0%2 0.0%2 0.0%2
Total 100.0% 100.0% 100.0% 100.0% 100.0% 100.0% 100.0% 100.0%
Unweighted Sample Size 435 170 253 42 79 85 61 68
Gender Annual Household Income
Health care
quality
18-39 40-59 60+HSG or
less
Some
college
4YD or
moreConservative Neither Liberal
Excellent 0.0%1 2.0%a 10.7%b 6.3%a 1.6%a 4.1%a 3.6%a 3.7%a 3.8%a
Good 35.7%a 35.5%a 47.5%a 33.9%a 44.9%a 41.9%a 46.2%a 35.5%a 35.3%a
Fair 37.0%a 40.9%a 31.3%a 32.5%a 39.8%a 38.9%a 35.1%a 37.9%a 36.3%a
Poor 27.3%a 20.2%a 9.6%b 25.8%a 13.5%b 15.2%a,b 15.1%a 21.9%a 23.9%a
Don't Know/Not Sure 0.0%1 1.5%a 0.9%a 1.6%a 0.3%a 0.0%1 0.0%1 1.0%a 0.7%a
Total 100.0% 100.0% 100.0% 100.0% 100.0% 100.0% 100.0% 100.0% 100.0%
Unweighted Sample Size 45 135 243 109 168 147 123 189 86
Age Groups Education Level Political Beliefs
Health care
quality

Page 34
Table 13 – Policing and Crime Control
2020 St. Lawrence County Results: Trend Analysis - Graphical Presentation:
Trend Analysis:
Northern New York Regional Comparison:
St. Lawrence County Cross-tabulations (2020):
Unweighted
Frequency
Weighted
Percentage
Excellent 69 13.3%
Good 232 47.2%
Fair 105 31.3%
Poor 23 7.6%
Don't Know/Not Sure 5 0.6%
Totals 434 100.0%
Policing and
crime control
2015 2016 2017 2018 2019 2020
Excellent 16% 11% 18% 19% - 13%
Good 50% 43% 46% 46% - 47%
Fair 28% 33% 24% 22% - 31%
Poor 6% 14% 10% 13% - 8%
Don't Know 0% 0% 1% 0% - 1%
St. Lawrence Jefferson Lewis
Excellent 13.3% 26.3% 23.4%
Good 47.2% 42.8% 52.4%
"Excellent or Good" 60.5%b 69.1%a 75.7%a
Fair 31.3%b 21.5%a 17.9%a
Poor 7.6%a 5.5%a 5.2%a
Don't Know/Not Sure 0.6%b 3.9%a 1.2%b
Totals: 100.0% 100.0% 100.0%
Unweighted n: 434 584 472
County
Policing and
crime control
Countywide
All
ParticipantsMale Female
Up to
$25,000
$25,001-
$50,000
$50,001-
$75,000
$75,001-
$100,000
Over
$100,000
Excellent 13.3% 14.6%a 11.8%a 10.0%a 19.5%a 15.0%a 12.9%a 11.8%a
Good 47.2% 47.3%a 46.9%a 39.9%a 43.1%a 39.1%a 50.4%a 60.0%a
Fair 31.3% 28.4%a 35.0%a 33.2%a 32.7%a 32.9%a 34.8%a 21.7%a
Poor 7.6% 9.4%a 5.3%a 16.3%a 3.3%a 12.1%a 1.9%a 6.2%a
Don't Know/Not Sure 0.6% 0.4%a 1.0%a 0.7%a 1.3%a 0.9%a 0.0%2 0.4%a
Total 100.0% 100.0% 100.0% 100.0% 100.0% 100.0% 100.0% 100.0%
Unweighted Sample Size 434 170 252 42 78 85 61 68
Gender Annual Household Income
Policing and
crime control
18-39 40-59 60+HSG or
less
Some
college
4YD or
moreConservative Neither Liberal
Excellent 11.1%a 10.6%a 18.1%a 10.4%a 15.0%a 15.7%a 18.9%a 10.4%a 8.4%a
Good 31.3%a 52.1%b 58.3%b 45.6%a 45.3%a 53.8%a 49.9%a 46.4%a 43.5%a
Fair 45.5%a 30.9%b 18.1%c 34.5%a 33.5%a 22.4%a 24.5%a 34.0%a 37.7%a
Poor 12.1%a 5.8%a,b 4.1%b 9.0%a 5.6%a 7.0%a 5.8%a 9.0%a 8.7%a
Don't Know/Not Sure 0.0%1 0.5%a 1.5%a 0.5%a 0.5%a 1.1%a 0.8%a 0.2%a 1.7%a
Total 100.0% 100.0% 100.0% 100.0% 100.0% 100.0% 100.0% 100.0% 100.0%
Unweighted Sample Size 45 134 243 109 167 147 123 189 85
Age Groups Education Level Political Beliefs
Policing and
crime control

Page 35
Table 14 – Availability of Good Jobs
2020 St. Lawrence County Results: Trend Analysis - Graphical Presentation:
Trend Analysis:
Northern New York Regional Comparison:
St. Lawrence County Cross-tabulations (2020):
Unweighted
Frequency
Weighted
Percentage
Excellent 4 0.9%
Good 46 11.7%
Fair 151 33.6%
Poor 219 51.9%
Don't Know/Not Sure 13 1.9%
Totals 433 100.0%
Availability of
good jobs
2015 2016 2017 2018 2019 2020
Excellent 1% 4% 3% 2% 2% 1%
Good 9% 8% 12% 13% 14% 12%
Fair 32% 26% 27% 33% 41% 34%
Poor 56% 62% 58% 52% 42% 52%
Don't Know 2% 1% 1% 1% 1% 2%
St. Lawrence Jefferson Lewis
Excellent 0.9% 8.9% 3.0%
Good 11.7% 22.8% 22.2%
"Excellent or Good" 12.6%b 31.7%a 25.1%a
Fair 33.6%a 35.2%a 44.0%b
Poor 51.9%b 28.2%a 27.4%a
Don't Know/Not Sure 1.9%b 4.9%a 3.5%a,b
Totals: 100.0% 100.0% 100.0%
Unweighted n: 433 583 474
County
Availability of
good jobs
Countywide
All
ParticipantsMale Female
Up to
$25,000
$25,001-
$50,000
$50,001-
$75,000
$75,001-
$100,000
Over
$100,000
Excellent 0.9% 1.7%a 0.2%a 2.6%a 0.0%2 0.3%a 0.0%2 0.0%2
Good 11.7% 11.4%a 12.6%a 5.5%a 10.3%a 5.5%a 9.9%a 15.3%a
Fair 33.6% 30.9%a 34.9%a 29.4%a 37.4%a 36.7%a 28.0%a 35.4%a
Poor 51.9% 54.4%a 50.1%a 61.2%a 48.6%a 57.6%a 59.2%a 49.3%a
Don't Know/Not Sure 1.9% 1.6%a 2.2%a 1.2%a 3.6%a 0.0%2 2.9%a 0.0%2
Total 100.0% 100.0% 100.0% 100.0% 100.0% 100.0% 100.0% 100.0%
Unweighted Sample Size 433 169 252 41 79 85 61 68
Gender Annual Household Income
Availability of
good jobs
18-39 40-59 60+HSG or
less
Some
college
4YD or
moreConservative Neither Liberal
Excellent 0.0%1 1.5%a 1.3%a 1.9%a 0.0%1 0.5%a 1.8%a 0.6%a 0.4%a
Good 17.8%a 6.2%b 12.3%a,b 9.3%a 15.3%a 12.0%a 19.6%a 8.2%b 8.8%a,b
Fair 31.5%a 34.1%a 33.0%a 30.6%a 31.9%a 40.1%a 29.6%a 31.5%a 44.1%a
Poor 50.6%a 57.3%a 48.5%a 55.9%a 51.5%a 45.3%a 45.3%a 59.2%b 45.4%a,b
Don't Know/Not Sure 0.0%1 1.0%a 4.9%b 2.3%a 1.4%a 2.0%a 3.7%a 0.3%a 1.3%a
Total 100.0% 100.0% 100.0% 100.0% 100.0% 100.0% 100.0% 100.0% 100.0%
Unweighted Sample Size 44 135 242 109 167 146 123 189 84
Age Groups Education Level Political Beliefs
Availability of
good jobs

Page 36
Table 15 – Quality of K-12 Education
2020 St. Lawrence County Results: Trend Analysis - Graphical Presentation:
Trend Analysis:
Northern New York Regional Comparison:
St. Lawrence County Cross-tabulations (2020):
Unweighted
Frequency
Weighted
Percentage
Excellent 56 11.9%
Good 222 47.7%
Fair 99 27.1%
Poor 27 5.7%
Don't Know/Not Sure 30 7.7%
Totals 434 100.0%
Quality of K-12
education
2015 2016 2017 2018 2019 2020
Excellent 13% 18% 20% 18% 13% 12%
Good 52% 49% 52% 51% 59% 48%
Fair 24% 21% 18% 19% 17% 27%
Poor 4% 6% 8% 6% 7% 6%
Don't Know 6% 6% 2% 6% 5% 8%
St. Lawrence Jefferson Lewis
Excellent 11.9% 18.1% 31.9%
Good 47.7% 40.6% 46.4%
"Excellent or Good" 59.5%a 58.7%a 78.3%b
Fair 27.1%a 20.9%a 14.1%b
Poor 5.7%a,b 9.0%a 3.3%b
Don't Know/Not Sure 7.7%a,b 11.5%a 4.4%b
Totals: 100.0% 100.0% 100.0%
Unweighted n: 434 586 474
County
Quality of K-12
education
Countywide
All
ParticipantsMale Female
Up to
$25,000
$25,001-
$50,000
$50,001-
$75,000
$75,001-
$100,000
Over
$100,000
Excellent 11.9% 15.0%a 8.9%a 9.9%a 5.2%a 17.7%a 17.7%a 13.3%a
Good 47.7% 45.8%a 49.9%a 46.8%a 47.7%a 41.5%a 55.3%a 41.2%a
Fair 27.1% 27.2%a 26.1%a 33.3%a 29.6%a 32.1%a 18.4%a 31.5%a
Poor 5.7% 4.5%a 6.9%a 10.0%a 3.6%a 6.4%a 3.2%a 1.2%a
Don't Know/Not Sure 7.7% 7.5%a 8.2%a 0.0%2 13.8%a 2.3%b 5.4%a,b 12.8%a,b
Total 100.0% 100.0% 100.0% 100.0% 100.0% 100.0% 100.0% 100.0%
Unweighted Sample Size 434 170 252 42 78 85 61 68
Gender Annual Household Income
Quality of K-12
education
18-39 40-59 60+HSG or
less
Some
college
4YD or
moreConservative Neither Liberal
Excellent 13.2%a 12.1%a 10.5%a 9.4%a 11.1%a 18.6%a 16.7%a 10.5%a 8.7%a
Good 46.0%a 42.9%a 55.0%a 46.7%a 50.3%a 45.4%a 42.2%a 49.1%a 49.7%a
Fair 27.8%a 31.3%a 20.5%a 30.4%a 23.6%a 24.0%a 17.9%a 31.3%b 33.0%a,b
Poor 4.9%a 6.2%a 5.9%a 3.6%a 7.7%a 7.3%a 8.5%a 4.6%a 5.8%a
Don't Know/Not Sure 8.1%a 7.4%a 8.2%a 9.9%a 7.2%a 4.8%a 14.8%a 4.5%b 2.8%b
Total 100.0% 100.0% 100.0% 100.0% 100.0% 100.0% 100.0% 100.0% 100.0%
Unweighted Sample Size 45 135 242 109 167 147 123 188 86
Age Groups Education Level Political Beliefs
Quality of K-12
education

Page 37
Table 16 – Overall State of the Local Economy
2020 St. Lawrence County Results: Trend Analysis - Graphical Presentation:
Trend Analysis:
Northern New York Regional Comparison:
St. Lawrence County Cross-tabulations (2020):
Unweighted
Frequency
Weighted
Percentage
Excellent 7 2.5%
Good 64 13.3%
Fair 189 42.8%
Poor 168 40.1%
Don't Know/Not Sure 6 1.3%
Totals 434 100.0%
The overall state
of the local
economy
2015 2016 2017 2018 2019 2020
Excellent 1% 1% 3% 2% 2% 3%
Good 17% 18% 18% 14% 20% 13%
Fair 41% 37% 42% 41% 36% 43%
Poor 39% 42% 35% 42% 39% 40%
Don't Know 2% 1% 1% 1% 4% 1%
St. Lawrence Jefferson Lewis
Excellent 2.5% 5.5% 2.7%
Good 13.3% 29.1% 34.1%
"Excellent or Good" 15.8%b 34.6%a 36.7%a
Fair 42.8%a 43.0%a 42.6%a
Poor 40.1%b 17.6%a 18.4%a
Don't Know/Not Sure 1.3%b 4.9%a 2.3%a,b
Totals: 100.0% 100.0% 100.0%
Unweighted n: 434 582 474
County
The overall
state of the
local economy
Countywide
All
ParticipantsMale Female
Up to
$25,000
$25,001-
$50,000
$50,001-
$75,000
$75,001-
$100,000
Over
$100,000
Excellent 2.5% 4.5%a 0.7%b 0.0%2 1.6%a 0.0%2 4.7%a 0.8%a
Good 13.3% 10.9%a 15.5%a 3.8%a 20.3%a 14.5%a 5.2%a 5.4%a
Fair 42.8% 44.7%a 39.4%a 34.6%a 39.1%a,b 35.7%a 62.9%b 50.1%a,b
Poor 40.1% 39.9%a 41.8%a 59.2%a 39.0%a,b 49.9%a,b 26.2%b 37.7%a,b
Don't Know/Not Sure 1.3% 0.0%2 2.6%a 2.4%a 0.0%2 0.0%2 1.0%a 6.0%a
Total 100.0% 100.0% 100.0% 100.0% 100.0% 100.0% 100.0% 100.0%
Unweighted Sample Size 434 170 252 42 79 85 61 68
Gender Annual Household Income
The overall state
of the local
economy
18-39 40-59 60+HSG or
less
Some
college
4YD or
moreConservative Neither Liberal
Excellent 5.0%a 1.8%a 1.1%a 4.3%a 0.0%1 3.6%a 7.9%a 0.3%b 0.0%1
Good 11.2%a 10.8%a 17.8%a 11.2%a 15.2%a 13.7%a 13.1%a,b 8.9%a 22.5%b
Fair 36.7%a 46.9%a 42.5%a 42.1%a 37.9%a 49.8%a 45.9%a 42.0%a 38.6%a
Poor 45.0%a 40.2%a 37.1%a 42.0%a 44.2%a 32.0%a 29.4%a 48.8%b 38.1%a,b
Don't Know/Not Sure 2.2%a 0.3%a 1.5%a 0.4%a 2.7%a 0.8%a 3.7%a 0.0%1 0.8%a
Total 100.0% 100.0% 100.0% 100.0% 100.0% 100.0% 100.0% 100.0% 100.0%
Unweighted Sample Size 45 135 242 109 168 146 123 188 86
Age Groups Education Level Political Beliefs
The overall state
of the local
economy

Page 38
Table 17 – Overall Quality of Life in the Area
2020 St. Lawrence County Results: Trend Analysis - Graphical Presentation:
Trend Analysis:
Northern New York Regional Comparison:
St. Lawrence County Cross-tabulations (2020):
Unweighted
Frequency
Weighted
Percentage
Excellent 49 10.8%
Good 214 44.2%
Fair 135 34.3%
Poor 33 10.3%
Don't Know/Not Sure 2 0.5%
Totals 433 100.0%
The overall
quality of life
in the area
2015 2016 2017 2018 2019 2020
Excellent 15% 13% 12% 16% 12% 11%
Good 46% 46% 48% 48% 57% 44%
Fair 29% 32% 30% 27% 22% 34%
Poor 9% 8% 9% 7% 8% 10%
Don't Know 0% 0% 1% 2% 0% 0%
St. Lawrence Jefferson Lewis
Excellent 10.8% 18.3% 22.9%
Good 44.2% 48.2% 55.0%
"Excellent or Good" 55.0%c 66.6%a 77.9%b
Fair 34.3%c 24.0%a 16.8%b
Poor 10.3%b 8.8%a,b 5.4%a
Don't Know/Not Sure 0.5%a 0.7%a 0.0%1
Totals: 100.0% 100.0% 100.0%
Unweighted n: 433 584 473
County
The overall
quality of life in
the area
Countywide
All
ParticipantsMale Female
Up to
$25,000
$25,001-
$50,000
$50,001-
$75,000
$75,001-
$100,000
Over
$100,000
Excellent 10.8% 14.2%a 7.0%b 5.5%a 6.8%a 8.2%a 9.5%a 9.6%a
Good 44.2% 41.4%a 48.1%a 30.3%a 46.6%a 39.2%a 51.6%a 56.2%a
Fair 34.3% 33.7%a 34.4%a 33.4%a 34.7%a 48.0%a 37.0%a 29.4%a
Poor 10.3% 10.7%a 9.6%a 30.9%a 11.9%a,b 4.2%b 1.9%b,c 4.8%b,d
Don't Know/Not Sure 0.5% 0.0%2 0.9%a 0.0%2 0.0%2 0.5%a 0.0%2 0.0%2
Total 100.0% 100.0% 100.0% 100.0% 100.0% 100.0% 100.0% 100.0%
Unweighted Sample Size 433 170 251 42 79 85 61 67
Gender Annual Household Income
The overall
quality of life in
the area
18-39 40-59 60+HSG or
less
Some
college
4YD or
moreConservative Neither Liberal
Excellent 7.2%a 12.0%a 12.8%a 13.2%a 8.6%a 8.6%a 17.0%a 6.7%b 10.0%a,b
Good 43.2%a,b 37.1%a 54.3%b 40.5%a 46.1%a 50.5%a 47.0%a 41.9%a 45.5%a
Fair 36.9%a 37.5%a 27.4%a 31.5%a 34.9%a 38.7%a 30.9%a 37.9%a 37.4%a
Poor 12.7%a 12.2%a 5.2%a 13.9%a 10.1%a,b 2.2%b 4.7%a 13.4%b 7.1%a,b
Don't Know/Not Sure 0.0%1 1.1%a 0.3%a 0.9%a 0.3%a 0.0%1 0.3%a 0.0%1 0.0%1
Total 100.0% 100.0% 100.0% 100.0% 100.0% 100.0% 100.0% 100.0% 100.0%
Unweighted Sample Size 45 134 242 109 167 146 122 188 86
Age Groups Education Level Political Beliefs
The overall
quality of life in
the area

Page 39
Section 3.2 – Personal Opinions – Issues in Our Society and Communities
Below are the eight “personal opinion” pairs of statements A and B that were provided in the interview, in the exact phrasing that they were included in the interview script. The order of the issues were randomized for each participant. The introductory script for this group of questions is provided below.
Introductory Script: “Next, we are interested in learning more about the opinions of residents of the county. For several issues I am going to read you two statements, I'll call them Statement A and Statement B, and for each I am interested in which statement you agree with, A or B, which is your personal opinion?”
Climate Change
A: All the talk about human’s role in climate change is pretty much exaggerated speculation.
B: Human contribution to climate change is pretty much a proven scientific conclusion.
Responsibility for Healthcare
A: Healthcare is a societal responsibility and government should ensure that good healthcare is available to all people.
B: Healthcare is an individual responsibility and government should stay out of it.
Presidential Approval
A: Overall, I think President Trump is good for our country.
B: Overall, I think President Trump is bad for our country.
Building a Physical Wall on the US-Mexico Border
A: To maintain and improve border security – our country should build a physical wall along the entire US-Mexico border.
B: To maintain and improve border security – our country should use other available technological methods and not build a physical wall along the entire US-Mexico border.
Same-sex Relationships
A: It is wrong for adults to be romantically involved with other adults of the same sex.
B: It is all right for adults to be romantically involved with other adults of the same sex.
Abortion
A: Choosing abortion is a woman's right, and society should protect that right.
B: Abortion is morally wrong, and society should prohibit it.
Systemic Racism and Social Injustice
A: Systemic racism and social injustice are major problems in our country that need to be addressed.
B: Systemic racism and social injustice are not major problems in our country that need to be addressed.
Gun Control and Rights
A: The Second Amendment of the US Constitution protects an individual’s right to own guns, and that should not be compromised by laws such as the NYS Safe Act.
B: Gun violence in the US is out of control and some gun regulation similar to the NYS Safe Act is necessary.
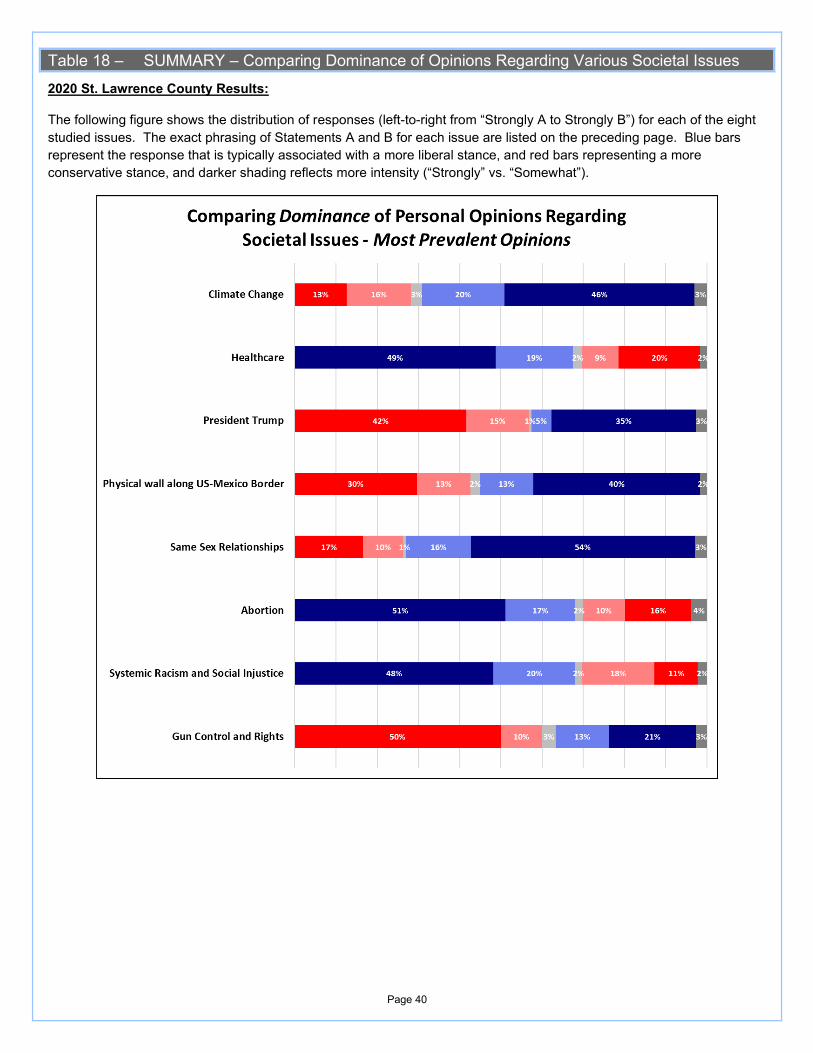
Page 40
Table 18 – SUMMARY – Comparing Dominance of Opinions Regarding Various Societal Issues
2020 St. Lawrence County Results:
The following figure shows the distribution of responses (left-to-right from “Strongly A to Strongly B”) for each of the eight
studied issues. The exact phrasing of Statements A and B for each issue are listed on the preceding page. Blue bars
represent the response that is typically associated with a more liberal stance, and red bars representing a more
conservative stance, and darker shading reflects more intensity (“Strongly” vs. “Somewhat”).

Page 41
Table 19 – Climate Change
A: All the talk about human’s role in climate change is pretty much exaggerated speculation.
B: Human contribution to climate change is pretty much a proven scientific conclusion.
2020 St. Lawrence County Results: Trend Analysis - Graphical Presentation:
Northern New York Regional Comparison:
St. Lawrence County Cross-tabulations (2020):
Unweighted
Frequency
Weighted
Percentage
Strongly A 51 12.5%
Somewhat A 62 15.7%
Both 7 2.7%
Somewhat B 81 20.0%
Strongly B 221 46.2%
Neither/Not Sure 12 3.0%
Totals 434 100.0%
Unweighted
Frequency
Weighted
Percentage
Speculation 113 28.2%
No Preference 19 5.7%
Proven Science 302 66.1%
Totals 434 100.0%
Climate Change
Climate Change
2019 2020
Strongly A 14% 13%
Somewhat A 12% 16%
Both 4% 3%
Somewhat B 20% 20%
Strongly B 48% 46%
Not Sure/Neither 2% 3%
St. Lawrence Jefferson Lewis
Speculation 28.2%a 28.7%a 33.4%a
No Preference 5.7%a 4.1%a 5.8%a
Proven Science 66.1%a 67.2%a 60.8%a
Totals: 100.0% 100.0% 100.0%
Unweighted n: 434 586 473
County
Climate Change
Countywide
All
ParticipantsMale Female
Up to
$25,000
$25,001-
$50,000
$50,001-
$75,000
$75,001-
$100,000
Over
$100,000
Speculation 28.2% 32.6%a 23.5%b 21.1%a 36.6%a 33.7%a 22.3%a 27.6%a
No Preference 5.7% 9.0%a 2.7%b 0.0%2 1.0%a 6.3%a 2.3%a 2.7%a
Proven Science 66.1% 58.4%a 73.8%b 78.9%a 62.4%a 60.0%a 75.5%a 69.7%a
Total 100.0% 100.0% 100.0% 100.0% 100.0% 100.0% 100.0% 100.0%
Unweighted Sample Size 434 169 253 42 79 85 60 68
Gender Annual Household Income
Climate Change
18-39 40-59 60+HSG or
less
Some
college
4YD or
moreConservative Neither Liberal
Speculation 23.3%a 32.9%a 27.9%a 28.6%a 31.0%a 21.7%a 46.2%a 23.8%b 4.9%c
No Preference 5.9%a 5.0%a 6.6%a 9.5%a 4.5%a,b 0.5%b 5.0%a 4.1%a 0.0%1
Proven Science 70.9%a 62.1%a 65.5%a 62.0%a 64.5%a,b 77.8%b 48.8%a 72.0%b 95.1%c
Total 100.0% 100.0% 100.0% 100.0% 100.0% 100.0% 100.0% 100.0% 100.0%
Unweighted Sample Size 45 135 242 109 167 147 123 188 86
Age Groups Education Level Political Beliefs
Climate Change

Page 42
Table 20 – Responsibility for Healthcare
A: Healthcare is a societal responsibility and government should ensure that good healthcare is available to all people.
B: Healthcare is an individual responsibility and government should stay out of it.
2020 St. Lawrence County Results: Trend Analysis - Graphical Presentation:
Northern New York Regional Comparison:
St. Lawrence County Cross-tabulations (2020):
Unweighted
Frequency
Weighted
Percentage
Strongly A 217 48.7%
Somewhat A 79 18.8%
Both 14 2.2%
Somewhat B 38 8.9%
Strongly B 79 19.8%
Neither/Not Sure 7 1.6%
Totals 434 100.0%
Unweighted
Frequency
Weighted
Percentage
Government 296 67.5%
No Preference 21 3.8%
Individual 117 28.7%
Totals 434 100.0%
Healthcare
Healthcare
2019 2020
Strongly A 47% 49%
Somewhat A 18% 19%
Both 4% 2%
Somewhat B 11% 9%
Strongly B 19% 20%
Not Sure/Neither 1% 2%
St. Lawrence Jefferson Lewis
Government 67.5%a 67.5%a 52.8%b
No Preference 3.8%a 4.6%a 2.8%a
Individual 28.7%a 27.9%a 44.5%b
Totals: 100.0% 100.0% 100.0%
Unweighted n: 434 585 474
County
Healthcare
Countywide
All
ParticipantsMale Female
Up to
$25,000
$25,001-
$50,000
$50,001-
$75,000
$75,001-
$100,000
Over
$100,000
Government 67.5% 64.6%a 69.9%a 83.3%a 64.5%a,b 68.0%a,b 64.5%a,b 50.0%b
No Preference 3.8% 4.2%a 3.6%a 5.5%a 2.2%a 1.8%a 0.0%2 3.7%a
Individual 28.7% 31.2%a 26.4%a 11.3%a 33.2%b 30.2%a,b 35.5%b 46.3%b
Total 100.0% 100.0% 100.0% 100.0% 100.0% 100.0% 100.0% 100.0%
Unweighted Sample Size 434 170 252 42 79 85 60 68
Gender Annual Household Income
Healthcare
18-39 40-59 60+HSG or
less
Some
college
4YD or
moreConservative Neither Liberal
Government 65.8%a 71.7%a 64.2%a 68.6%a 63.4%a 71.6%a 42.6%a 75.3%b 95.1%c
No Preference 0.0%1 4.2%a 7.8%a 6.2%a 2.5%a 1.6%a 6.9%a 2.2%a 2.1%a
Individual 34.2%a 24.1%a 28.1%a 25.2%a 34.0%a 26.8%a 50.5%a 22.5%b 2.8%c
Total 100.0% 100.0% 100.0% 100.0% 100.0% 100.0% 100.0% 100.0% 100.0%
Unweighted Sample Size 45 135 242 109 167 147 123 188 86
Age Groups Education Level Political Beliefs
Healthcare

Page 43
Table 21 – Presidential Approval
A: Overall, I think President Trump is good for our country.
B: Overall, I think President Trump is bad for our country.
2020 St. Lawrence County Results: Trend Analysis - Graphical Presentation:
Northern New York Regional Comparison:
St. Lawrence County Cross-tabulations (2020):
Unweighted
Frequency
Weighted
Percentage
Strongly A 160 41.6%
Somewhat A 50 15.1%
Both 5 0.7%
Somewhat B 23 4.8%
Strongly B 182 35.1%
Neither/Not Sure 9 2.6%
Totals 429 100.0%
Unweighted
Frequency
Weighted
Percentage
Good 210 56.8%
No Preference 14 3.3%
Bad 205 39.9%
Totals 429 100.0%
President Trump
President Trump
2019 2020
Strongly A 31% 42%
Somewhat A 11% 15%
Both 6% 1%
Somewhat B 11% 5%
Strongly B 37% 35%
Not Sure/Neither 3% 3%
St. Lawrence Jefferson Lewis
Good 56.8%a,b 53.5%a 64.0%b
No Preference 3.3%a 3.1%a 3.8%a
Bad 39.9%a 43.4%a 32.2%b
Totals: 100.0% 100.0% 100.0%
Unweighted n: 429 585 474
County
President
Trump
Countywide
All
ParticipantsMale Female
Up to
$25,000
$25,001-
$50,000
$50,001-
$75,000
$75,001-
$100,000
Over
$100,000
Good 56.8% 58.7%a 54.2%a 57.1%a 61.4%a 49.0%a 42.4%a 65.1%a
No Preference 3.3% 3.1%a 3.7%a 0.0%2 3.6%a 5.0%a 5.8%a 1.1%a
Bad 39.9% 38.3%a 42.0%a 42.9%a 35.1%a 46.0%a 51.8%a 33.8%a
Total 100.0% 100.0% 100.0% 100.0% 100.0% 100.0% 100.0% 100.0%
Unweighted Sample Size 429 168 249 42 78 84 61 66
Gender Annual Household Income
President Trump
18-39 40-59 60+HSG or
less
Some
college
4YD or
moreConservative Neither Liberal
Good 62.5%a 54.0%a 52.8%a 63.7%a 57.2%a 39.6%b 85.6%a 49.6%b 7.9%c
No Preference 3.5%a 3.3%a 3.3%a 2.8%a 4.3%a 3.1%a 2.0%a 5.0%a 0.0%1
Bad 34.0%a 42.6%a 43.9%a 33.5%a 38.5%a 57.3%b 12.4%a 45.4%b 92.1%c
Total 100.0% 100.0% 100.0% 100.0% 100.0% 100.0% 100.0% 100.0% 100.0%
Unweighted Sample Size 44 132 241 108 164 146 123 185 85
Age Groups Education Level Political Beliefs
President Trump

Page 44
Table 22 – Building a Physical Wall on US-Mexico Border
A: To maintain and improve border security – our country should build a physical wall along the entire US-Mexico border.
B: To maintain and improve border security – our country should use other available technological methods and not build a physical wall along the entire US-Mexico border.
2020 St. Lawrence County Results: Trend Analysis - Graphical Presentation:
Northern New York Regional Comparison:
St. Lawrence County Cross-tabulations (2020):
Unweighted
Frequency
Weighted
Percentage
Strongly A 119 29.6%
Somewhat A 47 13.0%
Both 9 2.3%
Somewhat B 52 13.0%
Strongly B 192 40.4%
Neither/Not Sure 8 1.7%
Totals 427 100.0%
Unweighted
Frequency
Weighted
Percentage
Build a Wall 166 42.6%
No Preference 17 4.0%
Do Not Build a Wall 244 53.4%
Totals 427 100.0%
Physical wall
along US-Mexico
Border
Physical wall
along US-Mexico
Border
2019 2020
Strongly A 26% 30%
Somewhat A 10% 13%
Both 5% 2%
Somewhat B 10% 13%
Strongly B 47% 40%
Not Sure/Neither 2% 2%
St. Lawrence Jefferson Lewis
Build a Wall 42.6%b 32.5%a 49.4%b
No Preference 4.0%a 4.4%a 5.0%a
Do Not Build a Wall 53.4%b 63.1%a 45.6%b
Totals: 100.0% 100.0% 100.0%
Unweighted n: 427 582 473
County
Physical wall
along US-
Mexico Border
Countywide
All
ParticipantsMale Female
Up to
$25,000
$25,001-
$50,000
$50,001-
$75,000
$75,001-
$100,000
Over
$100,000
Build a Wall 42.6% 47.8%a 36.1%b 38.1%a 41.9%a 43.2%a 22.7%a 47.0%a
No Preference 4.0% 4.9%a 3.2%a 7.2%a 2.1%a 0.6%a 6.7%a 5.9%a
Do Not Build a Wall 53.4% 47.2%a 60.7%b 54.7%a 56.1%a 56.3%a 70.6%a 47.1%a
Total 100.0% 100.0% 100.0% 100.0% 100.0% 100.0% 100.0% 100.0%
Unweighted Sample Size 427 168 249 41 79 85 59 65
Gender Annual Household Income
Physical wall
along US-Mexico
Border
18-39 40-59 60+HSG or
less
Some
college
4YD or
moreConservative Neither Liberal
Build a Wall 39.9%a 43.1%a 42.9%a 45.9%a 42.8%a 32.4%a 64.6%a 34.1%b 14.7%c
No Preference 6.5%a 1.5%a 4.2%a 1.5%a 8.2%b 2.2%a,b 3.9%a 3.3%a 5.8%a
Do Not Build a Wall 53.6%a 55.4%a 52.9%a 52.6%a,b 49.0%a 65.4%b 31.5%a 62.6%b 79.5%c
Total 100.0% 100.0% 100.0% 100.0% 100.0% 100.0% 100.0% 100.0% 100.0%
Unweighted Sample Size 45 132 240 107 165 145 123 183 86
Age Groups Education Level Political Beliefs
Physical wall
along US-Mexico
Border
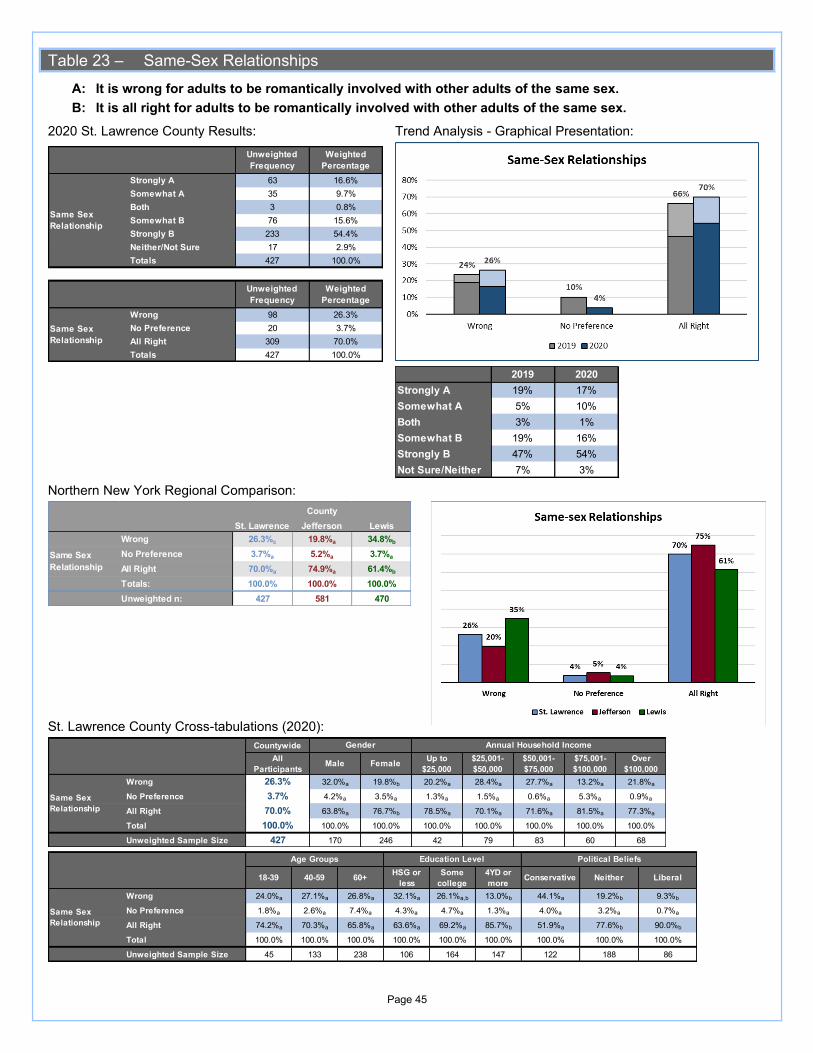
Page 45
Table 23 – Same-Sex Relationships
A: It is wrong for adults to be romantically involved with other adults of the same sex.
B: It is all right for adults to be romantically involved with other adults of the same sex.
2020 St. Lawrence County Results: Trend Analysis - Graphical Presentation:
Northern New York Regional Comparison:
St. Lawrence County Cross-tabulations (2020):
Unweighted
Frequency
Weighted
Percentage
Strongly A 63 16.6%
Somewhat A 35 9.7%
Both 3 0.8%
Somewhat B 76 15.6%
Strongly B 233 54.4%
Neither/Not Sure 17 2.9%
Totals 427 100.0%
Unweighted
Frequency
Weighted
Percentage
Wrong 98 26.3%
No Preference 20 3.7%
All Right 309 70.0%
Totals 427 100.0%
Same Sex
Relationship
Same Sex
Relationship
2019 2020
Strongly A 19% 17%
Somewhat A 5% 10%
Both 3% 1%
Somewhat B 19% 16%
Strongly B 47% 54%
Not Sure/Neither 7% 3%
St. Lawrence Jefferson Lewis
Wrong 26.3%c 19.8%a 34.8%b
No Preference 3.7%a 5.2%a 3.7%a
All Right 70.0%a 74.9%a 61.4%b
Totals: 100.0% 100.0% 100.0%
Unweighted n: 427 581 470
County
Same Sex
Relationship
Countywide
All
ParticipantsMale Female
Up to
$25,000
$25,001-
$50,000
$50,001-
$75,000
$75,001-
$100,000
Over
$100,000
Wrong 26.3% 32.0%a 19.8%b 20.2%a 28.4%a 27.7%a 13.2%a 21.8%a
No Preference 3.7% 4.2%a 3.5%a 1.3%a 1.5%a 0.6%a 5.3%a 0.9%a
All Right 70.0% 63.8%a 76.7%b 78.5%a 70.1%a 71.6%a 81.5%a 77.3%a
Total 100.0% 100.0% 100.0% 100.0% 100.0% 100.0% 100.0% 100.0%
Unweighted Sample Size 427 170 246 42 79 83 60 68
Gender Annual Household Income
Same Sex
Relationship
18-39 40-59 60+HSG or
less
Some
college
4YD or
moreConservative Neither Liberal
Wrong 24.0%a 27.1%a 26.8%a 32.1%a 26.1%a,b 13.0%b 44.1%a 19.2%b 9.3%b
No Preference 1.8%a 2.6%a 7.4%a 4.3%a 4.7%a 1.3%a 4.0%a 3.2%a 0.7%a
All Right 74.2%a 70.3%a 65.8%a 63.6%a 69.2%a 85.7%b 51.9%a 77.6%b 90.0%b
Total 100.0% 100.0% 100.0% 100.0% 100.0% 100.0% 100.0% 100.0% 100.0%
Unweighted Sample Size 45 133 238 106 164 147 122 188 86
Age Groups Education Level Political Beliefs
Same Sex
Relationship

Page 46
Table 24 – Abortion
A: Choosing abortion is a woman's right, and society should protect that right.
B: Abortion is morally wrong, and society should prohibit it.
2020 St. Lawrence County Results: Trend Analysis - Graphical Presentation:
Northern New York Regional Comparison:
St. Lawrence County Cross-tabulations (2020):
Unweighted
Frequency
Weighted
Percentage
Strongly A 223 51.1%
Somewhat A 76 17.0%
Both 8 1.8%
Somewhat B 39 10.3%
Strongly B 65 16.0%
Neither/Not Sure 15 3.9%
Totals 426 100.0%
Unweighted
Frequency
Weighted
Percentage
Woman's Right 299 68.1%
No Preference 23 5.6%
Morally Wrong 104 26.3%
Totals 426 100.0%
Abortion
Abortion
2019 2020
Strongly A 50% 51%
Somewhat A 13% 17%
Both 6% 2%
Somewhat B 8% 10%
Strongly B 20% 16%
Not Sure/Neither 2% 4%
St. Lawrence Jefferson Lewis
Women's Right 68.1%a 62.5%a 54.3%b
No Preference 5.6%a,b 4.2%a 8.4%b
Morally Wrong 26.3%b 33.3%a 37.3%a
Totals: 100.0% 100.0% 100.0%
Unweighted n: 426 579 473
County
Abortion
Countywide
All
ParticipantsMale Female
Up to
$25,000
$25,001-
$50,000
$50,001-
$75,000
$75,001-
$100,000
Over
$100,000
Woman's Right 68.1% 67.2%a 69.2%a 76.0%a 74.2%a 58.0%a 80.5%a 65.7%a
No Preference 5.6% 5.8%a 5.7%a 1.5%a 2.3%a 2.1%a 3.3%a 9.4%a
Morally Wrong 26.3% 26.9%a 25.0%a 22.5%a,b 23.5%a,b 39.9%a 16.2%b 24.8%a,b
Total 100.0% 100.0% 100.0% 100.0% 100.0% 100.0% 100.0% 100.0%
Unweighted Sample Size 426 170 245 42 78 85 60 68
Gender Annual Household Income
Abortion
18-39 40-59 60+HSG or
less
Some
college
4YD or
moreConservative Neither Liberal
Woman's Right 67.9%a 69.7%a 67.0%a 68.2%a 65.7%a 73.0%a 46.2%a 77.2%b 91.4%c
No Preference 6.5%a 5.4%a 5.4%a 5.3%a 7.8%a 3.2%a 5.3%a 4.3%a 1.3%a
Morally Wrong 25.6%a 24.9%a 27.6%a 26.5%a 26.5%a 23.8%a 48.5%a 18.5%b 7.3%b
Total 100.0% 100.0% 100.0% 100.0% 100.0% 100.0% 100.0% 100.0% 100.0%
Unweighted Sample Size 45 133 237 107 165 144 123 186 86
Age Groups Education Level Political Beliefs
Abortion

Page 47
Table 25 – Systemic Racism and Social Injustice
A: Systemic racism and social injustice are major problems in our country that need to be addressed.
B: Systemic racism and social injustice are not major problems in our country that need to be addressed.
2020 St. Lawrence County Results:
Trend Analysis:
Not measured in earlier St. Lawrence County studies.
Northern New York Regional Comparison:
St. Lawrence County Cross-tabulations (2020):
Unweighted
Frequency
Weighted
Percentage
Strongly A 224 48.2%
Somewhat A 83 19.9%
Both 7 1.6%
Somewhat B 55 17.6%
Strongly B 53 10.5%
Neither/Not Sure 7 2.2%
Totals 429 100.0%
Unweighted
Frequency
Weighted
Percentage
Major Problem 307 68.0%
No Preference 14 3.8%
Not Major Problem 108 28.1%
Totals 429 100.0%
Racism and
Social Injustice
Racism and
Social Injustice
St. Lawrence Jefferson Lewis
Major Problem 68.0%b 76.6%a 67.8%b
No Preference 3.8%a 1.9%a 3.7%a
Not Major Problem 28.1%b 21.5%a 28.5%b
Totals: 100.0% 100.0% 100.0%
Unweighted n: 429 579 473
County
Racism and
Social Injustice
Countywide
All
ParticipantsMale Female
Up to
$25,000
$25,001-
$50,000
$50,001-
$75,000
$75,001-
$100,000
Over
$100,000
Major Problem 68.0% 62.9%a 73.4%b 66.2%a 68.6%a 76.1%a 77.2%a 53.7%a
No Preference 3.8% 5.2%a 2.7%a 1.5%a 2.5%a 0.0%2 1.3%a 2.7%a
Not Major Problem 28.1% 31.9%a 23.9%a 32.3%a 29.0%a 23.9%a 21.5%a 43.6%a
Total 100.0% 100.0% 100.0% 100.0% 100.0% 100.0% 100.0% 100.0%
Unweighted Sample Size 429 169 248 42 79 85 61 68
Gender Annual Household Income
Racism and
Social Injustice
18-39 40-59 60+HSG or
less
Some
college
4YD or
moreConservative Neither Liberal
Major Problem 66.4%a 67.8%a 70.2%a 65.8%a 68.6%a 72.2%a 50.1%a 75.8%b 94.6%c
No Preference 4.2%a 3.7%a 4.0%a 3.7%a 5.5%a 1.7%a 4.5%a 1.4%a 1.9%a
Not Major Problem 29.4%a 28.5%a 25.8%a 30.4%a 25.9%a 26.1%a 45.4%a 22.9%b 3.5%c
Total 100.0% 100.0% 100.0% 100.0% 100.0% 100.0% 100.0% 100.0% 100.0%
Unweighted Sample Size 45 134 238 105 167 146 123 189 86
Age Groups Education Level Political Beliefs
Racism and
Social Injustice

Page 48
Table 26 – Gun Control and Rights
A: The Second Amendment of the US Constitution protects an individual’s right to own guns, and that should not be compromised by laws such as the NYS Safe Act.
B: Gun violence in the US is out of control and some gun regulation similar to the NYS Safe Act is necessary.
2020 St. Lawrence County Results: Trend Analysis - Graphical Presentation:
Northern New York Regional Comparison:
St. Lawrence County Cross-tabulations (2020):
Unweighted
Frequency
Weighted
Percentage
Strongly A 185 50.0%
Somewhat A 39 10.0%
Both 10 3.3%
Somewhat B 63 13.0%
Strongly B 123 21.1%
Neither/Not Sure 9 2.7%
Totals 429 100.0%
Unweighted
Frequency
Weighted
Percentage
Pro Gun Rights 224 60.0%
No Preference 19 5.9%
Pro Gun Control 186 34.1%
Totals 429 100.0%
Gun Control and
Rights
Gun Control and
Rights
2019 2020
Strongly A 43% 50%
Somewhat A 11% 10%
Both 4% 3%
Somewhat B 15% 13%
Strongly B 27% 21%
Not Sure/Neither 0% 3%
St. Lawrence Jefferson Lewis
Pro Gun Rights 60.0%a 61.3%a 74.7%b
No Preference 5.9%a 4.7%a 1.8%b
Pro Gun Control 34.1%a 34.0%a 23.5%b
Totals: 100.0% 100.0% 100.0%
Unweighted n: 429 583 472
County
Gun Control
and Rights
Countywide
All
ParticipantsMale Female
Up to
$25,000
$25,001-
$50,000
$50,001-
$75,000
$75,001-
$100,000
Over
$100,000
Pro Gun Rights 60.0% 62.2%a 57.3%a 58.5%a,b 76.0%a 51.2%b 53.1%a,b 66.6%a,b
No Preference 5.9% 8.7%a 3.6%b 9.2%a 2.1%a 0.5%a 2.2%a 9.2%a
Pro Gun Control 34.1% 29.1%a 39.2%b 32.3%a,c,d 21.8%a,b 48.3%c 44.7%a,c,d 24.2%b,d
Total 100.0% 100.0% 100.0% 100.0% 100.0% 100.0% 100.0% 100.0%
Unweighted Sample Size 429 170 247 42 79 84 61 68
Gender Annual Household Income
Gun Control and
Rights
18-39 40-59 60+HSG or
less
Some
college
4YD or
moreConservative Neither Liberal
Pro Gun Rights 64.9%a 60.1%a 53.9%a 65.9%a 60.9%a 44.6%b 78.5%a 59.1%b 23.1%c
No Preference 9.1%a 6.3%a 2.7%a 6.6%a 7.1%a 3.4%a 4.2%a 6.0%a 0.4%a
Pro Gun Control 26.0%a 33.6%a,b 43.4%b 27.6%a 32.0%a 52.0%b 17.2%a 34.9%b 76.5%c
Total 100.0% 100.0% 100.0% 100.0% 100.0% 100.0% 100.0% 100.0% 100.0%
Unweighted Sample Size 45 134 238 106 167 145 123 189 85
Age Groups Education Level Political Beliefs
Gun Control and
Rights

Page 49
Table 27 – Of the following five issues, which do you believe is the most important issue facing the nation right now?
2020 St. Lawrence County Results:
Trend Analysis:
Not measured in earlier St. Lawrence County studies.
Northern New York Regional Comparison:
St. Lawrence County Cross-tabulations (2020):
Unweighted
Frequency
Weighted
Percentage
Health care 39 9.4%
Coronavirus 192 36.6%
Jobs and the Economy 140 40.0%
Violent Crime 35 8.1%
Race and Ethnic Inequality 20 5.9%
Totals 426 100.0%
The most important
issue facing the
nation right now?
St. Lawrence Jefferson Lewis
Health care 9.4%a 8.5%a 8.3%a
Coronavirus 36.6%b 44.5%a 42.0%a,b
Jobs and the Economy 40.0%b 23.3%a 34.5%b
Violent Crime 8.1%a 11.1%a 10.9%a
Race and Ethnic Inequality 5.9%b 12.6%a 4.4%b
Totals: 100.0% 100.0% 100.0%
Unweighted n: 426 584 469
County
The most
important issue
facing the nation
right now?
Countywide
All
ParticipantsMale Female
Up to
$25,000
$25,001-
$50,000
$50,001-
$75,000
$75,001-
$100,000
Over
$100,000
Health care 9.4% 11.8%a 7.1%a 6.1%a 3.4%a 6.3%a 5.0%a 7.7%a
Coronavirus 36.6% 34.2%a 37.2%a 22.3%a 38.1%a,b 49.0%b 46.6%a,b 28.0%a,b
Jobs and the Economy 40.0% 38.2%a 43.3%a 53.9%a,b 48.9%a,b 30.5%a 29.6%a,b 54.7%b
Violent Crime 8.1% 7.8%a 8.3%a 17.0%a 4.4%a 5.4%a 16.0%a 3.7%a
Race and Ethnic Inequality 5.9% 8.0%a 4.0%a 0.7%a 5.2%a 8.7%a 2.8%a 5.9%a
Total 100.0% 100.0% 100.0% 100.0% 100.0% 100.0% 100.0% 100.0%
Unweighted Sample Size 426 167 247 42 79 84 61 68
Gender Annual Household Income
The most
important issue
facing the nation
right now?
18-39 40-59 60+HSG or
less
Some
college
4YD or
moreConservative Neither Liberal
Health care 13.6%a 6.7%a 7.8%a 8.8%a 7.5%a 14.1%a 7.0%a 7.5%a 8.1%a
Coronavirus 22.3%a 35.0%a 50.9%b 34.6%a 36.1%a 38.2%a 21.0%a 43.1%b 50.6%b
Jobs and the Economy 46.7%a 48.2%a 26.4%b 38.8%a 47.4%a 32.7%a 52.7%a 40.7%a 18.7%b
Violent Crime 4.9%a 6.8%a 12.8%a 11.2%a 6.5%a 4.3%a 14.7%a 5.6%b 1.3%b
Race and Ethnic Inequality 12.5%a 3.3%b 2.0%b 6.6%a,b 2.6%a 10.8%b 4.6%a 3.1%a 21.3%b
Total 100.0% 100.0% 100.0% 100.0% 100.0% 100.0% 100.0% 100.0% 100.0%
Unweighted Sample Size 45 131 238 103 166 146 120 189 86
Age Groups Education Level Political Beliefs
The most
important issue
facing the nation
right now?

Page 50
Section 3.3 – COVID-19 – Residents’ Opinions and Behaviors
Table 28 – In the past two weeks, how often have you worn a homemade or store bought respiratory mask when going out in public?
2020 St. Lawrence County Results: Trend Analysis - Graphical Presentation:
Northern New York Regional Comparison:
Unweighted
Frequency
Weighted
Percentage
Not at all 15 3.2%
1-2 times 24 5.7%
3-5 times 48 12.7%
Every other day 20 4.2%
Once per day 48 14.0%
More than once/day 260 57.3%
Don't Know/Not Sure 5 2.9%
Totals 420 100.0%
How often have you
worn a mask when
going out in public?
April 2020 October 2020
Not at all 80% 3%
1-2 times 8% 6%
3-5 times 4% 13%
Every other day 0% 4%
Once per day 3% 14%
More than once/day 4% 57%
Don't Know/Not Sure 1% 3%
St. Lawrence Jefferson Lewis
Not at all 3.2%a 1.4%a 2.3%a
1-2 times 5.7%a 4.3%a 6.7%a
3-5 times 12.7%a 10.6%a 12.2%a
Every other day 4.2%a 7.2%a 6.4%a
Once per day 14.0%a 14.3%a 12.6%a
More than once/day 57.3%a 61.6%a 58.8%a
Don't Know/Not Sure 2.9%b 0.6%a 1.0%a,b
Totals: 100.0% 100.0% 100.0%
Unweighted n: 420 578 470
County
How often have
you worn a mask
when going out in
public?
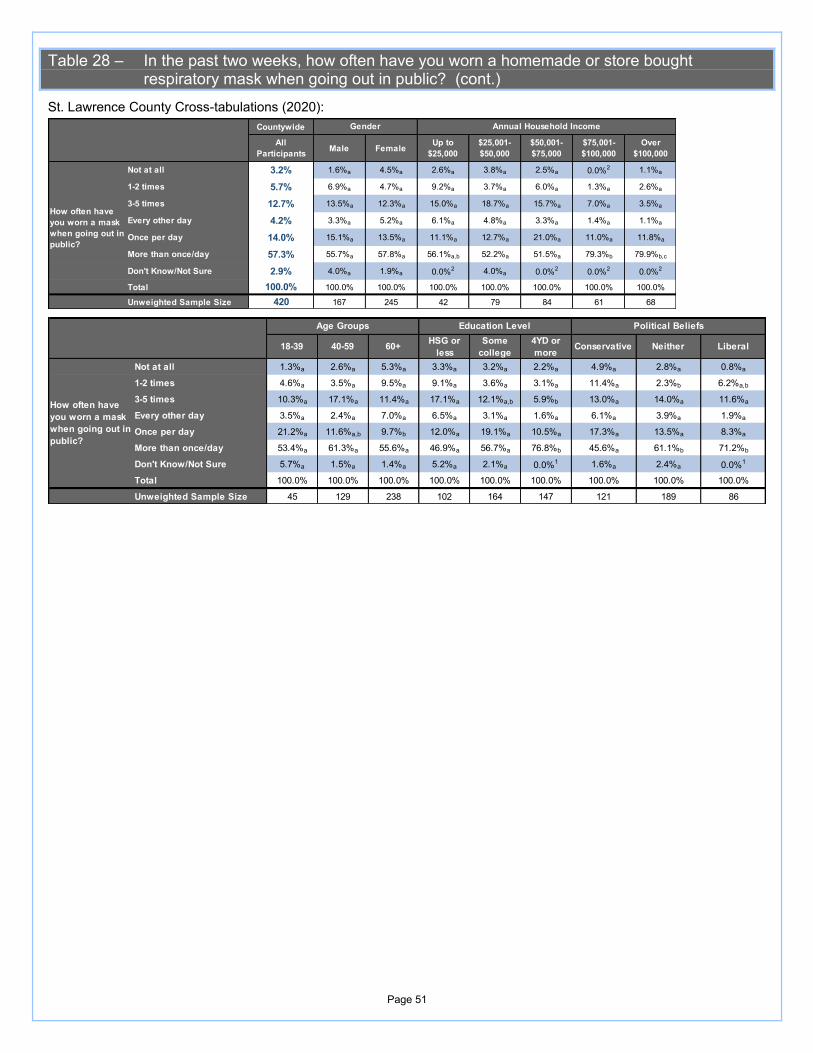
Page 51
Table 28 – In the past two weeks, how often have you worn a homemade or store bought respiratory mask when going out in public? (cont.)
St. Lawrence County Cross-tabulations (2020):
Countywide
All
ParticipantsMale Female
Up to
$25,000
$25,001-
$50,000
$50,001-
$75,000
$75,001-
$100,000
Over
$100,000
Not at all 3.2% 1.6%a 4.5%a 2.6%a 3.8%a 2.5%a 0.0%2 1.1%a
1-2 times 5.7% 6.9%a 4.7%a 9.2%a 3.7%a 6.0%a 1.3%a 2.6%a
3-5 times 12.7% 13.5%a 12.3%a 15.0%a 18.7%a 15.7%a 7.0%a 3.5%a
Every other day 4.2% 3.3%a 5.2%a 6.1%a 4.8%a 3.3%a 1.4%a 1.1%a
Once per day 14.0% 15.1%a 13.5%a 11.1%a 12.7%a 21.0%a 11.0%a 11.8%a
More than once/day 57.3% 55.7%a 57.8%a 56.1%a,b 52.2%a 51.5%a 79.3%b 79.9%b,c
Don't Know/Not Sure 2.9% 4.0%a 1.9%a 0.0%2 4.0%a 0.0%2 0.0%2 0.0%2
Total 100.0% 100.0% 100.0% 100.0% 100.0% 100.0% 100.0% 100.0%
Unweighted Sample Size 420 167 245 42 79 84 61 68
Gender Annual Household Income
How often have
you worn a mask
when going out in
public?
18-39 40-59 60+HSG or
less
Some
college
4YD or
moreConservative Neither Liberal
Not at all 1.3%a 2.6%a 5.3%a 3.3%a 3.2%a 2.2%a 4.9%a 2.8%a 0.8%a
1-2 times 4.6%a 3.5%a 9.5%a 9.1%a 3.6%a 3.1%a 11.4%a 2.3%b 6.2%a,b
3-5 times 10.3%a 17.1%a 11.4%a 17.1%a 12.1%a,b 5.9%b 13.0%a 14.0%a 11.6%a
Every other day 3.5%a 2.4%a 7.0%a 6.5%a 3.1%a 1.6%a 6.1%a 3.9%a 1.9%a
Once per day 21.2%a 11.6%a,b 9.7%b 12.0%a 19.1%a 10.5%a 17.3%a 13.5%a 8.3%a
More than once/day 53.4%a 61.3%a 55.6%a 46.9%a 56.7%a 76.8%b 45.6%a 61.1%b 71.2%b
Don't Know/Not Sure 5.7%a 1.5%a 1.4%a 5.2%a 2.1%a 0.0%1 1.6%a 2.4%a 0.0%1
Total 100.0% 100.0% 100.0% 100.0% 100.0% 100.0% 100.0% 100.0% 100.0%
Unweighted Sample Size 45 129 238 102 164 147 121 189 86
Age Groups Education Level Political Beliefs
How often have
you worn a mask
when going out in
public?

Page 52
Table 29 – How serious are your concerns about a lack of trust in the information about COVID-19 that you see in the media?
2020 St. Lawrence County Results: Trend Analysis - Graphical Presentation:
Northern New York Regional Comparison:
St. Lawrence County Cross-tabulations (2020):
Unweighted
Frequency
Weighted
Percentage
Very serious concerns 171 41.5%
Somewhat serious concerns 131 33.4%
Minor concerns 68 14.2%
No concerns at all 43 9.4%
Don't Know/Not Sure 8 1.5%
Totals 421 100.0%
Concerns about a
lack of trust in the
information about
COVID-19 that you
see in the media?
April 2020 October 2020
Very serious 39% 42%
Somewhat serious 22% 33%
Minor concerns 23% 14%
No concerns 15% 9%
Not sure 2% 2%
St. Lawrence Jefferson Lewis
Very serious concerns 41.5%a 40.9%a 46.0%a
Somewhat serious
concerns33.4%a 29.9%a 28.7%a
Minor concerns 14.2%a,b 18.1%a 12.2%b
No concerns at all 9.4%a 9.4%a 10.9%a
Don't Know/Not Sure 1.5%a 1.7%a 2.2%a
Totals: 100.0% 100.0% 100.0%
Unweighted n: 421 576 467
County
Concerns about a
lack of trust in the
information about
COVID-19 that you
see in the media?
Countywide
All
ParticipantsMale Female
Up to
$25,000
$25,001-
$50,000
$50,001-
$75,000
$75,001-
$100,000
Over
$100,000
Very serious concerns 41.5% 40.8%a 43.0%a 57.3%a 26.6%b 51.3%a 43.1%a,b 36.3%a,b
Somewhat serious concerns 33.4% 32.7%a 34.0%a 29.9%a,b 52.9%a 22.0%b 19.3%b,c 28.3%b,d
Minor concerns 14.2% 14.3%a 14.2%a 8.0%a 11.6%a 20.7%a 14.4%a 26.9%a
No concerns at all 9.4% 12.0%a 6.3%b 4.8%a,b 7.8%a,b 5.2%a 22.3%b 7.4%a,b
Don't Know/Not Sure 1.5% 0.2%a 2.5%b 0.0%2 1.1%a 0.9%a 0.8%a 1.2%a
Total 100.0% 100.0% 100.0% 100.0% 100.0% 100.0% 100.0% 100.0%
Unweighted Sample Size 421 167 245 42 79 84 61 68
Gender Annual Household Income
Concerns about a
lack of trust in the
information about
COVID-19 that you
see in the media?
18-39 40-59 60+HSG or
less
Some
college
4YD or
moreConservative Neither Liberal
Very serious concerns 43.7%a 38.4%a 43.7%a 48.6%a 40.4%a,b 30.9%b 43.9%a 37.1%a 48.0%a
Somewhat serious concerns 34.2%a 37.4%a 28.2%a 32.4%a 35.7%a 30.9%a 35.3%a 35.5%a 30.3%a
Minor concerns 13.7%a 13.1%a 16.1%a 10.8%a 12.7%a,b 23.8%b 10.7%a 17.1%a 16.8%a
No concerns at all 8.4%a 9.1%a 10.0%a 6.2%a 10.2%a 14.1%a 7.0%a 9.6%a 4.4%a
Don't Know/Not Sure 0.0%1 1.9%a 2.1%a 2.0%a 1.0%a 0.4%a 3.1%a 0.6%a 0.5%a
Total 100.0% 100.0% 100.0% 100.0% 100.0% 100.0% 100.0% 100.0% 100.0%
Unweighted Sample Size 45 130 237 102 165 146 122 189 85
Age Groups Education Level Political Beliefs
Concerns about a
lack of trust in the
information about
COVID-19 that you
see in the media?

Page 53
Table 30 – How satisfied are you with the actions that the United States public health leadership like the CDC have taken in response to COVID-19?
2020 St. Lawrence County Results: Trend Analysis - Graphical Presentation:
Northern New York Regional Comparison:
St. Lawrence County Cross-tabulations (2020):
Unweighted
Frequency
Weighted
Percentage
Very satisfied 70 12.2%
Somewhat satisfied 188 44.9%
Neither 30 8.4%
Somewhat dissatisfied 67 17.8%
Very dissatisfied 54 13.8%
Don't Know/Not Sure 12 2.9%
Totals 421 100.0%
United States public
health leadership like
the CDC
April 2020 October 2020
Satisfied 67% 57%
Dissatisfied 20% 32%
Neither/Not Sure 13% 11%
St. Lawrence Jefferson Lewis
Satisfied 57.1%a 64.0%a 60.6%a
Dissatisfied 31.6%b 23.5%a 28.2%a,b
Neither/Not Sure 11.3%a 12.5%a 11.2%a
Totals: 100.0% 100.0% 100.0%
Unweighted n: 421 576 470
County
United States public
health leadership like
the CDC
Countywide
All
ParticipantsMale Female
Up to
$25,000
$25,001-
$50,000
$50,001-
$75,000
$75,001-
$100,000
Over
$100,000
Satisfied 57.1% 52.5%a 61.8%a 65.7%a 58.0%a 60.0%a 59.2%a 49.2%a
Dissatisfied 31.6% 38.8%a 25.3%b 31.9%a 27.7%a 36.1%a 31.7%a 27.4%a
Neither/Not Sure 11.3% 8.7%a 12.9%a 2.4%a 14.2%a,b 3.9%a 9.1%a,b 23.4%b
Total 100.0% 100.0% 100.0% 100.0% 100.0% 100.0% 100.0% 100.0%
Unweighted Sample Size 421 167 245 42 79 85 60 68
Gender Annual Household Income
United States public
health leadership
like the CDC
18-39 40-59 60+HSG or
less
Some
college
4YD or
moreConservative Neither Liberal
Satisfied 48.1%a 57.8%a,b 66.0%b 54.7%a 59.5%a 58.3%a 50.1%a 64.5%b 56.9%a,b
Dissatisfied 39.2%a 31.9%a,b 24.7%b 35.7%a 28.7%a 30.1%a 33.3%a 26.1%a 41.1%a
Neither/Not Sure 12.7%a 10.3%a 9.3%a 9.5%a 11.8%a 11.5%a 16.6%a 9.4%a,b 2.0%b
Total 100.0% 100.0% 100.0% 100.0% 100.0% 100.0% 100.0% 100.0% 100.0%
Unweighted Sample Size 44 130 238 102 165 146 121 189 86
Age Groups Education Level Political Beliefs
United States public
health leadership
like the CDC

Page 54
Table 31 – How satisfied are you with the actions that President Trump and the US government have taken in response to COVID-19?
2020 St. Lawrence County Results: Trend Analysis - Graphical Presentation:
Northern New York Regional Comparison:
St. Lawrence County Cross-tabulations (2020):
Unweighted
Frequency
Weighted
Percentage
Very satisfied 93 26.6%
Somewhat satisfied 89 20.8%
Neither 16 4.6%
Somewhat dissatisfied 34 11.9%
Very dissatisfied 180 33.4%
Don't Know/Not Sure 9 2.8%
Totals 421 100.0%
President Trump and
the US government
April 2020 October 2020
Satisfied 54% 47%
Dissatisfied 37% 45%
Neither/Not Sure 9% 7%
St. Lawrence Jefferson Lewis
Satisfied 47.3%a 43.0%a 56.4%b
Dissatisfied 45.3%a,b 45.8%a 37.6%b
Neither/Not Sure 7.4%a,b 11.2%a 6.0%b
Totals: 100.0% 100.0% 100.0%
Unweighted n: 421 575 469
County
President Trump and
the US government
Countywide
All
ParticipantsMale Female
Up to
$25,000
$25,001-
$50,000
$50,001-
$75,000
$75,001-
$100,000
Over
$100,000
Satisfied 47.3% 54.0%a 40.2%b 45.3%a,b 58.2%a 43.2%a,b 30.4%b 46.7%a,b
Dissatisfied 45.3% 42.4%a 48.8%a 53.3%a,c,d 34.7%a,b 51.0%a,c,d 65.2%c 36.3%b,d
Neither/Not Sure 7.4% 3.6%a 10.9%b 1.4%a 7.1%a,b 5.9%a,b 4.4%a,b 17.0%b
Total 100.0% 100.0% 100.0% 100.0% 100.0% 100.0% 100.0% 100.0%
Unweighted Sample Size 421 167 245 42 79 85 61 68
Gender Annual Household Income
President Trump and
the US government
18-39 40-59 60+HSG or
less
Some
college
4YD or
moreConservative Neither Liberal
Satisfied 44.2%a 45.8%a 51.7%a 52.3%a 49.5%a 32.5%b 77.4%a 37.8%b 12.4%c
Dissatisfied 46.4%a 46.0%a 44.3%a 40.4%a 42.4%a 61.9%b 15.4%a 52.7%b 87.1%c
Neither/Not Sure 9.4%a 8.2%a 4.0%a 7.4%a 8.1%a 5.6%a 7.1%a 9.5%a 0.5%a
Total 100.0% 100.0% 100.0% 100.0% 100.0% 100.0% 100.0% 100.0% 100.0%
Unweighted Sample Size 45 129 238 101 165 147 122 189 86
Age Groups Education Level Political Beliefs
President Trump and
the US government

Page 55
Table 32 – How satisfied are you with the actions that Governor Cuomo and the New York State government have taken in response to COVID-19?
2020 St. Lawrence County Results: Trend Analysis - Graphical Presentation:
Northern New York Regional Comparison:
St. Lawrence County Cross-tabulations (2020):
Unweighted
Frequency
Weighted
Percentage
Very satisfied 133 23.0%
Somewhat satisfied 110 26.2%
Neither 10 3.1%
Somewhat dissatisfied 49 15.5%
Very dissatisfied 110 30.7%
Don't Know/Not Sure 6 1.4%
Totals 418 100.0%
Governor Cuomo and
the New York State
government
April 2020 October 2020
Satisfied 60% 49%
Dissatisfied 30% 46%
Neither/Not Sure 10% 5%
St. Lawrence Jefferson Lewis
Satisfied 49.2%a,b 51.5%a 43.0%b
Dissatisfied 46.2%b 38.0%a 53.3%b
Neither/Not Sure 4.6%b 10.5%a 3.7%b
Totals: 100.0% 100.0% 100.0%
Unweighted n: 418 576 466
County
Governor Cuomo and
the New York State
government
Countywide
All
ParticipantsMale Female
Up to
$25,000
$25,001-
$50,000
$50,001-
$75,000
$75,001-
$100,000
Over
$100,000
Satisfied 49.2% 43.2%a 55.8%b 45.3%a 52.2%a 52.0%a 51.3%a 48.4%a
Dissatisfied 46.2% 53.4%a 38.3%b 52.1%a 43.3%a 43.8%a 44.8%a 37.9%a
Neither/Not Sure 4.6% 3.3%a 6.0%a 2.6%a 4.5%a 4.2%a 3.9%a 13.7%a
Total 100.0% 100.0% 100.0% 100.0% 100.0% 100.0% 100.0% 100.0%
Unweighted Sample Size 418 167 243 42 79 85 60 68
Gender Annual Household Income
Governor Cuomo
and the New York
State government
18-39 40-59 60+HSG or
less
Some
college
4YD or
moreConservative Neither Liberal
Satisfied 40.5%a 52.5%a,b 56.0%b 42.4%a 52.7%a,b 58.3%b 18.6%a 60.4%b 79.9%c
Dissatisfied 53.2%a 43.7%a 40.3%a 52.6%a 44.4%a,b 34.9%b 76.3%a 35.2%b 15.3%c
Neither/Not Sure 6.3%a 3.8%a 3.7%a 5.0%a 3.0%a 6.9%a 5.1%a 4.4%a 4.8%a
Total 100.0% 100.0% 100.0% 100.0% 100.0% 100.0% 100.0% 100.0% 100.0%
Unweighted Sample Size 45 129 236 100 164 147 122 188 86
Age Groups Education Level Political Beliefs
Governor Cuomo
and the New York
State government

Page 56
Table 33 – How satisfied are you with the actions that the local County Public Health Department has taken in response to COVID-19?
2020 St. Lawrence County Results: Trend Analysis - Graphical Presentation:
Northern New York Regional Comparison:
St. Lawrence County Cross-tabulations (2020):
Unweighted
Frequency
Weighted
Percentage
Very satisfied 146 27.1%
Somewhat satisfied 194 53.2%
Neither 23 6.3%
Somewhat dissatisfied 29 6.0%
Very dissatisfied 13 3.1%
Don't Know/Not Sure 13 4.3%
Totals 418 100.0%
Our local County
Public Health
Departments
April 2020 October 2020
Satisfied 68% 80%
Dissatisfied 11% 9%
Neither/Not Sure 21% 11%
St. Lawrence Jefferson Lewis
Satisfied 80.4%b 69.8%a 81.9%b
Dissatisfied 9.1%a 14.1%a 13.4%a
Neither/Not Sure 10.6%c 16.2%a 4.7%b
Totals: 100.0% 100.0% 100.0%
Unweighted n: 418 574 466
County
Local County Public
Health Departments
Countywide
All
ParticipantsMale Female
Up to
$25,000
$25,001-
$50,000
$50,001-
$75,000
$75,001-
$100,000
Over
$100,000
Satisfied 80.4% 79.3%a 82.6%a 75.4%a 82.7%a 82.6%a 75.2%a 80.1%a
Dissatisfied 9.1% 10.4%a 7.1%a 6.7%a 5.8%a 11.2%a 17.5%a 4.8%a
Neither/Not Sure 10.6% 10.3%a 10.3%a 17.9%a 11.5%a 6.2%a 7.3%a 15.1%a
Total 100.0% 100.0% 100.0% 100.0% 100.0% 100.0% 100.0% 100.0%
Unweighted Sample Size 418 166 243 42 79 85 60 67
Gender Annual Household Income
Local County Public
Health Departments
18-39 40-59 60+HSG or
less
Some
college
4YD or
moreConservative Neither Liberal
Satisfied 82.8%a 76.1%a 84.0%a 79.8%a 82.4%a 80.8%a 72.2%a 82.4%a,b 91.1%b
Dissatisfied 5.4%a 10.8%a 10.3%a 10.0%a 6.4%a 10.3%a 18.7%a 4.4%b 5.2%b
Neither/Not Sure 11.8%a 13.1%a 5.8%a 10.2%a 11.2%a 9.0%a 9.1%a 13.2%a 3.7%a
Total 100.0% 100.0% 100.0% 100.0% 100.0% 100.0% 100.0% 100.0% 100.0%
Unweighted Sample Size 44 129 236 100 164 146 121 188 86
Age Groups Education Level Political Beliefs
Local County Public
Health Departments

Page 57
Table 34 – Which of the following best describes your feelings about the coronavirus in our country?
2020 St. Lawrence County Results: Trend Analysis - Graphical Presentation:
Northern New York Regional Comparison:
St. Lawrence County Cross-tabulations (2020):
Unweighted
Frequency
Weighted
Percentage
The Coronavirus is a major problem but
the worst is behind us.72 16.5%
The Coronavirus is a major problem
and the worst is yet to come.251 54.1%
The Coronavirus is not that major of a
problem.65 23.6%
Not sure 30 5.8%
Totals 418 100.0%
Which of the following best
describes your feelings
about the coronavirus in
our country?
April 2020 October 2020
Major problem – worst in past 5% 16%
Major problem – worst to come 87% 54%
Not a major problem 4% 24%
Not sure 5% 6%
St. Lawrence Jefferson Lewis
Major problem - worst in past 16.5%b 28.7%a 16.4%b
Major problem - worst to come 54.1%a 50.7%a 51.3%a
Not a major problem 23.6%b 14.3%a 18.8%a,b
Not sure 5.8%a 6.4%a 13.5%b
Totals: 100.0% 100.0% 100.0%
Unweighted n: 418 575 466
County
Which of the following
best describes your
feelings about the
coronavirus in our
country?
Countywide
All
ParticipantsMale Female
Up to
$25,000
$25,001-
$50,000
$50,001-
$75,000
$75,001-
$100,000
Over
$100,000
Major Problem - worst in past 16.5% 17.9%a 14.2%a 9.9%a 21.9%a 8.1%a 20.2%a 15.8%a
Major Problem - worst to come 54.1% 47.7%a 61.0%b 57.7%a 59.3%a 56.6%a 65.2%a 43.8%a
Not a major problem 23.6% 27.6%a 20.2%a 20.8%a,b 16.4%a,b 31.3%a,b 12.2%a 37.0%b
Not sure 5.8% 6.8%a 4.6%a 11.5%a 2.4%a 4.0%a 2.4%a 3.3%a
Total 100.0% 100.0% 100.0% 100.0% 100.0% 100.0% 100.0% 100.0%
Unweighted Sample Size 418 166 243 42 79 85 60 68
Gender Annual Household Income
Which of the following
best describes your
feelings about the
coronavirus in our
country?
18-39 40-59 60+HSG or
less
Some
college
4YD or
moreConservative Neither Liberal
Major Problem - worst in past 10.0%a 17.9%a,b 20.7%b 18.9%a 12.4%a 16.7%a 23.0%a 14.1%a 1.9%b
Major Problem - worst to come 50.5%a 54.3%a 58.4%a 49.6%a 51.8%a 68.4%b 36.0%a 58.1%b 88.8%c
Not a major problem 34.2%a 24.6%a 11.9%b 26.7%a 27.9%a 11.5%b 34.6%a 22.9%a 7.9%b
Not sure 5.3%a 3.1%a 8.9%a 4.9%a 7.9%a 3.4%a 6.4%a 4.9%a 1.5%a
Total 100.0% 100.0% 100.0% 100.0% 100.0% 100.0% 100.0% 100.0% 100.0%
Unweighted Sample Size 45 128 236 99 165 146 121 189 86
Age Groups Education Level Political Beliefs
Which of the following
best describes your
feelings about the
coronavirus in our
country?

Page 58
Table 35 – "The food supply chain challenges caused by the coronavirus pandemic have increased the value I put on local food producers."
2020 St. Lawrence County Results:
Northern New York Regional Comparison:
St. Lawrence County Cross-tabulations (2020):
Unweighted
Frequency
Weighted
Percentage
Strongly agree 124 28.3%
Agree 196 46.4%
Neither/Not sure 71 17.5%
Disagree 22 7.1%
Strongly disagree 5 0.7%
Totals 418 100.0%
"The food supply chain
challenges caused by the
coronavirus pandemic
have increased the value
I put on local food
producers."
St. Lawrence Jefferson Lewis
Agree 74.7%a 75.8%a 78.0%a
Neither/Not Sure 17.5%a,b 19.1%a 13.5%b
Disagree 7.9%a 5.1%a 8.5%a
Totals: 100.0% 100.0% 100.0%
Unweighted n: 418 575 467
County
"The food supply chain
challenges caused by the
coronavirus pandemic have
increased the value I put on
local food producers."
Countywide
All
ParticipantsMale Female
Up to
$25,000
$25,001-
$50,000
$50,001-
$75,000
$75,001-
$100,000
Over
$100,000
Agree 74.7% 72.5%a 78.3%a 71.2%a 81.8%a 81.6%a 70.6%a 68.0%a
Neither/Not Sure 17.5% 17.5%a 15.7%a 8.3%a 15.3%a 14.6%a 24.1%a 26.4%a
Disagree 7.9% 10.0%a 6.1%a 20.5%a 2.9%b 3.8%b 5.3%a,b 5.6%a,b
Total 100.0% 100.0% 100.0% 100.0% 100.0% 100.0% 100.0% 100.0%
Unweighted Sample Size 418 167 242 42 79 85 61 68
Gender Annual Household Income
"The food supply chain
challenges caused by the
coronavirus pandemic have
increased the value I put on
local food producers."
18-39 40-59 60+HSG or
less
Some
college
4YD or
moreConservative Neither Liberal
Agree 75.8%a 72.0%a 78.3%a 70.8%a 78.1%a 78.7%a 70.9%a 73.8%a 92.2%b
Neither/Not Sure 13.6%a 21.8%a 14.4%a 16.2%a 16.7%a 18.1%a 21.6%a 18.4%a,b 5.8%b
Disagree 10.6%a 6.2%a 7.2%a 13.0%a 5.2%b 3.2%b 7.5%a 7.9%a 2.1%a
Total 100.0% 100.0% 100.0% 100.0% 100.0% 100.0% 100.0% 100.0% 100.0%
Unweighted Sample Size 45 129 235 98 165 147 121 189 86
Age Groups Education Level Political Beliefs
"The food supply chain
challenges caused by the
coronavirus pandemic have
increased the value I put on
local food producers."

Page 59
Table 36 – In March 2020, the New York State Legislature voted and approved to grant emergency powers for Governor Andrew Cuomo to make decisions in response to COVID-19. Which of the following two statements is closest to your opinion about whether or not it is time to rescind these powers?
2020 St. Lawrence County Results:
Northern New York Regional Comparison:
St. Lawrence County Cross-tabulations (2020):
Unweighted
Frequency
Weighted
Percentage
"Do not rescind the emergency powers at
this time, because the Governor needs to
keep his expanded power to keep us all
211 41.7%
"Rescind the powers, the emergency is
over and we need to return to the normal
levels checks and balances."
148 40.1%
Neither 26 8.2%
Not sure 32 10.0%
Totals 417 100.0%
Emergency powers for
Governor Andrew Cuomo
to make decisions in
response to COVID-19.
St. Lawrence Jefferson Lewis
Do not rescind the powers 41.7%a,b 43.5%a 35.9%b
Rescind the powers 40.1%a 38.4%a 48.7%b
Neither 8.2%a 9.2%a 8.7%a
Not sure 10.0%a 8.9%a 6.6%a
Totals: 100.0% 100.0% 100.0%
Unweighted n: 417 573 467
County
Emergency powers for
Governor Andrew Cuomo
to make decisions in
response to COVID-19.
Countywide
All
ParticipantsMale Female
Up to
$25,000
$25,001-
$50,000
$50,001-
$75,000
$75,001-
$100,000
Over
$100,000
Do not rescind the powers 41.7% 39.3%a 44.0%a 32.8%a 43.3%a 43.5%a 47.5%a 35.6%a
Rescind the powers 40.1% 48.0%a 31.9%b 40.3%a 34.4%a 41.6%a 28.4%a 48.6%a
Neither 8.2% 5.5%a 10.7%a 10.3%a 7.9%a 7.2%a 7.2%a 13.4%a
Not sure 10.0% 7.1%a 13.4%b 16.5%a 14.4%a 7.8%a 16.9%a 2.3%a
Total 100.0% 100.0% 100.0% 100.0% 100.0% 100.0% 100.0% 100.0%
Unweighted Sample Size 417 166 242 42 79 85 61 68
Gender Annual Household Income
Emergency powers for
Governor Andrew Cuomo
to make decisions in
response to COVID-19.
18-39 40-59 60+HSG or
less
Some
college
4YD or
moreConservative Neither Liberal
Do not rescind the powers 32.2%a 44.2%a,b 49.4%b 38.4%a 37.5%a 55.6%b 20.6%a 43.1%b 85.2%c
Rescind the powers 41.2%a 40.7%a 37.9%a 45.7%a 38.2%a 31.5%a 68.8%a 30.6%b 9.2%c
Neither 12.4%a 6.9%a 4.7%a 6.3%a 9.3%a 9.6%a 3.4%a 11.1%b 5.6%a,b
Not sure 14.2%a 8.2%a 8.1%a 9.6%a,b 15.0%a 3.3%b 7.2%a 15.2%b 0.0%1
Total 100.0% 100.0% 100.0% 100.0% 100.0% 100.0% 100.0% 100.0% 100.0%
Unweighted Sample Size 45 129 234 97 165 147 121 189 86
Age Groups Education Level Political Beliefs
Emergency powers for
Governor Andrew Cuomo
to make decisions in
response to COVID-19.

Page 60
Section 3.4 – Personal Financial and Employment Situations
Table 37 – When considering you or your family's personal financial situation has it gotten better, stayed about the same, or gotten worse in the past 12 months?
2020 St. Lawrence County Results: Trend Analysis - Graphical Presentation:
Trend Analysis:
Northern New York Regional Comparison:
St. Lawrence County Cross-tabulations (2020):
Unweighted
Frequency
Weighted
Percentage
Better 31 7.8%
Same 282 60.9%
Worse 92 30.7%
Don't Know 3 0.7%
Totals 408 100.0%
Your family's personal
financial situation in
the past 12 months?
2015 2016 2017 2018 2019 2020
Better 25% 24% 17% 29% 26% 8%
Same 57% 56% 62% 60% 51% 61%
Worse 18% 19% 17% 11% 21% 31%
Don’t Know 1% 1% 4% 0% 2% 1%
St. Lawrence Jefferson Lewis
Better 7.8%b 13.3%a 13.7%a
Same 60.9%a 65.5%a 62.6%a
Worse 30.7%b 19.8%a 23.0%a
Don't Know 0.7%a 1.4%a 0.7%a
Totals: 100.0% 100.0% 100.0%
Unweighted n: 408 570 464
County
Your family's personal
financial situation in
the past 12 months?
Countywide
All
ParticipantsMale Female
Up to
$25,000
$25,001-
$50,000
$50,001-
$75,000
$75,001-
$100,000
Over
$100,000
Better 7.8% 10.6%a 5.2%b 2.9%a 5.7%a 10.0%a 9.2%a 13.9%a
Same 60.9% 56.7%a 64.6%a 37.4%a 63.8%b,c 50.6%a,b 75.7%c 61.0%a,b,c
Worse 30.7% 32.6%a 29.0%a 59.8%a 30.5%b,c 39.3%a,b 15.1%c 25.1%b,c
Don't Know 0.7% 0.2%a 1.2%a 0.0%2 0.0%2 0.0%2 0.0%2 0.0%2
Total 100.0% 100.0% 100.0% 100.0% 100.0% 100.0% 100.0% 100.0%
Unweighted Sample Size 408 162 242 42 79 85 61 68
Gender Annual Household Income
Your family's personal
financial situation in the
past 12 months?
18-39 40-59 60+HSG or
less
Some
college
4YD or
moreConservative Neither Liberal
Better 8.3%a 8.8%a 6.2%a 4.2%a 11.8%b 7.6%a,b 6.7%a 9.0%a 6.5%a
Same 48.4%a 57.7%a 77.3%b 55.8%a 62.6%a 67.0%a 72.6%a 51.7%b 62.7%a,b
Worse 42.2%a 33.4%a 15.6%b 39.5%a 25.6%b 23.2%b 20.1%a 38.5%b 30.3%a,b
Don't Know 1.1%a 0.0%1 0.9%a 0.5%a 0.0%1 2.1%a 0.7%a 0.8%a 0.5%a
Total 100.0% 100.0% 100.0% 100.0% 100.0% 100.0% 100.0% 100.0% 100.0%
Unweighted Sample Size 44 128 232 94 165 146 119 189 86
Age Groups Education Level Political Beliefs
Your family's personal
financial situation in the
past 12 months?

Page 61
Table 38 – What is your current occupation?
2020 St. Lawrence County Results:
Trend Analysis:
Northern New York Regional Comparison:
Unweighted
Frequency
Weighted
Percentage
Retired 180 30.3%
Not currently employed 5 2.2%
Disabled 14 4.4%
Homemaker 9 4.0%
Student 7 5.5%
Military 0 0.0%
Managerial 15 4.8%
Medical 30 8.0%
Professional/Technical 28 8.9%
Sales 7 1.8%
Clerical 15 5.2%
Service 5 1.5%
Blue-collar 20 11.8%
Teacher/Education 24 5.9%
Self-employed 17 5.5%
Not Sure 1 0.1%
Totals 377 100.0%
What is your current
occupation?
2017 2018 2019 2020
Retired 26% 23% 27% 30%
Unemployed 8% 2% 6% 2%
Disabled 2% 6% 2% 4%
Homemaker 3% 2% 3% 4%
Student 5% 5% 2% 5%
Military 3% 0% 0% 0%
Managerial 3% 4% 5% 5%
Medical 6% 6% 6% 8%
Professional/Technical 5% 10% 5% 9%
Sales 4% 7% 8% 2%
Clerical 4% 3% 4% 5%
Service 11% 11% 3% 1%
Blue Collar 10% 11% 12% 12%
Teacher/Education 6% 6% 7% 6%
Self-employed 5% 3% 6% 6%
Not sure 0% 1% 4% 0%

Page 62
Table 38 – What is your current occupation? (cont.)
St. Lawrence County Cross-tabulations (2020):
Countywide
All
ParticipantsMale Female
Up to
$25,000
$25,001-
$50,000
$50,001-
$75,000
$75,001-
$100,000
Over
$100,000
Retired 30.3% 30.3%a 30.5%a 36.6%a,b 40.9%a 26.4%a,b 30.0%a,b 14.8%b
Not currently employed 2.2% 2.2%a 2.2%a 0.0%2 1.6%a 4.8%a 3.5%a 0.0%2
Disabled 4.4% 3.0%a 5.8%a 22.2%a 0.3%b 3.8%b 4.2%a,b 1.6%b
Homemaker 4.0% 0.0%2 7.9%a 2.3%a 6.2%a 11.8%a 0.0%2 0.0%2
Student 5.5% 7.5%a 3.6%a 16.3%a 4.1%a 0.0%2 0.0%2 3.5%a
Military 0.0% 0.0%2 0.0%2 0.0%2 0.0%2 0.0%2 0.0%2 0.0%2
Managerial 4.8% 5.0%a 4.1%a 0.0%2 1.0%a 1.3%a 7.4%a,b 17.0%b
Medical 8.0% 3.8%a 12.1%b 0.0%2 9.7%a 4.4%a 10.7%a 16.5%a
Professional/Technical 8.9% 10.6%a 7.3%a 0.0%2 3.9%a 12.4%a 14.3%a 16.1%a
Sales 1.8% 2.4%a 1.3%a 9.6%a 2.0%a 1.0%a 0.7%a 0.7%a
Clerical 5.2% 3.7%a 6.7%a 0.0%2 16.0%a 3.1%b 3.0%a,b 0.0%2
Service 1.5% 0.0%2 2.9%a 6.4%a 1.2%a 2.8%a 0.0%2 0.0%2
Blue-collar 11.8% 21.7%a 2.4%b 0.0%2 5.6%a 17.1%a 11.6%a 7.5%a
Teacher/Education 5.9% 3.5%a 8.2%a 0.0%2 3.4%a 5.6%a 11.1%a 7.0%a
Self-employed 5.5% 6.3%a 4.8%a 6.7%a 3.8%a 5.5%a 3.5%a 15.1%a
Not Sure 0.1% 0.0%2 0.2%a 0.0%2 0.0%2 0.0%2 0.0%2 0.0%2
Total 100.0% 100.0% 100.0% 100.0% 100.0% 100.0% 100.0% 100.0%
Unweighted Sample Size 377 150 226 37 74 77 56 66
Gender Annual Household Income
What is your current
occupation?
18-39 40-59 60+HSG or
less
Some
college
4YD or
moreConservative Neither Liberal
Retired 0.0%1 7.0%a 81.1%b 41.4%a 26.4%b 19.3%b 33.9%a 29.3%a 26.5%a
Not currently employed 1.4%a 5.3%a 0.0%1 3.1%a 1.6%a 1.8%a 0.8%a 4.0%a 0.0%1
Disabled 1.7%a 10.3%b 1.4%a 5.5%a 3.2%a 4.7%a 3.3%a 6.0%a 2.5%a
Homemaker 7.1%a 2.9%a 2.3%a 7.1%a 3.6%a 0.0%1 2.3%a 5.6%a 2.9%a
Student 16.4%a 0.8%b 0.0%1 3.8%a 7.2%a 5.4%a 0.0%1 2.3%a 27.9%b
Military 0.0%1 0.0%1 0.0%1 0.0%1 0.0%1 0.0%1 0.0%1 0.0%1 0.0%1
Managerial 4.4%a,b 8.3%a 1.1%b 5.4%a 4.0%a 5.1%a 6.2%a 5.5%a 0.0%1
Medical 13.9%a 7.5%a,b 3.1%b 0.0%1 11.9%a 14.2%a 5.1%a 7.9%a 11.0%a
Professional/Technical 15.1%a 10.9%a 1.2%b 0.0%1 8.1%a 23.9%b 9.8%a 9.4%a 4.9%a
Sales 0.0%1 4.6%a 0.8%a 1.9%a 2.1%a 1.1%a 1.0%a 1.7%a 4.3%a
Clerical 9.9%a 3.3%a 2.8%a 4.5%a 7.7%a 2.3%a 7.7%a 4.8%a 1.0%a
Service 1.4%a 2.8%a 0.4%a 1.2%a 1.6%a 1.8%a 1.3%a 1.4%a 1.7%a
Blue-collar 19.5%a 14.9%a 1.7%b 17.6%a 12.0%a 2.4%b 24.3%a 6.8%b 1.1%b
Teacher/Education 8.0%a 8.3%a 1.7%a 0.0%1 6.9%a 13.4%a 0.9%a 7.6%b 11.9%b
Self-employed 1.4%a 13.0%b 2.2%a 8.5%a 3.4%a 4.4%a 3.4%a 7.6%a 4.2%a
Not Sure 0.0%1 0.0%1 0.3%a 0.0%1 0.3%a 0.0%1 0.0%1 0.2%a 0.0%1
Total 100.0% 100.0% 100.0% 100.0% 100.0% 100.0% 100.0% 100.0% 100.0%
Unweighted Sample Size 39 114 223 85 153 139 112 174 82
Age Groups Education Level Political Beliefs
What is your current
occupation?

Page 63
Section 3.5 – What Direction are Things Heading? – St. Lawrence County & the Entire Country
Table 39 – Generally speaking, would you say things in St. Lawrence County are heading in the right or wrong direction?
2020 St. Lawrence County Results:
Trend Analysis:
Not measured in earlier St. Lawrence County studies.
Northern New York Regional Comparison:
St. Lawrence County Cross-tabulations (2020):
Unweighted
Frequency
Weighted
Percentage
Right direction 152 35.5%
Wrong direction 134 34.0%
Don't Know/Not sure 119 30.5%
Totals 405 100.0%
Would you say that things in
St. Lawrence County are
heading in the right direction
or wrong direction?
St. Lawrence Jefferson Lewis
Right direction 35.5%b 43.2%a 49.3%a
Wrong direction 34.0%b 23.0%a 29.5%a,b
Don't Know/Not sure 30.5%a 33.8%a 21.1%b
Totals: 100.0% 100.0% 100.0%
Unweighted n: 405 569 463
County
Would you say that things in
________ County are
heading in the right direction
or wrong direction?
Countywide
All
ParticipantsMale Female
Up to
$25,000
$25,001-
$50,000
$50,001-
$75,000
$75,001-
$100,000
Over
$100,000
Right direction 35.5% 35.2%a 36.0%a 41.1%a 30.9%a 36.1%a 31.5%a 31.0%a
Wrong direction 34.0% 33.4%a 34.3%a 23.2%a 29.1%a 39.7%a 48.4%a 39.9%a
Don't Know/Not sure 30.5% 31.4%a 29.7%a 35.7%a 39.9%a 24.2%a 20.1%a 29.1%a
Total 100.0% 100.0% 100.0% 100.0% 100.0% 100.0% 100.0% 100.0%
Unweighted Sample Size 405 162 239 41 79 84 60 68
Gender Annual Household Income
Would you say that things in
St. Lawrence County are
heading in the right direction
or wrong direction?
18-39 40-59 60+HSG or
less
Some
college
4YD or
moreConservative Neither Liberal
Right direction 31.1%a 32.6%a 43.8%a 40.9%a 30.9%a 33.4%a 44.1%a 34.6%a,b 18.9%b
Wrong direction 37.5%a 35.6%a 28.0%a 31.9%a 35.4%a 35.6%a 31.5%a 34.8%a 39.3%a
Don't Know/Not sure 31.4%a 31.8%a 28.2%a 27.2%a 33.7%a 31.0%a 24.5%a 30.6%a 41.8%a
Total 100.0% 100.0% 100.0% 100.0% 100.0% 100.0% 100.0% 100.0% 100.0%
Unweighted Sample Size 44 127 230 95 164 143 118 189 85
Age Groups Education Level Political Beliefs
Would you say that things in
St. Lawrence County are
heading in the right direction
or wrong direction?

Page 64
Table 40 – Generally speaking, would you say things in this country are heading in the right or wrong direction?
2020 St. Lawrence County Results: Trend Analysis - Graphical Presentation:
Trend Analysis:
Northern New York Regional Comparison:
St. Lawrence County Cross-tabulations (2020):
Unweighted
Frequency
Weighted
Percentage
Right direction 105 26.7%
Wrong direction 229 53.7%
Don't Know/Not sure 72 19.6%
Totals 406 100.0%
Would you say that things in
this country are heading in the
right direction or wrong
direction?
2019 2020
Right Direction 39% 27%
Wrong Direction 48% 54%
Don’t Know/Not sure 14% 20%
St. Lawrence Jefferson Lewis
Right direction 26.7%a 33.2%a 31.6%a
Wrong direction 53.7%a 49.5%a 49.8%a
Don't Know/Not sure 19.6%a 17.3%a 18.6%a
Totals: 100.0% 100.0% 100.0%
Unweighted n: 406 570 462
County
Would you say that things in
this country are heading in
the right direction or wrong
direction?
Countywide
All
ParticipantsMale Female
Up to
$25,000
$25,001-
$50,000
$50,001-
$75,000
$75,001-
$100,000
Over
$100,000
Right direction 26.7% 32.9%a 20.6%b 26.3%a 26.3%a 31.3%a 30.8%a 20.5%a
Wrong direction 53.7% 49.9%a 57.5%a 50.9%a 41.3%a 59.5%a 55.9%a 58.0%a
Don't Know/Not sure 19.6% 17.2%a 21.8%a 22.9%a,b 32.4%a 9.2%b 13.3%a,b 21.6%a,b
Total 100.0% 100.0% 100.0% 100.0% 100.0% 100.0% 100.0% 100.0%
Unweighted Sample Size 406 162 240 42 79 84 60 68
Gender Annual Household Income
Would you say that things in
this country are heading in the
right direction or wrong
direction?
18-39 40-59 60+HSG or
less
Some
college
4YD or
moreConservative Neither Liberal
Right direction 22.3%a 26.7%a 31.5%a 30.3%a 22.1%a 27.5%a 38.2%a 24.3%b 8.7%c
Wrong direction 57.7%a 52.6%a 50.8%a 50.2%a 55.3%a 58.4%a 37.2%a 54.7%b 85.9%c
Don't Know/Not sure 20.0%a 20.7%a 17.8%a 19.5%a 22.6%a 14.1%a 24.6%a 21.1%a 5.4%b
Total 100.0% 100.0% 100.0% 100.0% 100.0% 100.0% 100.0% 100.0% 100.0%
Unweighted Sample Size 44 127 231 95 164 144 118 189 86
Age Groups Education Level Political Beliefs
Would you say that things in
this country are heading in the
right direction or wrong
direction?
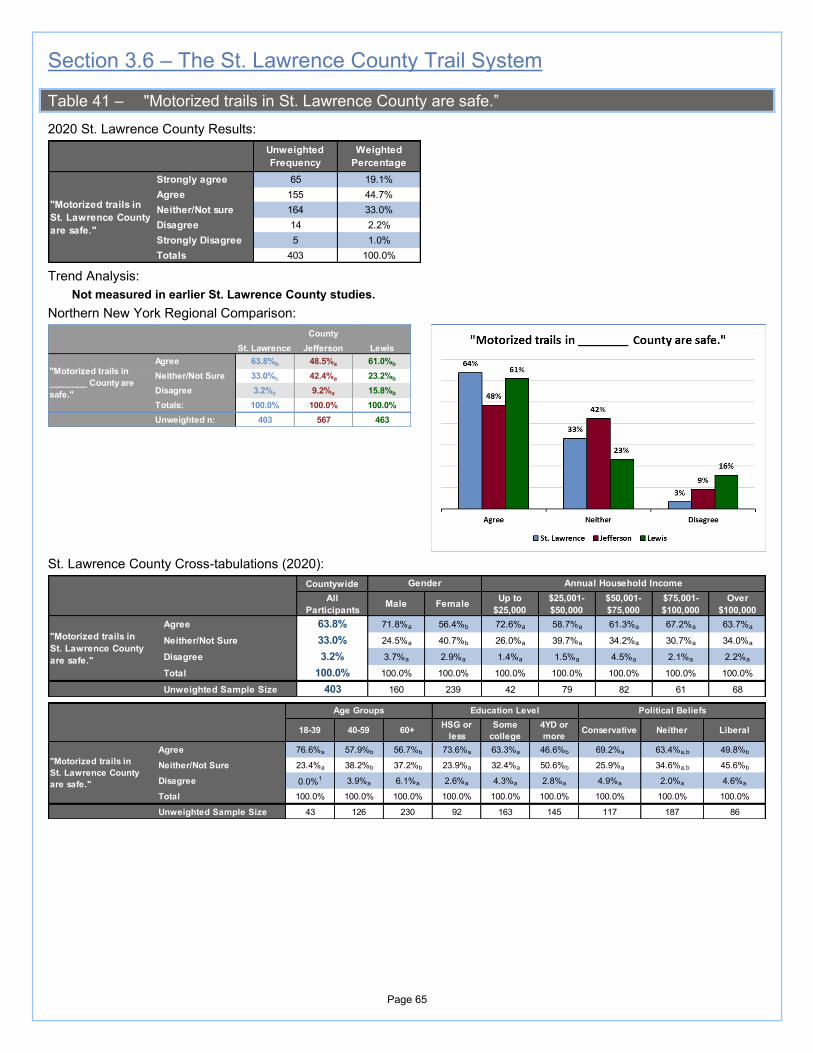
Page 65
Section 3.6 – The St. Lawrence County Trail System
Table 41 – "Motorized trails in St. Lawrence County are safe.”
2020 St. Lawrence County Results:
Trend Analysis:
Not measured in earlier St. Lawrence County studies.
Northern New York Regional Comparison:
St. Lawrence County Cross-tabulations (2020):
Unweighted
Frequency
Weighted
Percentage
Strongly agree 65 19.1%
Agree 155 44.7%
Neither/Not sure 164 33.0%
Disagree 14 2.2%
Strongly Disagree 5 1.0%
Totals 403 100.0%
"Motorized trails in
St. Lawrence County
are safe."
St. Lawrence Jefferson Lewis
Agree 63.8%b 48.5%a 61.0%b
Neither/Not Sure 33.0%c 42.4%a 23.2%b
Disagree 3.2%c 9.2%a 15.8%b
Totals: 100.0% 100.0% 100.0%
Unweighted n: 403 567 463
County
"Motorized trails in
________ County are
safe."
Countywide
All
ParticipantsMale Female
Up to
$25,000
$25,001-
$50,000
$50,001-
$75,000
$75,001-
$100,000
Over
$100,000
Agree 63.8% 71.8%a 56.4%b 72.6%a 58.7%a 61.3%a 67.2%a 63.7%a
Neither/Not Sure 33.0% 24.5%a 40.7%b 26.0%a 39.7%a 34.2%a 30.7%a 34.0%a
Disagree 3.2% 3.7%a 2.9%a 1.4%a 1.5%a 4.5%a 2.1%a 2.2%a
Total 100.0% 100.0% 100.0% 100.0% 100.0% 100.0% 100.0% 100.0%
Unweighted Sample Size 403 160 239 42 79 82 61 68
Gender Annual Household Income
"Motorized trails in
St. Lawrence County
are safe."
18-39 40-59 60+HSG or
less
Some
college
4YD or
moreConservative Neither Liberal
Agree 76.6%a 57.9%b 56.7%b 73.6%a 63.3%a 46.6%b 69.2%a 63.4%a,b 49.8%b
Neither/Not Sure 23.4%a 38.2%b 37.2%b 23.9%a 32.4%a 50.6%b 25.9%a 34.6%a,b 45.6%b
Disagree 0.0%1 3.9%a 6.1%a 2.6%a 4.3%a 2.8%a 4.9%a 2.0%a 4.6%a
Total 100.0% 100.0% 100.0% 100.0% 100.0% 100.0% 100.0% 100.0% 100.0%
Unweighted Sample Size 43 126 230 92 163 145 117 187 86
Age Groups Education Level Political Beliefs
"Motorized trails in
St. Lawrence County
are safe."

Page 66
Table 42 – "There is adequate law enforcement presence on the County’s motorized trail system."
2020 St. Lawrence County Results:
Trend Analysis:
Not measured in earlier St. Lawrence County studies.
Northern New York Regional Comparison:
St. Lawrence County Cross-tabulations (2020):
Unweighted
Frequency
Weighted
Percentage
Strongly agree 40 12.5%
Agree 103 28.9%
Neither/Not sure 202 42.9%
Disagree 43 12.4%
Strongly Disagree 15 3.3%
Totals 403 100.0%
"There is adequate
law enforcement
presence on the
County’s motorized
trail system."
St. Lawrence Jefferson Lewis
Agree 41.4%a,b 35.1%a 45.5%b
Neither/Not Sure 42.9%a 49.0%a 30.8%b
Disagree 15.7%a 15.9%a 23.7%b
Totals: 100.0% 100.0% 100.0%
Unweighted n: 403 567 462
County
"There is adequate law
enforcement presence
on the County’s
motorized trail system."
Countywide
All
ParticipantsMale Female
Up to
$25,000
$25,001-
$50,000
$50,001-
$75,000
$75,001-
$100,000
Over
$100,000
Agree 41.4% 48.0%a 35.3%b 40.4%a 37.3%a 49.0%a 52.1%a 39.3%a
Neither/Not Sure 42.9% 34.3%a 50.5%b 28.1%a 54.9%b 36.8%a,b 36.3%a,b 50.3%a,b
Disagree 15.7% 17.7%a 14.2%a 31.4%a 7.8%b 14.2%a,b 11.6%a,b 10.5%a,b
Total 100.0% 100.0% 100.0% 100.0% 100.0% 100.0% 100.0% 100.0%
Unweighted Sample Size 403 160 239 42 79 82 61 68
Gender Annual Household Income
"There is adequate law
enforcement presence
on the County’s
motorized trail system."
18-39 40-59 60+HSG or
less
Some
college
4YD or
moreConservative Neither Liberal
Agree 44.3%a 40.1%a 40.0%a 45.9%a 43.4%a,b 29.9%b 54.7%a 35.4%b 33.5%b
Neither/Not Sure 34.5%a 47.9%a 45.6%a 37.2%a 40.2%a 57.1%b 33.9%a 42.4%a 61.3%b
Disagree 21.1%a 12.0%a 14.4%a 16.9%a 16.4%a 13.0%a 11.4%a 22.3%b 5.1%a
Total 100.0% 100.0% 100.0% 100.0% 100.0% 100.0% 100.0% 100.0% 100.0%
Unweighted Sample Size 43 126 230 92 163 145 117 187 86
Age Groups Education Level Political Beliefs
"There is adequate law
enforcement presence
on the County’s
motorized trail system."

Page 67
Table 43 – "More people would utilize the motorized trail system if it were safer."
2020 St. Lawrence County Results:
Trend Analysis:
Not measured in earlier St. Lawrence County studies.
Northern New York Regional Comparison:
St. Lawrence County Cross-tabulations (2020):
Unweighted
Frequency
Weighted
Percentage
Strongly agree 26 8.0%
Agree 84 22.3%
Neither/Not sure 213 46.6%
Disagree 65 18.9%
Strongly Disagree 12 4.3%
Totals 400 100.0%
"More people would
utilize the motorized
trail system if it were
safer."
St. Lawrence Jefferson Lewis
Agree 30.2%a 36.8%a 37.9%a
Neither/Not Sure 46.6%a 47.4%a 35.6%b
Disagree 23.2%b 15.8%a 26.4%b
Totals: 100.0% 100.0% 100.0%
Unweighted n: 400 567 463
County
"More people would
utilize the motorized
trail system if it were
safer."
Countywide
All
ParticipantsMale Female
Up to
$25,000
$25,001-
$50,000
$50,001-
$75,000
$75,001-
$100,000
Over
$100,000
Agree 30.2% 27.4%a 33.1%a 30.0%a 14.1%a 28.5%a 29.4%a 33.8%a
Neither/Not Sure 46.6% 44.3%a 48.2%a 43.9%a,b 67.5%a 46.9%a,b 41.9%b 42.9%b,c
Disagree 23.2% 28.3%a 18.7%b 26.1%a 18.3%a 24.6%a 28.6%a 23.3%a
Total 100.0% 100.0% 100.0% 100.0% 100.0% 100.0% 100.0% 100.0%
Unweighted Sample Size 400 159 237 42 79 82 59 68
Gender Annual Household Income
"More people would
utilize the motorized
trail system if it were
safer."
18-39 40-59 60+HSG or
less
Some
college
4YD or
moreConservative Neither Liberal
Agree 39.4%a 24.3%b 26.9%a,b 32.8%a 25.1%a 34.2%a 32.4%a,b 25.4%a 41.6%b
Neither/Not Sure 36.8%a 48.5%a,b 54.2%b 41.3%a 49.0%a 51.6%a 43.4%a 49.7%a 40.5%a
Disagree 23.8%a 27.1%a 19.0%a 26.0%a 25.9%a 14.3%a 24.2%a 24.9%a 17.9%a
Total 100.0% 100.0% 100.0% 100.0% 100.0% 100.0% 100.0% 100.0% 100.0%
Unweighted Sample Size 43 126 227 91 162 144 116 186 86
Age Groups Education Level Political Beliefs
"More people would
utilize the motorized
trail system if it were
safer."

Page 68
Table 44 – “Hiking and walking trails are easy to find and well-marked."
2020 St. Lawrence County Results:
Trend Analysis:
Not measured in earlier St. Lawrence County studies.
Northern New York Regional Comparison:
St. Lawrence County Cross-tabulations (2020):
Unweighted
Frequency
Weighted
Percentage
Strongly agree 71 18.6%
Agree 169 43.8%
Neither/Not sure 118 27.9%
Disagree 37 8.8%
Strongly disagree 6 0.9%
Totals 401 100.0%
"Hiking and walking
trails are easy to find
and well-marked."
St. Lawrence Jefferson Lewis
Agree 62.4%a 59.9%a 56.2%a
Neither/Not Sure 27.9%a 24.0%a 24.7%a
Disagree 9.7%b 16.1%a 19.1%a
Totals: 100.0% 100.0% 100.0%
Unweighted n: 401 566 459
County
"Hiking and walking
trails are easy to find
and well-marked."
Countywide
All
ParticipantsMale Female
Up to
$25,000
$25,001-
$50,000
$50,001-
$75,000
$75,001-
$100,000
Over
$100,000
Agree 62.4% 66.4%a 59.3%a 65.4%a 49.8%a 58.1%a 61.7%a 72.8%a
Neither/Not Sure 27.9% 25.6%a 29.2%a 31.0%a,b 46.2%a 29.3%a,b 19.1%b 11.2%b,c
Disagree 9.7% 8.0%a 11.5%a 3.6%a 4.0%a 12.6%a 19.2%a 16.0%a
Total 100.0% 100.0% 100.0% 100.0% 100.0% 100.0% 100.0% 100.0%
Unweighted Sample Size 401 160 237 42 78 82 60 68
Gender Annual Household Income
"Hiking and walking
trails are easy to find
and well-marked."
18-39 40-59 60+HSG or
less
Some
college
4YD or
moreConservative Neither Liberal
Agree 73.7%a 59.7%b 54.4%b 65.6%a 59.1%a 63.1%a 61.1%a 62.7%a 68.5%a
Neither/Not Sure 19.3%a 26.9%a,b 36.8%b 28.9%a 30.1%a 20.9%a 31.9%a 26.3%a 20.3%a
Disagree 7.0%a 13.3%a 8.9%a 5.5%a 10.7%a,b 16.0%b 7.0%a 11.0%a 11.2%a
Total 100.0% 100.0% 100.0% 100.0% 100.0% 100.0% 100.0% 100.0% 100.0%
Unweighted Sample Size 43 126 228 92 162 144 117 185 86
Age Groups Education Level Political Beliefs
"Hiking and walking
trails are easy to find
and well-marked."

Page 69
Section 3.7 – Potential Legalization of Recreational Marijuana Use in New York State – Opinions about Growth and Sale in St. Lawrence County
Table 45 – If recreational marijuana were legalized by New York State, would you support or oppose the sale of marijuana in St. Lawrence County?
2020 St. Lawrence County Results:
Trend Analysis:
Not measured in earlier St. Lawrence County studies.
Northern New York Regional Comparison:
St. Lawrence County Cross-tabulations (2020):
Unweighted
Frequency
Weighted
Percentage
Support 211 60.6%
Oppose 122 22.8%
Neither 33 10.1%
Not sure 33 6.6%
Totals 399 100.0%
Would you support or
oppose the sale of
marijuana in St.
Lawrence County?
St. Lawrence Jefferson Lewis
Support 60.6%a 59.1%a 42.9%b
Oppose 22.8%c 31.0%a 43.3%b
Neither 10.1%a 6.6%a 10.1%a
Not sure 6.6%b 3.3%a 3.7%a,b
Totals: 100.0% 100.0% 100.0%
Unweighted n: 399 569 463
County
Would you support or
oppose the sale of
marijuana in ________
County?
Countywide
All
ParticipantsMale Female
Up to
$25,000
$25,001-
$50,000
$50,001-
$75,000
$75,001-
$100,000
Over
$100,000
Support 60.6% 66.9%a 54.6%b 73.8%a 59.5%a 59.6%a 63.7%a 61.8%a
Oppose 22.8% 20.0%a 24.9%a 19.2%a 17.8%a 22.3%a 22.2%a 23.0%a
Neither 10.1% 10.5%a 9.8%a 5.6%a 12.1%a 9.2%a 9.8%a 13.8%a
Not sure 6.6% 2.5%a 10.7%b 1.5%a 10.6%a 9.0%a 4.3%a 1.5%a
Total 100.0% 100.0% 100.0% 100.0% 100.0% 100.0% 100.0% 100.0%
Unweighted Sample Size 399 160 235 42 79 84 61 68
Gender Annual Household Income
Would you support or
oppose the sale of
marijuana in St.
Lawrence County?
18-39 40-59 60+HSG or
less
Some
college
4YD or
moreConservative Neither Liberal
Support 82.5%a 59.8%b 38.3%c 59.9%a 58.3%a 65.2%a 46.8%a 64.3%b 75.0%b
Oppose 6.4%a 19.6%b 42.8%c 24.0%a 18.9%a 26.4%a 33.6%a 17.9%b 16.6%a,b
Neither 8.7%a 12.4%a 9.3%a 8.9%a 14.7%a 4.9%a 7.8%a 13.3%a 4.8%a
Not sure 2.4%a 8.3%a,b 9.6%b 7.1%a 8.1%a 3.5%a 11.8%a 4.5%b 3.6%a,b
Total 100.0% 100.0% 100.0% 100.0% 100.0% 100.0% 100.0% 100.0% 100.0%
Unweighted Sample Size 42 127 226 91 161 144 118 187 86
Age Groups Education Level Political Beliefs
Would you support or
oppose the sale of
marijuana in St.
Lawrence County?

Page 70
Table 46 – If recreational marijuana were legalized by New York State, would you support or oppose allowing farmers to grow and profit from this new industry in St. Lawrence County?
2020 St. Lawrence County Results:
Trend Analysis:
Not measured in earlier St. Lawrence County studies.
Northern New York Regional Comparison:
St. Lawrence County Cross-tabulations (2020):
Unweighted
Frequency
Weighted
Percentage
Support 257 71.1%
Oppose 91 16.8%
Neither 21 6.7%
Not sure 27 5.5%
Totals 396 100.0%
Would you support or
oppose allowing farmers to
grow and profit from this
new industry in St.
Lawrence County?
St. Lawrence Jefferson Lewis
Support 71.1%a 67.6%a 53.7%b
Oppose 16.8%b 25.7%a 31.9%a
Neither 6.7%b 3.2%a 8.1%b
Not sure 5.5%a 3.5%a 6.3%a
Totals: 100.0% 100.0% 100.0%
Unweighted n: 396 568 462
County
Would you support or
oppose allowing farmers
to grow and profit from
this new industry in
________ County?
Countywide
All
ParticipantsMale Female
Up to
$25,000
$25,001-
$50,000
$50,001-
$75,000
$75,001-
$100,000
Over
$100,000
Support 71.1% 76.5%a 66.2%b 85.4%a 69.5%a 73.8%a 77.2%a 81.2%a
Oppose 16.8% 16.0%a 17.4%a 11.1%a 13.4%a 15.0%a 17.8%a 10.0%a
Neither 6.7% 5.3%a 7.6%a 2.0%a 11.0%a 3.8%a 4.4%a 7.3%a
Not sure 5.5% 2.2%a 8.8%b 1.5%a 6.1%a 7.4%a 0.6%a 1.5%a
Total 100.0% 100.0% 100.0% 100.0% 100.0% 100.0% 100.0% 100.0%
Unweighted Sample Size 396 159 233 41 78 84 61 68
Gender Annual Household Income
Would you support or
oppose allowing farmers
to grow and profit from
this new industry in St.
Lawrence County?
18-39 40-59 60+HSG or
less
Some
college
4YD or
moreConservative Neither Liberal
Support 86.0%a 73.5%b 53.0%c 67.2%a 73.3%a 74.7%a 59.5%a 74.6%b 82.5%b
Oppose 5.3%a 13.4%a 32.6%b 20.6%a 12.2%a 18.0%a 27.7%a 13.4%b 6.6%b
Neither 6.2%a 6.7%a 6.5%a 6.4%a 7.9%a 4.0%a 6.9%a 8.0%a 0.7%a
Not sure 2.4%a 6.4%a 8.0%a 5.7%a 6.6%a 3.4%a 5.9%a 3.9%a 10.3%a
Total 100.0% 100.0% 100.0% 100.0% 100.0% 100.0% 100.0% 100.0% 100.0%
Unweighted Sample Size 41 127 224 90 160 143 117 185 86
Age Groups Education Level Political Beliefs
Would you support or
oppose allowing farmers
to grow and profit from
this new industry in St.
Lawrence County?

Page 71
Section 3.8 – Internet Access and Use in St. Lawrence County–Employment and Learning
Table 47 – What kind of Internet connection do you use at home?
2020 St. Lawrence County Results:
Trend Analysis:
Not measured in earlier St. Lawrence County studies.
Northern New York Regional Comparison:
St. Lawrence County Cross-tabulations (2020):
Unweighted
Frequency
Weighted
Percentage
Cable TV Modem 265 65.1%
Cell Phone 186 49.1%
Fiber Optic 83 20.3%
Satellite Dish 47 10.7%
DSL 38 8.8%
WiFi (Mohawk, TDS, etc.) 1 0.3%
No Internet Access 3 0.7%
Totals 401 100.0%
What kind of Internet
connection do you
use at home?
St. Lawrence Jefferson Lewis
Cell Phone 49.1%b 58.1%a 45.3%b
Cable TV Modem 65.1%a,b 68.6%a 58.5%b
DSL 8.8%b 10.5%a,b 15.2%a
Fiber Optic 20.3%b 13.0%a 13.6%a
Satellite Dish 10.7%a,b 8.8%a 14.4%b
WiFi (Mohawk, TDS, etc.) 0.3%a 0.0%1 0.9%a
No Internet Access 0.7%a,b 0.4%a 2.8%b
Totals: 100.0% 100.0% 100.0%
Unweighted n: 401 568 455
County
What kind of Internet
connection do you use
at home?
Countywide
All
ParticipantsMale Female
Up to
$25,000
$25,001-
$50,000
$50,001-
$75,000
$75,001-
$100,000
Over
$100,000
Cable TV Modem 65.1% 71.1%a 59.6%b 53.3%a 55.9%a 71.3%a 69.7%a 65.6%a
Cell Phone 49.1% 45.7%a 52.0%a 50.9%a 55.5%a 46.8%a 49.9%a 44.1%a
Fiber Optic 20.3% 16.2%a 24.6%b 27.2%a 19.0%a 19.2%a 14.3%a 30.2%a
Satellite Dish 10.7% 10.2%a 10.9%a 18.3%a 7.8%a,b 5.9%a,b 16.2%a,b 1.9%b
DSL 8.8% 7.2%a 10.6%a 10.3%a 10.1%a 5.0%a 9.0%a 3.8%a
WiFi (Mohawk, TDS, etc.) 0.3% 0.0%2 0.5%a 0.0%2 1.3%a 0.0%2 0.0%2 0.0%2
No Internet Access 0.7% 0.0%2 0.8%a 0.0%2 2.1%a 0.0%2 0.0%2 0.0%2
Total 100.0% 100.0% 100.0% 100.0% 100.0% 100.0% 100.0% 100.0%
Unweighted Sample Size 401 161 236 42 79 84 60 68
Gender Annual Household Income
What kind of Internet
connection do you use
at home?
18-39 40-59 60+HSG or
less
Some
college
4YD or
moreConservative Neither Liberal
Cable TV Modem 63.5%a 67.4%a 64.9%a 63.0%a 64.6%a 70.9%a 62.2%a 63.3%a 79.8%a
Cell Phone 57.3%a 48.9%a,b 39.8%b 46.9%a,b 58.7%a 36.6%b 50.2%a 50.8%a 40.8%a
Fiber Optic 22.8%a 21.5%a 16.9%a 19.1%a 21.3%a 21.5%a 21.2%a 22.6%a 10.1%a
Satellite Dish 9.0%a,b 6.5%a 16.6%b 15.7%a 7.2%a 6.7%a 12.2%a 9.7%a 10.9%a
DSL 10.9%a 6.2%a 9.7%a 10.5%a 7.2%a 8.7%a 10.6%a 9.2%a 4.9%a
WiFi (Mohawk, TDS, etc.) 0.0%1 0.0%1 0.8%a 0.6%a 0.0%1 0.0%1 0.8%a 0.0%1 0.0%1
No Internet Access 0.0%1 0.0%1 1.3%a 1.0%a 0.0%1 0.0%1 0.0%1 0.8%a 0.0%1
Total 100.0% 100.0% 100.0% 100.0% 100.0% 100.0% 100.0% 100.0% 100.0%
Unweighted Sample Size 43 128 226 90 162 146 117 187 85
Age Groups Education Level Political Beliefs
What kind of Internet
connection do you use
at home?

Page 72
Table 48 – Is anyone living in your household currently working remotely using the Internet?
2020 St. Lawrence County Results:
Trend Analysis:
Not measured in earlier St. Lawrence County studies.
Northern New York Regional Comparison:
St. Lawrence County Cross-tabulations (2020):
Unweighted
Frequency
Weighted
Percentage
No 312 76.6%
Yes, part of their job is remote. 62 15.5%
Yes, their entire job is remote. 29 7.4%
Not sure 1 0.5%
Totals 404 100.0%
Working remotely
using the Internet?
St. Lawrence Jefferson Lewis
No 76.6%a 70.1%a 76.6%a
Yes, part of their job is remote. 15.5%a 18.4%a 15.5%a
Yes, their entire job is remote. 7.4%a 10.6%a 6.5%a
Not sure 0.5%a 0.9%a 1.4%a
Totals: 100.0% 100.0% 100.0%
Unweighted n: 404 570 464
County
Working remotely
using the Internet?
Countywide
All
ParticipantsMale Female
Up to
$25,000
$25,001-
$50,000
$50,001-
$75,000
$75,001-
$100,000
Over
$100,000
No 76.6% 76.4%a 76.4%a 91.8%a 84.2%a,b 70.7%b 72.3%a,b 67.0%b,c
Yes, part of their job is remote. 15.5% 15.3%a 16.0%a 4.7%a 10.5%a,b 24.3%b 22.0%a,b 23.5%b,c
Yes, their entire job is remote. 7.4% 8.3%a 6.6%a 0.0%2 5.3%a 5.0%a 5.7%a 9.5%a
Not sure 0.5% 0.0%2 1.0%a 3.6%a 0.0%2 0.0%2 0.0%2 0.0%2
Total 100.0% 100.0% 100.0% 100.0% 100.0% 100.0% 100.0% 100.0%
Unweighted Sample Size 404 161 239 42 78 84 61 68
Gender Annual Household Income
Working remotely
using the Internet?
18-39 40-59 60+HSG or
less
Some
college
4YD or
moreConservative Neither Liberal
No 71.6%a 69.7%a 88.9%b 87.0%a 77.2%a 56.2%b 82.7%a 75.8%a 69.2%a
Yes, part of their job is remote. 17.9%a 20.9%a 7.5%b 8.4%a 16.6%a,b 26.9%b 9.3%a 18.7%a 20.1%a
Yes, their entire job is remote. 10.5%a 8.0%a 3.6%a 3.3%a 6.2%a 16.9%b 8.0%a 4.5%a 10.7%a
Not sure 0.0%1 1.4%a 0.0%1 1.2%a 0.0%1 0.0%1 0.0%1 0.9%a 0.0%1
Total 100.0% 100.0% 100.0% 100.0% 100.0% 100.0% 100.0% 100.0% 100.0%
Unweighted Sample Size 43 128 229 91 164 146 117 189 86
Age Groups Education Level Political Beliefs
Working remotely
using the Internet?

Page 73
Table 49 – Is anyone living in your household currently learning remotely from home using the Internet?
2020 St. Lawrence County Results:
Trend Analysis:
Not measured in earlier St. Lawrence County studies.
Northern New York Regional Comparison:
St. Lawrence County Cross-tabulations (2020):
Unweighted
Frequency
Weighted
Percentage
Yes (only K-12) 71 26.1%
Yes (only college coursework) 31 9.5%
Yes (both K-12 and college) 10 2.1%
No 291 62.0%
Not sure 1 0.3%
Totals 404 100.0%
Learning remotely
from home using the
Internet?
St. Lawrence Jefferson Lewis
Yes (only K-12) 26.1%b 17.2%a 18.8%a
Yes (only college coursework) 9.5%b 17.2%a 6.7%b
Yes (both K-12 and college) 2.1%b 7.2%a 6.1%a
No 62.0%a,b 57.5%a 68.3%b
Not sure 0.3%a 0.9%a 0.1%a
Totals: 100.0% 100.0% 100.0%
Unweighted n: 404 568 464
County
Learning remotely
from home using the
Internet?
Countywide
All
ParticipantsMale Female
Up to
$25,000
$25,001-
$50,000
$50,001-
$75,000
$75,001-
$100,000
Over
$100,000
Yes (only K-12) 26.1% 19.3%a 33.1%b 32.9%a 10.9%b 36.0%a 29.4%a,b 28.1%a,b
Yes (only college coursework) 9.5% 13.5%a 5.9%b 13.3%a 2.9%a 4.6%a 2.2%a 10.5%a
Yes (both K-12 and college) 2.1% 0.3%a 3.9%b 0.0%2 4.4%a 3.0%a 1.0%a 3.5%a
No 62.0% 66.2%a 57.1%a 53.8%a 81.8%b 54.9%a 67.4%a,b 58.0%a
Not sure 0.3% 0.6%a 0.0%2 0.0%2 0.0%2 1.5%a 0.0%2 0.0%2
Total 100.0% 100.0% 100.0% 100.0% 100.0% 100.0% 100.0% 100.0%
Unweighted Sample Size 404 161 239 42 79 83 61 68
Gender Annual Household Income
Learning remotely
from home using the
Internet?
18-39 40-59 60+HSG or
less
Some
college
4YD or
moreConservative Neither Liberal
Yes (only K-12) 44.9%a 26.6%b 6.3%c 25.9%a 25.3%a 28.6%a 13.4%a 32.9%b 22.7%a,b
Yes (only college coursework) 16.5%a 7.9%a,b 4.1%b 7.5%a 9.4%a 13.8%a 10.0%a 4.6%a 27.6%b
Yes (both K-12 and college) 2.3%a 2.9%a 1.0%a 0.0%1 4.1%a 2.7%a 1.1%a 2.7%a 2.4%a
No 36.3%a 61.7%b 88.6%c 66.6%a 60.3%a 54.9%a 75.5%a 59.2%b 47.3%b
Not sure 0.0%1 0.9%a 0.0%1 0.0%1 0.8%a 0.0%1 0.0%1 0.6%a 0.0%1
Total 100.0% 100.0% 100.0% 100.0% 100.0% 100.0% 100.0% 100.0% 100.0%
Unweighted Sample Size 43 127 230 92 163 146 118 188 86
Age Groups Education Level Political Beliefs
Learning remotely
from home using the
Internet?
Page 74
Appendix - The Survey Instrument
The Center for Community Studies at Jefferson Community College
1220 Coffeen Street Watertown, New York 13601
E-mail: commstudies @sunyjefferson.edu Website: www.sunyjefferson.edu/community/community-studies/