Embed Size (px)
Citation preview

Northstar as a Catalyst for
Strengthening Livable Communities
Coon Rapids, MN August 2, 2006
Mariia Zimmerman [email protected]
The Center for Transit Oriented Development
Market demand IS changing. Are we meeting that demand with our
transit investments? Are we promoting community benefits
with development?
• Collaborative effort: Center for Neighborhood Technology, Strategic Economics and stakeholders
1

Transportation Meets Many Goals • Improves Mobility of People and Goods
• Catalyst for Economic Development and Redevelopment
• Links Housing with Economic and Community Opportunities
• Environmental impacts: can be positive or negative
• Creates Sense of Place – Rivers, Roads, Airports, Streetcars
After Housing, Transportation is 2nd Major Expense
Affordability = Housing Costs + Transportation Costs
2
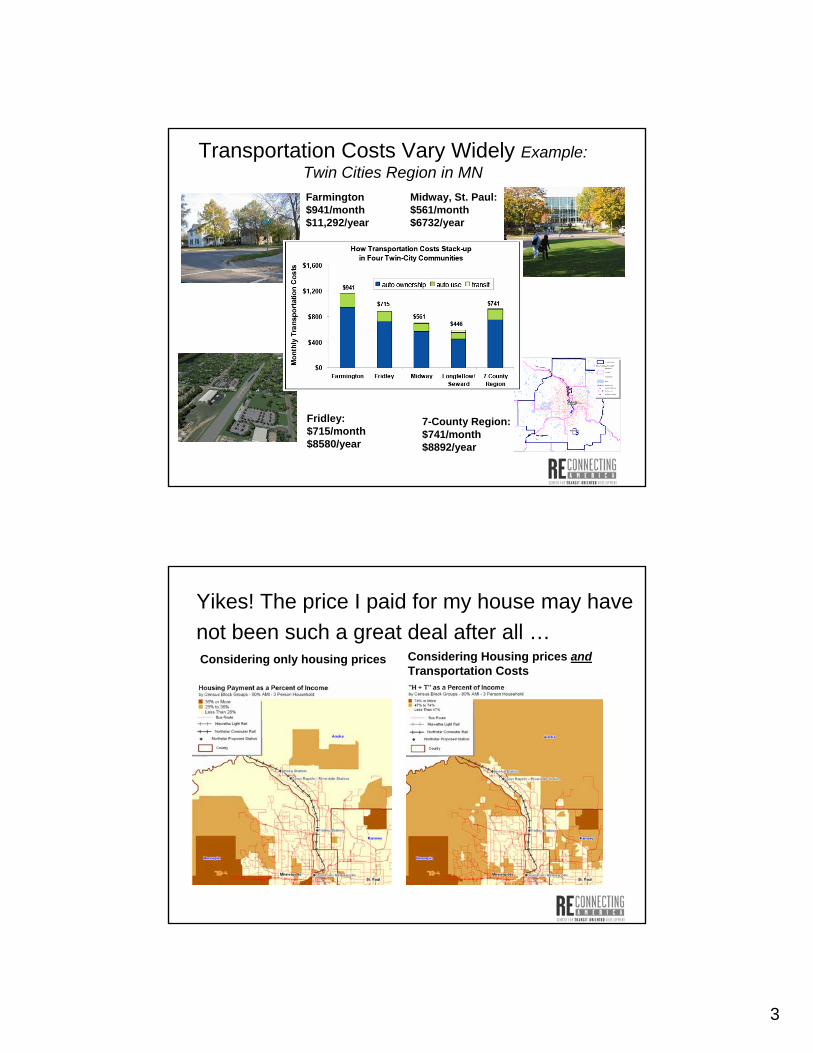
Transportation Costs Vary Widely Example: Twin Cities Region in MN
Farmington Midway, St. Paul: $941/month $561/month $11,292/year $6732/year
Fridley: 7-County Region: $715/month $741/month $8580/year $8892/year
Considering only housing prices Considering Housing prices and Transportation Costs
Yikes! The price I paid for my house may have not been such a great deal after all …
3

Our Communities are Growing and Changing
• Changing demographics, market forces and values are changing urban neighborhoods
• 90 million more people in next 25 years • Greater diversity, also greater disparity • Housing Preferences are Changing
Demand For Housing Near Transit is Growing
• By 2030, between 110,000 –124,000 Twin Cities’ households will have a potential demand for living near transit
• Nationally, demand for housing near transit could double to over 15 million households.
• 55% of these households will be non-family households(singles)
• 43% of the households with a potential demand for living neartransit qualify as Low Income
Hiawatha Line, Minneapolis
4
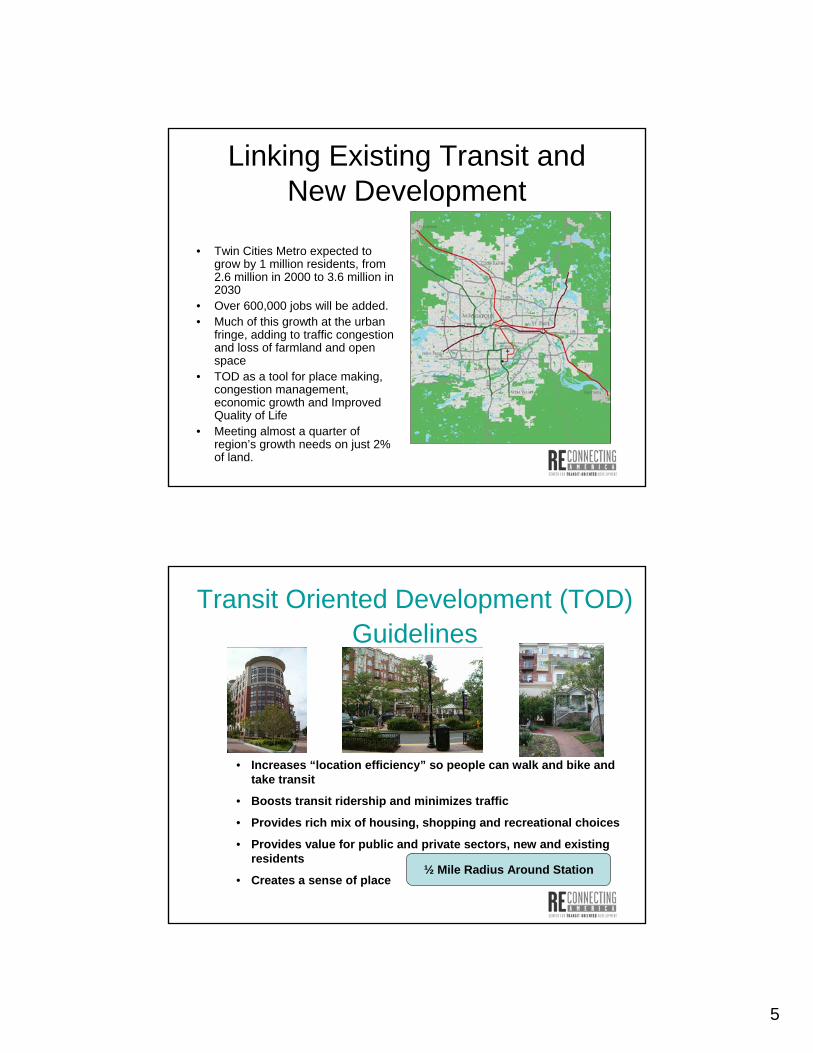
Linking Existing Transit and New Development
• Twin Cities Metro expected to grow by 1 million residents, from 2.6 million in 2000 to 3.6 million in 2030
• Over 600,000 jobs will be added. • Much of this growth at the urban
fringe, adding to traffic congestion and loss of farmland and open space
• TOD as a tool for place making, congestion management, economic growth and Improved Quality of Life
• Meeting almost a quarter of region’s growth needs on just 2% of land.
5
Transit Oriented Development (TOD) Guidelines
• Increases “location efficiency” so people can walk and bike and take transit
• Boosts transit ridership and minimizes traffic
• Provides rich mix of housing, shopping and recreational choices
• residents
• Creates a sense of place
Provides value for public and private sectors, new and existing
½ Mile Radius Around Station
Scale of Opportunity
Two types of projects:
• Transit-Oriented Development – Area w/in a 5 minute walk – Transit Villages / Town Centers/ urban
infill / greenfield
• Joint Development – On publicly owned land – Primarily with rail systems
Santa Ana TOD
Santa Ana Joint Development
6
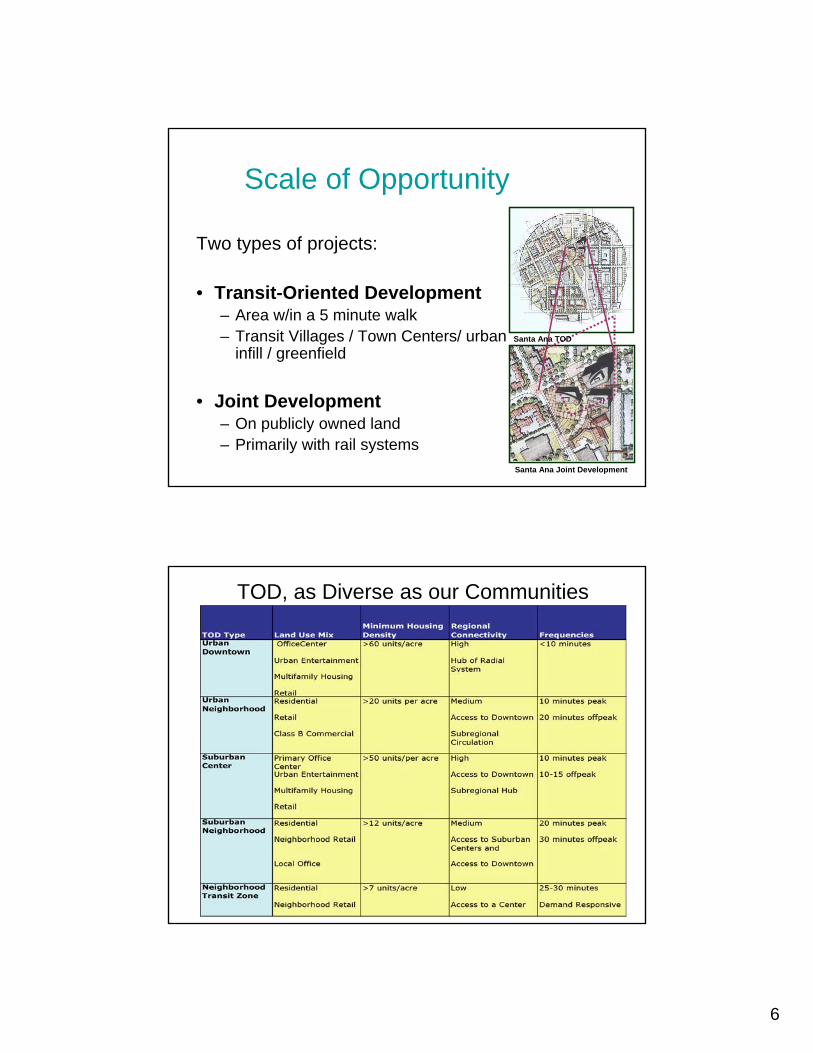
TOD, as Diverse as our Communities
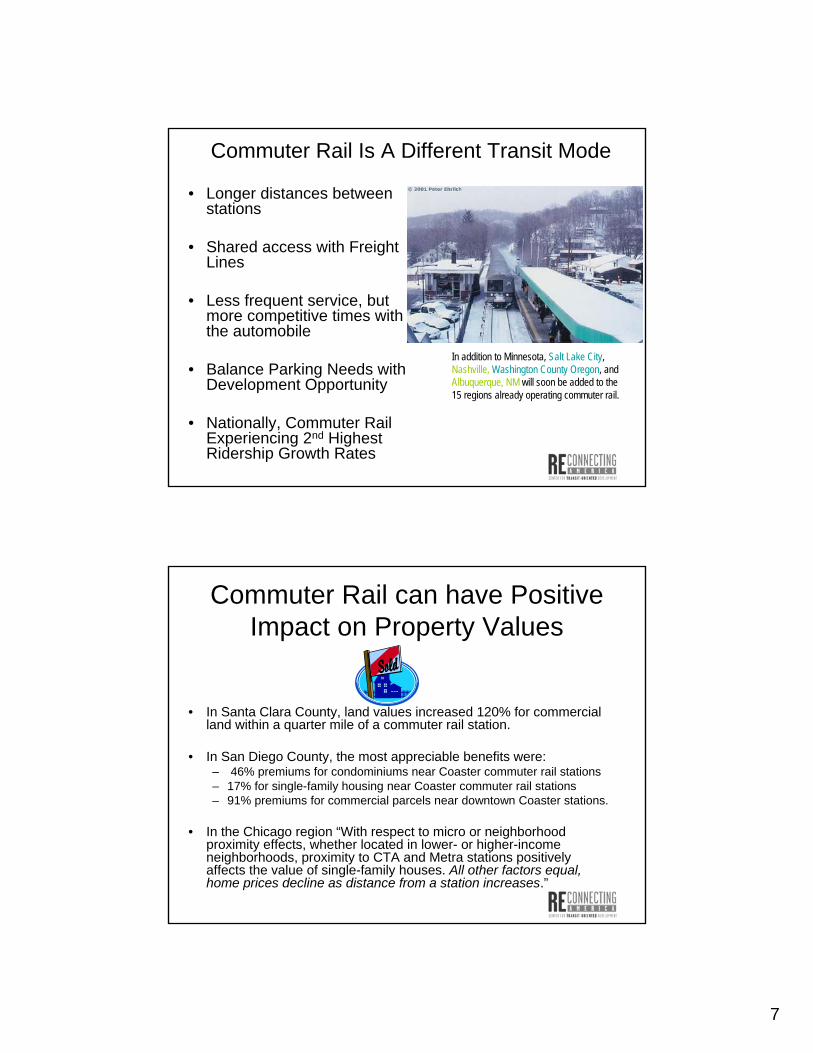
Commuter Rail Is A Different Transit Mode
• Longer distances between stations
• Shared access with Freight Lines
• Less frequent service, butmore competitive times withthe automobile
• Balance Parking Needs with Development Opportunity
• Nationally, Commuter Rail Experiencing 2nd HighestRidership Growth Rates
In addition to Minnesota, Salt Lake City, Nashville, Washington County Oregon, and Albuquerque, NM will soon be added to the 15 regions already operating commuter rail.
Commuter Rail can have Positive Impact on Property Values
• In Santa Clara County, land values increased 120% for commercialland within a quarter mile of a commuter rail station.
• In San Diego County, the most appreciable benefits were: – 46% premiums for condominiums near Coaster commuter rail stations – 17% for single-family housing near Coaster commuter rail stations – 91% premiums for commercial parcels near downtown Coaster stations.
• In the Chicago region “With respect to micro or neighborhood proximity effects, whether located in lower- or higher-income neighborhoods, proximity to CTA and Metra stations positively affects the value of single-family houses. All other factors equal, home prices decline as distance from a station increases.”
7

Commuter Rail’s ‘Choice Rider’ • 97 percent of riders are car
owners on some of Metrorail’s corridors in Southern California, and 65 percent of Metrolink riders previously drove solo.
• Ninety-five percent of riders own at least one car on the Trinity Express Railway in Dallas-Fort Worth.
Balance parking, design, and walkability
Existing Commuter Rail Systems
• Northern Virginia (Virginia RailwayExpress)
• Anchorage, AK (Alaska Railroad Corporation)
• Baltimore, MD (MARC Trains) • Boston, MA • Chesterton, IN (Northern Indiana
Commuter Transportation District) • Chicago, IL ((Northeast Illinois
Regional Commuter RailroadCorporation)
• Dallas, TX (Trinity Railway Express)
• Harrisburg, PA (PennsylvaniaDepartment of Transportation)
• Southern California Metrolink
• New Haven, CT (Shore Line East) • Long Island Rail Road • Newark, NJ (New Jersey Transit
Corporation) • Oceanside, CA Coaster Service • Philadelphia, PA (Southeastern
Pennsylvania Transportation Authority)
• South Florida Tri-Rail • San Carlos, CA CalTrain • Seattle, WA Sound Transit • Stockton, CA (Altamont Commuter
Express) • Syracuse, NY (On Track
Commuter Rail)
8

A look at 4 Different Commuter Rail Strategies
• Dallas: 5.7 million people in region, 35 miles Commuter Rail system with 9 stations •
• Seattle: 3.7 million people people in region, 63 mile in region, 80 mile system commuter rail line in NW with 9 stations area with 23 stations
• Twin Cities: 2.8 million people in region, 40 mile proposed commuter rail line with 6 stations
Chicago: 8.6 million
Evolving Dallas-Ft. Worth Market: Trinity Railway Express (TRE)
• Market for Commuter Rail TOD is much more sluggish than for LightRail
• Freight Rail traffic as a disincentive
• Financing for TOD on commuter rail is more challenging
• Good design and local policy framework isessential!
9
Seattle: Sounder Commuter Line
Municipalities rezoned to accommodate more transit-supportive land uses.
Leadership by SoundTransit (regional transit system) to aggressively pursue TOD as a ridership-building strategy.
Sumner Town Center, on Sounder line, developed to create a new, transit-oriented center for this small town.
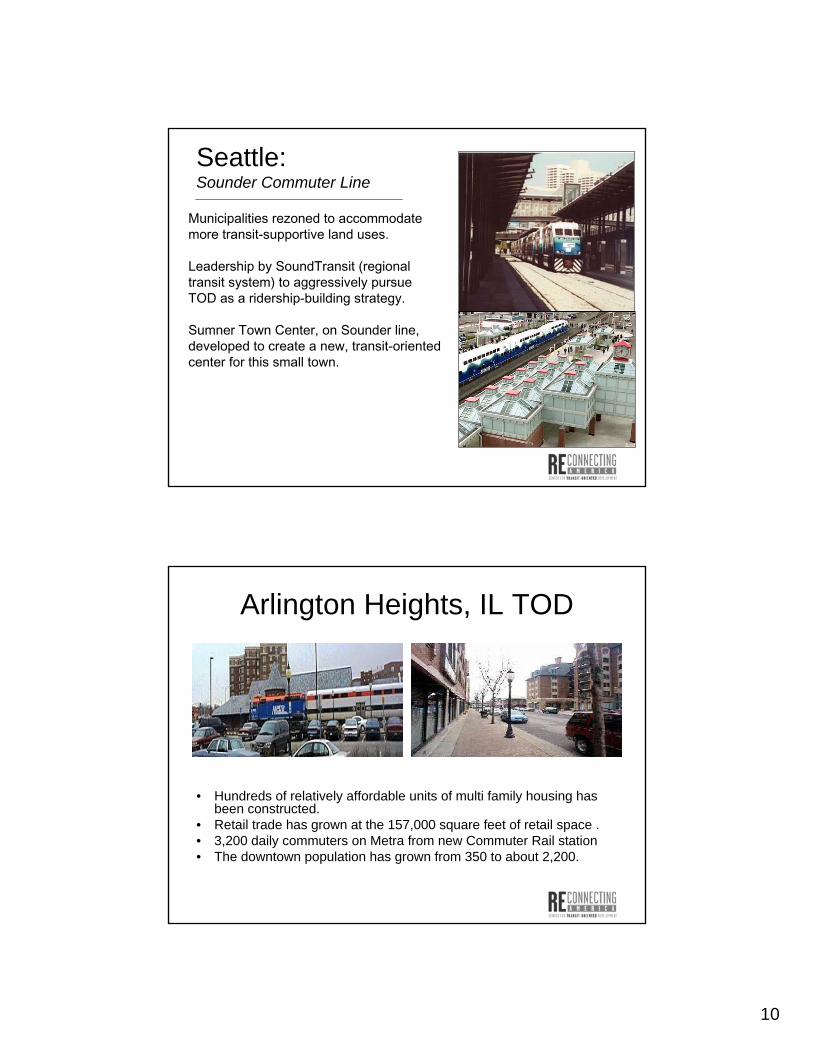
Arlington Heights, IL TOD
• Hundreds of relatively affordable units of multi family housing has been constructed.
• Retail trade has grown at the 157,000 square feet of retail space . • 3,200 daily commuters on Metra from new Commuter Rail station • The downtown population has grown from 350 to about 2,200.
10

Evanston, Illinois • Between 1990 - 2005, Evanston added
more than 2,472 housing units in the transit zones
• In the four-station area corridor, the population increased by 6% comparedto a 1.4% increase in the city overall from 1990 to 2000
• Metra ridership has increased bybetween 60% and 155% in Evanston
• 41% commute in Evanston by non-auto means, compared to 21% in the suburban metropolitan area transit zones
• In each of the four transit zones, vehicle ownership is 1.05 /household comparedto 1.3/household in the city
New streetscape and mixed use in Evanston, IL
Northstar corridor has lower densities and more land vacant land area adjacent to stations.
Population with ½ mile of stations
Fridley Station Area plan
11

i
Northstar Communites are interconnected
Top 5 places where residents work…
Anoka 2,020 22% Big Lake 540 17% Coon Rapids 6,615 19%
Coon Rapids 1,100 12% Monticello 375 12% Minneapolis 5,655 17%
Minneapolis 985 11% Minneapolis 200 6% Fridley 2,695 8%
Fridley 545 6% Elk River 175 5% Blaine 2,160 6%
Brooklyn Park 320 3% Plymouth 160 5% Anoka 1,760 5%
Elk River 2,835 33% Minneapolis 3,150 21% Minneapolis 107,980 53%
Anoka Coon Rapids B g Lake
Minneapolis Fridley Elk River
Minneapolis 655 8%
Plymouth 550 6% 6%11,370Bloomington 7%1,000St. Paul
7%13,715St. Paul20%3,095Fridley
Anoka 450 5% Blaine 530 3% Edina 7,390 4%
Coon Rapids 315 4% Coon Rapids 520 3% Minnetonka 5,355 3%
ON NORTHSTAR LINE
ON HIAWATHA / CENTRAL CORRIDORS LRT
Household Incomes Slightly Lower along Corridor Need for Fair and Full Range ofHousing Choices throughout the Region
12

Putting it Together For Minnesota
• Hiawatha is a tremendous opportunity to learn from – YES, a different mode and urban environment – BUT, demonstrates that Minnesotans like rail – AND, Rail as a powerful Development tool
• Partnerships – public/private and along the corridor
• Vision: at state, regional and local levels for existing and potential stations along corridor
• Balancing Nodes and Corridor – parking, station area TOD, transit access and connections
• Leadership: Who? At What level?
13