Embed Size (px)
Citation preview

The Certification of the Mass Fractions of As, Cd, Cu, Mn, Pb, Se and Zn in rice flour
IRMM-804
A. Held
Report EUR 22668

The mission of IRMM is to promote a common and reliable European measurement system in support of EU policies.
European Commission Directorate-General Joint Research Centre Institute for Reference Materials and Measurements Contact information A. Held European Commission Directorate-General Joint Research Centre Institute for Reference Materials and Measurements Retieseweg 111 B-2440 Geel • Belgium E-mail: [email protected] Tel.: +32 (0)14 571 957 Fax: +32 (0)14 571 548 http://www.irmm.jrc.be http://www.jrc.ec.europa.eu Legal Notice Neither the European Commission nor any person acting on behalf of the Commission is responsible for the use which might be made of the following information. A great deal of additional information on the European Union is available on the Internet. It can be accessed through the Europa server http://europa.eu.int EUR Report 22668 EN ISBN 978-92-79-04999-6 ISSN 1018-5593 Luxembourg: Office for Official Publications of the European Communities © European Communities, 2007 Reproduction is authorised provided the source is acknowledged Printed in Belgium

The Certification of the mass fractions of As, Cd, Cu, Mn, Pb, Se and Zn in rice flour
IRMM-804
A. Held
- 1 -
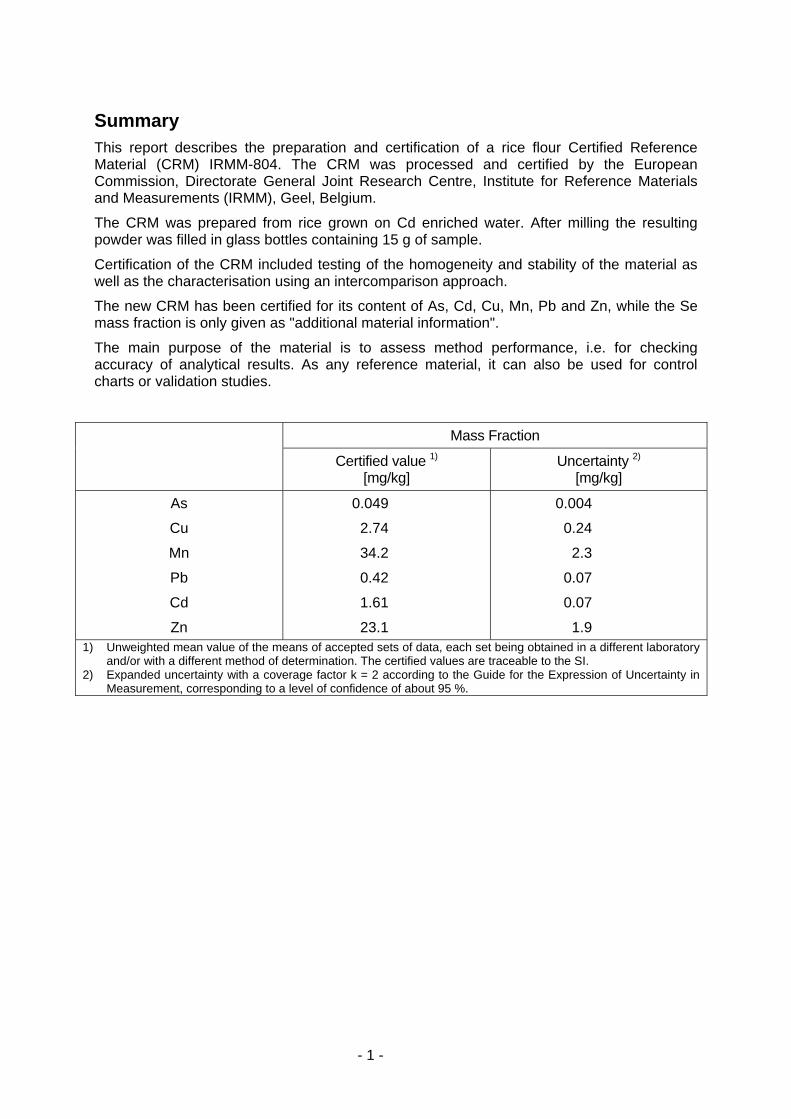
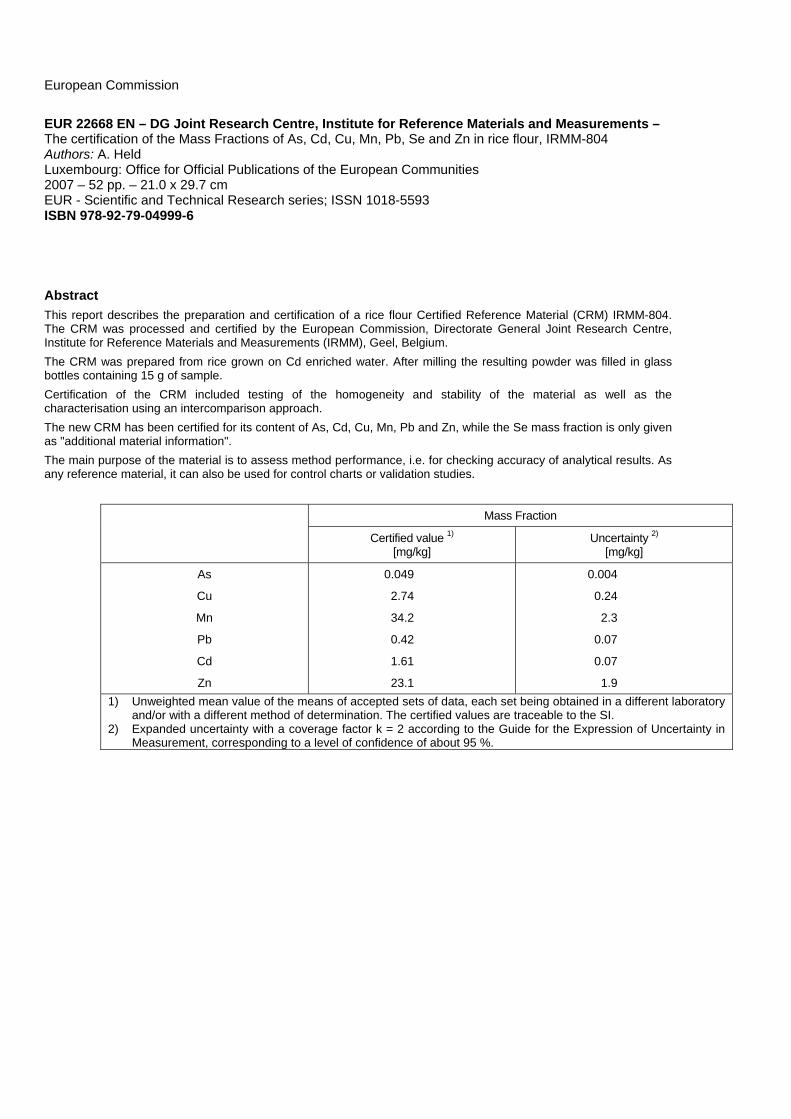
Summary This report describes the preparation and certification of a rice flour Certified Reference Material (CRM) IRMM-804. The CRM was processed and certified by the European Commission, Directorate General Joint Research Centre, Institute for Reference Materials and Measurements (IRMM), Geel, Belgium.
The CRM was prepared from rice grown on Cd enriched water. After milling the resulting powder was filled in glass bottles containing 15 g of sample.
Certification of the CRM included testing of the homogeneity and stability of the material as well as the characterisation using an intercomparison approach.
The new CRM has been certified for its content of As, Cd, Cu, Mn, Pb and Zn, while the Se mass fraction is only given as "additional material information".
The main purpose of the material is to assess method performance, i.e. for checking accuracy of analytical results. As any reference material, it can also be used for control charts or validation studies.
Mass Fraction Certified value 1)
[mg/kg] Uncertainty 2)
[mg/kg]
As
Cu
Mn
Pb
Cd
Zn
0.049
2.74
34.2
0.42
1.61
23.1
0.004
0.24
2.3
0.07
0.07
1.9 1) Unweighted mean value of the means of accepted sets of data, each set being obtained in a different laboratory
and/or with a different method of determination. The certified values are traceable to the SI. 2) Expanded uncertainty with a coverage factor k = 2 according to the Guide for the Expression of Uncertainty in
Measurement, corresponding to a level of confidence of about 95 %.

- 2 -

- 3 -
Table of contents Summary ..................................................................................................................................1 Table of contents......................................................................................................................3 Glossary ...................................................................................................................................4 1. Introduction....................................................................................................................6 2. Participants....................................................................................................................7 3. Processing of the material .............................................................................................8 4. Homogeneity .................................................................................................................9 4.1. Between bottle homogeneity .........................................................................................9 4.2. Micro-homogeneity, minimum sample intake ..............................................................10 5. Stability studies............................................................................................................12 5.1. Short-term stability.......................................................................................................12 5.2. Long-term stability .......................................................................................................13 6. Characterisation ..........................................................................................................15 6.1. Approach .....................................................................................................................15 6.2. Dry mass determination...............................................................................................15 6.3. Methods used ..............................................................................................................15 6.4. Evaluation of results ....................................................................................................15 7. Certified / indicative values..........................................................................................18 7.1. Certified values and uncertainties ...............................................................................18 7.2. Additional material information ....................................................................................18 7.3. Metrological traceability ...............................................................................................18 7.4. Commutability..............................................................................................................19 8. Instructions for use ......................................................................................................20 References .............................................................................................................................22 Acknowledgments ..................................................................................................................23 Annexes .................................................................................................................................24 Annex 1: Summary of methods used .....................................................................................25 Annex 2: Data from homogeneity studies ..............................................................................31 Annex 3: Data from stability studies .......................................................................................39 Annex 4: Data from characterisation studies..........................................................................46

- 4 -
Glossary y average of all results of a homogeneity study
MSwithinν degrees of freedom of MSwithin
AAS atomic absorption spectrometry
AFS atomic fluorescence spectrometry
CRM certified reference material
CVAFS cold vapour AFS
ETAAS electrothermal AAS
FAAS flame AAS
GFAAS graphite furnace AAS
HG hydride generation
HGAAS hydride generation AAS
HGAFS hydride generation atomic fluorescence spectrometry
ICP-MS (Q / HR) inductively coupled plasma mass spectrometry (quadrupole / high resolution i.e. sector field)
ICP-OES inductively coupled plasma optical emission spectrometry
ID isotope dilution technique
INAA instrumental NAA
k coverage factor
k0-NAA NAA using the k0-method for quantification
MSamong mean square among bottles from an ANOVA
MSwithin mean square within a bottle from an ANOVA
n average number of replicates per bottle
NAA neutron activation analysis
RNAA radiochemical NAA
sbb between-unit variability
SI Système International d'unités (international system of units)
smeas measurement variability
smethod method variability
TIMS thermal ionization mass spectrometry using the isotope dilution technique
ubb uncertainty related to a possible between-bottle inhomogeneity
ubb* uncertainty of inhomogeneity that could be hidden by method repeatability
uc combined uncertainty of the certified value
uc,bb combined uncertainty of the between-unit measurement
uchar uncertainty of the characterisation
- 5 -
UCRM expanded uncertainty of a certified value
Uind expanded uncertainty of an indicative value
ults uncertainty of stability

- 6 -
1. Introduction Food safety is a policy priority for the European Commission. This is reflected by a White Paper on Food Safety published in January 2000 [1]. It outlines a new food policy to be established in the years to come. This includes amongst others the setting up of a new food safety legislation covering the entire food chain from animal feed production to the final product on the consumers’ plate. One measure was the Commission Regulation setting maximum levels for certain contaminants in foodstuffs [2], covering nitrate, mycotoxins, 3-monochloropropane-1,2-diol and heavy metals, Pb, Cd and Hg in particular. In addition, a Directive laying down sampling methods and methods of analysis [3] has been published. This directive requests the use of certified reference materials where possible.
Rice is staple food in large parts of the world, particularly Asia. Nevertheless, consumption as well as production have been growing significantly over the past decades in Europe. At present, roughly 2.6 million tons are produced in Europe, with a consumption of around 3.5 million tons [4].
Rice is one of the foodstuffs for which maximum levels for lead and cadmium have been set in the Commission Regulation [2]. Besides lead and cadmium, the elements copper, zinc, manganese, selenium and arsenic have been included in the certification of the rice flour reference material. Copper, zinc, manganese and selenium are essential trace elements, but also an excess of these elements can cause adverse effects. The European Commission has therefore requested the Scientific Committee for Food (SCF) to review the upper level on the daily intake for copper [5], zinc [6], manganese [7] and selenium [8]. Arsenic has been included in the certification as a potentially toxic element.
The rice flour was also used as test material in an interlaboratory comparison (IMEP-19 [9, 10]) and a Comité international des poids et mesures - Comité consultatif pour la quantité de matière – métrologie en chimie (CIPM - CCQM) key comparison CCQM-K24 [11] and pilot study CCQM-P29 [12] as well as an EUROMET comparison [13]. Results from the CCQM key comparison and pilot study were used in this certification with permission of the participants.
- 7 -
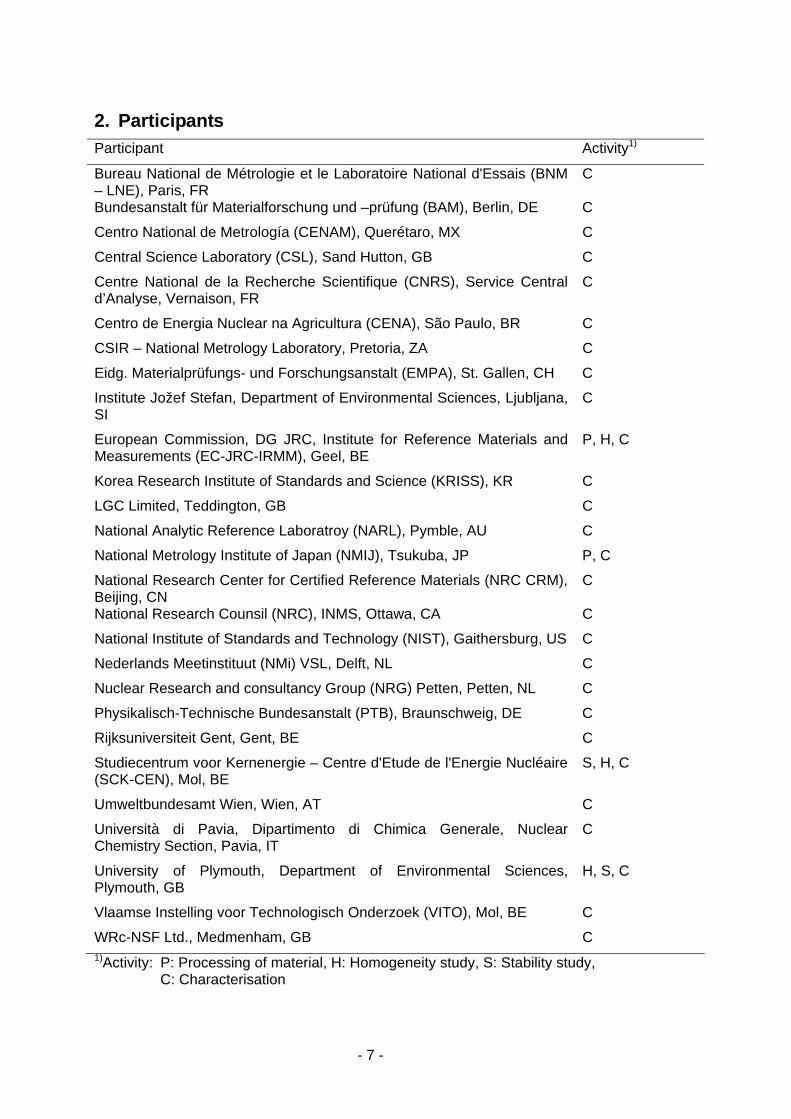
2. Participants Participant Activity1)
Bureau National de Métrologie et le Laboratoire National d'Essais (BNM – LNE), Paris, FR
C
Bundesanstalt für Materialforschung und –prüfung (BAM), Berlin, DE C
Centro National de Metrología (CENAM), Querétaro, MX C
Central Science Laboratory (CSL), Sand Hutton, GB C
Centre National de la Recherche Scientifique (CNRS), Service Central d’Analyse, Vernaison, FR
C
Centro de Energia Nuclear na Agricultura (CENA), São Paulo, BR C
CSIR – National Metrology Laboratory, Pretoria, ZA C
Eidg. Materialprüfungs- und Forschungsanstalt (EMPA), St. Gallen, CH C
Institute Jožef Stefan, Department of Environmental Sciences, Ljubljana, SI
C
European Commission, DG JRC, Institute for Reference Materials and Measurements (EC-JRC-IRMM), Geel, BE
P, H, C
Korea Research Institute of Standards and Science (KRISS), KR C
LGC Limited, Teddington, GB C
National Analytic Reference Laboratroy (NARL), Pymble, AU C
National Metrology Institute of Japan (NMIJ), Tsukuba, JP P, C
National Research Center for Certified Reference Materials (NRC CRM), Beijing, CN
C
National Research Counsil (NRC), INMS, Ottawa, CA C
National Institute of Standards and Technology (NIST), Gaithersburg, US C
Nederlands Meetinstituut (NMi) VSL, Delft, NL C
Nuclear Research and consultancy Group (NRG) Petten, Petten, NL C
Physikalisch-Technische Bundesanstalt (PTB), Braunschweig, DE C
Rijksuniversiteit Gent, Gent, BE C
Studiecentrum voor Kernenergie – Centre d'Etude de l'Energie Nucléaire (SCK-CEN), Mol, BE
S, H, C
Umweltbundesamt Wien, Wien, AT C
Università di Pavia, Dipartimento di Chimica Generale, Nuclear Chemistry Section, Pavia, IT
C
University of Plymouth, Department of Environmental Sciences, Plymouth, GB
H, S, C
Vlaamse Instelling voor Technologisch Onderzoek (VITO), Mol, BE C
WRc-NSF Ltd., Medmenham, GB C 1)Activity: P: Processing of material, H: Homogeneity study, S: Stability study,
C: Characterisation

- 8 -
3. Processing of the material The rice flour used for IRMM-804 was provided by the National Metrology Institute of Japan (NMIJ) and originates from rice grown in cadmium contaminated water. The high lead content of this rice compared to published data [14] also suggests a contamination of the water or the soil with lead. The rice was milled and bottled in units of 60 g at NMIJ. At IRMM the rice flour was redistributed into units of 15 g and bottled in amber 60 mL glass bottles with a crimp seal. A total of 1526 bottles was produced.
The particle size distribution of the material was assessed using a particle size analyser with a Helos measuring device (Sympatec, Germany). A typical particle size distribution is shown in Figure 1. The top particle size was shown to be 500 µm. The water content at the time of bottling was determined to be 4.5 ± 0.2 % (n = 20) by volumetric Karl Fisher titration. The water activity was determined to be 0.102 ± 0.005 (n = 20) using a water activity meter (Aqualab CX3, Decagon, USA). This low value indicates that the material is hygroscopic.
Figure 1: Typical particle size distribution of IRMM-804
- 9 -
4. Homogeneity
4.1. Between bottle homogeneity The between bottle homogeneity is tested to ensure that the certified values of the CRM are valid for all bottles of the material, within the stated uncertainty. This was carried out using ICP-MS (As, Cd, Cu, Mn, Pb, Se, Zn), ICP-OES (Mn, Zn) and ETAAS (Cu, Cd, Pb) after pressure digestion with HNO3 and HF.
For the elements Cd, Cu, Mn, Pb and Zn, 12 bottles were selected throughout the produced batch at approximately regular intervals, they were analysed for each analyte, three replicates have been measured per bottle. For As, the original measurements by ICP-MS were hampered by interferences. Instead, the k0-NAA data that was available for short- and long-term stability was also used to evaluate homogeneity. This is a valid approach, provided that no instability is detected (see Sections 5.1 and 5.2). This resulted in a dataset with measurements on 18 bottles which were analysed twice.
For Cd, Cu and Pb additional measurement data obtained by ID-ICP-MS was available. Using this method, 10 bottles have been measured, 5 bottles with 2 replicates per bottle, and 5 bottles with 3 replicates per bottle. This also allowed evaluation of the data as described below.
The results of these measurements were evaluated using a method described by Linsinger et al. [15] as described in the following paragraphs:
The obtained data is first tested whether they follow a normal, or at least unimodal distribution. This is done by visual inspection of normal probability plots and histograms. If the data does not follow at least a unimodal distribution, the calculation of standard deviations is doubtful or impossible.
The results were then evaluated by a one-way analysis of variance (ANOVA). From the results of the ANOVA calculation, the following figures are calculated:
Method repeatability (RSDmethod) expressed as a relative standard deviation is given as follows:
y
MSRSD within
method =
MSwithin: mean square within a bottle from an ANOVA
y : average of all results of the homogeneity study
Between-bottle variation (sbb) expressed as a relative standard deviation is given by the following equation:
yn
MSMS
s
withinamong
bb
−
=
MSamong: mean square among bottles from an ANOVA
n: average number of replicates per bottle
The inhomogeneity that can be hidden by method repeatability which is used as the minimum uncertainty contribution from homogeneity is defined as follows:
4* 2
MSwithin
methodbb n
RSDu
ν=

- 10 -
MSwithinν : degrees of freedom of MSwithin
The larger value of sbb or ubb* are used as uncertainty contribution for homogeneity, ubb.
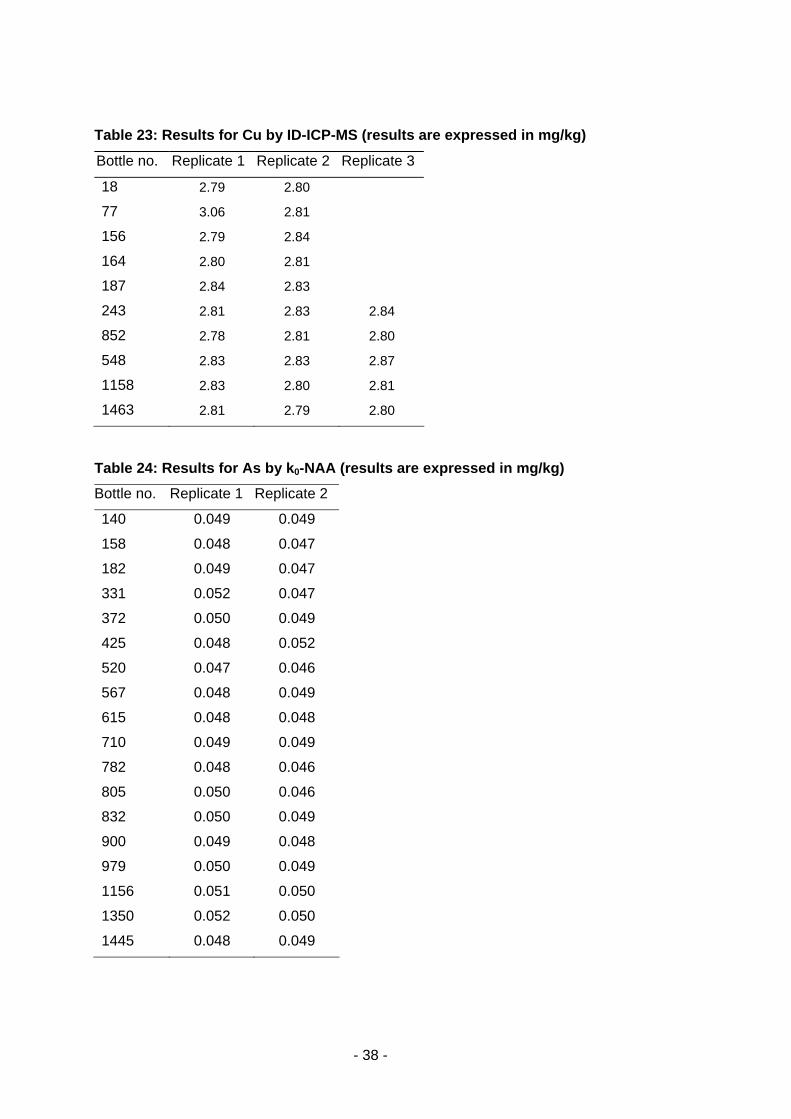
The results of the measurements are shown in Annex 2, Table 9 to Table 24. The statistical evaluation is summarised in Table 1. Where more than one result is available, the smaller value is used for calculating the uncertainty of the certified value (indicated by * in the table) as in most cases the uncertainty contribution for homogeneity is determined by the method repeatability.
Table 1: Results of the homogeneity study. ubb as used for calculating the uncertainty of the certified values indicated with *.
element method sbb / % ubb* / % ubb / %
As ICP-MS 17 15 17
As k0-NAA 0.97 0.93 0.97*
Cd ETAAS --- 1.6 1.6
Cd ICP-MS --- 1.5 1.5
Cd ID-ICP-MS 0.30 0.16 0.30*
Cu ETAAS 0.44 1.5 1.5
Cu ICP-MS --- 1.5 1.5
Cu ID-ICP-MS 0.83 0.66 0.83*
Mn ICP-MS --- 1.6 1.6
Mn ICP-OES 0.24 0.69 0.69*
Pb ETAAS 2.4 1.9 2.4
Pb ICP-MS --- 1.1 1.1*
Pb ID-ICP-MS 1.1 0.48 1.1
Zn ICP-MS --- 1.5 1.5
Zn ICP-OES --- 0.68 0.68*
The data obtained for Pb is somewhat inconsistent, the data obtained by ETAAS results in an sbb of 2.4 %, while with ICP-MS and ID-ICP-MS the data obtained results in sbb and ubb* both of 1.1 %. Due to the good agreement of the ICP-MS and ID-ICP-MS data, a value of 1.1 % is used in the further evaluation.
4.2. Micro-homogeneity, minimum sample intake The minimum sample intake is the minimal mass of sample that shall to be used in an analysis, to ensure that the certified value is valid within its uncertainty. The micro-homogeneity of the materials was assessed using solid sampling ZAAS [16] for Cd, Cu, Pb and Zn. Sample intakes of about 0.3 – 0.6 mg were used for Cd, Cu and Pb, for Zn sample intakes of about 1.2 mg were used. 160 replicate measurements were carried out per element.
The data has been evaluated according to the following equation [17]:

- 11 -
mu
skMett
m ⋅⎟⎟⎠
⎞⎜⎜⎝
⎛ ⋅′=
2
arg
2
With M minimum sample mass, k’2 factor for the two-sided 95 % tolerance limits for a normal distribution, sm relative standard deviation of the homogeneity experiment, utarget maximum relative uncertainty for sampling (this value should not exceed the uncertainty of the certified value) and m average mass used during the measurements.
The resulting minimum sample masses are summarised in Table 2.
Table 2: Minimum sample masses for a target uncertainty of 5 % as determined by solid sampling AAS
M (mg) sm m (mg)
Cd 22 0.135 0.63
Cu 15 0.146 0.36
Pb 19 0.160 0.39
Zn 12 0.069 1.24
For the other elements, the minimum sample intake was estimated from the characterisation study. Typical sample intakes used by the participating laboratories are used as minimum sample intake.
For As, Mn and Se sample intakes range from 0.2 to 1 g, most laboratories used 0.3 to 0.4 g.
For the four elements Cd, Cu, Pb and Zn a minimum sample intake of 20 mg can be considered acceptable, while for the elements As, Mn and Se the data of the characterisation study suggests that acceptable results can be obtained on samples of 200 mg or more.
There is no reason to assume that the elements As, Mn and Se are less homogeneously distributed than the elements Cd, Cu, Pb and Zn. Therefore, the overall minimum sample intake for this material, valid for all elements investigated, is set to 100 mg.

- 12 -
5. Stability studies
5.1. Short-term stability The short-term stability is tested to establish dispatch conditions for the material. During transport, especially in summer time, quite high temperatures can be reached. This is simulated in the short-term stability study.
The short-term stability has been assessed using an isochronous design [18]. Samples have been stored at 18 and 40 °C for 0, 2, 4 and 8 weeks. The reference temperature was set to -20 °C. Due to problems with the As measurements, the short-term stability test was repeated for this element using a test temperature of 60 °C and a reference temperature of -20 °C.
The samples have been analysed by ICP-MS (As, Cd, Cu, Mn, Pb, Zn), ICP-OES (Mn, Zn) and ETAAS (Cu, Cd, Pb) after pressure digestion with HNO3 and HF, under repeatability conditions. For As, the original measurements by ICP-MS were hampered by interferences, and were repeated. New measurements were carried out by k0-NAA on a new set of samples using 60°C as test temperature. The measurements for Se were not repeated, as the Se value is not certified and only given as additional material information.
The obtained data was first tested whether they follow a normal, or at least unimodal distribution. This is done by visual inspection of normal probability plots and histograms. If the data does not follow at least a unimodal distribution, the calculation of standard deviations is doubtful or impossible.
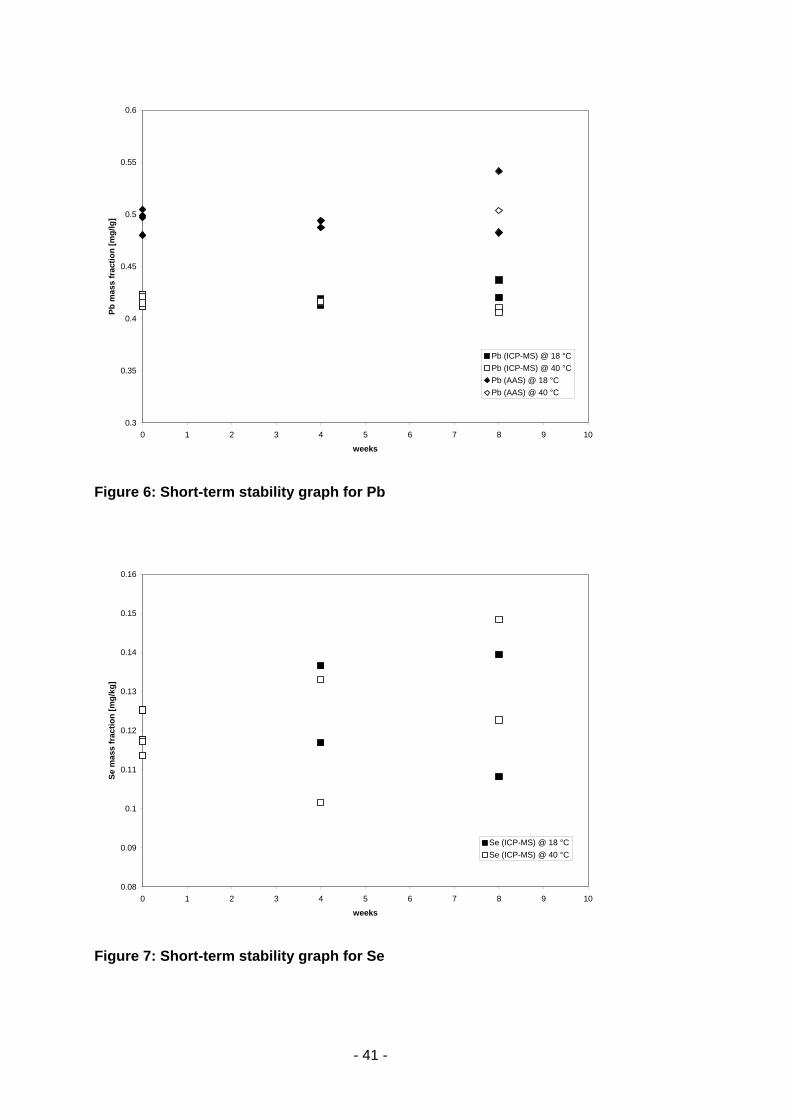
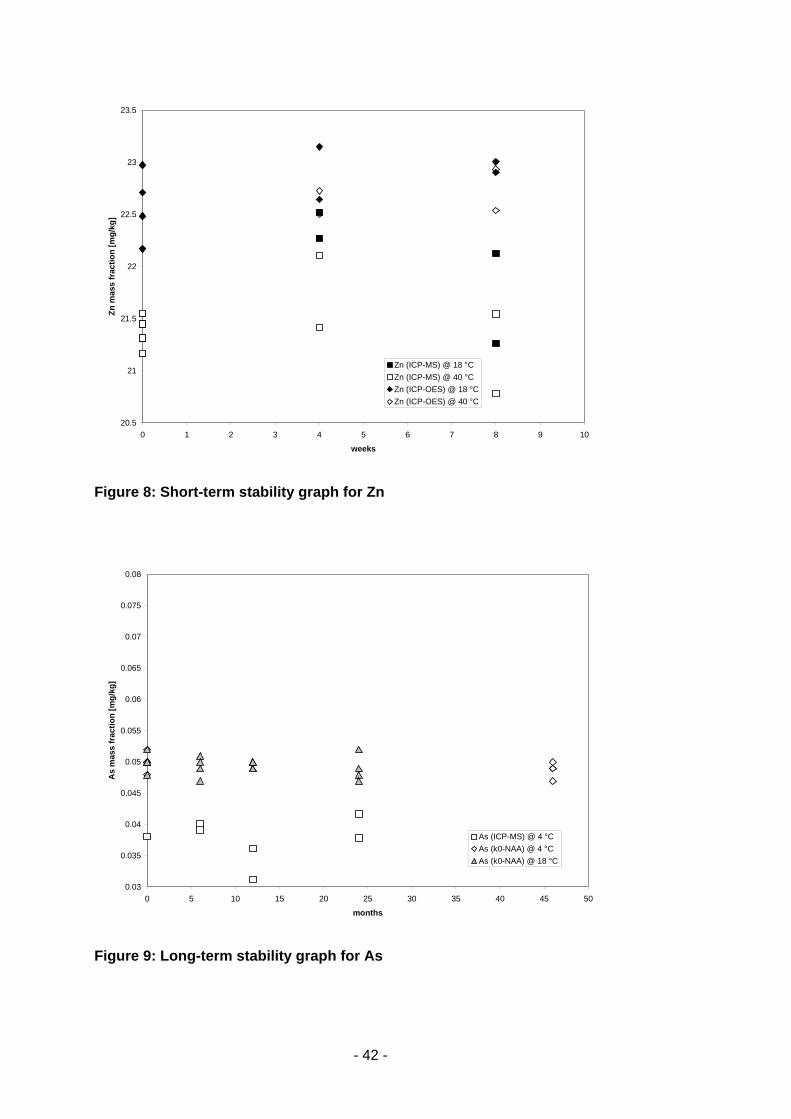
The data points obtained were plotted against storage time at the test temperature and the regression line calculated. The slope of the regression line was then tested for statistical significance. In Table 3 the results of these tests have been summarised. Only on two occasions this test indicated a significant slope. Nevertheless, in both cases the same samples have been measured additionally by another method, where no significant slope could be detected. The conclusion is therefore that the material is stable at 18°C and 40°C for up to 8 weeks.

- 13 -
Table 3: Results of the short-term stability test 18°C 40°C 60°C
Element Method Significance Significance Significance
As k0-NAA no
Cd ICP-MS yes no
Cd AAS no no
Cu ICP-MS no no
Cu GFAAS no no
Mn ICP-MS no no
Mn ICP-OES no no
Pb ICP-MS no yes
Pb GFAAS no no
Zn ICP-MS no no
Zn ICP-OES no no
It can be concluded that the samples can be safely dispatched under conditions where the temperatures do not exceed 40 °C for up to 8 weeks, i.e. at ambient temperature.
5.2. Long-term stability The long-term stability is tested to establish the shelf life of the CRM. The CRM is tested over a certain period of time, from which a prediction for the future is calculated. The samples have been analysed using using ICP-MS (As, Cd, Cu, Mn, Pb, Se, Zn), ICP-OES (Mn, Zn) and ETAAS (Cu, Cd, Pb) after pressure digestion with HNO3 and HF, under repeatability conditions. Again, for As additional measurements using k0-NAA were carried out. The Se data could not be used for the evaluation of the long-term stability. Since no certified value is established for this element, no additional measurements were carried out.
Also the long-term stability has been assessed using an isochronous design [18]. In this case samples have been stored at 4 °C for up to 24 months. The reference temperature was set to –20 °C. Also here measurements for As had to be repeated. Since the long-term stability could not easily be repeated due to the long time periods involved, a different approach was chosen. In parallel to the isochronous stability study at 4 °C, a second study at 18 °C had been conducted, but those samples had not been measured. This set of samples was now measured by k0-NAA for As. Additionally, two bottles of the material stored at the regular storage temperature (4 °C) were measured in comparison to two bottles of the material stored at the reference temperature for 46 months. This could be considered as a two-point isochronous stability study covering 46 months.
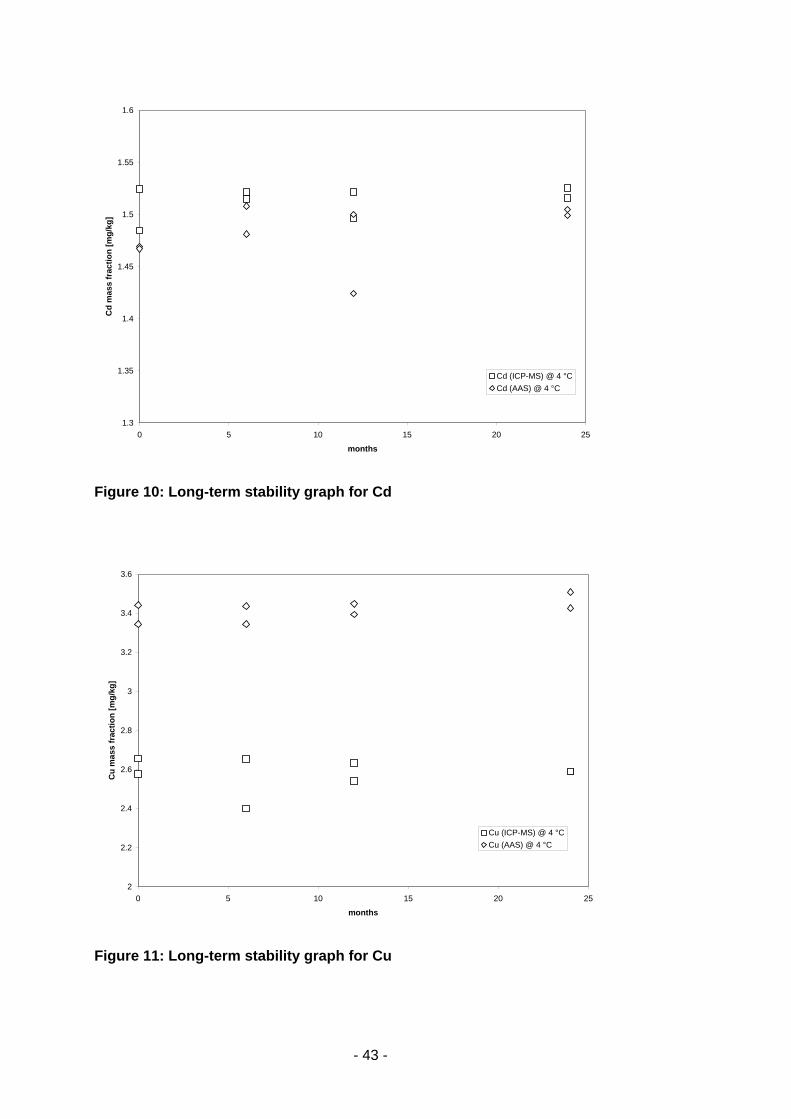
The data points were plotted against time and the regression line calculated. In all cases the slope of the regression line was found to be insignificant. The uncertainty of stability ults of the materials is then calculated for the required shelf life as:
( )x
xx
RSDui
lts ⋅−
=∑ 2
with RSD being the relative standard deviation of all results of the stability study, xi being the time point for each replicate, x being the average of all time points and x being the proposed shelf life (48 months at 4 °C in this case).

- 14 -
The results are summarised in Table 4.
Table 4: Uncertainty contribution of the long-term stability, ults, for a shelf life of 48 months. Values included in the final evaluation of the combined uncertainty of the certified values are indicated by *.
Element Method ults (%) comment
As ICP-MS 31.8
As k0-NAA 4.2 Isochronous study at 18 °C, 24 months
As k0-NAA 2.3* Isochronous study at 4 °C, 46 months
Cd GFAAS 3.6
Cd ICP-MS 1.9*
Cu GFAAS 3.1*
Cu ICP-MS 6.1
Pb GFAAS 10.5
Pb ICP-MS 6.4*
Zn ICP-OES 4*
Zn ICP-MS 5.7
Mn ICP-OES 1.9*
Mn ICP-MS 2.9
All slopes of the regression lines that were calculated for the different analytes were not significantly different from zero. Therefore a ults could be established for all analytes for 48 months at 4 °C. The material will be subjected to IRMM's regular stability monitoring programme to ensure stability beyond the initial 48 months.
- 15 -
6. Characterisation
6.1. Approach The certification of the material has been carried out using a laboratory intercomparison approach. In that intercomparison different laboratories used different methods to determine the analyte content in the rice flour. Nevertheless, dry mass determination had to be carried out according to a described procedure.
For the characterisation of the elements Cd and Zn results of the CCQM key comparison K24 [11] and the pilot study P29 [12] have been used. In these comparisons the same material (just differently labelled) has been used. One laboratory could only participate to the pilot study or the key comparison, thus no duplication of results could occur. Permission to use the data have been obtained from all but one participant of the key comparison and pilot study. The data of that one participant were consequently not used.
For the other analytes (As, Cu, Mn, Pb and Se) a group of laboratories has been recruited to carry out the measurements.
6.2. Dry mass determination For all measurements carried out for the certification of IRMM-804, the following protocol for dry mass determination was prescribed for the participants:
Dry mass determination should be carried out on separate subsamples, one subsample per independent digestion. Weighing of the samples for dry mass determination and the analysis must be done at the same time to avoid differences in moisture due to the hygroscopicity of the rice flour. Dry mass determination should be carried out by drying in a ventilated oven at 85 °C for at least 12 hours, until constant weight is reached. Constant weight is reached when two consecutive net sample weights differ by less than 0.5 %.
The protocol followed by the CCQM participants required a minimum sample mass of 1 g and defined constant weight when two consecutive net sample weights differed by less than 0.001 g [11, 12]. The IRMM protocol for IRMM-804 is more general than the CCQM protocol, but they agree. Therefore all sets of data are comparable with respect to the dry mass determination.
6.3. Methods used The methods used in the characterisation study are summarised in Annex 1. Each participant received 2 bottles of the material, and was requested to provide 6 independent results, three per bottle. In addition, the water content had to be determined on the same number of separate subsamples.
6.4. Evaluation of results Individual results of the participants, grouped per element are displayed in Annex 4. The obtained data was subjected to outlier tests (Dixon, Nalimov, Grubbs, Cochran). Based on these tests and a visual inspection of the data some outliers could be identified. Additionally the analysis reports from the participants were checked for compliance with the requested
- 16 -
analysis. No data was excluded from the evaluation based on outlier tests alone. Only if a sound technical reason was given, datasets were excluded.
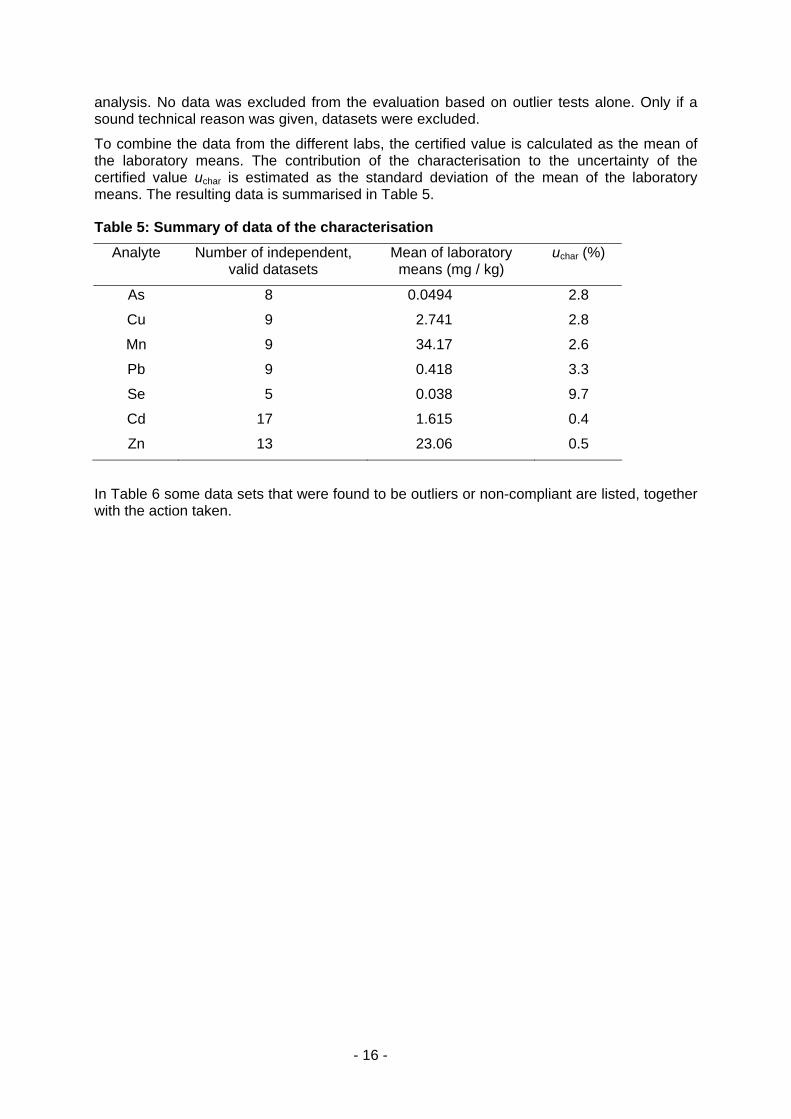
To combine the data from the different labs, the certified value is calculated as the mean of the laboratory means. The contribution of the characterisation to the uncertainty of the certified value uchar is estimated as the standard deviation of the mean of the laboratory means. The resulting data is summarised in Table 5.
Table 5: Summary of data of the characterisation Analyte Number of independent,
valid datasets Mean of laboratory
means (mg / kg) uchar (%)
As 8 0.0494 2.8
Cu 9 2.741 2.8
Mn 9 34.17 2.6
Pb 9 0.418 3.3
Se 5 0.038 9.7
Cd 17 1.615 0.4
Zn 13 23.06 0.5
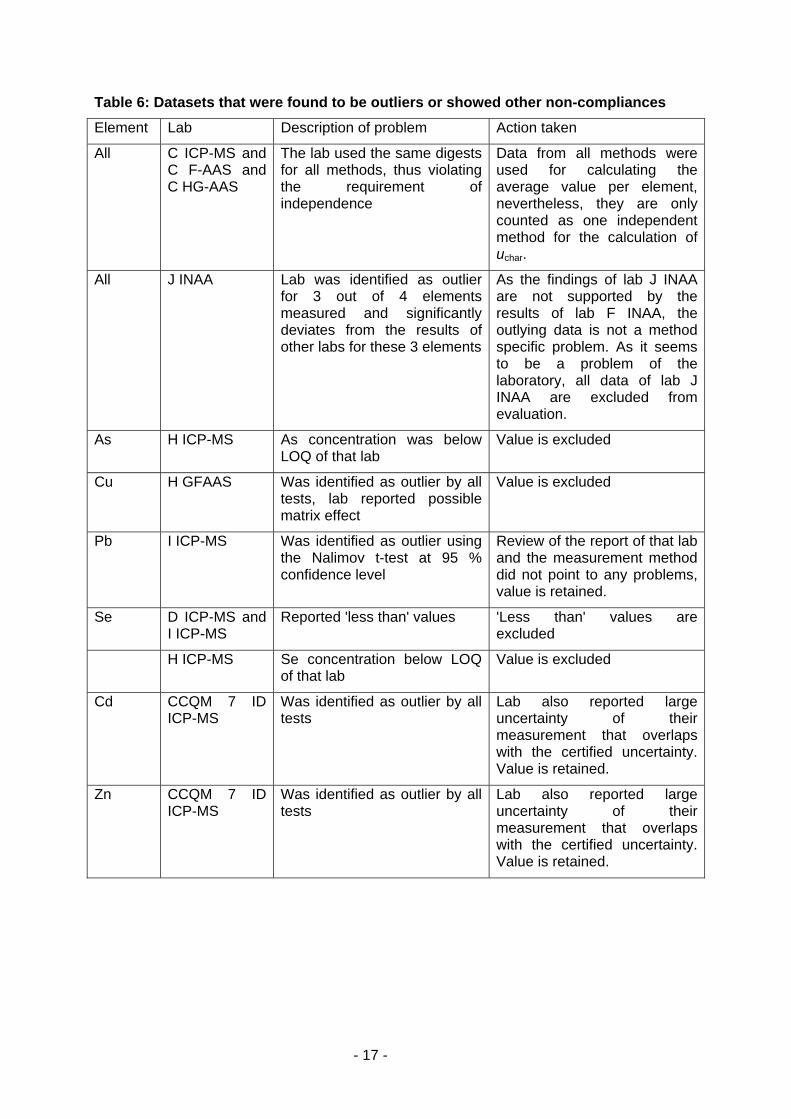
In Table 6 some data sets that were found to be outliers or non-compliant are listed, together with the action taken.
- 17 -
Table 6: Datasets that were found to be outliers or showed other non-compliances Element Lab Description of problem Action taken
All C ICP-MS and C F-AAS and C HG-AAS
The lab used the same digests for all methods, thus violating the requirement of independence
Data from all methods were used for calculating the average value per element, nevertheless, they are only counted as one independent method for the calculation of uchar.
All J INAA Lab was identified as outlier for 3 out of 4 elements measured and significantly deviates from the results of other labs for these 3 elements
As the findings of lab J INAA are not supported by the results of lab F INAA, the outlying data is not a method specific problem. As it seems to be a problem of the laboratory, all data of lab J INAA are excluded from evaluation.
As H ICP-MS As concentration was below LOQ of that lab
Value is excluded
Cu H GFAAS Was identified as outlier by all tests, lab reported possible matrix effect
Value is excluded
Pb I ICP-MS Was identified as outlier using the Nalimov t-test at 95 % confidence level
Review of the report of that lab and the measurement method did not point to any problems, value is retained.
Se D ICP-MS and I ICP-MS
Reported 'less than' values 'Less than' values are excluded
H ICP-MS Se concentration below LOQ of that lab
Value is excluded
Cd CCQM 7 ID ICP-MS
Was identified as outlier by all tests
Lab also reported large uncertainty of their measurement that overlaps with the certified uncertainty. Value is retained.
Zn CCQM 7 ID ICP-MS
Was identified as outlier by all tests
Lab also reported large uncertainty of their measurement that overlaps with the certified uncertainty. Value is retained.
- 18 -
7. Certified / indicative values
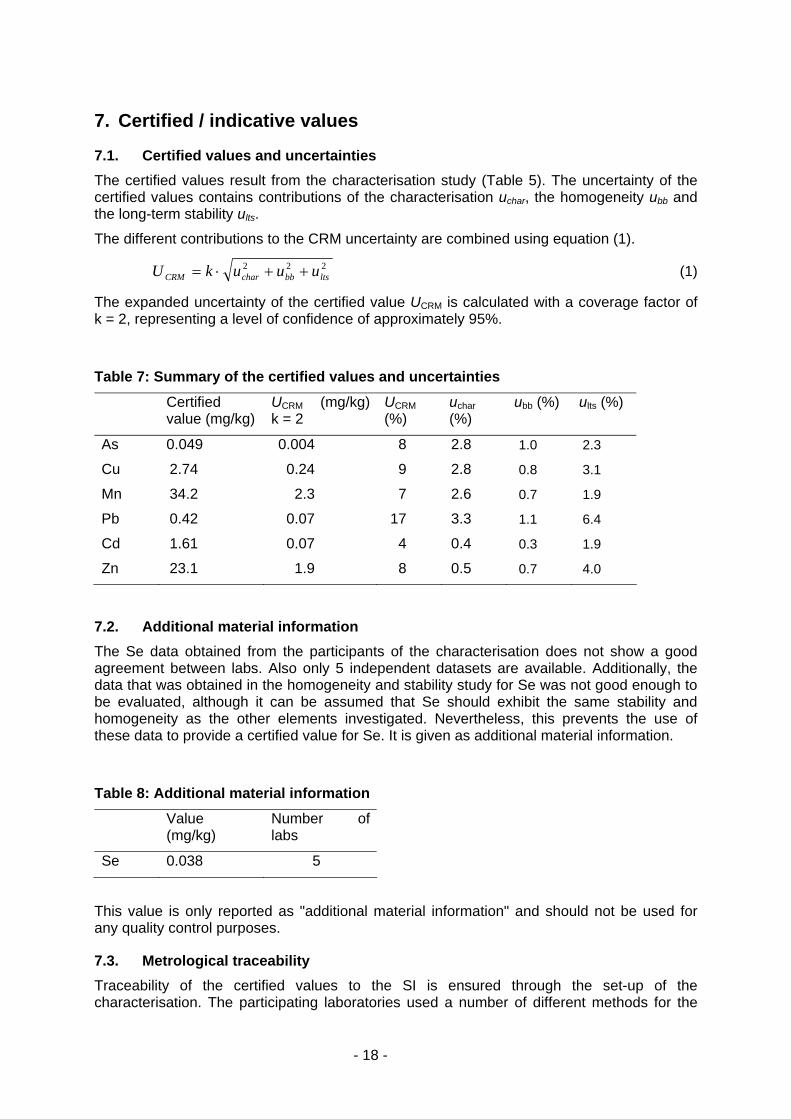
7.1. Certified values and uncertainties The certified values result from the characterisation study (Table 5). The uncertainty of the certified values contains contributions of the characterisation uchar, the homogeneity ubb and the long-term stability ults.
The different contributions to the CRM uncertainty are combined using equation (1).
222ltsbbcharCRM uuukU ++⋅= (1)
The expanded uncertainty of the certified value UCRM is calculated with a coverage factor of k = 2, representing a level of confidence of approximately 95%.
Table 7: Summary of the certified values and uncertainties
Certified value (mg/kg)
UCRM (mg/kg)k = 2
UCRM (%)
uchar (%)
ubb (%) ults (%)
As 0.049 0.004 8 2.8 1.0 2.3
Cu 2.74 0.24 9 2.8 0.8 3.1
Mn 34.2 2.3 7 2.6 0.7 1.9
Pb 0.42 0.07 17 3.3 1.1 6.4
Cd 1.61 0.07 4 0.4 0.3 1.9
Zn 23.1 1.9 8 0.5 0.7 4.0
7.2. Additional material information The Se data obtained from the participants of the characterisation does not show a good agreement between labs. Also only 5 independent datasets are available. Additionally, the data that was obtained in the homogeneity and stability study for Se was not good enough to be evaluated, although it can be assumed that Se should exhibit the same stability and homogeneity as the other elements investigated. Nevertheless, this prevents the use of these data to provide a certified value for Se. It is given as additional material information.
Table 8: Additional material information
Value (mg/kg)
Number of labs
Se 0.038 5
This value is only reported as "additional material information" and should not be used for any quality control purposes.
7.3. Metrological traceability Traceability of the certified values to the SI is ensured through the set-up of the characterisation. The participating laboratories used a number of different methods for the

- 19 -
sample preparation as well as for the final determination, thus eliminating any possibility of method dependent results. In addition, different calibrants have been used, including commercial standard solutions, CRMs and in-house gravimetrically prepared calibrants. Most laboratories also used matrix CRMs for quality control. In addition, the measurements for the characterisation of Cd and Zn have been carried out by national metrology institutes or designated laboratories, thus at a very high metrological level.
7.4. Commutability Commutable CRMs must exhibit the same analytical behaviour for given methods as a real laboratory sample. The laboratories participating in the characterisation study have been selected such as to provide a large variety of analytical methods, regarding digestion, calibration and detection. The good agreement between the results obtained shows the commutability of the material. Nevertheless it has to be kept in mind that the certified reference materials might show a behaviour different from real samples, in particular during digestion, due to their small particle sizes in contrast to the possibly larger particle sizes encountered for real laboratory samples, and the intensive processing that these materials have undergone.

- 20 -
8. Instructions for use The main purpose of the material is to assess method performance, i.e. for checking accuracy of analytical results. As any reference material, it can also be used for control charts or validation studies.
Storage of the material
Samples should be stored refrigerated at 4 °C. Care should be taken to avoid moisture pickup once the bottles are open, as the material is hygroscopic. However, the European Commission cannot be held responsible for changes that happen during storage of the material at the customer's premises, especially of opened samples.
Use of the material
The bottles should be shaken by turning upside down for at least two minutes before opening to ensure re-homogenisation of the content.
Dry mass correction
Dry mass determination should be carried out on separate subsamples. Weighing of the samples for dry mass determination and the analysis must be done at the same time to avoid differences in moisture due to the hygroscopicity of the rice flour. Dry mass determination should be carried out by drying in a ventilated oven at 85 °C for at least 12 hours, until constant weight is reached. At this stage two consecutive net sample weights should differ by less than 0.5 %.
Comparing an analytical result with the certified value
A result is unbiased if the combined uncertainty of measurement and certified value covers the difference between the certified value and the measurement result. To this end, the following steps are necessary:
1) Assessment of the measurement uncertainty: This uncertainty will depend whether accuracy of one individual result or accuracy of a method in general shall be assessed. Measurement uncertainty can be estimated from reproducibility data obtained during method validation. These reproducibility data do not comprise uncertainty of the calibration. This uncertainty has to be added. The uncertainty is then estimated as
22stRmeas uucu +=
umeas standard measurement uncertainty
c concentration for which the uncertainty should be evaluated
uR relative uncertainty due to reproducibility (as taken from the validation study)
ust relative uncertainty of the calibration standard (mainly purity).
ust can be ignored if it is < 1/3 uR
2) Take the standard uncertainty of the certified value of the material in question (uCRM). E.g. for As in IRMM-804, this would be 0.002 mg/kg.
- 21 -
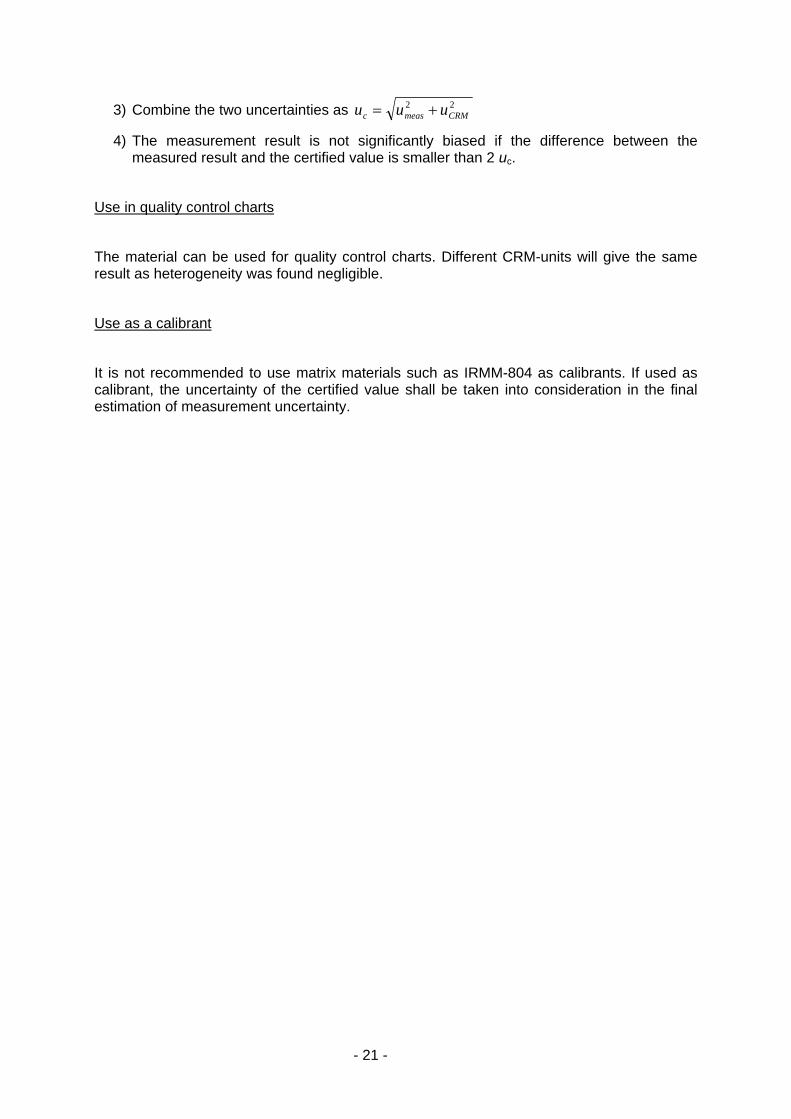
3) Combine the two uncertainties as 22CRMmeasc uuu +=
4) The measurement result is not significantly biased if the difference between the measured result and the certified value is smaller than 2 uc.
Use in quality control charts
The material can be used for quality control charts. Different CRM-units will give the same result as heterogeneity was found negligible.
Use as a calibrant
It is not recommended to use matrix materials such as IRMM-804 as calibrants. If used as calibrant, the uncertainty of the certified value shall be taken into consideration in the final estimation of measurement uncertainty.

- 22 -
References
[1] White Paper on Food Safety, January 2000, COM(1999)719 final.
[2] Commission Regulation (EC) No 466/2001 of 8 March 2001 setting maximum levels for certain contaminants in foodstuffs, Official Journal of the European Communities L 077, 16/03/2001, p. 0001 – 0013.
[3] Commission Directive 2001/22/EC of 8 March 2001 laying down the sampling methods and the methods of analysis for the official control of the levels of lead, cadmium, mercury and 3-MCPD in foodstuffs, Official Journal of the European Communities L077, 16/03/2001, p. 0014 – 0021.
[4] Source: FAOSTAT Database, 2003. FAO, Rome, 21 May 2003. Can be found at: http://apps.fao.org/default.htm or www.fao.org.
[5] Opinion of the Scientific Committee for Food, SCF/CS/NUT/UPPLEV/57 Final, 27 March 2003. To be found at http://europa.eu/comm/food/fs/sc/scf/reports_en.html.
[6] Opinion of the Scientific Committee for Food, SCF/CS/NUT/UPPLEV/62 Final, 19 March 2003. To be found at http://europa.eu/comm/food/fs/sc/scf/reports_en.html.
[7] Opinion of the Scientific Committee for Food, SCF/CS/NUT/UPPLEV/21 Final, 28 November 2000. To be found at http://europa.eu/comm/food/fs/sc/scf/reports_en.html.
[8] Opinion of the Scientific Committee for Food, SCF/CS/NUT/UPPLEV/25 Final, 28 November 2000. To be found at http://europa.eu/comm/food/fs/sc/scf/reports_en.html.
[9] Y. Aregbe, C. Harper, J. Nørgaard, M. De Smet, L. Van Nevel, P. Smeyers, P.D.P. Taylor, IMEP-19 Trace Elements in Rice, Report to Participants, EUR 20551 EN, European Communities Luxemburg, 2003.
[10] Y. Aregbe, C. Harper, J. Nørgaard, M. De Smet, P. Smeyers, L. Van Nevel, P.D.P. Taylor, Acc. Qual. Assur., 2004, 9, 323 – 332.
[11] Y. Aregbe, P. Taylor, Metrologia, 2003, 40, Tech. Suppl. 08001 (CCQM-K24 is part of Appendix B of the Mutual Recognition Arrangement, to be found at www.bipm.org/kcdb).
[12] Y. Aregbe, P. Taylor, Metrologia, 2003, 40, Tech. Suppl. 08002
[13] EUROMET comparison, project no. 565, www.euromet.org
[14] Z. -W. Zhang, C. -S. Moon, T. Watanabe, S. Shimbo, M. Ikeda, Sci. Tot. Env., 1996, 191, 169-175.
[15] T. P. J. Linsinger, J. Pauwels, A. M. H. van der Veen, H. G. Schimmel, A. Lamberty, Accred. Qual. Assur., 2001, 6, 20-25.
[16] M. Rossbach, K. H. Grobecker, Accred. Qual. Assur., 1999, 4, 498-503.
[17] J. Pauwels, C. Vandecasteele, Fresenius J. Anal. Chem., 1993, 345, 121-123.
[18] T. P. J. Linsinger, J. Pauwels, A. Lamberty, H. G. Schimmel, A. M. H. van der Veen, L. Siekmann, Fresenius J. Anal. Chem., 2001, 370, 183-188.
- 23 -
Acknowledgments The authors would like to thank T. Linsinger and G. Roebben (IRMM) for the reviewing of the certification report, as well as the experts of the Certification Advisory Panel ‘Elements and inorganic ions’, O. Donard (CNRS / Université de Pau et des pays de l’Adour, FR), L. Jorhem (Livsmedelsverket, SE) and H. Muntau (Ranco, IT) for their constructive comments.

- 24 -
Annexes
- 25 -
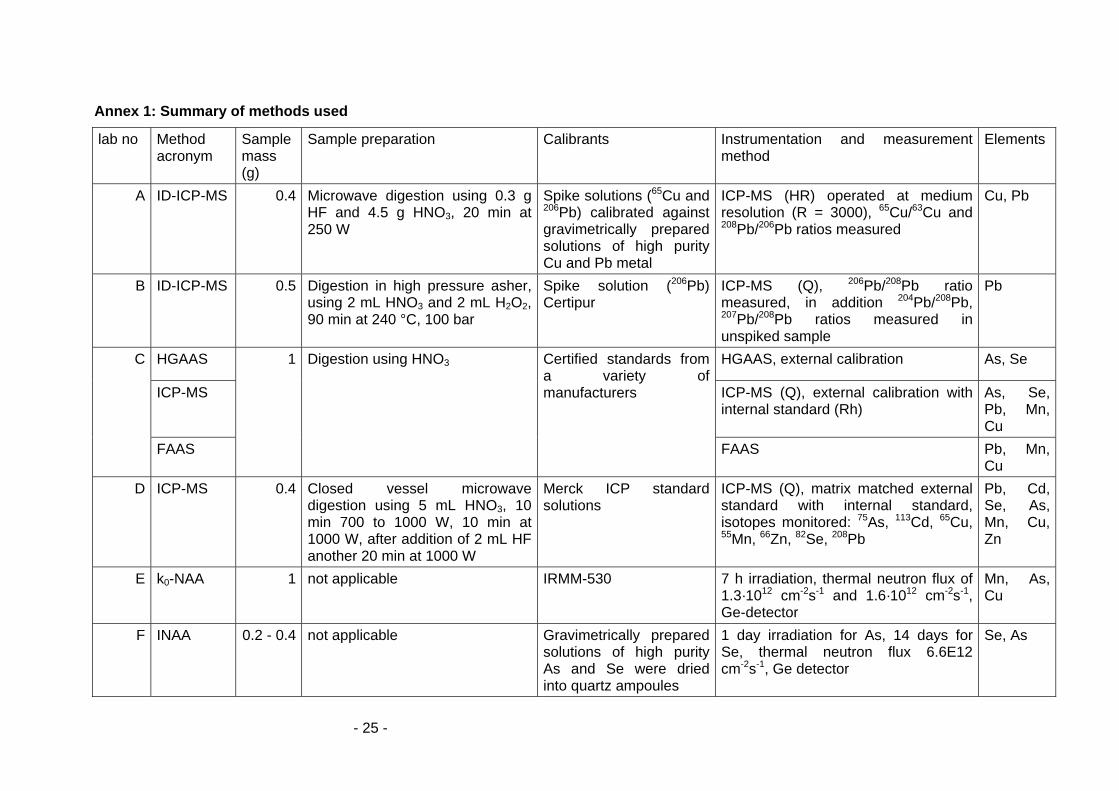
Annex 1: Summary of methods used
lab no Method acronym
Sample mass (g)
Sample preparation Calibrants Instrumentation and measurement method
Elements
A ID-ICP-MS 0.4 Microwave digestion using 0.3 g HF and 4.5 g HNO3, 20 min at 250 W
Spike solutions (65Cu and 206Pb) calibrated against gravimetrically prepared solutions of high purity Cu and Pb metal
ICP-MS (HR) operated at medium resolution (R = 3000), 65Cu/63Cu and 208Pb/206Pb ratios measured
Cu, Pb
B ID-ICP-MS 0.5 Digestion in high pressure asher, using 2 mL HNO3 and 2 mL H2O2, 90 min at 240 °C, 100 bar
Spike solution (206Pb) Certipur
ICP-MS (Q), 206Pb/208Pb ratio measured, in addition 204Pb/208Pb, 207Pb/208Pb ratios measured in unspiked sample
Pb
HGAAS HGAAS, external calibration As, Se
ICP-MS ICP-MS (Q), external calibration with internal standard (Rh)
As, Se, Pb, Mn, Cu
C
FAAS
1 Digestion using HNO3 Certified standards from a variety of manufacturers
FAAS Pb, Mn, Cu
D ICP-MS 0.4 Closed vessel microwave digestion using 5 mL HNO3, 10 min 700 to 1000 W, 10 min at 1000 W, after addition of 2 mL HF another 20 min at 1000 W
Merck ICP standard solutions
ICP-MS (Q), matrix matched external standard with internal standard, isotopes monitored: 75As, 113Cd, 65Cu, 55Mn, 66Zn, 82Se, 208Pb
Pb, Cd, Se, As, Mn, Cu, Zn
E k0-NAA 1 not applicable IRMM-530 7 h irradiation, thermal neutron flux of 1.3·1012 cm-2s-1 and 1.6·1012 cm-2s-1, Ge-detector
Mn, As, Cu
F INAA 0.2 - 0.4 not applicable Gravimetrically prepared solutions of high purity As and Se were dried into quartz ampoules
1 day irradiation for As, 14 days for Se, thermal neutron flux 6.6E12 cm-2s-1, Ge detector
Se, As

- 26 -
lab no Method acronym
Sample mass (g)
Sample preparation Calibrants Instrumentation and measurement method
Elements
Open digestion using HClO4 and HNO3 for 20 h at 250 °C
Cu, Pb, Se
ICP-MS
Open digestion using H2SO4 and HNO3 for 20 h at 250 °C
ICP-MS (Q), external calibration with internal standards, isotopes monitored: 75As, 63Cu, 65Cu, 206Pb, 207Pb, 208Pb, 82Se
As
G
ICP-OES
0.3 -0.5
Open digestion using HClO4 and HNO3 for 20 h at 250 °C
SPEX certified solutions
ICP-AES,external calibration, Mn: 257.611 nm, background correction
Mn
ICP-OES Mn: 257.610 nm, Zn: 213.856 nm Mn, Zn ETAAS Cd: 283.3 nm, modifier 50 µg PO4 +
3 µg Mg(NO3)2, Cu: 324.8 nm, modifier 5 µg Pd + 3 µg Mg(NO3)2, Pb 228.8 nm, modifier 50 µg PO4 + 3 µg Mg(NO3)2
Cd, Cu, Pb
H
ICP-MS
0.5 Digestion under reflux using 5 mL HNO3, heat to 65 °C for 8 h, then to 95 °C for 8 h, addition of 0.1 mL HF, further heating to 95 °C for 8 h. Evaporation to near dryness and redissolution in HNO3
Certified single element calibration solutions (PrimAg-xtra, UK), NIES 10 CRM
ICP-MS (HR) (resolution 400: Cd, Pb, resolution 4000: Mn, Cu, Zn, resolution 10000: As, Se), external calibration with Rh internal standard, isotopes monitored: 111Cd, 208Pb, 55Mn, 63Cu, 66Zn, 75As, 80Se
As, Cd, Cu, Mn, Pb, Se, Zn
I ICP-MS 0.5 Closed vessel microwave digestion using 5 mL HNO3
Spectrosol and Aristar single element calibration standards and CRMs (NIST, BCR, NRCC)
ICP-MS (Q), external calibration with internal standard (Rh)
As, Se, Pb, Mn, Cu
J INAA 0.2 - 0.5 not applicable Johnson Matthey Specpure As2O3, MnO2, SeO2, Cu and Zn metal
INAA, irradiation As, Se, Zn: 10 h, Mn: 600 s, Cu: 100 s, neutron flux: 4·1012 cm-2s-1, intrinsic Ge detector
As, Cu, Mn, Se, Zn

- 27 -
lab no Method acronym
Sample mass (g)
Sample preparation Calibrants Instrumentation and measurement method
Elements
ETAAS SRM 3144 (NIST) ETAAS using Zeeman background correction, Cu: 324.8 nm
Cu
FAAS
0.2 Closed vessel microwave digestion using 4 mL HNO3, heat to 180 °C during 20 min, hold for 20 min, then cool down
SRM 3132 (NIST) FAAS using a nitrous-oxide flame, Mn: 279.5 nm, background correction using a deuterium lamp
Mn
HGAFS 0.2 – 0.25
Digestion at ambient pressure using 0.5 mL H2SO4 and 1.5 mL of HNO3 heated to 60 °C over night, then to 130 °C for 1 h. Afterwards addition of twice 2 mL H2O2 and heating to 115 °C, addition of 0.1 mL V2O5 in H2SO4 and heating to 115°C, then reduction of Se(VI) to Se(IV) with 2.5 mL conc. HCl at 100 °C for 10 min
Prepared from Na2SeO3 (Sigma) in the same media as samples
HGAFS Se
K
RNAA 0.4 As: Wet digestion of irradiated sample with carrier, using H2SO4, HNO3 and H2O2. Addition of KI and extraction of AsI3 into toluene and re-extraction into H2O Se: Destruction of the irradiated sample using Mg(NO3)2, reduction with 6 M HCl, derivatization with 4-nitro-1,2-diaminobenzene and extraction of Se chelate in toluene
Merck single elements standard solutions
Well type and coaxial HPGe detectors, neutron flux 1.1·1012 cm-2·s-1 As: 20 h irradiation, measured at 559.1 keV Se: 40 h irradiation, measured at 400.7 keV
As, Se

- 28 -
lab no Method acronym
Sample mass (g)
Sample preparation Calibrants Instrumentation and measurement method
Elements
L k0-NAA 0.6 not applicable IRMM-530, Alfa Aesar single element standard solutions
7 h irradiation, thermal neutron flux of 3·1011 cm-2s-1 (As), 15 min irradiation, thermal neutron flux of 2 ·1011 cm-2s-1 (Mn),
Mn, As
M ID-ICP-MS 0.2 Microwave digestion using 4.5 mL HNO3 and 0.5 mL HF, microwave heating for 40 min using various power settings
IRMM-632 65Cu spike solution, IRMM-633 natural Cu solution
ICP-MS (Q), 63Cu/65Cu ratio measured Cu
CCQM- 1 INAA 0.25 not applicable Gravimetrically prepared
solutions of high purity metals, SRM 3108
16 h irradiation, neutron flux 3.1·1013 cm-2s-1
Cd, Zn
2 k0-NAA 0.56 not applicable Gravimetrically prepared solutions of Cd and Zn metal, k0-method
Thermal neutron flux 1.2·1013 cm-2s-1 Cd, Zn
3 ID-ICP-MS 0.5 Closed vessel microwave digestion, 6 mL H2O2, 10 mL HNO3, stepwise heating to 190°C during 40 min, keep at 190 °C for 30 min, evaporate to dryness, add 6 mL H2O2, 10 mL HNO3, heat to 210 °C within 30 min, keep for 20 min (microwave)
Spike solutions calibrated with SRM 746 and SRM 682
ICP-MS (HR), double focussing magnetic sector ICP-MS, single collector (electron multiplier), 111Cd/114Cd and 67Zn/64Zn ratio measured
Cd, Zn
4 ID-ICP-MS 0.2 - 0.25
Closed vessel microwave digestion, 4 mL HNO3, 1 mL H2O2
ICP-MS (Q), 111Cd/106Cd and 68Zn/67Zn ratio measured
Cd, Zn
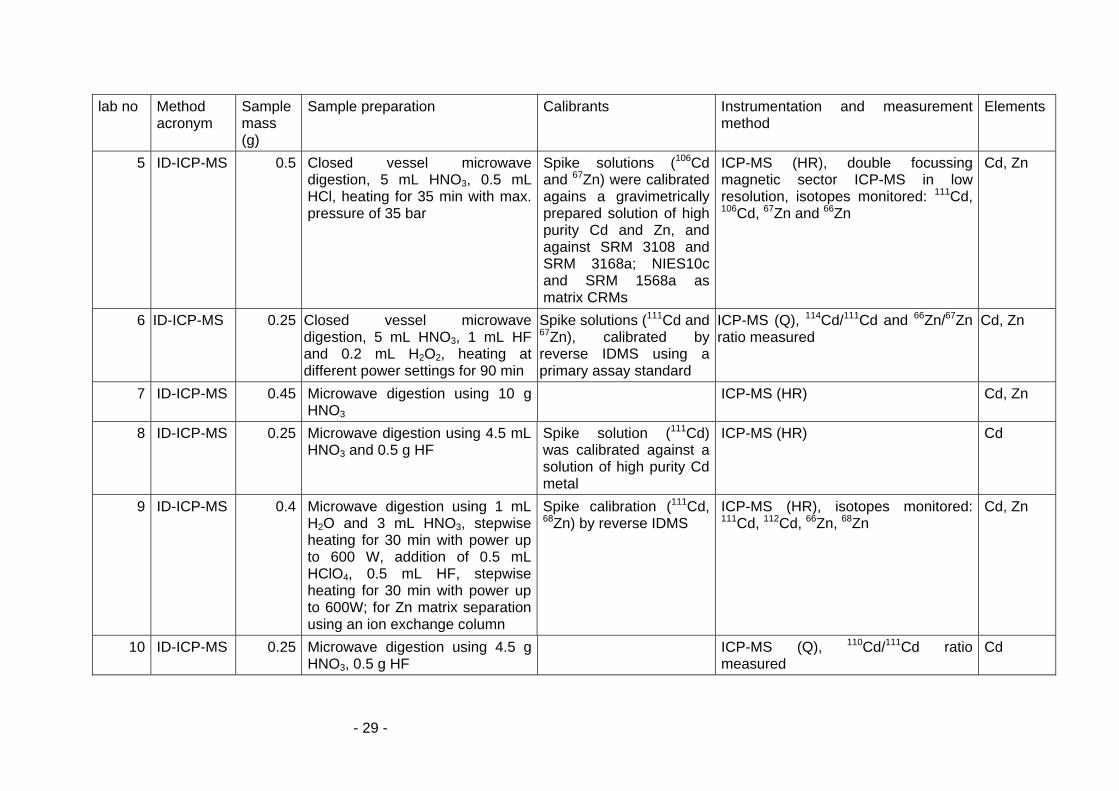
- 29 -
lab no Method acronym
Sample mass (g)
Sample preparation Calibrants Instrumentation and measurement method
Elements
5 ID-ICP-MS 0.5 Closed vessel microwave digestion, 5 mL HNO3, 0.5 mL HCl, heating for 35 min with max. pressure of 35 bar
Spike solutions (106Cd and 67Zn) were calibrated agains a gravimetrically prepared solution of high purity Cd and Zn, and against SRM 3108 and SRM 3168a; NIES10c and SRM 1568a as matrix CRMs
ICP-MS (HR), double focussing magnetic sector ICP-MS in low resolution, isotopes monitored: 111Cd, 106Cd, 67Zn and 66Zn
Cd, Zn
6 ID-ICP-MS 0.25 Closed vessel microwave digestion, 5 mL HNO3, 1 mL HF and 0.2 mL H2O2, heating at different power settings for 90 min
Spike solutions (111Cd and 67Zn), calibrated by reverse IDMS using a primary assay standard
ICP-MS (Q), 114Cd/111Cd and 66Zn/67Zn ratio measured
Cd, Zn
7 ID-ICP-MS 0.45 Microwave digestion using 10 g HNO3
ICP-MS (HR) Cd, Zn
8 ID-ICP-MS 0.25 Microwave digestion using 4.5 mL HNO3 and 0.5 g HF
Spike solution (111Cd) was calibrated against a solution of high purity Cd metal
ICP-MS (HR) Cd
9 ID-ICP-MS 0.4 Microwave digestion using 1 mL H2O and 3 mL HNO3, stepwise heating for 30 min with power up to 600 W, addition of 0.5 mL HClO4, 0.5 mL HF, stepwise heating for 30 min with power up to 600W; for Zn matrix separation using an ion exchange column
Spike calibration (111Cd, 68Zn) by reverse IDMS
ICP-MS (HR), isotopes monitored: 111Cd, 112Cd, 66Zn, 68Zn
Cd, Zn
10 ID-ICP-MS 0.25 Microwave digestion using 4.5 g HNO3, 0.5 g HF
ICP-MS (Q), 110Cd/111Cd ratio measured
Cd

- 30 -
lab no Method acronym
Sample mass (g)
Sample preparation Calibrants Instrumentation and measurement method
Elements
10 ko-NAA 0.35 not applicable IRMM-530 7 h irradiation, thermal neutron flux of 3·1011 cm-2s-1
Zn
11 ID-TIMS 0.4 Microwave digestion using 10 mL HNO3, 180 °C for 30 min, evaporate to dryness after addition of 0.5 mL HClO4; matrix separation on an anion exchange column
TIMS (multicollector instrument), single Re filament, silica gel, 112Cd/113Cd and 67Zn/66Zn ratio measured
Cd, Zn
12 ID-ICP-MS 0.8 Microwave digestion using 5 mL HNO3, heating to 230 °C, max. 75 bar for 30 min
Spike: IRMM-621, Oak Ridge Zn66, calibrated against SRM 3108 and SRM 3168a
ICP-MS (HR), used in low resolution, 114Cd/111Cd measured; ICP-MS (Q) with collision cell, 64Zn and 66Zn measured
Cd, Zn
13 ID-TIMS 0.3 Digestion using HNO3, matrix separation using an ion exchange resin
TIMS, 112Cd/111Cd ratio measured Cd
14 ID-ICP-MS 0.5 Microwave digestion using 4 mL HNO3 and 0.1 mL HClO4, after addition of 0.4 mL HClO4 and 0.2 mL second microwave digestion
111Cd and 66Zn used as spike
ICP-MS with collision cell, 112Cd/111Cd and 68Zn/66Zn ratio measured
Cd, Zn
15 ID-ICP-MS 0.5 Microwave digestion using HNO3:H2O:H2O2 (4:5:1)
111Cd used as spike ICP-MS (HR), 112Cd/111Cd ratio measured
Cd
16 ID-ICP-MS 0.5 - 1 Closed vessel digestion using HNO3 at 85 °C, extraction of Cd as iodide complex
111Cd spike (IRMM-621) ICP-MS (MC) Cd

- 31 -
Annex 2: Data from homogeneity studies
Table 9: Results for Cu by GFAAS (results are expressed in mg/kg)
Bottle no. Replicate 1 Replicate 2 Replicate 3
77 3.66 3.46 3.33
179 3.52 3.59 3.35
282 3.60 3.54 3.81
486 3.53 3.48 3.37
687 3.65 3.11 3.79
791 3.65 3.38 3.82
894 3.50 3.24 3.40
994 3.53 3.22 3.30
1200 3.43 3.46 3.34
1302 3.57 3.43 3.35
1403 3.54 3.28 3.35
1507 3.34 3.42 3.31
Table 10: Results for Cd by GFAAS (results are expressed in mg/kg)
Bottle no. Replicate 1 Replicate 2 Replicate 3
77 1.55 1.59 1.63
179 1.50 1.59 1.64
282 1.52 1.77 1.42
486 1.53 1.59 1.52
687 1.56 1.47 1.56
791 1.59 1.50 1.59
894 1.58 1.56 1.52
994 1.61 1.65 1.58
1200 1.68 1.54 1.59
1302 1.63 1.63 1.61
1403 1.61 1.63 1.58
1507 1.77 1.73 1.49

- 32 -
Table 11: Results for Pb by GFAAS (results are expressed in mg/kg)
Bottle no. Replicate 1 Replicate 2 Replicate 3
77 0.461 0.504 0.462
179 0.477 0.534 0.454
282 0.467 0.496 0.443
486 0.438 0.503 0.431
687 0.454 0.497 0.456
791 0.457 0.505 0.452
894 0.528 0.516 0.549
994 0.460 0.462 0.495
1200 0.462 0.510 0.435
1302 0.459 0.494 0.409
1403 0.510 0.519 0.464
1507 0.482 0.502 0.490
Table 12: Results for As by ICP-MS (results are expressed in mg/kg; n.d.: not detected, concentration below the limit of detection of the method)
Bottle no. Replicate 1 Replicate 2 Replicate 3
77 0.0153 n.d. n.d.
179 0.0169 n.d. n.d.
282 0.0198 n.d. n.d.
486 0.0121 0.0102 n.d.
687 0.0286 n.d. 0.0271
791 0.0166 0.0101 0.0138
894 n.d. 0.0229 0.0145
994 0.0234 0.0120 0.0315
1200 0.0199 0.0165 0.0212
1302 0.0378 n.d. 0.0181
1403 0.0125 0.0181 n.d.
1507 n.d. 0.0151 0.0126

- 33 -
Table 13: Results for Cd by ICP-MS (results are expressed in mg/kg)
Bottle no. Replicate 1 Replicate 2 Replicate 3
77 1.66 1.57 1.51
179 1.56 1.61 1.34
282 1.63 1.54 1.54
486 1.61 1.56 1.34
687 1.51 1.53 1.57
791 1.56 1.57 1.58
894 1.50 1.41 1.54
994 1.54 1.66 1.57
1200 1.57 1.57 1.43
1302 1.60 1.58 1.56
1403 1.52 1.53 1.50
1507 1.44 1.55 1.54
Table 14: Results for Cu by ICP-MS (results are expressed in mg/kg)
Bottle no. Replicate 1 Replicate 2 Replicate 3
77 2.49 2.44 2.32
179 2.40 2.47 2.02
282 2.48 2.38 2.43
486 2.45 2.48 2.26
687 2.52 2.36 2.46
791 2.45 2.47 2.46
894 2.42 2.21 2.54
994 2.47 2.61 2.49
1200 2.51 2.48 2.17
1302 2.58 2.47 2.54
1403 2.41 2.40 2.45
1507 2.27 2.48 2.41

- 34 -
Table 15: Results for Mn by ICP-MS (results are expressed in mg/kg)
Bottle no. Replicate 1 Replicate 2 Replicate 3
77 37.1 37.2 33.6
179 35.0 36.7 30.6
282 36.8 34.3 35.2
486 36.5 35.2 30.6
687 36.7 34.9 36.2
791 35.5 36.6 35.3
894 35.6 32.2 37.1
994 36.2 38.1 36.9
1200 36.2 36.4 32.6
1302 37.6 37.1 36.4
1403 37.0 35.4 37.2
1507 33.8 36.1 36.5
Table 16: Results for Pb by ICP-MS (results are expressed in mg/kg)
Bottle no. Replicate 1 Replicate 2 Replicate 3
77 0.464 0.458 0.420
179 0.442 0.456 0.441
282 0.444 0.428 0.450
486 0.446 0.448 0.445
687 0.452 0.428 0.449
791 0.443 0.449 0.445
894 0.432 0.492 0.447
994 0.439 0.465 0.443
1200 0.439 0.435 0.406
1302 0.458 0.441 0.450
1403 0.441 0.454 0.459
1507 0.412 0.441 0.446

- 35 -
Table 17: Results for Se by ICP-MS (results are expressed in mg/kg)
Bottle no. Replicate 1 Replicate 2 Replicate 3
77 0.122 0.077 0.112
179 0.094 0.119 0.101
282 0.091 0.110 0.133
486 0.164 0.119 0.106
687 0.128 0.123 0.115
791 0.144 0.098 0.164
894 0.137 0.110 0.106
994 0.156 0.132 0.138
1200 0.110 0.077 0.153
1302 0.105 0.130 0.133
1403 0.114 0.112 0.132
1507 0.114 0.125 0.088
Table 18: Results for Zn by ICP-MS (results are expressed in mg/kg)
Bottle no. Replicate 1 Replicate 2 Replicate 3
77 21.4 21.2 19.8
179 20.8 21.8 18.1
282 21.7 20.0 20.8
486 21.3 21.4 19.3
687 21.2 20.3 21.5
791 21.2 21.5 21.1
894 20.2 19.3 21.4
994 20.7 23.2 21.8
1200 21.5 21.3 19.0
1302 22.3 21.6 22.1
1403 20.1 20.4 20.7
1507 19.5 21.7 20.4
- 36 -
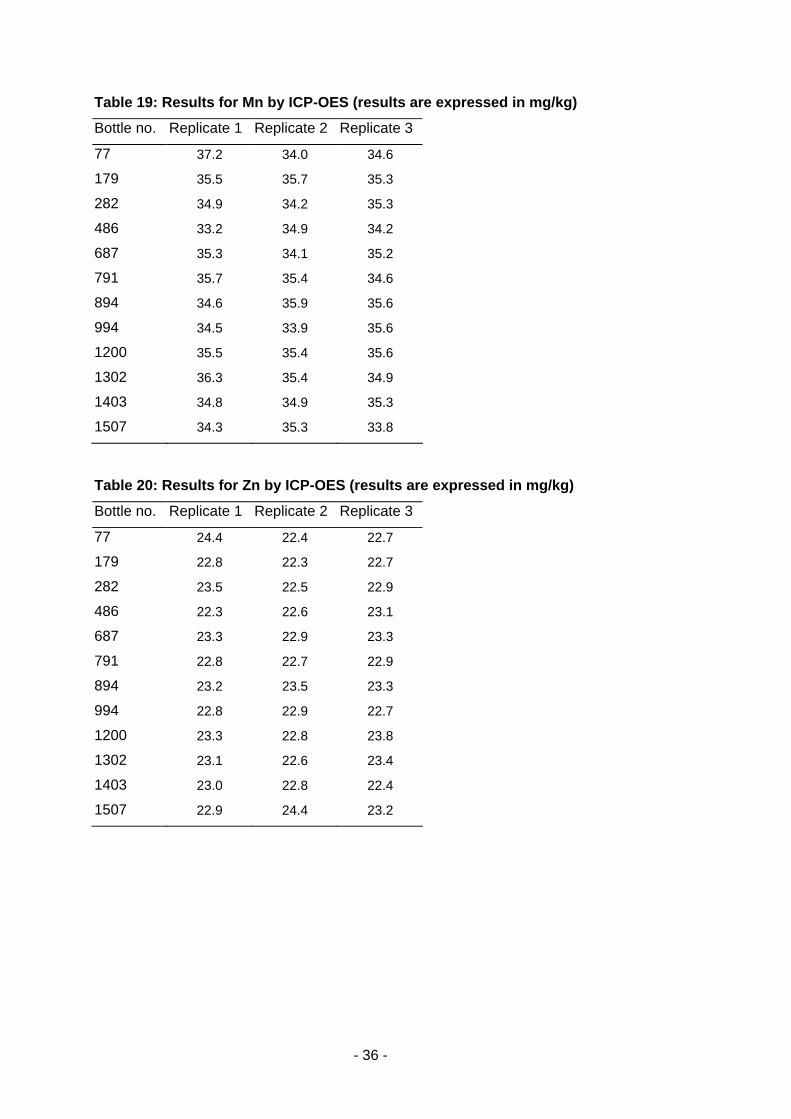
Table 19: Results for Mn by ICP-OES (results are expressed in mg/kg)
Bottle no. Replicate 1 Replicate 2 Replicate 3
77 37.2 34.0 34.6
179 35.5 35.7 35.3
282 34.9 34.2 35.3
486 33.2 34.9 34.2
687 35.3 34.1 35.2
791 35.7 35.4 34.6
894 34.6 35.9 35.6
994 34.5 33.9 35.6
1200 35.5 35.4 35.6
1302 36.3 35.4 34.9
1403 34.8 34.9 35.3
1507 34.3 35.3 33.8
Table 20: Results for Zn by ICP-OES (results are expressed in mg/kg)
Bottle no. Replicate 1 Replicate 2 Replicate 3
77 24.4 22.4 22.7
179 22.8 22.3 22.7
282 23.5 22.5 22.9
486 22.3 22.6 23.1
687 23.3 22.9 23.3
791 22.8 22.7 22.9
894 23.2 23.5 23.3
994 22.8 22.9 22.7
1200 23.3 22.8 23.8
1302 23.1 22.6 23.4
1403 23.0 22.8 22.4
1507 22.9 24.4 23.2

- 37 -
Table 21: Results for Pb by ID-ICP-MS (results are expressed in mg/kg)
Bottle no. Replicate 1 Replicate 2 Replicate 3
18 0.413 0.415
77 0.435 0.424
156 0.419 0.418
164 0.403 0.411
187 0.427 0.412
243 0.415 0.413 0.417
852 0.409 0.414 0.420
548 0.418 0.418 0.424
1158 0.420 0.413 0.417
1463 0.416 0.411
Table 22: Results for Cd by ID-ICP-MS (results are expressed in mg/kg)
Bottle no. Replicate 1 Replicate 2 Replicate 3
18 1.615 1.627
77 1.620 1.645
156 1.623 1.628
164 1.615 1.618
187 1.627 1.633
243 1.620 1.615 1.625
852 1.610 1.609 1.616
548 1.633 1.617 1.626
1158 1.614 1.618 1.617
1463 1.616 1.621 1.617
- 38 -
Table 23: Results for Cu by ID-ICP-MS (results are expressed in mg/kg)
Bottle no. Replicate 1 Replicate 2 Replicate 3
18 2.79 2.80
77 3.06 2.81
156 2.79 2.84
164 2.80 2.81
187 2.84 2.83
243 2.81 2.83 2.84
852 2.78 2.81 2.80
548 2.83 2.83 2.87
1158 2.83 2.80 2.81
1463 2.81 2.79 2.80
Table 24: Results for As by k0-NAA (results are expressed in mg/kg)
Bottle no. Replicate 1 Replicate 2
140 0.049 0.049
158 0.048 0.047
182 0.049 0.047
331 0.052 0.047
372 0.050 0.049
425 0.048 0.052
520 0.047 0.046
567 0.048 0.049
615 0.048 0.048
710 0.049 0.049
782 0.048 0.046
805 0.050 0.046
832 0.050 0.049
900 0.049 0.048
979 0.050 0.049
1156 0.051 0.050
1350 0.052 0.050
1445 0.048 0.049

- 39 -
Annex 3: Data from stability studies
0.03
0.035
0.04
0.045
0.05
0.055
0.06
0.065
0.07
0.075
0.08
0 1 2 3 4 5 6 7 8 9 10
weeks
As
mas
s fr
actio
n [m
g/kg
]
As (ICP-MS) @ 18 °CAs (ICP-MS) @ 40 °CAs (k0-NAA) @ 60 °C
Figure 2: Short-term stability graph for As
1.3
1.35
1.4
1.45
1.5
1.55
1.6
0 1 2 3 4 5 6 7 8 9 10
weeks
Cd
mas
s fr
actio
n [m
g/kg
]
Cd (ICP-MS) @ 18 °CCd (ICP-MS) @ 40 °CCd (AAS) @ 18 °CCd (AAS) @ 40 °C
Figure 3: Short-term stability graph for Cd

- 40 -
0
0.5
1
1.5
2
2.5
3
3.5
4
0 1 2 3 4 5 6 7 8 9
weeks
Cu
mas
s fr
actio
n [m
g/kg
]
Cu (ICP-MS) @ 18 °CCu (ICP-MS) @ 40 °CCu (AAS) @ 18 °CCu (AAS) @ 40 °C
Figure 4: Short-term stability graph for Cu
20
25
30
35
40
45
0 1 2 3 4 5 6 7 8 9 10
weeks
Mn
mas
s fr
actio
n [m
g/kg
]
Mn (ICP-MS) @ 18 °CMn (ICP-MS) @ 40 °CMn (ICP-OES) @ 18 °CMn (ICP-OES) @ 40 °C
Figure 5: Short-term stability graph for Mn
- 41 -
0.3
0.35
0.4
0.45
0.5
0.55
0.6
0 1 2 3 4 5 6 7 8 9 10
weeks
Pb m
ass
frac
tion
[mg/
lg]
Pb (ICP-MS) @ 18 °CPb (ICP-MS) @ 40 °CPb (AAS) @ 18 °CPb (AAS) @ 40 °C
Figure 6: Short-term stability graph for Pb
0.08
0.09
0.1
0.11
0.12
0.13
0.14
0.15
0.16
0 1 2 3 4 5 6 7 8 9 10
weeks
Se m
ass
frac
tion
[mg/
kg]
Se (ICP-MS) @ 18 °CSe (ICP-MS) @ 40 °C
Figure 7: Short-term stability graph for Se
- 42 -
20.5
21
21.5
22
22.5
23
23.5
0 1 2 3 4 5 6 7 8 9 10
weeks
Zn m
ass
frac
tion
[mg/
kg]
Zn (ICP-MS) @ 18 °CZn (ICP-MS) @ 40 °CZn (ICP-OES) @ 18 °CZn (ICP-OES) @ 40 °C
Figure 8: Short-term stability graph for Zn
0.03
0.035
0.04
0.045
0.05
0.055
0.06
0.065
0.07
0.075
0.08
0 5 10 15 20 25 30 35 40 45 50
months
As
mas
s fr
actio
n [m
g/kg
]
As (ICP-MS) @ 4 °CAs (k0-NAA) @ 4 °CAs (k0-NAA) @ 18 °C
Figure 9: Long-term stability graph for As
- 43 -
1.3
1.35
1.4
1.45
1.5
1.55
1.6
0 5 10 15 20 25
months
Cd
mas
s fr
actio
n [m
g/kg
]
Cd (ICP-MS) @ 4 °CCd (AAS) @ 4 °C
Figure 10: Long-term stability graph for Cd
2
2.2
2.4
2.6
2.8
3
3.2
3.4
3.6
0 5 10 15 20 25
months
Cu
mas
s fr
actio
n [m
g/kg
]
Cu (ICP-MS) @ 4 °CCu (AAS) @ 4 °C
Figure 11: Long-term stability graph for Cu

- 44 -
25
27
29
31
33
35
37
39
0 5 10 15 20 25
months
Mn
mas
s fr
actio
n [m
g/kg
]
Mn (ICP-MS) @ 4 °CMn (ICP-OES) @ 4 °C
Figure 12: Long-term stability graph for Cu
0.3
0.35
0.4
0.45
0.5
0.55
0 5 10 15 20 25
months
Pb m
ass
frac
tion
[mg/
lg]
Pb (ICP-MS) @ 4 °CPb (AAS) @ 4 °C
Figure 13: Long-term stability graph for Pb

- 45 -
0.1
0.11
0.12
0.13
0.14
0.15
0.16
0.17
0.18
0.19
0.2
0 5 10 15 20 25
months
Se m
ass
frac
tion
[mg/
kg]
Se (ICP-MS) @ 4 °C
Figure 14: Long-term stability graph for Se
20
20.5
21
21.5
22
22.5
23
23.5
24
24.5
25
0 5 10 15 20 25
months
Zn m
ass
frac
tion
[mg/
kg]
Zn (ICP-MS) @ 4 °CZn (ICP-OES) @ 4 °C
Figure 15: Long-term stability graph for Zn

- 46 -
Annex 4: Data from characterisation studies
Table 25: Individual results as reported for As (data expressed in mg/kg). Data not included in the final evaluation is indicated by a grey background. Results for Lab C are presented as individual results, but are only used as one set of data for the evaluation. sd: standard deviation
Labcode Results of the replicate measurements (mg/kg) mean sd
C HGAAS 0.047 0.044 0.047 0.047 0.044 0.047 0.046 0.0015
C ICP-MS 0.044 0.041 0.043 0.04 0.039 0.042 0.0415 0.0019
D ICP-MS 0.067 0.05 0.05 0.05 0.053 0.052 0.0537 0.0067
H ICP-MS 0.0744 0.0336 0.0487 0.0579 0.0605 0.0368
I ICP-MS 0.03 0.07 0.03 0.06 0.07 0.07 0.055 0.0197
G ICP-MS 0.05 0.053 0.045 0.054 0.053 0.049 0.0507 0.0034
J INAA 0.0746 0.0684 0.0725 0.0780 0.0746 0.0734
F INAA 0.0503 0.0487 0.0488 0.0489 0.0503 0.0503 0.0495 0.0008
K RNAA 0.0496 0.0492 0.051 0.046 0.0483 0.0491 0.0489 0.0017
E k0-NAA 0.0480 0.0498 0.0507 0.0503 0.0497 0.0523 0.0501 0.0014
L k0-NAA 0.0492 0.0488 0.0475 0.0500 0.0480 0.0498 0.0489 0.0010
0.0250.03
0.0350.04
0.0450.05
0.0550.06
0.0650.07
0.075
C H
GAA
S
C IC
P-M
S
D IC
P-M
S
F IN
AA
E ko
-NAA
I IC
P-M
S
G IC
P-M
S
K R
NAA
L k0
-NAA
Figure 16: Results for As as used for characterisation. Uncertainty bars represent the 95 % confidence interval of each lab's results. x-axis expressed in mg/kg ( : certified value, : expanded uncertainty of the certified value)
- 47 -
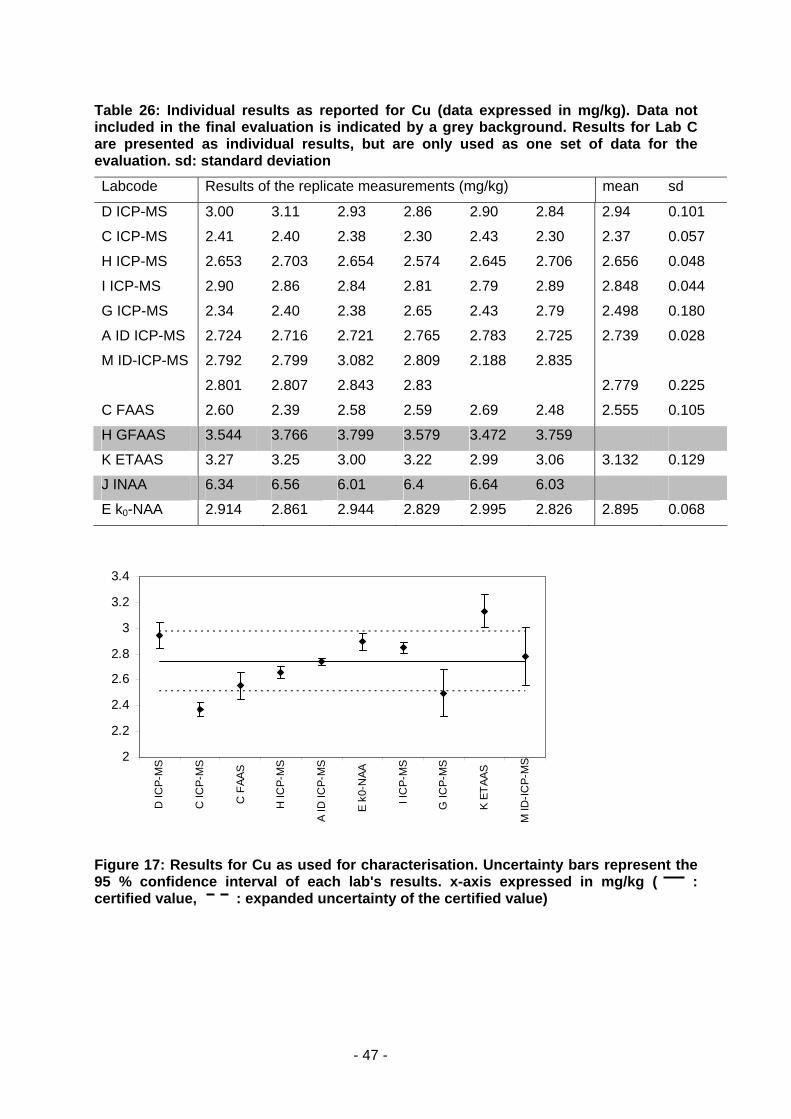
Table 26: Individual results as reported for Cu (data expressed in mg/kg). Data not included in the final evaluation is indicated by a grey background. Results for Lab C are presented as individual results, but are only used as one set of data for the evaluation. sd: standard deviation
Labcode Results of the replicate measurements (mg/kg) mean sd
D ICP-MS 3.00 3.11 2.93 2.86 2.90 2.84 2.94 0.101
C ICP-MS 2.41 2.40 2.38 2.30 2.43 2.30 2.37 0.057
H ICP-MS 2.653 2.703 2.654 2.574 2.645 2.706 2.656 0.048
I ICP-MS 2.90 2.86 2.84 2.81 2.79 2.89 2.848 0.044
G ICP-MS 2.34 2.40 2.38 2.65 2.43 2.79 2.498 0.180
A ID ICP-MS 2.724 2.716 2.721 2.765 2.783 2.725 2.739 0.028
M ID-ICP-MS 2.792 2.799 3.082 2.809 2.188 2.835
2.801 2.807 2.843 2.83 2.779 0.225
C FAAS 2.60 2.39 2.58 2.59 2.69 2.48 2.555 0.105
H GFAAS 3.544 3.766 3.799 3.579 3.472 3.759
K ETAAS 3.27 3.25 3.00 3.22 2.99 3.06 3.132 0.129
J INAA 6.34 6.56 6.01 6.4 6.64 6.03
E k0-NAA 2.914 2.861 2.944 2.829 2.995 2.826 2.895 0.068
2
2.2
2.4
2.6
2.8
3
3.2
3.4
D IC
P-M
S
C IC
P-M
S
C F
AAS
H IC
P-M
S
A ID
ICP-
MS
E k0
-NAA
I IC
P-M
S
G IC
P-M
S
K ET
AAS
M ID
-ICP-
MS
Figure 17: Results for Cu as used for characterisation. Uncertainty bars represent the 95 % confidence interval of each lab's results. x-axis expressed in mg/kg ( : certified value, : expanded uncertainty of the certified value)
- 48 -
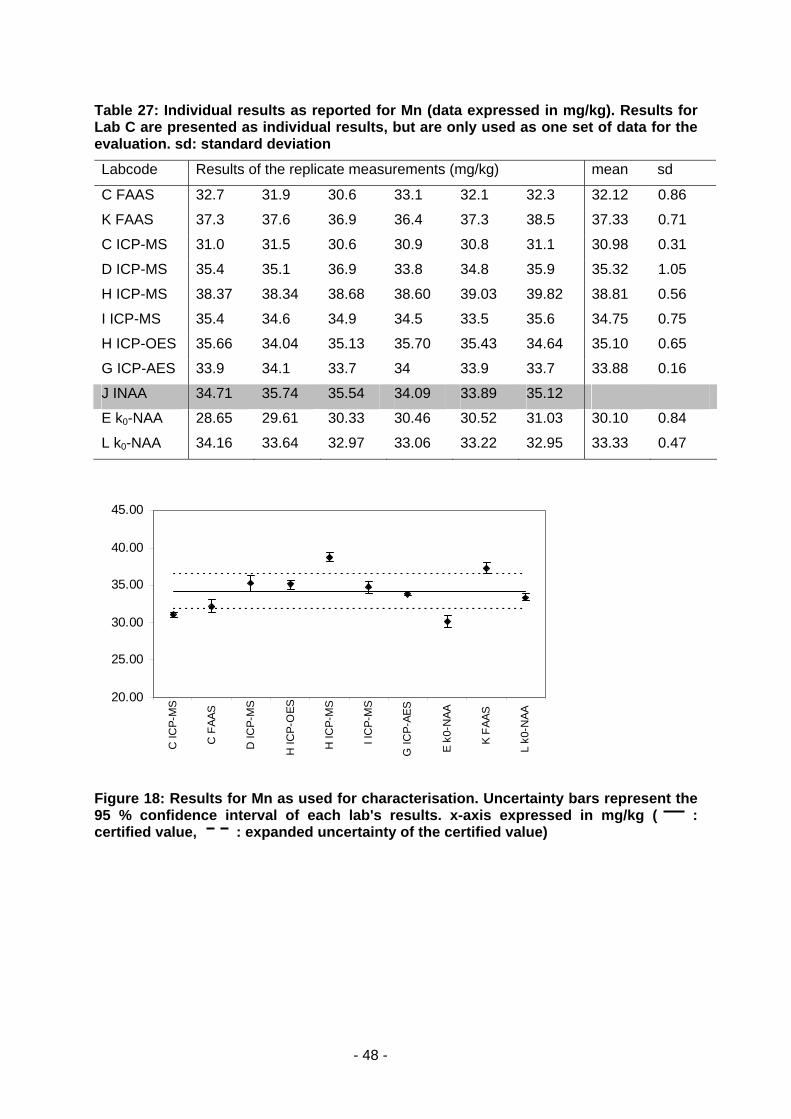
Table 27: Individual results as reported for Mn (data expressed in mg/kg). Results for Lab C are presented as individual results, but are only used as one set of data for the evaluation. sd: standard deviation
Labcode Results of the replicate measurements (mg/kg) mean sd
C FAAS 32.7 31.9 30.6 33.1 32.1 32.3 32.12 0.86
K FAAS 37.3 37.6 36.9 36.4 37.3 38.5 37.33 0.71
C ICP-MS 31.0 31.5 30.6 30.9 30.8 31.1 30.98 0.31
D ICP-MS 35.4 35.1 36.9 33.8 34.8 35.9 35.32 1.05
H ICP-MS 38.37 38.34 38.68 38.60 39.03 39.82 38.81 0.56
I ICP-MS 35.4 34.6 34.9 34.5 33.5 35.6 34.75 0.75
H ICP-OES 35.66 34.04 35.13 35.70 35.43 34.64 35.10 0.65
G ICP-AES 33.9 34.1 33.7 34 33.9 33.7 33.88 0.16
J INAA 34.71 35.74 35.54 34.09 33.89 35.12
E k0-NAA 28.65 29.61 30.33 30.46 30.52 31.03 30.10 0.84
L k0-NAA 34.16 33.64 32.97 33.06 33.22 32.95 33.33 0.47
20.00
25.00
30.00
35.00
40.00
45.00
C IC
P-M
S
C F
AAS
D IC
P-M
S
H IC
P-O
ES
H IC
P-M
S
I IC
P-M
S
G IC
P-AE
S
E k0
-NAA
K FA
AS
L k0
-NAA
Figure 18: Results for Mn as used for characterisation. Uncertainty bars represent the 95 % confidence interval of each lab's results. x-axis expressed in mg/kg ( : certified value, : expanded uncertainty of the certified value)

- 49 -
Table 28: Individual results as reported for Pb (data expressed in mg/kg). Data not included in the final evaluation is indicated by a grey background. Results for Lab C are presented as individual results, but are only used as one set of data for the evaluation. sd: standard deviation
Labcode Results of the replicate measurements (mg/kg) mean sd
C FAAS <=1.0 <=1.0 <=1.0 <=1.0 <=1.0 <=1.0
H GFAAS 0.5341 0.4332 0.4418 0.4593 0.4465 0.4217 0.456 0.040
C ICP-MS 0.412 0.372 0.32 0.398 0.391 0.297 0.365 0.046
D ICP-MS 0.44 0.46 0.42 0.43 0.43 0.44 0.437 0.014
H ICP-MS 0.4441 0.4245 0.4274 0.4161 0.4403 0.4331 0.431 0.010
G ICP-MS 0.372 0.386 0.355 0.370 0.372 0.348 0.367 0.014
I ICP-MS 0.469 0.483 0.500 0.518 0.523 0.454 0.491 0.027
A ID ICP-MS 0.3891 0.4054 0.4084 0.3923 0.3952 0.4038 0.399 0.008
B ID ICP-MS 0.4185 0.3984 0.3999 0.4056 0.3935 0.3941 0.402 0.009
M ID-ICP-MS 0.413 0.415 0.435 0.424 0.419 0.418
0.403 0.411 0.427 0.412 0.418 0.009
0.200
0.250
0.300
0.350
0.400
0.450
0.500
0.550
0.600
C IC
P-M
S
B ID
ICP-
MS
D IC
P-M
S
H IC
P-M
S
H G
FAAS
A ID
ICP-
MS
G IC
P-M
S
I IC
P-M
S
M ID
-ICP-
MS
Figure 19: Results for Pb as used for characterisation. Uncertainty bars represent the 95 % confidence interval of each lab's results. x-axis expressed in mg/kg ( : certified value, : expanded uncertainty of the certified value)
- 50 -
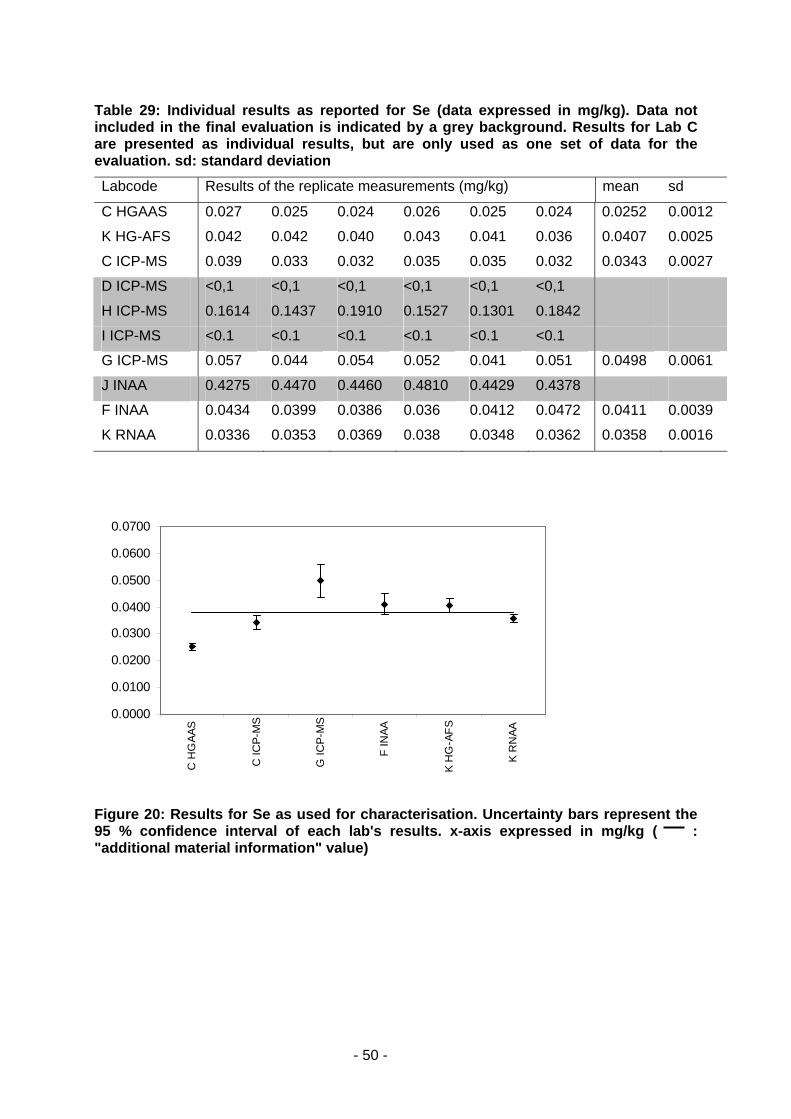
Table 29: Individual results as reported for Se (data expressed in mg/kg). Data not included in the final evaluation is indicated by a grey background. Results for Lab C are presented as individual results, but are only used as one set of data for the evaluation. sd: standard deviation
Labcode Results of the replicate measurements (mg/kg) mean sd
C HGAAS 0.027 0.025 0.024 0.026 0.025 0.024 0.0252 0.0012
K HG-AFS 0.042 0.042 0.040 0.043 0.041 0.036 0.0407 0.0025
C ICP-MS 0.039 0.033 0.032 0.035 0.035 0.032 0.0343 0.0027
D ICP-MS <0,1 <0,1 <0,1 <0,1 <0,1 <0,1
H ICP-MS 0.1614 0.1437 0.1910 0.1527 0.1301 0.1842
I ICP-MS <0.1 <0.1 <0.1 <0.1 <0.1 <0.1
G ICP-MS 0.057 0.044 0.054 0.052 0.041 0.051 0.0498 0.0061
J INAA 0.4275 0.4470 0.4460 0.4810 0.4429 0.4378
F INAA 0.0434 0.0399 0.0386 0.036 0.0412 0.0472 0.0411 0.0039
K RNAA 0.0336 0.0353 0.0369 0.038 0.0348 0.0362 0.0358 0.0016
0.0000
0.0100
0.0200
0.0300
0.0400
0.0500
0.0600
0.0700
C H
GAA
S
C IC
P-M
S
G IC
P-M
S
F IN
AA
K H
G-A
FS
K R
NAA
Figure 20: Results for Se as used for characterisation. Uncertainty bars represent the 95 % confidence interval of each lab's results. x-axis expressed in mg/kg ( : "additional material information" value)

- 51 -
Table 30: Individual results as reported for Cd (data expressed in mg/kg).
Labcode Mean1) Expanded uncertainty as reported by laboratory2)
CCQM-1 INAA 1.61 0.04 CCQM-2 NAA 1.63 0.04 CCQM-3 ID ICP-MS 1.614 0.011 CCQM-4 ID ICP-MS 1.57 0.05 CCQM-5 ID ICP-MS 1.604 0.015 CCQM-6 ID ICP-MS 1.64 0.04 CCQM-7 ID ICP-MS 1.55 0.06 CCQM-8 ID ICP-MS 1.66 0.03 CCQM-9 ID ICP-MS 1.60 0.02 CCQM-1 ID ICP-MS 1.62 0.03 CCQM-10 ID ICP-MS 1.63 0.02 CCQM-12 ID ICP-MS 1.62 0.03 CCQM-14 ID ICP-MS 1.61 0.04 CCQM-15 ID ICP-MS 1.659 0.017 CCQM-16 ID ICP-MS 1.61 0.02 CCQM-11 ID TIMS 1.623 0.006 CCQM-13 ID TIMS 1.633 0.017
1)In the CCQM study, laboratories were free to choose the number of replicates, and they were not asked to report results for their individual replicate measurements. Only the resulting laboratory mean was reported. 2)Results and uncertainties were all reported in nmol/g, only some laboratories also reported results in mg/kg. Results were converted in mg/kg during this evaluation.
1.401.451.501.551.601.651.701.751.80
CCQM-1 IN
AA
CCQM-2 NAA
CCQM-3 ID
ICP-M
S
CCQM-4 ID
ICP-M
S
CCQM-5 ID
ICP-M
S
CCQM-6 ID
ICP-M
S
CCQM-7 ID
ICP-M
S
CCQM-8 ID
ICP-M
S
CCQM-9 ID
ICP-M
S
CCQM-1 ID
ICP-M
S
CCQM-10 ID
ICP-M
S
CCQM-11 ID
TIMS
CCQM-12 ID
ICP-M
S
CCQM-13 ID
TIMS
CCQM-14 ID
ICP-M
S
CCQM-15 ID
ICP-M
S
CCQM-16 ID
ICP-M
S
Figure 21: Results for Cd as used for characterisation. Uncertainty bars represent the the expanded uncertainties of the measurements as reported by the participating laboratories. y-axis expressed in mg/kg ( : certified value, : expanded uncertainty of the certified value)

- 52 -
Table 31: Individual results as reported for Zn (data expressed in mg/kg).
Labcode Mean1) Expanded uncertainty as reported by laboratory2)
CCQM-1 INAA 23.3 0.6
CCQM-2 NAA 22.8 0.6
CCQM-10 k0-NAA 23.4 1.4
CCQM-3 ID ICP-MS 23.4 0.2
CCQM-4 ID ICP-MS 23.5 0.6
CCQM-5 ID ICP-MS 23.0 0.4
CCQM-6 ID ICP-MS 23.5 0.4
CCQM-7 ID ICP-MS 21.9 1.2
CCQM-9 ID ICP-MS 22.8 0.6
CCQM-1 ID ICP-MS 23.2 0.4
CCQM-12 ID ICP-MS 23.1 0.4
CCQM-14 ID ICP-MS 22.9 0.5
CCQM-11 ID TIMS 23.0 0.4 1)In the CCQM study, laboratories were free to choose the number of replicates, and they were not asked to report results for their individual replicate measurements. Only the resulting laboratory mean was reported. 2)Results and uncertainties were all reported in nmol/g, only some laboratories also reported results in mg/kg. Results were converted in mg/kg during this evaluation.
14.016.018.020.022.024.026.028.030.0
CCQM-1 IN
AA
CCQM-2 NAA
CCQM-3 ID
ICP-M
S
CCQM-4 ID
ICP-M
S
CCQM-5 ID
ICP-M
S
CCQM-6 ID
ICP-M
S
CCQM-7 ID
ICP-M
S
CCQM-9 ID
ICP-M
S
CCQM-1 ID
ICP-M
S
CCQM-10 k0
-NAA
CCQM-11 ID
TIMS
CCQM-12 ID
ICP-M
S
CCQM-14 ID
ICP-M
S
Figure 22: Results for Zn as used for characterisation. Uncertainty bars represent the the expanded uncertainties of the measurements as reported by the participating laboratories. y-axis expressed in mg/kg ( : certified value, : expanded uncertainty of the certified value)
European Commission EUR 22668 EN – DG Joint Research Centre, Institute for Reference Materials and Measurements – The certification of the Mass Fractions of As, Cd, Cu, Mn, Pb, Se and Zn in rice flour, IRMM-804 Authors: A. Held Luxembourg: Office for Official Publications of the European Communities 2007 – 52 pp. – 21.0 x 29.7 cm EUR - Scientific and Technical Research series; ISSN 1018-5593 ISBN 978-92-79-04999-6 Abstract This report describes the preparation and certification of a rice flour Certified Reference Material (CRM) IRMM-804. The CRM was processed and certified by the European Commission, Directorate General Joint Research Centre, Institute for Reference Materials and Measurements (IRMM), Geel, Belgium. The CRM was prepared from rice grown on Cd enriched water. After milling the resulting powder was filled in glass bottles containing 15 g of sample. Certification of the CRM included testing of the homogeneity and stability of the material as well as the characterisation using an intercomparison approach. The new CRM has been certified for its content of As, Cd, Cu, Mn, Pb and Zn, while the Se mass fraction is only given as "additional material information". The main purpose of the material is to assess method performance, i.e. for checking accuracy of analytical results. As any reference material, it can also be used for control charts or validation studies.
Mass Fraction
Certified value 1) [mg/kg]
Uncertainty 2)
[mg/kg]
As
Cu
Mn
Pb
Cd
Zn
0.049
2.74
34.2
0.42
1.61
23.1
0.004
0.24
2.3
0.07
0.07
1.9 1) Unweighted mean value of the means of accepted sets of data, each set being obtained in a different laboratory
and/or with a different method of determination. The certified values are traceable to the SI. 2) Expanded uncertainty with a coverage factor k = 2 according to the Guide for the Expression of Uncertainty in
Measurement, corresponding to a level of confidence of about 95 %.

The mission of the Joint Research Centre is to provide customer-driven scientific and technical support for the conception, development, implementation and monitoring of European Union policies. As a service of the European Commission, the JRC functions as a reference centre of science and technology for the Community. Close to the policy-making process, it serves the common interest of the Member States, while being independent of special interests, whether private or national.
15 LA
-NA
-22668-EN
-C