Embed Size (px)
Citation preview

The Challenges of the Economic Partnership
Agreements in Tanzania
By Robert B. Mabele
March 2007

2
Table of Contents Table of Contents .................................................................................................. 2 Foreword............................................................................................................... 3 1.0 Introduction: The Objectives of this Booklet................................................. 4
1.1 Introduction ....................................................................................................5 1.2 Coverage......................................................................................................... 6 1.3 Objectives and Principles ................................................................................7
1.3.1 Reciprocity...............................................................................................7 1.3.2 Strengthening ACP Regional Integration............................................... 7 1.3.3 Poverty Reduction.........................................................................................7
2.0 Tanzania’ s External Trade and the Challenges Facing the Country in the EPA Negotiations ............................................................................................. 9
2.1 Introduction ....................................................................................................9 2.1.1 The Structure of the Economy Matters in World Trade ........................ 9
2.2 The Structure of Tanzania’ s Trade ............................................................... 11 2.2.1 Tanzania’ s Exports ................................................................................ 11 2.2.2 Tanzania’ s Imports................................................................................ 13
2.3 Tanzania’ s Balance of Payments .................................................................. 15 2.4 EU Trade with Tanzania ............................................................................... 27
3.0 The EPA Negations: The Challenges........................................................... 29 3.1 Introduction .................................................................................................. 29 3.2 The Integration of LDCs, in the World Economy......................................... 29
3.2.1 The Link with Poverty Eradication ........................................................ 29 3.2.2 The Importance of Enhancing Tanzania’ s Capacity in International
Trade ..................................................................................................... 30 3.2.3 Regional Integration ............................................................................. 30 3.2.4 Trade Creation and not Trade Diversion.............................................. 31 3.2.5 Market Access....................................................................................... 31
3.3 Negotiating Strategy .................................................................................... 33 3.3.1 Configuration of Negotiating Group ................................................... 33 3.3.2 Coordination in the African Group ...................................................... 33 3.3.3 Defensive and Offensive List of Commodities ..................................... 34 3.3.4 Is there no Reciprocity on Tanzania’ s Part? ......................................... 34 3.3.5 Safeguard Measures ............................................................................. 35 3.3.6 Economic Cooperation ........................................................................ 35
4. Summary and Conclusion ............................................................................. 36 Acronyms ............................................................................................................ 41 Bibliography ........................................................................................................ 42

3
Foreword The Economic Partnership Agreements (EPAs) can be a key force for sustainable development. They can promote economic growth, reduce poverty, foster development or protect environment. But they can also have negative economic and social impacts, notably when the preparation of the domestic regulatory framework is inadequate or not implemented effectively. This is the second book of the series on the Cotonou Treaty and the Economic Partnership Agreements between the EU and ACP countries. Unlike the former two books which have been somehow general in analyzing the basic issues in EU – ACP cooperation, this book is specific to Tanzania and therefore drawing the practical experience on challenges facing the ACP countries. Although the examples are drawn from Tanzania, yet such experience can be applied to other developing countries within the ACP. The Challenges facing Tanzania in the EU-ACP Trade Negotiations on Economic Partnership Agreements (EPAs) can be a useful document to all social-political institutions in Tanzania like the Government officials from the Ministries of Trade, Industries and Marketing, Finance, Agriculture, Natural Resources and Tourism, the Parliamentary, Non State Actors, research and academic institutions. Apart from hard copies, you can as well download the soft copy through our website http://tanzania.fes-international.de/ . Dear reader, thank you for your interest. I hope you will find the book useful.
Reinhold Einloft Resident Director

4
1.0 Introduction: The Objectives of this Booklet
In an effort to contribute to a meaningful and fruitful participation of Non State
Actors i.e. the private sector, trade unions civil society etc— in the dialogue on and
subsequent implementation, monitoring and evaluation of the Cotonou Agreement,
the Friedrich-Ebert-Stiftung (FES) has undertaken to publish a series of booklets
designed to provide the basic and necessary information on the Cotonou
Agreement to the general public. In the first general introductory booklet titled
“ Finding Your Way through the Cotonou Agreement” by Sylvia Hangen-Riad it was
explained that the Cotonou Agreement is founded on three basic pillars namely a
strong political dimension, a development cooperation component and the
Economic Partnership Agreements Negotiations which mainly deal with future trade
arrangements between the EU and the ACP countries concerned.
The second booklet edited by Friedrich-Ebert-Stiftung Tanzania, titled appropriately
“ Understanding of the Economic Cooperation under the Cotonou Agreement”
explains the content of the second pillar.
The present booklet aims at exploring further the EU-ACP trade arrangement under
the Cotonou Agreement and especially elaborating on the negotiations on the
Economic Partnership Agreements between the two groups of countries (the EU
and the ACP group).
Following this introduction, the first section of the present booklet is devoted to a
brief discussion of the main Trade Provisions of the Cotonou Agreement especially
the objectives and principles of these provisions. Section 2 presents a short account
of the structure of Tanzania’ s trade in general and Tanzania’ s trade with the EU in
particular. This is important to take into account as it provides the actual Tanzanian
economic context within which these negotiations will take place. Section 3
presents the main issues and challenges facing Tanzania in the negations given the
5
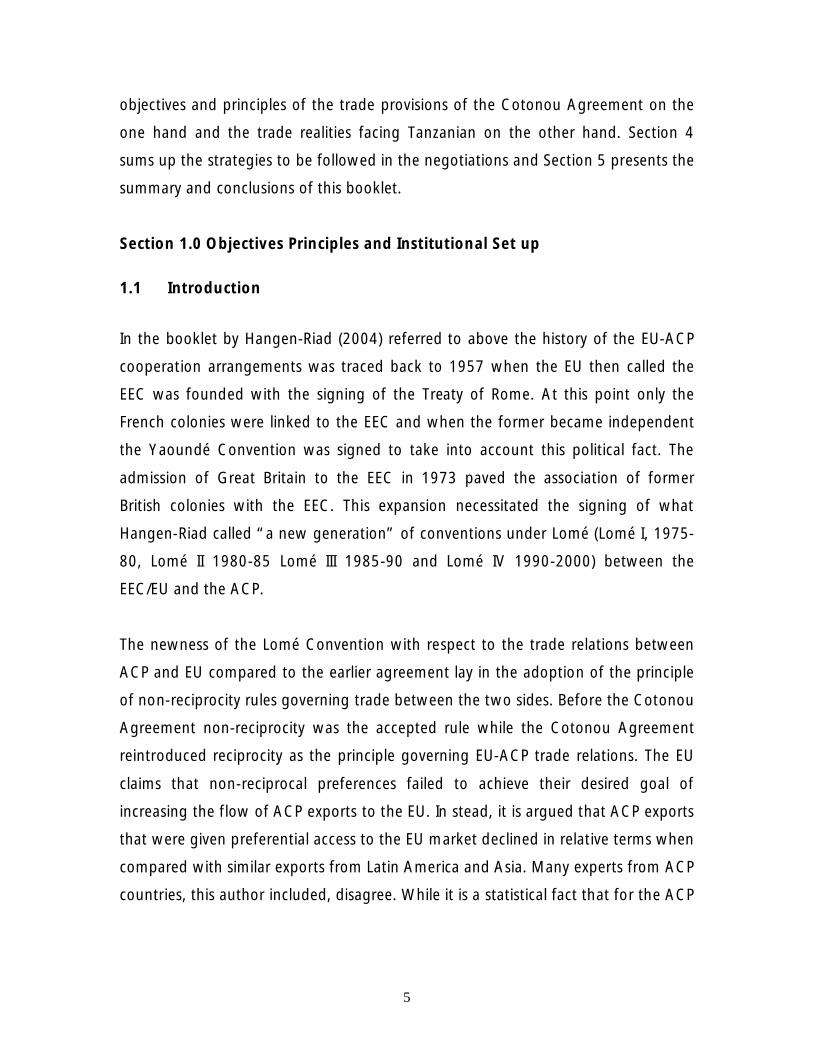
objectives and principles of the trade provisions of the Cotonou Agreement on the
one hand and the trade realities facing Tanzanian on the other hand. Section 4
sums up the strategies to be followed in the negotiations and Section 5 presents the
summary and conclusions of this booklet.
Section 1.0 Objectives Principles and Institutional Set up
1.1 Introduction
In the booklet by Hangen-Riad (2004) referred to above the history of the EU-ACP
cooperation arrangements was traced back to 1957 when the EU then called the
EEC was founded with the signing of the Treaty of Rome. At this point only the
French colonies were linked to the EEC and when the former became independent
the Yaoundé Convention was signed to take into account this political fact. The
admission of Great Britain to the EEC in 1973 paved the association of former
British colonies with the EEC. This expansion necessitated the signing of what
Hangen-Riad called “ a new generation” of conventions under Lomé (Lomé I, 1975-
80, Lomé II 1980-85 Lomé III 1985-90 and Lomé IV 1990-2000) between the
EEC/EU and the ACP.
The newness of the Lomé Convention with respect to the trade relations between
ACP and EU compared to the earlier agreement lay in the adoption of the principle
of non-reciprocity rules governing trade between the two sides. Before the Cotonou
Agreement non-reciprocity was the accepted rule while the Cotonou Agreement
reintroduced reciprocity as the principle governing EU-ACP trade relations. The EU
claims that non-reciprocal preferences failed to achieve their desired goal of
increasing the flow of ACP exports to the EU. In stead, it is argued that ACP exports
that were given preferential access to the EU market declined in relative terms when
compared with similar exports from Latin America and Asia. Many experts from ACP
countries, this author included, disagree. While it is a statistical fact that for the ACP

6
as a whole this relative decline happened despite of the preferences it was not
because of the preferences that this happened.
It can be shown that for some ACP countries where the preferences were
substantial, their exports to EU increased more significantly than similar exports
from Latin America and Asia. Secondly the formalities involved in claiming the
benefits associated with the preferences in some cases are too complicated to
exporters to put in their claims and therefore some exporters from ACP countries
decided to export like exporters from non-beneficiary countries. Lastly, shortly after
Lomé I, developing countries not associated with the EU mounted strong complaints
about being discriminated by the EU. The latter caved in and started negotiating
preferences with other countries outside the ACP block thus watering down the
relative benefits of these preferences.
1.2 Coverage The trade provisions of the Cotonou Agreement are enumerated under Part 3 Title
II, Articles 34 to 54 under the heading of Economic and Trade Cooperation and are
also set in a number of detailed Annexes and Protocols of the Agreement.
In short the provisions of the Cotonou Agreement can be summarized as follows:
• Objectives and principles related to ACP-EU economic and trade cooperation
• The general trade arrangements to be applied during the transition or
preparatory period i.e. 2000-07 during which the EPA negotiations will be
under way.
• The commodity protocols e.g. the sugar protocol
• The procedures and modalities of the EPA negotiations
• Institutional and joint consultative trade arrangements
• Commitments for joint consultations and cooperation in international fora
e.g. in the WTO

7
• Negotiations related to trade in services and trade related areas.
1.3 Objectives and Principles Under the Cotonou Agreement, the basic aim of ACP-EU economic and trade
cooperation is “ fostering the smooth and gradual integration of the ACP states into
the World economy” .
1.3.1 Reciprocity This is done in conformity with the WTO rules. The most important WTO rule is the
principle of reciprocity which means that the results of trade negotiations emanate
from mutual concessions. That is to receive concessions from other countries a
negotiating country such as Tanzania, must give concessions to the other countries.
While the WTO rules allow the creation of regional integration and cooperation
among its members, the rules specifically point out such cooperation shall be purely
based on reciprocity. That is why the EU applied for permission to grant temporary
non-reciprocity preferences to the ACP. In view of the fact that some of the ACP
countries are LDCs, the non-reciprocity provisions should continue under the
Cotonou Agreement.
1.3.2 Strengthening ACP Regional Integration The other principle governing the negotiations and implementation of EPAs is that
the latter will contribute to the strengthening of economic integration in the ACP
countries rather than contribute to their destruction or weakening.
1.3.3 Poverty Reduction It is pointed out in Hangen-Riad, the main avenue through which the ACP countries
will be helped by the EU to integrate into the world economy will be through the
negotiations and subsequent implementation of EPAs which “ aim to create
reciprocity, through the establishment of preferential trade areas (PTAs) which

8
conform to the rules of the World Trade Organizations (WTO) and build on regional
integration processes in the APC countries.
The same can be said about EPAs and economic development on the ACP side. In
the ACP Mandate agreed upon by all ACP countries it was emphasized that the
ACP-EU partnership is centered on establishing a comprehensive framework for
promoting “ economic development, the reduction and eventual eradication of
poverty and the smooth and gradual integration of ACP states into the world
economy” . The EU mandate on the other hand while mentioning this
developmental aspect of EPAs puts more emphasis on the dismantling of the ACP-
EU trade barriers – the trade liberalization aspect. The challenge for Tanzania and
other ACP countries is to maintain this trade-development balance perspective in
their negotiations.
Tanzania as a least developed country enjoyed a number of “ privileges” along with
other LDCs, with respect to trade and other economic relations under the Lomé
Conventions. In 2001 the EU approved the Everything But Arms initiative (EBA)
which allows duty free access into the EU for all products from LDCs, except arms
munitions and at least for a transitional period, sugar, bananas and rice. However
since the EU prefers to negotiate with groups of countries rather than individual
countries Tanzania and other LDCs may lose their EBA preferences since the LDCs
will have to abide by the EPA agreement reached by the EU and their respective
negotiating groups. This is a real possibility and has actually happened in the case of
the LDCs in SACU where the EU reached a partnership arrangement separately with
South Africa whose provisions became binding to all SACU members including the
LDCs. Tanzania along with the other LDCs in the ACP group must fight to keep this
EBA provision in whatever sub-regional grouping it may negotiate in.
9
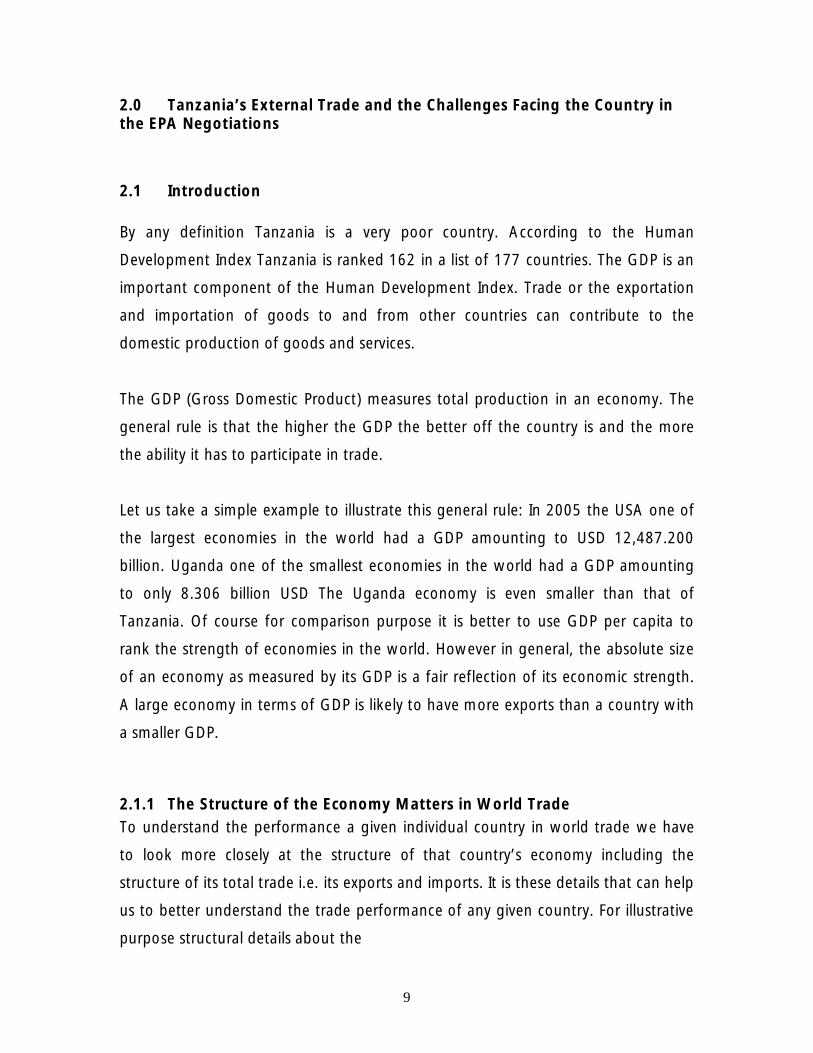
2.0 Tanzania’ s External Trade and the Challenges Facing the Country in the EPA Negotiations
2.1 Introduction By any definition Tanzania is a very poor country. According to the Human
Development Index Tanzania is ranked 162 in a list of 177 countries. The GDP is an
important component of the Human Development Index. Trade or the exportation
and importation of goods to and from other countries can contribute to the
domestic production of goods and services.
The GDP (Gross Domestic Product) measures total production in an economy. The
general rule is that the higher the GDP the better off the country is and the more
the ability it has to participate in trade.
Let us take a simple example to illustrate this general rule: In 2005 the USA one of
the largest economies in the world had a GDP amounting to USD 12,487.200
billion. Uganda one of the smallest economies in the world had a GDP amounting
to only 8.306 billion USD The Uganda economy is even smaller than that of
Tanzania. Of course for comparison purpose it is better to use GDP per capita to
rank the strength of economies in the world. However in general, the absolute size
of an economy as measured by its GDP is a fair reflection of its economic strength.
A large economy in terms of GDP is likely to have more exports than a country with
a smaller GDP.
2.1.1 The Structure of the Economy Matters in World Trade To understand the performance a given individual country in world trade we have
to look more closely at the structure of that country’ s economy including the
structure of its total trade i.e. its exports and imports. It is these details that can help
us to better understand the trade performance of any given country. For illustrative
purpose structural details about the
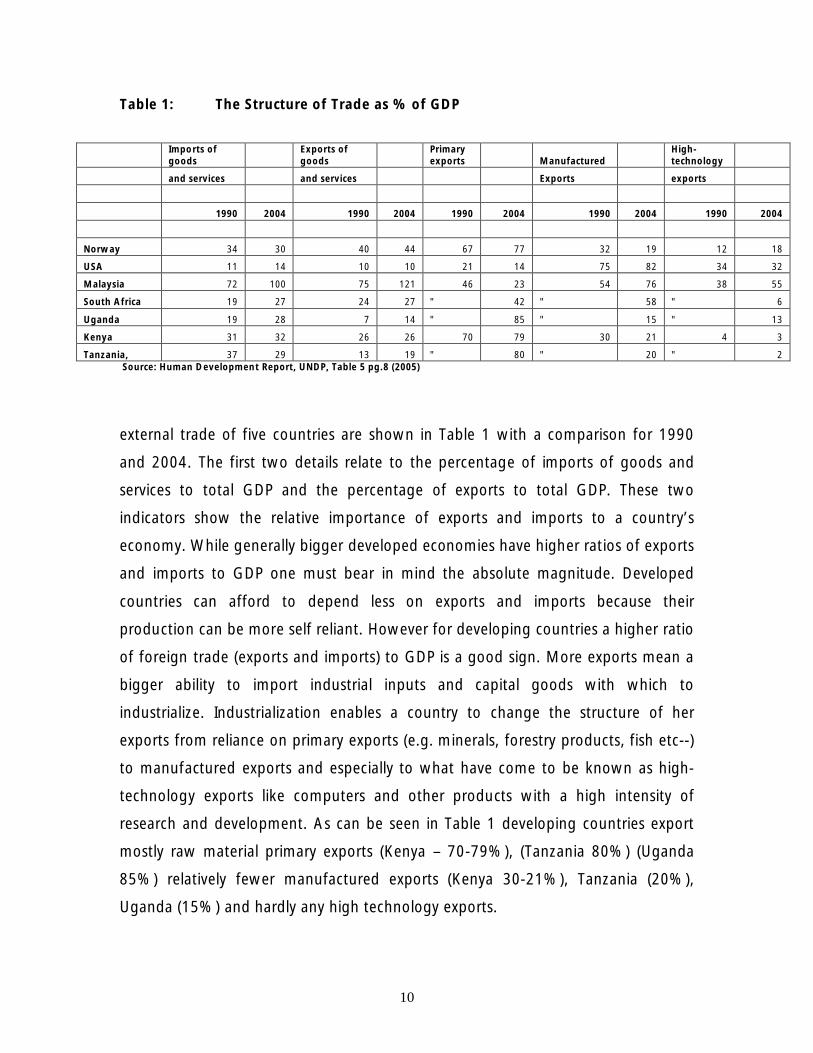
10
Table 1: The Structure of Trade as % of GDP
Imports of goods
Exports of goods
Primary exports Manufactured
High-technology
and services and services Exports exports
1990 2004 1990 2004 1990 2004 1990 2004 1990 2004
Norway 34 30 40 44 67 77 32 19 12 18
USA 11 14 10 10 21 14 75 82 34 32
Malaysia 72 100 75 121 46 23 54 76 38 55
South Africa 19 27 24 27 " 42 " 58 " 6
Uganda 19 28 7 14 " 85 " 15 " 13
Kenya 31 32 26 26 70 79 30 21 4 3
Tanzania, 37 29 13 19 " 80 " 20 " 2 Source: Human Development Report, UNDP, Table 5 pg.8 (2005)
external trade of five countries are shown in Table 1 with a comparison for 1990
and 2004. The first two details relate to the percentage of imports of goods and
services to total GDP and the percentage of exports to total GDP. These two
indicators show the relative importance of exports and imports to a country’ s
economy. While generally bigger developed economies have higher ratios of exports
and imports to GDP one must bear in mind the absolute magnitude. Developed
countries can afford to depend less on exports and imports because their
production can be more self reliant. However for developing countries a higher ratio
of foreign trade (exports and imports) to GDP is a good sign. More exports mean a
bigger ability to import industrial inputs and capital goods with which to
industrialize. Industrialization enables a country to change the structure of her
exports from reliance on primary exports (e.g. minerals, forestry products, fish etc--)
to manufactured exports and especially to what have come to be known as high-
technology exports like computers and other products with a high intensity of
research and development. As can be seen in Table 1 developing countries export
mostly raw material primary exports (Kenya – 70-79%), (Tanzania 80%) (Uganda
85%) relatively fewer manufactured exports (Kenya 30-21%), Tanzania (20%),
Uganda (15%) and hardly any high technology exports.

11
2.2 The Structure of Tanzania’ s Trade
2.2.1 Tanzania’ s Exports A country’ s trade pattern and performance depends on the production structure of
that country’ s economy. Tanzania’ s exports consist mainly of primary commodities
namely agricultural raw materials and minerals. Traditionally agricultural
commodities notably coffee, cotton tobacco, sisal, cashew nuts and tea contributed
the bulk of Mainland Tanzania’ s export earnings. Mainland Tanzania’ s export
economy is more diversified than that of Zanzibar which depends heavily on cloves
as a source of export earnings. In recent years beginning with the nineties the
relative contribution of traditional exports has declined considerably as shown on
Figure 1. Two items - minerals and to a less extent manufactured goods gained
importance as sources of export earnings. This is shown in detail in Table 2. The
other non-traditional exports include fish and forestry products.
Diagram 1: The Evolution of Tanzania of Trade
Source: Constructed by the author from Table 19, Economic Survey 2005 p.57
The evolution of the value of traditional and non-traditional exports
0.00%
10.00%
20.00%
30.00%
40.00%
50.00%
60.00%
70.00%
80.00%
90.00%
2000 2001 2002 2003 2004 2005
Year
TRADITIONAL COMMODITIES NON-TRADITIONAL COMMODITIES

12
Table 2. Traditional and non-traditional exports. Values in million US $
COMMODITIES 2000 % 2001 % 2002 % 2003 % 2004 % 2005 %
Traditional
Coffee 83.7 12.62 57.1 6.77 35.22 3.6 49.8 4.3 49.8 3.38 74.3 4.43
Cotton 38 5.73 33.7 3.96 28.63 2.92 41.3 3.57 74.6 5.06 111.5 6.65
Sisal 5.6 0.84 6.7 0.79 6.55 0.67 6.8 0.59 7.2 0.49 7.3 0.44
Tea 32.7 4.93 29 3.45 29.6 3.02 25 2.16 30.1 2.04 25.6 1.53
Tobacco 38.4 5.79 35.7 4.19 55.52 5.67 46 3.97 57.6 3.91 80.8 4.82
Cashew nuts 84.4 12.73 56.6 6.65 46.59 4.76 44.2 3.82 68.1 4.62 46.6 2.78
Cloves 10 1.51 19.3 1.44 3.96 0.4 10.3 0.89 10.3 0.7 8.5 0.51
Sub-total 292.8 44.14 231.1 27.14 206.07 21.03 223.4 19.29 297.7 20.21 354.6 21.15
Non-traditional
Petroleum products 0 0 0 0 0 0 0 0 0 0 0 0
Minerals 178.2 26.87 302.23 35.5 383.8 39.18 491.6 42.45 680.2 46.17 711.3 42.43
Manufactured goods 43.4 6.54 56.16 6.6 65.9 6.73 83.5 7.21 110.1 7.47 156.1 9.31
Other exports 148.8 22.45 261.9 30.76 323.9 33.06 359.7 31.06 385.1 26.14 454.4 27.11
Sub-total 370.5 55.86 620.29 72.86 773.6 78.96 934.8 80.71 1175.4 79.79 1321.8 78.85
GRAND TOTAL 663.3 100 851.39 100 979.67 99.96 1158.2 100 1473.1 100 1676.4 100
Note: some may not add up to 100% due to rounding off errors.
Source: The Annual Economic Survey 2005, Table No. 19 p.57

13
It can be seen from Table 2 that despite the slight improvement, manufactured
goods still form a very small part of Tanzania’ s exports although they have
somehow gained in importance. Tanzania is therefore still an underdeveloped
economy whose external sector is still dominated by the exportation of commodities
with manufactured goods and especially high technology goods accounting for very
little of her export earnings.
2.2.2 Tanzania’ s Imports Tanzania’ s composition of imports is depicted in Table 3 where these imports are
divided into three main categories of capital goods (consisting of Transport
equipment, building and construction equipment and Machinery), intermediate
goods like oil, fertilizers and industrial inputs and consumer goods which include
food products, and all other consumer goods. Ideally as a developing country
Tanzania should concentrate on importing capital goods which it needs to improve
her economic infrastructure and to expand its manufacturing sector. Unfortunately
the country is forced to spend her meager resources to import food and other
consumer goods as shown in Table 3 below.

14
Source: Bank of Tanzania
VALUE COMPOSITION OF IMPORTS 1986-2005
Table No. 3
Year Consumer goods % Intermediate goods % Capital goods %
Total Shs. Million %**
1986 8014 20.04 13058 32.66 18899 47.28 39971 100
1987 13180 16.69 23819 30.17 41948 53.13 78947 100
1988 29841 23.12 55284 42.83 43950 34.05 129075 100
1989 34779 18.14 60176 31.38 96804 50.48 191759 100
1990* 18783 8.12 116277 50.27 96223 41.6 231283 100
1991 62000 22.84 69710 25.68 139668 51.46 271378 100
1992 101641 25.88 94233 23.99 196791 50.12 392665 100
1993 194604 36.59 107481 20.21 229657 43.19 531742 100
1994 247076 37.08 128544 19.29 290638 43.62 666258 100
1995 201347 26.12 294224 38.17 275207 35.71 770778 100
1996 182340 25.95 267600 38.09 252501 35.95 702441 100
1997 301018 42.8 203418 28.9 198670 28.3 703106 100
1998 441024 48.6 155225 17.1 311244 34.3 907494 100
1999 503868 47.47 197271 18.58 360225 33.94 1061363 100
2000 401612 37.58 222399 20.82 444427 41.59 1068438 100
2001 405139 30.99 336252 25.72 565740 43.28 1307131 100
2002 456176 31 375241 25.5 640118 43.5 1471535 100
2003 601100 29.39 663580 32.45 780107 38.15 2044787 100
2004 905686 32.96 790251 28.76 1051470 38.27 2747407 100
2005 937348 28.3 1032906 31.19 1341431 40.51 3311685 100
* commencing 1990, the value of imports is quoted at F.O.B prices ( previously quoted at C.I.F prices )
*Others may not add up to 100% due to rounding off errors.

15
2.3 Tanzania’ s Balance of Payments
The balance of payments is the record of a country’ s economic transactions
between that country and the rest of the world for a given period usually for a given
year. While the record as a whole must balance, the individual items in that record
need not balance.
The summary of the state of Tanzania’ s external sector is given in the government’ s
Economic Survey published annually just before the budget session of parliament.
The examination of the state and performance of the external sector is treated in an
entire chapter of that survey. Apart from analyzing the country’ s exports and
imports of goods the chapter also discusses the outcome of the other items of the
balance of payments in terms of the balance of services, the balance of various
receipts and payments (incomes balance) and current transfers which all sum up to
the balance on current account.
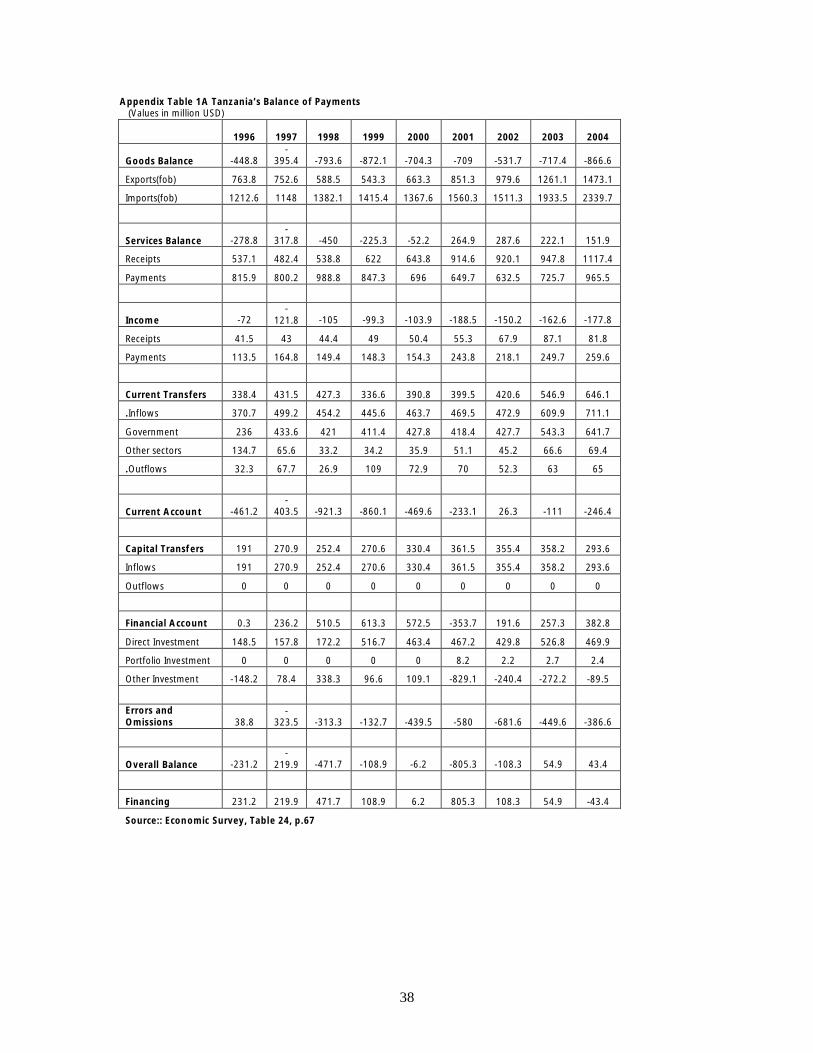
The balance of payments of Tanzania for the period 1996 to 2004 is depicted in
appendix table 1A. It can be seen from this table that the deficit in the Goods
Balance has generally increased from -448.8 USD million in 1996 to -866.6 USD
million in 2004. That is Tanzania imported goods that exceeded the goods it
exported by 448.8 USD million in 1996 and that in 2004, the value of goods
imported exceeded the value of exports by 866.6 USD million (see appendix table
1A).
Because of improvement of tourism in particular, Tanzania has been recording a
surplus in the service account. Thus if we add the goods balance and the services
balance the deficit recorded in the goods balance is reduced somewhat.

16
The income balance has always been in a deficit because the incomes we pay to
foreigners in terms of interest charges and salaries to foreigners has always
exceeded the incomes Tanzania residents have received from foreigners.
So after the improvement brought about by the surplus in the services sector the
over-all deficit increased because of the deficit on the incomes account. The current
transfers have always been in surplus because Tanzania receives budgetary and
other annual financial support from donor counties and others. If we add these
surplus transfers, the deficit we have decreases. However except for one year in
2002 these inflows have not been enough to close the current account gap
between receipts/income and payments. So our current account has usually been in
deficit.
Because of the good performance on the receipts side in the (Capital Account
payment of financial assets and direct investment) inflows have exceeded outflows
in the Capital Account.
Nevertheless when we add up everything, having taken errors and omissions into
consideration, because of the initial big deficit on the goods balance, the overall
balance has most of the time been in deficit as shown in Appendix Table IA.
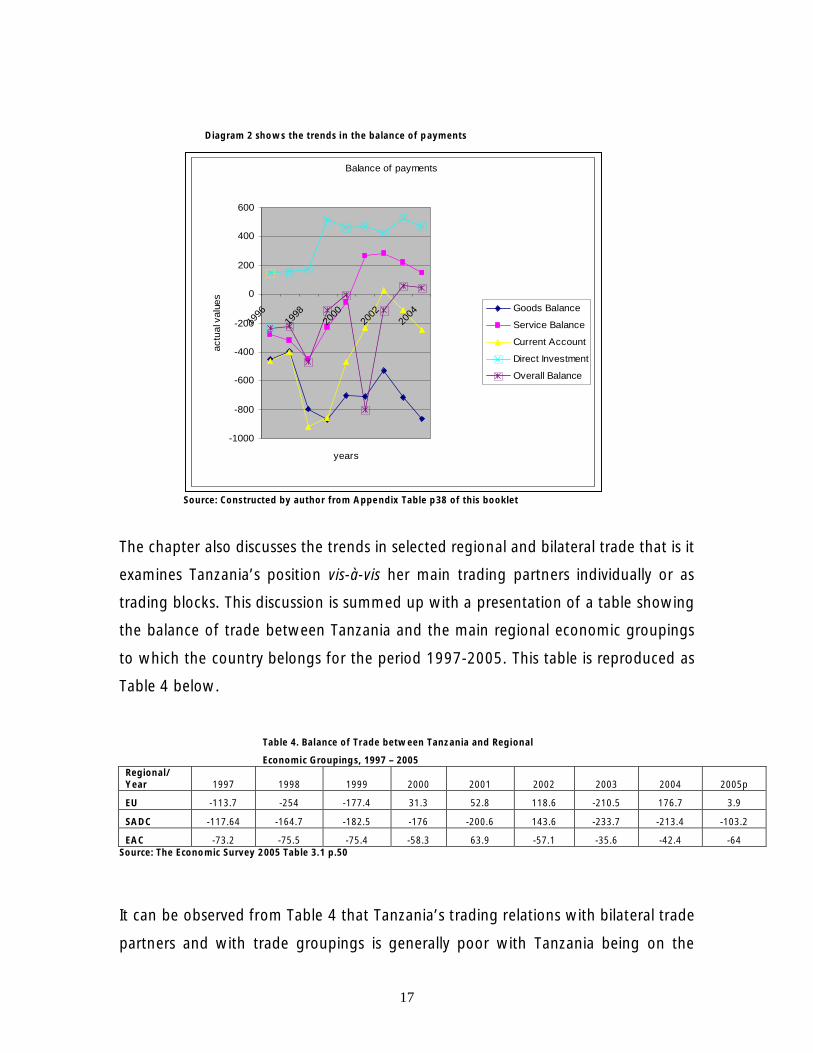
Diagram 2 depicts the movement in the various items of the Balance of payments.
17
Diagram 2 shows the trends in the balance of payments
Source: Constructed by author from Appendix Table p38 of this booklet
The chapter also discusses the trends in selected regional and bilateral trade that is it
examines Tanzania’ s position vis-à-vis her main trading partners individually or as
trading blocks. This discussion is summed up with a presentation of a table showing
the balance of trade between Tanzania and the main regional economic groupings
to which the country belongs for the period 1997-2005. This table is reproduced as
Table 4 below.
Table 4. Balance of Trade between Tanzania and Regional
Economic Groupings, 1997 – 2005 Regional/ Year 1997 1998 1999 2000 2001 2002 2003 2004 2005p
EU -113.7 -254 -177.4 31.3 52.8 118.6 -210.5 176.7 3.9
SADC -117.64 -164.7 -182.5 -176 -200.6 143.6 -233.7 -213.4 -103.2
EAC -73.2 -75.5 -75.4 -58.3 63.9 -57.1 -35.6 -42.4 -64 Source: The Economic Survey 2005 Table 3.1 p.50
It can be observed from Table 4 that Tanzania’ s trading relations with bilateral trade
partners and with trade groupings is generally poor with Tanzania being on the
Balance of payments
-1000
-800
-600
-400
-200
0
200
400
600
1996
1998
2000
2002
2004
years
actu
al v
alu
es
Goods Balance
Service Balance
Current Account
Direct Investment
Overall Balance

18
losing side i.e. Tanzania’ s balance of trade with all her three main trading blocks
was in deficit. If we divide the period shown in Table 4 into two periods: 1997-2000
and 2001-2005, we note that the first period was much worse than the second
one. This period shows the lingering effects of a long period of poor economic
performance which began towards the end of the 70’ s. The second period shows
discernible improvement in the balance of trade and therefore a testimony of overall
improvement in the economy. In the first period with the exception of a small
surplus in the trade with the EU in one year, deficits were generally the order of the
day for Tanzania’ s trade with her major trading partners including the EU.
To clarify the relationship between Tanzania’ s merchandise trade and the country’ s
status and performance within the country’ s main trading blocks we reproduce
information from the Tanzania Trade Diagnostic Study. This is reproduced here as
Table 5.
Table 5 shows Tanzania’ s total trade (Exports + Import), Exports and Imports for
selected years (1997, 2000 and 2003) all expressed as percentages of GDP. The
table then gives net-exports (deficits or surpluses) also expressed as percentages of
GDP.
The Table is divided into four parts each part representing a category of exports and
imports. The first part concerns trade in all goods (i.e. exports and imports, to and
from:
(a) The world
(b) Africa (the four sub regions and the rest of Africa)
(c) Rest of the World
The second part concerns the category of exports and imports related to agriculture,
food beverages and tobacco from (a) (b) and (c) as above.
The third part concerns the category of exports and imports related to minerals, and
base metals also from and to (a), (b) and (c).

19
And finally the fourth part concerns exports and imports of industrial manufactured
goods to and from (a) (b) and (c).
Table 5 is shown below.

20
Table Structure of Tanzania's Merchandise Trade within the Region
( percent of gross domestic product )
Total trade Exports Imports Net- Exports
1997 2000 2003 1997 2000 2003 1997 2000 2003 1997 2000 2003
All goods
World 22.2 21.5 33.1 7.5 7.2 11.8 14.7 14.3 21.3 -7.2 -7.1 -9.5
Africa 4 3.7 7.3 1.1 0.9 2.7 2.9 2.8 4.6 -1.8 -1.9 -1.8
EAC 1.7 1.1 2.5 0.4 0.4 1.3 1.3 0.7 1.2 -0.9 -0.3 0.1
SADC only 1.5 1.8 3.4 0.1 0.1 0.4 1.4 1.7 3 -1.3 -1.6 -2.6
SADC & COMESA 0.6 0.5 1 0.4 0.2 0.8 0.2 0.3 0.2 0.3 -0.1 0.6
COMESA only 0.2 0.2 0.3 0.2 0.1 0.2 0 0.1 0.1 0.1 0 0.1
Other Africa 0 0.1 0.2 0 0.1 0.1 0 0 0.1 0 0 0
Rest of World 18.2 17.8 25.8 6.4 6.3 9.1 11.8 11.5 16.7 -3.6 -3.2 -5.8
Agriculture, foods, bev erages
and tobacco
World 9.5 7.3 8.1 6.6 4.7 5.2 2.9 2.6 2.9 3.6 2.1 2.3
Africa 1.4 1.1 1.9 0.8 0.5 1.5 0.6 0.6 0.4 0.2 -0.1 1.1
EAC 0.5 0.4 1.1 0.3 0.3 1 0.2 0.1 0.1 0.1 0.1 0.9
SADC only 0.4 0.3 0.3 0.1 0 0.1 0.3 0.3 0.2 -0.2 -0.1 -0.1
SADC & COMESA 0.3 0.3 0.3 0.3 0.1 0.3 0 0.2 0 0.3 -0.1 0.3
COMESA only 0.1 0 0.1 0.1 0 0.1 0 0 0 0.1 0 0.1
Other Africa 0 0.1 0.1 0 0.1 0.1 0 0 0 0 0.1 0.1
Rest of World 8.1 6.2 6.2 5.8 4.2 3.7 2.3 2 2.5 2.1 3.2 2.2
Minerals and base metals
World 1 2.2 6.1 0 1.3 5 1 0.9 1.1 -1 0.4 3.9
Africa 0.4 0.3 0.8 0 0.1 0.3 0.4 0.2 0.5 -0.3 -0.1 -0.1
EAC 0.2 0.1 0.2 0 0 0.1 0.2 0.1 0.1 -0.2 -0.1 0
SADC only 0.1 0.2 0.6 0 0.1 0.2 0.1 0.1 0.4 -0.1 -0.1 -0.1
SADC & COMESA 0 0 0 0 0 0 0 0 0 0 0 0
COMESA only 0 0 0 0 0 0 0 0 0 0 0 0
Other Africa 0 0 0 0 0 0 0 0 0 0 0 0
Rest of World 0.6 1.9 5.3 0 1.2 4.7 0.6 0.7 0.6 0.2 -0.3 4.1
Industrial Manufacturing *
World 11.6 12.1 18.9 0.9 1.3 1.6 10.7 10.8 17.3 -9.8 -9.6 -15.7
Africa 2.3 2.4 4.6 0.3 0.4 0.9 2 2 3.7 -1.7 -1.7 -2.9
EAC 0.9 0.7 1.2 0.1 0.2 0.2 0.8 0.5 1 -0.7 -0.4 -0.7
SADC only 0.9 1.3 2.5 0 0 0.1 0.9 1.3 2.4 -0.9 -1.3 -2.3
SADC & COMESA 0.2 0.2 0.5 0.1 0.1 0.4 0.1 0.1 0.1 0 0 0.3
COMESA only 0.1 0 0.2 0.1 0 0.1 0 0 0.1 0 0 0
Other Africa 0 0 0.1 0 0 0 0 0 0.1 0 0 0
Rest of World 9.3 9.7 14.3 0.6 0.9 0.7 8.7 8.8 13.6 -6.5 -6.2 -10
Note: EAC trading partners are Keny a and Uganda; "SADC only " refers to Botsw ana, Lesotho, Mozambique
and RSA; "SADC & COMESA" is the group comprising Angola, DRC, Namibia, Malaw i, Mauritius, Sey chelles
Sw aziland, Zambia and Zimbabw e; and "COMESA only " consists of Burundi, Comoros, Djibouti, Egy pt, Eritrea
Ethiopia, Madagascar, Rw anda and Sudan
* Industrial manufacturing refers to all manufacturing sectros ex cept food, bev erages and tobacco and base metals
( ISIC rev . 2 codes 31 and 37 )
Source: Reproduced from Tanzania

21
Some brief interpretations are in order to help us understand this important table.
All total goods (exports and imports) accoutered for 22.2 percentage of GDP in
1997 and fell to 21.5 percentage in 2000 but rose fairly sharply in 2003 to 33.1
percent.
When total trade is decomposed into exports and imports we note that total exports
to the world accounted for 7.5 percent of the country’ s GDP while Tanzania
imported goods equivalent to 14.7 percent of GDP leaving a 7.2 percent deficit in
terms of the country’ s GDP in 1997. In 2000 the share of exports in GDP declined to
7.2 per cent and the share of imports also declined slightly to 14.3. In 2003 exports
increased to double digit percentage points. However imports accounted for even a
much bigger share of GDP increasing their share from 14.3 to 21.3 and hence the
deficit increased to 9.5 percent of GDP.
With regard to trade between Tanzania and Africa we note that for all goods
Tanzania’ s participation is very small with total trade between Tanzania and African
countries accounting for less than 2 per cent of GDP. Moreover as with the world,
Tanzania trade with all African countries put together was in deficit during all the
selected years with this deficit as a percentage of GDP having stagnated at around -
1.85 percent of GDP. With regard to trade with the major sub-regional groups in
Africa while there is improvement with some groups, Tanzania’ s balance of trade is
generally in deficit.
Thus in 2003 for the first time in many years Tanzania recorded a small surplus in
her trade with the EAC. It should be noted that this was because of the surplus with
Uganda. The trade transactions with Kenya have been in deficit for a long time
although it should be noted that the trade imbalance with Kenya has been on the
decline. Indeed it is this decline in the trade deficit with Kenya and the continuing
surplus with Uganda that led to the net surplus recorded in the EAC in 2003.

22
Mainly because of South Africa, Tanzania has a considerable deficit in the SADC. It
can be argued that Tanzania’ s declining deficit with Kenya can be explained by the
growing deficit with South Africa.
Sections 2 to 4 break down the first section which covers all sectors into three main
sectors of Agriculture Food, Beverages and Tobacco, Minerals and Base Metals and
Industrial Manufacturing. We note the following about the sectoral structure about
Tanzania’ s trade.
(a) Even globally there is no doubt that Tanzania has a comparative advantage
in the agriculture sector. It recorded surpluses for all the three years selected.
However there is no steady increase in the contribution of this sector of trade to
GDP. There is still an unexploited potential to increase exports in this sector and
therefore enhance Tanzania’ s status in world trade.
(b) Minerals and base metals are acquiring importance as one of Tanzania’ s
main source of export earnings. They constitute the most important contributor to
foreign exchange and account for the highest contribution from GDP derived from
merchandise trade. However, like agricultural products they add little to Tanzania’ s
trade with other African countries. Furthermore minerals are not considered as
being dynamic exports.
(c) Tanzania’ s trade in manufacturing constitutes the country’ s weakest link in
world trade as can clearly be seen in section four of Table 5. It is in this sector that
Tanzania has a deficit with almost every trading partner except few groups of
countries (i) SADC and COMESA, (ii) COMESA only and (iii) other Africa. For these
countries for some of the years Tanzania even recorded surpluses. However these
countries trade with Tanzania is insignificantly small. The issue is not so much that
Tanzania has no markets in other countries in the manufacturing sector. The truth
of the matter is that Tanzania has very little to export in this sector. The answer is
increased investment in manufacturing in order to produce more exportables. The

23
agricultural sector also needs investment to enable it to exploit its export potential
more fully. EPAs must help Tanzania to increase her exports and in particular help
Tanzania to trade in manufactured exports, if EPAs are to fulfill the objective of
integrating Tanzania and other LDCs in the world economy.
In Table 6 we present a more detailed view of Tanzania’ s structure of merchandise
trade in the world. Table 6 gives the Balance of Trade between Tanzania and the
rest of the world with details for major trading blocks and individual countries. This
Table is derived from Tables 2A and 3A in Appendix I. In this Table the rest of the
world is presented in greater details specifying trade with EU, African countries
American countries and other countries. Within these groupings important
individual countries, are singled out. It should be noted that in Table 6 the data is
presented in million USD. The deficits and surpluses are therefore easier to follow
than those in the previous table which are in terms of percentage of GDP. On the
basis of Table 6 we note the following further points.
(a) The data presented in Table 6 generally corroborate the findings based
on Table 5 However it should be noted Tanzania data from different
sources are notoriously contradictory at times!

24
Table 6: Tanzania Balance of Trade by Major Regions
Country/Region 1997 1998 1999 2000 2001 2002 2003 2004 2005p
EU -
140.6 -
273.4 -
198.4 17.5 42.5 110.3 210.5 176.8 3.9
Africa Southern African Development Community (SADC)
South Africa -88.1 -
124.4 -
164.2 -
162.3 -
194.7 -
172.3 -
269.1 -
216.6 -114.4
Zambia -15 -13.3 -4.5 2.3 3.7 13.1 15.7 0.7 4.8
Swaziland -9 -0.78 -12.5 -12.9 -12.7 -15.6 -12.2 -14.4 -17.9
Zimbabwe -4.73 -14.6 -5.6 -4.5 -3 -2 -1.2 -0.3 -0.1
Mozambique -2.5 -0.09 0.6 1.4 1 1.6 1.3 1.8 4.5
DRC 1.6 0.22 3.6 0 5.2 15.4 21.9 9.3 12.1
Other SADC 16.3 19.9 6.1 7.8
Total SADC -
117.6 -
164.7 -
182.5 -176 -
200.6 -
143.6 -
233.7 -
213.3 -103.2
East African Community (EAC)
Kenya -82.9 -79.8 -74.1 -61.2 -58 -59.9 -37.6 -46.4 -79
Uganda 9.7 4.2 -1.3 2.9 -5.9 2.8 2.1 4.1 15
Total EAC -73.2 -75.5 -75.4 -58.3 -63.9 -57.1 -35.5 -42.3 -64
Other African 4.3 0.4 3.4 4.7 6 13.9 4.4 -23.2 12.4
Total African -
186.5 -
239.8 -
254.5 -
229.6 -
258.4 -
186.8 -
264.8 -
278.9 -154.8
North American Countries
USA -31.2 -68.5 -81.3 -43.7 -50.2 -77.9 -58.4 -64.4 -83.4
Canada -10.8 -16 -26.1 -31.8 -22.7 -16.3 -17.9 -34.9 3.9
Other American -15.5 -38.9 -37.9 -24.5 -7.9 -12.4 -30.2 -30 -43
Total American -57.5 -
123.3 -
145.2 -
100.1 -80.7 -
106.6 -
106.5 -
129.3 -122.5
Other countries
India -11 25 18.2 9.7 -5.3 -42.6 -98.4 -
115.4 -23.9
Japan -14 -85.5 -
134.3 -
108.1 -82.2 -42.4 -81.7 -
116.3 -131.4
UAE -88.5 -52.9 -44.3 -50.7 -99.4 -82.8 -
131.4 -
167.2 -161.4
Others 145.1 0.2 -63.3 -
183.3 -
393.3 -
339.8 -417 -
446.8 -347.9 Source: calculated from Table 3.2 and 3.3, Economic Survey 2005 pg. 51 and 52,
While the EU has continued to be the most important market for Tanzania’ s exports
(see diagram 3) it has become less important as a source of Tanzania’ s imports.
Other countries notably Japan, India, China and many others are competing strongly
with the EU in Tanzania’ s markets (see diagram 4). This is also true with respect to
the EU and the markets of other ACP countries. EPA is therefore the EU’ s answer to
the problem of maintaining ACP markets in its hold in the face of fierce competition
from other trading blocks and individual countries. This is important for Tanzania
and other ACP countries to bear in mind in the EPA negotiations with Europe.

25
Diagram 3: Trend in Tanzania’ s Direction of Exports Source: Table 3.2 Economic Survey 2005 p.51
Tanzania's ex ports by region of destination
0.00%
10.00%
20.00%
30.00%
40.00%
50.00%
60.00%
70.00%
1997
1999
2001
2003
2005
p
Year
Perc
enta
ges EU
AFRICA
NORTH AMERICA
OTHER COUNTRIES

26
Diagram 4: Trend in Tanzania’ s Source of Imports Source: Table 3.3 Economic Survey 2005, p.52
The trade imbalance with South Africa is reaching alarming proportions. However
we should point out again, this is due to Tanzania’ s poor capacity to produce
manufactured goods in particularly and as a consequence, its inability to increase its
exports not only to South Africa but to most other places. As can be seen in Table 6
in SADC it is only the DRC that is a net importer from Tanzania (i.e. Tanzania has a
surplus in the goods balance with that country). For all the other SADC countries
Tanzania has had deficits in the merchandise trade with them for most of the time.
If the deficits are declining it is because some of these countries have their own
other problems (e.g. war in DRC and adverse economic conditions in Zimbabwe),
rather than Tanzania’ s improved export performance.
Tanzania's import
0.00%
10.00%
20.00%
30.00%
40.00%
50.00%
60.00%
1997
1999
2001
2003
2005
p
Year
Perc
enta
ges EU
AFRICA
NORTH AMERICA
OTHER COUNTRIES

27
2.4 EU Trade with Tanzania
In Table 5 Tanzania’ s exports and imports were categorized into three groups –
agricultural food, beverages and tobacco (in short agricultural commodities) (b)
Minerals and Base Metals and (c) Industrial Manufactures. In that Table Tanzania
exports to the EU and Tanzania imports from EU were concealed in the category
referred to as “ the rest of the world” . Because Tanzania trade links with African
countries are very small the rest of the world appeared to dominate Tanzania’ s
external trade. We know that this dominance of the “ rest of the world” in
Tanzania’ s trade is mainly explained by the dominance of EU’ s trade with Tanzania.
This is confirmed in appendix table 2A which shows the value of exports by
destination and appendix table 3A which shows the value of Tanzania imports by
country or trading block of origin.
With regard to exports two categories dominate Tanzania’ s exports globally –
minerals and agricultural products. Generally these are also the categories that
dominate Tanzania’ s exports to the EU. Taking Tanzania’ s exports to the EU in 2003
as an example, it is seen that Tanzania’ s exports amounted to USD 654.9 million out
of a total of USD 1129.2 million exports to the world. That is to say EU accounted
for 58.0 percent of Tanzania’ s exports. The top twenty commodities amounted to
USD 646,971,219 million as shown in Table 7 Minerals alone earned Tanzania USD
450, 153,034 million and they were the number one export to the EU accounting
for 57.5 percent of Tanzania’ s exports to the EU. Fish came second and brought in
USD 61,104,007 million of export earnings. The next 10 commodities after minerals
were all agriculturally related (If we take the FAO definition that includes fish other
marine products, forestry products including honey and timber, as part of
agriculture).
It is clear from table 7 that, out of the top 20 commodities exported by Tanzania to
Europe industrial manufactures do not account for much of Tanzania’ s exports to
EU.
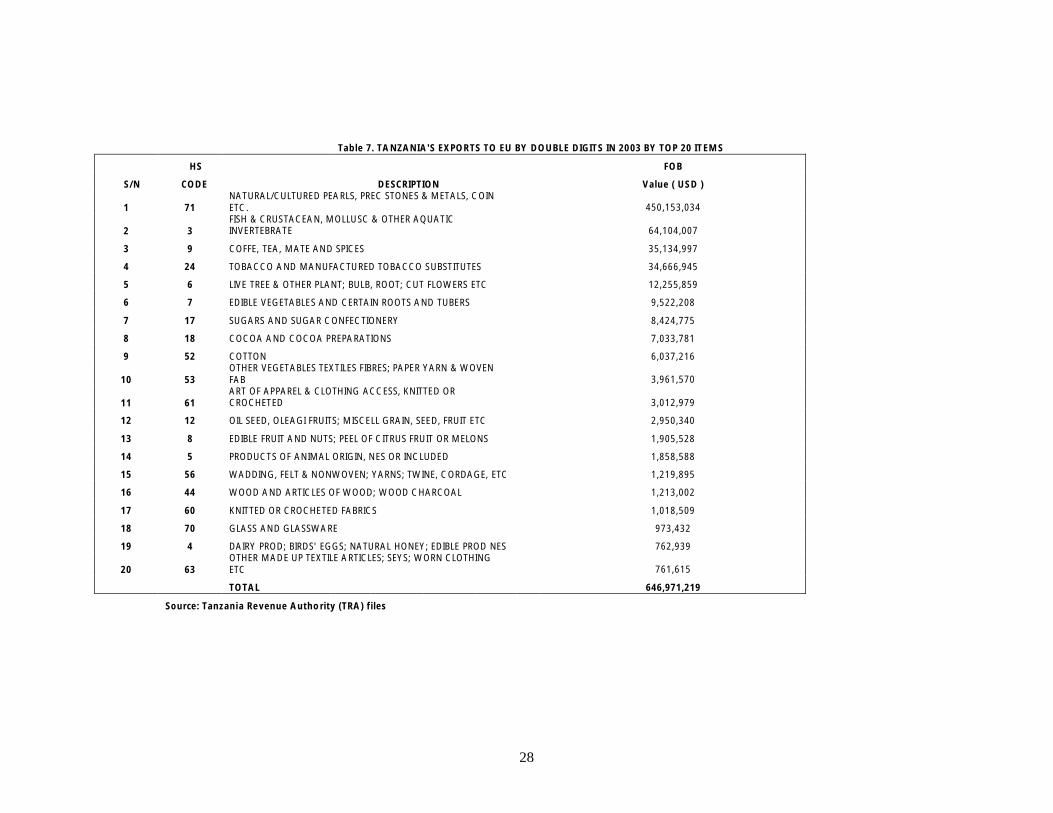
28
Table 7. TANZANIA'S EXPORTS TO EU BY DOUBLE DIGITS IN 2003 BY TOP 20 ITEMS
HS FOB
S/N CODE DESCRIPTION Value ( USD )
1 71 NATURAL/CULTURED PEARLS, PREC STONES & METALS, COIN ETC. 450,153,034
2 3 FISH & CRUSTACEAN, MOLLUSC & OTHER AQUATIC INVERTEBRATE 64,104,007
3 9 COFFE, TEA, MATE AND SPICES 35,134,997
4 24 TOBACCO AND MANUFACTURED TOBACCO SUBSTITUTES 34,666,945
5 6 LIVE TREE & OTHER PLANT; BULB, ROOT; CUT FLOWERS ETC 12,255,859
6 7 EDIBLE VEGETABLES AND CERTAIN ROOTS AND TUBERS 9,522,208
7 17 SUGARS AND SUGAR CONFECTIONERY 8,424,775
8 18 COCOA AND COCOA PREPARATIONS 7,033,781
9 52 COTTON 6,037,216
10 53 OTHER VEGETABLES TEXTILES FIBRES; PAPER YARN & WOVEN FAB 3,961,570
11 61 ART OF APPAREL & CLOTHING ACCESS, KNITTED OR CROCHETED 3,012,979
12 12 OIL SEED, OLEAGI FRUITS; MISCELL GRAIN, SEED, FRUIT ETC 2,950,340
13 8 EDIBLE FRUIT AND NUTS; PEEL OF CITRUS FRUIT OR MELONS 1,905,528
14 5 PRODUCTS OF ANIMAL ORIGIN, NES OR INCLUDED 1,858,588
15 56 WADDING, FELT & NONWOVEN; YARNS; TWINE, CORDAGE, ETC 1,219,895
16 44 WOOD AND ARTICLES OF WOOD; WOOD CHARCOAL 1,213,002
17 60 KNITTED OR CROCHETED FABRICS 1,018,509
18 70 GLASS AND GLASSWARE 973,432
19 4 DAIRY PROD; BIRDS' EGGS; NATURAL HONEY; EDIBLE PROD NES 762,939
20 63 OTHER MADE UP TEXTILE ARTICLES; SEYS; WORN CLOTHING ETC 761,615
TOTAL 646,971,219
Source: Tanzania Revenue Authority (TRA) files

29
3.0 The EPA Negations: The Challenges
3.1 Introduction
The proceeding sections have set the necessary background for a discussion of the
challenges facing Tanzania in the EPA negotiations. These challenges are related to,
on one hand, the principles of EPAs and on the other hand, the socio-economic
realities including the trade aspects, facing Tanzania.
3.2 The Integration of LDCs, in the World Economy
The first challenge relates to the interpretation of the objectives and principles
behind EU-ACP economic and trade cooperation. The Cotonou Agreement states
that the aim of the ACP-EU economic and trade cooperation to repeat the earlier
quotation is “ fostering the smooth and gradual integration of the ACP states into
the World economy ” (emphasis added). Tanzania we pointed out in Section 2, is a
small underdeveloped economy with a lop-sided economic structure which is
dependent on agriculture and other raw materials in terms of both production and
trade. Most people in Tanzania and other LDCs live in abject poverty. There is a link
between this poverty and the dependency on commodity exports by LDCs. (See
UNCTAD 2003).
3.2.1 The Link with Poverty Eradication The “ integration” of Tanzania into the World Economy must go hand in hand with
poverty eradication in Tanzania and other LDCs. The eradication of poverty as part
of the strategy to integrate developing ACP countries under EPA is mentioned in
some documents and pronouncements by EU participants in the negotiations.
However, greater emphasis seems to be put on the reciprocal elimination of ACP-EU
trade barriers. But even the WTO has accepted exceptions to the rule by giving LDCs
more time before they are required to abide by certain liberalization provisions that

30
require immediate conformity other members. Tanzania and other LDCs must
therefore fight to ensure that they are given ample time to adjust before being
asked to fully reciprocate An element of asymmetry must be built in making these
changes with LDCs reducing their tariffs at a slower rate than the EU.
Indeed the above objective talks about a “ smooth” and “ gradual” integration of
ACP countries into the world economy. The EPA negotiations are expected to end
by December 2007 when the new trade and economic relations are expected to
become operational. How gradual have these negotiations been? Given that only
few months remain before EPAs are implemented, it appears that this “ smooth”
and “ gradual” integration is not being observed.
The first phase negotiations were conducted at an all EU-ACP level and were
launched in September 2002 but by the time a report was issued no agreement was
reached on the issues discussed and therefore the anticipated all ACP-EU agreement
was never reached and it was decided to continue these ACP-EU level negotiations
parallel with the phase II negotiations which are being held at the regional/sub-
regional level.
3.2.2 The Importance of Enhancing Tanzania’ s Capacity in International Trade From section two it was seen that Tanzania is faced by a big trade imbalance
between exports and imports such that the main issue at present is not so much the
lack of access to markets but rather it is the small capacity to produce and export.
For Tanzania the developmental objectives of EPA are more important than the
trade objective of lowering barriers to trade.
3.2.3 Regional Integration EPAs are expected to complement and supplement the economic benefits arising
out of regional integration and not to undermine them. Tanzania is involved in a

31
number of integration schemes notably with the other two EAC countries and with
SADC. These integration schemes are still young and delicate based as they are on
trade among small and weak economies. EPAs must therefore as stated in the
Cotonou agreement seek to support these regional initiatives. If inter-regional
exports in Africa are forced to compete with EU exports to Africa, trade among
African states in some commodities like chicken milk and other food consumer
goods would be adversely affected even to the extent of being wiped out.
3.2.4 Trade Creation and not Trade Diversion A related issue is the impact of tariff reduction on Tanzania’ s trade with other
countries not linked to the Cotonou Agreement especially other third world
countries. Let us give an example of India. EPA will make EU’ s imports to Tanzania
cheaper than India’ s imports. This means that EPA arrangements will result into
trade diversion rather than trade creation that is EU’ s imports will replace India’ s
imports into the Tanzania market because without the EPA liberalization, Indian
imports were cheaper than EU imports. Tanzania’ s consumers will now be forced to
consume the more expensive EU goods which have been made cheaper by the
discriminating tariff reduction in favor of the EU. This is likely to be the case where
the tariff is high. Since Tanzania needs to negotiate for a reduction of tariffs for her
exports to some of these other countries notably China and India, the negotiations
will prove more difficult in view of some of these trade diverting results from EPA
Tanzania and other ACP countries may have to consider some lowering of their
tariffs with respect to other countries like China and India simultaneously with the
reduction of tariffs under the EPA negotiations.
3.2.5 Market Access While most Tanzanian exports do not face access problems in European markets a
few exports nevertheless directly or indirectly face problems. These problems appear
in the following form
32
(a) Tariff Peaks or particularly high tariffs constrain Tanzania’ s export entry to
other countries. For example fruit and vegetable juices which attract ad valorem
tariffs as high as 34 per cent.
(b) Escalation of tariffs – some high tariffs are related to the degree of
processing of a commodity where higher tariffs are imposed on more processed
forms. For example the EU has no tariffs on raw coffee that has neither been
roasted nor decaffeinated, but it imposes MFN tariffs of 7.5 per cent on roasted
coffee, 8.3 per cent on decaffeinated and 11 per cent on coffee that is both roasted
and decaffeinated. (Diagnostic Trade Integrating Study: 40).
(c) Rules of Origin: when countries in trading blocks liberalize access to one
another’ s markets they usually put conditions about the origins of the commodities
that can benefit from this preferential liberalization. The idea is to ensure that
commodities made outside the preferential trading areas do not benefit from the
preferences. Thus one of the rules of origin may state that the percentage of
imported inputs going into the making of the commodity must not exceed a certain
level otherwise the commodity loses its originating status. However some rules of
origin amount to non-tariff barriers pure and simple, and therefore negate or
reduce the preferential benefit in a trading arrangement. In the Lomé Convection
for example to benefits from the preferential treatment on fish fished from waters
of ACP countries, the fish had to be transported to an EU country in a ship
registered in the EU or the ACP countries otherwise the fish lost its originating
status! (The fish becomes Japanese just because it was carried from Tanzanian
waters in a Japanese ship)!
Tanzania along with others in the ACP must negotiate for the removal of rules that
appear to impose disguised barriers to the flow of ACP-EU trade. Many rules of
origin must be simplified so as to encourage Tanzanian and other ACP exporters to
use them. As it is traders in Tanzania find them so cumbersome that they give up
their entitlement to apply for the reduction in tariff.

33
One way of dealing with the problem of rules of origin is to use the of inputs from
developing. That is inputs imported from other ACPs or even better still developing
countries can be added up in order to meet rules of origin requirements.
3.3 Negotiating Strategy
The main issue to bear in mind is that EPA negotiations must safeguard Tanzania’ s
interests as an LDC and must contribute to Tanzania’ s poverty alleviation strategy
which is a precondition for Tanzania’ s integration in the world economy.
3.3.1 Configuration of Negotiating Group The EU prefers to negotiate EPA with groups rather than individual countries. The
idea is to build up Customs Unions among the ACP countries that become
economically integrated with the EU. It would have been better if these groups
existed before the EPA negotiations. As it is they are being formed for the EPA
negotiations while at the same time some countries also continue to be members in
several economic groups. Thus Tanzania is a member of SADC and the EAC but is
negotiating EPA with only some of the SADAC countries. Kenya and Uganda who
are in EAC are negotiating EPA with some COMESA members in the ESA group.
South Africa is in SACU and SADC but is not in any EPA negotiations because it has
its own separate deal with the EU. Ideally Tanzania should negotiate together with
Kenya and Uganda in the EAC as the three are already a Customs Union with a
common external tariff. It would be easier to negotiate mutual tariff reductions
between the EAC and the EU.
3.3.2 Coordination in the African Group Coordination among African countries will help to facilitate these negotiations so as
to ensure that internal economic problems do not get into the EPA negotiations
with the EU.

34
3.3.3 Defensive and Offensive List of Commodities To guard against the possibilities that sensitive sectors in Tanzania are not
overwhelmed to the extent of going out of production, Tanzania must either
backload their liberalization in EPA or leave them out in the negotiations altogether.
This should apply to cereals, livestock and livestock product’ s (e.g. milk, chicken
etc). These commodities are produced mostly by poor peasant producers using poor
technology. If they are exposed to open competition with EU producers, these
products will simply be replaced by EU products. This will worsen poverty among
peasant producers. Hence the negotiations on these products must be delayed or
be completely kept out of the EPA negotiations.
On the other hand Tanzania must identify the commodities that it must sell more in
EU markets. These include processed agricultural materials and industrial products
made by small and medium scale enterprises. This will promote poverty eradication
while enhancing Tanzania’ s integration in the world economy.
The asymmetric liberalization of trade between EU and ACP countries will also help
to ensure that other ACP countries receive preference over EU products in Tanzania
markets.
3.3.4 Is there no Reciprocity on Tanzania’ s Part? The question may be asked what will Tanzania and other ACP countries offer in
return? Tanzania and the other EAC partners have decided to remove all duties on
machinery and other capital goods including industrial inputs. That is these items
are zero-rated. It is true this is offered to imports from all origins. But this also
applies to the EBA provision which applies to all LDCs. The point is, this offer entails
sacrificing revenue on the part the EAC countries. Tanzania can choose to liberalize
tariffs on some consumer goods imported from the EU by stages – front-loading
some and back-loading others over an agreed period, all this with the purpose of

35
safeguarding the industrialization of the country while at the same time ensuring
the gradual but smooth integration of the country and other ACP countries in the
world economy.
3.3.5 Safeguard Measures During the Lomé Conventions when the EU used to give non-reciprocal tariff
concessions to the ACP group, there was a safeguard clause that allowed the EU
country concerned to reimpose part or the full tariff that had been given if it could
show that the concession had somehow. For example if the EU country concerned
could slow a loss of jobs in the economy because of the closure of some or all the
factories making a commodity or commodities being imported from the APC. This
safeguard clause must also be put in EPAs to safeguard the APC economies from
economic harmful effects resulting from EPA related liberalization.
3.3.6 Economic Cooperation It was explained in the second booklet that the EU has not yet firmed up in terms of
amounts, the aid and other financial details under Cotonou. However, if EPAs are to
help contribute to the integration of Tanzania and other LDCs into the world
economy a lot of financial and technical assistance will be needed in order for this
noble objective to be realized. Otherwise EPAs will remain nothing but dreams!

36
4. Summary and Conclusion
The present booklet aims at exploring the EU-ACP trade arrangements under the
Cotonou Agreement. The discussion centers on the negotiations on the Economics
Partnership Agreements between the two groups of countries. The discussion is
done in the context of Tanzania’ s peculiar economic conditions emphasizing on the
challenging issues that Tanzania negotiators will face during the negotiations.
The presentation begins with a discussion of the principles and objectives of the
Cotonou Agreement. The most important issue is that while EPAs aim at integrating
LDCs like Tanzania into the world economy EPAs must also assist these countries to
eradicate poverty. In their negotiations Tanzania and other negotiators must
emphasize the developmental objectives of these EPAs above the trade objective of
reciprocal trade liberalization. EPAs must also contribute to the enhancement of
regional cooperation efforts in APC countries.
The second section of the booklet explains in details the Balance of Payment
Problems of Tanzania. The country cannot produce enough exports to meet its
needs for imported goods. The structure of trade is dominated by agricultural
commodities and minerals whose supply has tended to grow sluggishly. The
solution to the Balance of Payments problem lies in increased investment particularly
in manufacturing in order to increase exports. At present Tanzania’ s trade with
most countries is in deficit. Tanzania performance in SADC, EAC and EU is poor.
The little improvement in the trade with EU has been more because imports from
other countries and areas have increased more than imports from EU. The overall
Balance of Payments for Tanzania therefore remains precarious.
Tanzania has some market access problems with the EU. These need to be
addressed in the EPA negotiations through coordination with other ACP countries
and especially with other African nations. Tanzania needs to identify its offensive

37
and defensive list of commodities. The offensive commodities are the exports that
Tanzania must sell more into the EU. The defensive commodities are the
commodities that Tanzania will try to keep out of the EPA negotiations. This will
help in the industrialization of the country and will also safeguard tax revenue.
38
Appendix Table 1A Tanzania’ s Balance of Payments (Values in million USD)
1996 1997 1998 1999 2000 2001 2002 2003 2004
Goods Balance -448.8 -
395.4 -793.6 -872.1 -704.3 -709 -531.7 -717.4 -866.6
Exports(fob) 763.8 752.6 588.5 543.3 663.3 851.3 979.6 1261.1 1473.1
Imports(fob) 1212.6 1148 1382.1 1415.4 1367.6 1560.3 1511.3 1933.5 2339.7
Services Balance -278.8 -
317.8 -450 -225.3 -52.2 264.9 287.6 222.1 151.9
Receipts 537.1 482.4 538.8 622 643.8 914.6 920.1 947.8 1117.4
Payments 815.9 800.2 988.8 847.3 696 649.7 632.5 725.7 965.5
Income -72 -
121.8 -105 -99.3 -103.9 -188.5 -150.2 -162.6 -177.8
Receipts 41.5 43 44.4 49 50.4 55.3 67.9 87.1 81.8
Payments 113.5 164.8 149.4 148.3 154.3 243.8 218.1 249.7 259.6
Current Transfers 338.4 431.5 427.3 336.6 390.8 399.5 420.6 546.9 646.1
.Inflows 370.7 499.2 454.2 445.6 463.7 469.5 472.9 609.9 711.1
Government 236 433.6 421 411.4 427.8 418.4 427.7 543.3 641.7
Other sectors 134.7 65.6 33.2 34.2 35.9 51.1 45.2 66.6 69.4
.Outflows 32.3 67.7 26.9 109 72.9 70 52.3 63 65
Current Account -461.2 -
403.5 -921.3 -860.1 -469.6 -233.1 26.3 -111 -246.4
Capital Transfers 191 270.9 252.4 270.6 330.4 361.5 355.4 358.2 293.6
Inflows 191 270.9 252.4 270.6 330.4 361.5 355.4 358.2 293.6
Outflows 0 0 0 0 0 0 0 0 0
Financial Account 0.3 236.2 510.5 613.3 572.5 -353.7 191.6 257.3 382.8
Direct Investment 148.5 157.8 172.2 516.7 463.4 467.2 429.8 526.8 469.9
Portfolio Investment 0 0 0 0 0 8.2 2.2 2.7 2.4
Other Investment -148.2 78.4 338.3 96.6 109.1 -829.1 -240.4 -272.2 -89.5
Errors and Omissions 38.8
-323.5 -313.3 -132.7 -439.5 -580 -681.6 -449.6 -386.6
Overall Balance -231.2 -
219.9 -471.7 -108.9 -6.2 -805.3 -108.3 54.9 43.4
Financing 231.2 219.9 471.7 108.9 6.2 805.3 108.3 54.9 -43.4
Source:: Economic Survey, Table 24, p.67

39
Appendix table 2A, Tanzania's export by region of destination
( values in million USD)
Country/Region 1997 1998 1999 2000 2001 2002 2003 2004 2005p
EU 226.5 241.2 214.7 362.1 432.2 479.9 644.9 654.1 619.6
AFRICA
SADC
South Africa 7.9 6.3 6.6 12.1 8.7 16.5 37.3 113.8 275.4
Zimbabwe 1.2 1.6
Zambia 10 3.7 2.8 4.7 5.5 17.4 17.7 6.8 8.7
Mozambique 2.6 0.1 0.7 1.5 1.4 1.6 2.2 3.4 6.5
DRC 1.8 5 3.7 0.1 5.4 15.8 22.6 10.1 12.6
Swaziland 2.8 0.6
Other SADC 20.3 24.7 13.8 16.9
Total SADC 22.3 15.1 13.8 18.4 21 71.6 94.5 151.9 322.3
EAC
Kenya 12.8 26 21 32.2 38.1 35.3 78.3 83.7 76.3
Uganda 11.6 6.5 4.7 8.5 5.5 5.5 10.3 11.7 20.1
Total EAC 24.4 32.5 25.7 40.7 43.6 40.8 88.6 95.4 96.4
Other African 4.5 0.5 3.5 4.7 6.2 22.9 22.2 20 34.7
Total African 51.2 48.1 43 63.8 70.8 135.3 205.3 267.3 453.4
AMERICAN
USA 21.4 12.8 18 15.2 15.1 13.5 11.3 13.7 16.5
Canada 1.7 0.7 0.6 0.5 0.5 1.4 1.7 4.8 39.2
Other American 1.3 2.7 2.6 3.7
Total American 23.1 13.5 18.6 15.7 15.6 16.2 15.7 21.1 59.4
Other countries
Japan 60 45.5 43.9 34.2 68.5 96.3 88.2 64.3 68.7
UAE 5 6.8 6.7 6.3 9.6 14.4 15.4 17.5 33.7
Hong Kong 18.2 5 7.8 8.8 8.7 11.2 9.9 12.3 9.6
India 66.5 114.8 112.8 98.5 82.2 64.2 69.6 100.7 63.2
Others 302 113.6 95.8 73.9 88.6 85 79.9 197.6 371.5
Sub-total 451.7 285.7 267 221.7 257.6 271.1 263 392.4 546.7
GRAND TOTAL 752.5 588.5 543.2 663.2 776.4 902.5 1129.2 1335 1676.3
Source:: Economic Survey, 2005, Table 3.2 p.51
p= provisional

40
Appendix Table 3A, Tanzania's imports by region of origin
( values in million USD )
Country/Region 1997 1998 1999 2000 2001 2002 2003 2004 2005p
EU 367.1 514.6 413.1 344.6 389.7 369.6 434.4 477.3 615.7
AFRICA
SADC
South Africa 96 130.7 170.8 174.4 203.4 188.8 306.4 330.4 389.8
Zimbabwe 4.73 14.6 5.6 4.5 3 2 1.2 1.5 1.7
Zambia 25 17 7.3 2.4 1.8 4.3 2 6.1 3.9
Mozambique 5.1 5.5 0.1 0.1 0.4 0 0.9 1.6 2
DRC 0.2 0.5 0.1 0.1 0.2 0.4 0.7 0.8 0.5
Swaziland 9 11.5 12.5 12.9 12.7 15.6 12.2 17.2 18.5
Other SADC 4 4.8 7.7 9.1
Total SADC 139.9 179.8 196.3 194.4 221.6 215.2 328.2 365.2 425.5
EAC
Kenya 95.7 105.8 95.1 93.4 96.1 95.2 115.9 130.1 155.3
Uganda 1.9 2.3 6 5.6 11.4 2.7 8.2 7.6 5.1
Total EAC 97.6 108 101.1 99 107.5 97.9 124.1 137.7 160.4
Other African 0.2 0.1 0.1 0 0.2 9 17.8 43.2 22.3
Total African 237.7 287.9 297.5 293.4 329.2 322.1 470.1 546.2 608.2
AMERICAN
USA 52.6 81.3 99.3 58.9 65.3 91.4 69.7 78.1 99.9
Canada 12.5 16.7 26.7 32.3 23.2 17.7 19.6 39.7 35.3
Other American 15.5 38.9 37.9 24.5 7.9 13.7 32.9 32.6 46.7
Total American 80.6 136.8 163.8 115.8 96.3 122.8 122.2 150.4 181.9
Other countries
Japan 74 131 178.2 142.3 150.7 138.7 169.9 180.6 200.1
UAE 93.5 59.7 51 57 109 97.2 146.8 184.7 195.1
China 61.5 48.8 58 68 70.6 79 116.7 171.4 217.4
India 77.5 89.8 94.6 88.8 87.5 106.8 168 216.1 87.1
Others 156.9 113.4 159.1 257.2 481.9 424.8 496.9 644.4 719.4
Sub-total 463.4 442.7 540.9 613.3 899.7 846.5 1098 1397 1419
GRAND TOTAL 1149 1382 1416 1367 1715 1661 2125 2571 2825
Source: Economic Survey, 2005, Table 3.3. p.52
p= provisional

41
Acronyms ACP African Caribbean and Pacific
COMESA Common Market for Eastern and Southern Africa
DRC Democratic Republic of Congo
EAC East African Community
EBA Everything But Arms
EEC European Economic Community
EPA Economic Partnership Agreement
EU European Union
FAO Food and Agriculture Organization
FES Friedrich-Ebert-Stiftung
GDP Gross Domestic Product
LDC Less developed Country
MFN Most favored Nation
PTA Preference Trade Agreement
SACU Southern African Customs Union
SADC Southern African Development Community
UAE United Arab Emirates
UNCTAD United Nations Conference on Trade and Development
USD US Dollar
WTO World Trade Organization
42
Bibliography Dominick Salvatore (2001) International Economics, (7th Edition), John Wiley and Sons, New York. F.K. Law Chambers (2004), Impact of an Economic Partnership Agreement (EPA) on Tanzania, Preliminary and Adjustment Scenarios, Draft Final Report, Dar es Salaam (Mimeo). FES (2004) Finding your Way through the Cotonou Agreement, Dar es Salaam. FES (2006) Understanding Development Cooperation under the Cotonou Agreement, Dar es Salaam. UNCTAD (2005) Partnership Agreements between African ACP States and The EU Note by the UNCTAD Secretariat, Prepared for the African Union Conference of Ministers of Trade, Third Ordinary Session, Cairo, Egypt, 5-9 June 2005. UNCTAD, Participation of the African, Caribbean and Pacific Group of States in International Trade; Report by the UNCTAD Secretariat to the Third Summit of ACP Heads of State and Government, 18-19 July 2002, Fiji. United Republic (2005) of Tanzania, Tanzania Diagnostic Trade Integration Study Report, Mimeo, Dar es Salaam. United Republic of Tanzania (2005) Economic Survey 2005 (Dar es Salaam). Websites ACP Secretariat websites; www.asp.sec.org EU Website: www.europa.eu.int FES Website: www.fes.de
![slides 2009 10 [Режим совместимости]qai.narod.ru/TomskWorkshop/slides_2009_10.pdf1.1. Основные виды ЭА ŠГенетический алгоритм (ГА)](https://img.pdfslide.net/doc/110x75/5f3a13349c6aaa38d679cac4/slides-2009-10-qainarodrutomskworkshopslides200910pdf.jpg)