Embed Size (px)
Citation preview
The changing claims
environment
Tim AndrewsFinity Consulting
18-20 May 2016
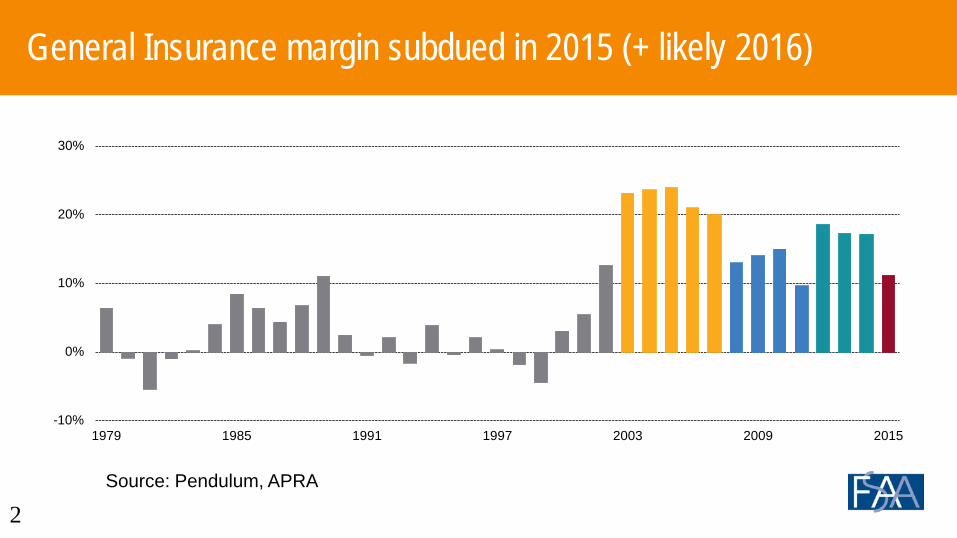
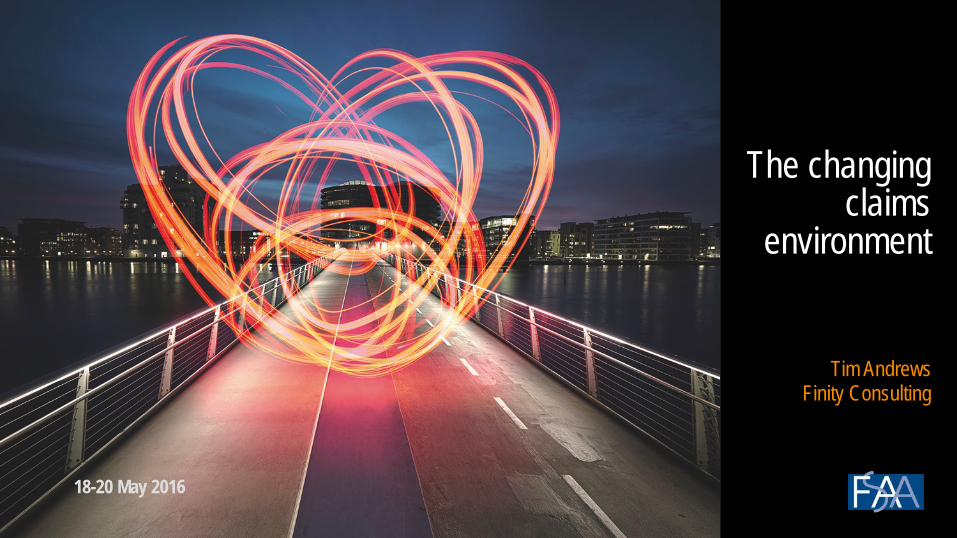
General Insurance margin subdued in 2015 (+ likely 2016)
2
-10%
0%
10%
20%
30%
1979 1985 1991 1997 2003 2009 2015
Source: Pendulum, APRA
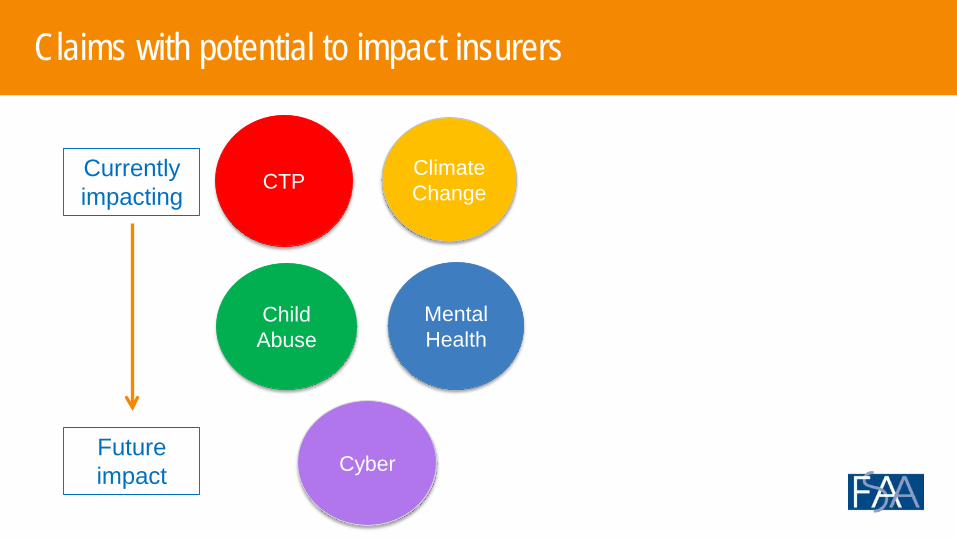
Claims with potential to impact insurers
ClimateChange
Child Abuse
Mental Health
CTP
Cyber
Currently impacting
Future impact
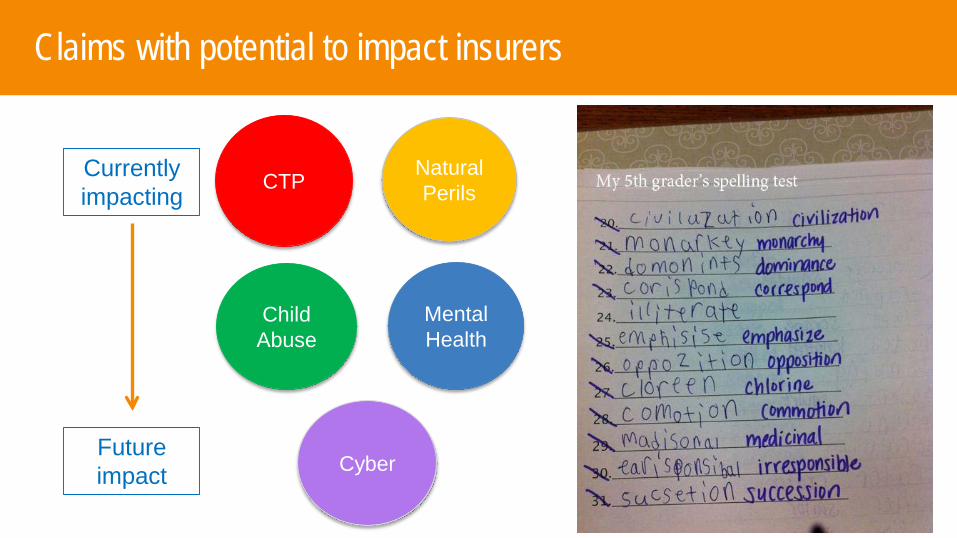
Claims with potential to impact insurers
Natural Perils
Child Abuse
Mental Health
CTP
Cyber
Currently impacting
Future impact
CTP
0%
10%
20%
30%
40%
50%
60%
70%
80%
0.0
1.0
2.0
3.0
4.0
5.0
6.0
7.0
8.0
01/0
2
02/0
3
03/0
4
04/0
5
05/0
6
06/0
7
07/0
8
08/0
9
09/1
0
10/1
1
11/1
2
12/1
3
13/1
4
14/1
5*
Utili
satio
n: %
of c
asua
lties
per 1
,000
veh
icle
s
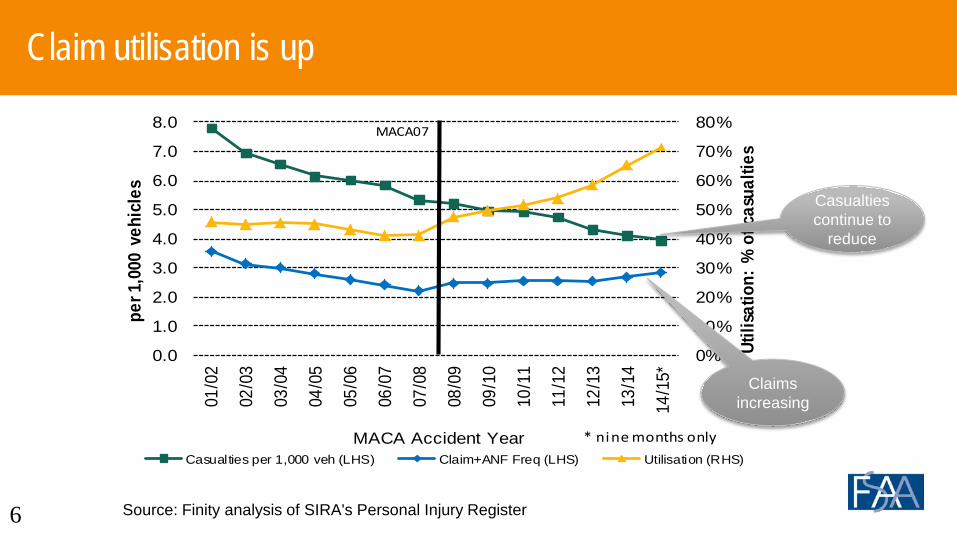
MACA Accident YearCasualties per 1,000 veh (LHS) Claim+ANF Freq (LHS) Utilisation (RHS)
MACA07
* nine months only
Casualties continue to
reduce
Claims increasing
Claim utilisation is up
6 Source: Finity analysis of SIRA's Personal Injury Register
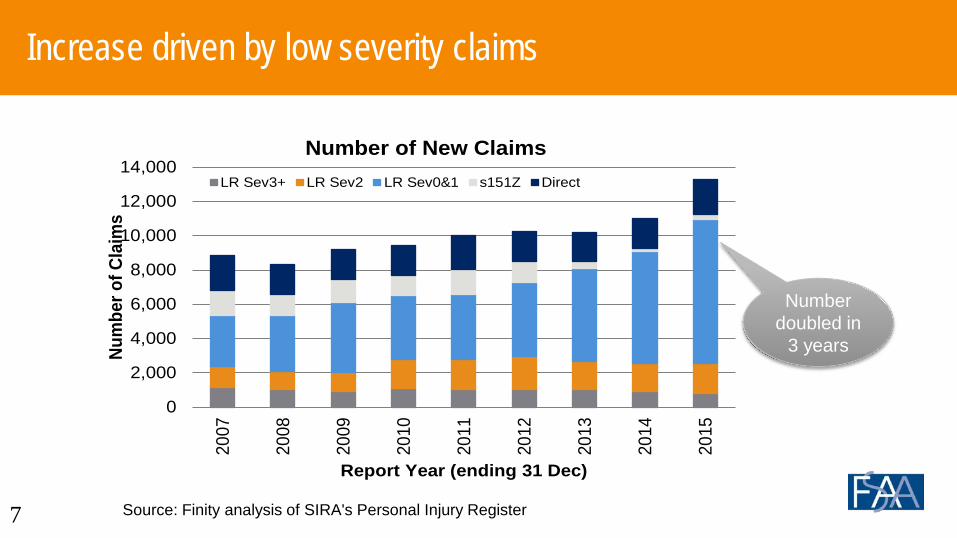
Increase driven by low severity claims
7
Number doubled in
3 years
0
2,000
4,000
6,000
8,000
10,000
12,000
14,000
2007
2008
2009
2010
2011
2012
2013
2014
2015
Num
ber o
f Cla
ims
Report Year (ending 31 Dec)
Number of New ClaimsLR Sev3+ LR Sev2 LR Sev0&1 s151Z Direct
Source: Finity analysis of SIRA's Personal Injury Register
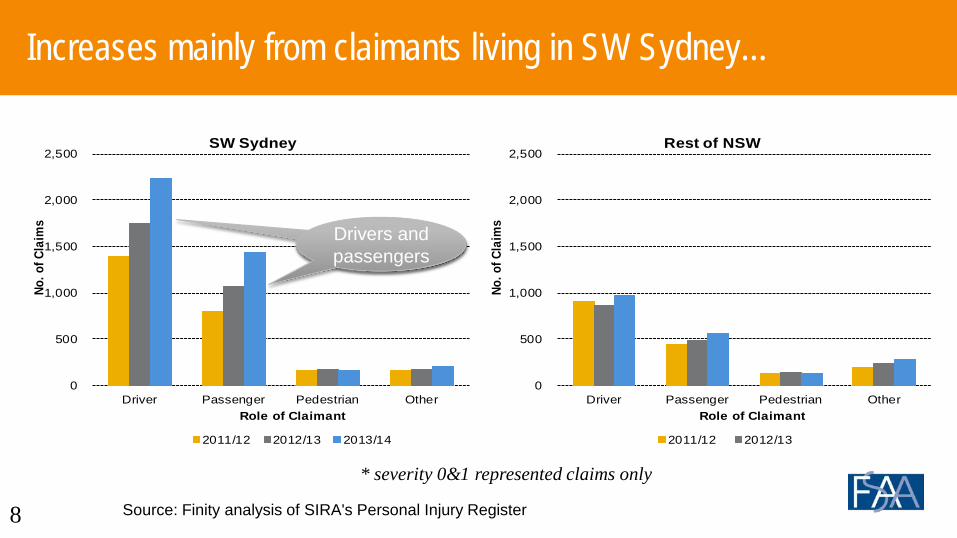
Increases mainly from claimants living in SW Sydney…
8
0
500
1,000
1,500
2,000
2,500
Driver Passenger Pedestrian Other
No. o
f Cla
ims
Role of Claimant
Rest of NSW
2011/12 2012/13
0
500
1,000
1,500
2,000
2,500
Driver Passenger Pedestrian Other
No. o
f Cla
ims
Role of Claimant
SW Sydney
2011/12 2012/13 2013/14
* severity 0&1 represented claims only
Drivers and passengers
Drivers and passengers
Source: Finity analysis of SIRA's Personal Injury Register
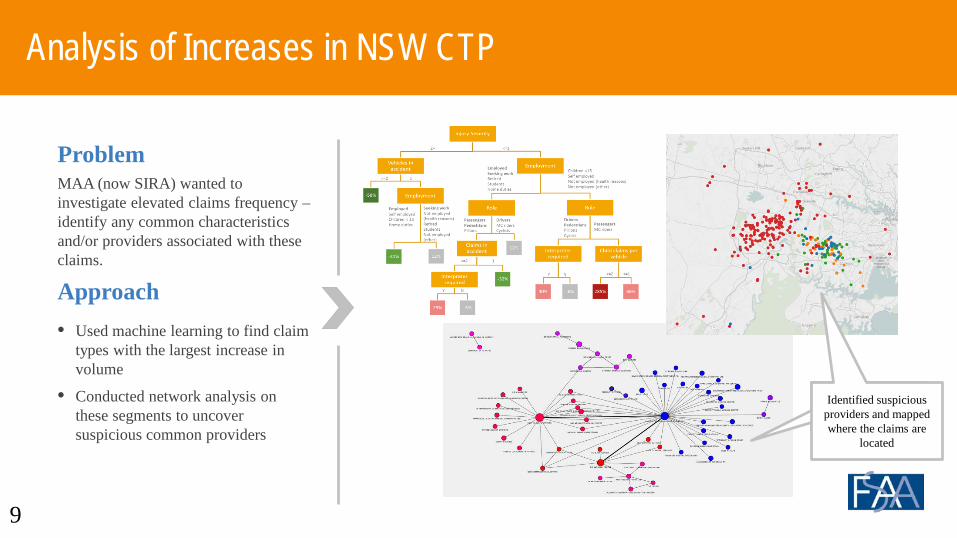
Analysis of Increases in NSW CTP
9
ProblemMAA (now SIRA) wanted to investigate elevated claims frequency –identify any common characteristics and/or providers associated with these claims.
• Used machine learning to find claim types with the largest increase in volume
• Conducted network analysis on these segments to uncover suspicious common providers
Approach
Identified suspicious providers
Identified suspicious providers and mapped where the claims are
located
10
Climate Change
What chance?
Climate Change
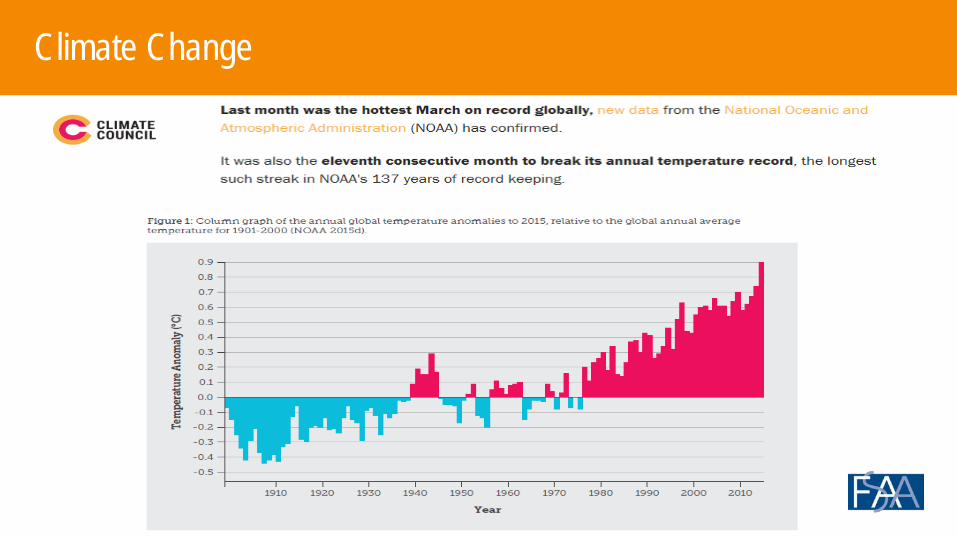
Climate Change
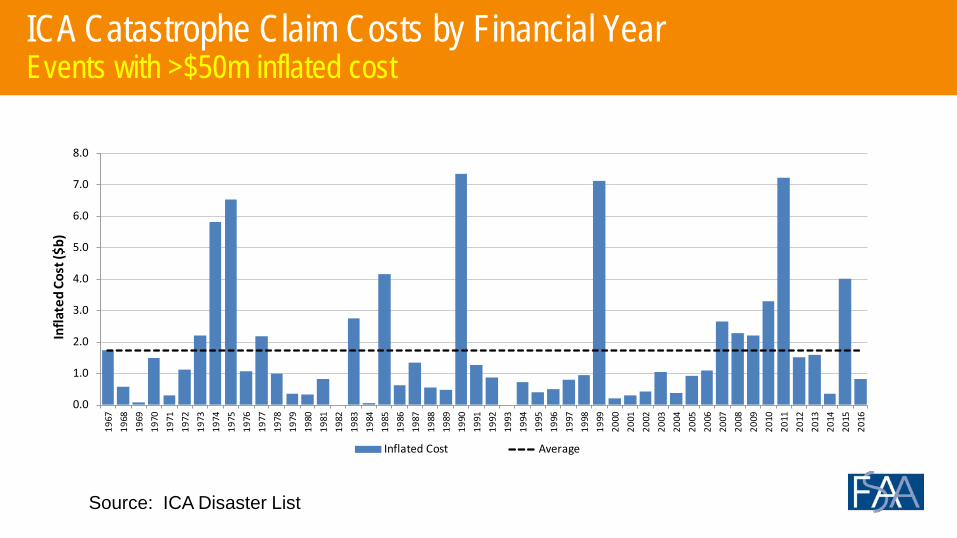
ICA Catastrophe Claim Costs by Financial YearEvents with >$50m inflated cost
0.0
1.0
2.0
3.0
4.0
5.0
6.0
7.0
8.0
1967
1968
1969
1970
1971
1972
1973
1974
1975
1976
1977
1978
1979
1980
1981
1982
1983
1984
1985
1986
1987
1988
1989
1990
1991
1992
1993
1994
1995
1996
1997
1998
1999
2000
2001
2002
2003
2004
2005
2006
2007
2008
2009
2010
2011
2012
2013
2014
2015
2016
Infla
ted
Cost
($b)
Inflated Cost Average
Source: ICA Disaster List
0.0
0.2
0.4
0.6
0.8
1.0
1.2
1.4
1.6
1.8
1967
1968
1969
1970
1971
1972
1973
1974
1975
1976
1977
1978
1979
1980
1981
1982
1983
1984
1985
1986
1987
1988
1989
1990
1991
1992
1993
1994
1995
1996
1997
1998
1999
2000
2001
2002
2003
2004
2005
2006
2007
2008
2009
2010
2011
2012
2013
2014
2015
2016
Infla
ted
Cost
($b)
Capped Incurred Average
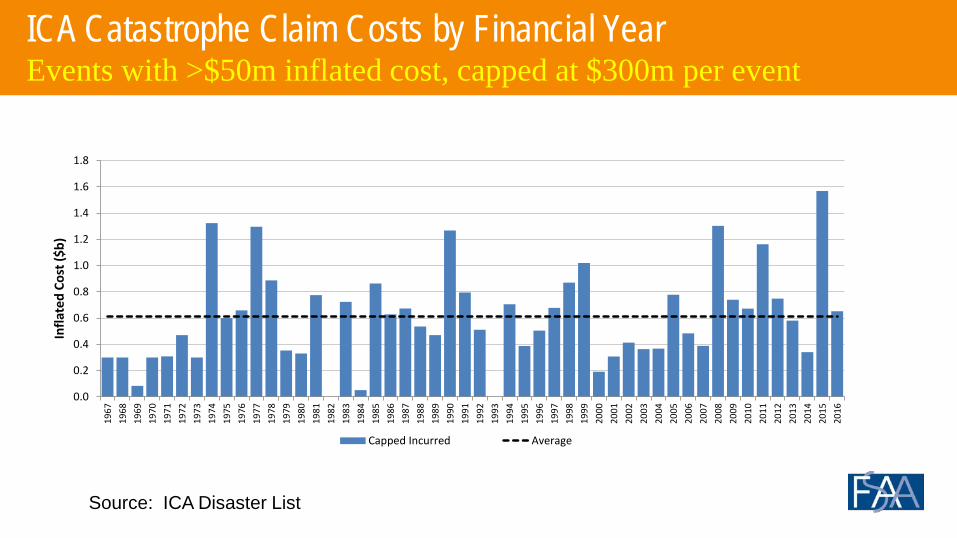
ICA Catastrophe Claim Costs by Financial YearEvents with >$50m inflated cost, capped at $300m per event
Source: ICA Disaster List
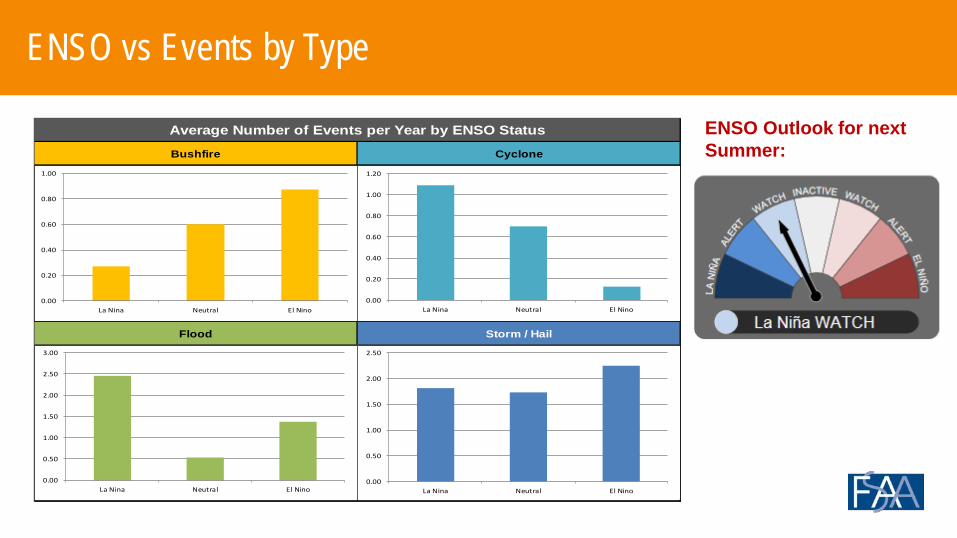
ENSO vs Events by Type
Bushfire Cyclone
Flood Storm / Hail
Average Number of Events per Year by ENSO Status
0.00
0.20
0.40
0.60
0.80
1.00
La Nina Neutral El Nino0.00
0.20
0.40
0.60
0.80
1.00
1.20
La Nina Neutral El Nino
0.00
0.50
1.00
1.50
2.00
2.50
3.00
La Nina Neutral El Nino0.00
0.50
1.00
1.50
2.00
2.50
La Nina Neutral El Nino
ENSO Outlook for next Summer:
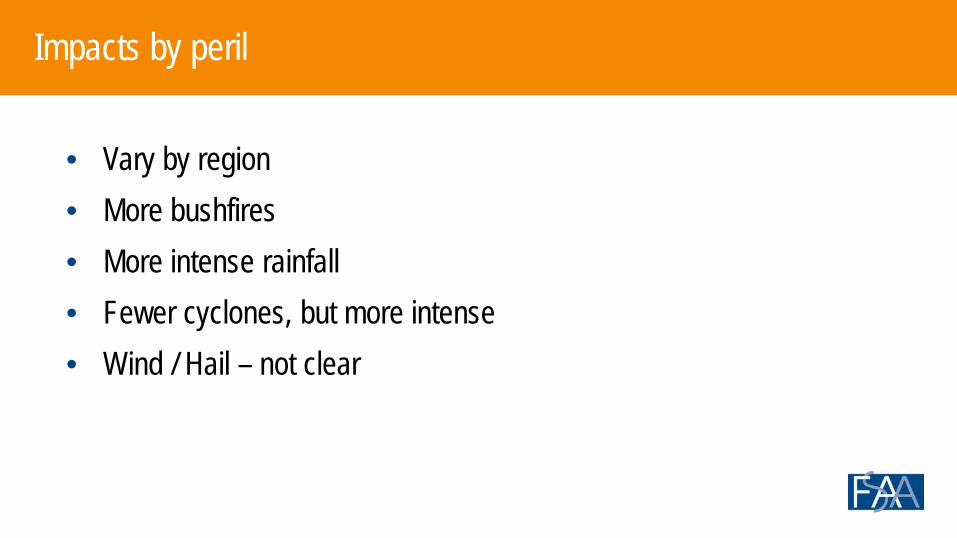
Impacts by peril
• Vary by region• More bushfires• More intense rainfall• Fewer cyclones, but more intense• Wind / Hail – not clear
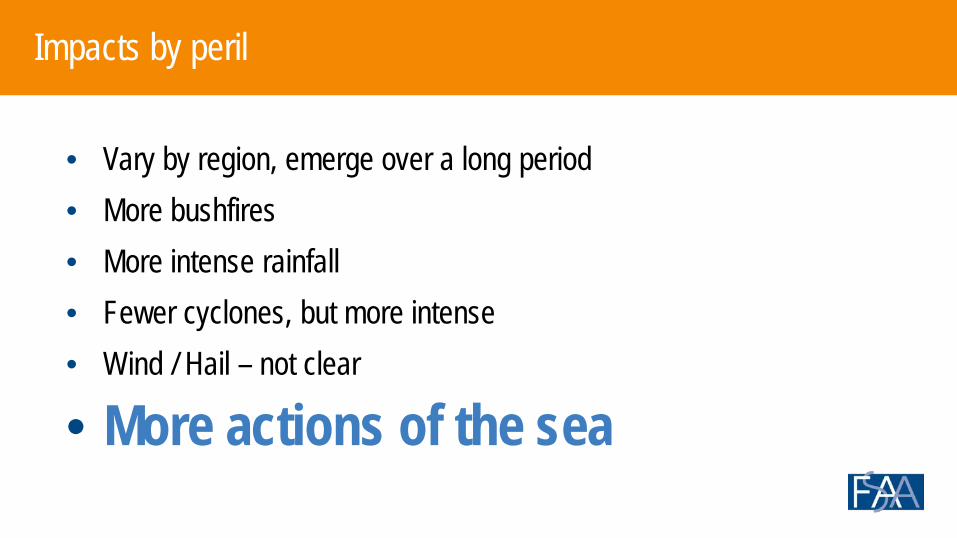
Impacts by peril
• Vary by region, emerge over a long period• More bushfires• More intense rainfall• Fewer cyclones, but more intense• Wind / Hail – not clear
• More actions of the sea

Mental Health
Identical twins
0
10
20
30
40
50
60
70
80
0
500
1,000
1,500
2,000
2,500
2001
2002
2003
2004
2005
2006
2007
2008
2009
2010
2011
Ment
al S
tress
Cla
im Fr
eque
ncy
All C
laim
Freq
uenc
y
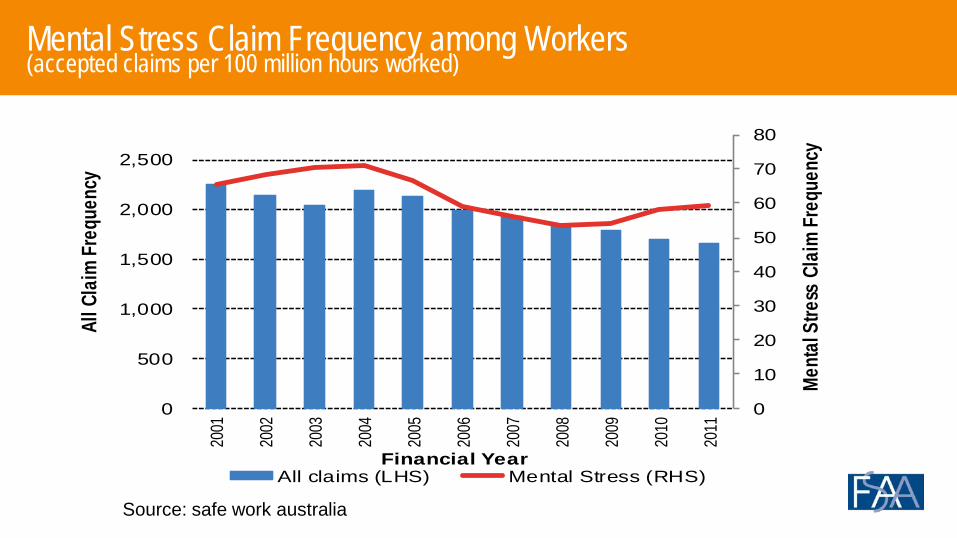
Financial YearAll claims (LHS) Mental Stress (RHS)
Mental Stress Claim Frequency among Workers (accepted claims per 100 million hours worked)
Source: safe work australia
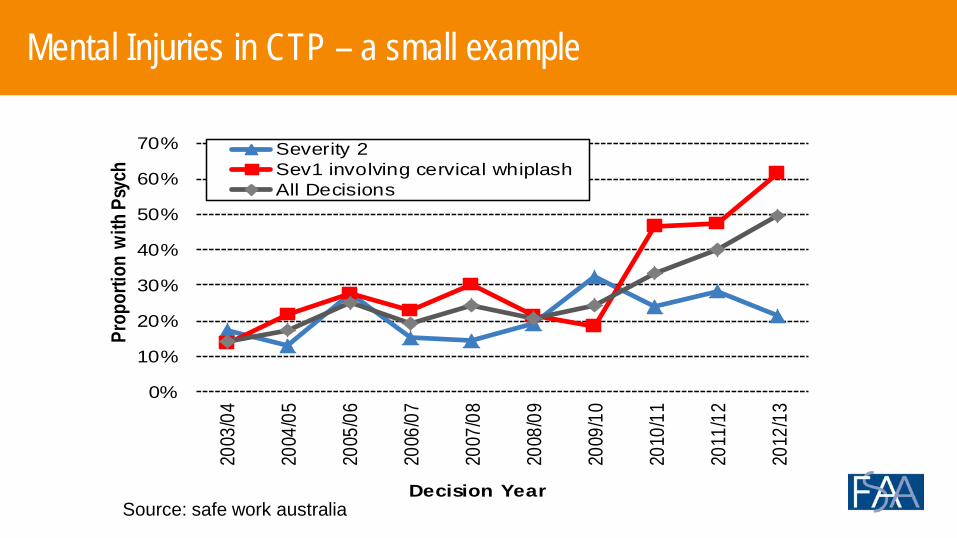
Mental Injuries in CTP – a small example
0%
10%
20%
30%
40%
50%
60%
70%
2003
/04
2004
/05
2005
/06
2006
/07
2007
/08
2008
/09
2009
/10
2010
/11
2011
/12
2012
/13
Prop
ortio
n wi
th P
sych
Decision Year
Severity 2Sev1 involving cervical whiplashAll Decisions
Source: safe work australia
0.0
1.0
2.0
3.0
4.0
5.0
6.0
7.0
8.0
2001 2002 2003 2004 2005 2006 2007 2008 2009 2010 2011
Med
ian
Tim
e Lo
st (w
eeks
)
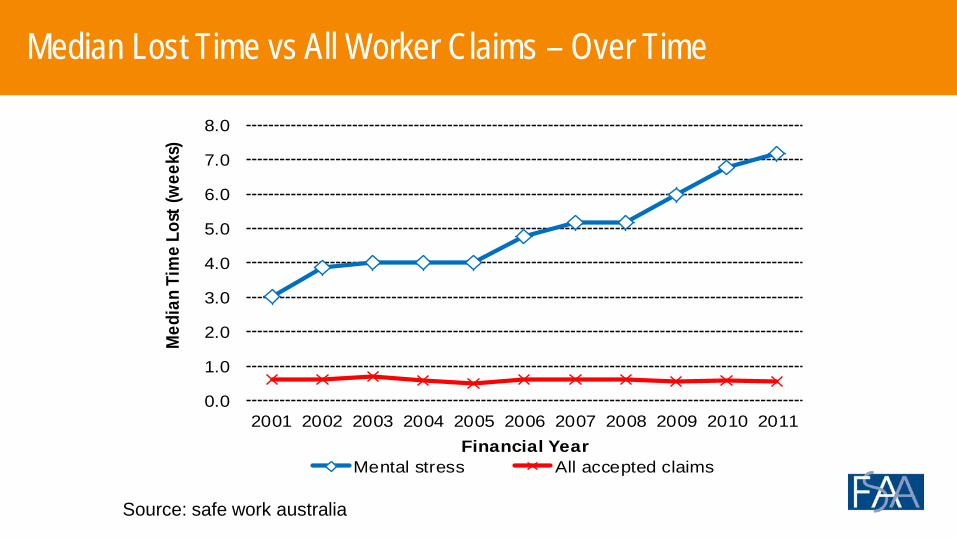
Financial YearMental stress All accepted claims
Median Lost Time vs All Worker Claims – Over Time
Source: safe work australia
Ella Ingram vs QBE Insurance
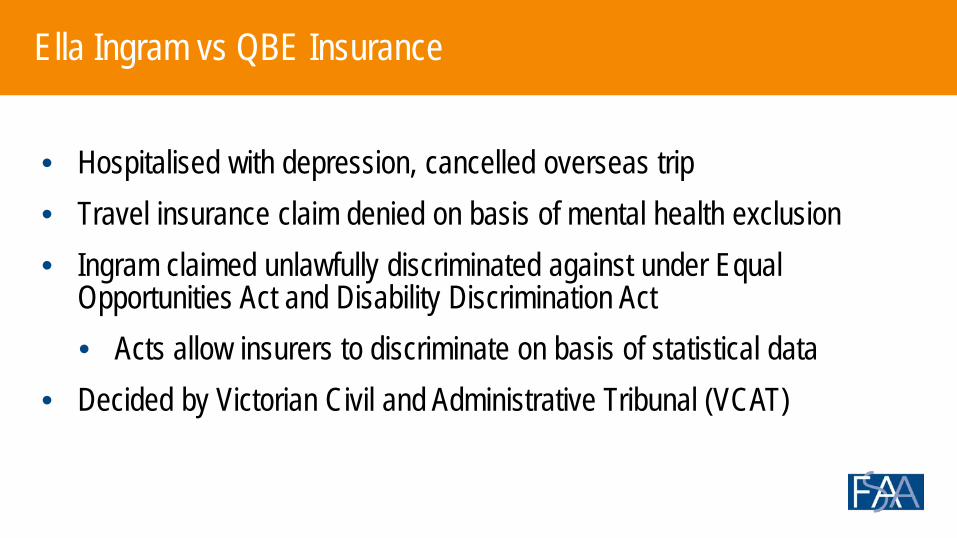
• Hospitalised with depression, cancelled overseas trip• Travel insurance claim denied on basis of mental health exclusion• Ingram claimed unlawfully discriminated against under Equal
Opportunities Act and Disability Discrimination Act• Acts allow insurers to discriminate on basis of statistical data
• Decided by Victorian Civil and Administrative Tribunal (VCAT)
Ella Ingram vs QBE Insurance
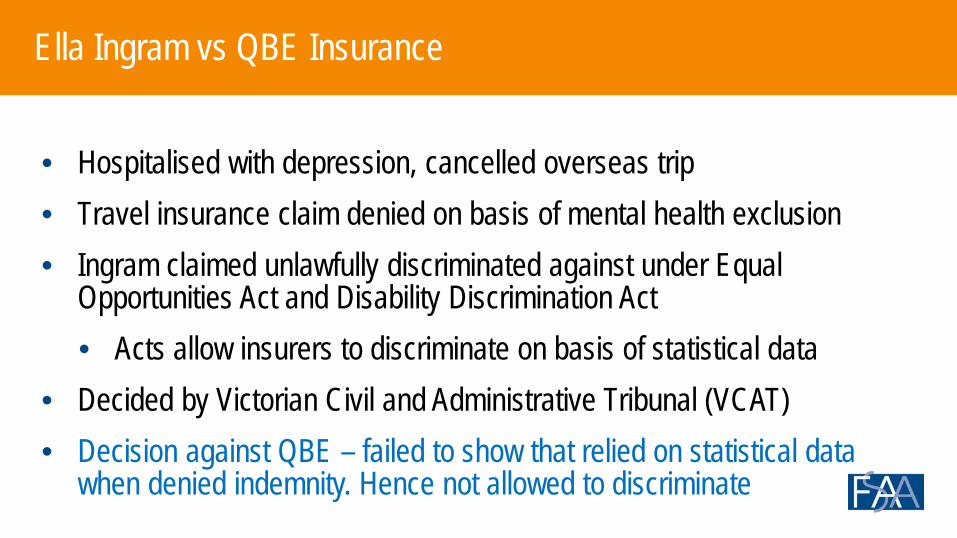
• Hospitalised with depression, cancelled overseas trip• Travel insurance claim denied on basis of mental health exclusion• Ingram claimed unlawfully discriminated against under Equal
Opportunities Act and Disability Discrimination Act• Acts allow insurers to discriminate on basis of statistical data
• Decided by Victorian Civil and Administrative Tribunal (VCAT)• Decision against QBE – failed to show that relied on statistical data
when denied indemnity. Hence not allowed to discriminate
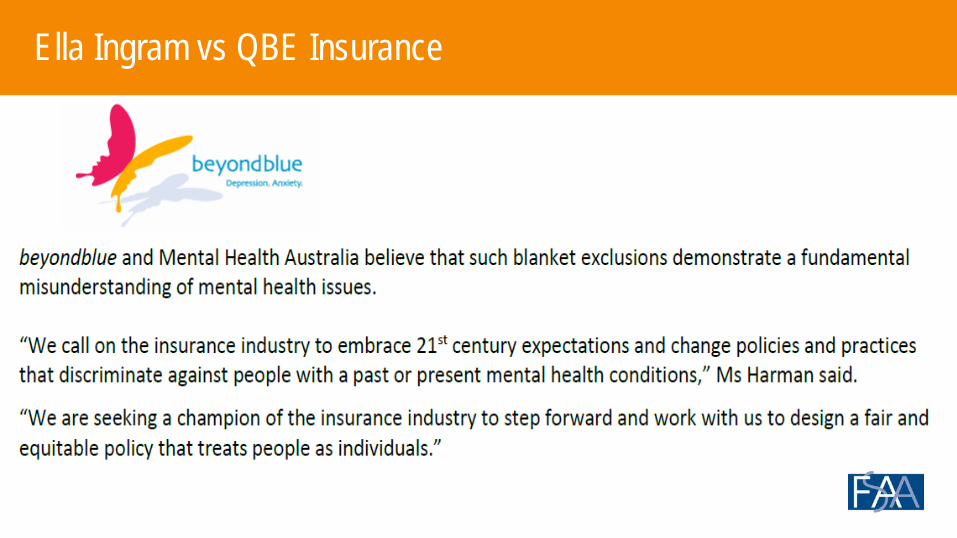
Ella Ingram vs QBE Insurance
Environment
• Senate enquiry into financial advice• Separate investigation by ASIC• Labour suggest consideration of a Royal Commission into life
insurance• ASIC’s report on motor dealers selling life insurance• NDIS impacts?
Child Abuse
Unlucky brothers
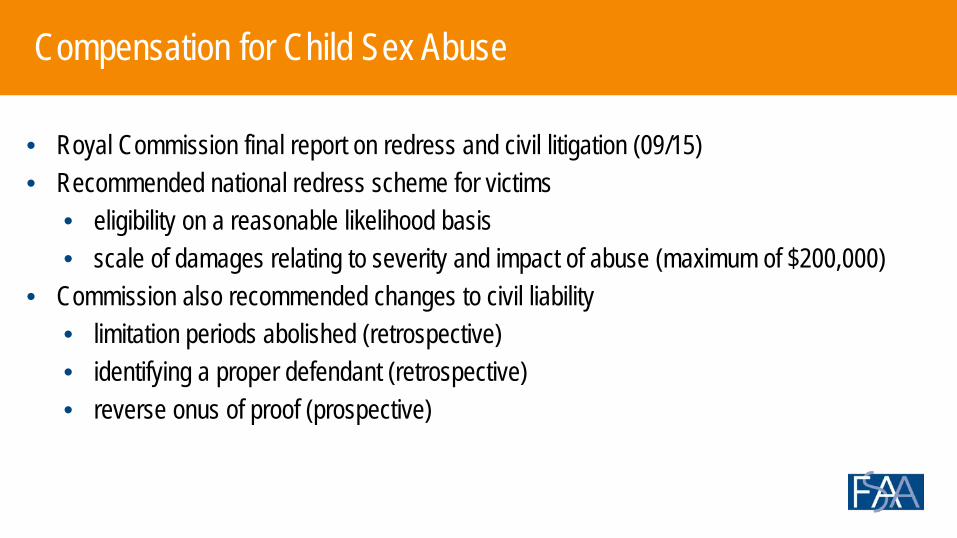
Compensation for Child Sex Abuse
• Royal Commission final report on redress and civil litigation (09/15)• Recommended national redress scheme for victims
• eligibility on a reasonable likelihood basis• scale of damages relating to severity and impact of abuse (maximum of $200,000)
• Commission also recommended changes to civil liability• limitation periods abolished (retrospective)• identifying a proper defendant (retrospective)• reverse onus of proof (prospective)
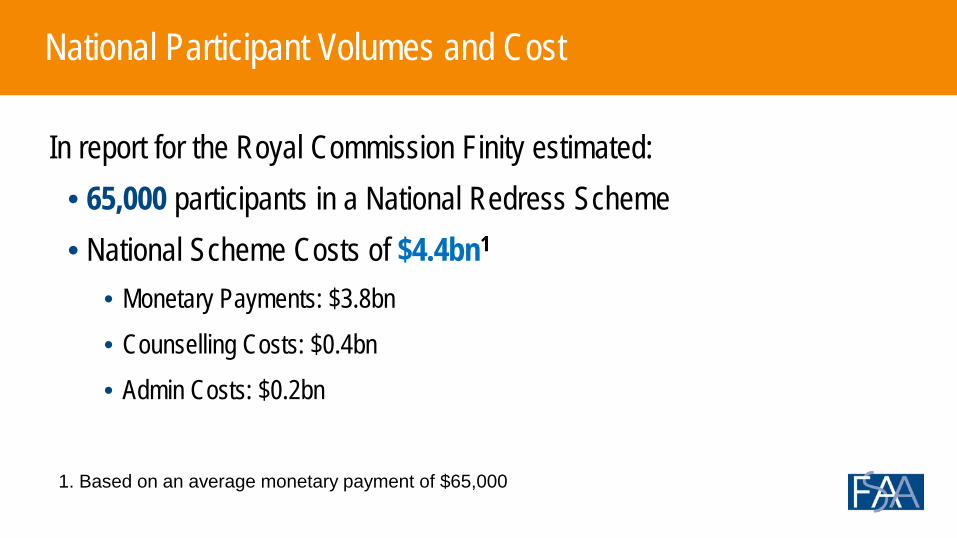
National Participant Volumes and Cost
In report for the Royal Commission Finity estimated:• 65,000 participants in a National Redress Scheme• National Scheme Costs of $4.4bn1
• Monetary Payments: $3.8bn• Counselling Costs: $0.4bn• Admin Costs: $0.2bn
1. Based on an average monetary payment of $65,000
Considerations for Insurers
• Unlikely a legal liability for Redress: Insurance Contracts not likely to trigger• BUT, existence of redress scheme likely to impact on behaviour of survivors
• will depend heavily on structure and design of redress scheme• If Statute of Limitations and Duty of Care rules changed there could be large
impacts for insurers
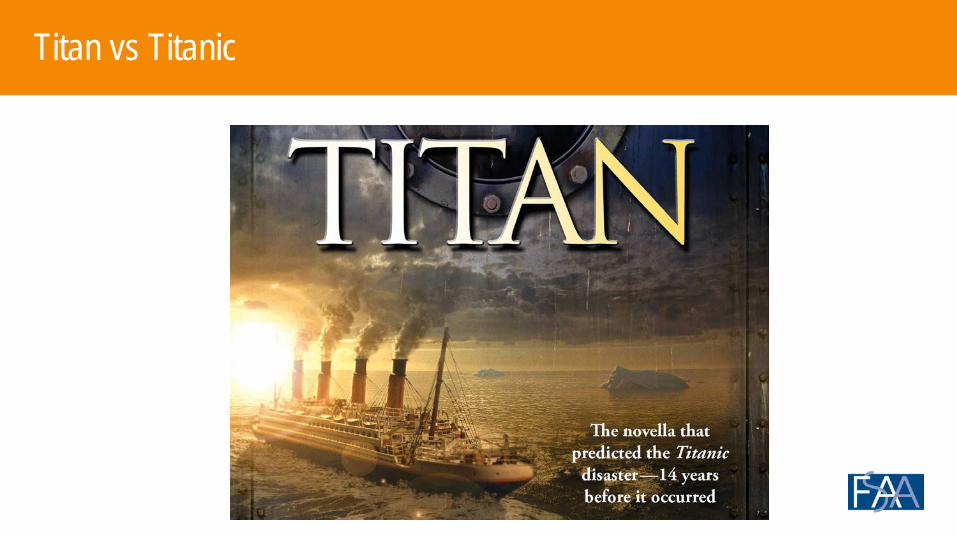
Titan vs Titanic
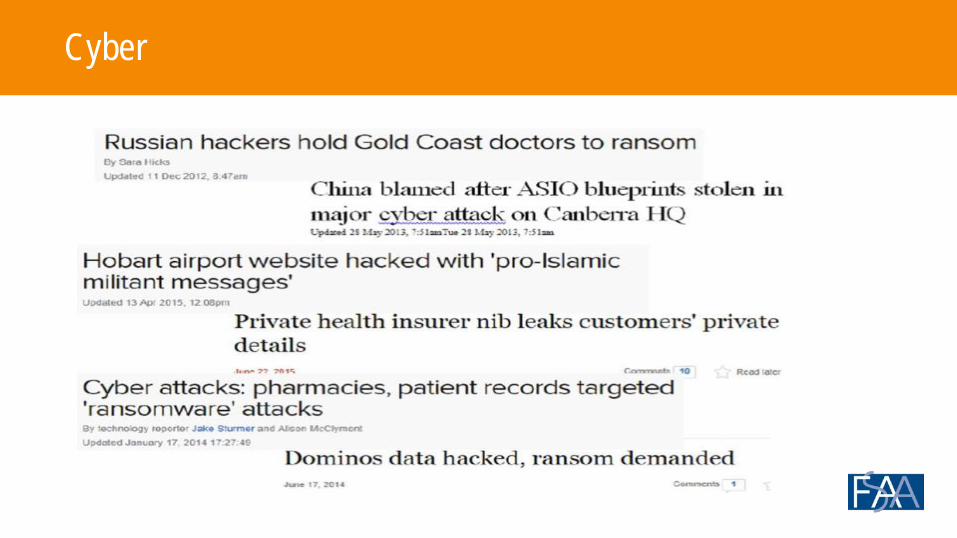
Cyber
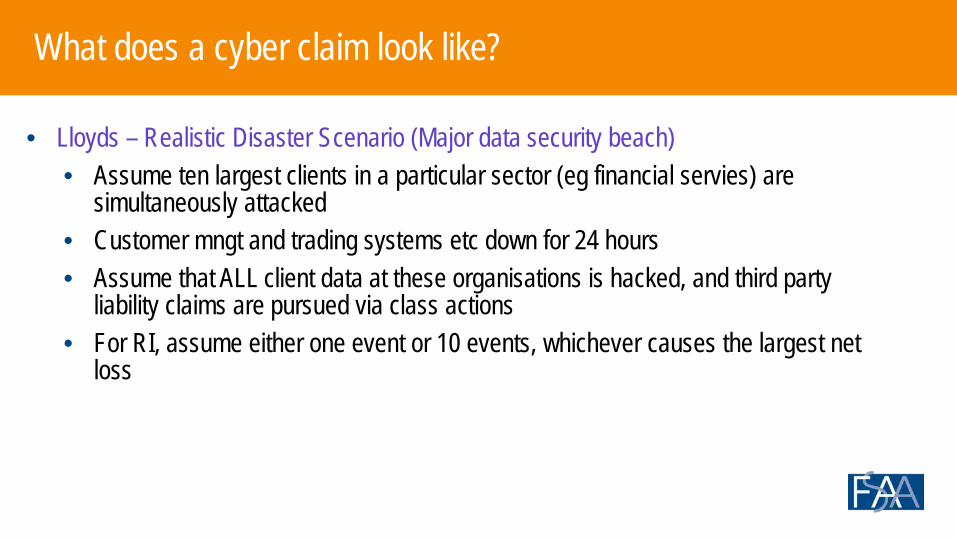
What does a cyber claim look like?
• Lloyds – Realistic Disaster Scenario (Major data security beach)• Assume ten largest clients in a particular sector (eg financial servies) are
simultaneously attacked• Customer mngt and trading systems etc down for 24 hours• Assume that ALL client data at these organisations is hacked, and third party
liability claims are pursued via class actions• For RI, assume either one event or 10 events, whichever causes the largest net
loss
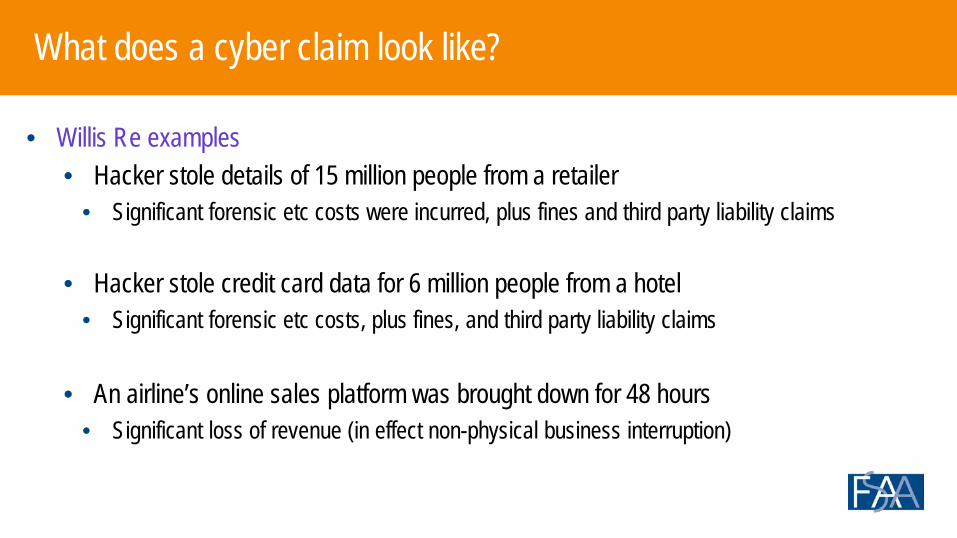
What does a cyber claim look like?
• Willis Re examples• Hacker stole details of 15 million people from a retailer
• Significant forensic etc costs were incurred, plus fines and third party liability claims
• Hacker stole credit card data for 6 million people from a hotel• Significant forensic etc costs, plus fines, and third party liability claims
• An airline’s online sales platform was brought down for 48 hours• Significant loss of revenue (in effect non-physical business interruption)
In conclusion
• The environment is a challenging one for insurers
• Sometimes strange things happen• to some extent that is the business of insurance
• Its helpful to think about Black Swans, but its at least as important to • recognise that unexpected situations occur • plan for the types of claims that are emerging
Distribution & UseThis presentation has been prepared for the FSAA conference, held on 19/20 May 2016. It is not intended, nor necessarily suitable, for any other purpose.
Third parties should recognise that the furnishing of this presentation is not a substitute for their own due diligence and should place no reliance on this presentation or the data contained herein which would result in the creation of any duty or liability by Finity to the third party.
Reliances & LimitationsFinity wishes it to be understood that the information presented at the seminar is of a general nature and does not constitute actuarial advice or investment advice. While Finity has taken reasonable care in compiling the information presented, Finity does not warrant that the information provided is relevant to a particular reader’s situation, specific objectives or needs.
Finity does not have any responsibility to any attendee at the conference or to any other party arising from the content of this presentation. Before acting on any information provided by Finity in this presentation, readers should consider their own circumstances and their need for advice on the subject – Finity would be pleased to assist.