Embed Size (px)
Citation preview

The changing landscape of public companies and a prediction on the evolution
of the competitive structure in audit industry
Daniel Aobdia
Kellogg School of Management, Northwestern University, and
PCAOB, Center for Economic Analysis
Luminita Enache
Tuck School of Business
Dartmouth College
Anup Srivastava
Tuck School of Business
Dartmouth College
Abstract
We predict how the competitive structure of the audit industry is likely to evolve based on the
changing nature of an average public company. Auditors must deal with more complex issues of
accounting estimates in financial reports with the arrival of each new cohort of listed companies,
which should increase audit risks and the likelihood of material errors in these reports. In response,
Big N audit firms appear to select fewer, less risky clients from newer cohorts, and non–Big N
audit firms service the growing market of riskier clients. Furthermore, because their risks remain
significantly higher than for legacy companies, newer cohorts tend to stay with non–Big N audit
firms even as they mature. Based on our findings, we predict that the market share of Big N firms
would decline unless they increase their risk tolerance in accepting new clients, consistent with the
changing landscape of listed companies.
JEL classification: M4; M41; M42
Keywords: Competitive structure; Public firms; Oligopoly; Big N audit firms; Audit risks;
Intangible assets; Financial reporting quality; Audit fees; Audit quality
* We thank David Emanuel, Joseph Gerakos, Michael Gurbutt, Gary Monroe, Tom Omer, Richard Sansing, and the
workshop participants of the 2015 annual meeting of American Accounting Association for helpful comments. Daniel
Aobdia gratefully acknowledges financial support from the Northwestern University Kellogg School of Management.
He co-wrote this paper before joining the Public Company Accounting Oversight Board (PCAOB). The views
expressed in this paper are his personal views and do not necessarily reflect the views of the Board, individual Board
members, or staff of the PCAOB.

1
“Forty percent of the companies in this room won’t exist, in my opinion, in a meaningful way in
10 years.” (Thurm 2015)
1. Introduction
Auditing plays an important role in the financial reporting process because managers
anticipating diligent verification by audit firms exert greater efforts in preparing financial reports
(Magee and Tseng 1990; Dye 1991; Antle and Nalebuff 1991; Ball et al. 2012). Since the mid-
1980s’ the audit industry has become so concentrated that just four players garner over 95% of
total audit fee revenue from public companies (Government Accountability Office [GAO] 2008).
We examine how the competitive structure of the assurance business is likely to evolve if the
current trend of the changing nature of publicly traded corporations continues. Any study making
predictions about the future by its very nature is bold, needs assumptions, and suffers from several
limitations, and our study is no exception. However, the subject of auditor concentration and its
current oligopolistic nature is important enough to tackle, as evident from recent regulatory
concerns and academic research, which makes our examination worth pursuing.1 Based on our
findings, we predict that the audit market will become less concentrated in the hands of Big N
firms unless they dramatically change their risk tolerance in accepting and retaining clients and
make their operating practices more suitable to the needs of smaller and riskier companies. (We
classify Ernst & Young, KPMG, Deloitte & Touche, PwC, and Arthur Andersen as Big N audit
firms.)
At a minimum, three contrasting predictions can be made on the evolution of the
competitive structure of the assurance business. First, the past trend of increasing concentration in
the hands of Big N will continue as public companies become more global in outlook and undergo
1 See Dwyer (2003), GAO (2003, 2008), Cox (2005), TACAP (2006), and Gerakos and Syverson (2015).

2
rapid technological changes (Rialp et al. 2005; Sood and Tellis 2005). Only Big N and perhaps a
very limited number of second-tier audit firms (notably BDO and Grant Thornton) possess the
resources and the economies of scale to develop the knowledge base and networks to service global
companies with fast changing business models (Sirois and Simunic 2011).
Second, the market share of the Big N will remain unchanged as a given company’s
characteristics predictably change over its life cycle, but the average of stages in life cycles for the
set of listed companies will remain constant (Anthony and Ramesh 1992; Jovanovic and
MacDonald 1994). That is, each company initially goes through a rapid-growth, but precarious,
stage of development. Surviving firms grow over time and, in their mature stages, display more
stable performance than their younger counterparts. Thus, the average property of the set of public
companies might keep reverting to its historical average as new companies with riskier
characteristics enter the public market, past new-list companies mature, and legacy companies
delist. To the extent that the smaller and riskier companies initially obtain services from smaller
auditors but shift to Big N auditors as they mature (Johnson and Lys 1990), the audit market might
keep reverting to Big N auditors. Furthermore, if the relative proportions of new and old companies
in the listed company population remain constant, then the overall market share of Big N auditors
would persist.
Third, the market share of Big N auditors will decline because the average properties of
the set of public companies change monotonically over time. Each new cohort of listed companies
uses more difficult-to-verify intangible assets and has riskier business models than its predecessor
(Brown and Kapadia 2007; Srivastava 2014a). The management literature reasons that newer U.S.
companies obtain market shares from their established counterparts by disruptive innovations and
by offering targeted services, both of which require more intangible inputs and riskier business

3
models than the manufacture of standardized goods.2 In addition, the “organizational imprinting”
hypothesis states that companies retain their initial, successful business models they adopt in their
formative years, because organizational changes are disruptive and costly to implement in the
mature stage of a firm’s lifecycle (Stinchcombe 1965; Hambrick 1983; Yip 2004; Christensen
1997). Thus, the average characteristics and risks of each successive cohort remain distinct and do
not converge on the previous cohort’s characteristics and risks despite the passage of time.
Consistent with the aforesaid third prediction, Brown and Kapadia (2007) and Srivastava
(2014a) show that each new cohort of listed companies not only has more intangible assets,
financial risks, and uncertain prospects than its predecessor, but also that the inter-cohort
differences persist. Thus, the arrival of each new cohort causes “a fundamental change in the
character of a typical publicly traded firm” (Brown and Kapadia 2007, p. 359). This trend should
affect the average representational faithfulness of listed companies, a key accounting attribute,
which requires limiting managers’ accounting choices to those based on hard, verifiable
information [Statement of Financial Accounting Standards (SFAC) No. 2].3 When large audit
firms do not receive adequate support for managers’ estimates [AU Sections 312.37 and 9312A,
Public Company Accounting Oversight Board (PCAOB)], they might not accept or retain such
clients, or they decline to certify the financial statements, because of their greater reputation capital
being at stake, litigation risk, or the desire to avoid the PCAOB’s risk-based scrutiny (Hanson
2014). Thus, if Big N firms maintain their client-selection or client-retention risk thresholds but
successive cohorts meet them to a decreasing extent, then a progressively smaller proportion of
2 See Acs and Audretsch (1988), Prahalad and Hamel (1990), Christensen (1997), Shapiro and Varian (1998), Romer
(1998), Zingales (2000), Apte et al. (2008), Brickley and Zimmerman (2010), Baumol and Schramm (2010), and
Igami (2015). 3 Several authors distinguish between “hard” and “soft” information. Ijiri (1975, p. 36) emphasizes that “the lack of
room for disputes over a measure may be expressed as the hardness of a measure.” Similar concepts have been
advanced by Gjesdal (1981), Penno (1990), and Penno and Watts (1991), and Arya et al. (1995).

4
clients from newer cohorts would be acceptable to, or retained by, Big N firms. In that case, the
market share of Big N firms would decline with each new cohort and non–Big N audit firms would
service the remaining, growing pool of riskier clients.
We cannot test our predictions using a simple time series analysis for two reasons. First,
time series results are affected by one-off economic shocks, changes in the regulatory environment,
and consolidation in the audit industry.4 Second, audit fees and audit characteristics data are
available only for recent years. Therefore, we rely on methods suggested in Fama and French
(2004), Brown and Kapadia (2007), and Srivastava (2014a). These studies show that the trend in
the average characteristics of listed companies can be ascertained from the patterns of successive
listing cohorts, because newer cohorts replace older cohorts in the listed company population over
time and because the characteristics of successive cohorts are monotonic, distinct, and persistent.
Thus, the evolution in the overall competitive structure of the audit industry should be predictable
based on the trend in the competitive structures of successive cohorts.
We divide all listed companies into five ordered groups based on their listing years. We
call companies listed before 1970 the pre-1970s cohort, consistent with Fama and French (2004).
(The year 1970 marks the advent of NASDAQ.) The remaining “new-list” companies are divided
into a 1970s, 1980s, 1990s, or a 2000s cohort based on the decade in which they were listed,
consistent with Srivastava (2014a).5 We measure all five cohorts’ characteristics over a common
4 Examples are changes in reporting regime with respect to the going-concern opinion [Statement on Auditing
Standard (SAS) No. 59 (American Institute of Certified Public Accountants {AICPA}1988)], the implementation of
the safe harbor provision of the Private Securities Litigation Reform Act of 1995, the implementation of the Sarbanes-
Oxley Act (SOX) of 2002 (Public Law 107-204), the creation of the PCAOB in 2002, and the demise of the audit firm
Arthur Andersen in 2002. 5 The approach of dividing companies by ten-year listing intervals may seem ad hoc but is consistent with Fama and
French (2004), Brown and Kapadia (2007), and Srivastava (2014). They find similar result using alternative ten-year
listing intervals (e.g., 1980–1989 and 1985–1994, respectively).

5
period of 2001 to 2012.6 We interpret trends in the audit characteristics across the five cohorts as
those resulting from distinctive economic characteristics of successive listing cohorts, not because
of changes in the regulatory or the macroeconomic environment.
Successive cohorts show differences in innate characteristics that could increase the
managerial judgment and forward-looking estimates required in financial reporting. For example,
the complexity of revenue recognition, the sales growth derived from corporate acquisitions
coupled with reliance on intangible assets, the employee compensation paid via stock options, and
the frequency of one-off special items increase with successive cohorts. We find similar increases
in the magnitude of performance-matched discretionary accruals, a summary measure of
managers’ judgment in financial reporting (Jones 1991; Subramanyam 1996; Kothari et al. 2005).
Also, the frequency with which this summary measure exceeds a materiality threshold appears to
increase with each new cohort.
Successive cohorts also characterize higher volatility of profits, cash flows, and stock
returns, indicating decreasing predictability of corporations’ key future events (Pástor and
Veronesi 2003; Zhang 2010). Thus, successive cohorts’ accounting estimates should be based on
fewer and fewer predictable future outcomes (Barth 2006). This development, in conjunction with
the increasing amounts of managers’ forward-looking estimates in financial reports, should lower
the extent to which financial numbers correspond with economic outcomes (Hribar and Nichols
2007). As expected, we find a large and economically significant decline in the association
between accruals and past, current, and future cash flows with each new cohort. We interpret this
trend as a decline in the quality of financial reports consistent with Dechow and Dichev (2002).
6 The most significant change during this period was a series of events discussed in footnote 3 that were largely
complete by 2004 (DeFond and Lennox 2011, p. 27). We find similar results for 2005–2012.

6
We also find that the decline in financial reporting quality across successive cohorts can be largely
explained by the trend in their innate characteristics.
One potential concern in our analysis is that we compare the characteristics of different
cohorts in a common year when they have different listing ages. Successive cohorts could be in
different phases of their life cycles and might display varying characteristics (Anthony and Ramesh
1992). For example, two pharmaceutical companies that went public in 1970 and 1995 are 30 and
five years old, respectively, in 2000, when they could be in the mature and the growth phases of
their life cycles. Also, the characteristics of companies that survive for 30 years could differ from
five-year old companies. However, Brown and Kapadia (2007, p. 374) rule out age difference as
the principal reason for cohort trends. Yet, to alleviate this concern, we conduct additional tests,
using longer time series data, measuring all companies’ characteristics at listing and at a fixed
interval after the listing year.7 We continue to find monotonic patterns in the accruals and risks of
cohorts at the common ages, showing that inter-cohort patterns are largely because of innate,
persistent attributes.
We next examine whether the competitive structure of the audit industry changes across
cohorts. We find an increasing dichotomy emerging in the assurance market between Big N and
non–Big N firms, arguably because of greater self-selection on the part of Big N auditors or client
companies. Prior papers support the idea of client-auditor self-selectivity. For example, Big N
firms stringently select clients with the least audit risks and the highest pre-audit reporting qualities
(Johnstone and Bedard 2003, 2004; Krishnan and Krishnan 1997; Lawrence et al. 2011).8
7 For example, we observe the characteristics of the two pharmaceutical companies in their listing years of 1970 and
1995 and when they are both ten years old, in 1980 and 2005, respectively. 8 Landsman et al. (2009) also argue that additional Section 404 audit work imposed capacity constraints on Big N
audit firms.

7
Companies with better financial reporting quality signal their inherent characteristics by choosing
high-quality auditors (Titman and Trueman 1986; Datar et al. 1991). Also, some clients need
internationally recognized auditors or specialized auditing services that can be provided only by
the largest audit firms (Ghosh and Lustgarten 2006). Other clients may prefer the services of local,
small auditors to obtain more personalized service at similar or lower costs (GAO 2008).
Our conclusion of increasing self-selection and dichotomy in the public assurance market
is supported by several trends. The numerical market share of Big N audit firms declines from
90% for the pre-1970 companies to 65% for the 2000s cohort. The differences in the amount and
the reliability of accounting estimates between companies audited by Big N and non–Big N firms
dramatically widens with each successive cohort. Thus, with the arrival of each new cohort,
companies audited by non–Big N audit firms show higher amounts of, but relatively less reliable,
accounting estimates. Accordingly, the difference between the financial reporting qualities of Big
N and non–Big N clients (that is, the relatively superior financial reporting quality associated with
Big N) increases with successive cohorts.9
The idea of increasing client-auditor self-selectivity is supported by an apparently
inconsistent finding. The Big N fee premium narrows with the arrival of each new cohort, a trend
opposite to the widening differential of financial reporting qualities.10 If Big N firms improved
financial reporting quality for newer cohorts to a greater extent because of their superior auditing
than do non–Big N firms, then the Big N audit fee premium would have increased, not declined
(Ireland and Lennox 2002; Ball et al. 2012 ; Hribar et al. 2014). Furthermore, factors unrelated to
9 For example, for the latest cohort, the volatility of cash flows is approximately 20 times higher for non–Big N clients
than for Big N clients. Also, as many as 31% of the clients receive a going-concern opinion from non–Big N firms,
compared with just 3% for Big N clients from the same cohort. 10 This is unlikely because of low-balling of fees by Big N auditors (DeAngelo 1981a) because there is no reason why
only Big N audit firms indulge in this practice.

8
audit and accounting (e.g., the increasing difference of stock return and cash flow volatility of Big
N and non–Big N clients) point to increased self-selectivity.
A growing number of smaller audit firms compete in the expanding market of riskier public
companies. Their number increases from 88 for pre-1970 companies to 722 for new-list
companies. The Herfindahl index declines, indicating greater fragmentation in the audit market
and increased competition. The aggregate numerical market share of non–Big N firms increases
more than threefold, from 10% to 35% from pre-1970 companies to the 2000s cohort. While Big
N firms continue to command the bulk of total fees (their share declines from 98.8% to 91.3%
from pre-1970 companies to the 2000s cohort), the increase in the fee share of non–Big N firms,
from 1.2% to 8.7%, is, nevertheless, sevenfold. These trends are unexplained by the rise of second-
tier firms (Hogan and Martin 2009).11 While we find declining (increasing) market share of Big N
(non–Big N, non-second-tier) firms, we find that no significant change has occurred in the market
share of second-tier firms. Furthermore, in many respects, the characteristics of second-tier firms
are more similar to Big N firms than to smaller auditors.12
Zingales (2000), Apte et al. (2008), Brown and Kapadia (2007), and Srivastava (2014a)
suggest that the trend of increases in the average intangible intensity and company risks will
continue in the near future as newer cohorts arrive and gain prominence. Assuming that this pattern
of changing landscape of public firms continues and Big N auditors still exercise stringent
thresholds in client selection and retention, we predict a decline in Big N’s market share. This
should ease concentration in the auditing industry, an outcome that the regulators would see as
11 The firms are BDO, Grant Thornton, Crowe Horwath, and McGladrey. 12 This result is consistent with the differing PCAOB inspection frequencies of audit firms mandated by SOX and
based on a threshold of one hundred publicly traded clients.

9
positive. We further predict that client size–adjusted audit fees would increase because of increases
in audit fees for non–Big N firms.
Several developments could negate our predictions. First, Big N auditors could increase
their risk tolerance in accepting new clients to maintain their market share. We find some evidence
of their increasing risk tolerance but not at the pace at which the market of public companies is
changing. Studies show that past large, successful entities often fail to change their business
strategies consistent with market developments and fall victim to the innovator’s dilemma
(Christensen 1997).13 Second, the surviving and growing non–Big N clients from newer cohorts
could switch to a Big N firm over time (Johnson and Lys 1990). However, we find that a greater
likelihood exists of a new-list company downgrading from a Big N to a non-Big N firm than
upgrading its auditor type over time. These results are consistent with Byrnes (2005), Landsman
et al. (2009), and Hogan and Martin (2009), who find a dramatic increase in downward switches
of risky clients in the post–Sarbanes-Oxley Act (SOX) of 2002 period, even for large companies.
Arguably, these companies did not meet Big N firms’ retention standards over time. [The surviving
companies from newer cohorts continue to characterize high risks (Brown and Kapadia 2007).]
Third, Big N firms might acquire small audit firms from time to time to maintain their market
share. A counterargument is that regulators might not permit such acquisitions (GAO 2008). And,
fourth, regulatory shocks could increase compliance costs that can be sustained only by large firms.
In addition to predicting trends in the competitive structure of the assurance business, our
study answers many of the questions on the time series trends in auditing raised in DeFond and
Zhang (2014) and Donovan et al. (2014). We find a significant decline in the measures of audit
13 Large, established companies fall if they overlook developments in markets, especially when emerging but smaller
markets do not fulfill their growth needs. They tend to wait too long, and new entrants usurp the market shares.

10
quality [a decrease in accrual quality and an increase in type 1 errors in going-concern (GC)
opinions (those not associated with future bankruptcies; Knechel et al. 2013)] but show that this
trend is almost entirely because of changes in client characteristics over time. Non–Big N auditors
appear to address their growing litigation risk by more frequently issuing going-concern opinions
(Lys and Watts 1994; Kaplan and Williams 2013). Furthermore, due to increasing client size–
adjusted audit fees of non–Big N clients, the audit fee premium for Big N firms appears to decline,
despite the widening differential between their conventional measures of financial reporting
qualities. In addition, we extend Lawrence et al. (2011) by showing that the increasing differences
in audit quality proxies for Big N versus non–Big N firms likely reflect growing client-auditor
self-selectivity.
Section 2 summarizes the literature and presents the hypotheses. Section 3 describes the
sample selection and the measurement of the variables. Section 4 describes the tests of the
hypotheses. Section 5 presents concluding remarks.
2. Prior research, theory, and motivation of hypotheses
In this section, we summarize prior literature that provides motivation for our hypotheses.
2.1. Increasing concentration in the audit industry
The evolution of the Public Accounting industry is characterized by the consolidation of
the market in the hands of large audit firms as a decreasing number of large U.S. accounting firms
perform audits for the vast majority of the public companies (GAO 2008). The number of these
firms has fallen from eight to four, as a result of mergers and the dissolution of one firm.14 The
GAO finds that these Big N firms audit 98% of the largest public companies and collect
14 The eight firms in the 1980s were Arthur Andersen LLP, Arthur Young LLP, Coopers & Lybrand LLP, Deloitte
Haskins & Sells LLP, Ernst & Whinney LLP, Peat Marwick Mitchell LLP, Price Waterhouse LLP, and Touche Ross
LLP.

11
approximately 95% of all audit fees paid by public companies. The agency also claims that the
U.S. audit market functions as an oligopoly and conjectures that the Big N firms have a large
enough market share to use their market power, either unilaterally or through collusion, to
influence price and other business practices to their advantage (GAO 2008).
Regulators, therefore, have consistently argued against the increasing market concentration
of Big N firms. For example, in 2003, Securities and Exchange Commission (SEC) chairman
William Donaldson called the large market share of Big N audit firms “a national problem” (Dwyer
2003). In 2005, SEC chairman Christopher Cox urged the SEC and the American Institute of
Certified Public Accountants (AICPA) “to support competition and choice in the market for
smaller public company auditing services” (Cox 2005). The pattern is not just confined to the U.S.
The European Commission (2010, p. 15), upon finding that 90% of audit fees go to Big N firms,
warned that “[s]uch concentration might entail an accumulation of systemic risk and the collapse
of a ‘systemic firm’ or a firm that has reached ‘systemic proportions’ could disrupt the whole
market.” Academic research, however, remains divided on whether the increased concentration
benefits or harms U.S. corporations (e.g., DeFond and Lennox 2011; Gerakos and Syverson 2015).
2.2. Recent surveys
DeFond and Zhang (2014) reason that audit characteristics are strongly related to clients’
underlying economics. They claim that a firm’s innate characteristics constrain the achievable
level of financial reporting quality post-audit (Lennox et al. 2014). Their study, along with
Donovan et al. (2014), raises several questions on the changes in the attributes of the Public
Accounting industry because of changes in the underlying economics of the listed company.
Changes in the competitive structure, the audit quality and fees, the role of high-quality audits in

12
overall financial reporting quality, and the response of audit firms to increasing intangible
intensiveness and riskiness of U.S. companies remain largely unexplored.
2.3. Changes in the nature of a typical listed firm
New firms must differentiate their products to earn higher price or must produce
standardized goods at lower costs to earn economic rents (Porter 1980; Prahalad and Hamel 1990).
Since the 1970s, physical assets have become less distinct and a smaller source of competitive
advantage (Zingales 2000; Zimmerman, J. L. 2015), which is evident from a gradual shift in the
manufacturing operations from the U.S. to low-cost economies (Apte et al. 2008). Management
literature reasons that newer U.S. companies obtain market shares from their established
counterparts by disruptive innovations and by offering targeted services, both of which require
more intangible inputs and riskier business models than the manufacture of standardized goods.15
Other studies argue that newer companies more frequently innovate than legacy firms because they
do not fear cannibalization of their existing products (Acs and Audretsch 1988; Igami 2015). These
studies suggest that systematic differences exist in the characteristics of successive waves of listed
firms.
Consistent with these ideas, Srivastava (2014a) finds that successive cohorts show
decreasing cost of goods sold (COGS) and increasing research and development (R&D) expenses
and market-to-book ratios, indicative of increasing intangible intensity. Because intangible
investments carry higher uncertainty of benefits than tangible investments (Kothari et al. 2002),
Srivastava (2014a) finds that successive cohorts show higher volatility of earnings. Other studies
find that new-list companies have higher growth but lower survival rates than pre-1970 companies
15 See Prahalad and Hamel (1990), Christensen (1997), Shapiro and Varian (1998), Romer (1998), Payne and Frow
(2005), Apte et al. (2008), Brickley and Zimmerman (2010), and Baumol and Schramm (2010).

13
and that successive cohorts display increasing volatility of stock returns beyond those explainable
by multifactor models (Fama and French 2004; Brown and Kapadia 2007).
Successive cohorts retain their risk characteristics for a long time beyond the initial public
offering (IPO) phase, and the risk differences across successive cohorts persist. Hence, Brown and
Kapadia (2007) conclude that inter-cohort differences are not related to firm age or size but are
strongly related to their persistent business practices. They also show that the time series trends of
the average characteristics of public companies are strongly related to trends in characteristics of
successive cohorts because newer cohorts regularly replace older cohorts in the set of public
companies.
2.4. Firm economics, forward-looking estimates, and the quality of financial reporting
The above developments could affect the quality of financial reports because nearly every
number in financial statements requires estimates and assumptions concerning future
developments (Fisher 2003).16 Thus, many elements in financial statements require estimates that
represent managers’ judgment concerning future events.
16 Barth (2006, p. 271) claims that, “by definition, assets and liabilities embody expected future inflows and outflows
of economic benefits.” Further, the recognition of revenues and expenses requires estimates about the future. For
example, the recognition of revenues calls for a judgment on whether cash will be collected from a customer. Also,
complex revenue arrangements require judgment in estimating the constituent components of a customer contract,
their stand-alone selling prices, and the likelihood of their deliveries. Whether an outlay is recognized as an expense
or an asset is based on the likelihood that it will produce future benefits. Thereafter, a recognized asset is tested for
impairment—whether the estimates of its future benefit have fallen below its carrying value. Accounting for a
corporate acquisition requires identification of constituent asset classes and the allocation of total purchase value to
asset classes based on the estimates of their future benefits. A deferred tax asset is reduced via a valuation allowance
based on an assessment that the asset can no longer reduce future tax payments. Recognition of an environmental
liability requires an estimate of the likelihood and the amount of future outflows. Recognition of stock option expense
requires estimates of stock return volatility, risk-free rate, lives of stock options, and dividend payments.
14
2.5. Trend in the amounts and the reliability of managerial estimates in financial reporting
Based on the discussion in Subsections 2.3 and 2.4, successive cohorts clearly exhibit
systematic trends in innate characteristics that potentially affect the properties of their accounting
systems. However, whether successive listing cohorts show an increase or decrease in the amount
of forward-looking estimates required in financial reports remains undetermined. Certain
developments, such as increased use of stock options, greater bundling of products and services in
the same revenue arrangements, and higher growth by corporate acquisitions, suggest increases in
accounting estimates. Other factors, such as an increase in intangible outlays that are immediately
expensed, decreasing use of physical assets that require estimates of useful lives and fair values,
and declining defined post-retirement benefit plans, predict decreases in the amount of accounting
estimates. Accordingly, we put forth H1a.
H1a: Successive cohorts do not exhibit any trend in the extent of managerial judgment and
estimates required in financial reporting.
We test H1a by using total accruals as a summary measure of managerial judgment in
financial reporting. We also examine whether the aggregate managerial judgment in financial
reports exceeds a materiality threshold.
In addition, we posit that the successive cohorts show decreasing predictability of their
key economic events (Brown and Kapadia 2007).
H1b: The uncertainty of future performance increases with successive cohorts.
We test H1b by ascertaining trends in volatilities of cash flows, stock returns, and sales
growth across successive cohorts (Pástor and Veronesi 2003; Zhang 2010).

15
2.6. Trend in the quality of financial reporting
Managers use judgment and estimates to convey useful information on future firm
performance to investors (Subramanyam 1996; Healy and Wahlen 1999; Fields at al. 2001;
Dechow et al. 2010). In H1a and H1b, we expect monotonic trends in successive cohorts’ forward-
looking estimates in financial reports as well as managers’ predictability of future events. These
two developments should likely lower the extent to which financial reports correspond with
economic outcomes.
H2: Successive cohorts exhibit a decline in the association between accounting estimates
and economic outcomes.
We test H2 by assessing whether accounting accruals are less associated with past, current,
and future cash flows for successive cohorts (Dechow and Dichev 2002).
2.7. Trend in contribution of high-quality audits to the overall quality of financial reporting
The preparation of financial statements requires initial estimates by managers followed by
an auditor’s review of that judgment (Fisher 2003). Hence, the quality of financial reporting is a
joint product of the manager’s and the auditor’s efforts (Magee and Tseng 1990; Dye 1991; Antle
and Nalebuff 1991). Thus, the public accountant’s audit is critical to the financial reporting process
(GAO 2008; Watts and Zimmerman 1981).
However, whether and how the audit firms’ incremental contribution to the overall
financial reporting process changes with successive listing cohorts remains unexamined. We
expect the successive cohorts to display less reliable managerial estimates in financial reports. On
one hand, high-quality audit firms can create greater value by more diligent verification of
successive cohorts’ accounting estimates. Prior studies indicate that, other things held constant,

16
Big N audit firms deliver superior audit efforts because they have better economies of scale, have
stronger incentives to protect their reputations, and are better able to attract high-quality inputs
(Watts and Zimmerman 1981; DeAngelo 1981b; Dopuch and Simunic 1982; Francis and Yu
2009). Anticipating Big N audit firms’ stringent verification of their estimates, managers exert
greater efforts in preparing financial reports (Ball et al. 2012).
On the other hand, the efficacy of the audit firms’ verification efforts should be limited by
the extent to which a firm’s future events can be forecasted or estimated. Stated differently, when
forecasting future events is difficult and managers can provide little support for their “soft”
estimates, the efficacy of verification of Big N audit firms might be no different than any other
auditor (Ijiri 1975). In addition, some arguments exist for why Big N clients might display
characteristics that are interpretable as lower quality of financial reports. Because of greater
reputational capital at stake and higher potential litigation liability, Big N audit firms might
encourage more conservative accounting. For example, they might favor immediate expensing of
investments that increase future revenues albeit in an uncertain manner [e.g., organizational
competency or brand development (Banker et al. 2011; Eisfeldt and Papanikolaou 2013)].
Immediate expensing of investment outlays that lowers the association between financial estimates
and economic outcomes is interpreted as a decline in quality of financial reports (Srivastava 2014a;
Lev and Sougiannis 1996). Furthermore, Big N audit firms might more frequently issue
conservative going-concern opinions, those not associated with future bankruptcies. These
erroneous opinions are indicative of lower audit quality (Knechel et al. 2013).
The contribution of Big N audit firms to the financial reporting of newer cohorts is not
clear. Accordingly, we state H3 in null form.

17
H3: The difference between contributions of Big N and smaller audit firms to financial
reporting quality does not change with successive cohorts.
2.8. Changes in the competitive structure of the Public Accounting industry
The evolution of the audit industry is characterized by its consolidation in the hands of a
few Big N audit firms. However, whether the Public Accounting industry becomes more or less
concentrated with successive cohorts remains an unexamined question. On one hand, it is plausible
that only large audit firms have the resources to invest in developing a knowledge base to keep
pace with the changing technologies and innovative business practices of successive cohorts.
Further, perhaps only large firms possess the competencies, technology, and skills required to audit
complex companies, especially those with international operations (Sirois and Simunic 2011).
Many new companies are technology intensive with a greater global reach than similar-size non-
technology companies (Jones 1999). Also, because newer companies are characterized by greater
uncertainty of cash flows and because the presence of a prestigious auditor reduces investors’
uncertainty about a newly traded company’s cash flows (Balvers et al. 1988; Beatty 1989; Titman
and Trueman 1986; Willenborg 1999.), newer companies might more frequently use Big N firms
as auditors to have successful IPOs.
On the other hand, an increasing proportion of new cohorts might not be able to obtain the
services of large audit firms. Big N might avoid audits of newer IPO firms that carry large litigation
risk because of greater volatility of their stock prices (Michaely and Shaw 1995). In addition,
representational faithfulness, a key accounting attribute, requires managers’ accounting choices to
be limited to those that are verifiable. Thus, when high-quality audit firms do not receive adequate
support for managers’ estimates (AU Sections 312.37 and 9312A, PCAOB), they might not accept

18
such clients to begin with or might drop them, because of their greater reputation capital being at
stake or to avoid regulatory scrutiny because PCAOB reviews are based on the assessments of
audit risks (Hanson 2014). Client-side reasons also exist to expect declining use of Big N auditors
by new cohorts. New-list companies with smaller scales of operations than the pre-1970s cohort
might not have a need to employ Big N audit firms. Furthermore, when speed to IPO is a key factor
for firms with rapidly changing technologies (Lowry and Schwert 2002; Loughran and Ritter
2004), newer cohorts might prefer the services of smaller auditors to obtain timelier and more
personalized services at the same or lower costs.
Thus, ex ante, it is not clear whether the Public Accounting industry will become more or
less concentrated in the hands of Big N firms for successive cohorts.
H4: The competitive structure and the aggregate market share of Big N audit firms do not
change with successive cohorts.
2.9. Changes in audit fees
How the changing characteristics of successive cohorts’ economic characteristics affect
audit fees remains unexamined. On one hand, the effort required for verification of accounting
estimates is likely to increase with successive cohorts. Further, given that successive cohorts show
decreasing survival rates and increasing stock return volatility, litigation risk, potential PCAOB
scrutiny, and damage to an auditor’s reputation, audit fees might increase with successive cohorts,
controlling for firm and auditor size (e.g., Thoman 1996). On the other hand, at least some factors
support the idea that auditor efforts and fees might decline with successive cohorts. For example,
barring certain industry-specific practices [e.g., the 1998 AICPA Statement of Position (SOP) 98-
1 for software companies], companies largely expense in-house intangible investments as incurred,

19
reducing the need to estimate the fair values of assets and test for their impairments in future years.
Also, audit firms might act conservatively by more frequently issuing going-concern opinions for
newer cohorts to potentially reduce litigation risks (e.g., Kaplan and Williams 2013).17 In addition,
newer cohorts without the burden of legacy systems might use the latest information technology
to store and process financial transactions, thereby reducing audit firms’ verification and data
processing efforts (Donovan et al. 2014). Accordingly, whether the successive cohorts display
increasing or decreasing audit fees, after controlling for firm size and auditor type, remains an
empirical question.
H5: The client size–adjusted audit fees do not change with successive cohorts.
2.10. Changes in premiums charged by Big N audit firms
Prior studies argue that Big N firms attract better inputs for conducting complex audits and
perform more careful audits because they have greater incentives to protect their reputations (e.g.,
Dye 1993). Big N firms can create greater improvement in overall financial reporting quality by
more stringent verification of estimates, and they charge premium fees over non–Big N firms,
adjusted for client size (Ball et al. 2012). This premium could increase with newer cohorts whose
estimates require more stringent verification and have a greater potential for improvement in
reporting quality because of diligent efforts from a high-quality auditor.
On the contrary, Big N firms could select only the safest accounts with the highest pre-
audit quality in successive cohorts (Johnstone and Bedard 2003, 2004). Furthermore, companies
with better financial reporting quality might choose high-quality auditors in the first place (Titman
17 Tangible assets command greater secondary market values than intangible assets in the event of firm failure
(Webster 1999). Thus, intangible-intensive firms could be associated with higher liability (after adjusting for
liquidation proceeds) in case of adverse outcomes.

20
and Trueman 1986; Datar et al. 1991). Thus, the pre-audit quality of clients left with smaller
auditors would decline with each successive cohort, at a greater pace than for Big N firms.
Plausibly, the smaller auditors might demand higher size-adjusted fees from successive cohorts to
compensate for their risks and efforts. In that case, the client size–adjusted fees difference between
Big N and smaller firms might decline with successive cohorts.
Given a lack of ex ante prediction, we frame a null hypothesis.
H6: The premiums that Big N audit firms charge relative to other audit firms do not change
with successive cohorts.
3. Sample selection and measurement of variables
In this section, we discuss sample selection and measurement of key variables.
3.1. Sample selection
We use 49,431 company-year observations with valid data in the Compustat and Audit
Analytics databases from 2001 to 2012.18 We exclude all finance companies, because the
traditional cost and accrual measures do not apply to those companies.19 Consistent with Srivastava
(2014a), we call the first year in which a firm has valid data in Compustat the listing year. This
makes our tests consistent with the availability of financial and audit data.20 We classify companies
as pre-1970s if they are listed before 1970 and as new-lists otherwise (Fama and French 2004).
Each cohort of new-lists is tied to a common listing decade. Thus, we divide all companies into
18 Each firm-year observation requires asset data for the previous four years, along with earnings and revenue data for
the current year and the previous three years (from Compustat). We also require data for the next year to calculate
future cash flows. All observations should have data on audit fees in Audit Analytics. Further, at least ten observations
are needed in an industry-year to estimate discretionary accruals and Dechow and Dichev (2002) regressions. 19 We exclude Fama and French industries identified by numbers 44–47 (representing finance companies) and 48
(labeled “almost nothing”), leaving 43 industries, consistent with Srivastava (2014a). 20 Compustat listing year leads the listing year in Center for Research in Security Prices (CRSP) database by a few
years. The results remain broadly unchanged if we use CRSP listing year (results not tabulated).

21
five groups: pre-1970s and cohorts for the 1970s, 1980s, 1990s, and 2000s. Our aim is to examine
systematic trends in successive cohorts of listed firms. A ten-year classification provides five
parsimonious and ordered categories for presentation purposes. Similar results are obtained by
annual classification, albeit with more significant t-statistics. Fama and French (2004) and Brown
and Kapadia (2007) also use ten-year classifications (e.g., 1980–1989 and 1985–1994,
respectively) and find monotonic trends.
We present the distribution of observations by cohorts in Table 1, Panel A.
[Insert Table 1 near here]
3.2. Measurement of variables
In this subsection, we discuss the measurement of key dependent and independent
variables. Detailed measurements are provided in the Appendix.
3.2.1. Intangible intensity
Following Dichev and Tang (2008), we calculate total expenses by subtracting income
before extraordinary items (Compustat IB) from revenues (Compustat SALES). We measure R&D
and COGS expenses by the Compustat data items XRD and COGS, respectively. The proportions
of these expenses are calculated by dividing them by a company-year’s total expenses and are
referred to as R&D_Intensity and COGS_Intensity, respectively. R&D_Intensity represents the
extent of intangible usage, and COGS_Intensity increases with physical costs of production
(material, labor, energy, and inventory). We measure high-technology industries consistent with
Schipper (1999) and Kwon et al. (2006).

22
3.2.2. Factors affecting the amount of accounting estimates and managerial judgment required in
financial reports
We measure the complexity of a firm’s revenue recognition by the ratio of deferred revenue
(Compustat DRC and DRLT) to revenues (DeferredRevenueToSalesRatio), consistent with
Prakash and Sinha (2013) and Srivastava (2014b). Consistent with Efendi et al. (2007), we define
LargeAcquisition as one, when the contribution from acquired assets (Compustat AQS) exceeds
20% of revenues for that year. We argue that the judgment required for the identification of asset
classes and the estimation of their fair values increases in LargeAcquisition. We measure
SpecialItems by (−1 × Compustat SPI scaled by average total assets) earnings. This variable
represents restructuring charges, asset impairments, and losses from asset sales (Donelson et al.
2011). Thus, it should also represent the unexpected developments in companies’ business
environments. In addition, restructuring charges often require estimates of future cash payments.
We examine the extent of stock option–based compensation by the absolute value of the ratio of
stock-based compensation expenses (Compustat STKCO) to total expense. The recording of this
expense requires many forward-looking estimates.
We measure managers’ judgment in financial reporting (Jones 1991; Kothari et al. 2005)
by the absolute value of performance-matched discretionary accruals
(AbsPerMatchedDiscAccruals). This judgment could be used for an opportunistic or informative
reason (Subramanyam 1996; Healy and Wahlen 1999; Fields at al. 2001; Dechow et al. 2010). We
consider the reporting period in which the magnitude of discretionary accruals exceeds a given
amount (either 10% or 20% of total assets) as a year in which the aggregate managerial judgment
in financial reporting exceeds a materiality threshold (Materiality10% and Materialty20%,
23
respectively). This measure assumes that, in determining materiality, audit firms consider not only
the amount of estimates made in each recorded transaction but also their additive effect.21
3.2.3. Uncertainty of future firm performance
We reason that a company’s volatilities of earnings, cash flows, and stock returns are
indicators of the unpredictability of its key economic events (Pástor and Veronesi 2003; Zhang
2010). We also reason that the higher such uncertainty, the lower the managers’ ability to forecast
future events and the lower the reliability of forward-looking estimates in financial reports. We
scale CFO [Cash Flow from Operations excluding Extraordinary Items (OANCF − XIDOC)] by
the average of the beginning and ending total assets. For tests described in Subsection 4.2.2, we
need data beginning from 1970. Therefore, we use the balance sheet method of calculating cash
flows for those tests. We estimate the standard deviations of CFO as well as those of sales growth
for each company-year using four rolling annual observations (t−3 through t). For multivariate
tests, we control for the uncertainty of firm performance by the standard deviation of cash flows
from operations (VolatilityCFO). Stock return volatility is the standard deviation of daily stock
returns measured over a fiscal year.
3.2.4. Measures of financial reporting and audit qualities
We measure financial reporting quality by the extent to which accounting accruals map
with economic outcomes. Such a quality of accruals is measured conversely by the absolute value
of the residuals from a regression of total current accruals on past, current, and future cash flows
(AbsResidualsDD) on an industry-year basis (Dechow and Dichev 2002), augmented with gross
property, plant, and equipment and sale change, deflated by average total assets (McNichols 2002;
21 PCAOB standard AU 9312A states: “[I]f each accounting estimate included in the financial statements was
individually reasonable, but the effect of the difference between each estimate and the estimate best supported by the
audit evidence was to increase income, the auditor should reconsider the estimates taken as a whole.”

24
Francis et al. 2005). The residual measure also represents the initial error in accounting estimates
(Dechow and Dichev 2002).
We use the incidence of an uncertainty regarding the going-concern assumption issued by
audit firms (Audit Analytics variable GOING_CONCERN) as an additional measure of audit
quality. We refine this measure consistent with Knechel et al. (2013). We define type 1 errors as
going-concern opinions not associated with future bankruptcies. We call non-issue of going-
concern opinions followed by bankruptcy the erroneous clean opinions. We identify bankruptcy
companies from the Securities Data Company database and the UCLA-LoPucki Bankruptcy
Research Database.
3.2.5. Auditor characteristics
All dummy variables discussed in this subsection are assigned a value of zero except as
follows: BigN takes a value of one if the auditor is a Big N firm; AuditorStickiness, if the company
persists with the same auditor as in the previous year; AuditorUpgrade, if the company changes
from a non–Big N auditor to a Big N auditor; AuditorDowngrade, if the company changes from a
Big N auditor to a non–Big N auditor; and AuditorTypeStickiness, if the company persists with the
same type of auditor (a Big N auditor or a non–Big N auditor).
We measure an auditor’s industry specialization (IndustrySpecialization) in each company-
year by the sum of assets of companies audited by that firm in that two-digit standard industrial
classification (SIC) code industry divided by the sum of assets of all companies in that industry.
We identify high-litigation industries consistent with Kim and Skinner (2012).
3.2.6. Audit fees
We measure audit and non-audit fees with data from Audit Analytics. We deflate audit fees
by the square root of assets (AuditFee_SqrtAssets) to obtain client size–adjusted audit fees for

25
multivariate tests consistent with prior literature (e.g., Simunic 1984).22 We measure audit firms’
competitiveness in an industry by the Herfindahl index (H-Index):
𝐻– 𝐼𝑛𝑑𝑒𝑥𝑗,𝑦 = ∑𝐴𝑢𝑑𝑖𝑡𝐹𝑒𝑒𝑠𝑆ℎ𝑎𝑟𝑒𝑖,𝑗,𝑦2 , (1)
where AuditFeesShareijy is the revenue share of auditor i in industry j (two-digit SIC code) in year
y. Lower H-Index indicates higher competition.
4. Tests of hypotheses
This section describes the tests of the hypotheses.
4.1. H1a and H1b: Trend in successive cohorts’ innate characteristics
We first calculate the cross-sectional average of variables by pre-1970 companies and new-
lists over the common period of 2001–2012 and test for their differences. We then calculate cross-
sectional averages (AverageCharacteristicCohort) for each of the five cohorts. We test for overall
trends in successive cohorts in the regression
AverageCharacteristicCohort = β1 + β2 × Cohort_Dummy +ε, (2)
where Cohort_Dummy is assigned values of 0, 1, 2, 3, and 4 corresponding to the pre-1970s
companies and the cohorts from the 1970s, 1980s, 1990s, and 2000s. Thus, we use five
observations of AverageCharacteristicCohort to estimate each of the regressions.23 The cohort
trend is measured by β2, with a positive (negative) value indicating a progressive increase
(decrease) in that characteristic across successive cohorts all measured at the same time.
We present the trend in intangible intensity in Panel A of Table 1, which shows that R&D
intensity for the new-lists is dramatically higher than for the pre-1970s cohort. Successive cohorts
22 In a regression of log (audit fees) on log (assets), the estimated coefficient is approximately 0.5 (Simunic 1980, p.
180), implying that audit fees increase according to the client’s square root of assets. A similar argument is made in
Simunic (1984), arguing that deflating audit fees by the square root of assets is appropriate. 23 These regressions are estimated using only five observations. Hence, they have only three degrees of freedom. In
this case, a t-statistic of 2.35 (1.64) represents significance at 5% (10%) on a one-tailed basis. We obtain more
significant t-statistics by regressing firm-year observations on cohort dummies (results not tabulated).

26
show increasing R&D_Intensity of 0.017, 0.025, 0.061, 0.095, and 0.071. The trend is opposite for
COGS_Intensity. Both cohort trends are significant at 5%. Furthermore, an increasing percentage
of companies come from high-tech industries. These results are consistent with prior studies.
We next examine trends in factors that could affect the amount of estimates required in the
preparation of financial reports. Panel B of Table 1 shows that, on average, the new-lists have
higher special items and deferred revenue-to-revenue ratios than the pre-1970s cohort. Further, the
new-lists derive greater revenue growth from acquisitions and use more stock option–based
compensation. The cohort trends for all of these variables are positive and significant at 5%. Thus,
successive cohorts exhibit a trend in innate characteristics that should enhance the judgment and
forward-looking estimates required to prepare financial statements.
Panel C of Table 1 shows that successive cohorts have increasing
AbsPerMatchedDiscAccruals of 0.037, 0.067, 0.077, 0.083, and 0.101, respectively. The cohort
trend, at 0.014, is positive and significant at 5%. This result is consistent with the idea that the
aggregate amount of managerial judgment required in financial reporting increases with successive
cohorts. Materiality10% and Materialty20% also increase with successive cohorts. These
thresholds are breached with a frequency of 26.2% and 12.1%, respectively, for the 2000s cohort,
much more frequently than 6.5% and 1.0%, respectively, for the pre-1970s cohort.
Consistent with H1b, we observe increasing trends in the volatility of cash flows, stock
returns, and sales growth (Panel D of Table 1). For example, the standard deviations of deflated
cash flows of successive cohorts are 0.038, 0.081, 0.163, 0.263, and 0.240, showing a significant
positive cohort trend of 0.059 (significant at 1%). These results indicate that the future business
environment of successive cohorts is increasingly uncertain and that their key economic events are
increasingly difficult to forecast (Pástor and Veronesi 2003).

27
H1a and H1b results are consistent with the proposition that, with each new cohort of listed
companies, audit firms must deal with more complex issues of accounting estimates. Their
increasing amounts frequently exceed materiality thresholds but are based on fewer and fewer
predictable future events. This development should increase the errors in accounting estimates.
4.2. H2: Trend in successive cohorts’ financial reporting quality
We examine the trends and determinants of the financial reporting quality of successive
cohorts.
4.2.1. Univariate tests
We measure the quality of accounting estimates conversely by the extent to which accruals
do not correspond with past, current, and future cash flows, that is, by AbsResidualsDD. Panel A
of Table 2 shows that successive cohorts from pre-1970s to 2000s show increasing
AbsResidualsDD of 0.027, 0.046, 0.056, 0.060, and 0.071, respectively. The trend at 0.010 is
positive and significant at 1% and supports the notion that audit as well as overall financial
reporting quality declines with successive cohorts (e.g., Dechow et al. 2010; Reichelt and Wang
2010).
[Insert Table 2 near here]
Panel A also shows that the successive cohorts receive an increasing percentage of going-
concern opinions: 1.59%, 4.92%, 7.59%, 8.75%, and 12.91%, respectively. More important, the
percentage of audit opinions with type 1 errors (ConservativeGoingConcernOpinion) also
increases monotonically with the successive cohorts: 1.45%, 4.81%, 7.43%, 8.60%, and 12.73%,
respectively. This trend is positive and significant (p-value < 0.05). In addition, Panel D of Table
1 shows that 15.4%, 24.9%, 33.8%, 43.2%, and 35.0% of companies from the successive cohorts,
respectively, come from high-litigation industries. The dramatic increase in erroneous GC opinions

28
suggests that audit firms act more conservatively in the issuance of GC opinions for newer cohorts,
potentially to reduce litigation liability (Kaplan and Williams 2013). In comparison, no significant
trend emerges in erroneous clean opinions.
4.2.2. Multivariate tests
We next examine whether H2 results (the decline in audit and financial reporting qualities)
can be largely explained by the distinctive innate characteristics of cohorts. We test this idea by
estimating the regression
InverseMeasureOfQualityi,t = α +β1× Cohort_Dummyi,t
+∑ βs× Controlsi,t + ε i,t, (3)
where i = company and t = year. InverseMeasureOfQuality is the AbsResidualsDD or the type 1
error in going-concern opinion (ConservativeGoingConcernOpinion). A positive β1 would imply
that the quality measure declines with successive cohorts, despite controlling for innate
characteristics. We control for factors that we examine in H1 tests: client size (LogAssets),
intangibility of inputs in production functions (COGS_Intensity, R&D_Intensity), complexity of
revenue recognition (DeferredRevenueToSalesRatio), acquisitions (LargeAcquisitions),
uncertainty of firm performance (VolatilityCFO), and losses (Loss).
Panel B of Table 2 presents results without any control variable. We find that β1 is
significant and positive at 1%, which is consistent with univariate trends.24 Panel C presents results
after including the control variables in equation (3). Now, β1 becomes much smaller and even turns
insignificant for AbsResidualsDD. Furthermore, the adjusted R2s increase, from 2.03% and 1.41%,
respectively, to 21.98% and 22.18%. These results suggest that the decline in financial reporting
across successive cohorts can be largely explained by differences in their innate characteristics.
24 The standard errors are clustered on industry and year.

29
4.2.3. Controlling for life-cycle effects and survivorship bias
One potential concern of these results is that we compare the characteristics of different
cohorts in a common year, that is, when they have different listing ages. At those different ages,
successive cohorts could be in different phases of their life cycles and would have survived over
varying periods. Thus, life-cycle effects and survivorship biases could be the reasons for the
observed patterns in their characteristics (Anthony and Ramesh 1992; Jovanovic and MacDonald
1994). We address this explanation by using a wider set of data from 1970 to 2013.
If different cohorts are similar in each respect except their listing year, then they should
also be at the same stages of their life cycles when they are equally old. We test this proposition
by observing all firms’ characteristics at the listing year and ten years after the listing year.25 We
then calculate the revised cohort trends. Panel D of Table 2 shows significant positive and
significant cohort trends similar to those measured over a common period. These results clearly
suggest that successive cohorts fundamentally differ in their innate characteristics, which do not
go away with age or maturity (Brown and Kapadia 2007).
4.3. H3: Trend in contribution of high-quality audits to the overall quality of financial reporting
We test for systematic differences in trends of financial reporting attributes of successive
cohorts audited by Big N and non–Big N firms.
4.3.1. Univariate tests
We test H3 by differences in trends of financial reporting attributes of companies audited
by Big N and non–Big N firms. We divide all companies into ten groups [two categories by audit
25 The cash flows are calculated using the balance sheet method for this analysis. For a ten-year analysis, the 2000s
cohort characteristics are calculated using data of firms listed in the initial years because data are not available for
firms listed in the later years.

30
firms (Big N, non–Big N firms) × five listing cohorts]. We then separately estimate the cohort
trends by the two categories of audit firms and examine their differences.
Panel A of Table 3 shows a significantly larger trend in the accounting estimates of
companies audited by non–Big N than by Big N audit firms. For example, the cohort trend in
AbsPerMatchedDiscAccruals of non–Big N clients at 0.026 is approximately four times larger
than 0.007 of Big N clients. The two cohort trends are significantly different. Furthermore, Big
N’s cohort trend is roughly half that of the overall listed population, as shown in Panel C of Table
1. This pattern indicates that while the Big N firms appear to have relaxed their standards in client
selection, this change has not kept pace with the change in the characteristics of the companies in
the public assurance market. Furthermore, non–Big N firms appear to be absorbing the riskiest
clients at an increasing pace. Thus, the differences in amounts of accounting estimates of Big N
and non–Big N clients widens with the arrival of each new cohort. Consequently, the biggest
differences are observed in the latest, 2000s, cohort. The magnitude of
AbsPerMatchedDiscAccruals for non–Big N clients in the 2000s cohort is three times larger than
for Big N clients. Similarly, Materialty20% is breached by approximately one in four non–Big N
clients, five times more frequently than for Big N clients.
[Insert Table 3 near here]
Panel B of Table 3 shows that the difference in unpredictability of economic events of Big
N and non–Big N clients also increases with each new cohort. Within the same 2000s cohort, the
volatility of cash flows is approximately 20 times higher for non–Big N clients than for Big N
clients. Similar patterns are observed in the volatility of revenue growth. Panel A and Panel B
results taken together indicate that, with the arrival of each new cohort, non–Big N firms cater to
clients that use the highest estimates in accounting but have the lowest predictability of future key

31
events. Panel B results are consistent with the idea of a growing separation between the client
pools of Big N and non–Big N firms due to client-auditor selectivity.
Trends described in Panels A and B should also affect the extent to which accounting
estimates correspond with economic outcomes, interpreted as measures of financial reporting and
audit quality. Panel C of Table 3 shows that the difference in AbsResidualsDD and type 1 errors
in GC errors of Big N and non–Big N clients widens with the arrival of new cohorts. Results are
also consistent with proposition that non–Big N audit firms respond to their increased audit risks
by liberally issuing conservative GC opinions.26 For example, within the 2000s cohort, non–Big
N audit firms issue conservative GC opinions for approximately 31% of their clients, ten times
more frequently than Big N audit firms (3%).
4.3.2. Multivariate tests
We next examine the trends in differences of financial and audit reporting qualities
associated with Big N and non–Big N audit firms by estimating the regression
InverseMeasureOfQualityi,t = α
+β1× Cohort_Dummyi,t + β2× BigNi,t + β3× Cohort_Dummyi,t × BigNi,t
+ β4× IndustrySpecializationi,t + β5× Cohort_Dummyi,t × IndustrySpecializationi,t
+ ∑ βs× Controlsi,t + εi,t. (4)
The coefficients on the interaction terms indicate the differences in the cohort trends of
high-quality versus smaller audit firms. Panel D of Table 3 presents results of equation (4). In both
regressions, β3 and β5 are significant and negative. Because the dependent variable is a converse
measure of audit quality, results support the idea of a widening difference in the financial reporting
qualities of companies audited by Big N and non–Big N audit firms. The results are consistent
26 These opinions almost entirely represent type 1 errors.

32
with at least two ideas. First, high-quality audit firms are better equipped to audit the performance
of companies with uncertain prospects or “high audit quality results in a larger improvement in
financial reporting quality for companies with relatively lower quality financial reporting system”
(DeFond and Zhang 2014, p. 283).27 Second, the separation between the client pools of Big N and
non–Big N firms is widening due to client-auditor selectivity (Titman and Trueman 1986; Datar
et al. 1991). H3 tests cannot distinguish between these two explanations.
4.4. H4: Changes in the competitive structure of the Public Accounting industry
Table 4, Panel A, presents evidence of distinct trends in the competitive structure of the
Public Accounting industry. Big N and industry-specialist audit firms are employed less frequently
by successive cohorts. Eighty-nine percent of pre-1970s companies use the audit services of Big
N firms, but only 69% of new-lists use their services. Further, the number of distinct audit firms,
representing mainly non–Big N firms, increases from 92 for the pre-1970s cohort to 726 for new-
lists. We also observe a declining trend in the usage of industry specialists. In addition,
competitiveness in the Public Accounting industry increases, as shown by a decreasing Herfindahl
index, indicating growing fractionalization of the industry. The increasing use of non–Big N firms
by newer cohorts appears inconsistent with the idea that only large audit firms possess the
competencies and knowledge to audit companies with fast-changing business models and
technologies. Yet results are consistent with two developments. First, successive cohorts consist
of smaller companies and do not require the expertise and resources of large audit firms. Second,
large audit firms more stringently select and retain clients from the pool of successive cohorts. H4
results cannot distinguish between the two explanations.
[Insert Table 4 near here].
27 Consistent with this idea, Weber and Willenborg (2003) find that going-concern opinions issued by Big N audit
firms are more predictive of future events than those of non–Big N audit firms.

33
Panel B of Table 4 shows that while auditor-client relationships are sticky, firms frequently
switch their auditors. Furthermore, new-lists change their auditors more frequently than pre-1970
companies. Approximately 96% of new-lists maintain their auditor types (a non–Big N auditor or
a Big N auditor). Among the new-lists that change their auditor types, the downgraders (from a
Big N auditor to a non–Big N auditor) exceed the upgraders (a non–Big N auditor to a Big N
auditor). This result is consistent with prior literature (Byrnes 2005; Landsman et al. 2009; Hogan
and Martin 2009). More important, results provide no support for the proposition that new-lists
shift from a non–Big N auditor to a Big N auditor over time, when they should grow and mature,
on average. As a result, the proportion of newer cohorts that obtain services from Big N auditor is
unlikely to increase over time.
Panel C of Table 4 shows very similar trends in the number and the proportion of non–Big
N audit firms in the years after 2004, by which time the phenomenon of post-SOX exodus of small
audit firms was largely complete (DeFond and Lennox 2011, p. 27). Thus, the trend of a steady
increase in both number and market shares of smaller audit firms arises despite the one-time large-
scale exit of smaller audit firms post SOX.
4.5. H5: Trend in successive cohorts’ audit fees
We examine trend in audit fees adjusted for client size for successive cohorts.
4.5.1. Univariate tests
Panel A of Table 5 shows that new-lists have significantly lower audit fees (LogAuditFees)
than the pre-1970 companies. Furthermore, successive cohorts have decreasing audit fees
(significant at 5%). We find a similar trend in non-audit fees. However, these trends could reflect
decreasing asset sizes. Hence, we calculate another measure of audit fees adjusted for client size
(audit fees per square root of total assets [AuditFee_SqrtAssets]) and find no significant trend.

34
[Insert Table 5 near here]
4.5.2. Multivariate tests
We next examine whether successive cohorts pay higher fees despite controlling for their
innate characteristics. We estimate the regression
AuditFee_SqrtAssetsi,t = α +β1× Cohort_Dummyi,t + ∑ βs× Controlsi,t + εi,t. (5)
The first column of Panel B of Table 5 shows that, without any controls, the coefficient on
Cohort_Dummy (β1) is insignificant. The second column shows that β1 remains insignificant after
controlling for companies’ innate characteristics. The largest t-statistics are observed on factors
that affect audit risks and efforts: tangibility of assets, loss, litigation, and business and geographic
segments. These results indicate that no significant trend exists in client size–adjusted audit fees
and that any change in fees across time likely reflects changes in innate characteristics.
4.6. H6: Changes in premium audit fees charged by Big N audit firms
We examine whether the difference in audit fees, adjusted for client size, charged by Big
N and non–Big N audit firms changes with successive cohorts.
4.6.1. Univariate tests
We first examine the differences in cohort trends in audit fees of companies audited by Big
N and non–Big N audit firms, similar to H3 tests. We separately estimate the cohort trends by the
two categories of audit clients and examine their differences. Panels A and B of Table 6 show no
significant differences in trends of fees of Big N and non–Big N clients, either using LogAuditFees
or size-adjusted audited fees (AuditFee_SqrtAssets). The only significant (positive) trend is in size-
adjusted audited fees for non–Big N clients. The higher risks that smaller audit firms take with
successive cohorts or the higher audit efforts required for firms with greater accounting estimates
potentially explain this result (Hogan and Wilkins 2008).

35
[Insert Table 6 near here]
4.6.2. Multivariate tests
We next examine whether the premiums that Big N firms obtain relative to non–Big N
firms changes with successive cohorts after controlling for companies’ innate characteristics. We
estimate the regression
AuditFee_SqrtAssetsi,t = α +β1× Cohort_Dummyi,t + β2× BigNi,t
+ β3× Cohort_Dummyi,t × BigNi,t + β4× IndustrySpecializationi,t
+ β5× Cohort_Dummyi,t × IndustrySpecializationi,t
+ ∑ βs× Controlsi,t + εi,t. (6)
The trend in the premium charged by high-quality audit firms from successive cohorts is
captured by the interaction terms (β3). Panel C of Table 6 shows that β2 is significant and positive
and that β3 is negative and significant. These results are consistent with the idea that Big N audit
firms charge premium fees, on average, but this premium declines with successive cohorts.
Because client size–adjusted fees do not increase with successive cohorts, declining premium
likely arises from increases in fees for non–Big N auditors.
Furthermore, these results, along with the results presented in Table 3, are consistent with
increases in client-auditor selectivity. The audit fee differential between the two types of clients
(that is, the Big N fee premium) narrows with each new cohort, which is opposite to the widening
differential of the financial reporting qualities. If this trend emerged because high-quality audit
firms brought greater improvement to financial reporting quality, then the Big N premium would
have increased, not declined. Results are also consistent with the idea that non–Big N firms are
increasingly saddled with high-risk or low-quality clients, and they charge higher fees with
successive cohorts to compensate for higher risks.

36
4.7. Selectivity hypothesis and the increasing role of smaller audit firms
Panel A of Table 4 shows that the numerical market share of non–Big N firms increases
from 10.6% for the pre-1970s cohort to 32.3% for the 2000s cohort. Panel D of Table 6 reports
that their share of total audit fees in a cohort increases sevenfold, from 1.2% to 8.7%. While Big
N firms continue to command the predominant share of total audit fees, non–Big N firms appear
to play an increasing role in the audit industry with the arrival of each new cohort. Because new-
lists appear to persist with non–Big N auditors, the non–Big N firms are likely to play an even
greater role in public accounting as newer cohorts gain prominence in the set of listed firms. This
trend is consistent with the regulators’ favored view of expanding the audit industry to a larger
number of players. However, the trend appears to be more a result of the changing landscape of
public companies than an outcome of regulatory intervention.
4.8. Assessing the importance of second-tier auditors
The increase in economic importance of non–Big N firms could principally be due to a
shift in client base from Big N firms to the second-tier auditors (Hogan and Martin 2009). We
conduct additional tests, described in Subsections 4.4 and 4.5, by dividing audit firms into three
categories: Big N, second-tier, and small firms. Panel A of Table 7 shows that the numerical market
share of Big N (small) firms declines (increases) with successive cohorts. However, no significant
trend emerges in the market share of second-tier firms. Furthermore, the difference between the
audit qualities of clients of second-tier and small firms increases, but the difference between their
audit fees declines, with successive cohorts. These results suggest that even second-tier firms are
increasingly more selective in client acceptance than are smaller firms. More important, these
results remain consistent with the idea that smaller audit firms are increasingly making inroads
into the market of firms with higher risks and innately lower financial reporting qualities.

37
5. Conclusion
We examine how the competitive structure of the assurance business is likely to evolve if
the current trend of the changing nature of publicly traded corporations continues. We rely on
methods suggested in Fama and French (2004), Brown and Kapadia (2007), and Srivastava
(2014a), which show that the trend in the average characteristics of listed companies can be
ascertained from the patterns in characteristics of successive cohorts of listed firms. This is because
newer cohorts replace older cohorts in the set of listed companies over time and because the
characteristics of successive cohorts are monotonic, distinct, and persistent.
We find that successive cohorts show differences in innate characteristics that could
increase the managerial judgment and forward-looking estimates required in financial reporting.
We find increases in magnitude of performance-matched discretionary accruals, a summary
measure of managers’ judgment in financial reporting, and the frequency with which this measure
exceeds a materiality threshold. Because accounting estimates are based on fewer and fewer
predictable future outcomes, we find a decline in the extent to which financial numbers correspond
with economic outcomes. As a result, the quality of financial reports decreases with the arrival of
each new cohort of public companies. Additional tests show that life-cycle effects or survivorship
biases cannot explain these patterns. Instead, the differences in financial reporting qualities of
successive cohorts are innate and persistent.
These trends should increase an average public company’s audit risk and likelihood of
material error in financial reports, lowering the number that potentially meet Big N’s selection
criteria of high-quality clients. We find that the numerical and audit fee market share of Big N
(non–Big N) audit firms declines (increases) with the arrival of each new cohort of listed firms.
Also, an increasing number of smaller audit firms service the growing market of riskier, newer

38
public companies. As a result, the difference between the financial reporting qualities of Big N
and non–Big N clients (that is, the relatively superior financial reporting quality associated with
Big N firms) increases, but the audit fee premium charged by Big N firms narrows.
Prior studies suggest that the trend of increases in average company risks will continue in
the near future because of monotonic and persistent differences in the characteristics of successive
listing cohorts. Based on this trend, we predict a decline in Big N firms’ market share, unless they
change their risk tolerance and client-selection criteria to keep pace with the changing landscape
of public companies. We further predict an increase in the client size–adjusted audit fees because
of increases in audit fees of clients of smaller firms.

39
References
Acs, Z., and D. B. Audretsch. 1988. Innovation in large and small firms: An empirical analysis.
American Economic Review 78(4): 678–690.
Advisory Committee on the Auditing Profession, Department of the Treasury (TACAP). 2008.
Final Report of the Advisory Committee on the Auditing Profession to the U.S. Department of
the Treasury. Available at http://www.treasury.gov/about/organizational-
structure/offices/Documents/final-report.pdf.
American Institute of Certified Public Accountants (AICPA). 1988. The Auditor’s Consideration
of an Entity’s Ability to Continue as a Going Concern. Statement on Auditing Standard No.
59. AICPA, New York, NY.
Anthony, J., and K. Ramesh. 1992. Association between accounting performance measures and
stock prices: A test of the life-cycle hypothesis. Journal of Accounting and Economics 15(2–
3): 203–227.
Antle, R., and B. Nalebuff. 1991. Conservatism and auditor-client negotiations. Journal of
Accounting Research 29: 31–54.
Apte, U. M., U. S. Karmarkar, and H. K. Nath. 2008. Information services in the U.S. economy:
Value, jobs, and management implications. California Management Review 50: 12–30.
Ball, R., S. Jayaraman, and S. Shivakumar. 2012. Audited financial reporting and voluntary
disclosure as complements: A test of the confirmation hypothesis. Journal of Accounting and
Economics 53: 136–166.
Balvers, R. J., B. McDonald, and R. E. Miller. 1988. Underpricing of new issues and the choice of
auditor as a signal of investment banker reputation. The Accounting Review 63(4): 605–622.
Banker, R. D., R. Huang, and R. Natarajan. 2011. Equity incentives and long-term value created
by SG&A expenditure. Contemporary Accounting Research 28: 794–830.
Barth, M. 2006. Including estimates of the future in today’s financial statements. Accounting
Horizons 20(3): 271–285.
Baumol, W. J., and C. J. Schramm. 2010. Foreword, in Handbook of Service Science: Research
and Innovations in the Service Economy. Springer, New York, NY, ix–xi.
Beatty, R. 1989. Auditor reputation and the pricing of initial public offerings. The Accounting
Review 64: 693–709.
Brickley, J. and J. Zimmerman. 2010. Corporate governance myths: Comments on Armstrong,
Guay, and Weber. Journal of Accounting and Economics 50: 235–245.
Brown, G., and N. Kapadia. 2007. Firm-specific risk and equity market development. Journal of
Financial Economics 84: 358–388.
Byrnes, N. 2005. The little guys doing large audits. BusinessWeek (August 22/29): 39.
Christensen, C. M. 1997. The Innovator's Dilemma: When New Technologies Cause Great Firms
to Fail. Harvard Business School Press. Boston, MA.
Cox, C. 2005. Speech by SEC Chairman: Remarks before the 2005 AICPA National Conference
on Current SEC and PCAOB Developments. Available at
http://www.sec.gov/news/speech/spch120505cc.htm.
Datar, S., G. Feltham, and J. Hughes. 1991. The role of audits and audit quality in valuing new
issues. Journal of Accounting and Economics 14(1): 3–49.
DeAngelo, L. E. 1981a. Auditor independence, “low balling,” and disclosure regulation. Journal
of Accounting and Economics 3(2): 113–127.
DeAngelo, L. E. 1981b. Auditor size and audit quality. Journal of Accounting and Economics 3(3):
183–199.

40
Dechow, P., W. Ge, and C. Schrand. 2010. Understanding earnings quality: A review of the
proxies, their determinants, and their consequences. Journal of Accounting and Economics
50(2–3): 344–401.
Dechow, P. M., and I. Dichev. 2002. The quality of accruals and earnings: The role of accrual
estimation errors. The Accounting Review 77: 35–59.
DeFond, M., and C. S. Lennox. 2011. The effect of SOX on small auditor exits and audit quality.
Journal of Accounting and Economics 52: 21–40.
DeFond, M., and J. Zhang. 2014. A review of archival auditing research. Journal of Accounting
and Economics 58: 275–326.
Dichev, I., and V. Tang. 2008. Matching and the changing properties of accounting earnings over
last 40 years. The Accounting Review 83: 1425–1460.
Donelson, D. C., R. Jennings, and J. McInnis. 2011. Changes over time in the revenue-expense
relation: Accounting or economics. The Accounting Review 86: 945–974.
Donovan, J., R. M. Frankel, J. A. Lee, A. Joshua, X. Martin, and H. Seo. 2014. Issues raised by
studying DeFond and Zhang: What should audit researchers do? Forthcoming Journal of
Accounting and Economics.
Dopuch, N., and D. Simunic, D. 1982. Competition in auditing: An assessment, in Symposium on
Auditing Research IV. University of Illinois, Urbana, IL, 401–450.
Dwyer, P. 2003. The Big Four: Too few to fail. BusinessWeek, August 31.
Dye, R. A. 1991. Informationally motivated auditor replacement. Journal of Accounting and
Economics 14(4): 347–374.
Dye, R. A. 1993. Auditing standards, legal liability, and auditor wealth. Journal of Political
Economy 101: 887–914.
Efendi, J., A. Srivastava, and E. P. Swanson. 2007. Why do corporate managers misstate financial
statements? The role of option compensation and other factors. Journal of Financial
Economics 85(3): 667–708.
Eisfeldt, A. L., and D. Papanikolaou. 2013. Organization capital and the cross section of expected
returns. The Journal of Finance 68: 1365–1406.
European Commission. 2010. Audit policy: Lessons from the crisis. Green paper. Brussels,
October 13.
Fama, E. F., and K. R. French. 2004. New-lists: Fundamentals and survival rates. Journal of
Financial Economics 73: 229–269.
Fields, T., T. Lys, and L. Vincent. 2001. Empirical research on accounting choice. Journal of
Accounting and Economics 31: 255–307.
Fisher, R. W. 2003. Foreword, in The Future of the Accounting Profession. Columbia University,
The American Assembly, New York, NY, 1. Available at
http://csis.org/images/stories/hills/080515_hills_%20future_of_accounting.pdf.
Francis, J., R. Lafond, P. Olsson, and K. Schipper. 2005. The market pricing of accruals quality.
Journal of Accounting and Economics 39, 295–327.
Francis, J. R ., and M. Yu. 2009. The effect of Big 4 office size on audit quality. The Accounting
Review 84: 1521–1552.
Gerakos, J., and C. Syverson. 2015. Competition in the audit market: Policy implications. Working
paper, University of Chicago.
Ghosh, A. and S. Lustgarten. 2006. Pricing of initial audit engagements by large and small audit
Firms. Contemporary Accounting Research 23(2): 333–368.
Gjesdal, F. 1981. Accounting for stewardship. Journal of Accounting Research (Spring): 208-231.

41
Government Accountability Office (GAO). 2003. Public Accounting Firms: Mandated Study on
Consolidation and Competition. U.S. Government Printing Office, Washington, DC.
Government Accountability Office (GAO). 2008. Audits of Public Companies: Continued
Concentration in Audit Market for Large Public Companies Does Not Call for Immediate
Action. U.S. Government Printing Office, Washington, DC.
Hambrick, D.C. 1983. High profit strategies in mature capital goods industries: A contingency
approach. Academy of Management Journal 26 (4): 687–707.
Hanson, J. 2014. An Overview of PCAOB Priorities. Speech delivered at the Tenth Annual
Pharma/Biotech Accounting and Reporting Congress.
Healy, P. M., and J. M. Wahlen. 1999. A review of the earnings management literature and its
implications for standard setting. Accounting Horizons (December): 365–383.
Hogan, C. E., and R. D. Martin. 2009. Risk shifts in the market for audits: An examination of
changes in risk for “second-tier” audit firms. Auditing: A Journal of Practice and Theory 28
(November): 93–118.
Hogan, C. E., and M. S Wilkins. 2008. Evidence on the audit risk model: Do auditors increase
audit fees in the presence of internal control deficiencies? Contemporary Accounting Research
25(1): 219–242.
Hribar, P., and C. Nichols. 2007. The use of unsigned earnings quality measures in tests of earnings
management. Journal of Accounting Research 45: 1017–1053.
Hribar, P, T. Kravet, and R. J. Wilson. 2014. A new measure of accounting quality. Review of
Accounting Studies 19(1): 506–538.
Igami, M. 2015. Estimating the innovator’s dilemma: Structural analysis of creative destruction in
the hard disk drive industry. Working paper, Yale University.
Ijiri, Y. 1975. The Theory of Accounting Measurement. American Accounting Association,
Sarasota, FL.
Ireland, C. J., and C. S. Lennox. 2002. The large audit firm fee premium: A case of selectivity
bias? Journal of Accounting, Auditing, and Finance 17(1): 73–91.
Johnstone, K. M., and J. C. Bedard. 2003. Risk management in client acceptance decisions. The
Accounting Review 78(4): 1003–1025.
Johnstone, K. M., and J. C. Bedard. 2004. Audit firm portfolio management decisions. Journal of
Accounting Research 42(4): 659–690.
Johnson, W. B., and T. Lys. 1990. The market for audit services: Evidence from voluntary auditor
changes. Journal of Accounting and Economics 12 (January): 281–308.
Jones, J. 1991. Earnings management during import relief investigations. Journal of Accounting
Research 29: 193–228.
Jones, M. V. 1999. The internationalization of small high-technology firms. Journal of
International Marketing 7(4): 15–41.
Jovanovic, B., and G. MacDonald. 1994. The life cycle of a competitive industry. Journal of
Political Economy 102(2): 322-347.
Kaplan, S. E., and D. D. Williams. 2013. Do going-concern audit reports protect auditors from
litigation? A simultaneous equations approach. The Accounting Review 88: 199–232.
Kim, I., and D. J. Skinner. 2012. Measuring securities litigation risk. Journal of Accounting and
Economics 53(1–2): 290–310.
Knechel, W. R., A. Vansraelen, and M. Zerni. 2013. Does the identity of engagement partners
matters? An analysis of audit partner reporting decisions. Working paper, University of
Florida, Maastricht University, and University of Vaasa.

42
Kothari, S., T. Laguerre, and A. Leone. 2002. Capitalization versus expensing: Evidence on the
uncertainty of future earnings from capital expenditures versus R&D outlays. Review of
Accounting Studies 7: 355–382.
Kothari, S. P., A. J. Leone, and C. E. Wasley. 2005. Performance-matched discretionary accrual
measures. Journal of Accounting and Economics 39(1): 163–197.
Krishnan, J., and J. Krishnan. 1997. Litigation risk and auditor resignations. The Accounting
Review 72 (October): 539–560.
Kwon, S. S., J. Yin, and J. Han. 2006. The effect of differential accounting conservatism on the
“over-valuation” of high-tech firms relative to low-tech firms over aggressive accounting for
high-tech firms in comparison to low-tech firms. Review of Quantitative Finance and
Accounting 27(2): 143–173.
Landsman, W. R., K. K. Nelson, and B. R. Rountree. 2009. Auditor switches in the pre- and post-
Enron eras: Risk or realignment? The Accounting Review 84(2): 531–558.
Lawrence, A., M. Minutti-Meza, and P. Zhang. 2011. Can Big 4 versus non–Big 4 differences in
audit-quality proxies be attributed to client characteristics? The Accounting Review 86(1): 259–
286.
Lennox, C. S., X. Wu, and T. Zhang. 2014. Does mandatory rotation of audit partners improve
audit quality? The Accounting Review 89: 1775–1803.
Lev, B. and T. Sougiannis. 1996, The capitalization, amortization, and value relevance of R&D.
Journal of Accounting and Economics 21: 107-138.
Loughran, T., and J. Ritter. 2004. Why has IPO underpricing changed over time? Financial
Management 5–37.
Lowry, M., and G. W. Schwert. 2002. IPO market cycles: Bubbles or sequential learning? Journal
of Finance 57: 1171–1200.
Lys, T., and R. Watts. 1994. Lawsuits against auditors. Journal of Accounting Research 32
(Supplement): 65–93.
Magee, R. P., and M.-C. Tseng. 1990. Audit pricing and independence. The Accounting Review
65: 315–336.
McNichols, M. 2002. Discussion of the quality of accruals and earnings: The role of accrual
estimation errors. The Accounting Review 77(s-1): 61–69.
Michaely, R., and W. H. Shaw. 1995. Does the choice of auditor convey quality in an initial public
offering? Financial Management 24: 15–30.
Pástor, L., and P. Veronesi. 2003. Stock valuation and learning about profitability. Journal of
Finance 58: 1749–1789.
Payne, A., and P. Frow. 2005. A strategic framework for customer relationship management.
Journal of Marketing 69(4): 167–176.
Penno, M. 1990. Accounting systems, participation in budgeting, and performance evaluation. The
Accounting Review 65(2): 303–314.
Penno, M., and J. S. Watts. 1991. An independent auditor’s ex post criteria for the disclosure of
information. Journal of Accounting Research 29: 194–212.
Porter, M. E. 1980. Competitive Strategy: Techniques for Analyzing Industries and Competitors.
New York: Free Press.
Prahalad, C.K., and G. Hamel. 1990. The core competence of the corporation. Harvard Business
Review 68 (3): 79–91.
Prakash, R., and N. Sinha. 2013. Deferred revenues and the matching of revenues and expenses.
Contemporary Accounting Research 30(2): 517–548.

43
Reichelt, K., and D. Wang. 2010. National and office-specific measures of auditor industry
expertise and effects on audit quality. Journal of Accounting Research 48: 647–686.
Rialp, A., J. Rialp, and G. Knight. 2005. The phenomenon of early internationalizing firms: What
do we know after a decade (1993–2003) of scientific inquiry? International Business Review
14(2): 147–166.
Romer, P. 1998. Bank of America roundtable on the soft revolution: Achieving growth by
managing intangibles. Journal of Applied Corporate Finance 11: 8–27.
Schipper, K. 1999. Have financial statements lost their relevance? Journal of Accounting Research
37(2): 319–352.
Shapiro, C., and H. Varian. 1998. Information Rules: A Strategic Guide to the Network Economy.
Harvard Business Review Press, Cambridge, MA.
Simunic, D. (1980). The pricing of audit services: Theory and evidence. Journal of Accounting
Research (Spring):161–190.
Simunic, D. 1984. Auditing, consulting, and auditor independence. Journal of Accounting
Research 22:679–702.
Sirois, L.-P., and D. A. Simunic. 2011. Auditor size and audit quality revisited: The importance of
audit technology. Working paper, University of British Columbia.
Sood, A., and G. J. Tellis. 2005. Technological evolution and radical innovation. Journal of
Marketing 69 (July): 152–168.
Srivastava, A. 2014a. Why have measures of earnings quality changed over time? Journal of
Accounting and Economics (2–3): 196–217.
Srivastava, A. 2014b. Selling-price estimates in revenue recognition and earnings informativeness.
Review of Accounting Studies 19: 661–697.
Stinchcombe, A. L. 1965. Social Structure and Organizations. In March, J. G. Handbook of
Organizations 7. Chicago: Rand McNally & Co.,142–193.
Subramanyam, K. R. 1996. The pricing of discretionary accruals. Journal of Accounting and
Economics 22(1–3): 249–281.
Thoman, L. 1996. Legal damages and auditor efforts. Contemporary Accounting Research 13(1):
275–306.
Thurm, S. 2015. John Chambers on digital disruptions ahead. The Wall Street Journal. February
9.
Titman, S., and B. Trueman. 1986. Information quality and the valuation of new issues. Journal
of Accounting and Economics 8(2): 159–172.
Watts, R., and J. Zimmerman. 1981. Auditors and the determination of accounting standards.
Working paper, University of Rochester.
Weber, J., and M. Willenborg. 2003. Do expert informational intermediaries add value? Evidence
from auditors in microcap IPOs. Journal of Accounting Research 41(4): 681–720.
Webster, E. 1999. The Economics of Intangible Investment. Edward Elgar Publishing Limited,
Cheltenham, UK.
Willenborg, M. 1999. Empirical analysis of the economic demand for auditing in the initial public
offerings market. Journal of Accounting Research (Spring): 225–238.
Yip, G.S. 2004. Using strategy to change your business model. Business Strategy Review 15(2):17-
24.
Zhang, C. 2010. A reexamination of the causes of time-varying stock return volatilities. Journal
of Financial and Quantitative Analysis 45(3), 663–684.

44
Zimmerman, J. L. 2015. The role of accounting in the 21st century firm. Working paper,.
University of Rochester.
Zingales, L. 2000. In search of new foundations. Journal of Finance 55(4): 1623–1653.

45
Appendix
Definitions of variables
The company population consists of all nonfinancial companies that in a sample formation year have asset data for
the previous four years, along with earnings and revenue data for the current year, the previous three years, and the
next year (from Compustat). All observations should have data on audit fees in Audit Analytics. Further, at least ten
observations are needed in each industry-year to estimate discretionary accruals and Dechow and Dichev (2002)
regressions. The corresponding data items in the Compustat annual database are listed in capital letters.
__________________________________________________________________________________________
Variable Definition
Total Assets AT
LogAssets Natural logarithm of client Total Assets
Revenues SALE, scaled by average Total Assets for the year
Earnings IB, scaled by average Total Assets for the year
Total Expenses (SALE – IB)
COGS Intensity Cost of Goods Sold (COGS) / Total Expenses
R&D Intensity Research and Development Expenditures (XRD) / Total Expenses
SpecialItems −1 × Special Items (SPI), scaled by average Total Assets for the
year
Accruals [Change in Current Assets (ACT) – Change in Cash (CHE) –
Change in Current Liabilities (LCT) + Change in Debt in Current
Liabilities (DLC) – Depreciation and Amortization (DP)], scaled by
beginning Total Assets
Cash Flow from Operations (CFO) Cash flow from operations excluding extraordinary items (OANCF
− XIDOC), scaled by beginning Total Assets; balance sheet method
of calculating cash flows used for tests in Table 2, Panel D
DeferredRevenueToSalesRatio Ratio of deferred revenue (DRC and DRLT) to revenues
LargeAcquisition Dummy variable that take a value of one when the contribution
from acquired assets (AQS) exceeds 20% of revenues for that year
Stock-Based Compensation Expense Ratio of stock-based compensation expenses (STKCO) to total
expense
AbsPerMatchedDiscAccrual Absolute values of performance-matched discretionary accruals
(Kothari et al. 2005); accruals are measured using the balance sheet
approach
AbsResidualsDD Absolute value of residuals from a regression of total current
accruals on past, current, and future cash flows on an industry-year
basis (Dechow and Dichev 2002) augmented with gross property,
plant, and equipment and sale change, both deflated by average total
assets (McNichols 2002; Francis et al. 2005); accruals are measured
using the balance sheet approach
Uncertainty of Firm Performance Standard deviations of CFO and revenue growth for each company-
year using four rolling annual observations (t−3 through t)
Standard Deviation of Stock Returns Standard deviation of the daily stock returns of the company,
computed over the fiscal year
High-Tech Industry Indicator variable equal to one when the company is in a high-tech
industry [three-digit standard industrial classification (SIC) code
equal to 272, 283, 355, 357, 360, 361, 362, 363, 364, 365, 366, 367,
369, 381, 382, 386, 481, 484, 489, 573, 596, 621, 679, 733, 737,
738, or 873]
High-Litigation Industry Indicator variable equal to one when the company is a high-
litigation industry (SIC code between 2833 and 2836, 8731 and
8734, 3570 and 3577, 7370 and 7374, 3600 and 3674, or 5200 and
5961)

46
Appendix A continued
Definitions of variables
Going-Concern Opinion Uncertainty regarding the going-concern assumption issued by
audit firms (Audit Analytics variable GOING_CONCERN)
Conservative Going-Concern
Opinion or Type 1 Errors
Going-concern opinions not associated with bankruptcy next year;
bankruptcy companies are identified from the Securities Data
Company database and the UCLA-LoPucki Bankruptcy Research
Database
Erroneous Clean Opinions Issue of clean opinion followed by bankruptcy
Materiality10%, Materialty20% When AbsPerMatchedDiscAccrual exceeds 0.10 and 0.20,
respectively; represents years in which the aggregate managerial
judgment in financial reporting exceeds a materiality threshold
LogAuditFees Log of audit fees from Audit Analytics
Auditor attributes
H-Index Herfindahl index measures as
𝐻– 𝐼𝑛𝑑𝑒𝑥𝑗,𝑦 = ∑𝐴𝑢𝑑𝑖𝑡𝐹𝑒𝑒𝑠𝑆ℎ𝑎𝑟𝑒𝑖,𝑗,𝑦2 , where AuditFeesShareijy
is the revenue share of auditor i in industry j (two-digit SIC code)
in year y; higher H-Index indicates lower competition
BigN Dummy variable that takes a value of one for Big N firms and zero
otherwise; Ernst & Young, KPMG, Deloitte & Touche, PwC, and
Arthur Andersen are Big N firms
Tier2 Dummy variable that takes a value of one for second-tier firms and
zero otherwise; BDO, Grant Thornton, Crowe Horwath, and
McGladrey are second-tier firms AuditorStickiness Dummy variable that takes a value of one if the company persists
with the same auditor as the previous year and zero otherwise
AuditorTypeStickiness Dummy variable that takes a value of one if the company persists
with the same type of auditor (a Big N auditor or a non–Big N
auditor) and zero otherwise
AuditorDowngrade Dummy variable that takes a value of one if the company changes
from a Big N auditor to a non–Big N auditor and zero otherwise
AuditorUpgrade Dummy variable that takes a value of one if the company changes
from a non–Big N auditor to a Big N auditor and zero otherwise
Company category
Listing year First year in which the company has valid data in Compustat
Pre-1970s Companies whose listing year is before 1970
New-lists Companies that are not pre-1970s
Listing cohorts All of the cohorts listed in a common decade are referred to as a
cohort of new companies; thus, all of the companies are divided
into the pre-1970s cohort or a cohort from the 1970s, 1980s, 1990s,
or 2000s
Cohort_Dummy Values of 0, 1, 2, 3, and 4 are assigned to the pre-1970s cohort and
the companies listed in the decades of the 1970s, 1980s, 1990s,
and 2000s, respectively
Notes:
All variables are winsorized at the 1st and 99th percentiles.
An attribute for a cohort is first calculated on a company-year basis and then averaged across all of the cross-
sectional observations in that cohort.

47
Table 1
Trends in characteristics of successive cohorts of listed companies that affect the amount and the reliability of
forward-looking estimates
The first year in which a firm’s data are available in Compustat is the listing year. All companies with a listing year
after 2009 are excluded (Srivastava 2014b). The remaining companies are divided into five listing cohorts. All
companies with a listing year before 1970 are classified as pre-1970s. The remaining companies are classified as new-
lists. All companies listed in a common decade make up a cohort of new-lists. Consequently, all of the companies are
divided into the pre-1970s cohort or a cohort from the 1970s, 1980s, 1990s, or 2000s. These five cohorts are assigned
Cohort_Dummy of 0, 1, 2, 3, and 4, respectively. All variables are defined in the Appendix. The average characteristics
of each cohort are calculated using pooled data from 2001 to 2012. The cohort trend is calculated using the following
equation and five observations of five average cohort characteristics: AverageCharacteristicCohort = β1 + β2 ×
Cohort_Dummy +ε. β2 represents the trend in average firm characteristics across successive cohorts.
Panel A: Cost and industry characteristics
Number of company-
year observations
R&D Intensity
COGS
Intensity
High-tech
industries
Difference between pre-1970s and new-lists
Pre-1970s 6,973 0.017 0.720 0.174
New-lists 42,458 0.078 0.573 0.451
Difference 0.061 –0.147 0.277
p-value <0.001 <0.001 <0.001
Trend in characteristics of successive cohorts of listed companies
Pre-1970s 6,973 0.017 0.720 17.4%
1970s cohort 3,597 0.025 0.649 33.1%
1980s cohort 8,385 0.061 0.591 41.6%
1990s cohort 22,619 0.095 0.558 49.9%
2000s cohort 7,857 0.071 0.563 40.3%
Cohort trend (β2) 0.018 –0.040 0.063
t-statistic 2.978 –4.605 2.403

48
Table 1 continued
Trends in characteristics of successive cohorts of listed companies that affect the amount and the reliability of
forward-looking estimates
Panel B: Characteristics that affect the amount of forward-looking estimates required in financial reporting
Special
items
Large
acquisition
Deferred
revenue-to-
revenue ratio
Option
expense-to-
total expense
ratio
Difference between pre-1970s and new-lists
Pre-1970s 0.011 0.019 0.010 0.004
New-lists 0.024 0.036 0.062 0.021
Difference 0.013 0.017 0.051 0.017
p-value <0.001 <0.001 <0.001 <0.001
Trend in characteristics of successive cohorts of listed companies
Pre-1970s 0.011 0.019 0.010 0.004
1970s cohort 0.007 0.028 0.019 0.007
1980s cohort 0.019 0.033 0.049 0.015
1990s cohort 0.028 0.038 0.068 0.019
2000s cohort 0.025 0.037 0.076 0.036
Cohort trend (β2) 0.005 0.005 0.018 0.008
t-statistic 2.959 4.614 8.507 6.058
Panel C: Measure of managers’ estimates in financial reporting
AbsPerMatchedDiscAccrual
Value Materiality10% Materiality20%
Difference between pre-1970s and new-lists
Pre-1970s 0.037 6.5% 1.0%
New-lists 0.084 21.8% 8.7%
Difference 0.046 15.3% 7.6%
p-value <0.001 <0.001 <0.001
Trend in characteristics of successive cohorts of listed companies
Pre-1970s 0.037 6.5% 1.0%
1970s cohort 0.067 16.9% 6.2%
1980s cohort 0.077 20.2% 7.3%
1990s cohort 0.083 21.5% 8.3%
2000s cohort 0.101 26.2% 12.1%
Cohort trend (β2) 0.014 0.044 0.024
t-statistic 6.081 4.940 5.740

49
Table 1 continued
Trends in characteristics of successive cohorts of listed companies that affect the amount and the reliability of forward-looking estimates
Panel D: Characteristics that affect the reliability of forward-looking estimates
Standard
deviation of
deflated cash
flows
Standard
deviation of
stock returns
Standard
deviation of
sales growth
Size (Log assets)
High-
litigation
industries
Difference between pre-1970s and new-lists
Pre-1970s 0.038 0.025 0.184 7.709 15.4%
New-lists 0.223 0.039 2.932 5.294 38.3%
Difference 0.185 0.014 2.749 –2.414 0.229
p-value <0.001 <0.001 <0.001 <0.001 <0.001
Trend in characteristics of successive cohorts of listed companies
Pre-1970s 0.038 0.025 0.184 7.709 15.4%
1970s cohort 0.081 0.031 0.392 5.608 24.9%
1980s cohort 0.163 0.036 1.096 5.317 33.8%
1990s cohort 0.263 0.040 3.189 5.276 43.2%
2000s cohort 0.240 0.040 5.390 5.178 35.0%
Cohort trend (β2) 0.059 0.004 1.321 –0.539 0.057
t-statistic 5.247 5.336 4.939 –2.290 2.857

50
Table 2
Trends in measures of audit and financial reporting quality of successive cohorts of listed companies
The first year in which a firm’s data are available in Compustat is the listing year. All companies with a listing year
after 2009 are excluded (Srivastava 2014b). The remaining companies are divided into five listing cohorts. All
companies with a listing year before 1970 are classified as pre-1970s. The remaining companies are classified as new-
lists. All companies listed in a common decade make up a cohort of new-lists. Consequently, all of the companies are
divided into the pre-1970s cohort or a cohort from the 1970s, 1980s, 1990s, or 2000s. These five cohorts are assigned
Cohort_Dummy of 0, 1, 2, 3, and 4, respectively. The numbers of observations in each cohort-year are described in
Table 1. All variables are defined in the Appendix. For Panels A–C, the average characteristics of each cohort are
calculated using pooled data from 2001 to 2012. For Panel D, we use all available data in Compustat. The cohort trend
is calculated using the following equation and five observations of five average cohort characteristics:
AverageCharacteristicCohort = β1 + β2 × Cohort_Dummy +ε. β2 represents the trend in average characteristics across
successive cohorts. For Panel B and C, we examine the association between financial reporting quality and innate
characteristics using the regression InverseMeasureOfQualityi,t = α + β1 × Cohort_Dummy i,t + ∑ βs× Controli,t + εi,t..
Standard errors are clustered by industry (Fama and French industry classification) and year.
Panel A: Univariate trends in measures of audit and financial reporting quality
AbsResidualsDD
Going-concern
opinion
Erroneous clean
opinion
Conservative going-
concern opinion
Difference between pre-1970s and new-lists
Pre-1970s 0.027 0.016 0.001 0.014
New-lists 0.060 0.090 0.001 0.088
Difference 0.033 0.074 –0.000 0.074
p-value <0.001 <0.001 0.267 <0.001
Trend in characteristics of successive cohorts of listed companies
Pre-1970s 0.027 1.59% 0.13% 1.45%
1970s cohort 0.046 4.92% 0.00% 4.81%
1980s cohort 0.056 7.59% 0.07% 7.43%
1990s cohort 0.060 8.75% 0.09% 8.60%
2000s cohort 0.071 12.91% 0.09% 12.73%
Cohort trend (β2) 0.010 0.026 0.000 0.026
t-statistic 7.168 11.003 0.049 10.896

51
Table 2 continued
Trends in measures of audit and financial reporting quality of successive cohorts of listed companies
Panel B: InverseMeasureOfQualityi,t = α +β1 × Cohort_Dummyi,t + ε i,t
AbsResidualsDD
ConservativeGoingConcernOpinion
Independent variable Estimate t-statistic Estimate t-statistic
Intercept 0.031 13.037 0.016 3.877
Cohort_Dummy 0.010 6.571 0.025 10.254
N 49,431 49,431
F-value 1026 703
Probability <0.001 <0.001
Adjusted R-squared 2.03% 1.41%
Panel C: InverseMeasureOfQualityi,t = α +β1 × Cohort_Dummyi,t + ∑ βs × Controli,t + ε i,t
AbsResidualsDD ConservativeGoingConcernOpinion
Independent variable Estimate t-statistic Estimate t-statistic
Intercept 0.137 14.382 0.317 15.191
Cohort_Dummy 0.000 0.086 –0.006 –2.328
LogAssets –0.015 –9.550 –0.038 –11.164
COGS_Intensity –0.009 –2.110 –0.066 –3.670
R&D_Intensity 0.000 –0.144 –0.022 –1.466
DeferredRevenueToSalesRatio 0.042 4.782 –0.030 –1.351
LargeAcquisitions –0.006 –2.162 –0.017 –2.210
Loss 0.008 7.936 0.088 9.990
VolatilityCFO 0.001 2.999 0.001 2.290
N 49,431 49,431
F-value 1,741 1,762
Probability <0.001 <0.001
Adjusted R-squared 21.98% 22.18%

52
Table 2 continued
Trends in measures of audit and financial reporting quality of successive cohorts of listed companies
Panel D: Univariate trends in measures of audit and financial reporting quality, after controlling for life-cycle effect and survivorship bias
Listing year Ten years after listing year
AbsPerMatchedD
iscAccrual
Standard
deviation of
deflated cash
flows AbsResidualsDD
AbsPerMatchedDi
scAccrual
Standard
deviation of
deflated cash
flows
AbsResiduals
DD
Trend in characteristics of successive cohorts of listed companies
Pre-1970s 0.066 0.073 0.032 0.057 0.069 0.027
1970s cohort 0.086 0.095 0.051 0.082 0.105 0.052
1980s cohort 0.108 0.131 0.072 0.092 0.137 0.065
1990s cohort 0.107 0.176 0.074 0.092 0.303 0.069
2000s cohort 0.165 0.612 0.103 0.087 0.541 0.064
Cohort trend (β2) 0.027 0.116 0.027 0.027 0.114 0.027
t-statistic 4.626 2.465 8.539 1.981 4.233 2.648

53
Table 3
Differences in trends of financial reporting attributes of companies audited by Big N and non–Big N audit firms
The first year in which a firm’s data are available in Compustat is the listing year. All companies with a listing year after 2009 are excluded (Srivastava 2014a).
The remaining companies are divided into five listing cohorts. All companies with a listing year before 1970 are classified as pre-1970s. The remaining companies
are classified as new-lists. All companies listed in a common decade make up a cohort of new-lists. Consequently, all of the companies are divided into the pre-
1970s cohort or a cohort from the 1970s, 1980s, 1990s, or 2000s. These five cohorts are assigned Cohort_Dummy of 0, 1, 2, 3, and 4, respectively. Ernst & Young,
KPMG, Deloitte & Touche, PwC, and Arthur Andersen are the Big N firms. For Panels A–C, the cohort trend is calculated using the following equation and five
observations of five average cohort characteristics: AverageCharacteristicCohort = β1 + β2 × Cohort_Dummy +ε. β2 represents the trend in average characteristics
across successive cohorts. For Panel D, the trend of changes in association of auditor size and audit quality is examined using the regression
InverseMeasureOfQualityi,t = α +β1 × Cohort_Dummy i,t + β2 × BigNi,t + β3 × Cohort_Dummyi,t × BigNi,t + β4 × IndustrySpecializationi,t + β5 × Cohort_Dummyi,t
× IndustrySpecializationi,t + ∑ βs× Controli,t + εi,t.. Standard errors are clustered by industry (Fama and French industry classification) and year. All variables are
defined in the Appendix.
Panel A: Univariate trends in magnitude of accounting estimates of companies audited by Big N and non-Big N firms
Listing Cohorts
AbsPerMatchedDiscAccruals
Value Materiality20%
Companies
audited by Big
N firms
Companies
audited by
non–Big N
firms Difference
Companies
audited by
Big N firms
Companies
audited by
non–Big N
firms Difference
Pre-1970s 0.035 0.055 0.020 0.74% 3.26% 2.52%
1970s cohort 0.045 0.115 0.071 1.85% 15.44% 13.60%
1980s cohort 0.053 0.120 0.067 3.07% 14.81% 11.74%
1990s cohort 0.060 0.139 0.079 4.19% 18.89% 14.70%
2000s cohort 0.063 0.174 0.112 4.69% 26.08% 21.39%
Cohort trend (β2) 0.007 0.026 0.019 0.010 0.049 0.039
t-statistic 8.792 5.543 4.104 13.189 4.710 3.651

54
Table 3 continued
Differences in trends of financial reporting attributes of companies audited by Big N and non–Big N audit firms
Panel B: Univariate trends in uncertainty of future performance of companies audited by Big N and non–Big N firms
Listing Cohorts
Volatility of cash flows Volatility of sales growth
Companies
audited by Big
N firms
Companies
audited by
non–Big N
firms Difference
Companies
audited by
Big N firms
Companies
audited by
non–Big N
firms Difference
Pre-1970s 0.039 0.064 0.025 0.179 0.222 0.043
1970s cohort 0.052 0.637 0.585 0.196 0.806 0.610
1980s cohort 0.113 1.511 1.398 0.356 2.444 2.088
1990s cohort 0.173 1.841 1.668 1.231 8.253 7.022
2000s cohort 0.242 5.368 5.126 3.262 9.574 6.312
Cohort trend (β2) 0.053 1.181 1.128 0.720 2.615 1.895
t-statistic 8.727 3.619 3.496 3.016 5.291 4.138
Panel C: Univariate trends in audit and financial reporting qualities of companies audited by Big N and non–Big N firms
Listing Cohorts
AbsResidualsDD
ConservativeGoingConcernOpinion
Companies
audited by Big
N firms
Companies
audited by
non–Big N
firms Difference
Companies
audited by
Big N firms
Companies
audited by
non–Big N
firms Difference
Pre-1970s 0.026 0.037 0.012 1.28% 2.85% 1.57%
1970s cohort 0.031 0.076 0.045 1.11% 12.60% 11.49%
1980s cohort 0.040 0.085 0.044 2.27% 16.64% 14.37%
1990s cohort 0.046 0.096 0.050 3.35% 21.99% 18.64%
2000s cohort 0.045 0.120 0.075 3.20% 30.53% 27.33%
Cohort trend (β2) 0.005 0.019 0.013 0.006 0.065 0.059
t-statistic 5.297 6.474 4.142 4.113 12.250 8.704

55
Table 3 continued
Differences in trends of financial reporting attributes of companies audited by Big N and non–Big N audit firms
Panel D: Multivariate tests
InverseMeasureOfQuality measured by
AbsResidualsDD
ConservativeGoingConcernOpinion
Independent variable
Estimate t-statistic
Estimate t-statistic
Intercept 0.103 17.231 0.180 9.343
Cohort_Dummy 0.013 7.295 0.047 10.426
BigN 0.030 5.830 0.078 5.325
Cohort_Dummy × BigN –0.013 –6.502 –0.054 –9.078
IndustrySpecialization 0.031 3.938 0.150 7.327
Cohort_Dummy × IndustrySpecialization –0.008 –3.511 –0.023 –3.974
RelationshipLength 0.000 2.132 0.002 2.999
LogAssets –0.015 –8.819 –0.036 –10.137
COGS_Intensity –0.008 –2.102 –0.065 –3.896
R&D_Intensity 0.000 0.143 –0.016 –1.276
DeferredRevenueToSalesRatio 0.044 5.033 –0.021 –1.043
LargeAcquisitions –0.006 –2.117 –0.017 –2.135
Loss 0.008 7.358 0.085 10.432
VolatilityCFO 0.001 3.053 0.001 2.339
N 43,990 43,990
F-value 1,126 1217
Probability <0.001 <0.001
Adjusted R-squared 22.83% 24.24%
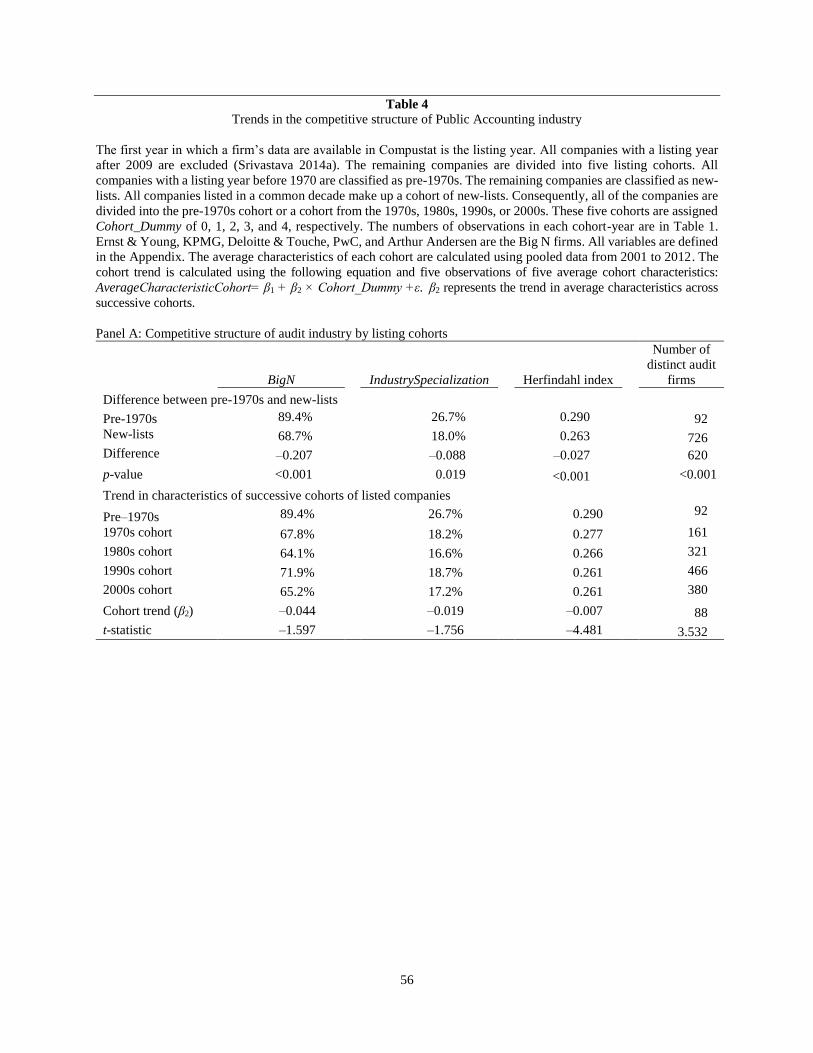
56
Table 4
Trends in the competitive structure of Public Accounting industry
The first year in which a firm’s data are available in Compustat is the listing year. All companies with a listing year
after 2009 are excluded (Srivastava 2014a). The remaining companies are divided into five listing cohorts. All
companies with a listing year before 1970 are classified as pre-1970s. The remaining companies are classified as new-
lists. All companies listed in a common decade make up a cohort of new-lists. Consequently, all of the companies are
divided into the pre-1970s cohort or a cohort from the 1970s, 1980s, 1990s, or 2000s. These five cohorts are assigned
Cohort_Dummy of 0, 1, 2, 3, and 4, respectively. The numbers of observations in each cohort-year are in Table 1.
Ernst & Young, KPMG, Deloitte & Touche, PwC, and Arthur Andersen are the Big N firms. All variables are defined
in the Appendix. The average characteristics of each cohort are calculated using pooled data from 2001 to 2012. The
cohort trend is calculated using the following equation and five observations of five average cohort characteristics:
AverageCharacteristicCohort= β1 + β2 × Cohort_Dummy +ε. β2 represents the trend in average characteristics across
successive cohorts.
Panel A: Competitive structure of audit industry by listing cohorts
BigN
IndustrySpecialization
Herfindahl index
Number of
distinct audit
firms
Difference between pre-1970s and new-lists
Pre-1970s 89.4% 26.7% 0.290 92
New-lists 68.7% 18.0% 0.263 726
Difference –0.207 –0.088 –0.027 620
p-value <0.001 0.019 <0.001 <0.001
Trend in characteristics of successive cohorts of listed companies
Pre–1970s 89.4% 26.7% 0.290 92
1970s cohort 67.8% 18.2% 0.277 161
1980s cohort 64.1% 16.6% 0.266 321
1990s cohort 71.9% 18.7% 0.261 466
2000s cohort 65.2% 17.2% 0.261 380
Cohort trend (β2) –0.044 –0.019 –0.007 88
t-statistic –1.597 –1.756 –4.481 3.532
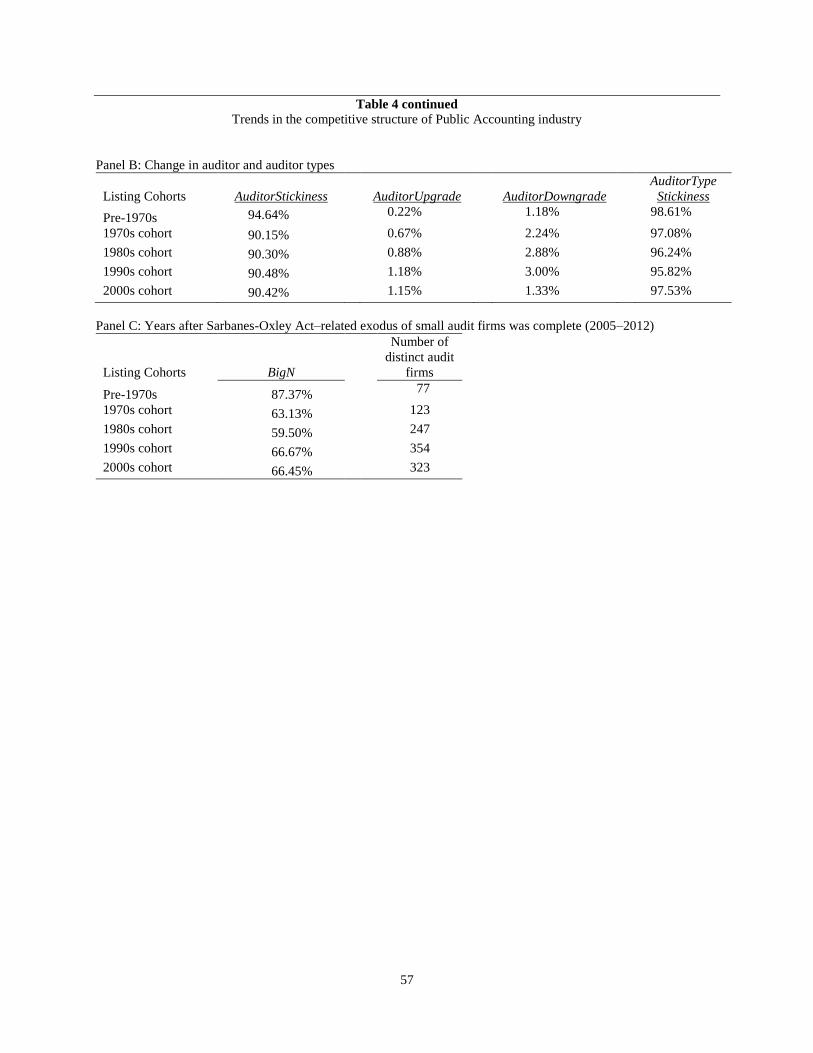
57
Table 4 continued
Trends in the competitive structure of Public Accounting industry
Panel B: Change in auditor and auditor types
Listing Cohorts AuditorStickiness AuditorUpgrade AuditorDowngrade
AuditorType
Stickiness
Pre-1970s 94.64% 0.22% 1.18% 98.61%
1970s cohort 90.15% 0.67% 2.24% 97.08%
1980s cohort 90.30% 0.88% 2.88% 96.24%
1990s cohort 90.48% 1.18% 3.00% 95.82%
2000s cohort 90.42% 1.15% 1.33% 97.53%
Panel C: Years after Sarbanes-Oxley Act–related exodus of small audit firms was complete (2005–2012)
Listing Cohorts BigN
Number of
distinct audit
firms
Pre-1970s 87.37% 77
1970s cohort 63.13% 123
1980s cohort 59.50% 247
1990s cohort 66.67% 354
2000s cohort 66.45% 323

58
Table 5
Trends in audit fees of successive cohorts of listed companies
The first year in which a firm’s data are available in Compustat is the listing year. All companies with a listing year
after 2009 are excluded (Srivastava 2014a). The remaining companies are divided into five listing cohorts. All
companies with a listing year before 1970 are classified as pre-1970s. The remaining companies are classified as new-
lists. All companies listed in a common decade make up a cohort of new-lists. Consequently, all of the companies are
divided into the pre-1970s cohort or a cohort from the 1970s, 1980s, 1990s, or 2000s. These five cohorts are assigned
Cohort_Dummy of 0, 1, 2, 3, and 4, respectively. The numbers of observations in each cohort-year are in Table 1. For
Panel A, the average characteristics of each cohort are calculated using pooled data from 2001 to 2012. The cohort
trend is calculated using the following equation and five observations of five average cohort characteristics:
AverageCharacteristicCohort = β1 + β2 × Cohort_Dummy +ε. β2 represents the trend in average firm
characteristics across successive cohorts. All variables are defined in the Appendix. For Panel B, we examine the
association between audit fees and innate characteristics using the regression AuditFee_SqrtAssetsi,t = α +β1 ×
Cohort_Dummyi,t + ∑ βs× Controli,t + εi,t.. Standard errors are clustered by industry (Fama and French industry
classification) and year.
Panel A: Univariate trend in audit fees
Log audit fees
Log non-audit
fees
Audit
fees/square root
of assets
Difference between pre-1970s and new-lists
Pre-1970s 14.258 12.882 43.544
New-lists 12.998 11.548 41.427
Difference –1.260 –1.335 –2.117
p-value <0.001 <0.001 <0.001
Trend in characteristics of successive cohorts of listed companies
Pre-1970s 14.258 12.882 43.544
1970s cohort 13.036 11.729 37.677
1980s cohort 12.957 11.613 39.240
1990s cohort 12.980 11.586 41.313
2000s cohort 13.077 11.255 45.806
Cohort trend (β2) –0.242 –0.340 0.816
t-statistic –1.624 –2.944 0.747

59
Table 5
Trends in audit fees of successive cohorts of listed companies
Panel B: Multivariate tests
No controls
Controls for company characteristics
Independent variable Estimate t-statistic Estimate t-statistic
Intercept 40.339 7.781 31.364 7.429
Cohort_Dummy 0.573 0.625 0.019 0.029
LogAssets –0.343 –0.902
COGS_Intensity –5.451 –2.219
R&D_Intensity 0.141 0.176
DeferredRevenueToSalesRatio 11.724 1.830
LargeAcquisitions 1.641 1.113
Loss 7.693 4.965
Litigation 3.406 2.149
DecYearEnd 1.238 0.932
BusinessSegments 1.701 5.239
GeographicSegments 2.888 7.961
VolatilityCFO 0.124 1.652
N 49,431 49,431
F-value 17.68 83.64
Probability <0.001 <0.001
Adjusted R-squared 0.03% 1.78%

60
Table 6
Differences in trends of audit fees of companies audited by Big N and non–Big N audit firms
The first year in which a firm’s data are available in Compustat is the listing year. All companies with a listing year
after 2009 are excluded (Srivastava 2014a). The remaining companies are divided into five listing cohorts. All
companies with a listing year before 1970 are classified as pre-1970s. The remaining companies are classified as new-
lists. All companies listed in a common decade make up a cohort of new-lists. Consequently, all of the companies are
divided into the pre-1970s cohort or a cohort from the 1970s, 1980s, 1990s, or 2000s. These five cohorts are assigned
Cohort_Dummy of 0, 1, 2, 3, and 4, respectively. The numbers of observations in each cohort-year are in Table 1.
Ernst & Young, KPMG, Deloitte & Touche, PwC, and Arthur Andersen are the Big N firms. For Panels A and B, the
average characteristics of each cohort are calculated using pooled data from 2001 to 2012. The cohort trend is calculated
using the following equation and five observations of five average cohort characteristics: AverageCharacteristicCohort
= β1 + β2 × Cohort_Dummy +ε. β2 represents the trend in average characteristics across successive cohorts.
For Panel C, we estimate the regression AuditFee_SqrtAssetssi,t = α +β1 × Cohort_Dummy i,t + β2 × BigNi,t + β3 ×
Cohort_Dummyi,t × BigNi,t + β4 × IndustrySpecializationi,t + β5 × Cohort_Dummyi,t × IndustrySpecializationi,t + ∑ βs
× Controli,t + εi,t. Standard errors are clustered by industry (Fama and French industry classification) and year. For
Panel D, the total audit fees of each cohort are calculated by adding audit fees from 2001 to 2012. All variables are
defined in the Appendix.
Panel A: Univariate trend in audit fees of companies audited by Big N and non–Big N audit firms
Log of audit fees
Listing Cohorts
Companies
audited by Big
N firms
Companies
audited by
non–Big N
firms Difference
Pre-1970s 14.481 12.375 –2.106
1970s cohort 13.701 11.636 –2.064
1980s cohort 13.613 11.786 –1.827
1990s cohort 13.386 11.942 –1.444
2000s cohort 13.772 11.777 –1.995
Cohort trend (β2) –0.173 –0.089 0.084
t-statistic –1.540 –0.983 0.984
Panel B: Univariate trend in audit fees of companies audited by Big N and non–Big N audit firms
Audit fees/square root of assets
Companies
audited by Big N
firms
Companies
audited by non–
Big N firms Difference
Pre-1970s 45.168 29.808 –15.360
1970s cohort 41.714 29.183 –12.531
1980s cohort 40.723 36.593 –4.130
1990s cohort 41.646 40.464 –1.182
2000s cohort 48.970 39.892 –9.078
Cohort trend (β2) 0.754 3.145 2.391
t-statistic 0.643 4.055 1.473

61
Table 6 continued
Differences in trends of audit fees of companies audited by Big N and non–Big N audit firms
Panel C: Multivariate tests
Independent variable Estimate t-statistic
Intercept 22.349 4.577
Cohort_Dummy 2.459 3.013
BigN 10.090 1.516
Cohort_Dummy × BigN –1.635 –1.843
IndustrySpecialization 7.252 0.655
Cohort_Dummy × IndustrySpecialization –1.130 –0.424
RelationshipLength 0.413 4.001
LogAssets –1.335 –2.326
COGS_Intensity –5.117 –2.250
R&D_Intensity –0.441 –0.455
DeferredRevenueToSalesRatio 11.227 1.668
LargeAcquisitions 2.131 1.471
Loss 7.654 5.014
Litigation 3.101 2.175
DecYearEnd 1.282 0.956
BusinessSegments 1.732 5.356
GeographicSegments 2.847 7.920
VolatilityCFO 0.122 1.671
N 43,990
F-value 225
Probability <0.001
Adjusted R-squared 7.91%
Panel D: Share of totals audit fees in the listing cohort
Percentage of cohort’s total audit fees
Listing Cohorts
Audited by
Big N firms
Audited by
non–Big N
firms Difference
Pre-1970s 98.8% 1.2% 97.6%
1970s cohort 95.6% 4.4% 91.1%
1980s cohort 93.2% 6.8% 86.4%
1990s cohort 92.1% 7.9% 84.2%
2000s cohort 91.3% 8.7% 82.7%

62
Table 7
Trends in the competitive structure of Public Accounting industry by Big N, second-tier, and smaller audit firms
The first year in which a firm’s data are available in Compustat is the listing year. All companies with a listing year after 2009 are excluded (Srivastava 2014a).
The remaining companies are divided into five listing cohorts. All companies with a listing year before 1970 are classified as pre-1970s. The remaining companies
are classified as new-lists. All companies listed in a common decade make up a cohort of new-lists. Consequently, all of the companies are divided into the pre-
1970s cohort or a cohort from the 1970s, 1980s, 1990s, or 2000s. These five cohorts are assigned Cohort_Dummy of 0, 1, 2, 3, and 4, respectively. The numbers
of observations in each cohort-year are in Table 1. Ernst & Young, KPMG, Deloitte & Touche, PwC, and Arthur Andersen are the Big N firms. BDO, Grant
Thornton, Crowe Horwath, and McGladrey are second-tier firms (Tier2). Audit firms that are not Big N or second-tier firms are smaller firms. All variables are
defined in the Appendix. The average characteristics of each cohort are calculated using pooled data from 2001 to 2012. The cohort trend is calculated using the
following equation and five observations of five average cohort characteristics: AverageCharacteristicCohort= β1 + β2 × Cohort_Dummy +ε. β2 represents the
trend in average characteristics across successive cohorts. For Panels B and C, we estimate the regression ClientCharacteristici,t = α +β1 × Cohort_Dummy i,t + β2
× BigNi,t + β3 × Cohort_Dummyi,t × BigNi,t + β4 × Tier2i,t + β5 × Cohort_Dummyi,t × Tier2i,t +β6 × IndustrySpecializationi,t + β6 × Cohort_Dummyi,t ×
IndustrySpecializationi,t + ∑ βs × Controli,t + εi,t. Standard errors are clustered by industry (Fama and French industry classification) and year.
Panel A: Competitive structure of audit industry by listing cohorts
Listing Cohorts
Big N Second-tier firms Small firms
Pre-1970s 89.4% 4.95% 5.71%
1970s cohort 67.8% 9.54% 22.80%
1980s cohort 64.1% 12.34% 23.69%
1990s cohort 71.9% 9.13% 19.13%
2000s cohort 65.2% 6.63% 28.26%
Cohort trend (β2) -0.044 0.003 0.041
t-statistic -1.597 0.289 2.047

63
Table 7 continued
Trends in the competitive structure of Public Accounting industry by Big N, second-tier, and smaller audit firms
Panel B: Trends in financial reporting qualities by type of audit firms
InverseMeasureOfQuality measured by
AbsResidualsDD
ConservativeGoingConcernOpinion
Independent variable
Estimate t-statistic
Estimate t-statistic
Intercept 0.103 18.676 0.171 7.568
Cohort_Dummy 0.015 6.833 0.059 9.829
BigN 0.026 4.677 0.069 3.744
Cohort_Dummy × BigN –0.015 –6.311 –0.066 –9.330
Tier2 0.001 0.173 0.025 1.328
Cohort_Dummy × Tier2 –0.011 –3.958 –0.055 –7.961
IndustrySpecialization 0.028 3.721 0.138 7.176
Cohort_Dummy × IndustrySpecialization –0.008 –3.426 –0.023 –4.165
RelationshipLength 0.000 1.765 0.001 2.722
LogAssets –0.014 –8.931 –0.033 –10.060
COGS_Intensity –0.008 –2.002 –0.062 –3.811
R&D_Intensity 0.001 0.314 –0.014 –1.191
DeferredRevenueToSalesRatio 0.044 5.400 –0.017 –0.981
LargeAcquisitions –0.006 –2.069 –0.016 –2.060
Loss 0.007 7.483 0.085 10.593
VolatilityCFO 0.001 3.084 0.001 2.364
N 43,990 43,990
F-value 1,008 1,133
Probability <0.001 <0.001
Adjusted R-squared 23.41% 25.56%

64
Table 7 continued
Trends in the competitive structure of Public Accounting industry by Big N, second-tier, and smaller audit firms
Panel C: Multivariate tests on trends in client size–adjusted audit fees by types of audit firms Multivariate tests
Independent variable Estimate t-statistic
Intercept 18.203 3.735
Cohort_Dummy 3.329 3.723
BigN 15.347 2.164
Cohort_Dummy × BigN –2.472 –2.993
Tier2 12.331 5.115
Cohort_Dummy × Tier2 –1.507 –1.638
IndustrySpecialization 8.277 0.755
Cohort_Dummy × IndustrySpecialization –1.233 –0.466
RelationshipLength 0.446 4.455
LogAssets –1.546 –2.479
COGS_Intensity –5.500 –2.428
R&D_Intensity –0.456 –0.481
DeferredRevenueToSalesRatio 11.155 1.659
LargeAcquisitions 2.067 1.451
Loss 7.652 4.967
Litigation 2.820 2.039
DecYearEnd 1.355 1.010
BusinessSegments 1.742 5.286
GeographicSegments 2.825 7.947
VolatilityCFO 0.125 1.684
N 43,990
F-value 211
Probability <0.001
Adjusted R-squared 7.49%