Embed Size (px)
Citation preview
1
The Changing Nature of Principals’ Work Final Report, October, 2014 Dr. Katina Pollock, with Dr. Fei Wang and Cameron Hauseman
2
Acknowledgements The research team would like to thank the Ontario Principals’ Council (OPC) for supporting this research project. A special note of gratitude is also reserved for each of the following groups and individuals:
• The principals who participated in the online survey;
• the principals who provided valuable feedback at focus groups during the survey design phase;
• Bob Pratt, President of the OPC, and Ian McFarlane, Executive Director of the OPC for their direction, guidance, and support throughout the course of the research project;
• Joanne Robinson, Director of Professional Learning at the OPC, for guidance during the survey development phase;
• Peggy Sweeney, Senior Communications Consultant at the OPC, for her assistance in disseminating information about the survey using social media and the OPC website; and,
• Dr. Patricia Briscoe, Michael Mindzak, Donna Swapp, Asma Ahmed and Julia Lowe for their assistance in bringing this study to fruition.
3
Executive Summary This study examines the changing nature of principals’ work. It seeks to provide a more accurate picture of what principals do on a daily basis, and the challenges and possibilities inherent in their work. Data collection was carried out using a mixed methods design that included focus groups and an online survey. Four focus groups were conducted to provide initial insight into the contemporary nature of principals’ work, and as an opportunity to pilot and receive feedback on the online survey. Three of the focus groups were conducted with groups of between six and nine current Ontario principals who piloted the survey and provided valuable feedback. The fourth focus group was conducted with members of the research team in order to incorporate feedback received from pilot focus groups. The online survey included 60 questions that touched on a number of aspects of principals’ work. A total of 1,821 OPC members responded to the survey when it was active for 26 days in October, 2013. After eliminating completions by non-principals and accounting for missing data, there were 1,423 surveys available for analysis. This represents a response rate of 52.68%. The sample is largely consistent with that of the larger principal population in Ontario. Descriptive and inferential statistical analyses revealed a number of intriguing findings. On average, principals reported working 58.7 hours per week. This finding was consistent across the sample; there were only minor variations (+/- 1.5 hours per week) based on the principals’ gender, experience, level of education, and contextual factors such as the size and socio-economic status of the community surrounding the school. Policies have a significant influence on what principals actually do at work, and in particular on their duties and responsibilities. Regulation 274/12 (77.7%), which deals with hiring practices and regulations, Growing Success (77.4%), and the Safe School Act – Bill 212 (69.1%), were cited by the participating principals as having the most influence on what they do on a daily basis. This study also revealed that principals face a number of challenges and possibilities in their daily work. These challenges and possibilities include recognition for the work principals do, managing mental health concerns in the school community, implementing and responding to provincial initiatives and mandates, and dealing with staff who are resistant to change. Principals employ a number of strategies to cope with these challenges, including spending time with friends/family, watching television or movies, and reading. However, 29% of the sample also indicated that they self-medicate in an effort to deal with the emotional toll of their work. When asked what skills they have had to learn in the past twelve months, principals indicated emotional intelligence/relationship-building skills, inter-personal communication skills, and knowledge of effective teaching and learning were the top three areas they strengthened to better navigate the changing education agenda. Despite finding some minor contextual differences in what principals do and how they do it, the lack of any major variations in principals’ work across personal and contextual variables implies that the principalship has become so structured and rooted in compliance that there is little room for principals to demonstrate professional judgement or autonomy in their daily work.
4
Contents Acknowledgements......................................................................................................................... 2 Executive Summary ........................................................................................................................ 3 Section One - Introduction.............................................................................................................. 5
Purpose of the Study. .................................................................................................................. 5 Organization. ............................................................................................................................... 5 Background and Rationale for Research. .................................................................................... 5
Section Two - Methodology ........................................................................................................... 6 Data Collection Methods............................................................................................................. 6 Sampling...................................................................................................................................... 7 Description of the Sample. .......................................................................................................... 7 Data Analysis. ........................................................................................................................... 13
Section Three - Findings............................................................................................................... 14 How Principals Spend Their Time. ........................................................................................... 14 Duties and Responsibilities. ...................................................................................................... 20 Accountability and External Influences .................................................................................... 23 Challenges and Possibilities. ..................................................................................................... 24 Well-Being and Work-Life Balance. ........................................................................................ 26
Dissatisfied Principals........................................................................................................... 30 Supports Available to Principals. .............................................................................................. 31 Professional Development......................................................................................................... 32 School-Level Partnerships......................................................................................................... 33
Section Four - Recommendations................................................................................................. 34 Ontario Principals’ Council....................................................................................................... 35 Current and Aspiring Principals. ............................................................................................... 37
Section Five - Conclusion and Future Directions ......................................................................... 38 References..................................................................................................................................... 40
5
Section One - Introduction Purpose of the Study. The work of school principals is changing. This research explores what principals do, providing a more accurate picture of school principals’ work than any other available research. It examines how school principals approach their work, how they spend their time, and explores the challenges and possibilities principals’ work presents to them. The intended outcomes of this study include:
• A more comprehensive understanding of the changing nature of principals’ work. • A compilation of what contemporary principals actually do in their work. • An increased awareness of the challenges school principals face in their work. • A knowledge base to better inform potential principals of what to expect of
administrative work. • New insights to assist the Ontario Principals’ Council (OPC) in providing appropriate
supports and professional learning opportunities for practicing administrators. Organization. This report is divided into five sections. The first section contains the introduction and describes the purpose of this research project and the rationale. The second section discusses the methods used to collect and analyze the dataset for this study. A discussion of the findings to emerge from this research, including how principals spend their time and how their work has changed in light of recent provincial policy and programmatic shifts, are contained in the third section. The fourth section includes recommendations for the OPC, as well as for current and aspiring principals. Lastly, the fifth and final section of the report features concluding remarks and directions for future research. Background and Rationale for Research. The term “work” is defined as all actions and activities performed by principals in an effort to realize the roles and responsibilities tied to the contemporary principalship. Trends that suggest changes in principals’ work have emerged from recent research. The ways in which principals interact, communicate, and collaborate with staff have been complicated by the changing nature of labour relations in the province (Wallace, 2010). Large-scale assessments (Ball, 2003; Goodwin, Cunningham & Childress, 2003; Harvey & Houle, 2006; Whitaker, 2003) and an increased focus on collaborative decision-making (Court & O’Neil, 2011; Fink & Brayman, 2006) are among the wave of reforms that swept across the educational landscape and eroded principals’ autonomy in the process. There is also evidence to suggest that advances in information and communications technology has altered (Fullan, 2014; Sheninger, 2014) and intensified (Haughey, 2006) principals’ work. Demographic trends, such as Canada’s aging population (Ontario Principals’ Council, 2001), rising levels of student diversity (Ryan, 2006; 2007; Shields, 2010), and other shifts in the external environment are undoubtedly having a similar influence. The influence of these changes on the work and expectations of teachers has received considerable academic attention (Adams, 2009; Ben-Peretz, 2001; Belfield, 2005; Grimmett & Echols, 2000; Hall, 2004; McGregor, Hooker, Wise & Devlin, 2010; Pollock, 2008). However, there is a dearth of literature examining the influence and impact of these changes on principals. More than a decade ago, an OPC-commissioned study (Ontario Principals’ Council, 2001) indicated that issues with time posed major challenges in principals’ work. In this study,
6
principals also indicated that they struggled with the high pace of curriculum policy changes, limited resources, and often unrealistic expectations of the principalship (Ontario Principals’ Council, 2001). Despite these and other research findings reporting principals working long hours, struggling with work-life balance (The Institute for Educational Leadership, 2008), and experiencing significant degrees of stress and mental health issues (Dewa et al., 2009), few research studies examine how principals go about their work and the challenges inherent in such work. An issue that may or may not be related to the above challenges is that too few educators aspire to the principalship. Principal shortages have been reported in Ontario and in other parts of the world, while current forecasts for the future are not encouraging (Brooking, Collins & O’Neill, 2003; Canadian Association for Principals, 1999; Catholic Principals’ Council of Ontario, 2001; Draper & McMichael, 2003; Fink & Brayman, 2006; Gronn & Rawlings-Sanaei, 2003; Ontario Principals’ Council, 2001; Quinn, 2002). If principals are to be assisted in their current work, if school systems are to attract and retain the best candidates, and if universities and other training institutions are to adequately prepare prospective principals for challenging jobs, then we need to better understand the current changing nature of administrative work and the kinds of contextual issues which influence that work. In light of these perceived changes in the nature, volume, and content of principals’ work, the OPC reached out to their membership using this study as a way to better understand what principals do on a daily basis and the challenges they face every day. Section Two - Methodology Data Collection Methods. The study employed a mixed methods design that included focus groups and an online survey.
Focus Groups. Focus groups were utilized for survey development purposes. Two focus group sessions occurred between October 2012 and April 2013. The focus groups consisted of between 6 and 9 school principals representing male, female, rural, and urban locations, as well as different career stages. Each session lasted more than two hours and was divided into two parts. The first hour primed principals to focus on their work so that they would provide meaningful feedback to the survey questions in the second hour of the focus group. Participants were asked to discuss their work as school principals, including the challenges they encountered and the strategies they used to accomplish their tasks. This information was recorded, and proved helpful in further developing the survey questions. During the second hour participants piloted the survey questions and commented on the survey’s design, question design, and content.
Online Survey. In order to capture a provincial snapshot of how OPC principals engaged in their work across the public school boards, an online survey was developed and distributed across the OPC membership. The survey was released on October 21, 2013 and was open for 26 days. The online survey went through a number of different stages of development to ensure that it best represented the responsibilities, roles, tasks, behaviours, and practices expected of principals. The first stage of survey development involved looking to the literature and recent changes to provincial education policy (e.g, Regulation 274/12 – Hiring Practices, Equity and Inclusive Education Strategy) for guidance. This was essential in both developing the initial draft and gaining a comprehensive understanding of the factors influencing principals and their work
7
in Ontario. After the initial draft of the online survey was reviewed by the OPC, the second stage of survey development involved piloting a revised version with current school principals during the focus groups, described in detail above. Incorporating the valuable feedback provided by focus group participants was the final stage of survey development and the most important. Multiple revisions resulted in an online survey that contained 60 questions and asked principals about their work in the following twelve areas:
• How they spend their time; • duties and responsibilities; • accountability and external influences; • challenges and possibilities; • well-being and job satisfaction; • work and life balance; • supports; • the Ontario Leadership Framework; • professional development; • school-level partnerships; • personal information; and • school details.
Principals were given opportunities to qualify their responses by offering additional comments when answering certain questions, or/and at the end of the online survey. Only three open-ended survey questions received the number of responses necessary to conduct meaningful quantitative analysis. Those questions inquired about school-level partnerships with external programs or agencies (1240 unique responses), accountability (854 unique responses), and coping mechanisms (250 unique responses). The “Additional Comments” section at the end of the survey received 788 unique responses. Qualitative data has been woven throughout the report to reinforce findings related to the questions identified above. Sampling. The sample consisted of members of the OPC who were working as school principals in Ontario at the time the survey was online. The OPC provided the research team with a list of e-mail addresses of all 2,701 of its members who, at the time of the survey, were designated as principals working in Ontario. Each of these principals was sent an individualized URL to the survey. Despite having direct access to the respondents, a number of strategies were employed to encourage principals to share their opinions and make their voices heard using the survey. Weekly e-mail reminders were sent to principals who had yet completed the survey. By providing updates on the OPC website and sending out tweets from the official OPC Twitter account when the survey was live, the OPC staff helped to generate a sense of excitement and “buzz” about the survey. These strategies help explain why the survey was able to achieve such a high response rate (52.68%). Description of the Sample. As mentioned above, the total sample of OPC principals who could potentially have responded to the online survey was 2,701. A total of 1,821 responses were collected during the 26 days the survey was live. Unfortunately, 398 responses were disqualified due to missing data or because they were completed by OPC members who were not principals.
8
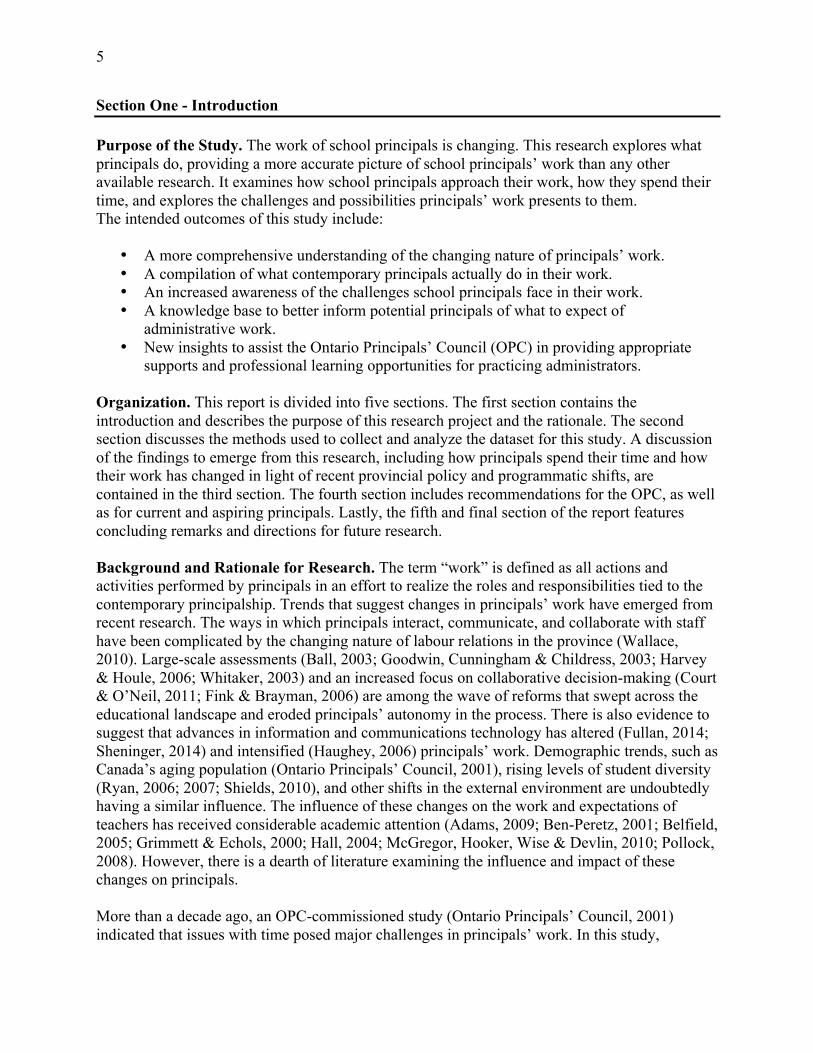
It was encouraging that so many vice-principals and system leaders recognized the value of the research, but as the scope of the survey focused on principals, their responses could not be included in the dataset used for analysis. As there were 1,423 usable responses to the survey, the response rate for this study is 52.68%. As a whole, the sample is largely representative of the OPC’s membership of current and practicing principals. Of the usable survey responses, 77.3% were from elementary principals, 16.4% from secondary principals, and 2.9% from principals of both elementary and secondary schools. Table 1: Participant Characteristics – School Type
School Type
Elementary Principals 1,108 77.3%
Secondary Principals 235 16.4%
Elementary/Secondary Principals 41 2.9%
Ratio of Secondary Principals to Elementary Principals 21/100
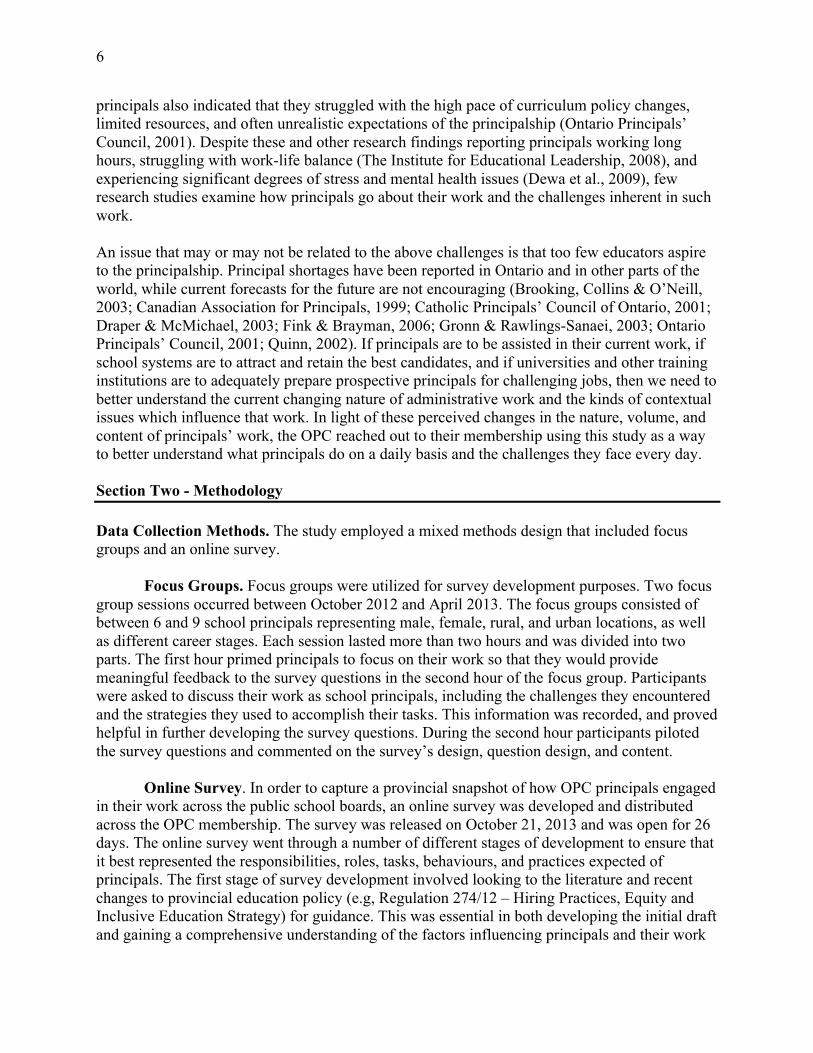
There was also diversity in terms of the gender of the respondents. As displayed below in Table 2, 62.8% of the principals who responded to the online survey self-identified as female, while the remaining 36.2% of participants self-identified as male. Table 2: Participant Characteristics - Gender
Gender %
Male 36.2%
Female 62.8%
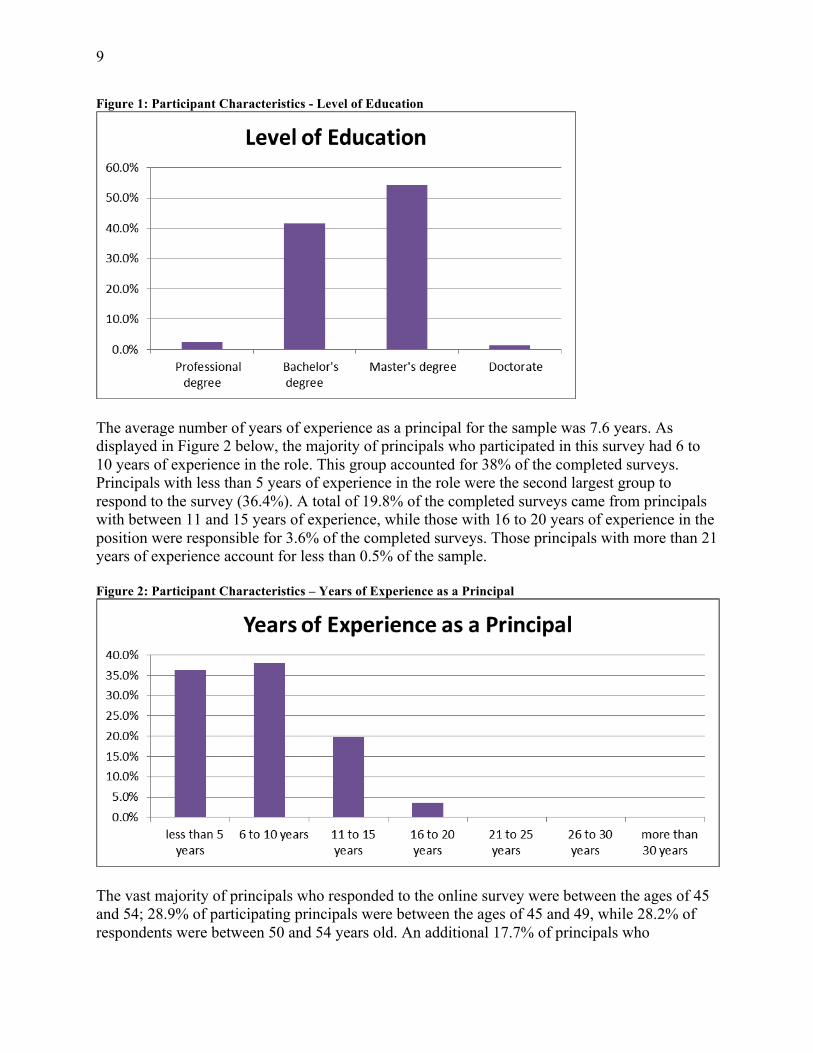
Ontario principals come to the position with a variety of educational backgrounds. A Bachelor’s degree was the most prevalent level of post-secondary education, completed by 41.6% of the principals who participated in this research. The majority of the sample, 54.3%, had a Master’s degree in addition to their undergraduate degrees. Only 2.4% of principals indicated that they had earned a professional degree, while 1.3% had completed a doctorate or other terminal degree.
9
Figure 1: Participant Characteristics - Level of Education
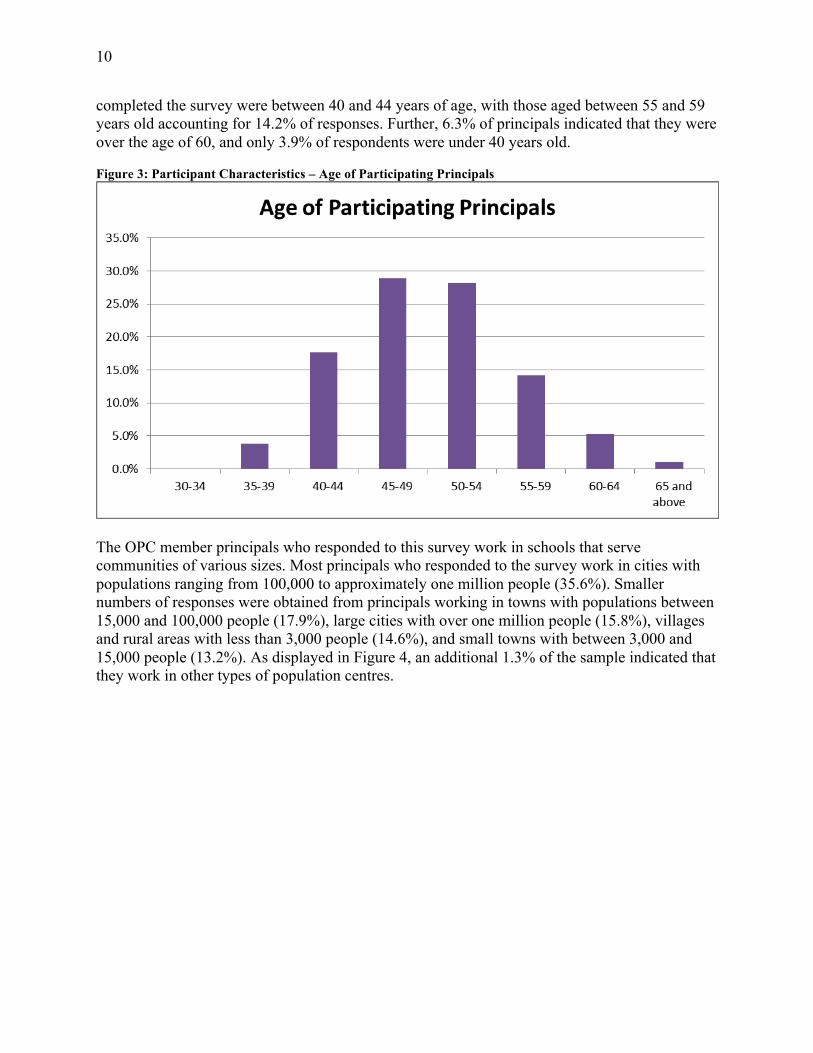
The average number of years of experience as a principal for the sample was 7.6 years. As displayed in Figure 2 below, the majority of principals who participated in this survey had 6 to 10 years of experience in the role. This group accounted for 38% of the completed surveys. Principals with less than 5 years of experience in the role were the second largest group to respond to the survey (36.4%). A total of 19.8% of the completed surveys came from principals with between 11 and 15 years of experience, while those with 16 to 20 years of experience in the position were responsible for 3.6% of the completed surveys. Those principals with more than 21 years of experience account for less than 0.5% of the sample. Figure 2: Participant Characteristics – Years of Experience as a Principal
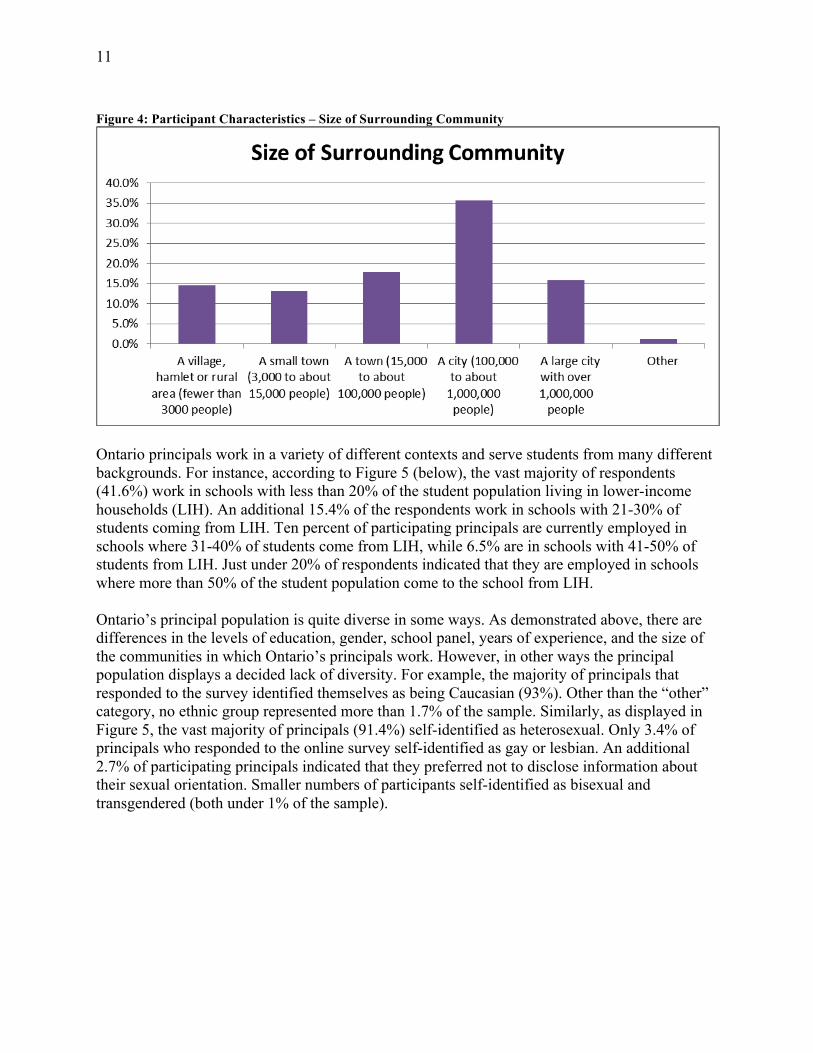
The vast majority of principals who responded to the online survey were between the ages of 45 and 54; 28.9% of participating principals were between the ages of 45 and 49, while 28.2% of respondents were between 50 and 54 years old. An additional 17.7% of principals who
10
completed the survey were between 40 and 44 years of age, with those aged between 55 and 59 years old accounting for 14.2% of responses. Further, 6.3% of principals indicated that they were over the age of 60, and only 3.9% of respondents were under 40 years old. Figure 3: Participant Characteristics – Age of Participating Principals
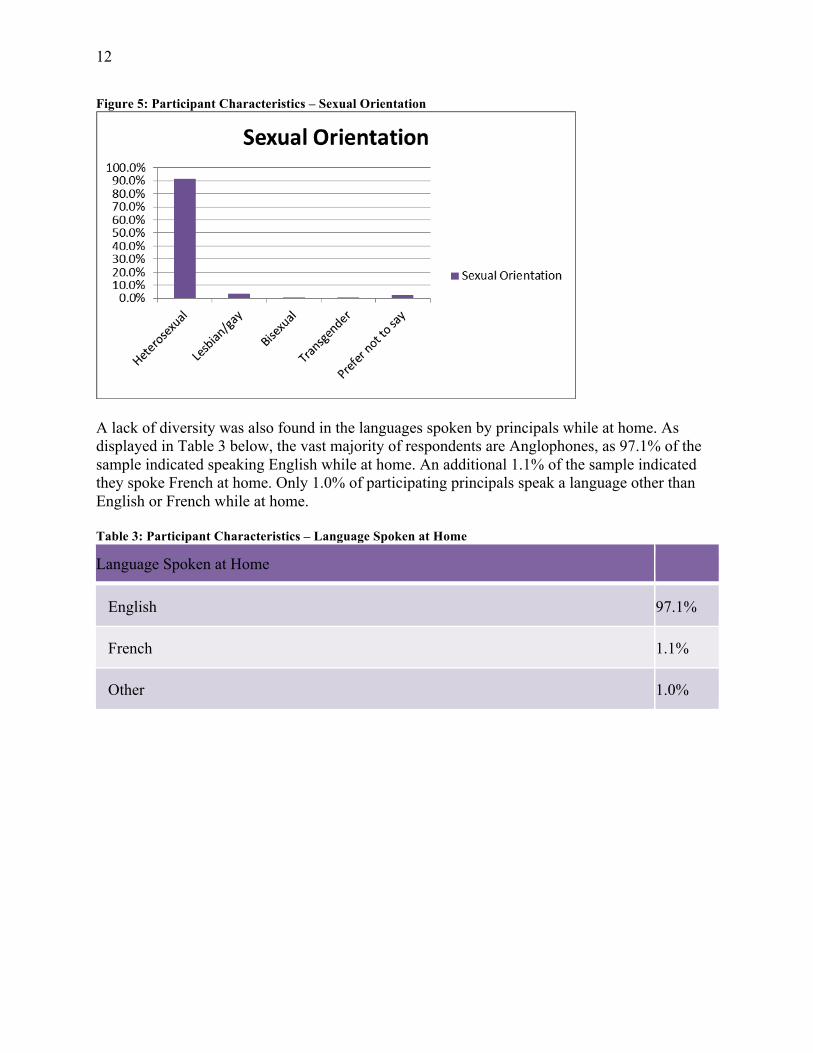
The OPC member principals who responded to this survey work in schools that serve communities of various sizes. Most principals who responded to the survey work in cities with populations ranging from 100,000 to approximately one million people (35.6%). Smaller numbers of responses were obtained from principals working in towns with populations between 15,000 and 100,000 people (17.9%), large cities with over one million people (15.8%), villages and rural areas with less than 3,000 people (14.6%), and small towns with between 3,000 and 15,000 people (13.2%). As displayed in Figure 4, an additional 1.3% of the sample indicated that they work in other types of population centres.
11
Figure 4: Participant Characteristics – Size of Surrounding Community
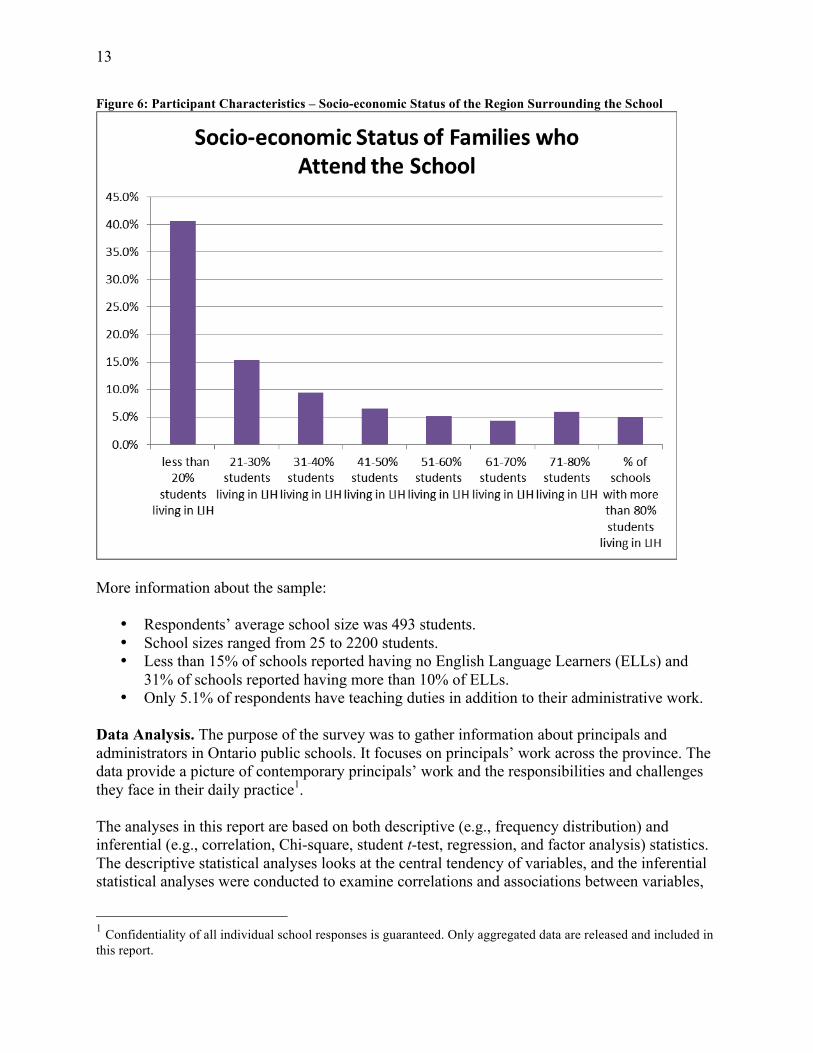
Ontario principals work in a variety of different contexts and serve students from many different backgrounds. For instance, according to Figure 5 (below), the vast majority of respondents (41.6%) work in schools with less than 20% of the student population living in lower-income households (LIH). An additional 15.4% of the respondents work in schools with 21-30% of students coming from LIH. Ten percent of participating principals are currently employed in schools where 31-40% of students come from LIH, while 6.5% are in schools with 41-50% of students from LIH. Just under 20% of respondents indicated that they are employed in schools where more than 50% of the student population come to the school from LIH. Ontario’s principal population is quite diverse in some ways. As demonstrated above, there are differences in the levels of education, gender, school panel, years of experience, and the size of the communities in which Ontario’s principals work. However, in other ways the principal population displays a decided lack of diversity. For example, the majority of principals that responded to the survey identified themselves as being Caucasian (93%). Other than the “other” category, no ethnic group represented more than 1.7% of the sample. Similarly, as displayed in Figure 5, the vast majority of principals (91.4%) self-identified as heterosexual. Only 3.4% of principals who responded to the online survey self-identified as gay or lesbian. An additional 2.7% of participating principals indicated that they preferred not to disclose information about their sexual orientation. Smaller numbers of participants self-identified as bisexual and transgendered (both under 1% of the sample).
12
Figure 5: Participant Characteristics – Sexual Orientation
A lack of diversity was also found in the languages spoken by principals while at home. As displayed in Table 3 below, the vast majority of respondents are Anglophones, as 97.1% of the sample indicated speaking English while at home. An additional 1.1% of the sample indicated they spoke French at home. Only 1.0% of participating principals speak a language other than English or French while at home. Table 3: Participant Characteristics – Language Spoken at Home
Language Spoken at Home
English 97.1%
French 1.1%
Other 1.0%
13
Figure 6: Participant Characteristics – Socio-economic Status of the Region Surrounding the School
More information about the sample:
• Respondents’ average school size was 493 students. • School sizes ranged from 25 to 2200 students. • Less than 15% of schools reported having no English Language Learners (ELLs) and
31% of schools reported having more than 10% of ELLs. • Only 5.1% of respondents have teaching duties in addition to their administrative work.
Data Analysis. The purpose of the survey was to gather information about principals and administrators in Ontario public schools. It focuses on principals’ work across the province. The data provide a picture of contemporary principals’ work and the responsibilities and challenges they face in their daily practice1. The analyses in this report are based on both descriptive (e.g., frequency distribution) and inferential (e.g., correlation, Chi-square, student t-test, regression, and factor analysis) statistics. The descriptive statistical analyses looks at the central tendency of variables, and the inferential statistical analyses were conducted to examine correlations and associations between variables,
1 Confidentiality of all individual school responses is guaranteed. Only aggregated data are released and included in this report.
14
and to compare the means of different variables. The data in this study were analyzed using SPSS 21. Calculations have been rounded to the nearest whole number where necessary, and therefore do not always add up to 100%. Where appropriate, comparisons by school size, school type, gender, or region are noted. Section Three - Findings This section includes a discussion of the key findings that emerged from analyses of survey responses. The findings are divided into eight subsections. The first describes how principals spend their time on a daily basis. This is followed by sections discussing findings regarding the duties and responsibilities expected of contemporary principals; accountability and external influences; challenges and possibilities; well-being and job satisfaction; and supports available to help school leaders manage the emotional, mental, and physical stress that comes with the position. Included in the subsection on the topic of well-being and job satisfaction is a thorough description surrounding the “dissatisfied” principals who responded to the survey. This section concludes with short subsections outlining the professional development needs identified by principals who responded to the survey, and principals’ involvement in school-level partnerships. How Principals Spend Their Time. On average, principals spend approximately 59 hours per week on their work. A breakdown of the hours principals work per week based on gender, school type, socio-economic status of the community surrounding the school, and the principals’ levels of experience2 can be found on the next page in Table 4. Data analysis shows that the different tasks and activities on which principals reported spending time are related to parents and communities, student personnel, and school management. A multiple regression analysis was conducted to evaluate how different activities and tasks predict the amount of time principals spent per week. The results show that the linear combination of predictors such as working with parents, internal school management, student discipline, principals’ professional development, district school board office committees, building maintenance, and community engagement was significantly related to the amount of time principals spent on their work among all work-related activities3, F (7,1304) = 25.2, p <.01. This indicates that principals’ time is more likely to be spent on the above-named predictors. Interestingly, as the amount of time principals spend working per week increases, less time is spent on building maintenance (r = -.39). A similar test showed that a linear combination of e-mails, formal meetings, and social media was also significantly related to the average time principals spend per week, F (3,1035) = 32.7, p <.01, which indicates that principals spend a great deal of their time on e-mails, formal meetings, and social media.
2 Principals were considered “experienced” if they had four or more years of experience in the role, and “less experienced” if they had been a principal for less than four years. 3 The survey asked principals to estimate how many hours they spend on average per week in the following work-‐related activities: a) Student discipline/attendance, b) Student-‐related activities (meetings, supervision, clubs, teams), c) Student transportation, d) Working with parents, e) Community (faith-‐based organization, youth employment, other organizations, etc.), f) District school board office committees (meetings task forces, reports, etc.), g) Principal’s professional development, h) Curriculum and instructional leadership, i) Budget, j) Personnel (hiring, evaluation, supervision, advising, mentoring, etc.), k) Internal school management (calendar, office, memos, newsletter, website, etc.), l) Walking hallways, playground, lunchroom, etc., m) Classroom walk-‐throughs, n) Building maintenance, o) Occupational health and safety.
15
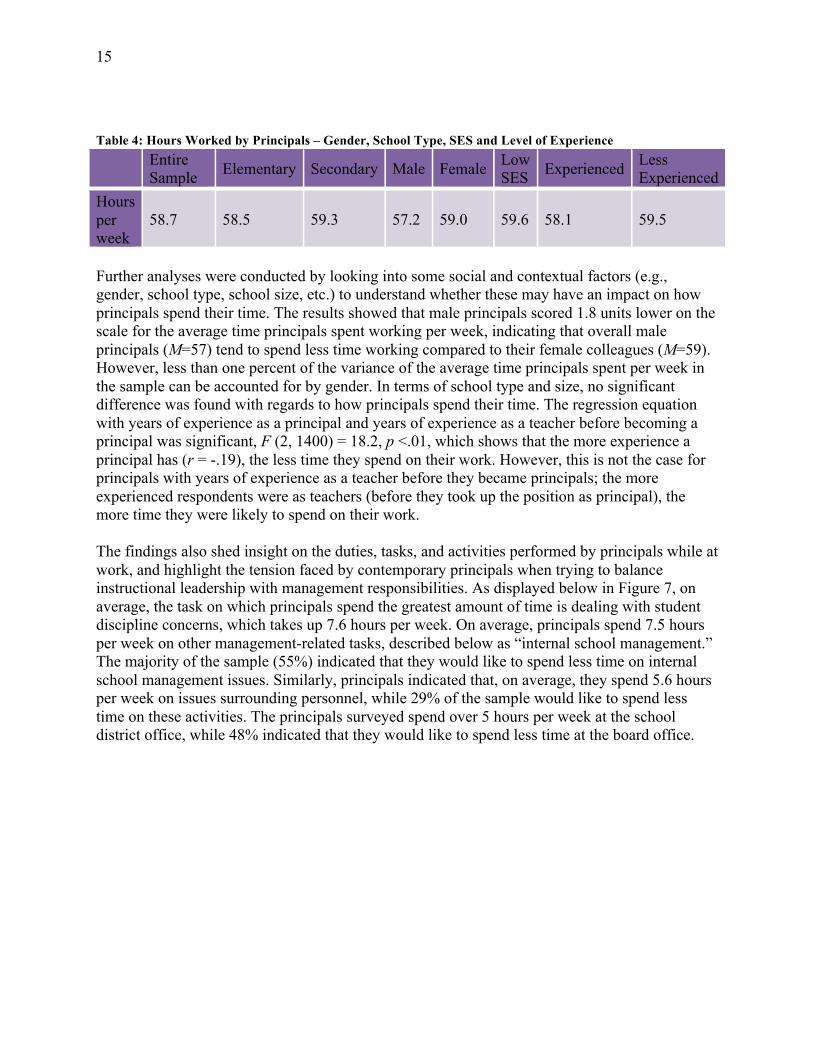
Table 4: Hours Worked by Principals – Gender, School Type, SES and Level of Experience
Entire Sample Elementary Secondary Male Female Low
SES Experienced Less Experienced
Hours per week
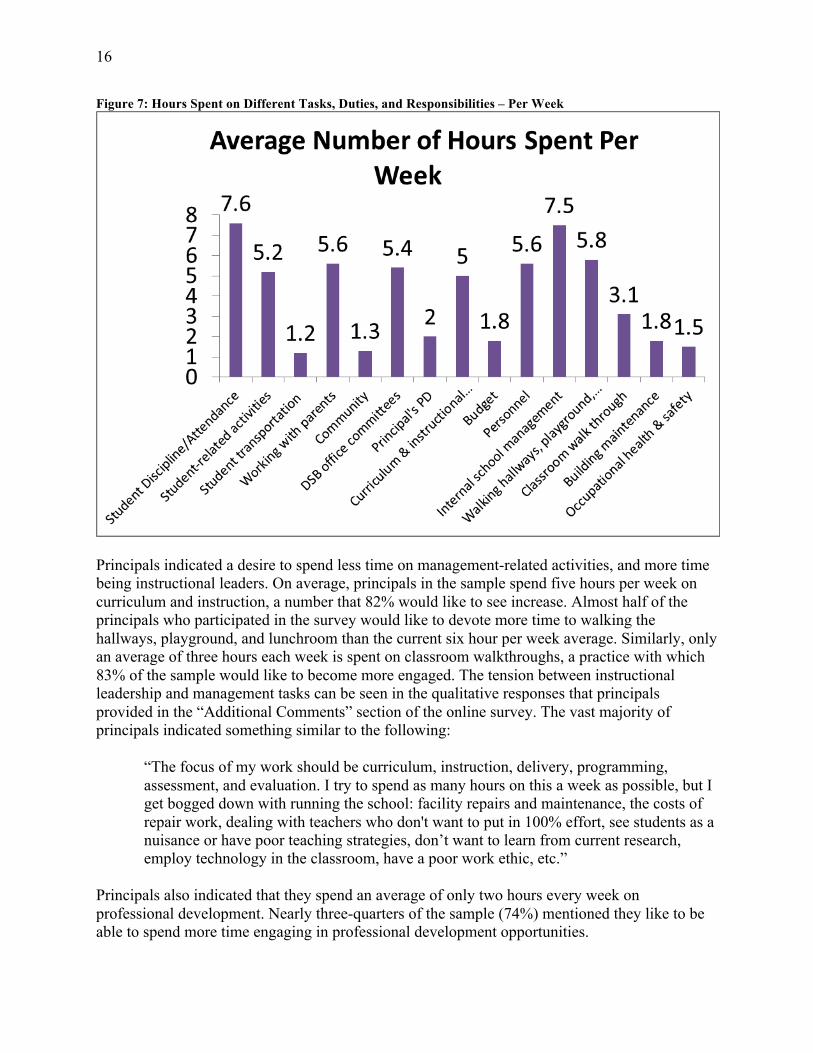
58.7 58.5 59.3 57.2 59.0 59.6 58.1 59.5 Further analyses were conducted by looking into some social and contextual factors (e.g., gender, school type, school size, etc.) to understand whether these may have an impact on how principals spend their time. The results showed that male principals scored 1.8 units lower on the scale for the average time principals spent working per week, indicating that overall male principals (M=57) tend to spend less time working compared to their female colleagues (M=59). However, less than one percent of the variance of the average time principals spent per week in the sample can be accounted for by gender. In terms of school type and size, no significant difference was found with regards to how principals spend their time. The regression equation with years of experience as a principal and years of experience as a teacher before becoming a principal was significant, F (2, 1400) = 18.2, p <.01, which shows that the more experience a principal has (r = -.19), the less time they spend on their work. However, this is not the case for principals with years of experience as a teacher before they became principals; the more experienced respondents were as teachers (before they took up the position as principal), the more time they were likely to spend on their work. The findings also shed insight on the duties, tasks, and activities performed by principals while at work, and highlight the tension faced by contemporary principals when trying to balance instructional leadership with management responsibilities. As displayed below in Figure 7, on average, the task on which principals spend the greatest amount of time is dealing with student discipline concerns, which takes up 7.6 hours per week. On average, principals spend 7.5 hours per week on other management-related tasks, described below as “internal school management.” The majority of the sample (55%) indicated that they would like to spend less time on internal school management issues. Similarly, principals indicated that, on average, they spend 5.6 hours per week on issues surrounding personnel, while 29% of the sample would like to spend less time on these activities. The principals surveyed spend over 5 hours per week at the school district office, while 48% indicated that they would like to spend less time at the board office.
16
Figure 7: Hours Spent on Different Tasks, Duties, and Responsibilities – Per Week
Principals indicated a desire to spend less time on management-related activities, and more time being instructional leaders. On average, principals in the sample spend five hours per week on curriculum and instruction, a number that 82% would like to see increase. Almost half of the principals who participated in the survey would like to devote more time to walking the hallways, playground, and lunchroom than the current six hour per week average. Similarly, only an average of three hours each week is spent on classroom walkthroughs, a practice with which 83% of the sample would like to become more engaged. The tension between instructional leadership and management tasks can be seen in the qualitative responses that principals provided in the “Additional Comments” section of the online survey. The vast majority of principals indicated something similar to the following:
“The focus of my work should be curriculum, instruction, delivery, programming, assessment, and evaluation. I try to spend as many hours on this a week as possible, but I get bogged down with running the school: facility repairs and maintenance, the costs of repair work, dealing with teachers who don't want to put in 100% effort, see students as a nuisance or have poor teaching strategies, don’t want to learn from current research, employ technology in the classroom, have a poor work ethic, etc.”
Principals also indicated that they spend an average of only two hours every week on professional development. Nearly three-quarters of the sample (74%) mentioned they like to be able to spend more time engaging in professional development opportunities.
17
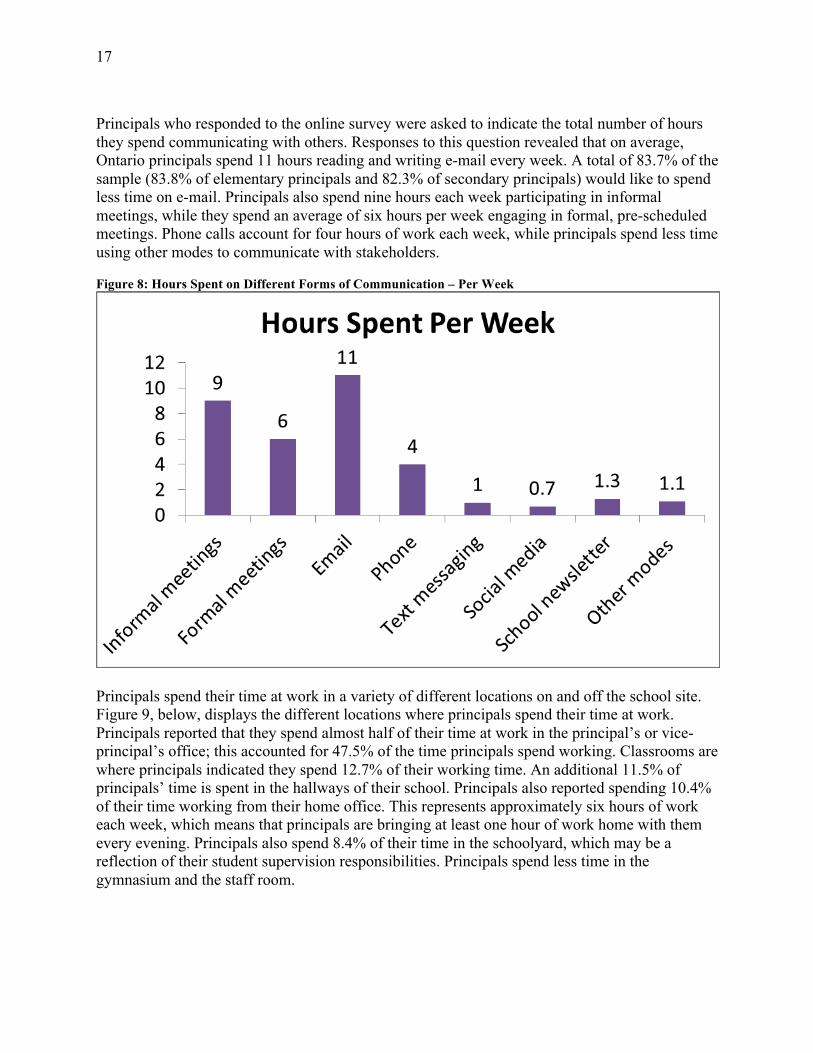
Principals who responded to the online survey were asked to indicate the total number of hours they spend communicating with others. Responses to this question revealed that on average, Ontario principals spend 11 hours reading and writing e-mail every week. A total of 83.7% of the sample (83.8% of elementary principals and 82.3% of secondary principals) would like to spend less time on e-mail. Principals also spend nine hours each week participating in informal meetings, while they spend an average of six hours per week engaging in formal, pre-scheduled meetings. Phone calls account for four hours of work each week, while principals spend less time using other modes to communicate with stakeholders. Figure 8: Hours Spent on Different Forms of Communication – Per Week
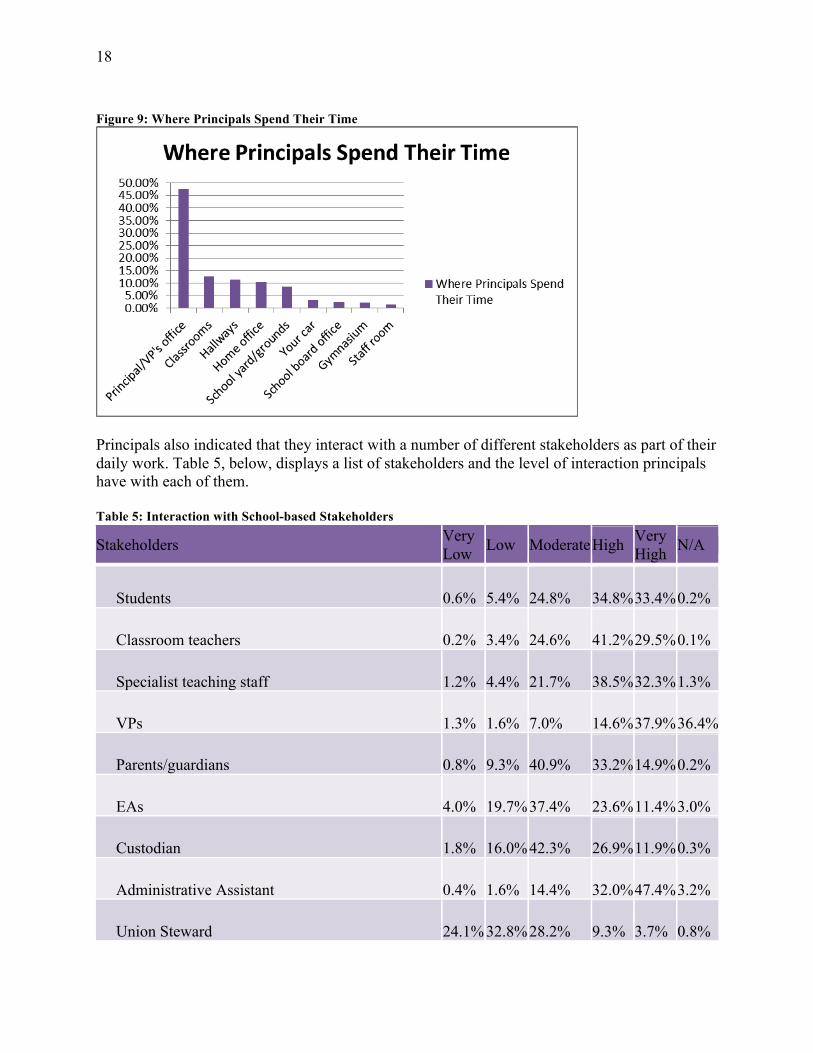
Principals spend their time at work in a variety of different locations on and off the school site. Figure 9, below, displays the different locations where principals spend their time at work. Principals reported that they spend almost half of their time at work in the principal’s or vice-principal’s office; this accounted for 47.5% of the time principals spend working. Classrooms are where principals indicated they spend 12.7% of their working time. An additional 11.5% of principals’ time is spent in the hallways of their school. Principals also reported spending 10.4% of their time working from their home office. This represents approximately six hours of work each week, which means that principals are bringing at least one hour of work home with them every evening. Principals also spend 8.4% of their time in the schoolyard, which may be a reflection of their student supervision responsibilities. Principals spend less time in the gymnasium and the staff room.
18
Figure 9: Where Principals Spend Their Time
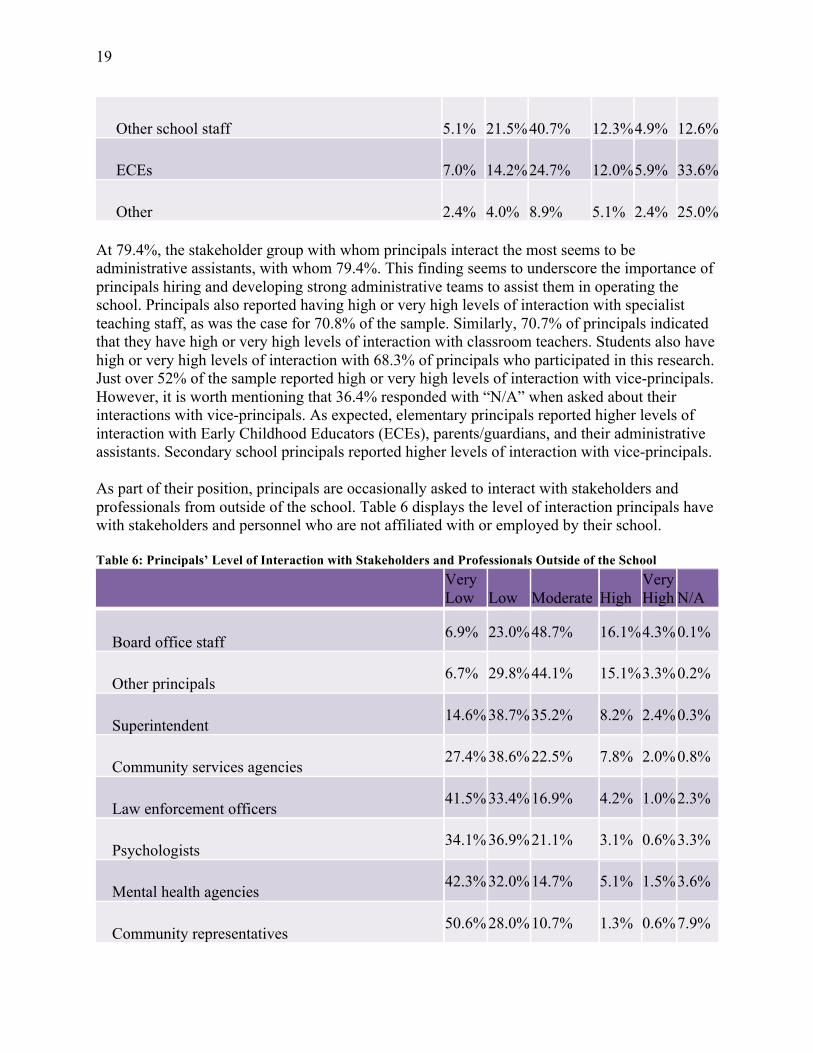
Principals also indicated that they interact with a number of different stakeholders as part of their daily work. Table 5, below, displays a list of stakeholders and the level of interaction principals have with each of them. Table 5: Interaction with School-based Stakeholders
Stakeholders Very Low Low Moderate High Very
High N/A
Students 0.6% 5.4% 24.8% 34.8% 33.4% 0.2%
Classroom teachers 0.2% 3.4% 24.6% 41.2% 29.5% 0.1%
Specialist teaching staff 1.2% 4.4% 21.7% 38.5% 32.3% 1.3%
VPs 1.3% 1.6% 7.0% 14.6% 37.9% 36.4%
Parents/guardians 0.8% 9.3% 40.9% 33.2% 14.9% 0.2%
EAs 4.0% 19.7% 37.4% 23.6% 11.4% 3.0%
Custodian 1.8% 16.0% 42.3% 26.9% 11.9% 0.3%
Administrative Assistant 0.4% 1.6% 14.4% 32.0% 47.4% 3.2%
Union Steward 24.1% 32.8% 28.2% 9.3% 3.7% 0.8%
19
Other school staff 5.1% 21.5% 40.7% 12.3% 4.9% 12.6%
ECEs 7.0% 14.2% 24.7% 12.0% 5.9% 33.6%
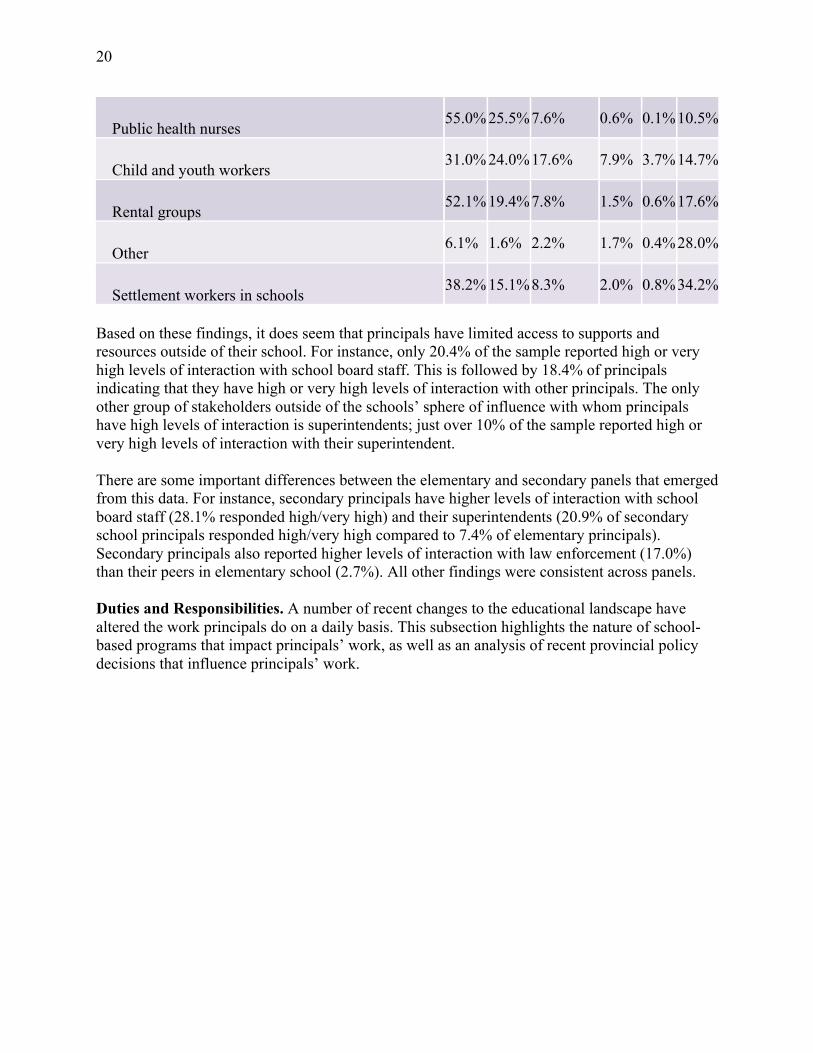
Other 2.4% 4.0% 8.9% 5.1% 2.4% 25.0% At 79.4%, the stakeholder group with whom principals interact the most seems to be administrative assistants, with whom 79.4%. This finding seems to underscore the importance of principals hiring and developing strong administrative teams to assist them in operating the school. Principals also reported having high or very high levels of interaction with specialist teaching staff, as was the case for 70.8% of the sample. Similarly, 70.7% of principals indicated that they have high or very high levels of interaction with classroom teachers. Students also have high or very high levels of interaction with 68.3% of principals who participated in this research. Just over 52% of the sample reported high or very high levels of interaction with vice-principals. However, it is worth mentioning that 36.4% responded with “N/A” when asked about their interactions with vice-principals. As expected, elementary principals reported higher levels of interaction with Early Childhood Educators (ECEs), parents/guardians, and their administrative assistants. Secondary school principals reported higher levels of interaction with vice-principals. As part of their position, principals are occasionally asked to interact with stakeholders and professionals from outside of the school. Table 6 displays the level of interaction principals have with stakeholders and personnel who are not affiliated with or employed by their school. Table 6: Principals’ Level of Interaction with Stakeholders and Professionals Outside of the School
Very Low Low Moderate High
Very High N/A
Board office staff 6.9% 23.0% 48.7% 16.1% 4.3% 0.1%
Other principals 6.7% 29.8% 44.1% 15.1% 3.3% 0.2%
Superintendent 14.6% 38.7% 35.2% 8.2% 2.4% 0.3%
Community services agencies 27.4% 38.6% 22.5% 7.8% 2.0% 0.8%
Law enforcement officers 41.5% 33.4% 16.9% 4.2% 1.0% 2.3%
Psychologists 34.1% 36.9% 21.1% 3.1% 0.6% 3.3%
Mental health agencies 42.3% 32.0% 14.7% 5.1% 1.5% 3.6%
Community representatives 50.6% 28.0% 10.7% 1.3% 0.6% 7.9%
20
Public health nurses 55.0% 25.5% 7.6% 0.6% 0.1% 10.5%
Child and youth workers 31.0% 24.0% 17.6% 7.9% 3.7% 14.7%
Rental groups 52.1% 19.4% 7.8% 1.5% 0.6% 17.6%
Other 6.1% 1.6% 2.2% 1.7% 0.4% 28.0%
Settlement workers in schools 38.2% 15.1% 8.3% 2.0% 0.8% 34.2%
Based on these findings, it does seem that principals have limited access to supports and resources outside of their school. For instance, only 20.4% of the sample reported high or very high levels of interaction with school board staff. This is followed by 18.4% of principals indicating that they have high or very high levels of interaction with other principals. The only other group of stakeholders outside of the schools’ sphere of influence with whom principals have high levels of interaction is superintendents; just over 10% of the sample reported high or very high levels of interaction with their superintendent. There are some important differences between the elementary and secondary panels that emerged from this data. For instance, secondary principals have higher levels of interaction with school board staff (28.1% responded high/very high) and their superintendents (20.9% of secondary school principals responded high/very high compared to 7.4% of elementary principals). Secondary principals also reported higher levels of interaction with law enforcement (17.0%) than their peers in elementary school (2.7%). All other findings were consistent across panels. Duties and Responsibilities. A number of recent changes to the educational landscape have altered the work principals do on a daily basis. This subsection highlights the nature of school-based programs that impact principals’ work, as well as an analysis of recent provincial policy decisions that influence principals’ work.
21
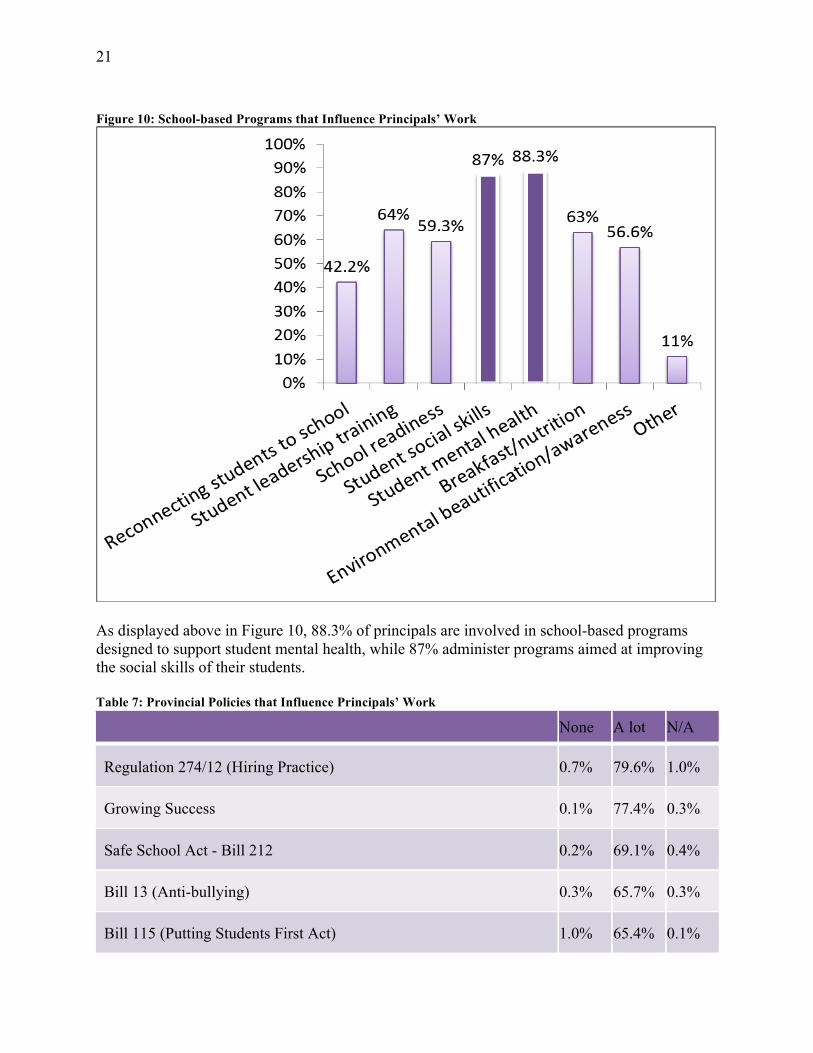
Figure 10: School-based Programs that Influence Principals’ Work
As displayed above in Figure 10, 88.3% of principals are involved in school-based programs designed to support student mental health, while 87% administer programs aimed at improving the social skills of their students. Table 7: Provincial Policies that Influence Principals’ Work
None A lot N/A
Regulation 274/12 (Hiring Practice) 0.7% 79.6% 1.0%
Growing Success 0.1% 77.4% 0.3%
Safe School Act - Bill 212 0.2% 69.1% 0.4%
Bill 13 (Anti-bullying) 0.3% 65.7% 0.3%
Bill 115 (Putting Students First Act) 1.0% 65.4% 0.1%
22
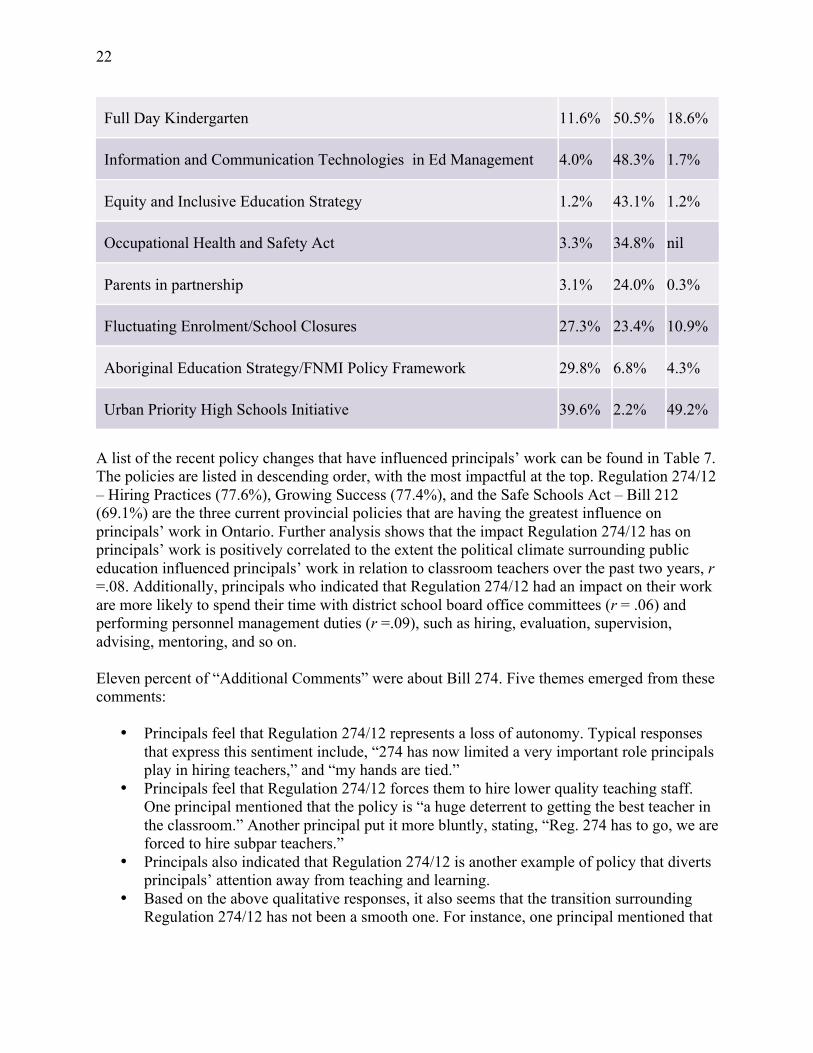
Full Day Kindergarten 11.6% 50.5% 18.6%
Information and Communication Technologies in Ed Management 4.0% 48.3% 1.7%
Equity and Inclusive Education Strategy 1.2% 43.1% 1.2%
Occupational Health and Safety Act 3.3% 34.8% nil
Parents in partnership 3.1% 24.0% 0.3%
Fluctuating Enrolment/School Closures 27.3% 23.4% 10.9%
Aboriginal Education Strategy/FNMI Policy Framework 29.8% 6.8% 4.3%
Urban Priority High Schools Initiative 39.6% 2.2% 49.2%
A list of the recent policy changes that have influenced principals’ work can be found in Table 7. The policies are listed in descending order, with the most impactful at the top. Regulation 274/12 – Hiring Practices (77.6%), Growing Success (77.4%), and the Safe Schools Act – Bill 212 (69.1%) are the three current provincial policies that are having the greatest influence on principals’ work in Ontario. Further analysis shows that the impact Regulation 274/12 has on principals’ work is positively correlated to the extent the political climate surrounding public education influenced principals’ work in relation to classroom teachers over the past two years, r =.08. Additionally, principals who indicated that Regulation 274/12 had an impact on their work are more likely to spend their time with district school board office committees (r = .06) and performing personnel management duties (r =.09), such as hiring, evaluation, supervision, advising, mentoring, and so on. Eleven percent of “Additional Comments” were about Bill 274. Five themes emerged from these comments:
• Principals feel that Regulation 274/12 represents a loss of autonomy. Typical responses that express this sentiment include, “274 has now limited a very important role principals play in hiring teachers,” and “my hands are tied.”
• Principals feel that Regulation 274/12 forces them to hire lower quality teaching staff. One principal mentioned that the policy is “a huge deterrent to getting the best teacher in the classroom.” Another principal put it more bluntly, stating, “Reg. 274 has to go, we are forced to hire subpar teachers.”
• Principals also indicated that Regulation 274/12 is another example of policy that diverts principals’ attention away from teaching and learning.
• Based on the above qualitative responses, it also seems that the transition surrounding Regulation 274/12 has not been a smooth one. For instance, one principal mentioned that
23
“new processes with Reg 274 /12 are especially time consuming, and not in the best interests of students.”
• Regulation 274/12 is a barrier to having a more representative population of teachers in the classroom: “Reg. 274 is the biggest blocker to diversity and representation of all cultures in the educational system.”
Principals who indicated the Growing Success policy influenced their work were more likely to spend their time on curriculum and instructional leadership (r =.10), budget (r = .06), internal school management (r = .08), and walking hallways, playground, and lunchrooms (r = .05). Time was likely to be spent on student discipline/attendance (r = .12) and working with parents (r = .07) if principals spoke of the impact of Bill 212 on their work. Accountability and External Influences. Based on their responses to the online survey, principals feel accountable to a number of different stakeholders. The levels of accountability principals feel towards each of these stakeholders are listed in descending order below:
• The students • Their staff • Parents/Community • Employer • Ministry of Education • Themselves and their family • God/church/synagogue/mosque
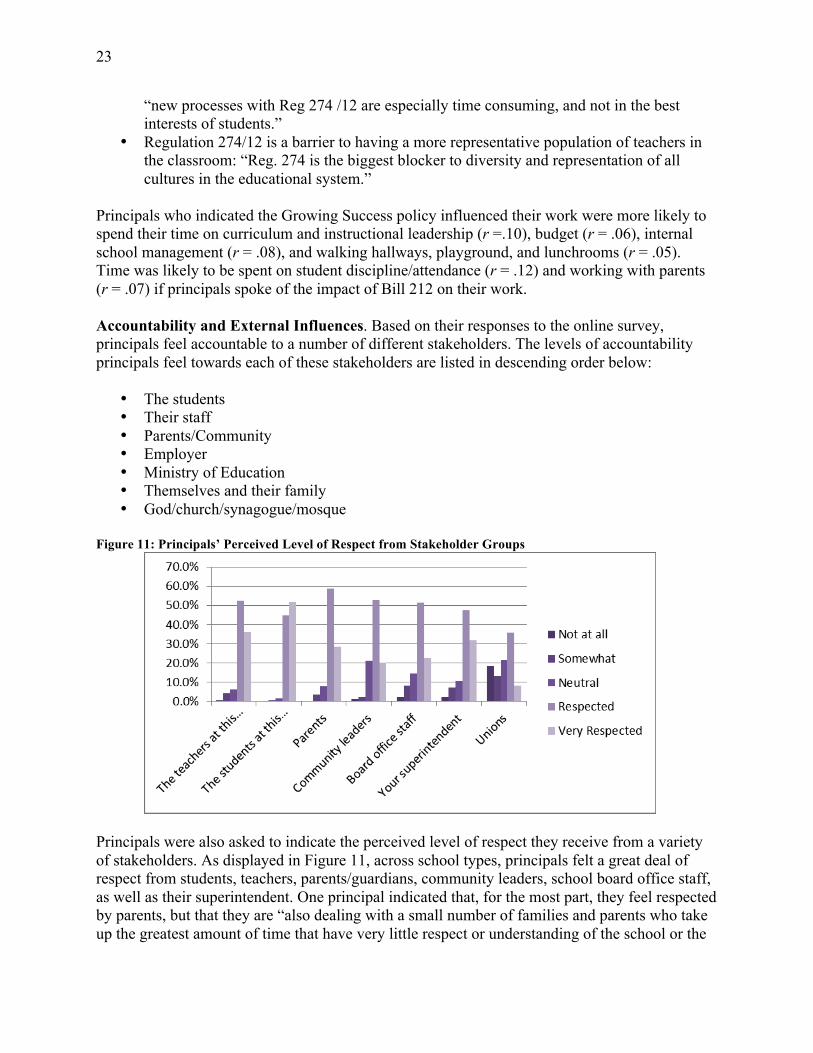
Figure 11: Principals’ Perceived Level of Respect from Stakeholder Groups
Principals were also asked to indicate the perceived level of respect they receive from a variety of stakeholders. As displayed in Figure 11, across school types, principals felt a great deal of respect from students, teachers, parents/guardians, community leaders, school board office staff, as well as their superintendent. One principal indicated that, for the most part, they feel respected by parents, but that they are “also dealing with a small number of families and parents who take up the greatest amount of time that have very little respect or understanding of the school or the
24
administration in the building.” However, principals perceive that they are less respected by provincial teachers’ unions; 18.5% of the entire sample responded “not at all” when asked if they felt respected by these unions. It appears that this finding is largely isolated to elementary school principals, as 21.2% of elementary school principals indicated that they are not respected at all by the teachers’ unions, while only 11.7% of secondary school principals echoed that sentiment. Less than 10% of principals who responded to this survey question felt “very respected” by the provincial teacher unions, which is significantly lower than any of the other stakeholder groups. There were also 854 principals who offered additional comments when asked about the groups to which they felt most accountable. Two themes emerged from this qualitative data. First, principals indicated that it is a challenge facing and fulfilling multiple accountability expectations on a daily basis. For instance, one principal mentioned:
“I/we feel that we are put into an impossible position. On one hand we are told/expected to maintain excellent labour relations (because we know this has a significant impact on student achievement). On the other hand we are expected to hold teachers accountable and enforce changes and expectations.”
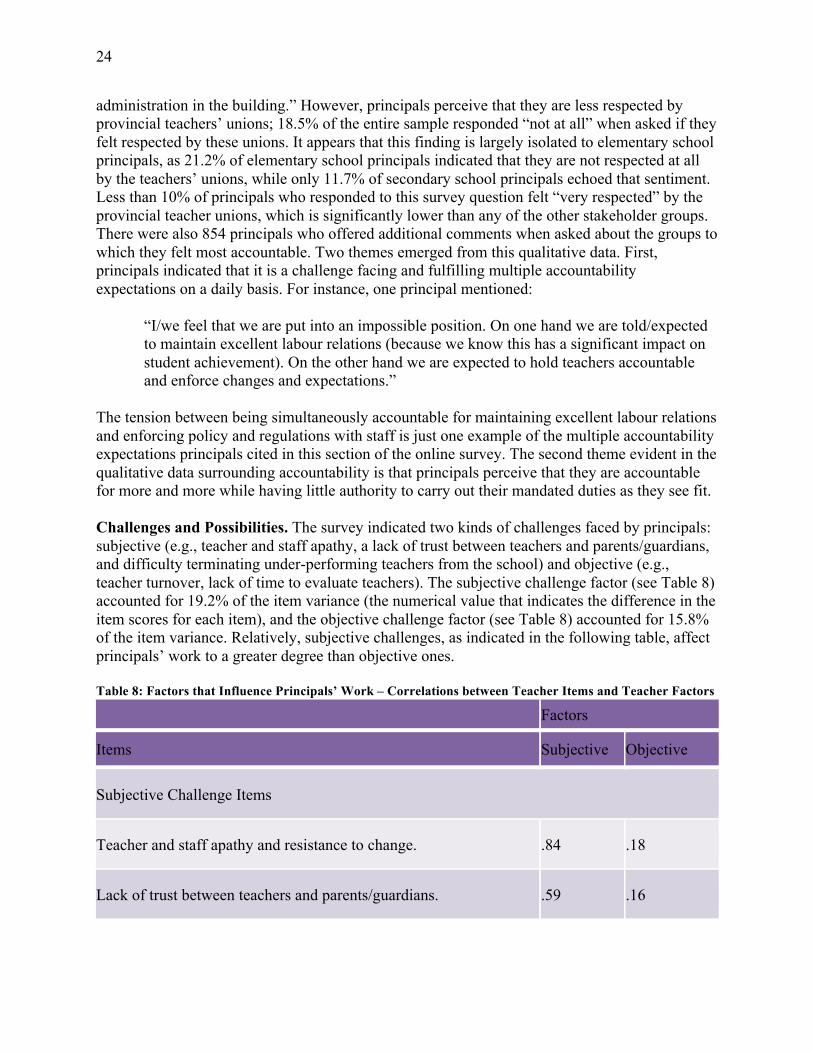
The tension between being simultaneously accountable for maintaining excellent labour relations and enforcing policy and regulations with staff is just one example of the multiple accountability expectations principals cited in this section of the online survey. The second theme evident in the qualitative data surrounding accountability is that principals perceive that they are accountable for more and more while having little authority to carry out their mandated duties as they see fit. Challenges and Possibilities. The survey indicated two kinds of challenges faced by principals: subjective (e.g., teacher and staff apathy, a lack of trust between teachers and parents/guardians, and difficulty terminating under-performing teachers from the school) and objective (e.g., teacher turnover, lack of time to evaluate teachers). The subjective challenge factor (see Table 8) accounted for 19.2% of the item variance (the numerical value that indicates the difference in the item scores for each item), and the objective challenge factor (see Table 8) accounted for 15.8% of the item variance. Relatively, subjective challenges, as indicated in the following table, affect principals’ work to a greater degree than objective ones. Table 8: Factors that Influence Principals’ Work – Correlations between Teacher Items and Teacher Factors
Factors
Items Subjective Objective
Subjective Challenge Items
Teacher and staff apathy and resistance to change. .84 .18
Lack of trust between teachers and parents/guardians. .59 .16
25
Lack of teacher knowledge and skills. .43 .36
Difficulty terminating under-performing teachers from the school. .42 .36
Objective Challenge Items
Difficulty recruiting and hiring the right teachers. .24 .49
Lack of time to evaluate teachers. .19 .58
Teacher turnover. .12 .39
Lack of time for teacher planning and PD. .11 .48
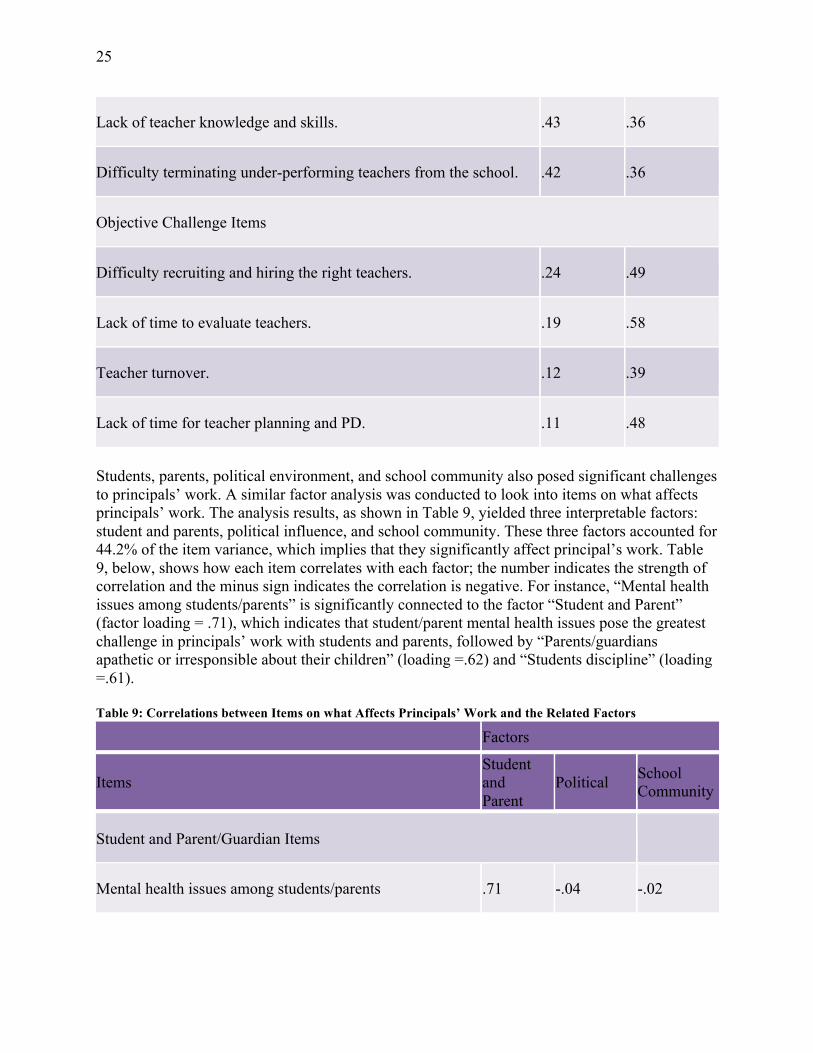
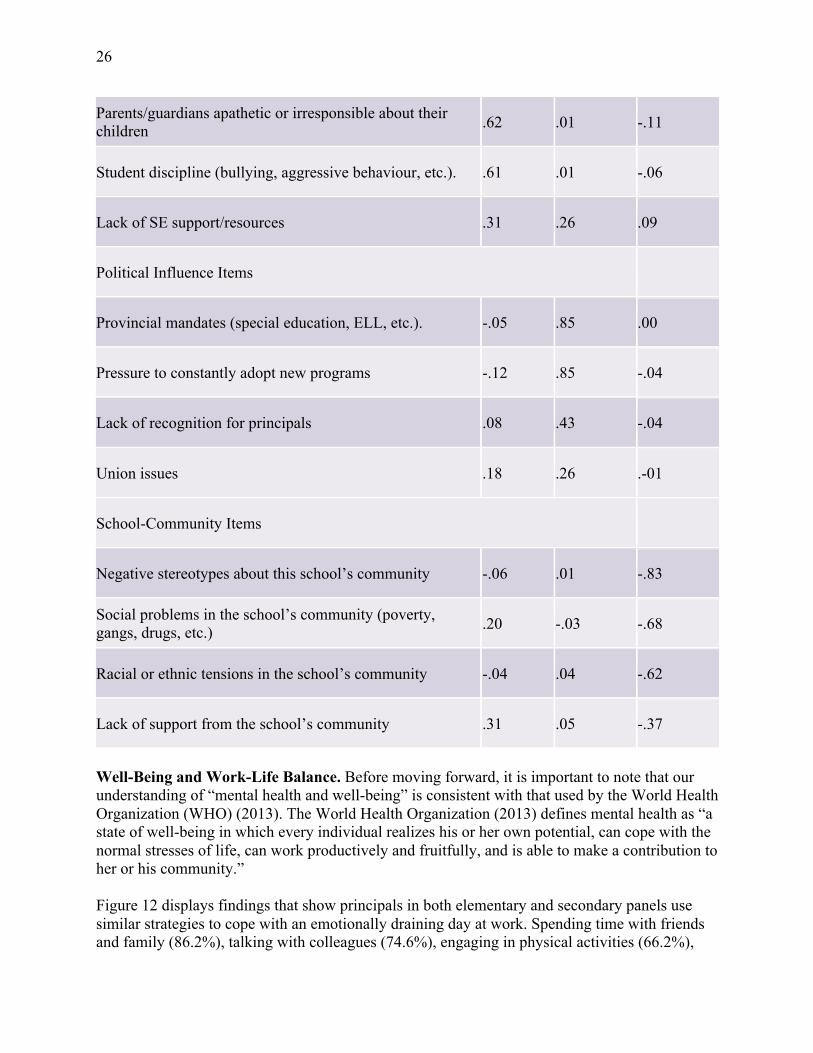
Students, parents, political environment, and school community also posed significant challenges to principals’ work. A similar factor analysis was conducted to look into items on what affects principals’ work. The analysis results, as shown in Table 9, yielded three interpretable factors: student and parents, political influence, and school community. These three factors accounted for 44.2% of the item variance, which implies that they significantly affect principal’s work. Table 9, below, shows how each item correlates with each factor; the number indicates the strength of correlation and the minus sign indicates the correlation is negative. For instance, “Mental health issues among students/parents” is significantly connected to the factor “Student and Parent” (factor loading = .71), which indicates that student/parent mental health issues pose the greatest challenge in principals’ work with students and parents, followed by “Parents/guardians apathetic or irresponsible about their children” (loading =.62) and “Students discipline” (loading =.61). Table 9: Correlations between Items on what Affects Principals’ Work and the Related Factors
Factors
Items Student and Parent
Political School Community
Student and Parent/Guardian Items
Mental health issues among students/parents .71 -.04 -.02
26
Parents/guardians apathetic or irresponsible about their children .62 .01 -.11
Student discipline (bullying, aggressive behaviour, etc.). .61 .01 -.06
Lack of SE support/resources .31 .26 .09
Political Influence Items
Provincial mandates (special education, ELL, etc.). -.05 .85 .00
Pressure to constantly adopt new programs -.12 .85 -.04
Lack of recognition for principals .08 .43 -.04
Union issues .18 .26 .-01
School-Community Items
Negative stereotypes about this school’s community -.06 .01 -.83
Social problems in the school’s community (poverty, gangs, drugs, etc.) .20 -.03 -.68
Racial or ethnic tensions in the school’s community -.04 .04 -.62
Lack of support from the school’s community .31 .05 -.37
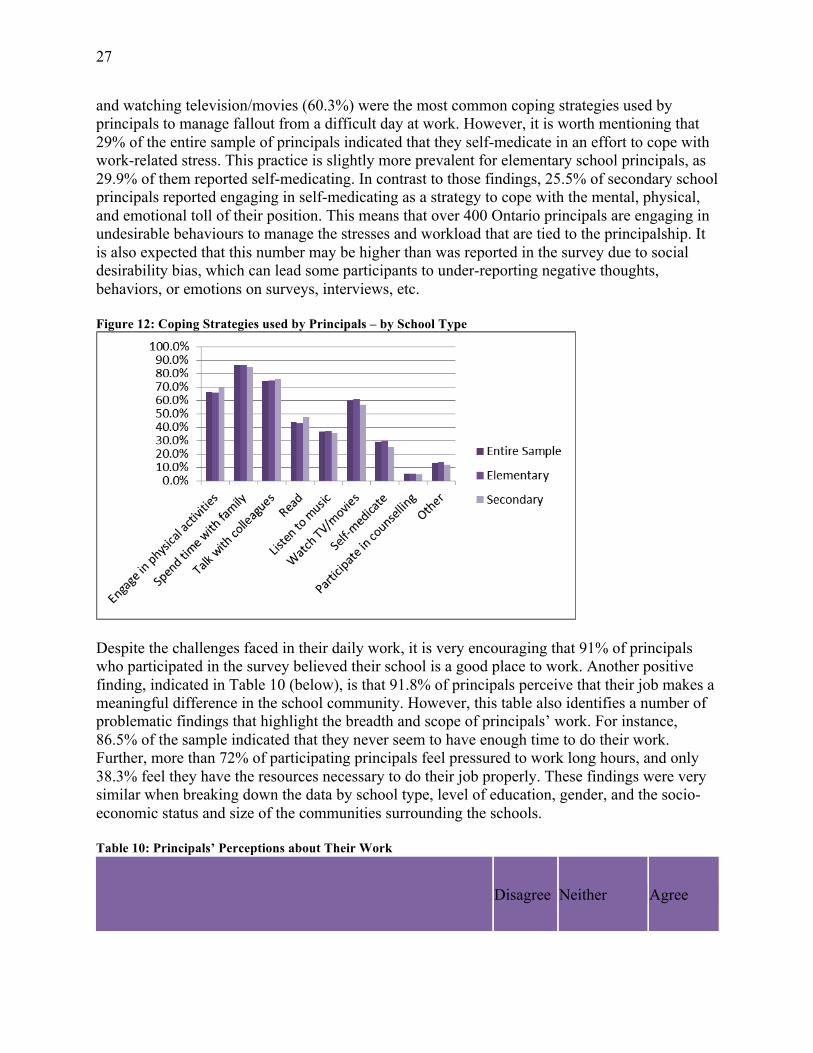
Well-Being and Work-Life Balance. Before moving forward, it is important to note that our understanding of “mental health and well-being” is consistent with that used by the World Health Organization (WHO) (2013). The World Health Organization (2013) defines mental health as “a state of well-being in which every individual realizes his or her own potential, can cope with the normal stresses of life, can work productively and fruitfully, and is able to make a contribution to her or his community.” Figure 12 displays findings that show principals in both elementary and secondary panels use similar strategies to cope with an emotionally draining day at work. Spending time with friends and family (86.2%), talking with colleagues (74.6%), engaging in physical activities (66.2%),
27
and watching television/movies (60.3%) were the most common coping strategies used by principals to manage fallout from a difficult day at work. However, it is worth mentioning that 29% of the entire sample of principals indicated that they self-medicate in an effort to cope with work-related stress. This practice is slightly more prevalent for elementary school principals, as 29.9% of them reported self-medicating. In contrast to those findings, 25.5% of secondary school principals reported engaging in self-medicating as a strategy to cope with the mental, physical, and emotional toll of their position. This means that over 400 Ontario principals are engaging in undesirable behaviours to manage the stresses and workload that are tied to the principalship. It is also expected that this number may be higher than was reported in the survey due to social desirability bias, which can lead some participants to under-reporting negative thoughts, behaviors, or emotions on surveys, interviews, etc. Figure 12: Coping Strategies used by Principals – by School Type
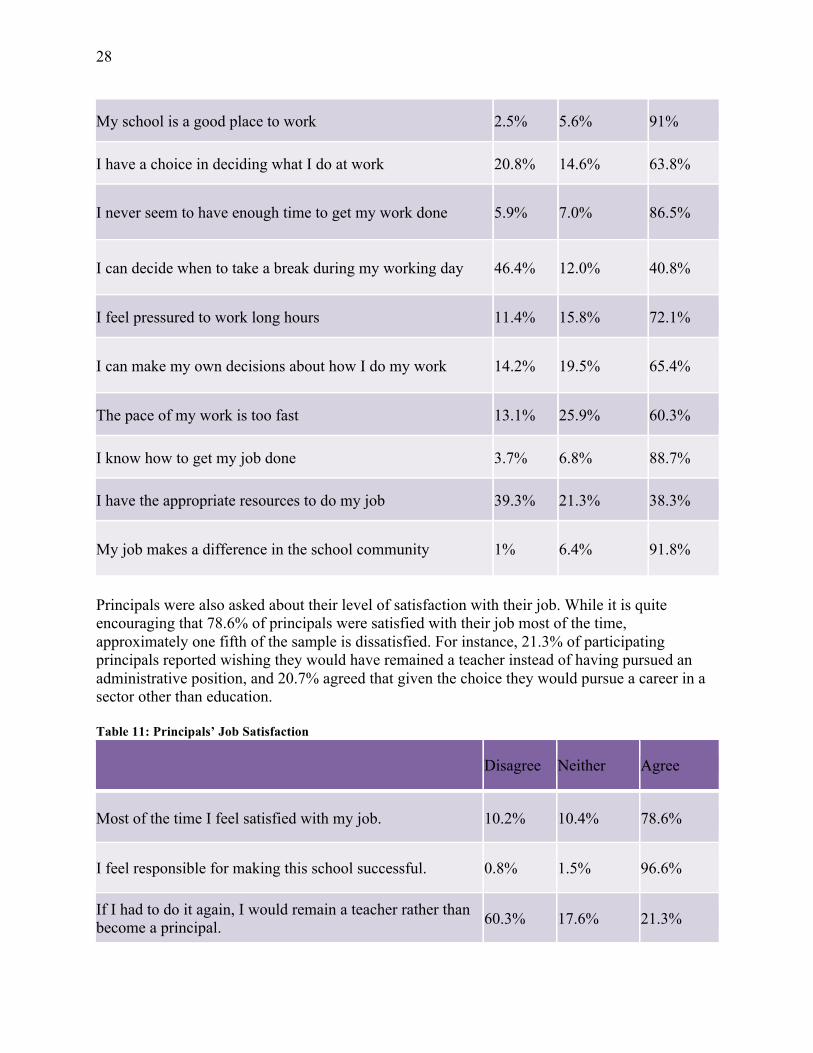
Despite the challenges faced in their daily work, it is very encouraging that 91% of principals who participated in the survey believed their school is a good place to work. Another positive finding, indicated in Table 10 (below), is that 91.8% of principals perceive that their job makes a meaningful difference in the school community. However, this table also identifies a number of problematic findings that highlight the breadth and scope of principals’ work. For instance, 86.5% of the sample indicated that they never seem to have enough time to do their work. Further, more than 72% of participating principals feel pressured to work long hours, and only 38.3% feel they have the resources necessary to do their job properly. These findings were very similar when breaking down the data by school type, level of education, gender, and the socio-economic status and size of the communities surrounding the schools. Table 10: Principals’ Perceptions about Their Work
Disagree Neither Agree
28
My school is a good place to work 2.5% 5.6% 91%
I have a choice in deciding what I do at work 20.8% 14.6% 63.8%
I never seem to have enough time to get my work done 5.9% 7.0% 86.5%
I can decide when to take a break during my working day 46.4% 12.0% 40.8%
I feel pressured to work long hours 11.4% 15.8% 72.1%
I can make my own decisions about how I do my work 14.2% 19.5% 65.4%
The pace of my work is too fast 13.1% 25.9% 60.3%
I know how to get my job done 3.7% 6.8% 88.7%
I have the appropriate resources to do my job 39.3% 21.3% 38.3%
My job makes a difference in the school community 1% 6.4% 91.8% Principals were also asked about their level of satisfaction with their job. While it is quite encouraging that 78.6% of principals were satisfied with their job most of the time, approximately one fifth of the sample is dissatisfied. For instance, 21.3% of participating principals reported wishing they would have remained a teacher instead of having pursued an administrative position, and 20.7% agreed that given the choice they would pursue a career in a sector other than education. Table 11: Principals’ Job Satisfaction
Disagree Neither Agree
Most of the time I feel satisfied with my job. 10.2% 10.4% 78.6%
I feel responsible for making this school successful. 0.8% 1.5% 96.6%
If I had to do it again, I would remain a teacher rather than become a principal. 60.3% 17.6% 21.3%
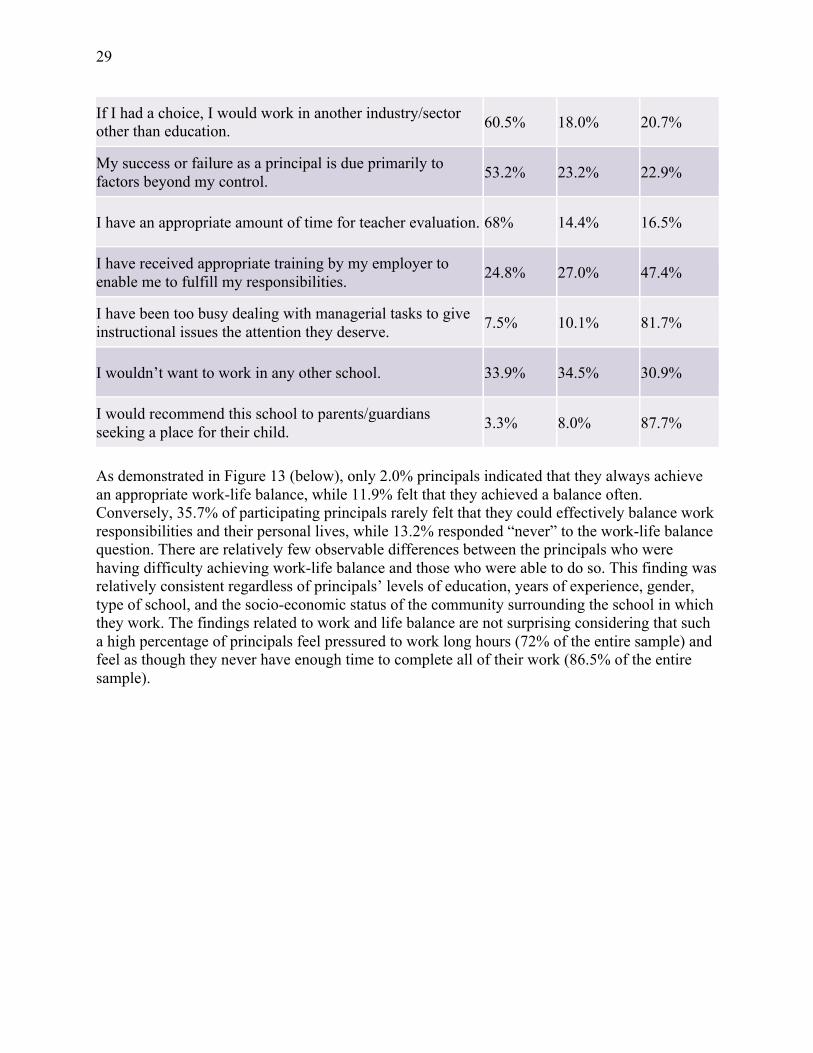
29
If I had a choice, I would work in another industry/sector other than education. 60.5% 18.0% 20.7%
My success or failure as a principal is due primarily to factors beyond my control. 53.2% 23.2% 22.9%
I have an appropriate amount of time for teacher evaluation. 68% 14.4% 16.5%
I have received appropriate training by my employer to enable me to fulfill my responsibilities. 24.8% 27.0% 47.4%
I have been too busy dealing with managerial tasks to give instructional issues the attention they deserve. 7.5% 10.1% 81.7%
I wouldn’t want to work in any other school. 33.9% 34.5% 30.9%
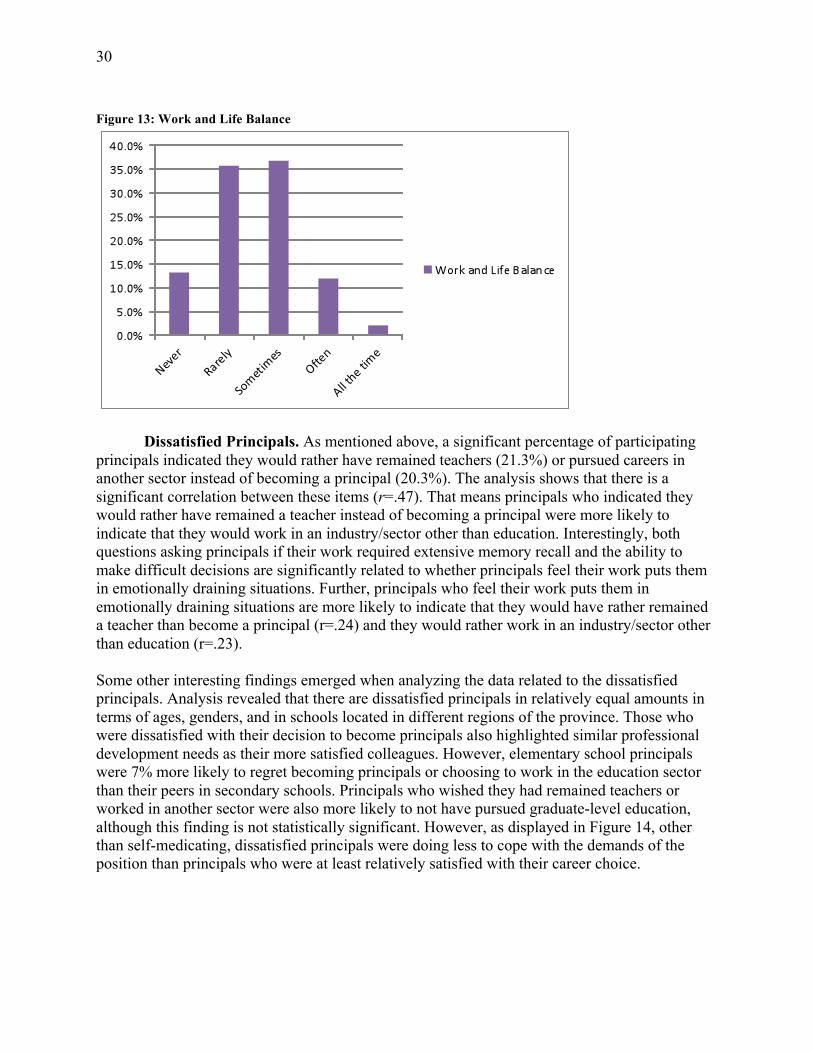
I would recommend this school to parents/guardians seeking a place for their child. 3.3% 8.0% 87.7% As demonstrated in Figure 13 (below), only 2.0% principals indicated that they always achieve an appropriate work-life balance, while 11.9% felt that they achieved a balance often. Conversely, 35.7% of participating principals rarely felt that they could effectively balance work responsibilities and their personal lives, while 13.2% responded “never” to the work-life balance question. There are relatively few observable differences between the principals who were having difficulty achieving work-life balance and those who were able to do so. This finding was relatively consistent regardless of principals’ levels of education, years of experience, gender, type of school, and the socio-economic status of the community surrounding the school in which they work. The findings related to work and life balance are not surprising considering that such a high percentage of principals feel pressured to work long hours (72% of the entire sample) and feel as though they never have enough time to complete all of their work (86.5% of the entire sample).
30
Figure 13: Work and Life Balance
Dissatisfied Principals. As mentioned above, a significant percentage of participating
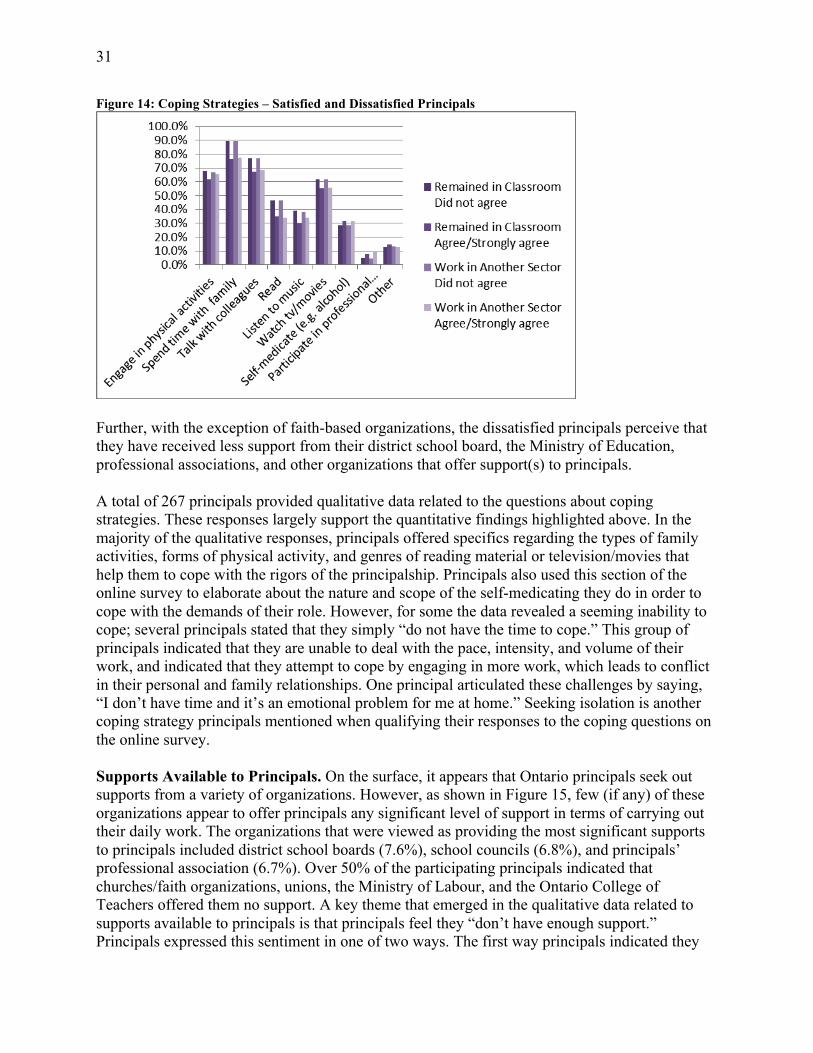
principals indicated they would rather have remained teachers (21.3%) or pursued careers in another sector instead of becoming a principal (20.3%). The analysis shows that there is a significant correlation between these items (r=.47). That means principals who indicated they would rather have remained a teacher instead of becoming a principal were more likely to indicate that they would work in an industry/sector other than education. Interestingly, both questions asking principals if their work required extensive memory recall and the ability to make difficult decisions are significantly related to whether principals feel their work puts them in emotionally draining situations. Further, principals who feel their work puts them in emotionally draining situations are more likely to indicate that they would have rather remained a teacher than become a principal (r=.24) and they would rather work in an industry/sector other than education (r=.23). Some other interesting findings emerged when analyzing the data related to the dissatisfied principals. Analysis revealed that there are dissatisfied principals in relatively equal amounts in terms of ages, genders, and in schools located in different regions of the province. Those who were dissatisfied with their decision to become principals also highlighted similar professional development needs as their more satisfied colleagues. However, elementary school principals were 7% more likely to regret becoming principals or choosing to work in the education sector than their peers in secondary schools. Principals who wished they had remained teachers or worked in another sector were also more likely to not have pursued graduate-level education, although this finding is not statistically significant. However, as displayed in Figure 14, other than self-medicating, dissatisfied principals were doing less to cope with the demands of the position than principals who were at least relatively satisfied with their career choice.
31
Figure 14: Coping Strategies – Satisfied and Dissatisfied Principals
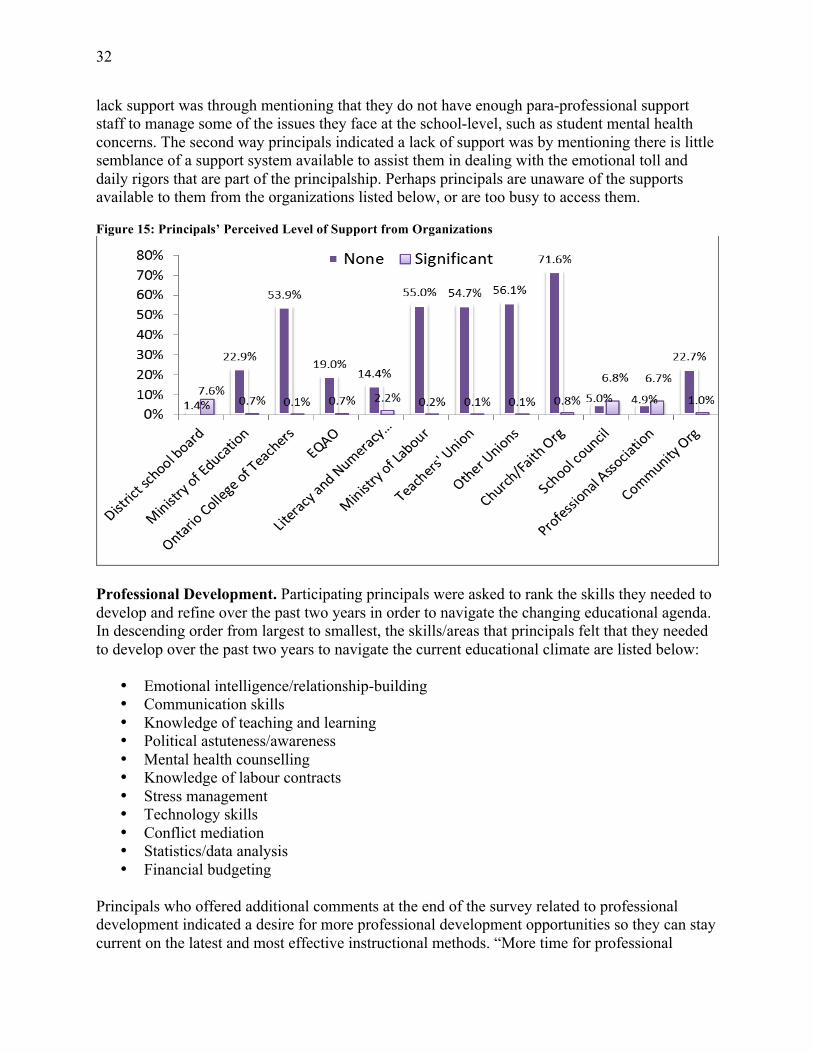
Further, with the exception of faith-based organizations, the dissatisfied principals perceive that they have received less support from their district school board, the Ministry of Education, professional associations, and other organizations that offer support(s) to principals. A total of 267 principals provided qualitative data related to the questions about coping strategies. These responses largely support the quantitative findings highlighted above. In the majority of the qualitative responses, principals offered specifics regarding the types of family activities, forms of physical activity, and genres of reading material or television/movies that help them to cope with the rigors of the principalship. Principals also used this section of the online survey to elaborate about the nature and scope of the self-medicating they do in order to cope with the demands of their role. However, for some the data revealed a seeming inability to cope; several principals stated that they simply “do not have the time to cope.” This group of principals indicated that they are unable to deal with the pace, intensity, and volume of their work, and indicated that they attempt to cope by engaging in more work, which leads to conflict in their personal and family relationships. One principal articulated these challenges by saying, “I don’t have time and it’s an emotional problem for me at home.” Seeking isolation is another coping strategy principals mentioned when qualifying their responses to the coping questions on the online survey. Supports Available to Principals. On the surface, it appears that Ontario principals seek out supports from a variety of organizations. However, as shown in Figure 15, few (if any) of these organizations appear to offer principals any significant level of support in terms of carrying out their daily work. The organizations that were viewed as providing the most significant supports to principals included district school boards (7.6%), school councils (6.8%), and principals’ professional association (6.7%). Over 50% of the participating principals indicated that churches/faith organizations, unions, the Ministry of Labour, and the Ontario College of Teachers offered them no support. A key theme that emerged in the qualitative data related to supports available to principals is that principals feel they “don’t have enough support.” Principals expressed this sentiment in one of two ways. The first way principals indicated they
32
lack support was through mentioning that they do not have enough para-professional support staff to manage some of the issues they face at the school-level, such as student mental health concerns. The second way principals indicated a lack of support was by mentioning there is little semblance of a support system available to assist them in dealing with the emotional toll and daily rigors that are part of the principalship. Perhaps principals are unaware of the supports available to them from the organizations listed below, or are too busy to access them. Figure 15: Principals’ Perceived Level of Support from Organizations
Professional Development. Participating principals were asked to rank the skills they needed to develop and refine over the past two years in order to navigate the changing educational agenda. In descending order from largest to smallest, the skills/areas that principals felt that they needed to develop over the past two years to navigate the current educational climate are listed below:
• Emotional intelligence/relationship-building • Communication skills • Knowledge of teaching and learning • Political astuteness/awareness • Mental health counselling • Knowledge of labour contracts • Stress management • Technology skills • Conflict mediation • Statistics/data analysis • Financial budgeting
Principals who offered additional comments at the end of the survey related to professional development indicated a desire for more professional development opportunities so they can stay current on the latest and most effective instructional methods. “More time for professional
33
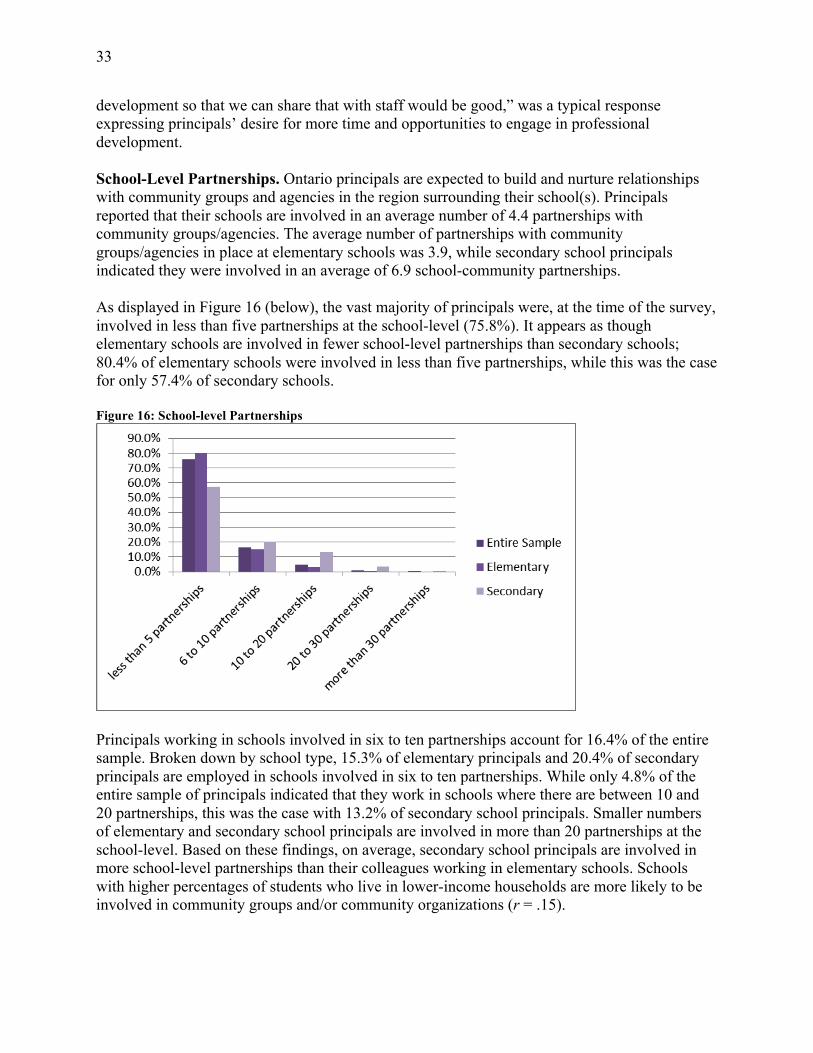
development so that we can share that with staff would be good,” was a typical response expressing principals’ desire for more time and opportunities to engage in professional development. School-Level Partnerships. Ontario principals are expected to build and nurture relationships with community groups and agencies in the region surrounding their school(s). Principals reported that their schools are involved in an average number of 4.4 partnerships with community groups/agencies. The average number of partnerships with community groups/agencies in place at elementary schools was 3.9, while secondary school principals indicated they were involved in an average of 6.9 school-community partnerships. As displayed in Figure 16 (below), the vast majority of principals were, at the time of the survey, involved in less than five partnerships at the school-level (75.8%). It appears as though elementary schools are involved in fewer school-level partnerships than secondary schools; 80.4% of elementary schools were involved in less than five partnerships, while this was the case for only 57.4% of secondary schools. Figure 16: School-level Partnerships
Principals working in schools involved in six to ten partnerships account for 16.4% of the entire sample. Broken down by school type, 15.3% of elementary principals and 20.4% of secondary principals are employed in schools involved in six to ten partnerships. While only 4.8% of the entire sample of principals indicated that they work in schools where there are between 10 and 20 partnerships, this was the case with 13.2% of secondary school principals. Smaller numbers of elementary and secondary school principals are involved in more than 20 partnerships at the school-level. Based on these findings, on average, secondary school principals are involved in more school-level partnerships than their colleagues working in elementary schools. Schools with higher percentages of students who live in lower-income households are more likely to be involved in community groups and/or community organizations (r = .15).
34
A total of 1,240 principals provided additional comments when responding to questions on the topic of school-level partnerships. Essentially, the vast majority of respondents make the claim that such programs add to the workload of the school principals. As one principal mentioned, work related to school-level partnerships “makes my briefcase heavier each night.” The impact of school-level partnerships and programs on principals’ workload occurred by both adding tasks and activities to principals’ workload, while also diminishing the time available to engage in high-priority tasks and activities, such as those related to instruction. Principals reported that school-level partnerships add to their workload in the following ways:
• it takes time to build and sustain meaningful partnerships at the school-level; • engaging in partnerships has the potential to extend a principal’s workday, both in terms
of time spent at the school and work completed from their home office; • it increases the amount of paperwork and e-mail a principal receives; • staff are reluctant to take on these responsibilities, so principals are often left to
implement, monitor, and coordinate school-level partnerships and external programming; • additional time is needed to communicate and engage parents and the school community
surrounding the various partnerships occurring at the school-level.
As mentioned above, principals also reported that engaging in work surrounding school-level partnerships decreases the time available to complete other, often high-priority tasks, such as:
• other school priorities; • instructional leadership and classroom observation; • interacting with students; and • supervising lunch/breaks.
It is also worth mentioning that many principals indicated that school-level partnerships surrounding student mental health concerns increase their workload dramatically. Analysis suggests that student mental health is becoming a serious concern for principals because students are coming to school with greater needs than in the past. One principal who responded to the online survey mentioned that schools now face “far greater demands in terms of mental health issues for students, the community partners are also facing cuts which makes providing for students more difficult.” As demonstrated in the quote above, principals also reported that community agencies and supports are facing funding cuts, which means that that the school often becomes the only place where some students in distress can receive assistance. Principals, teachers, and those who work in schools are increasingly being looked upon as front-line mental health workers, though they require additional training, knowledge, and competencies to perform this new role expectation. Section Four - Recommendations Survey respondents were generous in dedicating time during their busy days to provide responses and information that allow us to make recommendations to the OPC and to current and aspiring principals with confidence.
35
Ontario Principals’ Council. The Ontario Principals’ Council has been active in representing its members in a number of ways, such as providing legal representation, providing professional development, funding research for practice, facilitating research into practice, and advocating for its membership. Recommendations based on this study fall into two general categories: support and advocacy.
Support. The OPC has a long history of supporting its members through a number of approaches. The recommendations below are meant to complement existing support activities and should be taken into consideration, in concert with the Ministry of Education and local District School Boards, for future support endeavours.
a) Engage Dissatisfied Principals: While the principal workforce appears to be overall positive towards their work, there remains recurring themes from the survey data that in-dicate a sub-group of administrators are not coping well, or are unengaged or disgruntled with their work. This knowledge will require OPC to consider how to support member-ship in the future.
b) Communicate Supports to All Principals: Our analysis indicated that principals’ work can be isolating. When asked what organizations provided the most significant supports to principals professional associations were the third of the top three mentioned (district school boards [7.6%], school councils [6.8%] and professional association [6.7%]). Therefore, further consideration should be given in how to better communicate existing supports for principals and determine whether other additional supports are required.
c) Provide Effective Professional Development that is Aligned with Principals’ Work: Principals were clear about the top three areas in which they needed to seek additional professional learning. These included, in order of priority: 1) emotional intelli-gence/relationship-building; 2) communication skills; and 3) knowledge of teaching and learning. However, other survey responses indicate that principals also spend substantial time dealing with student mental health issues. We recommend that OPC continue to de-velop and deliver professional learning opportunities in these key areas including issues around mental health.
d) Support Healthy Work Environments: Our findings around mental health and wellness indicate that the OPC should include attention to the provision of guidance and support for its members to not only prevent burnout but to foster a healthy workforce.
e) Change the Culture: The survey findings suggest that OPC members are extremely dedi-cated, as most respondents indicated they are satisfied with their decisions to become principals despite working long hours, feeling less respected by teacher unions, and feel-ing like they have little time to complete all of their work. The qualitative findings strongly indicated that principals’ workloads leave little opportunity for them to engage in healthy behaviors, such as taking legally mandated 15 minute breaks, using sick days when necessary, regularly eating lunch, or taking time away from the school to engage in professional learning. These activities are designed to make the principalship more man-ageable. The OPC could work with their members, as well as with aspiring principals, to change the culture surrounding principals and their own expectations of their work and roles in the school by encouraging principals to engage in these work entitlements and practices.
36
f) Commit to a Diverse Workforce: Our data analysis confirms what has been reported elsewhere (see Ryan, Pollock & Antonelli, 2009, for example): that the principal work-force is not diverse in terms of race and ethnicity. While Regulation 274/12 severely limits principals’ opportunities to support a diverse workforce, the OPC can actively sup-port and mentor aspiring principals from visible minoritized groups to pursue official school leadership positions.
g) Build Research Partnerships: In an effort to provide members information based on research evidence and in a timely manner, OPC should continue to build partnerships and networks with research organizations such as universities. These efforts will continue to bridge the knowledge-practice gap and help build capacity within the principal workforce.
h) Further Research: The overwhelming response from principals indicates that OPC has touched on an area that its membership is interested in/concerned about, and we encourage the OPC to continue this line of research. One immediate approach is to figure out what kind of role vice-principals play given the intensification of principals’ work. Do vice-principals also experience the same scarcity of time, stress from work, and mental health issues as principals? In what ways? This line of research can be framed in a way that would allow comparison between the work of vice-principals and principals. The overwhelming response from vice-principals who wanted to participate in this study and their disappointment that they could not indicates that vice-principals want a voice in the research. With 52.5% (36.4% responded with “N/A”) of the sample reporting high or very high levels of interaction with vice-principals, our findings indicate that vice-principals play a vital role in many schools. Another argument for considering the work of vice-principals is that, for the most part, their work has been largely ignored. Recently they have been included in transitional studies that are narrowly defined using a small sample size, or their responses have been included with those of principals. We believe that the work of vice-principals is different from that of a principal, and therefore vice-principals should have their voices heard. A follow-up study on vice-principals’ work could provide in-depth understanding, act as a baseline for future research, and provide additional data to better understand the work of principals.
Advocacy. Since principals were removed from the teacher union, the Ontario Principals’
Council has played an increasingly central role in advocating for principals’ interests with the Ontario provincial government and local district school boards. Recommendations included here support much of the ongoing advocacy work of the OPC.
a) Advocate for District-based Professional Learning: We believe that the OPC should continue to advocate for school districts to provide professional learning for aspiring and practicing principals that addresses many of the issues highlighted in the survey findings.
b) Address the Impact of Regulation 274/12: The OPC should further lobby the Ontario provincial government to address workplace issues, such as the policy and initiative intensification that has increased over the past few decades, specifically Regulation 274/12.
c) Change the Principals’ Qualification Program (PQP): The OPC is encouraged to promote changes to the PQP that i) reflect findings reported and ii) respond to some of the challenges that principals indicated they face on a daily basis.
37
d) Negotiate for Appropriate Benefits: Because principals experience work intensification in a rather isolating work role and cope with their work utilizing individualistic coping strategies, we encourage the OPC to negotiate with the employer for benefits (either increased, additional, or both) such as benefits that cover health services (such as massage, physiotherapy, chiropractic, and professional counseling) or promote healthy living (such as coverage of a nutritionist or for physical activity services like sport or gym membership). Principals should also be encouraged to use these benefits to their full potential.
e) Advocate for Appropriate Resources Supports: Our findings indicate that principals’ work is significantly affected by provincial mandates connected to special education and English-language learners (ELLs). We recommend the OPC advocate for appropriate resources that can support principals working with these specific populations.
f) Develop Productive Working Relationships with Teachers and Teacher Unions: Our findings indicate that teachers affect principals’ work as well. For example, in relation to classroom teachers, the political climate has significantly influenced principals’ work. We recommend that OPC advocate for and work towards creating a healthy and productive relationship with teachers and their unions. This may also mean advocating at the provincial level for changes in workplace relationships.
Current and Aspiring Principals. Survey findings provide some valuable insight for current and aspiring principals in relation to their work. Recommendations included are for individuals seeking ways to more positively engage in their present or future leadership role.
a) Be Informed: We recommend aspiring leaders seek out as much information as possible about the principal’s role through additional professional learning, independent reading, and informal conversations with those currently in the position, so that they have a better understanding of what to expect and a better understanding of the transitional process that comes with entering such a demanding position.
b) Be Proactive: Aspiring and current school principals will need to be proactive about developing their individual skills and knowledge, first by identifying what their strengths are and what they need to improve, then by seeking out helpful resources to support them.
c) Build a Leadership Skill Set: Survey findings indicate that principal practitioners should specifically seek out skills training around four key areas: emotional intelligence/relationship-building; communication skills, knowledge of teaching and learning; and mental health and wellness.
d) Develop Healthy Coping Strategies: As our data analysis demonstrated, principals’ work is time consuming and demanding, and principals are therefore encouraged to build a repertoire of healthy coping strategies that promote positive mental health and wellness.
e) Develop a Supportive Network of Friends, Family, and Fellow Administrators When Transitioning into the Principalship: Survey results indicate that friends, family, and fellow administrators are the three main groups to whom principals turn for support in an effort to cope with the demands of their workload. It is recommended that aspiring principals make efforts to surround themselves with a supportive and encouraging network of friends, family, and fellow administrators when transitioning into the principalship.
38
Section Five - Conclusion and Future Directions The purpose of this research was to examine principals’ work. This was done by exploring how school principals approach their work, how they spend their time, and articulating the challenges and possibilities their work presents to them. This research has found that Ontario principals work approximately 59 hours per week. Though principals with certain characteristics work slightly more hours per week than others, this finding was consistent regardless of the level of education, years of experience, gender, type of school, and the socio-economic status of the community surrounding the school. Principals who responded to the online survey indicated that the three stakeholders to whom they feel most accountable are students, their staff, and parents/the community. Policies have a significant influence on what principals actually do at work. Regulation 274/12 (77.7%), which deals with hiring practices and regulations, Growing Success (77.4%), and the Safe School Act – Bill 212 (69.1%) were cited by the participating principals as having the most influence on what they do on a daily basis. This research also revealed that principals face a number of challenges and possibilities in their daily work. Subjective challenges (e.g., teacher and staff apathy, a lack of trust between teachers and parents/guardians, and difficulty terminating under-performing teachers from the school), affects principals’ work to a greater degree than do objective challenges (e.g., teacher turnover, lack of time to evaluate teachers). It was also revealed through a factor analysis that political issues, student discipline and parent engagement, and working with the school-community influence principals’ work. Student and parent factors, such as mental health concerns, lack of special education training and resources, student discipline, and teacher apathy influence principals’ work more than political and school-community factors. However, political factors influence the work of principals in schools with a heavy union presence, as 18.5% of the entire sample responded “not at all” when asked if they felt respected by the provincial teacher unions. Principals were also asked about the supports they access in order to manage the stress and emotional toll inherent in their work. The organizations that were viewed as providing the most significant supports to principals included district school boards (7.6%), school councils (6.8%), and principals’ professional association (6.7%). Over 50% of the participating principals indicated that churches/faith organizations, unions, the Ministry of Labour, and the Ontario College of Teachers offered them no support at all. Based on the low levels of support received from all organizations, principals were either uninterested/unaware of the current supports available to them, uncomfortable accessing the supports, or simply do not have the time to take care of their own needs. Principals employ a number of strategies to cope with their daily work, including spending time with friends/family, watching television or movies, reading, or by self-medicating, which was the case with 29% of the sample. This practice is slightly more prevalent for elementary school principals. The top three skills/areas in which principals indicated a need to improve are emotional intelligence/relationship-building, communication skills, and knowledge of teaching and learning.
39
The data suggests that dissatisfied principals (those who indicated they would prefer to be teaching [21.3%] and those who wished they had chosen another sector [20.3%]) may feel isolated or underappreciated as they seek out less support than their colleagues who are more satisfied with their decisions to become school principals. The nuanced analysis conducted as part of this research found some minor differences in how principals approach and conduct their work based on the following variables:
• Gender • Level of education • Demographic location of the school • SES of the area surrounding the school • Panel • Ethnic diversity
Each of these differences were mentioned earlier in the report. However, the lack of any major variations in principals’ work across all of those variables implies that the principalship has become so structured and rooted in compliance that there is little room for principals to execute professional judgement or autonomy concerning how they conduct their work.
40
References Adams, T. (2009). The changing nature of professional regulation in Canada, 1867-1961. Social Science History, 33(2), 217-43. Ball, S. J. (2003). The teacher’s soul and the terrors of performativity. Journal of Education Policy 18 (2), 215–228. Belfield, C. (2005). The teacher labour market in the US: Challenges and reforms. Educational Review, 57(2), 175-91. Ben-Peretz, M. (2001). The impossible role of teacher educators in a changing world. Journal of Teacher Education, 52(1), 48-56. Canadian Association of Principals. (1999). Leadership crisis study: Part 1 – 1999. Retrieved from www.cdnprincipals.org Catholic Principals’ Council of Ontario. (2004). Role of the principal action research project: Interim report on workload. Retrieved from: http://www.cpco.on.ca/news/docs/interimreport.pdf Court, M., & O’Neill, J. (2011). ‘Tomorrow's schools’ in New Zealand: From social democracy to market managerialism. Journal of Educational Administration and History, 43(2), 119-140 Dewa, C.S., Dermer, S.W., Chau, N., Lowrey, S., Mawson, S., & Bell, J. (2009). Examination of factors associated with the mental health status of principals. Work, 33(4), 439-448. Draper, J., & McMichael, P. (2003). The rocky road to headship. Australian Journal of Educa-tion, 47(2), 185-197. Fink, D., & Brayman, C. (2006). School leadership succession and the challenges of change. Educational Administration Quarterly, 42(1), 62-89. Fullan, M. (2014). The principal: Three keys to maximizing impact. San Francisco, CA: Jossey- Bass / Ontario Principals’ Council. Gidney, R. (1999). From Hope to Harris: The reshaping of Ontario’s schools. Toronto, Ontario: University of Toronto Press. Goodwin, R. H., Cunningham, M. L., & Childress, R. (2003). The changing role of the secon-dary principal. NASSP Bulletin, 87(634), 26-42. doi: 10.1177/01926365030876340 Grimmett, P.P., & Echols, F.H. (2000). Teacher and administrator shortages in changing times. Canadian Journal of Education, 25(4), 328-343. Gronn, P., & Rawlings-Sanaei, F. (2003). Recruiting principals in a climate of disengagement. Australian Journal of Education, 47(2), 172-184.
41
Hall, C. (2004). Theorizing changes in teachers’ work. Canadian Journal of Educational Administration and Policy, 32(1), 1-4. Hargreaves, A. (1994). Changing teachers, changing times: Teachers' work and culture in the postmodern age. Toronto, Ontario: OISE Press. Harvey, E. B., & Houle, R. (2006). Demographic changes in Canada and their impact on public education. Toronto, Ontario: The Learning Partnership. Haughey, M. (2006). The impact of computers on the work of the principal: Changing discourses on talk, leadership and professionalism, School Leadership & Management, 26(1), 23-36. The Institute for Education Leadership. (2008). Putting Ontario's leadership framework into ac-tion: A guide for school and system leaders. Retrieved from http://www.education-leadership-ontario.ca/files/FrameworkAction.pdf Lingard, B., & Douglas, P. (1999). Men engaging feminisms: Pro-feminism, backlashes and schooling. Buckingham, UK: Open University Press. McGregor, D., Hooker, B., Wise, D., & Devlin, L. (2010). Supporting professional learning through teacher educator enquiries: An ethnographic insight into developing understandings and changing identities. Professional Development in Education, 36(1-2), 37-41. Ontario Principals’ Council. (2001). Unrecognized exodus, unaccepted accountability: The looming shortage of principals and vice principals in Ontario public school boards. Retrieved from: http://principals/ca/documents/QueensStudy_fullreport.pdf Pollock, K. (2008). Occasional teachers’ work engagement: Professional identity, work- related learning and access to the profession and to daily work. Unpublished doctoral thesis. Toronto, Ontario: University of Toronto. Ryan, J. (2006). Inclusive Leadership. San Francisco: Jossey-Bass. Ryan, J. (2007). Dialogue, identity and inclusion: Administrators as mediators in diverse school contexts. Journal of School Leadership. 17(3), 340-369. Sheninger, E. (2014). Digital Leadership: Changing Paradigms for Changing Times. Thousand Oaks, CA: Corwin – A Sage Company / Ontario Principals’ Council. Shields, C. M. (2010). Transformative leadership: Working for equity in diverse contexts. Edu cational Administration Quarterly, 46(4), 558-589 Törnsén, M. (2010). Keys to successful leadership: High support for capable and versatile prin-cipals. The Educational Forum, 74(2), 90-103.
42
Wallace, J. (2010). Facing “reality”: including the emotional in school leadership programmes. Journal of Educational Administration, 48(5): 595-610. Whitaker, K. S. (2003). Principal role changes and influence on principal recruitment and selection: An international perspective. Journal of Educational Administration; 41(1), 37- 54. World Health Organization (2013). Mental health: a state of well-being. Retrieved from the World Health Organization website: http://www.who.int/features/factfiles/mental_health/en/