Embed Size (px)
Citation preview
202
The changing pattern of urban fertility in eastern Australia 1966-1976
M.G.A. WILSON
The article seeks to enhance understanding of post-transitional demographic change by examining the working out at the local level of the macro-scale societal processes underpinning the recent cyclic oscillation in Australian reproductive behaviour. Variations in urban marital and overall fertility between 1966 and 1971 and between 1971 and 1976 are described and analysed. In general, inter-urban variability in both measures diminished greatly, as did the explanatory po wer of ecological differentials, suggesting widespread acceptance of the small family norm throughout the study-area. While the process of convergence was continuous for marital fertility, structural changes contributed to later divergence of overall fertility levels, in accordance with Alonso's cyclical model of change. The current low level of residual inter-urban variability suggests that little more may be gained from analyses of this type.
For almost twenty-five years Australian fertility levels have experienced near-continuous decline until, in 1980, all states and the Commonwealth at large achieved birth rates lower than those ever recorded previously. In the late 1960s and the early 197Os, however, the long term reduction in birth rates was interrupted by a significant but transitory upturn - a phenomenon registered also in the structure-free total fertility rate.
Both the nature and the magnitude of the behavioural and societal dynamics underpinning these trends have been effectively described and analysed (see, for example, Ruzicka and Caldwell, 1977) and shown to be closely associated with increasing then decreasing age-specific marriage and fertility rates among women under twenty-five years of age, and reflective of widespread changes in female workforce participation levels, the general acceptance of close- to-perfect contraception and the increasing availability of pregnancy termination in a society experiencing significant changes in the role and status of women. At the societal level, therefore, it might be argued that little more remains to be unravelled and that further concern with the parameters of and processes underlying fertility change during this period would be superfluous.
Department of Geography, University of Wollongong, Wollongong, New South Wales. Australian Geographical Studies 22. October 1984.
Urban Fertility in Eastern Australia 203
As yet, however, little if any attempt has been made by demographers or population geographers to articulate or to analyse the working out of these macro-scale changes at the micro-scale- that is, to focus upon the way local or regional community fertility levels have responded to such societal transformation -despite the clear centrality of such issues to the field of population geQgraphy as currently perceived (see, for example, Jones, 1981, 123). It is to this question that the paper is addressed, in the particular context of the eastern Australian system of urban centres.
By intent this study is more descriptive than explanatory. Nevertheless, by re-posing in this temporal and spatial frame the sort of questions concerning the spatial dynamics of fertility change posed by Demeny (1972, 155) a t the outset of his study of the early fertility decline in Austria-Hungary relating. for example to spatial variations in the timing of fertility movements and the speed of change, it may be possible to arrive at an enhanced understanding of the process of demographic change in the post-transitional society. In particular. it offers an opportunity to evaluate the claims of conflicting or complementary hypotheses concerning the nature, perpetuation and significance of fertility differentials in contemporary Australia. Specifically, therefore, this study will be concerned with: describing the changing pattern of fertility in ninety-six defined urban centres in Queensland, New South Wales, the Australian Capital Territory, Victoria and South Australia across two intercensal periods (1966-1971 ; 1971-1976); assessing the relevance of the ‘convergence thesis’ to such changes; and determining the extent to which ecological analysis, drawing upon conventional inter-group fertility differentials, such as income. education, religion and work-force participation, retains its utility in the explanation of inter-urban differences in fertility.
THE FERTILITY DECLINE AND DIFFERENTIAL FERTILITY
A recurrent theme in the literature of the demographic transition is the convergence of fertility differentials with the long term lowering of fertility levels (see, for example, Carlsson, 1966; Beshers, 1967; Tsubouchi, 1970; Jones, 1981), reflecting a postulated gradual homogenisation of societal values, attitudes towards family formation, desired family size and knowledge of, access to and use of effective methods of fertility control, regardless of income, educational, religious, ethnichacia1 or other forms of socio-economic or cultural differentiation. While there can be little disagreement with the general argument. the extent to which such convergence might proceed and the detailed dynamics of the process seem still matters for debate and enquiry. Spengler (1966). for example, asserted that such differentials, while convergent, would not tend to disappear entirely but, rather, would retain their analytical significance. The Taeubers (1971) and Beegle (1966), however, inclined to the view that, in the North American context at least, such differentials would narrow, ultimately to disappear, ‘leaving the field of differential fertility research to the social historian’ (Beegle, 1966), a view with which the conclusions of writers such as Slesinger (1974) and Jones and Westoff (1979), among others, would seem broadly consistent.
By contrast, Alonso (1980, 406) has drawn attention to the lack of convergence in United States regional fertility levels in recent decades, despite the general and marked lowering of national, regional and state fertility rates and the ‘dramatic convergence of per capita income among the states and regions of the United States . . . testimony of the progressive integration of the national socio-economy’, and has hypothesised that this results from the super-imposition of ‘cyclical’ upon ‘developmental’ effects. Specifically. it is argued that during the periodic oscillations (‘cyclical’ rises and falls) in fertility which overlie the generally downward ‘developmental’ fertility trajectory, populations (or regions) highly developed socio-economically
204 Australian Geographical Studies
(low fertility) appear to have greater sensitivity to cyclical factors affecting fertility (for example, employment, income, contraceptive technology/innovations) than those at lower levels of socio- economic development. As a consequence regional levels of fertility will tend to converge in times of cylical upturn and to diverge in times of downturn in fertility. That is, during the up-phase of any cyclical movement, fertility rates in low fertility regions will rise and during the down-phase decline more steeply than those of higher fertility populations. Thus, while:
the gap between the D, and D, (the developmental trajectories of low and high fertility regions) curves may narrow over time and the magnitude of the difference may decrease, a persistent cyclical pattern of converging and diverging rates between regions can be expected to be the normal state of affairs (O’Connell, 1981, 13).
Taken literally these arguments suggest that, for the present at least, fertility differentials, whether sectoral or spatial, are alive ‘and well and presumably (in Spengler’s terms) retentive of their analytical significance. Additionally, however, they contribute to the general debate by identifying and elucidating a counter-tendency which, in the shorter term, might well be mistaken for ‘a more permanent secular trend‘ (O’Connell, 1981, 13). It would seem important therefore to determine the applicability of these conclusions in other post-transitional societies and also at other scales of areal disaggregation before their integration into the fabric of post- transitional ‘demographic theory’.
The implications of the developmental model are simple; declining mean levels of fertility should be accompanied by a reduction in the extent of dispersion about the mean. Furthermore, closure of inter-area differentials, being the product of convergent inter-group fertilities, would seem likely, in ecological analyses, to reduce the utility of such differentials in accounting for place to place variations in the level of fertility, not least because such analyses necessarily deal with much noisier data than those whose populations are homogeneous with respect to fertility related attributes, such as religion, income and race, but heterogeneous in terms of location.
The cyclical model requires a more complex pattern of parameter behaviour specifically; rising then falling levels of mean fertility; and declining levels of fertility rate dispersion (convergence) followed by increased dispersion (divergence). Moreover, the relationship between initial fertility rates and subsequent rates of change in fertility should move from negative to positive, reflecting the postulated greater sensitivity to cyclical forces of lower fertility populations during each phase of the cycle. Its implications for ecological analysis remain unclear, however, for while rising then falling levels of fertility might be expected to bring about some corresponding increase then decrease in the explanatory power of compositional attributes, tendencies towards cyclical convergence (during the up-phase) and divergence (the down-phase) would seem likely to generate concomitant but antithetic changes.
The relative merits of these complementary sets of expectations will be evaluated in later sections of this article by reference to: cartographic presentations of urban fertility levels for each census year and of inter-censal change in fertility rates; tabulations of measures of central tendency and dispersion in urban fertility rates and inter-censal changes in these parameters; ,
regression analyses of the relationships between urban fertility levels and changes in fertility; and regression analyses of the relationships, at each census year, between fertility indices and sets of independent variables chosen for their assumed capacity to act as effective proxies for social and other attributes conventionally associated with differential fertility.
Urban Fertility in Eastern Australia 205
FERTILITY DATA AND MEASUREMENT
Birth totals forming the basis of this article are derived from unpublished annual tabulations. prepared by the Australian Bureau of Statistics Office in each state, of births by local government area (LGA) of mother’s usual place of residence corrected, so far as possible, for inter-state movements. The problems of analysing such data are sufficiently well known to require only brief consideration at this point. Cross-temporal studies of small area data, for example, are frequently bedevilled by changes to local government area boundaries. All, whether concerned with change or with spatial patterning at one point in time, must cope with the problem of annual fluctuations in the number of births and the effects of such fluctuations upon the stability of rates of occurrence when populations at risk are comparatively small. It is not possible also to be completely confident that each event is correctly allocated within the spatial frame (for example, births occurring to mothers living in rural shires adjoining urban areas may in some instances be attributed to the urban area rather than to the shire), but it has been asserted that such cases should not be numerous.
In this study such problems have been, so far as possible, countered in conventional ways. The effect of temporal variability in event occurrence has been minimised in the majority of cases by the use of three year averages of birth numbers, centred on the census year (1966; 1971; 1976) and by the elimination from consideration of defined urban areas (i.e. with city, municipal, town or borough status) where the three-year average was numerically small (generally less than approximately 100 births). Boundary changes, where significant, have been handled in a number of ways, ranging from area amalgamation, to the use of two-year averages, to the omission of the centre from the analysis.
For each of the ninety-six defined urban or, in the case of the largest metropolitan and provincial centres, ‘urbanised’ areas (comprising an aggregation of urban cities and boroughs, together with defined suburbanised shires or portions of shires for which separate vital statistics are available) average birth totals were used, in conjunction with published (ABS. 1976) or unpublished census cross-tabulations of females by age by marital status, to calculate age standardised indices of overall and marital fertility (I, and I, respectively) and, as well, a summary measure of the proportion mamed among women of childbearing age (I,,,) following the method of Coale (1969), now adopted widely by other analysts of fertility change (see, for example, Tsubouchi, 1970; Demeny, 1972; Knodel, 1974; Coward, 1978). For the former, actual briths occurring in an area are expressed as a decimal fraction of births expected to occur in a population of identical age and marital status composition experiencing the age specific fertility rates of Hutterite women in the 1920s (the highest recorded rates of marital fertility and with a very high proportion of the population married). Thus the index of overall fertility:
B I, =- EwiFi
where B is the average annual number of live births to all women in the given period, wi is the number of women in each five year age interval between fifteen and forty-nine years and Fi is the age specific fertility rate for married Hutterite women in the age interval. Similarly, the index of marital fertility:
B, I, = Emi Fi
206 Australian Geographical Studies
where B, is the average annual number of nuptial live births and mi the number of currently married women in each age interval. The proportion of women of childbearing age married:
Emi Fi
Ewi Fi I, = -
indicates, according to Knodel(l974, 35) ‘how much marriage is contributing to the achievement of the highest potential fertility of the given population’. It is ‘best thought of as a weighted index of the proportion of women married, giving a large weight to the proportion of women married in the most fertile years’.
When a similar index of ex-nuptial fertilify (I,,) is calculated by relating ex-nuptial live births to the weighted fertility of unmarried women then these several indices are related in the following manner:
I, = &.I, + I,(1 -1,).
so that where ex-nuptial births are relatively unimportant:
I, ==I&.
The accuracy with which marital fertility index values (I ) can be determined is dependent, of course, upon the availability and reliability of birth data cfassified according to nuptial status. Regrettably, the distinction between nuptial and ex-nuptial births has not been incorporated consistently into the tabulations of births at the local government area level in each state over the period of concern to this study. The use of estimating procedures (the proportional allocation of ex-nuptial birth totals for larger areas - statistical subdivisions or statistical divisions- across their component local government areas according to total birth numbers) has been necessary therefore in the determination of marital fertility values for New South Wales and Victoria in 1966 and New South Wales in 1971. To the extent that these estimates are in error, I, values for those years in the two most populous states thus may be expected to vary somewhat about their true values though, it is hoped, not so much as to render unrecognisable any significant regional or sub-regional patterning. The extent to which such indices are in error elsewhere or at other times, being P function of the vital statistics recording process, must remain unknown; neither I, nor I, valur
PATTERNS AND PARAMETERS OF CHANGE
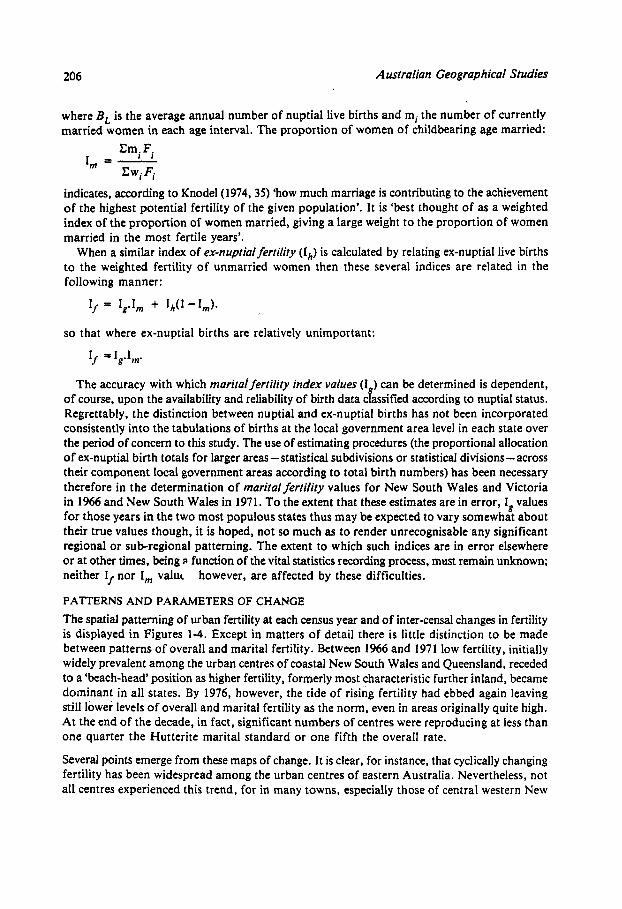
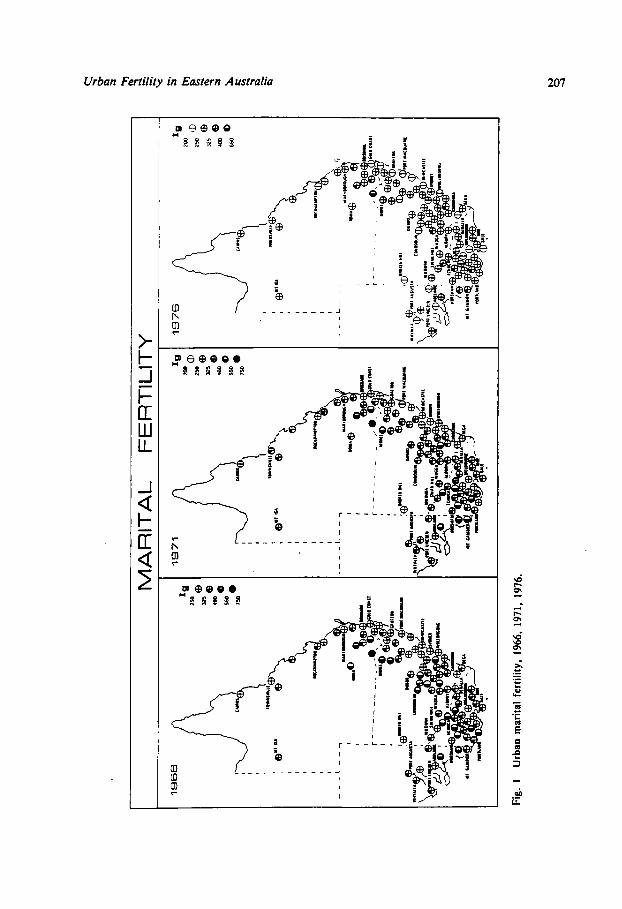
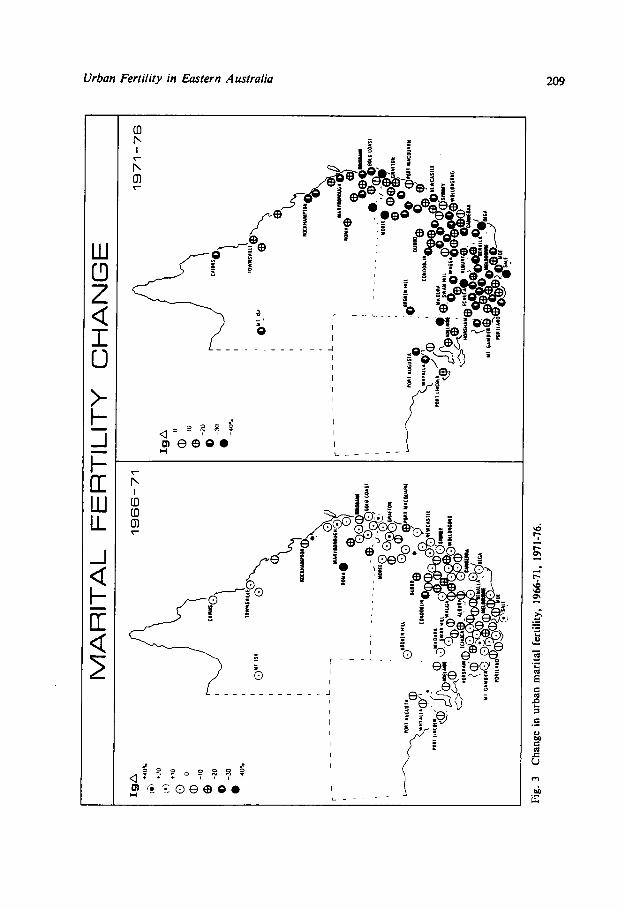
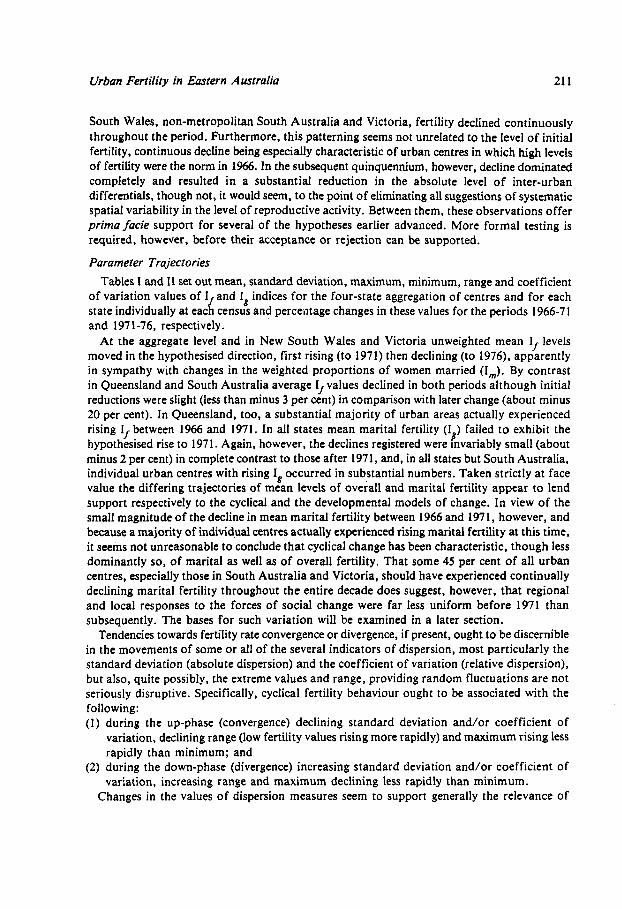
The spatial patterning of urban fertility at each census year and of inter-censal changes in fertility is displayed in Figures 1-4. Except in matters of detail there is little distinction to be made between patterns of overall and marital fertility. Between 1966 and 1971 low fertility, initially widely prevalent among the urban centres of coastal New South Wales and Queensland, receded to a ‘beach-head’ position as higher fertility, formerly most characteristic further inland, became dominant in all states. By 1976, however, the tide of rising fertility had ebbed again leaving still lower levels of overall and marital fertility as the norm, even in areas originally quite high. At the end of the decade, in fact, significant numbers of centres were reproducing at less than one quarter the Hutterite marital standard or one fifth the overall rate.
Several points emerge from these maps of change. It is clear, for instance, that cyclically changing fertility has been widespread among the urban centres of eastern Australia. Nevertheless, not all centres experienced this trend, for in many towns, especially those of central western New
however, are affected by these difficulties.
Urban Fertility in Eastern Australia 207

208 Australian Geographical Studies
i,' 4
-- a < I
r
Urban Fertility in Eastern Australia 209
210 Australian Geographical Studies
Urban Fertility in Eastern Australia 21 1
South Wales, non-metropolitan South Australia and Victoria, fertility declined continuously throughout the period. Furthermore, this patterning seems not unrelated to the level of initial fertility, continuous decline being especially characteristic of urban centres in which high levels of fertility were the norm in 1%. In the subsequent quinquennium, however, decline dominated completely and resulted in a substantial reduction in the absolute level of inter-urban differentials, though not, it would seem, to the point of eliminating all suggestions of systematic spatial variability in the level of reproductive activity. Between them, these observations offer prima facie support for several of the hypotheses earlier advanced. More formal testing is required. however, before their acceptance or rejection can be supported.
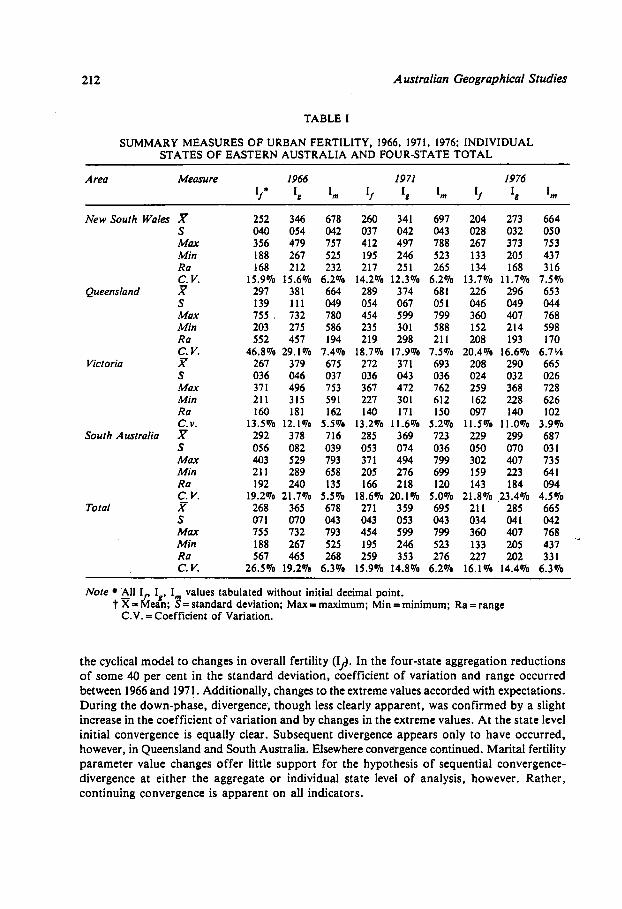
Parameter Trajectories Tables I and I1 set out mean, standard deviation, maximum, minimum, range and coefficient
of variation values of I, and I, indices for the four-state aggregation of centres and for each state individually at each census and perceatage changes in these values for the periods 1966-71 and 1971-76, respectively.
At the aggregate level and in New South Wales and Victoria unweighted mean If levels moved in the hypothesised direction, first rising (to 1971) then declining (to 1976), apparently in sympathy with changes in the weighted proportions of women married (Im). By contrast in Queensland and South Australia average I, values declined in both periods although initial reductions were slight (less than minus 3 per cent) in comparison with later change (about minus 20 per cent). In Queensland, too, a substantial majority of urban areas actually experienced rising I, between 1966 and 1971. In all states mean marital fertility (I ) failed to exhibit the hypothesised rise to 1971. Again, however, the declines registered were invariably small (about minus 2 per cent) in complete contrast to those after 1971, and, in all states but South Australia, individual urban centres with rising I, occurred in substantial numbers. Taken strictly at face value the differing trajectories of mean levels of overall and marital fertility appear to lend support respectively to the cyclical and the developmental models of change. In view of the small magnitude of the decline in mean marital fertility between 1966 and 1971, however, and because a majority of individual centres actually experienced rising marital fertility at this time, it seems not unreasonable to conclude that cyclical change has been characteristic, though less dominantly so, of marital as well as of overall fertility. That some 45 per cent of all urban centres, especially those in South Australia and Victoria, should have experienced continually declining marital fertility throughout the entire decade does suggest, however, that regional and local responses to the forces of social change were far less uniform before 1971 than subsequently. The bases for such variation will be examined in a later section.
Tendencies towards fertility rate convergence or divergence, if present, ought to be discernible in the movements of some or all of the several indicators of dispersion, most particularly the standard deviation (absolute dispersion) and the coefficient of variation (relative dispersion), but also, quite possibly, the extreme values and range, providing random fluctuations are not seriously disruptive. Specifically, cyclical fertility behaviour ought to be associated with the following: (1) during the up-phase (convergence) declining standard deviation and/or coefficient of
variation, declining range (low fertility values rising more rapidly) and maximum rising less rapidly than minimum; and
(2) during the down-phase (divergence) increasing standard deviation and/or coefficient of variation, increasing range and maximum declining less rapidly than minimum.
Changes in the values of dispersion measures seem to support generally the relevance of
k
212 Australian Geographical Studies
TABLE I
SUMMARY MEASURES OF URBAN FERTILITY, 1966, 1971, 1976: INDIVIDUAL STATES OF EASTERN AUSTRALIA AND FOUR-STATE TOTAL
Area Measure 1966 1971 1976 If* I, Im If Ig Im 11 Ig Im
New South Wales x 252 346 678 260 341 697 204 213 664 S 040 054 042 037 042 043 028 032 050 M U 356 479 757 412 497 788 267 373 753 Min 188 267 525 195 246 523 133 205 437 Ra 168 212 232 217 251 265 134 168 316 c. v. 15.9% 15.6% 6.2% 14.2% 12.3% 6.2% 13.7% 11.7% 7.5%
Queensland x 297 381 664 289 374 681 226 296 653 S 139 111 049 054 067 051 046 049 044 Max 755 I 732 780 454 599 799 360 407 768 Min 203 275 586 235 301 588 152 214 598 Ra 552 457 194 219 298 211 208 193 170 c. v. 46.8% 29.1% 7.4% 18.7% 17.9% 7.5% 20.4% 16.6% 6.7%
Victoria x 267 379 675 212 371 693 208 290 665 S 036 046 037 036 043 036 024 032 026 Max 371 496 753 367 472 762 259 368 728 Min 211 315 591 227 301 612 162 228 626 Ra 160 181 162 140 171 150 097 140 102 c. v. 13.5% 12.1% 5.5% 13.2% 11.6% 5.2% 11.5% 11.0% 3.9%
South Australia x 292 378 716 285 369 723 229 299 687 S 056 082 039 053 074 036 050 070 031 M U 403 529 793 371 494 799 302 407 735 Min 211 289 658 205 276 699 159 223 641 Ra 192 240 135 166 218 120 143 184 094 c. v. 19.2% 21.7% 5.5% 18.6% 20.1% 5.0% 21.8% 23.4% 4.5% K 268 365 678 271 359 695 211 285 665 S 071 070 043 043 053 043 034 041 042 M U 755 132 793 454 599 799 360 407 168 Min 188 267 525 195 246 523 133 205 437 Ra 561 465 268 259 353 276 227 202 331 c. v. 26.5% 19.2% 6.3% 15.9% 14.8% 6.2% 16.1% 14.4% 6.3%
Total
Note All I I , I values tabulated without initial decimal point. t x = fiea%; f = standard deviation; Max = maximum: Min =minimum: Ra = range
C.V. =Coefficient of Variation.
the cyclical model to changes in overall fertility (If). In the four-state aggregation reductions of some 40 per cent in the standard deviation, coefficient of variation and range occurred between 1966 and 1971. Additionally, changes to the extreme values accorded with expectations. During the down-phase, divergence, though less clearly apparent, was confirmed by a slight increase in the coefficient of variation and by changes in the extreme values. At the state level initial convergence is equally clear. Subsequent divergence appears only to have occurred, however, in Queensland and South Australia. Elsewhere convergence continued. Marital fertility parameter value changes offer little support for the hypothesis of sequential convergence- divergence at either the aggregate or individual state level of analysis, however. Rather, continuing convergence is apparent on all indicators.
Urban Fertility in Eastern Australia 213
TABLE I1
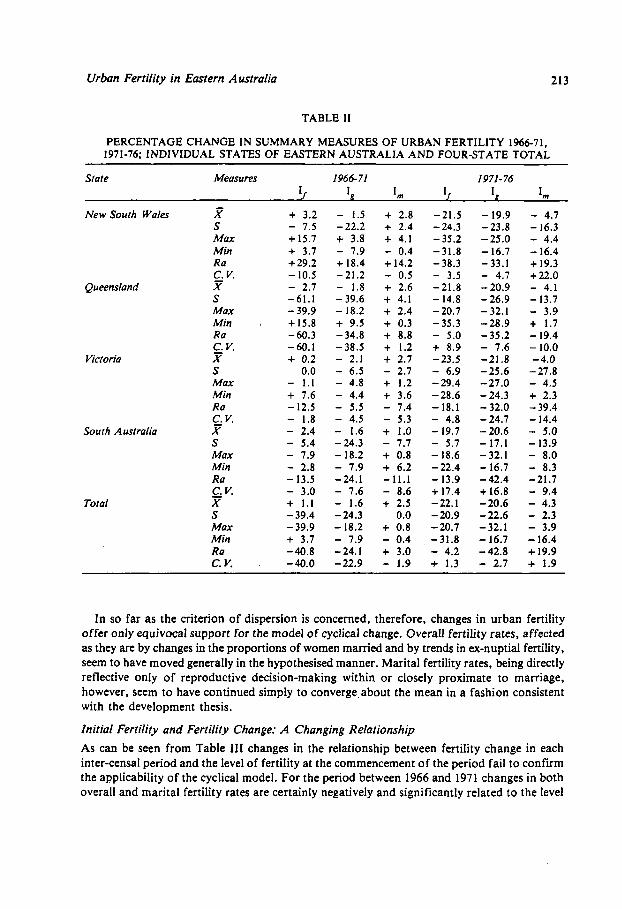
PERCENTAGE CHANGE IN SUMMARY MEASURES OF URBAN FERTILITY 1966-71, 1971-76; INDIVIDUAL STATES OF EASTERN AUSTRALIA AND FOUR-STATE TOTAL
State Measures 1966-71 1971-76
Queensland
Victoria
South Australia
New South Wales x S MaU Min Ra c. v. S M U Min , Ra
x
c, v. X ~~
S M U Min Ra c, v. X S Max Min Ra
Total c. v. x S Max Min Ra c. v.
+ 3.2 - 7.5 + 15.7 + 3.7 +29.2 - 10.5 - 2.7 -61.1 - 39.9 + 15.8 -60.3 - 60.1 + 0.2
0.0 - 1.1 + 7.6 - 12.5 - 1.8 - 2.4 - 5.4 - 7.9 - 2.8 - 13.5 - 3.0 + 1.1 - 39.4 - 39.9 + 3.7 -40.8 - 40.0
- 1.5 - 22.2 + 3.8 - 7.9 + 18.4 -21.2 - 1.8 - 39.6 - 18.2 + 9.5 - 34.8 - 38.5 - 2.1 - 6.5 - 4.8 - 4.4 - 5.5 - 4.5 - 1.6 - 24.3 - 18.2 - 7.9 - 24.1 - 7.6 - 1.6 - 24.3 - 18.2 - 7.9 -24.1 -22.9
+ 2.8 + 2.4 + 4.1 - 0.4 + 14.2 - 0.5 + 2.6 + 4.1 + 2.4 + 0.3 + 8.8 + 1.2 + 2.7 - 2.7 + 1.2 + 3.6 - 7.4 - 5.3 + 1.0 - 7.7 + 0.8 + 6.2 -11.1 - 8.6 + 2.5
0.0 + 0.8 - 0.4 + 3.0 - 1.9
- 21.5 - 24.3 - 35.2 -31.8 - 38.3 - 3.5 -21.8 - 14.8 - 20.7 - 35.3 - 5.0 + 8.9 -23.5 - 6.9 - 29.4 - 28.6 - 18.1 - 4.8 - 19.7 - 5.7 - 18.6 - 22.4 - 13.9 + 17.4 - 22.1 - 20.9 -20.7 -31.8 - 4.2 + 1.3
- 19.9 - 23.8 - 25.0 - 16.7 -33.1 - 4.7 - 20.9 - 26.9 - 32.1 -28.9 -35.2 - 7.6 -21.8 -25.6 -27.0 - 24.3 - 32.0 - 24.7 - 20.6 - 17.1 -32.1 - 16.7 -42.4
- 20.6 - 22.6 -32.1 - 16.7 - 42.8 - 2.7
+ 16.8
- 4.7 - 16.3 - 4.4 - 16.4 + 19.3 + 22.0 - 4.1 - 13.7 - 3.9 + 1.7 - 19.4 - 10.0 -4.0 - 27.8 - 4.5 + 2.3 - 39.4 - 14.4 - 5.0 - 13.9 - 8.0 - 8.3 -21.7 - 9.4 - 4.3 - 2.3 - 3.9 - 16.4 + 19.9 + 1.9
In so far as the criterion of dispersion is concerned, therefore, changes in urban fertility offer only equivocal support for the model of cyclical change. Overall fertility rates, affected as they are by changes in the proportions of women mamed and by trends in ex-nuptial fertility, seem to have moved generally in the hypothesised manner. Marital fertility rates, being directly reflective only of reproductive decision-making within or closely proximate to marriage, however, seem to have continued simply to converge.about the mean in a fashion consistent with the development thesis.
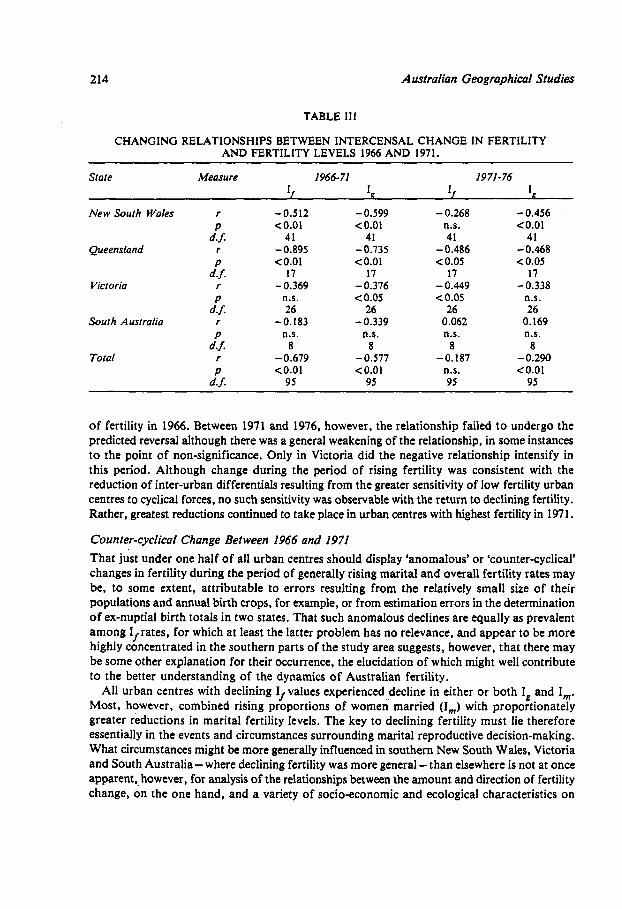
Initial Fertility and Fertility Change: A Changing Relationship As can be seen from Table I11 changes in the relationship between fertility change in each inter-censal period and the level of fertility at the commencement of the period fail to confirm the applicability of the cyclical model. For the period between 1966 and 1971 changes in both overall and marital fertility rates are certainly negatively and significantly related to the level
214 Australian Geographical Studies
TABLE Ill
CHANGING RELATIONSHIPS BETWEEN INTERCENSAL CHANGE IN FERTILITY AND FERTILITY LEVELS 1966 AND 1971.
Sfote Measure 1966- 71 19 71- 76 I, I II I
New South Wales r P
d.f. Queensland r
P d.f.
Victoria r P
d.f. South Australia r
P d.J
Total r P
d.f.
-0.512 co.01
41 -0.895 co.01
17 - 0.369 n.s. 26
n.s. 8
- 0.679 co.01
95
-0.183
- 0.599 co.01
41 -0.735 co.01
17 - 0.376 c 0.05
26 - 0.339 n.s.
a - 0.577 co.01
95
-0.268 n.s. 41
-0.486 c 0.05
17 - 0.449 ~ 0 . 0 5
26 0.062 n.s.
a -0.187
n.s. 95
- 0.456 <0.01
41 - 0.468 C0.05
17
n.s. 26
0.169 n.s.
8 - 0.290 < 0.0 I
95
-0.338
of fertility in 1966. Between 1971 and 1976, however, the relationship failed to undergo the predicted reversal although there was a general weakening of the relationship, in some instances to the point of non-significance. Only in Victoria did the negative relationship intensify in this period. Although change during the period of rising fertility was consistent with the reduction of inter-urban differentials resulting from the greater sensitivity of low fertility urban centres to cyclical forces, no such sensitivity was observable with the return to declining fertility. Rather, greatest reductions continued to take place in urban centres with highest fertility in 1971.
Counter-cyclical Change Between 1966 and 1971 That just under one half of all urban centres should display ‘anomalous’ or ‘counter-cyclical’ changes in fertility during the period of generally rising marital and overall fertility rates may be, to some extent, attributable to errors resulting from the relatively small size of their populations and annual birth crops, for example, or from estimation errors in the determination of ex-nuptial birth totals in two states. That such anomalous declines are equally as prevalent among I,rates, for which at least the latter problem has no relevance, and appear to be more highly concentrated in the southern parts of the study area suggests, however, that there may be some other explanation for their occurrence, the elucidation of which might well contribute to the better understanding of the dynamics of Australian fertility.
All urban centres with declining I, values experienced decline in either or both I, and I,. Most, however, combined rising proportions of women married (I,) with proportionately greater reductions in marital fertility levels. The key to declining fertility must lie therefore essentially in the events and circumstances surrounding marital reproductive decision-making. What circumstances might be more generally influenced in southern New South Wales, Victoria and South Australia- where declining fertility was more general -than elsewhere is not at once apparent,. however, for analysis of the relationships between the amount and direction of fertility change, on the one hand, and a variety of socio-economic and ecological characteristics on
Urban Fertility in Eastern Australia 215
the other reveals few significant and no substantial associations on which to base a n argument. A weak negative association between change in I and the proportion of males employed
in agriculture, a stronger one with the level of fertility in 1966 (two-thirds of all declining fertility centres had marital fertility rates in 1966 that were above-usually well above-the average for all ninety-six urban areas) and a tendency for decline to be most marked in towns subjectively assessed as more heavily involved with the servicing of rural communities all suggest, however, that some part of the decline may be attributable to a ‘lag effect’, a catch up by family formers less rapidly adoptive of the new values, birth control practices and declining family size norms diffusing rapidly throughout Australian society during the early 196Os, and therefore less readily affected by either the societal or behavioural influences contributing to the rise of fertility in the late 1960s. At best, though, this is a speculative and only partial explanation that leaves unscathed such exceptions as three of the four state capitals and several other major industrial cities in all states.
6
THE SOCIO-SPATIAL CONTEXT OF FERTILITY AND FERTILITY CHANGE
So far analysis of parameter change, the spatial distribution of fertility rate change and the relationship between fertility levels and rate change offers little unequivocal support for the view that declining fertility after 1971 was accompanied by a general reversal of the process of inter-urban fertility differential convergence. Under such circumstances it would seem likely that the explanatory power of ecological differentials would continue to decline also more or less continuously over the decade following the general homogenisation of urban fertility rates at unprecedently low levels.
The validity of this expectation will be tested by stepwise linear multiple regression analysis of the relationships, at each census year, between indices of fertility -as dependent variables- and sets of independent variables selected for their assumed capacity to act as effective proxies for social and other attributes conventionally associated with differential fertility, such as religious affiliation, female educational attainment, occupational status, and workforce participation.
The Independent Variables Table IV identifies and operationally defines a set of nine independent variables derived
from published census data relating to the demographic and socio-economic composition of each urban area at the censuses of 1966, 1971 and 1976 and a tenth, income descriptive, relating to 1976. In the case of one variable, indicative of the relative importance of the Aboriginal population in each centre, 1966 values have been derived by allocating statistical division Aboriginal total populations across urban local government areas according to the 1971 proportional distribution.
The Bases of Order In the mid-1 960s the capacity of such comparatively crude techniques to account for place
to place variations in both marital and overall fertility was limited but by no means exhausted. At the aggregate four-state level, for example, a linear combination of three variables - reflective of the degree of rural orientation in the community, the level of female educational attainment, and the incidence of Roman Catholicism - accounted for some 25 per cent of the variation in marital fertility and in the three largest states, separately considered, ‘rurality’, on its own or in conjunction with Catholicism, explained between 50 and 70 per cent of such variation (Table V).

216 Australian Geographical Studies
TABLE 1V
INDEPENDENT ECOLOGICAL VARIABLES USED IN REGRESSION WITH FERTILITY INDICES
Variable Definition
1 Catholicism (Cathol) (1966; 1971; 1976) % total population professing adherence to ‘Catholic’ or Roman Catholic faith.
2 Population change (Popch) (1966; 1971; 1976) Intercensal population change as per cent of population enumerated at previous census.
3 Female education (Femed) (1966) % females I5 + attaining ‘Intermediate’ level or better. (1971) Vo females 15+ completing schooling to Level 8 or better. (1976) % females IS+ leaving school aged 16 years or over. (1966) 070 females 15 + ‘matriculating’ and tertiary qualified. (1971;1976) % females 15+ qualified at technician and tertiary levels. (1966;1971;1976) % females I S + in labour force (employed/
(1966;1971;1976) % males in labour force occupied as farmers,
(1966;1971;1976) ‘Jio males in labour force occupied as miners, craftsmen, production process workers, labourers, etc.
(1966;1971;1976) To males in labour force occupied in professional, technical, administrative and manageriaVexecutive activities.
(1966) log ,. estimated Qo of total population ‘Aboriginal’. (1971;1976) log ,, ‘70 of total population claiming Aboriginal status. (1976) 070 of income earning families stating income 2 $12,000.
4 Female qualification (Fequal)
5 Female workforce participation (Femwk) unemployed).
6 Male employment in agriculture (Farms) farmworkers, etc.
7 Male employment in manufacturing and mining (Blucol)
8 Male employment in pro fessional/admin occupations (Pro wk)
9 Aboriginal population (A &orid
10 Farnib income (Income)
These same variables, in combination with the index of proportions of women married (I,) and, in the case of New South Wales, the measure of ‘Aboriginality’ were equally as effective in accounting for variations in overall fertility (I ), both in aggregate and for each state. Clearly, then, although fertility levels were generahy lower than at any time since the 1930s, inter-urban variations in compositional attributes ostensibly directly reflective of differences in attitudes, preferences and practices relevant to child bearing and family formation continued to offer useful insight into the origins of urban fertility differentials in eastern Australia.
By 1971, the explanatory power of these ecological differentials seemed not to have altered substantially nor in any consistent manner at the individual state level, despite the prevalence of rising fertility and the marked convergence of inter-urban differentials. Nor were the combinations of variables involved changed greatly. At the four-state aggregate level, however, the level of explanation for marital fertility differentials was lower.
Five years later, the explanatory power of the selected variables seems to have waned significantly. Less than 20 per cent of the place to place variation in marital fertility could be accounted for in New South Wales and Victoria and in the aggregate anaIysis; however, the proportion in Queensland remained very much higher. Furthermore, the array and the role of individual variables involved had altered; Catholicism, for example. remained important only in New South Wales and even the measure of ‘rurality’ remained analytically useful only in Queensland and, at a greatly reduced level, in Victoria. By contrast, other variables-income

C & 2 3 *rl
TAB
LE V
SIG
NIF
ICA
NT*
STA
ND
AR
DIS
ED R
EGR
ESSI
ON
CO
EFFI
CIE
NTS
, REG
RES
SIO
N O
F I,,
I, O
N E
CO
LOG
ICA
L V
AR
IAB
LES,
196
6, 1
971,
197
6 8 - a’
19
66
1971
19
76
Ir 1
lr I
lr 1
New
Sou
th W
ales
(N
= 42
)
Que
ensla
nd
(N =
18)
Vic
tori
a (N
= 27
)
Fou
r-St
ate
tota
l (N
= 96
)
Farm
s C
atho
l I A
aorig
R’
F(
4.37
) Fa
rms
I (F2.
15)
Farm
s
I?
~(2,
241
Farm
s Fe
med
I F(
3,92
) fl
0.39
86 F
arm
s 0.
3986
Cat
hol
0.27
29 R
’ 0.
2565
F(2
,39)
0.
5677
12
.15*
* 0.
7085
Far
ms
0.50
48 C
atho
l 0.
4600
R’
6.39
** F
(2,1
5)
0.66
46 F
arm
s 0.
5916
R’
0.69
47 F
(l,2
5)
27.3
0**
0.30
00 F
arm
s -0
.254
3 Fe
qual
0.
2369
Cat
hol
0.19
34 R
* 7.
35**
F(3
,92)
0.50
53 C
atho
l 0.
3957
Abo
rig
0.47
79 I
, 17
.85*
* R’
F
(33
)
0.63
66 F
equa
l 0.
3506
Far
ms
0.69
90 I
17
.41*
* Rq F(
3,W
0.
7349
Far
ms
0.54
01 I
29
.36*
* fa
thol
R’
F(
3,23
) 0.
4554
I
-0.2
047
Aor
ig
0.17
58 B
luco
l 0.
2414
Cat
hol
9.76
** F
emed
R’
F(5,
W
0.49
98 C
atho
l 0.
3994
Abo
rig
0.38
67 R
’ 0.
5059
F(2
.39)
12
.97*
*
0.25
69 F
arm
s 0.
7366
Cat
hol
0.66
52 B
luco
l 0.
7941
R’
18.0
0**
F(3.
14)
0.69
81 F
arm
s 0.
4886
Cat
hol
0.31
44 R
’ 0.
7093
F(2
,24)
0.45
48 F
arm
s 0.
2149
Cat
hol
-0.2
183
Fem
ed
0.26
07 R
’
0.31
10
8.13
**
18.7
1**
-0.2
287
F(3,
92)
0.60
45 I
, 0.
3722
Cat
hol
0.43
1 3 I
ncom
e 14
.79*
* Fe
mw
k -R
’ F(4.
37)
0.85
14 F
arm
s 0.
5671
1, 0.
4945
Cat
hol
0.75
86 R
’ 14
.66*
* F(
3,14
) 0.
7895
I,
0.36
35 F
arm
s 0.
5876
R’
17.0
9**
F(2,
24)
0.29
10 I
0.
2871
A%
orig
0.15
45 C
atho
l 5.
60**
R’
F(
4,91
)
-0.1
831
Prow
k
0.56
50 C
atho
l 0.
2783
R’
-0.4
199
F(1.
40)
.. ,
0.41
00
0.47
30
8.30
**
0.66
82 F
arm
s 0.
5709
Pop
ch
0.30
47 R
’ 0.
9025
F(
2.15
)
0.52
23 F
arm
s 0.
4118
R’
0.42
07 F
(1,2
5)
8.72
**
43.2
0* *
0.43
08 P
row
k 0.
2083
Cat
hol
0.23
61 F
(2.9
3)
0.27
5 1
8.63
**
-0.3
307
R’
0.41
62
3 0.
I733
b 2
8.38
**
5
r 5 0.
6647
0.75
59
23.2
2**
0.43
IS
0.18
62
5.72’
-0.3
334
-0.3
610
0.23
90
0.10
81
5.64
’.
Not
e: *
p 5
0.
05;
** p
s 0
.01;
N =
num
ber o
f ur
ban
area
s.
218 Australian Geographical Studies
and occupation structure related, rather than culturaVattitudinal influences on reproductive activity-assumed a new or enhanced significance in New South Wales and overall,
In the course of the decade, therefore, the relationship between ecological. structural and urban fertility differentials can be seen to have changed signally in several ways, though not in each state identically. In the case of marital fertility it would seem that the effect of the widespread rise was generally insufficient to affect significantly the explanatory power of the relationships, although at the aggregate level the effect of such changes was more noticeable. Subsequent decline and continuing convergence, however, were accompanied by very substantial reductions in the analytical utility of such relationships to the point at which, it would seem, serious doubts about their continuing importance and meaning must be entertained. Nevertheless, where, as in Queensland, higher fertility is the norm, even the substantial convergence of inter-urban differentials that has taken place seems not to have had this effect.
The inclusion of the structural variable (I,,,) in the analysis of overall fertility, reasonably enough, is responsible across the board for a significant increase in R* levels over those associated with marital fertility. When that effect is taken account of, however, the residual effect, attributable to compositional variability, is substantially reduced in each state between 1971 and 1976, somewhat in contrast with the more variable effect between 1966 and 1971. Nevertheless, net decline in their significance was generally the case across the decade.
In sum, then, it would seem’that the effects of the up-turn in fertility between 1966 and 1971 were not sufficiently profound to be reflected in signficant changes in the analytical utility of inter-urban differences in socio-economic and cultural attributes. Since continued, ubiquitous reduction in fertility during the 1970s has been associated with quite marked reduction in their significance, however, it would seem not unreasonable to argue that the real effect of the earlier increase in If and I, values was rather to delay the onset of such changes or to moderate very considerably their magnitude.
CONCLUSION
Between 1966 and 1976 urban fertility levels in eastern Australia declined dramatically, inter- regional and inter-urban differentials were very substantially ironed out and the analytical significance of ecological differentials was so reduced as to cast serious doubts on their continuing utility in studies with a spatial frame of reference. These changes offer clear evidence for the view that, by 1976, the small family (two-child) norm had been adopted widely throughout Australian society. regardless of regional location, community size. or even socio- cultural composition. In short, the experience of urban eastern Australia seems little distinguishable from the developmental trajectory of post-transitional decline and convergence commonly associated with the progressive homogenisation of societal values, attitudes and preferences and the ‘growing integration of the national socio-economy’ (Alonso, 1980). The extent to which short term changes in reproductive behaviour during the period are more appropriately and effectively interpreted within the context of the cyclical model of change, however, must be examined.
Alonso (1980) and O’Connell(l981) do not explicitly recognise the need to distinguish between changes in fertility within marriage and changes in overall fertility, stemming from variations in the proportions of women married and/or in ex-nuptial fertility as well as from changes in marital reproductive activity. Their discussion of the cyclical model is couched only in terms of overall fertility. Yet, the evidence presented here suggests the clear desirability of a disaggregative approach. In this final segment, therefore, changes in marital fertility will be examined separately from those in overall reproductive rates.
Urban Fertility in Eastern Australia 219
Marital Fertility Despite the descent to unprecedently low levels, strongly marked systematic spatial patterning
was clearly apparent in urban marital fertility in 1966. In broad, regional variability seemed reflective of socio-economic compositional differences, but the clarity of such effects was variable between states. Between 1966 and 1971 high fertility urban centres, many of them strongly rural in orientation and, it would seem, later to adopt birth control innovations and to that point less influenced by the opportunity costs and other disutilities of larger families, continued to experience declining levels of reproductive activity. Centres with lower fertility, on the other hand, showed a distinct tendency towards rising rates. As a result, substantial inter-urban rate convergence about the mean occurred. These rises were not, however, sufficiently large or prevalent to bring about an upturn in the level of mean marital fertility at either state or aggregate level, nor did they affect seriously the strength of the ecological relationships examined. After 1971, fertility decline reasserted itself throughout the urban system; but intercensal changes showed little or no systematic relationship with previous levels of fertility, nor, it appears, with’compositional attributes, and convergence of differentials continued, albeit at a somewhat slower rate; from which it would seem that, since 1971, married urban women throughout the study area have shared somewhat similar reproductive targets.
In short, the evidence discussed here suggests that while during the late 1960s ‘different areas had different elasticities of response to cyclical fertility movements’ (O’Connell, 1981, 12) the magnitude of these differences was insufficient to do more than slow the pace of decline while increasing the pace of inter area differential convergence; that is to vary the detail but not the basic form of the developmental trajectory of change.
Overall Fertility Variations in overall fertility reflect changes in proportions married and ex-nuptial fertility
levels as well as in marital fertility. During the 1960s proportions married tended generally to increase and in a majority of centres fertility within marriage also increased. Not surprisingly, therefore, I, levels in those centres rose more markedly than I sufficiently so, in fact, to effect an upward move in the mean value. As with marital fertility gighest gains were most common among centres experiencing lowest fertility with declines more general among those with high rates. As a result a high rate of differential convergence was characteristic.
The nationally evident downturn in both proportions married and marital fertility after 1971 was reflected in declining overall fertility in every urban area. Reductions in the strength and gradient of the relationship between initial fertility and the amount of decline, and clear indications of an increase in the level of relative dispersion about the mean, however, suggest that during this period divergence replaced the convergence earlier evident. It seems reasonable to conclude, therefore, that largely, though not entirely for structural reasons (principally the pattern of change in levels of Im) systematic and significant differences in the elasticities of response to the forces underlying changing fertility were clearly identifiable in both phases of the cycle; that is, that a genuine cyclical effect can be discerned.
In 1976, the high level of uniformity in both marital and overall fertility rates throughout the study area about mean levels lower than ever before achieved suggests that the regionally variable effects of future cyclical changes in levels of reproductive activity- unless more clearly marked and perhaps, too, more extensive in time than those examined here-may be rather difficult to identify. It must also be apparent that low level near-uniformity places serious impediments in the way of further worthwhile spatial analyses at the local level, perhaps to the point that there is little more to be gained from them. It would seem appropriate to suggest,
220 Australian Geographical Studies
therefore, that the path to further understanding of the process of post-transitional demographic change, including residual regional or sub-regional variations in fertility, may lie less in studies of this genre-census and vital statistic dependent as they are-than in detailed analyses at the individuaVbehavioural level which focus quite specifically upon attitudes, values, preferences and family formation.
ACKNOWLEDGEMENTS
cartography is gratefully acknowledged.
REFERENCES Alonso, W., 1980 Population as a system in regional development, American Economic Review, 70,405-9. Australian Bureau of Statistics, 1976: Characteristics of rhe Population: Local Government Areas
Beshers, J.M., 1967: Population Processes in Social Systems, Toronto, The Free Press. Beegle, J.A.. 1966: Social structure and the changing fertility of the farm population, Rural Sociology,
Carlsson, G., 1% The decline of fertility: innovation or adjustment process, Populafion Studies, 20, 149-74. Coale, A.J., 1969: The decline of fertility in Europe from the French Revolution to World War 11, in
S . Behrman, el al. (eds) Fertilify and Family Planning: A World View, Ann Arbor, University of Michigan Press, 3-24.
Coward, J., 1978: Changes in the pattern of fertility in the Republic of Ireland. Tijdchrifr Voor Economische en Sociale Geografie, 69, 353-61.
Demeny, P., 1972: Early fertility decline in Austria-Hungary: a lesson in demographic transition, in D.V. Glass and R. Revelle (eds) Populafion and Social Change, London, Arnold, 153-72.
Jones, E.F. and Westoff, C.F., 1979: The end of 'Catholic' fertility, Demography, 16, 209-18. Jones, H.R., 1981: A Population Geography, London, Harper and Row. Knodel, J.E., 1974: The Decline of Ferfilify in Germany, 1871-1939, Princeton. Princeton University Press. O'Connell, M., 1981: Regional fertility in the United States: convergence or divergence? Infernational
Regional Science Review, 6, 1-14. Ruzicka. L.T. and Caldwell. J.C., 1977: The End of Demographic Transition in Australia, Australian
Family Formation Monograph No. 5, Canberra, Department of Demography. Australian National University.
Slesinger, R.S., 1974: Fertility and metropolitan dominance: a new look. Rural Sociology. 39. 350-61. Spengler, J.J., 1966: Values and fertility analysis, Demography, 3, 109-30. Taeuber, I.B. and Taeuber, C., 1971: People of the Unifed Sfates in fheZOth Century, Washington D.C.,
Tsubouchi, Y.. 1970 Changes in fertility in Japan by region: 1920-1965. Demography, 7. 121-34.
The assistance of Ethel Lee with computational matters and Richard Miller with the
(Preliminary), Canberra.
31, 415-27.
Government Printing Office.


![Oscar Anzorena, Tiempo de Violencia y Utopia [1966-1976]](https://img.pdfslide.net/doc/110x75/55cf9dd7550346d033af7c4a/oscar-anzorena-tiempo-de-violencia-y-utopia-1966-1976.jpg)


