Embed Size (px)
Citation preview
The characteristics of retail wastes in the city of Yenagoa, Nigeria
Amasuomo, Ebikapadi; Baird, Jim
Published in:Journal of Management and Sustainability
DOI:10.5539/jms.v6n4p59
Publication date:2016
Document VersionPublisher's PDF, also known as Version of record
Link to publication in ResearchOnline
Citation for published version (Harvard):Amasuomo, E & Baird, J 2016, 'The characteristics of retail wastes in the city of Yenagoa, Nigeria', Journal ofManagement and Sustainability, vol. 6, no. 4, pp. 59-72. https://doi.org/10.5539/jms.v6n4p59
General rightsCopyright and moral rights for the publications made accessible in the public portal are retained by the authors and/or other copyright ownersand it is a condition of accessing publications that users recognise and abide by the legal requirements associated with these rights.
Take down policyIf you believe that this document breaches copyright please view our takedown policy at https://edshare.gcu.ac.uk/id/eprint/5179 for detailsof how to contact us.
Download date: 16. Jan. 2022
Journal of Management and Sustainability; Vol. 6, No. 4; 2016 ISSN 1925-4725 E-ISSN 1925-4733
Published by Canadian Center of Science and Education
59
The Characteristics of Retail Wastes in the City of Yenagoa, Nigeria
Ebikapade Amasuomo1 & Jim Baird1 1 School of Engineering and Built Environment, Glasgow Caledonian University, UK
Correspondence: Ebikapade Amasuomo, School of Engineering and Built Environment, Glasgow Caledonian University, UK. E-mail: [email protected]
Received: October 12, 2016 Accepted: November 6, 2016 Online Published: November 25, 2016
doi:10.5539/jms.v6n4p59 URL: http://dx.doi.org/10.5539/jms.v6n4p59
Abstract Wastes management is a clear strategy where wastes are channelled through processes that ensures proper storage, collection, transportation, treatment and disposal of wastes with ample consideration for environmental protection and public health. In Yenagoa where the current study was conducted, the lack of proper wastes management structure is apparent, particularly among retailers where samples were drawn from for the study. Little is known on the volume and characteristics of wastes produced by the retail sector in the city, like many other Nigerian cities.
The study employed a mixed method approach using closed and open-ended questionnaires in collecting data. In all about 900 questionnaires were collected and analysed for the study. Knowing that no proper waste management plan can be developed until the current practice, sources, components and volume of waste has been well understood. The use of qualitative methods in this paper helps to better understand and gather data on areas of interest. A multi stage cluster sampling technique was employed due to the unavailability of an up-to-date sampling frame in the area.
The findings from the study show that wastes materials produced by retailers in Yenagoa are mainly wastes paper, tins, cans, plastics, cardboard, furniture, wood products and possibly WEEE. However, plastics and cardboard materials were the dominant wastes materials produced by the retail sector. The study therefore concludes that there is a need to establish a wastes processing facility in Yenagoa with heavy emphasis on recycling.
Keywords: wastes, Yenagoa, plastics, cardboard, recycling
1. Introduction 1.1 The Management of Waste
Formulating effective strategies to control and manage wastes is a necessary step for any country seeking to protect public health (Giusti, 2009). This is particularly true in today’s society where environmental degradation is a major huddle especially with the ever increasing population and appetite for energy. It is for this reason that countries around the world are developing strategies to promote sustainable development so as to guarantee environmental and public health protection (Amasuomo et al., 2015).
The pattern of relationships that exists between wastes, wastes management and public health must be clearly identified so that policy makers, members of the public and other stakeholders are on the same page on the need to have efficient and effective wastes management strategies in place. Louis (2004) reported that although waste production is a by-product of human activities, effective management is required to avoid negative consequences that could arise from unfriendly practices. According to (Rushton, 2003) several studies have investigated the health impacts associated with waste and waste management. Mohan et al. (2006) pointed out that some of these studies have shown that, some waste management practices such as landfilling of wastes have negative impact on public health. Likewise the open burning of waste which has been proven to be environmentally unsafe is still a major method of waste management in many countries (Estrellan & Iino, 2010). Avakian et al. (2002) pointed out that waste burning could have a negative impact on human health if the combustion process is incomplete.
Rushton (2003) revealed that some waste management methods releases substances that can affect the kidney, lungs, liver and other human tissues. In addition, Rushton found that some toxic substances released are cancerous material. Furthermore, organochlorines and other toxic substances from wastes materials affect reproductive health (Rushton, 2003). This is in agreement with the findings of (Elliott et al., 2001) which
jms.ccsenet.org Journal of Management and Sustainability Vol. 6, No. 4; 2016
60
reported that some waste management processes affect human reproductive health, resulting in low birth weights in addition to congenital anomalies for people living close to landfill sites. Similarly, Tchobanoglous (1993) argued that uncontrolled dump sites formed the optimum environment needed for the breeding of disease carrying insects and animals.
Despite the fact that the relationship between poor wastes management practices and diseases was not known many centuries ago, public health protection has always influenced waste management. According to Wilson (2007) public health was the main driver for waste management in the early parts of the twentieth century. In the USA for instance, Louis (2004) reported that many centuries ago wastes collected from households were disposed of on uncontrolled dumps and open water bodies. Wastes were also used in an uncontrolled manner for agricultural purposes to enhance crop growth. The subsequent deaths and epidemics that followed these unfriendly practices prompted the authorities to embark on sanitary reforms leading to improvement in water supply, sewer network and organised refuse collection and disposal. However, Louis noted that it was not until 1976 that the practice of disposing waste on open dumps was banned in the United States altogether.
Williams (2005) reported that as people began to draw a link between poor waste management and the spread of diseases, steps were taken to protect public health. For example, in the UK several Acts were enacted to deal with the collection and disposal of waste in the nineteenth century. Vergara & Tchobanoglous (2012) and Wilson (2007) observed that public health protection is still the main motivation for the management of solid waste in many developing countries of today.
1.2 Retail Sector Waste
The retail sector covers various commercial activities from the sales of vehicles to household items in or outside stores. Most wastes produced from the sector are non-metallic with composition ranging from packaging materials to animal and vegetable waste (DEFRA, 2011). Generally, the type of materials sold influences the type of waste produced. A survey of grocery stores in Quebec, Canada (Norrie et al., 1997) revealed that materials such as fruits, baked products, seafood, packaging materials and other frozen products make up a large amount of waste from grocery stores.
In 2008 alone, the retail sector generated about 1.4 million tonnes of packaging and food waste in the UK (WRAP, 2010). In 2005 commercial activities such as retailing, wholesaling, public administration, real estates and other business activities produced about 460kt/yr of waste in Northern Ireland (Northern Ireland’s Environment & Heritage Service, 2005). Likewise, in Mexico a single store in Mexicali generated about 5,375kg of cartons and 339kg of plastics per week (Ochoa et al., 2010).
One supermarket chain in Quebec spends as much as $6 million yearly for waste disposal (Norrie et al., 1997). Hence, Ochoa et al. (2010) suggested that, supermarkets should consider recycling and reusing as a waste management tool in other to recover some operational cost.
1.3 Retail Sector in Yenagoa
Most of the retail stores in Yenagoa are extensions of private buildings or buildings purposely built to be used as stores. Some of the store owners and workers either combine running their shops with other jobs or work as full time retailers. The sector is mainly dominated by semiformal and informal businesses. Majority of the retailers do not necessarily obtain any form of permit to operate a business as done in many developing societies. As a result of the high unemployment crisis in Yenagoa, like other cities in Nigeria, many individuals or families, who are unable to secure a formal sector employment in government or private sector, often resort to one form of trading or another for their livelihood. These informal businesses generate as much as 50% of all urban employment in many sub Saharan African counties (Nwaka, 2005). In Yenagoa, apart from the hydrocarbon industry, small and medium-size enterprises (SME) drive the local economy through the provision of employment and income for many families. Almost one fourth of the working populations in developing countries are involved in small scale enterprises (Mead & Liedholm, 1998). In Yenagoa and Nigeria as a whole, small scale businesses are not only perceived as a force that drives economic development through employment generation; but also as a tool to solving social problems such as rural-urban migration. Additionally, SMEs in the country aid industrialization through entrepreneurial skills development, usage of local technology and raw material utilization (Asikhia, 2010).
jms.ccsenet.org Journal of Management and Sustainability Vol. 6, No. 4; 2016
61
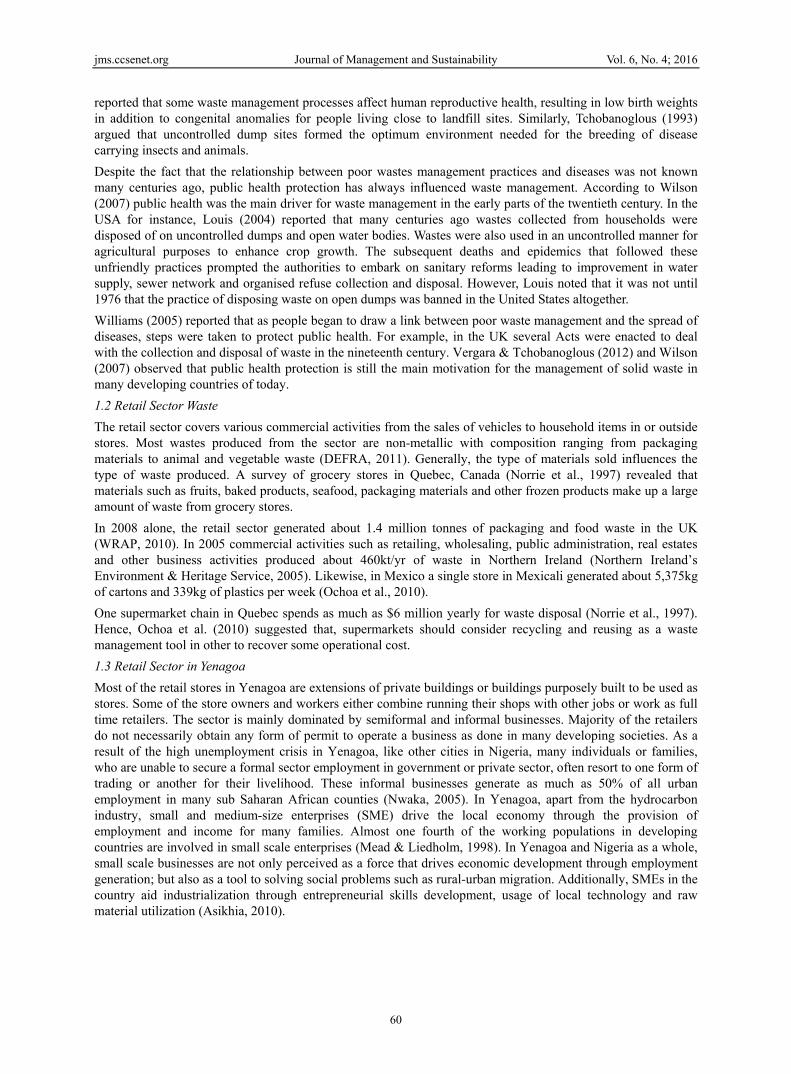
Figure 1. A section of Aretha lane road, Yenagoa
Source: Author’s photograph.
Despite the wide spread nature of informal businesses in Yenagoa and their importance, there seems to be very little government control, aid, incentives or involvement beside taxation. As a result of the little government involvement in the sector, small scale informal entrepreneurs in Yenagoa often have limited resources and start up capitals. This might account for their inability to employ more than 7 persons at a time.
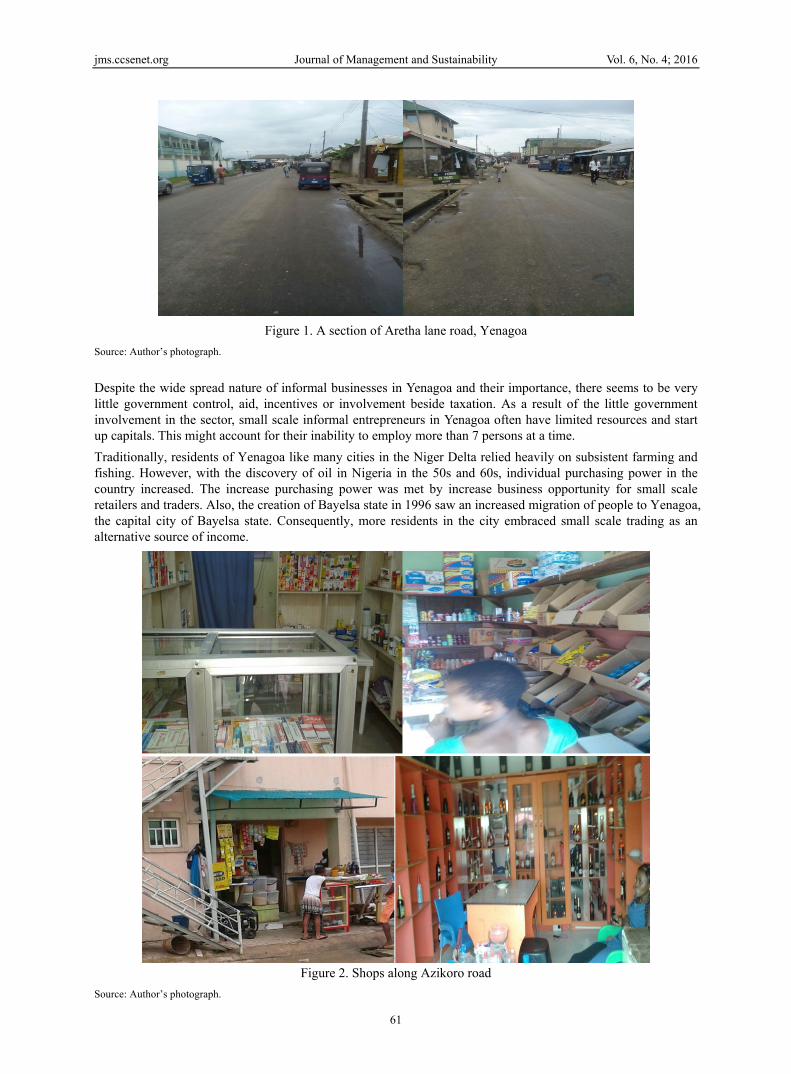
Traditionally, residents of Yenagoa like many cities in the Niger Delta relied heavily on subsistent farming and fishing. However, with the discovery of oil in Nigeria in the 50s and 60s, individual purchasing power in the country increased. The increase purchasing power was met by increase business opportunity for small scale retailers and traders. Also, the creation of Bayelsa state in 1996 saw an increased migration of people to Yenagoa, the capital city of Bayelsa state. Consequently, more residents in the city embraced small scale trading as an alternative source of income.
Figure 2. Shops along Azikoro road
Source: Author’s photograph.
jms.ccsenet.org Journal of Management and Sustainability Vol. 6, No. 4; 2016
62
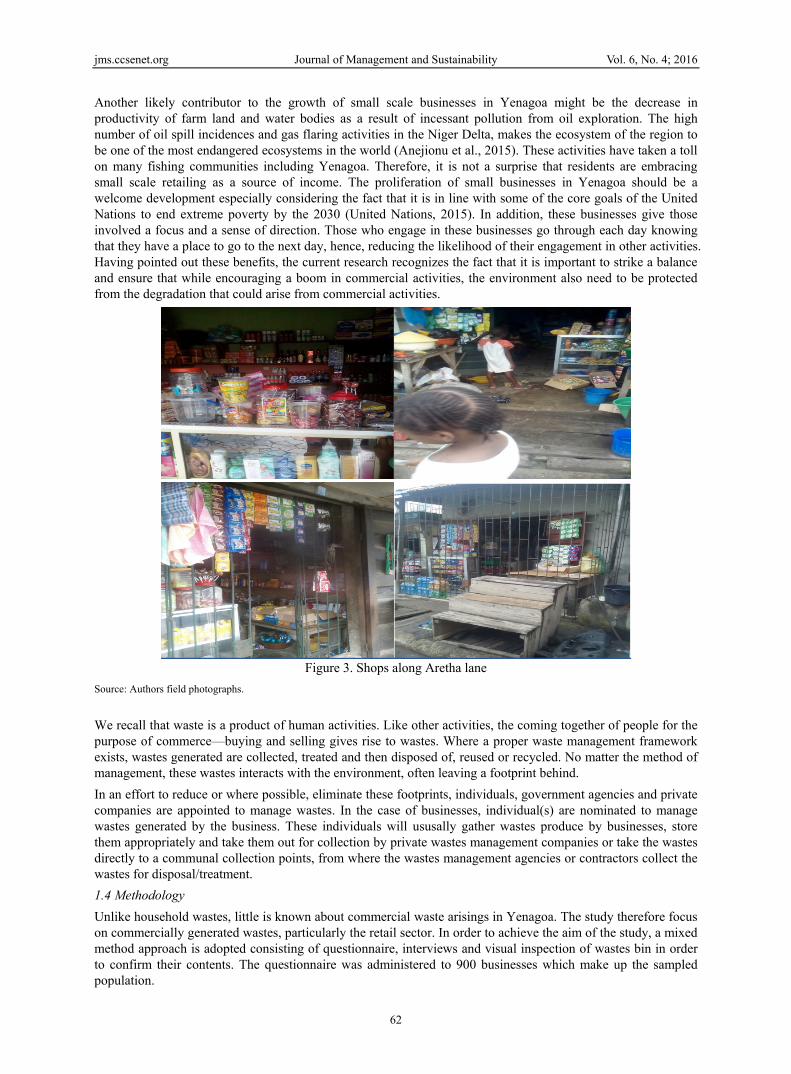
Another likely contributor to the growth of small scale businesses in Yenagoa might be the decrease in productivity of farm land and water bodies as a result of incessant pollution from oil exploration. The high number of oil spill incidences and gas flaring activities in the Niger Delta, makes the ecosystem of the region to be one of the most endangered ecosystems in the world (Anejionu et al., 2015). These activities have taken a toll on many fishing communities including Yenagoa. Therefore, it is not a surprise that residents are embracing small scale retailing as a source of income. The proliferation of small businesses in Yenagoa should be a welcome development especially considering the fact that it is in line with some of the core goals of the United Nations to end extreme poverty by the 2030 (United Nations, 2015). In addition, these businesses give those involved a focus and a sense of direction. Those who engage in these businesses go through each day knowing that they have a place to go to the next day, hence, reducing the likelihood of their engagement in other activities. Having pointed out these benefits, the current research recognizes the fact that it is important to strike a balance and ensure that while encouraging a boom in commercial activities, the environment also need to be protected from the degradation that could arise from commercial activities.
Figure 3. Shops along Aretha lane
Source: Authors field photographs.
We recall that waste is a product of human activities. Like other activities, the coming together of people for the purpose of commerce—buying and selling gives rise to wastes. Where a proper waste management framework exists, wastes generated are collected, treated and then disposed of, reused or recycled. No matter the method of management, these wastes interacts with the environment, often leaving a footprint behind.
In an effort to reduce or where possible, eliminate these footprints, individuals, government agencies and private companies are appointed to manage wastes. In the case of businesses, individual(s) are nominated to manage wastes generated by the business. These individuals will ususally gather wastes produce by businesses, store them appropriately and take them out for collection by private wastes management companies or take the wastes directly to a communal collection points, from where the wastes management agencies or contractors collect the wastes for disposal/treatment.
1.4 Methodology
Unlike household wastes, little is known about commercial waste arisings in Yenagoa. The study therefore focus on commercially generated wastes, particularly the retail sector. In order to achieve the aim of the study, a mixed method approach is adopted consisting of questionnaire, interviews and visual inspection of wastes bin in order to confirm their contents. The questionnaire was administered to 900 businesses which make up the sampled population.
jms.ccsenet.org Journal of Management and Sustainability Vol. 6, No. 4; 2016
63
In a mixed method approach the researcher generates or gathers data in the form of text through open ended questionnaires, interviews or in focus groups, whilst simultaneously or sequentially collection numeric data (Creswell, 2003; McCusker & Gunaydin, 2014). Similarly, due to the multidisciplinary nature of solid waste management studies, data collected often cut across several disciplines. Hence, text and numeric data are often generated (Ezeah, 2010), as is the case with the current study. Therefore a more robust method of investigation is required, thus the adoption of a mixed method approach.
1.4.1 Multi Stage Cluster Sampling Technique
In Yenagoa, retailers often tend to maximize profit and space by selling multiple items in one store. Hence, a shop owner may sell goods ranging from snacks, drinks and maybe footwear. However, a few retailers do sell single items. This practice of selling multiple items in a single store makes differentiating retailers according to items sold in store a difficult task. Consequently, during the survey, retailers were not categorised or stratified according to the items sold. Rather, the survey collected data from small scale retailers together as a sector of the economy (the retail sector).
Three major zones were purposefully selected for the study (zones A, B and C). A detailed sampling frame was developed for each zone by the research team through a listing and numbering system. A multi stage cluster sampling technique was employed due to the unavailability of an up-to-date sampling frame in the area. A similar approach of investigation was used by (Rahji & Oloruntoba, 2009). This approach of sampling might be used when dealing with population spread over a wide area as obtained in Yenagoa. Furthermore, this type of sampling technique should be applied when it is time consuming and capital intensive to develop a sampling frame for the entire region under study (Saunders et al., 2009).
Multistage sampling is a cheaper and convenient method of sampling when compared to other methods. It is also a flexible method since several aspects of the design have to be chosen including the number of stages and, for each stage, the unit of selection, the method of selection and number of units selected. This flexibility allows for a large scope which meets the demands of a particular survey in an efficient way (Steel, 2011). Additionally, a key benefit of the multistage sampling system is that it is often a practical and cost-efficient solution in situations where a list of elementary (or analytic) units is not available for direct sampling. In those cases, a list of elementary units can be compiled within just the sample clusters rather than for the whole frame (Valliant et al., 2013). This lack of a list comprising all the retailers in the area of study is the main reason why multistage cluster sampling technique was employed for this survey. The term Cluster sampling as used in the chapter means that a group of units is selected at the first stage of sampling. The clusters can be geographic areas, establishments, schools, or some other type of aggregate unit (Valliant et al., 2013).
2. Waste Characterisation This section considers the composition of wastes produced by the retail sector in Yenagoa, this is an important aspect of wastes management as wastes compostion influences the treatment and management options available to waste managers.
During the survey, it was observed that retailers in Yenagoa do not dispose their stored wastes on a daily basis. It was confirmed that retailers often compress their wastes so that the storage containers are full to capacity before they take them to disposal site. They cited the time involved to leave their shops to take wastes to disposal site as the main reason why they prefer compressing the waste into the storage containers to the maximum capacity before disposal.
The retailers were also interviewed with respect to the waste they generated. They were asked the following:
1) What size of waste container do they have?
2) How often (in days) do they empty the waste at a local collection point?; and
3) What percentage of materials do they have in their box from the following list?
Table 1. List of possible materials in wastes stream
• Wood • Textiles • Paper
• Cardboard • Putrescible • Glass • Metals • Fines • Plastic film • Other plastics • Electronic waste and batteries • Cans • Other
jms.ccsenet.org Journal of Management and Sustainability Vol. 6, No. 4; 2016
64
Much of the above materials listed by retailers as components of their wastes are highly subjective, in order to be sure of the contents, the researcher examined wastes bins to determine size, and then carried out a visual inspection of waste contained therein. Even so this still remained a highly subjective exercise for the following reasons:
• The inspection is carried out at a specific time and waste composition and amounts will vary with time;
• Although retailers indicate that the waste is compacted in the bin to maximise content, the bulk density of those waste and the possibility that side waste (large items of waste such as cardboard boxes which do not fit in the bin) might not be included in the data.
• The degree of compaction made by the retailer will affect the bulk density and therefore any estimations of waste.
Nevertheless the data was collected and reported here.
2.1 Frequency of Collection, Size of Bins and Waste Volumes
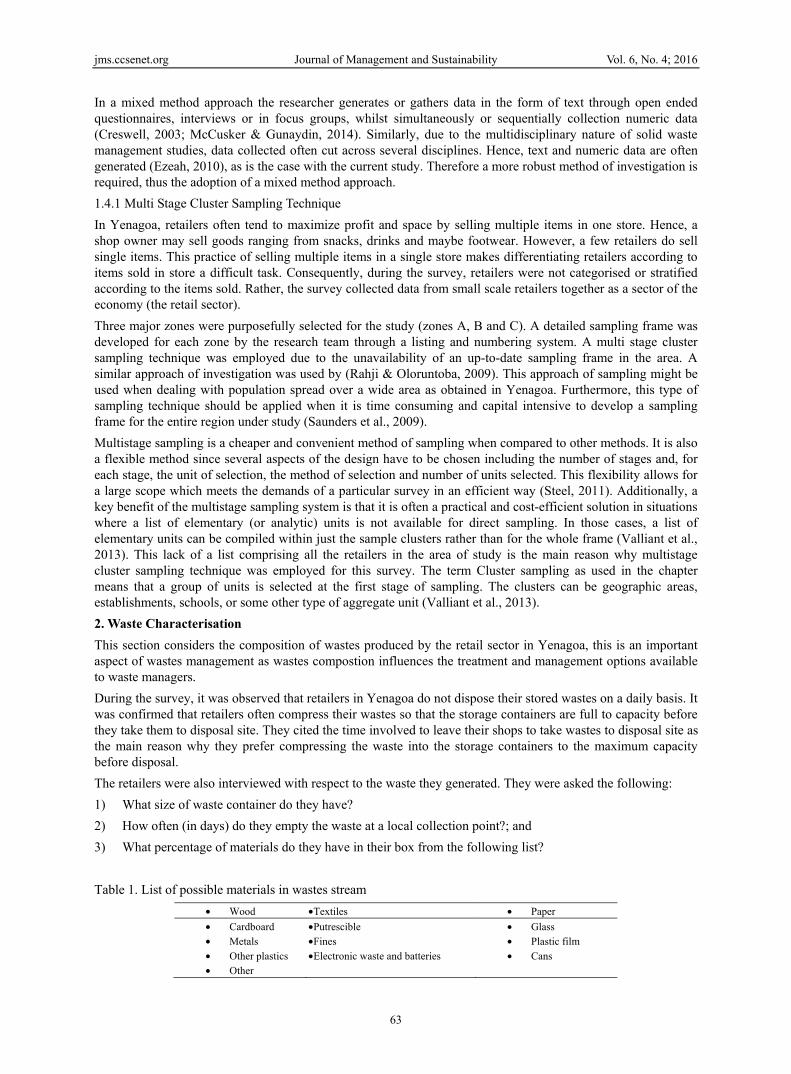
The frequency or interval between emptying the bins varied from daily to once every four weeks as shown in Figure 4, with the most popular being on a weekly basis (30% of the retailers). Few retailers emptied their waste bins on a daily basis.
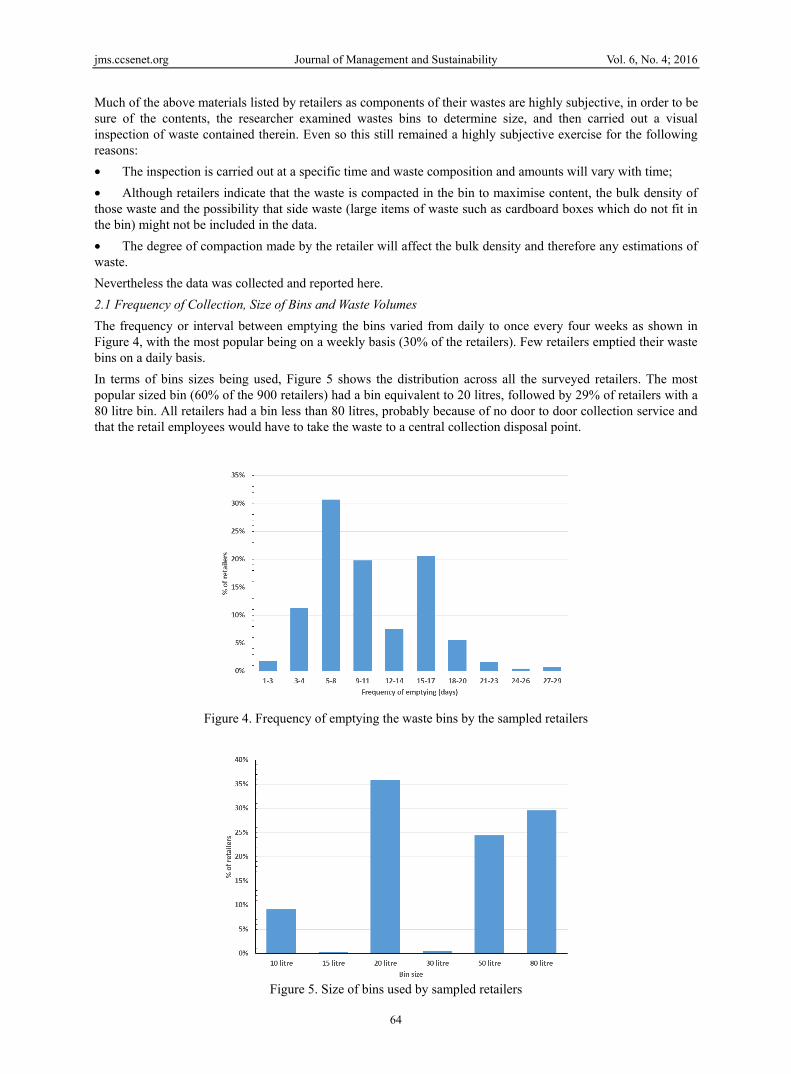
In terms of bins sizes being used, Figure 5 shows the distribution across all the surveyed retailers. The most popular sized bin (60% of the 900 retailers) had a bin equivalent to 20 litres, followed by 29% of retailers with a 80 litre bin. All retailers had a bin less than 80 litres, probably because of no door to door collection service and that the retail employees would have to take the waste to a central collection disposal point.
Figure 4. Frequency of emptying the waste bins by the sampled retailers
Figure 5. Size of bins used by sampled retailers
jms.ccsenet.org Journal of Management and Sustainability Vol. 6, No. 4; 2016
65
2.2 General Waste Characterisation
As part of the survey, participants were asked about how much of different types of waste they produced and disposed of. In addition to this question, a visual inspection was made of their bins at the time of survey. This was a fairly crude approach and estimates were based on the overall percentage thought to exist for each, based on intervals of 10%.
Table 2, summarises the percentages for a range of materials identified. For many of the materials—wood, paper, glass, fines, dense plastic are determined to be in the 0-10% category. However, cardboard and plastic films are the predominant materials.
Table 2. Waste composition of retail businesses surveyed
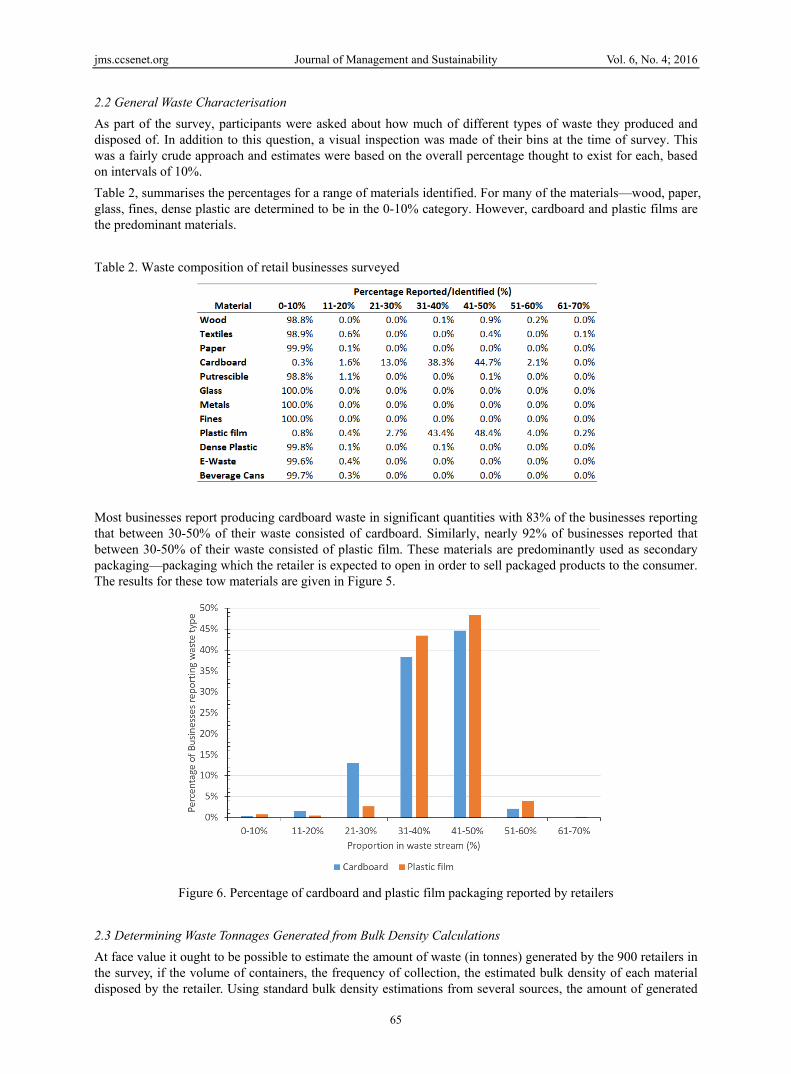
Most businesses report producing cardboard waste in significant quantities with 83% of the businesses reporting that between 30-50% of their waste consisted of cardboard. Similarly, nearly 92% of businesses reported that between 30-50% of their waste consisted of plastic film. These materials are predominantly used as secondary packaging—packaging which the retailer is expected to open in order to sell packaged products to the consumer. The results for these tow materials are given in Figure 5.
Figure 6. Percentage of cardboard and plastic film packaging reported by retailers
2.3 Determining Waste Tonnages Generated from Bulk Density Calculations
At face value it ought to be possible to estimate the amount of waste (in tonnes) generated by the 900 retailers in the survey, if the volume of containers, the frequency of collection, the estimated bulk density of each material disposed by the retailer. Using standard bulk density estimations from several sources, the amount of generated
jms.ccsenet.org Journal of Management and Sustainability Vol. 6, No. 4; 2016
66
by each retailer was calculated and the total waste generated for all 900 retailers was estimated to be 225 tonnes per year. This intuitively was considered to be too low suggesting that on average each business was generating 0.25 tonnes of waste per year. This is rather too low and it is suspected that there is under-reporting of total wastes produced as not all wastes are stored. Another possible reason for the lack of accurate reporting of actual volume of wastes will be that not all packaging waste will fit into the waste bins and that side waste, particularly cardboard will not be included in the figures.
2.4 Implications of the Findings
“There is no single correct method to achieve proper waste management. Nevertheless, there are common needs that must be addressed by those seeking to manage wastes. These include; knowledge of the type of wastes, volume of wastes arising, where it arises, who produces it and what happens to it (Rushbrook & Finnecy, 1988)”.
It has been established that almost all the retailers in Yenagoa produces wastes with various characteristics. However, two wastes materials in particular were produced in higher quantities—cardboard materials and plastic film and bags. These materials are recyclable. It is suspected that most shops use plastic bags and cardboard as packaging materials for their goods.
The study estimates that several tonnes of wastes are produced by each business on a yearly basis. In a city with several tens of thousands of small scale retailers, this includes all the markets in the city. It is clear that the volume of wastes materials produced as a result of commercial activities by retailers across the city are obviously enormous and there is a need to look at the wastes emanating from the sector critically with a view to identify the best method of managing wastes from the sector.
2.5 Establishment of Wastes Recycling Deport
This should be an extensive wastes management facility for the recycling or processing of wastes paper, tins, cans, plastics, cardboard, furniture, wood products and possibly WEEE. The facility will also process food wastes through composting. As a pilot, one facility can be established at the initial stage in a central location in Yenagoa where food/putrescible wastes from the market and household can be deposited for processing. At the same time, wastes from recyclables from institutions and businesses can also be processed at the facility. The establishment of such facility is certainly not beyond the reach of the government considering the substantial allocation that the state receives on a monthly basis.
The facility is not expected to be very expensive as wastes will not be processed to other products. Rather, it should be a basic system where the major investment will perhaps be for the construction of the facility with a medium size conveyor belt system capable of separating wastes into components.
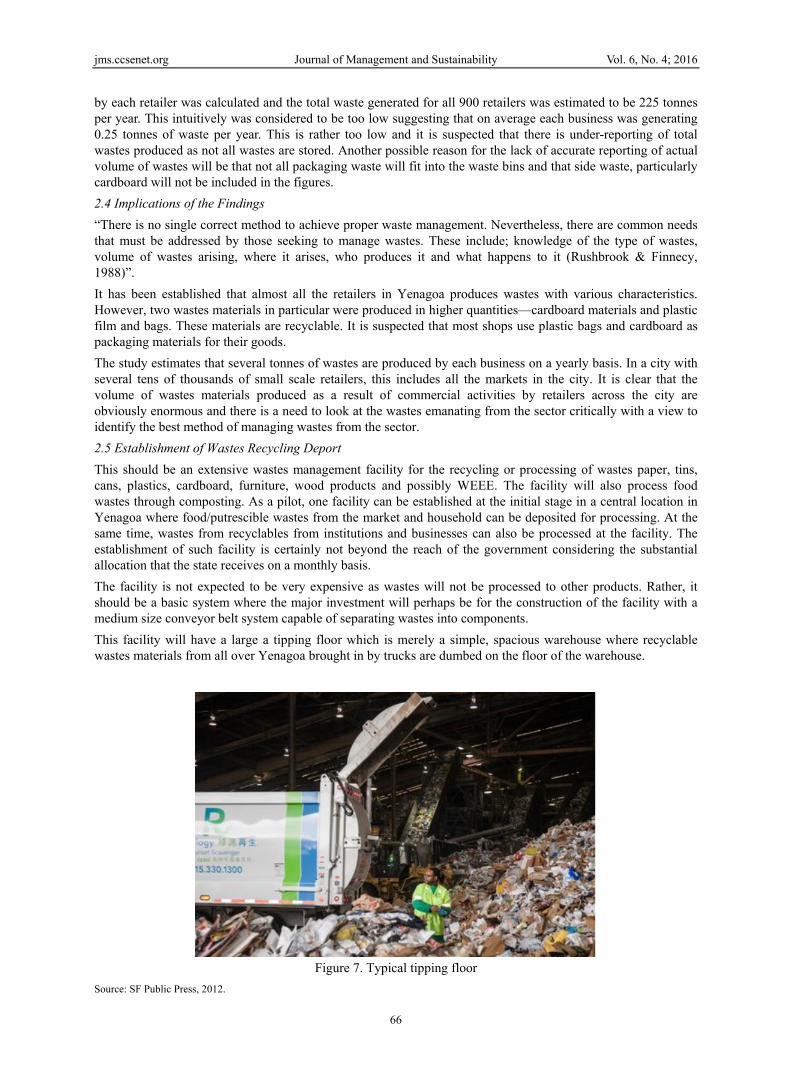
This facility will have a large a tipping floor which is merely a simple, spacious warehouse where recyclable wastes materials from all over Yenagoa brought in by trucks are dumbed on the floor of the warehouse.
Figure 7. Typical tipping floor
Source: SF Public Press, 2012.
jms.ccsenet.org Journal of Management and Sustainability Vol. 6, No. 4; 2016
67
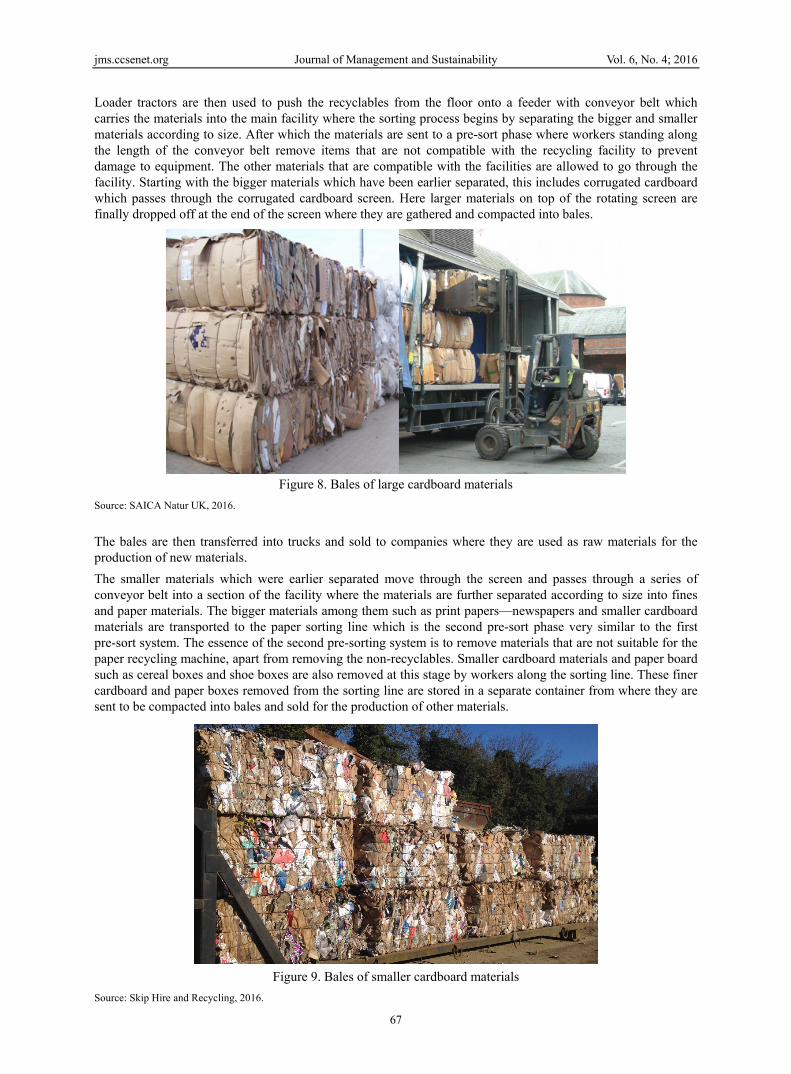
Loader tractors are then used to push the recyclables from the floor onto a feeder with conveyor belt which carries the materials into the main facility where the sorting process begins by separating the bigger and smaller materials according to size. After which the materials are sent to a pre-sort phase where workers standing along the length of the conveyor belt remove items that are not compatible with the recycling facility to prevent damage to equipment. The other materials that are compatible with the facilities are allowed to go through the facility. Starting with the bigger materials which have been earlier separated, this includes corrugated cardboard which passes through the corrugated cardboard screen. Here larger materials on top of the rotating screen are finally dropped off at the end of the screen where they are gathered and compacted into bales.
Figure 8. Bales of large cardboard materials
Source: SAICA Natur UK, 2016.
The bales are then transferred into trucks and sold to companies where they are used as raw materials for the production of new materials.
The smaller materials which were earlier separated move through the screen and passes through a series of conveyor belt into a section of the facility where the materials are further separated according to size into fines and paper materials. The bigger materials among them such as print papers—newspapers and smaller cardboard materials are transported to the paper sorting line which is the second pre-sort phase very similar to the first pre-sort system. The essence of the second pre-sorting system is to remove materials that are not suitable for the paper recycling machine, apart from removing the non-recyclables. Smaller cardboard materials and paper board such as cereal boxes and shoe boxes are also removed at this stage by workers along the sorting line. These finer cardboard and paper boxes removed from the sorting line are stored in a separate container from where they are sent to be compacted into bales and sold for the production of other materials.
Figure 9. Bales of smaller cardboard materials
Source: Skip Hire and Recycling, 2016.
jms.ccsenet.org Journal of Management and Sustainability Vol. 6, No. 4; 2016
68
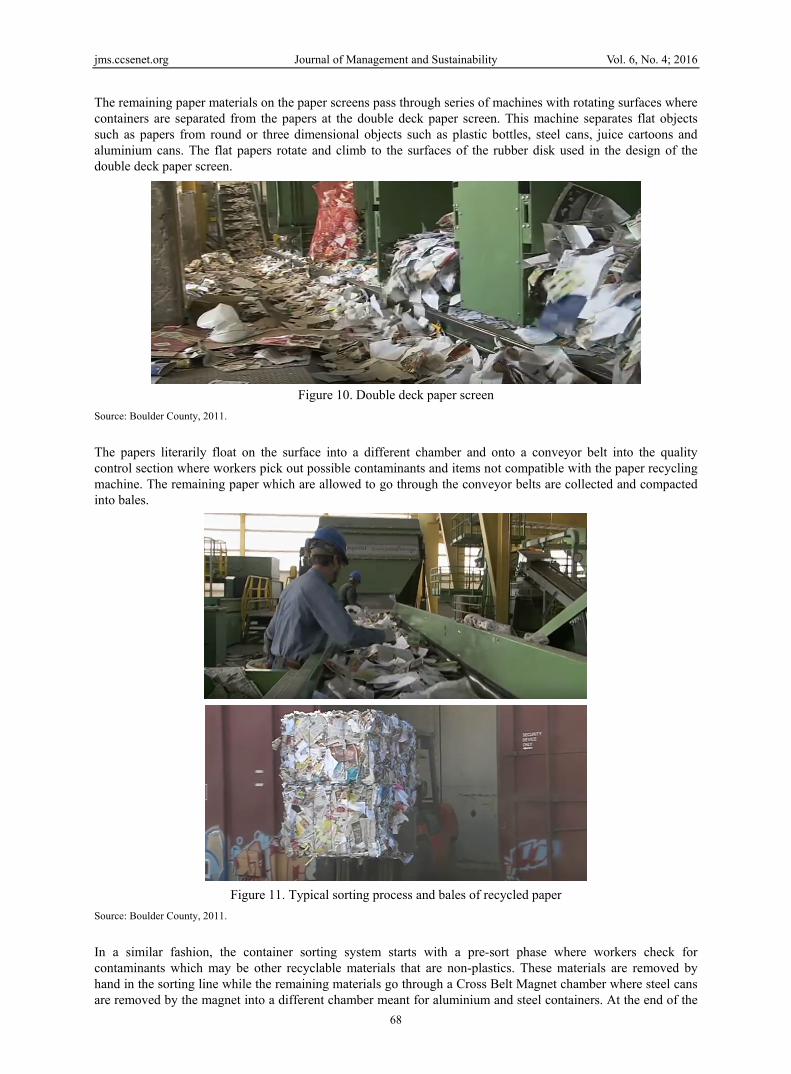
The remaining paper materials on the paper screens pass through series of machines with rotating surfaces where containers are separated from the papers at the double deck paper screen. This machine separates flat objects such as papers from round or three dimensional objects such as plastic bottles, steel cans, juice cartoons and aluminium cans. The flat papers rotate and climb to the surfaces of the rubber disk used in the design of the double deck paper screen.
Figure 10. Double deck paper screen
Source: Boulder County, 2011.
The papers literarily float on the surface into a different chamber and onto a conveyor belt into the quality control section where workers pick out possible contaminants and items not compatible with the paper recycling machine. The remaining paper which are allowed to go through the conveyor belts are collected and compacted into bales.
Figure 11. Typical sorting process and bales of recycled paper
Source: Boulder County, 2011.
In a similar fashion, the container sorting system starts with a pre-sort phase where workers check for contaminants which may be other recyclable materials that are non-plastics. These materials are removed by hand in the sorting line while the remaining materials go through a Cross Belt Magnet chamber where steel cans are removed by the magnet into a different chamber meant for aluminium and steel containers. At the end of the
jms.ccsenet.org Journal of Management and Sustainability Vol. 6, No. 4; 2016
69
sorting process, the plastics are gathered together in bales where they are sold for the production of clothes, plastic containers, packaging products, construction products such as drainage pipes, plastic seats, bin liners and several other products.
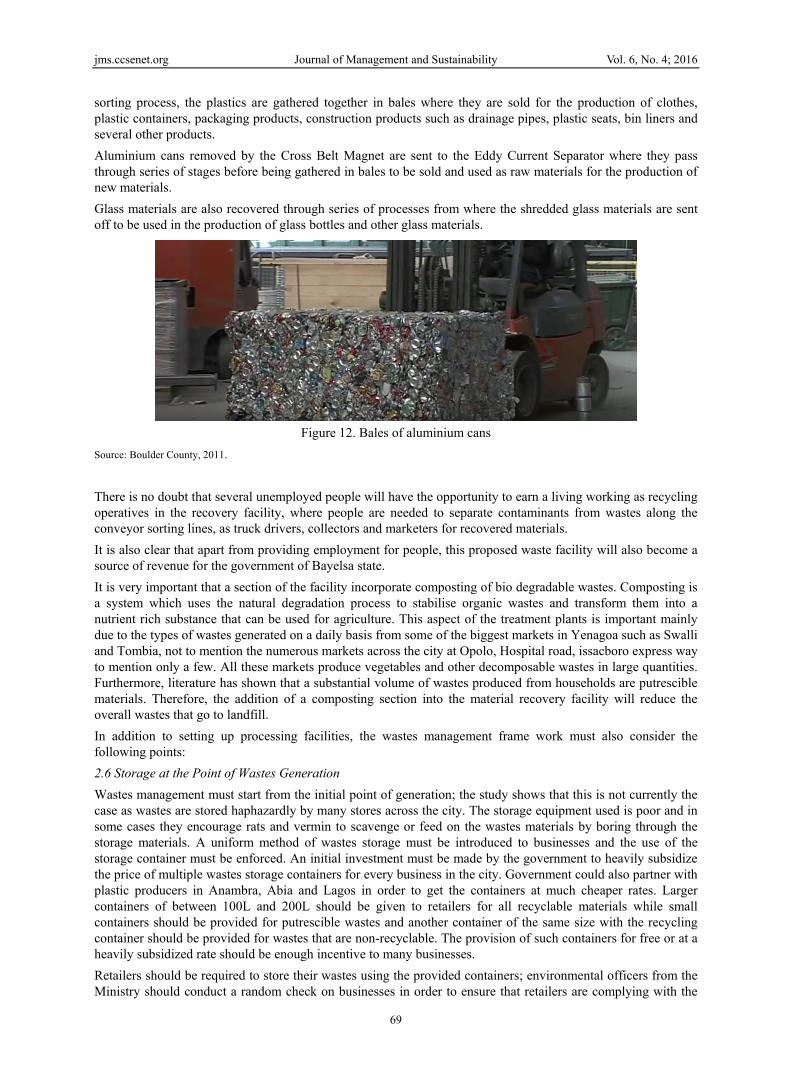
Aluminium cans removed by the Cross Belt Magnet are sent to the Eddy Current Separator where they pass through series of stages before being gathered in bales to be sold and used as raw materials for the production of new materials.
Glass materials are also recovered through series of processes from where the shredded glass materials are sent off to be used in the production of glass bottles and other glass materials.
Figure 12. Bales of aluminium cans
Source: Boulder County, 2011.
There is no doubt that several unemployed people will have the opportunity to earn a living working as recycling operatives in the recovery facility, where people are needed to separate contaminants from wastes along the conveyor sorting lines, as truck drivers, collectors and marketers for recovered materials.
It is also clear that apart from providing employment for people, this proposed waste facility will also become a source of revenue for the government of Bayelsa state.
It is very important that a section of the facility incorporate composting of bio degradable wastes. Composting is a system which uses the natural degradation process to stabilise organic wastes and transform them into a nutrient rich substance that can be used for agriculture. This aspect of the treatment plants is important mainly due to the types of wastes generated on a daily basis from some of the biggest markets in Yenagoa such as Swalli and Tombia, not to mention the numerous markets across the city at Opolo, Hospital road, issacboro express way to mention only a few. All these markets produce vegetables and other decomposable wastes in large quantities. Furthermore, literature has shown that a substantial volume of wastes produced from households are putrescible materials. Therefore, the addition of a composting section into the material recovery facility will reduce the overall wastes that go to landfill.
In addition to setting up processing facilities, the wastes management frame work must also consider the following points:
2.6 Storage at the Point of Wastes Generation
Wastes management must start from the initial point of generation; the study shows that this is not currently the case as wastes are stored haphazardly by many stores across the city. The storage equipment used is poor and in some cases they encourage rats and vermin to scavenge or feed on the wastes materials by boring through the storage materials. A uniform method of wastes storage must be introduced to businesses and the use of the storage container must be enforced. An initial investment must be made by the government to heavily subsidize the price of multiple wastes storage containers for every business in the city. Government could also partner with plastic producers in Anambra, Abia and Lagos in order to get the containers at much cheaper rates. Larger containers of between 100L and 200L should be given to retailers for all recyclable materials while small containers should be provided for putrescible wastes and another container of the same size with the recycling container should be provided for wastes that are non-recyclable. The provision of such containers for free or at a heavily subsidized rate should be enough incentive to many businesses.
Retailers should be required to store their wastes using the provided containers; environmental officers from the Ministry should conduct a random check on businesses in order to ensure that retailers are complying with the
jms.ccsenet.org Journal of Management and Sustainability Vol. 6, No. 4; 2016
70
requirement. It has been shown that where retailers are required to perform certain environmental duties by the government, they tend to be largely compliant as most retailers would prefer to avoid confrontation, fines or prosecution. Therefore, government can take advantage of their disposition to perform environmental duties which are compulsory. The mere fact that it is a requirement by the government to recycle will lead to massive improvement in recycling rate.
2.7 Integrated Collection Centres
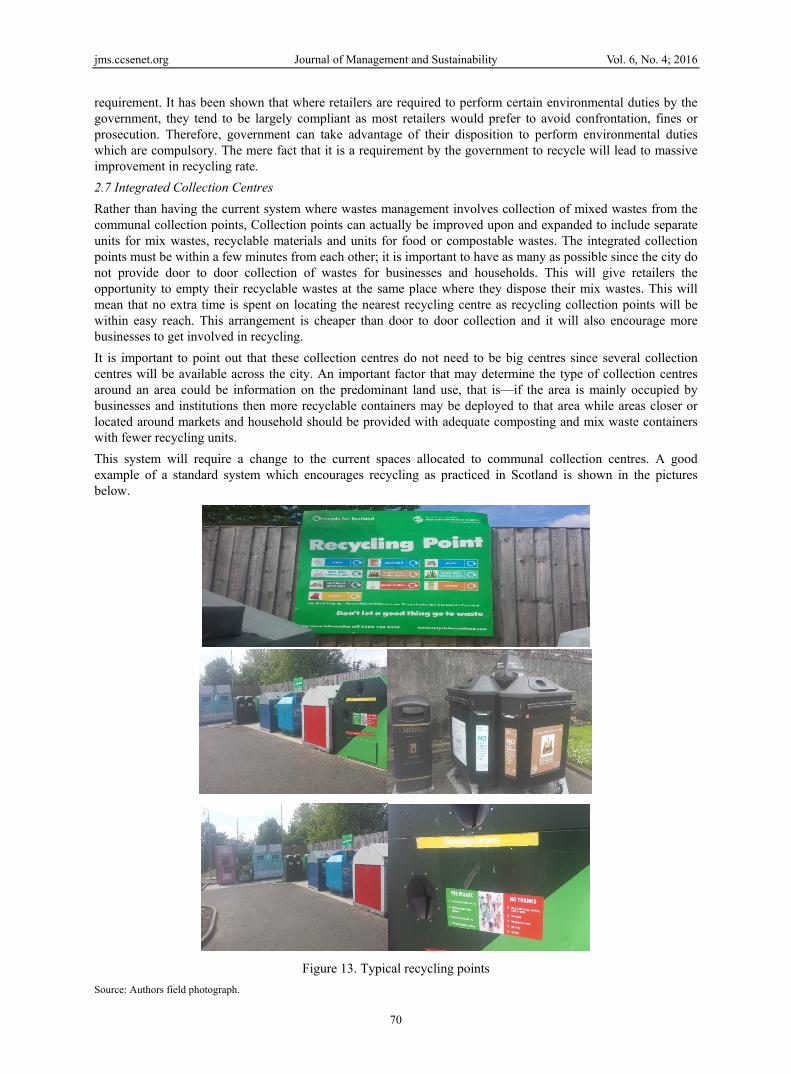
Rather than having the current system where wastes management involves collection of mixed wastes from the communal collection points, Collection points can actually be improved upon and expanded to include separate units for mix wastes, recyclable materials and units for food or compostable wastes. The integrated collection points must be within a few minutes from each other; it is important to have as many as possible since the city do not provide door to door collection of wastes for businesses and households. This will give retailers the opportunity to empty their recyclable wastes at the same place where they dispose their mix wastes. This will mean that no extra time is spent on locating the nearest recycling centre as recycling collection points will be within easy reach. This arrangement is cheaper than door to door collection and it will also encourage more businesses to get involved in recycling.
It is important to point out that these collection centres do not need to be big centres since several collection centres will be available across the city. An important factor that may determine the type of collection centres around an area could be information on the predominant land use, that is—if the area is mainly occupied by businesses and institutions then more recyclable containers may be deployed to that area while areas closer or located around markets and household should be provided with adequate composting and mix waste containers with fewer recycling units.
This system will require a change to the current spaces allocated to communal collection centres. A good example of a standard system which encourages recycling as practiced in Scotland is shown in the pictures below.
Figure 13. Typical recycling points
Source: Authors field photograph.
jms.ccsenet.org Journal of Management and Sustainability Vol. 6, No. 4; 2016
71
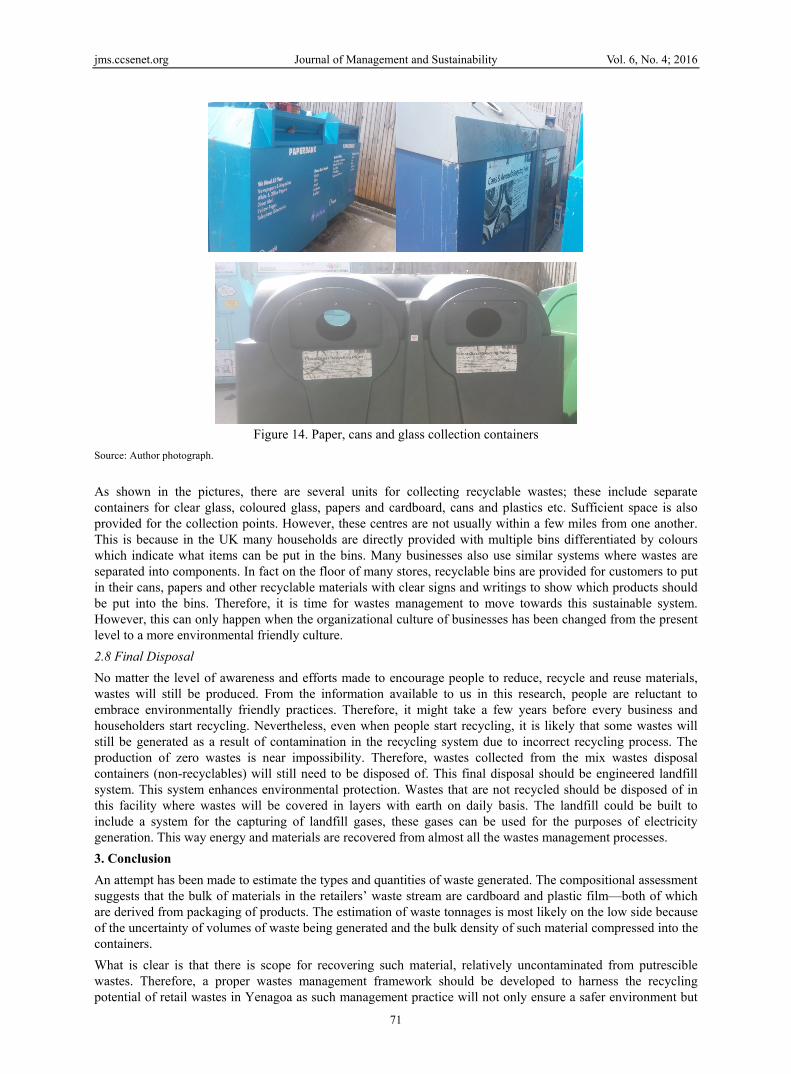
Figure 14. Paper, cans and glass collection containers
Source: Author photograph.
As shown in the pictures, there are several units for collecting recyclable wastes; these include separate containers for clear glass, coloured glass, papers and cardboard, cans and plastics etc. Sufficient space is also provided for the collection points. However, these centres are not usually within a few miles from one another. This is because in the UK many households are directly provided with multiple bins differentiated by colours which indicate what items can be put in the bins. Many businesses also use similar systems where wastes are separated into components. In fact on the floor of many stores, recyclable bins are provided for customers to put in their cans, papers and other recyclable materials with clear signs and writings to show which products should be put into the bins. Therefore, it is time for wastes management to move towards this sustainable system. However, this can only happen when the organizational culture of businesses has been changed from the present level to a more environmental friendly culture.
2.8 Final Disposal
No matter the level of awareness and efforts made to encourage people to reduce, recycle and reuse materials, wastes will still be produced. From the information available to us in this research, people are reluctant to embrace environmentally friendly practices. Therefore, it might take a few years before every business and householders start recycling. Nevertheless, even when people start recycling, it is likely that some wastes will still be generated as a result of contamination in the recycling system due to incorrect recycling process. The production of zero wastes is near impossibility. Therefore, wastes collected from the mix wastes disposal containers (non-recyclables) will still need to be disposed of. This final disposal should be engineered landfill system. This system enhances environmental protection. Wastes that are not recycled should be disposed of in this facility where wastes will be covered in layers with earth on daily basis. The landfill could be built to include a system for the capturing of landfill gases, these gases can be used for the purposes of electricity generation. This way energy and materials are recovered from almost all the wastes management processes.
3. Conclusion An attempt has been made to estimate the types and quantities of waste generated. The compositional assessment suggests that the bulk of materials in the retailers’ waste stream are cardboard and plastic film—both of which are derived from packaging of products. The estimation of waste tonnages is most likely on the low side because of the uncertainty of volumes of waste being generated and the bulk density of such material compressed into the containers.
What is clear is that there is scope for recovering such material, relatively uncontaminated from putrescible wastes. Therefore, a proper wastes management framework should be developed to harness the recycling potential of retail wastes in Yenagoa as such management practice will not only ensure a safer environment but
jms.ccsenet.org Journal of Management and Sustainability Vol. 6, No. 4; 2016
72
will also generate a source of employment for residents who will be interested in working in recycling facilities. It is suggested that wastes management facilities should be established to cater for recyclable wastes in the city. This is because apart from the retail sector, Yenagoa has several institutions such as financial and educational institutions as well as government ministries where a substantial volume of recyclable wastes such as papers are produced.
References Amasuomo, E., Hasnain, S. A., & Osanyinlusi, A. Y. (2015). Sustainable Development in the Context of Major
Infrastructure Projects in United Kingdom. Journal of Geoscience & Environment Protection, 3(4), 44-55. https:/doi.org/10.4236/gep.2015.34006
Anejionu, O. C. D., Ahiarammunnah, P. A. N., & Nri-ezedi, C. J. (2015). Hydrocarbon pollution in the Niger Delta: Geographies of impacts and appraisal of lapses in extant legal framework. Resources Policy, 45, 65-77. https://doi.org/10.1016/j.resourpol.2015.03.012
Asikhia, O. (2010). Customer Orientation and Firm Performance among Nigerian Small and Medium Scale Businesses. International Journal of Marketing Studies, 2(1), 197-212. https://doi.org/10.5539/ijms.v2n1p197
Beranek, W. (1992). Solid Waste Management and Economic Development. Economic Development Review, 10, 49.
Ezeah, C. (2010). Analysis of barriers and success factors affecting the adoption of sustainable management of municipal solid waste in Abuja, Nigeria. Journal of Environmental Management, 103, 9-14. https://doi.org/10.1016/j.jenvman.2012.02.027
Giusti, L. (2009). A review of waste management practices and their impact on human health. Waste Management, 29(8), 2227-2239. https://doi.org/10.1016/j.wasman.2009.03.028
Mead, D. C., & Liedholm, C. (1998). The dynamics of micro and small enterprises in developing countries. World Development, 26(1), 61-74. https://doi.org/10.1016/S0305-750X(97)10010-9
Norrie, J., Lafortune, P., & Beauchamp, C. J. (1997). Characterization of waste materials originating from Quebec supermarkets and an assessment of recycling potential. Resources Conservation & Recycling, 19(4), 265-277. https://doi.org/10.1016/S0921-3449(96)01192-5
Rahji, M. A. Y., & Oloruntoba, E. O. (2009). Determinants of households’ willingness-to-pay for private solid waste management services in Ibadan, Nigeria. Waste Management & Research the Journal of the International Solid Wastes & Public Cleansing Association Iswa, 27(10), 961-965. https://doi.org/10.1177/0734242X09103824
Rushbrook, P. E., & Finnecy, E. E. (1988). Planning for future waste management operations in developing countries. Waste Management & Research, 6(1), 1-21. https://doi.org/10.1177/0734242X8800600101
Saunders, M., Lewis, P., & Thornhill, A. (2009). Research methods for business students. London: Pearson Education.
Steel, D. (2011). Multistage Sampling. In M. Lovric (Ed.), International Encyclopedia of Statistical Science (pp. 896-898). Berlin Heidelberg: Springer. https://doi.org/10.1007/978-3-642-04898-2_392
Troschinetz, A. M., & Mihelcic, J. R. (2009). Sustainable recycling of municipal solid waste in developing countries. Waste Management, 29(2), 915-923. https://doi.org/10.1016/j.wasman.2008.04.016
United Nations. (2015). Outcome document of Summit for adoption of the post 2015 development agenda. Retrieved from http://www.un.org/pga/wp-content/uploads/sites/3/2015/08/120815_outcome-document-of-Summit-for-adoption-of-the-post-2015-development-agenda.pdf
Valliant, R., Dever, J. A., & Kreuter, F. (2013). Designing Multistage Samples (pp.203-255). New York: Springer. https://doi.org/10.1007/978-1-4614-6449-5_9
Copyrights Copyright for this article is retained by the author(s), with first publication rights granted to the journal.
This is an open-access article distributed under the terms and conditions of the Creative Commons Attribution license (http://creativecommons.org/licenses/by/4.0/).