Embed Size (px)
Citation preview
The charnockite-anorthosite suite of rocks exposed in
central Dronning Maud Land, East Antarctica: a study
on fluid-rock interactions, and post-entrapment change
of metamorphic fluid inclusions
Die charnockitischen und anorthositischen
Gesteinsserien im zentralen Dronning Maud Land:
Fluid-Gesteins-Wechselwirkungen und die
Veränderung metamorpher Fluid-Einschlüsse nach
ihrer Bildung

Bärbel Kleinefeld
Geologie der PolargebieteFachbereich GeowissenschaftenUniversität BremenPostfach 33044028334 Bremen
Die vorliegende Arbeit ist die inhaltlich unveränderte Fassung der Dissertation,die im Juli 2002 dem Fachbereich Geowissenschaften der Universität Bremenunter gleichem Titel vorgelegt wurde.

Table of contents
i
Table of contents
Abstract....................................................................................................................... 1
Zusammenfassung .................................................................................................... 3
1. Introduction ........................................................................................................ 5
1.1. Fluid-rock interactions in deep-seated crustal rocks............................... 5
1.2. Previous studies and scope of the thesis .................................................. 7
2. The charnockite – anorthosite suite of rocks .................................................. 9
2.1. Classifying rocks of the charnockite series .............................................. 9
2.2. Massif-type anorthosites.......................................................................... 10
2.3. "Incipient" or "arrested-type" charnockitisation .................................... 11
3. Principles of fluid inclusion studies ............................................................. 14
3.1. Theoretical background - the ideal model ............................................. 14
3.2. Practical aspects of fluid inclusion studies ............................................ 16
3.2.1. Irreversible post-entrapment change.................................................................. 18
3.3. Nomenclature ........................................................................................... 19
4. Analytical methods and data evaluation....................................................... 20
4.1. Polarisation microscopy .......................................................................... 20
4.2. Electron microprobe analysis.................................................................. 20
4.3. Microthermometry................................................................................... 21
4.4. Raman spectrometry................................................................................ 23
4.5. Bulk composition, molar volume and isochore calculations................ 23
5. Geological setting............................................................................................. 27
5.1. The position of central Dronning Maud Land in respect to Rodiniaand Gondwana reconstruction................................................................ 27
5.2. Geography and geological evolution of central Dronning MaudLand........................................................................................................... 29
5.3. Nomenclature of geographic sites in Dronning Maud Land ............... 32
Table of contents
ii
6. The basement lithologies of the central Petermannketten - an exampleof secondary charnockitisation and leaching processes.............................. 34
6.1. Metamorphic charnockites and gneisses of the basement lithologies. 35
6.1.1. Petrography of "dark" rock varieties................................................................... 35
6.1.2. Petrography of "light" rock varieties................................................................... 39
6.1.3. Fluid inclusion studies........................................................................................... 43
6.1.4. Mineral chemistry of feldspars, pyroxenes and garnets ................................. 49
6.2. Syn- and post-kinematic intrusions........................................................ 52
6.2.1. Petrography ............................................................................................................. 52
6.2.2. Fluid inclusion studies........................................................................................... 54
6.3. Summary and Discussion - metamorphic charnockitisation andsuccessive leaching .................................................................................. 55
7. The Otto-von-Gruber-Gebirge - fluid content of a massif-typeanorthosite complex......................................................................................... 62
7.1. Massif-type anorthosite samples ............................................................ 62
7.1.1. Petrography ............................................................................................................. 62
7.1.2. Fluid inclusion studies........................................................................................... 66
7.2. Shear zones within the O.-v.-Gruber anorthosite complex .................. 71
7.2.1. Petrography ............................................................................................................. 71
7.2.2. Fluid inclusion studies........................................................................................... 75
7.2.3. Mineral chemistry of feldspars, pyroxenes, and garnets ................................ 77
7.3. Discussion ................................................................................................. 79
8. Fluid inclusions as micro-chemical systems: evidence and modellingof fluid-host interaction in plagioclase (separate paper) ............................ 87
9. Conclusion ...................................................................................................... 114
References .............................................................................................................. 118
Appendix.....................................................................................................................I
9.1. Appendix C................................................................................................ II
9.2. Appendix D .............................................................................................XX
Acknowledgements
Abstract
1
Abstract
The study area of central Dronning Maud Land, East Antarctica is a typical example
of a granulite facies Precambrian terrane that was exposed to substantial
polymetamorphism during the late Neoproterozoic/early Palaeozoic. Fluid inclusion
studies from typical representatives of the charnockite-anorthosite suite of rocks,
associated gneisses and syenitic intrusives give new constraints on both peak
metamorphic conditions and post-peak metamorphic processes during retrograde
uplift. Detailed petrographical studies were supported by Electron Microprobe
techniques and combined with microthermometry and Raman spectrometry data.
Three distinct fluid phases, either consisting of CO2±N2, H2O-salt or CO2±N2±H2O-
salt were differentiated. All fluid inclusion types are hosted by plagioclase, quartz and
garnet and display textural relationships indicative for a primary (metamorphic or
magmatic) origin. The CO2±N2 fluid is most abundant, and it is assumed that it played
an important role during metamorphic charnockite formation and anorthosite
emplacement. However, evidence of post-entrapment change reveals that a large
number of inclusions were subjected to profound reequilibration processes that
resulted in a modification of original fluid properties, often accompanied by the partial
to complete loss of an aqueous component.
An important indicator for the residual character of some CO2±N2 fluid inclusions
was the frequent observation of sheet silicate and carbonate microcrystals that were
produced by a micro-chemical reaction of an originally CO2-H2O±N2 fluid with its
plagioclase host. These observations from the anorthosite complex were used to model
the fluid-host interaction with consideration of different original fluid compositions.
Compared to an actual fluid inclusion it is obvious, that volume estimations of solid
phases can be used as a starting point to reverse the retrograde reaction and recalculate
the compositional and volumetrical properties of the original fluid. Isochores for an
unmodified inclusion can thus be reconstructed, leading to a more realistic estimation
of P-T conditions during earlier metamorphic stages or fluid capturing.
Although CO2±N2 inclusions detected within the anorthosite body and associated
shear zones reveal a large range in densities, isochoric calculations for the highest
density inclusions are in accordance with independent P-T data for near peak-
metamorphic conditions. This again illustrates that metamorphic minerals (plagioclase
and garnet) are able to preserve the original metamorphic fluid, as substantial
reequilibration processes do not take place uniformly within single crystals. A detailed
fluid inclusion study can thus provide valuable constraints on the P-T conditions
acting during different stages of fluid entrapment and reequilibration.
A selection of representative isochores from the different basement lithologies have
Abstract
2
been correlated with P-T constraints based on mineral-equilibria data available from
other studies. The gradual decrease in fluid densities best fits a clockwise P-T path and
mineral-fluid equilibration during near isothermal decompression is postulated for the
post-peak-metamorphic and retrograde development of the rocks exposed in central
Dronning Maud Land.
Zusammenfassung
3
Zusammenfassung
Das Arbeitsgebiet im zentralen Dronning Maud Land (Ostantarktis) ist ein typisches
Beispiel für einen granulitfaziellen präkambrischen Terran, der während des späten
Neoproterozoikums/frühen Paläozoikums durch intensive Polymetamorphose
überprägt wurde. Untersuchungen von Fluid-Einschlüssen repräsentativ ausgewählter
Gesteine der Charnockit-Anorthosit-Folge, der assoziierten Gneise und der
syenitischen Intrusiva liefern neue Hinweise sowohl auf die peak-metamorphen
Bedingungen als auch auf die post-peak-metamorphen Prozesse, die während des
retrograden Aufstiegpfades stattfanden. Detaillierte petrographische Studien wurden
durch Elektronenstrahl-Mikrosonden-Untersuchungen ergänzt und mit
mikrothermometrischen und Raman spektrometrischen Analysemethoden kombiniert.
Drei unterschiedliche fluide Phasen konnten identifiziert werden, die entweder aus
CO2±N2, H2O-Salz oder einem komplexen CO2±N2±H2O-Salz Gemisch bestehen. Die
Wirtsminerale für alle Einschlusstypen sind Plagioklas, Quarz und Granat. Die
Einschlüsse zeigen eine texturelle Anordnung, die für einen primären (primär
metamorphen oder magmatischen) Ursprung charakteristisch ist. Am weitesten
verbreitet sind CO2±N2 Einschlüsse, die während der Enstehung metamorpher
Charnockite und der Intrusion des Anorthositkörpers eine vermutlich wichtige Rolle
einnahmen. Anzeichen für eine Veränderung der Einschlüsse nach ihrer Entstehung
weisen jedoch darauf hin, dass eine grosse Anzahl von Fluid-Einschlüssen
umfangreichen Reequilibrierungsprozessen ausgesetzt waren. Diese führten zu einer
Veränderung der ursprünglichen Fluid-Eigenschaften, die häufig mit einem partiellen
oder vollständigen Verlust der wässrigen Anteile einhergingen. Ein wichtiges
Anzeichen für den residualen Charakter einiger CO2±N2 Einschlüsse ist das häufige
Auftreten von Schichtsilikaten sowie karbonatischen Mikrokristallen, die durch eine
mikro-chemische Reaktion des umgebenden Wirtsminerals mit dem ursprünglich
eingeschlossenen Fluid (CO2-H2O±N2) entstanden sind. Diese Beobachtungen an
Gesteinen des Anorthositkörpers wurden verwendet, um die wechselseitige Reaktion
zwischen dem Fluid und dem umgebenden Wirtsmineral zu modellieren. Dabei
wurden unterschiedliche ursprüngliche Fluid-Zusammesetzungen berücksichtigt. Im
Vergleich mit tatsächlich vorkommenden Einschlüssen zeigt sich, dass
Volumenabschätzungen der Festphase als Ausgangspunkt für eine rechnerische
Umkehr der retrograden Reaktion genutzt werden können. Dies erlaubt die
Berechnung der ursprünglichen Volumina und Zusammensetzungen von Fluid-
Einschlüssen. Auf diese Weise können Isochoren für ursprüngliche und unveränderte
Einschlüsse berechnet werde, was eine realistischere Abschätzung der P-T-
Bedingungen während einer früh-metamorphen Phase oder dem Moment der

Zusammenfassung
4
Einschlussbildung ermöglicht.
Obwohl die CO2±N2 Einschlüsse des Anorthositkörpers und der mit ihm
assoziierten Scherzonen einen weiten Dichtebereich abdecken, stimmen die Isochoren
der dichtesten Einschlüsse mit aus unabhängigen Daten rekonstruierten P-T-
Bedingungen nahe der Peak-Metamorphose überein. Dies wiederum zeigt, dass
metamorphe Mineralphasen (Plagioklas und Granat) durchaus in der Lage sind, das
ursprüngliche Fluid zu konservieren, da umfangreiche Reequilibrierungsprozesse
innerhalb eines Kristalls nicht gleichmäßig ablaufen. Die detaillierte Untersuchung von
Fluid-Einschlüssen kann daher wichtige Hinweise auf P-T-Bedingungen während
unterschiedlicher Phasen der Einschluss-Bildung und -Reequilibrierung liefern.
Eine repräsentative Auswahl von Isochoren aus den verschiedenen lithologischen
Einheiten des Grundgebirges wurde mit unabhängigen P-T-Daten aus publizierten
Arbeiten korreliert. Die allmähliche Abnahme der Fluid-Dichten kann am besten mit
einem im Uhrzeigersinn verlaufenden P-T-Pfad erklärt werden. Sie weist auf Mineral-
Fluid-Equilibrierung unter Einfluss isothermer Druckentlastung während der
retrograden Entwicklung der im zentralen Dronning Maud Land anstehenden
Gesteine hin.
1. Introduction
5
1. Introduction
1.1. Fluid -rock interactions in deep-seated crustal rocks
In recent years, the origin, nature and role of the fluid phase involved in granulite
formation has again become a vital subject of scientific interest. In most Precambrian
terranes, continental crust consists of granulites, with a difference between a
(relatively) more superficial part (felsic, metasedimentary granulites) and a more
igneous, intrusive deeper part (Touret, 1995). Affiliated peak metamorphism is
suggested to be triggered by a sudden temperature increase, most probably related to
intrusions of mantle derived melts (magmatic underplating) (Touret, 1995). Rocks
generated or modified under granulite facies conditions are water deficient, and
metamorphism has taken place at temperatures that would be sufficient to cause
melting in the presence of water. The apparent dryness is reflected in the anhydrous
mineralogy. Orthopyroxene-bearing members of the charnockite - anorthosite suite of
rocks (cf. chapter 2) are abundant. Sheet silicates and amphiboles are absent or are
present only as minor components. This implies that metamorphism has either
occurred under fluid absent conditions, or the fluid must have been of other than
predominantly aqueous composition. The absence or subordinate occurence of free
H2O and dominance of CO2±N2±CH4 bearing fluids in granulitic lithologies has been
demonstrated by several fluid inclusion studies from various granulite terranes
worldwide (e.g. Raith et al., 1990; Santosh & Yoshida, 1992).
Prograde or peak-metamorphic inclusions have been shown to be preserved in
varying metamorphic minerals that have undergone a metamorphic cycle (Blom, 1988;
Vry & Brown, 1991; Bakker & Mamtani, 2000). Nevertheless, the assumption that CO2-
rich fluids even of high density always reflect peak metamorphic conditions has been
questioned, and shown to be misleading (e.g. Lamb et al., 1987; Lamb; 1990).
Furthermore, fluid inclusions detected in metamorphic rocks frequently reveal
densities, which are incompatible with P-T constraints derived from solid phase
equilibria (e.g. Swanenberg, 1980; Sterner & Bodnar, 1989; Phillipot & Selverstone,
1991). That inclusions undergo varying compositional and density changes during
metamorphic history has been demonstrated by several findings in nature and
experiment (e.g. Sterner & Bodnar, 1989; Hall & Sterner, 1993; Bakker & Jansen, 1994).
Küster & Stöckhert (1997) even presumed, that quartz is unable to preserve primary
(metamorphic) inclusions that were captured above 300°C. It is thus very likely that
fluid inclusions that formed during peak-metamorphic granulite facies conditions have
experienced multiple retrograde modifications, including complete or partial
decrepitation (failure by fracturing), stretching (failure by plastic creep), diffusion, or
1. Introduction
6
reactions of the fluid with its mineral host (so-called "back-reactions" in Heinrich &
Gottschalk, 1995). Additionally, the retrograde fluid evolution is characterised by a
complicated regime of large and small scale fluid migration and influx, combined with
fluid mixing and/or buffering. One example for large scale fluid migration is the
pervasive influx or channelling of a carbonic fluid along shear zones, which some
workers suggest to be responsible for "incipient" charnockite formation (e.g.
Srikantappa et al., 1985; Hansen et al., 1987). The free fluid phase might also be
involved in ongoing alteration processes. Pineau et al. (1981) have described the
formation of small carbonate particles at the emplacement of former inclusions through
the reaction of a CO2-rich fluid with an incoming H2O-salt fluid. These "late"
carbonates are suggested to be very abundant in many granulites (Touret, 1995).
Aqueous fluids may also be involved in retrograde mineral reactions leading to the
formation of hydrous phases (like sheet silicates) and remarkable variations in fluid
salinities.
Potential host minerals react differently to the possible modification processes, and
the mechanisms of local reequilibration are not systematic. As a result, the overall fluid
movement was often not able to homogenise the fluid composition, not even in hand
specimen scale (Touret, 1995), and samples may comprise a large variation in fluid
compositions and densities.
It can be stated that fluid-rock interactions (involving modification of fluid
inclusions and the interaction of an enclosed fluid with its mineral host) are abundant
during granulite formation. The majority of fluid inclusions detected within granulite
terranes are in fact characterised by the dominance of a CO2-rich and nearly complete
absence of an H2O-bearing component. However, this does not necessarily imply, that
the current fluid is identical with the fluid active during metamorphic reactions. In
order to derive any useful data on former P-T conditions, fluid inclusion populations
must be differentiated and related to specific stages of metamorphic history. Any
possible mechanism of secondary change has to be taken into account during the
evaluation and interpretation of derived data. A change in original fluid composition
or density may specify reequilibration processes which are not yet completely
understood, or give valuable information about particular reequilibration processes,
which are known to occur only under certain conditions.

1. Introduction
7
1.2. Previous studies and scope of the thesis
Hitherto, fluid inclusion data of metamorphic charnockites and associated granulitic
lithologies from East Antarctica are rare, and have only been reported from the
Lützow-Holm Bay (LHB) region (Santosh & Yoshida, 1991, 1992). The authors show
that the fluid imprint on gneiss and metamorphic charnockite assemblages is
dominantly pure CO2, and postulate an external, sub-lithospheric origin of the
preserved fluid. Furthermore they combine fluid inclusion data with P-T-data derived
from mineral phase equilibria and geochronologic information, and conclude that the
LHB rocks followed a clockwise prograde and retrograde P-T-t-path.
The granulite facies basement complex exposed in the Petermannketten and the
Otto-von-Gruber-Gebirge, central Dronning Maud Land, East Antarctica, comprises
lithologies typical of Precambrian granulite terranes. In this study, basement gneisses
that have obviously been subjected to metamorphic charnockitisation and subsequent
leaching processes, massif-type anorthosites and associated shear zone samples, as
well as anorogenic syenite and charnockite intrusives are investigated with regard to
their modal and chemical mineral composition (using Electron Microprobe technique),
and fluid content.
In a first step, the gneisses, anorthosites and shear zone samples are classified
according to the recommendations of the IUGS subcommission for members of the
charnockite-anorthosite suite of rocks. The main objective of this study is to examine
the contemporary fluid content preserved in the different lithologies by
microthermometry and Raman spectrometry. The data are evaluated in context of the
nature of the fluid present during the early stage of granulitic metamorphism,
charnockite formation and intrusion and deformation of the anorthosite body. It is
illustrated that early-metamorphic fluids may be preserved in metamorphic minerals,
although the influence of post-entrapment change is abundant and substantial.
Derived density data are used to calculate isochores, which are correlated with
independent P-T-data to give further constraints on the character of the retrograde P-T-
path.
Based on the frequent observation of carbonate and sheet silicate microcrystals in
carbonic fluid inclusions, further emphasis is put upon micro-chemical reaction
processes between an enclosed CO2-H2O fluid and its mineral host during
retrogression. It is assumed that a fluid that originally contained an aqueous phase
may react with surrounding plagioclase under complete consumption of the aqueous
phase, and the formation of carbonates and sheet silicates. A quantitative model is
established to describe volumetric and compositional changes caused by the possible
reactions. The model is applied to hypothetical and actual fluid inclusions. It is shown
1. Introduction
8
that the combination of fluid inclusion data with thermodynamic modelling may
provide crucial constraints on the volumetrical and compositional properties of the
original fluid inclusion trapped during high-grade metamorphism. Isochores for an
unmodified original inclusion can thus be reconstructed, leading to a more realistic
estimation of P-T conditions during earlier metamorphic stages or fluid capturing.
The results are presented in two chapters devided on the basis of rock types
(gneisses and anorthosites) and sample localities and (Petermannketten and Otto-von-
Gruber-Gebirge). The detailed study using thermodynamic modelling techniques is
presented in a separate chapter which consists of a manuscript that has been accepted
for publication by the Journal of Metamorphic Geology.
2. The charnockite - anorthosite suite of rocks
9
2. The charnockite - anorthosite suite of rocks
2.1. Classifying rocks of the charnockite series
Rocks of the charnockite series (Holland, 1900) or the charnockite- anorthosite suite
of rocks (Goldschmidt, 1916) are widespread in Precambrian terranes. Often the entire
range of compositions from granitic to anorthositic varieties occurs in close proximity.
Charnockitic rocks can be igneous, meta-igneous or thoroughly metamorphic, and
despite the fact that they often show signs of deformation and recrystallisation, they
have been included in the classification scheme of igneous rocks (Streckeisen, 1976; Le
Maitre, 1989). Chemically, they are defined as equivalent to plutonic rocks of QAPF
fields 2-10, i.e. 0-100 vol% alkali-feldspar or plagioclase, and 0-60 vol% quartz
component. The difference, though, lies in the mineralogical composition. Instead of, or
in addition to biotite and hornblende, which are the typical major mafic minerals in
calc-alcalic rocks, orthopyroxene or fayalite + quartz are present. Perthitic or
antiperthitic development of feldspar is a further characteristic. Using the classification
of the QAPF double triangle, perthite (sensu stricto) is counted as "A" (alkali feldspar),
antiperthite as "P" (plagioclase) and mesoperthite as 50/50 A/P. Originally, the
orthopyroxene had been specified as hypersthene (Fs30-50) (cf. Isachsen, 1968; LeMaitre,
1989), but that no longer is an approved mineral name (cf. Morimoto, 1988). The
presence of very fine-grained chlorite and calcite in brittle crystal fractures causes a
"greasy-green" colouring of plagioclase, which in return is responsible for the typical
"waxy grey-green" appearance of the rocks (Shelley, 1993).
The mineralogical difference described above reflects a variation in PH2O-T
conditions during rock formation and charnockitic rocks are characterised by low H2O-
activities in the fluid phase. Thereby, igneous charnockitic rocks represent CO2-rich
synmetamorphic intrusives while metamorphic varieties are products of dehydration
reactions caused by the reduction of water-activity. The members of the charnockite
series are the granulite-facies equivalent of calc-alcalic rocks, which normally contain
mineral assemblages typical for the upper amphibolite facies (Isachsen, 1968; Shelley,
1993). Thus, the metamorphic varieties of the charnockitic rocks are also properly
described as granulites, whereas igneous charnockitic rocks may be given more
standard names (e.g. orthopyroxene granite). The nomenclature used in literature is
confusing, as long as general and special terms are used mutually for the same rock
types. The varying names that may be applied to members of the charnockitic rock
suite are given in Table 2.1.
In the present study, samples were labelled according to the strict definition of the
term "charnockite" (Holland, 1900; Streckeisen, 1976). Special terms were used when

2. The charnockite - anorthosite suite of rocks
10
available, and general terms applied, when no special terms exist ( Table 2.1).
Table 2.1: Special and general names used for charnockitic rocks ( after Le Maitre, 1989)
QAPF field General term Special term
2 orthopyroxene alkali feldspar granite alkali feldsparcharnockite
3 orthopyroxene granite 3a: charnockite3b: farsundite
4 orthopyroxene granodiorite opdalite orcharno-enderbite
5 orthopyroxene tonalite enderbite6 orthopyroxene alkali feldspar syenite --7 orthopyroxene syenite --8 orthopyroxene monzonite mangerite9 monzonorite (orthopyroxene monzodiorite) jotunite10 norite (orthopyroxene diorite) or
anorthosite if M (mafic minerals) < 10 vol%--
2.2. Massif-type anorthosites
One distinctive member of the charnockitic rock suite is the group of anorthosites or
"plagioclasites". The cumulate rocks are defined to contain 90 vol% plagioclase with a
compositional range of andesine to bytownite (An30-70), and a focal point on An40-60, but
no albite, and < 10 vol% mafic minerals, preferably hornblende, pyroxene and olivine
(Le Maitre, 1989). Ashwal (1993) differentiates between four major types of
anorthosites: Archean anorthosites, Proterozoic massif-type anorthosites, anorthosites
in layered intrusions and lunar anorthosites. Subordinate varieties are anorthosites of
oceanic settings and anorthosite inclusions in igneous rocks. Massif-type anorthosite
complexes can reach thousands of km2 in areal extend, and are typically made up of
nearly monomineralic coarse to very coarse grained anorthosites, leuconorites,
leucogabbros, and leucotroctolites. Minor volumes of comagmatic norites, gabbros,
troctolites, and Fe-Ti-oxide-rich rocks including massive ilmenite-magnetite ore-
deposits also form part of the common anorthosite complexes. Additionally, most
massifs contain small dikes or intrusions of Fe-, Ti-, and P-rich rocks, i.e. ferrodiorites
or ferrogabbros. Spatially associated with nearly all massif-type anorthosites are rocks
of broadly granitic composition, essentially other members of the charnockitic rock
suite. Most commonly reported is an intrusive relationship, with the granitoid suite
being younger than the associated anorthositic rocks. The reverse relationship is rare or
absent, and it is well accepted that the chemically independent granitic melts generated
from anatexis of the country rocks during intrusion of the main magma suite and
probably mixed with variable amounts of highly fractionated anorthositic residual melt
(e.g. De Waard, 1968a, b; Kolker & Lindsley, 1989; Ashwal, 1993; Emslie et al., 1994 and
references herein).
Despite many attempts to unravel the history of massif-type anorthosites, their

2. The charnockite - anorthosite suite of rocks
11
genesis has still remained unclear. Models concerning a typical tectonic environment,
the origin and chemical composition of the parental magmas, the mode of
emplacement (melt versus crystal mush) and depth of crystallisation are miscellaneous
(e.g. Ashwal, 1993 and references herein; Schiellerup et al., 2000; Krause et al., 2001). So
far, plate tectonic settings as different as Andean-type margins and continental rifts
have been discussed as being characteristic for massif-type anorthosite genesis (e.g.
Bruce et al., 1989; McLelland, 1989; Ashwal, 1993 and references herein). A similar
dissension subsists with regard to original magma derivation. At present, massif-type
anorthosites are believed to have crystallised from either crustally contaminated
mantle-derived mafic melts that have fractionated olivine and pyroxene at depth
(Emslie, 1985; Ashwal, 1993) or primary aluminous gabbroic to jotunitic melts derived
from the lower continental crust (Longhi et al., 1999; Duchesne et al., 1999; Schiellerup
et al., 2000). Concerning the mode of crystallisation, several authors favour
emplacement of anorthosites as crystal-rich mush that formed in large, slowly cooling
magma chambers before ascending into the upper crust as coalescending diapirs (e.g.
Ashwal, 1993; Lafrance et al., 1996).
Intrusion ages reported from massif-type anorthosites are concentrated upon the
period between 1.8 and 0.9 Ga (Ashwal, 1993; Scoates, 2000). Data indicating a late-
Proterozoic to early-Phanerozoic age of emplacement have so far only been reported
from the Aïr ring complex, Niger (e.g. Demaiffe et al., 1991 a, b) and from the Eckhörner
and O.-v.-Gruber anorthosites , central Dronning Maud Land, East Antarctica
(Mikhalsky et al., 1997; Jacobs et al., 1998).
2.3. "Incipient" or "arrested-type" charnockitisation
The main known types of charnockitic rocks comprise (a) magmatic charnockitic
rocks associated with large massif-type anorthosites (for example O.-v.-Gruber
anorthosite complex, Antarctica: e.g. Kämpf & Stackebrandt, 1985), (b) massive
charnockites found in granulite terranes (for example Nilgiri Hills, India: e.g. Raith et
al. 1990), (c) metamorphic charnocktisation in contact aureoles around intrusive
enderbites (for example South Africa: e.g. van den Kerkhof & Grantham, 1999), and (d)
abundant pervasive metamorphic charnockitisation along fractures and shear zones in
gneissic complexes. The latter, also referred to as "arrested-type" or "incipient"
charnockitisation, has first been described by Pichamuthu (1960) from Kabbaldurga,
southern India, and several other locations throughout the southern Indian high-grade
terrane and the adjacent Sri Lankan terrane have been reported thereafter (cf.
Ravindra-Kumar et al., 1985; Srikantappa et al., 1985; Hansen et al., 1987). As a typical
feature observed in Precambrian gneiss complexes, incipient charnockitisation is also
known from the northern hemisphere e.g. from Siberia and Finland (Perchuk et al.,

2. The charnockite - anorthosite suite of rocks
12
1989). However, no secured data on this type of charnockitisation have yet been
reported from the East Antarctic craton as to be expected when considering the several
findings on the other crustal segments of former East Gondwana (India, Sri Lanka) and
their common geological history.
Meso- and macroscopically, the hornblende-, biotite- and/or quartzofeldspathic
gneisses typically show grey-green patches and streaky zones where the original gneiss
texture is blurred or completely erased by recrystallisation and grain-size coarsening.
Mineralogical changes in these zones involve the partial to complete breakdown of
hornblende, biotite and garnet and the neoblastesis of orthopyroxene (hypersthen).
Despite the variable bulk chemistry, mineral composition and texture of the host
gneisses, the charnockite is always a coarse-grained orthopyroxene-bearing rock with
remarkably uniform granitic composition (Raith & Srikantappa, 1993), which hints at
more or less pronounced element mobility and open-system behaviour during the
dehydration process (e.g. Hansen et al., 1987; Stähle et al., 1987; Milisenda et al., 1991).
Because of this observation and the conspicuous intimate relationship between
gneisses and "arrested-type" metamorphic charnockites, a fluid-controlled mechanism
to explain this phenomena is widely favoured (e.g. Janardhan et al., 1979; Newton et al.,
1980; Glassley, 1983; Stähle et al., 1987; Raith et al., 1989; Santosh et al., 1990; Perchuk et
al., 2000).
Some workers have proposed a high grade CO2-metasomatic process to be
responsible for the spatially restricted decrease in H2O-activity - a prerequisite
assumed to be essential for in situ charnockitisation (e.g. Touret, 1971; Newton et al.,
1980; Glassley, 1983; Raith et al., 1989 and references herein). According to them, CO2-
influx causes the expulsion or dilution of pore-fluids. Sufficient amounts of CO2 are
suggested to originate from e.g. degassing of crystallising underplated basaltic magma,
decarbonation of subducted oceanic lithosphere or upper mantle, or sudden tapping
and expulsion of 'fossil' reservoirs of 'internally' derived and buffered carbonic fluids
trapped in deeper-crustal granulites. The idea of CO2-influx is supported by the
observation, that the majority of fluid inclusions hosted by incipient charnockites is
CO2-dominated. The infiltration and mobility of significant amounts of CO2 require an
environment structurally controlled by fracturing and shearing, and it has been shown
that even diffuse patches and stringers and random distribution of patchy charnockites
have developed along tectonically generated structures (e.g. Dobmeier & Raith, 2000).
However, the appeal of carbonic fluids as a mainspring in granulite metamorphism
has been confined by their poor wetting ability relative to silicate mineral grain
boundaries, inhibiting infiltration, and the low solubilities of silicate constituents in
CO2-rich fluids. Thereupon more recent studies have concentrated on the importance
of alkali-mobility and the role of highly saline fluid phases ("brines") during granulite

2. The charnockite - anorthosite suite of rocks
13
facies metamorphism and charnockitisation processes (e.g. Perchuk & Gerya, 1992,
1993; Newton et al., 1998). The role of potassium in the formation of some arrested
charnockites has been demonstrated by Stähle et al. (1987). Perchuk & Gerya (1992,
1993) proposed, that the chemical potentials of CO2, H2O and K2O in a metamorphic
fluid govern the charnockitisation process during retrogression, and that high alkali
activity allows orthopyroxene formation under H2O-activities similar or even higher
than that for the initial gneisses. Additionally, experimental studies have shown that
concentrated supercritical brines have appropriate low H2O-activities, high infiltration
ability and high alkali mobility to foster charnockite formation (e.g. Shmulovich &
Graham, 1996; Aranovich & Newton, 1998).
Perchuk et al. (2000) even found evidence of both fluid regimes described above,
and they concluded that two immiscible fluids, i.e. an alkalic supercritical brine and
almost pure CO2 coexisted during incipient charnockite formation. According to them,
the ongoing metasomatic process could also be responsible for partial melting, a
feature often observed in conjunction with arrested-type charnockites. The abundance
of pegmatites, quartzo-feldspathic veins and migmatites spatially associated with
incipient charnockites has also been interpreted in terms of partial melting under H2O-
undersaturated conditions (e.g. Bhattacharya & Sen, 1986; Holness, 1993), which in turn
provoked early workers to explain the formation of incipient charnockites by
metamorphism of anhydrous lithologies (e.g. Lamb & Valley, 1984) or the extraction of
partial hydrous melts (e.g. Fyfe, 1973; Waters, 1988; Burton & O'Nions, 1990).
In summary, most recent studies agree that the known domains of arrested-type
charnockitisation formed by in situ dehydration processes during a late stage of
tectonothermal history at a structurally controlled site (Dobmeier & Raith, 2000).
Nevertheless, mechanisms conducting fluid movements during high-grade
metamorphism and incipient charnockite formation, and the scale at which fluid-
controlled processes operate (mm, m, km) have not been examined to a satisfying
degree yet. Fluid fugacities can be controlled by several parameters e.g., the internal
buffering by metamorphic reactions (fluid-rock interaction), diffusion processes,
immiscibility of complex fluid phases or wetting properties of mineral-fluid under
given metamorphic conditions, largely determining the mobility of fluids of different
compositions. Consequently, varying mechanisms are currently envisaged to account
for arrested charnockitisation in different granulite terranes, either operating
independently, in conjunction or mutual relationship. Thus, the debate about the
models mentioned above is still controversial and more detailed investigations will
have to be carried out before concluding explanations may be given.
3. Principles of fluid inclusion studies
14
3. Principles of fluid inclusion studies
3.1. Theoretical background - the ideal model
Fluid inclusions are present in nearly all rock types whether derived from the crust
or the mantle. As they are almost ubiquitous in geologic samples their study is
applicable to a variety of geologic questions. Most natural fluids (gases and liquids at
high pressure) consist of molecular compounds of the system C-O-H-N-S + salt (with
"salt" representing e.g. NaCl, CaCl2, KCl and other chlorides). The "simple" species
H2O, CO2, CH4, N2 and H2S appear to be most stable in fluid inclusions. Brewster (1823)
and Sorby (1858) were amongst the first to realise their potential for the understanding
of geologic problems, and three main prerequisites for the model of ideal fluid
inclusion behaviour can be ascribed to these early workers:
• The host crystal of inclusions that formed under high P-T conditions is
impermeable to any chemical changes
• Because of the crystals' rigidity, external variations in stress are not transferred to
the fluid and the compressibility and expansion of the host crystal are negligible
over geologic P-T conditions
• The host crystal is considered to transfer heat between the geologic surroundings
and the fluid inclusion.
Based on these presumptions, the ideal model fluid inclusions are considered to be
closed ("isoplethic") and constant volume ("isochoric") systems that remain in thermal
equilibrium with their immediate environment. Consequently, once entrapped within
a crystal, the fluid inclusion follows an isochoric and isoplethic path through P-T space
where internal pressure is dependent on the imposed temperature (cf. Sorby, 1858;
Roedder, 1984).
For the composition of the isopleth, the P-T conditions that prevail at the moment of
entrapment from a homogeneous fluid phase dictate the bulk molar volume (density)
of the fluid inclusion. If the inclusion remains an isoplethic-isochoric system, then no
matter how many times it is heated or cooled, the P-T trajectory of the inclusion is
locked on the isochore which passes through the point (in P-T space) of entrapment
(Fig. 3.1). As the inclusion cools from its entrapment point the internal pressure drops
and the isochore eventually intersects the miscibility boundary of the given system. At
this point the homogeneous fluid separates into a liquid-like and a vapour-like phase,
i.e. a bubble nucleates. As fluid isochores have positive P-T slopes, the temperature at
which the bubble appears must be less than the entrapment temperature. The natural
cooling path of the fluid may be reversed in the laboratory by heating above room
temperature and observing the inclusion through a microscope (method of

3. Principles of fluid inclusion studies
15
microthermometry). Thus, the minimum formation temperature of the inclusion may
be determined from the temperature of homogenisation (Th) of the bubble (i.e. the
point at which the bubble disappears upon heating) (Fig. 3.1). Additionally, the mode
of homogenisation i.e. homogenisation into the liquid phase (the bubble shrinks upon
heating) or into the vapour phase (the bubble grows upon heating) indicates, whether
the original homogeneous fluid was vapour-like or liquid-like (Fig. 3.1).
Fig. 3.1: Schematic diagram of PVT properties in the unary CO2 system., (modified after Burruss, 1981).
Three pure CO2 inclusions with different molar volume (V1-3) were trapped in the one phase region and
"locked" to the associated isochore at the moment of trapping marked by the star. Upon cooling, phase
separation occurs as soon as the isochore intersects the miscibility boundary (black dots). Proportions of
the separated liquid and vapour phase are determined by the lever rule. Black dots also mark the PVT
conditions at the moment of homogenisation (upon heating). Note that the molar volume determines the
mode of homogenisation. Th (l), (v), or (crit). c.p. = critical point (31.1 °C for pure CO2).
As much as the temperature of homogenisation is characteristic of the molar volume
of a fluid, the melting temperature (Tm) of the solid phases that formed through
supercooling and freezing of the inclusion provides an indication of the composition of
the captured fluid. In the H2O-salt system, for example, the eutectic melting
temperature is characteristic of the type of salt present, whereas the extent to which the
melting point of ice is depressed provides an indication of the bulk salinity of the
inclusions. In carbonic inclusions, the lowering of the triple point of pure CO2 (-56.6°C)
is symptomatic for the presence of additional gas species, such as N2 or CH4.
The phase behaviour described above (Th and Tm) is valid for simple unary or
binary systems (e.g. pure CO2 or H2O-salt). The prevalent fluids identified in the study
3. Principles of fluid inclusion studies
16
area either belong to the system CO2±N2 or H2O-salt, but a more complex fluid,
containing H2O-CO2±salt, was detected as well. In H2O-gas-salt-rich systems, further
phase transitions, e.g. formation and melting of a gas hydrate (or clathrate) and/or
partial homogenisation of a subsystem, can be observed during heating or cooling,
which complicates the interpretation of microthermometrical data. For example, the
presence of a CO2-clathrate (CO2•5.75 H2O ) at the moment of ice melting or partial
homogenisation of the subsystem, has a crucial effect on the proper calculation of bulk
fluid composition or molar volume, as it deprives small amounts of H2O and CO2 from
the bulk system. Consequently, neglecting its appearance would result in incorrect
estimates of salinities or densities of the remaining gaseous species. For more detailed
descriptions of possible phase changes, fluid behaviour in more complex systems or
the significance of clathrate refer to e.g. Diamond (1992, 2001) for CO2-H2O inclusions;
Thiery et al. (1994) and van den Kerkhof (1988) for the system CO2±CH4±N2; Bodnar
(1993) for H2O-NaCl fluid systems, and Collins (1979) and Bakker (1998) for gas
hydrates in fluid inclusions.
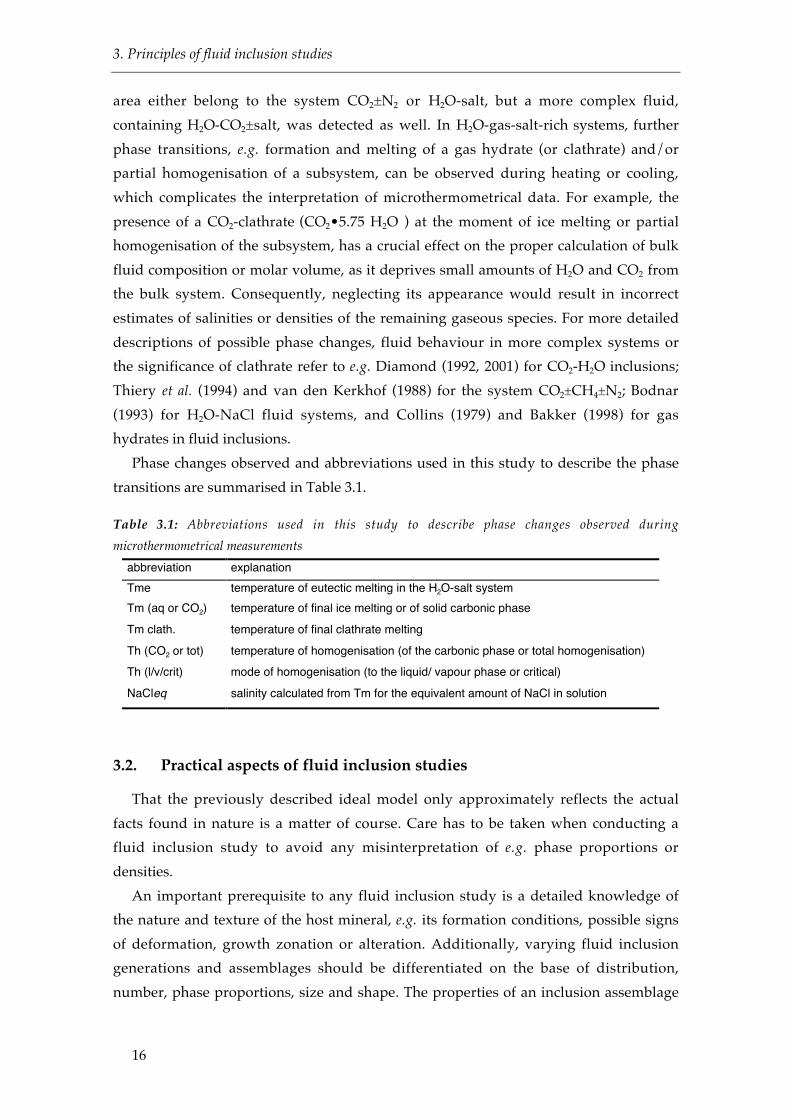
Phase changes observed and abbreviations used in this study to describe the phase
transitions are summarised in Table 3.1.
Table 3.1: Abbreviations used in this study to describe phase changes observed during
microthermometrical measurements
abbreviation explanation
Tme temperature of eutectic melting in the H2O-salt system
Tm (aq or CO2) temperature of final ice melting or of solid carbonic phase
Tm clath. temperature of final clathrate melting
Th (CO2 or tot) temperature of homogenisation (of the carbonic phase or total homogenisation)
Th (l/v/crit) mode of homogenisation (to the liquid/ vapour phase or critical)
NaCleq salinity calculated from Tm for the equivalent amount of NaCl in solution
3.2. Practical aspects of fluid inclusion studies
That the previously described ideal model only approximately reflects the actual
facts found in nature is a matter of course. Care has to be taken when conducting a
fluid inclusion study to avoid any misinterpretation of e.g. phase proportions or
densities.
An important prerequisite to any fluid inclusion study is a detailed knowledge of
the nature and texture of the host mineral, e.g. its formation conditions, possible signs
of deformation, growth zonation or alteration. Additionally, varying fluid inclusion
generations and assemblages should be differentiated on the base of distribution,
number, phase proportions, size and shape. The properties of an inclusion assemblage

3. Principles of fluid inclusion studies
17
combined with data derived from microthermometry measurement (e.g. Th, Tm) form
the smallest unit of geological information. Nearly every inclusion assemblage is
characterised by a standard deviation (or better for small numbers: total range) in
inclusion attributes. Thus, crucial conclusions can be drawn concerning the nature of
the fluid at the time of entrapment (homogeneous versus heterogeneous fluid phase),
and whether the inclusions have been altered and changed after trapping (cf. 3.2.1).
Formation of a fluid inclusion assemblage in the one-phase field, i.e. trapping of a
homogeneous fluid, will result in inclusions with relatively similar microthermometric
properties and uniform volumetric proportions at room temperature. This principle is
also valid for all solid phases that precipitate from such a fluid during cooling
(formation of "daughter minerals" e.g., salt crystals or nahcolite).
Contrary to the features described above, trapping of a heterogeneous fluid phase
i.e. trapping in a multi-phase field, results in variable microthermomeric properties
and a mutable distribution of relative volumetric proportions of the included phases at
room temperature. Reasons for heterogeneity of a natural fluid phase may be boiling,
effervescence or immiscibility of the present fluid species (e.g., water/hydrocarbon).
This principle also applies to solid phases that were "accidentally-trapped" during
inclusion formation.
The determination of densities -the key parameter for many geological
interpretations- is only justified when both phase behaviour and composition of
individual inclusions are known. The density is calculated by means of experimentally
derived models (equations of state) using data obtained by the observation of phase
transitions at controlled temperatures ("microthermometry"), and knowledge of the
composition of gases, entrapped solids, and/or frozen fluids as gained by Raman
spectrometry (c.f. chapters 4.5 to 4.6).
Many fluid inclusion studies aim at the calculation of isochores from inclusion
densities. Isochores can be combined with independent pressure and/or temperature
estimates for a better understanding of metamorphic conditions.
In summary, the main parameters that have to be respected when selecting
representative densities (and isochores) for any interpretation of fluid inclusion work
are:
• the precise relationship between inclusions (host mineral) and metamorphic stage
• the compositional complexity of fluid inclusions (inclusions with a similar fluid
content must be chosen, as e.g., the presence of reasonable amounts of N2 in CO2±N2
fluid inclusions can drastically lower the inclusion densities)
• the possibility of post-entrapment modification
3. Principles of fluid inclusion studies
18
3.2.1. Irreversible post-entrapment change
The occurence of variable of microthermometric properties (Th, Tm, volume
fractions), already described as indicator for trapping of a heterogeneous fluid, may
also indicate volumetric or compositional modifications of fluid inclusions after their
formation. Reversible change (phase separation upon cooling, precipitation of "daughter
minerals") has already briefly been addressed in the previous paragraph. However, the
influence of irreversible secondary change of fluid inclusions, though is widely spread
in (granulitic) metamorphic environments. It is therefore considered in more detail.
Several possible mechanisms that alter fluid inclusions e.g., brittle and/or plastic
deformation of the host-crystal, or reaction of the fluid with the enclosing mineral,
have been reported from nature and experiment up to now (cf. Sterner & Bodnar, 1989;
Hall & Sterner, 1993; Bakker & Jansen, 1994; Küster & Stöckhert, 1997; Heinrich &
Gottschalk, 1995).
Brittle failure either results in complete or partial explosion ("decrepitation") or
implosion of fluid inclusions. Microstructural evidence for brittle failure are highly
irregular inclusion shapes, radial cracks that originate from the inclusion, and healed
microfractures represented by halos of small inclusions (e.g. Roedder, 1984).
The effect of plastic deformation on the enclosing mineral is generally referred to as
"stretching" or "reequilibration". The microstructural record is less pronounced and
unequivocal. Regular or roundish to negative inclusion shapes have been suggested to
be indicative for stretching (e.g. Sterner & Bodnar, 1989).
Both modes of irreversible deformation are triggered by differential stress (the
pressure difference between the internal fluid pressure and the confining pressure
acting on the host mineral) that builds up, as soon as the metamorphic P-T path
deviates significantly from the fluid isochore. They are controlled by parameters like
the mechanical strength of the host mineral, initial inclusion shape and size, prevailing
temperature, or strain rate (e.g. Küster & Stöckhert, 1997). Additionally, the
compositional change is influenced by selective loss of H2O or nitrogen, which diffuse
and migrate more easily than CO2 through any host mineral (Vityk & Bodnar, 1998;
Audétat & Günther, 1999; Touret, 2001). Next to the microstructural record, a
correlation of inclusion size with Th (and thus densities) may be indicative for the
mode of failure and type of metamorphism. Large inclusions are more likely to
undergo decrepitation and subsequent leakage than small inclusions due to their lower
mechanical strength (e.g. Swanenberg, 1980; Bodnar et al., 1989). Consequently, a
positive correlation with Th, e.g., the absence of large inclusions with high densities
may hint at fluid loss due to overpressure, and thus (rapid) decompression during
uplift. A negative correlation with inclusion size though, may indicate a phase of
isobaric cooling, as inclusion size has to decrease without leakage in order to increase

3. Principles of fluid inclusion studies
19
the density (Touret, 2001).
In contrast to the formation of real "daughter-phases", the occurrence of chemical
reactions between the entrapped fluid and a reactive mineral host (e.g. feldspar, garnet,
pyroxene) has been reported by only a few workers so far (cf. Andersen et al., 1984;
Heinrich & Gottschalk, 1995; Svensen et al., 2001), and is not sufficiently well
documented, yet. The reaction of parts of a complex fluid with the inclusion walls
results in the generation of a residual (probably less complex) fluid and one to several
solids, so called "step-daughter" phases (Svensen et al., 1999). Depending on the phases
and components involved, this may either result in an increase or decrease of inclusion
volume and densities.
The magnitude of modification usually varies between individual inclusions in one
assemblage of originally identical fluids, which leads to variable inclusion properties in
a petrographic assemblage. Processes involved may interact, and do not follow a well-
defined scheme. However, the alleged ambiguities of origin and subsequent change
can even cause the obtained data to have greater significance, provided that the
techniques used are adequate to resolve them.
3.3. Nomenclature
The classification scheme most widely used for the description of fluid inclusions
was proposed by Roedder (1984). Roedder (1984) differentiates on a genetical base
between "primary" inclusions that formed during mineral growth and "secondary"
inclusions that developed after the primary crystallisation of the host, e.g., through
entrapment during healing of microfractures. A zone of overlap of these two types are
so called "pseudosecondary" inclusions that may form along crystal faces or fractures
that develop during crystal growth. In most metamorphic rocks, though, the
application of the terms "primary" and "secondary" might be difficult or even
impossible. The total fluid content of such samples is a record of the several stages of
rock evolution and many generations of fluid assemblages occur in close proximity.
The size of most fluid inclusions is expressed in the range of several microns, and
their shape varies between highly irregular (often a result of decrepitation), irregular,
rounded and negative crystal shape. Distribution of inclusions throughout a crystal is
described as single or isolated, alongside trails or planes/clusters. The physical state of
enclosed phases is either liquid-like (l), vapour or gas-like (v) or solid (s).
In practice it is often difficult to observe eutectic melting temperatures, which are
characteristic of the type of salt present in H2O-salt inclusions. Therefore it is generally
accepted to recalculate salinities on the base of freezing point depression caused by an
equivalent amount of NaCl in solution, and salinity then is given in wt% NaCleq (Table
3.1).
4. Analytical methods
20
4. Analytical methods and data evaluation
4.1. Polarisation microscopy
Detailed petrographic studies were carried out on thinsections (approx. 25 µm thick)
of 25 samples using a Zeiss Axioplan petrographic microscope equipped with Zeiss
2.5X, 5X, 10X and 40X objective lenses, 10X oculars, and an Olympus DP 10 digital
camera. If more than one thinsection was prepared of a single sample e.g., to allow a
more detailed analysis on veins or pegmatitic mobilisates, the different thinsections
were labelled with an additional letter in alphabetical order. The magmatic rocks were
classified and named on the base of the estimated mode mineral content (in volume
percent), using the QAPF double triangle and following the IUGS recommendations
(Le Maitre, 1989). Metamorphic rock species were classified and named according to
the hierarchical system recommended by Shelley (1993). The guidelines for classifying
members of the charnockitic rock suite have already been discussed and specified in
chapter 2.1. All mineral abbreviations used are based on Bucher & Frey (1994).
4.2. Electron Microprobe analysis
Polished thinsections were covered with a thin layer of vapourised carbon, and used
for representative analysis of 7 gneiss, and anorthosite mineral assemblages. Mineral
analyses and garnet element mappings were carried out on a Cameca SX-50 electron
microprobe at the Ruhr-Universität-Bochum, Germany. It is fitted with four
wavelength-dispersive spectrometers (WDS) and one energy-dispersive spectrometer
(EDS). Qualitative and quantitative element analyses wer performed on alkali-feldspar,
plagioclase, pyroxene and garnet. Operating conditions were an acceleration voltage of
15 kV and a beam current of 15 nA. Counting times were 20 s on peak and 10 s on
background. A focussed beam was applied to all phases except for micas which were
analysed with a slightly defocussed beam. Natural and synthetic minerals and glasses
were used as calibration standards. Calculation of concentrations given in weight
percent of elements was performed by the built-in correction procedure. Weight
percent of oxides, mineral formulas and endmembers were calculated as described in
Spear (1993) and using Excel spreadsheets kindly provided by Dr. P. Appel (Christian-
Albrechts-Universität Kiel, Germany).
The calculation of the mineral formulas of plagioclase and alkali-feldspars was
carried out on the base of 8 oxygens, and of garnet on the base of 24 oxygens.
Very detailed electron microprobe analysis around single fluid inclusions hosted by
plagioclase of a characteristical anorthosite sample were performed at the Montan
Universität Leoben, Austria, using an upgraded ARL-SEMQ 30 microprobe equipped
4. Analytical methods
21
with TAP, LiF and PET wavelength dispersive spectrometer crystals. Beam conditions
were 20 kV and 15 nA. A plagioclase standard from the Leoben University was used
for calibration. The Bastin correction was applied to the obtained data, and mineral
formulas were calculated as described above.
4.3. Microthermometry
Besides the petrographic examinations, the qualitative to semi-quantitative, non-
destructive method of "microthermometry" is the most important analytical technique
for characterising fluid inclusions. Its basic principle is the observation of various
phase transitions under controlled conditions of heating and cooling. If the inclusions
have simple compositions (less than 3 or 4 major components) then the
microthermometric measurements allow the bulk composition and density of the
inclusions to be calculated. If the inclusions are more complex, then the phase-
transition temperatures provide useful constraints on the bulk composition and
density, but additional analytical results must be combined to reach a more exact
solution (e.g. Raman spectrometry).
Microthermometric measurements were carried out on fragments of doubly
polished thicksections (ca. 100 µm) using two different heating/freezing stages - a
modified U.S. Geological Survey (U.S.G.S.) gas-flow stage at the Universität Bremen,
Germany, and a Linkam MDS 600 stage at the Universität Leoben, Austria.
The modified U.S.G.S. gas-flow stage (FLUID INC., Denver, Colorado, U.S.A.) heats
and cools samples over a temperature range of -196 °C to 700 °C, by passing preheated
or chilled gas and/or liquid nitrogen directly over the specimen. The temperature is
measured via a thermocouple element placed upon the wafer, and pressing it to the
bottom window of the heating/cooling chamber. The stage is mounted on a Zeiss
Standard-WL transmitted-light microscope, equipped with Leitz 4X, 10X and 32X long-
working distance objective lenses, 10X oculars and a 12V/100V quartz-halogen light
source.
The Linkam MDS 600 motor driven stage, combined with a TMS 93 temperature
programmer and LNP 93/2 cooling system covers a temperature range of -196 °C to
600 °C. Heating/freezing experiments are controlled via a Pentium III 450 MHz
computer with a Nokia 445Xpro monitor using the LinkSys software package. Held by
a quartz crucible and sample carrier, a fragment of the specimen is placed upon a silver
block equipped with heater and integral cooling chamber. A platinum resistor sensor is
mounted near to the surface of the silver block and allows for an accurate and stable
temperature signal. The stage is mounted on an Olympus BX 60 microscope (modified
and supplied by FLUID INC.) outfitted for use with reflected and transmitted visible
light, reflected UV light, and transmitted IR light, using 4X, 10X, 40X and 100X

4. Analytical methods
22
Olympus long-working distance objective lenses for visible light and 10X oculars.
Visible-light images are digitally acquired and viewed on the monitor using a JVC F553
3-ccd-chip video camera.
Both stages were calibrated and regularly monitored using synthetic fluid inclusion
temperature standards provided by SYN FLINC, covering a temperature range from -
56.6 °C to 0.0 °C and 374.1 °C, the melting of pure CO2, and the melting and
homogenisation of pure H2O, respectively. Additionally, the U.S.G.S. gas-flow stage
was calibrated with an ice bath (0 °C) and liquid nitrogen (-196.8 °C). The accuracy of
temperature measurements on either of the stages was determined to ± 0.2 °C at
temperatures below 100 °C, and ± 0.4 °C at higher temperatures.
With respect to the size of sample wafers, their thickness, polishing quality and
mineral content, heating rates were chosen and kept as a routine procedure in order to
get best temperature reproducibilities for standard and sample measurements. When
using the U.S.G.S. gas-flow stage, the location of the thermocouple relative to the
inclusion(s) being measured was considered as well. At the beginning of every new
experiment, samples were cooled close to liquid nitrogen temperature (-196 °C), and
subsequently heated back to 32 °C very quickly (>50 °C/minute) to get a first
impression of the fluid composition and to recognise even subtle phase changes e.g.,
melting of very small amounts of carbon dioxide, initial melting near the eutectic or
final ice melting of low salinity fluids. Knowing the approximate transition
temperatures from the fast run, the experiments were repeated, stepping the
temperature up in increments, and using progressively slower heating rates (50°/min,
10°/min and 5°C) from -120 °C until ca. 5 °C below the phase transition. Rates used for
the exact determination of the temperature of phase changes were:
• 1°/min for CO2 and H2O melting and CO2 homogenisation
• 2°/min for H2O homogenisation
• 0.5°/min for sluggish reactions like recrystallisation or hydrate melting
The method of "cycling" (c.f. Roedder, 1984; Shepherd et al., 1985; Goldstein &
Reynolds, 1994) was applied to confirm e.g., final clathrate melting or homogenisation
temperatures in very small or dark fluid inclusions. Every phase change was measured
at least two times to confirm the received data. For further descriptions of technical
details concerning the stages or special techniques of measuring fluid inclusions with
one of the stages mentioned above, refer to e.g. Roedder (1984), Shepherd et al., (1985),
or the stage reference manuals provided by Fluid Inc. and Linkam.

4. Analytical methods
23
4.4. Raman spectrometry
The application of Raman spectrometry on fluid inclusions allows the immediate
qualitative and semi-quantitative measurement of individual phases in a non-
destructive way. Especially the identification of small solid (crystalline) compounds
like daughter minerals (carbonates, sulphates etc.), which are difficult to analyse by
more traditional methods (e.g. electron microprobe) has been enhanced by this method.
A Dilor LABRAM confocal-Raman spectrometer combined with a frequency-
doubled Nd-YAG laser (100 mW, 532.2 nm) and a Olympus BX 40 microscope with 50X
and 100X objective lenses (Olympus) was used to identify fluid and solid phases in
inclusions. Wavenumber measurements have an accuracy of 1.62 cm-1 at low D n
(Raman shift around 0 cm-1) and 1.1 cm-1 at high Dn (around 3000 cm-1). To analyse a
homogeneous gas mixture and invisible small amounts of H2O by Raman
spectrometry, samples were held at controlled temperatures of +33 °C and -120 °C with
a Linkam THMSG 600 heating-freezing stage. The objective lenses combined with a
confocal optical arrangement enable a spatial resolution in the order of one cubic
micrometre. Thus, the laser (100 mW frequency-doubled Nd-YAG with 532 nm
wavelength i.e. a "green-laser") can be focussed on very small individual phases within
multi-phase inclusions.
The interaction of the incident laser light with the molecular bonds in the target
species scatters some of the incident light via the "Raman effect", emitting light with a
frequency that is shifted from that of the laser, and that is characteristic of the
vibrational mode and energy of the bond. A portion of the scattered light is collected
through the microscope and focussed onto a diffraction grating. The grating selects the
desired region of the Raman spectrum and reflects this onto a Peltier-cooled, matrix
detector. The resulting spectrum (intensity versus Raman-shifted frequency) is
displayed on a computer monitor for further processing and interpretation. The
positions and intensities of Raman lines are slightly dependent on the density and
especially on the physical state (gas or liquid). The implication for the accuracy of the
quantitative Raman analysis is limited but measurements can be checked by the
comparison with composition calculated or graphically estimated from
microthermometrical data and available phase models (cf. chapter 3.6.). A more
detailed description of the possible applications of Raman spectrometry on fluid
inclusions can be found in e.g., Dubessy et al. (1989) or Burke (2001).
4.5. Bulk composition, molar volume and isochore calculations
Apart from a subordinate number of aqueous fluid inclusions, the majority of
inclusions shows melting of a solid phase within a temperature range of –59.2 to –56.6
°C. Thus, the cavities were interpreted to contain a CO2-dominated fluid. The lowering
4. Analytical methods
24
of the triple point of pure CO2 (-56.6 °C) by up to 2.6 °C is symptomatic of the presence
of small quantities of additional gases such as CH4 or N2. However, nitrogen was the
only additional gaseous species detected in CO2-dominated inclusions by Raman
analysis. The presence of N2 could not always be confirmed by Raman spectrometry. In
other cases the amount of N2 detected by Raman spectrometry was lower than
expected from graphic estimations where homogenisation and melting temperatures
were transferred into volume-composition (VX) properties using the diagrams
provided by Thiery et al. (1994). Vice versa, Raman spectrometric measurements
sometimes proved the presence of accessory gases, where microthermometry had
indicated a pure carbonic fluid phase.
Possible reasons for these discrepancies can be summarised as following:
• The quality of Raman measurements is affected by many parameters e.g. the
quality of wafer, inclusion size, shape and its position within the sample or its
density (cf. Burke, 2001). No standards exist for the calibration of gas mixtures or
the internal standard deviations of the Raman equipment. Although analytical
conditions and methodology were tried to be optimised, it can not be completely
excluded that one or another factor had a negative effect on the quality of the
measurements, leading to less accurate results.
• Due to the mineral colour (e.g. in garnet), the presence of many small solid or
fluid inclusions that becloud single crystals (often the case in feldspar), or the
darkish appearance of many CO2-dominated inclusions, the quality of the
observation of a phase transition may be limited. Consequently, the melting
temperature measured by microthermometry does not correspond exactly to the
actual content of the fluid inclusion although, the accuracy of the stages was
determined to ± 0.2 °C for low temperature measurements and special techniques
(e.g. cycling) had been applied.
• The use of VX diagrams to graphically determine fluid compositions or molar
volumes is afflicted with a relatively large error. The VX values incorporated in
the published diagram for CO2-N2 fluid inclusions are based on an experimental
reproduction of TPX-data. Deviations caused by inaccuracies may be sizeable
especially in the critical region. For some inclusions, no data on composition or
molar volume can be derived as no point of intersection exists for the curves of
the melting- and homogenisation temperatures measured.
The deviation between compositional values derived from Raman analysis and
those determined graphically may be as high as 7 mole % (e.g. incl. no. 2176-2-24).
Albeit, the fact that the results attained by applying several methods do not always
agree with each other, the error concerning the exact fluid composition lies within
acceptable analytical limits. Particularly, if one considers the errors that occur during
4. Analytical methods
25
molar volume/density and isochore calculations that result from the limited
applicability of available equations of state.
Densities were calculated for all fluid inclusions whose composition could have
been derived from either method, and thus guide values were obtained for inclusion
assemblages. Nevertheless, to avoid possible miscalculations or misinterpretations,
isochores were calculated only for representative fluid inclusions whose composition
known from Raman microanalysis is in close accordance with results from graphic
estimates.
The bulk compositions, molar volumes/densities and isochores of individual fluid
inclusions were calculated from microthermometry data, Raman analysis and volume
fraction estimates using the software packages Fluids (Bakker, in press) and Clathrates
(Bakker, 1997). The programs provide several equations of state (EOS) for the
calculations of PVTX properties of varying fluid systems. In consideration of the
particular fluid system and the accuracy and limitations of the corresponding
equations of state, the suitable equations were chosen for further calculations (see
below). During all isochore computations the program took into account the
compressibility and expansion of the hostmineral with the volumetric data for quartz
taken from Hosieni et al. (1985) and from Berman (1988) for all other minerals. If the
amount of N2 detected by Raman spectrometry or graphic estimations did not exceed 2
mol%, fluid properties were calculated as being equivalent to pure CO2. The error in
molar volume calculations resulting from this assumption is by far smaller than liquid-
vapour equilibrium calculations with published equations of state.
Pure CO2
Molar volumes of pure CO2 fluid inclusions were obtained from the homogenisation
temperatures using the equation of Duschek et al. (1990), and isochore calculations are
based on the equation of state of Span & Wagner (1996).
CO2-N2
VX properties of mixed CO2-N2 fluids were determined from homogenisation
temperatures and Raman data according to the EOS of Thiery et al. (1994), based on the
modelling of PTX-conditions by the Soave-Redlich-Kwong EOS (Soave, 1972) and
molar volumes by the Lee-Kesler correlation (Lee & Kesler, 1975). Isochores were
calculated applying the EOS of Duan et al. (1992, 1996).
H2O-salt (NaCleq)
Fluid salinities (in wt% NaCleq) were determined from final ice melting
temperatures applying the data of Bodnar (1993). The EOS for bulk fluid density and
isochore calculations given by Zhang & Frantz (1987) was used for further
computations.
4. Analytical methods
26
H2O-CO2±N2±salt
Complex fluid systems containing mixtures of several gases (e.g. CO2-CH4-N2), H2O
and salt are not yet accurately investigated by experimental studies. Consequently,
data on solvus PVTX properties are not available and homogenisation temperatures
can not be directly transformed into bulk molar volumes/densities but depend on
estimation of volume fractions of the fluid phases present.
If clathrate melting in presence of a heterogeneous carbonic phase was observed in
complex fluid systems, the program Q2 from the software package Clathrates (Bakker,
1997) was used for the calculation of bulk fluid properties applying the EOS of Duan et
al. (1992, 1996) and Thiery et al. (1994) (H2O-CO2-N2-salt) or Duschek et al. (1990) (H2O-
CO2-NaCl) in combination with volume fraction estimates. Isochores were calculated
according to Bowers & Helgeson (1983) modified by Bakker (1999).
In salt free complex systems (H2O-CO2-N2), volume fraction estimates were
combined with volumetric properties calculated after Thiery et al. (1994) whereas
isochores were calculated with the equation of state of Holloway (1977).

5. Geological setting
27
5. Geological setting
5.1. The position of central Dronning Maud Land in respect to Rodinia and
Gondwana reconstruction
The geotectonic and metamorphic history of East Antarctica, and thus of Dronning
Maud Land (DML), is closely related to the formation and fragmentation of Rodinia
(McMenamin & McMenamin, 1990), an early Neoproterozoic supercontinent centred
around Laurentia, and the subsequent amalgamation of Gondwana in late
Neoproterozoic/early Palaeozoic times (cf. Bond et al., 1984; Moores, 1991; Dalziel,
1991; Hoffmann, 1991).
As concluded from the correlation of palaeomagnetic data with relicts of
Mesoproterozoic mobile belts preserved in the margins of Proterozoic continental
nuclei, the assembly of Rodinia was connected with a phase of deformation and
metamorphism caused by a collisional orogeny at ca. 1100-1000 Ma, also known as the
"Grenville-age event". The exact position of individual Proterozoic cratons constituting
Rodinia are still under debate (cf. Torsvik et al., 1996; Pelechaty et al., 1996; Weil et al.,
1998; Grunow, 1999; Meert, 2001), but it is in general agreed upon, that East Antarctica
was facing the western margin of Laurentia (Moores, 1991).
Tectonic activities from ca. 750 Ma to ca. 550 Ma eventually led to the breakup of
Rodinia and the consolidation of Gondwana (cf. Black & Liegeois, 1993; Rogers et al.,
1995a,b). The rifting and drifting of Rodinias continental elements probably began with
the separation of East Gondwana as a coherent block, at ca. 750-730 Ma (Li & Powell,
1993; Powell et al., 1993; Borg & DePaolo, 1994). The latest phase of diachronuous
dispersal of Rodinia overlaps in time with early collision events between East
Gondwana (Australia, India, East Antarctica) and West Gondwana cratons (South
American and African cratons/shield areas), generally referred to as the "Pan-African
event" (correlative to e.g. the Pan-Indian event, the Ross - or the Brasiliano orogeny).
However, some authors have stated that parts of East Gondwana were not fully
assembled until the latest Neoproterozoic to early Palaeozoic as indicated by the
existence of Pan-African-age orogenic belts within East Antarctia, Australia,
Madagascar and Sri Lanka (Shiraishi et al., 1994; Grunow et al., 1996). The final collision
of East and West Gondwana at ca. 530 Ma resulted in the closing and consumption of
the 'Mozambique Ocean' and the formation of the late Neoproterozoic/early
Palaeozoic East African Orogen (EAO) (Stern, 1994) or the extended East
African/Antarctic Orogen (EAAO) (Jacobs & Thomas., in press) (Fig. 5.1).
Antarctica, once forming the central part of Gondwana, today is pivotal for an
improved reconstruction of the supercontinent. During the amalgamation of East and

5. Geological setting
28
West Gondwana, the study area of central Dronning Maud Land (cDML) was located
next to the eastern margin of southern Africa (Fig. 5.1). Consequently, it shares distinct
litho-chronological and tectonic characteristics with parts of the Mozambique Belt
exposed in Mozambique, Madagascar, Sri Lanka and southern India.
Fig. 5.1: The position of cDML (marked by the rectangle) within the late Neoproterozoic/early Palaeozoic
supercontinent Gondwana (reconstruction after Lawver & Scotese, 1987). C: Coates Land; EAAO: East
African/Antarctic Orogen; EM: Ellsworth Mountains; FCB: Filchner crustal block; FM: Falkland
Microplate; G: Grunehogna craton; H: Heimefrontfjella; HN: Haag Nunatak; K: Kirvanveggen; LHB:
Lützow-Holm bay; M: Madagascar; MB: Mwembesi shear zone; MH: Mühlig-Hofmann-Gebirge; PB:
Prydz Bay; R: Richtersveld craton; S: Saldania belt; SL: Sri Lanka; Sø: Sør Rondane; SR: Shackleton
Range; Z: Zambesi belt; (modified after Jacobs & Thomas, in press).
A Pan-African high-grade metamorphic overprint of earlier Grenville-age
structures, a pre- to post-tectonic anorthositic and granitic (charnockitic) magmatic
province and sinistral shear zones typical for most parts of the Mozambique Belt in
Africa (e.g. Pinna et al., 1993; Kröner, 1997) find their analogies in cDML (Jacobs et al.,
1998). Thus, DML and the region farther east, also termed the "East Antarctic mobile
belt", are interpreted to represent the continuation of the Pan-African Mozambique Belt
into Antarctica (Unrug, 1996; Dirks & Wilson, 1995; Jacobs et al., 1998). Nevertheless, it
has yet remained unclear where the Mozambique Suture between E- and W-
5. Geological setting
29
Gondwana projects into Antarctica and whether there is just one or more of them to be
detected (Jacobs et al., 1998). Shackleton (1996) suggests to locate the suture in
Heimefrontfjella, western DML, while Grunow et al. (1996) and Wilson et al. (1997)
argue for the Lützow-Holm Complex as an alternative location. The latter shows better
correlation with data from Jacobs et al. (1995, 1998), who interpret the Pan-African-age
tectonised part of Dronning Maud Land as a foreland thrust belt with the core and
suture of the belt located farther to the east. However, due to the similar geotectonical
situations found in DML and the Lützow-Holm Bay complex, pinpointing the exact
position of the suture between East and West Gondwana in East Antarctica is still an
outstanding problem. Hitherto, no clear answer has been given to the question whether
DML originally was part of East or West Gondwana or if it even formed an individual
microplate within the Mozambique Ocean (Jacobs et al., 1998; Jacobs & Thomas, in
press).
5.2. Geography and geological evolution of central Dronning Maud Land
South of the Lazarev- and Riiser-Larsen-Sea, Dronning Maud Land encompasses the
antarctic region between 20°W and 45°E. From its northern coastline to the south, the
Nivlisen (Novolazarevskaya) and Lazarev ice shelve passes gradually over into a
gentle foreland covered with thick inland ice sheets. At ca. 70°40’S and 11°-12°E, the ice
sheet is interrupted by the Schirmacher Oase, the northernmost ice free spot and
continental boundary of DML. Further south between 71°20’S and 72°20’S, a ca. 60 km
wide steep and rugged mountain-ridge that runs subparallel to the coastline of East
Antarctica for approximately 800 km protrudes the ice cover. This E-W trending
mountain chain reaches from the Heimefrontfjella in the west to the Sør Rondane
mountain complex in the east (Fig. 5.4). To the south, it is bordered by the Wegener
inland ice which finds its continuation in the central antarctic ice cap. The study area of
central Dronning Maud Land (cDML) lies between 8°E to 14°E, where the strongly
accentuated relief (Fig. 5.2) reaches elevations of 3000 m and higher. CDML embraces
the nearly N-S aligned mountain chains of Orvinfjella, comprising Drygalskiberge,
Holtedahlfjella, Kurzegebirge, Dallmannberge, Småskeidrista and Conradgebirge, and
of Wohlthatmassiv, including Alexander-von-Humboldt-Gebirge, Petermannketten
and Otto-von-Gruber-Gebirge (Fig. 5.4). To the west cDML is flanked by the Mühlig-
Hofmann-Gebirge, while to the east it continues into the Sør Rondane mountain
complex.

5. Geological setting
30
Fig. 5.2: (a) The rugged morphology of the central Petermannketten; (b) The Otto-von-Gruber-Gebirge.
Being situated at the margin of the East Antarctic craton, cDML has experienced at
least two phases of major deformation and metamorphism: the "Grenville-age event" at
ca. 1100 – 1000 Ma, which is only preserved in relics, and the younger and
predominant "Pan-African event", that led to a strong pervasive overprint of the older
structures. The various lithologic units cropping out in cDML can generally be
described as a two-fold subdivision of metamorphic basement rocks versus syn-, late-,
and/or post-kinematic intrusive bodies of felsic and mafic composition.
A thick supracrustal series of sedimentary and volcanic rocks, today forming the
crystalline basement complex, was subjected to an extensive tectono-metamorphism at
high- to medium-pressure granulite facies conditions (M1 according to Bauer et al.,
1996). The metasedimentary units are composed of garnet-biotite±hornblende gneisses,
garnet-sillimanite-cordierite–bearing metapelites, quartzites and calc-silicate boudins
often associated with marble layers or lenses (Bauer et al., 1996; Markl & Piazolo, 1998;
Piazolo & Markl, 1999). The leucocrate paragneisses are mainly exposed in the A.-v.-
Humboldt-Gebirge and Petermannketten, and often contain a network of dark-
coloured to greenish hue or brown orthopyroxene-bearing patches and tubes
crosscutting the gneissic foliation. This secondary charnockitisation pattern is locally
interrupted by bleached zones around fractures and mylonite zones or undeformed
pegmatite veins and felsic dykes (Paech, 1997) (Fig. 5.3).
Fig. 5.3: Field view of secondary charnockitisation pattern crosscut by light-grey bleached zones around
fractures and foliation planes (central Petermannketten).
a b
5. Geological setting
31
The metavolcanic rocks are characterised by a layered sequence of fine-grained
banded hornblende-bearing gneiss, plagiogneiss and amphibolites, hinting at a
bimodal character of the original volcanic units, and intercalations of ultramafic lenses
and metagabbros (Bauer et al., 1996; Paech, 1997; Colombo & Talarico, in press).
Magmatic zircons of these rocks gave crystallisation ages of ca. 1130 Ma and
metamorphic zircon overgrowth at ca. 1080 Ma (Jacobs et al., 1998). This early
Grenville-age metamorphic event was associated with the syntectonic intrusion of
granite sheets and plutons at ca. 1085 to 1075 Ma (Jacobs et al., 1998), that were locally
metamorphosed to garnet-bearing migmatic orthogneisses. Rare remnants of D1
deformation are S1 planes parallel to the compositional layering and isoclinal,
intrafolial and often rootless microfolds with variable orientations (Bauer et al., 1996).
No further tectonothermal or magmatic imprint is recorded until ca. 600 Ma when
anorogenic magmatism marked the onset of an extended period of late Neoproterozoic
to lower Palaeozoic geodynamic activity. Subsequent high-grade tectonothermal
overprint was caused by the collision of East and West Gondwana which is ascribed to
the broader "Pan-African event". (cf. Black & Liegeois, 1993; Rogers et al., 1995a,b). The
intrusion of igneous rocks into the Grenville-age basement pre- and post-dates the
geodynamic event.
In the Wohlthatmassiv, the magmatic activity started with the emplacement of a
voluminous massif-type anorthosite complex (the O.-v.-Gruber–Anorthosite complex)
associated with subordinate charnockites, ferrodiorites and norites (Kämpf &
Stackebrandt, 1985; Jacobs et al., 1998; Markl et al., in press). The O.-v.-Gruber
anorthosite complex crops out over approximately 250 km2 and shows a relatively
homogeneous plagioclase ± orthopyroxene ± clinopyroxene - magnetite - illmenite
mineral assemblage. A common feature are layers and lenses of ultramafic
composition, mainly composed of Fe-Ti oxides and orthopyroxene. The anorthosite
complex is crosscut by ferrodioritic dykes, varying amounts of (leuco-) gabbros and
(leuco-)norites and late Pan-African pegmatoids (Markl et al., in press). Granitic
plutons, anorthositic dykes, and rocks of the ferrodiorite suite also intruded in the area
of the Petermanketten (Ravich & Kamenev, 1975; Parimoo et al., 1988; Joshi et al., 1991).
The margins of the anorthosite body were strongly deformed at ca. 580-550 Ma
(Jacobs et al., 1998). Deformation took place at medium-pressure granulite facies
conditions of about 6.8 ± 0.5 kbar and 830 ± 20 °C, and is interpreted as representing the
collisional stage, i.e. Pan- African I (Markl & Piazolo, 1998; D2 in Bauer et al., in press).
Within the anorthosite body discrete mylonitic shear zones developed during this high
grade event.
The main structural trend ascribed to the Pan African I (or D2) deformational event
is not homogenous throughout cDML. In the Wohlthatmassiv, tight B2 fold axes are
5. Geological setting
32
preserved, but their original vergence is concealed by later refolding and rotation.
Common features of the coeval metamorphism M2 that can be observed within the
metamorphic basement rocks include syntectonic migmatisation, dehydration melting
of metapelites and expulsion of leucosomes (Bauer et al., in press). The anorthosite
body was affected by a foliation S2 which bends gradually from E-W in the northern
margins over NE-SW in the north-west to N-S at the western flank. In the eastern and
central region no foliation is discernible, and undeformed magmatic textures and
–layering are preserved. Thus, the anorthosite is interpreted as having behaved like a
large delta-clast during deformation (Bauer et al., in press; Markl et al., in press).
A subsequent tectono-metamorphic event (Pan-African II; D3/M3 in Bauer et al., in
press) started with the syntectonic intrusion of granitoids and gabbros at
approximately 530-515 Ma (Jacobs et al., 1998; Bauer et al., in press). Metamorphic
conditions were at low–pressure granulite facies of 4 - 5 kbar and temperatures of
about 640 ± 10 °C (Markl & Piazolo, 1998).
Extensional shearing (D4) gave way for a second voluminous anorogenic
anorthosite-charnockite cycle and the intrusion of post-tectonic syenite-batholiths at ca.
510 Ma (Mikhalsky et al., 1997) that marked the final stage of Pan-African
metamorphism. It was accompanied by a poorly developed and yet undated
retrogression at pressures of approximately 2 - 5 kbar and 480 - 580 °C post-dating the
voluminous intrusion of granitoids at 510 Ma (Markl & Piazolo, 1998; D4 in Bauer et al.,
in press).
Thermobarometric studies indicate a clockwise PT-path characterised by an
isothermal decompression evolution for the early Pan-African I event, whereas the
structures of the Pan-African II event are ascribed to a late-orogenic extensional
collapse of the East African/Antarctic Orogen (Colombo & Talarico, in press.; Jacobs &
Thomas, in press).
5.3. Nomenclature of geographic sites in Dronning Maud Land
The naming of topographic features in central Dronning Maud Land has not been
unitised yet. When selecting existing names for the use in this work, preference was
given to the earliest approved or documented names, as recommended by the
guidelines of the "Composite Gazetteer of Antarctica"(www.pnra.it/SCAR_GAZE),
published by the Scientific Committee on Antarctic Research (SCAR) - Working Group on
Geodesy and Geographic Information. According to SCAR recommendations, place names
should be given in their original form and not in a translated version. In 1937, when
Norway claimed the sector between 20°W and 45°E to secure its whaling activities, the
region was named in honour of the Norwegian Queen Maud (1869-1938). Thus, the
Norwegian term Dronning Maud Land is used throughout this study. On the other

5. Geological setting
33
hand, most geographic names that are in common use today can be traced back to the
German Expedition led by A. Ritscher in 1938/39, during which the geography of
Dronning Maud Land was systematically mapped with the help of aircraft and
aerophotogrammetry. Consequently, German and Norwegian names are applied in
hierarchical succession or according to their prevalence and acceptance throughout
recent literature. English terms are applied, if no appropriate German or Norwegian
names exist or if they are the ones most widely accepted.
Fig. 5.4: Overview map of
central Dronning Maud Land
showing its position within the
Antarctic continent, the most
important geological units and
sample locations. (modified
after Meier, 1999)
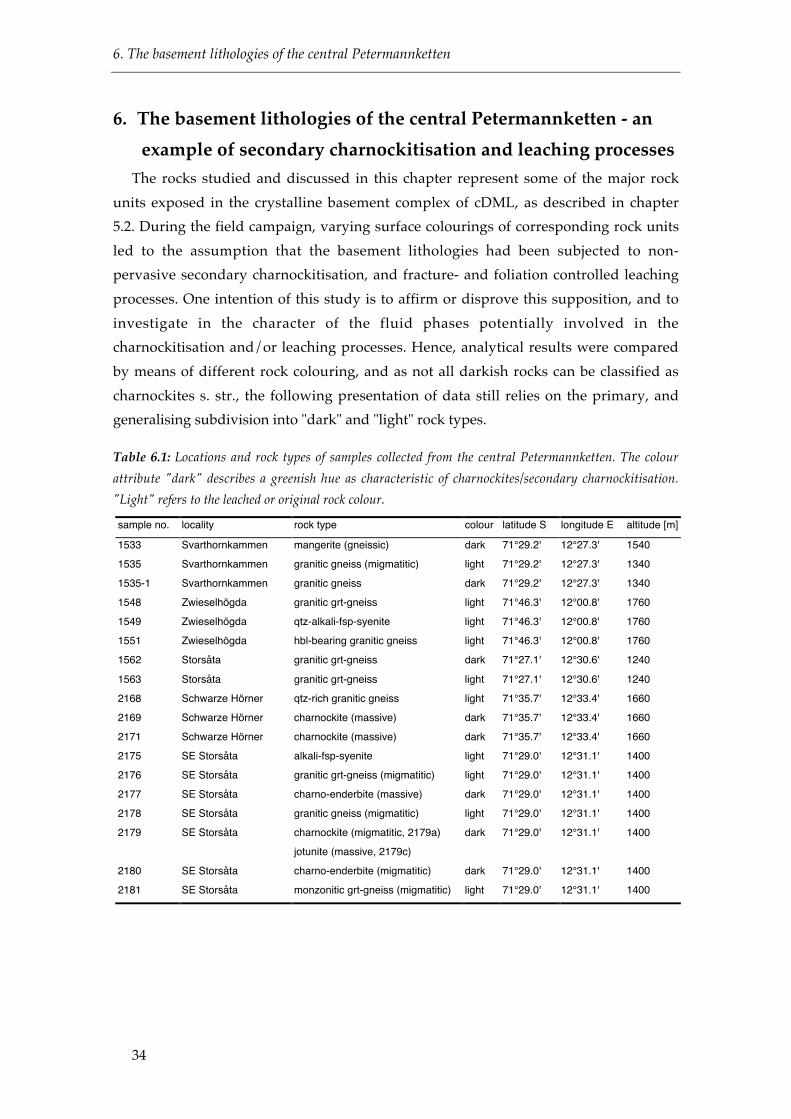
6. The basement lithologies of the central Petermannketten
34
6. The basement lithologies of the central Petermannketten - an
example of secondary charnockitisation and leaching processes
The rocks studied and discussed in this chapter represent some of the major rock
units exposed in the crystalline basement complex of cDML, as described in chapter
5.2. During the field campaign, varying surface colourings of corresponding rock units
led to the assumption that the basement lithologies had been subjected to non-
pervasive secondary charnockitisation, and fracture- and foliation controlled leaching
processes. One intention of this study is to affirm or disprove this supposition, and to
investigate in the character of the fluid phases potentially involved in the
charnockitisation and/or leaching processes. Hence, analytical results were compared
by means of different rock colouring, and as not all darkish rocks can be classified as
charnockites s. str., the following presentation of data still relies on the primary, and
generalising subdivision into "dark" and "light" rock types.
Table 6.1: Locations and rock types of samples collected from the central Petermannketten. The colour
attribute "dark" describes a greenish hue as characteristic of charnockites/secondary charnockitisation.
"Light" refers to the leached or original rock colour.
sample no. locality rock type colour latitude S longitude E altitude [m]
1533 Svarthornkammen mangerite (gneissic) dark 71°29.2' 12°27.3' 1540
1535 Svarthornkammen granitic gneiss (migmatitic) light 71°29.2' 12°27.3' 1340
1535-1 Svarthornkammen granitic gneiss dark 71°29.2' 12°27.3' 1340
1548 Zwieselhögda granitic grt-gneiss light 71°46.3' 12°00.8' 1760
1549 Zwieselhögda qtz-alkali-fsp-syenite light 71°46.3' 12°00.8' 1760
1551 Zwieselhögda hbl-bearing granitic gneiss light 71°46.3' 12°00.8' 1760
1562 Storsåta granitic grt-gneiss dark 71°27.1' 12°30.6' 1240
1563 Storsåta granitic grt-gneiss light 71°27.1' 12°30.6' 1240
2168 Schwarze Hörner qtz-rich granitic gneiss light 71°35.7' 12°33.4' 1660
2169 Schwarze Hörner charnockite (massive) dark 71°35.7' 12°33.4' 1660
2171 Schwarze Hörner charnockite (massive) dark 71°35.7' 12°33.4' 1660
2175 SE Storsåta alkali-fsp-syenite light 71°29.0' 12°31.1' 1400
2176 SE Storsåta granitic grt-gneiss (migmatitic) light 71°29.0' 12°31.1' 1400
2177 SE Storsåta charno-enderbite (massive) dark 71°29.0' 12°31.1' 1400
2178 SE Storsåta granitic gneiss (migmatitic) light 71°29.0' 12°31.1' 1400
2179 SE Storsåta charnockite (migmatitic, 2179a)
jotunite (massive, 2179c)
dark 71°29.0' 12°31.1' 1400
2180 SE Storsåta charno-enderbite (migmatitic) dark 71°29.0' 12°31.1' 1400
2181 SE Storsåta monzonitic grt-gneiss (migmatitic) light 71°29.0' 12°31.1' 1400
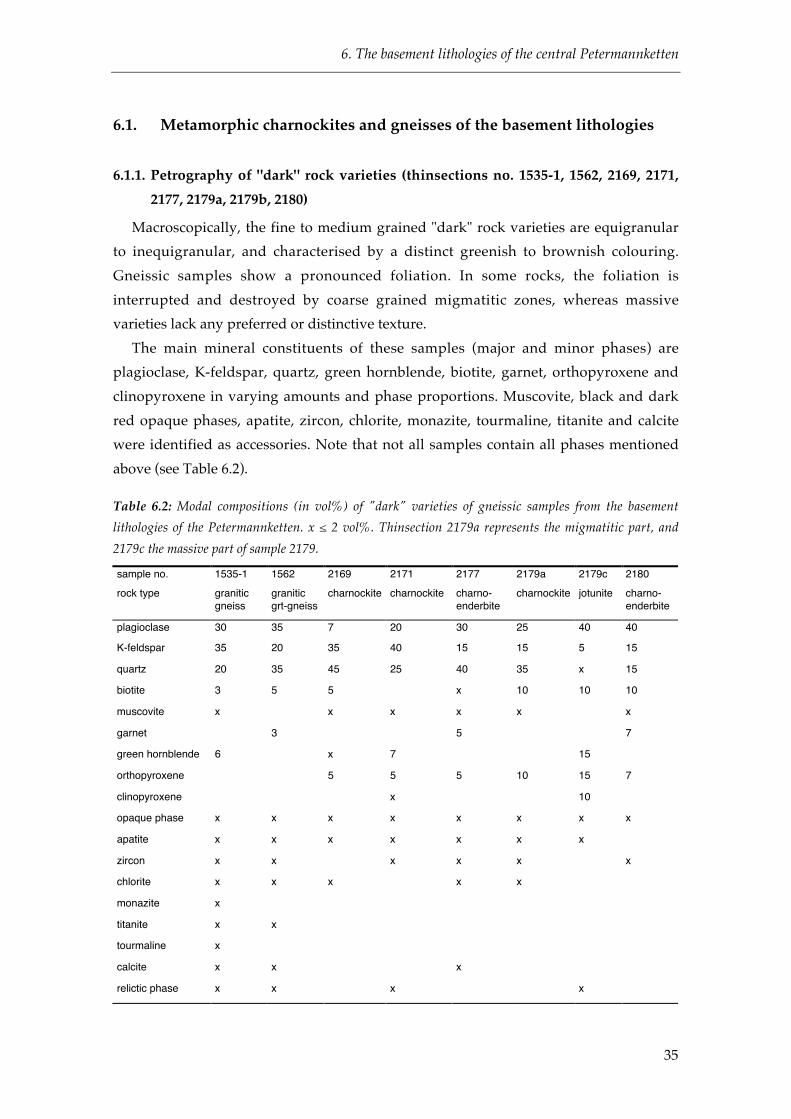
6. The basement lithologies of the central Petermannketten
35
6.1. Metamorphic charnockites and gneisses of the basement lithologies
6.1.1. Petrography of "dark" rock varieties (thinsections no. 1535-1, 1562, 2169, 2171,
2177, 2179a, 2179b, 2180)
Macroscopically, the fine to medium grained "dark" rock varieties are equigranular
to inequigranular, and characterised by a distinct greenish to brownish colouring.
Gneissic samples show a pronounced foliation. In some rocks, the foliation is
interrupted and destroyed by coarse grained migmatitic zones, whereas massive
varieties lack any preferred or distinctive texture.
The main mineral constituents of these samples (major and minor phases) are
plagioclase, K-feldspar, quartz, green hornblende, biotite, garnet, orthopyroxene and
clinopyroxene in varying amounts and phase proportions. Muscovite, black and dark
red opaque phases, apatite, zircon, chlorite, monazite, tourmaline, titanite and calcite
were identified as accessories. Note that not all samples contain all phases mentioned
above (see Table 6.2).
Table 6.2: Modal compositions (in vol%) of "dark" varieties of gneissic samples from the basement
lithologies of the Petermannketten. x ≤ 2 vol%. Thinsection 2179a represents the migmatitic part, and
2179c the massive part of sample 2179.
sample no. 1535-1 1562 2169 2171 2177 2179a 2179c 2180
rock type graniticgneiss
graniticgrt-gneiss
charnockite charnockite charno-enderbite
charnockite jotunite charno-enderbite
plagioclase 30 35 7 20 30 25 40 40
K-feldspar 35 20 35 40 15 15 5 15
quartz 20 35 45 25 40 35 x 15
biotite 3 5 5 x 10 10 10
muscovite x x x x x x
garnet 3 5 7
green hornblende 6 x 7 15
orthopyroxene 5 5 5 10 15 7
clinopyroxene x 10
opaque phase x x x x x x x x
apatite x x x x x x x
zircon x x x x x x
chlorite x x x x x
monazite x
titanite x x
tourmaline x
calcite x x x
relictic phase x x x x
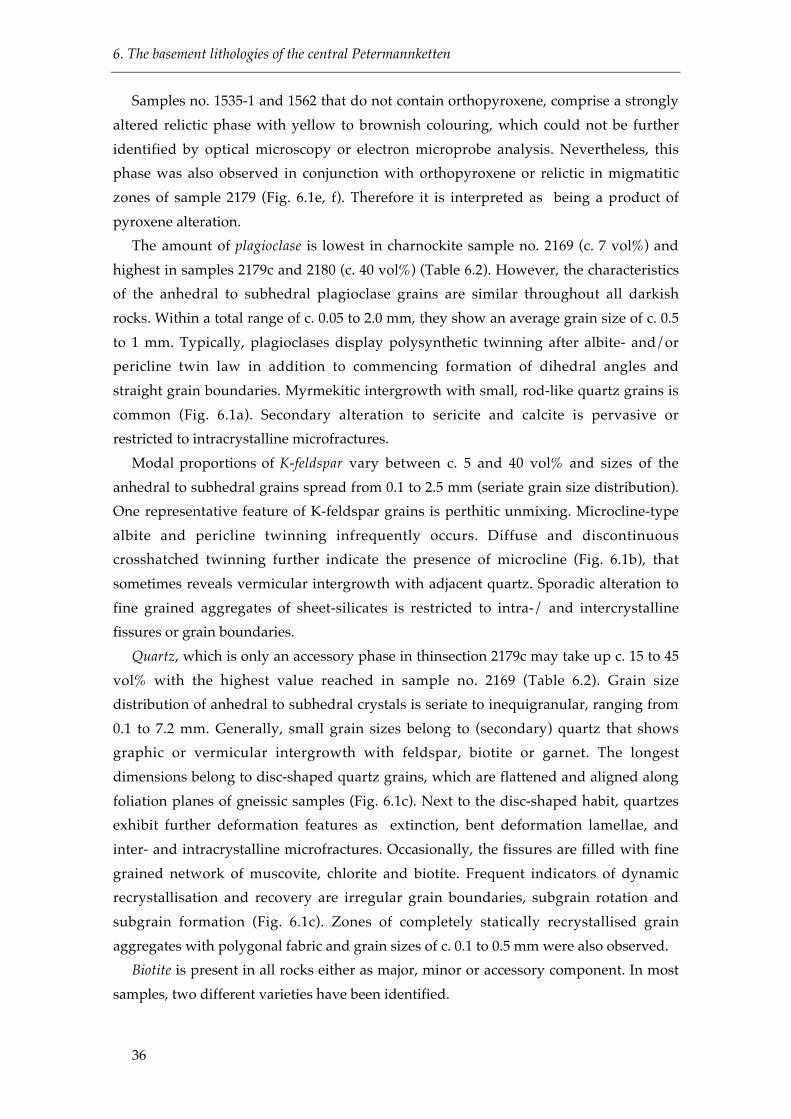
6. The basement lithologies of the central Petermannketten
36
Samples no. 1535-1 and 1562 that do not contain orthopyroxene, comprise a strongly
altered relictic phase with yellow to brownish colouring, which could not be further
identified by optical microscopy or electron microprobe analysis. Nevertheless, this
phase was also observed in conjunction with orthopyroxene or relictic in migmatitic
zones of sample 2179 (Fig. 6.1e, f). Therefore it is interpreted as being a product of
pyroxene alteration.
The amount of plagioclase is lowest in charnockite sample no. 2169 (c. 7 vol%) and
highest in samples 2179c and 2180 (c. 40 vol%) (Table 6.2). However, the characteristics
of the anhedral to subhedral plagioclase grains are similar throughout all darkish
rocks. Within a total range of c. 0.05 to 2.0 mm, they show an average grain size of c. 0.5
to 1 mm. Typically, plagioclases display polysynthetic twinning after albite- and/or
pericline twin law in addition to commencing formation of dihedral angles and
straight grain boundaries. Myrmekitic intergrowth with small, rod-like quartz grains is
common (Fig. 6.1a). Secondary alteration to sericite and calcite is pervasive or
restricted to intracrystalline microfractures.
Modal proportions of K-feldspar vary between c. 5 and 40 vol% and sizes of the
anhedral to subhedral grains spread from 0.1 to 2.5 mm (seriate grain size distribution).
One representative feature of K-feldspar grains is perthitic unmixing. Microcline-type
albite and pericline twinning infrequently occurs. Diffuse and discontinuous
crosshatched twinning further indicate the presence of microcline (Fig. 6.1b), that
sometimes reveals vermicular intergrowth with adjacent quartz. Sporadic alteration to
fine grained aggregates of sheet-silicates is restricted to intra-/ and intercrystalline
fissures or grain boundaries.
Quartz, which is only an accessory phase in thinsection 2179c may take up c. 15 to 45
vol% with the highest value reached in sample no. 2169 (Table 6.2). Grain size
distribution of anhedral to subhedral crystals is seriate to inequigranular, ranging from
0.1 to 7.2 mm. Generally, small grain sizes belong to (secondary) quartz that shows
graphic or vermicular intergrowth with feldspar, biotite or garnet. The longest
dimensions belong to disc-shaped quartz grains, which are flattened and aligned along
foliation planes of gneissic samples (Fig. 6.1c). Next to the disc-shaped habit, quartzes
exhibit further deformation features as extinction, bent deformation lamellae, and
inter- and intracrystalline microfractures. Occasionally, the fissures are filled with fine
grained network of muscovite, chlorite and biotite. Frequent indicators of dynamic
recrystallisation and recovery are irregular grain boundaries, subgrain rotation and
subgrain formation (Fig. 6.1c). Zones of completely statically recrystallised grain
aggregates with polygonal fabric and grain sizes of c. 0.1 to 0.5 mm were also observed.
Biotite is present in all rocks either as major, minor or accessory component. In most
samples, two different varieties have been identified.
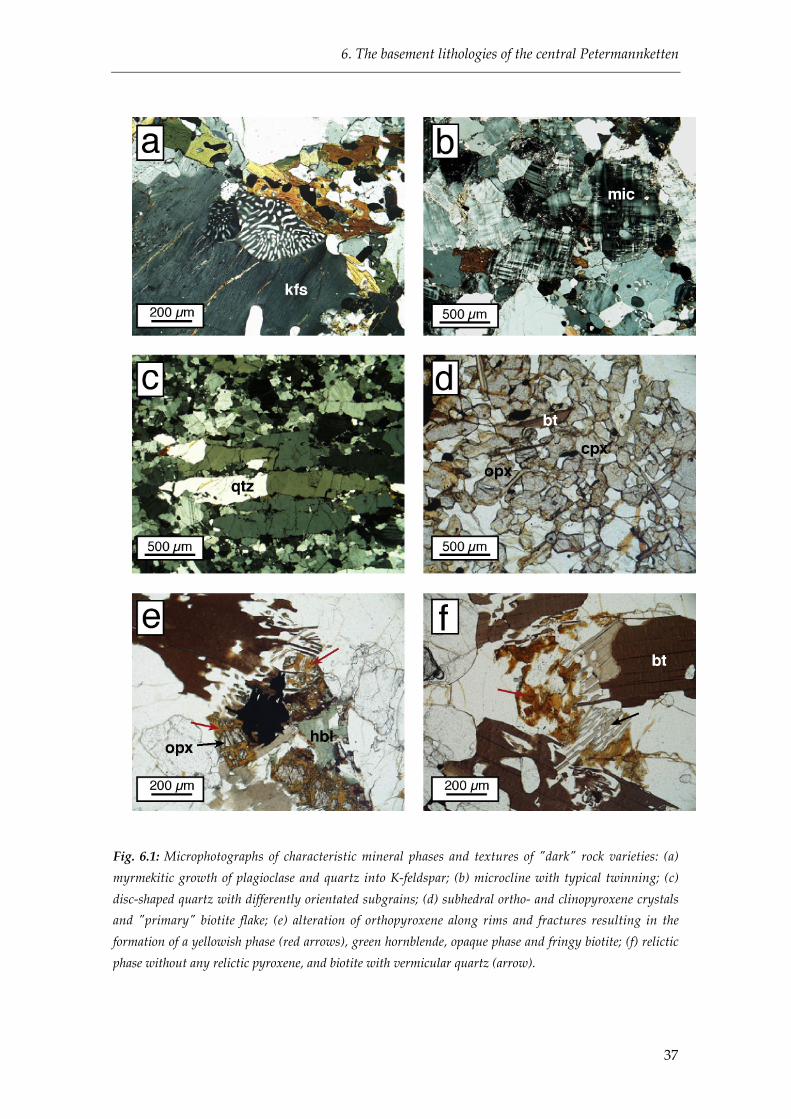
6. The basement lithologies of the central Petermannketten
37
Fig. 6.1: Microphotographs of characteristic mineral phases and textures of "dark" rock varieties: (a)
myrmekitic growth of plagioclase and quartz into K-feldspar; (b) microcline with typical twinning; (c)
disc-shaped quartz with differently orientated subgrains; (d) subhedral ortho- and clinopyroxene crystals
and "primary" biotite flake; (e) alteration of orthopyroxene along rims and fractures resulting in the
formation of a yellowish phase (red arrows), green hornblende, opaque phase and fringy biotite; (f) relictic
phase without any relictic pyroxene, and biotite with vermicular quartz (arrow).
6. The basement lithologies of the central Petermannketten
38
One type of biotite is aligned along foliation planes or integrated in the fabric of
massive samples. Pleochroitic colouring of the subhedral flakes is dark brown to light
brown, and grain size is c. 0.3 to 1.0 mm (Fig. 6.1d). Inclusions of small rounded zircon
grains are surrounded by black pleochroitic halos. The other, and assumedly
secondary, type of mostly anhedral biotite may be larger, ranging from 0.2 to 2.0 mm in
longest dimension. It displays similar pleochroitic colouring, but some grains also
reveal pleochroism from dark to light green. The most characteristic attribute is its
vermicular intergrowth with quartz, which results in a fringy appearance (Fig. 6.1e,f).
Single grains generally overgrow the rocks' fabric, form rims around pyroxene or occur
paragenetically with or as solid inclusion in in garnet or green hornblende. Around the
strongly altered relictic phase of samples no. 1562 and 1535-1, biotite also appears in
conjunction with calcite. It is not always possible to clearly differentiate both biotite
varieties in respect to volume percentage estimation, as the second type may reveal
epitaxical overgrowth on early grains.
Orthopyroxene (i.e. hypersthene), the mineral phase essential for classifying rocks in
respect of the charnockitic rock suite, was detected in all thinsections except for
samples no. 1562 and 1535-1. Orthopyroxene crystals are euhedral to subhedral, and
range from c. 0.05 to 2.0 mm in size. Their pleochroitic colour changes between pale
green to pale yellowish (Fig. 6.1d). Most minerals exhibit varying states of alteration
along mineral cleavage planes, microfractures or grain margins. Alteration results in
formation of brownish opaque phase, a network of unspecified yellow microcrystals or
different sheet-silicates, green hornblende and secondary biotite (Fig. 6.1e). Biotite
(early type), black opaque phase, quartz and feldspar occur as solid inclusions in
orthopyroxene. Clinopyroxene was identified by means of weak pleochroism (light
green and light red), and high birefringence. The euhedral to subhedral crystals are
between c. 0.05 and 0.5 mm in size. Large grains are sometimes surrounded by a
narrow rim of orthopyroxene.
Samples no. 1562, 2177 and 2180 contain subhedral garnet blasts that range from c.
0.1 to 4.0 mm in size. The blasts sometimes reveal open microfractures, and varying
numbers and combinations of solid inclusions, which were identified as quartz, black
opaque phase and biotite (early and late type).
Green hornblende is an accessory phase in sample no. 2169 and a major constituent in
samples no. 1535-1, 2171, and 2179. The mineral grains are anhedral to subhedral, 0.2 to
0.8 mm in size. They reveal a strong pleochroism of light to dark green. Mineral
cleavage planes are visible in sections cut perpendicular to the c-axis. In general green
hornblende has formed as mantle around pyroxene. It has also developed along
fractures and cleavage planes of pyroxene, or intergrown with biotite. Rarely, green
hornblende displays beginning of calcitisation and sericitisation.
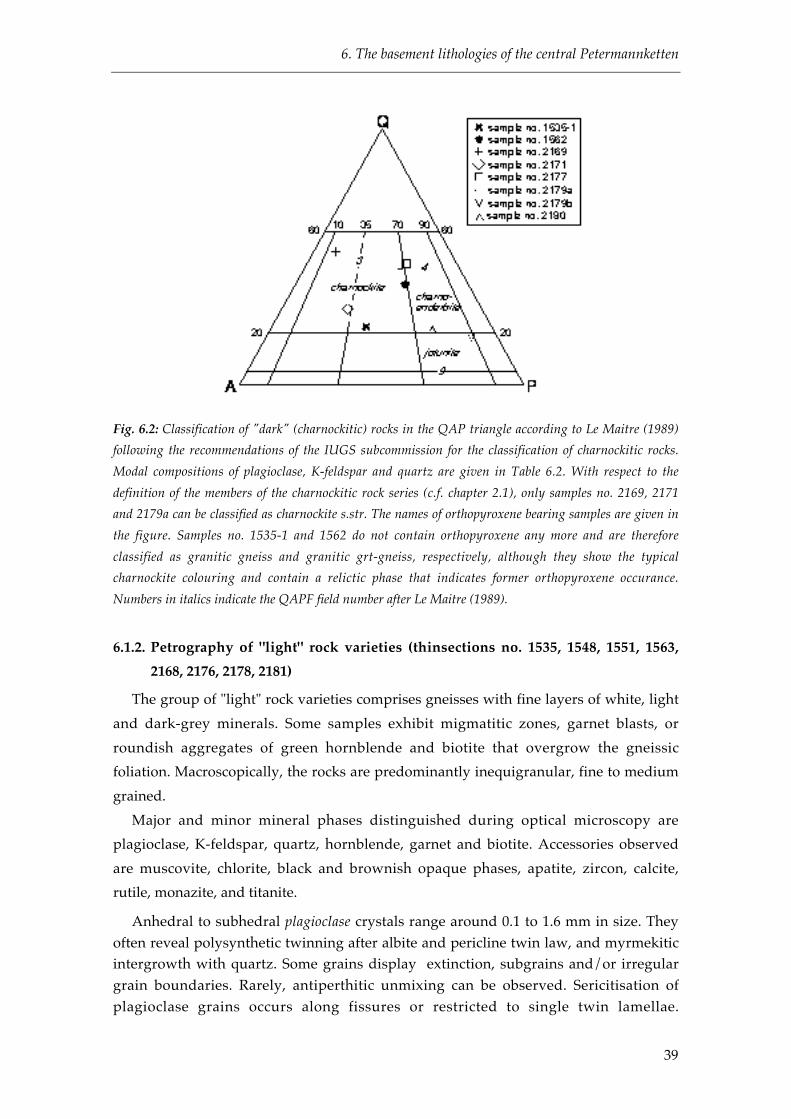
6. The basement lithologies of the central Petermannketten
39
Fig. 6.2: Classification of "dark" (charnockitic) rocks in the QAP triangle according to Le Maitre (1989)
following the recommendations of the IUGS subcommission for the classification of charnockitic rocks.
Modal compositions of plagioclase, K-feldspar and quartz are given in Table 6.2. With respect to the
definition of the members of the charnockitic rock series (c.f. chapter 2.1), only samples no. 2169, 2171
and 2179a can be classified as charnockite s.str. The names of orthopyroxene bearing samples are given in
the figure. Samples no. 1535-1 and 1562 do not contain orthopyroxene any more and are therefore
classified as granitic gneiss and granitic grt-gneiss, respectively, although they show the typical
charnockite colouring and contain a relictic phase that indicates former orthopyroxene occurance.
Numbers in italics indicate the QAPF field number after Le Maitre (1989).
6.1.2. Petrography of "light" rock varieties (thinsections no. 1535, 1548, 1551, 1563,
2168, 2176, 2178, 2181)
The group of "light" rock varieties comprises gneisses with fine layers of white, light
and dark-grey minerals. Some samples exhibit migmatitic zones, garnet blasts, or
roundish aggregates of green hornblende and biotite that overgrow the gneissic
foliation. Macroscopically, the rocks are predominantly inequigranular, fine to medium
grained.
Major and minor mineral phases distinguished during optical microscopy are
plagioclase, K-feldspar, quartz, hornblende, garnet and biotite. Accessories observed
are muscovite, chlorite, black and brownish opaque phases, apatite, zircon, calcite,
rutile, monazite, and titanite.
Anhedral to subhedral plagioclase crystals range around 0.1 to 1.6 mm in size. They
often reveal polysynthetic twinning after albite and pericline twin law, and myrmekitic
intergrowth with quartz. Some grains display extinction, subgrains and/or irregular
grain boundaries. Rarely, antiperthitic unmixing can be observed. Sericitisation of
plagioclase grains occurs along fissures or restricted to single twin lamellae.

6. The basement lithologies of the central Petermannketten
40
Table 6.3: Modal compositions (vol%) of "light" varieties of gneiss and migmatite samples from the
basement lithologies of the Petermannketten. x ≤ 2 vol%.
sample no. 1535 1548 1551 1563 2168 2176 2178 2181
rock type graniticgneiss
graniticgrt-gneiss
hbl-bearinggranitic gneiss
graniticgrt-gneiss
qtz-richgranitic gneiss
graniticgrt-gneiss
graniticgneiss
monzoniticgrt-gneiss
plagioclase 25 20 20 25 7 25 20 40
K-feldspar 40 20 25 25 20 25 30 30
quartz 25 40 40 40 50 35 35 10
biotite 7 7 5 x 10 x x 10
muscovite x x x x x
garnet 7 5 5 5 4
green hornblende 7 x
opaque phase x x x x x x x x
apatite x x x x x x
zircon x x x x x x x x
chlorite x x x x x
monazite x
calcite x
rutile x x x
titanite x
relictic phase x x x x x
K-feldspar shows seriate grain size distribution, generally ranging from c. 0.05 to 1.5
mm, but grain sizes up to c. 30.0 mm are also present in migmatitic samples. The
subhedral to anhedral grains commonly reveal perthitic unmixing and discontinuous
crosshatched twinning as it is typical for microcline (Fig. 6.3a). Abundant
microstructures caused by deformation and/or recovery include irregular grain
boundaries (Fig. 6.3a), extinction, and subgrain formation. Fine grained recrystallised
K-feldspar aggregates or thin twin lamellae are a subordinate feature. Straight grain
boundaries and dihedral angles have preferably formed in contact with quartz and
biotite. Evidence of brittle fracturing is given by the presence of inter- and
intracrystalline fissures and microfractures. Regularly, they are filled with fine grained
aggregates of muscovite, calcite and/or chlorite.
Quartz generally displays bimodal grain size distribution, ranging from c. 0.8 to 8.8
mm. In strongly foliated gneisses, large anhedral quartz crystals are disc-shaped and
flattened parallel to the foliation planes (Fig. 6.3a). They show interlobate grain
boundaries, undulous extinction and subgrain formation. The texture and habit of
small quartz grains of these samples indicate dynamic and sometimes static
recrystallisation, the latter leading to the formation of polygonal fabric, a lack of
undulous extinction, and interfacial angles of approximately 120°. In migmatitic
samples, grain size distribution is similar (c. 0.4 bis 6.4 mm), but the large crystals are
anhedral old grains that do not show any preferred orientation.

6. The basement lithologies of the central Petermannketten
41
Fig. 6.3: Microphotographs of "light" coloured samples of the basement lithologies: (a) disc-shaped quartz
and microcline with irregular grain boundaries; (b) flaky (primary) biotite aligned within gneissic
foliation; (c) green hornblende in circular arrangement around plagioclase; (d) the same display detail as
in (c), but with crossed polars; (e) garnet, biotite, and relictic yellow phase (arrow); (f) orthopyroxene and
clinopyroxene of mangerite sample no. 1533 (synkinematic intrusion, cf. chapter 6.2).
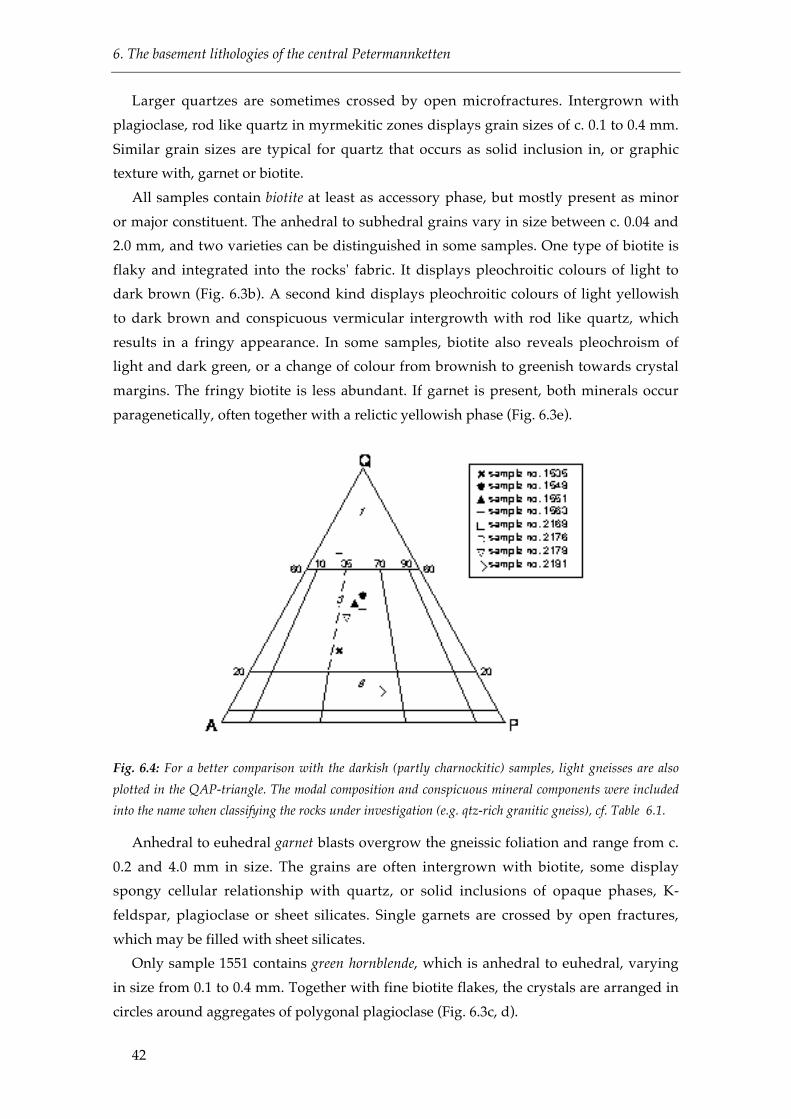
6. The basement lithologies of the central Petermannketten
42
Larger quartzes are sometimes crossed by open microfractures. Intergrown with
plagioclase, rod like quartz in myrmekitic zones displays grain sizes of c. 0.1 to 0.4 mm.
Similar grain sizes are typical for quartz that occurs as solid inclusion in, or graphic
texture with, garnet or biotite.
All samples contain biotite at least as accessory phase, but mostly present as minor
or major constituent. The anhedral to subhedral grains vary in size between c. 0.04 and
2.0 mm, and two varieties can be distinguished in some samples. One type of biotite is
flaky and integrated into the rocks' fabric. It displays pleochroitic colours of light to
dark brown (Fig. 6.3b). A second kind displays pleochroitic colours of light yellowish
to dark brown and conspicuous vermicular intergrowth with rod like quartz, which
results in a fringy appearance. In some samples, biotite also reveals pleochroism of
light and dark green, or a change of colour from brownish to greenish towards crystal
margins. The fringy biotite is less abundant. If garnet is present, both minerals occur
paragenetically, often together with a relictic yellowish phase (Fig. 6.3e).
Fig. 6.4: For a better comparison with the darkish (partly charnockitic) samples, light gneisses are also
plotted in the QAP-triangle. The modal composition and conspicuous mineral components were included
into the name when classifying the rocks under investigation (e.g. qtz-rich granitic gneiss), cf. Table 6.1.
Anhedral to euhedral garnet blasts overgrow the gneissic foliation and range from c.
0.2 and 4.0 mm in size. The grains are often intergrown with biotite, some display
spongy cellular relationship with quartz, or solid inclusions of opaque phases, K-
feldspar, plagioclase or sheet silicates. Single garnets are crossed by open fractures,
which may be filled with sheet silicates.
Only sample 1551 contains green hornblende, which is anhedral to euhedral, varying
in size from 0.1 to 0.4 mm. Together with fine biotite flakes, the crystals are arranged in
circles around aggregates of polygonal plagioclase (Fig. 6.3c, d).

6. The basement lithologies of the central Petermannketten
43
6.1.3. Fluid inclusion studies (thicksections no. 1535, 1535-1, 1562, 1563, 2176, 2177,
2178, 2179a, 2179c, 2180, 2181)
Not all samples described in the previous chapter were suitable for
microthermometry analysis, and hence, the most characteristic and promising ones
were selected for further investigations. Within both groups of rocks ("dark" and "light"
varieties) three different fluid phases containing either CO2±N2, H2O-salt or H2O-
CO2±N2-salt, have been identified. Fluid inclusions are predominantly hosted by
quartz and subordinately by plagioclase and garnet.
CO2±N2- bearing inclusions
The fluid phase that is most abundant throughout the dark and light varieties of
(migmatitic) gneisses is CO2-rich with minor and varying amounts of nitrogen. When
hosted by quartz, these inclusions range between 3.5 to 45.0 µm in size. They are mostly
arranged in intracrystalline clusters and trails but single inclusions do also occur.
Inclusion shapes are highly irregular or elongated (Fig. 6.6a), but predominantly
roundish to negative crystal shape (Fig. 6.6b). Melting temperatures of solid CO2 after
supercooling to -120°C and reheating to room temperature is -58.3 to -56.6 °C (light
rock types) and -58.4 to -56.6 °C (dark rocks) (Fig. 6.5a, b). Homogenisation
temperatures range between 10.9 and 30.7 °C (light rocks) and 7.5 to 29.9 °C (dark
rocks) and homogenisation either occurs to the liquid or to the vapour phase (Fig.
6.5a,b). Some rare inclusions also reveal fading of the miniscus of the bubble which
indicates critical homogenisation. Densities calculated from homogenisation
temperatures range between 0.17 and 0.84 gcm-3 for light rock varieties and 0.37 to 0.82
gcm-3 for dark rock varieties.
Fig. 6.5a: Homogenisation and melting temperatures of qtz-hosted CO2±N2 inclusions of "dark" and
"light" rock types. Homogenisation is either to the vapour or the liquid phase. Note that no characteristic
regularity in Th or Tm of darkish and light rock varieties can be derived.
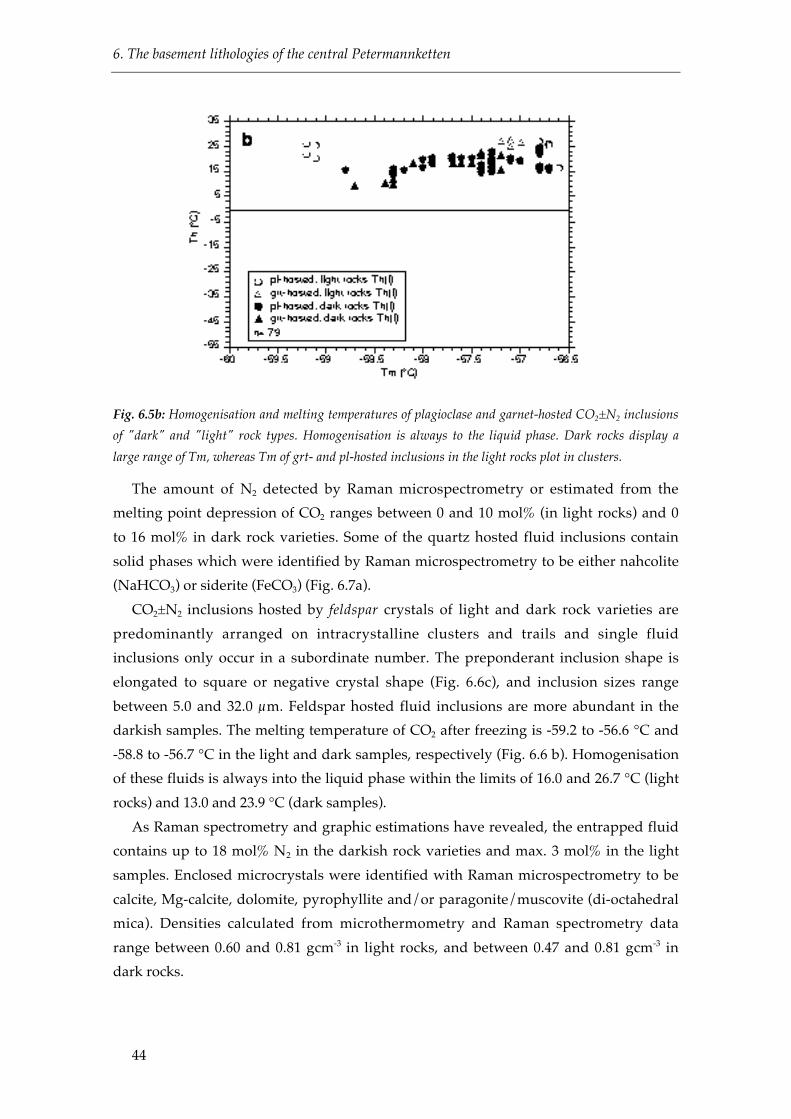
6. The basement lithologies of the central Petermannketten
44
Fig. 6.5b: Homogenisation and melting temperatures of plagioclase and garnet-hosted CO2±N2 inclusions
of "dark" and "light" rock types. Homogenisation is always to the liquid phase. Dark rocks display a
large range of Tm, whereas Tm of grt- and pl-hosted inclusions in the light rocks plot in clusters.
The amount of N2 detected by Raman microspectrometry or estimated from the
melting point depression of CO2 ranges between 0 and 10 mol% (in light rocks) and 0
to 16 mol% in dark rock varieties. Some of the quartz hosted fluid inclusions contain
solid phases which were identified by Raman microspectrometry to be either nahcolite
(NaHCO3) or siderite (FeCO3) (Fig. 6.7a).
CO2±N2 inclusions hosted by feldspar crystals of light and dark rock varieties are
predominantly arranged on intracrystalline clusters and trails and single fluid
inclusions only occur in a subordinate number. The preponderant inclusion shape is
elongated to square or negative crystal shape (Fig. 6.6c), and inclusion sizes range
between 5.0 and 32.0 µm. Feldspar hosted fluid inclusions are more abundant in the
darkish samples. The melting temperature of CO2 after freezing is -59.2 to -56.6 °C and
-58.8 to -56.7 °C in the light and dark samples, respectively (Fig. 6.6 b). Homogenisation
of these fluids is always into the liquid phase within the limits of 16.0 and 26.7 °C (light
rocks) and 13.0 and 23.9 °C (dark samples).
As Raman spectrometry and graphic estimations have revealed, the entrapped fluid
contains up to 18 mol% N2 in the darkish rock varieties and max. 3 mol% in the light
samples. Enclosed microcrystals were identified with Raman microspectrometry to be
calcite, Mg-calcite, dolomite, pyrophyllite and/or paragonite/muscovite (di-octahedral
mica). Densities calculated from microthermometry and Raman spectrometry data
range between 0.60 and 0.81 gcm-3 in light rocks, and between 0.47 and 0.81 gcm-3 in
dark rocks.
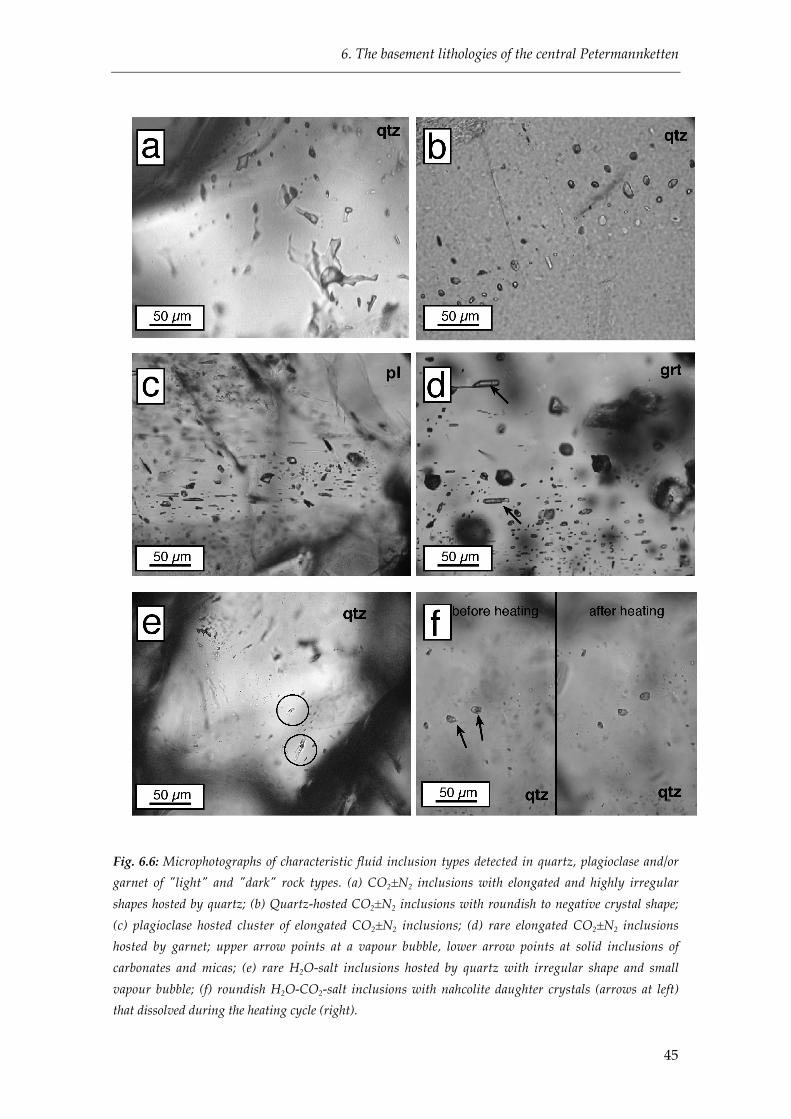
6. The basement lithologies of the central Petermannketten
45
Fig. 6.6: Microphotographs of characteristic fluid inclusion types detected in quartz, plagioclase and/or
garnet of "light" and "dark" rock types. (a) CO2±N2 inclusions with elongated and highly irregular
shapes hosted by quartz; (b) Quartz-hosted CO2±N2 inclusions with roundish to negative crystal shape;
(c) plagioclase hosted cluster of elongated CO2±N2 inclusions; (d) rare elongated CO2±N2 inclusions
hosted by garnet; upper arrow points at a vapour bubble, lower arrow points at solid inclusions of
carbonates and micas; (e) rare H2O-salt inclusions hosted by quartz with irregular shape and small
vapour bubble; (f) roundish H2O-CO2-salt inclusions with nahcolite daughter crystals (arrows at left)
that dissolved during the heating cycle (right).
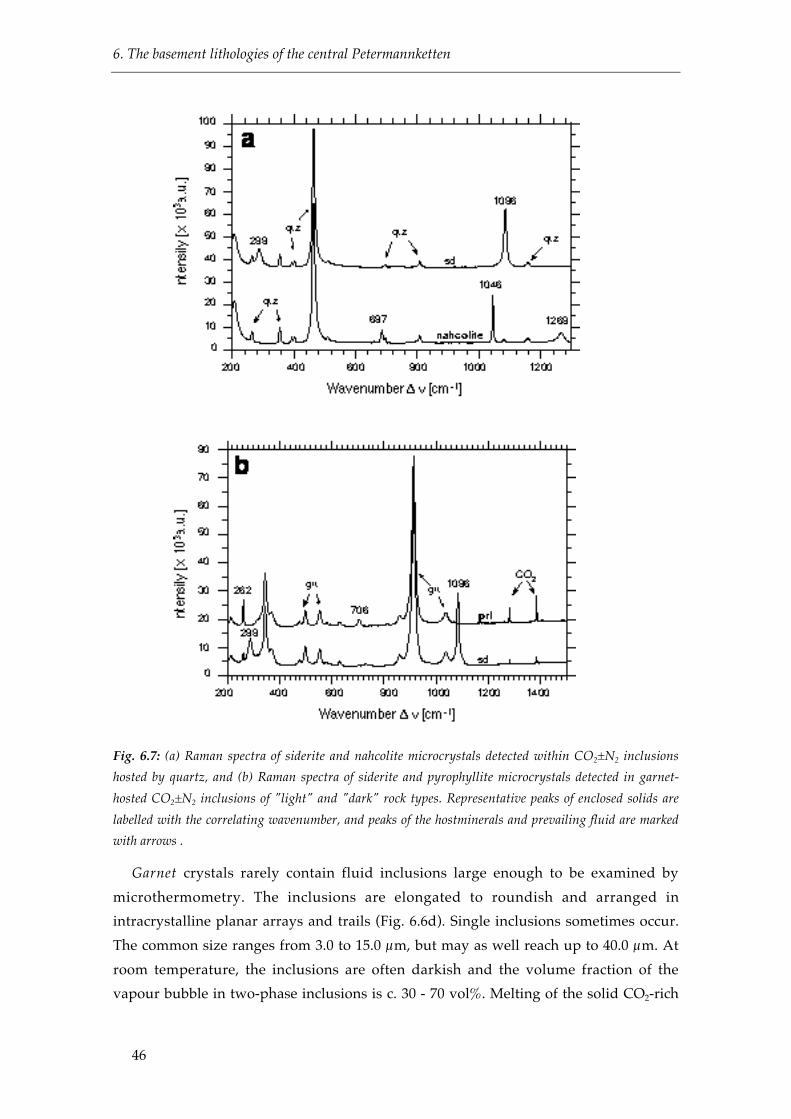
6. The basement lithologies of the central Petermannketten
46
Fig. 6.7: (a) Raman spectra of siderite and nahcolite microcrystals detected within CO2±N2 inclusions
hosted by quartz, and (b) Raman spectra of siderite and pyrophyllite microcrystals detected in garnet-
hosted CO2±N2 inclusions of "light" and "dark" rock types. Representative peaks of enclosed solids are
labelled with the correlating wavenumber, and peaks of the hostminerals and prevailing fluid are marked
with arrows .
Garnet crystals rarely contain fluid inclusions large enough to be examined by
microthermometry. The inclusions are elongated to roundish and arranged in
intracrystalline planar arrays and trails (Fig. 6.6d). Single inclusions sometimes occur.
The common size ranges from 3.0 to 15.0 µm, but may as well reach up to 40.0 µm. At
room temperature, the inclusions are often darkish and the volume fraction of the
vapour bubble in two-phase inclusions is c. 30 - 70 vol%. Melting of the solid CO2-rich

6. The basement lithologies of the central Petermannketten
47
phase occurs at -57.2 to -56.6 °C in inclusions found in light coloured gneisses and
between -58.7 and -57. 2 °C in dark basement rocks. Homogenisation is always into the
liquid phase at temperatures ranging from 24.8 to 26.9 °C and 8.8 to 22.4°C in light and
dark rock types, respectively (Fig. 6.5b). The amount of nitrogen detected by Raman
spectrometry does not exceed 7 mol% in inclusions found in the light rocks, whereas
graphically estimated amounts in dark gneiss (sample no. 1562) reach as high as 21
mol%. Microcrystals enclosed in these inclusions (Fig. 6.6d) were identified as being
either calcite, siderite, Ca/Mg-calcite, pyrophyllite or paragonite/muscovite in varying
volume fractions and combinations (Fig. 6.7b).
H2O-salt- bearing inclusions
Quartz is the only mineral that contains a low saline aqueous fluid. This type of fluid
inclusions is rare, but more abundant in the light rock varieties. Inclusion shape is
mostly irregular and elongated and rounded inclusions rarely occur (Fig. 6.6e).
Inclusions are arranged on intracrystalline planes and trails, but single inclusions can
be detected as well. Inclusion size ranges from 3.0 to 40.0 µm and 6.0 to 45.0 µm in light
and dark rocks, respectively. At room temperature, the inclusions contain a liquid and
a vapour phase, the latter occupying about 5 to 50 vol% of the total fill. After
supercooling to -120°C, melting of the solid aqueous phase during reheating to room
temperature occurs at minimum temperature of -3.5 °C in light rocks and -2.0 °C in
dark samples (Fig. 6.8a, b). The melting temperatures correspond to a salinity of 5.71
and 3.34 wt% NaCleq, respectively. Eutectic melting was only hardly visible in all
inclusions under investigation, and thus appropriate data are scarce. In darkish rocks,
eutectic melting was observed at -35.5 and -31.2 °C which hints at H2O-NaCl-MgCl2 as
being the actual salt system. In light rock varieties, eutectic melting was observed at -
29.3, -26.4, and -21.1 °C, of which the latter clearly indicates the presence of NaCl in
solution.
Homogenisation usually occurred into the liquid phase, with Th ranging between
127.9 °C and 370.2 °C in light rocks and 140.0 to 363.0 °C in darkish samples (Fig. 6.8a,
b). A few inclusions decrepitated before fluid homogenisation. Densities calculated
from homogenisation temperatures vary between 0.51 and 0.96 gcm-3 (light rocks) and
0.52 and 0.94 gcm-3 (dark rocks), indicating a molar volume of 35.87 and 19.05 cm3mol-1
and 34.59 and 19.27 cm3mol-1, respectively. Aqueous inclusions were inspected for
traces of gaseous components like CO2, N2 or CH4 with Raman spectrometry, but no
indications of any of these gases were found. Small birefringent crystals enclosed in
quartz hosted aqueous inclusions of the light rock types were identified as siderite.
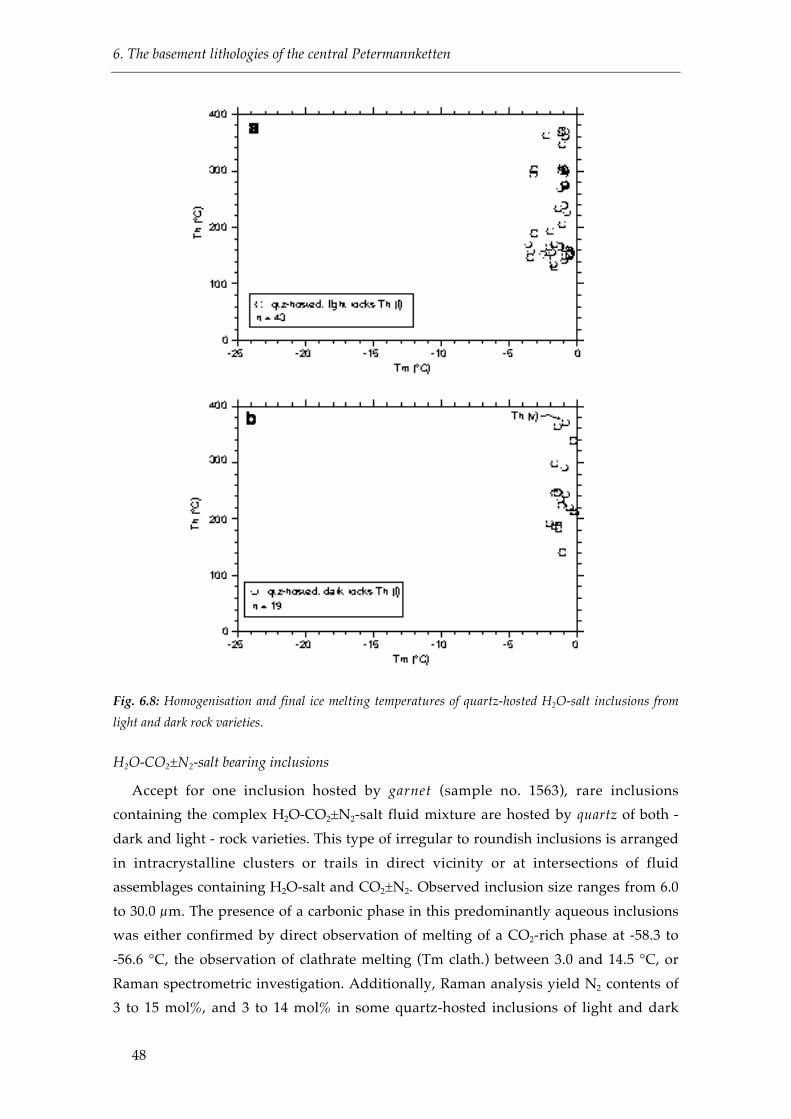
6. The basement lithologies of the central Petermannketten
48
Fig. 6.8: Homogenisation and final ice melting temperatures of quartz-hosted H2O-salt inclusions from
light and dark rock varieties.
H2O-CO2±N2-salt bearing inclusions
Accept for one inclusion hosted by garnet (sample no. 1563), rare inclusions
containing the complex H2O-CO2±N2-salt fluid mixture are hosted by quartz of both -
dark and light - rock varieties. This type of irregular to roundish inclusions is arranged
in intracrystalline clusters or trails in direct vicinity or at intersections of fluid
assemblages containing H2O-salt and CO2±N2. Observed inclusion size ranges from 6.0
to 30.0 µm. The presence of a carbonic phase in this predominantly aqueous inclusions
was either confirmed by direct observation of melting of a CO2-rich phase at -58.3 to
-56.6 °C, the observation of clathrate melting (Tm clath.) between 3.0 and 14.5 °C, or
Raman spectrometric investigation. Additionally, Raman analysis yield N2 contents of
3 to 15 mol%, and 3 to 14 mol% in some quartz-hosted inclusions of light and dark

6. The basement lithologies of the central Petermannketten
49
rocks, respectively. Total homogenisation of the enclosed fluid phase was rarely
observed at 147.7 to 382.0 °C, and decrepitation of these inclusions was common. The
salinity of the aqueous phase was calculated from clathrate melting temperatures to
vary between 0.87 and 6.74 wt% NaCleq. Bulk fluid properties were calculated for
those inclusions, where homogenisation of the carbonic phase occurred after final
clathrate melting and densities range between 0.73 and 0.98 gcm-1 in light rocks and
0.52 and 0.98 gcm-3 in dark rocks. An additional characteristic feature of this inclusion
type is the presence of birefringent microcrystals, which occur in uniform volume
fraction and were identified as nahcolite by Raman spectrometry. These nahcolite
crystals dissolved during heating until homogenisation temperature was reached (Fig.
6.6f), and are thus interpreted to be real daughter minerals.
6.1.4. Mineral chemistry of feldspars, pyroxenes and garnets of samples no. 1562,
1563, 2168, 2169, and 2181
The chemical compositions of individual feldspars, orthopyroxenes and garnets of
some "light" and "dark" samples were calculated from Electron Microprobe analyses.
A selection of the results of feldspar analyses and endmember calculations from the
basement rocks are illustrated in Fig. 6.9. The variation in the plagioclase and K-
feldspar composition of all samples, and within single samples is small. It ranges
between An63Ab36Or1 and An71Ab28Or1 for plagioclases, and between An19.5Ab0.5Or80 and
An8Ab0Or92 for K-feldspars. Additionally, no significant differences in feldspar
compositions of dark and light rock types can be detected (cf. samples no. 1562 and
1563, Fig. 6.9). The sometimes assumed iron incorporation into feldspars during the
formation of charnockitic rocks, which is thought to be responsible for the greenish
colouring, was not be approved.
The only data on pyroxene chemistry are available from sample no. 2169. The
graphic representation of the orthopyroxene compositions in the Di-Hd-En-Fs
quadrilateral shows a range of En20Fs72Wo2 to En28Fs80Wo4. Thus orthopyroxenes are
labelled as ferrosilites according to the approved classification scheme of Morimoto
(1998).
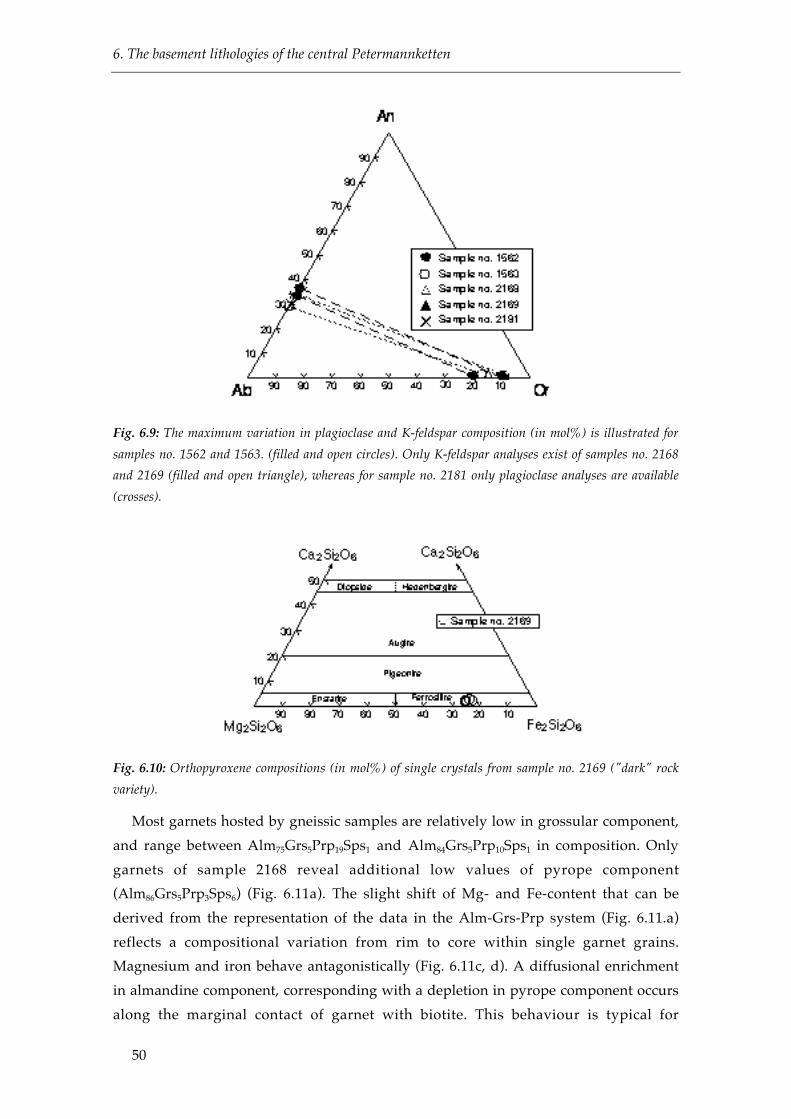
6. The basement lithologies of the central Petermannketten
50
Fig. 6.9: The maximum variation in plagioclase and K-feldspar composition (in mol%) is illustrated for
samples no. 1562 and 1563. (filled and open circles). Only K-feldspar analyses exist of samples no. 2168
and 2169 (filled and open triangle), whereas for sample no. 2181 only plagioclase analyses are available
(crosses).
Fig. 6.10: Orthopyroxene compositions (in mol%) of single crystals from sample no. 2169 ("dark" rock
variety).
Most garnets hosted by gneissic samples are relatively low in grossular component,
and range between Alm75Grs5Prp19Sps1 and Alm84Grs5Prp10Sps1 in composition. Only
garnets of sample 2168 reveal additional low values of pyrope component
(Alm86Grs5Prp3Sps6) (Fig. 6.11a). The slight shift of Mg- and Fe-content that can be
derived from the representation of the data in the Alm-Grs-Prp system (Fig. 6.11.a)
reflects a compositional variation from rim to core within single garnet grains.
Magnesium and iron behave antagonistically (Fig. 6.11c, d). A diffusional enrichment
in almandine component, corresponding with a depletion in pyrope component occurs
along the marginal contact of garnet with biotite. This behaviour is typical for

6. The basement lithologies of the central Petermannketten
51
retrograde reequilibration processes. The detailed analyses ("XMaps") also exhibit a
growth zonation of garnet with enrichment of the grossular component in the crystal
core (Fig. 6.11b). The decrease of calcium from the core to the rim, connected with a
nearly constant magnesium content (Fig. 6.11d) hints at a retrograde path influenced
by isothermic decompression (Martignole & Nantel, 1982). An exhumation model
related to this type of isothermic unloading can be explained with an uplift subsequent
to magmatic underplating in continent/continent collision zones. A similar model has
already been stated for the Shackleton Range (Olesch, 1991).
Fig. 6.11: Composition of garnets hosted by grt-gneisses from central Petermannketten plottet in the
Alm-Grs-Sps-triangle, and element distribution maps (Fe, Mg and Ca) of one garnet from sample no.
1562.
6. The basement lithologies of the central Petermannketten
52
6.2. Syn- and postkinematic intrusions
6.2.1. Petrography (thinsections no. 1533, 1549, 2175)
Samples described in the following paragraph are representatives of syn- and
postmetamorphic plutonic bodies that intruded into the basement lithologies (see
chapter 5.2).
Macroscopically, the light-grey alkali-feldspar syenite and quartz-alkali-feldspar
syenite (samples no. 2175 and 1549) are coarse grained, seriate to inequigranular with
granitic-type texture. Euhedral K-feldspar phenocrysts may reach up to c. 20.0 mm in
size. Major and minor mineral components are K-feldspar, plagioclase, quartz, biotite,
and green hornblende. Accessory phases include muscovite, black and dark red
opaque phases, apatite, zircon, rutile and titanite.
Microscopically, grain size of euhedral to subhedral K-feldspar ranges between c. 0.1
and 20.0 mm. Some crystals display perthitic unmixing, and microcline phenocrysts
show twinning after Carlsbad twin law. Fractured crystals may be altered to sericite
and calcite along fissures. K-feldspar is often invaded by myrmekite, and contains solid
inclusions of quartz, biotite, hornblende, apatite, plagioclase and/or opaque phases.
Euhedral to anhedral plagioclase varies between c. 0.08 to 4.0 mm in size. Fine
polysynthetic twinning after albite and pericline twin law is common and myrmekitic
intergrowth with quartz occurs. Growth lines and pervasive sericitisation restricted to
crystal cores indicate magmatic zoning. Additional sericitisation has developed along
intracrystalline fractures.
Anhedral quartz varies from 0.1 to 6.0 mm in size and fills interstices between
subhedral feldspars. It displays fissures, undulous extinction, subgrains and is
vermicularly intergrown with, or included in, K-feldspar or biotite.
The common grain size of subhedral biotite crystals is c. 0.4 to 2.4 mm and
pleochroitic colouring changes from yellowish to dark brown. Mineral phases
overgrown by single biotite crystals are apatite, quartz, opaque phase and zircon, the
latter being surrounded by black pleochroitic halos. Crystal margins show
opacitisation and some grains are intergrown with either green hornblende or quartz.
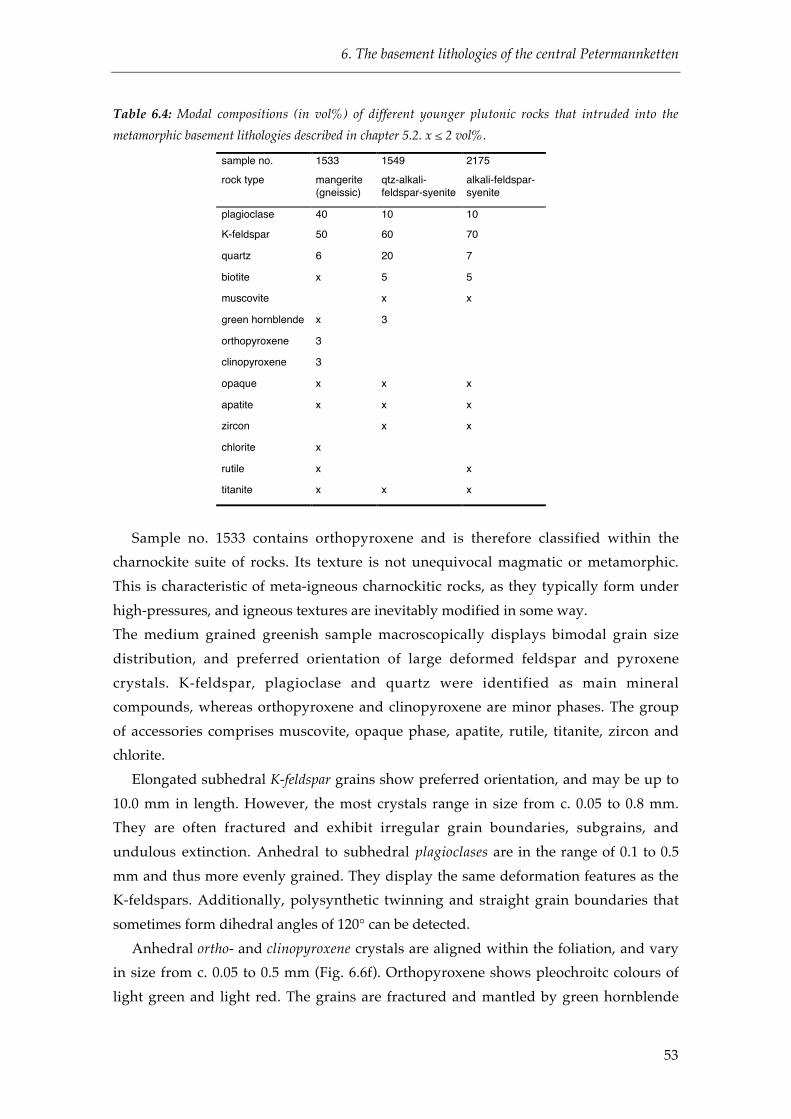
6. The basement lithologies of the central Petermannketten
53
Table 6.4: Modal compositions (in vol%) of different younger plutonic rocks that intruded into the
metamorphic basement lithologies described in chapter 5.2. x ≤ 2 vol%.
sample no. 1533 1549 2175
rock type mangerite(gneissic)
qtz-alkali-feldspar-syenite
alkali-feldspar-syenite
plagioclase 40 10 10
K-feldspar 50 60 70
quartz 6 20 7
biotite x 5 5
muscovite x x
green hornblende x 3
orthopyroxene 3
clinopyroxene 3
opaque x x x
apatite x x x
zircon x x
chlorite x
rutile x x
titanite x x x
Sample no. 1533 contains orthopyroxene and is therefore classified within the
charnockite suite of rocks. Its texture is not unequivocal magmatic or metamorphic.
This is characteristic of meta-igneous charnockitic rocks, as they typically form under
high-pressures, and igneous textures are inevitably modified in some way.
The medium grained greenish sample macroscopically displays bimodal grain size
distribution, and preferred orientation of large deformed feldspar and pyroxene
crystals. K-feldspar, plagioclase and quartz were identified as main mineral
compounds, whereas orthopyroxene and clinopyroxene are minor phases. The group
of accessories comprises muscovite, opaque phase, apatite, rutile, titanite, zircon and
chlorite.
Elongated subhedral K-feldspar grains show preferred orientation, and may be up to
10.0 mm in length. However, the most crystals range in size from c. 0.05 to 0.8 mm.
They are often fractured and exhibit irregular grain boundaries, subgrains, and
undulous extinction. Anhedral to subhedral plagioclases are in the range of 0.1 to 0.5
mm and thus more evenly grained. They display the same deformation features as the
K-feldspars. Additionally, polysynthetic twinning and straight grain boundaries that
sometimes form dihedral angles of 120° can be detected.
Anhedral ortho- and clinopyroxene crystals are aligned within the foliation, and vary
in size from c. 0.05 to 0.5 mm (Fig. 6.6f). Orthopyroxene shows pleochroitc colours of
light green and light red. The grains are fractured and mantled by green hornblende

6. The basement lithologies of the central Petermannketten
54
and biotite. The latter also occurs as fracture-filling. Clinopyroxene reveals light green
colours and very weak pleochroism. Fracturing and mantling by hornblende or biotite
are less strongly developed.
Quartz nearly exclusively occurs as myrmekitic intergrowth with plagioclase in K-
feldspar.
6.2.2. Fluid inclusion studies (thicksections no. 1533 & 2175)
The only type of fluid inclusions detected in the mangerite sample no. 1533 contains
pure CO2 and is hosted by plagioclase. The inclusions uniformly reveal negative crystal
shapes and sizes ranging between 6.0 and 15.0 µm. They are arranged on
intracrystalline clusters and trails and the volume fraction of the vapour bubble present
at room temperature is 40 to 50 vol%. Melting of the solid carbonic phase consistently
appears at -56.6 °C and homogenisation into the liquid phase occurs between 16.9 and
26.6 °C (Fig. 6.12). Calculated densities lie in the range of 0.68 to 0.80 gcm-3.
The majority of fluid inclusions observed in quartzes of the syenite intrusion (sample
no. 2175) are arranged on intracrystalline planar arrays and trails, and are characterised
by nearly perfect negative crystal shape with sizes that range between 3.0 and 60.0 µm.
A subordinate number of inclusions reveal similar arrangement but irregular and
elongated forms. During microthermometry measurements, the only phase transitions
observed were melting of a pure carbonic phase at c. -56.6 °C, and homogenisation of
this fluid at temperatures between 16.3 and 28.4 °C (Fig. 6.12). In inclusions with
negative crystal shape, homogenisation occurs into the liquid phase. Irregular
inclusions generally display critical behaviour or homogenisation into the vapour
phase. Investigation with Raman spectrometry has proved though, that the fluid also
contains small amounts of H2O, and minor amounts of N2. Solid phases enclosed were
identified as being accidentally trapped crystals of calcite, rutile and opaque phases.
Densities calculated for this inclusions range between 0.21 to 0.81 gcm-3. Bulk fluid
properties of inclusions that had been proved to contain H2O were calculated taking
into account a maximum value of 15 vol% "hidden" H2O (cf. Roedder, 1984). The
resulting densities are in a similar range of 0.40 and 0.84 gcm-3.

6. The basement lithologies of the central Petermannketten
55
Feldspar crystals rarely contain single, dark fluid inclusions with highly irregular to
negative crystal shapes. Melting temperatures of -56.6 °C indicate the presence of a
pure carbonic phase, which was confirmed by Raman spectrometry. Homogenisation
of these inclusions was at 27.9 and 28.5 °C into the liquid phase, which corresponds to
calculated densities of 0.64 and 0.66 gcm-3 (68.42 and 66.92 cm3mol-1).
Fig. 6.12: Homogenisation and melting temperatures of the carbonic phase of quartz and plagioclase
hosted inclusions of the syenite and plagioclase-hosted inclusions of the mangerite samples.
6.3. Summary and Discussion - metamorphic charnockitisation and
successive leaching
The most dominant metamorphic features present in the basement lithologies of
cDML today can most probably be traced back to the broader "Pan-African" event
caused by the collision of East and West Gondwana (M2 & M3; cf. chapter 5). High-
pressure granulite facies conditions (6.8±0.5 kbar, 830±20 °C) have been suggested for
the first stage of Pan African metamorphism (Pan African I, M2), followed by a low-
pressure granulitic event (Pan African II, M3; 4-5 kbar, 640±10 °C), and amphibolite
facies retrogression (cf. chapter 5).
In progressive metamorphism the transition from amphibolite to garnulite facies is
marked by a replacement of hydrous phases (e.g. biotite reacts to form orthopyroxene
and K-feldspar plus water) and expulsion of the resulting aqueous phase. Dehydration
processes and the presence of a fluid regime largely controlled by the absence of high
water activities have been stated to be responsible for in situ charnockitisation (cf.
chapter 2).
Massive and migmatitic gneisses of the metamorphic basement lithologies that crop

6. The basement lithologies of the central Petermannketten
56
out in the central Petermannketten, cDML, show a patchy, non-pervasive greenish hue,
sometimes associated with grain coarsening. The darkish lithologies are in turn
crisscrossed by a fracture- and foliation controlled network of light coloured rocks
(Fig.!5.3). The field hypothesis that the darkish colouring is linked to metamorphic
charnockite formation, and that these charnockitic rocks were again subjected to
leaching processes, has been verified by thorough petrographic studies.
The presence of orthopyroxene is crucial for a classification within the charnockite-
anorthosite suite of rocks (cf. chapter 2), and the majority of "darkish" samples does
indeed contain orthopyroxene (identified as being ferrosilite in sample 2169). Two of
the samples displaying the conspicuous colour, and some of the light rock varieties
contain a yellowish relictic phase that has also been found in conjunction with
commencing orthopyroxene alteration (Fig. 6.1e,f; 6.3e). Hence it is concluded that the
samples which at presence give evidence of the relictic phase did also contain
orthopyroxene at some stage of their geological evolution. This implies that the
formation of the charnockitic mineral assemblage in paragneiss was followed by
processes that resulted in partial to complete orthopyroxene breakdown, locally
accompanied by thorough leaching of the previously greenish rocks. In light-grey
rocks that do not contain a relictic phase leaching processes may either have been more
severe, or orthopyroxene did not form during granulitic metamorphism.
Retrograde destabilisation of the anhydrous phase assemblage is indicated by
orthopyroxene alteration to form amphibole, biotite and garnet. The secondary biotite
variation displays a distinct fringy appearance and vermicular intergrowth with
quartz. Detailed microprobe analyses have revealed that single garnet crystals exhibit
zonation characteristic of retrograde reequilibration processes, presumably connected
to a phase of isothermal decompression (cf. chapter 3.2.1).
Besides the presence or absence of orthopyroxene, no further conspicuous difference
in mineralogical composition of charnockitic and gneissic samples do occur.
Furthermore, no valuable correlation can be drawn between the modal composition
and the state of alteration in light and dark rocks (Table 6.2 & 6.3). Light samples reveal
slightly stronger feldspar alteration to calcite and sericite than the darkish rocks, but
the overall distribution of phases indicative for retrograde reaction (biotite,
hornblende) can not be stated to be more abundant in the light rocks.
The observed retrograde mineral assemblage, locally restricted migmatitisation and
the structurally controlled leaching, give clear evidence of the presence of an free
aqueous phase during retrogression. For peak metamorphic conditions Colombo &
Talarico (in press) on the base of mineral equilibria studies suggest that metamorphism
was largely controlled by very low water activities.

6. The basement lithologies of the central Petermannketten
57
Fluid inclusion studies have shown, that the majority of inclusions hosted by either
quartz, plagioclase or garnet displayed phase transitions characteristic of a CO2±N2
("dry") fluid. The most CO2±N2 inclusions suitable for microthermometry
investigations were detected in quartz. All inclusions are arranged on intracrystalline
trails or planes and thus textural evidence of early metamorphic (primary) origin is
given. Carbonic inclusions from all host minerals predominantly exhibit roundish or
negative crystal shapes indicating post-entrapment modification influenced by
reequilibration processes. Some inclusions also contain microsolids identified as
carbonates or sheet silicates. If detected in plagioclase-hosted inclusions, they most
probably result from chemical interactions of the fluid with the surrounding mineral
under consumption of the aqueous phase (cf. chapter 8). Nahcolite crystals in quartz,
may either be an accidentally trapped phase or a real daughter phase of an H2O-
CO2±N2-salt fluid, whose aqueous phase proportion has been lost during
reequilibration (see below). The nitrogen content is generally in the range of 2 - 5
mol%. Taken all together, light rocks display a slight tendency towards lower N2
contents, whereas darkish rocks show a larger variation of N2 composition, especially
in garnet and plagioclase hosted inclusions (Fig. 6.5a,b). All homogenisation
temperatures plot in a narrow range between 7.5 and 30.7 °C. Homogenisation into the
vapour phase only occurs in quartz hosted inclusions, and was less frequently
observed in charnockitic samples (Fig. 6.13). Corresponding densities are
homogeneous as well. In quartz-hosted inclusions (Th(l) or Th(v)) they lie between 0.17
to 0.84 gcm-3. When hosted by plagioclase they are in a range from 0.47 to 0.83 gcm-3,
and densities of garnet-hosted inclusions vary from 0.44 to 0.75 gcm-3.
Fig. 6. 13: All homogenisation temperatures measured in CO2-N2 inclusions hosted by quartz, garnet and
plagioclase of light and darkish samples.

6. The basement lithologies of the central Petermannketten
58
A closer look at the available density values (and isochores, Fig. 6.16) reveals that
high densities (≥ 1 gcm-3) as expected to result from granulite facies metamorphism
have not been preserved during the retrograde stage. Even inclusions hosted by
mechanically stable garnet do not reflect peak metamorphic conditions and the overall
observation can be best explained with a modification of inclusions after their
entrapment, resulting in fluid loss and/or volume change. A diagram depicting the
relationship between inclusion size and homogenisation temperature (independent
from the host mineral) reveals that no correlation exists between homogenisation
temperatures and inclusion size. A positive correlation would in general indicate
preferential decrepitation of larger inclusions due to internal overpressure and fluid
loss. The even scatter of Th and inclusion size between 10 and 30°C and 5.0 to 20 µm
(Fig 6.14.), though supports the earlier presumption that post-entrapment change was
largely controlled by ductile deformation processes.
Fig. 6.14: Relationship between homogenisation temperatures and inclusion size of CO2±N2 inclusions.
Irregular to roundish H2O-salt inclusions are only found in quartz and their textural
arrangement on intracrystalline clusters and trails also implies early metamorphic
(primary) formation. A comparison of aqueous inclusions detected in dark and light
rock varieties shows that the inclusions do not differ with regard to their final ice
melting temperatures, i.e. their salt content (max 5.71 wt% NaCleq), nor to their wide
spread of Th. Density calculations exhibit the same similarity, as they vary between
0.54 and 0.96 gcm-3 in light rocks, and 0.52 and 0.94 gcm-3 in darkish samples. As in the
CO2-N2 inclusions, a correlation of Th with inclusion sizes reveals a random
distribution of depicted values (Fig. 6.15).

6. The basement lithologies of the central Petermannketten
59
Fig. 6.16 Correlation of inclusion size and homogenisation temperatures of quartz-hosted H2O-salt
inclusions from dark and light rock varieties.
The origin and coexistence of aqueous and carbonic inclusions in granulite facies
rocks has been described in earlier studies. For metasedimentary lithologies Touret
(1995) states the prevalence of a prograde fluid of aqueous composition, which is
essentially found as remnant of early brines with modified salinities and densities. At
peak metamorphic granulite facies conditions, the influence of carbonic fluids becomes
more important. Possible origins of the CO2-dominated fluid regime include
metamorphic reactions in carbonatic sediments, selective H2O dissolution in silica
melts, or the influx of magmatic CO2 transported by deep-seated intrusions.
The third type of H2O-CO2±N2-salt inclusions has rarely been detected in quartz of
dark and light rocks, and only once hosted by garnet of a light coloured gneiss.
Texturally they reveal the same primary (metamorphic) character as do the CO2±N2
and H2O-salt inclusions. Their rare occurrence and close spatial relationship to
inclusions of the aqueous and carbonic type implies, that they most probably formed
by fluid mixing during mineral reequilibration/recrystallisation. Previously formed
inclusions might e.g., be tapped and a homogeneous or heterogeneous fluid mixture
may be resealed in a newly formed inclusion. That nahcolite formed as a real daughter
phase (Fig. 6.6f) has important constraints on the nature of the aqueous phase present
in these inclusions. Andersen et al. (1989) have suggested that nahcolite precipitates as
real daughter mineral from a concentrated, highly alkaline aqueous inclusion with a
high HCO3- content or an excess of CO2. Even though the salinities of H2O-salt
inclusions and of H2O-CO2±N2-salt inclusions do not exceed maximum values of 6.74
wt% NaCleq, these rare findings suggest that high alkaline brines have at least locally
occurred. This again is in accordance with recent studies on granulitic metamorphism

6. The basement lithologies of the central Petermannketten
60
that stress the importance of alkali-mobility and the role of highly saline fluid phases
("brines") during charnockitisation processes (cf. chapter 2).
None of the investigated samples shows any evidence of a late fluid phase
responsible for the fracture and foliation controlled leaching. The presumably aqueous
fluid seems to have been completely consumed during retrograde mineral reactions
(e.g., resulting in sericitisation of plagioclase). Thus no further conclusions on the
nature of the leaching fluid can be drawn. The actual fluid content of post-tectonic
syenite and mangerite intrusions, which possibly might have been accompanied by
large scale fluid infiltration, does not allow detailed implications as well, although it
has been proved that some of the generally CO2-dominated inclusions do contain a
maximum of 10 vol% H2O.
The thorough influence of reequilibration processes that acted on the metamorphic
fluid inclusions is also reflected by the position of isochores calculated from inclusion
densities. Independent of fluid content, rock type (light or dark) or host mineral, none
of the analysed inclusions reflects densities that could be correlated with the Pan-
African event.
Fig. 6.16: P-T diagram with isochores of minimum and maximum density values of H2O-salt (grey lines
with numbers indicating densities) and CO2±N2 (black lines) inclusions. Solid lines depict inclusions
hosted by dark rocks and dashed lines those measured in light rocks. The nature of the host mineral and
densities in gcm-3 are indicated in the legend in the same order as the isochores. M2, M3, M4 and grey
boxes depict P-T constraints on Pan African I and II (Pan1, Pan2) metamorphism according to Markl &
Piazolo (1998). Two possible P-T paths (A, B) resulting from correlation of fluid data with M4 conditions
are indicated. See text for explanation.
6. The basement lithologies of the central Petermannketten
61
All inclusions reequilibrated under retrograde conditions and highest density
isochores intersect independently estimated M4 conditions at the low pressure range
(c. 2.5 kbar, 550 °C). Maximum densities of aqueous inclusions hosted by quartz could
be explained with volume loss under preservation of the original fluid content, which
is generally interpreted to indicate a retrogression under isobaric cooling. A resulting
P-T path (B, in Fig. 6.16) though would not be in good agreement with P-T conditions
indicated by the isochores of carbonic inclusions. Minimum and average density
isochores of aqueous inclusions, however, correlate with the gradual decrease in fluid
densities of reequilibrated CO2±N2 inclusions. This indicates that retrogression of the
metamorphic basement lithologies of the central Petermannketten most probably
started with a phase of near isothermal uplift, followed by a stage of gradual cooling
and decompression as depicted by path A in Fig. 6.16.
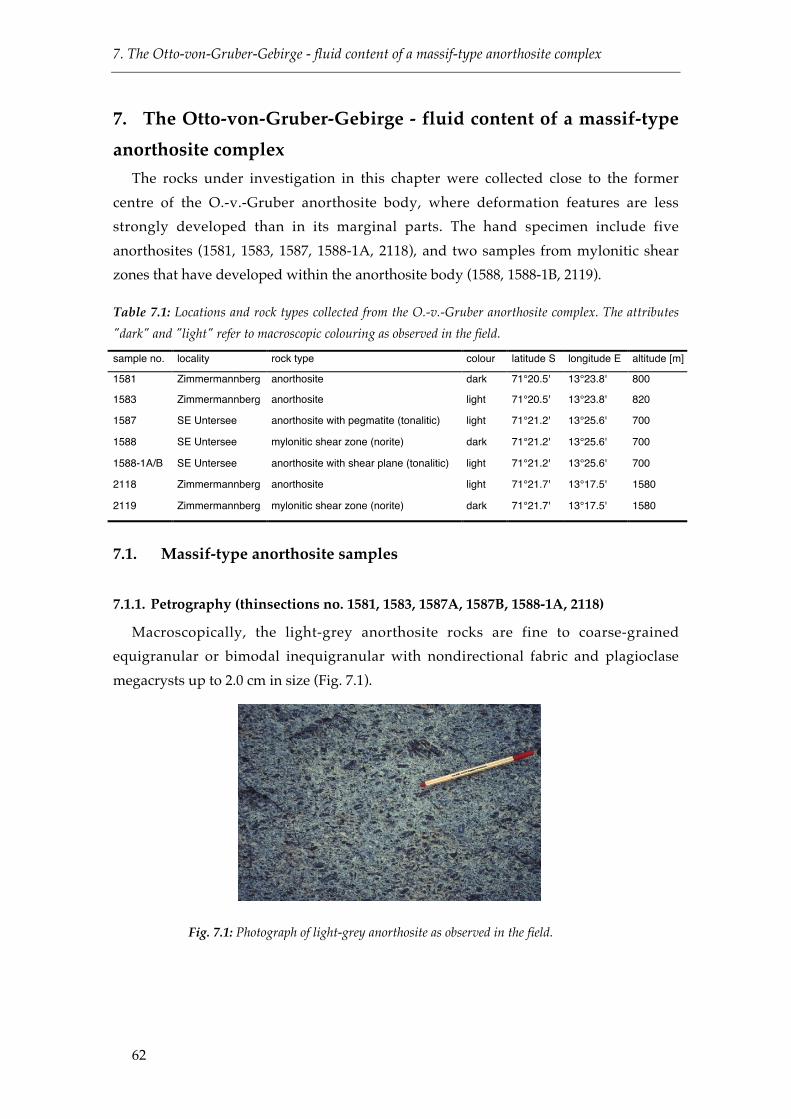
7. The Otto-von-Gruber-Gebirge - fluid content of a massif-type anorthosite complex
62
7. The Otto-von-Gruber-Gebirge - fluid content of a massif-type
anorthosite complex
The rocks under investigation in this chapter were collected close to the former
centre of the O.-v.-Gruber anorthosite body, where deformation features are less
strongly developed than in its marginal parts. The hand specimen include five
anorthosites (1581, 1583, 1587, 1588-1A, 2118), and two samples from mylonitic shear
zones that have developed within the anorthosite body (1588, 1588-1B, 2119).
Table 7.1: Locations and rock types collected from the O.-v.-Gruber anorthosite complex. The attributes
"dark" and "light" refer to macroscopic colouring as observed in the field.
sample no. locality rock type colour latitude S longitude E altitude [m]
1581 Zimmermannberg anorthosite dark 71°20.5' 13°23.8' 800
1583 Zimmermannberg anorthosite light 71°20.5' 13°23.8' 820
1587 SE Untersee anorthosite with pegmatite (tonalitic) light 71°21.2' 13°25.6' 700
1588 SE Untersee mylonitic shear zone (norite) dark 71°21.2' 13°25.6' 700
1588-1A/B SE Untersee anorthosite with shear plane (tonalitic) light 71°21.2' 13°25.6' 700
2118 Zimmermannberg anorthosite light 71°21.7' 13°17.5' 1580
2119 Zimmermannberg mylonitic shear zone (norite) dark 71°21.7' 13°17.5' 1580
7.1. Massif-type anorthosite samples
7.1.1. Petrography (thinsections no. 1581, 1583, 1587A, 1587B, 1588-1A, 2118)
Macroscopically, the light-grey anorthosite rocks are fine to coarse-grained
equigranular or bimodal inequigranular with nondirectional fabric and plagioclase
megacrysts up to 2.0 cm in size (Fig. 7.1).
Fig. 7.1: Photograph of light-grey anorthosite as observed in the field.

7. The Otto-von-Gruber-Gebirge - fluid content of a massif-type anorthosite complex
63
The major constituent of all samples is plagioclase (c. 90 vol%). Minor components
in varying amounts are clinopyroxene and alkali-feldspar (often microcline). Quartz,
biotite, green hornblende, orthopyroxene, chlorite, black and brown to dark red
opaque phases, muscovite/paragonite, zoisite, calcite, apatite, and zircon were
identified as accessory phases (Table 7.2).
Table 7.2: Modal compositions (in vol%) of samples taken from the O.-v.-Gruber anorthosite body x ≤ 2
vol%. (1587A: pegmatite vein in anorthosite, 1587B: anorthosite, 1588-1A: anorthosite around shear
plane).
sample no. 1581 1583 1587A 1587B 1588-1A 2118
rock type anorthosite anorthosite tonaliticpegmatite
anorthosite anorthosite anorthosite
plagioclase 90 90 60 90 90 90
alkali-feldspar 5 3 x 4 3 4
quartz 3 x 37 x x x
biotite x x x x x x
muscovite/paragonite x x x x x
garnet
green hornblende x x x x
orthopyroxene x x x
clinopyroxene x x 3 x
opaque phase x x x x
apatite x x
zircon x x x x
chlorite x x x x x
zoisite x x
calcite x x x x x x
titanite x
rutile
Microscopically, some large (0.8 - 1.5 mm) subhedral to anhedral grains of plagioclase
are slightly flattened and show lattice-preferred orientation, but the general
microfabric is nondirectional. Plagioclase crystals may reveal antiperthitic unmixing,
vermicular intergrowth with quartz and/or moderate alteration to sericite, chlorite,
and calcite. Twinning after albite- and pericline twin law is common (see Fig. 8.3).
Undulous extinction, bent deformation lamellae and subgrain formation give evidence
of intracrystalline deformation and recovery. Occasionally, bulging of grain boundaries
in addition to subgrain rotation led to the formation of aggregates of small (c. 0.2 - 0.5
mm), dynamically recrystallised plagioclase grains alongside the grain boundaries of
larger feldspar crystals (Fig. 7.2e and 8.3b), thus forming “core-and-mantle” structures
(as described by Passchier & Trouw, 1996).
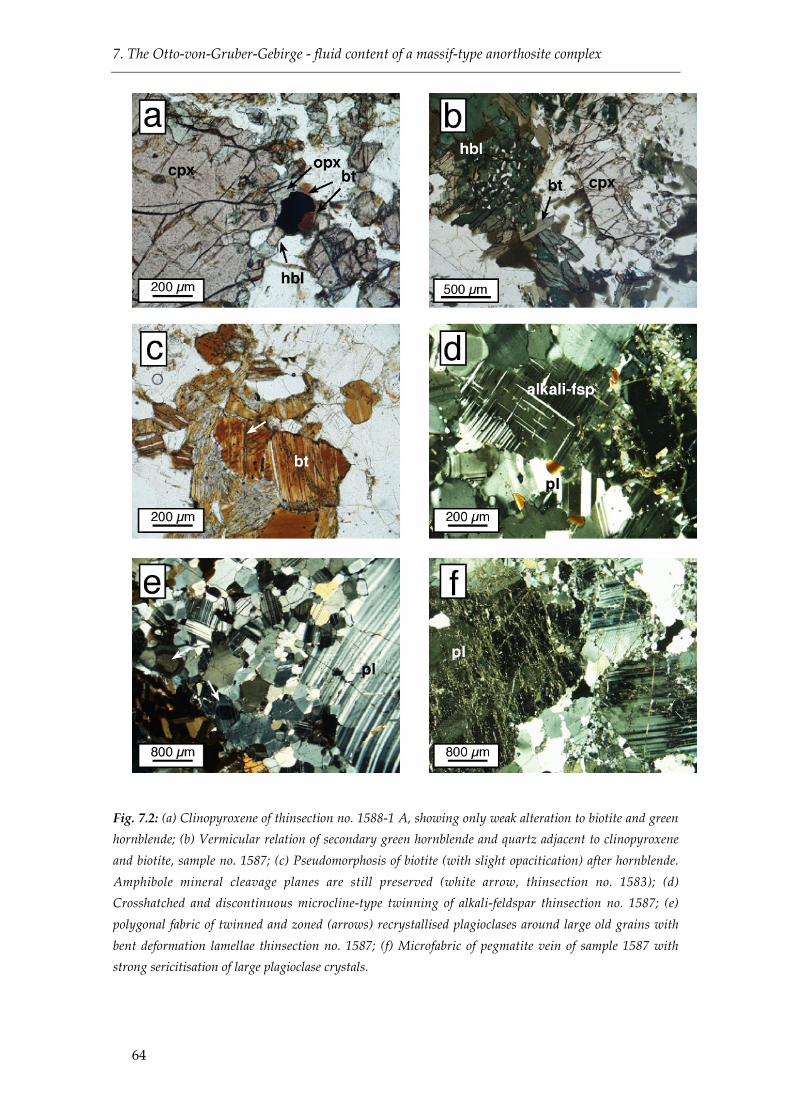
7. The Otto-von-Gruber-Gebirge - fluid content of a massif-type anorthosite complex
64
Fig. 7.2: (a) Clinopyroxene of thinsection no. 1588-1 A, showing only weak alteration to biotite and green
hornblende; (b) Vermicular relation of secondary green hornblende and quartz adjacent to clinopyroxene
and biotite, sample no. 1587; (c) Pseudomorphosis of biotite (with slight opacitication) after hornblende.
Amphibole mineral cleavage planes are still preserved (white arrow, thinsection no. 1583); (d)
Crosshatched and discontinuous microcline-type twinning of alkali-feldspar thinsection no. 1587; (e)
polygonal fabric of twinned and zoned (arrows) recrystallised plagioclases around large old grains with
bent deformation lamellae thinsection no. 1587; (f) Microfabric of pegmatite vein of sample 1587 with
strong sericitisation of large plagioclase crystals.
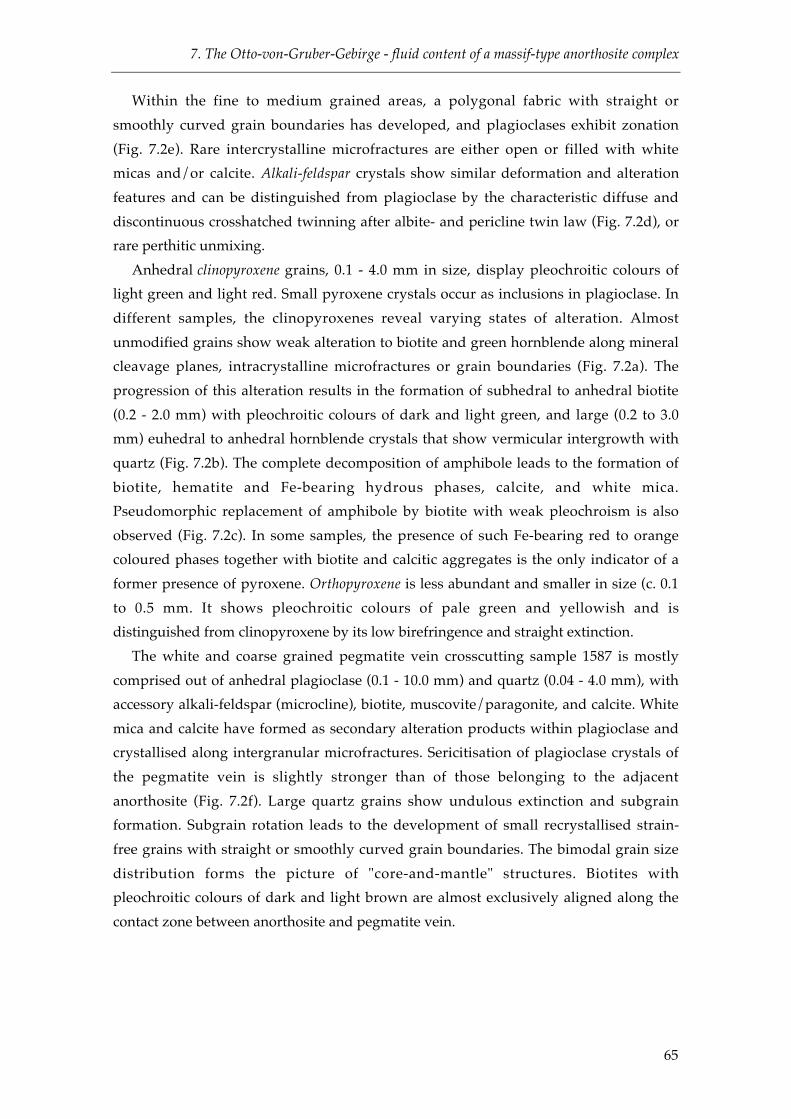
7. The Otto-von-Gruber-Gebirge - fluid content of a massif-type anorthosite complex
65
Within the fine to medium grained areas, a polygonal fabric with straight or
smoothly curved grain boundaries has developed, and plagioclases exhibit zonation
(Fig. 7.2e). Rare intercrystalline microfractures are either open or filled with white
micas and/or calcite. Alkali-feldspar crystals show similar deformation and alteration
features and can be distinguished from plagioclase by the characteristic diffuse and
discontinuous crosshatched twinning after albite- and pericline twin law (Fig. 7.2d), or
rare perthitic unmixing.
Anhedral clinopyroxene grains, 0.1 - 4.0 mm in size, display pleochroitic colours of
light green and light red. Small pyroxene crystals occur as inclusions in plagioclase. In
different samples, the clinopyroxenes reveal varying states of alteration. Almost
unmodified grains show weak alteration to biotite and green hornblende along mineral
cleavage planes, intracrystalline microfractures or grain boundaries (Fig. 7.2a). The
progression of this alteration results in the formation of subhedral to anhedral biotite
(0.2 - 2.0 mm) with pleochroitic colours of dark and light green, and large (0.2 to 3.0
mm) euhedral to anhedral hornblende crystals that show vermicular intergrowth with
quartz (Fig. 7.2b). The complete decomposition of amphibole leads to the formation of
biotite, hematite and Fe-bearing hydrous phases, calcite, and white mica.
Pseudomorphic replacement of amphibole by biotite with weak pleochroism is also
observed (Fig. 7.2c). In some samples, the presence of such Fe-bearing red to orange
coloured phases together with biotite and calcitic aggregates is the only indicator of a
former presence of pyroxene. Orthopyroxene is less abundant and smaller in size (c. 0.1
to 0.5 mm. It shows pleochroitic colours of pale green and yellowish and is
distinguished from clinopyroxene by its low birefringence and straight extinction.
The white and coarse grained pegmatite vein crosscutting sample 1587 is mostly
comprised out of anhedral plagioclase (0.1 - 10.0 mm) and quartz (0.04 - 4.0 mm), with
accessory alkali-feldspar (microcline), biotite, muscovite/paragonite, and calcite. White
mica and calcite have formed as secondary alteration products within plagioclase and
crystallised along intergranular microfractures. Sericitisation of plagioclase crystals of
the pegmatite vein is slightly stronger than of those belonging to the adjacent
anorthosite (Fig. 7.2f). Large quartz grains show undulous extinction and subgrain
formation. Subgrain rotation leads to the development of small recrystallised strain-
free grains with straight or smoothly curved grain boundaries. The bimodal grain size
distribution forms the picture of "core-and-mantle" structures. Biotites with
pleochroitic colours of dark and light brown are almost exclusively aligned along the
contact zone between anorthosite and pegmatite vein.

7. The Otto-von-Gruber-Gebirge - fluid content of a massif-type anorthosite complex
66
Fig. 7.3: Classification of the samples taken from the O.-v.-Gruber anorthosite complex, according to Le
Maitre (1989). Modal compositions of quartz, plagioclase and alkali-feldspar are given in Table 5.2. The
pegmatite vein has tonalitc composition. All other rocks are anorthosites. If the estimated mode % of
quartz was ≤ 2 vol%, the maximum value of 2 vol% was used for the recalculation to total 100%.
Numbers in italics indicate the QAPF field number after Le Maitre (1989).
7.1.2. Fluid inclusion studies (thicksections no. 1583, 1587A, 1587B, 1588-1A, 1588-1B,
2118)
Only one type of fluid inclusions was identified within all anorthosite samples.
They are hosted by plagioclase and range in size between c. 5.0 and 12.0 µm (longest
dimension) (Fig. 7.4a, c). Sizes down to 2.5 µm and up to 65.0 µm were also observed.
Inclusion shapes vary from roundish or oval to negative-crystal shape (Fig. 7.4a and
8.4a) Fluid inclusions lie on intracrystalline planar arrays (Fig. 7.4a) and trails (Fig.
8.4d), thus giving evidence of pseudosecondary origin, as they do not crosscut grain
boundaries. In some crystals, alignment of fluid inclusions along single twin lamellae
was observed (Fig. 8.4c). Rarely, the accumulated appearance of fluid inclusions at the
centre of large feldspar crystals, best visible in sections perpendicular to the c-axes,
give evidence of relictic magmatic growth zonation in plagioclase. Inclusions, are
darkish and either contain a single liquid-like phase or a liquid and a vapour phase at
room temperature. A common feature observed in these inclusions is the occurrence of
varying amounts and ratios of different birefringent microcrystals as enclosed solids
(Fig. 8.4a and 8.4b).
During microtherometry measurements, initially homogeneous inclusions nucleate
a gas bubble at c. 0.0 °C, before supercooling leads to the formation of a solid phase
around –90.0 °C in all inclusions. During the heating cycle, melting of the solid phase
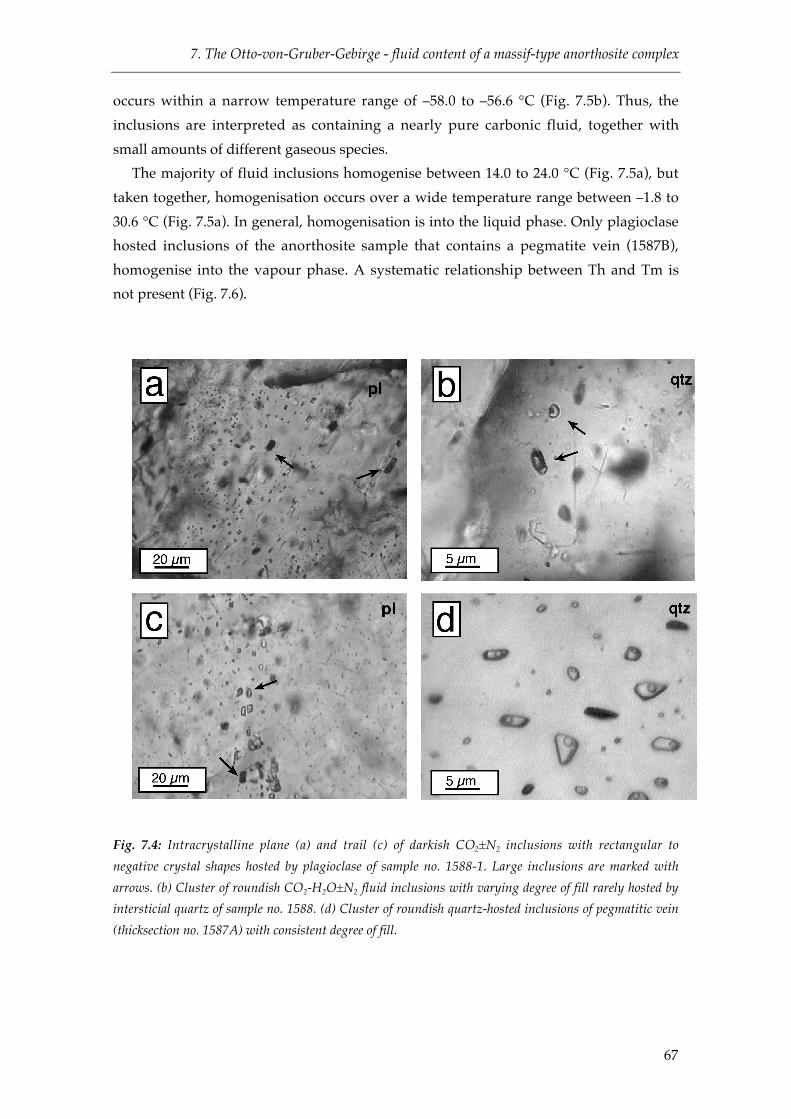
7. The Otto-von-Gruber-Gebirge - fluid content of a massif-type anorthosite complex
67
occurs within a narrow temperature range of –58.0 to –56.6 °C (Fig. 7.5b). Thus, the
inclusions are interpreted as containing a nearly pure carbonic fluid, together with
small amounts of different gaseous species.
The majority of fluid inclusions homogenise between 14.0 to 24.0 °C (Fig. 7.5a), but
taken together, homogenisation occurs over a wide temperature range between –1.8 to
30.6 °C (Fig. 7.5a). In general, homogenisation is into the liquid phase. Only plagioclase
hosted inclusions of the anorthosite sample that contains a pegmatite vein (1587B),
homogenise into the vapour phase. A systematic relationship between Th and Tm is
not present (Fig. 7.6).
Fig. 7.4: Intracrystalline plane (a) and trail (c) of darkish CO2±N2 inclusions with rectangular to
negative crystal shapes hosted by plagioclase of sample no. 1588-1. Large inclusions are marked with
arrows. (b) Cluster of roundish CO2-H2O±N2 fluid inclusions with varying degree of fill rarely hosted by
intersticial quartz of sample no. 1588. (d) Cluster of roundish quartz-hosted inclusions of pegmatitic vein
(thicksection no. 1587A) with consistent degree of fill.
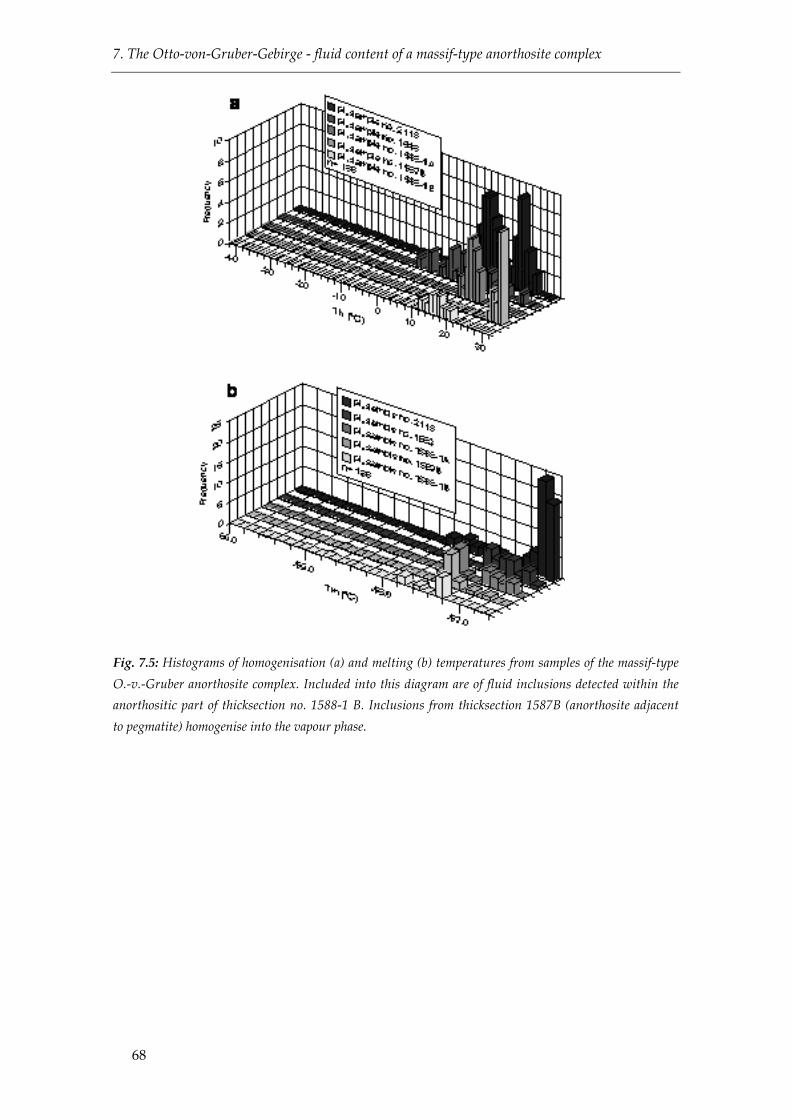
7. The Otto-von-Gruber-Gebirge - fluid content of a massif-type anorthosite complex
68
Fig. 7.5: Histograms of homogenisation (a) and melting (b) temperatures from samples of the massif-type
O.-v.-Gruber anorthosite complex. Included into this diagram are of fluid inclusions detected within the
anorthositic part of thicksection no. 1588-1 B. Inclusions from thicksection 1587B (anorthosite adjacent
to pegmatite) homogenise into the vapour phase.
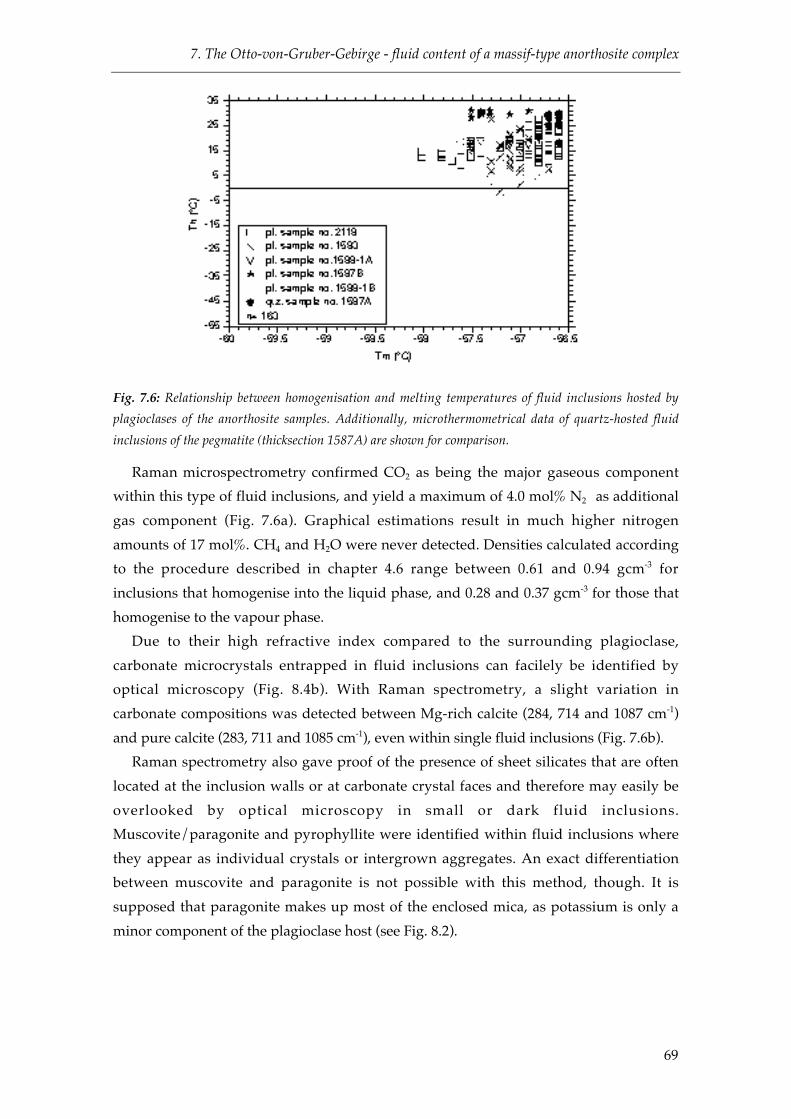
7. The Otto-von-Gruber-Gebirge - fluid content of a massif-type anorthosite complex
69
Fig. 7.6: Relationship between homogenisation and melting temperatures of fluid inclusions hosted by
plagioclases of the anorthosite samples. Additionally, microthermometrical data of quartz-hosted fluid
inclusions of the pegmatite (thicksection 1587A) are shown for comparison.
Raman microspectrometry confirmed CO2 as being the major gaseous component
within this type of fluid inclusions, and yield a maximum of 4.0 mol% N2 as additional
gas component (Fig. 7.6a). Graphical estimations result in much higher nitrogen
amounts of 17 mol%. CH4 and H2O were never detected. Densities calculated according
to the procedure described in chapter 4.6 range between 0.61 and 0.94 gcm-3 for
inclusions that homogenise into the liquid phase, and 0.28 and 0.37 gcm-3 for those that
homogenise to the vapour phase.
Due to their high refractive index compared to the surrounding plagioclase,
carbonate microcrystals entrapped in fluid inclusions can facilely be identified by
optical microscopy (Fig. 8.4b). With Raman spectrometry, a slight variation in
carbonate compositions was detected between Mg-rich calcite (284, 714 and 1087 cm-1)
and pure calcite (283, 711 and 1085 cm-1), even within single fluid inclusions (Fig. 7.6b).
Raman spectrometry also gave proof of the presence of sheet silicates that are often
located at the inclusion walls or at carbonate crystal faces and therefore may easily be
overlooked by optical microscopy in small or dark fluid inclusions.
Muscovite/paragonite and pyrophyllite were identified within fluid inclusions where
they appear as individual crystals or intergrown aggregates. An exact differentiation
between muscovite and paragonite is not possible with this method, though. It is
supposed that paragonite makes up most of the enclosed mica, as potassium is only a
minor component of the plagioclase host (see Fig. 8.2).
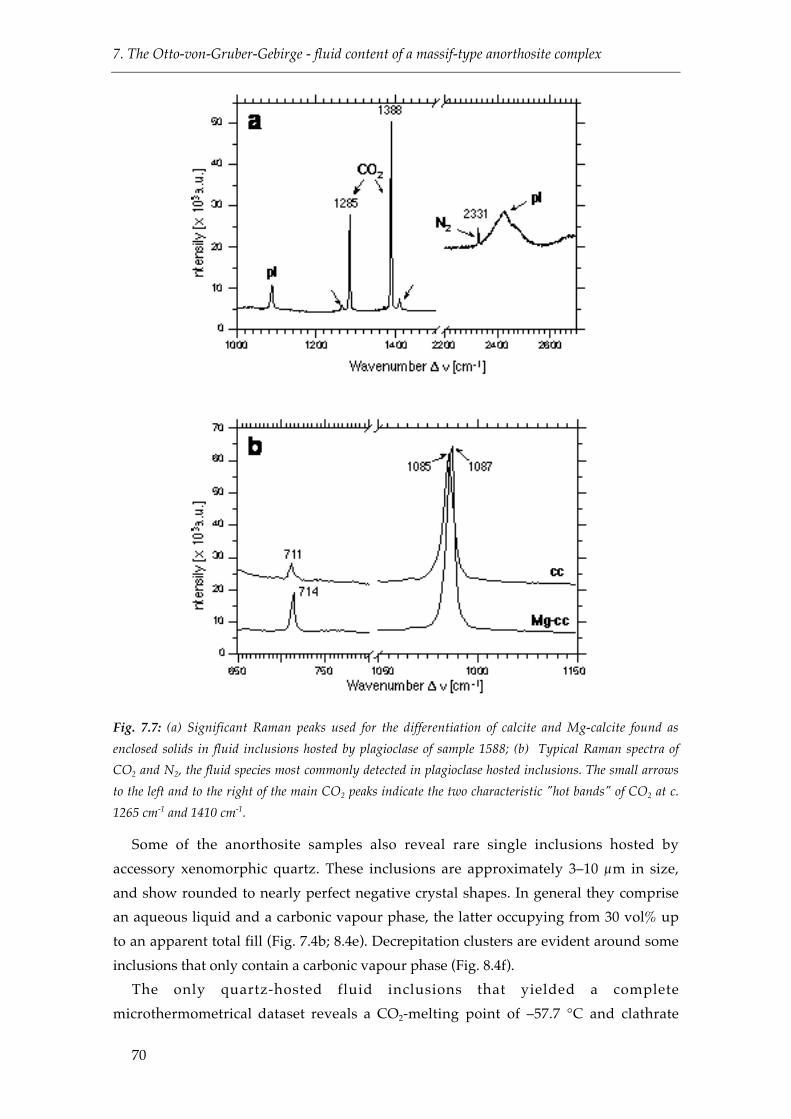
7. The Otto-von-Gruber-Gebirge - fluid content of a massif-type anorthosite complex
70
Fig. 7.7: (a) Significant Raman peaks used for the differentiation of calcite and Mg-calcite found as
enclosed solids in fluid inclusions hosted by plagioclase of sample 1588; (b) Typical Raman spectra of
CO2 and N2, the fluid species most commonly detected in plagioclase hosted inclusions. The small arrows
to the left and to the right of the main CO2 peaks indicate the two characteristic "hot bands" of CO2 at c.
1265 cm-1 and 1410 cm-1.
Some of the anorthosite samples also reveal rare single inclusions hosted by
accessory xenomorphic quartz. These inclusions are approximately 3–10 µm in size,
and show rounded to nearly perfect negative crystal shapes. In general they comprise
an aqueous liquid and a carbonic vapour phase, the latter occupying from 30 vol% up
to an apparent total fill (Fig. 7.4b; 8.4e). Decrepitation clusters are evident around some
inclusions that only contain a carbonic vapour phase (Fig. 8.4f).
The only quartz-hosted fluid inclusions that yielded a complete
microthermometrical dataset reveals a CO2-melting point of –57.7 °C and clathrate

7. The Otto-von-Gruber-Gebirge - fluid content of a massif-type anorthosite complex
71
melting was observed around 7.9 °C in the presence of two CO2-rich phases.
Homogenisation of CO2 occurred at 18.7 °C into the liquid phase. Salinity obtained
from the clathrate melting temperature is equivalent to 4.2 wt% NaCl, and the bulk
fluid density was calculated to 0.88 gcm-3. Analysis with Raman spectrometry gave
proof of the presence of CO2 and small (≤ 2 mol%) amounts of N2. The presence of H2O
was even confirmed in those inclusions that did not reveal a visible aqueous rim.
Entrapped minerals were not detected within these inclusions.
Due to the strong alteration, no fluid inclusions are preserved in plagioclase crystals
of the pegmatite vein of sample 1587 (thinsection 1587A). Quartz crystals contain fluid
inclusions that vary between 3.5 and 14.5 µm in size and show irregular to roundish or
negative crystal shapes (Fig. 7.4d). They are arranged in intracrystalline clusters, and
usually only a single carbonic phase is visible at room temperature. Melting of a solid
phase after supercooling down to -120 °C uniformly occurs at -56.6 or -56.7 °C, which
hints at the presence of a pure carbonic phase (Fig. 7.6). Raman spectrometrical data
verified this interpretation, as no additional gaseous species could be detected by this
method. Homogenisation into the liquid phase consistently occurs between 17.7 and
29.1 °C with emphasis on 25.0 to 29.1 °C (Fig. 7.6). Calculated densities range between
0.63 and 0.80 gcm-3.
7.2. Shear zones within the O.-v.-Gruber anorthosite complex
7.2.1. Petrography (thinsections no. 1588, 1588-1B, 2119)
In the field and in hand specimen, shear zones are characterised by brownish
colouring, a distinct foliation, secondary garnet growth, and lattice-preferred
orientation of the main mineral constituents (Fig. 7.9a, b).
Plagioclase is the dominant mineral phase (c. 60 vol%), but in contrast to the
surrounding anorthosite, these samples contain garnet, orthopyroxene and
clinopyroxene, alkali-feldspar (often microcline), and quartz as minor components.
Green hornblende, biotite, chlorite, black (magnetite) and brown to dark red opaque
phases, muscovite/paragonite, calcite, chlorite, apatite, zircon, titanite and tourmaline
were identified as accessory phases. The shear plane of sample 1588-1 (thinsection
1588-1B) is only one centimetre in width, and modal fractions of the mafic minerals are
increased compared to the shear zones, with the effect that plagioclase is only a
subordinate phase next to garnet, but biotite occurs as a minor phase (Table 7.3).

7. The Otto-von-Gruber-Gebirge - fluid content of a massif-type anorthosite complex
72
Fig. 7.8: Garnet bearing shear zone that has formed within the massif-type O.-v.-Gruber anorthosite
complex showing typical brownish surface colour.
Grain size distribution of the subhedral to anhedral plagioclase crystals is bimodal
inequigranular (0.1 - 10 mm) to equigranular (0.05 - 0.4 mm). Typical intracrystalline
deformation features include deformation twinning after albite- and pericline twin law,
bent deformation lamellae, and undulous extinction. Subgrain formation and subgrain
rotation, grain size coarsening and bulging of grain boundaries give evidence of
dynamic recrystallisation and recovery. Areas with recrystallised plagioclase grains
show a polygonal fabric with straight grain boundaries. Antiperthitic unmixing is often
observed in larger (3.0 - 6.0 mm) plagioclase grains, as is myrmekite growth along the
boundaries of K-feldspar porphyroclasts (Fig. 7.9d). Alteration to sericite does occur.
Alkali-feldspar crystals display perthitic unmixing, fine deformation lamellae, undulous
extinction, and diffuse and discontinuous crosshatched twinning after albite- and
pericline law.
Quartz is inequigranular (0.04 - 3.5 mm) and preferably occurs close to domains
dominated by garnet, pyroxene and opaque phases. Opaque minerals and tourmaline
crystals are sometimes found as inclusions in quartz. Anhedral quartz grains may be
disc-shaped and disc-quartz shows undulous extinction and subgrain formation (Fig.
7.9c). Subgrain rotation recrystallization has led to the development of high angle grain
boundaries, and the formation of new grains. In sample 1588, grain sizes of anhedral to
subhedral quartz varies between 0.05 to 0.4 mm.
The size of subhedral garnet porphyroblasts ranges from 0.1 to 4.0 mm with the
majority being 0.1 to 0.4 mm. Garnets are associated with a black opaque phase, biotite
and green hornblende and show vermicular intergrowth with small anhedral quartz
grains. The modal amount of garnet that has formed along a shear zone or shear plane
is inversely proportional to the amount of pyroxene as can be seen by a direct
comparison of the thinsections and estimated modal compositions (Table 7.3).
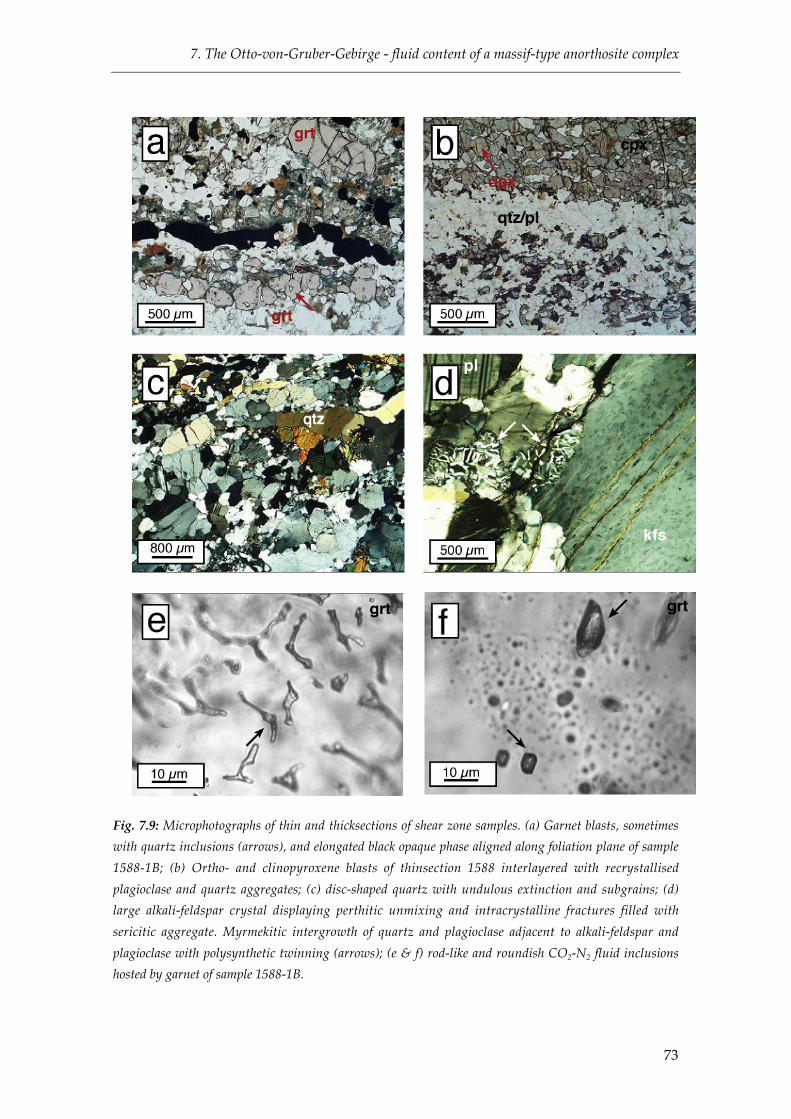
7. The Otto-von-Gruber-Gebirge - fluid content of a massif-type anorthosite complex
73
Fig. 7.9: Microphotographs of thin and thicksections of shear zone samples. (a) Garnet blasts, sometimes
with quartz inclusions (arrows), and elongated black opaque phase aligned along foliation plane of sample
1588-1B; (b) Ortho- and clinopyroxene blasts of thinsection 1588 interlayered with recrystallised
plagioclase and quartz aggregates; (c) disc-shaped quartz with undulous extinction and subgrains; (d)
large alkali-feldspar crystal displaying perthitic unmixing and intracrystalline fractures filled with
sericitic aggregate. Myrmekitic intergrowth of quartz and plagioclase adjacent to alkali-feldspar and
plagioclase with polysynthetic twinning (arrows); (e & f) rod-like and roundish CO2-N2 fluid inclusions
hosted by garnet of sample 1588-1B.
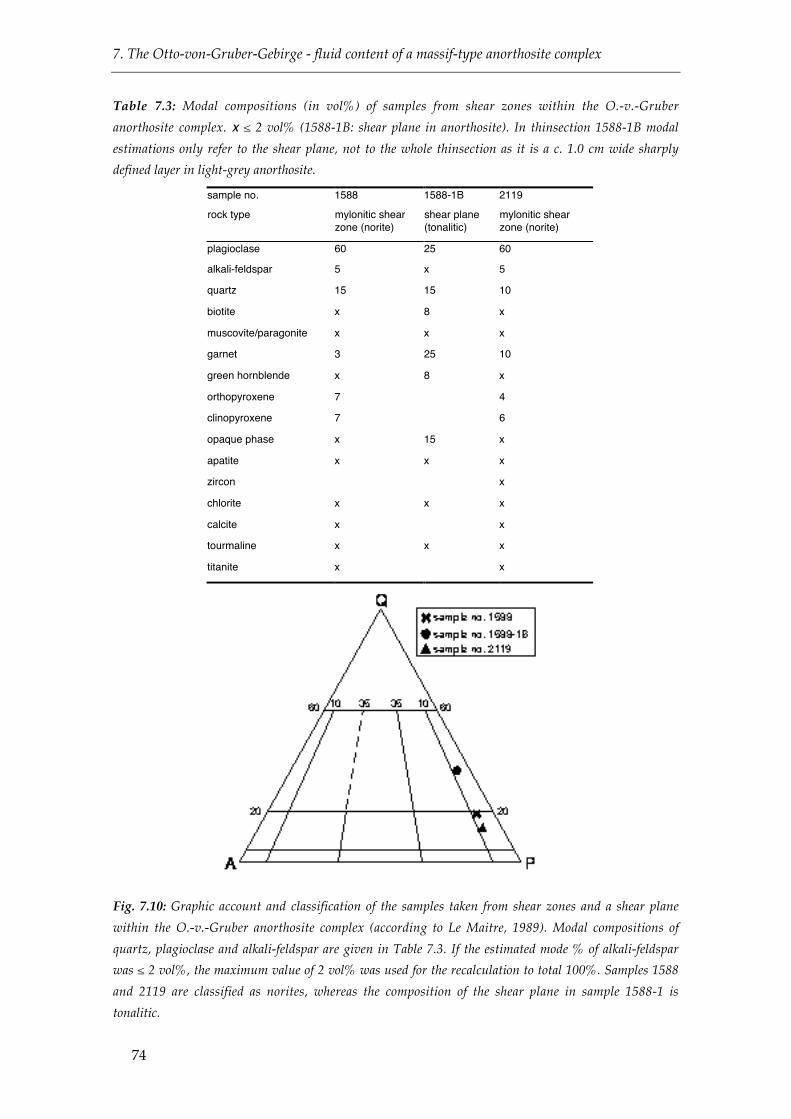
7. The Otto-von-Gruber-Gebirge - fluid content of a massif-type anorthosite complex
74
Table 7.3: Modal compositions (in vol%) of samples from shear zones within the O.-v.-Gruber
anorthosite complex. x ≤ 2 vol% (1588-1B: shear plane in anorthosite). In thinsection 1588-1B modal
estimations only refer to the shear plane, not to the whole thinsection as it is a c. 1.0 cm wide sharply
defined layer in light-grey anorthosite.
sample no. 1588 1588-1B 2119
rock type mylonitic shearzone (norite)
shear plane(tonalitic)
mylonitic shearzone (norite)
plagioclase 60 25 60
alkali-feldspar 5 x 5
quartz 15 15 10
biotite x 8 x
muscovite/paragonite x x x
garnet 3 25 10
green hornblende x 8 x
orthopyroxene 7 4
clinopyroxene 7 6
opaque phase x 15 x
apatite x x x
zircon x
chlorite x x x
calcite x x
tourmaline x x x
titanite x x
Fig. 7.10: Graphic account and classification of the samples taken from shear zones and a shear plane
within the O.-v.-Gruber anorthosite complex (according to Le Maitre, 1989). Modal compositions of
quartz, plagioclase and alkali-feldspar are given in Table 7.3. If the estimated mode % of alkali-feldspar
was ≤ 2 vol%, the maximum value of 2 vol% was used for the recalculation to total 100%. Samples 1588
and 2119 are classified as norites, whereas the composition of the shear plane in sample 1588-1 is
tonalitic.

7. The Otto-von-Gruber-Gebirge - fluid content of a massif-type anorthosite complex
75
Orthopyroxene is colourless to light green with weak pleochroism, and varies in
size between 0.1 to 2.0 mm. Clinopyroxene has the same variation in grain size but
displays stronger pleochroism from light green to pale red and higher birefringence
(Fig. 7.9b).
Nearly all major and minor mineral constituents show microfractures (Fig. 7.9d).
Those observed in feldspars and garnet are often refilled with white micas and calcite
or a brownish secondary phase that can also be found as alteration product along
pyroxene mineral cleavage and grain boundaries.
7.2.2. Fluid inclusion studies (thicksections no. 1588, 1588-1B, 2119)
Fluid inclusions observed in these samples are either hosted by plagioclase (sample
no. 2119), by plagioclase and garnet (sample no. 1588) or apatite and garnet (sample no.
1588-1B). The size of the plagioclase-hosted inclusions varies between 3.0 and 33.0 µm in
sample 2119 and between 2.0 and 8.5 µm in sample 1588. In the latter they are darker
and much less abundant. Inclusions predominantly have roundish to negative crystal
shapes, but irregular forms can be observed as well. Throughout the crystals the
majority of inclusions is arranged in intracrystalline clusters or trails and single
inclusions are rare. Garnet hosted fluid inclusions range in size between 3.5 and 26 µm.
Except for a few single inclusions, they are distributed in intracrystalline clusters and
show irregular tube-like or roundish to negative-crystal shapes.
At room temperature, most plagioclase and garnet hosted inclusions contain a
single liquid-like carbonic phase, and some comprise a varying number of solid phases
that were identified as being calcite, Mg-calcite or pyrophyllite. Minor amounts of
nitrogen (max. 4 mol%) have been detected by Raman spectrometry and rarely,
amounts as high as 8 mol% were estimated using the diagrams provided by Thiery et
al. (1994). Homogenisation of all fluid inclusions occurs into the liquid phase.
Inclusions hosted by garnets and plagioclases of sample 1588 show a wide range of
homogenisation temperatures between -10.4 and +27.2°C and -38.6 and +22.9°C,
respectively. Fluid inclusions detected in sample 2119 show a similar spread of Th (-
12.8 to +23.8 °C) (Fig. 7.11a). Melting temperatures are consistent, as well, and range
from -59.1 to -56.6 °C (Fig. 7.11b). A systematic relationship between Th and Tm is not
present (Fig. 7.12). Calculated densities lie between 0.64 and 0.98 gcm-3 in sample no.
2119, and between 0.56 and 0.96 gcm-3 (garnet) and 0.52 and 1.07 gcm-3 (plagioclase) in
sample 1588 .
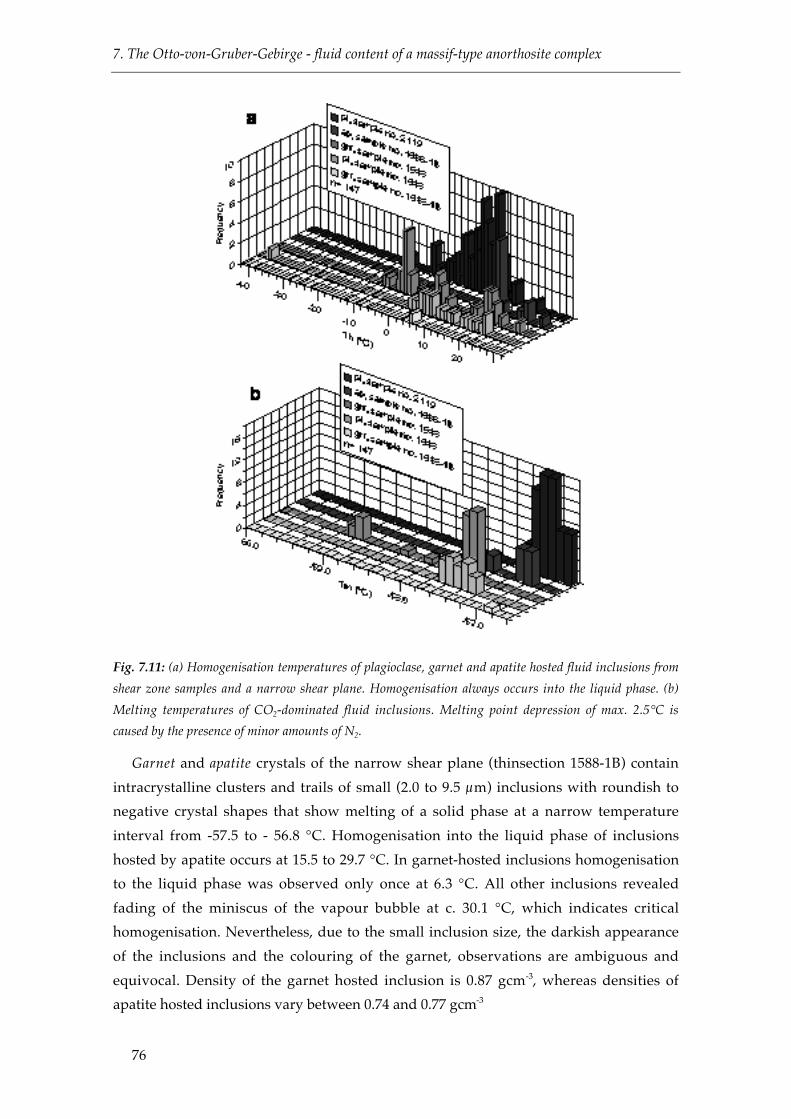
7. The Otto-von-Gruber-Gebirge - fluid content of a massif-type anorthosite complex
76
Fig. 7.11: (a) Homogenisation temperatures of plagioclase, garnet and apatite hosted fluid inclusions from
shear zone samples and a narrow shear plane. Homogenisation always occurs into the liquid phase. (b)
Melting temperatures of CO2-dominated fluid inclusions. Melting point depression of max. 2.5°C is
caused by the presence of minor amounts of N2.
Garnet and apatite crystals of the narrow shear plane (thinsection 1588-1B) contain
intracrystalline clusters and trails of small (2.0 to 9.5 µm) inclusions with roundish to
negative crystal shapes that show melting of a solid phase at a narrow temperature
interval from -57.5 to - 56.8 °C. Homogenisation into the liquid phase of inclusions
hosted by apatite occurs at 15.5 to 29.7 °C. In garnet-hosted inclusions homogenisation
to the liquid phase was observed only once at 6.3 °C. All other inclusions revealed
fading of the miniscus of the vapour bubble at c. 30.1 °C, which indicates critical
homogenisation. Nevertheless, due to the small inclusion size, the darkish appearance
of the inclusions and the colouring of the garnet, observations are ambiguous and
equivocal. Density of the garnet hosted inclusion is 0.87 gcm-3, whereas densities of
apatite hosted inclusions vary between 0.74 and 0.77 gcm-3

7. The Otto-von-Gruber-Gebirge - fluid content of a massif-type anorthosite complex
77
Fig. 7.12: Relationship between Th and Tm of plagioclase hosted inclusions from shearzone samples
7.2.3. Mineral chemistry of feldspars, pyroxenes and garnets of samples no. 2118 and
2119
Electron microprobe analyses of varying mineral phases were carried out on
samples 2118 and 2119 to enlighten possible changes in mineral chemistry during the
deformational event that led to the shear zone formation. The plagioclases of the
anorthosite sample no. 2118 have a uniform compositional range varying between
An40Ab57Or3 and An46Ab53Or1 (Fig. 7.13).
Fig. 7.13: Compositions of plagioclase and K-feldspar (in mol%) from anorthosite and mylonitic shear
zone samples no. 2118 and 2119 plotted in the albite (Ab)-anorthit (An)-orthoclase (Or) system.

7. The Otto-von-Gruber-Gebirge - fluid content of a massif-type anorthosite complex
78
Plagioclase crystals of the mylonitic shear zone sample have slightly higher An
values of An51Ab47Or2 to An63Ab36Or1 (Fig. 7.13). The transition is smoothly, and
compositional values may overlap, as further investigations of anorthosite hosted
plagioclases (An46Ab53Or1 to An53Ab46Or1) from samples no. 1583 and 1588-1 have
revealed (cf. chapter 8, Fig. 8.2). Rare K-feldspar exsolution lamellae in plagioclase have
a composition of An3Ab3Or94 in anorthosite, and of An7Ab16Or77 in shear zone samples.
This depicts an identical trend of enrichment of the anorthite component in K-feldspars
during the deformational event.
The graphic representation of pyroxene compositions shows that clinopyroxenes of
sample 2118 are either Fe-rich diopsides with a slight shift towards Fe-poor
hedenbergite, or Ca-rich augites with counterbalanced fractions of magnesium and
iron (Fig. 7.14). In sample 2119, clinopyroxene compositions are predominantly in the
range of Fe-poor hedenbergite with a weak tendency towards Ca-rich augite.
Clinopyroxene compositions of samples 2118 and 2119 mainly differ in higher Fe-
values of pyroxenes hosted by the shear zone sample. Orthopyroxene of sample 2119 is
in the range of ferrosilite.
Fig. 7.14: Chemical composition of pyroxenes (in mol%) of anorthosite and shearzone samples 2118 and
2119
Endmember calculations of secondary garnet blasts from the shear zone sample
2119 exhibit that the garnet solid solution has a relatively narrow compositional range.
It varies only slightly between Alm66Grs27Prp6Sps1 and Alm70Grs20Prp8Sps2. Andradite
does not occur during endmember calculations, as total iron was completely calculated
as ferrous component of almandine.
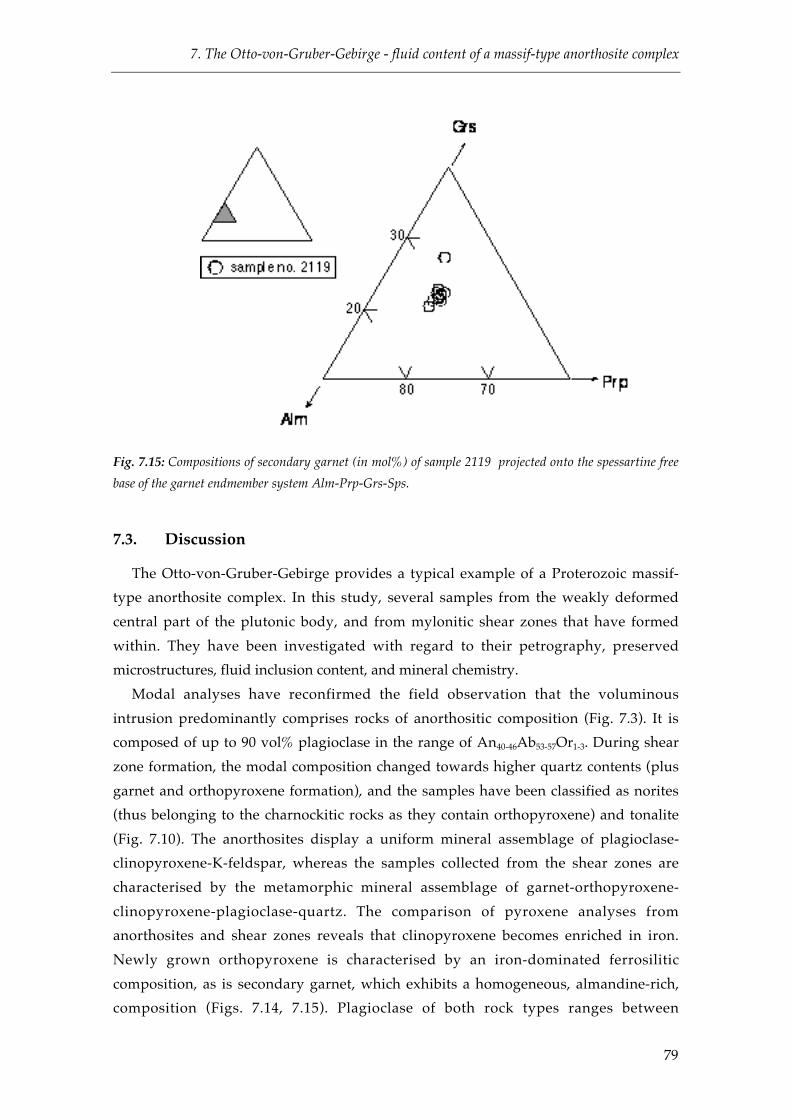
7. The Otto-von-Gruber-Gebirge - fluid content of a massif-type anorthosite complex
79
Fig. 7.15: Compositions of secondary garnet (in mol%) of sample 2119 projected onto the spessartine free
base of the garnet endmember system Alm-Prp-Grs-Sps.
7.3. Discussion
The Otto-von-Gruber-Gebirge provides a typical example of a Proterozoic massif-
type anorthosite complex. In this study, several samples from the weakly deformed
central part of the plutonic body, and from mylonitic shear zones that have formed
within. They have been investigated with regard to their petrography, preserved
microstructures, fluid inclusion content, and mineral chemistry.
Modal analyses have reconfirmed the field observation that the voluminous
intrusion predominantly comprises rocks of anorthositic composition (Fig. 7.3). It is
composed of up to 90 vol% plagioclase in the range of An40-46Ab53-57Or1-3. During shear
zone formation, the modal composition changed towards higher quartz contents (plus
garnet and orthopyroxene formation), and the samples have been classified as norites
(thus belonging to the charnockitic rocks as they contain orthopyroxene) and tonalite
(Fig. 7.10). The anorthosites display a uniform mineral assemblage of plagioclase-
clinopyroxene-K-feldspar, whereas the samples collected from the shear zones are
characterised by the metamorphic mineral assemblage of garnet-orthopyroxene-
clinopyroxene-plagioclase-quartz. The comparison of pyroxene analyses from
anorthosites and shear zones reveals that clinopyroxene becomes enriched in iron.
Newly grown orthopyroxene is characterised by an iron-dominated ferrosilitic
composition, as is secondary garnet, which exhibits a homogeneous, almandine-rich,
composition (Figs. 7.14, 7.15). Plagioclase of both rock types ranges between
7. The Otto-von-Gruber-Gebirge - fluid content of a massif-type anorthosite complex
80
An40-63Ab36-57Or1-3, with the highest An values measured in the shear zone samples (Fig.
7.13). A very primitive composition of An74Ab26Or0 has been reported from the core of a
plagioclase porphyroclast from the central O.-v.-Gruber anorthosite body by Markl et
al. (in press). It is suggested that this composition reflects the beginning of plagioclase
crystallisation from a primitive basaltic magma. Ashwal (1993), who has reported even
more primitive plagioclase compositions from undeformed anorthosite complex,
argues that compositional changes towards lower An contents are indicative for
recrystallisation of plagioclase during metamorphic overprint. Based on these
considerations, lower An values of 40 to 46 mol% are interpreted to reflect the effect of
metamorphic recrystallisation. Subsequent shearzone formation again resulted in an
increase of anorthite component in plagioclase and K-feldspar. This interpretation is
also in conformity with the general observation that an enrichment in anorthite
component in plagioclase indicates a progression in pressure and/or temperature, as
already considered by Becke (1903). A comparison of pre- and postmetamorphic
mineral assemblages reveals, that the mineral reactions would not have taken place in
an isochemical system. Thus, the change in chemical composition during the time span
of shear zone formation - increase of femic components and decrease of sodium- must
have been allochemical, possibly under influence of an ion-rich fluid phase. The
pseudomorphosis of biotite after amphibole (Fig. 7.2c) hints at a high K-mobility
during retrogression. Additionally, the alteration of pyroxene to hornblende and
biotite, as well as sericitisation of plagioclase observed in all samples is typical for
retrogression under presence of an aqueous fluid phase.
Conspicuous microstructures observed in feldspar of anorthosites and shear zones
include undulous extinction, deformational twinning, bent deformation lamellas,
"core-and-mantle" stuctures, myrmekite growth and the formation of real subgrain
structures. Bent deformation lamellae, undulous extinction and "core-and-mantle"
stuctures are indicative for deformation at temperatures around 450 to 550 °C
(Passchier & Trouw, 1996). Quartz from the shear zones reveals a disc-shaped habit
which is characteristic of deformation under granulite facies conditions (Shelley, 1993).
The pegmatitic mobilisate of tonalitc composition reveals microstructures very similar
to those of the surrounding anorthosite, and is therefore considered to be concomitant
to the deformation of the anorthosite body. Mineral deformation is not restricted to
high grade conditions but continues towards lower temperatures and pressures.
Processes responsible for recrystallisation or brittle fracturing are important during
retrogression, and may strongly effect fluid inclusions that formed during prograde or
peak-metamorphic conditions.
Thorough fluid inclusion studies have revealed, that the current fluid content of the
samples collected from the O.-v.-Gruber anorthosite complex is CO2±N2 dominated

7. The Otto-von-Gruber-Gebirge - fluid content of a massif-type anorthosite complex
81
with the melting temperatures of solid CO2 varying between -59.1 and -56.6 °C. The
amount of nitrogen detected is mostly in the range of 2-4 mol%. Nearly all fluid
inclusions homogenise into the liquid phase. The uniformity in fluid composition
(CO2±N2) is accompanied by largely homogeneous inclusion shapes (roundish to
negative crystal shape), and the frequent occurrence of enclosed solids. The latter were
identified as carbonates and/or varying sheet silicates. The microcrystals
predominantly occur in in plagioclase hosted inclusions, but some inclusions hosted by
garnet contain solids as well. Fluid inclusions are exclusively arranged along
intracrystalline clusters and trails, and no evidence of secondary origin or influx of
different (late or secondary) fluid generations was found. The only evidence for the
presence of any free H2O derived from microthermometry and Raman spectrometrical
investigations is given by extremely rare H2O-CO2-bearing fluid inclusions hosted by
intersticial quartz of the anorthosite samples.
A comparison of all plagioclase hosted inclusions from anorthosite and shear zone
samples exhibits, that the majority of fluid inclusions from the anorthosites
homogenises at higher temperatures than those hosted by plagioclase of the shear
zones (Fig. 7.16).
Fig. 7.16: Compilation of all homogenisation temperatures measured from plagioclase-hosted fluid
inclusions from the O.-v.-Gruber anorthosite complex
This tendency is also reflected by the results of density calculations (high Th
generally corresponding to low densities). The whole range of densities in the shear
zones spreads from 0.73 to 1.07 gcm-3, with densities > 1.0 gcm-3 just reached once.
Considering only those inclusions that homogenise into the liquid phase, the whole
range of densities of anorthosite hosted inclusions lies between 0.61 and 0.94 gcm-3.
Very low densities (0.28 to 0.38 gcm-3) were exclusively calculated from irregular to
roundish inclusions that homogenise into the vapour phase. They are located in

7. The Otto-von-Gruber-Gebirge - fluid content of a massif-type anorthosite complex
82
immediate vicinity of the pegmatite vein. Quartz hosted inclusions from the pegmatite
itself yield densities of 0.63 to 0.80 gcm-3. Densities from garnet and apatite hosted
inclusions from the shear zones fall in the range of 0.56 to 0.96 gcm-3 (limits determined
from garnet hosted inclusions). Consequently, all densities calculated from
homogenisation temperatures (Th (l)) measured in other minerals than plagioclase fall
well into the range already encompassed by the most abundant host mineral.
The relatively wide spread of densities and slight variation in fluid composition
within the homologous inclusion assemblages can be best explained by the different
reaction of single inclusions on the influence of post-entrapment change. Evidence for
brittle failure during decompressional uplift is given by a positive correlation of
inclusion size and homogenisation temperatures (Fig. 7.17). Large inclusions tend to
decrepitate easier than small inclusions which results in a fluid loss and generation of
larger inclusion volumes (e.g. Swanenberg, 1980; Bodnar et al., 1989). A further
indicator is the occurrence of decrepitation clusters around rare quartz hosted
inclusions (Fig. 8.4f). Evidence for post-entrapment change through reequilibration
processes is given by the predominantly roundish to negative crystal shapes, and by
microstructural features evident in the host minerals. The modification of inclusions is
often accompanied by selective loss of N2 or H2O. The very low density of inclusions
found adjacent to the pegmatite vein most probably result from destruction and fluid
loss during locally restricted melt injection.
Fig. 7.17: Correlation between homogenisation temperatures and inclusion sizes of anorthosites and shear
zone samples. Smaller inclusions display a wide range of Th, whereas large inclusions generally do not
reveal low homogenisation temperatures (with one exception).
The results from microthermometrical studies (Th, Tm) reveal that the composition
of the actual fluid content from the O.-v.-Gruber anorthosite complex is relatively

7. The Otto-von-Gruber-Gebirge - fluid content of a massif-type anorthosite complex
83
homogeneous. In a first approach, isochores were calculated for selected inclusions
containing a maximum amount of 4 mol% N2 and compared with published P-T data
deduced from independent thermobarometrical studies.
Representative isochores depicted in Fig. 7.18 indicate the maximum and minimum
P-T conditions from garnet and plagioclase hosted inclusions of the shear zones, and
plagioclase hosted inclusions of the anorthosite samples, respectively. The absolute
maximum P values result from high density, garnet and plagioclase hosted inclusions
that were rarely detected in the shear zone samples (0.96 and 1.07 gcm-3). The intrusion
of the anorthosite body into the metamorphic basement lithologies of cDML occurred
at c. 600 Ma, subsequently followed by a first stage of Pan African I metamorphism at
580-550 Ma (Jacobs et al., 1998). The isochores intersect with metamorphic conditions of
the Pan African I event (M2) as given by Markl & Piazolo, 1998 (Fig. 7.18). Thus it is
concluded that despite the frequent evidence for post-entrapment change, these rare
inclusions still reflect peak metamorphic conditions.
Fig. 7.18: P-T diagram with isochores derived from fluid inclusion data of plagioclase hosted inclusions of
anorthosites and shear zone samples. Given isochores represent maximum and minimum density values
of CO2±N2 inclusions detected in plagioclase of anorthosite (dashed lines), and plagioclase (solid lines)
and garnet (dash-dot-lines) of shear zone samples. The majority of isochores calculated from plagioclase,
garnet, apatite or quartz hosted inclusions fall in the field encompassed by maximum and minimum
isochores from the anorthosite samples (dashed lines). Numbers refer to the densities in gcm-3. Boxes
indicate metamorphic conditions of Pan African I (Pan1), Pan African II (Pan2) and retrogression (M4)
cf. chapter 5. The possible P-T paths resulting from the intersection of isochores with independent P-T
constraints are indicated by the grey arrosw, description is given in the text.
7. The Otto-von-Gruber-Gebirge - fluid content of a massif-type anorthosite complex
84
The isochore calculated from maximum density values of the anorthosite inclusion
(0.94 gcm-3) is interpreted to represent maximum pressure conditions prevailing during
a further metamorphic event, as the vast majority of inclusions reveal similar or lower
densities (0.71 to 0.84 gcm-3 in anorthosites and 0.81 and 0.92 gcm-3 in shear zone
samples). The resulting pressure estimation is in accordance with independent P-T
conditions, given for the second stage of Pan-African metamorphism (Pan2, M3 from
Markl & Piazolo, 1998).
A multitude of calculated isochores (not depicted in Fig. 7. 18) falls into the range
encompassed by the isochore reflecting M3 conditions (0.94 gcm-3) and minimum value
isochores derived from plagioclase and garnet hosted inclusions of anorthosites and
shear zones (0.73, 0.56 and 0.61 gcm-3). Density values (and indicated pressures)
decrease gradually and terminate at the minimum value isochores.
Near isobaric cooling (P-T path B in Fig. 7.18) from high-grade granulite facies
conditions would result in volume decrease without major loss of fluid content, and
abundance of high density inclusions (≥ 1.0 gcm-3), even when followed by a stage of
rapid isothermal decompression (Lamb & Morrison, 1997; Touret, 2001). The absence
of any significant amounts of high density inclusions in the O.-v.-Gruber anorthosite
complex, in addition to evidence of decrepitation (Fig. 7.17) though is in favour of a
periode of isothermal decompression for the retrograde stage between the Pan African
I and Pan African II metamorphic stage (path A in Fig. 7.18). Fluid inclusion densities
were "reset" at M3 conditions and a second period of retrogression followed.
Density values reflecting the post-M3 phase (ranging between 0.94 and 0.56 gcm-3)
decrease gradually and occur rather evenly distributed throughout all samples. This
indicates an even influence of reequilibration processes acting over a long period of
time. Thus, a gradual (nearly linear) decrease in P-T conditions is proposed (path A')
for the post M3 retrograde stage, which has only very roughly been confined by other
thermobarometric studies (M4 taken from Markl & Piazolo, 1998; Colombo & Talarico,
in press). The presence of slightly higher average density values in shear zone samples
is probably an effect of shear zone reactivation or a less pronounced influence of
retrograde fluid inclusion modification. Again, the absence of a significant number of
high density inclusions (≥ 0.92 gcm-3) speaks against a mode of isobaric cooling (path
B').
It is evident from the fluid inclusion studies, that the majority of inclusions under
investigation have changed their initial volumetric and compositional properties
towards lower densities. A partial loss of the fluid phase during change after inclusion
formation often has the character of selective loss of one fluid component (e.g. H2O or
N2). Fluid pressure indicated by isochores calculated from inclusions hosted by well
identified metamorphic minerals (e.g. garnet) is almost systematically lowered about 1-

7. The Otto-von-Gruber-Gebirge - fluid content of a massif-type anorthosite complex
85
2 kbar, compared to metamorphic pressures derived from solid-equilibria estimations
(Touret & Huizenga, 1999). This feature has often been reported from granulite
lithologies and may be explained by systematic H2O -loss through water leakage (e.g.
Touret, 2001). Heinrich & Gottschalk (1995) have suggested that peak metamorphic
fluids that were captured in prograde metamorphic minerals react with the
surrounding host somewhere along the retrograde path, leading to a severe change in
volume and loss of some fluid components. That a free aqueous phase must have been
present at some stage of the geologic evolution of the O.-v.-Gruber anorthosite
complex is unequivocally documented by extremely rare quartz-hosted inclusions that
contain a CO2-H2O fluid. Further indicators are sericitisation and calcitisation of
plagioclase (most dominantly developed in the pegmatite vein), and slight alteration of
pyroxene to biotite and amphibole. That up to 15 vol% H2O, forming a small rim
around the vapour bubble, might be overlooked during microthermometry studies has
already been reported by early workers (cf. Roedder, 1984). Furthermore, besides the
models that largely connect granulite petrogenesis to "dry" conditions with low water
activities (e.g. Newton et al., 1980; Santosh et al., 1990), more recent studies do not
preclude the presence or even participation of an aqueous phase during granulite
facies metamorphism (e.g. van den Kerkhof, & Grantham, 1999; Newton et al., 1998).
The initial anorthositic magma system must have contained certain amounts of
dissolved H2O and CO2, and as no evidence for the influx of significant amounts of a
later fluid phase was detected it is presumed that the initial fluid was comprised out of
CO2±H2O±N2.
Thorough Raman spectrometry analyses have ruled out the possible presence of any
"hidden" water in the plagioclase and garnet hosted CO2±N2 inclusions under
investigation. Based on the frequent findings of hydrous microsolids (sheet silicates)
and carbonates in plagioclase and garnet hosted inclusions, it is suggested that the H2O
component of the initial fluid reacted with the surrounding mineral host under
formation of so-called "step-daughter" phases. The mechanism of post-entrapment
change through the reaction of an entrapped fluid with its mineral host, has only been
reported by a few workers, so far (e.g. Heinrich & Gottschalk, 1995; Svensen et al.,
2001). The effect of volumetric and compositional change on plagioclase hosted
inclusions has not been described before. Thus the example studied was used to model
and evaluate the modifications a CO2-N2 bearing fluid hosted by plagioclase would
undergo during retrograde metamorphism, and the effect on isochore calculations if it
could be proved that the initial inclusion contained significant amounts of H2O.
7. The Otto-von-Gruber-Gebirge - fluid content of a massif-type anorthosite complex
86
----------------------------------------------------------------------------------------------------------------
The following chapter consists of an individual paper on modelling of fluid host
interactions of plagioclase with an enclosed H2O-CO2-bearing fluid, leading to the
formation of "step-daughter" microcrystals within fluid inclusions under complete
consumption of the aqueous phase. It contains own chapters on introduction,
geological setting, discussion, and conclusions, and separate references. All data used
are presented either in the text or the appendices A and B. With the detailed study of
fluid inclusions of anorthosite samples 1583 and 1588-1, the results of the publication
have a close relationship to the data discussed in chapter 7 of this thesis.
8. Fluid inclusions as micro-chemical systems
87
Chapter 8
Fluid inclusions as micro-chemical systems: evidence and
modelling of fluid-host interactions in plagioclase
Bärbel Kleinefeld* & Ronald. J. Bakker°
*Faculty of Geosciences, University of Bremen, Postfach 330440,D-28334 Bremen (Germany), [email protected]
°Institute of Geosciences, Mineralogy & Petrology,University of Leoben, Peter-Tunner-Str. 5, A-8700 Leoben (Austria)
” Blackwell Science Inc., UK
Abstract
Dense, CO2-rich fluid inclusions hosted by plagioclases, An45 to An54, of the O.-v.-
Gruber anorthosite body, central Dronning Maud Land, East Antarctica, have shown to
contain varying amounts of small calcite, paragonite and pyrophyllite crystals, as
detected by Raman microspectrometry. These crystals are reaction products that have
formed during cooling of the host and the original CO2-rich H2O-bearing enclosed
fluid. Variable amounts of these reaction products illustrate, that the reaction did not
take place uniformly in all fluid inclusions, possibly due to differences in kinetics as
caused by differences in shape and size, or due to compositional variation in the
originally trapped fluid. The reaction Albite + 2Anorthite + 2H2O + 2CO2 = Pyrophyllite +
Paragonite + 2Calcite was thermodynamically modelled with consideration of different
original fluid compositions. Although free H2O is not detectable in plagioclase-hosted
inclusions, the occurrence of OH-bearing sheet silicates indicates that the original fluid
was not pure CO2, but contained significant amounts of H2O. Compared to an actual
fluid inclusion it is obvious, that volume estimations of solid phases can be used as a
starting point to reverse the retrograde reaction and recalculate the compositional and
volumetrical properties of the original fluid. Isochores for an unmodified inclusion can
thus be reconstructed, leading to a more realistic estimation of P-T conditions during
earlier metamorphic stages or fluid capturing.

8. Fluid inclusions as micro-chemical systems
88
Introduction
The interpretation of many fluid inclusion studies is based on the assumption that
the entrapped fluid has not changed its composition and density during the long
exhumation history. Fluid inclusions, both primary and secondary, form during
precipitation processes of a mineral host. At this stage, the enclosed fluid and its host
crystal are not chemically reactive. However, at temperatures and pressures different
from the formation conditions, the micro-system may become unstable and therefore
react. Quartz, the most studied host mineral, is not chemically reactive with most of the
enclosed fluids over a wide range of P-T conditions. The occurrence of chemical
reactions between the entrapped fluid and a reactive mineral host (e.g. feldspar and
pyroxene) has been reported so far by only a few workers.
Andersen et al. (1984) described inclusions in pyroxene from mantle xenoliths with a
residual composition of nearly pure CO2 and two secondary solids of carbonate and
amphibole. It was suggested that both phases resulted from reaction between the
pyroxene host and an original H2O-CO2-rich entrapped fluid. They used SEM and
microprobe techniques to identify the varying entrapped minerals in fluid inclusions,
and Raman microspectrometry for the analysis of fluid components. The density
change of the remaining fluid was modelled against the volume change of the solid
phase involved in the reaction. The reaction of melt inclusions with a garnet host was
described by Schulze (1985). Included olivine is supposed to react with garnet to form
spinel and pyroxene, which are later transformed into serpentine. Davis et al. (1990)
reported the reaction of a salt-saturated aqueous solution in fluid inclusions with a
halite host during a freezing-heating experiment. A rim presumably composed of
hydrohalite formed just after the melting of ice. Heinrich & Gottschalk (1995)
introduced the term “back-reactions” for decarbonation reaction during retrogression
in wollastonite-hosted fluid inclusions leading to the formation of quartz and calcite.
On heating in the microstage, the progress of the prograde reaction is estimated
visually and then thermodynamically modelled, using compositions and densities of
similar but unmodified fluids entrapped in neighbouring quartz. Svensen et al. (1999,
2001) considered that some of the many entrapped crystals (e.g. calcite, quartz and K-
feldspar) within fluid inclusions in omphacite and garnet may be reaction products of
fluid and host (“step-daughter-crystals”), whereas the others were accidentally trapped
during multiple re-opening, or precipitated out of a supersaturated fluid.
Thermodynamic modelling of fluid-host reactions as applied to wollastonite by
Heinrich & Gottschalk (1995) allows a more precise and realistic interpretation of fluid
inclusions analysed in metamorphic rocks. In this study we have combined the varying
approaches of the previously described studies, including the exact analysis of reaction
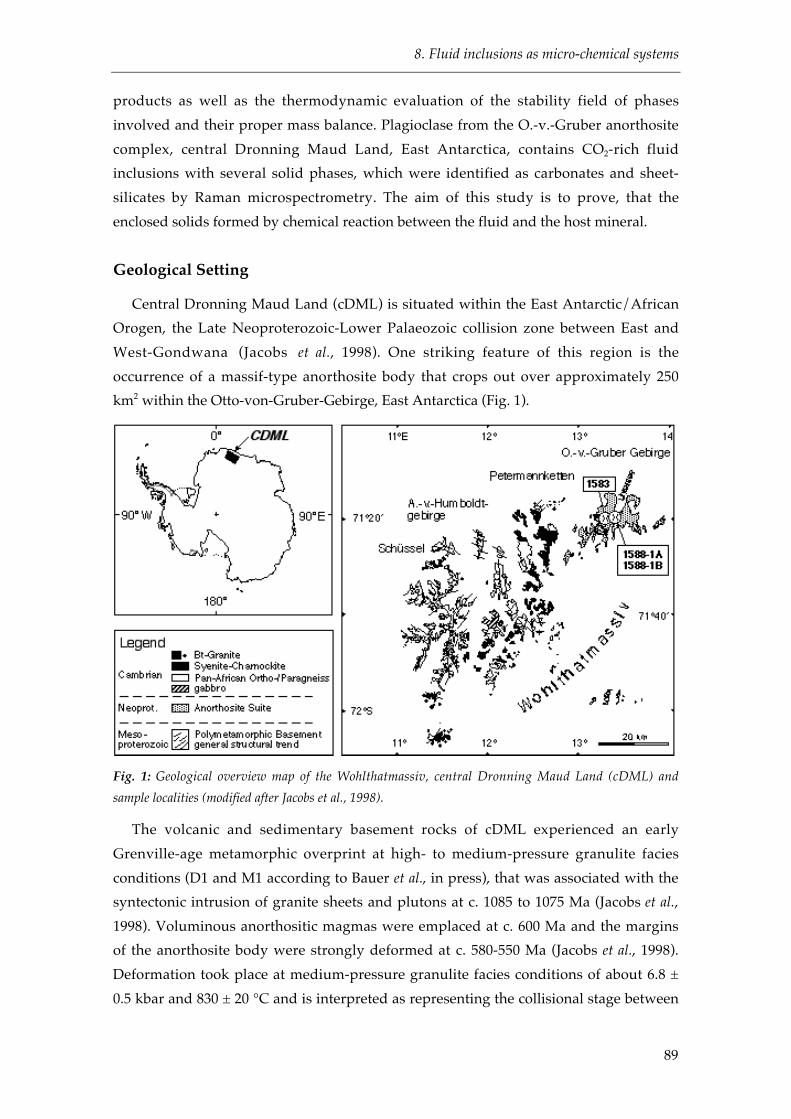
8. Fluid inclusions as micro-chemical systems
89
products as well as the thermodynamic evaluation of the stability field of phases
involved and their proper mass balance. Plagioclase from the O.-v.-Gruber anorthosite
complex, central Dronning Maud Land, East Antarctica, contains CO2-rich fluid
inclusions with several solid phases, which were identified as carbonates and sheet-
silicates by Raman microspectrometry. The aim of this study is to prove, that the
enclosed solids formed by chemical reaction between the fluid and the host mineral.
Geological Setting
Central Dronning Maud Land (cDML) is situated within the East Antarctic/African
Orogen, the Late Neoproterozoic-Lower Palaeozoic collision zone between East and
West-Gondwana (Jacobs et al., 1998). One striking feature of this region is the
occurrence of a massif-type anorthosite body that crops out over approximately 250
km2 within the Otto-von-Gruber-Gebirge, East Antarctica (Fig. 1).
Fig. 1: Geological overview map of the Wohlthatmassiv, central Dronning Maud Land (cDML) and
sample localities (modified after Jacobs et al., 1998).
The volcanic and sedimentary basement rocks of cDML experienced an early
Grenville-age metamorphic overprint at high- to medium-pressure granulite facies
conditions (D1 and M1 according to Bauer et al., in press), that was associated with the
syntectonic intrusion of granite sheets and plutons at c. 1085 to 1075 Ma (Jacobs et al.,
1998). Voluminous anorthositic magmas were emplaced at c. 600 Ma and the margins
of the anorthosite body were strongly deformed at c. 580-550 Ma (Jacobs et al., 1998).
Deformation took place at medium-pressure granulite facies conditions of about 6.8 ±
0.5 kbar and 830 ± 20 °C and is interpreted as representing the collisional stage between
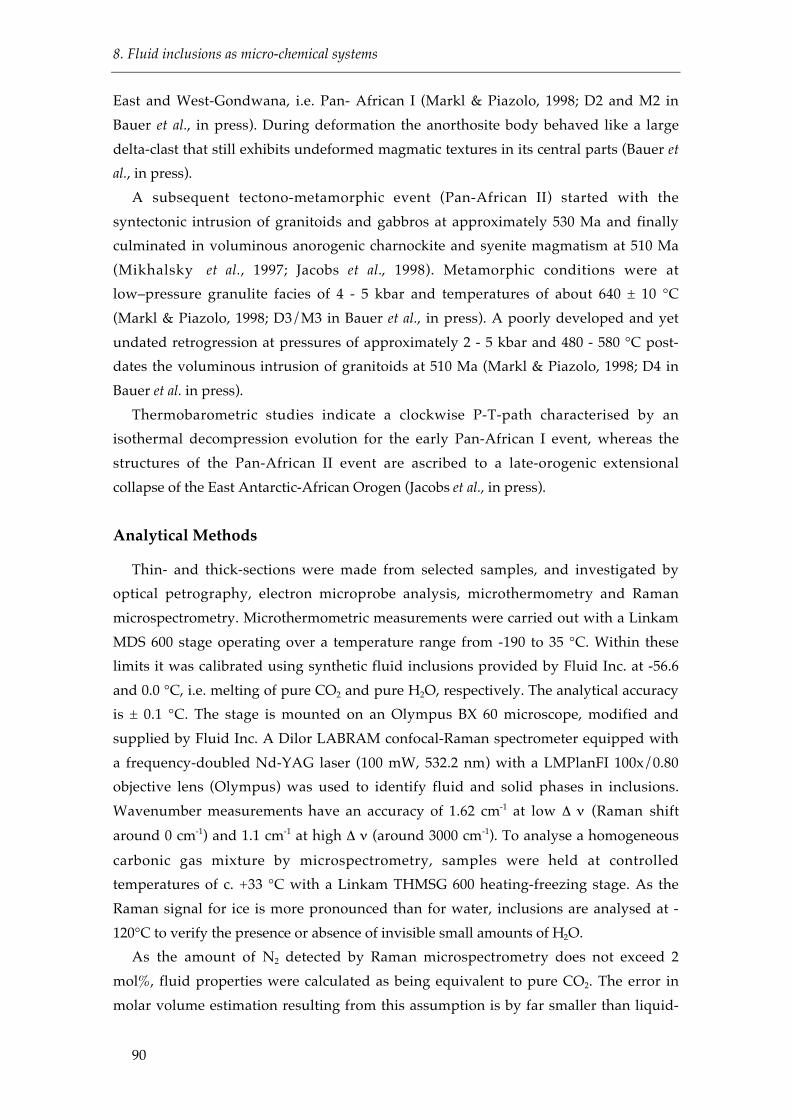
8. Fluid inclusions as micro-chemical systems
90
East and West-Gondwana, i.e. Pan- African I (Markl & Piazolo, 1998; D2 and M2 in
Bauer et al., in press). During deformation the anorthosite body behaved like a large
delta-clast that still exhibits undeformed magmatic textures in its central parts (Bauer et
al., in press).
A subsequent tectono-metamorphic event (Pan-African II) started with the
syntectonic intrusion of granitoids and gabbros at approximately 530 Ma and finally
culminated in voluminous anorogenic charnockite and syenite magmatism at 510 Ma
(Mikhalsky et al., 1997; Jacobs et al., 1998). Metamorphic conditions were at
low–pressure granulite facies of 4 - 5 kbar and temperatures of about 640 ± 10 °C
(Markl & Piazolo, 1998; D3/M3 in Bauer et al., in press). A poorly developed and yet
undated retrogression at pressures of approximately 2 - 5 kbar and 480 - 580 °C post-
dates the voluminous intrusion of granitoids at 510 Ma (Markl & Piazolo, 1998; D4 in
Bauer et al. in press).
Thermobarometric studies indicate a clockwise P-T-path characterised by an
isothermal decompression evolution for the early Pan-African I event, whereas the
structures of the Pan-African II event are ascribed to a late-orogenic extensional
collapse of the East Antarctic-African Orogen (Jacobs et al., in press).
Analytical Methods
Thin- and thick-sections were made from selected samples, and investigated by
optical petrography, electron microprobe analysis, microthermometry and Raman
microspectrometry. Microthermometric measurements were carried out with a Linkam
MDS 600 stage operating over a temperature range from -190 to 35 °C. Within these
limits it was calibrated using synthetic fluid inclusions provided by Fluid Inc. at -56.6
and 0.0 °C, i.e. melting of pure CO2 and pure H2O, respectively. The analytical accuracy
is ± 0.1 °C. The stage is mounted on an Olympus BX 60 microscope, modified and
supplied by Fluid Inc. A Dilor LABRAM confocal-Raman spectrometer equipped with
a frequency-doubled Nd-YAG laser (100 mW, 532.2 nm) with a LMPlanFI 100x/0.80
objective lens (Olympus) was used to identify fluid and solid phases in inclusions.
Wavenumber measurements have an accuracy of 1.62 cm-1 at low D n (Raman shift
around 0 cm-1) and 1.1 cm-1 at high D n (around 3000 cm-1). To analyse a homogeneous
carbonic gas mixture by microspectrometry, samples were held at controlled
temperatures of c. +33 °C with a Linkam THMSG 600 heating-freezing stage. As the
Raman signal for ice is more pronounced than for water, inclusions are analysed at -
120°C to verify the presence or absence of invisible small amounts of H2O.
As the amount of N2 detected by Raman microspectrometry does not exceed 2
mol%, fluid properties were calculated as being equivalent to pure CO2. The error in
molar volume estimation resulting from this assumption is by far smaller than liquid-
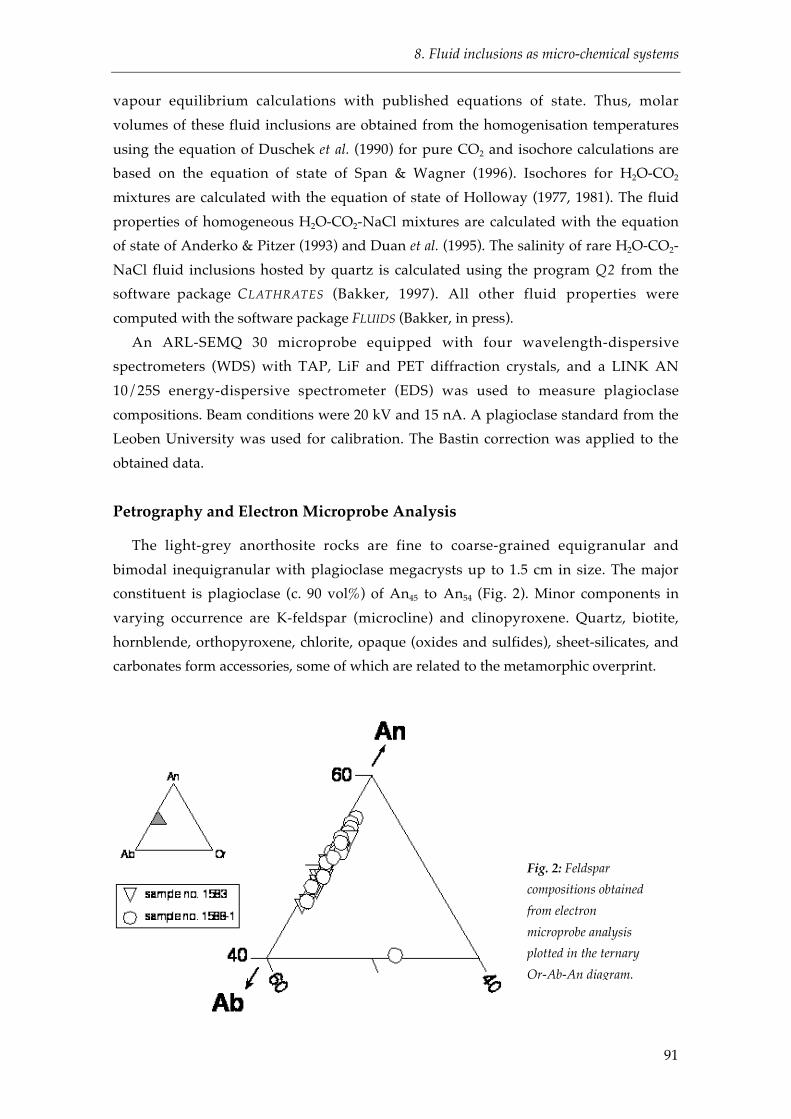
8. Fluid inclusions as micro-chemical systems
91
vapour equilibrium calculations with published equations of state. Thus, molar
volumes of these fluid inclusions are obtained from the homogenisation temperatures
using the equation of Duschek et al. (1990) for pure CO2 and isochore calculations are
based on the equation of state of Span & Wagner (1996). Isochores for H2O-CO2
mixtures are calculated with the equation of state of Holloway (1977, 1981). The fluid
properties of homogeneous H2O-CO2-NaCl mixtures are calculated with the equation
of state of Anderko & Pitzer (1993) and Duan et al. (1995). The salinity of rare H2O-CO2-
NaCl fluid inclusions hosted by quartz is calculated using the program Q2 from the
software package CLATHRATES (Bakker, 1997). All other fluid properties were
computed with the software package FLUIDS (Bakker, in press).
An ARL-SEMQ 30 microprobe equipped with four wavelength-dispersive
spectrometers (WDS) with TAP, LiF and PET diffraction crystals, and a LINK AN
10/25S energy-dispersive spectrometer (EDS) was used to measure plagioclase
compositions. Beam conditions were 20 kV and 15 nA. A plagioclase standard from the
Leoben University was used for calibration. The Bastin correction was applied to the
obtained data.
Petrography and Electron Microprobe Analysis
The light-grey anorthosite rocks are fine to coarse-grained equigranular and
bimodal inequigranular with plagioclase megacrysts up to 1.5 cm in size. The major
constituent is plagioclase (c. 90 vol%) of An45 to An54 (Fig. 2). Minor components in
varying occurrence are K-feldspar (microcline) and clinopyroxene. Quartz, biotite,
hornblende, orthopyroxene, chlorite, opaque (oxides and sulfides), sheet-silicates, and
carbonates form accessories, some of which are related to the metamorphic overprint.
Fig. 2: Feldspar
compositions obtained
from electron
microprobe analysis
plotted in the ternary
Or-Ab-An diagram.
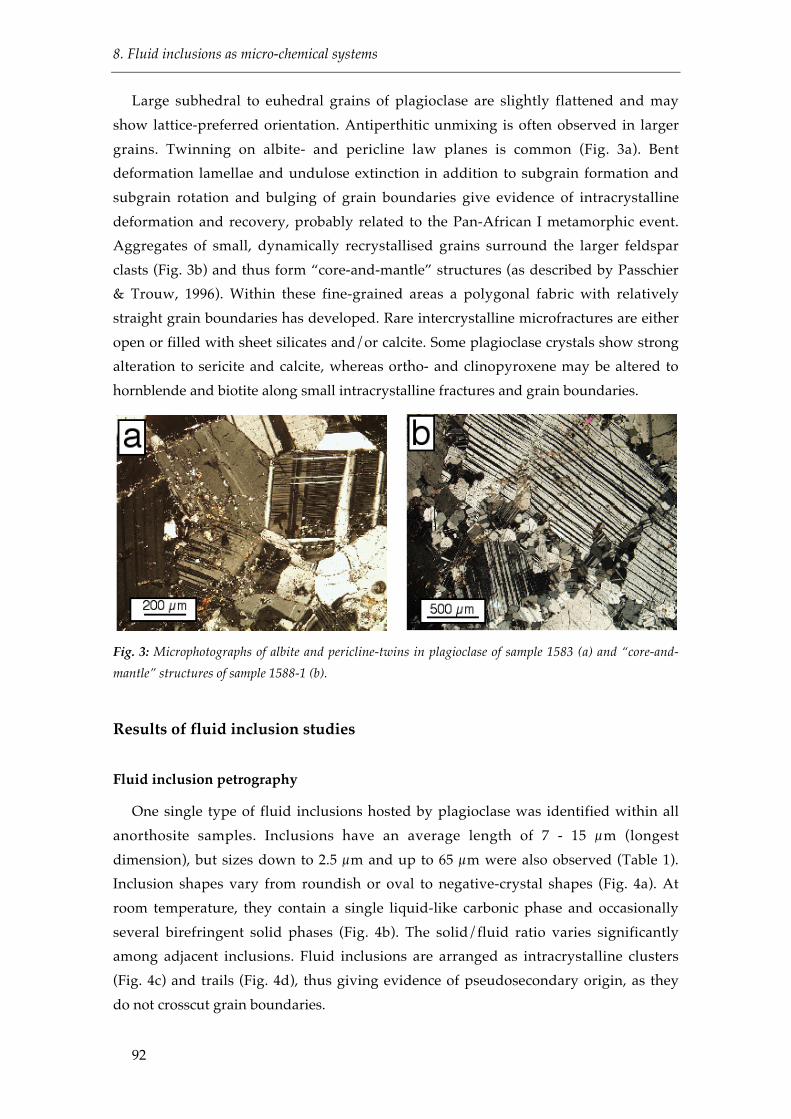
8. Fluid inclusions as micro-chemical systems
92
Large subhedral to euhedral grains of plagioclase are slightly flattened and may
show lattice-preferred orientation. Antiperthitic unmixing is often observed in larger
grains. Twinning on albite- and pericline law planes is common (Fig. 3a). Bent
deformation lamellae and undulose extinction in addition to subgrain formation and
subgrain rotation and bulging of grain boundaries give evidence of intracrystalline
deformation and recovery, probably related to the Pan-African I metamorphic event.
Aggregates of small, dynamically recrystallised grains surround the larger feldspar
clasts (Fig. 3b) and thus form “core-and-mantle” structures (as described by Passchier
& Trouw, 1996). Within these fine-grained areas a polygonal fabric with relatively
straight grain boundaries has developed. Rare intercrystalline microfractures are either
open or filled with sheet silicates and/or calcite. Some plagioclase crystals show strong
alteration to sericite and calcite, whereas ortho- and clinopyroxene may be altered to
hornblende and biotite along small intracrystalline fractures and grain boundaries.
Fig. 3: Microphotographs of albite and pericline-twins in plagioclase of sample 1583 (a) and “core-and-
mantle” structures of sample 1588-1 (b).
Results of fluid inclusion studies
Fluid inclusion petrography
One single type of fluid inclusions hosted by plagioclase was identified within all
anorthosite samples. Inclusions have an average length of 7 - 15 µm (longest
dimension), but sizes down to 2.5 µm and up to 65 µm were also observed (Table 1).
Inclusion shapes vary from roundish or oval to negative-crystal shapes (Fig. 4a). At
room temperature, they contain a single liquid-like carbonic phase and occasionally
several birefringent solid phases (Fig. 4b). The solid/fluid ratio varies significantly
among adjacent inclusions. Fluid inclusions are arranged as intracrystalline clusters
(Fig. 4c) and trails (Fig. 4d), thus giving evidence of pseudosecondary origin, as they
do not crosscut grain boundaries.

8. Fluid inclusions as micro-chemical systems
93
Table 1: Microthermometrical data, length (in µm) and molar volume (in cm3mole-1) of carbonic (car)
fluid inclusions. Melting (Tm) and homogenisation temperatures (Th) are given in °C. Homogenisation is
always into the liquid phase. The solid phases calcite (cal), Mg-calcite (mg-cal), dioctaedral mica (dm) and
pyrophyllite (prl) were identified with Raman spectrometry. Numbers in brackets indicate the volume
percentage of the specific solid phase. The occurrence of at least one solid phase that was not further
identified is indicated by "+".
Inclusion no. Length (µm) Solid Phases Tm (car) °C Th (car) °C VM (cm3mole--
1)1583-1-01 14.3 + -57.1 14.3 53.201583-1-02 7.5 + -57.2 12.2 52.13
1583-1-03 9.0 + -57.3 6.6 49.71
1583-1-04 4.5 + -57.3 10.2 51.20
1583-1-05 5.0 + -57.3 5.8 49.41
1583-1-06 13.0 mg-cal -57.1 7.5 50.06
1583-1-07 9.0 + -57.3 27.3 65.64
1583-1-08 11.0 mg-cal -57.3 10.6 51.38
1583-1-09 30.0 mg-cal -57.0 22.8 59.39
1583-1-10 9.0 -57.0 7.9 50.22
1583-1-11 9.0 -57.0 6.3 49.60
1583-1-12 9.0 mg-cal -57.0 1.1 47.80
1583-1-13 7.5 + -57.2 15.6 53.93
1583-1-14 14.0 cal (25), dm (12) -56.7 7.1 49.91
1583-1-15 11.0 + -56.8 10.8 51.47
1583-1-16 5.0 + -56.8 4.6 48.97
1583-1-17 10.0 -56.8 17.5 55.11
1583-1-18 14.0 cal -57.2 16.5 54.47
1583-1-19 11.0 + -56.9 18.5 55.79
1583-1-20 7.0 mg-cal -56.9 19.2 56.29
1583-1-21 65.0 mg-cal (11), dm (3) -56.8 18.5 55.79
1583-3-03 15.0 mg-cal (5), dm-prl (6) -57.1 8.7 50.55
1583-3-04 27.0 mg-cal (34), dm-prl (9) -57.1 20.9 57.64
1583-3-05 7.0 mg-cal (6), dm-prl (6) -57.1 11.4 51.74
1583-3-06 30.0 mg-cal (34), dm-prl (4) -57.0 17.0 54.79
1583-3-07 17.0 Mg-cal (34) -57.2 -1.8 46.92
1583-3-08 8.0 mg-cal (5), dm-prl (7) -57.3 1.0 47.77
1588-1A-1-01 13.0 -56.8 19.4 56.44
1588-1A-1-02 9.5 + -56.9 16.8 54.66
1588-1A-1-03 9.5 -56.8 19.9 56.82
1588-1A-1-04 11.0 -56.8 19.9 56.82
1588-1A-1-05 8.0 -57.0 14.5 53.31
1588-1A-1-06 5.5 -57.0 17.3 54.98
1588-1A-1-07 5.5 + -56.9 17.1 54.85
1588-1A-1-08 2.5 -57.1 17.4 55.04
1588-1A-1-09 7.0 -57.1 18.0 55.44
1588-1A-1-10 2.5 + -57.0 17.2 54.91
1588-1A-1-11 3.5 -57.1 18.9 56.07
1588-1A-1-12 6.0 -57.1 16.6 54.54
1588-1A-2-13 22.0 cal, mg-cal (2) -57.5 15.7 53.99
1588-1A-2-14 8.5 + -57.5 14.4 53.26
1588-1A-2-15 15.0 mg-cal -57.5 18.0 55.44
1588-1A-2-16 18.5 cal, prl -57.5 17.4 55.04
1588-1A-2-17 6.5 mg-cal -57.5 18.4 55.72
1588-1A-2-18 10.0 mg-cal -57.5 17.4 55.04
1588-1A-2-19 8.5 mg-cal -57.4 18.2 55.58
1588-1A-2-20 8.5 cal -57.5 16.2 54.29
1588-1B-3-22 30.0 mg-cal (8), prl (4) -57.3 14.1 53.1
1588-1B-3-23 7.0 -57.3 15.9 54.11
1588-1B-3-24 10.0 -57.3 17.2 54.91
1588-1B-3-25 15.5 -57.3 12.5 52.27
1588-1B-3-26 14.5 mg-cal -57.3 20.6 57.38
1588-1B-3-27 14.5 -57.6 18.1 55.51
1588-1B-3-28 16.5 -57.8 17.2 54.91
1588-1B-3-29 15.0 -57.6 15.7 53.99

8. Fluid inclusions as micro-chemical systems
94
Rarely, the accumulated appearance of fluid inclusions at the centre of large
feldspar crystals, best visible in sections perpendicular to the c-axis, give evidence of
relictic magmatic growth zonation in plagioclase. In some crystals, alignment of fluid
inclusions along single twin lamellae was observed.
Aside from this dominant type of fluid inclusions hosted by plagioclase, accessory
xenomorphic quartz also contains some inclusions. These are approximately 3–10 µm
in size, rounded to negative crystal shape. In general they comprise an aqueous liquid
and a carbonic vapour phase, the latter occupying from 30 vol% up to an apparent total
fill (Fig. 8.4e). Decrepitation clusters occur around some inclusions that contain only a
carbonic vapour phase (Fig. 4f).
Composition of plagioclase adjacent to fluid inclusions
Electron microprobe analysis reveals that there is no evidence for significant
chemical gradients in feldspar around single fluid inclusions (Fig. 5). Potassium
variation is close to nil whereas for Al, Ca and Na show ranges of c. 2 wt% (Fig. 5). No
systematic relationship between composition and distance from inclusion could be
detected. The average composition of plagioclase around this particular inclusion is
An46Ab53Or1 to An53Ab46Or1 (see Appendix A, Table A1).
Microthermometry and Raman microspectrometry of the enclosed fluid
Upon cooling from room temperature, the inclusions first nucleate a gas bubble
around 0 °C before supercooling leads to the formation of a solid phase around –90 °C.
Upon heating, melting of the solid phase occurs within a narrow temperature range of
–57.8 to –56.8 °C (Fig. 6 and Table 1). CO2 was confirmed by Raman microspectrometry
as being the major gaseous component within all fluid inclusions hosted by
plagioclase. The lowering of the final melting temperature of pure CO2 is caused by the
addition of small amounts of N2 (maximally 2 mol%) whereas CH4 and H2O were never
detected. All fluid inclusions homogenise into the liquid phase over a broad
temperature interval of –1.8 to 27.3, with the majority homogenising between 14 to 20
°C (Fig. 6 and Table 1). There is no systematic relationship between Th and Tm.
Quartz-hosted fluid inclusions reveal a similar CO2-melting point of –57.7 °C and
additional clathrate melting was observed around 7.9 °C. Homogenisation of CO2
occurred at 18.7 °C into the liquid phase. The calculated salinity obtained from the
clathrate melting temperature is equivalent to 4.2 wt% NaCl. In addition to CO2, small
amounts of N2 were identified with Raman microspectrometry. The presence of H2O
was even confirmed in those inclusions that did not show a visible aqueous rim (e.g.
Fig. 4f). Entrapped minerals were not detected within these inclusions.

8. Fluid inclusions as micro-chemical systems
95
Fig. 4: Microphotographs of CO2-rich fluid inclusions hosted by plagioclase: (a) negative-crystal shaped
inclusions containing carbonate crystals; (b) containing various birefringent crystals; (c) cluster between
albite twins; (d) pseudosecondary trails; (e) two phase inclusion in quartz, containing a CO2-rich bubble
and a H2O-rich rim; (f) decrepitation cluster around an apparently carbonic-rich fluid inclusion in
quartz.

8. Fluid inclusions as micro-chemical systems
96
Fig. 5: Al2O3, CaO, Na2O and K2O concentrations (in wt%) along two profiles around a fluid inclusion.
"0 µm" marks the inclusion wall. Profiles “p” and “q” are perpendicular to each other. The orientation of
albite and pericline twins is schematically indicated by thin lines.
Fig. 6: Th-Tm plot of CO2-dominated fluid inclusions hosted by plagioclase. Freezing-point depression is
caused by N2-contents of up to 2 mol%; all inclusions homogenise into the liquid phase.
Raman microspectrometry of enclosed solids
Because of their high refractive index compared to the surrounding plagioclase,
carbonate crystals entrapped in fluid inclusions can easily be identified by optical
microscopy (Fig. 8.4b). Raman spectrometry is able to detect even slight variations in
carbonate composition (Bischoff, 1985), and a shift of Raman peaks from 284, 714 and
1087 cm-1 to 283, 711 and 1085 cm-1 shows, that the enclosed minerals are Mg-enriched
(< 10 mol% MgCO3) or pure calcite (Table 1), respectively.
Sheet silicates are often located at the inclusion walls or at carbonate crystal faces
and may easily be overlooked in small or dark fluid inclusions. The Raman peaks of
muscovite and paragonite are similar, not further differentiated in this study and
therefore more generally referred to as di-octahedral mica. Nevertheless, paragonite is

8. Fluid inclusions as micro-chemical systems
97
thought to makeup most of the enclosed mica, as potassium is only a minor component
of the feldspar host. The Raman spectra for di-octahedral mica and pyrophyllite are
similar up to a Raman shift of about 1200 cm-1 (Fig. 7). Both have an intense peak at 264
cm-1, whereas the second peak is slightly higher for pyrophyllite (708 cm-1) than for di-
octahedral mica (702 cm-1). Most diagnostic peaks appear at higher wavenumbers,
between 3600 and 3700 cm-1, where different types of O-H bonds in the mineral
structure are detectable. The sharp peak for pyrophyllite at 3674 cm-1 is clearly distinct
from the broad peak for di-octahedral mica at 3626 cm-1 (Fig. 7b). Both minerals were
identified within fluid inclusions where they appear as individual crystals or
intergrown aggregates (Fig. 7, Table 1).
Fig. 7. Raman spectra of sheet silicates from sample 1583 in different ranges of the Raman shift Dn: (a)
200 to 1000 cm-1; (b) 3500 to 3800 cm-1. Standard spectra of muscovite (ms) (substitutional for the di-
octahedral micas) and pyrophyllite (prl) are indicated as a reference. pl = background peak of plagioclase
host.

8. Fluid inclusions as micro-chemical systems
98
Discussion
The microchemical reaction
Fluid-inclusion studies have proved that feldspar-hosted inclusions from the O.-v.-
Gruber anorthosite body commonly contain a dense CO2-rich gas mixture together
with different volume fractions of solids, i.e. calcite, pyrophyllite and a di-octahedral
mica. The frequent occurrence of this characteristic feature throughout the samples
rules out the possibility of accidental trapping (capturing). Additionally, the lack of
H2O, and the varying amounts of solids present suggest that it is very unlikely that the
solids formed as daughter crystals out of a supersaturated fluid/melt. It is therefore
assumed that the solids have developed as products of reaction (1) or (2).
NaAlSi3O8 + 2CaAl2Si2O8[ ]plag
+ 2H2O + 2CO2[ ]fluid
¤
Al2Si4O10 OH( )2[ ]
prl
+ NaAl2Si3AlO10 OH( )2[ ]
pg
+ 2CaCO3[ ]cal
(1)
KAlSi3O8 + 2CaAl2Si2O8[ ]plag
+ 2H2O + 2CO2[ ]fluid
¤
Al2Si4O10 OH( )2[ ]
prl
+ KAl2Si3AlO10 OH( )2[ ]
ms
+ 2CaCO3[ ]cal
(2)
As the plagioclase is low in potassium (Fig. 2), it is more likely that reaction (1)
predominated during the interaction between the host mineral and the fluid. The
thermodynamic data of the individual components involved in the reaction were taken
into account to determine the P-T stability field of products and reactants (Appendix
B). The proposed reaction within fluid inclusions takes place if the rock P-T conditions
move into the stability field of the products. The position of the reaction curves in a P-T
diagram is dependent on the initial fluid composition (Fig. 8). A mixture of 50 mol%
H2O and 50 mol% CO2 defines the maximum reaction temperature in the amphibolite
facies, whereas the reaction temperatures are lower for all other mixtures. The
immiscibility fields of H2O-CO2 mixtures, according to Tödheide & Franck (1963), do
not interfere with the reaction for any fluid composition (Fig. 8 and Appendix B). The
immiscibility fields of CO2-rich fluids in the H2O-CO2-NaCl system also do not have
interference with the reaction (Appendix B). Reaction (1) occurs at temperatures well
below those given for metamorphic conditions in cDML by Markl & Piazolo (1998) and
therefore it must have taken place at a late stage of crustal evolution (post M4). The
presence of carbonate and sheet silicates in most fluid inclusions indicates that the
reaction has indeed proceeded. The occurrence of sheet silicates requires the presence
of H2O within the inclusions before the reaction took place.
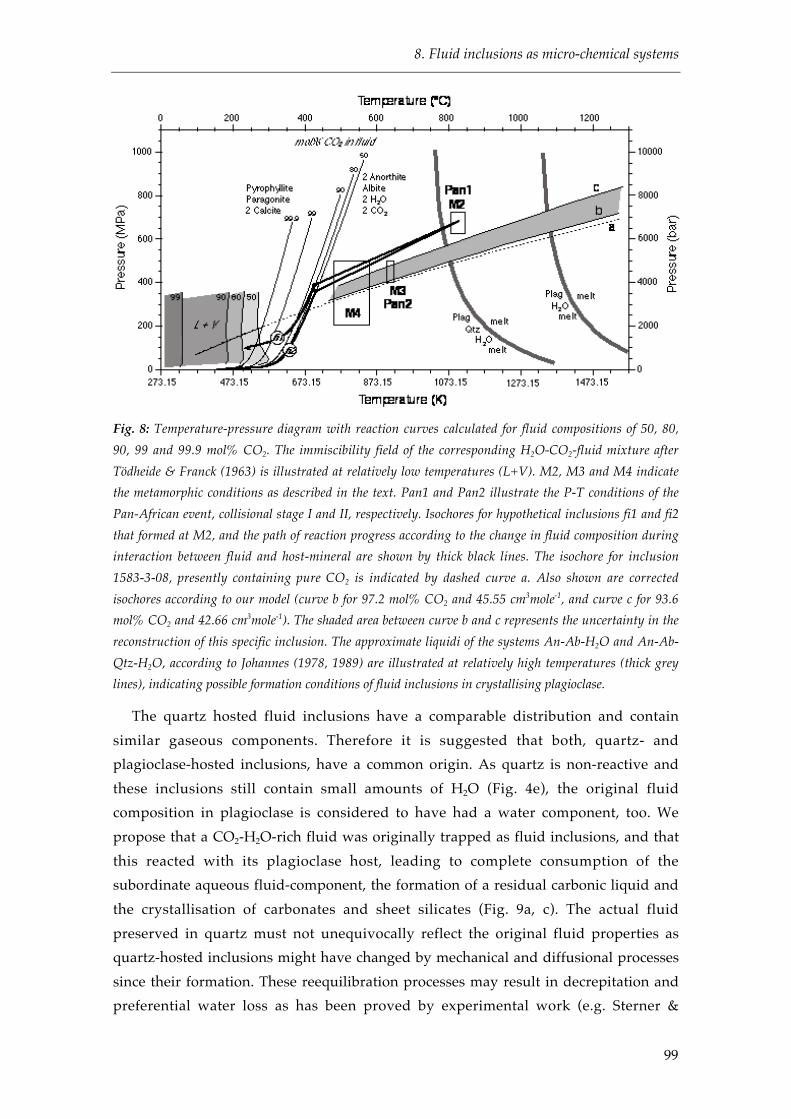
8. Fluid inclusions as micro-chemical systems
99
Fig. 8: Temperature-pressure diagram with reaction curves calculated for fluid compositions of 50, 80,
90, 99 and 99.9 mol% CO2. The immiscibility field of the corresponding H2O-CO2-fluid mixture after
Tödheide & Franck (1963) is illustrated at relatively low temperatures (L+V). M2, M3 and M4 indicate
the metamorphic conditions as described in the text. Pan1 and Pan2 illustrate the P-T conditions of the
Pan-African event, collisional stage I and II, respectively. Isochores for hypothetical inclusions fi1 and fi2
that formed at M2, and the path of reaction progress according to the change in fluid composition during
interaction between fluid and host-mineral are shown by thick black lines. The isochore for inclusion
1583-3-08, presently containing pure CO2 is indicated by dashed curve a. Also shown are corrected
isochores according to our model (curve b for 97.2 mol% CO2 and 45.55 cm3mole-1, and curve c for 93.6
mol% CO2 and 42.66 cm3mole-1). The shaded area between curve b and c represents the uncertainty in the
reconstruction of this specific inclusion. The approximate liquidi of the systems An-Ab-H2O and An-Ab-
Qtz-H2O, according to Johannes (1978, 1989) are illustrated at relatively high temperatures (thick grey
lines), indicating possible formation conditions of fluid inclusions in crystallising plagioclase.
The quartz hosted fluid inclusions have a comparable distribution and contain
similar gaseous components. Therefore it is suggested that both, quartz- and
plagioclase-hosted inclusions, have a common origin. As quartz is non-reactive and
these inclusions still contain small amounts of H2O (Fig. 4e), the original fluid
composition in plagioclase is considered to have had a water component, too. We
propose that a CO2-H2O-rich fluid was originally trapped as fluid inclusions, and that
this reacted with its plagioclase host, leading to complete consumption of the
subordinate aqueous fluid-component, the formation of a residual carbonic liquid and
the crystallisation of carbonates and sheet silicates (Fig. 9a, c). The actual fluid
preserved in quartz must not unequivocally reflect the original fluid properties as
quartz-hosted inclusions might have changed by mechanical and diffusional processes
since their formation. These reequilibration processes may result in decrepitation and
preferential water loss as has been proved by experimental work (e.g. Sterner &

8. Fluid inclusions as micro-chemical systems
100
Bodnar, 1989; Bakker & Jansen, 1991). Decrepitation clusters and a variation in the
enclosed amount of water have been observed in fluid inclusions in quartz (Fig. 4f).
The lack of any carbonates or sheet silicates in some of the plagioclase-hosted CO2-
rich inclusions and the variable volume fraction of the reaction products can be
explained by a variation in the original fluid composition. Furthermore, the same
reequilibration processes that have previously been described for quartz may have
effected the plagioclase. Microstructures preserved in plagioclase crystals imply, that
these processes have occurred (Fig. 3). Kinetics may be responsible for the non-
completion of reactions which again results in a diversity of inclusion contents.
Fig. 9: Schematic reaction progress in a closed fluid-inclusion system with an originally homogeneous
H2O-CO2 fluid not containing any solid phases at high P-T. a) No reaction for inclusions in quartz and
part of the plagioclase. b) After occurrence of part of the reaction in only plagioclase. c. After complete
consumption of H2O and formation of larger calcite, paragonite and pyrophyllite volume fractions.

8. Fluid inclusions as micro-chemical systems
101
The model
Considering a fluid inclusion as a closed system, a quantitative model was
established to describe volumetric and compositional changes caused by reaction (1).
Two hypothetical fluid inclusions of the H2O-CO2 binary (fi1 and fi2 in Fig. 8) are
assumed to have been trapped at M2 metamorphic conditions, with initial fluid
compositions of 80 mol% CO2 and 50 mol% CO2, respectively (molar volumes are 38.93
cm3mol-1 and 33.32 cm3mol-1 respectiveley). With favourable kinetics, both inclusions
start to react when the system reaches the corresponding reaction curves at about 450
°C. With progressive reaction, these inclusions develop in different ways. The molar
volume of fi1 reaches a maximum value of about 59.5 cm3mol-1 at lower temperatures,
which is a nearly pure CO2 liquid-like fluid, whereas fi2 continuously increases its
molar volume up to a vapour-like fluid (Fig. 10a). The fluid composition in fi2 does not
change. The Fi1 volume percentages will be 10.7 calcite, 18.5 pyrophyllite and 19.1
paragonite after the reaction is nearly complete at lower temperatures (Fig. 10b). The
volume percentages of solid reaction products in fi2 are higher, i.e. 16.9 calcite, 29.3
pyrophyllite and 30.3 paragonite. These amounts may not be reached if the reaction
ceases when the kinetics becomes unfavourable at lower temperatures. Vice versa, the
evaluation of the amount of reaction products allows the recalculation of the
composition and molar volume of the initial fluid.
Using a natural example, fluid inclusion 1583-3-08 (Table 1) presently contains a
dense pure CO2 liquid, c. 5 vol% calcite and c. 7 vol% of paragonite and pyrophyllite as
visually estimated, corresponding to 1.355 mmole and 0.54 mmole, respectively, in a
hypothetical fluid inclusion of 1 cm3 total volume. At 1.0 °C, its CO2 content
homogenises to the liquid phase, which corresponds to a molar volume of 47.77
cm3mol-1, or a total mount of 18.42 mmole CO2 in 1 cm3 total volume. In order to model
the density change of the fluid phase, the equation from Andersen et al. (1984) has been
slightly modified to take into consideration the temperature and pressure effect on
molar volumes of the solid phases (from Berman, 1988). To reverse reaction (1) and
recalculate the original fluid composition and density, there are two possible
formulations with which to start. First, the estimated amount of bound H2O in sheet
silicates (7 vol%) is used as fixed parameter. In this case, 0.54 mmole of H2O and CO2 is
calculated to have been consumed by the reaction with the formation of 0.54 mmole
calcite and sheet silicates. Therefore the original inclusion must have contained 0.54
mmole H2O and 18.96 mmole CO2 (i.e. 2.8 mol% H2O and 97.2 mol% CO2) resulting in a
molar volume of this fluid of 45.55 cm3mol-1. However, the actual inclusion contains a
total amount of 1.355 mmole calcite, meaning that there is 0.815 mmole calcite in excess
(i.e. 3 vol%). This suggests that part of the observed carbonate may have been
accidentally trapped during initial inclusion formation, or perhaps the measurement of
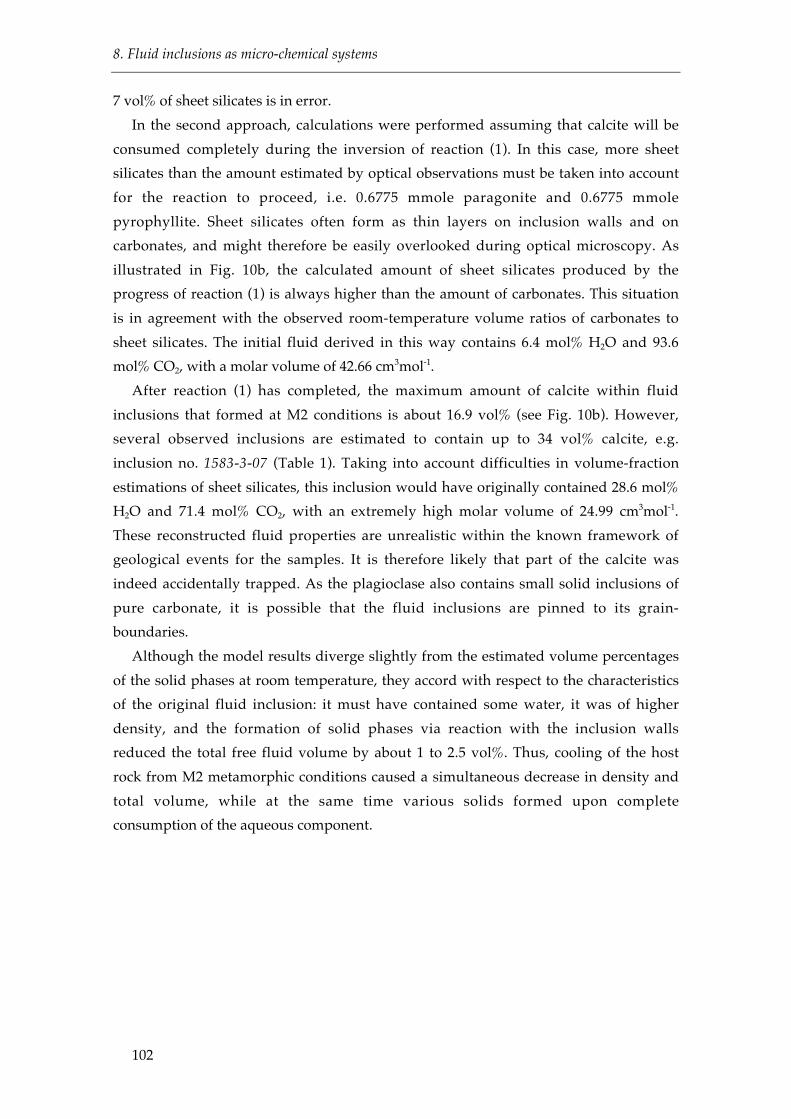
8. Fluid inclusions as micro-chemical systems
102
7 vol% of sheet silicates is in error.
In the second approach, calculations were performed assuming that calcite will be
consumed completely during the inversion of reaction (1). In this case, more sheet
silicates than the amount estimated by optical observations must be taken into account
for the reaction to proceed, i.e. 0.6775 mmole paragonite and 0.6775 mmole
pyrophyllite. Sheet silicates often form as thin layers on inclusion walls and on
carbonates, and might therefore be easily overlooked during optical microscopy. As
illustrated in Fig. 10b, the calculated amount of sheet silicates produced by the
progress of reaction (1) is always higher than the amount of carbonates. This situation
is in agreement with the observed room-temperature volume ratios of carbonates to
sheet silicates. The initial fluid derived in this way contains 6.4 mol% H2O and 93.6
mol% CO2, with a molar volume of 42.66 cm3mol-1.
After reaction (1) has completed, the maximum amount of calcite within fluid
inclusions that formed at M2 conditions is about 16.9 vol% (see Fig. 10b). However,
several observed inclusions are estimated to contain up to 34 vol% calcite, e.g.
inclusion no. 1583-3-07 (Table 1). Taking into account difficulties in volume-fraction
estimations of sheet silicates, this inclusion would have originally contained 28.6 mol%
H2O and 71.4 mol% CO2, with an extremely high molar volume of 24.99 cm3mol-1.
These reconstructed fluid properties are unrealistic within the known framework of
geological events for the samples. It is therefore likely that part of the calcite was
indeed accidentally trapped. As the plagioclase also contains small solid inclusions of
pure carbonate, it is possible that the fluid inclusions are pinned to its grain-
boundaries.
Although the model results diverge slightly from the estimated volume percentages
of the solid phases at room temperature, they accord with respect to the characteristics
of the original fluid inclusion: it must have contained some water, it was of higher
density, and the formation of solid phases via reaction with the inclusion walls
reduced the total free fluid volume by about 1 to 2.5 vol%. Thus, cooling of the host
rock from M2 metamorphic conditions caused a simultaneous decrease in density and
total volume, while at the same time various solids formed upon complete
consumption of the aqueous component.
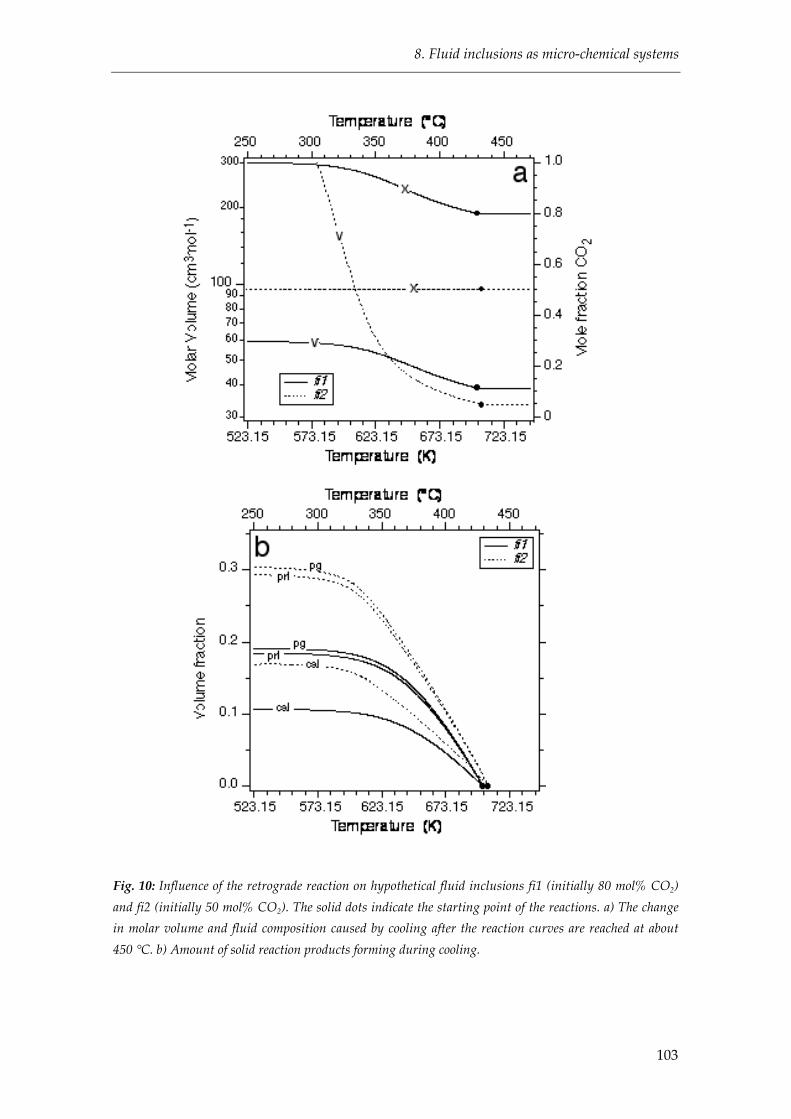
8. Fluid inclusions as micro-chemical systems
103
Fig. 10: Influence of the retrograde reaction on hypothetical fluid inclusions fi1 (initially 80 mol% CO2)
and fi2 (initially 50 mol% CO2). The solid dots indicate the starting point of the reactions. a) The change
in molar volume and fluid composition caused by cooling after the reaction curves are reached at about
450 °C. b) Amount of solid reaction products forming during cooling.
8. Fluid inclusions as micro-chemical systems
104
Reconstructed isochores
Recalculated isochores of the assumed original fluid compositions and densities, e.g.
lines b and c in Fig. 8, are shifted towards higher pressures than those estimated for the
present state of inclusions at room temperature (line a in Fig. 8.8). Considering the
fluid inclusions formed at an early stage of the rock development, they may have
originated immediately after crystallisation of a plagioclase-rich melt of intermediate
composition. The pseudo-secondary character of most inclusion trails confirms this
early formation at granulite facies conditions. As the presence of a host crystal is a
necessity for the formation of fluid inclusions, the liquidus of the plagioclase system
theoretically defines the maximum formation conditions. However, it is more likely
that inclusions formed shortly after completion of the crystallisation of the magma, i.e.
at solidus conditions. The original magma systems must have contained certain
amounts of dissolved CO2 and H2O. The system albite-anorthite-H2O (Johannes, 1978)
has a liquidus at about 1100 °C at 500 MPa water pressure (Fig. 8.8). The addition of
small amounts of quartz to this system can drastically lower the liquidus temperature
to about 800 °C at 500 MPa and to about 900 °C at 200 MPa (Johannes, 1978, 1989). Data
for a CO2 bearing system are not available, but it will transpose both liquidus and
solidus to higher pressures at a selected temperature.
The intersection of the corrected isochores from fluid inclusion 1583-3-08 (Fig. 8.8)
with the albite-anorthite-H2O liquidus are at about 1080 °C and 650-730 MPa.
However, much higher pressures will be obtained from those inclusions that contain a
higher volume percentage of reaction products. This may give important constraints on
possible P-T conditions for the emplacement of the anorthositic magmas between M1
and M2 metamorphism (Jacobs et al., 1998), which could not be estimated by other
means.
Conclusions
The combined use of laser-Raman spectrometry and microthermometry has
characterised a complete micro-chemical reaction system hosted by plagioclase.
Submicroscopic phases (fluid and solid) covering inclusion walls, and optically visible
solids were identified as carbonates, muscovite/paragonite and pyrophyllite, together
with a nearly pure, dense CO2 fluid phase. These solids are assumed to have developed
as products of reaction between the fluid and its host. The OH-bearing sheet silicates
are interpreted as proof of an aqueous component within the originally entrapped
fluid. The amount of H2O initially available in the trapped fluid is considered to
control the extent of the retrograde reaction. With all involved phases identified, the
reaction was thermodynamically modelled and the P-T stability conditions of products

8. Fluid inclusions as micro-chemical systems
105
and reactants were determined, as a function of the fluid compositions. Quantitative
analysis on the basis of volume estimates of the solid reaction-products found in
plagioclase-hosted fluid inclusions were used to recalculate the composition and molar
volume of the original fluid. The deviation in the ratio of carbonate to sheet silicates
formed within the hypothetical and the real inclusions lies within the uncertainty
limits of the method. Thin layers of sheet silicates can be easily overlooked during
microscopy and it is possible that part of the carbonate was accidentally trapped at the
time of inclusion formation. The results have shown that detailed fluid inclusion
studies combined with thermodynamic modelling can be used to trace back and
evaluate the changes that a fluid inclusion has undergone since its formation. Thus,
valuable petrogenetic information can be derived and used for more precise estimation
of P-T conditions during earlier metamorphic stages or fluid entrapment.
Acknowledgements
This work is part of the PhD thesis of B. Kleinefeld funded by the FNK, University
of Bremen, Germany, reference number 05/134/7. The samples and field data were
collected during the GeoMaud Expedition 95/96, directed by the Bundesanstalt für
Geowissenschaften und Rohstoffe (BGR), Germany, and kindly provided by M. Olesch.
The technical support of V. Kolb, H. Mühlhans and P. Witte is greatly appreciated. L.
Diamond kindly made constructive remarks on the manuscript and improvements on
the English. B.K. is grateful for the use of technical facilities of the Institute of
Geosciences, Mineralogy & Petrology, University of Leoben, Austria. T. Andersen and
W. Heinrich are thanked for constructive reviewing.

8. Fluid inclusions as micro-chemical systems
106
Appendix A
Table A1.: Microprobe analysis of plagioclase around the fluid inclusion illustrated in Fig. 5.
Sample O.-v.-Gruber anorthosite - sample no.1583
Mineral Plagioclase
Analysis p.1 p.2 p.3 p.4 p.5 p.6 p.7 p.8 p.9 q.1 q.2 q.3 q.4 q.5 q.6
SiO2 54.57 55.05 55.15 56.03 54.73 54.50 56.34 55.66 56.36 56.19 55.52 56.01 56.31 53.97 54.97
TiO2 0.00 0.00 0.00 0.00 0.00 0.00 0.00 0.00 0.00 0.00 0.00 0.00 0.00 0.00 0.00
Al2O3 27.40 27.23 27.11 27.14 28.27 28.23 26.48 26.58 25.89 27.02 27.01 26.63 26.67 27.20 27.04
Cr2O3 0.00 0.00 0.00 0.00 0.00 0.00 0.00 0.00 0.00 0.00 0.00 0.00 0.00 0.00 0.00
FeO 0.10 0.17 0.17 0.10 0.07 0.15 0.10 0.12 0.07 0.05 0.17 0.05 0.07 0.17 0.10
Fe2O3 0.00 0.00 0.00 0.00 0.00 0.00 0.00 0.00 0.00 0.00 0.00 0.00 0.00 0.00 0.00
MgO 0.05 0.05 0.05 0.00 0.00 0.00 0.10 0.00 0.05 0.00 0.05 0.05 0.00 0.05 0.10
MnO 0.00 0.00 0.00 0.00 0.00 0.00 0.00 0.00 0.00 0.00 0.00 0.00 0.00 0.00 0.00
CaO 10.13 10.01 10.24 10.05 9.63 9.69 9.19 9.22 8.92 9.96 10.30 10.31 10.15 10.30 10.28
Na2O 5.18 5.37 5.37 5.45 5.26 5.26 5.70 5.08 5.70 5.62 5.19 5.45 5.36 5.37 4.92
K2O 0.21 0.27 0.25 0.22 0.23 0.23 0.26 0.22 0.27 0.17 0.25 0.23 0.25 0.24 0.21
Total 97.64 98.15 98.34 98.99 98.19 98.06 98.17 96.88 97.26 99.01 98.49 98.73 98.81 97.30 97.62
Si 2.51 2.52 2.52 2.54 2.50 2.50 2.57 2.57 2.59 2.55 2.53 2.55 2.56 2.50 2.53
Al(IV) 0.00 0.00 0.00 0.00 0.00 0.00 0.00 0.00 0.00 0.00 0.00 0.00 0.00 0.00 0.00
Al 1.49 1.47 1.46 1.45 1.52 1.52 1.42 1.45 1.40 1.44 1.45 1.43 1.43 1.49 1.47
Ti 0.00 0.00 0.00 0.00 0.00 0.00 0.00 0.00 0.00 0.00 0.00 0.00 0.00 0.00 0.00
Cr 0.00 0.00 0.00 0.00 0.00 0.00 0.00 0.00 0.00 0.00 0.00 0.00 0.00 0.00 0.00
Fe2+ 0.00 0.01 0.01 0.00 0.00 0.01 0.00 0.00 0.00 0.00 0.01 0.00 0.00 0.01 0.00
Fe3+ 0.00 0.00 0.00 0.00 0.00 0.00 0.00 0.00 0.00 0.00 0.00 0.00 0.00 0.00 0.00
Mg 0.00 0.00 0.00 0.00 0.00 0.00 0.01 0.00 0.00 0.00 0.00 0.00 0.00 0.00 0.01
Mn 0.00 0.00 0.00 0.00 0.00 0.00 0.00 0.00 0.00 0.00 0.00 0.00 0.00 0.00 0.00
Ca 0.50 0.49 0.50 0.49 0.47 0.48 0.45 0.46 0.44 0.48 0.50 0.50 0.49 0.51 0.51
Na 0.46 0.48 0.48 0.48 0.47 0.47 0.50 0.45 0.51 0.49 0.46 0.48 0.47 0.48 0.44
K 0.01 0.02 0.01 0.01 0.01 0.01 0.02 0.01 0.02 0.01 0.01 0.01 0.01 0.01 0.01
Ab 0.513 0.499 0.505 0.498 0.496 0.497 0.464 0.494 0.456 0.490 0.515 0.504 0.504 0.507 0.529
An 0.474 0.485 0.479 0.489 0.490 0.489 0.521 0.492 0.528 0.500 0.470 0.482 0.481 0.479 0.458
Or 0.013 0.016 0.016 0.013 0.014 0.014 0.015 0.014 0.016 0.010 0.015 0.014 0.015 0.014 0.013

8. Fluid inclusions as micro-chemical systems
107
Appendix B
Thermodynamics of Reaction
The coefficients in the formula for heat capacity and standard state properties of the
minerals and gases involved in reaction 1 and 2 are taken from Berman (1988). The
temperature and pressure dependency of molar volumes of minerals is also taken from
Berman (1988). The Gibbs free energy calculation (Eq. B1) was used to determine the
reaction in p-T-V-x space.
D RG = n iGi
i
 = 0 (B1a)
D RG = Gprl + Gpg + 2Gcal - Gab - Gan - 2GH 2O- 2GCO2
= 0 (B1b)
where n and G are the stoichiometric coefficient and the molar Gibbs free energy of
the indicated phase, respectively. For each phase the change of Gibbs free energy with
temperature, pressure and composition is expressed according to equation (B2).
dG =∂G
∂T
Ê Ë
ˆ ¯ P,n i
dT +∂G
∂P
Ê Ë
ˆ ¯ T ,n i
dP +∂G
∂ni
Ê
Ë Á ˆ
¯ ˜
T ,P,n j
dnii
 (B2a)
∂G
∂ni
Ê
Ë Á Á
ˆ
¯ ˜ ˜ T ,P,n j
= mi (B2b)
where T, P, and n are temperature, pressure and the amount of component i given
in moles, respectively. µi is the chemical potential of component i. The reaction (1)
involves a fluid mixture and a plagioclase mixture, whereas the reaction products
pyrophyllite, paragonite and calcite are pure phases. Although, paragonite may
include a calcium component and calcite may include a sodium component, the mass
balance easily indicates that both margarite and sodium carbonate can not be obtained
from the specific reactants in reaction (1), which is confirmed by Raman
microspectrometry. The chemical potential of a component i in a mixture is calculated
according to equation (B3).
mi(T, P, x) = mi
pure(T ,P) + RT ln ai( ) (B3)
where x and a are the mole fraction and the activity of component i, respectively.
This equation is also valid for pure phases, where the activity equals unity. The
standard state condition for the fluid mixture is the thermodynamic properties of the
pure components at the given temperature and 0.1 MPa, whereas properties of the

8. Fluid inclusions as micro-chemical systems
108
pure components at the given temperature and pressure is the standard condition for
the plagioclase. The chemical potential at standard conditions is obtained from the
integration of the temperature and pressure dependent parameters in equation (B2a)
(eq. B4),
∂G
∂T
Ê Ë
ˆ ¯ P0 ,n iT0
T
Ú dT = Cp( )P0 ,n i
dT - S0 ⋅ T - T0( ) - T ⋅
Cp
T
Ê Ë
ˆ ¯ P0 , ni
dTT0
T
ÚT0
T
Ú (B4a)
∂G
∂P
Ê Ë
ˆ ¯ T ,n i
dPP0
P
Ú = V( )T ,n i dPP0
P
Ú (B4b)
where S0 is the standard state entropy, Cp is the heat capacity at constant pressure, V
is the molar volume, and T0 and P0 are the standard conditions, respectively.
The activity of fluid components is defined by the fugacities (f) of H2O and CO2 (eq.B5),
ai =fi(T,P)
fipure(T, P)
(B5)
where i is either H2O or CO2. The fugacity of H2O and CO2 in gas mixtures was
calculated with the modified Redlich-Kwong equation of state according to Holloway
(1977, 1981) and Flowers (1979). This equation is the most accurate available
thermodynamic model representing experimental fugacities of CO2-H2O fluids within
the temperature and pressure limits of the reaction. The fugacity of fluid components
in the ternary H2O-CO2-NaCl system are calculated with the equation of state from
Anderko & Pitzer (1993) and Duan et al. (1995). The boundaries of the immiscibility
field of CO2-rich fluid mixtures are highly inaccurately estimated by this equation.
Therefore, it is only applied to homogeneous mixtures.
The activities of albite and anorthite in the plagioclase are obtained from a non-ideal
mixing model for ternary feldspar according to Elkins & Grove (1990). This model is an
empirical fit to experimental data on the feldspar composition at temperatures between
600 and 900 ºC, and at pure H2O pressures between 100 MPa and 300 MPa. Although
reaction (1) occurs at temperatures well below this fit, it is assumed that the estimated
ternary Margules expression is also valid at lower temperatures.
The effect of several mixing models on the fluid and the plagioclase of reaction (1) is
illustrated in Fig. B1.
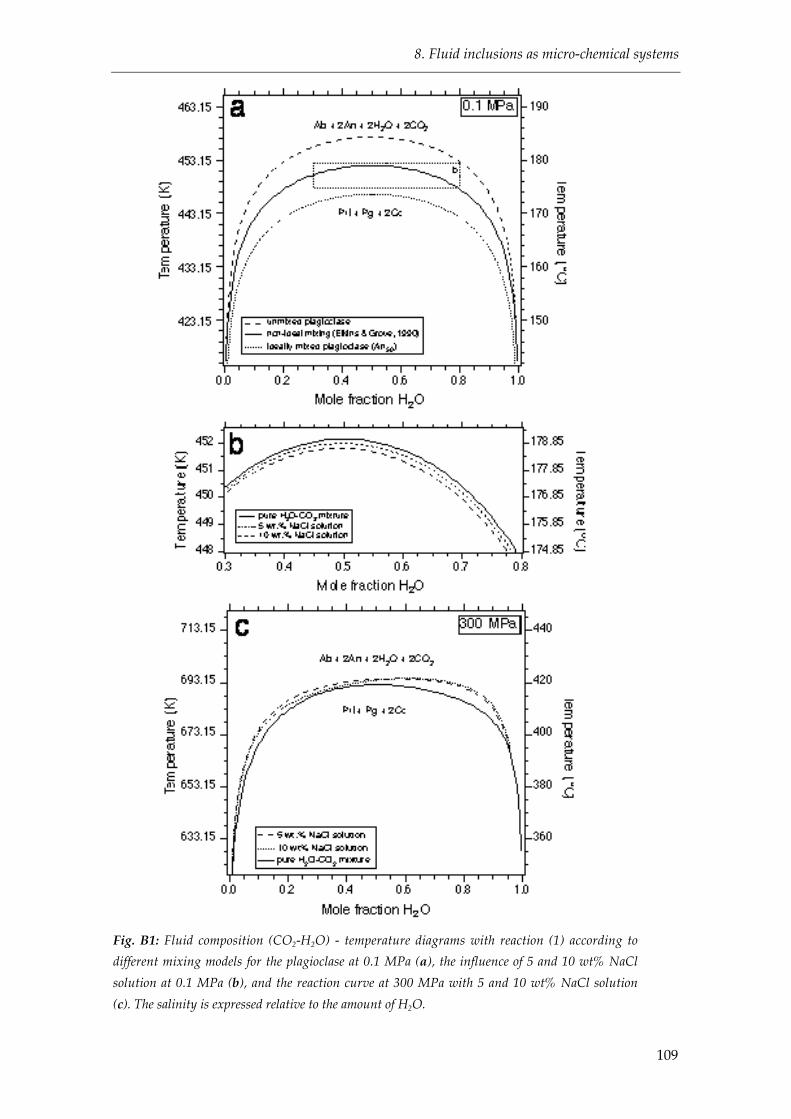
8. Fluid inclusions as micro-chemical systems
109
Fig. B1: Fluid composition (CO2-H2O) - temperature diagrams with reaction (1) according to
different mixing models for the plagioclase at 0.1 MPa (a), the influence of 5 and 10 wt% NaCl
solution at 0.1 MPa (b), and the reaction curve at 300 MPa with 5 and 10 wt% NaCl solution
(c). The salinity is expressed relative to the amount of H2O.

8. Fluid inclusions as micro-chemical systems
110
For any pressure, the maximum reaction temperature is defined at a fluid
composition of approximately 50 mol% CO2 and 50 mol% H2O. The ideal mixing model
for plagioclase causes a decrease of about 10 °C of the reaction temperature for any
fluid composition compared to a model with unmixed plagioclase (Fig. B1a). The non-
ideal mixing model of plagioclase according to Elkins & Grove (1990) puts the reaction
curve about 5 °C higher than the ideal mixing model. Addition of small amounts of
NaCl to the fluid mixture has a minor effect on the reaction temperature (Fig. B1b). In
H2O-rich fluids the reaction temperature is decreased by 0.2 and 0.5 ° for a 5 wt% and a
10 wt% NaCl solution, respectively. Additional NaCl in CO2-rich fluids is a negligible
factor. At higher pressures (Fig. B1c), the reaction curve is asymmetrical in a T-x
diagram due to differences in the activities of H2O and CO2. The immiscibility field of
H2O-CO2 mixtures is elevated to higher pressures and temperatures if certain amounts
of NaCl are added to the system (Fig. B2).
Fig. B2: Temperature - pressure diagram with the solvi of H2O-CO2 fluid mixtures (dashed curves) and
the solvi of H2O-CO2 fluid mixtures with 6 wt% NaCl (solid curves). The numbers 80, 50, and 20 denote
the mole percentage of CO2. The superscript S indicates the addition of 6 wt% NaCl to the corresponding
fluid. The open circles are experimental data from Gehrig (1984). KD marks the corrected solvus of a
21.01 mol% CO2, 77.47 mol% H2O and 1.52 mol% NaCl fluid mixture (i.e. 6 wt% NaCl) according to
Krüger & Diamond (2001). The reaction is illustrated for a 20, 50 and 80 mol% CO2 fluid mixture.

8. Fluid inclusions as micro-chemical systems
111
Experimental data from Tödheide & Franck (1963) and Gehrig (1980) illustrate, that
the addition of 6 wt% NaCl to a fluid mixture of 50 mol% H2O and 50 mol% CO2 raises
its solvus about 100 °C at variable pressures. A H2O-rich fluid mixture has a large
expansion of its immiscibility field to low pressures and higher temperatures (see also
Krüger & Diamond, 2001), whereas the effect of the addition of NaCl diminishes with
higher CO2 contents. The reaction (1) between the entrapped fluids and the plagioclase
appears to proceed mainly outside the immiscibility fields of salt-free systems. In a 6
wt% NaCl solution, only H2O-rich fluids, i.e. > 50mol% H2O, interfere with the reaction
at about 380 °C, whereas CO2-rich fluids remain homogeneous at reaction conditions.
Within fluid inclusions in quartz salinities of < 6 wt% NaCl have been measured.
Therefore, it can be concluded that there is no interference between the reaction and
the immiscibility field at any conditions.

8. Fluid inclusions as micro-chemical systems
112
References
Anderko, A. & Pitzer, K.J., 1993. Equation of state representation of phase equilibriaand volumetric properties of the system NaCl-H2O above 573 K. Geochimica etCosmochimica Acta, 57, 1657-1680.
Andersen, T., O' Reilly, S. Y. & Griffin, W. L., 1984. The trapped fluid phase in uppermantle xenoliths from Victoria, Australia; implications for mantle metasomatism.Contributions to Mineralogy and Petrology, 88, 72-85.
Bakker, R. J. & Jansen, J. H. B., 1991. Experimental post-entrapment water loss fromsynthetic CO2-H2O inclusions in natural quartz. Geochimica et Cosmochimica Acta, 55,
2215-2230.Bakker, R. J., 1997. Clathrates: Computer Programs to calculate fluid inclusion V-X
properties using clathrate melting temperatures. Computers & Geosciences, 23, 1-18.Bakker, R. J., in press. Package Fluids1 Computer programs for the analysis of fluid
inclusion data and general fluid properties research. Chemical Geology.Bauer, W., Jacobs, J. & Paech, H.-J., in press. Structural evolution of the Crystalline
Basement of central Dronning Maud Land, East Antarctica. Geologisches Jahrbuch, 96.Berman, R. G., 1988. Internally-consistent thermodynamic data for minerals in the
system Na2O-K2O-CaO-MgO-FeO-Fe2O3-Al2O3-SiO2-TiO2-H2O-CO2. Journal ofPetrology, 29, 445-522.
Bischoff, W. D., Sharma, S. K. & Mackenzie, F. T., 1985. carbonate disorder in syntheticand biogenetic magnesian calcites: a Raman spectral study. American Mineralogist,70, 581-589.
Davis, D. W., Lowenstein, T. K. & Spencer, R. J., 1990. Melting behaviour of fluidinclusions in laboratory grown halite crystals in the systems NaCl-H2O, NaCl-KCl-H2O, NaCl-MgCl2-H2O and NaCl-CaCl2-H2O. Geochimica et Cosmochimica Acta, 54,
591-601.Duschek, W., Kleinrahm, R. & Wagner, W., 1990. Measurement and correlation of the
(pressure, density, temperature) relation of carbon dioxide. II. Saturated-liquid andsaturated-vapour density and the vapour pressure along the entire coexistencecurve. Journal of Chemical Thermodynamics, 22, 841-864.
Duan, Z., Moller, N. & Weare, J.H., 1995. Equation of state for the NaCl-H2O-CO2
system: Prediction of phase equilibria and volumetric properties. Geochimica etCosmochimica Acta, 59, 2869-2882.
Elkins, L.T. & Grove, T.L., 1990. Ternary feldspar experiments and thermodynamicmodels. American Mineralogist, 75, 544-559.
Flowers, G. C., 1979. Correction of Holloway’s (1977) adaption of the modified Redlich-Kwong equation of state for calculation of fugacities of molecular species insupercritical fluids of geological interest. Contributions to Mineralogy and Petrology,69, 315-318.
Gehrig, M., 1980. Phasengleichgewichte und PVT-daten ternärer Mischungen ausWasser, Kohlendioxid und Natriumchlorid bis 3 kbar und 550 °C. PhD Thesis,University Karlsruhe, Hochschulverlag, Freiburg.
Heinrich, W. & Gottschalk, M., 1995. Metamorphic reactions between fluid inclusionsand mineral hosts; I, Progress of the reaction calcite+quartz = wollastonite+CO2 innatural wollastonite-hosted fluid inclusions. Contributions to Mineralogy andPetrology, 122, 51-61.
8. Fluid inclusions as micro-chemical systems
113
Holloway, J. R., 1977. Fugacity and activity of molecular species in supercritical fluids.In: Fraser D. G. (ed.), Thermodynamics in geology. NATO ASI, Series D. Reidel,Dordrecht, pp 161-182.
Holloway, J. R., 1981. Compositions and volumes of supercritical fluids in the earth’scrust. In: Hollister, L. S. & Crawford, M. L. (ed.), Short Course in Fluid inclusions:Application to Petrology, pp 13-38.
Jacobs, J., Fanning, C. M., Henjes, K. F., Olesch, M. & Paech, H. J., 1998. Continuation ofthe Mozambique Belt into East Antarctica; Grenville-age metamorphism andpolyphase Pan-African high-grade events in central Dronning Maud Land. Journal ofGeology, 106, 385-406.
Jacobs, J., Klemd, R., Fanning, C.M., Bauer, W. & Colombo, F, (in press). Extensionalcollapse of the Late Neoproterozoic/Early Palaeozoic East African/AntarcticOrogen in central Dronning Maud Land. Journal of the Geological Society of London.Special Publications.
Johannes, W., 1978. Melting of plagioclase in the system Ab-An-H2O and Qz-Ab-An-H2O at PH2O = 5 kbars, an equilibrium problem. Contributions to Mineralogy andPetrology, 66, 295-303.
Johannes, W., 1989. Melting of plagioclase-quartz assemblages at 2 kbar waterpressure. Contributions to Mineralogy and Petrology, 103, 270-276.
Krüger, Y. & Diamond, L. W., 2001. P-V-T-X properties of two H2O-CO2-NaCl mixturesup to 850 °C and 500 MPa: A synthetic fluid inclusion study. XVI ECROFI, Faculdadede Ciências do Porto, Departamiento de Geologia, Memória, 7, 241-244.
Markl, G. & Piazolo, S., 1998. Halogen-bearing minerals in syenites and high-grademarbles of Dronning Maud Land, Antarctica; monitors of fluid compositionalchanges during late-magmatic rock-rock interaction processes. Contributions toMineralogy and Petrology, 132, 246-268.
Mikhalsky, E. V., Beliatsky, B. V., Savva, E. V., Wetzel, H. U., Federov, L. V., Weiser, T.& Hahne, K., 1997. Reconnaissance Geochronologic Data on Polymetamorphic andIgneous rocks of the Humboldt Mountains, central Queen Maud Land, EastAntarctica. In: The Antarctic Region: Geological Evolution and Processes (ed. Ricci, C.A.), pp. 45-53, Terra Antarctica Publication, Siena, Italy.
Passchier, C. W. & Trouw, R. A. J., 1996. Microtectonics. Springer-Verlag, Berlin.Schulze, D. J., 1985. Evidence for primary kimberlite liquids in megacrysts from
kimberlites in Kentucky, USA. Journal of Geology, 93, 75-80.Svensen, H., Jamtveit, B., Yardley, B., Engvik, A. K., Austrheim, H. & Broman, C., 1999.
Lead and bromine enrichment in eclogite-facies fluids: Extreme fractionation duringlower crustal hydration. Geology, 27, 467-470.
Svensen, H., Jamtveit, B., Banks, D. A. & Austrheim, H., 2001. Halogen contents ofeclogite facies fluid inclusions and minerals; Caledonides, western Norway. Journalof Metamorphic Geology, 19, 165-178.
Span, R. & Wagner, W., 1996. A new equation of state for carbon dioxide covering thefluid region from the triple point temperature to 1100 K at pressures up to 800 MPa.Journal of Physical Chemistry Reference Data, 25, 1509-1596.
Sterner, S. M. & Bodnar, R. J., 1989. Synthetic fluid inclusion; VII, Re-equilibration offluid inclusions in quartz during laboratory simulated metamorphic burial anduplift. Journal of Metamorphic Geology, 7, 243-260.
Tödheide, K. & Franck, E. U., 1963. Das Zweiphasengebiet und die kritische Kurve imSystem Kohlendioxid-Wasser bis zu Drucken von 3500 bar. Zeitschrift PhysikalischeChemie. Neue Folge, 37, 387-401.

9. Conclusions
114
9. Conclusions
The results of this study are discussed at the end of the respective chapters.
Chapter 6: The petrography and fluid imprint of the basement lithologies exposed in
the central Petermannketten, and the resulting implications for secondary
charnockitisation, leaching processes, and the retrograde P-T-path
Chapter 7: The petrography of the O.-v.-Gruber anorthosite body, the assessment of the
actual fluid content in context of possible secondary modification of the original
fluid composition
Chapter 8: The possible post peak-metamorphic and retrograde P-T-path, and the
modelling of micro-chemical reactions of a CO2-H2O fluid with its plagioclase host
under formation of "step-daughter" phases, to evaluate the resulting volumetrical
and compositional change and its implications for isochore calculations.
In the following, the results of the preceding chapters are summarised.
The nature of rocks exposed in central Dronning Maud Land
It has been shown that the granulite-facies basement of the central Petermannketten,
and Otto-von-Gruber-Gebirge is largely composed of lithologies belonging to the
charnockite-anorthosite suite of rocks. Gneisses that were locally transformed into
arrested-type charnockites represent the (relatively) more superficial part, and the
anorthosite body the more igneous, intrusive deeper part of late Neoproterozoic/early
Palaeozoic granulitic continental crust.
Subsequent to charnockite formation, gneisses were subjected to alteration
processes leading to partial or complete orthopyroxene breakdown. This was
accompanied by the formation of hydrous mineral assemblages and severe leaching of
the previously darkish/greenish rocks. However, the complete orthopyroxene
decomposition was not necessarily connected to intense leaching. Some gneisses that
still display the typical charnockite colouring do not contain orthopyroxene any more,
and can thus not be included in a classification of charnockitic rocks in the narrowest
sense. This implies that declarations of the occurrence of charnockites, given by field
observations of "typical" rock colouring, have to be carefully reviewed and attested on
the basis of further scientific investigations. Magmatic bodies of charnockitic and
syenitic compositions remained nearly undeformed and unaltered. Their intrusion
could not unequivocal be linked with large scale alteration mechanisms (e.g., invasion
of a fluid phase responsible for leaching).
The anorthosite body reveals features typical of Precambrian massif-type
anorthosite complexes. It is composed of >90 vol% plagioclase, and the homogeneous
rock composition exhibits major changes only in discrete mylonitic shear zones. The
latter are characterised by secondary garnet growth and noritic or tonalitic

9. Conclusions
115
composition. The norites belong to the group of charnockitic rocks. Thus a further
example of "arrested-type" charnockitisation, connected with shear zone formation, is
shown to occur in central Dronning Maud Land. Additionally, iron-enrichment of
pyroxenes and the local concentration of opaque mineral phases most probably hint at
shear zone formation under the influence of an iron-rich fluid phase.
The fluids preserved in gneissic and anorthositic rocks
All fluid inclusions under investigation in this study reveal textural evidence of
primary (metamorphic) origin. No indication of secondary fluid influx or the presence
of various fluid generations is given. The most abundant type of fluids enclosed in all
samples under investigation is comprised of a CO2±N2 mixture. The nitrogen content
generally ranges between 2 - 5 mol%. This "dry" character of fluid inclusions hosted
either by plagioclase, quartz or garnet is in accordance with fluid inclusion studies that
have been performed on rocks from Precambrian granulite facies terranes worldwide.
For the anorthosite complex and shear zones, carbonic inclusions are the only type
of fluids present, and no conspicuous difference with regard to the fluid composition
can be detected. It is concluded that the preserved fluid has its origin in the magmatic
source of the "anorthositic" melts. Inclusion shapes and crystal microstructures imply
that the fluid inclusions and host minerals have undergone post-peak metamorphic
changes through reequilibration and recrystallisation processes. Furthermore, a
detailed examination of microsolids enclosed in some fluid inclusions has led to the
assertion that inclusions were also modified by back-reactions of the enclosed fluid
with its mineral host. Thus, the present-day CO2±N2 fluid only represents the residual
proportion of a more complex CO2±H2O±N2 fluid.
A CO2-H2O fluid that is trapped in minerals crystallising from an ascending magma,
or during prograde metamorphism (mechanisms accompanied by dehydration and
decarbonation) will most likely react with its host during retrogression, provided, that
the host is a reactive mineral. This results in the formation of microcrystals, which may
be detected as solid inclusions in fluid inclusions, and the partial or complete
consumption of the fluid components. In the O.-v.-Gruber anorthosite body the
enclosed solids are carbonates and sheet silicates. As it can be precluded that the
crystals were accidentally trapped they are presumed to have formed by "back-
reactions". They can only have formed if an aqueous phase had been present in the
inclusion at some stage in the past.
A detailed examination of fluid inclusion densities exhibits that plagioclase and
garnet from the shear zones have preserved the highest inclusion densities, whereas
lowest density values were found to be evenly distributed throughout all samples and
host minerals. High density isochores are in accordance with independent P-T-
constraints on peak-metamorphic conditions. Consequently, metamorphic minerals are

9. Conclusions
116
able to preserve the original metamorphic fluid, even though the influence of post-
entrapment changes are severe. The statement that CO2±N2 inclusions have preserved
the original fluid density is only seemingly contradictory to the argument that the
original fluid must have had a H2O component. Fluid compositions can vary on a small
local scale as each inclusion reacts individually on applied modification processes. The
fact that high densities were exclusively found in shear zone samples support this
observation, as the destruction and tapping of inclusions generally leads to a preferred
loss of H2O and N2.
In the light and dark coloured gneissic/charnockitic lithologies of the central
Petermannketten the overall fluid imprint is more complex. Besides inclusions that
contain a CO2±N2 mixture, H2O-salt inclusions and CO2-H2O±N2-salt fluids have been
detected. As they all give textural prove of primary (metamorphic) origin it is
concluded that none of the preserved fluids is connected with the late, structurally
controlled leaching processes. Salinities of the aqueous inclusions do not exceed 6.74
wt% NaCleq. Nevertheless, the occurrence of nahcolite as a real daughter mineral
indicates that high alkaline brines have at least locally been present at an earlier stage
in geologic evolution. This is in good agreement with studies from different granulite
terranes where rather recent findings of highly saline fluid phases are interpreted to
play an important role in charnockite formation, and questions the widely accepted
model that granulitisation is mainly governed by CO2-dominated fluids. The aqueous
phase was most probably captured during the prograde path, whereas the carbonic
fluid is suggested to originate from influx of external fluids during peak
metamorphism. However a more precise explanation of the origin of the fluid cannot
be given on the base of the available data.
The fluid inclusions which are predominantly hosted by quartz have been subjected
to substantial retrograde reequilibration processes, and no densities reflecting Pan
African high-grade metamorphism were found. The position of isochores only
correlates with the rough P-T estimates on retrograde conditions available from
independent P-T data.
Implications for a possible retrograde P-T-path
A selection of representative isochores from the different basement lithologies have
been correlated with P-T constraints based on mineral-equilibria data available from
other studies. Taking into account the evidence of reequilibration processes prevailing
during the retrograde evolution, the gradual decrease in fluid densities best fits a
clockwise P-T path and mineral-fluid equilibration during near isothermal
decompression.

9. Conclusions
117
Fig. 9.1: P-T-paths as derived from isochore data from the varying lithologies investigated during this
study. Path A is based on data from the O.-v.-Gruber anorthosite body and associated shear zones. Path B
is based upon fluid inclusion data gathered from gneissic and charnockitic samples from the central
Petermannketten. Boxes indicate P-T conditions of the successive metamorphic stages as proposed by
Markl & Piazolo (1998). Numbers indicate densities (in gcm-3) of fluids used for isochore calculations.
Dashed lines: H2O-salt inclusions; dash-dot-line: qtz-hosted CO2-N2 inclusions from Petermannketten;
solid lines: pl-hosted CO2-N2 inclusions from anorthosite and shear zones.
A compilation of the two independent P-T-paths (Fig. 9.1) described and favoured
in chapters 6.3 and 7.3 illustrates that the mode and P-T-conditions of retrogression are
in good accordance for both sample localities as to be expected from data gathered in a
close spatial relationship. Additionally, pressure estimates of c. 2.5 kbar for the
beginning of M4 are depicted, which argue for the low pressure range proposed by
Markl & Piazolo (1998). A similar P-T-path has been postulated from the Lützow Holm
Bay region, East Antarctica by Santosh & Yoshida (1992). The tendency of isochores
from the Petermannketten towards lower densities and the absence of high density
isochores from that region also illustrates the different potential of varying host
minerals to preserve peak metamorphic fluids. The higher resistance of plagioclase to
the application of stress seems to be reflected in the better ability of rocks that nearly
completely consist out of plagioclase to preserve metamorphic fluids. In the gneissic
basement lithologies, mechanically less stable quartz is much more abundant and
modification of fluid inclusions is much more profound.

References
118
References
Andersen, T., O'Reilly, S. Y. & Griffin, W. L., 1984. The trapped fluid phase in upper mantle
xenoliths from Vicotria, Australia: implications for mantle metasomatism. Contributions to
Mineralogy and Petrology, 88, 72-85.
Andersen, T., Burke, E. A. J., Austrheim, H., 1989. Nitrogen-bearing, aqueous fluid inclusions in
some eclogites from the Western Gneiss Region of the Norwegian Caledonides. Contributions to
Mineralogy and Petrology, 103, 153-165.
Aranovich, L. Y. & Newton, R. C., 1998. H2O activity in concentrated KCl and KCl-NaCl solutions at
high temperatures and pressures measured by the brucite-periclase equilibrium. Contributions to
Mineralogy and Petrology, 127, 261-271.
Ashwal, L. D., 1993. Anorthosites. Springer, Berlin, Heidelberg, New York, 422 pp.
Audétat, A. & Günher, D., 1999. Mobility and H2O loss from fluid inclusions in natural quartz
crystals. Contributions to Mineralogy and Petrology, 137, 1-14.
Bakker, R. J., & Jansen, J. B. H., 1994. Preferential water leakage from fluid inclusions by means of
mobile dislocations. Nature, 345, 58-60.
Bakker, R. J., 1997. Clathrates: Computer Programs to calculate fluid inclusion V-X properties usingclathrate melting temperatures. Computers & Geosciences, 23, 1-18.
Bakker, R. J., 1998. Improvements in clathrate modelling; II, The H2O-CO2-CH4-N2-C2H6 fluidsystem. In: Gas hydrates; relevance to world margin stability and climate change. (eds. Henriet, J.-P. &Mienert, J.) Geological Society Special Publications, pp. 75-105, Geological Society of London,
London, United Kingdom.
Bakker, R.J., 1999. Adaption of the Bowers & Helgeson (1983) equation of state to the H2O-CO2-CH4-
N2-NaCl system. Chemical Geology, 154, 225-236.
Bakker, R. J. & Mamtani, M. A., 2000. Fluid inclusions as metamorphic process indicators in the
Southern Aravali Mountain Belt (India). Contributions to Mineralogy and Petrology, 139, 163-179.
Bakker, R. J., in press. Package Fluids1 Computer programs for the analysis of fluid inclusion dataand general fluid properties research. Chemical Geology.
Bauer, W., Jacobs, J. & Paech, H. J., 1996. Structural evolution of polyphase metamorphosed
basement rocks in central Dronning Maud Land, East Antarctica. In: Proceedings of the UNESCO-
IUGS-IGCP-368 international field workshop on the Proterozoic continental crust of southern India.
(eds. Santosh & M ; Yoshida) Gondwana Research Group Miscellaneous Publication, 4-6, Osaka City
University, Department of Geosciences, Faculty of Science, Gondwana Research Group, Osaka,
Japan.
Bauer, W., Jacobs, J. & Paech, H.-J., 2003. Structural evolution of the Crystalline Basement of central
Dronning Maud Land, East Antarctica. Geologisches Jahrbuch, B 96.
Becke, F, 1903. Über Mineralbestand und Struktur der kristallinen Schiefer. IX. Session du Congres
geologique internationaux, Compte rendu. Part 2, 553-570.
Berman, R. G., 1988. Internally consistent thermodynamic dataset for minerals in the system Na2O-
K2O-CaO-MgO-FeO-Fe2O3-Al2O3-SiO2-TiO2-H2O-CO2. Journal of Petrology, 29, 445-552.

References
119
Bhattacharya, A. & Sen, S. K., 1986. Granulite metamorphism, fluid buffering, and dehydration
melting in the Madras charnockites and metapelites. Journal of Petrology, 27, 1119-1141.
Black, R. & Liegeois, J. P., 1993. Cratons, mobile belts, alkaline rocks and continental lithospheric
mantle; the Pan-African testimony. Journal of the Geological Society of London, 150 (Part 1), 89-98.
Blom, K. A., 1988. Fluid inclusions from the Suosmujarvi area, Southwest Finland. Lithos, 21, 263-
278.
Bodnar, R. J. Binns, P. R. & Hall, D. L., 1989. Synthetic fluid inclusions; VI, Quantitative evaluation
of the decrepitation behaviour of fluid inclusions in quartz at one atmosphere confining
pressure. Journal of Metamorphic Geology. 7; 2, Pages 229-242.
Bodnar, R. J., 1993. Revised equation and table for determining the freezing point depression of
H2O-NaCl solutions. Geochimica et Cosmochimica Acta, 57, 683-684.
Bodnar, R. J. & Vityk, M. O., 1994. Applications of fluid inclusions in tectonic reconstruction;
microthermometric analysis. In: Fifth biennial Pan-American conference on Research on fluid
inclusions. (eds. Izquierdo M. G., Suarez-A. M. C., Guevara G. M., Vanko D., Viggiano G.J.C.),
Program and Abstracts; Biennial Pan-American Conference on Research on Fluid Inclusions, 5,
10.
Bond, G. C., Nickeson, P. A. & Kominz, M. A., 1984. Breakup of a supercontinent between 625 Ma
and 555 Ma; new evidence and implications for continental histories. Earth and Planetary Science
Letters, 70(2), 325-345.
Borg, S. G. & DePaolo, D. J., 1994. Laurentia, Australia, and Antarctica as a late Proterozoic
supercontinent; constraints from isotopic mapping. Geology 22, 307-310.
Bowers, T. S. & Helgeson, H. C., 1983. Calculation of the thermodynamic and geochemical
consequences of nonideal mixing in the system H2O-CO2-NaCl on phase relations in geologic
systems; equation of state for H2O-CO2-NaCl fluids at high pressures and temperatures.
Geochimica et Cosmochimica Acta, 47, 1247-1275.
Brewster , D., 1823. Notice respecting the existence of the new fluid in a large cavity in a specimen
of sapphire. Edinburgh Journal of Science, 6, 155-156.
Bruce, R. M., Nelson, E. P. & Weaver, S. G., 1989. Effects of synchronous uplift and intrusion during
magmatic arc construction. In: Growth of the continental crust. (eds. Ashwal & Lewis)
Tectonophysics, 317-329, Elsevier, Amsterdam, Netherlands.
Bucher, K. & Frey, 1994. Petrogenesis of metamorphic rocks. Springer, Berlin, 318 pp.
Burke, E. A. J., 2001. Raman microspectrometry of fluid inclusions. In: Fluid inclusions; phase
relationships-methods-applications; special volume in honour of Jacques Touret. (eds. Andersen, T.;
Frezzotti, M. L.; Burke E.), 139-158, Elsevier. Amsterdam.
Burruss, R. C. 1981. Analysis of phase equilibria in C-O-H-S fluid inclusions. In: Short Course in
Fluid inclusions: Application to Petrology, (eds. Hollister, L. S. & Crawford, M. L.), pp 39-74.
Burton, K. W. & O'Nions, R. K., 1990. The timescale and mechanism of granulite formation at
Kurunegala, Sri Lanka. Contributions to Mineralogy and Petrology, 106, 66-89.
Collins, P., L., F., 1979. Gas hydrates in CO2-bearing fluid inclusions and the use of freezing data for
estimation of salinity. Economic Geology, 74, 1435-1444.

References
120
Colombo, F. & Talarico, F., 2003. Regional metamorphism in the high grade basement of central
Dronning Maud Land, East Antarctica. Geologisches Jahrbuch, B 96.
Dalziel, I. W. D., 1991. Pacific margins of Laurentia and East Antarctica-Australia as a conjugate rift
pair; evidence and implications for an Eocambrian supercontinent. Geology, 19, 598-601.
De Waard, D., 1968a. Annotated bibliography of anorthosite petrogeneses. In: Origin of anorthosite
and related rocks (ed. Isachsen, Y. W.), 1-11, New York State Museum Science Service Memoir,
Albany, N.Y.
De Waard, D., 1968b. The Anorthosite Problem: The problem of the anorthosite-charnockite suite of
rocks. In: Origin of anorthosite and related rocks (ed. Isachsen, Y. W.), 71-91, N.Y. State Museum
Science Service Memoir, Albany, N.Y.
Demaiffe, D., Moreau, C. & Brown, W. L., 1991a. Ring-complexes of Ofoud-type in Aïr, Niger: a
new anorogenic-type anorthosite association. In: Magmatism in extensional structural settings. (eds.
Kampunzu, A. B. & Lubala, R. T.), 353-376, Springer, Berlin, Heidelberg, New York.
Demaiffe, D., Moreau, C., Brown, W. L. & Weis, D., 1991b. Geochemical and isotopic composition
(Sr, Nd and Pb) and the origin of the anorthosite-bearing anorogenic complexes of the Aïr
Province, Niger. Earth and Planetary Science Letters, 105, 28-46.
Diamond, L. W., 1992. Stability of CO2 clathrate hydrate +CO2 liquid + CO2 vapour + aqueous KCl-
NaCl solutions.: Experimental determination and application to salinity estimates of fluid
inclusions. Geochimica et Cosmochimica Acta, 56, 19-41.
Diamond, L. W., 2001. Review of the systematics of CO2-H2O fluid inclusions. Lithos, 55, 69-99.
Dirks, P. H. G. M. & Wilson, C. J. L., 1995. Crustal evolution of the East Antarctic mobile belt in
Prydz Bay; continental collision at 500 Ma? In: Tectonics of East Antarctica. Precambrian Research,
75, 209-230.
Dobmeier, C. & Raith, M. M., 2000. On the origin of "arrested" charnockitization in the Chilka Lake
area, Eastern Ghats Belt, India; a reappraisal. Geological Magazine, 137, 27-37.
Duan, Z. H.; Moller, N. & Weare, J. H., 1992. An equation of state for the CH4-CO2-H2O system: 2.
Mixtures from 50°C to 1000°C and 0 to 1000 bar. Geochimica Cosmochimica Acta, 56, 2619-2631.
Duan, Z. H., Moller, N. & Weare, J. H., 1996. A general equation of state for supercritical fluid
mixtures and molecular dynamics simulation of mixture PVTX properties. Geochimica
Cosmochimica Acta, 60, 1209-1216.
Dubessy, J., Poty, B. & Ramboz, C., 1989. Advances in C-O-H-N-S fluid geochemistry based on
micro-Raman spectrometric analysis of fluid inclusions. European Journal of Mineralogy, 1, 517-
534.
Duchesne, J. C., Liégeois, J. P., Van der Auwera, J. & Longhi, J., 1999. The crustal tongue melting
model and the origin of massive anorthosites. Terra Nova, 11, 100-105.
Duschek, W., Kleinrahm, R. & Wagner, W., 1990. Measurement and correlation of the (pressure,
density, temperature) relation of carbon dioxide. II. Saturated-liquid and saturated-vapour
density and the vapour pressure along the entire coexistence curve. Journal of Chemical
Thermodynamics, 22, 841-864.
References
121
Emslie, R. F., 1985. The deep Proterozoic crust in the north atlantic provinces (eds. Tobi, A. C. &
Touret, J. L. R.), 39-60, Reidel, Dordrecht.
Emslie, R. F., Hamilton, M. A. & Théiault, R. J., 1994. Petrogenesis of a Mid-Proterozoic
Anorthosite-Mangerite-Charnockite-Granite- (AMCG) complex: Isotopic and chemical evidence
from the Nain Plutonic Suite. Journal of Geology, 102, 539-558.
Fyfe, W. S., 1973. Dehydration Reactions. The American Association of Petroleum Geologists Bulletin, 57,
190-197.
Glassley, W. E., 1983. The role of CO2 in the chemical modification of deep continental crust.
Geochimica et Cosmochimica Acta, 47, 597-616.
Goldschmidt, V. M., 1916. Geologisch-petrographische Studien im Hochgebirge des südlichen Norwegens.
IV. Übersicht der Eruptivgesteine im kaledonischen Gebirge zwischen Stavanger und Trondhjem.
Vidensk.-Selsk. Kristiania Skrifter. I. Mat.-Naturvidenskaften.
Goldstein, R. H. & Reynolds, T. J., 1994. Systematics of Fluid Inclusions in Diagenetic Minerals. SEPM
Short course, 31, 198 pp.
Grunow, A. M., Hanson, R. & Wilson, T. J., 1996. Were aspects of Pan-African deformation linked to
Iapetus opening? Geology , 24, 1063-1066.
Grunow, A. M., 1999. Gondwana events and palaeogeography; a palaeomagnetic review. In: Alex
du Toit special issue; Gondwana 10; event stratigraphy of Gondwana; keynote presentations. (eds. De
Wit & Maarten) Journal of African Earth Sciences, 53-69, Pergamon, London-New York.
Hall, D. L. & Sterner, S. M. 1993. Preferential water loss from synthetic fluid inclusions.
Contributions to Mineralogy and Petrology, 114, 489-500.
Hansen, E. C., Janardhan, A. S., Newton, R. C., Prame, W. K. B. N. & Ravindra, K. G. R., 1987.
Arrested charnockite formation in southern India and Sri Lanka. Contributions to Mineralogy and
Petrology, 96, 225-244.
Heinrich, W. & Gottschalk, M., 1995. Metamorphic reactions between fluid inclusions and mineral
hosts; I, Progress of the reaction calcite+quartz = wollastonite+CO2 in natural wollastonite-hosted fluid inclusions. Contributions to Mineralogy and Petrology, 122, 51-61.
Hoffman, P. F., 1991. Did the breakout of Laurentia turn Gondwanaland inside-out? Science, 252,
1409-1412.
Holland, T. H., 1900. The charnockite series, a group of Archean hyperstenic rocks in peninsular
India. Geological Survey of India Memorandum, 28, 119-249.
Holloway, J. R., 1977. Fugacity and activity of molecular species in supercritical fluids. In: Fraser D.G. (ed.), Thermodynamics in geology. NATO ASI, Series D. Reidel, Dordrecht, pp. 161-182.
Holness, M. B., 1993. Temperature and pressure dependence of quartz-aqueous fluid dihedral
angles; the control of adsorbed H2O on the permeability of quartzites. Earth and Planetary Science
Letters, 117, 363-377.
Hosieni, K. R., Howald, R. A. & Scanlon, M. W., 1985. Thermodynamics of the lambda transition
and the equation of state of quartz. American Mineralogist, 70, 782-793.
Isachsen, Y. W., 1968. Origin of anorthosites and related rocks; a summarization. Memoir - New York
State Museum and Science Service, 18, 435-445.
References
122
Jacobs, J., Ahrendt, H., Kreutzer, H. & Weber, K., 1995. K-Ar, 40Ar-39Ar and apatite fission-track
evidence for Neoproterozoic and Mesozoic basement rejuvenation events in the Heimefrontfjella
and Mannefallknausane (East Antarctica). In: Tectonics of East Antarctica. (eds. Dirks, P. H. G. M.,
Passchier, C. W. & Hoek, J. D.) Precambrian Research, 251-262, Elsevier, Amsterdam,
International.
Jacobs, J., Fanning, C. M., Henjes, K. F., Olesch, M. & Paech, H. J., 1998. Continuation of the
Mozambique Belt into East Antarctica; Grenville-age metamorphism and polyphase Pan-African
high-grade events in central Dronning Maud Land. Journal of Geology, 106, 385-406.
Jacobs, J. & Thomas, R. J., in press. The Mozambique Belt from an East Antarctic perspective.
Proceedings of the VIII International Symposium on Antarctic Earth Sciences.
Janardhan, A. S., Newton, R. C. & Smith, J. V., 1979. Ancient crustal metamorphism at low pH2O;
charnockite formation at Kabbaldurga, South India. Nature , 278, 511-514.
Joshi, A., Pant, N. C. & Parimoo, M. L., 1991. Granites of Petermann Ranges, East Antarctica, and
implications on their genesis. Journal of the Geological Society of India, 38, 169-181.
Kämpf, H & Stackebrandt, W., 1985. Geologic investigations in the Eliseev Anorthosite Massif,
Central Dronning Maud Land, East Antarctica. Zeitschrift der Geologischen Wissenschaft, 13,
321-333.
Kolker, A. & Lindsley, D. H., 1989. Geochemical evolution of the Maloin Ranch pluton, Laramie
Anorthosite Complex, Wyoming: petrology and mixing relations. American Mineralogist, 74, 307-
324.
Krause, O., Dobmeier, C., Raith, M. M. & Mezger, K., 2001. Age of emplacement of massif-type
anorthosites in the Eastern Ghats Belt, India; constraints from U-Pb zircon dating and structural
studies. Precambrian Research, 109, 25-38.
Kröner, A., Sacchi, R., Jaeckel, P. & Costa, M., 1997. Kibaran magmatism and Pan-African granulite
metamorphism in northern Mozambique; single zircon ages and regional implications. Journal of
African Earth Sciences, 25, 467-484.
Küster, M. & Stöckhert, B., 1997. Density changes of fluid inclusions in high-pressure low-
temperature metamorphic rocks from Crete: A thermobarometric approach based on the creep
strength of the host mineral. Lithos, 41, 151-167.
Lafrance, B.; John, B. E. & Scoates, J. S., 1996. Syn-emplacement recrystallization and deformation
microstructures in the Poe Mountain Anorthosite, Wyoming. Contributions to Mineralogy and
Petrology, 122, 431-440.
Lamb, W. M. & Valley, J. W., 1984. Metamorphism of reduced granulites in low-CO2 vapour-free
environment. Nature , 312, 56-58.
Lamb, W. M., Valley, J. W. & Brown, P. E. 1987. Post-metamorphic CO2 inclusions in granulites.
Contributions to Mineralogy and Petrology, 96, 485-495.
Lamb, W. M., 1990. Fluid inclusions in granulites: peak versus retrograde formation. In: Granulites
and crustal evolution. (eds. Vielzeuf, D. & Vidal, P.) NATO ASI Series. Series C: Mathematical and
Physical Sciences, 419-433, D. Reidel Publishing Company, Dordrecht-Boston.

References
123
Lamb, W. M. & Morrison, J., 1997. Retrograde fluids in the Archean Shawmere anorthosite,
Kapuskasing Structural Zone, Ontario, Canada. Contributions to Mineralogy and Petrology, 129,
105-119.
Lawver, L. A. & Scotese, C. R. 1987. A revised reconstruction of Gondwanaland. In: Gondwana six:
Structure, Tectonics, and Geophysics (ed. G.D. McKenzie), 40, 17-20. American Geophysical Union
Geophysical Monographs.
Le Maitre, R. W., 1989. A classification of igneous rocks and glossary of terms. Blackwell Science
Publications, Oxford, 139 pp.
Lee, B. I. & Kesler, M. G., 1975. A generalized thermodynamic correlation based on three-parameter
corresponding states. American Institute of Chemical Engeneering Journal, 21, 510-527.
Li, Z. X. & Powell, C. M., 1993. Late Proterozoic to early Paleozoic paleomagnetism and the
formation of Gondwanaland. In: Assembly, evolution and dispersal; proceedings of the Gondwana
eight symposium. (eds. Findlay, H. ; Unrug, R. ; Banks, D. & Veevers, R.) International Gondwana
Symposium, 9-21, International Gondwana Symposium.
LINKAM, Scientific Instruments, Ltd., 1993. Stage Reference Manual (Geology Version). 18 pp.
LINKAM, Scientific Instruments, Ltd., 1993. TP 92 Reference Manual. 9 pp.
Longhi, J., Van der Auwera, J., Fram, M. S. & Duchesne, J. C., 1999. Some phase equilibrium
constraints on the origin of Proterozoic (massif) type anorthosites and related rocks. Journal of
Petrology, 40, 339-362.
Markl, G. & Piazolo, S., 1998. Halogen-bearing minerals in syenites and high-grade marbles of
Dronning Maud Land, Antarctica; monitors of fluid compositional changes during late-
magmatic rock-rock interaction processes. Contributions to Mineralogy and Petrology, 132, 246-268.
Markl, G., Piazolo, S., Bauer, W., Paech, H. J., Krauß, U. & Mikhalsky, E. V., 2003. Panafrican massif-
type anorthosites from central Dronning Maud Land, Antarctica. Geologisches Jahrbuch, B 96, in
press.
Martignole, J. & Nantel, S., 1982. Geothermobarometry of cordierite-bearing metapelites near the
Morin anorthosite complex, Grenville Province, Quebec. The Canadian Mineralogist, 20, 307-318.
McLelland, J. M., 1989. Crustal growth associated with anorogenic, mid-Proterozoic anorthosite
massifs in northeastern North America. In: Growth of the continental crust, (ed. Ashwal, L. D.),
Tectonophysics, 3-4, 331-341, Elsevier, Amsterdam, Netherlands.
McMenamin, M. A. S. & McMenamin, D. L. S., 1990. The emergence of animals; the Cambrian
breakthrough. Columbia Univ. Press, New York, NY, United States.
Meert, J. G., Van, d. V. R., Pisarevsky, S. A., Komissarova, R. A. & Khramov, A. N., 2001. New
palaeomagnetic results from Vendian red sediments in Cisbaikalia and the problem of the
relationship of Siberia and Laurentia in the Vendian; discussion and reply. Geophysical Journal
International, 146, 867-873.
Mikhalsky, E. V., Beliatsky, B. V., Savva, E. V., Wetzel, H.-U., Federov, L. V., Weiser, T. & Hahne,
K., 1997. Reconnaissance Geochronologic Data on Polymetamorphic and Igneous Rocks of the
Humboldt Mountains, Central Queen Maud Land, East Antarctica. In: The Antarctic Region:

References
124
Geological Evolution and Processes. Proceedings of the VII International Symposium on Antarctic Earth
Sciences, Siena, 1995 (ed. Alberto, R. C.), 45-54, Terra Antarctica Publication, Siena.
Milisenda, C., Liew, T. C., Hofmann, A. W. & Kroener, A., 1991. Isotopes, element mobility and
mineral stability during charnockite formation in Sri Lanka. In: Sixth meeting of the European
Union of Geosciences. (ed. Anonymous) Terra Abstracts, 437, Blackwell Scientific Publications,
Oxford, International.
Moores, E. M., 1991. Southwest U.S.-East Antarctic (SWEAT) connection; a hypothesis. Geology, 19,
425-428.
Morimoto, N., 1988. Nomenclature of pyroxenes; Subcommitee on Pyroxenes, Commission on New
Minerals and Mineral Names (CNMMN), International Mineral Association (IMA).
Schweizerische Mineralogische und Petrographische Mitteilungen = Bulletin Suisse de Mineralogie et
Petrographie, 68, 95-111.
Newton, R. C., Smith, J. V. & Windley, B. F., 1980. Carbonic metamorphism, granulites and crustal
growth. Nature, 288, 45-50.
Newton, R. C., Aranovich, L. Y., Hansen, E. C. & Vandenheuvel, B. A., 1998. Hypersaline fluids in
Precambrian deep-crustal metamorphism. In: Earth's evolution through the Precambrian. (eds.
Percival, J. & Ludden, A.) Precambrian Research, 41-63, Elsevier, Amsterdam.
Olesch, M., 1991. Metamorphism of basement rocks from the southern Shackleton Range. In: Sixth
international symposium on Antarctic earth sciences. (ed. Anonymous), International Symposium on
Antarctic Earth Sciences, 6, 456.
Paech, H. J., 1997. Central Dronning Maud Land; its history from amalgamation to fragmentation of
Gondwana. In: European Union of Geoscience; EUG 9, symposium on Antarctic Earth sciences. (eds.
Kleinschmidt, G., Ricci, C. A., Storey, B. C., Tessensohn, F. & van, d. W. F. M.) Terra Antartica, 41-
49, Universita di Siena. Dipartimento di Scienze della Terra, Siena, Italy.
Parimoo, M. L., Joshi, A. & Pant, N. C., 1988. Petrogenesis of the anorthosite suite of central
Dronning Maud Land, East Antarctica. In: Penrose Conference on the origin and evolution of
anorthosite and associated rocks, 38, Wyoming, U.S.
Passchier, C. W. & Trouw, R. A. J., 1996. Microtectonics. Springer-Verlag, Berlin, 289 pp.
Pelechaty, S. M., Grotzinger, J. P., Kashirtsev, V. A. & Zhernovsky, V. P., 1996. Chemostratigraphic
and sequence stratigraphic constraints on Vendian-Cambrian basin dynamics, Northeast
Siberian Craton. Journal of Geology, 104, 543-563.
Perchuk, L., Gerya, T. & Nozhkin, A., 1989. Petrology and retrograde P-T path in granulites of the
Kanskaya Formation, Yenisey Range, eastern Siberia. Journal of Metamorphic Geology, 7, 599-617.
Perchuk, L. L. v. & Gerya, T. V., 1992. The fluid regime of metamorphism and the charnockite
reaction in granulites; a review. International Geology Review, 34, 1-58.
Perchuk, L. L. & Gerya, T. V., 1993. Fluid control of charnockitization. In: Fluid-rock interaction in the
deeper continental lithosphere. (eds. Touret, J., R. & Thompson, A.) Chemical Geology, 175-186,
Elsevier, Amsterdam, Netherlands.

References
125
Perchuk, L. L., Safonov, O. G., Gerya, T. V., Fu, B. & Harlov, D. E., 2000. Mobility of components in
metasomatic transformation and partial melting of gneisses; an example from Sri Lanka.
Contributions to Mineralogy and Petrology, 140, 212-232.
Phillipot, P. & Selverstone, J., 1991. Trace-element-rich brines in eclogite veins: Implications for
fluid composition and and transport during subduction. Contributions to Mineralogy and
Petrology, 106, 417-430.
Piazolo, S. & Markl, G., 1999. Humite- and scapolite-bearing assemblages in marbles and
calcsilicates of Dronning Maud Land, Antarctica; new data for Gondwana reconstructions.
Journal of Metamorphic Geology, 17, 91-107.
Pichamuthu, C. S., 1960. Charnockite in the making. Nature, 188(4745), 135-136.
Pineau, F., Javoy, M. Behar, F. & Touret, J., 1981. La géochimie isotopique du facies granulite du
Bamble (Norvège) et l'origine des fluides carbonés dans la crote profonde. Bulletin de Mineralogie,
104, 630-641.
Pinna, P., Jourde, G., Calvez, J. Y., Mroz, J. P. & Marques, J. M., 1993. The Mozambique Belt in
northern Mozambique; Neoproterozoic (1100-850 Ma) crustal growth and tectogenesis, and
superimposed Pan-African (800-550 Ma) tectonism. Precambrian Research, 62, 1-59.
Powell, C. M., Li, Z. X., McElhinny, M. W., Meert, J. G. & Park, J. K., 1993. Paleomagnetic
constraints on timing of the Neoproterozoic breakup of Rodinia and the Cambrian formation of
Gondwana; with Suppl. Data 9335. Geology, 21, 889-892.
Raith, M., Hoernes, S., Klatt, E. & Staehle, H. J., 1989. Contrasting mechanisms of charnockite
formation in the amphibolite to granulite grade transition zones of southern India. In: Fluid
movements; element transport and the composition of the deep crust. (eds. Bridgwater & David) NATO
ASI Series. Series C: Mathematical and Physical Sciences, 29-38, D. Reidel Publishing Company,
Dordrecht-Boston, International.
Raith, M., Srikantappa, C., Ashamanjari, K. G. & Spiering, B., 1990. The granulite terrane of the
Nilgiri Hills (southern India); characterization of high-grade metamorphism. In: Granulites and
crustal evolution. (eds. Vielzeuf, D. & Vidal, P.) NATO ASI Series. Series C: Mathematical and
Physical Sciences, 339-365, D. Reidel Publishing Company, Dordrecht-Boston.
Raith, M. & Srikantappa, C., 1993. Arrested charnockite formation at Kottavattam, southern India.
In: Special issue on South Indian granulites. (ed. Mohan, A.) Journal of Metamorphic Geology, 815-832,
Blackwell, Oxford, United Kingdom.
Ravich, M. G. & Kamenev, E. N., 1975. Crystalline basement of the Antarctic platform. Wiley, New
York.
Ravindra-Kumar, G. R., Srikantappa, C. & Hansen, E., 1985. Charnockite formation at Ponmudi in
southern India. Nature, 313, 207-209.
Roedder, E., 1984. Fluid inclusions. Mineralogical Society of America.
Rogers, J. J. W., Miller, J. S. & Clements, A. S., 1995a. A Pan-African zone linking East and West
Gondwana. In: India and Antarctica during the Precambrian. (eds. Yoshida & M ; Santosh) Memoir -
Geological Society of India, 11-23, Geological Society of India, Bangalore, India.

References
126
Rogers, J. J. W., Unrug, R. & Sultan, M., 1995b. Tectonic assembly of Gondwana. Journal of
Geodynamics, 19, 1-34.
Santosh, M., Harris, N. B. W., Jackson, D. H. & Mattey, D. P., 1990. Dehydration and incipient
charnockite formation; a phase equilibria and fluid inclusion study from South India. Journal of
Geology, 98, 915-926.
Santosh, M. & Yoshida, M., 1991. Trapped carbon dioxide in East Antarctic granulites: Evidence
from fluid inclusions. Proceedings of the NIPR Symposium on Antarctc Geosciences, 5, 136-145.
Santosh, M. & Yoshida, M., 1992. A petrologic and fluid inclusion study of charnockites from the
Lützow-Holm Bay region, East Antarctica; evidence for fluid-rich metamorphism in the lower
crust. Lithos, 29, 107-126.
Schiellerup, H., Lambert, D. D., Prestvik, T., Robins, B., McBride, J. S. & Larsen, R. B., 2000. Re-Os
isotopic evidence for a lower crustal origin of massif-type anorthosites. Nature, 405, 781-784.
Scientific Committee on Antarctic Research (SCAR) - Working Group on Geodesy and Geographic
Information. Composite Gazetteer of Antarctica" (www.pnra.it/SCAR_GAZE).
Scoates, J. S., 2000. The plagioclase-magma density paradox re-examined and the crystallisation of
Proterozoic anorthosites. Journal of Petrology, 41, 627-649.
Shackleton, R. M., 1996. The final collision zone between East and West Gondwana; where is it? In:
IGCP 348 (Mozambique and related belts). (eds. Thomas, J, Shackleton R. M. & Muhongo, A.)
Journal of African Earth Sciences, 271-287, Pergamon, London-New York.
Shelley, D., 1993. Igneous and metamorphic rocks under the microscope. Chapman & Hall, London.
Sheperd, T. J., Rankin, A. H. & Alderton, D. H. M., 1985. A practical guide to fluid inclusion studies.
Blackie & Son, London and Glasgow.
Shiraishi, K., Ellis, D. J., Hiroi, C., Fanning, C. M., Motoyoshi, Y. & Nakai, Y., 1994.Cambrian
Orogenic Belt in East Antarctica and Sri Lanka: Implications for Gondwana Assembly. The
Journal of Geology, 102, 47-65.
Shmulovich, K. & Graham, C. M., 1996. Melting of albite and dehydration of brucite in H2O-NaCl
fluids to 9 kbars and 700-900 °C; implications for partial melting and water activities during high
pressure metamorphism. Contributions to Mineralogy and Petrology, 124, 370-382.
Soave, G., 1972. Equilibrium constants from a modified Redlich-Kwong equation of state. Chemistry
in English Science, 27, 1197-1203.
Sorby, H. C., 1858. On the microscopical structure of crystals, indicating the origin of minerals and
rocks. Journal of the Geological Society of London, 14, 453-500.
Span, R. & Wagner, W., 1996. A new equation of state for carbon dioxide covering the fluid region
from the triple point temperature to 1100 K at pressures up to 800 MPa. Journal of Physical
Chemistry Reference Data, 25, 1509-1596.
Spear, F. S., Rumble, D., III & Ferry, J. M., 1982. Linear algebraic manipulation of n-dimensional
composition space. In: Characterization of metamorphism through mineral equilibria. (eds. Ferry &
John) Reviews in Mineralogy, 53-104, Mineralogical Society of America, Washington, DC, United
States.

References
127
Spear, F. S., 1993. Metamorphic phase equilibria and pressure-temperature-time paths. Mineralogical
Society of America, Washington, D. C., 799 pp.
Srikantappa, C., Raith, M. & Spiering, B., 1985. Progressive charnockitization of a leptynite-
khondalite suite in southern Kerala, India; evidence for formation of charnockites through
decrease in fluid pressure? Journal of the Geological Society of India, 26, 849-872.
Stähle, H. J., Raith, M., Hoernes, S. & Delfs, A., 1987. Element mobility during incipient granulite
formation at Kabbaldurga, southern India. Journal of Petrology, 28, 803-834.
Stern, R. J., 1994. Arc-assembly and continental collision in the Neoproterozoic East African Orogen;
implications for the consolidation of Gondwanaland. Annual Review of Earth and Planetary
Sciences, 22, 319-351.
Sterner, S. M. & Bodnar, R. J., 1989. Synthetic fluid inclusion; VII, Re-equilibration of fluidinclusions in quartz during laboratory simulated metamorphic burial and uplift. Journal of
Metamorphic Geology, 7, 243-260.
Streckeisen, 1976. To each plutonic rock its proper name. Earth Science Review, 12, 1-33.
Svensen, H., Jamtveit, B., Yardley, B., Engvik, A. K., Austrheim, H. & Broman, C., 1999. Lead and
bromine enrichment in eclogite-facies fluids: Extreme fractionation during lower crustal
hydration. Geology, 19, 165-178.
Svensen, H., Jamtveit, B., Banks, D. A. & Austrheim, H., 2001. Halogen contents of eclogite facies
flued inclusions and minerals; Caledonites, western Norway. Journal of Metamorphic Geology, 19,
165-178.
Swanenberg, H. E. C., 1980. Fluid inclusions in high-grade metamorphic rocks from Southern
Norway. Geologia Ultraiectina, 25, 147 pp.
Thiery, R., van den Kerkhof, A. M. & Dubessy, J., 1994. VX properties of CH4-CO2 and CO2-N2 fluid
inclusions; modelling for T<31 degrees C and P<400 bars. European Journal of Mineralogy, 6, 753-
771.
Torsvik, T. H., Smethurst, M. A., Meert, J. G., Van, d. V. R., McKerrow, W. S., Brasier, M. D., Sturt,
B. A. & Walderhaug, H. J., 1996. Continental break-up and collision in the Neoproterozoic and
Palaeozoic; a tale of Baltica and Laurentia. Earth-Science Reviews, 40, 229-258.
Touret, J. L. R., 1971. Controle du facies granulite dans le Bamble par le CO2 de la phase fluide.
Bulletin de la Societe Geologique de France, 3, 143-145.
Touret, J. L. R. 1995. The role and nature of fluids in the continental lower crust. In: India and
Anatarctic during the precambrian, (eds. Yoshida, M. & Santosh, M.), 143-160, Memoir 35,
Geological Society of India, Bangalore.
Touret, J. L. R. & Huizenga, J. M., 1999. Precambrian intraplate magmatism: high temparture, low
pressure crustal granulites. Journal of African Earth Sciences, 28, 367-382.
Touret, J. L. R., 2001. Fluids in metamorphic rocks. Lithos, 55, 1-25.
United States Geological Survey (U.S.G.S), 1988. Fluid Inclusion Instruction Manual. U.S.G.S., USA, 34
pp.
Unrug, R., 1996. The assembly of Gondwanaland; Scientific results of IGCP Project 288;
Gondwanaland sutures and mobile belts. Episodes, 19, 11-20.

References
128
van den Kerkhof, A. M., 1988. The system CO2-CH4-N2 in fluid inclusions: theoretical modelling
and geological applications. Ph. D. thesis, Amsterdam (Free University), pp 206.
van den Kerkhof, A. M. & Grantham, G. H., 1999. Metamorphic charnockite in contact aureoles
around intrusive enderbite from Natal, South Africa. Contributions to Mineralogy and Petrology,
137, 115-132.
Vityk, M. O. & Bodnar, R. J., 1998. Statistical microthermometry of synthetic fluid inclusions in
quartz during decompression reequilibration. Contributions to Mineralogy and Petrology, 132, 149-
162.
Vry, J. K. & Brown, P.E., 1991. Texturally-early fluid inclusions in garnets: evidence of the prograde
metamorphic path? Contributions to Mineralogy and Petrology, 108, 271-282.
Waters, D. J., 1988. Partial melting and the formation of granulite facies assemblages in
Namaqualand, South Africa. In: Studies in the genesis and deformation of migmatites. (eds. Tracy,
Robert, J ; Day & Howard) Journal of Metamorphic Geology, 387-404, Blackwell, Oxford, United
Kingdom.
Weil, A. B., Van der Voo R., MacNiocall, C. & Meert, J. G., 1998. The Proterozoic supercontinent
Rodinia; paleomagnetically derived reconstructions for 1100 to 800 Ma. Earth and Planetary
Science Letters, 154, 13-24.
Wilson, T. J., Grunow, A. M. & Hanson, R. E., 1997. Gondwana assembly: The view from southern
Africa and East Gondwana. Journal of Geodynamics, 23, 263-286.
Zhang, Y. G. & Frantz, J. D. 1987. Determination of the homogenisation temperatures and densities
of supercritical fluids in the system NaCl-KCl-CaCl2-H2O using synthetic fluid inclusions.
Chemical Geology, 64. 335-350.

Acknowledgements
Acknowledgements
At first I would like to thank Prof. Dr. M. Olesch for giving me the opportunity to
carry out the thesis, providing me with the samples and field data, and supervising my
work. I also thank Prof. Dr. R. X. Fischer for taking on the second expert report.
The work was funded by the FNK, University of Bremen, Germany, reference
number 05/134/7. The samples and field data were collected during the GeoMaud
Expedition 95/96, directed by the Federal Institute for Geosciences and Natural
Resources (BGR Hanover) (expedition leader Prof. Dr. H.-J. Paech, BGR Hanover). This
study is part of the project OL 25/10 which was funded by the Deutsche
Forschungsgemeinschaft (DFG). The Alfred Wegener Institute for Polar and Marine
Research is also thanked for providing polar equipment and logistic support during
the GeoMaud 1995/96 expedition.
I am grateful to Dr. habil. R. J. Bakker who introduced me to Raman spectrometry,
thermodynamic modelling and the art of paper-writing. His patience, encouragement
and willingness for extended discussions on fluid inclusions (and all there is to them)
are very well appreciated. The hospitality of the staff the of the Institute of
Geosciences, Mineralogy & Petrology, University of Leoben, Austria, is also kindly
acknowledged.
V. Kolb, B. Schröder P. Witte provided important support in practical, technical and
bureaucratical matters, and it was always good to know that they were around in case
of need.
My current and former collegues Dipl.-Geol. B. Emmel, Dipl.-Geol. M. Gorke, Prof.
Dr. R. Klemd, Dr. F. Lisker, Dr. habil. J. Jacobs, Dr. S. Meier and Dr. B. Ventura are
thanked for helpful suggestions, corrections, advice, mental support, company and
social distraction during my time at the University of Bremen.
Last but not least I want to say thanks to my companion, my close and closest
friends, my parents, and sister who seperately and concertedly provide a network and
social background that I know, I can always rely upon.